Protege: A Mobile Health Application for the Elder-caregiver Monitoring Paradigm
Upload
khangminh22Category
view
0download
0
i
Functional Recovery and Caregiver Support
of Stroke Patients Admitted for Rehabilitation
in Singapore Community Hospitals
(1996 to 2005)
Spine Title: Functional Recovery and Caregiver Support of Stroke Patients Admitted for
Rehabilitation in Singapore Community Hospitals (1996 To 2005)
(Thesis Format: Integrated Article)
by
Gerald Choon-Huat Koh
Graduate Program in Family Medicine
A thesis submitted in partial fulfilment of the requirements
for the degree of Doctor of Philosophy
School of Graduate and Postdoctoral Studies
The University of Western Ontario
London, Ontario, Canada
© Gerald Choon-Huat Koh 2012

ii
THE UNIVERSITY OF WESTERN ONTARIO School of Graduate and Postdoctoral Studies
Certificate of Examination
Supervisors ______________________________ Dr. Amardeep Thind ______________________________ Dr. Rob Petrella Supervisory Committee ______________________________ Dr. ______________________________ Dr.
Examiners ______________________________ Dr. Mark Bayley ______________________________ Dr. Deborah Lucy ______________________________ Dr. Stewart Harris ______________________________ Dr. Evelyn Vingilis
The thesis by
Gerald Choon-Huat Koh
entitled:
Functional Recovery and Caregiver Support of Stroke Patients Admitted for Rehabilitation in Singapore Community Hospitals (1996 To 2005)
is accepted in partial fulfillment of the requirements for the degree of
Doctor of Philosophy
______________________ _______________________________ Date Chair of the Thesis Examination Board
iii
Abstract
Post-acute rehabilitation is the active process where disabled persons realize their optimal
recovery potential through therapy after discharge from acute hospital admissions.
Community hospitals which are mainly run by family physicians in Singapore provide post-
acute rehabilitation, and are similar to US inpatient rehabilitation facilities and Canada’s
specialty rehabilitation facilities. This thesis is based on a national dataset of all admissions
into community hospitals in Singapore from 1996 to 2005 (ten years) manually extracted
from medical records of four sites by the PhD candidate. Four chapters are presented: (1) a
systematic review of the rehabilitation indices from published studies and their reported
predictors, (2) a descriptive study of community hospitals admissions in total and stratified by
hospital and year of admission, (3) an analysis of the predictors of rehabilitation
effectiveness (REs) and efficiency (REy) among stroke rehabilitation patients and trade-off
relationships between REs and REy, and (4) the factors independently associated with
caregiver availability, number of potential caregivers and primary caregiver identity among
stroke rehabilitation patients. The systematic review found five main rehabilitation indices in
existing literature (absolute functional gain, REs, REy, relative REs and relative REy) and
strong evidence for age, pre-rehabilitation functional status and cognitive impairment as the
independent predictors of REs and REy. The second study found increasing annual trends in
mean age, need for subsidized beds, admission for post hip fracture arthroplasty
rehabilitation, mean admission and discharge functional status, and reliance on foreign
domestic worker as primary caregivers among patients admitted into community hospitals
from 1996 to 2005. The third study identified new factors predictive of poorer stroke REs and
REy such as female gender, minority ethnicities and caregiver availability. Trade-off
relationships between REs and REy were found with respect to admission functional status
and length of stay, with optimal admission Barthel Index score and length of stay to optimize
REs and REy, as 35 to 60 units and 37 to 41 days respectively. The fourth study found that
social factors such as age, gender, religion, ethnicity and socioeconomic status of stroke
rehabilitation patients were associated with caregiver availability, number of potential
caregivers and primary caregiver identity.
(350 words)

iv
MeSH Keywords
(In alphabetical order): activities of daily living; caregivers; effectiveness; efficiency; length
of stay; outcome assessment (health care); rehabilitation; rehabilitation centres;
socioeconomic factors; stroke.

v
Co-Authorship Statement
Each manuscript/chapter contained within this thesis is based upon research that was conceived,
designed, executed and analyzed by the author, Gerald Choon-Huat Koh, as a component of his
doctoral work. The data for this research was obtained from four community hospitals in
Singapore and data collection was funded by research grants which the PhD candidate was the
principal investigator. Contributions in the form of regular feedback, methodological or statistical
inputs were provided by the co-investigators throughout the course of this research study which
include site investigators of each community hospital (Dr. Chan Kin Ming [Ang Mo Kio Thye
Hua Kwan Hospital], Drs. Fong Ngan Phoon and Tan Boon Yeow [St Luke’s Hospital]), Dr.
Edward Menon [St Andrew’s Community Hospital], Drs. Ee Chye Hua and Lee Kok Keng
[Bright Vision Hospital]); department co-investigators (Drs. David Koh, Chia Kee Seng, Patsy
Chow and Nashia Rizvi, Ms Angela Cheong and Mr Wee Liang En); biostatisticians (Drs. Tai
Bee Choo, Choi Kwok Pui and Ms Cynthia Chen Huijin) and thesis supervisors (Drs. Amardeep
Thind and Rob Petrella). Gerald Choon-Huat Koh was the primary author of every chapter.
.

vi
Epigraph
“Always do what you love so when you wake up in the morning,
you don’t go to work; you go to play.”
Koh Keng Hoe, my father and inspiration

vii
Dedication
To God - for His grace and blessings;
To Susanna - my beautiful wife, best friend, soul-mate and
wonderful mother of my three children;
To Maryanne – my precious baby girl and first-born;
To Michael Xavier – my angel baby boy and second-born;
To Maryssa – my bundle of joy and third-born.
Thank you for your love and patience.
I love you all.

viii
Acknowledgments
First and foremost, I would like to extend my deepest gratitude to my thesis supervisors,
Drs. Amardeep Thind and Rob Petrella, for guiding and supporting me. Thanks also go to
Drs. Judith Brown and Moira Stewart for welcoming me into the PhD Program in Family
Medicine; Ms Liz McInnis for running the Graduate Studies in Family medicine program so
efficiently; all my teachers I have encountered during my onsite sessions and online modules;
and my classmates who I have had the privilege of encountering along the way.
I would also like to thank the staff of Ang Mo Kio Thye Hua Kwan Hospital, St Luke’s
Hospital, St Andrew’s Community Hospital and Bright Vision Hospital for assisting in the
study.
Lastly, I would also like to express my sincerest appreciation to the National Medical
Research Council (NMRC) and National University of Singapore (NUS) who funded this
research (Grant Numbers: R-186-000-076-214, R-186-000-076-133 and R-186-000-085-
112); the Schulich School of Medicine & Dentistry, University of Western Ontario, Canada
for their Graduate Thesis Research Award and Schulich Graduate Scholarship; and the
National Medical Research Council, Ministry of Health, Singapore who sponsored my PhD
studies through a Research Fellowship.

ix
Table of Contents
Certificate of Examination ......................................................................................................... ii
Abstract .................................................................................................................................... iii
Co-Authorship Statement........................................................................................................... v
Epigraph .................................................................................................................................... vi
Dedication ................................................................................................................................ vii
Acknowledgments.................................................................................................................. viii
Table of Contents ...................................................................................................................... ix
List of Tables ......................................................................................................................... xiii
List of Figures ......................................................................................................................... xiv
List of Abbreviations .............................................................................................................. xvi
List of Nomenclature ............................................................................................................. xvii
CHAPTER ONE: INTRODUCTION ................................................................................ 1
1. Disability and Disabled Persons ......................................................................................... 1
2. Post-Acute Rehabilitation - A Comparison between US, Canada & Singapore ................ 3
2.1. United States (US) ....................................................................................................... 4
2.1.1 Skilled Nursing Facilities (SNFs) ........................................................................ 5
2.1.2. Home Health Agencies (HHAs) .......................................................................... 5
2.1.3. Inpatient Rehabilitation Facilities (IRFs)............................................................. 6
2.1.4. Long-Term Care Hospitals (LTCHs) ................................................................... 6
2.2. Canada ......................................................................................................................... 7
2.3. Singapore ..................................................................................................................... 9
3. Epidemiology of Physical Disability in Older Persons .................................................... 15
3.1. Prevalence ................................................................................................................. 15
3.2. Incidence ................................................................................................................... 17
3.3. Trends ........................................................................................................................ 18
4. Evidence for Rehabilitation of Older Persons .................................................................. 22
4.1. Inter-Disciplinary Approach ..................................................................................... 22
4.2. Initiation and Duration .............................................................................................. 23
4.3. Intensity ..................................................................................................................... 23
4.4. Setting........................................................................................................................ 24

x
5. Functional Assessment Tools and their Validity & Reliability ........................................ 25
5.1 Katz Index (KI) ......................................................................................................... 26
5.2 Barthel Index (BI) ..................................................................................................... 27
5.3 Functional Independence Measure (FIM) ................................................................. 29
6. Research Agenda for Post-Acute Rehabilitation .............................................................. 31
6.1. Measures of Rehabilitation Outcomes ...................................................................... 31
6.2. Effectiveness of Post-Acute Rehabilitation............................................................... 32
7. Rehabilitation Outcome Indices and their Validity & Utility ........................................... 34
7.1. Absolute Functional Gain (AFG) / Absolute Efficacy / Total Gain ......................... 35
7.2. Rehabilitation Effectiveness (REs) / Montebello Rehabilitation Factor Score
(MRFS) / Relative Functional Gain (RFG) .......................................................................... 36
7.3 Rehabilitation Efficiency (REy) / Length of Stay Efficiency (LOS-EFF) / BI
Efficiency / FIM Efficiency ................................................................................................. 43
7.4 Relative Functional Efficiency (RFE) / MRFS Efficiency ....................................... 60
7.5 Revised MRFS (MRFS-R) ........................................................................................ 61
7.6 Maximal Score Attainable ......................................................................................... 64
7.7 Summary ................................................................................................................... 65
8. Post-Acute Inpatient Rehabilitation in Singapore ............................................................ 69
8.1 Gaps in Knowledge ................................................................................................... 70
9. PhD Thesis Research Proposal ......................................................................................... 72
9.1 Aim and Objectives ................................................................................................... 72
9.2 Methodology ............................................................................................................. 73
9.2.1 Study Design ...................................................................................................... 73
9.2.2 Study Population ................................................................................................ 73
9.2.3 Measures ............................................................................................................ 73
9.3 Statistical Analysis .................................................................................................... 75
9.4 Ethical Considerations............................................................................................... 76
References ................................................................................................................................ 78
CHAPTER TWO: THE SOCIODEMOGRAPHIC AND CLINICAL PROFILE OF
ADMISSIONS TO COMMUNITY HOSPITALS IN SINGAPORE FROM 1996 TO
2005: A DESCRIPTIVE STUDY .................................................................................. 109
Introduction ............................................................................................................................ 109
Methods.................................................................................................................................. 110
Statistical Analysis ............................................................................................................. 112

xi
Results .................................................................................................................................... 113
Discussion .............................................................................................................................. 116
Conclusion ............................................................................................................................. 121
Tables ..................................................................................................................................... 123
Figures.................................................................................................................................... 135
References .............................................................................................................................. 139
CHAPTER THREE: PREDICTORS OF AND TRADE-OFFS BETWEEN
EFFECTIVENESS AND EFFICIENCY IN STROKE REHABILITATION ............... 147
Introduction ............................................................................................................................ 147
Methods.................................................................................................................................. 148
Results .................................................................................................................................... 153
Discussion .............................................................................................................................. 155
Conclusion ............................................................................................................................. 158
References .............................................................................................................................. 169
CHAPTER FOUR: CAREGIVER SUPPORT OF RECENT STROKE SURVIVORS
ADMITTED FOR REHABILITATION IN COMMUNITY HOSPITALS .................. 175
Introduction ............................................................................................................................ 175
Methods.................................................................................................................................. 176
Results .................................................................................................................................... 180
Discussion .............................................................................................................................. 182
Conclusion ............................................................................................................................. 186
References .............................................................................................................................. 195
CHAPTER FIVE: GENERAL DISCUSSION AND CONCLUSIONS ........................ 203
Introduction ............................................................................................................................ 203
Chapter 1: Rehabilitation Outcome Indices ........................................................................... 205
Chapter 2: The Socio-demographic and Clinical Profile of Admissions into Community
Hospital in Singapore from 1996 to 2005 .............................................................................. 208
Chapter 3: Predictors and Trade-Offs between Rehabilitation Effectiveness and Efficiency in
Stroke Rehabilitation ............................................................................................................. 213
Chapter 4: Caregivers Support of Recent Stroke Survivors Admitted for Rehabilitation in
Community Hospitals ............................................................................................................ 216
Other Future Plans for Community Hospital Dataset ............................................................ 219
Summary ................................................................................................................................ 222
Conclusions ............................................................................................................................ 223

xii
References .............................................................................................................................. 225
Appendix 1. Definition of Data Variables Extracted ............................................................ 227
Appendix 2. Shah Modified Barthel Index ........................................................................... 236
Appendix 3. Permission to Use Charlson Co-Morbidity Index ............................................ 240
Appendix 4. Formula System for Charlson Co-Morbidity Index Score ............................... 241
Appendix 5. Data Collection Form ....................................................................................... 243
Appendix 6. NUS IRB Approval Certificate ........................................................................ 247
Appendix 7. Supplementary Material for Chapter Three ...................................................... 250
Appendix 8: Additional Details to Add to Database ............................................................. 267
Appendix 9: Proposed Conversion of Shah Modified Barthel Index to ElderShield Disability
Levels ..................................................................................................................................... 269
11. Curriculum Vitae ........................................................................................................ 275

xiii
List of Tables
Table 1. Comparison of Post-Acute Rehabilitation between US, Canada and Singapore ....... 13
Table 2. Summary of independent factors of poorer REs/MRFS/RFG in studies ................... 38
Table 3. Summary of independent factors of poorer REs/MRFS/RFG in studies by study population (paper reference numbers in cells) ......................................................................... 42
Table 4. Summary of independent factors of poorer REy/ LOS-EFF/Efficiency in studies ... 45
Table 5. Summary of independent factors of poorer REy/ LOS-EFF/Efficiency in studies by study population (paper reference numbers in cells) ............................................................... 57
Table 6. Summary of rehabilitation indices and their formulae .............................................. 66
Table 7. Characteristics of all patient admissions to Singaporean community hospitals from 1996-2005 by community hospital (N=19,360) .................................................................... 123
Table 8. Characteristics of all patient admissions to Singaporean community hospitals from 1996-2005 (by year of admission) (N= 19,360) .................................................................... 129
Table 9. Characteristics of study population (N=3796) ......................................................... 159
Table 10. Associated factors of rehabilitation effectiveness (REs) and efficiency (REy) (N=3335) ................................................................................................................................ 161
Table 11. Multivariate analysis of rehabilitation effectiveness (REs) and efficiency (REy) (N=3335) ................................................................................................................................ 166
Table 12. Characteristics of stroke rehabilitation patients admitted to Singaporean community hospitals from 1996-2005 (N=3796) .................................................................. 187
Table 13. Patient factors for caregiver availability among stroke rehabilitation patients admitted to Singaporean community hospitals from 1996-2005 on bivariate analysis (N=3796) ................................................................................................................................ 189
Table 14. Patient factors for number of potential caregivers among stroke rehabilitation patients with caregivers admitted to Singaporean community hospitals from 1996-2005 on bivariate amalysis (N=3796) .................................................................................................. 190
Table 15. Patient factors for primary caregiver identity of stroke rehabilitation patients admitted to Singaporean community hospitals from 1996-2005 on bivariate analysis (N=3401) ................................................................................................................................ 191
Table 16. Patient factors for caregiver availability, number of potential caregivers and primary caregiver identity among stroke rehabilitation patients admitted to Singaporean community hospitals from 1996-2005 on multivariate analysis ............................................ 193

xiv
List of Figures
Figure 1: % of Population Aged >75 Years with Impaired Mobility (1983, 1995 & 2005) ... 20
Figure 2: % of Population Aged >75 Years with ADL Dependency (1983, 1995 & 2005) .... 21
Figure 3. Ethnicity of all patients admissions in Singaporean community hospitals from 1996-2005, by year of admission. ................................................................................................... 135
Figure 4. Government subsidy levels of all patient admissions in Singaporean community hospitals from 1996-2005, by year of admission. .................................................................. 135
Figure 5. Relationship of primary caregiver to patient for all patient admissions in Singaporean community hospitals from 1996-2005, by year of admission ........................... 136
Figure 6. Primary diagnosis for all patient admissions in Singaporean community hospitals from 1996-2005, by year of admission .................................................................................. 136
Figure 7. Mean admission and discharge BI score for all patient admissions in Singaporean community hospitals from 1996-2005, by year of admission ............................................... 137
Figure 8. Ratio of median rank of rehabilitation effectiveness (REs) to efficiency (REy) by admission BI score ................................................................................................................. 167
Figure 9. Ratio of median rank of rehabilitation effectiveness (REs) to efficiency (REy) by length of stay .......................................................................................................................... 168
xv
List of Appendices
Appendix 1. Definition of Data Variables Extracted ............................................................ 227
Appendix 2. Shah Modified Barthel Index ........................................................................... 236
Appendix 3. Permission to Use Charlson Co-Morbidity Index ............................................ 240
Appendix 4. Formula System for Charlson Co-Morbidity Index Score ............................... 241
Appendix 5. Data Collection Form ....................................................................................... 243
Appendix 6. NUS IRB Approval Certificate ........................................................................ 247
Appendix 7. Supplementary Material for Chapter Three ...................................................... 250
Appendix 8: Additional Details to Add to Database ............................................................. 267
Appendix 9: Proposed Conversion of Shah Modified Barthel Index to ElderShield Disability Levels ..................................................................................................................................... 269

xvi
List of Abbreviations (by alphabetical order)
ADL Activity of Daily Living AFG Absolute Functional Gain AIC Agency for Integrated Care AMKTHKH Ang Mo Kio Thye Hua Kwan Hospital BBA Balance Budget Act BI Barthel Index BVH Bright Vision Hospital CIHI Canadian Institute for Health Information FDW Foreign Domestic Worker FIM Functional Independence Measure HHA Home Health Agency IADL Instrumental Activity of Daily Living ICF International Classification of Functioning, Disability and Health ICIDH International Classification of Impairments, Disability and Handicaps ILTC Intermediate and Long-Term Care IRB Institutional Review Board IRF Inpatient Rehabilitation Facility KI Katz Index LOS Length of Stay LOS-EFF Length of Stay – Efficiency LTCH Long-Term Care Hospital MMSE Mini-Mental State Examination MOH Ministry of Health (Singapore) MRFS Montebello Rehabilitation Factor Score MRFS-R Montebello Rehabilitation Factor Score (Revised) NLTCS National Long-Term Care Survey NRS National Rehabilitation Reporting System NUS National University of Singapore PAC Post-Acute Care PALS Participation and Activity Limitation Survey PAR Post-Acute Rehabilitation PhD Doctorate in Philosophy PPS Prospective Payment System PRT Progressive Resistance Training RCCH Ren Ci Community Hospital REs Rehabilitation Effectiveness REy Rehabilitation Efficiency RFE Relative Functional Efficiency RFG Relative Functional Gain SACH St Andrew’s Community Hospital SD Standard Deviation SLH St Luke’s Hospital SNF Skilled Nursing Facility UDSMR Uniform Data System for Medical Rehabilitation UK United Kingdom UN United Nations US/USA United States / United States of America USHCFA US Health Care Financing Administration VWO Voluntary Welfare Organization WHO World Health Organization

xvii
List of Nomenclature
Term Definition Source
Disability An umbrella term for impairments, activity
limitations or participation limitations WHO’s International
Classification of Impairments, Disability and Handicaps (ICIDH)
Disabled Persons
Persons who have long-term physical, mental, intellectual, or sensory impairments which in interaction with various barriers may hinder their full and effective participation in society on an equal basis with others
UN’s Draft Convention on the Rights of Persons with Disabilities
Rehabilitation The active process by which those disabled by injury/disease achieve a full recovery, or if full recovery is not possible, realise their optimal physical, mental and social potential and are integrated into their most appropriate environment
WHO’s 2006-2011 Action Plan on Disability and Rehabilitation
Post-Acute Care
Care provided after patients are discharged from acute hospital stays
US Department of Health and Human Services
Older Person - Person aged 60 years and above
- UN
- Person aged 65 years and above
- WHO*
Functional Assessment Tool
An instrument to measure the functional status of a person (e.g. Barthel Index, Functional Independence Measure, etc)
Rehabilitation Index
A composite formula involving functional assessment which measures a rehabilitation outcome
* WHO’s definition of an older person is used in the thesis.

1
CHAPTER ONE: INTRODUCTION
1. Disability and Disabled Persons
In 1980, the World Health Organization (WHO) first published the International
Classification of Impairments, Disability and Handicaps (ICIDH)1 and in 2001, ICIDH was
revised and renamed the International Classification of Functioning, Disability and Health
(ICF)2. This international classification of disability has provided a unified and standard
language and framework for the description of function, disability and health, and has been
widely used as a clinical, social policy, educational and research tool. Disability is defined by
the ICF as “an umbrella term for impairments, activity limitations or participation
limitations”.3 In 2006, another international body, the United Nations, defined “persons with
disability” in their Draft Convention on the Rights of Persons with Disabilities as “those who
have long-term physical, mental, intellectual, or sensory impairments which in interaction
with various barriers may hinder their full and effective participation in society on an equal
basis with others”.4 This definition is also useful as it also recognizes that there are multiple
domains to disability and emphasizes the rights of disabled persons in society.
WHO estimates that 10% of the world population (approximately 650 million people) will
experience some form of disability in their lifetime.5 Disabilities are commonly associated
with chronic conditions such as neurological illness, cardiovascular disorders, chronic
respiratory diseases, cancer, diabetes mellitus, injuries (including fractures) and mental
illness. The number of persons with disabilities is expected to increase as a result of global
population growth, population ageing and increasing life expectancy, and will place
considerable demands on healthcare and rehabilitation services. In 2005, the World Health

2
Assembly requested the WHO to focus on ensuring that all persons with disabilities live in
dignity with equal rights and opportunities. This led to the formulation of the WHO Action
Plan on Disability and Rehabilitation by the WHO Disability and Rehabilitation Department.6
The plan recognises that disability has yet to be given the attention it deserves, both as a
development issue and a human rights issue. Personal mobility is also recognized as a
fundamental human right in Article 20 of the United Nations Convention on Rights of
Persons with Disabilities.
In 2002, the 2nd World Assembly on Ageing adopted and endorsed the Madrid International
Plan of Action on Ageing.7 In this international document, it was recognized that the
incidence of disability increases with age and it is essential to promote maximal functional
independence among disabled older persons and empower them to participate fully in all
aspects of society. The document also recommended that older persons with disability should
be provided with physical and mental rehabilitation, and assistive technologies so they can be
as fully integrated into society as possible.
In summary, disability is prevalent, especially among older persons, and rehabilitation should
be provided to maximise recovery and function in order to fully re-integrate disabled persons
into society and regain self dignity.

3
2. Post-Acute Rehabilitation - A Comparison between US, Canada &
Singapore
Rehabilitation is the “active process by which those disabled by injury/disease achieve a full
recovery, or if full recovery is not possible, realise their optimal physical, mental and social
potential and are integrated into their most appropriate environment", as defined by WHO.6
Rehabilitation begins after the acute disabling condition (e.g. stroke) is fully investigated and
stabilized, and the newly disabled patient is capable of commencing therapy. However, post-
acute care (PAC) which includes post-acute rehabilitation is defined by the US Department of
Health and Human Services as “care provided after patients are discharged from acute
hospital stays”.8 In Singapore and many other countries including the US, inpatient
rehabilitation departments exist in acute hospitals and since rehabilitation is provided during
the acute hospital stay, rehabilitation provided within acute hospitals does not constitute post-
acute care based on the definition by the US Department of Health and Human Services.
Moreover, inpatient rehabilitation provided in acute hospitals focus on initiating
rehabilitation as early as possible after a disabling event during a short length of stay (usually
for a several days), while inpatient rehabilitation provided by a dedicated inpatient
rehabilitation facility (IRF) (termed “community hospitals” in Singapore) focuses on longer
term rehabilitation and hence longer length of stay (usually over several weeks). Community
hospitals are part of the intermediate and long term care (ILTC) healthcare system of
Singapore which includes non-acute and non-primary care healthcare services. Although
community hospitals provide mainly rehabilitation, it also offers sub-acute, chronic sick and
respite care. Community hospitals are also distinct from acute hospitals in that the former do
not offer acute emergency services or provide expensive ancillary services such as
computerized tomography or magnetic resonance imaging services. In Singapore, the funding

4
system for inpatient rehabilitation in acute hospitals is different from inpatient rehabilitation
in community hospitals (see subsequent section on Singapore for further details). As my
thesis is based on community hospitals in Singapore, I will be focusing on post-acute
rehabilitation and in this instance, refer to the term “acute” as describing a level of care as
opposed to a clinical meaning (i.e. sudden onset of a disabling condition).
Rehabilitation participation and provision are often determined by the funding mechanisms
and healthcare system it is structured in. In the sections which follow, the funding system and
structure of rehabilitation service provision for US, Canada and Singapore will be described
and compared. These three countries were chosen because (1) my thesis will be based on data
from Singapore, (2) I am doing my PhD thesis with a Canadian university and it would be
contextually relevant to include a comparison with Canada’s national rehabilitation system,
and (3) the US are neighbours with Canada and is comparatively productive in rehabilitation
research.
2.1. United States (US)
Escalating expenditure for US Medicare's post-acute care benefits - from about $2.5 billion in
1986 to more than $30 billion in 1996 - catalyzed the creation of the 1997 Balance Budget
Act (BBA) which mandated prospective payment systems for skilled nursing facilities
(SNFs), home health agencies (HHAs) and inpatient rehabilitation facilities (IRFs), and
legislated a prospective payment system for long-term care hospitals (LTCHs). Changing
from a retrospective to a prospective payment system (PPS) for post-acute care represented a
major policy response to the expenditure escalation, but did not address other cost, quality,

5
and access concerns.8 Medicare currently treats these groups of post-acute care providers
differently in terms of payment eligibility and certification as follows:
2.1.1 Skilled Nursing Facilities (SNFs)
Current eligibility for SNF benefit is restricted to persons who have had a hospital stay of at
least three days within the 30 days before admission into SNF. Coverage is limited to a
maximum of 100 days within the SNF for each illness episode. There is no deductible for
SNF care but after the first 20 days of a stay, a daily co-insurance payment is required from
the beneficiary. In addition to these eligibility, coverage, and cost-sharing provisions, SNFs
must also have a transfer agreement with a hospital to accept patients recommended for SNF
care; sufficient staff to provide 24-hour nursing services; a physician who supervises patient
care and is available 24 hours a day on an emergency basis; and dietary, pharmaceutical,
dental, and medical social services available. Rehabilitation services are not mandatory for
SNFs and it is estimated that only about 10% of SNFs provide rehabilitation.9
2.1.2. Home Health Agencies (HHAs)
Currently, Medicare provides health benefits to HHA beneficiaries who require intermittent
or part-time skilled nursing care and therapy services, and who are homebound which is
flexibly defined to include individuals who "occasionally leave the home". These services
must be prescribed and eligibility re-certified every 62 days by a physician. However, there is
no prior hospitalization requirement or limit on the number of HHA visits a person may
receive, nor is there any co-payment or deductible associated with home health visits

6
(although persons requiring durable medical equipment need to contribute a 20 percent co-
payment to purchase them).
2.1.3. Inpatient Rehabilitation Facilities (IRFs)
Eligibility for IRF benefits from Medicare is physician-determined. Rehabilitation hospitals
must demonstrate that 75% of their patients have at least one of ten specific conditions (nine
related to neurological or musculoskeletal disorders, plus burns). Patients must require
frequent physician involvement, 24-hour rehabilitation nursing, generally at least three hours
of therapy a day, and care by a coordinated group of skilled professionals. In order for
Medicare to cover IRF services, patients are expected to improve as a result of therapy. IRFs
have a deductible for each episode of illness, a daily co-insurance rate (after the first 30
days), and a maximum length of stay of 90 days per episode of illness.
2.1.4. Long-Term Care Hospitals (LTCHs)
Like IRFs, LTCHs’ benefit criteria from Medicare are also physician-determined and LTCHs
have a deductible for each episode of illness, a daily co-insurance rate (after the first 30
days), and a maximum length of stay of 90 days per episode of illness. However, unlike IRFs,
the 75% rule does not apply to LTCHs but they must preserve an average length of stay of at
least 25 days. Like SNFs and IRFs, LTCH patients must also receive frequent physician
involvement, 24-hour rehabilitation nursing, generally at least three hours of therapy a day,
and care by a coordinated group of skilled professionals.

7
All post-acute care providers, except SNFs, may be ‘deemed’ to meet certification
requirements by a national accreditation board if they are found to meet or exceed Medicare
conditions for participation. The US Health Care Financing Administration (USHCFA)
recommended against deemed status for SNFs because accrediting organizations were found
to have incomparable standards and processes, and the USHCFA had concerns about the
minimal physician involvement in SNFs and vulnerability of patients served.
Medicare still treats the four types of post-acute care providers differently even though they
are becoming progressively similar in the types and intensity of services they deliver, as well
as the types of patients they serve.9 Another concern about the US Medicare system is that
current policy incentivizes PAC services to discharge patients for financial rather than quality
of care reasons, and this creates access problems for patients who need longer and greater
care.
2.2. Canada
As Canada has a predominantly publicly financed health system, the funding for inpatient
rehabilitation is publicly funded. However, the funding of outpatient rehabilitation which
generally occurs in physiotherapy clinics depends on the provincial/territorial health plan or
workers’ compensation benefits, or the benefits conferred through employment-based private
health insurance policies. Some home care physiotherapy and workplace occupational
therapy may also be available, although all of these services can also be purchased out-of-
pocket by those able to afford them.10

8
Rehabilitation in Canada can occur within or outside hospitals. The Canadian Institute for
Health Information (CIHI) developed the National Rehabilitation Reporting System (NRS) to
collect data on inpatient rehabilitation episodes to support inpatient rehabilitation service
planning and policy development. The NRS includes only clients with a primary health
condition that is physical in nature so it excludes rehabilitation provided for mental health
conditions and drug or alcohol addiction. As of 2007, 94 IRFs from Newfoundland,
Labrador, Nova Scotia, New Brunswick, Ontario, Saskatchewan, Alberta and British
Columbia submitted data to CIHI’s NRS.11 However, approximately 86% of all NRS data are
submitted by participating NRS facilities in Ontario alone because rehabilitation facilities in
this province must submit data to NRS to receive funding. The NRS subdivides IRFs in
Canada into two groups, general facilities and specialty facilities, but this classification may
be inconsistent with facility classification methods used in various provinces or regions. The
NRS defines a general rehabilitation facility as a rehabilitation unit or collection of beds
designated for rehabilitation purposes and is part of a general hospital offering multiple levels
or types of care. A specialty rehabilitation facility is defined as one that provides more
extensive and specialized inpatient rehabilitation services and is commonly a freestanding
facility or a specialized unit within a hospital. It is the rehabilitation team at the facility who
decides which profile most closely represents its rehabilitation program. The latest NRS
annual statement reported that that almost two-thirds (64%) of all clients were admitted to
general facilities and one-third (36%) were admitted to specialty facilities.10 There was little
information on rehabilitation provided in Canadian SNFs because there are no Canadian
SNFs per se, although a study on all stroke patients admitted into SNFs from Ohio and
Michigan (USA) and Ontario (Canada) reported that rehabilitation therapy was given to over
95% of residents for whom discharge was expected within 90 days and to over 60% of
residents for whom discharge was uncertain or not expected.12

9
2.3. Singapore
Similar to Medicare in the US, community hospitals and nursing homes which are partially
funded by the government require periodic certification. Although government subvention for
Singapore’s ILTC sector (which includes community hospitals, day rehabilitation centres and
nursing homes) still function on a retrospective payment system, conversion of all ILTC
funding to PPS is currently being considered.
In Singapore, post-acute care services are largely similar to US Medicare system with a few
differences. Firstly, our inpatient rehabilitation services are generally only found in two types
of hospitals: acute hospitals (which are run by the government) and community hospitals
(which are part of Singapore’s ILTC system and run by voluntary welfare organizations
[VWOs]). The funding for rehabilitation departments within acute hospitals follows the
nationwide public acute hospital funding system where annual expenditure is largely borne
by the government (90%). In contrast, the annual expenditure of community hospitals is co-
shared by the government (60%) and the VWO running the community hospital (40%).
Inpatient rehabilitation in public-run acute hospitals is considered as acute care as they follow
acute hospital funding and policies, and are not required to adhere to local ILTC sector
regulations. For example, the means-testing system to determine the eligibility of patients for
government subsidies at different tiers is different between acute hospitals13 and community
hospitals14. Means testing is a way to focus limited resources for needy Singaporeans, by
channelling government subsidies to those who need it most. Lower-income patients receive
more subsidies than the higher-income patients at these facilities. Nevertheless, patients will
still retain their freedom to choose their ward class. Any patient, regardless of whether they

10
are rich or poor, can choose to be admitted to subsidized wards (i.e. a Class C or B2). They
will still be heavily subsidised, but at different rates. Higher-income patients will be
subsidised less than lower-income patients, but their bills will remain affordable. A higher
salaried patient in Class C will still receive higher subsidy in than if he opted for Class B2.*
Hence, locally, community hospitals are more similar to Medicare’s IRF than rehabilitation
units in acute hospitals. Similar to both US Medicare’s IRFs and LTCHs, Singapore’s
community hospitals are required to provide frequent physician involvement (a doctor’s
review at least every 2 days), 24-hour rehabilitation nursing, therapy twice a day (generally
morning and afternoon), care by a coordinated group of skilled professionals and a maximum
length of stay of 90 days per episode of illness. However, our community hospitals do not
have a “75% rule” like US Medicare’s IRFs and are not required to maintain an average
length of stay like US Medicare’s LTCHs. As all community hospitals in Singapore provide
specialized rehabilitation in a freestanding facility, they are similar to specialty rehabilitation
facilities as defined by Canada’s NRS.
Unfortunately, home rehabilitation is practically non-existent in Singapore except for a
handful of private rehabilitation therapists who provide home rehabilitation on an ad-hoc
basis. As of December 2011, Singapore has 63 nursing homes (private and VWO) which are
equivalent to SNFs and like with US Medicare, only a minority offer skilled inpatient
rehabilitation.15 Unlike US Medicare, non-residential day rehabilitation centres and social day
care centres with rehabilitation services are a part of Singapore’s ILTC system, and
* Means testing is a way to focus limited resources for needy Singaporeans, by channelling government subsidies to those who need it most. Lower-income patients receive more subsidies than the higher-income patients at these facilities. Nevertheless, patients will still retain their freedom to choose their ward class. Any patient, regardless of whether they are rich or poor, can choose to be admitted to subsidized wards (i.e. a Class C or B2). They will still be heavily subsidised, but at different rates. Higher-income patients will be subsidised less than lower-income patients, but their bills will remain affordable. A higher salaried patient in Class C will still receive higher subsidy in than if he opted for Class B2.

11
government subsidies for rehabilitation are available at these centres. As of December 2011,
Singapore has 31 day rehabilitation centres and 10 social day care centres with rehabilitation
services scattered throughout the country.16
According to our MOH guidelines, it is generally recommended that rehabilitation units in
acute hospitals cater to younger patients where the goal is to return the patient to the
workforce while rehabilitation in community hospitals cater to older patients where the goal
is to return the patient to their homes.17 As a result, staff in rehabilitation units in acute
hospitals are trained in specialized fields such as traumatic spinal injury while staff in
community hospitals are trained in geriatric medicine. Correspondingly, the mean age of
patients admitted into community hospitals is generally older than those who are admitted
into acute hospital rehabilitation departments. In a study on all patients admitted into a
rehabilitation department of a local acute hospital, the mean age was 61.3years18 whereas the
mean age of community hospital patients from 1995 to 2005 was 74.1 years (see Chapter 2).
The age profile of patients admitted for rehabilitation in US Medicare’s IRFs and Canada’s
CIHI’s NRS are more similar to Singapore’s community hospitals than acute hospitals: the
mean age of US Medicare’s IRFs stroke patient population in 2006-2007 was 76.0 years19
and Canada’s NRS patient population was 70.3 years10.
Table 1 provides a summary of the key differences in post-acute rehabilitation between
United States, Canada and Singapore.
As inpatient rehabilitation in PAC settings mainly serves older persons and as my thesis will
be based on patients admitted into community hospitals in Singapore, I will focus on older

12
persons when I review the epidemiology of physical disability and evidence for rehabilitation
in subsequent sections.

13
Table 1. Comparison of Post-Acute Rehabilitation between US, Canada and Singapore
United States Canada Singapore
(Medicare System) Outpatient
• Home Health Agencies
(HHA): o For homebound o Includes
rehabilitation services
Outpatient
• Not publicly funded
Outpatient
• Home rehabilitation: o Not publicly funded
• Day rehabilitation centres: o Follows ILTC means-testing (MT) system o Public subsidy depends of patient’s MT category
after testing Inpatient
• Skilled Nursing Facilities
(SNF): o Only 10% of
SNFs provide rehabilitation
• Inpatient Rehabilitation
Facilities (IRF): o Required to
provide >3 hrs of rehabilitation per day
o Patients expected to improve functionally
o “75% rule” applies*
o Mean age of patients: 76.0 years
• Long-Term Care Hospitals
(LTCH): o Similar to IRF
except “75% rule” does not apply*
Inpatient
• Publicly funded
• Inpatient Rehabilitation Facilities (IRF): o Monitored by National Reporting System (NRS) o Two main types of IRF:
� General (64%):
• Definition: Rehabilitation unit or collection of beds designated for rehabilitation purposes and is part of a general hospital offering multiple levels or types of care
� Specialized (36%):
• Definition: Provides more extensive and specialized inpatient rehabilitation services and is commonly a freestanding facility or a specialized unit within a hospital
o Mean age of patients: 70.3 years
Inpatient
• Inpatient Rehabilitation Facilities (IRF): o Two main types of IRF:
� Acute hospitals:
• Mostly run by government
• Follows acute hospital MT system
• % of annual expenditure which is publicly subsidized: 90%
• Mean age of patients: 61.3 years � Community hospitals:
• Mostly run by voluntary welfare organizations
• Follows ILTC MT system
• % of annual expenditure which is publicly subsidized: 60%
• Mean age of patients: 74.1 years

14
ILTC: Intermediate and long term care MT: Means-testing * 75% rule = 75% of their patients have at least one of ten specific conditions (nine related to neurological or musculoskeletal disorders, plus burns)

15
3. Epidemiology of Physical Disability in Older Persons
WHO defines an older person as aged 65 years and above while the United Nations defines
an older person as aged 60 years and above.20 Older persons are often sub-classified as the
young-old (those aged between 60 to 75 years or between 65 to 80 years old) and the old-old
(those aged 75 and above or 80 years and above). The basis for these two sub-categories is
that disability and frailty are more prevalent among the old-old. However, these definitions
only consider chronological age and not functional age. In recent years, researchers in the
fields of geriatric psychiatry and frailty have recommended the use of functional age as a
more accurate measure of age in older persons than chronological age because the former
correlates better with cognitive health and life expectancy.21,22 They have argued that a
chronologically older person who is functionally independent should be considered younger
than a chronologically younger person who is completely dependent. For example, a disabled
50 year old person may resemble an “older person” more closely than a seventy year old
active retiree. Nevertheless, chronological age remains the easiest method of defining an
older person.
3.1. Prevalence
Physical disability is more often associated with older persons, especially the old-old (age 75
years and above).
For example, in Canada, based on the 2006 Participation and Activity Limitation Survey
(PALS) which is done every 5 years, the prevalence of disability among adults aged 65 years
and above was 33.1% (about 1.3 million people), with the prevalence (including both

16
genders) increasing from 23.8% for those in the 65-74 years age-group, to 40.7% for those in
the 75-84 years age-group and to 60.5% for those in the 85 years and above age-group.23
PALS defined persons with disabilities as those who reported difficulties with daily living
activities, or who indicated that a physical or mental condition or health problem reduced the
kind or amount of activities they could do. The respondents’ answers to the disability
questions represented their perception of the situation and were therefore subjective. Women
aged 65 years and older are more likely to report mobility limitations than their male
counterparts, with 37.2% of all women in Canada aged 65 years and over reporting mobility
limitations compared to 28.1% of men.
In Singapore, where only about 7% of its population was aged 65 years and above in 1997, a
study by Yadav in the same year found that 20.5% of Singaporeans aged 60-64 years were
handicapped whereas 64.6% of those aged above 85 years were handicapped.24 He also
found that severity of handicap increased with older age. Yadav had defined a handicap as “a
limitation to perform one or more tasks associated with daily living (namely self-care,
mobility and verbal communication) due to a disability” which was based on WHO’s
definitions used in the ICIDH.
These findings are in contrast to the national survey of community-living non-
institutionalised senior citizens aged 55 years and above (done two years earlier in 1995)
which found that the prevalence of disability in activities of daily living (ADL) was low in
Singapore; only 1.9% of those studied needed supervision or assistance in mobility; and 2%
were dependent in toileting, 1.1% in feeding, 2.7% in bathing and grooming; and 1.1% were
incontinent.25 However, when analyzing those aged 75 years and above, 6.0% needed
supervision or assistance in mobility, and 6% were dependent in toileting, 3.7% in feeding,

17
8.1% in bathing and grooming and 3.7% were incontinent. These percentages would have
been higher if elderly residing in nursing homes were included in the study. These different
results also highlight that the prevalence rate of disability depends on the definitions used (i.e.
although the prevalence of ADL limitation is high in the community, most do not need
supervision or assistance).
3.2. Incidence
The physical disability status of an elderly person is also not static. Hardy and Gill found that
81% of newly disabled community-dwelling elderly aged 70 years and above in the US
regained independence in four key ADLs (bathing, dressing, walking and transferring) within
21 months of their initial disabling episode, and the majority remained independent for at
least another 6 months.26 Moreover, older persons may experience several episodes of
disability in their lifetime with recovery after each episode. Hardy and Gill reported in
another paper that they had assessed ADL function in the above same cohort on a monthly
basis.27 They defined the prevalence rate of disability as the number of participants who
reported disability for that month divided by the number of participants who had a telephone
interview that month. They also defined the cumulative rate of disability as the number of
participants who reported disability in that month or any preceding month divided by all
active participants and those who had developed disability before being censored for reasons
of death or loss to follow-up. They found that the cumulative rate of disability was 2 to 5
times higher than the prevalence rate of disability in elderly. Their findings suggest that
disability in older persons is a highly dynamic process which may be inadequately
characterized by surveys with long assessment intervals. Disability for many older persons is
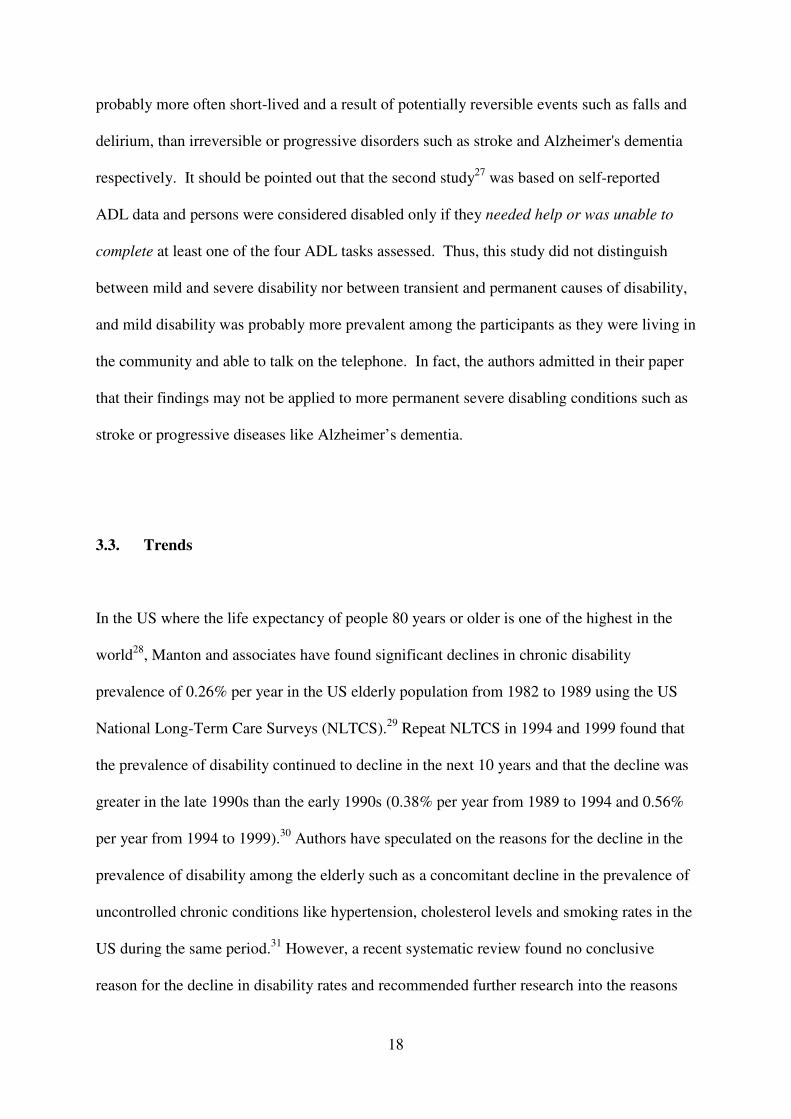
18
probably more often short-lived and a result of potentially reversible events such as falls and
delirium, than irreversible or progressive disorders such as stroke and Alzheimer's dementia
respectively. It should be pointed out that the second study27 was based on self-reported
ADL data and persons were considered disabled only if they needed help or was unable to
complete at least one of the four ADL tasks assessed. Thus, this study did not distinguish
between mild and severe disability nor between transient and permanent causes of disability,
and mild disability was probably more prevalent among the participants as they were living in
the community and able to talk on the telephone. In fact, the authors admitted in their paper
that their findings may not be applied to more permanent severe disabling conditions such as
stroke or progressive diseases like Alzheimer’s dementia.
3.3. Trends
In the US where the life expectancy of people 80 years or older is one of the highest in the
world28, Manton and associates have found significant declines in chronic disability
prevalence of 0.26% per year in the US elderly population from 1982 to 1989 using the US
National Long-Term Care Surveys (NLTCS).29 Repeat NLTCS in 1994 and 1999 found that
the prevalence of disability continued to decline in the next 10 years and that the decline was
greater in the late 1990s than the early 1990s (0.38% per year from 1989 to 1994 and 0.56%
per year from 1994 to 1999).30 Authors have speculated on the reasons for the decline in the
prevalence of disability among the elderly such as a concomitant decline in the prevalence of
uncontrolled chronic conditions like hypertension, cholesterol levels and smoking rates in the
US during the same period.31 However, a recent systematic review found no conclusive
reason for the decline in disability rates and recommended further research into the reasons
19
for these improvements to better predict future healthcare demand among the elderly.32
Nevertheless, it must be noted that although the prevalence of disability among Americans
aged 65 years and over has decreased in the US, the absolute number of disabled Americans
aged 65 years and over has increased from 6.4 million in 1982 to 7.3 million in 1996 because
of the increase in the size of the elderly population during the same period. It should also be
noted that Manton defined a disability as the inability to perform one or more IADL
(instrumental activity of daily living) due to illness or ageing or the inability to perform one
or more ADL without personal assistance or the use of special equipment. Thus, the severity
of ADL disability was not taken into consideration in his studies and included IADL
disability. Among disabled community-living elderly in the US, spending growth among the
least disabled has been growing more quickly than among the most disabled which offsets
some of the cost savings associated with declining disability rates.33
In Canada, based on the PALS was done in 2001 and 2006, the prevalence of disability for
adults aged 65 years and above (including both genders) increased from 31.5% in 2001 to
33.1% in 2006.23,34 During this period, disability rates increased in all provinces and
interestingly, the largest increase (+26.6%) occurred in the number of people reporting mild
disabilities, while the smallest increase (+16.4%) occurred in the number reporting very
severe disabilities.35 However, it is not absolutely certain whether this increase is due to
change in disability profiles, reporting practices or a combination of the two. Population
aging was one of the factors that have contributed to the increase in the disability rate in
Canada since 2001 but it did not explain the entire gain. When the impact of population aging
on disability rates was controlled using age-standardized disability rates, researchers
estimated that only about 40% of the disability rate increase could be explained by population

20
aging.35 However, population aging explained more of the increases in the Atlantic provinces
because their populations are among the oldest in Canada.
In Singapore, a national survey of senior citizens is conducted periodically to monitor trends
among elderly persons in the population, including mobility and ADLs. There have been
three surveys conducted so far, one in 198336, another in 199526 and the last one in 200537.
Although the same sampling methodology was employed for all three surveys, the types of
ADLs assessed varied between the three surveys. Figure 1 illustrates the rising trend in the
proportion of the elderly aged >75 years who require walking aids or supervision in mobility
or total physical assistance:
Figure 1: % of Population Aged >75 Years with Impaired Mobility (1983, 1995 & 2005)
Figure 2 illustrates the rising trend in the proportion of the elderly population aged 75 years
and above who require assistance for 5 ADLs:
13.6
10.2
20.3
0
5
10
15
20
25
1983 1995 2005
% o
f P
op
ula
tio
n
Year of National Survey of Senior Citizens
Impaired Mobility of 75 Years Old and Above in Singapore
Require walking aids/need supervision with walking aids/require total physical assistance

21
Figure 2: % of Population Aged >75 Years with ADL Dependency (1983, 1995 & 2005)
As Singapore’s national surveys of senior citizens do not report age-standardized disability
prevalence rates beyond 75 years, it is uncertain if the increasing trend in ADL dependency
among those aged >75 years is due to increases in life expectancy in this age group or
increases in age-standardized rates of disability. Nevertheless, in contrast to the US, there is a
suggestion that prevalence of disability among those aged ≥75 years is increasing in
Singapore and this is a concern.
0.9
5.3
2.1
0
1.9
Not
done
11.2
1.8
6.0
10.1
Not
done
3.7
10.7
0
2
4
6
8
10
12
1983 1995 2005
% o
f P
op
ula
tio
n
Year of National Survey of Senior Citizens
Trend in ADL Dependency of 75 Year Olds and Above in Singapore
Unable to feed independently
Unable to bathe / bathe & groom independently
Unable to dress independently
Unable to go to toilet / toilet independently
Incontinent
8.1
3.7
22
4. Evidence for Rehabilitation of Older Persons
Rehabilitation in the elderly has been extensively studied. For example, a PubMed search on
14 November 2010 using the Medical Subject Headings (MeSH) search terms
“rehabilitation” and “aged” yielded 37,323 papers. Using the same MeSH terms but limiting
the search to meta-analyses or review papers alone still yielded 1,913 papers, illustrating the
extent of knowledge synthesis on elderly rehabilitation that currently exists in literature.
Hence, I have opted to summarize the evidence for elderly rehabilitation using recent high-
quality reviews (i.e. systematic reviews and meta-analyses) and key papers on the topic.
4.1. Inter-Disciplinary Approach
There is strong evidence to support inter-disciplinary inpatient rehabilitation of older adults,
especially for stroke. In an evaluation of English-language systematic reviews that examined
inter-disciplinary therapy-based rehabilitation services for adults published in the last five
years, Prvu-Bettger and Stineman found strong evidence supporting the benefits of post-acute
rehabilitation for stroke patients which often included patients above 60 years old.38 Older
subjects who received stroke rehabilitation had better functional outcomes and reduced one-
year mortality, dependency and institutionalization rates.39-41 Other studies have also found
that elderly adults with hip fractures who received inter-disciplinary inpatient rehabilitation
were more likely to be discharged home, exhibit improved physical function at 6 and 12
months, and survive to 6 months after fracture.42-44 However, there is relatively scant
literature for the effectiveness of interdisciplinary therapy-based rehabilitation for other
medical conditions such as Parkinson’s disease and amputations.

23
4.2. Initiation and Duration
Functional recovery is maximized when rehabilitation is initiated as early as possible after an
acute disabling event.45,46 Functional recovery also plateaus after a few months up to a year
after the acute disabling event. For example, in a Copenhagen study, functional recovery
plateaued three months post-stroke for those mildly disabled and five months for those
severely disabled.47 In Scotland, post-stroke functional recovery did not plateau until one year
after acute stroke.48 In both these studies, rehabilitation was continued in the community until
functional recovery plateaued. Nevertheless, studies have also shown that the continuation of
rehabilitation months to years after stroke can still improve functional status (albeit not as
much as before plateau of functional recovery), self-esteem and depression.49-51 Thus,
although most functional recovery occurs in the first few months after an acute disabling
event, rehabilitation may be beneficial over a long period. As it is recognized that there are
diminishing returns from rehabilitation of the elderly compared to younger persons, rigorous
cost-effectiveness studies are needed to examine if the cost of rehabilitation to achieve small
functional improvements outweighs the direct and indirect cost savings from improved
independence in older persons. Unfortunately, such studies are not available yet.
4.3. Intensity
Studies have found a positive relationship between therapy intensity and functional
recovery.52-54 A meta-analysis of randomized controlled trials in older adults found that
progressive resistance training (PRT) is an effective intervention for improving physical
functioning, muscle strength and performance of simple and complex activities.55 Another

24
meta-analysis of randomized controlled trials in older adults found that higher PRT intensities
were superior to lower PRT intensities in improving maximal strength and to a lesser degree,
functional performance.56
4.4. Setting
A recent systematic review of randomised controlled trials on persons aged >60 years and
residing in long-term care facilities found that 33 out of 49 trials reported improvement in
mobility, strength, flexibility and/or balance with rehabilitation.57

25
5. Functional Assessment Tools and their Validity & Reliability
Early measures of function focused on impairment as defined by the WHO’s 1980 ICIDH
model which measured function in terms of muscle strength, sensation, range of motion,
balance, and other physical abilities. As the field of rehabilitation grew and moved beyond
the acute phase of disability, the concerns shifted toward moving individuals back into the
community.58 With this shift in focus, measurements progressed beyond impairment to
assessing disability in terms of activities that individuals perform in their daily life (i.e.
activities of daily living or ADLs). This transition was reflected in the change of focus from
impairment in original ICIDH developed in 1981 to ADLs in the revised ICIDH published in
2001 (and renamed the ICF). The first ADL assessment, the Katz index, was developed in the
late 1950s to assess the elderly and chronically ill within institutionalized settings. In 1971,
Lawton proposed the term instrumental activities of daily living (IADLs) to address higher
level competencies needed by older individuals who were discharged from nursing homes
and returning to the community.59 IADLs encompass the more complex activities needed to
be self-reliant in the community such as shopping, food preparation, money management,
housekeeping and use of transportation.
Functional measures can also be grouped into those that are generic and those that are
designed for specific conditions. Generic measures are designed to assess functional status
(e.g. ADLs) regardless of the cause of an individual’s impairment or disability. Specific
measures are designed to be sensitive to a disease (e.g. Modified Rankin Scale for stroke) or
functional domain (e.g. Berg Balance Scale for balance) of interest. As my PhD thesis is
based on post-acute inpatient rehabilitation facilities which is defined by age rather than by
specific disease or disability domain, I will review three common generic ADL assessment

26
tools used in rehabilitation: (1) the Katz Index (KI) - because it was the first ADL assessment
tool created, (2) the Barthel Index (BI) - because it is the ADL assessment tool used by all
community hospitals in Singapore as recommended by our MOH17, and (3) the Functional
Independence Measure (FIM) instrument which is the most widely used ADL assessment tool
in the international rehabilitation community.
Another concept that is relevant to functional assessments is performance versus capacity.
Performance measures assess what an individual does in real situations whereas capacity
measures assess what an individual can do in a hypothetical or standard situation.60,61 When
measuring performance, issues such as motivation and personality factors can influence
performance. However, performance measures provide a truer picture of the real functional
status than capacity measures. Performance measures also better reflect the assistance an
individual needs to function. On the other hand, capacity measures are more appropriate for
determining the type and course of therapeutic intervention to recommend or prescribe to
patients. In Singapore, BI is scored as a performance measure and not a capacity measure in
community hospitals.17
5.1 Katz Index (KI)
The KI was the first ADL instrument developed and it assesses six ADLs: bathing, dressing,
toileting, transferring, continence and feeding.62 Each ADL has a three-category score:
independent, assistance needed and unable to perform. Unfortunately, there is little evidence
for the validity and reliability of the KI. Criterion validity has only been presented in a few
studies: Two showed the KI correlated highly with the BI63,64 while another two showed it

27
predicted length of hospital stay, discharge destination and mortality.65,66 Katz et al58 reported
that their tool’s inter-rater reliability was r=0.95 but there is no published evidence on its test-
retest reliability.
5.2 Barthel Index (BI)
The BI is a classic ADL assessment instrument. It was originally developed by Mahoney and
Barthel in 1965 and contains 10 items.67 Eight can be described as self-care activities
(feeding, transfer from chair to bed and back; grooming; toileting; bathing; dressing; bowel
and bladder continence), and two as mobility-related activities (walking or propelling a
wheelchair on a level surface with or without devices or prostheses; ascending and
descending stairs). The score ranges from 0 to 100 in discrete values of 5 with higher scores
indicating greater functional independence. Hence, the BI can also be scored from 0 to 20 in
discrete values of 1. There are definitions for each task, it is simple to administer and score,
and requires no training. The BI, like the KI, is typically administered by observation by a
professional caregiver. Administration can range from a few minutes (if completed based on
the caregiver’s knowledge of the individual) to 1 hour (if completed as a test by direct
observation).68
The BI is one of the most widely used measures of functional status and hence has been
extensively tested for validity, reliability and sensitivity.69 As it was the first measure
developed to assess the rehabilitation outcomes, it has served as a benchmark when judging
other measures. In so doing, its criterion validity has, in turn, been established.
D’Olhaberriague et al reviewed a number of disability measures used in assessing individuals

28
with stroke and concluded that the BI correlated highly with a wide variety of post-discharge
outcomes, supporting the criterion validity for the BI.70 Studies of subjects a year after
stroke71 and subjects with recent hip fractures72 showed that although the BI was responsive
to change, it demonstrated both floor and ceiling effects. However, a study by van der Putten
et al comparing the responsiveness of the BI and the FIM in individuals with multiple
sclerosis and stroke showed similar floor and ceiling effects between the two measures.73
Although the FIM was developed to be more comprehensive and sensitive to change than the
BI, they also found that the FIM had no advantage over the BI and the latter was relatively
easier and quicker to administer. Reliability of the BI has been demonstrated in numerous
studies and test-retest, intra-rater and inter-rater reliability have been shown to be high by
correlation methods (r = 0.87, 0.71-0.99 and 0.75-0.99 respectively).74-76 One study has also
shown the BI to be highly reliable when administered during telephone interviews when
compared with face-to-face interviewing, with an intra-class correlation coefficient of 0.89.77
With time, the BI has been modified in many clinical settings to become more sophisticated
and detailed, such as with the Shah-modified BI score.78 The Shah-modified BI is currently
used by all community hospitals in Singapore to quantify functional impairment as
recommended by our MOH. While the original BI only has a range of 20 discrete points and
three levels within each ADL category, the Shah-modified BI has a range of 100 discrete
points and five levels within each ADL category. The Shah-modified BI has been shown to
have better sensitivity than the original BI without affecting the minimum and maximum
weightings relative to the original BI. Scale reliability of the Shah-modified BI is better than
the original BI as the former has higher Cronbach alpha values at both admission and
discharge.79 The Shah-modified BI has been used widely in research80-85 and a Chinese
version has been developed86.
29
5.3 Functional Independence Measure (FIM)
The Functional Independence Measure (FIM) is the most widely accepted and robust
functional assessment measure in the rehabilitation community. It was developed by the
American Congress of Rehabilitation Medicine and the American Academy of Physical
Medicine and Rehabilitation to resolve the long-standing lack of uniform measurement and
data on disability and rehabilitation outcomes needed to determine funding for US
rehabilitation facilities.87 The FIM is an 18-item Likert-like summated rating scale of ADLs
and has been extensively used in neurological and orthopaedic conditions.88,89 The FIM was
designed to assess the “burden of care” based on a person’s need for assistance (human or
equipment) in self care, transfers, sphincter control, locomotion, communication and social
cognition. Each area is scored on a seven level scale, with a score of 1 indicating total
assistance required and a score of 7 indicating complete independence. The total FIM score
can range from 18 to 126.
The psychometric properties and validity of the FIM has been extensively evaluated.69
Ottenbacher et al performed a quantitative review of eleven published studies of FIM
reliability and found that for the total FIM, median inter-rater reliability was 0.95, test-retest
reliability was 0.95, and equivalence reliability between observed and interview scores was
0.92.90 The ability of the instrument to detect meaningful change in level of function during
rehabilitation (i.e. precision) has been observed by Granger et al to be high.91 However, it has
been reported that the FIM cognitive items have a substantial ceiling effect among spinal cord
injury patients at discharge from rehabilitation.92 The FIM may also not be adequate for
assessing outpatient rehabilitation outcomes due to the higher levels of functioning in such

30
settings and the ceiling effect in the FIM.93 The sensitivity of FIM is poor among individuals
with various levels of amputation.94 During inpatient rehabilitation, the FIM is generally
scored by treating professional staff. Post-discharge follow-up scores are typically obtained
by telephone or in-person interview. It takes about at least 10 to 20 minutes to obtain FIM
scores by interview, depending on the interviewer’s familiarity with the FIM instrument and
the functional status of the person.95
Unfortunately, the FIM has not been adopted widely in Singapore because it takes more time
to complete than the BI, requires specialized training to use it competently and needs a
substantial fee payment from users outside the Uniform Data System for Medical
Rehabilitation (UDSMR). Moreover, historically, the majority of therapists and rehabilitation
physicians in Singapore were trained in Australia where the Shah-modified BI is widely used,
and this explains why most non-rehabilitation departments in acute hospitals (e.g. geriatric
medicine and orthopaedics) and post-acute rehabilitation centres in Singapore use the BI
instead of the FIM. Nevertheless, in the recent decade, more acute hospital rehabilitation
physicians have been trained in US and the FIM has been introduced in rehabilitation
departments in acute hospitals.
31
6. Research Agenda for Post-Acute Rehabilitation
In February 2007, a symposium was held in Virginia, USA to set a research agenda and
develop an evidence base for practice and public policy recommendations for post-acute
rehabilitation. Entitled ‘‘State-of-the-Science on Post-Acute Rehabilitation: Setting a
Research Agenda and Developing an Evidence Base for Practice and Public Policy,’’ it
involved a diverse group of invited experts representing US federal government agencies,
private insurers, professional organizations, providers of rehabilitation services, patients and
their advocates, and health researchers. Two of the key themes that emerged from the
symposium were the need for improved indices of rehabilitation outcomes and outcome-
based payment policies that are based on research evidence.96
6.1. Measures of Rehabilitation Outcomes
The symposium participants generally agreed that there are well developed measures of
physical function (i.e. activities of daily living, mobility), especially for persons with
neuromuscular diseases like stroke and injuries like fractures. However, little was known
about the effects of case-mix within a rehabilitation facility (e.g. proportion of disease types
and co-morbidity burden of patients) on outcomes. Symposium participants also agreed that
Medicare’s current PPS assessment and casemix system data was insufficient to serve as
case-mix adjusters. Without data on case-mix factors to allow for adjustment for selection
bias and different prognoses, outcomes across different post-acute rehabilitation settings
cannot be compared. As a result, the provision of financial incentives to optimize
rehabilitation outcomes by fairly adjusting for different case-mix between rehabilitation units

32
(i.e. a pay-for-performance model) remains elusive. Thus, meaningful implementation of pay-
for-performance policies for various conditions must await identification of case-mix factors
which are powerful enough to prevent misuse of such a system.
As a result, the workgroup identified two research priorities: (1) the development of robust
adjusters across different patient populations in post-acute rehabilitation, and (2) evidence-
based outcome measures to support quality improvement efforts and related payment
systems.
6.2. Effectiveness of Post-Acute Rehabilitation
The symposium participants felt that it was important to examine which components of
rehabilitation have the greatest effect using randomized controlled trials or quasi-
experimental study designs, and select outcome measures that are most strongly influenced
by rehabilitation. Symposium participants also felt that effectiveness research should also
identify and use short-term outcome measures which are specifically tied to the anticipated
effects of rehabilitation, in order to build a body of evidence that will inform long-term
outcome research. However, it was acknowledged that case-mix and selection bias were
central issues within post-acute rehabilitation effectiveness research as unknown factors can
affect outcomes in groups of patients. Moreover, payment based on outcomes may have
deleterious effects on patient rehabilitation if not accompanied by case-mix adjustment.
Different stakeholders also valued different outcomes: for example, consumers valued
maximization of functional recovery while rehabilitation funding agencies valued cost-
effective rehabilitation processes.

33
Despite much progress in measurement of functional outcomes, symposium participants felt
that it was imperative that new or improved measures of patient characteristics, treatment
contents and long-term outcomes are developed. To advance this research agenda,
researchers will need to focus on differences among individual patients and how these
differences affect the short and long term outcome of post-acute rehabilitation. Symposium
participants identified several research priorities in this area: To (1) conduct quantitative,
qualitative and mixed methods research to identify the rehabilitation outcomes that were
important to specific stakeholders, and determine how to best measure these outcomes in
different cultures, backgrounds, geographies and disabilities, (2) identify robust short and
long term rehabilitation outcome indices that can be measured across sites and settings for
comparative effectiveness research, and (3) identify the key factors to adjust for these short
and long term rehabilitation outcome indices so that they can be evaluated across sites and
settings in meaningful ways.

34
7. Rehabilitation Outcome Indices and their Validity & Utility
In many current randomised controlled trials in rehabilitation, the key outcome measure is
post-intervention functional status as measured by a functional assessment tool at the end of
the trial and adjusted for the subject’s pre-intervention functional status. However, when the
independent variable (pre-intervention functional status) and dependent variable (post-
intervention functional status) use the same assessment tool, the former will inherently be
strongly correlated with latter and account for most of the variance between independent
variables and the dependent variable in multivariate analysis.97 Moreover, final functional
status as an individual measure is unidimensional as it does not consider speed of functional
recovery or achievement of rehabilitation potential and focuses on a single end-point in time
instead of an episode of care, both of which are important considerations selecting a measure
of quality of care.98,99 Researchers have devised several functional outcomes indices that
account for baseline functional status. However, these functional outcomes indices have been
given different names even though that they share the same formula for calculation which
creates confusion. Hence, in this chapter, I have decided to describe the formula for
calculation and synonyms for these functional outcomes indices, systematically review
published papers using these indices and summarize the details of each paper (i.e. year of
study, study population, country, sample size and ADL measure used) and the factors
independently associated with each rehabilitation index.

35
7.1. Absolute Functional Gain (AFG) / Absolute Efficacy / Total Gain
Absolute Functional Gain (AFG) was coined by Heruti et al in 1999 it is the absolute
difference in functional test score before and after a period of rehabilitation.100
Mathematically, its formula for a period of inpatient rehabilitation (where FIM=Functional
Independence Measure; DC=Discharge; Adm=Admission) is as follows:
AFG = FIMDC - FIMAdm
Other authors have referred to AFG as Absolute (FIM) Efficacy101,102 or Total (FIM)
Gain103,104.
While AFG/Absolute Efficacy/Total Gain considers baseline functional status, this index
does not take into account the potential maximal functional improvement. For example,
Patient A improved his BI score from 20 to 60 whereas Patient B improved his BI score from
60 to 100. Although both patients improved by 40 BI units, Patient A has only reached [(60-
20) / (100-20)] = 40/80 = 50% of his highest possible level of improvement whereas Patient
B has reached his highest possible level of improvement (100%) and is now independent.
AFG also does not consider the rate of functional improvement per unit time. Hence, AFG is
not considered an ideal rehabilitation index.

36
7.2. Rehabilitation Effectiveness (REs) / Montebello Rehabilitation Factor Score
(MRFS) / Relative Functional Gain (RFG)
Rehabilitation effectiveness was a concept first suggested by Heinemann et al in 1987 who
reported the mean percentage of achieved rehabilitation potential of their study population as
55% (standard deviation, SD = 15%).97 However, it was Shah et al who coined the term
Rehabilitation Effectiveness (REs) later in 1990.105 Expressed as a percentage reflecting the
proportion of potential improvement actually achieved during rehabilitation, it can be
calculated using the formula (where DC=Discharge; Adm=Admission; Max=Maximum
possible score):
REs = BIDC - BIAdm
X 100% (if BI is used) BIMax - BIAdm
or
REs = FIMDC - FIMAdm
X 100% (if FIM is used) FIMMax - FIMAdm
REs was renamed Montebello Rehabilitation Factor Score (MRFS) by Drubach et al in
1994106 (and subsequently adopted by other authors107-113) and Relative Functional Gain
(RFG) by other authors114,115.
There are few studies on rehabilitation that have studied the predictors of REs/MRFS/RFG. A
literature review using PubMed search with the terms “rehabilitation effectiveness” or

37
“Montebello rehabilitation factor score” or “relative functional gain” on 31 Dec 11 yielded 16
individual papers which used this rehabilitation index and are detailed in Table 2.116 Of note,
Heruti et al’s study found associations between REs/MRFS/RFG and cognitive impairment
but none with AFG, supporting the superiority of REs/MRFS/RFG as a rehabilitation index
over AFG.100

38
Table 2. Summary of independent factors of poorer REs/MRFS/RFG in studies
S/No. Author(s) Year of
publication Study population Country of study
Sample size
Independent factors associated with poorer rehabilitation outcome
ADL measure
used
Rehabilitation index used
1. Heinemann et al97
1987 Stroke patients in an inpatient rehabilitation unit
USA 176 • Older age
• Lower admission ADL score
• Admission from sources other than home
BI REs
2. Shah et al105
1990 Stroke patients in an inpatient rehabilitation unit
Australia 258 • Older age
• Lower Brunnstrom arm recovery level
• Myocardial infarction
• Longer ‘stroke onset to admission to unit’ time
• Longer ‘admission to unit to start of rehabilitation’ time
• Urinary incontinence
BI REs
3. Heruti et al100
1999 Elderly hip fracture patients admitted into a hospital geriatric rehabilitation department
Israel 224 Cognitive impairment FIM MRFS
4. Lin et al117 2000 Stroke patients in an inpatient rehabilitation unit
Taiwan 110 • Older age
• Lower stage of arm motor recovery
FIM REs
5. Heruti et al112
2002 Elderly stroke patients admitted into a geriatric rehabilitation division at a large, urban, academic, freestanding hospital
Israel 336 • Older age
• Cognitive impairment
• Greater stroke severity
FIM MRFS
6. Jones et al111 2002 Hip fracture patients followed up after discharge from inpatient rehabilitation.
Canada 100 Only descriptive data presented. Telephone FIM
interview
MRFS
7. Micieli et al118
2002 Stroke patients in an inpatient acute stroke unit
Italy 386 Poor adherence to clinical practice guidelines
FIM REs
8. Adunsky et al110
2003 Elderly post hip fracture surgery patients admitted into a large urban academic freestanding hospital
Israel 320 • Cognitive impairment
• Two-step model of orthopaedic surgery followed by transfer to a geriatric rehabilitation facility, as compared with an orthogeriatric
FIM MRFS

39
S/No. Author(s) Year of
publication Study population Country of study
Sample size
Independent factors associated with poorer rehabilitation outcome
ADL measure
used
Rehabilitation index used
setting
9. Rolland et al109
2004 Elderly hip fracture patients admitted into a hospital geriatric rehabilitation unit
France 61 Cognitive impairment FIM MRFS
10. Shiri-Sharvit et al113
2005 Elderly hip fracture patients admitted into a large urban academic freestanding hospital
Israel 263 No difference between those on psychotropic medications and those not
FIM MRFS
11. Hershkovitz et al114
2007 Elderly proximal hip fracture patients admitted into a geriatric rehabilitation centre
Israel 133 • Cognitive impairment
• Pre-injury functional level
FIM RFG
12. Guerini et al115
2007 Patients consecutively admitted with gait disorders due to multiple aetiology in an elderly rehabilitation unit
Italy 103 Sub-cortical vascular lesions BI RFG
13. Luk et al107 2008 Elderly Chinese patients from geriatric rehabilitation units of 2 convalescence hospitals
Hong Kong
778 • Longer length of stay
• Cognitive impairment
• Urinary incontinence
• Lower body mass index
BI & Elderly
Mobility Scale
MRFS
14. Denti et al108 2008 First-stroke patients aged 75 years admitted for active rehabilitation treatment to hospital rehabilitation wards
Italy 359 • Older age
• Cognitive impairment (using cognitive FIM)
• Truncal control (using Truncal Control test)
• Admission functional status (using Rankin and FIM)
FIM MRFS
15. Di Monaco et al119
2011 Right hemispheric stroke patients admitted into a rehabilitation hospital
Italy 107 • Unilateral spatial neglect as measured by behavioural Inattention Tests
FIM FIM efficiency
16. Koh et al120 2011 First stroke patients admitted into a rehabilitation hospital
Singapore 2810 • Older age
• Female gender
• Ethnicity (Malay vs. Chinese)
• Caregiver availability (vs. no caregiver)
BI REs

40
S/No. Author(s) Year of
publication Study population Country of study
Sample size
Independent factors associated with poorer rehabilitation outcome
ADL measure
used
Rehabilitation index used
• Lower admission functional status
• Infarct (vs. haemorrhage)
• Longer ‘stroke onset to admission to unit’ time
• Shorter length of stay
• Dementia

41
From Table 2, independent predictors of poorer REs/MRFS/RFG that have been reported are
(1) older age97,105,108,117,120, (2) lower pre-rehabilitation functional status97,105,114,117,120, (3)
non-acute hospital admissions97, (4) cognitive impairment107,109,100,110,112,114,120, (5) urinary
incontinence105,107, (6) myocardial infarction105, (7) longer ‘stroke onset to admission to unit’
time105,120, (8) longer ‘admission to unit to start of rehabilitation’ time105, (9) poor adherence
to clinical practice guidelines118, (10) orthogeriatric setting (as compared with a two-step
model of orthopaedic surgery followed by transfer to a geriatric rehabilitation facility)110,
(11) sub-cortical vascular lesions115, (12) longer length of stay107, (13) lower body-mass
index107, (14) unilateral spatial neglect119, (15) female gender120, (16) Malay (vs. Chinese)
ethnicity120, (17) caregiver availability (vs. none) 120, (18) cerebral infarct (vs.
haemorrhage)120 and (19) shorter length of stay120.
Table 3 details the independent predictors of REs/MRFS/RFG stratified by study population
[i.e. stroke (8 studies)97,105,108,112,117,118,119,120, hip fracture (4 studies)109,100,110,114, gait disorders
(1 study)115 and elderly (1 study)107]. Overall, there is evidence that older age, lower pre-
rehabilitation functional status and cognitive impairment are predictive of poorer
REs/MRFS/RFG with five, six and eight studies reporting this association respectively. The
evidence for older age and lower pre-rehabilitation functional status being predictive of
poorer REs/MRFS/RFG is stronger in stroke rehabilitation with five studies reporting this
association in stroke rehabilitation each, compared to post hip-fracture arthroplasty
rehabilitation where none and one study reporting these associations respectively.
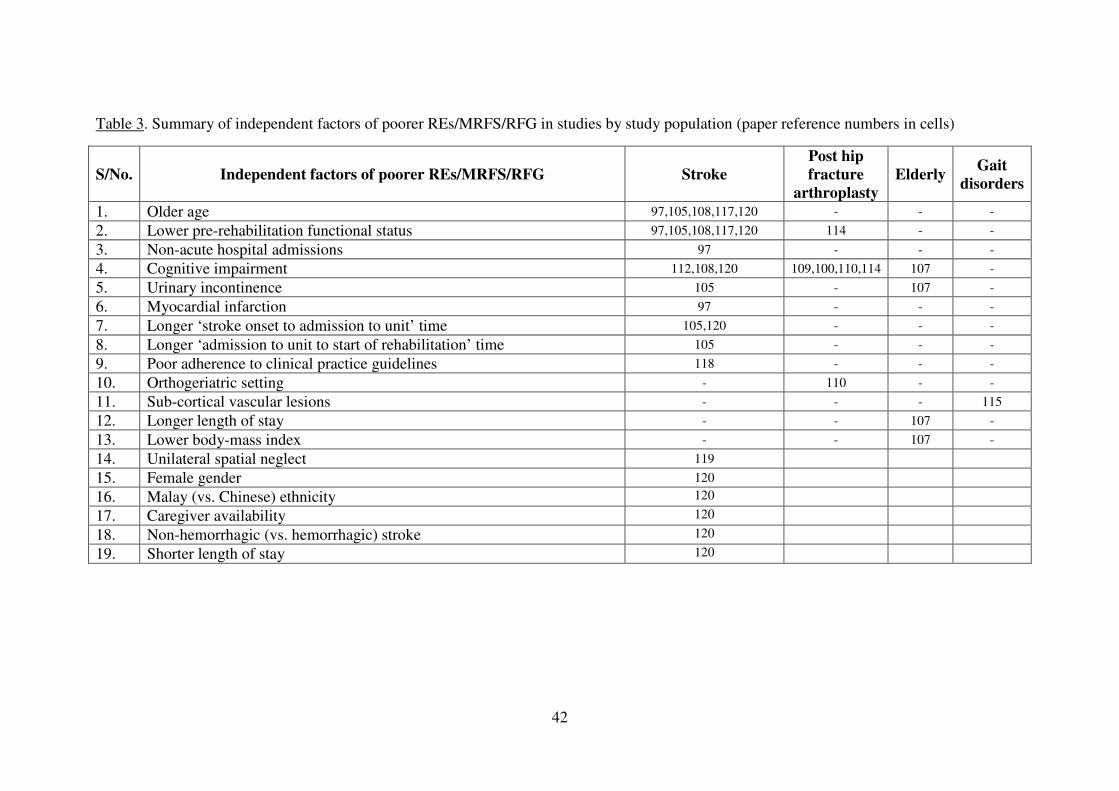
42
Table 3. Summary of independent factors of poorer REs/MRFS/RFG in studies by study population (paper reference numbers in cells)
S/No. Independent factors of poorer REs/MRFS/RFG Stroke Post hip fracture
arthroplasty Elderly
Gait disorders
1. Older age 97,105,108,117,120 - - -
2. Lower pre-rehabilitation functional status 97,105,108,117,120 114 - -
3. Non-acute hospital admissions 97 - - -
4. Cognitive impairment 112,108,120 109,100,110,114 107 -
5. Urinary incontinence 105 - 107 -
6. Myocardial infarction 97 - - -
7. Longer ‘stroke onset to admission to unit’ time 105,120 - - -
8. Longer ‘admission to unit to start of rehabilitation’ time 105 - - -
9. Poor adherence to clinical practice guidelines 118 - - -
10. Orthogeriatric setting - 110 - -
11. Sub-cortical vascular lesions - - - 115
12. Longer length of stay - - 107 -
13. Lower body-mass index - - 107 -
14. Unilateral spatial neglect 119
15. Female gender 120
16. Malay (vs. Chinese) ethnicity 120
17. Caregiver availability 120
18. Non-hemorrhagic (vs. hemorrhagic) stroke 120
19. Shorter length of stay 120

43
7.3 Rehabilitation Efficiency (REy) / Length of Stay Efficiency (LOS-EFF) / BI
Efficiency / FIM Efficiency
The concept of rehabilitation efficiency was also first suggested by Heinemann et al in 1987
who reported the mean rehabilitation efficiency index of their study population as 0.6 units
per day (SD = 0.5 units per day) using the BI.97 Later, Shah et al renamed this concept to
simply Rehabilitation Efficiency (REy).105 It is the amount of functional improvement
divided by the duration of rehabilitation. It can be regarded as the average increase in the
score of a functional assessment tool per day and is calculated using the following formula
(where DC=Discharge; Adm=Admission; Date=Date of functional assessment scoring):
REy = BIDC - BIAdm
(if BI is used) DateDC - DateAdm
or
REy = FIMDC - FIMAdm
(if FIM is used) DateDC - DateAdm
Most researchers use length of stay (LOS) for a hospital stay as the denominator for REy
instead of the number of days between first and final functional assessment scoring. This is
acceptable provided that functional scoring is performed with the first 2 days and last 2 days
of hospital admission. However, as functional scoring may be performed after the second day

44
of admission or much earlier than the day of discharge, it is more accurate to use the date of
first and final functional assessment scoring than hospital LOS as the denominator for REy.
REy is also known as LOS Efficiency (LOS-EFF) and FIM Efficiency. Compared with
REs/MRFS/RFG, there are many more studies which have used REy/LOS-EFF/Efficiency.
A literature review using PubMed search with the terms “rehabilitation efficiency” or “LOS
efficiency” or “FIM efficiency” on 31 Dec 2011 yielded 77 individual papers which used this
rehabilitation index and are detailed in Table 4.

45
Table 4. Summary of independent factors of poorer REy/ LOS-EFF/Efficiency in studies
S/No. Author(s) Year of
publication Study population Country of
study Sample
size
Independent factors associated with poorer rehabilitation outcome
ADL measure used
Rehabilitation index used
1. Heinemann et al97
1987 Stroke patients in an inpatient rehabilitation unit
USA 176 Admission from sources other than home
BI REy
2. Shah et al105
1990 Stroke patients in an inpatient
rehabilitation unit Australia 258 • Older age
• Lower Brunnstrom arm recovery level
• Lower admission ADL score
• Square of admission ADL score
BI REy
3. Chae et al121 1996 Hemorrhagic (n=25) and non-hemorrhagic (n=25) stroke patients matched for age and onset to admission interval, admitted for inpatient rehabilitation
USA 50 Non-hemorrhagic (vs. hemorrhagic) stroke
FIM FIM efficiency
4. Dombovy et al122
1998 Subarachnoid haemorrhage stroke patients admitted into a rehabilitation unit
USA 80 Only descriptive data presented FIM FIM efficiency
5. Huang et al123 1998 Brain tumour (n=63) and acute stroke (n=63) patients matched for age, gender and location of lesion, both admitted for inpatient rehabilitation
USA 126 No difference between brain tumour and acute stroke patients.
FIM FIM efficiency
6. Juneja et al124 1998 Heterogeneous patients admitted into for acute inpatient rehabilitation
USA 45 Poorer balance (as measured by Berg Balance Scale)
FIM FIM efficiency
7. O’Dell et al125
1998 Brain tumour (n=40) and traumatic brain injury (n=40) patients matched for age, gender and admission functional status, both admitted for inpatient rehabilitation
USA 80 No difference between brain tumour and traumatic brain injury patients
FIM FIM efficiency
8. Oden et al126 1998 Post-cardiac stroke (n=19) and other stroke (n=216) patients admitted into an inpatient
USA 235 No difference between post-cardiac stroke and non post-cardiac stroke patients
FIM FIM efficiency

46
S/No. Author(s) Year of
publication Study population Country of
study Sample
size
Independent factors associated with poorer rehabilitation outcome
ADL measure used
Rehabilitation index used
rehabilitation unit
9. Cifu et al127 1999 Adult paraplegic spinal cord injury patients admitted into 20 medical centres
USA 2169 Older age FIM FIM efficiency
10. Gillen et al128 1999 Stroke patients from an acute stroke unit and rehabilitation unit in a hospital
USA 73 Depression (as measured by the Geriatric Depression Scale)
FIM Length of Stay- Efficiency (LOS-EFF)
11. Heruti et al113 1999 Elderly patients admitted for rehabilitation after surgery for hip fracture
Israel 224 Cognitive impairment FIM FIM efficiency
12. Johns et al129 1999 Traumatic brain injury patients with (n=26) and without (n=26) heterotopic ossification on triple-phase bone scan
USA 52 Heterotopic ossification (vs. none)
FIM FIM efficiency
13. Lin et al130 1999 Stroke patients admitted into a rehabilitation unit
Taiwan 163 Only correlational analysis performed. No multivariate analysis was performed.
FIM FIM efficiency
14. McKinley et al131
1999a Neoplastic spinal cord compression (n=29) and matched traumatic spinal cord injury (n=29)
USA 58 No difference between neoplastic spinal cord compression and traumatic spinal cord injury patients
FIM FIM efficiency
15. McKinley et al132
1999b Acute traumatic spinal cord injury patients admitted for rehabilitation
USA 87 Substance abuse (including alcohol) was not associated with FIM efficiency
FIM FIM efficiency
16. McKinley et al133
1999c Spinal cord injury patients admitted into a trauma centre
USA 220 Non-traumatic (vs. traumatic) spinal cord injury
FIM FIM efficiency
17. Moorthi et al134
1999 Patient with encephalitis admitted into a brain injury rehabilitation unit
USA 8 Encephalitis (vs. traumatic brain injury or stroke)
FIM Length of Stay- Efficiency (LOS-EFF)
18. Huang et al135 2000 Brain tumour (n=78) and matched acute traumatic brain injury patients (n=78)
USA 156 No difference between brain tumour and acute traumatic brain injury patients
FIM FIM efficiency
19. Lin et al117 2000 Stroke patients in an inpatient rehabilitation unit
Taiwan 110 • Longer length of stay
• Lower arm motor recovery
FIM REy

47
S/No. Author(s) Year of
publication Study population Country of
study Sample
size
Independent factors associated with poorer rehabilitation outcome
ADL measure used
Rehabilitation index used
stage
20. Adunsky et al136
2001 Acute stroke patients admitted for rehabilitation
Israel 315 • Direct admission from emergency ward (vs. indirect admission via general medical ward)
• Lower admission functional status
• Hemiplegia
FIM Daily FIM gain (FIM efficiency)
21. Gillen et al137 2001 Stroke patients in an inpatient rehabilitation unit
USA 348 • Lower admission ADL Score
• Worse (higher) Geriatric Depression Scale scores
FIM REy
22. Lin138 * 2001 First stroke patients admitted into a university hospital
Taiwan 105 Degree of disability was not associated with REy
FIM REy
23. Lin et al139 * 2001 First stroke patients admitted into a rehabilitation ward in a university medical centre
Taiwan 107 Degree of disability was not associated with REy
FIM REy
24. Marciniak et al140
2001 Brain tumour patients with functional impairment admitted for inpatient rehabilitation
USA 132 • Not receiving radiation therapy during rehabilitation
• Recurrent (vs. after initial diagnosis) tumour
FIM FIM efficiency
25. McKinley et al141
2001 Traumatic spinal cord injury (n=86) and non-traumatic spinal cord injury patients (n=86) matched for age, neurologic level of injury and American Spinal Injury Association impairment classification
USA 172 Type of spinal injury was not associated with FIM efficiency
FIM FIM efficiency
26. Patrick et al142
2001 Elderly patients in an inpatient rehabilitation unit
Canada 110 • Lower admission ADL score
• Greater co-morbidity burden (measured using Cumulative Illness Rating
FIM REy

48
S/No. Author(s) Year of
publication Study population Country of
study Sample
size
Independent factors associated with poorer rehabilitation outcome
ADL measure used
Rehabilitation index used
Scale)
27. Ergeletzis et al143
2002 Stroke patients admitted into inpatient rehabilitation unit
Greece 223 Older age FIM FIM efficiency
28. Lew et al144 2002 Heterogeneous patients admitted for inpatient rehabilitation
USA 175 Only descriptive data presented FIM FIM efficiency
29. McKinley et al145
2002 Traumatic spinal cord injury (n=102) and spinal stenosis-induced spinal cord injury (n=81) patients
USA 183 Spinal stenosis-induced (vs. traumatic) spinal cord injury in tetraplegics
FIM FIM efficiency
30. Murakami & Inouye146
2002 First stroke patients from a rehabilitation hospital
Japan 464 Compared to US UDSMR data, LOS-EFF in Japan was lower
FIM Length of Stay- Efficiency (LOS-EFF)
31. O’Dell et al147
2002 Subarachnoid haemorrhage stroke patients admitted for inpatient rehabilitation
USA 42 Only descriptive data presented FIM FIM efficiency
32. Roth et al148 2002 Stroke patients admitted for inpatient rehabilitation
USA 1480 • Greater neurological impairment (as measured by National Institute of Health Stroke Scale)
• Older age
• Right hemisphere stroke
• Longer onset to admission interval
• Use of indwelling urinary catheters, enteral feeding tubes and tracheostomies (vs. none used) not independently associated with FIM efficiency
FIM FIM efficiency
33. Burnett et al149
2003 Traumatic brain injury patients admitted for inpatient rehabilitation
USA 2020 Only descriptive data presented FIM FIM efficiency
34. Hoffman et al150
2003 Traumatic brain injury patients admitted for inpatient rehabilitation
USA 1807 Only descriptive data presented FIM FIM efficiency
35. Kevorkian et al151
2003 Post-cardiac surgery stroke (n=47) and matched other-stroke (n=47)
USA 94 Type of stroke was not associated with FIM efficiency
FIM FIM efficiency

49
S/No. Author(s) Year of
publication Study population Country of
study Sample
size
Independent factors associated with poorer rehabilitation outcome
ADL measure used
Rehabilitation index used
patients admitted into a rehabilitation unit
36. Forrest152 2004 Haemodialysis (n=34) and non-haemodialysis patients (n=497) admitted into a rehabilitation unit
USA 531 Unadjusted FIM efficiency was lower for dialysis patients than non-dialysis
FIM FIM efficiency
37. Lenze et al153 2004 Elderly hip fracture patients admitted into a inpatient rehabilitation unit
USA 57 • Depression
• Cognitive impairment (Both mediated by rehabilitation participation)
FIM FIM efficiency
38. Shah et al154 2004 Anoxic brain injury (n=34) and traumatic brain injury (n=34) patients admitted for inpatient rehabilitation
USA 68 Cause of brain injury not associated with FIM efficiency (p=0.095)
FIM FIM efficiency
39. Forrest el al155
2005 Haemodialysis (n=40) and non-haemodialysis patients (n=915) admitted into a rehabilitation unit
USA 955 Program to reduce conflicts between haemodialysis and therapy sessions
FIM FIM efficiency
40. Gagnon et al156
2005 Stroke patients admitted into a rehabilitation unit
Canada 422 Extremes of dependency FIM Length of Stay- Efficiency (LOS-EFF)
41. Yu & Richmond157
*
2005 Elderly patients in an outpatient rehabilitation unit
USA 201 • Age above 80 years
• Lower admission ADL score
• Interaction between age and admission ADL score
FIM REy
42. Yu et al158 * 2005 Elderly frail adults from a nurse-managed, community-based comprehensive outpatient rehabilitation facility
USA 201 • Age above 80 years
• Lower admission ADL score
• Interaction between age and admission ADL score
• However, cognitive impairment (as measured by the Mini-Mental State Examination) was not associated with REy
FIM REy

50
S/No. Author(s) Year of
publication Study population Country of
study Sample
size
Independent factors associated with poorer rehabilitation outcome
ADL measure used
Rehabilitation index used
43. Bottemiller et al159
2006 Stroke patients admitted into a rehabilitation unit
USA 748 Discharge to nursing facility home (vs. home)
FIM FIM efficiency
44. Diamond et al160
2006 Post primary total knee arthroplasty patients admitted into an acute inpatient rehabilitation unit
USA 184 Lower haemoglobin levels FIM FIM efficiency
45. Salter et al161 2006 First unilateral stroke patients admitted into a rehabilitation unit
Canada 435 Early admission (vs. delayed admission)
FIM FIM efficiency
46. Turner-Stokes et al162
2006 Severe acquired brain injury patients admitted into an inpatient rehabilitation unit
UK 297 Extremes of dependency FIM FIM efficiency
47. Vincent et al163
2006a Unilateral total knee, bilateral total knee and total hip arthroplasty patients admitted into a rehabilitation hospital using the 2004 Medicare 75% rule criteria
USA 867 Only descriptive data presented FIM FIM efficiency
48. Vincent et al164 *
2006b Total hip arthroplasty patients admitted into a rehabilitation hospital
USA 402 • Lower admission ADL score
• Discharge to setting other than home
• Revision (vs. primary) total hip arthroplasty (THA)
• Among revision THA, revision for infection (vs. for pain)
FIM FIM efficiency
49. Vincent et al165*
2006c Total knee arthroplasty patients admitted into a rehabilitation hospital
USA 286 • Revision (vs. primary) total knee arthroplasty
• Female gender
FIM FIM efficiency
50. Vincent et al166 *
2006d Total knee arthroplasty patients admitted into a rehabilitation hospital
USA 424 • Female gender
• Discharge to setting other than home
• Revision (vs. primary) total knee arthroplasty
• Among revision TKA, revision for infection (vs. for pain)
FIM FIM efficiency

51
S/No. Author(s) Year of
publication Study population Country of
study Sample
size
Independent factors associated with poorer rehabilitation outcome
ADL measure used
Rehabilitation index used
51. Vincent et al167 *
2006e Total hip arthroplasty patients admitted into a rehabilitation hospital
USA 332 • Older age
• Female gender
• Revision (vs. primary) total
hip arthroplasty
FIM FIM efficiency
52. Yokoyama et al168
2006 Spinal cord injury patients in a rehabilitation centre
Japan 34 Aortic aneurysm repair induced (vs. traumatic) spinal cord injury)
FIM FIM efficiency
53. Ng et al169 2007a First stroke patients admitted into an inpatient rehabilitation program
USA 2213 Vascular territory is not associated with FIM efficiency
FIM FIM efficiency
54. Ng et al170 2007b Heterogeneous patients admitted into a inpatient rehabilitation unit
Singapore 1502 Principal disability diagnosis (in order of decreasing FIM efficiency): traumatic brain injury, stroke, spinal cord injury, amputations and pulmonary conditions)
FIM FIM efficiency
55. Vincent et al171
2007a Total hip arthroplasty patients admitted into a rehabilitation hospital from 2002-05
USA 339 • Extremes of body-mass index in a curvilinear fashion
• Number of co-morbidities
FIM FIM efficiency
56. Vincent et al172
2007b Total knee arthroplasty patients admitted into a rehabilitation hospital
USA 285 • Gender
• Ethnicity
• Etiologic diagnosis
• Revision (vs. primary) total knee arthroplasty
FIM FIM efficiency
57. Kortebein et al173
2008 Patients ≥ 65 yrs old with a primary or co-morbid debility diagnosis from the UDSMR database (2002-03)
USA 63,171 Patients with a primary (vs. co-morbid) debility diagnosis
FIM REy
58. Ottenbacher et al174
2008 Patients from the UDSMR database who received inpatient medical rehabilitation after a first stroke (2002-03)
USA 161,692 Hispanic and black (vs. non-Hispanic white) ethnicity
FIM FIM efficiency
59. Rabadi et al175
2008 Stroke patients admitted into an acute stroke rehabilitation unit
USA 233 Cognitive impairment is not associated with FIM efficiency (p=0.058)
FIM FIM efficiency

52
S/No. Author(s) Year of
publication Study population Country of
study Sample
size
Independent factors associated with poorer rehabilitation outcome
ADL measure used
Rehabilitation index used
60. Woo et al176 2008 Stroke patients in three rehabilitation hospitals
Hong Kong 2210 • Older age
• Admission FIM score
• Better care processes
• Reduction in staff to patient ratio
FIM FIM efficiency
61. Fromovich-Amit et al177
2009 One spinal rehabilitation unit from four countries
Denmark, Russia,
Lithuania & Israel
199 Only descriptive data presented Spinal Cord Independence
Measure (SCIM)
REy
62. Granger et al178
2009 Patients from 893 medical rehabilitation facilities within the UDSMR database who received inpatient rehabilitation after stroke (2000-07)
USA 634,105 Only descriptive data presented FIM FIM efficiency
63. McGilton et al179
2009 Older community-residing adults who participated in a rehabilitation program following hip fracture surgery
Canada 31 Only descriptive data presented FIM REy
64. Tay et al180 2009 Cancer and non-cancer patients admitted into a inpatient rehabilitation unit
Singapore 1750 No difference in FIM efficiency between cancer and non-cancer patients, or between cancer sub-groups
FIM FIM efficiency
65. Granger et al181
2010a Patients from 893 medical rehabilitation facilities within the UDSMR database who received inpatient rehabilitation after traumatic brain injury (2000-07)
USA 101,188 Only descriptive data presented FIM FIM efficiency
66. Granger et al182
2010b Patients from 893 medical rehabilitation facilities within the UDSMR database who received inpatient rehabilitation after lower limb joint replacement (2000-07)
USA 705,345 Only descriptive data presented FIM FIM efficiency
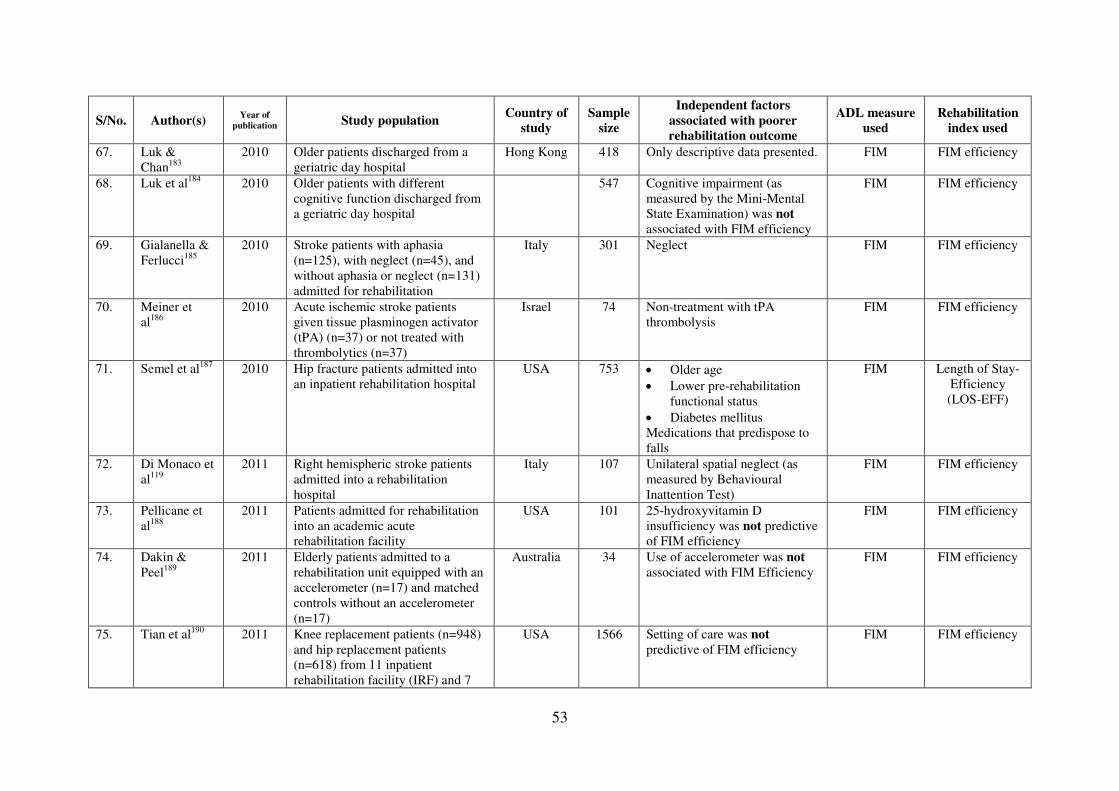
53
S/No. Author(s) Year of
publication Study population Country of
study Sample
size
Independent factors associated with poorer rehabilitation outcome
ADL measure used
Rehabilitation index used
67. Luk & Chan183
2010 Older patients discharged from a geriatric day hospital
Hong Kong 418 Only descriptive data presented. FIM FIM efficiency
68. Luk et al184 2010 Older patients with different cognitive function discharged from a geriatric day hospital
547 Cognitive impairment (as measured by the Mini-Mental State Examination) was not associated with FIM efficiency
FIM FIM efficiency
69. Gialanella & Ferlucci185
2010 Stroke patients with aphasia (n=125), with neglect (n=45), and without aphasia or neglect (n=131) admitted for rehabilitation
Italy 301 Neglect FIM FIM efficiency
70. Meiner et al186
2010 Acute ischemic stroke patients given tissue plasminogen activator (tPA) (n=37) or not treated with thrombolytics (n=37)
Israel 74 Non-treatment with tPA thrombolysis
FIM FIM efficiency
71. Semel et al187 2010 Hip fracture patients admitted into an inpatient rehabilitation hospital
USA 753 • Older age
• Lower pre-rehabilitation functional status
• Diabetes mellitus Medications that predispose to falls
FIM Length of Stay- Efficiency (LOS-EFF)
72. Di Monaco et al119
2011 Right hemispheric stroke patients admitted into a rehabilitation hospital
Italy 107 Unilateral spatial neglect (as measured by Behavioural Inattention Test)
FIM FIM efficiency
73. Pellicane et al188
2011 Patients admitted for rehabilitation into an academic acute rehabilitation facility
USA 101 25-hydroxyvitamin D insufficiency was not predictive of FIM efficiency
FIM FIM efficiency
74. Dakin & Peel189
2011 Elderly patients admitted to a rehabilitation unit equipped with an accelerometer (n=17) and matched controls without an accelerometer (n=17)
Australia 34 Use of accelerometer was not associated with FIM Efficiency
FIM FIM efficiency
75. Tian et al190 2011 Knee replacement patients (n=948) and hip replacement patients (n=618) from 11 inpatient rehabilitation facility (IRF) and 7
USA 1566 Setting of care was not predictive of FIM efficiency
FIM FIM efficiency

54
S/No. Author(s) Year of
publication Study population Country of
study Sample
size
Independent factors associated with poorer rehabilitation outcome
ADL measure used
Rehabilitation index used
skilled nursing facility (SNF)
76. Koh et al120 2011 First stroke patients admitted into a rehabilitation hospital
Singapore 2810 • Older age
• Ethnicity (Malay vs. Chinese)
• Caregiver availability (vs. no caregiver)
• Higher admission functional status
• Infarct (vs. haemorrhage)
• Shorter onset to admission interval
• Longer length of stay
• Dementia Peptic ulcer disease
BI REy
77. Granger et al191
2011 Patients from 893 medical rehabilitation facilities within the UDSMR database who received inpatient rehabilitation after hip fracture (2000-07)
USA 303,594 Only descriptive data presented FIM FIM efficiency
* These pairs of studies may potentially be duplicate publications: Lin (2001)139 and Lin et al (2001)139; Yu & Richmond (2005)157 and Yu et al (2005)158; Vincent et al
(2006a)163 and Vincent et al (2006d)166; Vincent et al (2006b)164 and Vincent et al (2006c)165.

55
From Table 4, the independent predictors of poorer REy/ LOS-EFF/Efficiency that have been
reported are (1) non-acute hospital admissions97, (2) older age105,120,127,143,157,167,176,187, (3)
female gender165,166,167,, (4) lower pre-rehabilitation functional status105,117,137,142,157,164,176,187,
(5) non-hemorrhagic (vs. hemorrhagic) stroke120,121, (6) depression128,137,153, (7) cognitive
impairment113,120,153,175,176, (8) poorer balance124,130, (9) heterotopic ossification on triple-
phase bone scan (vs. none)129, (10) non-traumatic (vs. traumatic) spinal cord injury133, (11)
encephalitis (vs. traumatic brain injury or stroke)134, (12) longer length of stay117,120, (13)
direct admission from emergency ward (vs. indirect admission via general medical ward)136,
(14) not receiving radiation therapy during rehabilitation (vs. receiving) in brain tumour
patients140, (15) recurrent (vs. initial diagnosis) tumour in brain tumour patients140, (16)
greater co-morbidity burden142,171, (17) spinal stenosis-induced (vs. traumatic) spinal cord
injury145, (18) Japan (vs. USA)146, (19) use of indwelling urinary catheters, enteral feeding
tubes and tracheostomies (vs. none)148, (20) dialysis (vs. non-dialysis) patients152, (21)
traumatic (vs. anoxic) brain injury154, (22) conflicts between haemodialysis and therapy
sessions (vs. a program to reduce it)155, (23) extremes of dependency156,162, (24) discharge to
setting other than home159,164,166, (25) lower haemoglobin levels160, (26) early admission (vs.
delayed admission)120,161, (27) revision (vs. primary) total hip arthroplasty164, (28) revision
(vs. primary) total knee arthroplasty165,166,172, (29) aortic aneurysm repair induced (vs.
traumatic) spinal cord injury168, (30) principal disability diagnosis (in order of decreasing
FIM efficiency: traumatic brain injury, stroke, spinal cord injury, amputations and pulmonary
conditions)170, (31) extremes of body mass index171, (32) primary (vs. co-morbid) debility
diagnosis173, (33) Hispanic and black (vs. white) ethnicity174, (34) lower staff to patient
ratio176, (35) neglect185,187, (36) non-treatment with thrombolysis186, (37) diabetes mellitus187,
(38) medications that predispose to falls187, (39) Malay (vs. Chinese) ethnicity120, (40)

56
caregiver availability (vs. none)120, (41) higher pre-rehabilitation functional status120 and (42)
peptic ulcer disease120.
Table 5 details the independent predictors of REy/ LOS-EFF/Efficiency stratified by study
population [i.e. stroke (21
studies)97,105,117,119,120,121,128,130,136,137,143,146,148,156,159,161,174,175,176,185,186, post hip
fracture/arthroplasty (6 studies) 113,153,164,167,171,187, elderly (3 studies)142,157,173, heterogeneous
(2 studies)124,170, brain tumour (1 study)140, brain injury (3 studies)129,154,162, spinal cord injury
(4 studies)127,133,145,168, , encephalitis (1 study)134, haemodialysis (2 studies)152,155 and post
knee arthroplasty (4 studies) 160,165,166,172]. Overall, there is evidence that older age and lower
pre-rehabilitation functional status are predictive of poorer REy/LOS-EFF/Efficiency with
eight studies reporting this association each, with half of the studies based on stroke
rehabilitation. This is similar to the evidence for REs/MRFS/RFG. Unlike REs/MRFS/RFG,
the evidence for depression being predictive of poorer REy/ LOS-EFF/Efficiency is stronger
(three studies vs. none respectively).

57
Table 5. Summary of independent factors of poorer REy/ LOS-EFF/Efficiency in studies by study population (paper reference numbers in cells)
S/No.
Independent factors of poorer REy/LOS Efficiency/FIM Efficiency/AFE
Stroke Post hip fracture
arthroplasty Elderly Heterogeneous
Brain tumour
Brain injury
Spinal cord
injury Encephalitis Haemodialysis
Knee arthroplasty
1. Non-acute hospital admissions
97 - - - - - - - - -
2. Older age 105,120,143,176, 167, 187 157 - - - 127 - - -
3. Female gender - 167 - - - - - - - 165,166
4. Lower pre-rehabilitation functional status
105,117,137,176 164, 187 142,157 - - - - - - -
5. Non-hemorrhagic (vs. hemorrhagic) stroke
120,121 - - - - - - - - -
6. Depression 128, 137 153 - - - - - - - -
7. Cognitive impairment 120,175,176 113,153 - - - - - - - -
8. Poorer balance 130 - - 124 - - - - - -
9. Heterotopic ossification on triple-phase bone scan (vs. none)
- - - - - 129 - - - -
10. Non-traumatic (vs. traumatic) spinal cord injury
- - - - - - 133 - - -
11. Encephalitis (vs. traumatic brain injury or stroke)
- - - - - - - 134 - -
12. Longer length of stay 117, 120 - - - - - - - - -
13. Direct admission from emergency ward (vs. indirect admission via general medical ward)
136 - - - - - - - - -
14. Not receiving radiation therapy during rehabilitation (vs. receiving) in brain tumour patients
- - - - 140 - - - - -
15. Recurrent (vs. initial diagnosis) tumour in brain tumour patients
- - - - 140 - - - - -
16. Greater co-morbidity burden
- 171 142 - - - - - - -
17. Spinal stenosis-induced - - - - - - 145 - - -

58
S/No.
Independent factors of poorer REy/LOS Efficiency/FIM Efficiency/AFE
Stroke Post hip fracture
arthroplasty Elderly Heterogeneous
Brain tumour
Brain injury
Spinal cord
injury Encephalitis Haemodialysis
Knee arthroplasty
(vs. traumatic) spinal cord injury
18. Japan (vs. USA) 146 - - - - - - - - -
19. Use of indwelling urinary catheters, enteral feeding tubes and tracheostomies (vs. none)
148 - - - - - - - - -
20. Dialysis (vs. non-dialysis) patients
- - - - - - - - 152 -
21. Traumatic (vs. anoxic) brain injury
- - - - - 154 - - - -
22. Program to reduce conflicts between haemodialysis and therapy sessions
- - - - - - - - 155 -
23. Extremes of dependency 156 - - - - 162 - - - -
24. Discharge to nursing facility (vs. home)
159 - - - - - - - - -
25. Lower haemoglobin levels
- - - - - - - - - 160
26. Early admission (vs. delayed admission)
120, 161 - - - - - - - - -
27. Revision (vs. primary) total hip arthroplasty
- 164 - - - - - - - -
28. Revision (vs. primary) total knee arthroplasty
- - - - - - - - - 165,166,172
29. Aortic aneurysm repair induced (vs. traumatic) spinal cord injury
- - - - - - 168 - - -
30. Principal disability diagnosis (in order of decreasing FIM efficiency: traumatic brain injury, stroke, spinal cord injury,
- - - 170 - - - - - -

59
S/No.
Independent factors of poorer REy/LOS Efficiency/FIM Efficiency/AFE
Stroke Post hip fracture
arthroplasty Elderly Heterogeneous
Brain tumour
Brain injury
Spinal cord
injury Encephalitis Haemodialysis
Knee arthroplasty
amputations and pulmonary conditions)
31. Extremes of body-mass index
- 171 - - - - - - - -
32. Primary (vs. co-morbid) debility diagnosis
- - 173 - - - - - - -
33. Hispanic and black (vs. white) ethnicity
174 - - - - - - - - -
34. Lower staff to patient ratio
176 - - - - - - - - -
35. Neglect 119, 185 - - - - - - - - -
36. Non-treatment with thrombolysis
186 - - - - - - - - -
37. Diabetes mellitus - 187 - - - - - - - -
38. Medications that predispose to falls
- 187 - - - - - - - -
39. Malay (vs. Chinese) ethnicity
120 - - - - - - - - -
40. Caregiver availability (vs. none)
120 - - - - - - - - -
41. Higher pre-rehabilitation functional status
120 - - - - - - - - -
42. Peptic ulcer disease 120 - - - - - - - - -

60
7.4 Relative Functional Efficiency (RFE) / MRFS Efficiency
Heruti et al defined Relative Functional Efficiency (RFE) in 2002 as RFG (or REs) divided
by LOS.112 In the same year, Zwecker et al used the term MRFS Efficiency to describe the
same formula.103 The formula for RFE/MRFS Efficiency using FIM as the functional
assessment tool (where DC=Discharge; Adm=Admission; Max=Maximum possible score) is
as follows:
RFE = FIMDC - FIMAdm
= REs
= AFG
(FIMMax - FIMAdm) X LOS LOS (FIMMax - FIMAdm) X LOS
Heruti et al were able to demonstrate that the RFE/MRFS Efficiency was higher in
cognitively intact elderly subjects admitted into a geriatric rehabilitation unit compared to
cognitively-impaired elderly subjects112 but Zwecker et al found no associations between
RFE/MRFS Efficiency and the Loewenstein Occupational Therapy Cognitive Assessment,
the Mini-Mental State Examination or the cognitive subscale of the FIM instrument among
66 first stroke patients undergoing comprehensive inpatient rehabilitation in Israel103. To
date, these are the only two papers so far which have used the RFE/MRFS Efficiency index.
Further studies will be needed to determine the metric properties of this new index and
validate it.

61
7.5 Revised MRFS (MRFS-R)
In 2007, Press and colleagues proposed a new index of rehabilitation outcome: the Revised
MRFS. 192 In their paper, they explained the rationale for creating this new index as follows:
The MRFS index only reflects the absolute gains in functional status without considering the
pre-morbid functional status which may be misleading. Moreover, Press et al proposed that
the highest possible functional status should not be the maximum score of the functional
assessment tool used but the pre-morbid functional score instead. For example: hypothetical
Patient A was quite functional with a pre-morbid functional score (FIMPM) of 120 before a
hip fracture; after fracture repair, on admission to the rehabilitation department, Patient A’s
FIMAdm score had dropped to 60. After rehabilitation, Patient A’s FIMDC rose to 80. In this
case, Patient A’s MRFS was 0.33, as follows:
MRFS = FIMDC - FIMAdm
= 80 – 60
= 20
= 0.33 (FIMPM - FIMAdm) 120 – 60 60
Patient B who was much more dependent before suffering a hip fracture had pre-morbid
functional score (FIMPM) of 80. Patient B’s FIMAdm score dropped to 20 after hip fracture and
after rehabilitation, Patient B’s FIMDC score rose to 40. In Patient B’s case, the MRFS score
was also 0.33:
MRFS = FIMDC - FIMAdm
= 40 – 20
= 20
= 0.33 (FIMPM - FIMAdm) 80 – 20 60
As such, according to the MRFS formula, both these two patients enjoyed an equal level of
rehabilitation success. However, these two patients are different as Patient B started with a

62
poorer pre-morbid functional status than Patient A. As such, Press et al proposed a revised
MRFS (MRFS-R) which adjusts the MRFS to make it more relevant to clinical practice by
changing the calculation from an absolute to a relative one and using the pre-morbid
functional score as the highest possible functional status attainable, as follows:
MRFS-R = (FIMDC - FIMAdm) / FIMDC
(FIMPM - FIMAdm) / FIMPM
Using this new index, Patient A’s MRFS-R would be 0.5, as follows:
MRFS-R =
(FIMDC - FIMAdm) / FIMDC
=
(80 – 60) / 80
=
20 / 80
=
0.25
= 0.5 (FIMPM - FIMAdm) / FIMPM (120 – 60) / 120 60 / 120 0.5
Patient B’s MRFS-R score would be higher at 0.67, as follows:
MRFS-R = (FIMDC - FIMAdm) / FIMDC
= (40 – 20) / 40
= 20 / 40
= 0.5
= 0.67 (FIMPM - FIMAdm) / FIMPM (80 – 20) / 80 60 / 80 0.75
Press et al assert that Patient B realized his/her rehabilitation potential more than Patient A
and that the MRFS-R is a more useful way to quantify the differences than MRFS alone since
the revised index controls in part for pre-morbid functional status.
In the same paper, Press et al compared the MRFS-R with MRFS among 102 elderly post hip
fracture patients undergoing inpatient rehabilitation in Israel using the FIM and found, not
surprisingly, that these two rehabilitation indices were very highly correlated (r = 0.99,
p<0.01).192 Nevertheless, in a linear regression model with MMSE, length of stay and

63
Severity Index of Cumulative Illness Rating Scale for Geriatrics as independent factors, they
found the adjusted R2 for the MRFS-R was higher than with the MRFS as the dependent
variable (0.16 vs. 0.12), suggesting that the MRFS-R was a more valid index than MRFS for
the assessment of rehabilitation status. As this is the first and currently only paper using the
MRFS-R, more studies will be needed to determine the metrics of this new index and validate
it.

64
7.6 Maximal Score Attainable
Three rehabilitation indices use the variable ‘maximal score attainable’ (i.e. BIMax or
FIMMax): (1) REs/MRFS/RFG, (2) Relative Functional Efficiency/MRFS Efficiency and (3)
Revised MRFS. Most researchers used the maximum score of the ADL measure (e.g. 100 for
BI and 126 for FIM) while Press et al used the pre-morbid functional level of the patient (i.e.
prior to disabling event like before stroke or hip fracture). The proponents for the latter
reason that pre-morbid functional status is more appropriate because it is more meaningful to
the patient and a person’s function rarely improves beyond their pre-morbid functional status.
However, there are disadvantages to using pre-morbid functional status as the ‘maximal score
attainable’. Firstly, pre-morbid functional data is often not available as patients often present
in acute settings already disabled from a stroke or hip fracture. Hence, pre-morbid functional
data is often collected retrospectively from patient or caregiver and is vulnerable to recall
bias. Secondly, studies has shown that persons can still improve their functional status
months to years after their acute disabling event with rehabilitation, suggesting that one’s pre-
morbid functional status is not necessarily the maximal functional status attainable.49,50,51
Lastly, by fixing BIMax and FIMMax as the maximum score of ADL measure used,
rehabilitation indices become standardized when comparing across studies, sites or time.

65
7.7 Summary
Increasingly complex rehabilitation indices have been developed in the past decade in
response to the need to create composite summative measures that control for pre-morbid
functional status, pre-rehabilitation functional status and rate of functional improvement. The
current rehabilitation indices available in increasing complexity are:
1. Absolute Functional Gain (AFG) / Absolute Efficacy / Total Gain
2. Rehabilitation Effectiveness (REs) / Montebello Rehabilitation Factor Score (MRFS) / Relative
Functional Gain (RFG)
3. Rehabilitation Efficiency (REy) / Length of Stay – Efficiency (LOS-EFF) / Efficiency
4. Relative Functional Efficiency (RFE) / MRFS Efficiency
5. Revised MRFS (MRFS-R)
Their corresponding formulas are summarized in Table 6. Based on current literature, there
are more studies that use REy/LOS-EFF/Efficiency than REs/MRFS/RFG, and even fewer
that use AFG/Absolute Efficacy/Total Gain, Relative Functional Efficiency/MRFS Efficiency
or Revised MRFS. Thus, the face and criterion validity is greatest for REy/LOS-
EFF/Efficiency than the other rehabilitation indices. REy/LOS-EFF/Efficiency has been used
in diverse fields such as neurology, geriatrics, neurosurgery, orthopaedics and diseases such
as stroke, brain tumours, brain injury, spinal cord injury, post hip arthroplasty, knee
arthroplasty, encephalitis, haemodialysis and even cancer. As a rehabilitation index may have
three different names and there are common terms between indices, there is a need to
harmonize the nomenclature of rehabilitation outcome measures.

66
Table 6. Summary of rehabilitation indices and their formulae
S/No. Current Names Formula
1. • Absolute Functional Gain (AFG)
• Absolute (FIM) Efficacy
• Total (FIM) Gain
FIMDC - FIMAdm
2. • Rehabilitation Efficiency (REy)
• (FIM) Efficiency
• Absolute Functional Efficiency (AFE)
FIMDC - FIMAdm
LOS
3. • Rehabilitation Effectiveness (REs)
• Montebello Rehabilitation Factor Score (MRFS)
• Relative Functional Gain (RFG)
FIMDC - FIMAdm
FIMMax - FIMAdm
4. • Relative Functional Efficiency (RFE)
• MRFS Efficiency
FIMDC - FIMAdm
(FIMMax - FIMAdm) X
LOS
5. • Revised MRFS (MRFS-R) (FIMDC - FIMAdm) /
FIMDC
(FIMPM - FIMAdm) /
FIMPM

67
(Where FIM=Functional Independence Measure; DC=Discharge; Adm=Admission; Max=Maximum possible score, LOS=Length of Stay;
PM=Pre-morbid)


Page 69 of 308
8. Post-Acute Inpatient Rehabilitation in Singapore
As previously mentioned, post-acute rehabilitation in Singapore is provided by community
hospitals of which there are currently five in Singapore: Ang Mo Kio Thye Hua Kuan Hospital
(AMKTHKH), St Luke’s Hospital (SLH), St Andrew’s Community Hospital (SACH), Bright
Vision Hospital (BVH) and Ren Ci Community Hospital (RCCH). AMKTHKH
(www.amkh.com.sg/) is a 200-bedded hospital which opened in 1993. SLH (www.slh.org.sg/) is
a 185-bedded community hospital which opened in 1996. SACH (www.sach.org.sg/) is the
oldest community hospital in Singapore – it opened in 1992 and only had 40 beds till 2005 when
it moved to a new premise and expanded its bed capacity to 200 beds. BVH (www.bvh.org.sg/)
opened in 2003 and currently has 120 beds. RCCH (www.renci.org.sg/) is the newest community
hospital - it opened in December 2008 and has 140 community hospital beds. Patients transferred
to these hospitals are usually newly disabled elderly who suffered an acute medical condition
requiring rehabilitation. The common principal diagnoses for admission include stroke, hip
fractures, de-conditioning from medical illness or surgery and amputations, similar to US
Medicare IRFs.193 Most patients are directly admitted to these community hospitals from acute
hospitals and receive inpatient rehabilitation during their stay. According to our MOH’s
guidelines, initial functional assessment and rehabilitation should be initiated within two days of
admission into the community hospital for patients admitted for rehabilitation. Most patients are
discharged to their own homes but a few are transferred to a nursing home. A minority of
patients are transferred back to the acute hospital, usually within the first week of admission,
because their medical status deteriorates beyond the community hospital’s capability to manage
them safely.

Page 70 of 308
8.1 Gaps in Knowledge
Singapore is currently the second fastest ageing country in Asia (after Japan) and the proportion
of older persons in the population is expected to increase from 9% in 2010 to 18% in 2030.20 To
address the challenges to the healthcare system arising from Singapore’s rapidly ageing
population, our MOH set up an independent corporate body called the Agency for Integrated
Care (AIC) to enhance and integrate care, and monitor patient health outcomes within the ILTC
sector which includes community hospitals. 194 As rehabilitation is a primary function and role of
the ILTC sector, AIC has been tasked by our MOH to measure and monitor trends on
rehabilitation outcomes within community hospitals, nursing homes and day rehabilitation
centres. However, one of the key challenges when objectively comparing rehabilitation outcomes
between types of rehabilitation centres and across time is variations in patient socio-demographic
and co-morbidity profile. Hence, there is a need to robustly identify the independent predictors of
rehabilitation outcomes in our local setting and adjust for them when generating centre-
standardized rehabilitation outcomes to compare quality of rehabilitation between centres and
across time (akin to hospital-standardized mortality ratios used in US, Canada and UK to
compare quality of inpatient medical care in acute hospitals).195 Unfortunately, as most ILTC
facilities are under-resourced, they do not have electronic medical record systems, and all their
rehabilitation data is only available in hard copies. Moreover, due to space constraints, many
ILTC facilities have been culling medical records older than 7 years and inadvertently losing a
potentially rich source of medical data which may be extracted and used to retrospectively
measure rehabilitation outcomes in the past decade and identify independent predictors of

Page 71 of 308
rehabilitation outcomes in our local setting. Historical data on rehabilitation outcomes will be
useful to AIC and MOH to review the quality of rehabilitation in previous years, and project
future trends in national prevalence rates of disability and need for inpatient and outpatient
rehabilitation services, especially in the light of our rapidly ageing population.
From an international health services research perspective, there is also a growing need for
objective rehabilitation outcome measures in today’s pay-for-performance era to compare
rehabilitation quality between centres and track trends over time.99 Traditional measures such as
mortality are useful in acute hospital settings but are of little value in sub-acute rehabilitation
units where death is a rare occurrence and rehabilitation is its primary function. Moreover,
rehabilitation should be measured in terms of both effectiveness and efficiency, and not just final
functional status which does not consider speed of recovery or achievement of rehabilitation
potential.98 Studies on independent factors associated with disease-specific rehabilitation
outcomes (adjusting for co-morbidity burden when generating centre standardized rehabilitation
outcomes) and the utility of these outcomes in comparing between rehabilitation centres of
similar type and across time are needed. It is hoped that such studies can improve understanding
of the factors affecting rehabilitation outcomes, identify high-performing rehabilitation centres
(from which best practices can be learned) and under-performing rehabilitation centres (so that
support can be given to improve their standards of care), and monitor rehabilitation outcomes
with time to validate the investments by governments and donors to fund rehabilitation services.

Page 72 of 308
9. PhD Thesis Research Proposal
9.1 Aim and Objectives
The aim of the proposed PhD thesis research was to retrospectively analyze a national database
of all admissions into all community hospitals in Singapore from 1996 to 2005 (10 years). The
database was compiled by the PhD candidate and research nurses from 2006 to 2008 and
contains socio-demographic, medical and rehabilitation data of all admitted patients. The
objectives of the retrospective analysis were to:
1. Determine the profile of patients into community hospitals in Singapore and the trends in
patient socio-demographic, health and functional profile and rehabilitation outcomes by
hospital and year of admission from 1996 to 2005;
2. Determine the independent predictors of rehabilitation outcomes [e.g. rehabilitation
efficiency (REy) and rehabilitation effectiveness (REs)] for all stroke patients and
examine if there are any trade-off relationships between REs and REy with respect to
independent predictors identified;
3. Determine, among the stroke patients with caregivers, independent patient factors
associated with caregiver availability, number of potential caregivers and relationship of
primary caregiver to patient (primary caregiver identity).

Page 73 of 308
9.2 Methodology
9.2.1 Study Design
A retrospective analysis of a national database of all patients admitted to all community hospitals
in Singapore from 1996 to 2005 (i.e. SLH, AMHTHKH, SACH and BVH) was performed. The
database was manually compiled by the PhD candidate and four research nurses from November
2006 to December 2009 and contains the socio-demographic, medical and rehabilitation data of
all admitted patients. The medical data recorded from community hospitals medical records were
double-checked with subject’s discharge summaries from referring hospitals.
9.2.2 Study Population
All patients admitted to all community hospitals in Singapore from 1996 to 2005 (i.e. SLH,
AMHTHKH, SACH and BVH).
9.2.3 Measures
As all community hospitals in Singapore used the 100-point Shah-modified BI from 1996 to
2005, functional data from all four community hospitals were pooled together. Moreover, the
PhD candidate managed to collect medical and functional data of patients admitted to all
community hospitals before they were culled. In all four institutions, Shah-modified BI scoring
was performed by occupational therapists who are the most skilled in assessing ADL function

Page 74 of 308
among the multi-disciplinary team, suggesting that the quality of functional data obtained is
high.
The variables collected were as follows: date of birth, gender, ethnicity, marital status,
hospitalization type, date of admission and discharge, primary diagnosis for admission (e.g.
stroke and subtype, fracture and subtypes, amputation and subtypes, etc), date of onset of
primary diagnosis, level of government subsidy given (as a measure of socio-economic class),
number of adults (including foreign domestic worker) aged 18 years and above and living with
patient in same household and is able to physically care for patient, relationship of primary
caregiver (defined as the potential caregiver who was main person providing physical care to the
patient), 100-point Shah-modified Barthel Index scores at admission and discharge and co-
morbidity burden (using Charlson Co-Morbidity Index [CCMI]) and specific co-morbidities (i.e.
HIV and AIDS, connective tissue disease, cerebrovascular disease, chronic pulmonary disease,
congestive heart failure, previous myocardial infarction (excluding ischaemic heart disease
without previous myocardial infarction), peripheral vascular disease, hemiplegia, peptic ulcer
disease, dementia, diabetes mellitus and severity, renal disease and severity, liver disease and
severity, solid tumours, leukaemia, lymphoma, hypertension, hyperlipidaemia and ischaemic
heart disease (with or without previous myocardial infarction). Please see (1) Appendix 1 for
details on the criteria used to define all data variables extracted, (2) Appendix 2 for details on the
Shah-modified Barthel Index used in this study, (3) Appendix 3 for permission from Dr Mary
Charlson to use her co-morbidity index, (4) Appendix 4 for the formula system used to compute
the Charlson Co-Morbidity Index score.

Page 75 of 308
The national database was created by manually extracting data from medical records by four
research nurses supervised and a set of data collection guidelines (Appendix 1) was created to
standardize and guide data collection. Data collection started first in AMKTHKH, then SLH,
then BVH and lastly SACH, with all four research nurses moving sequentially from one
community hospital to the next. Data was entered directly into a prescribed form and was
scanned as image files (please see Appendix 5 for a copy of the data collection form). Scansys
Scanning Systems® software was be used to read the images to extract the data to minimize data
entry errors and scanned data was converted into SPSS (Statistical Package for Social Sciences)
format. Inter-rater variability between the four research nurses and variations in quality of data
extraction over time were not examined. However, a 10% random sample of subjects was
subsequently analyzed for data extraction accuracy by an independent physician and the error
rate was found to be only 0.07%. Inter-rater variability between the four research nurses and
variations in quality of data extraction over time were not examined. The rate of missing data for
each variable listed in Appendix 5 ranged from 0.2% to 13.3%. The range of missing data rates
was 0.2% to 0.3% for sociodemographic and clinical variables, 4.9% to 5.1% for admission BI
items, and 12.2% to 13.3% for discharge BI items.
9.3 Statistical Analysis
As the missing data rates were low, cases with missing data were deleted during statistical
analysis. Logarithmic transformation was used for non-parametric continuous data where
appropriate and geometric means were reported. For bivariate analysis, Chi-square analysis was
used to compare between categorical variables (Fisher’s Exact Test was used instead if n in any

Page 76 of 308
Chi-square table cell is less than 5); linear by linear association was used to test for trends in
categorical outcomes by year; simple linear regression analysis was be used to determine the
bivariate relationship between independent variables and REs or REy as dependent variables. For
parametric continuous outcomes, means and β–coefficients were reported. For non-parametric
continuous outcomes which were logarithmically transformed, geometric means, ratio of
geometric means and β–coefficients were reported. All variables with P-value <0.2 on bivariate
analysis were considered for inclusion into subsequent multivariable models. For continuous
outcomes, we used backward mixed model linear regression adjusting for clustering effects by
hospital and year of admission by treating them as non-hierarchical random factors and entering
them into models as random slopes and random intercepts. Similarly, for categorical outcomes,
we used backward mixed model logistic regression adjusting for clustering effects by hospital
and year of admission by treating them as non-hierarchical random factors and entering them
into models as random slopes and random intercepts. For all statistical analysis, reported P-
values were two-tailed and significance level was set at 0.05. Statistical Package for Social
Sciences (SPSS) or Stata software was used for statistical analysis.
9.4 Ethical Considerations
Written approval and support from all four community hospital boards to conduct this study and
NUS IRB Approval to conduct this study in all four community hospitals was obtained (please
see Appendix 6 for the NUS IRB Approval Certificate). To protect the privacy of subjects, the
data safety management plan included a data collection form that only had identifying
information on a separate sheet that was detached from the main data collection form upon

Page 77 of 308
completion of data collection and kept in a separate database. Only a unique number linked the
identifier database with the de-identified dataset. The identifier database was kept under security
by a trusted third party (TTP) and was only activated by the PhD candidate and/or his designate
under his close supervision. The PhD candidate and research nurses have taken the oath of
confidentiality under Singapore’s Official Secrets Act and only the minimum number of research
personnel had access to the de-identified dataset.

Page 78 of 308
References
1. Centres for Disease Control and Prevention, National Centre for Health Statistics.
Classifications of Diseases and Functioning and Disability. 2008. Accessed from
http://www.cdc.gov/nchs/icd/icf.htm on 12 Nov 10.
2. World Health Organization. Information Office. World Health Assembly endorses WHO’s
strategic priorities. Press Release WHA 54/6. 2001a. Accessed on 12 Nov 10 at webpage
http://www.who.int/inf-pr-2001/en/pr2001WHA-6.html.
3. World Health Organization. International Classification of Functioning, Disability and
Health. 2001b. Accessed on 12 Nov 10 at webpage
http://www.who.int/classifications/icf/en/.
4. United Nations. Draft convention on the rights of persons with disabilities. 2007. Accessed
on 12 Nov 10 at webpage http://www.un.org/esa/socdev/enable/rights/ahc8adart.htm#art2.
5. World Health Organization. Concept Note for World Report on Disability and Rehabilitation.
2005. Accessed on 12 Nov 10 at webpage
http://www.who.int/disabilities/publications/dar_world_report_concept_note.pdf.

Page 79 of 308
6. World Health Organization. Disability and Rehabilitation: WHO Action Plan 2006 – 2011.
2006. Accessed on 12 Nov 10 at webpage
http://www.who.int/disabilities/publications/dar_action_plan_2006to2011.pdf.
7. United Nations. Report on the Second World Assembly on Ageing. Madrid. 2002b. Accessed
on 12 Nov 10 at webpage http://www.un-ngls.org/orf/pdf/MIPAA.pdf.
8. Morley M, Gage B, Smith L, Spain P, Ingber M. Post Acute Care Episodes. U.S. Department
of Health and Human Services. 2009. Downloaded on 13 Nov 10 from website
http://aspe.hhs.gov/health/reports/09/pacepifinal/report.pdf.
9. Leon J, Cheng M, Dunbar J. Trends in special care: The 1995 National Nursing Home
Census of Sub-Acute Units. 1997. Available at
http://aspe.hhs.gov/daltcp/reports/sctrndes.htm.
10. Marchildon GP. Health Systems in Transition:Canada. Copenhagen, WHO Regional Office
for Europe on behalf of the European Observatory on Health Systems and Policies. 2005.
11. Canadian Institute for Health information, Inpatient Rehabilitation in Canada, 2006–2007
(Ottawa: CIHI, 2008).

Page 80 of 308
12. Wodchis WP, Teare GF, Naglie G, Bronskill SE, Gill SS, Hillmer MP, Anderson GM,
Rochon PA, Fries BE. Skilled nursing facility rehabilitation and discharge to home after
stroke. Arch Phys Med Rehabil. 2005;86:442-8.
13. Ministry of Health. Means-testing for restructured hospitals. Downloaded on 10 Nov 10 from
website
http://www.moh.gov.sg/mohcorp/uploadedFiles/Publications/Educational_Resources/2009/
MT%20pamphlet%20(English).pdf.
14. Agency for Integrated Care. Means-testing for intermediate and long term care services.
Downloaded on 10 Nov 10 from website http://www.aic.sg/individuals-and-
caregivers/paying-for-my-care-services/applying-for-subsidy/what-is-means-test/.
15. AsiaOne. Nursing homes urged to boost rehab services. 10 Nov 2010. Downloaded on 13
Nov 10 from website
http://www.asiaone.com/News/AsiaOne+News/Singapore/Story/A1Story20101110-
246528.html.
16. Agency for Integrated Care. List of intermediate and long term care providers. Downloaded
on 13 Nov 10 from website http://www.aic.sg/.
17. Elderly and Continuing Care Division, Ministry of Health (Singapore). Healthcare Services
for the Elderly. An information booklet for healthcare professionals. Singapore. 2004.

Page 81 of 308
18. Ng YS, Jung H, Tay SS, Bok CW, Chiong Y, Lim PA. Results from a prospective acute
inpatient rehabilitation database: clinical characteristics and functional outcomes using the
Functional Independence Measure. Ann Acad Med Singapore 2007;36:3-10.
19. Deutsch A, Granger CV, Heinemann AW, Fiedler RC, DeJong G, Kane RL, Ottenbacher KJ,
Naughton JP, Trevisan M. Poststroke rehabilitation: outcomes and reimbursement of
inpatient rehabilitation facilities and subacute rehabilitation programs. Stroke 2006;37:1477-
82.
20. United Nations. Population Division, Department of Economic and Social Affairs. World
Population Ageing 1995-2050. 2002.
21. Graham JE, Mitnitski, AB, Mogilner AJ, Rockwood K. The dynamics of cognitive aging:
distinguishing functional age and disease from chronological age in a population. Am J
Epidem 1999; 150:1045-54.
22. Mitnitski AB, Graham JE, Mogilner AJ, Rockwood K. Frailty, fitness and late-life mortality
in relation to chronological and biological age. BMC Geriatr 2002 ;2:1.
23. Statistics Canada. Participation and Activity Limitation Survey 2006: Analytical Report.
Accessed on 6 Apr 11 at webpage http://www.statcan.gc.ca/pub/89-628-x/89-628-x2007002-
eng.pdf.

Page 82 of 308
24. Yadav SS. Disability and Handicap Among Elderly Singaporeans. Singapore Med J
2001;42:360-367.
25. National Advisory Council on Family and Aged. The National Survey of Senior Citizens in
Singapore. 1995.
26. Hardy SE, Gill TM. Recovery from disability among community-dwelling older persons.
JAMA 2004;291:1596-1602.
27. Gill TM, Hardy SE, Williams CS. Underestimation of disability among community-living
older persons. J Am Geriatr Soc 2002;50:1492-1497.
28. Manton KG, Vaupel JW. Survival after the age of 80 in the United States, Sweden, France,
England and Japan. N Engl J Med 1995;333:1232-5.
29. Manton KG, Corder L, Stallard E. Estimates of change in chronic disability and institutional
incidence and prevalence rates in the US elderly population from the 1982, 1984 and 1989
National Long Term Care Survey. J Gerontol B Psychol Sci Soc Sci. 1993;48:S153-66.
30. Manton KG, Gu XL. Changes in the prevalence of chronic disability in the United States
black and non-black population above age 65 from 1982 to 1999. Proc Natl Acad Sci USA
2001;98:6354-9.

Page 83 of 308
31. Manton KG, Corder L, Stallard E. Chronic disability trends in elderly United States
populations: 1982-1994. Proc Natl Acad Sci USA 1997;94:2593-8.
32. Vicki AF, Martin LG and Schoeni RF. Recent trends in disability and functioning among
older Adults in the United States. A systematic review. JAMA 2002;288):3137-46.
33. Chernew ME, Goldman DP, Pan F, Shang B. Disability and health care spending among
Medicare beneficiaries. Health Aff 2006 (doi: 10.1377/hltaff.W5.R42).
34. Participation and Activity Limitation Survey 2001. Accessed on 6 Apr 11 at webpage
http://www.statcan.gc.ca/pub/89-577-x/4065026-eng.htm.
35. The Daily. Participation and Activity Limitation Survey 2006. Accessed on 6 Apr 11 at
webpage http://www.statcan.gc.ca/daily-quotidien/071203/dq071203a-eng.htm.
36. Ministry of Social Affairs. Report on the National Survey of Senior Citizens. 1983.
37. Ministry of Community, Youth and Sports. National Survey of Senior Citizens. 2005.
38. Prvu-Bettger JA, Stineman MG. Effectiveness of multidisciplinary rehabilitation services in
postacute care: state-of-the-science. A review. Arch Phys Med Rehabil 2007;88:1526-34.

Page 84 of 308
39. Ottenbacher KJ, Jannell S. The results of clinical trials in stroke rehabilitation research. Arch
Neurol 1993;50:37-44.
40. Stroke Unit Trialists' Collaboration. Collaborative systematic review of the randomised trials
of organised inpatient (stroke unit) care after stroke. BMJ 1997;314:1151-9.
41. Langhorne P, Duncan P. Does the organization of postacute stroke care really matter? Stroke
2001;32:268-74.
42. Stuck AE, Siu AL, Wieland GD, Adams J, Rubenstein LZ. Comprehensive geriatric
assessment: a meta-analysis of controlled trials. Lancet 1993;342:1032-6.
43. Adunsky A, Lusky A, Arad M, Heruti RJ. A comparative study of rehabilitation outcomes of
elderly hip fracture patients: the advantage of a comprehensive orthogeriatric approach. J
Gerontol A Biol Sci Med Sci 2003;58:542-7.
44. Huusko TM, Karppi P, Avikainen V, Kautiainen H, Sulkava R. Intensive geriatric
rehabilitation of hip fracture patients: a randomized, controlled trial. Acta Orthop Scand
2002;73:425-31.
45. Paolucci S, Antonucci G, Grasso MG, Morelli D, Troisi E, Coiro P, Bragoni M. Early versus
delayed inpatient stroke rehabilitation: a matched comparison conducted in Italy. Arch Phys
Med Rehabil 2000;81:695-700.

Page 85 of 308
46. Kwakkel G, Wagenaar RC, Kollen BJ, et al. Predicting disability in stroke--a critical review
of the literature. Age Ageing 1996;25:479-89.
47. Jorgensen HS, Nakayama H, Raaschou HO, Vive-Larsen J, Stoier M, Olsen TS. Outcome
and time course of recovery in stroke. Part II: time course of recovery. The Copenhagen
Stroke Study. Arch Phys Med Rehabil 1995;76:406-412.
48. Andrews K, Brocklehurst JC, Richards B, Laycock PJ. The rate of recovery from stroke - and
its measurement. Int Rehabil Med 1981;3:155-61.
49. Werner RA, Kessler S. Effectiveness of an intensive outpatient rehabilitation programme for
post-acute stroke patients. Am J Phys Med Rehabil 1996;75:114-20.
50. Tangeman PT, Banaitis DA, Williams AK. Rehabilitation of chronic stroke patients. Changes
in functional performance. Arch Phys Med Rehabil 1990;71:876-80.
51. Wade DT, Collen FM, Robb GF, Warlow CB. Physiotherapy intervention late after stroke
and mobility. BMJ 1992;304:609-13.
52. Saxena SK, Ng TP, Yong D, Fong NP, Koh G. Functional outcomes in inpatient
rehabilitative care of stroke patients: predictive factors and the effect of therapy intensity.
Quality in Primary Care 2006;14:145-53.

Page 86 of 308
53. Bhogal SK, Teasell R, Speechley M. Intensity of aphasica therapy, impact on recovery.
Stroke 2003;34:987-93.
54. Sivenius J, Pyorala K, Heinonen OP, Salonen JT, Riekkinen P. The significance of intensity
of rehabilitation of stroke – a controlled trial. Stroke 1985;16:928-31.
55. Liu CJ, Latham NK. Progressive resistance strength training for improving physical function
in older adults. Cochrane Database Syst Rev 2009;(3):CD002759.
56. Steib S, Schoene D, Pfeifer K. Dose-response relationship of resistance training in older
adults: a meta-analysis. Med Sci Sports Exerc 2010;42:902-14.
57. Forster A, Lambley R, Young JB. Is physical rehabilitation for older people in long-term care
effective? Findings from a systematic review. Age Ageing. 2010;39:169-75.
58. McDowell I, Newell C. Measuring health: a guide to rating scales and questionnaires. New
York: Oxford University Press; 1987.
59. Lawton MP. The functional assessment of elderly people. J Am Geriatr Soc 1971;19:456-81.
60. Weingarden SI, Martin C. Independent dressing after spinal cord injury: a functional time
evaluation. Arch Phys Med Rehabil 1989;70:518-9.

Page 87 of 308
61. Spilker B. editor. Quality of life assessments in clinical trials. New York: Raven Pr; 1990.
62. Katz S, Ford AB, Moskowitz RW, Jackson BA, Jaffee MW. Studies of illness in the aged.
The index of ADL: A standardized measure of biological and psychosocial function. JAMA
1963;185: 914-9.
63. Gresham GE, Phillips TF, Labi MLC. ADL status in stroke: relative merits of three standard
indexes. Arch Phys Med Rehabil 1980;61:355-8.
64. Hartig MT, Engle VF, Graney MJ. Accuracy of nurse aides’ functional health assessments of
nursing home residents. J Gerontol 1997;52:142-8.
65. Asberg KH, Nydevik I. Early prognosis of stroke outcome by means of Katz Index of
activities of daily living. Scand J Rehabil Med 1991;23:187-91.
66. Gillen P, Spore D, Mor V, Freiberger W. Functional and residential status transitions among
nursing home residents. J Gerontol 1996;51:29-36.
67. Mahoney FI, Barthel DW. Functional evaluation: The BI. Maryland State Medical Journal
1965;14:61-5.

Page 88 of 308
68. Crewe NM, Dijkers M. Functional assessment. In: Cushman LA, Scherer MJ, editors.
Psychological assessment in medical rehabilitation. Measurement and instrumentation in
psychology. Washington (DC): American Psychological Association; 1995. p101-44.
69. Cohen ME, Marino RJ. The Tools of Disability Outcomes Research Functional Status
Measures. Arch Phys Med Rehabil 2000;81(12Suppl 2):S21-9.
70. D’Olhaberriague L, Litvan I, Mitsias P, Mansbach HH. A reappraisal of reliability and
validity studies in stroke. Stroke 1996;27:2331-6.
71. Wellwood I, Dennis MS, Warlow CP. A comparison of the BI and the OPCS disability
instrument used to measure outcome after acute stroke. Age Aging 1995;24:54-7.
72. Shepherd SM, Prescott RJ. Use of standardized assessment scales in elderly hip fracture
patients. J Royal Coll Physicians London 1996,30:335-43.
73. Van der Putten JJ, Hobart JC, Freeman JA, Thompson AJ. Measuring change in disability
after the inpatient rehabilitation: comparison of the responsiveness of the BI and the
Functional Independence Measure. J Neurol Neurosurg Psychiatry 1999;66:480-4.
74. Granger CV, Albrecht GL, Hamilton BB. Outcome of comprehensive medical rehabilitation:
measurement of PULSES profile and BI. Arch Phys Med Rehabil 1979;60:145-54.

Page 89 of 308
75. Roy CW, Togneri J, Hay E, Pentland B. An inter-rater reliability study of the BI. Int J
Rehabil Res 1988;11:67-70.
76. Shinar D, Gross, CR, Bronstein KS, Licata-Gehr E, Eden DT, Cabrera AR, et al. Reliability
of the Activities of Daily Living Scale and its use in telephone interview. Arch Phys Med
Rehabil 1997;68:723-8.
77. Korner-Bitensky N, Wood-Dauphinee S. BI information elicited over the telephone. Is it
reliable? Am J Phys Med Rehabil 1995;74:9-18.
78. Shah S, Vanclay F, Cooper B. Improving the sensitivity of the BI for stroke rehabilitation. J
Clin Epidemiol 1989;42:703-9.
79. Shah S, Muncer S. Sensitivity of Shah, Vanclay and Cooper's modified BI. Clin Rehabil
2000;14:551-2.
80. De Morton NA, Keating JL, Davidson M. Rasch analysis of the BI in the assessment of
hospitalized older patients after admission for an acute medical condition. Arch Phys Med
Rehabil 2008;89:641-7.
81. Mudge AM, Giebel AJ, Cutler AJ. Exercising body and mind: an integrated approach to
functional independence in hospitalized older people. J Am Geriatr Soc 2008;56:630-5.

Page 90 of 308
82. McLean R. Employment status six months after discharge from inpatient rehabilitation for a
mild-to-moderate physical disability. Ann Acad Med Singapore 2007;36:18-21.
83. Bennett M, Ryall N. Using the modified BI to estimate survival in cancer patients in hospice:
observational study. BMJ 2000;321:1381-2.
84. Pinedo Otaola S, de La Villa MF. The evolution and prognosis of disability in patients with
hemiplegia. Med Clin (Barc) 2000;115:487-92.
85. Shah S, Vanclay F, Cooper B. Stroke rehabilitation: Australian patient profile and functional
outcome. J Clin Epidemiol 1991;44:21-8.
86. Leung SO, Chan CC, Shah S. Development of a Chinese version of the Modified BI-validity
and reliability. Clin Rehabil 2007;21:912-22.
87. Black T. FIM system adapts to rehabilitation’s changing needs. ARN Network 1992;14:1-2.
88. Pollack N, Rheault W, Stoecker J. Reliability and validity of the FIM for persons aged 80
years and above from a multilevel continuing care retirement community. Arch Phys Med
Rehabil 1996;77:1056-62.

Page 91 of 308
89. Stineman M, Shea J, Jette A, Tassoni C, Ottenbacher K, Fielder R, Granger C. The
Functional Independence Measure: Tests of scaling assumptions, structure, and reliability
across 20 diverse impairment categories. Arch Phys Med Rehabil 1996;77:1101-8.
90. Ottenbacher KJ, Hsu Y, Granger CV, Fiedler RC. The reliability of the functional
independence measure: a quantitative review. Arch Phys Med Rehabil 1996;77:1226-32.
91. Granger CV, Cotter AS, Hamilton BB, Fiedler RC, Hens MM. Functional assessment scales:
a study of persons with multiple sclerosis. Arch Phys Med Rehabil 1990;71:870-5.
92. Hall KM, Cohen ME, Wright J, Call M, Werner P. Characteristics of the Functional
Independence Measure in traumatic spinal cord injury. Arch Phys Med Rehabil
1999;80:1471-6.
93. Granger CV, Ottenbacher KJ, Baker JG, Sehgal A. Reliability of a brief outpatient functional
outcome assessment measure. Am J Phys Med Rehabil 1995;74:469-75.
94. Dodds TA, Matrin DP, Stolov WC, Deyo RA. A validation of the Functional Independence
Measurement and its performance among rehabilitation inpatients. Arch Phys Med Rehabil
1993; 74:531-6.

Page 92 of 308
95. Deutsch A, Braun S, Granger C. The Functional Independence Measure (FIM) and the
Functional Independence Measure for Children (Wee-FIM Instrument): ten years of
development. Crit Rev Phys Rehabil Med 1996;8:267-81.
96. Clohan DB, Durkin EM, Hammel J, Murray P, Whyte J, Dijkers M, Gans BM, Graves DE,
Heinemann AW, Worsowicz G. Postacute rehabilitation research and policy
recommendations. Arch Phys Med Rehabil 2007;88:1535-41.
97. Heinemann AW, Roth EJ, Cichowski K, Betts HB: Multivariate analysis of improvement in
outcome following stroke rehabilitation. Arch Neurol 1987;44:1167-72.
98. Pronovost PJ, Miller M, Wachter RM. The GAAP in quality measurement and reporting.
JAMA 2007;298:1800-1802.
99. Hayward RA. Performance measurement in search of a path. N Engl J Med 2007;356:951-53.
100. Heruti RJ, Lusky A, Barell V, Ohry A, Adunsky A. Cognitive status at admission: does it
affect the rehabilitation outcome of elderly patients with hip fracture? Arch Phys Med
Rehabil. 1999;80:432-6.
101. Lieberman D, Friger M, Lieberman D. Rehabilitation outcome following hip fracture
surgery in elderly diabetics: a prospective cohort study of 224 patients. Disabil Rehabil
2007;29:339-45.

Page 93 of 308
102. Adunsky A, Fleissig Y, Levenkrohn S, Arad M, Noy S. Clock drawing task, mini-mental
state examination and cognitive-functional independence measure: relation to functional
outcome of stroke patients. Arch Gerontol Geriatr 2002;35:153-60.
103. Zwecker M, Levenkrohn S, Fleisig Y, Zeilig G, Ohry A, Adunsky A. Mini-Mental State
Examination, cognitive FIM instrument, and the Loewenstein Occupational Therapy
Cognitive Assessment: relation to functional outcome of stroke patients. Arch Phys Med
Rehabil. 2002;83:342-5.
104. Zeilig G, Weingarden HP, Zwecker M, Rubin-Asher D, Ratner A, Ohry A. Civilian
spinal cord injuries due to terror explosions. Spinal Cord. 2010;48:814-8.
105. Shah S, Vanclay F, Cooper B. Efficiency, effectiveness, and duration of stroke
rehabilitation. Stroke 1990:21:241-6.
106. Drubach DA, Kelly MP, Taragano FE. The Montebello rehabilitation factor score. J
Neuro Rehabil 1994;8:92-6.
107. Luk JK, Chiu PK, Chu LW.Rehabilitation of older Chinese patients with different
cognitive functions: how do they differ in outcome? Arch Phys Med Rehabil 2008;89:1714-
9.

Page 94 of 308
108. Denti L, Agosti M, Franceschini M. Outcome predictors of rehabilitation for first stroke
in the elderly. Eur J Phys Rehabil Med 2008;44:3-11.
109. Rolland Y, Pillard F, Lauwers-Cances V, Busquère F, Vellas B, Lafont C. Rehabilitation
outcome of elderly patients with hip fracture and cognitive impairment. Disabil Rehabil.
2004;26:425-31.
110. Adunsky A, Lusky A, Arad M, Heruti RJ. A comparative study of rehabilitation
outcomes of elderly hip fracture patients: the advantage of a comprehensive orthogeriatric
approach. J Gerontol A Biol Sci Med Sci. 2003;58:542-7.
111. Jones GR, Miller TA, Petrella RJ. Evaluation of rehabilitation outcomes in older patients
with hip fractures. Am J Phys Med Rehabil 2002;81:489-97.
112. Heruti RJ, Lusky A, Dankner R, Ring H, Dolgopiat M, Barell V, Levenkrohn S, Adunsky
A. Rehabilitation outcome of elderly patients after a first stroke: effect of cognitive status at
admission on the functional outcome. Arch Phys Med Rehabil. 2002;83:742-9.
113. Shiri-Sharvit O, Arad M, Mizrahi EH, Fleissig Y, Adunsky A. The association between
psychotropic medication use and functional outcome of elderly hip fracture patients
undergoing rehabilitation. Arch Phys Med Rehabil 2005; 86:1389-1393.
Page 95 of 308
114. Hershkovitz A, Kalandariov Z, Hermush V, Weiss R, Brill S. Factors affecting short-term
rehabilitation outcomes of disabled elderly patients with proximal hip fracture. Arch Phys
Med Rehabil 2007;88:916-21.
115. Guerini F, Frisoni GB, Bellelli G, Trabucchi M. Subcortical vascular lesions and
functional recovery in older patients with gait disorders. Arch Gerontol Geriatr 2007;45:87-
96.
116. National Institutes of Health. U.S. National Library of Medicine. Accessed on 8 Nov 10
from http://www.ncbi.nlm.nih.gov/pubmed/.
117. Lin JH, Chang CM, Liu CK, Huang MH, Lin YT. Efficiency and effectiveness of stroke
rehabilitation after first stroke. J Formos Med Assoc 2000;99:482-90.
118. Micieli G, Cavallini A, Quaglini S. Guideline compliance improves stroke outcomes: a
preliminary study in 4 districts in the Italian region of Lombardia. Stroke 2002;33:1341-7.
119. Di Monaco M, Schintu S, Dotta M, Barba S, Tappero R, Gindri P. Severity of unilateral
spatial neglect is an independent predictor of functional outcome after acute inpatient
rehabilitation in individuals with right hemispheric stroke. Archives of physical medicine and
rehabilitation 2011;92(8):1250-6.

Page 96 of 308
120. Koh GC, Chen C, Cheong A, Choo TB, Pui CK, Phoon FN et al. Trade-offs between
effectiveness and efficiency in stroke rehabilitation. Int J Society 2011. DOI: 10.1111/j.1747-
4949.2011.00612.x.
121. Chae J, Zorowitz RD, Johnston MV. Functional outcome of hemorrhagic and
nonhemorrhagic stroke patients after in-patient rehabilitation. Am J Phys Med Rehabil
1996;75:177-82.
122. Dombovy ML, Drew-Cates J, Serdans R. Recovery and rehabilitation following
subarachnoid haemorrhage. Part I: Outcome after inpatient rehabilitation. Brain Inj
1998;12:443-54.
123. Huang ME, Cifu DX, Keyser-Marcus L. Functional outcome after brain tumor and acute
stroke: a comparative analysis. Arch Phys Med Rehabil 1998;79:1386-90.
124. Juneja G, Czyrny JJ, Linn RT. Admission balance and outcomes of patients admitted for
acute inpatient rehabilitation. Am J Phys Med Rehabil 1998;77:388-93.
125. O'Dell MW, Barr K, Spanier D, Warnick RE. Functional outcome of inpatient
rehabilitation in persons with brain tumors. Arch Phys Med Rehabil 1998;79:1530-4.

Page 97 of 308
126. Oden KE, Kevorkian CG, Levy JK. Rehabilitation of the post-cardiac surgery stroke
patient: analysis of cognitive and functional assessment. Arch Phys Med Rehabil 1998;79:67-
71.
127. Cifu DX, Huang ME, Kolakowsky-Hayner SA, Seel RT. Age, outcome, and
rehabilitation costs after paraplegia caused by traumatic injury of the thoracic spinal cord,
conus medullaris, and cauda equina. J Neurotrauma 1999;16:805-15.
128. Gillen R, Eberhardt TL, Tennen H, Affleck G, Groszmann Y. Screening for depression in
stroke: relationship to rehabilitation efficiency. J Stroke Cerebrovasc Dis 1999;8:300-6.
129. Johns JS, Cifu DX, Keyser-Marcus L, Jolles PR, Fratkin MJ. Impact of clinically
significant heterotopic ossification on functional outcome after traumatic brain injury. J Head
Trauma Rehabil 1999;14:269-76.
130. Lin JH, Huang MH, Liu CK, Lin YT, Lee CH. The relation between admission balance
and functional outcomes following stroke rehabilitation: a medical centre based study.
Kaohsiung J Med Sci 1999;15:491-7.
131. McKinley WO, Huang ME, Brunsvold KT. Neoplastic versus traumatic spinal cord
injury: an outcome comparison after inpatient rehabilitation. Arch Phys Med Rehabil
1999;80:1253-7.

Page 98 of 308
132. McKinley WO, Kolakowsky SA, Kreutzer JS. Substance abuse, violence, and outcome
after traumatic spinal cord injury. Am J Phys Med Rehabil 1999;78:306-12.
133. McKinley WO, Seel RT, Hardman JT. Nontraumatic spinal cord injury: incidence,
epidemiology, and functional outcome. Arch Phys Med Rehabil 1999;80:619-23.
134. Moorthi S, Schneider WN, Dombovy ML. Rehabilitation outcomes in encephalitis--a
retrospective study 1990-1997. Brain Inj 1999;13:139-46.
135. Huang ME, Cifu DX, Keyser-Marcus L. Functional outcomes in patients with brain
tumor after inpatient rehabilitation: comparison with traumatic brain injury. Am J Phys Med
Rehabil 2000;79:327-35.
136. Adunsky A, Levenkron S, Fleissig Y, Blumstein Z, Chetrit A. In-hospital referral source
and rehabilitation outcome of elderly stroke patients. Aging (Milano) 2001;13:430-6.
137. Gillen R, Tennen H, McKee TE, Gernert-Dott P, Affleck G. Depressive symptoms and
history of depression predict rehabilitation efficiency in stroke patients. Arch Phys Med
Rehabil 2001;82:1645-9.
138. Lin JH. Influence of admission functional status on functional gain and efficiency of
rehabilitation in first time stroke patients. Kaohsiung J Med Sci 2001;17:312-8.

Page 99 of 308
139. Lin JH, Hsiao SF, Liu CK, Lin YT. Rehabilitation fees, length of stay and efficiency for
hospitalized stroke patients: a preliminary study based on function-related groups. Kaohsiung
J Med Sci 2001;17:475-83.
140. Marciniak CM, Sliwa JA, Heinemann AW, Semik PE. Functional outcomes of persons
with brain tumors after inpatient rehabilitation. Arch Phys Med Rehabil 2001;82:457-63.
141. McKinley WO, Seel RT, Gadi RK, Tewksbury MA. Nontraumatic vs. traumatic spinal
cord injury: a rehabilitation outcome comparison. Am J Phys Med Rehabil 2001;80:693-9.
142. Patrick L, Knoefel F, Gaskowski P, Rexroth D. Medical comorbidity and rehabilitation
efficiency in geriatric inpatients. J Am Geriatr Soc 2001;49:1471-7.
143. Ergeletzis D, Kevorkian CG, Rintala D. Rehabilitation of the older stroke patient:
functional outcome and comparison with younger patients. Am J Phys Med Rehabil
2002;81:881-9.
144. Lew HL, Lee E, Date ES, Zeiner H. Influence of medical comorbidities and
complications on FIM change and length of stay during inpatient rehabilitation. Am J Phys
Med Rehabil 2002;81:830-7.
145. McKinley WO, Tewksbury MA, Mujteba NM. Spinal stenosis vs traumatic spinal cord
injury: a rehabilitation outcome comparison. J Spinal Cord Med 2002;25:28-32.

Page 100 of 308
146. Murakami M, Inouye M. Stroke rehabilitation outcome study: a comparison of Japan
with the United States. Am J Phys Med Rehabil 2002;81:279-82.
147. O'Dell MW, Watanabe TK, De Roos ST, Kager C. Functional outcome after inpatient
rehabilitation in persons with subarachnoid hemorrhage. Arch Phys Med Rehabil
2002;83:678-82.
148. Roth EJ, Lovell L, Harvey RL, Bode RK, Heinemann AW. Stroke rehabilitation:
indwelling urinary catheters, enteral feeding tubes, and tracheostomies are associated with
resource use and functional outcomes. Stroke 2002;33:1845-50.
149. Burnett DM, Kolakowsky-Hayner SA, Slater D, Stringer A, Bushnik T, Zafonte R, Cifu
DX. Ethnographic analysis of traumatic brain injury patients in the national Model Systems
database. Arch Phys Med Rehabil 2003;84:263-7.
150. Hoffman JM, Doctor JN, Chan L, Whyte J, Jha A, Dikmen S. Potential impact of the new
medicare prospective payment system on reimbursement for traumatic brain injury inpatient
rehabilitation. Arch Phys Med Rehabil 2003;84:1165-72.

Page 101 of 308
151. Kevorkian CG, Kaldis T, Mahajan G, Graves DE. Rehabilitation of postcardiac surgery
stroke patients. Progress, outcomes, and comparisons with other stroke patients. Am J Phys
Med Rehabil 2003;82:537-43.
152. Forrest GP. Inpatient rehabilitation of patients requiring hemodialysis. Arch Phys Med
Rehabil 2004;85:51-3.
153. Lenze EJ, Munin MC, Dew MA, Rogers JC, Seligman K, Mulsant BH, Reynolds CF 3rd.
Adverse effects of depression and cognitive impairment on rehabilitation participation and
recovery from hip fracture. Int J Geriatr Psychiatry 2004;19:472-8.
154. Shah MK, Al-Adawi S, Dorvlo AS, Burke DT. Functional outcomes following anoxic
brain injury: a comparison with traumatic brain injury. Brain Inj 2004;18:111-7.
155. Forrest G, Nagao M, Iqbal A, Kakar R. Inpatient rehabilitation of patients requiring
hemodialysis: improving efficiency of care. Arch Phys Med Rehabil 2005;86:1949-52.
156. Gagnon D, Nadeau S, Tam V. Clinical and administrative outcomes during publicly-
funded inpatient stroke rehabilitation based on a case-mix group classification model. J
Rehabil Med 2005;37:45-52.
157. Yu F, Richmond T. Factors affecting outpatient rehabilitation outcomes in elders. J Nurs
Scholarsh 2005;37:229-36.

Page 102 of 308
158. Yu F, Evans LK, Sullivan-Marx EM. Functional outcomes for older adults with cognitive
impairment in a comprehensive outpatient rehabilitation facility. J Am Geriatr Soc
2005;53:1599-606.
159. Bottemiller KL, Bieber PL, Basford JR, Harris M. FIM score, FIM efficiency, and
discharge disposition following inpatient stroke rehabilitation. Rehabil Nurs 2006;31:22-5.
160. Diamond PT, Conaway MR, Mody SH, Bhirangi K. Influence of hemoglobin levels on
inpatient rehabilitation outcomes after total knee arthroplasty. J Arthroplasty 2006;21:636-
41.
161. Salter K, Jutai J, Hartley M, Foley N, Bhogal S, Bayona N, Teasell R. Impact of early vs
delayed admission to rehabilitation on functional outcomes in persons with stroke. J Rehabil
Med 2006;38:113-7.
162. Turner-Stokes L, Paul S, Williams H. Efficiency of specialist rehabilitation in reducing
dependency and costs of continuing care for adults with complex acquired brain injuries. J
Neurol Neurosurg Psychiatry 2006;77:634-9.
163. Vincent KR, Lee LW, Weng J, Alfano AP, Vincent HK. A preliminary examination of
the CMS eligibility criteria in total-joint arthroplasty. Am J Phys Med Rehabil 2006;85:872-
81.

Page 103 of 308
164. Vincent KR, Vincent HK, Lee LW, Weng J, Alfano AP. Outcomes after inpatient
rehabilitation of primary and revision total hip arthroplasty. Arch Phys Med Rehabil
2006;87:1026-32.
165. Vincent KR, Vincent HK, Lee LW, Alfano AP. Outcomes in total knee arthroplasty
patients after inpatient rehabilitation: influence of age and gender. Am J Phys Med Rehabil
2006;85:482-9.
166. Vincent KR, Vincent HK, Lee LW, Alfano AP. Inpatient rehabilitation outcomes in
primary and revision total knee arthroplasty patients. Clin Orthop Relat Res 2006;446:201-7.
167. Vincent HK, Alfano AP, Lee L, Vincent KR. Sex and age effects on outcomes of total
hip arthroplasty after inpatient rehabilitation. Arch Phys Med Rehabil 2006;87:461-7.
168. Yokoyama O, Sakuma F, Itoh R, Sashika H. Paraplegia after aortic aneurysm repair
versus traumatic spinal cord injury: functional outcome, complications, and therapy intensity
of inpatient rehabilitation. Arch Phys Med Rehabil 2006;87:1189-94.
169. Ng YS, Stein J, Ning M, Black-Schaffer RM. Comparison of clinical characteristics and
functional outcomes of ischemic stroke in different vascular territories. Stroke 2007;38:2309-
14.

Page 104 of 308
170. Ng YS, Jung H, Tay SS, Bok CW, Chiong Y, Lim PA. Results from a prospective acute
inpatient rehabilitation database: clinical characteristics and functional outcomes using the
Functional Independence Measure. Ann Acad Med Singapore 2007;36:3-10.
171. Vincent HK, Weng JP, Vincent KR. Effect of obesity on inpatient rehabilitation
outcomes after total hip arthroplasty. Obesity (Silver Spring) 2007;15:522-30.
172. Vincent HK, Vincent KR, Lee LW, Alfano AP. Effect of obesity on inpatient
rehabilitation outcomes following total knee arthroplasty. Clin Rehabil 2007;21:182-90.
173. Kortebein P, Bopp MM, Granger CV, Sullivan DH. Outcomes of inpatient rehabilitation
for older adults with debility. Am J Phys Med Rehabil 2008;87:118-25.
174. Ottenbacher KJ, Campbell J, Kuo YF, Deutsch A, Ostir GV, Granger CV. Racial and
ethnic differences in postacute rehabilitation outcomes after stroke in the United States.
Stroke 2008;39:1514-9.
175. Rabadi MH, Rabadi FM, Edelstein L, Peterson M. Cognitively impaired stroke patients
do benefit from admission to an acute rehabilitation unit. Arch Phys Med Rehabil
2008;89:441-8.

Page 105 of 308
176. Woo J, Chan SY, Sum MW, Wong E, Chui YP. In patient stroke rehabilitation
efficiency: influence of organization of service delivery and staff numbers. BMC Health Serv
Res 2008;8:86.
177. Fromovich-Amit Y, Biering-Sørensen F, Baskov V, Juocevicius A, Hansen HV,
Gelernter I, Hart J, Baskov A, Dreval O, Terese P, Catz A. Properties and outcomes of spinal
rehabilitation units in four countries. Spinal Cord 2009;47:597-603.
178. Granger CV, Markello SJ, Graham JE, Deutsch A, Ottenbacher KJ. The uniform data
system for medical rehabilitation: report of patients with stroke discharged from
comprehensive medical programs in 2000-2007. Am J Phys Med Rehabil 2009;88:961-72.
179. McGilton KS, Mahomed N, Davis AM, Flannery J, Calabrese S. Outcomes for older
adults in an inpatient rehabilitation facility following hip fracture (HF) surgery. Arch
Gerontol Geriatr 2009;49:e23-31.
180. Tay SS, Ng YS, Lim PA. Functional outcomes of cancer patients in an inpatient
rehabilitation setting. Ann Acad Med Singapore 2009;38:197-201.
181. Granger CV, Markello SJ, Graham JE, Deutsch A, Reistetter TA, Ottenbacher KJ. The
uniform data system for medical rehabilitation: report of patients with traumatic brain injury
discharged from rehabilitation programs in 2000-2007. Am J Phys Med Rehabil
2010;89:265-78.

Page 106 of 308
182. Granger CV, Markello SJ, Graham JE, Deutsch A, Reistetter TA, Ottenbacher KJ. The
uniform data system for medical rehabilitation: report of patients with lower limb joint
replacement discharged from rehabilitation programs in 2000-2007. Am J Phys Med Rehabil
2010;89:781-94.
183. Luk JK, Chan CF. Rehabilitation outcomes of older patients at 6 months follow-up after
discharged from a geriatric day hospital (GDH). Arch Gerontol Geriatr 2010. [Epub ahead of
print]
184. Luk JK, Chan CF, Chan FH, Chu LW. Rehabilitation outcomes of older Chinese patients
with different cognitive function in a geriatric day hospital. Arch Gerontol Geriatr 2010.
[Epub ahead of print]
185. Gialanella B, Ferlucci C. Functional outcome after stroke in patients with aphasia and
neglect: assessment by the motor and cognitive functional independence measure instrument.
Cerebrovasc Dis 2010;30(5):440-7.
186. Meiner Z, Sajin A, Schwartz I, Tsenter J, Yovchev I, Eichel R et al. Rehabilitation
outcomes of stroke patients treated with tissue plasminogen activator. PM&R 2010;2(8):698-
702.

Page 107 of 308
187. Semel J, Gray JM, Ahn HJ, Nasr H, Chen JJ. Predictors of outcome following hip
fracture rehabilitation. PM&R 2010;2(9):799-805.
188. Pellicane AJ, Wysocki NM, Mallinson TR, Schnitzer TJ. Prevalence of 25-
hydroxyvitamin D deficiency in the acute inpatient rehabilitation population and its effect on
function. Arch Phys Med Rehabil 2011;92(5):705-11.
189. Dakin L, Peel N. Effect of accelerometry on the functional mobility of older
rehabilitation inpatients as measured by functional independence measure--locomotion (FIM)
gain: a retrospective matched cohort study. J Nutr Health Aging 2011;15(5):382-6.
190. Tian W, Dejong G, Horn SD, Putman K, Hsieh CH, Davanzo JE. Efficient rehabilitation
care for joint replacement patients: skilled nursing facility or inpatient rehabilitation facility?
Med Decision Making 2012;32(1):176-87.
191. Granger CV, Reistetter TA, Graham JE, Deutsch A, Markello SJ, Niewczyk P,
Ottenbacher KJ. The Uniform Data System for Medical Rehabilitation: report of patients
with hip fracture discharged from comprehensive medical programs in 2000-2007. Am J
Phys Med Rehabil 2011;90:177-89.
192. Press Y, Grinshpun Y, Berzak A, Friger M, Clarfield AM. The effect of co-morbidity on
the rehabilitation process in elderly patients after hip fracture. Arch Gerontol Geriatr
2007;45:281-94.

Page 108 of 308
193. Carter GM, Hayden O, Paddock SM, Barbara, Wynn BO. Case Mix Certification Rule
for Inpatient Rehabilitation Facilities. RAND. 2003.
194. Agency for Integrated Care. Mission and core values. Accessed on 7 Apr 11 at webpage
http://www.aic.sg/page.aspx?id=127.
195. Jarman B, Gault S, Alves B, et al. Explaining differences in English hospital death rates
using routinely collected data. BMJ 1999;318:1515-20.

Page 109 of 308
CHAPTER TWO: THE SOCIODEMOGRAPHIC AND CLINICAL PROFILE OF ADMISSIONS TO COMMUNITY HOSPITALS IN
SINGAPORE FROM 1996 TO 2005: A DESCRIPTIVE STUDY
[This chapter was accepted for publication in the Annals of Academy of Medicine Singapore on
19 April 2012.]
Introduction
Intermediate care and long term care (ILTC), a range of services facilitating step-down care from
the hospital to home,1,2 has become an integral part of healthcare systems. Community hospitals,
are key providers of residential intermediate care.3,4 Patients may be admitted into community
hospitals for various purposes, such as rehabilitation, sub-acute care, palliative care and respite
care.5 These community hospitals can be viable alternatives to acute hospitals by increasing
functional independence post-rehabilitation6,7 and reducing long-term mortality8 as well as
readmissions to acute care;9 while remaining as cost-effective as elderly care departments in
acute hospitals.10,11 While a wealth of literature exists on the benefits of community hospitals for
various disease-specific outcomes, there has been little evaluation of changes over time with
regards to patient characteristics, medical co-morbidities, and functional status of patients
admitted to community hospitals. The lack of routine data on community hospital activities poses
problems when evaluating their role in healthcare delivery.12 The few existing studies from West
demonstrate that there can be significant changes in casemix, patient profile, and purpose of
admission both over time and between similar inpatient facilities in the same region.5,13,14
Particularly in Asia, where ageing populations15,16 will likely increase demand for intermediate
care, such studies would help in planning healthcare service delivery in these societies.

Page 110 of 308
Singapore is one such example of a multi-ethnic Asian society with an ageing population. In
Singapore, ILTC is provided both in residential settings, such as community hospitals, nursing
homes with and without chronic sick facilities, and hospices; as well as in home-based settings.17
Community hospitals in Singapore provide the bulk of intermediate care and are run by
voluntary welfare organizations (VWOs). They care for patients who have been discharged from
acute hospitals but still require inpatient rehabilitative, subacute and/or convalescent care.18 As
per Singapore’s Ministry of Health (MOH) guidelines, community hospitals ensure that these
patients achieve their optimal potential before being discharged.19 Currently, Singapore has five
community hospitals: Ang Mo Kio Thye Hua Kwan Hospital (AMKTHKH), St Luke’s Hospital
(SLH), St Andrew’s Community Hospital (SACH), Bright Vision Hospital (BVH) and Ren Ci
Hospital, providing a total of more than 1000 beds and there are plans to build at least two more
community hospitals by 2016.20 Although there have been studies on determinants of length of
stay21 and discharge-related issues,22,23,24 there has been no local study investigating the profile
of community hospital patient admissions on a national level. As such, we reviewed the profile
and sociodemographic characteristics of all patient admissions in all community hospitals in
existence from 1996-2005, with the aim of studying the differences, if any, by hospital and year
of admission. We believe that such a review would be of use to those involved in the planning
and delivery of intermediate care in Singapore and other similar societies.
Methods
Data extraction was performed retrospectively from non-computerized medical records of all
patients admitted to the four community hospitals existent in Singapore from 2nd January 1996

Page 111 of 308
to 31st December 2005 (AMKTHKH, SLH, SACH and BVH) with BVH opening only in late
2002. Four research nurses who were tasked with collecting the data underwent training and
were supervised by the PhD candidate. The data collection period was from November 2006 to
December 2009. The study was approved by the National University of Singapore Institutional
Review Board and ethics committees of all the hospitals. The sampling frame for the study was
all patients from all four community hospitals. Variables studied included the socio-demographic
characteristics, clinical profile using the Charlson co-morbidity index (CCMI),25 and
socioeconomic status based on hospital bed class and means testing. In Singapore, during the
study period, only patients staying in C class (non air-conditioned, 8-bedded) or B2 class (non
air-conditioned, 6-bedded) wards receive subsidies from the government for cost of hospital stay;
patients in higher class wards do not receive any subsidy. In 2001, means testing was
implemented at ILTC facilities for C and B2 class patients to ensure that subsidies were awarded
according to patient and family’s financial circumstance (i.e. the patient’s total family income
per capita).17 In this study, immediate family members were defined as spouse, children,
grandchildren (or siblings if the patient is single) who are aged ≥18 years and able to provide
care to the patient; potential caregivers were defined as anyone aged ≥18 years, living with the
patient and is physically able to provide care to the patient (including foreign domestic worker);
while the primary caregiver was defined as the main person among all potential caregivers who
will provide physical care to the patient. Functional status was quantified using the Shah-
modified Barthel Index (BI)26 and both admission BI and discharge BI were recorded. Length of
stay (LOS) was calculated as the total number of inpatient days and time to rehabilitation was
calculated as number of days between date of onset of principal diagnosis for admission and date
of admission to community hospital.

Page 112 of 308
Statistical Analysis
Data was reviewed for all patient admissions in the four community hospitals from 1996 through
2005. LOS and time to rehabilitation in the study were skewed, and were log transformed before
bivariate analysis and their geometric means calculated. Pearson’s chi-square test was used for
univariate analysis of all categorical variables by type of community hospitals; and test for linear
by linear association was used to assess trends in categorical variables by year of admission. For
continuous variables such as geometric mean of time from onset of principal diagnosis for
admission to date of admission, length of stay and mean BI scores, ANOVA was used to
compare between hospitals and to generate beta coefficients for trend by year of admission. The
same patient who was admitted more than once into community hospitals could be counted more
than once when generating descriptive results (e.g. gender, ethnicity). However, for some
variables like age, length of stay and BI scores, results will vary between different admissions for
the same patient. As the profile of patient admissions is more important from a health services
research perspective (e.g. for health policy and resource planning) than the individual patient, we
opted to analyze data by patients admissions and not by individual patient. All statistical analyses
were performed using SPSS Version 17.0 (IBM Corp, NY, USA). Statistical significance was set
at the conventional p<0.05. Correction for multiple comparisons was not done as the main aim of
this paper was only to examine bivariate relationships between sociodemographic variables and
hospital or year of admission. Nevertheless, the p-values are reported so that readers can adjust

Page 113 of 308
for multiple comparisons (e.g. using Bonferroni correction) and adopt a more stringent level for
statistical significance (e.g. p<0.001 for 50 comparisons) if desired.
Results
For the purpose of anonymity, the four community hospitals are referred to as Hospital A, B, C,
and D. The total sample includes 19,360 admissions from all the four community hospitals from
1996 through 2005. The sociodemographic and clinical information for all patient admissions
are shown by hospital type in Table 7 and by year of admission in Table 8.
All Patient Admissions (Table 7)
The mean age of all patient admissions was 74.1 (SD = 11.7) years and 58.1% comprised of
females. All four ethnic groups were represented in the sample, with Chinese making up the
majority (88.4%). Majority were widowed (46.7%) or married (41.4%); 9.1% were single and
2.9% were separated or divorced. Rehabilitation was the main purpose for admission (88.0%)
while respite care was the second most common reason for admission (7.6%). Most (91.0%)
were admitted to the subsidized wards. Since means-testing was started in 2002, the majority of
patient admissions were not means-tested (71.9%). Of the 5432 who were means-tested, 57.4%
were not eligible for government subvention; 22%, 14.5% and 6.1% qualified for the 75%, 50%
and 25% subvention respectively. The majority (82.3%) were first admissions and only 3.2%
were admitted three or more times. Almost 84% had two or more immediate family members,
while 5.4% had none. In terms of caregiver status, 14.9% had no primary caregiver to look after
them, while a third (33.1%) named a foreign domestic helper as their primary caregiver,
followed by children (20.4%) and spouse (18.6%). The principal diagnoses for admission were

Page 114 of 308
strokes (37.1%) and fractures (26.0%). The most common discharge destination was to the
patient’s own home (73.5%). The geometric mean length of stay for all patient admissions was
28.1 days (range=2-203), while the geometric mean time to rehabilitation was 19.9 days
(range=0-11,068) and the mean admission and discharge BI were 46.5 units (standard deviation,
SD=25.5) and 60.2 units (SD=28.0).
By Hospital (Table 7)
Hospital C had the oldest mean age of patient admissions of 75.4 (SD=11.8) years. Although the
ethnic distribution between hospitals was statistically different, this was attributable to small
differences in proportions among the non-Chinese ethnicities. Hospital D had the highest
proportion of singles admitted (22.0% vs. 6.9%-9.2%). C-class patients (those with the highest
subsidy) formed the largest percentage of admissions except in Hospital C where a majority
came from the B2 class (69.2% vs. 0-34.2%). Hospital D had the most C-class patients (99.9%)
and sub-acute care patient admissions (13.4% vs. 0.5-4.3%) while Hospital C had the most
patient admissions for respite care (13.7% vs. 0.7-10.4%). Hospital D had the highest proportion
of patient admissions with no potential caregiver (18.5% vs. 4.8-11.4%) and no immediate
family members (10.6% vs. 2.6-7.7%), and the lowest reliance on foreign domestic workers as a
primary caregiver (20.9% vs. 28.4-43.9%). Not surprisingly, the discharge destination for a
significant proportion of patient admissions in Hospital D was to nursing homes (25.7%)
compared to other community hospitals (6.5-13.1%). For the principal diagnosis for admission
across all four community hospitals, Hospital D had the lowest percentage of stroke cases
(20.5% vs. 35.5-42.2% ) and the highest percentage for fractures (36.4% vs. 21.5-28.4%) while
Hospital B had the reverse (stroke: 42.2% vs. 20.5-37.8%; fractures: 21.5% vs. 26.7-36.4%). The

Page 115 of 308
co-morbidity burden was highest in Hospital B (mean CCMI score 1.42 vs. 1.17-1.21); Hospital
B also had the longest geometric mean time from date of onset of principal diagnosis for
admission to date of admission (25.0 days vs. 17.4-24.3 days); as well as the longest geometric
mean length of stay (34.7 days vs. 24.7-34.3 days). Hospital C had the lowest mean admission
BI (36.3 units vs. 38.3-53.5 units) and the lowest mean discharge BI score (50.9 units vs. 53.9-
68.8 units), while Hospital B had the highest mean admission BI score (53.5 units vs. 36.3-48.1
units) and the highest mean discharge BI score (68.6 units vs. 50.9-61.3 units).
By year of admission (Table 8)
The mean age for patient admissions has been increasing over the years, rising from the mean of
72.8 (SD=12) years in 1996 to 74.8 (SD=11.7) years in 2005. The proportion of females
admitted over the ten year period has been consistently higher than males. Annual trends in
ethnic makeup are detailed in Figure 3. There was a gradual decrease in Chinese (90.4% in 1996
to 86.4% in 2005) and a steady increase in Malay patient admissions over the years (4.8% in
1996 to 8.3% in 2005), but the Chinese percentage is still disproportionately higher and the
Malay percentage lower when compared with the national ethnic distribution of Chinese (78%)
and Malay (12%). The proportion of rehabilitation cases increased from 78.6% in 1996 to 88.7 %
in 2005, peaking to 91.1% and 91.9% in 2001 and 2002 respectively. The proportion of C Class
patient admissions (those with the highest level of government subsidy) has been steadily
increasing over the ten years from 18.7% in 1996 to 83.5% in 2005, while the proportion of
Class B2 patient admissions has declined correspondingly from 63.4% in 1996 to 13.0% in 2005
(Figure 4). With introduction of means testing in 2002, an increasing proportion failed to qualify
for government subvention from 19.6% in 2002 to 46.1% in 2005. Over the years, the number of

Page 116 of 308
potential caregivers has remained stable even though number of immediate family members has
been decreasing, with a mean of 4.22 (SD= 2.51) in 1996 to a mean of 3.98 (SD=2.47) in 2005.
Dependence on foreign domestic workers as primary caregivers has increased steadily from
21.3% in 1996, peaked at 42.1% and 42.5% in 2000 and 2001 respectively, then declined to
32.7% in 2005 (Figure 5). The proportion of stroke cases has been decreasing (50.5% in 1996 to
20.9% in 2005) while those of fractures have been steadily increasing (21.0% in 1996 to 31.8%
in 2005) (Figure 6). However, CCMI score has largely remained unchanged (borderline p-value
of 0.044). There was no rising trend of discharge to nursing homes. Over the ten year period,
the geometric mean length of stay has decreased from 29.7 days (range=4-156) to 26.7 days
(range=2-152) while the geometric mean time from onset of principal diagnosis for admission to
admission to community hospital has remained relatively unchanged (p=0.420). Both mean
admission and discharge BI scores have been increasing from 1996 [41.0 (SD=24.9) and 51.8
(SD=30.0) respectively] to 2005 [48.4 (SD=24.5) and 64.2 (SD=27.3) respectively] (Figure 7).
The analyses comparing variables between hospital and by year of admission were repeated by
treating the unit of analysis as patients instead of admissions, and the results were largely similar
(data not shown).
Discussion
There were significant differences in the profile of patient admissions in Singaporean community
hospitals from 1996 to 2005, both by community hospital and by year. Rehabilitation was still
the main purpose for admission to community hospitals (88.0%), demonstrating that community

Page 117 of 308
hospitals in Singapore function more like inpatient rehabilitation facilities in the US and
specialty rehabilitation facilities in Canada than community hospitals in the UK where sub-acute
care is the most common reason for admission to community hospitals.27 UK community
hospitals also have higher proportion of patients admitted for respite care (31%) and a
correspondingly lower proportion admitted for rehabilitation (22%).5 The proportion of
admissions into community hospitals for respite care in the UK may have increased over time, as
suggested by a 1975 study on one community hospital where 12% of admissions were for
respite28 and another study 20 years later in 1995 on eight community hospitals where 31% of
admissions were for respite.5 Respite care is a key service in Western societies, and can be
accessed in a variety of settings, such as day centres, family placement schemes, and institutional
care.29 In Singapore, there is demand for respite care30 but only a minority of caregiver support
providers offer respite care.31 The reduced role of respite care in the Singaporean context could
be due to limited supply, absence of subsidies for respite care and cultural sensitivities; in Asian
societies, respite care can be culturally sensitive due to negative perceptions of lack of filial piety
associated with institutionalizing one’s parents, even for a short period.32,33
There were also intriguing differences in caregiver status for elderly patient admissions to
community hospitals in an urbanised Asian society. Thirty-eight percent of patients admitted to
UK community hospitals lived alone5 compared with around 10% in our study, reflecting the
tendency of older persons living with their children in Asia. Moreover, foreign domestic workers
were identified as the most common primary caregiver in the Singaporean context (33.1%)
which is strikingly different from the UK situation where the spouse was the most common
primary caregiver (31.4%).5 Unfortunately, there is little literature on the nature of caregivers of

Page 118 of 308
patients admitted into inpatient rehabilitation facilities in US and Canada. It is possible that
shrinking family size, increasing employment rates or greater disposable household incomes
locally have led to decreased availability of family members, leading to dependence on foreign
domestic workers.34 In Singapore, there were over 100,000 foreign domestic workers in the late
1990s, with 75% from the Philippines and 20% from Indonesia.35 The trend of migrant workers
being over-represented in long-term care is not a new one in developed countries.36 However,
this is usually in the context of skilled nurses and other allied healthcare professionals working in
long-term care institutions, and not unskilled foreign domestic workers employed as caregivers
within the community. The employment of live-in foreign domestic workers as carers for the
elderly has become commonplace in Singapore.37,38 This trend is also present in other urbanised
Asian societies like Hong Kong and Malaysia . There has been little study on the effects of
employing foreign domestic workers as caregivers. Studies in Hong Kong and Singapore found
that employment of a foreign domestic worker predicted reduced institutionalisation of the
elderly.39,40 However, a study from Malaysia suggested that the employment of maids did not
alleviate caregiver burden for carers of dementia patients.41 Most foreign domestic workers do
not have formal training in eldercare and there are significant language and cultural barriers
between them and the elderly which may increase stress, miscommunication, and possibly
caregiving errors. Given the under-appreciated role of foreign domestic workers in caring for the
elderly in these societies, more studies are needed on the effects of these carers on patient health
outcomes, their impact on family caregivers and patients, and the sustainability of such
arrangements.

Page 119 of 308
Our finding that there were significant differences in the profile of patient admissions between
community hospitals is similar to UK studies which demonstrated variability between
community hospitals located in the same region and Canadian studies which found variability
between general and specialized inpatient rehabilitation facilities .5,14 This could be accentuated
in Singapore because the different community hospitals are run by voluntary welfare
organisations with different ethos and missions. These differences in missions were to some
extent reflected in the results. For example, Hospital D with its admission criteria focussed on
the poor and needy, saw the highest proportion of patient admissions with indicators of lower
socioeconomic status and poor social support. As community hospitals are not the same,
different hospitals might need varying degrees of public support and ancillary services to meet
patient needs and remain viable. The proportion of the different types of care offered would also
vary according to medical capabilities. For example, Hospital D had more subacute care patient
admissions because of the availability of the relevant expertise to provide this higher level of
care when it opened in 2003. Hospital D was run by a voluntary welfare organisation up to 2011
when the hospital was transferred to the Ministry of Health because the VWO faced significant
challenges in sustaining medical capabilities to provide care to patients. Hence, doctors referring
patients to these hospitals should not adopt a “one size fits all” approach, but should consider
individual needs of the patient in the context of the varying capacities of different community
hospitals.42
In terms of trends in admissions to Singaporean community hospitals over the 10 year period,
mean age of patient admissions has been increasing steadily. Demand for intermediate care is
likely to grow in the foreseeable future as the proportion of older persons in the national

Page 120 of 308
population is projected to increase from 9% in 2009 to 19% in 2030.18 The proportion of stroke
cases has been decreasing while those of fractures have been increasing; this may be a result of
the changing trends in incidence of stroke and osteoporotic fractures or selection bias of patients
referred to community hospitals. According to the Annual Stroke Registry Report by the MOH
National Registry of Diseases Office, the number of new stroke patients aged 15 years and above
increased from 5,463 in 2005 to 5,743 in 2010.43 Although this community hospitals study’s data
included recurrent stroke and examined the decade before Annual Stroke Registry Report data, it
is unlikely that the decreasing proportion of stroke cases in community hospitals from 1996 to
2005 is attributable to changing trends in incidence rates of stroke. Unfortunately, the incidence
rate of strokes in Singapore from 1996 to 2005 is not publicly available. Over ten years, mean
length of stay has decreased while admission and discharge BI scores have increased. Although
the average length of stay of 28.1 days was longer than estimates from community hospitals in
the UK (14-20 days)5, inpatient rehabilitation facilities in the US (12-20 days)13 and general
inpatient rehabilitation facilities in Canada (13 days)14, this could be because of the focus of the
local community hospitals on rehabilitation, which requires more time compared to subacute or
respite care; the decreasing length of stay also suggests that community hospitals in Singapore
are not in danger of becoming mere long-stay geriatric units, a criticism sometimes levelled at
community hospitals.41 Interestingly, the average length of stay for speciality inpatient
rehabilitation facilities in Canada was 30 days which is similar to our study14, further supporting
that our community hospitals may function more similarly to specialty rather than general
inpatient rehabilitation facilities in Canada. Admission BI scores have been increasing over the
10 year period; whether this is a result of changing functional status after acute disabling
conditions or selection of less disabled patients for admission needs further research.

Page 121 of 308
Nevertheless, like with admission BI scores, discharge BI scores were also increasing over the 10
year period, suggesting that Singaporean community hospitals have been generally successful in
rehabilitation to some extent. The discharge destination for 73.5% of patient admissions was
patient’s own home; this is similar to estimates of 67-76% in UK community hospitals5 but is
lower than estimates from US (81-91%)13 and Canada (84%) inpatient rehabilitation facilities14.
Our study has several limitations. As most of the data reported in this study was descriptive, we
were unable to establish a causative relationship for the trends reported in this study. We did not
have data on the variations in staffing numbers for each discipline and bed occupancy within the
decade studied which could have affected the staff to patient ratios which in turn could have
affected outcomes like discharge BI scores. Furthermore, the data in this study was retrospective
and limited to the 1996-2005 period, and hence may not reflect the current situation. Since 2006,
there have been several changes in the intermediate and long-term care sector in Singapore; most
notably, another 327 community hospital beds have been added to Singapore’s healthcare
infrastructure which were not included in this study. Lastly, the descriptive data presented is
based on patient admissions and not by individual patient, although the majority of admissions
were first admissions (83.3%) and the analyses between community hospitals and by year of
admission were largely similar when the unit of analysis were patients instead of admissions.
Conclusion
Community hospitals play an integral role of the ILTC landscape in Singapore’s healthcare
system, and their importance is likely to grow in an ageing society. However, there are
significant differences in the profile of patient admissions to these hospitals serving an urbanised

Page 122 of 308
Asian society, compared with their counterparts in the West. Such differences include a greater
focus on rehabilitation and lesser focus on sub-acute/respite/palliative care that is a priority in
Western societies; as well as intriguing differences in caregiver profile, particularly a heavy
dependence on foreign domestic workers as primary caregivers. Nevertheless, length of stay was
comparable with specialty inpatient rehabilitation facilities in Canada. It is hoped that this
information on socio-demographic profile and clinical characteristics of patient admissions will
broaden health practitioners and policymakers’ perspective of the temporal changes that have
occurred within community hospitals, and help them project future healthcare service needs.

Page 123 of 308
Tables
Table 7. Characteristics of all patient admissions to Singaporean community hospitals from 1996-2005 by community hospital (N=19,360)
Characteristic Total (%)
(N=19,360)
Community Hospital, n (%) p-
value A (N=9,675)
B (N=5,012)
C (N=3,911)
D (N=762)
Age (years)
≤ 70 6,104 (31.5) 3309 (34.2) 1520 (30.3) 1005
(25.7) 270
(35.4) <0.001
> 70 13,256 (68.5) 6366 (65.8) 3492 (69.7) 2906
(74.3) 492
(64.6)
Age Mean (SD) 74.1 (11.7) 73.3 (11.8) 74.9 (10.6) 75.4
(11.8) 73.0
(14.6) -
Gender
Male 8,120 (41.9) 4087 (42.2) 2121 (42.3) 1590
(40.7) 322
(42.3) 0.341
Female 11,240 (58.1) 5588 (57.8) 2891 (57.7) 2321
(59.3) 440
(57.7) Ethnicity
Chinese 17,112 (88.4) 8629 (89.2) 4404 (87.9) 3403
(87.0) 676
(88.7) <0.001 Malay 1,159 (6.0) 509 (5.3) 325 (6.5) 285 (7.3) 40 (5.2)
Indian 842 (4.3) 433 (4.5) 226 (4.5) 144 (3.7) 39 (5.1) Others 247(1.3) 104 (1.1) 57 (1.1) 79 (2.0) 7 (0.9) Marital status
Single 1,756 (9.1) 886 (9.2) 433 (8.7) 269 (6.9) 168
(22.0) <0.001
Married 8,002 (41.4) 3996 (41.4) 2121 (42.2) 1639
(41.9) 246
(32.3)

Page 124 of 308
Widowed 9,018 (46.7) 4525 (46.9) 2299 (46.0) 1885
(48.2) 309
(40.6) Separated or divorced 551 (2.9) 248 (2.6) 149 (3.0) 115 (2.9) 39 (5.1) Type of hospitalization
Rehabilitation 17,046 (88.0) 9014 (93.2) 4183 (83.5) 3199
(81.8) 650
(85.3)
<0.001 Sub-acute care 417 (2.1) 148 (4.3) 146 (2.9) 21 (0.5) 102
(13.4) Chronic sick 326 (1.7) 65 (0.7) 103 (2.1) 154 (3.9) 4 (0.5) Respite 1,476 (7.6) 414 (4.3) 523 (10.4) 534 (13.7) 5 (0.7) Others 95 (0.5) 34 (0.4) 57 (1.1) 3 (0.1) 1 (0.1) Government subsidy level A 292 (1.5) 171 (1.8) 46 (0.9) 74 (1.9) 1 (0.1)
<0.001 B1 630 (3.3) 594 (6.1) 26 (0.5) 10 (0.3) 0 (0.0) B2+ 830 (4.3) 813 (8.4) 12 (0.2) 5 (0.1) 0 (0.0)
B2
6,847 (35.4) 3313 (34.2) 828 (16.5) 2706 (69.2)
0 (0.0)
C 10,761(55.6) 4784 (49.4) 4100 (81.8) 1116
(28.5) 761
(99.9) Means test category*
Not done 13,982 (71.9) 6417 (66.3) 4826 (96.3) 2682
(68.6) 3 (0.4)
<0.001
0% 3,116 (16.1) 2050 (21.2) 81 (1.6) 808 (20.7) 177
(23.2) 25% 332 (1.7) 216 (2.2) 7 (0.1) 55 (1.4) 54 (7.1)
50% 789 (4.1) 420 (4.3) 25 (0.5) 144 (3.7) 200
(26.2)
75% 1,195 (6.2) 572 (5.9) 73 (1.5) 222 (5.7) 328
(43.0) No. of visits
1 15,904 (82.3) 8061 (83.3) 4078 (81.4) 3158
(80.7) 607
(79.9) <0.001 2 2,775 (14.3) 1351 (14.0) 711 (14.2) 589 (15 124

Page 125 of 308
.1) (16.3) 3 438 (2.2) 201 (2.1) 147 (2.9) 112 (2.9) 23 (3.0) 4 139 (0.7) 43 (0.4) 53 (1.1) 35 (0.9) 8 (1.0) ≥ 5 59 (0.3) 19 (0.2) 23 (0.4) 17 (0.4) 0 (0.0) No. of immediate family members
0 1,034 (5.4) 467 (4.8) 386 (7.7) 100 (2.6) 81
(10.6)
0.002
1 2,076 (10.7) 1112 (11.5) 497 (9.9) 325 (8.3) 142
(18.6)
2 2,650 (13.7) 1368 (14.2) 583 (11.6) 557 (14.2) 142
(18.6)
3 3,058 (15.8) 1542 (16.0) 727 (14.5) 632 (16.2) 157
(20.6)
4 2,864 (14.8) 1442 (15.0) 749 (14.9) 597 (15.3) 76 (10.0
) 5 2,299 (11.9) 1152 (12.0) 601 (12.0) 438 (12.3) 63 (8.3) 6 1,789 (9.3) 848 (8.8) 499 (10.0) 399 (10.2) 43 (5.6) 7 1,378 (7.1) 661 (6.8) 356 (7.1) 340 (8.7) 12 (2.8) 8 930 (4.8) 434 (4.5) 269 (5.4) 212 (5.4) 15 (2.0) 9 598 (3.1) 293 (3.0) 171 (3.4) 124 (3.2) 10 (1.3) ≥10 643 (3.3) 315 (3.3) 174 (3.5) 142 (3.6) 12 (1.6) Number of potential caregivers
0 1,967 (10.2) 1100 (11.4) 537 (10.7) 189 (4.8) 141
(18.5)
<0.001
1 3,676 (19.0) 1888 (19.5) 980 (19.6) 581 (14.9) 227
(29.8)
2 6,145 (31.7) 2922 (30.2) 1693 (33.8) 1359
(34.7) 171
(22.4)
3 4,975 (25.7) 2333 (24.1) 1290 (25.7) 1245
(31.8) 107
(14.0)
4 1,866 (9.6) 987 (10.2) 392 (7.8) 410 (10.5) 77
(10.1) ≥5 731 (3.8) 445 (4.6) 120 (2.4) 127 (3.2) 39 (5.1)

Page 126 of 308
Relationship of primary caregiver to patient
No primary caregiver 2,877 (14.9) 1719 (17.8) 646 (12.9) 318 (8.1) 194
(25.5)
Foreign domestic helper 6,413 (33.1) 2743 (28.4) 1793 (35.8) 1718
(43.9) 159
(20.9)
<0.001
Child 3,954 (20.4) 1988 (20.5) 1084 (21.6) 750 (19.2) 132
(17.3)
Spouse 3,592 (18.6) 1872 (19.3) 926 (18.5) 672 (17.2) 122
(16.0) Sibling 322 (1.7) 141 (1.5) 95 (1.9) 59 (1.5) 27 (3.5)
Others (e.g. friend) 2,074 (10.7) 1134 (11.7) 420 (8.4) 392 (10.0) 128
(16.8) Unknown 128 (0.7) 78 (0.8) 48 (1.0) 2 (0.1) 0 (0.0) Year of admission 1996 910 (4.7) 364 (3.8) 95 (1.9) 451 (11.5) NA
<0.001
1997 1,974 (10.2) 1267 (13.1) 325 (6.5) 382 (9.8) NA 1998 2,064 (10.7) 1234 (12.8) 420 (8.4) 410 (10.5) NA 1999 2,096 (10.8) 1211 (12.5) 479 (9.6) 406 (10.4) NA 2000 1,843 (9.5) 861 (8.9) 602 (12.0) 380 (8.9) NA 2001 1,862 (9.6) 931 (9.6) 582 (11.6) 349 (8.9) NA 2002 1,628 (8.4) 984 (10.2) 289 (5.8) 301 (7.7) 54 (7.1)
2003 2,004 (10.4) 800 (8.3) 794 (15.8) 293 (7.5) 117
(15.4)
2004 2,403 (12.4) 1040 (10.7) 794 (14.8) 354 (9.1) 260
(34.1)
2005 2,576 (13.3) 983 (10.2) 677 (13.5) 585 (15.0) 331
(43.4) Principal diagnosis for admission Stroke
Infarct 5,931 (30.6) 2938 (30.4) 1655 (33.0) 1212
(31.1) 126
(16.5) <0.001 Haemorrhage 1,100 (5.7) 448 (4.6) 403 (8.0) 224 (5.7) 25 (3.3)

Page 127 of 308
Both 151 (0.8) 45 (0.5) 60 (1.2) 41 (1.0) 5 (0.7) Fracture
Hip 3,416 (17.9) 1764 (18.2) 710 (14.2) 764 (19.5) 223
(29.3) Vertebral 589 (3.0) 305 (3.2) 115 (2.3) 153 (3.9) 16 (2.1) Others 992 (5.1) 510 (5.3) 249 (5.0) 195 (5.0) 38 (5.0) Lower limb amputation Below knee 319 (1.6) 186 (1.9) 87 (1.7) 35 (0.9) 11 (1.4) Above knee 71 (0.4) 41(0.4) 18 (0.4) 8 (0.2) 4 (0.5) Others (forefoot & others) 37 (0.2) 15 (0.2) 13 (0.3) 9 (0.2) 0 (0.0)
Others
6,708 (34.6) 3423 (35.4) 1702 (34.0) 1270 (32.5)
314 (41.2)
Charlson co-morbidity index
0 3,270 (16.8) 1890 (19.5) 603 (12.0) 637 (16.3) 140
(18.4)
<0.001 1 – 3
8,675 (44.8) 4271 (44.1) 2031 (40.5) 1984 (50.7)
392 (51.4)
4 – 6 6,443 (33.2) 3088 (31.9) 2015 (40.2) 1150
(29.4) 190
(24.9) > 7 969 (5.0) 425 (4.4) 363 (7.2) 140 (3.6) 40 (5.2)
Mean ( SD) -
1.21 (0.80) 1.42 (0.80) 1.20
(0.75) 1.17
(0.80) <0.001
AIDS 20 (0.1) 20 (0.4) 0 (0.0) 0 (0.0) 0 (0.0) <0.001
Cerebrovascular disease 9,746 (50.3) 4487 (46.4) 2882 (57.5) 2078
(53.1) 299
(39.2) <0.001
Chronic pulmonary Disease 987 (5.1) 451 (4.7) 342 (6.8) 148 (3.8) 46 (6.0) <0.001
Congestive heart failure 1,343(6.9) 613 (6.3) 313 (6.2) 317 (8.1) 100
(13.1) <0.001
Connective tissue disease 361(1.9) 193(2.0) 97 (1.9) 43 (1.1) 28 (3.7) <0.001
Dementia 2,562 (13.2) 940 (9.7) 1109 (22.1) 412 (10.5) 101
(13.3) <0.001
Hemiplegia 9,189 (47.5) 4528 (46.8) 2880 (57.5) 1600
(40.9) 181
(23.8) <0.001

Page 128 of 308
Leukaemia 57 (0.3) 10 (0.1) 47 (0.9) 0 (0.0) 0 (0.0) <0.001 Lymphoma 62(0.3) 0 (0.0) 55 (1.1) 2 (0.1) 5 (0.7) <0.001 Myocardial infarct 763 (3.9) 307 (3.2) 258 (5.1) 160 (4.1) 38 (5.0) <0.001 Peripheral vascular disease 1,441 (7.4) 681 (7.0) 452 (9.0) 248 (6.3) 60 (7.9) <0.001
Ulcer disease 2,772(14.3) 1204 (12.4) 919 (18.3) 543 (13.9) 106
(13.9) <0.001
Diabetes
With end organ damage 5,778 (29.8) 2773 (28.7) 1670 (33.3) 1151
(29.4) 184
(24.1) <0.001
Without end organ damage 1,608 (8.3) 925 (9.6) 284 (5.7) 318 (8.1) 81
(10.6) Liver disease Mild 89 (0.5) 21 (0.2) 45 (0.9) 22 (0.6) 1 (0.1)
<0.001 Moderate or Severe 125 (0.6) 77 (0.8) 25 (0.5) 17 (0.4) 6 (0.8) Renal disease Mild 574 (3.0) 244 (2.5) 155 (3.1) 133 (3.4) 42 (5.5)
<0.001 Moderate or Severe 609 (3.1) 352 (3.6) 128 (2.6) 92 (2.4) 37 (4.9) Malignant tumour Non-metastatic 1,227 (6.3) 684 (7.1) 263 (5.2) 229 (5.9) 51 (6.7)
<0.001 Metastatic 328 (1.7) 154 (7.1) 64 (1.3) 77 (2.0) 33 (4.3)
Hypertension 12,442 (64.3) 5928 (61.3) 3430 (68.4) 2630
(67.2) 454
(59.6) <0.001
Hyperlipidaemia 5,227 (27.0) 2456 (25.4) 1580 (31.5) 988 (25.3) 203 (26.6)
<0.001
Ischemic Heart Disease (including myocardial infarct)
5,243(27.1) 2332 (24.1) 1448 (28.9) 1245 (31.8)
218 (28.6)
<0.001
Discharge destination
Home 14,224 (73.5) 7206 (74.5) 3609 (72.0) 3006
(76.9) 403
(52.9)
<0.001 Acute hospital 2,872 (14.8) 1460 (15.1) 681 (13.6) 612 (15.6) 119
(15.6)
Nursing home 1,930 (10.0) 822 (8.5) 658 (13.1) 254 (6.5) 196
(25.7)

Page 129 of 308
SD = Standard deviation Numbers may not add up to N because of missing data (rate of missing data across variables ranged from 0% to 0.1%) * Data available from 2002 onwards
Table 8. Characteristics of all patient admissions to Singaporean community hospitals from 1996-2005 (by year of admission) (N= 19,360)
Characteristics Year of admission (n %)
P for trend
1996 (N=910)
1997 (N=1,974)
1998 (N=2,064)
1999 (N=2,096)
2000 (N=1,843)
2001 (N=1,862)
2002 (N=1,628)
2003 (N=2,004)
2004 (N=2,403)
2005 (N=2,576)
Age (Years) ≤ 70 318 (34.9) 688 (34.9) 691 (33.3) 726 (34.7) 544 (29.5) 543 (29.1) 521 (32) 642 (32) 697 (28.9) 740 (28.7)
<0.001 > 70
592 (65.0) 1283 (65.1)
1378 (66.7)
1369 (65.3)
1296 (70.5)
1319 (70.9)
1108 (68) 1361 (68) 1709 (71.1)
1834 (71.3)
Age Mean (SD) 72.8 73.1 73.4 73.5 74.8 74.8 74.5 74.0 74.5 74.8
Another community hospital 55 (0.3) 19 (0.2) 15 (0.3) 15 (0.4) 6 (0.8) Sheltered home 64 (0.3) 35 (0.4) 10 (0.2) 9 (0.2) 10 (1.3) Discharge against advice 42 (0.2) 22 (0.2) 18 (0.4) 2 (0.1) 0 (0.0) Death in Community Hospital 67 (0.3) 16 (0.2) 18 (0.4) 10 (0.3) 23 (0.3) Others 106 95 (1.0) 3 (0.1) 3 (0.1) 5 (0.7) Time from onset of principal diagnosis for admission to date of admission (days)
Geometric mean (range) 19.9
(0-11,068) 17.4
(0-3,066) 25.0
(0-2,975) 19.8 (0-
11,068)
24.3 (0-348) <0.001
Length of stay (days)
Geometric mean (range) 28.1 (2-203) 24.7 (2-149) 34.7 (2-156) 28.2 (2-
203) 34.3 (3-
136) <0.001
Admission BI score (units)
Mean (SD) 46.5 (25.5) 48.1 (23.5) 53.5 (26.1) 36.3
(25.6) 38.3
(26.7) <0.001
Discharge BI score (units)
Mean (SD) 60.2 (28.0) 61.3 (25.5) 68.8 (26.7) 50.9
(30.8) 53.9
(31.9) <0.001

Page 130 of 308
(12.0) (12.4) (12.0) (11.5) (11.3) (10.7) (11.5) (11.9) (11.3) (11.7) Gender Male
368 (40.3) 823 (41.7) 911 (43.9) 888 (42.4) 744 (40.6) 814 (43.7) 706 (43.3) 861 (43) 957 (39.7) 1050 (40.8)
0.241 Female
543 (59.7) 1150 (58.3)
1159 (56.1)
1208 (57.6)
1096 (59.4)
1049 (56.3)
923 (56.7) 1140 (57.0)
1449 (60.3)
1525 (59.2)
Ethnicity Chinese
823 (90.4) 1758 (89.1)
1851 (89.7)
1891 (90.2)
1650 (89.5)
1655 (88.9)
1428 (87.7)
1753 (87.5)
2077 (86.4)
2226 (86.4)
<0.001 Malay 44 (4.8) 95 (4.8) 102 (4.9) 88 (4.2) 93 (5.0) 103 (5.5) 110 (6.8) 129 (6.4) 182 (7.6) 213 (8.3) Indian 35 (3.8) 104 (5.3) 88 (4.3) 95 (4.5) 70 (3.8) 73 (3.9) 63 (3.9) 102 (5.1) 115 (4.8) 97 (3.8) Others 8 (0.9) 17 (0.9) 23 (1.1) 22 (1.0) 30 (1.6) 31 (1.7) 27 (1.7) 20 (1.0) 29 (1.2) 40 (1.6) Marital status Single 66 (7.3) 169 (8.6) 173 (8.4) 188 (9.0) 142 (7.7) 133 (7.1) 142 (8.7) 220 (11.0) 246 (10.2) 277 (10.8)
0.454
Married 380 (41.9) 807 (40.9) 904 (44.0) 882 (42.2) 803 (43.6) 807 (43.4) 666 (40.9) 813 (40.7) 941 (39.2) 999 (38.8) Widowed
429 (47.3) 952 (48.3) 918 (44.7) 973 (46.5) 847 (46.0) 881 (47.3) 770 (47
.3) 904 (45.2)
1142 (47. 5)
1202 (46.7)
Separated or Divorced
32 (3.5) 43 (2.2) 59 (2.9) 49 (2.3) 50 (2.7) 40 (2.1) 49 (3.0) 61 (3.1) 74 (3.1) 94 (3.7)
Type of hospitalization
Rehabilitation 715 (78.6)
1641 (83.1)
1787 (86.6)
1818 (86.7)
1617 (87.7)
1696 (91.1)
1496 (91.9)
1793 (89.5)
2200 (91.5)
2284 (88.7)
<0.001 Sub-Acute Care 21 (2.3) 43 (2.2) 31 (1.5) 39 (1.9) 25 (1.4) 7 (0.4) 10 (0.6) 32 (1.6) 25 (1.0) 93 (3.6) Chronic Sick 153 (16.8) 231 (11.7) 225 (10.9) 227 (10.8) 180 (9.8) 150 (8.1) 95 (5.8) 112 (5.6) 48 (2.0) 56 (2.2) Respite 15 (1.6) 40 (2.0) 16 (0.8) 7 (0.3) 12 (0.7) 4 (0.2) 16 (1.0) 49 (2.4) 121 (5.0) 138 (5.4) Others 6 (0.7) 19 (1.0) 5 (0.2) 5 (0.2) 9 (0.5) 5 (0.3) 11 (0.7) 18 (0.9) 12 (0.5) 5 (0.2) Government subsidy level
A 33 (3.6) 54 (2.7) 38 (1.8) 39 (1.9) 25 (1.4) 30 (1.6) 18 (1.1) 15 (0.8) 15 (0.6) 25 (1.0)
<0.001
B1 68 (7.5) 137 (6.9) 98 (4.7) 98 (4.7) 63 (3.4) 47 (2.5) 38 (2.3) 25 (1.3) 27 (1.1) 30 (1.2) B2+ 62 (6.8) 179 (9.1) 141 (6.8) 109 (5.2) 83 (4.5) 77 (4.1) 69 (4.2) 36 (1.8) 38 (1.6) 36 (1.4) B2
577 (63.4) 895 (45.3) 1000 (48.4)
1035 (49.4)
898 (48.7) 854 (45.9) 596 (36.6) 341 (17.0) 317 (13.2) 334 (13.0)
C 170 (18.7) 709 (35.9) 787 (38.1) 815 (38.9) 774 (42.0) 854 (45.9) 907 (55.7)
1587 (79.0)
2007 (83.5)
2151 (83.5)
Means test category*
Not done NA NA NA NA NA NA
1062 (65.2)
779 (38.9) 762 (31.7) 581 (22.6) <0.001

Page 131 of 308
0% NA NA NA NA NA NA 319 (19.6) 694 (34.6) 911 (37.9)
1187 (46.1)
25% NA NA NA NA NA NA 42 (2.6) 71 (3.5) 109 (4.5) 110 (4.3) 50% NA NA NA NA NA NA 74 (4.5) 182 (9.1) 265 (11.1) 267 (10.4) 75% NA NA NA NA NA NA 131 (8.0) 278 (13.9) 355 (14.8) 431 (16.7) No. of visits 1
842 (92.5) 1717 (87) 1690 (81.9)
1700 (81.1)
1487 (80.7)
1473 (79.1)
1320 (81.1)
1652 (82.4)
1949 (81.1)
2074 (80.5)
<0.001 2 63 (6.9) 221 (11.2) 311 (15.1) 320 (15.3) 273 (14.8) 303 (16.3) 242 (14.9) 267 (13.3) 378 (15.7) 397 (15.4) 3 5 (0.5) 31 (1.6) 49 (2.4) 56 (2.7) 58 (3.1) 53 (2.8) 45 (2.8) 60 (3.0) 56 (2.3) 70 (2.7) 4 0 (0.0) 4 (0.2) 10 (0.5) 13 (0.6) 19 (1.0) 19 (1.0) 14 (0.9) 18 (0.9) 14 (0.6) 28 (1.1) ≥ 5 0 (0.0) 1 (0.1) 4 (0.2) 7 (0.3) 6 (0.3) 14 (0.8) 7 (0.4) 7 (0.3) 6 (0.2) 7 (0.3) No. of immediate family members
0 38 (4.2) 137 (7.0) 113 (5.5) 103 (4.9) 88 (4.8) 88 (4.7) 68 (4.2) 145 (7.2) 122 (5.1) 132 (5.1)
0.015
1 94 (10.4) 266 (13.5) 251 (12.2) 189 (9.0) 161 (8.7) 166 (8.9) 151 (9.3) 216 (10.8) 284 (11.8) 298 (11.6) 2 126 (14.0) 298 (15.1) 280 (13.6) 305 (14.6) 245 (13.3) 220 (11.8) 201 (12.3) 287 (14.3) 340 (14.1) 348 (13.5) 3 126 (14.0) 281 (14.3) 303 (14.8) 327 (15.6) 289 (15.7) 283 (15.2) 284 (17.4) 312 (15.6) 407 (16.9) 446 (17.3) 4 132 (14.7) 264 (13.4) 281 (13.7) 298 (14.2) 292 (15.9) 295 (15.8) 251 (15.4) 320 (16.0) 357 (14.9) 374 (14.5) 5 114 (12.7) 199 (10.1) 219 (10.7) 275 (13.1) 216 (11.7) 241 (12.9) 192 (11.8) 251 (12.5) 252 (10.5) 340 (13.2) 6 98 (10.9) 149 (7.6) 191 (9.3) 229 (10.9) 176 (9.6) 186 (10.0) 156 (9.6) 152 (7.6) 238 (9.9) 214 (8.3) 7 79 (8.8) 131 (6.7) 166 (8.1) 136 (6.5) 156 (8.5) 149 (8.0) 118 (7.2) 120 (6.0) 156 (6.5) 167 (6.5) 8 33 (3.7) 110 (5.6) 115 (5.6) 106 (5.1) 96 (5.2) 95 (5.1) 87 (5.3) 77 (3.8) 111 (4.6) 100 (3.9) 9 23 (2.6) 66 (3.4) 61 (3.0) 64 (3.1) 58 (3.1) 64 (3.4) 55 (3.4) 55 (2.7) 74 (3.1) 78 (3.0) ≥10 37 (4.1) 66 (3.4) 73 (3.6) 63 (3.0) 65 (3.5) 75 (4.0) 33 (2.0) 66 (3.3) 62 (2.6) 77 (3.0) Number of potential caregivers
0 74 (8.1) 217 (11.0) 215 (10.4) 203 (9.7) 140 (7.6) 159 (8.5) 147 (9.0) 249 (12.4) 256 (10.7) 307 (11.9)
0.328
1 185 (20..3)
427 (21.6) 432 (20.9) 370 (17.7) 269 (14.6) 267 (14.3) 297 (18.2) 411 (20.5) 479 (19.9) 539 (20.9)
2 327 (35.9) 680 (34.4) 698 (33.8) 704 (33.6)
553 (30.0 )
575 (30.9) 466 (28.6) 620 (30.9) 721 (30.0) 801 (31.1)
3 202 (22.2) 436 (22.1) 492 (23.8) 522 (24.9) 570 (30.9) 553 (29.7) 445 (27.3) 497 (24.8) 612 (25.5) 646 (25.1) 4 72 (7.9) 155 (7.9) 164 (7.9) 206 (9.8) 221 (12.0) 224 (12.0) 207 (12.7) 165 (8.2) 248 (10.3) 204 (7.9) ≥5 50 (5.5) 59 (3.0) 63 (3.1) 91 (4.3) 90 (4.9) 84 (4.5) 55 (3.4) 62(3.1) 87 (3.6) 79 (3.1) Relationship of primary caregiver to Patient
No primary 101 (11.1) 270 (13.7) 233 (11.3) 232 (11.1) 215 (11.7) 236 (12.7) 285 (17.5) 373 (18.6) 441 (18.4) 491 (19.1) <0.001
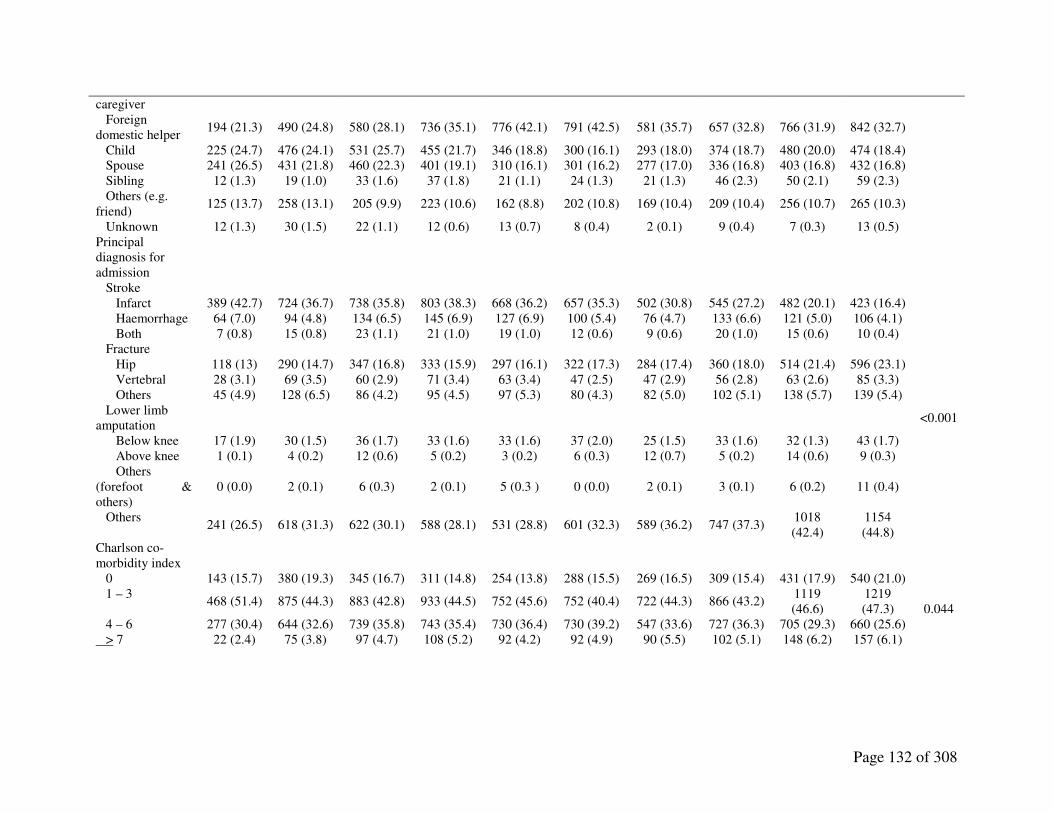
Page 132 of 308
caregiver Foreign domestic helper
194 (21.3) 490 (24.8) 580 (28.1) 736 (35.1) 776 (42.1) 791 (42.5) 581 (35.7) 657 (32.8) 766 (31.9) 842 (32.7)
Child 225 (24.7) 476 (24.1) 531 (25.7) 455 (21.7) 346 (18.8) 300 (16.1) 293 (18.0) 374 (18.7) 480 (20.0) 474 (18.4) Spouse 241 (26.5) 431 (21.8) 460 (22.3) 401 (19.1) 310 (16.1) 301 (16.2) 277 (17.0) 336 (16.8) 403 (16.8) 432 (16.8) Sibling 12 (1.3) 19 (1.0) 33 (1.6) 37 (1.8) 21 (1.1) 24 (1.3) 21 (1.3) 46 (2.3) 50 (2.1) 59 (2.3) Others (e.g. friend)
125 (13.7) 258 (13.1) 205 (9.9) 223 (10.6) 162 (8.8) 202 (10.8) 169 (10.4) 209 (10.4) 256 (10.7) 265 (10.3)
Unknown 12 (1.3) 30 (1.5) 22 (1.1) 12 (0.6) 13 (0.7) 8 (0.4) 2 (0.1) 9 (0.4) 7 (0.3) 13 (0.5) Principal diagnosis for admission
Stroke Infarct 389 (42.7) 724 (36.7) 738 (35.8) 803 (38.3) 668 (36.2) 657 (35.3) 502 (30.8) 545 (27.2) 482 (20.1) 423 (16.4)
<0.001
Haemorrhage 64 (7.0) 94 (4.8) 134 (6.5) 145 (6.9) 127 (6.9) 100 (5.4) 76 (4.7) 133 (6.6) 121 (5.0) 106 (4.1) Both 7 (0.8) 15 (0.8) 23 (1.1) 21 (1.0) 19 (1.0) 12 (0.6) 9 (0.6) 20 (1.0) 15 (0.6) 10 (0.4) Fracture Hip 118 (13) 290 (14.7) 347 (16.8) 333 (15.9) 297 (16.1) 322 (17.3) 284 (17.4) 360 (18.0) 514 (21.4) 596 (23.1) Vertebral 28 (3.1) 69 (3.5) 60 (2.9) 71 (3.4) 63 (3.4) 47 (2.5) 47 (2.9) 56 (2.8) 63 (2.6) 85 (3.3) Others 45 (4.9) 128 (6.5) 86 (4.2) 95 (4.5) 97 (5.3) 80 (4.3) 82 (5.0) 102 (5.1) 138 (5.7) 139 (5.4) Lower limb amputation
Below knee 17 (1.9) 30 (1.5) 36 (1.7) 33 (1.6) 33 (1.6) 37 (2.0) 25 (1.5) 33 (1.6) 32 (1.3) 43 (1.7) Above knee 1 (0.1) 4 (0.2) 12 (0.6) 5 (0.2) 3 (0.2) 6 (0.3) 12 (0.7) 5 (0.2) 14 (0.6) 9 (0.3) Others (forefoot & others)
0 (0.0) 2 (0.1) 6 (0.3) 2 (0.1) 5 (0.3 ) 0 (0.0) 2 (0.1) 3 (0.1) 6 (0.2) 11 (0.4)
Others 241 (26.5) 618 (31.3) 622 (30.1) 588 (28.1) 531 (28.8) 601 (32.3) 589 (36.2) 747 (37.3)
1018 (42.4)
1154 (44.8)
Charlson co- morbidity index
0 143 (15.7) 380 (19.3) 345 (16.7) 311 (14.8) 254 (13.8) 288 (15.5) 269 (16.5) 309 (15.4) 431 (17.9) 540 (21.0)
0.044 1 – 3
468 (51.4) 875 (44.3) 883 (42.8) 933 (44.5) 752 (45.6) 752 (40.4) 722 (44.3) 866 (43.2) 1119 (46.6)
1219 (47.3)
4 – 6 277 (30.4) 644 (32.6) 739 (35.8) 743 (35.4) 730 (36.4) 730 (39.2) 547 (33.6) 727 (36.3) 705 (29.3) 660 (25.6) > 7 22 (2.4) 75 (3.8) 97 (4.7) 108 (5.2) 92 (4.2) 92 (4.9) 90 (5.5) 102 (5.1) 148 (6.2) 157 (6.1)

Page 133 of 308
AIDS 0 (0.0) 0 (0.0) 3 (0.1) 8 (0.4) 3 (0.2) 0 (0.0) 1 (0.1) 4 (0.2) 0 (0.0) 1 (0.0) 0.289 Cerebrovascular Disease
533 (58.6) 1036 (52.5)
1111 (53.8)
1119 (53.4)
1057 (57.4)
1049 (56.3)
826 (50.7)
992 (49.5)
1028 (42.8)
995 (38.6)
<0.001
Chronic pulmonary Disease 39 (4.3) 88 (4.5)
113 (5.5)
145 (6.9)
87 (4.7) 68 (3.7) 80 (4.9) 113 (5.6)
131 (5.5)
123 (4.8) 0.948
Congestive heart failure 68 (7.5)
150 (7.6)
123 (6.0)
145 (6.9)
135 (7.3)
142 (7.6)
108 (6.6)
133 (6.6)
166 (6.9)
173 (6.7) 0.521
Connective tissue disease 8 (0.9) 22 (1.1) 41 (2.0 ) 43 (2.1) 23 (1.2) 26 (1.4) 34 (2.1) 53 (2.6) 60 (2.5) 51 (2.0) <0.001 Dementia
70 (7.7) 219
(11.1) 277
(13.4) 308
(14.7) 262
(14.2) 297
(16.0) 198
(12.2) 295
(14.7) 339
(14.1) 297
(11.5) 0.052
Hemiplegia 512(56.3)
1022 (51.8)
1073 (52.0)
1133 (54.1)
997 (54.1)
1007 (54.1)
772 (47.4)
925 (46.2)
913 (38.0)
835 (32.4)
<0.001
Leukaemia 1 (0.1) 2 (0.1) 1 (0.1) 1 (0.1) 2 (0.1) 1 (0.1) 0 (0.0) 4 (0.2) 4 (0.2) 41 (1.6) <0.001 Lymphoma 0 (0.0) 0 (0.0) 1 (0.0) 2 (0.1) 2 (0.1) 1 (0.1) 1 (0.1) 7 (0.3) 6 (0.2) 42 (1.6) <0.001 Myocardial infarct
31 (3.4) 48 (2.4) 78 (3.8) 69 (3.3) 65 (3.5) 65 (3.5) 69 (4.2) 86 (4.3) 106 (4.4)
146 (5.7) <0.001
Peripheral vascular disease 39 (4.3)
121 (6.1)
147 (7.1)
164 (7.8)
131 (7.1)
126 (6.8)
123 (7.6)
172 (8.6)
192 (8.0)
226 (8.8) <0.001
Ulcer disease 109 (12.0)
222 (11.2)
290 (14.1)
275 (13.1)
237 (12.9)
267 (14.3)
279 (17.1)
336 (16.8)
343 (14.3)
414 (16.1)
<0.001
Diabetes With end organ damage
242(26.6) 566
(28.7) 647
(31.3) 654
(31.2) 585
(31.7) 587
(31.5) 487
(29.9) 645
(32.2) 688
(28.6) 677
(26.3) 0.740
Without end organ damage 63 (6.9)
141 (7.1)
146 ( 7.1)
151 (7.2)
129 (7.0)
138 (7.4)
141 (8.7)
160 (8.0)
269 (11.2)
270 (10.5)
Liver Disease Mild 2 (0.2) 9 (0.5) 6 (0.3) 8 (0.4) 8 (0.4) 10 (0.5) 5 (0.3) 6 (0.3) 24 (1.0) 11 (0.4)
<0.001 Moderate or severe 0 (0.0) 7 (0.4) 8 (0.4) 6 (0.3) 19 (1.0) 14 (0.8) 11 (0.7) 14 (0.7) 23 (1.0) 23 (0.9) Renal Disease Mild 21 (2.3) 38 (1.9) 37 (1.8) 47 (2.2) 57 ( 3.1) 55 (3.0) 58 (3.6) 65 (3.2) 88 (3.7) 108 (4.2)
<0.001 Moderate or severe 11 (1.2) 39 (2.0) 48 (2.3) 43 (2.1) 45 (2.4) 46 (2.5) 59 (3.6) 81 (4.0)
111 (4.6)
126 (4.9)
Malignant Tumour Non-metastatic
40 (4.4) 108 (5.5)
106 (5.1)
112 (5.3)
107 (5.8)
135 (7.3)
114 (7.0)
134 (6.7)
190 (7.9)
181 (7.0) <0.001
Metastatic 8 (0.9) 20 (1.0) 40 (1.9) 32 (1.5) 19 (1.0) 30 (1.6) 25 (1.5) 46 (2.3 ) 56 (2.3) 52 (2.0) Hypertension
550 (60.4) 1054 (53.4)
1207 (59.2)
1240 (59.2)
1212 (65.8)
1252 (67.2)
1080 (66.3)
1394 (69.6)
1667 (69.4)
1786 (69.3)
<0.001
Hyperlipidaemia 101(11.1)
254 (12.9)
369 (17.9)
459 (21.9)
460 (25.0)
529 (28.4)
531 (32.6)
711 (35.5)
836 (34.8)
977 (37.9)
<0.001
Ischemic heart disease (including myocardial infarct)
237 (26.0) 489
(24.8) 464
(22.5) 540
(25.8) 506
(27.5) 524
(28.1) 462
(28.4) 635
(31.7) 656
(27.3) 730
(28.3) <0.001
Discharge destination Home
685 (75.3) 1440 (72.9)
1472 (71.3)
1566 (74.7)
1386 (75.2)
1378 (74)
1243 (76.4)
1374 (68.6)
1743 (72.5)
1937 (75.2)
0.090 Acute hospital
130 (14.3) 301
(15.2) 355
(17.2) 297
(14.2) 287
(15.6) 283
(15.2) 214
(13.1) 292
(14.6) 369
(15.4) 344
(13.4) Nursing home
85 (9.3) 195 (9.9)
201 (9.7)
194 (9.3)
136 (7.4)
177 (9.5)
152 (9.3)
292 (14.6)
246 (10.2)
252 (9.8)
Another community hospital 5 (0.5) 5 (0.3) 12 (0.6) 2 (0.1) 7 (0.4) 8 (0.4) 3 (0.2) 6 (0.3) 1 (0.1) 6 (0.2)

Page 134 of 308
Sheltered home 0 (0.0) 3 (0.2) 3 (0.1) 5 (0.2) 9 (0.5) 4 (0.2) 2 (0.1) 9 (0.4) 22 (0.9) 7 (0.3) Discharge against advice 0 (0.0) 1 (0.1) 7 (0.3) 5 (0.2) 2 (0.1) 2 (0.1) 3 (0.2) 7 (0.3) 2 (0.1) 13 (0.5) Death in community hospital 2 (0.2) 7 (0.4) 3 (0.1) 6 (0.3) 6 (0.3) 5 (0.3) 2 (0.1) 14 (0.7) 15 (0.6) 7 (0.3) Others 3 (0.3) 22 (1.1) 11 (0.5) 21 (1.0) 10 (0.5) 5 (0.3) 9 (0.6) 10 (0.5) 5 (0.2) 10 (0.4)
β
coefficient* P-
value No. of immediate family members
Mean (SD) 4.22
(2.51) 3.91
(2.64) 4.11
(2.60) 4.16
(2.47) 4.26
(2.51) 4.43
(2.53) 4.26
(2.50) 3.89
(2.51) 3.98
(2.47) 3.98
(2.46) - 0.016 0.015
No. of potential caregivers
Mean (SD) 2.17
(1.23) 2.03
(1.20) 2.07
(1.20) 2.20
(1.24) 2.40
(1.23) 2.35
(1.24) 2.28
(1.26) 2.05
(1.24) 2.15
(1.26) 2.05
(1.23) - 0.003 0.328
Charlson co- morbidity index Mean ( SD) 1.20
(0.72) 1.20
(0.80) 1.30
(0.80) 1.31
(0.80) 1.30
(0.75) 1.33
(0.80) 1.30
(0.80) 1.31
(0.80) 1.23
(0.81) 1.20
(0.82) -0.004 0.044
Time from onset of principal diagnosis for admission to date of admission (days)
Geometric mean (range) 17.0
(0-2993) 19.1
(0-3520) 20.9
(0-2975) 22.2
(0-4151) 20.1
(0-2941) 18.6
(0-2175) 19.0
(0-2494) 23.1
(0-2891) 18.5
(0-5570)
19.1 (0-
11068) - 0.002 0.420
Length of stay (days)
Geometric mean (range) 29.7
(4-156) 27.7
(3-145) 29.2
(4-203) 29.4
(3-148) 28.7
(2-138) 27.0
(2-137) 27.7
(3-178) 29.2
(4-143) 27.0
(3-133) 26.7
(2-152) - 0.008 <0.001
Admission BI score (units)
Mean (SD) 41.0
(24.9) 45.1
(25.5) 44.8
(25.3) 48.5
(26.7) 47.8
(26.0) 46.2
(26.0) 46.2
(25.0) 44.6
(25.4) 48.1
(25.0) 48.4
(24.5) 0.380 <0.001
Discharge BI score (units)
Mean (SD) 51.8
(30.0) 55.5
(27.2) 56.0
(27.0) 61.0
(28.0) 60.8
(28.0) 60.6
(27.7) 61.1
(28.0) 59.4
(28.3) 63.8
(28.1) 64.2
(27.3) 1.040 <0.001
Numbers may not add up to N because of missing data (rate of missing data across variables ranged from 0% to 0.1%) * Unstandardized

Page 135 of 308
Figures
Figure 3. Ethnicity of all patients admissions in Singaporean community hospitals from 1996-
2005, by year of admission.
Figure 4. Government subsidy levels of all patient admissions in Singaporean community
hospitals from 1996-2005, by year of admission.
0
10
20
30
40
50
60
70
80
90
1995 1996 1997 1998 1999 2000 2001 2002 2003 2004 2005 2006
%
Year of Admission
A
B1 B2+
B2 C
80
90
100
0
5
10
1996 1997 1998 1999 2000 2001 2002 2003 2004 2005
%
Year of Admission
Malay
Indian
Others
Chinese

Page 136 of 308
Figure 5. Relationship of primary caregiver to patient for all patient admissions in Singaporean
community hospitals from 1996-2005, by year of admission
Figure 6. Primary diagnosis for all patient admissions in Singaporean community hospitals from
1996-2005, by year of admission
0
10 20 30 40 50 60
1996 1997 1998 1999 2000 2001 2002 2003 2004 2005
%
Year of Admission
Stroke Fracture Amputation
Others
0
5
10 15 20 25 30 35 40 45
1996 1997 1998 1999 2000 2001 2002 2003 2004 2005
%
Year of Admission
Maid
Child
Spouse
None

Page 137 of 308
Figure 7. Mean admission and discharge BI score for all patient admissions in Singaporean
community hospitals from 1996-2005, by year of admission
35
45
55
65
75
1996 1997 1998 1999 2000 2001 2002 2003 2004 2005
Units
Year of Admission
Admission BI Score Discharge BI Score
BI units


139
References
1. Steiner A. Intermediate Care: conceptual framework and review of the literature. London:
The King’s Fund, 1997.
2. British Geriatrics Society, London. Intermediate Care: guidance for commissioners and
providers of health and social care. United Kingdom: British Geriatrics Society. 2001.
Available from: http://www.bgs.org.uk/compedium/comd4.html. Accessed on 29 May 2011.
3. Gladman JR. Improving long-term rehabilitation. Br Med Bull 2000;56:495-500.
4. Young J, Donaldson K. Community hospitals and older people. Age Ageing 2001;30 Suppl
3:S7-10.
5. Tomlinson J, Raymond NT, Field D, Botha JL. Use of general practitioner beds in
Leicestershire community hospitals. Br J Gen Pract 1995;45:399-403.
6. Young J, Green J, Forster A, Small N, Lowson K, Bogle S, George J, Heseltine D, Jayasuriya
T, Rowe J. Postacute care for older people in community hospitals: a multicentre
randomized, controlled trial. J Am Geriatr Soc. 2007;55:1995-2002.

140
7. Green J, Young J, Forster A, Mallinder K, Bogle S, Lowson K, Small N. Effects of locality
based community hospital care on independence in older people needing rehabilitation:
randomised controlled trial. BMJ 2005;331:317-22.
8. Garasen H, Windspoll R, Johnsen R. Long-term patients' outcomes after intermediate care at
a community hospital for elderly patients: 12-month follow-up of a randomized controlled
trial. Scand J Public Health 2008;36:197-204.
9. Garasen H, Windspoll R, Johnsen R. Intermediate care at a community hospital as an
alternative to prolonged general hospital care for elderly patients: a randomised controlled
trial. BMC Public Health 2007;7:68.
10. O'Reilly J, Lowson K, Young J, Forster A, Green J, Small N. A cost effectiveness analysis
within a randomised controlled trial of post-acute care of older people in a community
hospital. BMJ 2006;333:228.
11. O'Reilly J, Lowson K, Green J, Young JB, Forster A. Post-acute care for older people in
community hospitals--a cost-effectiveness analysis within a multi-centre randomised
controlled trial. Age Ageing 2008;37:513-20.
12. L D Ritchie, K Robinson. Community hospitals: new wine in old bottles? Br J Gen Pract
1998; 48: 1039–1040.

141
13. Ottenbacher KJ, Smith PM, Illig SB, Linn RT, Ostir GV, Granger CV. Trends in length of
stay, living setting, functional outcome, and mortality following medical rehabilitation.
JAMA 2004 13;292:1687-95.
14. Canadian Institute for Health information, Inpatient Rehabilitation in Canada, 2006–2007
(Ottawa: CIHI, 2008). 1245
15. Flaherty JH, Liu ML, Ding L, Dong B, Ding Q, Li X, Xiao S. China: the aging giant. J Am
Geriatr Soc 2007;55:1295-300.
16. Dhar HL. Emerging geriatric challenge. J Assoc Physicians India 2005;53:867-72.
17. Teo P. Health care for older persons in Singapore: integrating state and community
provisions with individual support. J Aging Soc Policy 2004;16:43-67.
18. Moh.gov.sg [Internet]. Singapore: Ministry of Health, Government of Singapore.; c2009-10
[updated 2007; cited 2011 May 28]. Available from:
http://www.moh.gov.sg/mohcorp/hcsystem.aspx?id=102.
19. Elderly and Continuing Care Division, Ministry of Health, Singapore. Healthcare Services
for the Elderly. An Information booklet for healthcare professionals. Singapore: Ministry of
Health.2004

142
20. Moh.gov.sg [Internet]. Singapore: Ministry of Health, Government of Singapore.; c2009-10
[updated 2009 Apr; cited 2011 May 28]. Available from:
http://www.moh.gov.sg/HEALTHSCOPE/archive/apr09.pdf.
21. Saxena SK, Koh GC, Ng TP, Fong NP, Yong D. Determinants of length of stay during post-
stroke rehabilitation in community hospitals. Singapore Med J 2007;48:400-7.
22. Yap LK, Ow KH, Hui JY, Pang WS. Premature discharge in a community hospital.
Singapore Med J 2002;43:470-5.
23. Tan C, Sng BL, Long J, Loh LK, Liew R, Aw E. Discharge planning in a community
hospital--a multidisciplinary approach. Singapore Med J 1998;39:461-4.
24. Saxena SK, Ng TP, D Yong, Fong NP, Koh G. Total direct cost, length of hospital stay,
institutional discharges and their determinants from rehabilitation settings in stroke patients.
Acta Neurologica Scandinavica 2006;114:307-314.
25. Charlson ME, Pompei P, Ales KL, MacKenzie CR. A new method of classifying prognostic
comorbidity in longitudinal studies: development and validation. J Chronic Dis 1987;40:373-
83.

143
26. Shah S, Vanclay F, Cooper B. Improving the sensitivity of the Barthel Index for stroke
rehabilitation. J Clin Epidemiol 1989;42:703-709.
27. McCormack B. The developing role of community hospitals: an essential part of a quality
service. Quality in Health Care 1993;2:219-223.
28. Kernick DP, Davies SE. The community hospital: a three-year study. BMJ 1976;2:1243-5.
29. Renwick D. Community care and social services. BMJ 1996;313:869-72.
30. Ang YH, Wong SF. Perceived need for community geriatric services: a survey at a regional
hospital in Singapore in an inpatient setting. Ann Acad Med Singapore 1999;28:377-83.
31. Ng GT. Support for family caregivers: what do service providers say about accessibility,
availability and affordability of services? Health Soc Care Community 2009;17:590-8.
32. Huang HL, Shyu YI, Chang MY, Weng LC, Lee I. Willingness to use respite care among
family caregivers in Northern Taiwan. J Clin Nurs 2009;18:191-8.
33. Braithwaite V. Institutional respite care: breaking chores or breaking social bonds?
Gerontologist 1998;38:610-7.

144
34. Department of Statistics, Singapore. Population Trends 2007. Singapore: Department of
Statistics, Government of Singapore.2007. Available from:
http://www.singstat.gov.sg/pubn/popn/population2007.pdf
35. Yeoh BS, Huang S, Gonzalez J. Migrant female domestic workers: debating the economic,
social and political impacts in Singapore. Int Migr Rev 1999;33:114-36.
36. Howe AL. Migrant care workers or migrants working in long-term care? A review of
Australian experience. J Aging Soc Policy 2009;21:374-92.
37. Yeoh BS, Huang S. Foreign domestic workers and home-based care for elders in Singapore.
J Aging Soc Policy 2010;22:69-88.
38. Kong KH, Chua KS, Tow AP. Clinical characteristics and functional outcome of stroke
patients 75 years old and older. Arch Phys Med Rehabil 1998;79:1535-9.
39. Chau PH, Woo J, Kwok T, Chan F, Hui E, Chan KC. Usage of Community Services and
Domestic Helpers Predicted Institutionalization of Elders Having Functional or Cognitive
Impairments: A 12-Month Longitudinal Study in Hong Kong. J Am Med Dir Assoc 2010 Oct
15. [Epub ahead of print]

145
40. Tew CW, Tan LF, Luo N, Ng WY, Yap P. Why family caregivers choose to institutionalize a
loved one with dementia: a Singapore perspective. Dement Geriatr Cogn Disord
2010;30:509-16.
41. Choo WY, Low WY, Karina R, Poi PJ, Ebenezer E, Prince MJ. Social support and burden
among caregivers of patients with dementia in Malaysia. Asia Pac J Public Health
2003;15:23-9.
42. Grant JA, Dowell J. A qualitative study of why general practitioners admit to community
hospitals. Br J Gen Pract 2002;52:628-30, 632-5.
43. Ministry of Health, National Registry of Diseases Office. Annual Stroke Registry Report:
Stroke trends in Singapore 2005-2010. Accessed on 15 Aug 12. Available from:
http://www.nrdo.gov.sg/uploadedFiles/NRDO/Stroke_Interim_Final3_MOH_logo.pdf.


147
CHAPTER THREE: PREDICTORS OF AND TRADE-OFFS BETWEEN EFFECTIVENESS AND EFFICIENCY IN STROKE
REHABILITATION
[Portions of this chapter (i.e. data based on Ang Mo Thye Hua Kwan Hospital and St Luke’s
Hospital only) were published online in the International Journal of Stroke in 6 Oct 2011.
Citation: Koh GCH, Chen C, Cheong A, Tai BC, Choi KP, Fong NP, Chan KM, Tan BY,
Petrella R, Thind A, Koh D, Chia KS. Trade-offs between effectiveness and efficiency in stroke
rehabilitation. Int J Stroke 2011. DOI: 10.1111/j.1747-4949.2011.00612.x.]
Introduction
Only a small proportion of stroke patients die in the acute phase and the majority will experience
physical disability with better functional recovery occurring with rehabilitation.1 There is a need
to compare outcome measures of stroke rehabilitation in this pay-for-performance era between
centres and track trends over time.2 Traditional measures such as mortality are only useful in
acute stroke units and are of little value in sub-acute stroke rehabilitation units where death is a
rare occurrence. Moreover, stroke rehabilitation should be measured in terms of both
effectiveness and efficiency, and not just final functional status which does not consider speed of
recovery or achievement of rehabilitation potential.3 Heinemann et al and Shah et al suggested
measures of stroke rehabilitation effectiveness (REs) and rehabilitation efficiency (REy) in 1987
and 1990 respectively.4,5 They defined REs as the percentage of potential functional
improvement actually achieved and REy as the rate of functional recovery during rehabilitation.
Ever since, there have only been a few studies on the independent factors of stroke REs6,7 and

148
REy8, and all have been limited by small sample sizes (range 110 to 348 subjects) which may
explain why only few independent factors of REs (age4,5,6) and REy (lower arm recovery stage5,6
and initial functional status5,8) have ever been consistently identified, and why conflicting
findings have been reported (e.g. one study found older age to be an independent factor of poorer
REy5 while others did not4,6,8). In recent years, REs and REy have also been used to measure
stroke rehabilitation outcomes in epidemiological and clinical studies, but without considering
their confounders.7,9,10 When REs and REy are used as outcome measures of stroke
rehabilitation, adjustment for baseline prognostic factors is essential to increase validity of
comparative effectiveness research11 and statistical power in clinical trials.12
Previous studies on REs and REy have also never examined potential trade-offs between these
two rehabilitation indices which measure two different aspects of rehabilitation quality: REs
measures the degree of potential functional recovery achieved with rehabilitation while REy
measures the speed at which functional recovery occurs. There is a perception that REs and REy
are greater in acute stroke patients with milder levels of disability, and that while a longer
duration of inpatient rehabilitation increases REs, it is generally inefficient given the common
problem of limited resources. However, these perceptions of potential trade-offs between REs
and REy have never been empirically examined.
Methods
We conducted a retrospective analysis of a cohort of all stroke patients admitted into all four
community hospitals from 1996 to 2005 to determine the independent factors affecting REs and

149
REy, and examine the factors which demonstrated trade-offs between the two indices. Within
each factor which demonstrated trade-offs between REs and REy, we also determined their ideal
ranges which optimized both rehabilitation indices.
Data Extraction
We retrospectively extracted data from non-computerized medical records of all patients who
were admitted into Ang Mo Kio Thye Hua Kwan Hospital, St Luke’s Hospital, St Andrew’s
Community Hospital and Bright Vision Hospital from 2 January 1996 to 31 December 2005, and
verified data with acute stroke unit records. These four hospitals are designated sub-acute
rehabilitation units which provide multi-disciplinary team-based rehabilitation of acutely
disabled persons, including post-stroke patients. In both hospitals, rehabilitation is provided
every weekday until discharge. Data collection was performed from November 2006 to
December 2009 by four research nurses who were trained and supervised by the first author.
Data collection guidelines were used to standardize data collection . Data was entered directly
into a standardized scanner-readable form to minimize data entry error and read by a Scansys®
optical scanner. Multiple iterations of data cleaning and verification were performed. A 10%
random sample of subjects was subsequently analyzed for data extraction accuracy by an
independent physician and the error rate was found to be only 0.07%. The study was approved
by the National University of Singapore Institutional Review Board and ethics committees of all
hospitals.
Data Management

150
We applied the following inclusion criteria to define our study population: (1) principal
admission diagnosis of stroke as defined by WHO criteria, (2) admission for rehabilitation, (3)
first admission for stroke, (4) length of stay > 14 days and < 90 days to ensure rehabilitation was
sufficiently sustained and avoid the plateau effect in post-stroke functional recovery which
begins to occur three months after stroke.13 As the calculation of REs and REy requires both
admission and discharge functional measures to be known, we excluded subjects who had either
or both missing.
The independent variables studied were socio-demographic (including patient-defined ethnicity)
and clinical variables including Charlson comorbidity index.14 As all eligible subjects had a
stroke, the item in the Charlson comorbidity index for stroke was coded as present for all
subjects. In Singapore, only patients staying in C class (non air-conditioned 8-bedded) or B2
class (non air-conditioned 6-bedded) wards receive subsidies from the government for total cost
of hospital stay (75% and 50% subsidy respectively) and patients who stay in higher class (i.e.
air-conditioned six to single bedded) wards do not receive any government subsidy. In our study,
we dichotomized government subsidy levels into C class versus B2 class and above as C class
patients best represented the lower socio-economic class in our population. A caregiver was
defined as any person aged 18 years and above who could offer care and take responsibility for
the patient after discharge, and recognized as a caregiver by the patient. Caregivers can hence
include family members, relatives, friends or other paid helpers.
Outcome Measures

151
Functional status as measured by performance of activities of daily living (ADLs) was assessed
using the Shah-modified Barthel Index (BI) which is currently used by all community hospitals
in Singapore as recommended by our Ministry of Health.15 Although both original and Shah-
modified BI have a range from zero to 100, the original BI has three sub-categories for each
ADL category and 20 possible discrete values (in multiples of 5) while the Shah-modified BI has
five sub-categories for each ADL category and 100 possible discrete values.16 A score of zero
reflects complete ADL dependence and 100 reflects complete ADL independence. The Shah-
modified BI’s scale reliability is better than the original BI with higher Cronbach alpha values at
both admission and discharge17 and it has been used widely in research.18-20 According to our
Ministry of Health’s requirements, admission BI should be scored within 48 hours of admission
and at least every two weeks until discharge.15 These were performed by occupational therapists
in respective hospitals and the scores were treated as a continuous variable in the study. The first
BI recorded was taken as the admission BI and last BI was taken as discharge BI, and date of
both scorings were recorded.
We used the method described by Heinemann et al and Shah et al to calculate the primary
outcomes REs and REy.4,5 REs is the percentage of potential improvement eventually achieved
with rehabilitation and was calculated as:
Rehabilitation effectiveness
(REs) =
(Discharge BI score) – (Admission BI score)
X
100%
(Maximum BI score [i.e. 100]) – (Admission BI score)
REy is the rate of functional improvement during rehabilitation and was calculated as:
Rehabilitation efficiency
(REy) =
(Discharge BI score) – (Admission BI score)
X
30
No. of days between admission and discharge scoring
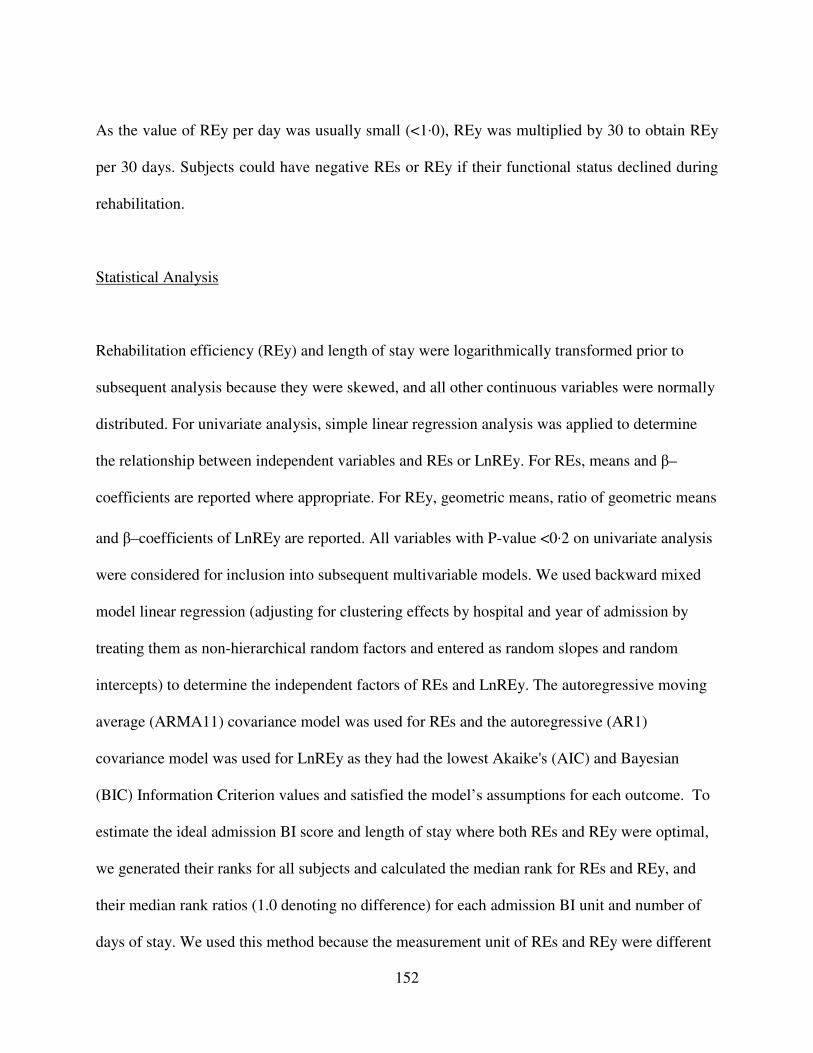
152
As the value of REy per day was usually small (<1.0), REy was multiplied by 30 to obtain REy
per 30 days. Subjects could have negative REs or REy if their functional status declined during
rehabilitation.
Statistical Analysis
Rehabilitation efficiency (REy) and length of stay were logarithmically transformed prior to
subsequent analysis because they were skewed, and all other continuous variables were normally
distributed. For univariate analysis, simple linear regression analysis was applied to determine
the relationship between independent variables and REs or LnREy. For REs, means and β–
coefficients are reported where appropriate. For REy, geometric means, ratio of geometric means
and β–coefficients of LnREy are reported. All variables with P-value <0.2 on univariate analysis
were considered for inclusion into subsequent multivariable models. We used backward mixed
model linear regression (adjusting for clustering effects by hospital and year of admission by
treating them as non-hierarchical random factors and entered as random slopes and random
intercepts) to determine the independent factors of REs and LnREy. The autoregressive moving
average (ARMA11) covariance model was used for REs and the autoregressive (AR1)
covariance model was used for LnREy as they had the lowest Akaike's (AIC) and Bayesian
(BIC) Information Criterion values and satisfied the model’s assumptions for each outcome. To
estimate the ideal admission BI score and length of stay where both REs and REy were optimal,
we generated their ranks for all subjects and calculated the median rank for REs and REy, and
their median rank ratios (1.0 denoting no difference) for each admission BI unit and number of
days of stay. We used this method because the measurement unit of REs and REy were different

153
and we needed to transform both outcomes into equivalent measures to study their relationship
with admission BI score and length of stay. We used SPSS (Version 19) for all statistical
analysis, all reported P-values are two-tailed and significance level was set at 0.05.
Results
3796 subjects who satisfied inclusion criteria and the sociodemographic and clinical profile of
the study population are detailed in Table 9. Out of these 3796 subjects, 461 had either
admission or discharge or both BI scores missing (12.1%), leaving 3335 subjects available for
REs and REy analysis. There was no significant difference in sociodemographic and clinical
profile between subjects with both admission and discharge BI scores available vs. those with
either admission or discharge or both BI scores missing except more subjects from former group
were from the lower socioeconomic class (72.5 vs. 51.9%, p<0.001), had shorter time from onset
of disability to admission (13.2 vs. 14.1 days, p<0.001), had longer length of stay (39.2 vs. 34.4
days, p=0.006) and had no co-morbidities (58.1 vs. 16.8%, p<0.001). Only 0.4% of subjects
attained a discharge BI of zero and 2.1% of subjects attained a discharge BI of 100, both of
which are much lower than the limit of 20% used to define significant floor or ceiling effects
when using a functional measurement tool in a specific population or period.21 The mean age
was 71.9 (SD=10.1) years, mean discharge ADL score was 59.0 (SD=26.6), mean REs was
32.3% (SD=29.2) and median REy was 17.6 per 30 days (IQR=19.1). 457 subjects (13.7%)
either did not improve or deteriorated in their functional status. LnREy could not be calculated
for these patients so they were excluded from subsequent analyses involving LnREy. The mean
LnREy was 2.69 (SD=0.90). The median time from date of admission to admission BI scoring

154
was 2 (inter-quartile range = 1–3) days and the median time from date of discharge BI scoring to
discharge was 3 (inter-quartile range = 1-6) days.
On bivariate analysis, the factors associated with poorer REs were older age, female gender,
Malay vs. Chinese ethnicity, having a religion, caregiver availability, infarct stroke type, lower
admission BI scores, longer time from stroke onset to admission into rehabilitation hospital,
shorter length of stay, dementia and absence of hyperlipidaemia (Table 10). The covariates
associated with poorer REy on univariate analysis were the same as for REs except gender,
ethnicity, having a religion and caregiver availability were not associated with REy, and higher
government subsidy level and peptic ulcer disease was associated with poorer REy. Greater REs
was associated with longer length of stay whereas greater REy was associated with shorter length
of stay.
On multivariate analysis, the independent factors of poorer REs were older age, female gender,
Malay vs. Chinese ethnicity, caregiver availability, infarct stroke type, lower admission BI score,
longer time from stroke onset to admission, shorter length of stay and dementia (Table 11). The
independent factors of REy were the same as REs except gender was not associated with REy
and there was trade-offs between REs and REy with respect to admission functional status and
length of stay: an increase of 10 in admission BI score predicted an increase of 3.8% [95%CI 3.4
– 4.2] in REs but a decrease of 0.03 [95%CI -0.04 – -0.01] in log REy (equivalent to a reduction
of REy by 1.0 per 30 days), and an increase in log length of stay by 1 (equivalent to a length of
stay of 2.7 days) predicted an increase of 9.1% [95%CI 6.9 – 11.2] in REs but a decrease of
0.74 [95%CI -0.81 – -0.66] in log REy (equivalent to a reduction in REy by 2.3 per 30 days).

155
When the ratio of median rank of REs to REy was plotted for each admission BI unit (where 1.0
denotes no difference between REs and REy), the range of BI scores close to 1.0 was 35 to 60 BI
units (Figure 8). When the ratio of median rank of REs to REy was similarly plotted for each
day of length of stay, the range of length of stay in which the ration was close to 1.0 was 37 to 41
days (Figure 9). These ranges were corroborated by the ratios of median rank of REs to REy
with respect to admission BI scores (Appendix 7, Table 1) and number of days of stay
(Appendix 7, Table 2).
Discussion
Previous research has found that longer time from stroke onset to rehabilitation, ischemic strokes
and dementia are independently associated with poorer functional outcomes.22 Our study
confirmed that older age is an adverse risk factor for both REs and REy, and identified several
new factors associated with REs and REy. Females were less likely to achieve high REs and
Malays were more likely to achieve lower REs and REy than the Chinese, independent of
socioeconomic factors. The association between poorer REs and REy among Malays may either
be due to other relative disadvantage of being a minority ethnic group or ethnic-specific cultural
norms that may negatively influence the rehabilitation process. Further research is needed to test
these hypotheses.
A surprising finding was that post-stroke patients without caregivers exhibited better REs and
REy than those who had caregivers. It was possible that patients with caregivers are discharged
earlier because doctors assume that such patients can continue the rehabilitation at home with the
help of the caregiver. However, in our multivariate both caregiver availability and length of stay

156
were independent predictors of REs and REy, and hence the final model was already adjusted for
length of stay. Moreover, additional analysis found no association between length of stay and
number of caregivers available (Spearman correlation coefficient, rs=0.01, p=0.551). Our finding
contradicts a systematic review by Kwakkel et al who found that higher levels of social support
was associated with better post-stroke functional recovery.22 The paper cited in the review used
patient-perceived social support and was community-based which may explain our contrary
findings. Another possible explanation is that patients without caregivers were more motivated to
participate in rehabilitation because they had nobody to rely on.23 Conversely, subjects could
have been over-protected by their caregivers which reduced motivation to participate in
rehabilitation.24 Our finding may be unique to the Asian culture where the sense of filial piety is
stronger and caregivers, out of good intentions, may discourage patients from performing ADLs
for themselves even when they are capable, inadvertently hindering rehabilitation. It would be
useful for future research to examine if this association between caregiver availability and poorer
REs and REy exists in Western cultures.
The finding that there was a trade-off between REs and REy with respect to admission functional
status and length of stay has implications for policy formulation and clinical practice in stroke
rehabilitation. Some institutions and governments have admission criteria or maximum duration
of stay for inpatient rehabilitation funding eligibility. While unnecessary prolongation of
inpatient rehabilitation may be inefficient, premature termination of sub-acute stroke
rehabilitation because of financial constraints may limit maximal functional recovery. Similarly,
inpatient rehabilitation of mildly disabled sub-acute stroke patients may result in greater
functional recovery but this may not be an efficient use of resources. Clinicians and stroke
patients value rehabilitation effectiveness more because they are concerned with functional

157
independence while policymakers generally value rehabilitation efficiency more because they
want to maximize stroke outcomes using limited healthcare resources. However, increasing sub-
acute stroke rehabilitation efficiency by restricting admission functional status and length of stay
may compromise rehabilitation effectiveness, and vice versa. Stroke patients, caregivers,
clinicians and policymakers must recognize the trade-off between rehabilitation effectiveness
and efficiency, and arrive at a consensus on the relative value they place on each outcome
measure when formulating policies on admission functional status and length of stay during sub-
acute stroke rehabilitation. Moreover, it must be emphasized that although the ideal admission BI
score was 35 to 60 days, it does not mean that subjects with an admission BI score of <35 did not
improve in their functional status at discharge; in fact, the majority of this group of subjects still
improved functionally with inpatient rehabilitation.
Our study has its limitations. Retrospective data extraction from medical records is dependent on
the accuracy and completeness of medical records. However, the low rate of missing BI data
suggests data was quite complete. Our study was based on data during community hospital stay
and did not follow-up subjects after discharge. Hence, our results are also only limited to sub-
acute post-stroke patients and inpatient rehabilitation settings. REs and REy are also dependent
on the functional measurement tool used and their independent factors may be different if
another functional measurement tool was used. When determining predictors of LnREy, subjects
with REy <0 were excluded so our results involving LnREy cannot be extrapolated to those who
did not improve in their functional recovery. The ideal admission BI score and length of stay
identified in this study may not apply to other settings or countries as they may only be specific
to context of the rehabilitation hospitals studied. We also did not study the effects of other
known predictors of post-stroke functional outcomes such as degree of neurological impairment

158
and depression as medical records in both hospitals had insufficient details to allow the
application of standardized tools to measure these variables. It would have been useful to analyze
the intermediate BI scores between admission and discharge BI scores to characterize the overall
BI trend during hospital stay. However, unfortunately, we did not collect intermediate BI scores
during data collection.
Conclusion
In conclusion, in the context of stroke rehabilitation, there appears to be trade-off relationships
between rehabilitation effectiveness and rehabilitation efficiency with respect to admission
functional status and length of stay. During policy formulation and clinical practice, caution
should be exercised when limiting admission functional status and length of stay to increase sub-
acute stroke rehabilitation efficiency as this may occur at the expense of rehabilitation
effectiveness.

159
Table 9. Characteristics of study population (N=3796)
Characteristic n (%)*
Age (years)
< 70 1547 (40.8) > 70 2249 (59.2) Mean ± SD 71.84± 10.16
Community Hospital Hospital A 838 (22.1) Hospital B 2165 (57.0) Hospital C 764 (20.1) Hospital D 29 (0.8)
Gender Male 1843 (48.6) Female 1953 (51.5)
Ethnicity Chinese 3280 (86.4) Malay 327 (86.1) Indian 157 (4.1) Others 32 (0.8)
Marital Status Single, widowed or divorced 1794 (47.3) Married 2000 (52.7)
Religion No 378 (10.0) Yes 3417 (90.0)
Government subsidy level Low or no subsidy 2065 (54.4) High subsidy 1731 (45.6)
Caregiver availability No 156 (4.1) Yes 3640 (95.9)
Stroke type Infarct 3427 (85.5) Bleed 478 (12.6) Both 71 (1.9)
Charlson Co-Morbidity Index 0 827 (21.8) 1 – 3 1163 (30.6) 4 – 6 1664 (43.8) > 7 142 (3.7) Mean ± SD 3.36 ± 2.14
Admission BI score (units) Mean ± SD 42.8 ± 24.4
Time to rehabilitation (days) Mean ± SD 14.0 ± 6.5
Length of stay (days) Median (IQR) 35.0 (25.0 - 49.0) Mean ± SD 37.3 ± 16.3
Year of Admission 1996 234 (6.2) 1997 415 (10.9) 1998 445 (11.7)

160
1999 457(12.0) 2000 413 (10.9) 2001 420 (11.1) 2002 347 (9.1) 2003 399 (10.5) 2004 355 (9.4) 2005 311 (8.2)
AIDS 4 (0.1) Chronic pulmonary disease 120 (3.2) Congestive heart failure 142 (3.7) Connective tissue disease 23 (0.6) Dementia 355 (9.4) Hemiplegia 3568 (94.0) Leukaemia 8 (0.2) Lymphoma 8 (0.2) Myocardial infarct 117 (3.1) Peripheral vascular disease 142 (3.7) Ulcer disease 396 (10.4) Diabetes
With end organ damage 1608 (42.4) Without end organ damage 32 (0.8)
Liver disease Mild 6 (0.2) Moderate or severe 11 (0.3)
Renal Disease Mild 66 (1.7) Moderate or severe 52 (1.4)
Malignant tumour Non-metastatic 115 (3.0) Metastatic 11 (0.3)
Hypertension† 2989 (78.7) Hyperlipidaemia† 1736 (45.7) Ischemic heart disease (including myocardial infarct) † 923 (24.3)
* Numbers may not add up to total because of untraceable data. Only valid percentages are shown. † Co-morbidities not in Charlson Co-morbidity Index.

161
Table 10. Associated factors of rehabilitation effectiveness (REs) and efficiency (REy) (N=3335)
Mean of REs
(95%CI)
Unstandardized β coefficient of REs
(95%CI)
Geometric mean of REy
(95%CI)
Relative mean difference of LnREy
(95%CI)
Unstandardized β coefficient of
LnREy (95%CI) Age (years)
< 70 37.55 (35.84-39.27) 0.00 15.82 (15.08-16.60) 1.00 0.00
> 70 28.64 (27.47-29.80) -9.44 (-11.38 – -7.49)† 13.98 (13.37-14.61) 0.90 (0.84 – 0.96)† -0.11 (-0.17 – -0.04)† Gender
Male 34.18 (32.62-35.74) 0.00 14.73 (14.06-15.44) 1.00 0.00
Female 30.46 (29.22-31.70) -3.53 (-5.45 – -1.61)† 14.59 (13.94-15.26) 0.99 (0.93 – 1.05) -0.006 (-0.07 - 0.05) Ethnicity
Chinese 32.81 (31.73-33.89) 0.00 14.88 (14.37-15.41) 1.00 0.00
Malay 27.29 (24.31-30.27) -6.50 (-9.94 – -3.06)† 13.87 (12.40-15.53) 0.92 (0.82 – 1.03)║ -0.08 (-0.20 – 0.03)║
Indian 30.31 (25.18-35.44) -2.12 (-7.02 – 2.78) 12.94 (10.67-15.68) 0.86 (0.73 – 0.99)§ -0.15 (-0.32 – -
0.009)§
Others 35.81 (25.94-45.68) 2.44 (-9.12 – 13.00) 13.20 (9.24-18.85) 0.94 (0.66 – 1.31) -0.07 (-0.41 – 0.27) Marital status
Married 33.10 (31.62-34.58) 0.00 14.73 (14.03-15.47) 1.00 0.00 Single, widowed or divorced
31.32 (29.99-32.65) -1.85 (-0.08 – 3.78)§ 14.73 (14.03-15.40) 1.00 (0.95 – 1.08) 0.01 (-0.05 – 0.08)
Religion
No 37.00 (33.67-40.33) 0.00 15.03 (13.57-16.64) 1.00 0.00
Yes 31.72 (30.68-32.76) -4.06(-7.24 – -0.87)‡ 14.73 (14.23-15.25) 0.95 (0.86 – 1.06) -0.05 (-0.15 – 0.06) Government subsidy level
Low or none 31.10 (29.85-32.35) 0.00 15.49 (14.83-16.17) 1.00 0.00
High 33.51 (31.95-35.97) -2.17 (-4.44 – 0.11)§ 14.01 (13.33-14.73) 0.89 (0.83 – 0.96)‡ -0.12 (-0.19 – -0.04)‡ Caregiver availability
No 43.68 (35.52-51.84) 0.00 16.95 (14.65-19.60) 1.00 0.00
Yes 31.75 (30.78-32.72) -12.5 (-17.0 – -8.0)† 14.59 (14.10-15.08) 0.90 (0.77 – 1.05)║ -0.11 (-0.26 – 0.05)║

162
Mean of REs
(95%CI)
Unstandardized β coefficient of REs
(95%CI)
Geometric mean of REy
(95%CI)
Relative mean difference of LnREy
(95%CI)
Unstandardized β coefficient of
LnREy (95%CI) Stroke type
Infarct 31.24 (30.18-32.30) 0.00 14.30 (13.80-14.81) 1.00 0.00
Bleed 39.25 (36.38-42.12) 7.33 (4.44 - 10.21)† 18.17 (16.67-19.82) 0.77 (0.70 – 0.85)† 0.26 (0.16 - 0.36)†
Admission BI score - 0.38 (0.34 – 0.42)† 1.00 (1.00-1.00)† 0.002
(0.001 – 0.003)†
Time to rehabilitation (days) - -0.36 (-0.51 – -0.21)† 0.99 (0.99-1.00)† -0.01 (-0.01 – -0.004)†
Log length of stay (days) - 4.03 (1.76 – 6.31)† 0.51 (0.47-0.54)† -0.68 (-0.75 – -0.61)†
Charlson Co-Morbidity Index
0 34.38 (32.08-36.68) 0.0 14.30 (13.23-15.45) 1.00 0.00
1 – 3 33.01 (31.14-34.88) 0.99 (-6.90 – 8.88) 15.64 (14.79-16.55) 1.03 (0.85-1.25) 0.03 (-0.16 – 0.22)
4 – 6 31.29 (29.88-32.70) -1.18 (-9.01 – 6.64) 14.30 (13.62-15.01) 0.94 (0.78 – 1.14) -0.06 (-0.25 – 0.13)
> 7 28.56 (24.42-32.70) -6.19 (-15.34 – 2.95)║ 14.44 (12.09-17.25) 0.97 (0.76 – 1.25) -0.03 (-0.27 – 0.22)
AIDS
No 32.29 (31.30-33.28) 0.0 14.73 (14.26-15.22) 1.00 0.00
Yes 26.68 (10.65-34.49) -28.97 (-56.82 –1.12) 13.33 (6.57-27.06) 1.02 (0.30 – 3.46) 0.02 (-1.21 – 1.24)
Chronic pulmonary disease
No 32.27 (31.26-33.28) 0.0 14.73 (14.25-15.23) 1.00 0.00
Yes 31.77 (26.29-37.25) -0.57 (-6.07 – 4.92) 16.44 (13.27-20.38) 1.14 (0.95 – 1.36)║ 0.13 (-0.06 – 0.32)║
Congestive heart failure
No 32.30 (31.29-33.31) 0.0 14.73 (14.25-15.23) 1.00 0.00
Yes 31.18 (26.48-35.88) -1.54 (-6.62-3.54) 14.44 (12.07-17.28) 0.98 (0.84-1.16) -0.02 (-0.18-0.15)
Connective tissue disease
No 32.27 (31.28-33.26) 0.0 14.73 (14.26-15.22) 1.00 0.00
Yes 30.07 (15.67-44.47) -4.15 (-16.33-8.02) 12.81 (7.68-21.35) 0.85 (0.56-1.30) -0.16 (-0.58-0.26)

163
Mean of REs
(95%CI)
Unstandardized β coefficient of REs
(95%CI)
Geometric mean of REy
(95%CI)
Relative mean difference of
LnREy (95%CI)
Unstandardized β coefficient of
LnREy (95%CI)
Dementia
No 33.33 (32.28-34.38) 0.0 15.03 (14.52-15.55) 1.00 0.00
Yes 22.66 (19.91-25.41) -13.09 (-16.3 – -9.89)† 12.30 (10.99-13.78) 0.83 (0.74 – 0.93)‡ -0.19 (-0.30– -0.07)‡
Leukaemia
No 32.23 (31.24-33.22) 0.0 14.73 (14.26-15.22) 1.00 0.00
Yes 46.59 (27.33-65.85) 7.41 (-13.90 – 28.72) 19.49 (11.25-33.77) 1.30 (0.68 – 2.53) 0.26 (-0.39 – 0.93)
Lymphoma
No 32.24 (31.25-33.23) 0.0 14.73 (14.26-15.22) 1..00 0.00
Yes 41.15 (20.43-61.87) 1.39 (-20.00 – 22.78) 14.30 (8.88-23.02) 0.98 (0.50 – 1.90) -0.02 (-0.69 – 0.64)
Myocardial infarct
No 32.39 (31.38-33.40) 0.0 14.73 (14.25-15.23) 1.00 0.00
Yes 27.89 (22.89-32.89) -5.11 (-10.79 – 0.56)§ 15.18 (12.36-18.65) 1.02 (0.84 – 1.23) 0.02 (-0.17 – 0.21)
Peripheral vascular disease
No 32.47 (31.46-33.48) 0.0 14.73 (14.25-15.23) 1.00 0.00
Yes 27.05 (22.29-31.81) -5.93 (-10.89 – 9.83) 13.07 (10.96-15.58) 0.89 (0.76 – 1.04)║ -0.12 (-0.28 – 0.04)║
Peptic ulcer disease
No 32.35 (31.30-33.40) 0.0 14.88 (14.38-15.40) 1.00 0.00
Yes 31.47 (28.54-34.40) -2.08(-5.21 – 1.03)║ 13.20 (11.81-14.74) 0.90 (0.80 – 0.99)‡ -0.11 (-0.22 – -0.01)‡
Diabetes mellitus
No 31.83 (30.45-33.21) 0.0 14.88 (14.23-15.55) 1.00 0.00
Without end organ damage 35.56 (24.26-46.86) 1.95 (-9.34 – 13.25) 12.18 (8.22-18.06) 0.90 (0.61 – 1.30) -0.11 (-0.50 – 0.26)
With end organ damage 32.77 (31.34-34.20) 1.10 (-0.85 – 3.05) 14.59 (13.88-15.33) 0.99 (0.93 – 1.05) -0.006 (-0.07 – 0.05)

164
Mean of REs
(95%CI)
Unstandardized β coefficient of REs
(95%CI)
Geometric mean of REy
(95%CI)
Relative mean difference of
LnREy (95%CI)
Unstandardized β coefficient of
LnREy (95%CI)
Liver disease
No 32.32 (31.33-33.31) 0.0 14.88 (14.40-15.38) 1.00 0.00
Mild 19.40 (3.68-42.48) -17.13 (-42.00 – 7.72)║ 11.59 (4.70-28.56) 0.79 (0.29 – 2.12) -0.25 (-1.25 – 0.75)
Moderate or severe 19.79 (9.17-30.41) -15.34 (-32.13 – 1.44)§ 16.44 (11.45-23.62) 0.93 (0.52 – 1.65) -0.07 (-0.65 – 0.50)
Renal disease
None 32.35 (31.34-33.36) 0.0 14.73 (14.25-15.23) 1.00 0.00
Mild 28.04 (22.25-33.83) -6.25 (-13.51-1.00)§ 14.01 (11.27-17.43) 0.95 (0.75-1.20) -0.05 (-0.29-0.18)
Moderate or severe 31.66 (24.30-39.02) -1.84 (-10.19-6.50) 13.20 (9.42-18.49) 0.90 (0.69-1.19) -0.10 (-0.37 – 0.17)
Malignant tumour
No 32.51 (31.50-33.52) 0.0 14.73 (14.25-15.23) 1.00 0.00
Non-metastatic 23.94 (19.21-28.67) -8.99 (-14.53 – -3.46)§ 12.81 (10.44-15.71) 0.90 (0.73 – 1.07) -0.12 (-0.31 – 0.07)
Metastatic 42.39 (20.06-64.72) 10.36 (-10.62 – 31.36) 15.03 (9.35-24.15) 1.12 (0.58 – 2.14) 0.11 (-0.54 – 0.76)
Hypertension*
No 31.69 (29.57-33.81) 0.0 14.44 (13.45-15.51) 1.00 0.00
Yes 32.42 (31.30-33.54) -0.86 (-3.23 – 1.49) 14.73 (14.20-15.29) 1.03 (0.96 – 1.12) 0.03 (-0.04 – 0.11)
Hyperlipidaemia*
No 30.27 (28.86-31.68) 0.0 14.73 (14.07-15.42) 1.00 0.00
Yes 34.51 (33.13-35.89) 2.17 (0.19 – 4.15)‡ 14.59 (13.91-15.29) 0.99 (0.93 – 1.05) -0.01 (-0.07 – 0.05)
Ischemic heart disease (including myocardial infarct)*
No 32.91 (31.74-34.08) 0.0 14.73 (14.07-15.42) 1.00 0.00
Yes 30.19 (28.36-32.02) -3.37 (-5.63 –1.10) 14.59 (13.91-15.29) 0.96 (0.89 – 1.03) -0.04 (-0.12 – 0.03)

165
Relative mean difference is the ratio of geometric means * Co-morbidities which are not part of the Charlson Co-Morbidity Index
† P-value <0.001
‡ 0.001 < P-value < 0.05
§ 0.05 < P-value < 0.1
║ 0.1 < P-value < 0.2

166
Table 11. Multivariate analysis of rehabilitation effectiveness (REs) and efficiency (REy) (N=3335)*
Rehabilitation effectiveness† Ln Rehabilitation efficiency‡
β coefficient (95%CI) P-value β coefficient (95%CI) P-value
Age group (>70 vs. < 70 years old) -5.58 (-7.45--3.71) < 0.001 -0.15 (-0.21 - -0.08) < 0.001
Gender (females vs. males) -1.96 (-3.76--0.16) 0.033 - -
Ethnicity - 0.077 - 0.078
Malay vs. Chinese -4.02 (-7.23 - -0.81) 0.014 -0.12 (-0.23 - -0.01) 0.038
Indian vs. Chinese -1.95 (-6.51 - 2.6) 0.401 -0.13 (-0.29 - 0.02) 0.094
Caregiver availability (yes vs. none) -4.17 (-8.21 - -0.13) 0.043 -0.15 (-0.29 - -0.02) 0.028
Stroke type (bleed vs. infarct) 7.72 (5.01 - 10.42) < 0.001 0.27 (0.18 - 0.36) < 0.001
Admission BI score 0.38 (0.34 - 0.42) < 0.001 -0.003 (-0.004 - -0.001) < 0.001
Time to rehabilitation -0.27 (-0.41 - -0.13) < 0.001 -0.01 (-0.01 - -0.004) < 0.001
Log length of stay 9.08 (6.91 - 11.24) < 0.001 -0.74 (-0.81 - -0.66) < 0.001
Dementia (yes vs. no) -9.02 (-12.06 - -5.99) < 0.001 -0.19 (-0.29 - -0.08) 0.001
* Backward mixed model linear regression (adjusting for clustering effects by hospital and year of admission by treating them as non-hierarchical random factors and entered as random slopes and random intercepts) was used to determine the independent factors of REs and LnREy. † Autoregressive moving average (ARMA11) covariance model used. Estimates of ARMA11 diagonal, rho and phi were 47.94, 0.89 and 0.85 respectively. ‡ Autoregressive (AR1) covariance model used. Estimates of AR1 diagonal and rho were 0.10 and 0.76 respectively.

167
Figure 8. Ratio of median rank of rehabilitation effectiveness (REs) to efficiency (REy) by admission BI score
0.00
0.50
1.00
1.50
2.00
2.50
3.00
3.50
0 10 20 30 40 50 60 70 80 90
Ra
tio
me
dia
n r
an
k R
Es/
RE
y
Admission ADL score
Ratio of median rank by Admission ADL Score
35 60

168
Figure 9. Ratio of median rank of rehabilitation effectiveness (REs) to efficiency (REy) by length of stay
0.00
0.50
1.00
1.50
2.00
2.50
3.00
14 24 34 44 54 64 74 84
Ra
tio
me
dia
n r
an
k R
Es/
RE
y
Length of stay (days)
Ratio of median rank by length of stay
37 41

169
References
1. Bates B, Choi JY, Duncan PW, et al; US Department of Defense; Department of
Veterans Affairs. Veterans Affairs/Department of Defense Clinical Practice
Guideline for the Management of Adult Stroke Rehabilitation Care: executive
summary. Stroke 2005;36:2049-2056.
2. Hayward RA. Performance measurement in search of a path. N Engl J Med
2007;356:951-953.
3. Pronovost PJ, Miller M, Wachter RM. The GAAP in quality measurement and
reporting. JAMA 2007;298:1800-1802.
4. Heinemann AW, Roth EJ, Cichowski K, Betts HB. Multivariate analysis of
improvement in outcome following stroke rehabilitation. Arch Neurol
1987;44:1167-1172.
5. Shah S, Vanclay F, Cooper B. Efficiency, effectiveness, and duration of stroke
rehabilitation. Stroke 1990:21:241-6.
6. Lin JH, Chang CM, Liu CK, et al. Efficiency and effectiveness of stroke
rehabilitation after first stroke. J Formos Med Assoc 2000;99:482-490.
7. Micieli G, Cavallini A, Quaglini S. Guideline compliance improves stroke
outcomes: a preliminary study in 4 districts in the Italian region of Lombardia.
Stroke 2002;33:1341-1347.

170
8. Gillen R, Tennen H, McKee TE, et al. Depressive symptoms and history of
depression predict rehabilitation efficiency in stroke patients. Arch Phys Med
Rehabil 2001;82:1645-1649.
9. Gialanella B, Monguzzi V, Santoro R, et al. Functional recovery after hemiplegia
in patients with neglect: The rehabilitative role of anosognosia. Stroke
2005;36:2687-2690.
10. Platz T, van Kaick S, Mehrholz J, et al. Best conventional therapy versus modular
impairment-oriented training for arm paresis after stroke: A single-blind,
multicentre randomized controlled trial. Neurorehabil Neural Repair
2009;23:706-16.
11. Institute of Medicine. Initial national priorities for comparative effectiveness
research. Washington, DC: Institute of Medicine, 2009.
12. Optimising the Analysis of Stroke Trials (OAST) Collaboration, Gray LJ, Bath
PM, Collier T. Should stroke trials adjust functional outcome for baseline
prognostic factors? Stroke 2009;40:888-894.
13. Jørgensen HS, Nakayama H, Raaschou HO, et al. Outcome and time course of
recovery in stroke. Part II: Time course of recovery. The Copenhagen Stroke
Study. Arch Phys Med Rehabil 1995;76:406-412.

171
14. Charlson ME, Pompei P, Ales KL, et al. A new method of classifying prognostic
comorbidity in longitudinal studies: development and validation. J Chronic Dis
1987;40:373-383.
15. Elderly and Continuing Care Division, Ministry of Health (Singapore).
Healthcare Services for the Elderly. An information booklet for healthcare
professionals. 1st Edition. Singapore. Ministry of Health. 2004.
16. Shah S, Vanclay F, Cooper B. Improving the sensitivity of the Barthel Index for
stroke rehabilitation. J Clin Epidemiol 1989;42:703-709.
17. Shah S, Muncer S. Sensitivity of Shah, Vanclay and Cooper's modified Barthel
Index. Clin Rehabil 2000;14:551-552.
18. De Morton NA, Keating JL, Davidson M. Rasch analysis of the barthel index in
the assessment of hospitalized older patients after admission for an acute medical
condition. Arch Phys Med Rehabil 2008;89:641-647.
19. Mudge AM, Giebel AJ, Cutler AJ. Exercising body and mind: an integrated
approach to functional independence in hospitalized older people. J Am Geriatr
Soc 2008;56:630-635.
20. Bennett M, Ryall N. Using the modified Barthel index to estimate survival in
cancer patients in hospice: observational study. BMJ 2000;321:1381-1382.
172
21. Barak S, Duncan PW. Issues in selecting outcome measures to assess functional
recovery after stroke. NeuroRx 2006;3:505-524.
22. Kwakkel G, Wagenaar RC, Kollen BJ, et al. Predicting disability in stroke--a
critical review of the literature. Age Ageing 1996;25:479-489.
23. Dixon G, Thornton EW, Young CA. Perceptions of self-efficacy and
rehabilitation among neurologically disabled adults. Clin Rehabil 2007;21:230-
240.
24. Maclean N, Pound P, Wolfe C, et al. Qualitative analysis of stroke patients'
motivation for rehabilitation. BMJ 2000;321:1051-1054.

173


175
CHAPTER FOUR: CAREGIVER SUPPORT OF RECENT STROKE SURVIVORS ADMITTED FOR
REHABILITATION IN COMMUNITY HOSPITALS
Introduction
Stroke is a major global health problem and a leading cause of long-term disability.1,2
Most disabled stroke survivors are looked after by caregivers, such as their spouses,
children, or friends.3 There is a wealth of literature on the benefits4,5 as well as
burdens6,7 of caregiving on the carer. However, the role of caregivers across different
cultures, particularly non-Western ones, is not well understood.8,9 In Western
populations, caregivers for stroke survivors tend to be female10,11 and are usually
spouses;12 while advanced age and female gender of stroke patient are associated with
poorer caregiver availability.12 In comparison, much less is known about caregivers in
Asian societies.13,14 Given that the negative (e.g. caregiver burden)15,16 and positive
aspects (e.g. satisfaction of knowing that their loved one is getting excellent care,
personal growth and increased meaning and purpose in one’s life)17 of the caregiving
process in stroke varies depending on a multitude of sociodemographic factors and the
relationship between carer and patient,18 cross-cultural differences in carer profiles are
likely to exist and affect the caregiving process. More studies are needed on the
nature of caregivers and predictors of caregiver availability across various cultures.
Compared with the extensive literature on the burden of caregiving amongst carers,
the impact of caregivers on patients’ rehabilitation outcomes is less studied. Most
studies in Western populations concur that having a caregiver improves rehabilitation
outcomes in stroke,19,20 although there was wide heterogeneity in the rehabilitation
outcomes that were studied. However, in the preceding chapter, having a caregiver

176
may negatively impacted rehabilitation outcomes in an Asian population;21 perhaps
because patients, reliant on their caregivers, are less motivated to improve their
functional independence. 22,23 It would be interesting to compare the caregiver profiles
of Asian stroke survivors with Western populations, to examine any cross-cultural
differences, particularly when the burden of stroke is expected to rise significantly in
Asia over the next decades.24,25,26
Singapore is a multi-ethnic urbanised Asian society with Chinese, Indians and Malays
and stroke has been the third leading cause of death over the past forty years.27 As
stroke mortality rates fall,28 the need for post-stroke rehabilitation has
correspondingly increased. There has been only one local study on nature of
caregivers published in 1987,13 but given demographic trends such as population
ageing and declining fecundity rates,29 the nature of caregivers is likely to have
changed since then. In particular, employing live-in hired help called foreign domestic
workers (FDW) as caregivers for disabled older persons is increasingly
commonplace,30,31 similar to other urbanised Asian societies.32,33 We conducted a
retrospective analysis of stroke patients admitted into all community hospitals in
Singapore over a ten-year period from 1996-2005, to determine: (1) the nature of
caregiver support for patients undergoing stroke rehabilitation; (2) the patient factors
associated with caregiver availability, number of potential caregivers and relationship
of primary caregiver to patient (“primary caregiver identity”) amongst stroke
survivors.
Methods
Data Extraction

177
We retrospectively extracted data from medical records of all stroke patients admitted
into all community hospitals across Singapore for rehabilitation from 2nd January
1996 to 31st December 2005, of which there were four in existence during this period
[Ang Mo Kio Thye Hua Kwan Hospital (AKTHKH); Saint Luke’s Hospital (SLH);
Saint Andrew’s Community Hospital (SACH); and Bright Vision Hospital (BVH)]
with BVH opening only in late 2002. Community hospitals in Singapore provide the
bulk of inpatient rehabilitative care.34 As per Singapore’s Ministry of Health
guidelines, community hospitals ensure that these patients achieve their optimal
potential before being discharged.35 Rehabilitation is provided every weekday until
discharge. Data extraction from non-computerized medical records was manually
performed from November 2006 to December 2009 by four research nurses who were
trained and supervised by the PhD candidate. We also verified data with acute stroke
unit discharge records. Multiple iterations of data cleaning and verification were
performed. A 10% random sample of subjects was subsequently analyzed for
accuracy of all data variables extracted by an independent physician and the error rate
was found to be only 0.07%. The study was approved by the National University of
Singapore Institutional Review Board and ethics committees of all hospitals.
Data Management
We applied the following inclusion criteria: (1) principal admission diagnosis of
stroke as defined by WHO criteria, (2) admission for rehabilitation, (3) first admission
for stroke, (4) length of stay > 14 days and < 90 days to ensure rehabilitation was
sufficiently sustained. Independent variables were socio-demographic variables
including age, gender, ethnicity, marital status, having a religion, government subsidy
level (as a surrogate measure of socioeconomic status); clinical variables including

178
Charlson co-morbidity index (a measure of co-morbidity burden),36 length of stay,
time to rehabilitation (defined as time from onset of stroke to admission into
community hospital) and variables related to caregiver factors. Singapore is a multi-
ethnic and hence multi-religious country with Buddhism, Islam and Christianity as the
major religions. In Singapore, the majority of Buddhists are Chinese and the majority
of Muslims are Malay. In community hospitals in Singapore, self-reported religion is
routinely asked for pastoral and dietary purposes and in this study, having a religion is
defined as a subject reporting a religion versus none. In all hospitals in Singapore,
only patients opting C class (non air-conditioned 8-bed) or B2 class (non air-
conditioned 6-bed) wards receive government subsidies for hospital stay (75% and
50% subsidy respectively); patients opting higher class (i.e. air-conditioned six to
single bedded) wards do not receive subsidies. In our study, we dichotomized
government subsidy levels into C class versus B2 class and above as C class patients
best represented the lower socio-economic class in the Singapore population.
Outcome Measures
A potential caregiver was defined as any person aged 18 years and above, living with
the stroke patient after discharge and possibly capable of physically caring for the
patient. Potential caregivers can hence include family members, relatives, friends or
other paid helpers, and there could be more than one. A primary caregiver was
defined as the main person among all potential caregivers who would actually provide
physical care to the stroke patient after discharge.11 We studied the variables
associated with the following caregiver factors as dependent variables: (1) caregiver
availability, (2) number of potential caregivers and (3) primary caregiver identity.

179
Functional status was assessed using the Shah-modified Barthel Index (BI) which was
used by all rehabilitation hospitals in Singapore as recommended by our local
Ministry of Health during the study period.34 The Shah-modified BI has a range from
zero to 100, with five sub-categories for each activity of daily living (ADL) category
and 100 possible discrete values.37 A score of zero reflects complete ADL dependence
and 100 reflects complete ADL independence. The Shah-modified BI’s scale
reliability is better than the original BI38 and is widely used. According to our
Ministry of Health’s requirements, admission BI must be scored within 48 hours of
admission34 and were performed by occupational therapists in respective hospitals.
Statistical Analysis
For patient factors associated with caregiver availability, bivariate and multivariate
analysis was performed using mixed model logistic regression, adjusting for
clustering effects by hospital and year of admission. For patient factors associated
with number of potential caregivers, bivariate and multivariate analysis was
performed using mixed Poisson modelling, adjusting for clustering by hospital and
year of admission. For patient factors associated with primary caregiver identity, we
excluded patients who selected “others” as their primary caregiver from the analysis
because their number was too small for meaningful analysis. For patient factors
associated with primary caregiver identity, bivariate and multivariate analysis was
performed using mixed model logistic regression, adjusting for clustering effects by
hospital and year of admission. Length of stay was skewed to the right so we used
Mann-Whitney-U test for bivariate analysis with caregiver availability and primary
caregiver identity but used natural log of length of stay for bivariate analysis with
number of potential caregivers and all multivariate analyses. For all multivariate

180
models, we used a P<0.2 on bivariate analysis as criterion for inclusion of variables;
backward regression to construct the most parsimonious model; and included age,
gender and ethnicity as common adjustment baseline variables regardless of statistical
significance. We used Stata (Version SE 11.0, StataCorp LP, Texas, USA) for
statistical analysis and significance level was set at the conventional P<0.05.
Results
Study population
3796 subjects who satisfied inclusion criteria and the sociodemographic and clinical
profile of the study population are detailed in Table 12. Of these subjects, 3640
(3640/3796=95.9%) had caregivers, of which 211 could not identify a primary
caregiver, leaving 3429 (3429/3640=94.2%) subjects who had a primary caregiver. Of
those with primary caregivers, 1412 (41.2%) were cared for by FDWs, 947 (27.6%)
by spouses, 739 (21.6%) by own child or parent, 303 (8.4%) by other relatives
(including in-laws) and 28 (0.8%) by other caregivers such as friends, neighbours or
nursing home staff. We excluded the non-relative non-FDW (‘others’) category of
primary caregivers when analyzing the factors associated with primary caregiver
identity because the number was small.
Caregiver factors
On bivariate analysis, patient factors associated with having a caregiver amongst
recent stroke survivors undergoing rehabilitation were older age, female gender,
Malay (minority) ethnicity compared to Chinese, being married, having a religion,
higher socio-economic class and lower admission BI score (i.e. poorer initial
functional status) (Table 13). For bivariate analysis of patient factors associated with

181
greater number of potential caregivers, we found associations with being married,
having a religion, higher socio-economic status, fewer co-morbidities and lower
admission BI score (Table 14). On bivariate analysis of the 3401 subjects with
primary caregivers (excluding the “others” category) and with reference to those who
had spouses as primary caregivers, the patient factors associated with reliance on a
child or parent were older age, female gender, Malay ethnicity compared with
Chinese ethnicity, having a religion, lower socioeconomic status and lower admission
BI scores; the patient factors associated with reliance on other relatives were older
age, female gender and lower socioeconomic status; and the patient factors associated
with reliance on FDWs were older age, female gender, Chinese compared to Malay or
Indian ethnicities, higher socioeconomic status, lower admission BI scores, longer
time to rehabilitation and longer length of stay (Table 15).
On multivariate analysis, patient factors independently associated with caregiver
availability were older age, female gender, being married, having a religion, higher
socio-economic class, lower admission BI scores and shorter length of stay (Table
16). Patient factors independently associated with greater number of potential
caregivers were the same for caregiver availability except length of stay was not
associated (Table 16). On multivariate analysis and with reference to those who had
spouse as primary caregiver, the independent patient factors associated with reliance
on children or parent were older age, female gender, lower socioeconomic status and
having mixed hemorrhagic and ischemic strokes (compared to only having
hemorrhagic stroke); the independent patient factors associated with reliance on other
relatives were older age, female gender and lower socioeconomic status; the
independent patient factors associated with reliance on FDWs were older age, female

182
gender, Chinese compared to Malay ethnicity, higher socioeconomic class and lower
admission BI scores (Table 16).
Discussion
From our national study of profile of stroke patients admitted into community
hospitals who had caregivers, we found that those who were older were independently
more likely to have a caregiver, more likely to have a larger number of potential
caregivers but less likely to be cared for by a spouse. The older a person ages, the
greater the proportion of their children and grandchildren reach the age of 18 years
(our age criterion for a caregiver) and the higher the likelihood of widowhood.
Females were also independently more likely to have a caregiver, have more potential
caregivers and not be cared for by a spouse. As women have a longer life expectancy
than men, it is expected that females are more likely to not be cared for by a spouse.
However, it is surprising that female stroke patients were more likely to have a
caregiver and a larger number of potential caregivers, independent of age of stroke
patient. There have been many studies on the predominance of female caregivers of
stroke patients3,4 but none have studied the association of gender of stroke patients
with caregiver availability. A possible explanation is that women generally have
greater social resources and are better at mobilizing social resources than men10 and
hence, are more likely to have caregivers. Another possible and more intriguing
possibility is that there may be differences in the degree of filial piety of children for
fathers and mothers. Filial piety is a set of attitudes, values and social beliefs based on
the virtue of respect for one's parents and elders, and has its origins rooted in Asian
and Confucian philosophies. The term can also be applied to general obedience, and is
used in religious titles in Christian Churches like in a "filial” priest who is

183
“subordinate” to a larger parish. In more general terms, filial piety means to be good
to one's parents, to take care of one's parents, and to engage in good conduct not just
towards parents but also outside the home so as to bring a good name to one's parents.
Researchers of cross-cultural attitudes of filial piety have posited that most children
from a Judeo-Christian background do not honor and care for parents to the extent of
those from Eastern backgrounds because in the West, the individual is more important
than the family and when an elderly parent becomes a burden to the adult child, the
needs of the adult child to be burden-free supersedes any obligation to care for the
elderly parent.39 Traditionally, filial piety in Asian cultures is engendered with male
adult children demonstrating greater filial attitudes but lesser filial behaviours
compared to female adult children.40 It is possible that in the context of inter-
generational reciprocity in Singapore, adult children may in turn be more willing to
care for their mothers than their fathers as mothers are often the parent providing
direct nurturing care to children than fathers. However, this remains a hypothesis to
be tested further. Married stroke patients were independently more likely to have
caregivers and this is expected as they are more likely to have children and
grandchildren. Stroke survivors with poorer post-stroke functional status are also
more likely to have caregivers. This is probably a situation of reverse causality where
greater disability in a stroke patient resulted in more family members and friends
stepping forward to become a caregiver. While there are studies on the effect of
having a religion on coping by caregivers in Western populations,41,42 our study is
probably the first to report a positive association between patients having a religion
and caregiver availability and number of potential caregivers in a multi-religious
Asian population. Explanations for these associations are likely to be complex,
especially in our local context where the major religions (Buddhism, Islam and

184
Christianity) encourage fecundity, large families and extended families living within
the same household, explaining why having a religion was independently associated
with greater number of potential caregivers. The three major religions in Singapore
also uphold the moral importance of respecting one’s parents and elders, as do Asian
socio-cultural norms.43 Nevertheless, it is difficult to clearly dissect the contribution
Asian socio-cultural norms which are ethnicity-specific from the influence of religion
as most Muslims are Malays and most Buddhists are Chinese . Ethnic differences also
influence relationship of caregiver to stroke patient in our study population: although
Malays were more likely to be cared for by their child or parent instead of their
spouses than Chinese, Malays were less likely to rely on foreign domestic workers as
primary caregivers than Chinese (independent of socioeconomic status), in keeping
with other local studies.44 In the Malay culture and Islamic faith, it is considered a
blessing to not only care for both parents, but also to alleviate the burdens of parents
in their later years. Hence, Malay children are more likely to view it as their
responsibility to care for their disabled parent than for their other well parent to do so.
This may also explain why Malays are less likely to employ a FDW to care for their
disabled parent and prefer to perform their caregiver role themselves.
While 82-93% of stroke patients in Western studies depended on either their spouse
or first-degree relatives as caregivers,11,45,46 only 49.2% of patients in our study did so.
Instead, two-fifths of primary caregivers of stroke survivors in Singapore were FDWs
and greater functional dependency was independently associated with greater
likelihood of the stroke survivor being cared for by a FDW than relations. In the past,
care for dependent elderly in Singapore has traditionally been provided primarily by
co-resident family members, especially women.47,48 However, with rising affluence,

185
more Singaporean women have entered the workforce, straining their ability to
perform household chores and care for dependent elderly family members as well.49
Combined with the rapid ageing of Singapore’s population, such socio-demographic
trends have led to the number of FDW in Singapore to expand from 20,000 in 1987 to
more than 100,000 in 1995, one for every eight households in the country.50 Such
trends are not unique to Singapore. The use of foreign maids in the care of elderly
patients with stroke has become the norm in many Asian cities, such as in Taiwan,
Hong Kong and Malaysia.51,52 Even in Western countries, the use of hired help (e.g.
nursing aides, home help staff) to care for stroke survivors is also expected to rise,
especially in urbanized areas where similar socio-demographic transitions are also
occurring. Nevertheless, employing a FDW is not a cheap alternative as it involves a
monthly levy payable to the government of S$170, a monthly salary for the foreign
domestic worker of about S$500-1000, and food and lodging for the FDW.
Considering that the median monthly household income of Singaporeans is S$7,032,
lower income Singaporean households find it financially challenging to afford a FDW
to care for a stroke patient.53 This also explains why socioeconomic status as
measured by government subsidy levels was strongly associated with primary
caregiver identity, with stroke patients from higher socioeconomic status are more
likely to have a FDW are their primary caregiver, followed by spouse, child or parent
and lastly by other relatives.
Strengths of our study were the long study duration of ten years and that our sample
consisted of all stroke patients admitted into all community hospitals in Singapore
during the study period. Nevertheless, our study also has limitations. As data was
extracted retrospectively, reliability of our study depends on the completeness of
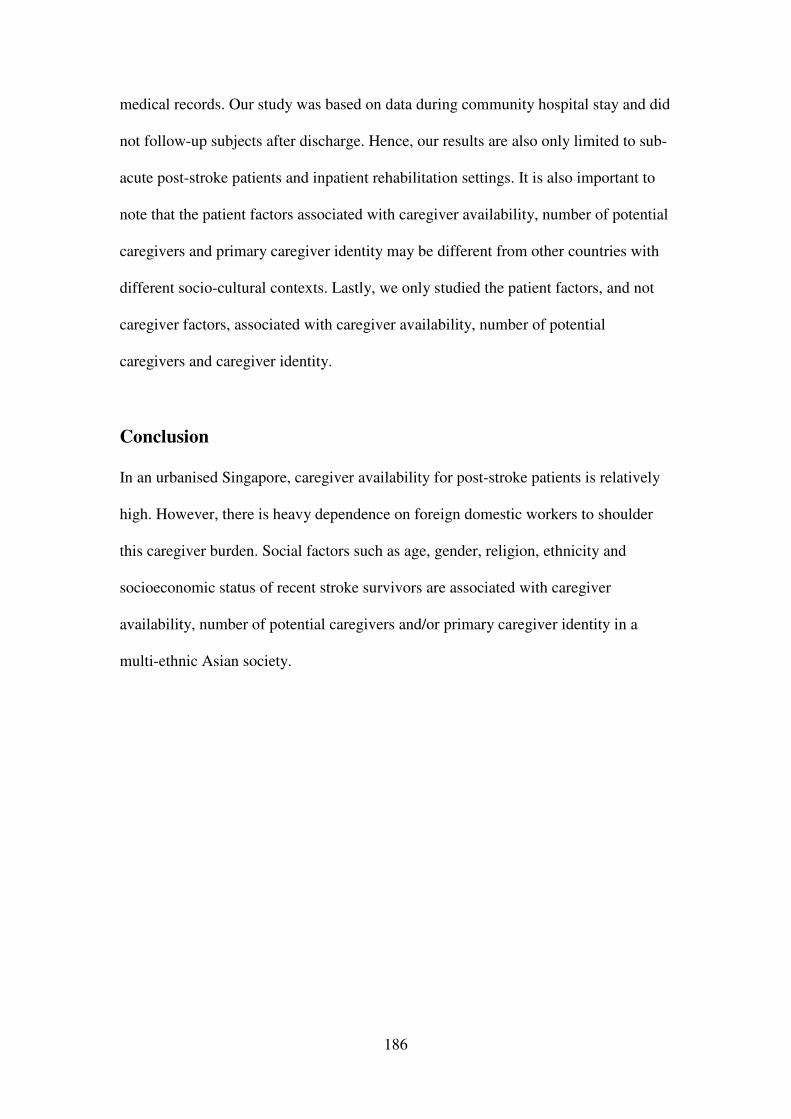
186
medical records. Our study was based on data during community hospital stay and did
not follow-up subjects after discharge. Hence, our results are also only limited to sub-
acute post-stroke patients and inpatient rehabilitation settings. It is also important to
note that the patient factors associated with caregiver availability, number of potential
caregivers and primary caregiver identity may be different from other countries with
different socio-cultural contexts. Lastly, we only studied the patient factors, and not
caregiver factors, associated with caregiver availability, number of potential
caregivers and caregiver identity.
Conclusion
In an urbanised Singapore, caregiver availability for post-stroke patients is relatively
high. However, there is heavy dependence on foreign domestic workers to shoulder
this caregiver burden. Social factors such as age, gender, religion, ethnicity and
socioeconomic status of recent stroke survivors are associated with caregiver
availability, number of potential caregivers and/or primary caregiver identity in a
multi-ethnic Asian society.

187
Table 12. Characteristics of stroke rehabilitation patients admitted to Singaporean community hospitals from 1996-2005 (N=3796)
Characteristic n (%)*
Age (years)
< 70 1547 (40.8) > 70 2249 (59.2) Mean ± SD 71.8± 10.2
Community Hospital Hospital A 838 (22.1) Hospital B 2165 (57.0) Hospital C 764 (20.1) Hospital D 29 (0.8)
Gender Male 1843 (48.6) Female 1953 (51.5)
Ethnicity Chinese 3280 (86.4) Malay 327 (86.1) Indian 157 (4.1) Others 32 (0.8)
Marital Status Never married, widowed or divorced 1794 (47.3) Married 2000 (52.7)
Religion No 378 (10.0) Yes 3417 (90.0)
Government subsidy level Low or no subsidy 2065 (54.4) High subsidy 1731 (45.6)
Caregiver availability No 156 (4.1) Yes 3640 (95.9) Number of caregivers†
0 156 (4.1) 1 631 (16.6) 2 1183 (31.2) 3 1167 (30.7) 4 469 (12.4) 5 141 (3.7) 6 32 (0.8) 7 10 (0.3) 8 5 (0.1) 9 2 (0.1)
Has primary caregiver‡ No 211 (5.8) Yes 3429 (94.2)
Relationship of primary caregiver to patient§ Spouse 947 (27.6) Child/parent 739 (21.6) Other relatives 303 (8.4) Foreign domestic worker (live-in hired help) 1412 (41.2) Others (e.g. friends, neighbours, nursing home staff) 28 (0.8)
Stroke type Infarct 3427 (85.5) Bleed 478 (12.6) Both 71 (1.9)

188
Charlson Co-Morbidity Index 0 827 (21.8) 1 – 3 1163 (30.6) 4 – 6 1664 (43.8) > 7 142 (3.7)
Admission BI score (units) Mean ± SD 42.8 ± 24.4
Discharge BI score (units) Mean ± SD 59.2 ± 26.6
Time to rehabilitation (days) Mean ± SD 14.00 ± 6.47
Length of stay (days) Median (IQR) 35.0 (25.0 - 49.0) Mean ± SD 37.3 ± 16.3
Year of Admission 1996 234 (6.2) 1997 415 (10.9) 1998 445 (11.7) 1999 457(12.0) 2000 413 (10.9) 2001 420 (11.1) 2002 347 (9.1) 2003 399 (10.5) 2004 355 (9.4) 2005 311 (8.2)
* Numbers may not add up to total because of untraceable data. Only valid percentages are shown. † A caregiver was defined as any person aged 18 years and above, living with the stroke patient and potentially capable of physically caring for the patient. Percentages reported based on those with caregiver available as denominator. ‡ A primary caregiver was defined as the main caregiver who would actually provide physical care to the stroke patient after discharge. § Percentages reported based on those who had a primary caregiver.

189
NC: Cannot be calculated. Numbers may not add up to total because of untraceable data. Only valid percentages are shown. * Adjusted for clustering by community hospital and year of admission † Exp(B) reported instead of OR. ‡ Mann-Whitney-U test used to generate p-value.
Table 13. Patient factors for caregiver availability among stroke rehabilitation patients admitted to Singaporean community hospitals from 1996-2005 on bivariate analysis (N=3796)
Characteristic No caregiver
(n=156) n (%)
Caregiver (n=3640)
n (%)
OR or Exp(B) (95% CI)*
P-value
Age (years) < 70 76 (48.7) 1471 (40.4) 1.00 - > 70 80 (51.3) 2169 (59.6) 1.36 (0.99-1.88) 0.061 Mean (SD) 70.1 (10.3) 71.9 (10.2) - 0.042 Gender Male 90 (57.7) 1753 (48.2) 1.00 - Female 66 (42.3) 1887 (51.8) 1.47 (1.06-2.03) 0.021 Ethnicity
Chinese 144 (92.3) 3136 (85.2) 1.00 - Malay 5 (3.2) 322 (8.9) 2.87 (1.16-7.05) 0.022 Indian 5 (3.2) 30 (0.8) 1.40 (0.57-3.48) 0.465 Others 2 (1.3) 30 (0.8) 0.61 (0.12-2.61) 0.505 Marital Status Never married, widowed or divorced
141 (90.4) 1653 (45.4) 1.00 -
Married 15 (9.6) 1985 (54.6) 11.18 (6.53-19.11) <0.001 Religion No 29 (18.6) 349 (9.6) 1.00 - Yes 127 (81.4) 3290 (90.4) 2.20 (1.44-3.35) <0.001 Government subsidy level Low or no subsidy 42 (26.9) 2023 (55.6) 1.00 - High subsidy 114 (73.1) 1617 (44.4) 0.26 (0.18-0.38) <0.001 Stroke type Bleed 22 (14.1) 456 (12.5) 1.00 - Infarct 131 (84.0) 3116 (85.6) 1.11 (0.32-3.86) 0.865 Both 3 (1.9) 68 (1.9) 1.18 (0.75-1.89) 0.465 Charlson Co-Morbidity Index 0 20 (12.8) 807 (22.2) 1.00 - 1 – 3 65 (41.7) 1098 (30.2) 0.47 (0.21-1.09) 0.078 4 – 6 65 (41.7) 1599 (43.9) 0.69 (0.30-1.56) 0.369 > 7 6 (3.9) 136 (3.7) 0.62 (0.21-1.84) 0.385 Admission BI score (units) † Mean (SD) 56.6 (21.0) 42.2 (24.3) 0.97 (0.96-0.98) <0.001 Time to rehabilitation (days)† Mean (SD) 14.9 (6.5) 13.9 (6.5) 0.98 (0.96-1.00) 0.086 Length of stay (days)‡ Median (IQR) 36.5 (26-53) 35 (25-49) - 0.053

190
Table 14. Patient factors for number of potential caregivers among stroke rehabilitation patients with caregivers admitted to Singaporean community hospitals from 1996-2005 on bivariate analysis (N=3796)
Characteristic ß (95%CI)* P-value
Age (years) < 70 0.00 - > 70 0.01 (-0.03-0.05) 0.623 Continuous 0.001 (-0.001-0.003) 0.572 Gender Male 0.00 - Female -0.02 (-0.06-0.02) 0.322 Ethnicity Chinese 0.00 - Malay 0.02 (-0.05-0.09) 0.526 Indian -0.04 (-0.14-0.06) 0.464 Others -0.21 (-0.46-0.03) 0.087 Marital Status Never married, widowed or divorced 0.00 - Married 0.25 (0.21-0.30) <0.001 Religion No 0.00 - Yes 0.09 (0.02-0.16) 0.015 Government subsidy level Low or no subsidy 0.00 - High subsidy -0.15 (-0.19--0.10) <0.001 Stroke type Bleed 0.00 - Infarct 0.08 (-0.07-0.24) 0.289 Both 0.01 (-0.05-0.07) 0.752 Charlson Co-Morbidity Index 0 0.00 1 – 3 -0.10 (-0.16--0.04) 0.001 4 – 6 -0.07 (-0.13--0.16) 0.011 > 7 -0.15 (-0.27--0.03) 0.013 Admission BI score (units) -0.003 (-0.004--0.002) <0.001 Time to rehabilitation (days) 0.000 (-0.003-0.003) 0.989 Ln Length of stay (days) 0.02 (-0.03-0.06) 0.519
* Adjusted for clustering by community hospital and year of admission

191
Table 15. Patient factors for primary caregiver identity of stroke rehabilitation patients admitted to Singaporean community hospitals from 1996-2005 on bivariate analysis (N=3401)*
Characteristic
Relationship of primary caregiver to stroke patient n (%)
OR or Exp(B) (95% CI)
(1) Spouse (n=939)
(2) Child or parent (n=228)
(3) Other
relative (n=73)
(4) Foreign
domestic worker (n=691)
(2) vs. (1) (3) vs. (1) (4) vs. (1)
Age (years) < 70 605 (63.9) 229 (31.0) 103 (34.0) 414 (29.3) 1.00 1.00 1.00
> 70 342 (36.1) 510 (69.0) 200 (66.0) 998 (70.7) 4.03
(3.28-4.96)† 3.52
(2.66-4.64)† 4.15
(2.46-4.97)† Mean (SD) 66.6 (9.8) 73.8 (9.6) 73.4 (10.4) 74.5 (9.1) † † † Gender Male 703 (74.2) 273 (36.9) 117 (38.6) 548 (38.8) 1.00 1.00 1.00
Female 244 (25.8) 466 (63.1) 186 (61.4) 864 (61.2) 4.91
(3.99-6.06)† 4.77
(3.60-6.31)† 4.82
(3.99-5.83)† Ethnicity Chinese 782 (82.6) 595 (80.5) 252 (83.2) 1287 (91.2) 1.00 1.00 1.00
Malay 103 (10.9) 108 (14.6) 37 (12.2) 63 (4.5) 1.41
(1.05-1.90)‡ 1.16
(0.77-1.75) 0.35
(0.25-0.49)†
Indian 49 (5.2) 35 (4.7) 12 (4.0) 48 (3.4) 0.91
(0.58-1.42) 0.76
(0.40-1.46) 0.60
(0.39-0.91)‡
Others 13 (1.4) 1 (0.1) 2 (0.7) 14 (1.0) 0.09
(0.01-0.71)‡ 0.47
(0.10-2.13) 0.57
(0.27-1.25)║ Religion No 100 (10.6) 46 (6.2) 22 (7.3) 149 (10.6) 1.00 1.00 1.00
Yes 847 (89.4) 693 (93.8) 281 (92.7) 1262 (89.4) 1.81
(1.25-2.61)‡ 1.47
(0.90-2.40)║ 1.06
(0.80-1.40) Government subsidy level Low or no subsidy 568 (60.0) 380 (51.4) 149 (49.2) 844 (59.8) 1.00 1.00 1.00
High subsidy 379 (40.2) 359 (48.6) 154 (50.8) 568 (40.2) 1.42
(1.16-1.76)† 1.86
(1.38-2.52)† 0.72
(0.57-0.90)†

192
Stroke type Bleed 118 (12.5) 93 (12.6) 39 (12.9) 180 (12.8) 1.00 1.00 1.00
Infarct 812 (85.7) 632 (85.5) 257 (84.8) 1202 (85.1) 1.03
(0.48-2.21) 1.23
(0.47-3.22) 1.07
(0.55-2.08)
Both 17 (1.8) 14 (1.9) 7 (2.3) 30 (2.1) 0.98
(0.73-1.32) 0.93
(0.63-1.37) 0.97
(0.75-1.26) Charlson Co-Morbidity Index 0 213 (22.5) 129 (17.5) 64 (21.1) 367 (26.0) 1.00 1.00 1.00
1 – 3 286 (30.2) 235 (31.8) 106 (35.0) 369 (26.1) 1.31
(0.95-1.80)§ 1.02
(0.54-1.92) 0.66
(0.43-1.03)§
4 – 6 416 (43.9) 344 (46.6) 124 (40.9) 617 (43.7) 1.33
(0.99-1.79)§ 0.84
(0.45-1.57) 0.74
(0.48-1.13)║
> 7 32 (3.4) 31 (4.2) 9 (3.0) 59 (4.2) 1.55
(0.89-2.72)║ 0.85
(0.33-2.15) 0.86
(0.47-1.57) Admission BI score (units) ¶
Mean (SD) 47.2 (23.2) 43.4 (23.8) 45.1 (22.9) 36.7 (24.3) 0.98
(0.97-0.99)† 0.99
(0.99-1.00) 0.98
(0.97-0.99)† Time to rehabilitation (days)¶
Mean (SD) 13.4 (6.5) 13.8 (6.3) 13.4 (6.3) 14.3 (6.5) 1.00
(0.99-1.02) 0.99
(0.97-1.02) 1.01
(1.00-1.02)‡ Length of stay (days)** Median (IQR) 35 (25-47) 34 (25-49) 35 (25-47) 37 (26-51) - - ‡
Numbers may not add up to total because of untraceable data. Only valid percentages are shown. * Of the 3640 patients with caregivers, 211 patients who were unable to identify a primary caregiver and 28 patients who identified their primary caregiver as “others”- e.g. friends, neighbours- were excluded from this analysis. † P-value <0.001 ‡ 0.001 < P-value < 0.05 § 0.05 < P-value < 0.1 ║ 0.1 < P-value < 0.2 ¶ Exp(B) reported instead of OR. ** Mann-Whitney-U test used to generate p-value.

193
Table 16. Patient factors for caregiver availability, number of potential caregivers and primary caregiver identity among stroke rehabilitation patients admitted to Singaporean community hospitals from 1996-2005 on multivariate analysis
Characteristic
Caregiver availability (n=3796)
Number of caregivers (n=3796)
Relationship of primary caregiver to stroke patient (n=3401)
Child or parent vs. spouse
Other relatives vs. spouse
Foreign domestic worker vs. spouse
OR or Exp(B)
(95% CI) P-value
β (95% CI)
P-value
OR or Exp(B)
(95% CI) P-value
OR or Exp(B)
(95% CI) P-value
OR (95% CI)
P-value
Age group (>70 vs. < 70 years old)
1.53 (1.06-2.23)
0.024 0.06
(0.02-0.11) 0.009
4.55 (3.16-5.73)
<0.001 4.12
(3.03-5.59) <0.001
4.06 (3.28-5.02)
<0.001
Gender (females vs. males)
2.15 (1.47-3.13)
<0.001 0.07
(0.02-0.11) 0.005
5.81 (4.61-7.32)
<0.001 5.91
(4.33-8.05) <0.001
4.79 (3.85-5.96)
<0.001
Ethnicity*
Malay vs. Chinese 2.33
(0.91-5.97) 0.078
0.01 (-0.06-0.09)
0.762 1.64
(1.18-2.29) 0.003
1.39 (0.87-2.18)
0.160 0.35
(0.23-0.53) <0.001
Indian vs. Chinese 1.70
(0.59-4.88) 0.323
-0.02 (-0.13-0.09)
0.694 1.36
(0.84-2.21) 0.209
0.90 (0.44-1.87)
0.787 0.79
(0.48-1.30) 0.355
Marital status (married vs. not married)
16.2 (8.9-29.5)
<0.001 0.29
(0.24-0.34) <0.001 NA† NA† NA† NA† NA† NA†
Religion (yes vs. no)
1.70 (1.03-2.81)
0.037 0.08
(0.01-0.16) 0.028 - - - - - -
Government subsidy level (high subsidy vs. no or low subsidy)
0.31 (0.20-0.46)
<0.001 -0.12
(-0.16--0.07) <0.001
1.41 (1.11-1.78)
0.006 2.15
(1.51-3.04) <0.001
0.70 (0.53-0.90)
0.006
Admission BI score‡ 0.97
(0.96-0.98) <0.001
-0.003 (-0.004--0.002)
<0.001 - - - - 0.98
(0.97-0.99) <0.001
Ln length of stay‡ 0.57
(0.38-0.86) 0.008 - - - - - - - -
Stroke type (vs. bleed)
Infarct - - - - 0.93
(0.32-2.75) 0.902 - - - -
Both - - - - 0.58
(0.37-0.91) 0.018 - - - -

194
Most parsimonious model presented; age, gender and ethnicity were included as common baseline variables. NA: Not applicable. * The Others category for ethnicity was dropped because of the small numbers in this category. † Marital status was excluded from the final multivariate model as spouse was the reference group of the outcome variable. ‡ Exp(B) reported instead of OR.

Page 195 of 308
References
1. Sousa RM, Ferri CP, Acosta D, Albanese E, Guerra M, Huang Y, et al. Contribution of
chronic diseases to disability in elderly people in countries with low and middle incomes:
a 10/66 Dementia Research Group population-based survey. Lancet 2009;374:1821-30.
2. O'Donnell M, Xavier D, Diener C, Sacco R, Lisheng L, Zhang H, et al. Rationale and
design of INTERSTROKE: a global case-control study of risk factors for stroke.
Neuroepidemiology 2010;35:36-44.
3. Anderson CS, Linto J, Stewart-Wynne EG. A population-based assessment of the impact
and burden of caregiving for long-term stroke survivors. Stroke 1995;26:843-49.
4. Haley WE, Allen JY, Grant JS, Clay OJ, Perkins M, Roth DL. Problems and benefits
reported by stroke family caregivers: results from a prospective epidemiological study.
Stroke 2009;40:2129-33.
5. Poulin MJ, Brown SL, Ubel PA, Smith DM, Jankovic A, Langa KM. Does a helping hand
mean a heavy heart? Helping behavior and well-being among spouse caregivers. Psychol
Aging 2010;25:108-17.
6. Roth DL, Haley WE, Wadley VG, Clay OJ, Howard G. Race and gender differences in
perceived caregiver availability for community-dwelling middle-aged and older adults.
Gerontologist 2007;47:721-9.

Page 196 of 308
7. Schulz R, Beach SR. Caregiving as a risk factor for mortality: the Caregiver Health
Effects Study. JAMA 1999;282:2215-9.
8. Gallant MP, Spitze G, Prohaska T. Help or hindrance? How family and friends influence
chronic illness self-management among older adults. Res Aging 2007;29:375–409.
9. Silverman M. Self-managing chronic care: Exploring cultural variations in strategies.
Journal of Cross-Cultural Gerontology 2008;23:1.
10. Pinquart M, Sörensen S. Gender differences in caregiver stressors, social resources, and
health: an updated meta-analysis. Journal of Gerontology 2006;61:33–45.
11. Dewey HM, Thrift AG, Mihalopoulos C, Carter R, Macdonell RA, McNeil JJ, et al.
Informal care for stroke survivors: results from the North East Melbourne Stroke
Incidence Study (NEMESIS). Stroke 2002;33:1028-33.
12. Pinquart M, Sörensen S. Ethnic differences in stressors, resources, and psychological
outcomes of family caregiving: A meta-analysis. The Gerontologist 2005;45:90–106.
13. Fong NP, Wong PK, Lau-Ting C, Devathasan G, Chong PN. Disability, rehabilitation and
after-care of stroke patients after discharge from hospital, Singapore 1983-84. Ann Acad
Med Singapore 1987;16:122-7.
14. Jullamate P, de Azeredo Z, Pául C, Subgranon R. Thai stroke patient caregivers: who they
are and what they need. Cerebrovasc Dis 2006;21:128-33.

Page 197 of 308
15. McCullagh E, Brigstocke G, Donaldson N, Kalra L. Determinants of caregiving burden
and quality of life in caregivers of stroke patients. Stroke 2005;36:2181-6.
16. Haley WE, Roth DL, Howard G, Safford MM. Caregiving strain and estimated risk for
stroke and coronary heart disease among spouse caregivers: differential effects by race and
sex. Stroke 2010;41:331-6.
17. Mackenzie A, Greenwood N. Positive experiences of caregiving in stroke: a systematic
review. Disability and Rehabilitation 2012;17:1413-22.
18. King RB, Hartke RJ, Houle TT. Patterns of relationships between background
characteristics, coping, and stroke caregiver outcomes. Top Stroke Rehabil 2010;17:308-
17.
19. Harris JE, Eng JJ, Miller WC, Dawson AS. The role of caregiver involvement in upper-
limb treatment in individuals with subacute stroke. Phys Ther 2010;90:1302-10.
20. Kwakkel G, Wagenaar RC, Kollen BJ, Lankhorst GJ. Predicting disability in stroke--a
critical review of the literature. Age Ageing 1996;25:479-489.
21. Koh GCH, Chen C, Cheong A, Tai BC, Choi KP, Fong NP, et al. Tradeoffs between
effectiveness and efficiency in stroke rehabilitation. [published online ahead of print
October 6, 2011]. Int J Stroke 2011. DOI: 10.1111/j.1747-4949.2011.00612.x. Accessed
November 7, 2011.

Page 198 of 308
22. Hinojosa MS, Rittman M, Hinojosa R, Rodriguez W. Racial/ethnic variation in recovery
of motor function in stroke survivors: role of informal caregivers. J Rehabil Res Dev
2009;46:223-32.
23. Dixon G, Thornton EW, Young CA. Perceptions of self-efficacy and rehabilitation among
neurologically disabled adults. Clin Rehabil 2007;21:230-40.
24. Gunarathne A, Patel JV, Gammon B, Gill PS, Hughes EA, Lip GY. Ischemic stroke in
South Asians: a review of the epidemiology, pathophysiology, and ethnicity-related
clinical features. Stroke 2009;40:e415-23.
25. Thom TJ. Stroke mortality trends. An international perspective. Ann Epidemiol
1993;3:509-18.
26. Zhang X, Patel A, Horibe H, Wu Z, Barzi F, Rodgers A, et al. Cholesterol, coronary heart
disease, and stroke in the Asia Pacific region. Int J Epidemiol 2003;32:563-72.
27. Singapore Registry of Births and Deaths. Annual Report on Births and Deaths 1970 to
1994. Singapore: Singapore Registry of Births and Deaths; 1995.
28. Venketasubramanian N. Trends in cerebrovascular disease mortality in Singapore: 1970-
1994. Int J Epidemiol 1998;27:15-9.

Page 199 of 308
29. Department of Statistics, Singapore. Population Trends 2007. Singapore: Department of
Statistics, Government of Singapore; 2007.
30. Yeoh BS, Huang S. Foreign domestic workers and home-based care for elders in
Singapore. J Aging Soc Policy 2010;22:69-88.
31. Kong KH, Chua KS, Tow AP. Clinical characteristics and functional outcome of stroke
patients 75 years old and older. Arch Phys Med Rehabil 1998;79:1535-9.
32. Chau PH, Woo J, Kwok T, Chan F, Hui E, Chan KC. Usage of community services and
domestic helpers predicted institutionalization of elders having functional or cognitive
impairments: A 12-month longitudinal study in Hong Kong. J Am Med Dir Assoc 2010.
DOI: doi:10.1016/j.jamda.2010.07.011. Accessed November 6, 2011.
33. Choo WY, Low WY, Karina R, Poi PJ, Ebenezer E, Prince MJ. Social support and burden
among caregivers of patients with dementia in Malaysia. Asia Pac J Public Health
2003;15:23-9.
34. Ministry of Health, Singapore. Singapore’s Health System. Singapore: Ministry of Health,
Government of Singapore; 2007.
35. Elderly and Continuing Care Division, Ministry of Health, Singapore. Healthcare Services
for the Elderly. An information booklet for healthcare professionals. Singapore: Ministry
of Health, Government of Singapore; 2004.

Page 200 of 308
36. Charlson ME, Pompei P, Ales KL, MacKenzie CR. A new method of classifying
prognostic comorbidity in longitudinal studies: development and validation. J Chronic Dis
1987;40:373-83.
37. Shah S, Vanclay F, Cooper B. Improving the sensitivity of the Barthel Index for stroke
rehabilitation. J Clin Epidemiol 1989;42:703-9.
38. Shah S, Muncer S. Sensitivity of Shah, Vanclay and Cooper's modified Barthel Index.
Clin Rehabil 2000;14:551-2.
39. Lee RP, Yu E, Sun S, Liu WT. Living arrangements and elderly care: the case of Hong
Kong. In Who Should Care for the Elderly: An East-West Value Divide. Eds Liu WT &
Kendig H. Singapore University Press, National University of Singapore and World
Scientific. Singapore. 2000. Pages 269–96.
40. Chen SX, Bond MH, Tang D. Decomposing filial piety into filial attitudes and filial
enactments. Asian J Soc Psychol 2007;10:213–3.
41. Chang BH, Noonan AE, Tennstedt SL. The role of religion/spirituality in coping with
caregiving for disabled elders. Gerontologist 1998;38:463-70.
42. Choi G, Tirrito T, Mills F. Caregiver's spirituality and its influence on maintaining the
elderly and disabled in a home environment. J Gerontol Soc Work 2008;51:247-59.

Page 201 of 308
43. Laidlaw K, Wang D, Coelho C, Power M. Attitudes to ageing and expectations for filial
piety across Chinese and British cultures: a pilot exploratory evaluation. Aging Ment
Health 2010;14:283-92.
44. Population Studies Centre, Institute for Social Research. Domestic servants assisting the
elderly in Singapore: current situation and future research recommendations. Ann Arbor,
USA: University of Michigan; 2002.
45. Bergström AL, Eriksson G, von Koch L, Tham K. Combined life satisfaction of persons
with stroke and their caregivers: associations with caregiver burden and the impact of
stroke. Health Qual Life Outcomes 2011;9:1.
46. Jönsson AC, Lindgren I, Hallström B, Norrving B, Lindgren A. Determinants of quality of
life in stroke survivors and their informal caregivers. Stroke 2005;36:803-8.
47. Cheung P, Vasoo S. Ageing Population in Singapore: A Case Study. In Ageing in East
and Southeast Asia, ed. David R. Phillips, 77-104. London, UK: Edward Arnold; 1992.
48. Kua EH, Yong S. Stress of Family carers of the frail elderly: Can day care alleviate the
distress? Malaysian Journal of Psychiatry 1993;2:60-66.
49. Vasoo S, Ngiam TL, Cheung P. Singapore’s ageing population: Social challenges and
responses. In Ageing in the Asia-Pacific Region: Issues, Policies, and Future Trends, ed.
David R. Phillips, 174-193. New York, USA: Routledge; 2000.

Page 202 of 308
50. Wong D. Foreign domestic workers in Singapore. Asian Pac Migr J 1996;1:117-138
51. Chuang KY, Wu SC, Dai YT, Ma AH. Post-hospital care of stroke patients in Taipei: use
of services and policy implications. Health Policy 2007;82:28-36.
52. Tan KS, Wong KS, Venketasubramanian N. Setting priorities in Asian stroke research.
Neurology Asia 2006;11:5–11.
53. Department of Statistics. Household Income Increased in 2011 for All Income Groups.
Singapore. Accessed from http://www.singstat.gov.sg/news/news/press14022012.pdf on 5
May 12.

Page 203 of 308
CHAPTER FIVE: GENERAL DISCUSSION AND CONCLUSIONS
“It’s hard for us to make good policies for the intermediate and long-term care sector without
good-quality objectively-collected data for us to base them on.”
Dr Ling Sing Lin
Ex-Director of the old Elderly and Continuing Care Division, Ministry of Health, Singapore
Introduction
When I am asked by students, colleagues and friends as to why I joined academia, I often
share the following story which will explain the motivation for my PhD thesis research.
When I was still a physician in Ang Mo Kio Thye Hua Kwan Hospital, our local Ministry of
Health would often introduce policies to the ILTC sector and community hospitals which
sometimes baffled us. An example of such a policy was one that was being considered in
2004 which intended to limit the length of stay in community hospitals by termination of
deduction of monies from a patient’s Medisave account2 to pay for their admission after 28
days of stay. The intention of this policy was to incentivize community hospitals to be
efficient in their rehabilitation and discharge planning, and reduce patients’ length of stay.
However, many severely disabled subjects did not have a caregiver and were not be able to
2 Medisave is the name of Singapore’s compulsory medical savings account which can be used to pay for hospitalization fees and recently, cost of management of selected chronic disease at the primary care level. More details are available at website http://mycpf.cpf.gov.sg/CPF/my-cpf/Healthcare/PvdHC2.htm.

Page 204 of 308
return home to care for themselves, and the waiting time for nursing home admission was six
months at that time. Moreover, our multi-disciplinary rehabilitation team felt that the majority
of patients could improve their functional status significantly beyond 28 days of inpatient
stay. At one of our regular 3-monthly meetings with our Ministry of Health, I asked Dr Ling
Sing Lin, then the Director of the now defunct Elderly and Continuing Care Division,
Ministry of Health, for the basis for limiting length of stay to 28 days. Dr Ling is a wonderful
woman and excellent administrator and in her usual thoughtful and kind way, she told me
[paraphrased]: “There is no basis for choosing 28 days. We do not have any raw data from
community hospitals because all their data are in hard copies of patient medical records, and
both the Ministry of Health and community hospital staff do not have the time or the
manpower to extract it. It’s hard for us to make good policies for the intermediate and long-
term care sector without good-quality objectively-collected data for us to base them on.”
What Dr Ling said struck me deeply and suddenly, it dawned on me why research was so
important and how fortunate Singapore was to have administrators in our ministries who
appreciated the need for research evidence to base policy formulation. At that same time, the
then Department of Community, Occupational and Family Medicine (now renamed as the
Saw Swee Hock School of Public Health) had invited me to join their department as a
fulltime academic after teaching there as an adjunct staff for three years. In a sense, these
words by Dr Ling was the key motivating factor which helped me decide to join the
department in 2005 and devote the next decade of my life to research in the ILTC sector,
beginning with the topic and sector I was most familiar with – rehabilitation in community
hospitals.
The next step in my research path was the decision to extract data from all patients admitted
into all community hospitals in Singapore. Fortunately, I had the support of all the Medical
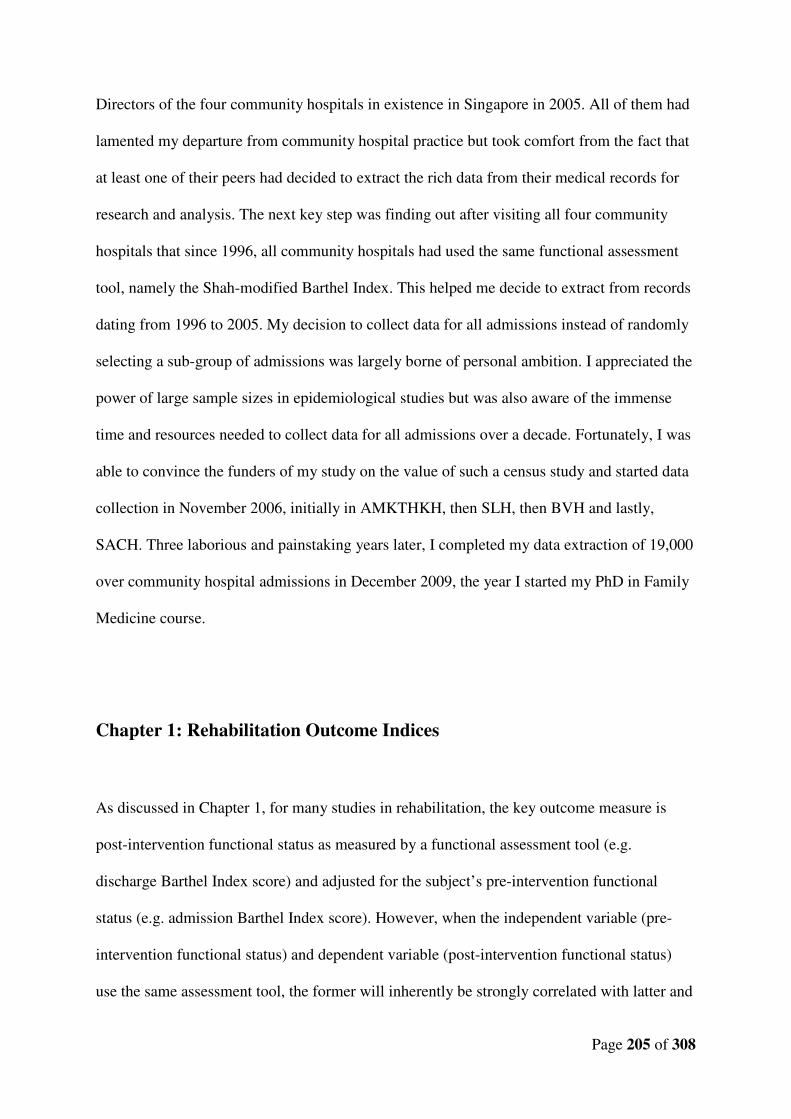
Page 205 of 308
Directors of the four community hospitals in existence in Singapore in 2005. All of them had
lamented my departure from community hospital practice but took comfort from the fact that
at least one of their peers had decided to extract the rich data from their medical records for
research and analysis. The next key step was finding out after visiting all four community
hospitals that since 1996, all community hospitals had used the same functional assessment
tool, namely the Shah-modified Barthel Index. This helped me decide to extract from records
dating from 1996 to 2005. My decision to collect data for all admissions instead of randomly
selecting a sub-group of admissions was largely borne of personal ambition. I appreciated the
power of large sample sizes in epidemiological studies but was also aware of the immense
time and resources needed to collect data for all admissions over a decade. Fortunately, I was
able to convince the funders of my study on the value of such a census study and started data
collection in November 2006, initially in AMKTHKH, then SLH, then BVH and lastly,
SACH. Three laborious and painstaking years later, I completed my data extraction of 19,000
over community hospital admissions in December 2009, the year I started my PhD in Family
Medicine course.
Chapter 1: Rehabilitation Outcome Indices
As discussed in Chapter 1, for many studies in rehabilitation, the key outcome measure is
post-intervention functional status as measured by a functional assessment tool (e.g.
discharge Barthel Index score) and adjusted for the subject’s pre-intervention functional
status (e.g. admission Barthel Index score). However, when the independent variable (pre-
intervention functional status) and dependent variable (post-intervention functional status)
use the same assessment tool, the former will inherently be strongly correlated with latter and

Page 206 of 308
account for most of the variance between independent variables and the dependent variable in
multivariate analysis. Moreover, final functional status as an individual measure is
unidimensional as it does not consider speed of functional recovery or achievement of
rehabilitation potential and focuses on a single end-point in time instead of an episode of
care, both of which are important considerations selecting a measure of quality of care.
Researchers have devised several functional outcome indices that account for baseline
functional status but these indices may have different names even though that they share the
same formula for calculation, creating confusion. Hence, I felt it was important to
systematically review existing literature to (1) determine the names of various rehabilitation
outcome indices used so far, (2) categorize these rehabilitation outcome indices by the
formula used, (3) summarize the details of each paper (i.e. year of study, study population,
country, sample size and ADL measure used), (4) determine the known independent
predictors of these rehabilitation outcome indices, stratified by the index disease for which
they were used for.
Although I found numerous but inconsistently-named rehabilitation indices used throughout
medical literature, there were basically only five main formulas used, of which REs and REy
were the most frequently used indices. Categorization of these five main rehabilitation
indices by same formula allowed classification of papers by rehabilitation indices and
meaningful comparison of study methodology and results. Stratification of independent
predictors of REs and REy identified by primary diagnosis for admission also revealed that
most studies have been on stroke and post-hip fracture arthroplasty patients, and consistent
independent predictors of poorer REs and REy were older age, poorer pre-rehabilitation
functional status and cognitive impairment.
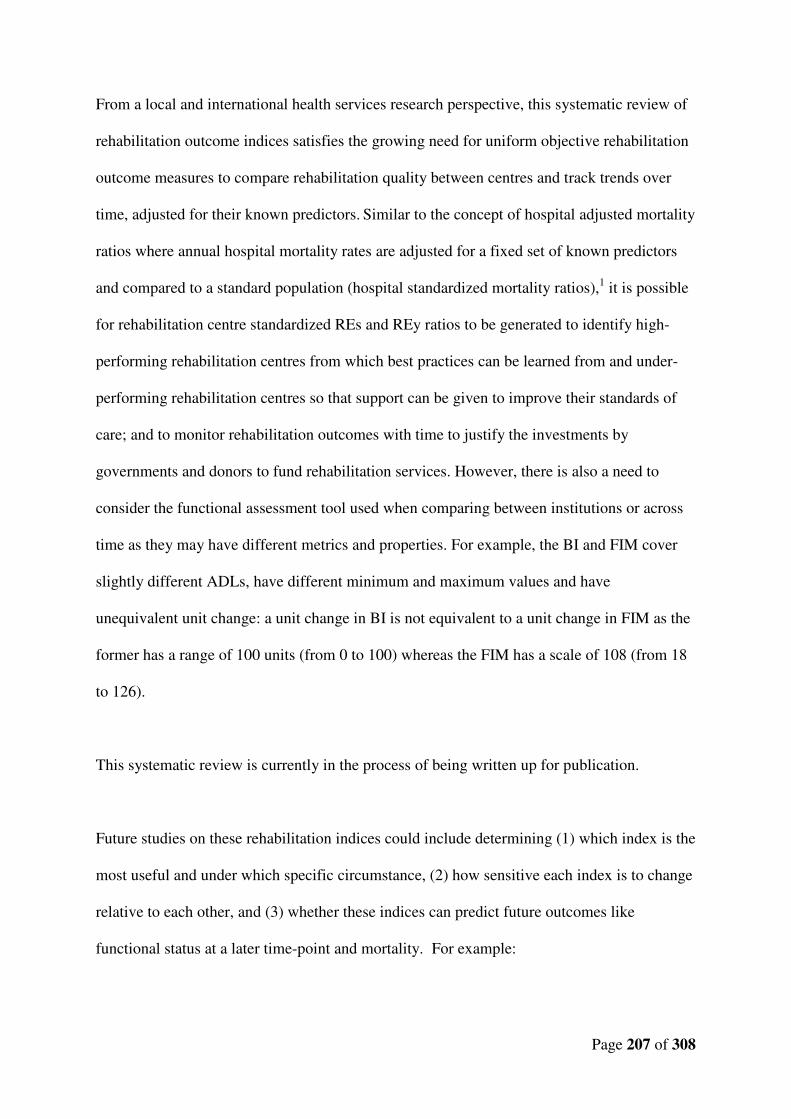
Page 207 of 308
From a local and international health services research perspective, this systematic review of
rehabilitation outcome indices satisfies the growing need for uniform objective rehabilitation
outcome measures to compare rehabilitation quality between centres and track trends over
time, adjusted for their known predictors. Similar to the concept of hospital adjusted mortality
ratios where annual hospital mortality rates are adjusted for a fixed set of known predictors
and compared to a standard population (hospital standardized mortality ratios),1 it is possible
for rehabilitation centre standardized REs and REy ratios to be generated to identify high-
performing rehabilitation centres from which best practices can be learned from and under-
performing rehabilitation centres so that support can be given to improve their standards of
care; and to monitor rehabilitation outcomes with time to justify the investments by
governments and donors to fund rehabilitation services. However, there is also a need to
consider the functional assessment tool used when comparing between institutions or across
time as they may have different metrics and properties. For example, the BI and FIM cover
slightly different ADLs, have different minimum and maximum values and have
unequivalent unit change: a unit change in BI is not equivalent to a unit change in FIM as the
former has a range of 100 units (from 0 to 100) whereas the FIM has a scale of 108 (from 18
to 126).
This systematic review is currently in the process of being written up for publication.
Future studies on these rehabilitation indices could include determining (1) which index is the
most useful and under which specific circumstance, (2) how sensitive each index is to change
relative to each other, and (3) whether these indices can predict future outcomes like
functional status at a later time-point and mortality. For example:

Page 208 of 308
- Is REs and REy also useful in comparing outcomes between centres and with time in
outpatient rehabilitation settings?
- Is Montebello Rehabilitation Factor Score (MRFS) Efficiency or Revised MRFS more
sensitive to change than REy and REs respectively?
- Can REs and REy during inpatient stay predict better functional status one year later or
even survival (i.e. mortality)?
Although these research questions are beyond the scope of this thesis, they are worthy of
further investigation.
Chapter 2: The Socio-demographic and Clinical Profile of Admissions into
Community Hospital in Singapore from 1996 to 2005
In the light of Singapore’s rapidly ageing population, our Ministry of Health expects that the
need for ILTC services will increase exponentially in the future. Community hospitals in
Singapore provide the bulk of intermediate inpatient care and are run by voluntary welfare
organizations. They care for patients who have been discharged from acute hospitals but still
require inpatient rehabilitation. As per Singapore’s Ministry of Health (MOH) guidelines,
community hospitals assist these patients to achieve their optimal functional potential before
being discharged.
While literature exists on community hospitals and inpatient rehabilitation facilities in
Western countries, there is little data on such settings from Asian countries and changes over
time with regards to patient characteristics, medical co-morbidities, and functional status of
patients admitted. The lack of routine data on community hospital activities in Singapore

Page 209 of 308
poses problems when evaluating their role in healthcare delivery. The few existing studies,
mainly from Western countries, demonstrate that there can be significant differences in
casemix, patient profile, and purpose of admission both over time and between community
hospitals in the same region.
Although there have been local studies on determinants of length of stay and discharge-
related issues, to date there have been none investigating the profile of community hospital
patient admissions on a national level in Singapore by hospital or year of admission. Such a
review would be useful for planning and future provision of intermediate care in Singapore
and possibly other countries.
As such, we reviewed the profile and sociodemographic characteristics of all patient
admissions in all community hospitals in existence from 1996 to 2005 and the results were
interesting. Rehabilitation was the main purpose for admission to community hospitals
(88.0%) which reaffirms its main role as an inpatient rehabilitation facility (IRF) in
Singapore. This is quite different from the UK where sub-acute care is the most common
reason for admission to community hospitals and where they also have a higher proportion of
patients admitted for respite care (31%) and a correspondingly lower proportion admitted for
rehabilitation (22%). Unfortunately, in Singapore, only a minority of caregiver support
providers offer respite care. The reduced role of respite care in the Singaporean context is
probably due to limited supply, absence of subsidies for respite care and cultural sensitivities;
in Asian societies, respite care can be culturally taboo due to perceptions of decreased filial
piety when institutionalising the elderly. Nevertheless, there is demand for respite care and
more needs to be done locally to increase the availability and affordability of respite care to
Page 210 of 308
reduce caregiver burden, depression and potentially delay premature institutionalization into
nursing homes.
Another interesting finding in this study was that foreign domestic workers (FDWs) were the
most common primary caregiver in the Singaporean context (33.1%) which is strikingly
different from the UK situation where the spouse was the most common primary caregiver
(31.4%). This observation demonstrated an increasing and persisting trend over the 10 years
studied, suggesting that this will be an enduring local societal phenomenon. It is likely that
shrinking family size, increasing employment rates or greater disposable household incomes
locally have led to decreased availability of family members, leading to our national
dependence on FDWs. Nevertheless, the trend of migrant workers being overrepresented in
long-term care is not a new one in developed countries. Yet, this is usually in the context of
skilled nurses and other allied healthcare professionals working in long-term care institutions;
unlike the Singapore situation where the majority of FDWs are trained in housekeeping and
not nursing or caregiving skills, but are still employed as paid caregivers within the
community. While caregiver training is provided by community hospitals to FDWs prior to
patient discharge, many FDWs encounter significant language and cultural barriers with their
care recipient which increase stress and miscommunication, and is likely to hinder the
effectiveness of caregiver training and the caregiving process itself. Given the
underappreciated role of FDWs in caring for the elderly in Singapore, more studies are
needed on the adequacy of the caregiver training they receive, the effectiveness of these
caregivers on health outcomes of their dependents, the impact of caregiving on the FDW
themselves as well as the sustainability of such arrangements.

Page 211 of 308
Similar to UK and Canada, there was great variability between community hospitals in
Singapore. This is probably because each community hospital is run by voluntary welfare
organisations with different ethos and missions. These differences in missions were to some
extent reflected in the results - for example, Hospital D with its admission criteria focussed
on the poor and needy, saw the highest proportion of patient admissions with lower
socioeconomic status indicators and without primary caregivers. Hospital D also had more
subacute care patient admissions because of the availability of the relevant expertise to
provide a higher level of care when it opened in 2003. Hence, our local doctors should not
adopt a “one size fits all” approach when referring patients to these hospitals but should
instead consider individual needs of the patient in the context of the varying capacities of
each community hospital.
In terms of trends in admissions to Singaporean community hospitals over the 10 year period,
mean age of patient admissions has been increasing steadily, in line with our rapidly ageing
population. It was also interesting to note that the proportion of Malay patients seeking
community hospital admission increased over time, probably reflecting shifting socio-ethno-
cultural norms and increasing openness to inpatient rehabilitation within the Malay
community. The need for heavily subsidized C-class beds also increased significantly from
18.7% in 1996 to 83.5% in 2005, probably reflecting the rising cost of healthcare, the Asian
financial crisis which affected Singapore from 1997 to early 2000s and the Sudden Acute
Respiratory Syndrome (SARS) crisis which halted Singapore’s economy in 2003. The
proportion of stroke cases has been decreasing while those of fractures have been increasing.
As the incidence of stroke and osteoporotic fractures probably increased during the study
period due to population ageing, this trend towards fewer stroke admissions and more
osteoporotic fracture admissions is probably the result of selection bias of patients for

Page 212 of 308
admission into community hospitals as osteoporotic fracture patients are easier to rehabilitate
than stroke patients. This is important from a health services perspective as this suggests that
the proportion of subacute stroke patients deprived of inpatient rehabilitation may be
increasing. However, further research is needed to test this hypothesis. Over ten years,
median length of stay has decreased, suggesting that community hospitals in Singapore are
not in danger of becoming mere long-stay geriatric units, a criticism sometimes levelled at
community hospitals. Mean admission BI scores have also been increasing over the 10 year
period; whether this is a result of changing functional status after acute disabling conditions
or selection of less disabled patients for admission because they are easier to care needs
further research. Nevertheless, mean discharge BI scores were also consistently
correspondingly higher (indicating greater independence) than admission BI scores over the
10 year period, suggesting that Singaporean community hospitals have generally been
successful in rehabilitation to a significant extent. The discharge destination for 73.5% of
patient admissions was patient’s own home and this compares favourably with estimates of
67-76% in UK community hospitals.
This chapter was accepted for publication by the Annals of Academy of Medicine Singapore
on 19 April 2012.
Future studies on this national 10-year dataset of community hospital admission may include
determining profile and sociodemographic characteristics of (1) all admissions for
rehabilitation, again stratified by hospital and year of admission, to specifically compare the
REs and REy between community hospitals and with time, (2) all admissions for
rehabilitation, stratified by principal diagnosis for admission, to specifically compare the
REs and REy between different causes of disability, and (3) all admissions for subacute,

Page 213 of 308
chronic sick and respite care for all community hospitals combined (as the numbers will be
relatively much smaller) to obtain a historical national picture of such levels of care in the
decade studied.
Chapter 3: Predictors and Trade-Offs Between Rehabilitation
Effectiveness and Efficiency in Stroke Rehabilitation
As stroke is the commonest and an important reason for rehabilitation in community
hospitals, I opted to analyze the predictors of inpatient rehabilitation effectiveness and
efficiency of stroke patients in this population for this thesis. Previous studies on REs and
REy have also never examined potential trade-offs between these two rehabilitation indices
which measure two different aspects of rehabilitation quality. As I had completed data
extraction, entry and cleaning for the first two community hospitals which were also the two
largest community hospitals in Singapore during the study period (i.e. AMKTHKH and
SLH), representing 87.5% of nationally available community hospital bed-years during the
study period, I started data analysis on these two community hospitals first. This paper was
published online in International Journal of Stroke (Appendix 7) on 6 Oct 2011. However,
for the purpose of this thesis, I included all four community hospitals and repeated the same
analysis, and the findings were essentially the same.
In concordance to my systematic review of previous literature, this study found that older
age, longer time from stroke onset to rehabilitation, ischemic strokes and dementia were
independently predictive with poorer functional outcomes with inpatient stroke rehabilitation.
I also identified several new factors associated with stroke REs and REy such as gender,

Page 214 of 308
ethnicity and caregiver availability: females were more likely to achieve lower REs than
males and Malays (minority ethnic group) were more likely to achieve lower REs and REy
than Chinese (majority ethnic group), independent of socioeconomic factors. The association
between poorer REs and REy among Malays is likely to be due to ethnic-specific cultural
norms that may negatively influence the rehabilitation process; further research is needed to
test this hypothesis. A surprising finding was that post-stroke patients without caregivers
exhibited better REs and REy than those who had caregivers. It was possible that patients
with caregivers are discharged earlier because doctors assume that such patients can continue
the rehabilitation at home with the help of the caregiver, resulting in lower REs relative to
those without caregivers. However, in our multivariate analysis of independent predictors of
REs and REy, both caregiver availability and length of stay were controlled for; and if this
“shorter length of stay for those with caregivers” hypothesis was true, REy would be higher
and not lower for those with caregivers. Moreover, additional analysis found no association
between length of stay and number of caregivers available (Spearman correlation coefficient,
rs=0.01, p=0.551). Our finding contradicts prevailing opinion that higher levels of social
support are associated with better post-stroke functional recovery. A more likely explanation
is that patients without caregivers were more motivated to participate in rehabilitation
because they had nobody to rely on. Conversely, subjects could have been over-protected by
their caregivers who then experienced reduced motivation to participate in rehabilitation. Our
finding may be unique to the Asian culture where the sense of filial piety is stronger and
caregivers, out of good intentions, may discourage stroke patients from performing ADLs
even when they are capable, inadvertently hindering rehabilitation. It would be useful for
future research to examine if this association between caregiver availability and poorer REs
and REy exists in Western cultures.

Page 215 of 308
I also found trade-off relationships between REs and REy with respect to admission
functional status and length of stay: an increase of 10 in admission BI score predicted an
increase of 3.8% in REs but a decrease of REy by 1.0 per 30 days, and an increase in length
of stay of 2.7 days predicted an increase of 9.1% in REs but a decrease of REy by 2.3 per 30
days. When the ratio of median rank of REs to REy was plotted for each admission BI unit
(where 1.0 denotes no difference between REs and REy), the optimal range of admission BI
scores was 35 to 60; and when the ratio of median rank of REs to REy was similarly plotted
for each day of length of stay, the optimal range of length of stay was 37 to 41 days. The
finding that there were trade-off relationships between REs and REy with respect to
admission functional status and length of stay has major implications on policy formulation
and clinical practice in stroke rehabilitation in Singapore. When I presented my findings at a
local conference in 2010, the Ministry of Health decided to relax the policy of limiting the
length of stay in community hospital by termination of deduction of monies from patients’
Medisave account to pay for their admission after 28 days of stay and became more cognizant
of the trade-off relationship between REs and REy with respect to length of stay.
Future studies on the independent predictors of REs and REy could focus on (1) post hip
fracture surgery patients and (2) geriatric patients (defined as age > 65 years as according to
WHO’s criteria) with principal diagnosis for admission as an independent variable.
Page 216 of 308
Chapter 4: Caregivers Support of Recent Stroke Survivors Admitted for
Rehabilitation in Community Hospitals
I was intrigued by the finding that post-stroke patients without caregivers exhibited better
REs and REy than those who had caregivers, and decided to explore the socio-demographic
profile of stroke patients admitted into community hospital who had caregivers, and the
patient factors associated with caregiver factors such as caregiver availability, number of
potential caregivers available and primary caregiver relationship with stroke patient
(“primary caregiver identity”).
On multivariate analysis, patient factors independently associated with caregiver availability
were older age, female gender, being married, having a religion, higher socio-economic class,
lower admission BI scores and shorter length of stay. Patient factors independently associated
with greater number of potential caregivers were the same for caregiver availability except
length of stay was not associated. With reference to those who had spouse as primary
caregiver, the patient factors independently associated with reliance on children or parent
were older age, female gender, lower socioeconomic status and having mixed hemorrhagic
and ischemic strokes (compared to only having hemorrhagic stroke); the patient factors
independently associated with reliance on other relatives were older age, female gender and
lower socioeconomic status; the patient factors independently associated with reliance on
FDWs were older age, female gender, Chinese compared to minority ethnicities, higher
socioeconomic class and lower admission BI scores.
In our urban multi-ethnic Asian population, factors associated with both caregiver availability
and greater number of caregivers was largely similar to predictors of greater social support in

Page 217 of 308
Western countries. However, surprisingly, female stroke patients were more likely to have a
caregiver and a larger number of potential caregivers, independent of age of stroke patient. A
possible explanation is that women generally have greater social resources and are better at
mobilizing social resources than men and hence, are more likely to have caregivers. Another
possible and more intriguing possibility is that there may be differences in the degree of filial
piety of children for fathers and mothers. Traditionally, filial piety in Asian cultures is
engendered with male adult children demonstrating greater filial attitudes but lesser filial
behaviours compared to female adult children. It is possible that in the context of inter-
generational reciprocity in Singapore, adult children may in turn be more willing to care for
their mothers than their fathers as mothers are often the parent providing direct nurturing care
to children than fathers. However, this remains a hypothesis to be tested further.
Interestingly, having a religion was also independently associated with caregiver availability
and number of potential caregivers. Explanations for these associations are likely to be
complex, especially in our local context where the major religions (Buddhism, Islam and
Christianity) encourage fecundity and extended families living within the same household,
Asian norms of filial piety are prevalent and religious values may be undergirding the
phenomenon of filial piety in Asian societies.
Ethnic differences also influence relationship of caregiver to stroke patient in our study
population: although Malays were more likely to be cared for by their child or parent instead
of their spouses than Chinese, Malays were less likely to rely on foreign domestic workers as
primary caregivers than Chinese (independent of socioeconomic status), in keeping with
other local studies. In the Malay culture and Islamic faith, it is considered a blessing to not
only care for both parents, but also to alleviate the burdens of parents in their later years.

Page 218 of 308
Hence, Malay children are more likely to view it as their responsibility to care for their
disabled parent than for their other well parent to do so. This may also explain why Malays
are less likely to employ a FDW to care for their disabled parent and prefer to perform their
caregiver role themselves.
While 82-93% of stroke patients in Western studies depended on either their spouse or first-
degree relatives as caregivers, only 49.2% of patients in our study did so. Instead, two-fifths
of primary caregivers of stroke survivors in Singapore were FDWs and greater functional
dependency was independently associated with greater likelihood of the stroke survivor being
cared for by a FDW than relations. Such trends are not unique to Singapore. The use of
foreign maids in the care of elderly patients with stroke has become the norm in many Asian
cities, such as in Taiwan, Hong Kong and Malaysia. Even in Western countries, the use of
hired help (e.g. nursing aides, home help staff) to care for stroke survivors is also expected to
rise, especially in urbanized areas where similar socio-demographic transitions are also
occurring. Nevertheless, employing a FDW is expensive and is illustrated by the strong
association between socioeconomic status and primary caregiver identity, with stroke patients
from a higher socioeconomic status having a FDW are their primary caregiver. This study
also reinforces our findings from the study in Chapter 2 that there is a need for research on
the adequacy of training and skill levels of FDW in the light of their increasing role as stroke
caregivers in Singapore.

Page 219 of 308
Other Future Plans for Community Hospital Dataset
Currently, there are plans underway to further (1) improve the database, (2) link the database
to other national registries and (3) extend the database.
(1) Improving the Database
I have begun to collect (1) depression data from all 19,000 over patient admissions and (2)
hip surgery details for the subset of patients admitted for post hip fracture rehabilitation. A
copy of the additional data collection form is attached as Appendix 8 to this chapter. I hope
to repeat the analysis to test if clinically-diagnosed depression is an independent predictor of
REs and REy, and to add depression as an independent variable in future analyses. With
additional hip surgery details, I hope to better describe the subset of post hip fracture
rehabilitation patients in future publications.
(2) Linking the Database
I am also in discussion with our Ministry of Health to link my database to our National Death
Registry to capture date and cause of death of all subjects. Such linkage will allow me to
determine the median survival of acutely disabled persons (e.g. from stroke), the independent
predictors of survival (including their relative hazard ratios) and cause-specific mortality
risks. Another impetus to link my dataset with Singapore’s National Death Registry is related
to Singapore’s national long-term care disability insurance scheme called ElderShield.
Singapore is one of few countries after Japan, Germany and Israel to have a long-term care
disability insurance scheme to contain the escalating healthcare cost of disabled older adults.2

Page 220 of 308
ElderShield was first launched by the Ministry of Health in September 2002 as an affordable
severe disability insurance scheme which provides basic financial protection to those who
need long term care. It provides a monthly cash payout for a limited period to help pay the
out-of pocket expenses for the care of severely disabled persons.3 All Singaporeans and
Permanent Residents (PRs) who are Central Provident Fund (CPF, Singapore’s compulsory
retirement saving account) members are automatically covered under ElderShield when they
turn 40 years old, unless they opt out of the scheme. To qualify for ElderShield payout,
members must be unable to do at least 3 out of 6 of the following ADLs after maximizing
their functional recovery by rehabilitation: washing, dressing, feeding, toileting, mobility and
transferring. As of 2007, the monthly payout is $400 and the maximum payout period is 6
years (72 months). About 30% of ElderShield claims are for a principal diagnosis of stroke.4
A paper by Slot et al based on stroke data from the UK reported that the median survival of
patients who were fully dependent after stroke was 6 years.5 If we extrapolated this to
ElderShield, about half of dependent elderly Singaporean will outlive their basic ElderShield
payout after 6 years, leaving this group of stroke survivors and their families in financial
difficulties as the former will not be in a position to be re-employed. Unfortunately, the
functional measure used in Slot et al’s study was the Modified Rankin Scale which is specific
for stroke6 and ElderShield payouts covers all causes of disability. Currently, the survival of
disabled Singaporeans immediately after onset of acute disabling condition, stratified by
number and type of ADLs disabled and degree of disability for each ADL, is unknown. By
linking my database to our National Death Registry, I will be able to:
(a) Determine the survival of acutely disabled patients for a variety of primary causes of
disability by number, type and severity of ADL disabilities for Singapore;

Page 221 of 308
(b) Identify the socio-demographic and clinical predictors of survival in acutely disabled
patients for a variety of primary causes for disability;
(c) Determine the survival of acutely disabled persons at current ElderShield payout
criteria;
(d) Calibrate the disability cut-off for ElderShield payout to cover a pre-specified
proportion of recipients till death by number, type and degree of disability of ADLs assessed;
(e) Propose an evidence-based graduated schedule of ElderShield payouts founded upon
life expectancy at different degrees of ADL disability to better meet the financial needs and
life expectancy of disabled Singaporeans.
To achieve equivalence between Shah-modified Barthel Index scores in my database and
current ElderShield Disability Levels and payout cut-offs, I have proposed a conversion
system detailed in Appendix 9.
(3) Extending the Database
As the medical records of all community hospitals are still not fully computerized and only
BVH and SLH are partially computerized, I hope to apply for a research grant to extend data
collection of all admissions to community hospitals for another 7 years (from 2006 to 2012),
this time including Ren Ci Community Hospital which opened in December 2008.7 This will
allow longer tracking of national trends in socio-demographic profile and rehabilitation
outcomes of patients admitted into community hospitals, and test and compare hospital-
standardized REs and REy ratios between community hospitals.

Page 222 of 308
Lastly, as I am currently conducting a study to determine the cost of care of newly disabled
stroke survivors in their first post stroke year at different degrees of disability (funded by a
Ministry of Health Health Services Research Grant), I also hope to triangulate the results of
this study with death data from my database to estimate the average total cost of care from
disability onset to death in order to assess whether the ElderShield payout of $400 per month
for a maximum period of 6 years is sufficient for post-stroke patients per lifetime.
Summary
Although there are many inconsistently-named rehabilitation outcome indices which
incorporate pre and post functional status throughout medical literature, there are five main
formulas used, of which rehabilitation effectiveness (REs) and rehabilitation efficiency (REy)
are most frequently used. Based on a national dataset of all patient admissions into all
inpatient rehabilitation facilities (called community hospitals) in existence (n=4) in Singapore
from 1996 to 2005, rehabilitation was the main purpose for admission to community hospitals
(88.0%). Temporal trends noted during this 10-year period included an increasing reliance on
FDWs as primary caregivers, increasing mean age, increasing proportion of Malays,
increasing need for heavily subsidized beds, decreasing proportion of stroke and increasing
proportion of hip fractures as principal diagnosis for admission, decreasing median length of
stay, and increasing admission and discharge functional independence. Based on all stroke
patients admitted into community hospitals in Singapore during the 10-year study period, the
factors independently associated with poorer REs and REy were female gender, older age,
Malay vs. Chinese ethnicity, caregiver availability, longer time from stroke onset to
rehabilitation, ischemic strokes and dementia. There were also trade-off relationships

Page 223 of 308
between REs and REy with respect to admission functional status and length of stay: an
increase of 10 in admission BI score predicted an increase of 3.8% in REs but a decrease of
REy by 1.0 per 30 days; and an increase in length of stay of 2.7 days predicted an increase of
9.1% in REs but a decrease of REy by 2.3 per 30 days. When the ratio of median rank of REs
to REy was plotted for each admission BI unit and number of days spent in hospital (where
1.0 denotes no difference between REs and REy), the optimal range of admission BI scores
was 35 to 60 and the optimal range of length of stay was 37 to 41 days. Lastly, social factors
such as age, gender, religion, ethnicity and socioeconomic status of recent stroke survivors
are associated with caregiver availability, number of potential caregivers and/or primary
caregiver identity in a multi-ethnic Asian society.
Conclusions
This thesis was based on a national dataset of all admissions to all community hospitals in
Singapore from 1996 to 2005 which has yielded important findings. For example, I found that
there was an increasing reliance on FDWs as primary caregivers and an increasing need for
heavily subsidized beds which have significant implications for health policy and service
planning, especially in the light of Singapore’s rapidly ageing population where the national
prevalence of disability is expected to increase in the next few decades. I also found that there
were trade-off relationships between REs and REy with respect to admission functional status
and length of stay; and the optimal range of admission BI scores was 35 to 60 BI units and
optimal range of length of stay was 37 to 41 days for Singapore community hospitals. These
findings have important policy and clinical practice implications when admission functional
status and length of stay are limited to maximize REy which may occur at the expense of

Page 224 of 308
REs. Stroke patients, caregivers, family physicians working in community hospitals,
policymakers and the public must recognize the trade-off between rehabilitation effectiveness
and efficiency, and arrive at a consensus on the relative value they place on each outcome
measure when formulating policies on admission functional status and length of stay during
sub-acute stroke rehabilitation. The national community hospital dataset has potential for
further analyses and I hope it will continue to yield significant and important findings.

Page 225 of 308
References
1. Jarman B, Gault S, Alves B, et al. Explaining differences in English hospital death rates
using routinely collected data. BMJ 1999;318:1515-20.
2. Koh GCH. National long term care severe disability insurance in Singapore. Older
persons in Southeast Asia (Book). Arifin EN, Ananta A(eds). Institute of Southeast Asian
Studies (Singapore). 2009. Pages 97-115.
3. Ministry of Health. ElderShield. Costs and Financing – Schemes and Subsidies. Accessed
from
http://www.moh.gov.sg/content/moh_web/home/costs_and_financing/schemes_subisdies/
ElderShield.html on 9 Dec 11.
4. Wong H. ElderShield Experience 2002-2007. MOH Information Paper 2007/21.
Accessed from
http://www.moh.gov.sg/content/dam/moh_web/Publications/Information%20Papers/2007
/ESH_Experience_2002-2007.pdf on 9 Dec 11.
5. Slot KB, Berge E, Dorman P, Lewis S, Dennis M, Sandercock P, on 3 behalf of the
Oxfordshire Community Stroke Project, the International Stroke Trial (UK), and the
Lothian Stroke Register Collaborative Groups. Impact of functional status at six months

Page 226 of 308
on long term survival in patients with ischaemic stroke: prospective cohort studies. BMJ
2008;336(7640):376-9.
6. mRS International. Modified Rankin Scale. Accessed from http://www.rankinscale.org/
on 9 Dec 11.
7. Ren Ci Hospital. Services. Community Hospital. Accessed from
http://www.renci.org.sg/Services/CommunityHospital.aspx on 8 Dec 11.

Page 227 of 308
Appendix 1. Definition of Data Variables Extracted
Socio-Demographic Variables
S/No. Item Number Notes
1. Name of Community Hospital:
• SLH: St Luke’s Hospital (for the Elderly).
• AMKH: Ang Mo Kio (Community) Hospital.
• SACH: St Andrew’s Community Hospital.
• BVH: Bright Vision Hospital.
2. State Serial Number of Visit for This Admission:
• Only admissions after 1 Jan 1996 will be entered into the study.
• Enter 1st if the patients has been admitted to hospital once.
• If patient has been admitted to the same hospital more than once, then state which admission it is (e.g. 1st, 2nd, 3rd, etc).
• Create one Data Collection Form (DCF) for each admission.
3. Class of Bed:
• A: Single bed.
• B1: 4-bedded.
• B2+: 6-bedded (airconditioned).
• B2: 6-bedded (non-airconditioned).
• C: 8-bedded.
4. Means Test Category:
• Means test was made compulsory for all community hospital from 2002 only.
• Hence, enter “not done” if patient was admitted before implementation of means testing in respective hospital.
• Also enter “not done” if means-testing was still not done after 2002.
5. Ethnicity:
• Enter accordingly.
6. Gender:

Page 228 of 308
• Enter accordingly.
7. Religion:
• Enter accordingly.
• Leave blank if not recorded.
8. Type of Hospitalisation: This refers to the chief aim for admission of patient. For example:
• Rehabilitation: such patients usually stay in community hospitals until they have plateaued in their rehabilitation recovery and are discharged into the community.
• Chronic Sick: Otherwise known as Continuing Care. Such patients usually have intensive nursing or medical needs that cannot be provided at home. They usually stay in the chronic sick unit (CSU) of the community hospital until they pass away.
• Respite: Otherwise known as Short Stay. Respite care is to give caregivers a break; no rehabilitation is given during short stay (usually a fortnight to 1-2 months)
• Sub-Acute Care: This type of admission only existed from 2002 onwards. Enter this option only if stated so in the case-notes.
• Social: This option is for admissions for social reasons (e.g. carer stress, family crisis, etc).
• Others: This option is for other types of hospitalisation which do not fall under the above categories. Please use this category sparingly.
9. Date of Birth:
• In day-day, month-month, year-year-year-year format.
• For example: 1st May 2005 is entered as 01/05/2005.
• If only the year of birth is known (yyyy), enter the date of birth as 01/07/yyyy.
10. Date of Admission:
• Refers to date of admission into community hospital (NOT restructured hospital).
• Enter in dd/mm/yyyy format.

Page 229 of 308
11. Date of Discharge:
• Refers to date of discharge from community hospital (NOT restructured hospital).
• Enter in dd/mm/yyyy format.
12. PRIMARY Diagnosis for Admission:
• Only ONE diagnosis can be entered. Enter NA for the other options. For example, if the primary diagnosis is stroke (a), then enter NA for Fracture (b), Amputation (c) and Others (d).
• Preceding hospital discharge summary and community hospital discharge summary should be reviewed to confirm PRIMARY diagnosis for admission into community hospital.
• The PRIMARY diagnosis is the diagnosis that required patient to be admitted for in-patient rehabilitation.
Stroke:
• Please enter if infarct or haemorrhagic.
• If both are present (e.g. infarct with haemorrhagic conversion, please enter “Both”).
• Definition of stroke (WHO criteria): Rapidly developed clinical signs of focal disturbance of cerebral function lasting more than 24 hours (or leading to death) with no apparent cause other than vascular origin, including sub-arachnoid and sub-dural haemorrhages.
If patient’s primary diagnosis is stroke &has hemiplegia, the co-morbid conditions table must reflect “hemiplegia”.
Fracture:
• Please enter if femoral, vertebral or others. If others, please state site of fracture.
• If there is more than one fracture, please enter main disabling fracture, followed by other fracture details under Others. If a patient has both femoral and vertebral fractures, the femoral fracture should be considered as the main disabling fracture.
• Examples of femoral fractures: neck-of-femur fractures (NOF #), inter-trochanteric fractures (IT #), shaft-of-femur fractures, etc).

Page 230 of 308
Lower limb amputation:
• Please enter level of lower limb amputation [e.g. forefoot amputation, below-knee amputation (BKA), above-knee amputation (AKA) and others].
• If patient has more than one amputation, please indicate more than one option. For example, if a patient has left BKA and right AKA, enter AKA and BKA. If a patient has bilateral BKA, shade BKA and enter another BKA under Others.
If patient has an amputation that is NOT due to trauma, then his co-morbid conditions should reflect “peripheral vascular disease”. If patient is diabetic, then he has “end-organ damage” as well.
Others:
• Please state the main diagnosis requiring inpatient rehabilitation in the community hospital.
• Examples include sepsis (eg. pneumonia, urinary tract infections, post-surgery).
• You may enter more than one diagnosis but be specific and logical.
13. Date of Onset of PRIMARY Diagnosis:
• This refers to the date of onset of event related to PRIMARY Diagnosis.
• Enter in dd/mm/yyyy format. Example:
• Stroke: enter the date of onset of neurological deficit. If the date of stroke is not known, then enter date of diagnosis of stroke.
• Fracture: enter the date of fracture. If the date of fracture is not known, then enter date of diagnosis of fracture.
• Amputations: enter the date of operation for amputation. If the patient has a forefoot amputation that was revised later to a BKA or AKA, enter the date of the latest operation before admission to community hospital.
• Others: enter the date of onset of symptoms that led to pre-ceding hospital admission.

Page 231 of 308
Social History
14. No. of immediate family members (eg. spouse, children, grandchild, sibling if patient is single) aged ≥ 18 years who are alive and physically able to care for patient: Inclusion criteria:
• Aged 18 years and above;
• Physically able to care for patient (i.e. no medical or physical impairment that renders family member unfit for care-giving);
• If patient is married, this item refers to spouse and children but excludes siblings;
• If patient is unmarried, this item refers only to siblings.
15. Total number of adults aged ≥ 18 years living with patient (including maid) and physically able to care for patient: Inclusion criteria:
• Aged 18 years and above;
• Persons living with patient;
• Includes maids, all relatives, friends, house-mates, etc;
• Physically able to care for patient.
16. Marital status of patient during admission:
• Enter accordingly.
17. Primary person giving physical care (i.e. primary caregiver):
• Enter only one option.
• This refers to person who physically cares for patient most of the time.
• If there is a maid within the household, the main person giving direct physical care is usually the maid, even if the relative is also listed as a caregiver (unless it is specifically stated that the relative provides most of the physical care).
18. Discharge Destination:
• This refers to the final discharge destination which the patient will reside for the long-term after discharge from the community hospital.
• If, for example, the patient is awaiting nursing home but was discharged home first, the discharge destination should be nursing home.
• Acute hospitals: Alexandra Hospital (AH), National University Hospital (NUH), Singapore General Hospital

Page 232 of 308
(SGH), Tan Tock Seng Hospital (TTSH), Changi General Hospital (CGH), Mt Alvernia Hospital (MAH), Gleneagles Hospital (Glen Hosp), Mt Elizabeth Hospital (MEH), East Shore Hospital (ESH).
• Check type of nursing/sheltered home patient is discharged to if unsure before entry.
• Enter name of nursing/sheltered home or acute/community hospital.
• Enter AOR discharge if patient discharged himself.
• Enter Others if discharge destination does not fall into other categories and write down name of discharge destination.
• If patient passed away while in community hospital, please enter (1) date of death & (2) primary cause of death.

Page 233 of 308
Functional Data
22 (& 33).
Date of Admission & Discharge of Barthel Index (BI) Score:
• Enter in dd/mm/yyyy format.
• If there is only one BI scoring done during stay, please enter scores in the closest section. For example, if only one BI was done on 19 Jan 04 for a patient who was admitted from 2 Jan 04 to 13 Feb 04, then enter the BI score under “Admission BI Score”.
• If there are more than one BI scoring done during the admission, then choose the first BI as the Admission BI and the last BI as the Discharge BI.
23 to 32 (and 34 to 43).
Barthel Index Items:
• Refer to Shah-Modified Barthel Index for description of each category.
Please note the following:
• Personal hygiene refers to washing hands/face, combing hair, cleaning teeth, shaving or applying make-up.
• Dressing refers to both upper and body dressing. Choose the sub-type of dressing which is functionally worse.
• Toileting refers to getting on and off the toilet, fastening and unfastening clothes, prevention of soiling of clothes and use toilet paper. If necessary, the patient may use bad pan or commode, or urinal at night.
• Bowel and urinary control & management: refers to continence. Facilitatory techniques in bowel control refer to insertion of laxative suppositories. A person dependent on indwelling urinary catheters or diapers scores zero.
• Transferring: Refers to moving from chair to bed, lying down, sitting up again and coming to a sitting position on the side of the bed and transferring back onto chair safely.
• Ambulation: For a patient to score 15, he must be able to wear orthoses (if required) and walk 50 metres without help or supervision. The patient may be able to use crutches, canes or a walking frame. If the patient is limited by heart failure or chronic obstructive lung disease (COLD) and is unable to walk 50m without help, he cannot score 15.
• Wheelchair ambulation: This is linked to Mobility. This option is only entered if (1) the patient scores zero under Mobility and (2) has been trained in wheelchair mobility. If the patient cannot propel himself for short distances on a flat surface, he scores zero.
• Stairs: If a patient is dependent in Ambulation or Wheelchair (i.e. scores zero for either items), he cannot climb stairs and hence scores zero for Stairs.
Refer to written notes by physiotherapists and occupational therapists (1) to check that BI scores concur with recorded Shah modified Barthel Index scores and (2) for missing sub-scores, to enter an estimated sub-score that best reflects the written notes.

Page 234 of 308
Co-Morbid Conditions
44 to 58.
Does the patient have any of the following illnesses?
• Enter only if present.
• You may choose more than one option.
• Problem lists found in preceding hospital and community hospital discharge summaries should be reviewed to determine if any of the listed diagnos(e)s is/are present.
• It would be faster if one familiarises herself to the options available.
Synonyms:
• AIDS: HIV.
• Stroke: CVA, ICH (intra-cranial haemorrhage), SDH (sub-dural haemorrhage), SAH (sub-arachnoid haemorrhage).
• Chronic lung disease: COLD (chronic obstructive lung disease), COPD (chronic obstructive pulmonary disease).
• Heart failure: CCF (congestive cardiac failure), CHF (congestive heart failure), LVF (left ventricular failure), RVF (right ventricular failure), LHF (left heart failure), RHF (right heart failure), etc.
• Autoimmune disease: SLE (Systemic lupus erythromatosus, rheumatoid arthritis, AS (anklylosing spondylitis), psoriasis, (AIHA) auto-immune haemolytic anaemia, (SS) Sjogren’s syndrome), etc.
• Dementia: AD (Alzheimer’s dementia), MID (multi-infarct dementia), VaD (vascular dementia), dementia of Lewy Body subtype, fronto-temporal dementia, etc.
• Hemiplegia: enter only if patient has hemiparesis (weakness on one side of the body).
• Leukaemia: ALL (acute lymphoblastic leukaemia, AML (acute myeloid leukaemia, CLL (chronic lymphoblastic leukaemia), CML (chronic myeloid leukaemia), etc.
• Malignant lymphoma: Hodgkin’s lymphoma, non-Hodgkin’s lymphoma, Burkitt’s lymphoma, etc.
• Myocardial infarction (MI): AMI (acute myocardial infarction). Enter only if patient has a MI in preceding hospital.
• Peripheral vascular disease (PVD): lower limb ischaemia, lower limb vascular insufficiency, gangrene, etc.
• Peptic ulcer disease (PUD): includes gastritis, duodenitis, gastric ulcer, duodenal ulcer, etc.
• Hypertension: HPT or HT or ↑BP.
• Hyperlipidaemia: ↑lipid., ↑chole(sterol), ↑LDL, ↑TG(trigylceridaemia), etc.
• Ischaemic heart disease (IHD): stable angina, unstable angina, CVD (coronary vascular disease), etc.
A person with hemiplegia from stroke must have both CVA and Hemiplegia entered. A diabetic with AMI, CVA, PVD or IHD must have target-organ damage. A patient with AMI must also have IHD.

Page 235 of 308
59. Diabetes Mellitus:
• Enter none if absent.
• If present, enter whether end-organ damage present or not. End organ damage is said to have occurred if the following are present along with diabetes mellitus:
• IHD
• CVA
• PVD
• Diabetic retinopathy
• Diabetic nephropathy (protein in the urine)
60. Liver Disease:
• Enter none if absent.
• If present, enter degree of severity. Follow Child-Pugh’s criteria (see table below).
Child-Pugh Classification for Liver Disease
Parameter 1-point 2-points 3-points
Bilirubin (mg/dl) <2 2-3 >3
Albumin (g/dl) >3.5 2.8-3.5 <2.8
Increase in Prothrombin Time (PT) (s)
1-3 4-5 >6
Ascites None Mild Moderate or Severe
Encephalopathy None Mild Moderate or Severe
• Mild: 5-6 points
• Moderate: 7 – 9 points
• Severe: 10-15 points.
61. Renal Disease:
• Enter none if absent.
• If present, enter degree of severity. The degree of renal impairment is defined by the best recorded serum creatinine level:
• Mild: serum creatinine = 140 to 200umol/l.
• Moderate: serum creatinine = 200-500umol/l.
• Severe: serum creatinine >500umol/l or on dialysis.
62. Malignant Solid Tumour:
• Stage 1, 2, and 3 cancers are non-metastatic.
• Stage 4 cancers are metastatic.

Page 236 of 308
Appendix 2. Shah Modified Barthel Index
No.
Activities of Daily
Living (ADL)
Scale Points Points
1. Personal Hygiene
The patient is unable to attend to personal hygiene and is dependent in all aspects.
0
Assistance is required in all steps of personal hygiene.
1
Some assistance is required in one or more steps of personal hygiene.
3
Patient is able to conduct his/her own personal hygiene but requires minimal assistance before and/or after the activity.
4
The patient can wash his/her hands and face, comb hair, clean teeth and shave. A male patient may use any kind of razor but must insert the blade, or plug in the razor without help, as well as retrieve it from he drawer or cabinet. A female patient must apply her own make-up, if used, but need not braid or style her hair.
5
2. Bathing
Total dependence in bathing self. 0
Assistance required in all aspects of bathing.
1
Assistance required with either transfer to shower/bath or with washing or drying; including inability to complete a task because of condition or disease, etc.
3
Supervision is required for safety in adjusting the water temperature, or in the transfer.
4
The patient may use a bath tub, a shower, or take a complete sponge bath. The patient must be able to do all the steps of whichever methods is employed without another person being present.
5
3. Dressing The patient is dependent in all aspects of dressing and is unable to participate in the activity.
0
The patient is able to participate to some degree, but is dependent in all aspects of dressing.
2
Assistance is needed in putting on, and/or removing any clothing.
5
Only minimal assistance is required with fastening clothing, such as buttons, zips, bra, shoes, etc.
8
The patient is able to put on, remove, and fasten clothing, tie shoelaces, or put on, fasten, remove corset, braces, as prescribed.
10
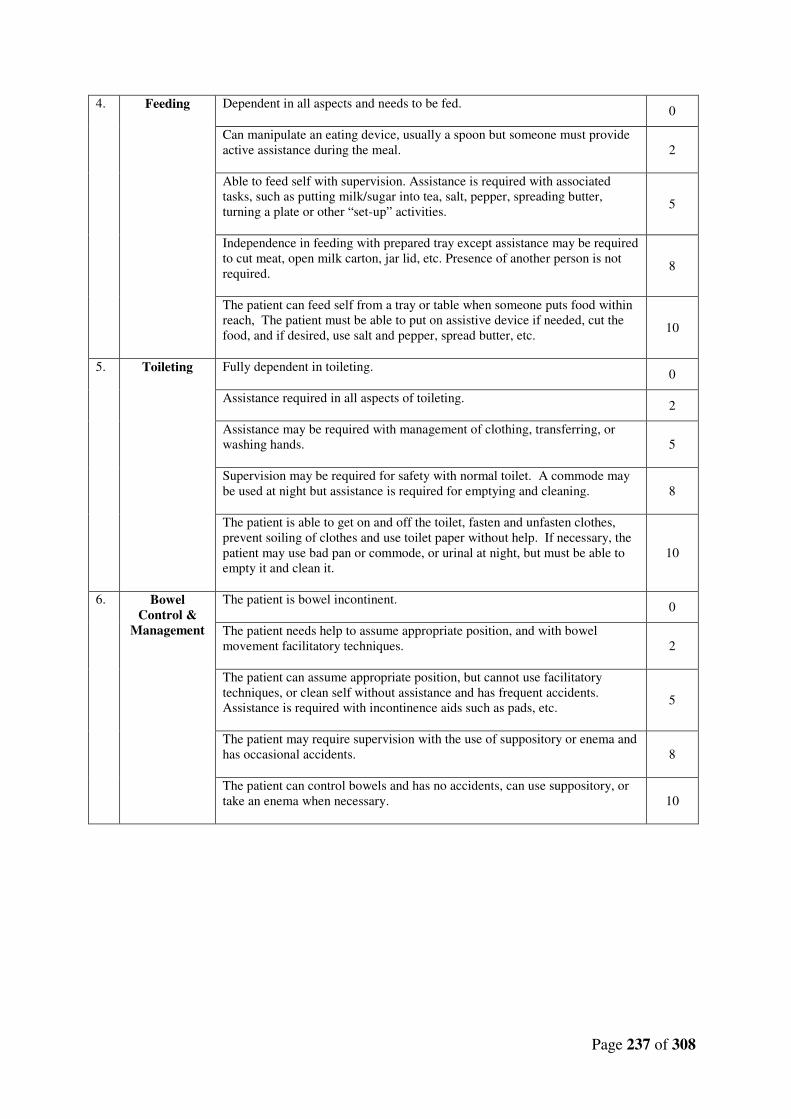
Page 237 of 308
4. Feeding Dependent in all aspects and needs to be fed.
0
Can manipulate an eating device, usually a spoon but someone must provide active assistance during the meal.
2
Able to feed self with supervision. Assistance is required with associated tasks, such as putting milk/sugar into tea, salt, pepper, spreading butter, turning a plate or other “set-up” activities.
5
Independence in feeding with prepared tray except assistance may be required to cut meat, open milk carton, jar lid, etc. Presence of another person is not required.
8
The patient can feed self from a tray or table when someone puts food within reach, The patient must be able to put on assistive device if needed, cut the food, and if desired, use salt and pepper, spread butter, etc.
10
5. Toileting Fully dependent in toileting.
0
Assistance required in all aspects of toileting.
2
Assistance may be required with management of clothing, transferring, or washing hands.
5
Supervision may be required for safety with normal toilet. A commode may be used at night but assistance is required for emptying and cleaning.
8
The patient is able to get on and off the toilet, fasten and unfasten clothes, prevent soiling of clothes and use toilet paper without help. If necessary, the patient may use bad pan or commode, or urinal at night, but must be able to empty it and clean it.
10
6. Bowel Control &
Management
The patient is bowel incontinent.
0
The patient needs help to assume appropriate position, and with bowel movement facilitatory techniques.
2
The patient can assume appropriate position, but cannot use facilitatory techniques, or clean self without assistance and has frequent accidents. Assistance is required with incontinence aids such as pads, etc.
5
The patient may require supervision with the use of suppository or enema and has occasional accidents.
8
The patient can control bowels and has no accidents, can use suppository, or take an enema when necessary.
10

Page 238 of 308
7. Bladder Control &
Management
The patient is dependent in bladder management, is incontinent, or has indwelling catheter.
0
The patient is incontinent but is able to assist with the application of an internal or external device.
2
The patient is generally dry by day and not at night, and needs some assistance with the devices.
5
The patient is generally dry by day and night, but may have an occasional accident, or need minimal assistance with internal or external devices.
8
The patient is able to control bladder day and night, and/or is independent with internal or external devices.
10
8. Transferring
Unable to participate in transfer. Two attendants are required to transfer the patient with or without a mechanical device.
0
Able to participate but maximum assistance of one other person is required in all aspects of the transfer.
3
The transfer requires the assistance of one other person. Assistance may be required in any aspect of the transfer.
8
The presence of another person is required either as a confidence measure or to provide supervision for safety.
12
The patient can safely approach the bed in a wheelchair, lock the brakes, lift the footrests, move safely to bed, lie down, come to a sitting position on the side of the bed, change the position of the wheelchair, transfer back into it safely. The patient must be independent in all phases of this activity.
15
9a. Mobility (Ambulation)
Dependent in ambulation.
0
Constant presence of one or more assistants is required during ambulation.
3
Assistance is required with reaching aids and/or their manipulation. One person is required to offer assistance.
8
The patient is independent in ambulation but unable to walk 50 metres without help, or supervision is needed for confidence or safety in hazardous situations.
12
The patient must be able to wear braces if required, lock and unlock these braces, assume standing position, sit down, and place the necessary aids into position for use. The patient must be able to use crutches, canes or a walking frame, and walk 50 metres without help or supervision.
15

Page 239 of 308
9b. Wheelchair Ambulation
[Only use this
item if the patient scored
‘0’ for mobility
(ambulation), and then only if the patient
has been trained in wheelchair
management]
Dependent in wheelchair management.
0
Patient can propel self short distances on flat surfaces, but assistance is required for all other steps of wheelchair management.
1
Presence of one person is necessary and constant assistance is required to manipulate chair to table, bed, etc.
3
The patient can propel self for a reasonable duration over regularly encountered terrain. Minimal assistance may still be required in “tight corners”.
4
To propel wheelchair independently, the patient must be able to go around corners, turn around, manoeuvre the chair to a table, bed, toilet, etc. The patient must be able to push a wheelchair at least 50 metres.
5
10. Stairs
The patient is unable to climb stairs.
0
Assistance is required in all aspects of stair-climbing, including assistance with walking aids.
2
The patient is able to ascend/descend but is unable to carry walking aids, and needs supervision and guidance.
5
Generally no assistance is required. At times, supervision is required for safety due to morning stiffness, shortness of breath, etc.
8
The patient is able to go up and down a flight of stairs safely without help or supervision. The patient is able to use hand rails, cane, or crutches when needed and is able to carry these devices as he/she ascends or descends.
10
Overall Score
Dependency Level
0 – 24 Total 25 – 49 Severe 50 – 74 Moderate 75 – 90 Mild 91 – 99 Minimal
100 Independent

Page 240 of 308
Appendix 3. Permission to Use Charlson Co-Morbidity Index

Page 241 of 308
Appendix 4. Formula System for Charlson Co-Morbidity Index Score
The Charlson Co-Morbidity Index (CCMI) contains 19 categories of co-morbidity. Each
category has an associated weight which is based on the adjusted risk of one-year mortality.
The overall CCMI score is the sum of the weighted scores and it reflects the cumulative
disease burden: the higher the score, the greater the burden of co-morbidity.
Charlson’s original 19 categories of co-morbidity and their assigned weights were as follows:
The minimum and maximum score for CCMI is zero and 35 respectively. For this study, the
conditions ‘diabetes’ and ‘diabetes with end organ damage” was collapsed into one category
but with the original Charlson weights retained. This was similarly done for liver disease and
tumour. The following below presents the above data in alphabetical order and with the
collapsed categories.

Page 242 of 308
Co-Morbidity Charlson Weights
AIDS No = 0, Yes = 6
Connective tissue disease No = 0, Yes = 1
Cerebrovascular disease No = 0, Yes = 1
Chronic pulmonary disease No = 0, Yes = 1
Congestive heart failure No = 0, Yes = 1
Dementia No = 0, Yes = 1
Diabetes Mellitus* • No = 0
• Without end organ damage = 1
• With end organ damage = 2
Hemiplegia No = 0, Yes = 2
Leukemia No = 0, Yes = 2
Liver Disease* • No = 0
• Mild = 1
• Moderate or severe = 3
Lymphoma No = 0, Yes = 2
Myocardial infarct No = 0, Yes = 1
Ulcer disease No = 0, Yes = 1
Peripheral vascular disease No = 0, Yes = 1
Renal disease • No or mild = 0
• Moderate or severe = 3
Solid tumour* • No = 0
• Yes (non-metastatic) = 2
• Yes (metastatic) = 6
* Coded as separate variables in original CCMI.

Page 243 of 308
Appendix 5. Data Collection Form

Page 244 of 308

Page 245 of 308

Page 246 of 308

Page 247 of 308
Appendix 6. NUS IRB Approval Certificate

Page 248 of 308

Page 249 of 308

Page 250 of 308
Appendix 7. Supplementary Material for Chapter Three
Actual International Journal of Stroke publication

Page 251 of 308

Page 252 of 308

Page 253 of 308

Page 254 of 308

Page 255 of 308

Page 256 of 308
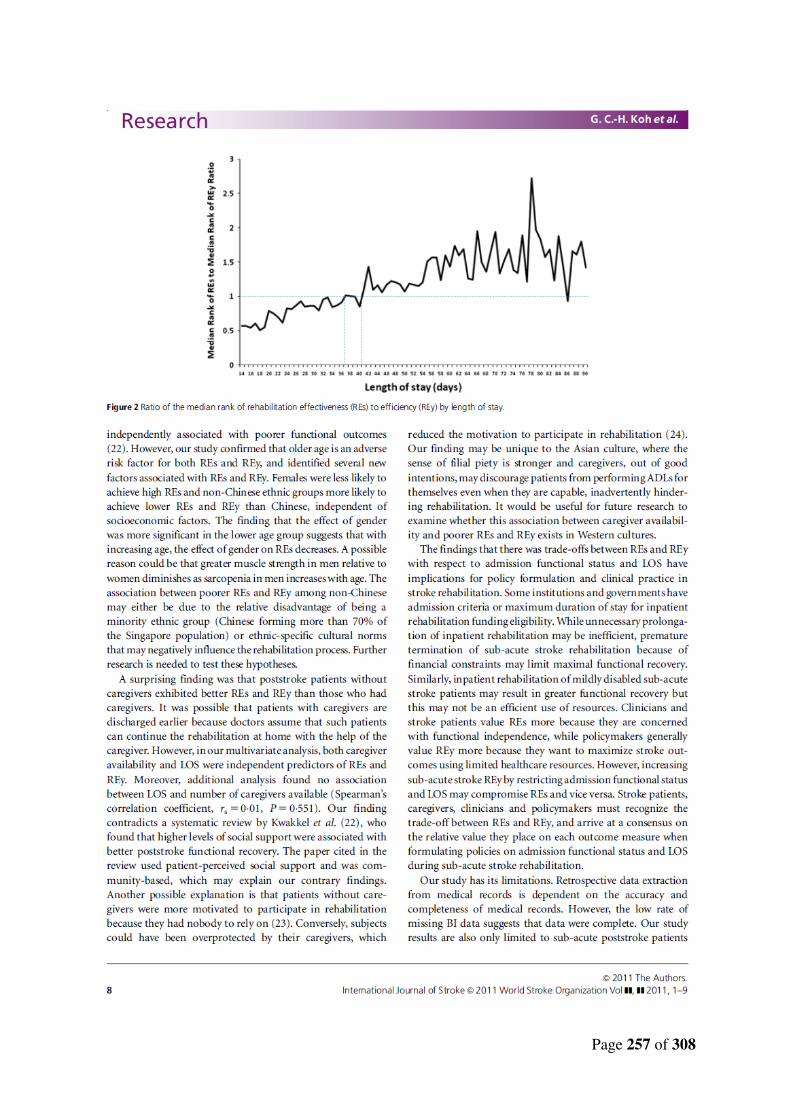
Page 257 of 308

Page 258 of 308

Page 259 of 308
Table 1. Median rank of rehabilitation effectiveness (REs) and rehabilitation
efficiency (REy), and median rank of REs to REy ratio for admission
Barthel Index scores
2. Median rank of rehabilitation effectiveness (REs) and rehabilitation
efficiency (REy), and median rank of REs to REy ratio for length of
stay

260
Table 1. Median rank of rehabilitation effectiveness (REs) and
rehabilitation efficiency (REy), and ratio of median rank of REs to REy
for admission Barthel Index scores
Admission Barthel Index score*
n (%) Median
rank of REs Median
rank of REy Median rank of REs / median rank of REy
0 98 (2.94) 480 503 0.95
1 9 (0.27) 884 1601 0.55
2 24 (0.72) 613 1035 0.59
3 42 (1.26) 973 1106 0.88
4 21 (0.63) 704 803 0.88
5 41 (1.23) 755 1015 0.74
6 39 (1.17) 1024 1218 0.84
7 40 (1.20) 918 1340 0.68
8 47 (1.41) 977 1221 0.80
9 36 (1.08) 1014 1459 0.69
10 29 (0.87) 494 482 1.03
11 56 (1.68) 1269 1724 0.74
12 13 (0.39) 838 936 0.90
13 34 (1.02) 949 1289 0.74
14 37 (1.11) 895 1069 0.84
15 30 (0.9) 993 1328 0.75
16 51 (1.53) 858 1103 0.78
17 22 (0.66) 1766 1887 0.94
18 44 (1.32) 1540 2005 0.77
19 40 (1.20) 1450 1844 0.79
20 18 (0.54) 1278 1329 0.96
21 52 (1.56) 1374 1591 0.86
22 26 (0.78) 1483 1973 0.75
23 34 (1.02) 1727 2004 0.86
24 42 (1.26) 1487 1825 0.81
25 26 (0.78) 1965 2154 0.91
26 37 (1.11) 1410 2021 0.70
27 32 (0.96) 1520 2090 0.73
28 31 (0.93) 1597 2038 0.78
29 42 (1.26) 1584 2259 0.70
30 29 (0.87) 1901 1945 0.98
31 34 (1.02) 1756 1785 0.98
32 30 (0.90) 1595 1913 0.83
33 35 (1.05) 1728 1827 0.95

261
Table 1 (cont’d). Median rank of rehabilitation effectiveness (REs) and
rehabilitation efficiency (REy), and ratio of median rank of REs to REy
for admission Barthel Index scores
Admission Barthel Index score*
n (%) Median
rank of REs Median
rank of REy Median rank of REs / median rank of REy
34 48 (1.44) 2014 2288 0.88
35 27 (0.81) 1647 1567 1.05
36 37 (1.11) 1974 1922 1.03
37 33 (0.99) 1091 1322 0.83
38 22 (0.66) 2009 2007 1.00
39 59 (1.77) 1835 2038 0.90
40 35 (1.05) 1859 1752 1.06
41 37 (1.11) 1681 1752 0.96
42 37 (1.11) 1644 1752 0.94
43 29 (0.87) 1590 1530 1.04
44 49 (1.47) 1964 2062 0.95
45 34 (1.02) 1694 1911 0.89
46 42 (1.26) 1904 2054 0.93
47 48 (1.44) 1669 2150 0.78
48 29 (0.87) 1683 1195 1.41
49 53 (1.59) 1859 1945 0.96
50 51 (1.53) 1977 1908 1.04
51 47 (1.41) 1831 1647 1.11
52 58 (1.74) 1859 1885 0.99
53 40 (1.20) 2020 1841 1.10
54 52 (1.56) 1756 1595 1.10
55 43 (1.29) 1607 1886 0.85
56 51 (1.53) 1987 1945 1.02
57 77 (2.31) 2014 1658 1.21
58 47 (1.41) 2213 2214 1.00
59 61 (1.83) 1618 1477 1.10
60 45 (1.35) 1537 1678 0.92
61 52 (1.56) 2199 1883 1.17
62 90 (2.70) 1898 1906 1.00
63 54 (1.62) 2269 1991 1.14
64 56 (1.68) 1763 1752 1.01
65 42 (1.26) 2434 1672 1.46
66 26 (0.78) 2529 2000 1.26
67 28 (0.84) 1810 1438 1.26
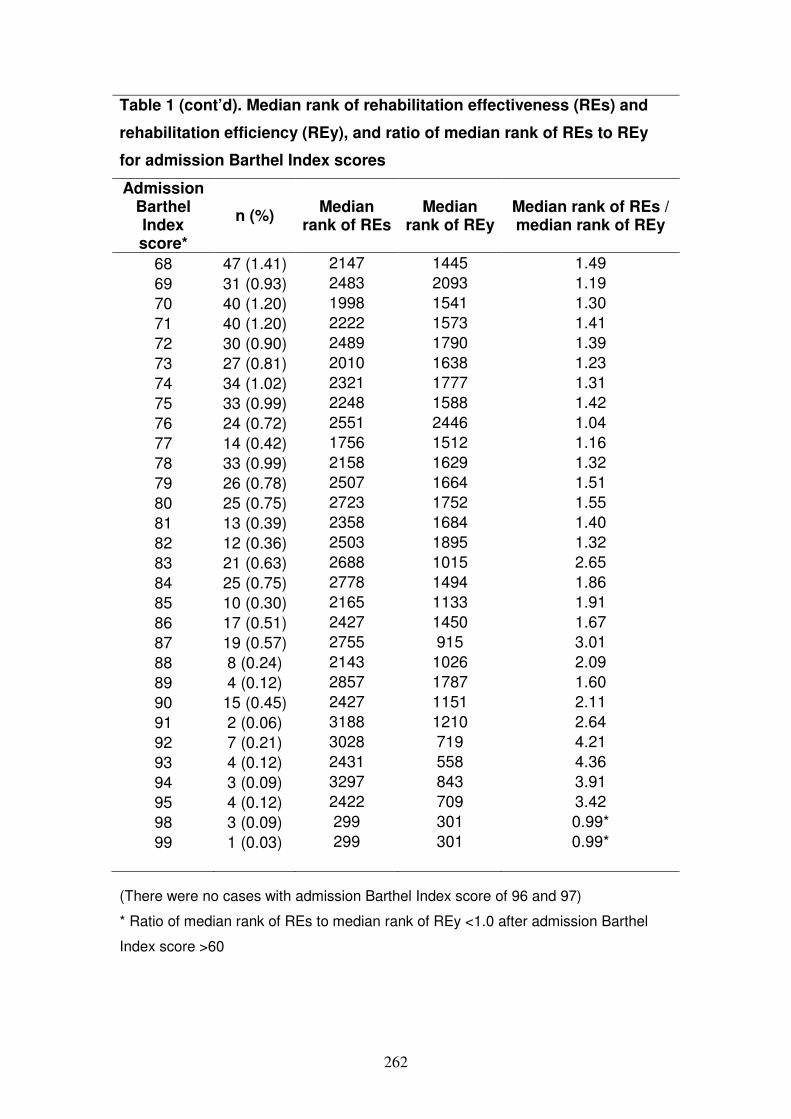
262
Table 1 (cont’d). Median rank of rehabilitation effectiveness (REs) and
rehabilitation efficiency (REy), and ratio of median rank of REs to REy
for admission Barthel Index scores
Admission Barthel Index score*
n (%) Median
rank of REs Median
rank of REy Median rank of REs / median rank of REy
68 47 (1.41) 2147 1445 1.49
69 31 (0.93) 2483 2093 1.19
70 40 (1.20) 1998 1541 1.30
71 40 (1.20) 2222 1573 1.41
72 30 (0.90) 2489 1790 1.39
73 27 (0.81) 2010 1638 1.23
74 34 (1.02) 2321 1777 1.31
75 33 (0.99) 2248 1588 1.42
76 24 (0.72) 2551 2446 1.04
77 14 (0.42) 1756 1512 1.16
78 33 (0.99) 2158 1629 1.32
79 26 (0.78) 2507 1664 1.51
80 25 (0.75) 2723 1752 1.55
81 13 (0.39) 2358 1684 1.40
82 12 (0.36) 2503 1895 1.32
83 21 (0.63) 2688 1015 2.65
84 25 (0.75) 2778 1494 1.86
85 10 (0.30) 2165 1133 1.91
86 17 (0.51) 2427 1450 1.67
87 19 (0.57) 2755 915 3.01
88 8 (0.24) 2143 1026 2.09
89 4 (0.12) 2857 1787 1.60
90 15 (0.45) 2427 1151 2.11
91 2 (0.06) 3188 1210 2.64
92 7 (0.21) 3028 719 4.21
93 4 (0.12) 2431 558 4.36
94 3 (0.09) 3297 843 3.91
95 4 (0.12) 2422 709 3.42
98 3 (0.09) 299 301 0.99*
99 1 (0.03) 299 301 0.99*
(There were no cases with admission Barthel Index score of 96 and 97)
* Ratio of median rank of REs to median rank of REy <1.0 after admission Barthel
Index score >60

263
Table 2. Median rank of rehabilitation effectiveness (REs) and rehabilitation
efficiency (REy), and ratio of median rank of REs to REy for length of stay
Length of stay (days)
n (%) Median
rank of REs Median rank
of REy Median rank of REs / median rank of REy
14 69 (2.07) 1331 2458 0.54
15 56 (1.68) 1113 1945 0.57
16 63 (1.89) 1362 2405 0.57
17 61 (1.83) 1404 2377 0.59
18 86 (2.58) 1076 2098 0.51
19 80 (2.40) 1258 2006 0.63
20 73 (2.19) 1663 2021 0.82
21 73 (2.19) 1236 1668 0.74
22 90 (2.70) 1562 2292 0.68
23 83 (2.49) 1331 1908 0.70
24 66 (1.98) 1658 2061 0.80
25 102 (3.06) 1286 1544 0.83
26 97 (2.91) 1914 2259 0.85
27 73 (2.19) 1018 1151 0.88
28 58 (1.74) 1084 1267 0.86
29 85 (2.55) 1919 2207 0.87
30 90 (2.70) 1788 1945 0.92
31 97 (2.91) 1607 1752 0.92
32 102 (3.06) 1590 1724 0.92
33 75 (2.25) 1704 1833 0.93
34 68 (2.04) 1530 1828 0.84
35 69 (2.07) 1672 1752 0.95
36 68 (2.04) 1984 2029 0.98
37 77 (2.31) 1807 1785 1.01
38 63 (1.89) 1953 1894 1.03
39 77 (2.31) 1634 1655 0.99
40 83 (2.49) 1689 1919 0.88
41 61 (1.83) 1763 1584 1.11
42 49 (1.47) 1775 1494 1.19
43 50 (1.50) 1875 1692 1.11
44 80 (2.40) 1868 1616 1.16
45 66 (1.98) 1752 1600 1.09
46 51 (1.53) 1958 1719 1.14
47 57 (1.71) 1663 1410 1.18
48 31 (0.93) 1048 869 1.21

264
Table 2 (cont’d). Median rank of rehabilitation effectiveness (REs) and
rehabilitation efficiency (REy), and ratio of median rank of REs to REy for
length of stay
Length of stay (days)
n (%) Median
rank of REs Median rank
of REy Median rank of REs / median rank of REy
49 38 (1.14) 1527 1293 1.18
50 33 (0.99) 1714 1303 1.32
51 50 (1.50) 1890 1547 1.22
52 41 (1.23) 1886 1609 1.17
53 36 (1.08) 1857 1441 1.29
54 32 (0.96) 1840 1593 1.16
55 29 (0.87) 1819 1406 1.29
56 25 (0.75) 1537 994 1.55
57 31 (0.93) 2028 1596 1.27
58 31 (0.93) 1813 1283 1.41
59 29 (0.87) 1969 1459 1.35
60 29 (0.87) 2381 1684 1.41
61 53 (1.59) 2270 1285 1.77
62 20 (0.60) 2004 1451 1.38
63 20 (0.60) 1767 1222 1.45
64 31 (0.93) 1991 1390 1.43
65 12 (0.36) 2363 1689 1.40
66 34 (1.02) 2055 1593 1.29
67 18 (0.54) 1819 1299 1.40
68 11 (0.33) 2312 1617 1.43
69 15 (0.45) 1694 1024 1.66
70 21 (0.63) 2121 1098 1.93
71 20 (0.60) 1874 1095 1.71
72 14 (0.42) 2046 1447 1.41
73 11 (0.33) 1273 853 1.49
74 14 (0.42) 2457 1633 1.50
75 13 (0.39) 1895 1419 1.34
76 12 (0.36) 2068 1010 2.05
77 5 (0.15) 1799 1151 1.56
78 2 (0.06) 2075 1027 2.02
79 6 (0.18) 2384 1330 1.79
80 5 (0.15) 2371 964 2.46
81 6 (0.18) 1721 1096 1.57
82 6 (0.18) 1921 1145 1.68
83 5 (0.15) 1825 1494 1.22

265
Table 2 (cont’d). Median rank of rehabilitation effectiveness (REs) and
rehabilitation efficiency (REy), and ratio of median rank of REs to REy for
length of stay
Length of stay (days)
n (%) Median
rank of REs Median rank
of REy Median rank of REs / median rank of REy
84 7 (0.21) 1893 962 1.97
85 4 (0.12) 592 472 1.25
86 12 (0.36) 1954 1225 1.59
87 7 (0.21) 1509 914 1.65
88 8 (0.24) 1702 1027 1.66
89 7 (0.21) 1454 764 1.90
90 3 (0.09) 2609 1861 1.40

266

267
Appendix 8: Additional Details to Add to Database
Hip fracture
• Pre-fracture (i.e. pre-morbid) functional status: (1) Independent or (2) Needs assistance.
• Referring institution: (1) National University Hospital (2) Singapore General Hospital (3) Tan Tock Seng Hospital (4) Chamgi General Hospital (5) Alexandra Hospital (6) Others
• Type of hip fracture: (1) Inter-trochanteric (IT), (2) Neck of femur (NOF)
• Was operation done? (1) Yes, (2) No
• If yes: (1) Date of operation: ____/ ____/ ____ (dd/mm/yyyy) (2) Type of operation: (a) IT: (1) Dynamic hip screw,
(2) Others (b) NOF: (1) Bipolar hemi-arthroplasty,
(2) Unipolar hemi-arthroplasty, (3) Cancellous screw, (4) Others.
(3) Was patient on weight bearing in community hospital?: (1) Yes, (2) No (4) If yes, when was weight bearing started:
(a) Before admission to CH: (1) Yes, (2) No (b) During CH admission: (1) Yes, (2) No
If yes, (i) Date of weight-bearing commencement: ____/ ____/ ____ (dd/mm/yyyy) (ii) What type of weight bearing started: (1) Toe-touch, (2) Partial, (3) Full
(c) Weight-bearing status on discharge: (1) Toe-touch, (2) Partial, (3) Full

268
Depression:
• Was the patient depressed during CH stay?: (1) Yes, (2) No (Definition for a positive answer are: (1) stated anywhere in problem list or case notes
(2) patient on an anti-depressant during stay
• Is there a history of depression?: (1) Yes, (2) No (Put this down only if (1) patient has a record that states “history of depression” and (2) was not depressed during CH stay (i.e. did not fulfill the criteria in preceding question).

269
Appendix 9: Proposed Conversion of Shah Modified Barthel Index to ElderShield Disability Levels
S/No.
Activities of Daily Living (ADL) Shah Modified Barthel Index ElderShield Disability Levels
Scale Points Points Test Scale Points Payout 1. Washing/Bathing
(Ability to wash in the bath or
shower (including getting into and out of the bath or shower) or wash
by other means)
Total dependence in bathing self.
0
Test patient's ability to wash these body parts: 1. Left arm. 2. Right arm. 3. Chest. 4. Abdomen. 5. Front perineum. 6. Back perineum. 7. Left upper leg. 8. Right upper leg. 9. Left lower leg. 10. Right lower leg. Assign 10% to each body part, summate and categorize as above.
Level 4 (Total assistance – Assistance for ADL is required 100% of the time)
Yes
Assistance required in all aspects of bathing.
1
Level 3 (Maximal assistance – Assistance for ADL is required 75-99% of the time)
Yes
Assistance required with either transfer to shower/bath or with washing or drying; including inability to complete a task because of condition or disease, etc.
3
Level 2 (Minimal to moderate assistance – Assistance for ADL is required 1-74% of the time)
No
Supervision is required for safety in adjusting the water temperature, or in the transfer. 4
The patient may use a bath tub, a shower, or take a complete sponge bath. The patient must be able to do all the steps of whichever methods is employed without another person being present.
5
Level 1 (Independent – Assistance for ADL is required 0% of the time)
No

270
2. Dressing
(Ability to put on, take off, secure and unfasten all garments (upper and
lower) and, as appropriate, any braces, artificial limbs, or other surgical or medical appliances)
The patient is dependent in all aspects of dressing and is unable to participate in the activity. 0
Score upper and lower body dressing separately and take the lower score. Test patient's ability to dress as follows for each side, (1) left and (2) right: a. Shirt: Thread sleeves, pull down across chest and fasten. b. Pants: Thread through legs, pull above hips and fasten. Assign 25% to each step (left vs. right and shirt vs. pants).
Level 4 (Total assistance – Assistance for ADL is required 100% of the time)
Yes
The patient is able to participate to some degree, but is dependent in all aspects of dressing. 2
Level 3 (Maximal assistance – Assistance for ADL is required 75-99% of the time)
Yes
Assistance is needed in putting on, and/or removing any clothing.
5 Level 2 (Minimal to moderate assistance – Assistance for ADL is required 1-74% of the time)
No Only minimal assistance is required with fastening clothing, such as buttons, zips, bra, shoes, etc. 8
The patient is able to put on, remove, and fasten clothing, tie shoelaces, or put on, fasten, remove corset, braces, as prescribed. 10
Level 1 (Independent – Assistance for ADL is required 0% of the time)
No

271
3. Feeding
(Ability to feed oneself food after it has been prepared and made
available)
Dependent in all aspects and needs to be fed.
0
Test patient's ability to feed and swallow. General guide: For non-tube feeding user: Level 2: Requires helper only for set-up of food (e.g. cutting the food into small pieces, removal of bones. Level 3: Requires helper to scoop or pick food. Level 4: For every mouthful, needs to be fed or monitored for safe swallowing. For tube feeding user: Assess the amount of assistance required. Refer to Notes
For non-tube feeding user: Level 4: For every mouthful, needs to be fed or monitored for safe swallowing For tube feeding user: Total assistance required.
Yes
Can manipulate an eating device, usually a spoon but someone must provide active assistance during the meal.
2
For non-tube feeding user: Level 3: Requires helper to scoop or pick food. For tube feeding user: Maximal assistance required.
Yes
Able to feed self with supervision. Assistance is required with associated tasks, such as putting milk/sugar into tea, salt, pepper, spreading butter, turning a plate or other “set-up” activities.
5
For non-tube feeding user: Level 2: Requires helper only for set-up of food (e.g. cutting the food into small pieces, removal of bones. For tube feeding user: Minimal to moderate assistance required.
No Independence in feeding with prepared tray except assistance may be required to cut meat, open milk carton, jar lid, etc. Presence of another person is not required.
8
The patient can feed self from a tray or table when someone puts food within reach. The patient must be able to put on assistive device if needed, cut the food, and if desired, use salt and pepper, spread butter, etc.
10
Level 1 (Independent)
No

272
4. Toileting
(Ability to use the lavatory or manage bowel and bladder function
through the use of protective undergarments or surgical appliances, if appropriate)
Fully dependent in toileting.
0
Test patient on the following: 1. Removing clothing; 2. Maintaining balance; 3. Perineal hygiene; 4. Wear clothing. Assign 25% to each step. For diaper or catheter user, assess the amount of assistance required. Refer to Notes.
Level 4 (Total assistance – Assistance for ADL is required 100% of the time)
Yes
Assistance required in all aspects of toileting.
2
Level 3 (Maximal assistance – Assistance for ADL is required 75-99% of the time)
Yes
Assistance may be required with management of clothing, transferring, or washing hands.
5 Level 2 (Minimal to moderate assistance – Assistance for ADL is required 1-74% of the time)
No Supervision may be required for safety with normal toilet. A commode may be used at night but assistance is required for emptying and cleaning.
8
The patient is able to get on and off the toilet, fasten and unfasten clothes, prevent soiling of clothes and use toilet paper without help. If necessary, the patient may use bad pan or commode, or urinal at night, but must be able to empty it and clean it.
10
Level 1 (Independent – Assistance for ADL is required 0% of the time)
No

273
5. Transferring
(Ability to move from a bed to an upright chair or wheelchair, and
vice-versa)
Unable to participate in transfer. Two attendants are required to transfer the patient with or without a mechanical device.
0 Test patient's ability to transfer.
Level 4 (Requires total assistance to transfer)
Yes
Able to participate but maximum assistance of one other person is required in all aspects of the transfer. 3
Level 3 (Requires assistance to life the body, otherwise patient will fall)
Yes
The transfer requires the assistance of one other person. Assistance may be required in any aspect of the transfer.
8 Level 2 (Requires supervision and contact assistance)
No
The presence of another person is required either as a confidence measure or to provide supervision for safety.
12
The patient can safely approach the bed in a wheelchair, lock the brakes, lift the footrests, move safely to bed, lie down, come to a sitting position on the side of the bed, change the position of the wheelchair, transfer back into it safely. The patient must be independent in all phases of this activity.
15
Level 1 No supervision or assistance required)
No

274
6. Mobility
(Ability to move indoors from room to room on level surfaces)
Dependent in ambulation. 0
Test patient's ability to move. (Levels apply for patients using special adaptive equipment.)
Level 4 (Requires total assistance to move)
Yes
Constant presence of one or more assistants is required during ambulation. 3
Level 3 (Requires maximal assistance to move)
Yes
Assistance is required with reaching aids and/or their manipulation. One person is required to offer assistance.
8 Level 2 (Requires minimal to rnoderate assistance to move)
No The patient is independent in ambulation but
unable to walk 50 metres without help, or supervision is needed for confidence or safety in hazardous situations.
12
The patient must be able to wear braces if required, lock and unlock these braces, assume standing position, sit down, and place the necessary aids into position for use. The patient must be able to use crutches, canes or a walking frame, and walk 50 metres without help or supervision.
15
Level 1 (No assistance required to move)
No

11. Curriculum Vitae
Personal Particulars
Name: Gerald Choon-Huat KOH (
Gender: Male Age: 42 years Nationality: Singaporean Ethnicity: Chinese Research Areas
• Influenza
• Salivary biomarkers
• Stroke rehabilitation
• Medical education Teaching Areas
• Family medicine
• Community medicine
• Geriatric medicine Present Appointment
• Associate Professor, Saw Swee Hock School of Public Health, NUS, NUHS
• Joint Associate Professor, Dean’s Office, Yong Loo Lin School of Medicine, NUS, NUHS
• Visiting Consultant, Ang Mio Kio Thye Hua Kwan Hospital Academic/Education History
• MBBS (1995), National University of Singapore
• Masters in Medicine in Family Medicine (2000), National University of Singapore
• Graduate Diploma in Geriatric Medicine
• Fellowship in Family Medicine (2003), College of Family Physicians (Singapore)
• Diploma in Gerontology & Geriatrics (2004), University of Malta
• Masters in Gerontology & Geriatrics (2008), University of Malta
• PhD in Family Medicine, University of Western Ontario, Canada (Ongoing) Clinical Training/Employment History
• Associate Professor, Saw Swee Hock School of PublicHealth†, NUS, NUHS
• Assistant Professor, Department of Epidemiology & PublicPublic Health (EPH)*, Yong Loo Lin School of Medicine(YLLSoM), National University Health System (NUHS)
• Resident Advisor, Prince George’s Park Residence, NUS
275
Curriculum Vitae
Huat KOH (许春发)
Associate Professor, Saw Swee Hock School of Public Health, NUS, NUHS
Joint Associate Professor, Dean’s Office, Yong Loo Lin School of Medicine,
Visiting Consultant, Ang Mio Kio Thye Hua Kwan Hospital
Academic/Education History
MBBS (1995), National University of Singapore
Masters in Medicine in Family Medicine (2000), National University of Singapore
Graduate Diploma in Geriatric Medicine (2002), National University of Singapore
Fellowship in Family Medicine (2003), College of Family Physicians (Singapore)
Diploma in Gerontology & Geriatrics (2004), University of Malta
Masters in Gerontology & Geriatrics (2008), University of Malta
amily Medicine, University of Western Ontario, Canada (Ongoing)
Clinical Training/Employment History
Associate Professor, Saw Swee Hock School of Public Jul 11
Assistant Professor, Department of Epidemiology & Public Mar 09Public Health (EPH)*, Yong Loo Lin School of Medicine (YLLSoM), National University Health System (NUHS)
Resident Advisor, Prince George’s Park Residence, NUS 15 Mar 08
Associate Professor, Saw Swee Hock School of Public Health, NUS, NUHS
Joint Associate Professor, Dean’s Office, Yong Loo Lin School of Medicine,
Masters in Medicine in Family Medicine (2000), National University of Singapore
(2002), National University of Singapore
Fellowship in Family Medicine (2003), College of Family Physicians (Singapore)
amily Medicine, University of Western Ontario, Canada (Ongoing)
Jul 11 – present
Mar 09 – Jun 11
15 Mar 08-present

276
• Assistant Professor, Department of Community, Occupational Jun 05 – Mar 09 & Family Medicine (COFM)*, YLLSoM, NUS
• Adjunct Assistant Professor (Family Medicine), COFM, Jan 05 – Jun 05 YLLSoM, NUS
• Consultant Family Physician, Raffles Medical Group Nov 04 – May 05
• Registrar, Ang Mo Kio Hospital (AMKH) Nov 00 – Oct 04
• Adjunct Teaching Fellow, COFM, Medical Faculty, NUS Jan 03 – Oct 03
• Medical Officer, AMKH May 00 – Oct 00
• Medical Officer, Woodland’s Polyclinic, Family Health May 99 – Apr 00 Service
• Medical Officer, General Medicine, National University Nov 98 – Apr 99 Hospital (NUH)
• Medical Officer, Paediatrics, NUH May 98 – Oct 98
• Medical Officer, Psychological Medicine, NUH. Nov 97 – Apr 98
• Medical Officer, Accident & Emergency, Tan Tock Seng May 97 – Oct 97 Hospital (TTSH)
• Medical Officer, Anaesthesia, Singapore General Hospital Nov 96 – Apr 97 (SGH)
• Medical Officer, Healthy Lifestyle Unit, Ministry of Health May 96 – Oct 96 MOH
• House-Officer, Onco-Urogynaecology, Kedang Kerbau Jan 96 – Apr 96 Women and Child Hospital
• House-Officer, Internal Medicine, SGH Sep 95 – Dec 95
• House-Officer, General Surgery, TTSH May 95 – Aug 95 * The name of the department changed from COFM to EPH in March 2009 † The Department of EPH became the Saw Swee Hock School of Public Health in October 2011.

277
Scholarships and Awards Scholarships
• Graduate Thesis Research Award, Schulich School of May 09-Aug 11 Medicine & Dentistry, University of Western Ontario,
• Schulich Graduate Scholarship, University of Western Sep 09 – Jun 13 Ontario
• National Medical Research Council (NMRC) Research 11 Mar 09 Fellowship Award to read for a PhD in Family Medicine at University of Western Ontario, Canada
• Merck Institute of Ageing and Health (MIAH) Scholarship Jul 03 (Postgraduate Diploma in Gerontology and Geriatrics)
Research Awards
• 10th International Scientific Congress of the Royal College 26 Mar 12 of Obstetrics and Gynecology Best Abstract Award
• Singapore Medical Association Public Research Award, 15 Feb 12 2nd YLLSoM Annual Scientific Congress 2012
• Singapore Medical Association Wong Hock Boon Award, 15 Feb 12 2nd YLLSoM Annual Scientific Congress 2012
• Best Poster (Quality and Health Services Research) Award 11-12 Nov 11 (3rd), Singapore Health and Biomedical Congress.
• Merit Award, Allied Health Specialties Category, 6th Kedang 15-16 Jul 11 Kerbau Women and Child Hospital Annual Scientific Meeting
• Best Oral Presentation Prize (3rd), 2nd Asia Pacific Primary 4-5 Dec 10 Care Research Conference
• Best Oral Presentation Prize, Inaugural Asian Conference on 25 Feb 11 Integrated Care
• 2nd Prize, Best Poster Presentation, 2nd Asia Pacific Primary 4-5 Dec 10 Care Research Conference
• Bronze Prize, Singapore Young Investigator Award (Quality, 12-13 Nov 10 Health Services Research Category), 1st Singapore Health and Biomedical Congress
• Best Student Paper, 5th Singapore Public Health and 19-20 Aug 10 Occupational Medicine Conference
• Merit Award, 5th Singapore Public Health and Occupational 19-20 Aug 10 Medicine Conference
• Best Scientific Paper Award, Asian Medical Students’ 25 Jul-1 Aug 10 Conference, Jakarta Indonesia
• Best Oral Communication (Primary Care Category) Award, 16 Oct 09 National Healthcare Group Annual Scientific Congress
• Poster Presentation Merit Award, 4th Singapore Public 27-28 Aug 09 Health and Occupational Medicine Conference
• NUS YLLSoM Student Elective Symposium (Merit Award) 15 Jan 09 (Supervisor)
• Silver Award, National Healthcare Group Annual Scientific 7-8 Nov 08 Congress Oral/Poster Competition (Supervisor)

278
• Merit Award, National Healthcare Group Annual Scientific 7-8 Nov 08 Congress Oral/Poster Competition (Primary Care Category)
• 1st Runner Up, Best Poster Presentation (Student Category), 16 Oct 08 COFM 60th Anniversary Scientific Symposium (Supervisor)
• Best Paper Award at 19th Asian Conference on Occupational Sep 08 Health
• Best Oral Presentation (Primary Care Category) at National Nov 07 Healthcare Group Annual Scientific Congress
• Best Free Paper (Oral) Award of the 6th Annual Scientific 5 Oct 02 Meeting of the Society of Geriatric Medicine (Singapore)
Teaching Awards
• Top 10 Tutor Award (awarded by NUS Medical Students Sep 09 Society)
• NUS University Annual Teaching Excellence Award (ATEA) 2 Mar 09
• YLLSoM Faculty Teaching Excellence Award (2007/2008) 14 Jan 09
• College of Family Physicians (Singapore) Teachers’ Award Jun 05 Service Awards
• Ministry of Education (MOE) Service to Education Award May 08
• Raffles Medical Group (RMG) Star Service Award Apr 05 Academic/Professional Leadership International
• Top 100 Health Professional 2011, International April 11 Biographical Centre, Cambridge, UK
• Chief Judge, Presentation Merit Award Judging Dec 06 - Jul 07 Committee, World Organisation of Family Doctors (WONCA) 18th World Conference 2007
• Chief Abstract Reviewer, World Organisation of Family Jan 2005- Jul 2007 Doctors (WONCA) 18th World Conference
• Member, World Organisation of Family Doctors (WONCA) Jan 2005 – Jul 07 18th World Conference Scientific Committee
• Invited Lecturer for UN-INIA and Beijing Civil Affairs 30 Oct – 5 Nov 05 Bureau (BCAB) Training Programme in Gerontology
• Honorary Secretary, ISACA [UN-International Institute of Aug 05 - present Ageing (INIA) – Singapore Action Group of Elders (SAGE) ASEAN Centre of Ageing] [Ref: Choo V. UN agency on ageing sets up first satellite centre in Singapore. Lancet 2002;360:856.]
Local
• Council Member, College of Family Physicians of Singapore Jun 11-Jun 13

279
• Advisory Panel of Gerontology Programme, School of Jun 11-May 13 Human Development and Social Services, SIM University
• Professional Development Program (Teaching) Practicum Jan 11 Supervisor, Centre for Development of Teaching and Learning
• Member, Policy Study Workgroup on Health Issues Jan – Dec 10 (Caregiving), REACH, Ministry of Community, Youth and Sports (MCYS)
• Academic Advisor, National Care Assessment Framework Apr 10– Mar 12 Steering Committee, Agency for Integrated Care
• Resident Advisor, Prince George’s Park Residence, NUS Since 15 Mar 08
• Reviewer, National Healthcare Group Annual Scientific 2008 Congress 2008
• Member, Tribunal for Maintenance of Parents, Ministry of Since May 08 Community, Youth and Sports (MCYS)
• Family Medicine Continuing Medical Education Advisor Since 2008 (CFPS & Singapore Medical Council)
• Member, Medical Education Unit, Yong Loo Lin School of Since Jul 09 Medicine, NUS
• Member, Publications Support Unit, Yong Loo Lin School Since Dec 07 of Medicine, NUS
• Advisor and Member, Scientific Advisory Review Panel, 12 – 16 Nov 07 Environmental Health Institute, National Environmental Agency
• Invited Lecturer, Genetic and Molecular Epidemiology Nov 2006 Course PhD Programme, NUS
• Institute of Technical Education (ITE) Healthcare Apr 05 - present Academic Advisory Committee
• Chairman, Organising Committee for the 1st Community Jan – Aug 03 Healthcare for Older Persons (CHOP) Annual Scientific Meeting

280
PUBLICATIONS
Original Article in Journal
Influenza and other infectious diseases
1. Hsu JP, Phoon MC, Koh GCH, ChenMIC, Lee V, Wu Y, Xie ML, Cheong A, Leo
YS, Chow VTK. Comparison of neutralizing antibody and cell-mediated immune responses to pandemic H1N1-2009 influenza virus before and after H1N1-2009 influenza vaccination of elderly subjects and healthcare workers. Int J Infect Dis. Accepted for publication on 18 Apr 12.
2. Tang JW, Nicolle A, Pantelic J, Koh GC, Liang DW, Muhammad A, Klettner CA, Cheong DKW, Sekhar C, Tham KW. Airflow dynamics of coughing in healthy human volunteers by shadowgraph imaging: an aid to aerosol infection control. PLoS ONE. Accepted for publication on 6 Feb 12.
3. Chen MI*, Barr IG, Koh GCH, Lee VJM, Lee CPS, Shaw R, Cui L, Yap J, Cook AR, Tan BH, Loh J, Barkham T, Chow VTK, Lin RTP, Leo YS. Serological Response in RT-PCR Confirmed H1N1-2009 Influenza A by hemagglutination inhibition and virus neutralization assays: An observational study. PLoS ONE 2010;5(8):e12474. Doi:10.1371/journal.pone.0012474.
4. Chen MIC*, Lee VJM, Lim WY, Barr I, Lin RTP, Koh GCH, Yap J, Lin C, Cook AR, Laurie K, Tan LWL, Tan BH, Loh J, Shaw R, Durrant C, Chow VTK, Kelso A, Chia KS, Leo YS. 2009 Influenza A(H1N1) Seroconversion rates and risk factors among distinct adult cohorts in Singapore. JAMA 2010; 303(14):1383-91.
5. Pannu NK*, GCH Koh. Sharp Injuries – Are they preventable? Medical
Progress. 2009;36(12):577-581. 6. Gerald CH Koh*, Abikusno N, Cheong SK, Wong TY, Kusumaratna R,
Sundram M, Koh K, Chia SE, Koh D. Avian influenza and South Jakarta primary healthcare workers: a controlled mix-method study. Trop Med Int Health 2009;14(7):817-29. (Trop Med Int Health is the 2nd highest ranked journal by impact factor in ISI Journal Citation Report after Malaria J in 2007).
7. Wong TY*, Gerald CH Koh, Cheong SK, Sundram M, Koh K, Chia SE, D Koh. A cross-sectional study of primary-care physicians in Singapore on their concerns and preparedness for an avian influenza outbreak. Ann Acad Med
Singapore 2008;37(6):458-64. Cited in a Straits Times editorial entitled “Point to ponder: Pandemic and fleeing doctors” on 6 October 2008, page A20.
8. Wong TY*, Gerald CH Koh, Cheong SK, Lee HY, Fong YT, Sundram M, K Koh, Chia SE, D Koh. Concerns, perceived impact and preparedness in an avian influenza pandemic – a comparative study between healthcare workers in primary and tertiary care. Ann Acad Med Singapore 2008;37:96-102.
9. Imai T*, Takahashi K, Todoroki M, Kunishima H, Hoshuyama T, Takashi K, Koyama N, Endo K, Fujita H, Iwata K, Gerald Koh, Sin Eng Chia, David Koh. Perception in relation to a potential influenza pandemic among healthcare workers in Japan: Implications for preparedness. Journal of Occupational Health 2008;50(1):13-23.
10. Cheong SK*, Lee HY, Tan BY, Gerald CH Koh, Wong TY, Chan KM, Chia SE, D Koh. Concerns and Preparedness of Healthcare Workers in Hospitals for an Avian Influenza Pandemic. Industrial Health 2007;45:653-661.

281
11. Dave QR Ong*, N Sitaram, M Rajakulendran, Gerald CH Koh, Adeline LH Seow, Evan SL Ong, FY Pang. Knowledge and practice of household mosquito breeding control measure between a dengue hotspot and non-hotspot in Singapore. Ann Acad of Med Singapore 2010;39(2):146-9.
12. Koh D*, Lim MK, Chia SE, Ko SM, Qian F, Ng V, Tan BH, Wong KS, Chew WM, Tang HK, Ng W, Muttakin Z, Emmanuel S, Fong NP, Koh G, Kwa CT, Tan KBC, Fones C. Risk perception and impact of Severe Acute Respiratory Syndrome (SARS) on work and personal lives of healthcare workers in Singapore: what can we learn? Med Care. 2005;43(7):676-682.
13. Chia SE*, Koh D, Fones C, Qian F, Ng V, Tan BH, Wong KS, Chew WM, Tang HK, Ng W, Muttakin Z, Emmanuel S, Fong NP, G Koh G and Lim MK. Appropriate use of personal protective equipment among healthcare workers in public sector hospitals and primary healthcare clinics during SARS outbreak in Singapore. Occup Environ Med. 2005;62:473-477.
Salivary Biomarkers 1. Koh GCH*, Shek LPS, Kee J, Wee A, Ng V, Koh D. Saliva and serum
eosinophil cationic protein in asthmatic children and adolescents with and without allergic sensitization. Journal of Asthma 2010;47:61-5.
2. Koh GCH*, Shek LPS, Kee J, Wee A, Ng V, Koh D. An association between floor vacuuming and dust mite sensitization and serum eosinophil cationic protein in young asthmatics. Indoor Air 2009;19:468-73.
3. Zyphur M*, Narayanan J, Koh G, Koh D. Testosterone-status mismatch lowers collective efficacy in groups: evidence from a slope-as-predictor multilevel structural equation model. Organizational Behavior and Human Decision
Processes 2009;110(2):70-9. 4. Wong TY*, Koh D, Wee A, Ng V, Koh YT, Sum ZJ, Koh G. The effect of
cotton-based collection methods on salivary concentrations of eosinophil cationic protein. Journal of Asthma and Allergy 2008;1:45-8.
5. Gerald CH Koh*, Lynette PC Shek, Daniel YT Goh, Hugo Van Bever, David SQ Koh. Eosinophil Cationic Protein: Is it useful in asthma? a systematic review. Respiratory Medicine 2007;101:696-705.
6. David Koh*, Gerald C H Koh. The use of salivary biomarkers in occupational and environmental health. Occup Environ Med 2007;64:202-210.
Stroke Rehabilitation 1. Koh G, Wee LE, Rizvi NA, Chen C, Cheong A, Fong NP, Chan KM, Tan BY,
Menon E, Ee CH, Lee KK, Petrella R, Thind A, Koh D, Chia KS. Socio-demographic and clinical profile of admissions to community hospitals in Singapore from 1996 to 2005: A descriptive study. Ann Acad Med Singapore. Accepted for publication on 19 Apr 12.
1. Koh GCH*, Saxena SK, Ng TP, Yong D, Fong NP. The effect of duration, participation rate and supervision during community rehabilitation on functional outcomes in the first post stroke year in Singapore. Arch Phys Med Rehabil. Accepted for publication.

282
2. Koh GCH*, Chen C, Cheong A, Tai BC, Choi KP, Fong NP, Chan KM, Tan BY, Petrella R, Thind A, Koh D, Chia KS. Trade-offs between effectiveness and efficiency in stroke rehabilitation. Int J Stroke. Accepted for publication.
3. Saxena SK*, Ng TP, Yong D, Fong NP, Koh G. Subthreshold depression and cognitive impairment but not demented in stroke patients during their rehabilitation. Acta Neurol Scand 2008;117(2):133-40.
4. Saxena SK*, G Koh, Ng TP, Fong NP, D Yong. Determinants of length of stay during post-stroke rehabilitation in community hospitals. Singapore Medical
Journal 2007;48(5):400-407. 5. Saxena SK*, Ng TP, D Yong, Fong NP, G Koh. Total direct cost, length of
hospital stay, institutional discharges and their determinants from rehabilitation settings in stroke patients. Acta Neurologica Scandinavica 2006;114(5):307-314.
6. Saxena SK*, Ng TP, D Yong, Fong NP, G Koh. Functional outcomes in inpatient rehabilitative care of stroke patients: predictive factors and the effect of therapy intensity. Quality in Primary Care 2006;14:145-153.
7. Saxena SK*, Ng TP, Koh G, Yong D, Fong NP. Is improvement in impaired cognition and depressive symptoms in post-stroke patients associated with recovery in activities of daily living? Acta Neurologica Scandinavica 2007;115(5):339-46.
8. Gerald C H Koh*, D Koh. Occupational health for an ageing workforce: do we need a geriatric perspective? J Occup Med Toxicol 2006,1:8 (doi:10.1186/1745-6673-1-8).To be reprinted in a book (5,000 copies) An Insight into Occupational
Health Services by Institute of Chartered Financial Analysts of India (Icfai) University Press which publishes professional reference books with a special focus on emerging and frontier themes.
9. Gerald C H Koh*. Overnutrition among older persons in a Maltese nursing home. Malta Medical Journal. 2005;15(1):21-32.
10. Gerald C H Koh*. Capacity building and manpower training in elderly healthcare. BOLD (Quarterly Journal of the International Institute on Ageing). 2005;15(2):23-26.
11. Gerald C H Koh*. Fall audit in a community hospital. Singapore Family
Physician. Oct - Dec 2004; Vol 30(4):44-8. 12. Gerald C H Koh*. Nursing homes: what parameters should be audited?
Singapore Family Physician. Jul – Sep 2004; Vol 30(3):62-67. 13. Gerald C H Koh*. Preventive care for institutionalised elderly. Singapore
Family Physician. Oct – Dec 2003; Vol 29(4):86-90. 14. Gerald C H Koh*. Case study of a patient with stroke who underwent
rehabilitation in a community hospital. Singapore Family Physician. Oct-Dec 2002; Vol 28(4):101-103.
15. Gerald C H Koh*. Caring for an ageing population: a call for more geriatric training among family physicians. Singapore Family Physician. Oct-Dec 2002; Vol 28(4):77-80.
Medical Education 2. Koh GCH, Merchant RA, Lim WS, Amin Z. The knowledge-attitude
dissociation in geriatric education: Can it be overcome? Ann Acad Med
Singapore. Accepted for publication on 20 Mar 12. 3. Tan SB, Koh GCH, Ding YW, Malhotra R, Tam CH, Pietrobon R, Kusumaratna
R, Tie RN, Cunha G, Martins H, Seim A, Altermatt F, Biderman A, Puoane T,

283
Carvalho E, Ostbye T. Inclination towards a research career among first year medical students: an international study. South East Asian Journal of Medical
Education. Accepted 9 Nov 11. 4. Wee LE, Yeo WX, Koh GCH*. Doctors-to-be at the doorstep - comparing
service-learning programs in an Asian medical school. Med Teach
2011;33(9):e471-8. 5. Wee LE, Koh GCH*, Lim VKG. The Neighborhood Health Screening-
outcomes of a longitudinal, inter-professional student-run home visit program caring for the underserved in Singapore. Acad Med 2011;86(7):829-39.
6. Koh GCH*, Wong TY, Cheong SK, Erle CH Lim, Raymond CS Seet, Tang WE, Chia CS. Acceptability of Medical Students by Patients from Private and Public Family Practices and Specialist Outpatient Clinics. Ann Acad Med Singapore 2010;39(7):555-64.
7. Wee LE, Koh GCH*, Yeo WX, Tay-Ming C, Lee JMJ. The pedagogical value of a student-run community-based experiential learning project: The Yong Loo Lin School of Medicine Public Health Screening. Ann Acad Med Singapore 2010;39:686-91.
8. Cheong SK*, Wong TY, Koh G. Attitudes towards the elderly among Singapore medical students. Ann Acad Med Singapore 2009;38(10):857-61.
9. Koh GCH*, Khoo HE, Wong ML, D Koh. The effects of problem based learning during medical school on physician competency: a systematic review. Canadian
Medical Association Journal 2008;178:34-41. (IP=7.4 in 2005). Full text article available online for free at http://www.cmaj.ca/cgi/content/full/178/1/34?etoc and appendices at http://www.cmaj.ca/cgi/content/full/178/1/34/DC2. This paper was the basis on a BMJ editorial by the Director of Medical Education and Clinical Dean of the University of Cambridge, School of Clinical Medicine [Wood DF. Problem based learning. BMJ 2008;336(7651):971.]
Family Medicine 1. Wee LE, Koh GCH, Chin RT; Yeo WX; Seow B; Chua D. Socioeconomic
factors affecting colorectal, breast and cervical cancer screening in an Asian urban low-income setting at baseline and post-intervention. Prev Med. Accepted for publication on 19 Apr 12.
2. Wee LE, Koh GCH*, Yeo WX, Chin RT, Wong J, Seow B. Screening for cardiovascular disease risk factors in an urban low-income setting at baseline and post-intervention: a prospective intervention study. Eur J Cardiovasc Prev
Rehabil. Accepted for publication on 5 Dec 11. 3. Wee LE, Koh GCH*. Individual and neighborhood social factors of
hypertension management in a low socioeconomic status population: a community-based case-control study in Singapore. Hyptens Res 2011. DOI: doi:10.1038/hr.2011.187.
4. Wee LE, Koh GCH*. The effect of neighborhood, socioeconomic status and a community-based program on multi-disease health screening in an Asian population: a controlled intervention study. Prev Med 2011;53:64-69.
5. Foo SC*, Thia JJP, Ng ZP, Fong NP, Koh GCH. Colorectal Cancer Screening: The Effects of Education on its Barriers and Acceptability. Asia Pac J Public
Health 2011(DOI: 10.1177/1010539511399119).

284
6. Wee LE, Koh GCH*, Toh ZJ. Multi-disease health screening in an urban, low-income setting: a community-based study in Singapore. Ann Acad Med
Singapore 2010;39:750-57. 7. Wong TY*, Gerald CH Koh, Lee EH, Cheong SK, Goh LG. Family medicine
education in Singapore – a long-standing collaboration between specialists and family physicians. Ann Acad Med Singapore 2008;37:132-5.
8. GH Lim*, E Seow, G Koh, D Tan, HP Wong. Study on the discrepancies between the admitting diagnoses from the emergency department and the discharge diagnoses. Hong Kong Journal of Emergency Medicine. 2002;9(2): 78-82.
Others
Editorial, Letter (including Research Letter) or Commentary in Journal Influenza and other infectious diseases 1. J Sng*, D Koh, G Koh. Influenza A (H1N1) infections among healthcare
workers – a cause for cautious optimism? Occup Environ Med 2009;66(9):569-70.
2. Gerald C H Koh*, J Sng, Wong TY, Cheong SK, D Koh. Flu pandemic preparedness guidance for GPs – don’t forget the staff. BMJ 2009. (http://www.bmj.com/cgi/eletters/338/jan08_3/b69)
3. Koh G*, Sng J, Koh D. Preparedness for pandemic influenza in nursing homes. JAMA 2008;300(20):2366-7.
4. Gerald C H Koh*, Wong TY, Cheong SK, D Koh. Avian influenza: A global threat needing a global solution. Asia Pacific Family Medicine Journal. 2008. DOI: doi:10.1186/1447-056X-7-5. Available from http://www.apfmj.com/content/7/1/5.
5. Koh GCH*, D Koh. Preparedness for a bird flu pandemic: Comparing UK and Singapore’s healthcare system. BMJ 2006. (http://bmj.bmjjournals.com/cgi/eletters/333/7570/674-a)
Salivary Biomarkers 1. David Koh*, Gerald C H Koh. The confounding effects of intra-oral metals in
salivary biomarkers - Authors’ reply. Occup Environ Med 2007;64:856. Geriatrics 1. Koh G*, Tan BY, Fong NP, Chan KM, Menon E, Lee KK, Cheong SK, Wong
TY, Cheong A, Chia KS, Koh D. Predictors of Geriatric Rehabilitation Effectiveness and Efficiency, J Am Geriatr Soc 2009;57:S204-5.
2. Thean HPY*, Wong ML, Koh GCH, Wong A. Oral health status and treatment needs of elderly residents in a Singapore nursing home. Ann Acad Med Singapore 2009;38(3):282-3.
3. Gerald C H Koh*. A review of geriatric education in Singapore. Ann Acad Med
Singapore 2007;36(8):687-90.

285
4. Koh GCH*. Ageism in Healthcare. BMJ 2006. (http://bmj.bmjjournals.com/cgi/eletters/333/7567/525)
Medical Education 1. Gerald CH Koh*, Wong TY, Cheong SK, Erle CH Lim, Raymond CS Seet,
Tang WE, Chia CS. Acceptance of medical students by patients from three outpatient settings in a multi-ethnic Asian population. Med Teach 2009;31:776-7.
2. Koh GCH*, Sng J, Koh D. Chaperoning medical students during patient examinations. Ann Acad Med Singapore 2009:38(10):920-1.
3. GCH Koh*. Qualitative physician competencies: Are they neglected? Ann Acad
Med Singapore 2009;38(2):172-3. 4. Koh GCH*, Khoo HE, Wong ML, Koh D. A response from Koh et al. BMJ
2008. E-letter at website http://www.bmj.com/cgi/eletters/336/7651/971 . 5. Koh GCH*, Khoo HE, Wong ML, Koh D. Lack of quantification and
characteristics of faculty staff: More evidence is needed – Authors’ reply. Canadian Medical Association Journal 2008. E-letter at website http://www.cmaj.ca/cgi/eletters/178/1/34#18259.
Family Medicine
1. Stewart M*, Olufemi A, Vingilis E, Freeman T, Koh G. Fragmented research, fragmented care - the need for a new family medicine research approach. Ann Fam Med 2012. http://www.annfammed.org/letters?first-index=&hits=25&days=&submit=Go.
2. Wee LE, Koh GCH*. Hypertension awareness, treatment and control in an urban low-income setting: a community-based study in Singapore. Prev Med
2010;51:447-8. 3. Ong CS, Ooi G, Tan XQ, Lee J, Koh GCH, Verkooijen HM*. Prevalence of
limited cancer knowledge in Singaporeans, its determinants and association with cancer screening. Prev Med 2010;50:304-5.
4. Gerald CH Koh*, Wong TY, Cheong SK. Long-acting beta-2-agonists and not antagonists. BMJ 2007. (http://bmj.com/cgi/eletters/335/7613/253#174107).
5. G Koh*. National Political Will Needed for Implementation of Primary Care Reforms. New Engl J Med 2008. E-Comment at http://www.nejm.org/perspective/primary-care-video/ (16 Nov 08).
6. Lee SM*, Sng, J, Koh GCH, Koh D. Sickness absence - partnership with relevant stakeholders. BMJ 2008. (http://www.bmj.com/cgi/eletters/336/7646/682).
7. Wong TY*, Cheong SK, Gerald CH Koh, Goh LG. Translating the family medicine vision into educational programs in Singapore. Ann Acad Med
Singapore 2008:37(5):421-5. 8. Gerald CH Koh*, Jeremy FY Lim. Bridging the gap between primary and
specialist care: formidable challenges ahead. Ann Acad Med Singapore 2008;37(2):89-90.
Book Chapters & Other Periodicals Influenza and other infectious diseases

286
447-8 1. Gerald C H Koh, David S Q Koh. The Socioeconomic Effects of an Avian
Influenza Pandemic. In Bird flu: A rising pandemic in Asia and beyond? Tambyah P, Leung PC (eds). World Scientific 2006:127-46.
Geriatrics 1. GCH Koh. National long term care severe disability insurance in Singapore.
Older persons in Southeast Asia (Book). EN Arifin, A Ananta (eds). Institute of Southeast Asian Studies (Singapore). 2009. Pages 97-115.
Family Medicine 1. Lim ECH, GCH Koh, Lien CTC, Thomas J, Tan JJH, Tan AKY, Tan EK, Tan
LCS, Au WL. Parkinson’s disease. Ministry of Health Clinical Practice Guidelines 6/2007: Dec 2007.
* Corresponding Author

287
Highest Impact Factor of Journals Since 2006
Journal Impact Factor
NUS/ NUHS Tier
No. of publications
Original Journal Article Others* Total
1. New England Journal of Medicine (NEJM) 52.589 1 - 1 1
2. Journal of the American Medical Association (JAMA) 31.718 1 1 1 2
3. British Medical Journal (BMJ) 12.827 1 - 6 6
4. Canadian Medical Association Journal (CMAJ) 7.464 1 1 1 2
5. PLoS ONE (Public Library of Science) 4.351 - 2 0 2
6. Medical Care 3.745 1 1 - 1
7. Occupational and Environmental Medicine 3.643 1 2 2 4
8. Indoor Air 3.151 1 1 - 1
9. Organizational Behavior and Human Decision Processes 2.740 1 1 - 1
10. Archives of Physical Medicine and Rehabilitation 2.731 - 1 - 1
11. Academic Medicine 2.607 1 1 - 1
12. Annals of Family Medicine 4.975 2 - 1 1
13. Journal of the American Geriatrics Society 3.805 2 - 1 1
14. Preventive Medicine 3.172 2 2 2 4
15. Hypertension Research 3.146 2 1 - 1
16. European Journal of Cardiovascular Prevention and Rehabilitation
2.638 2 1 - 1
17. Tropical Medicine and International Health 2.595 2 1 - 1
18. Respiratory Medicine 2.338 2 1 - 1
19. Acta Neurologica Scandinavica 2.324 2 3 - 3
20. Medical Teacher 1.333 2 1 2 3
21. Annals of Academy of Medicine Singapore 1.200 2 9 6 15
22. International Journal of Stroke 3.125 4 1 - 1
23. International Journal of Infectious Diseases 2.603 4 1 - 1

288
24. Journal of Occupational Health 1.848 4 1 - 1
25. Journal of Asthma 1.476 4 1 - 1
26. Industrial Health 1.215 4 1 - 1
27. Asia-Pacific Journal of Public Health 0.763 - - - 1
28. Asia-Pacific Journal of Family Medicine Pending - - 1 1
29. BOLD (Journal of International Institute on Ageing) - - - 1 1
30. Hong Kong Journal of Emergency Medicine - - 1 - 1
31. Journal of Asthma and Allergy Pending 1 - 1
32. Journal of Occupational Medicine and Toxicology Pending - - 1 1
33. Malta Medical Journal - - 1 - 1
34. Medical Progress - 1 - 1
35. Quality in Primary Care - - 1 - 1
36. Singapore Family Physician - - 1 4 5
37. Singapore Medical Journal - - 1 1 2
Total NA NA 43 31 74
* Editorials, letters (including research letters), commentaries, book chapters and other periodicals

289
Research Grants As Principal Investigator 1. Agency for Integrated Care Research Grant for Project Title Oct 11
“Home Medical Care in Singapore – A Retrospective Research Project of Code 4 Medical Service (Jan 2000 - Dec 2009)” (1 year) [$100,460]
2. Singapore Millennium Foundation Grant for Project Title Sep 11 “Tele-Rehabilitation for Newly-Disabled Homebound Older Persons Needing Supervised Physical Therapy” (3 years) [$749,800]
3. NUS Cross Faculty Grant for Project Title “Tele-Rehabilitative Jan 11 Technologies for Home Therapy in Stroke Patients” (2 years) [S$24,500]
4. Ministry of Health (MOH) Health Services Research (HSR) Apr 10 Competitive Research Grant for Project Title “The health, social and financial effects of care-giving among primary caregivers of elderly stroke patients in the first post stroke year: a prospective cohort study” (2 years) [S$987,000]
5. Mitsui Sumitomo Insurance Welfare Foundation Research Grant Nov 07 for Project Title “The Effects of Exercise on Cognitive Ability, Psychological Well-Being & Immunity in Elderly Patients using a Painless Technique involving Salivary Cortisol and Secretory IgA analysis” (3 years) [$10,000]
6. NUS Academic Research Fund for Project Title “The Rehabilitation Jan 07 Efficiency and Effectiveness of Geriatric Rehabilitation in Community Hospitals in Singapore” (3 years) [S$75,000]
7. NUS Centre for Development of Teaching and Learning (CDTL) Nov 06
Teaching Enhancement Grant for Project Title “Improving Ambulatory Teaching of Medical Students: Identifying Barriers to Acceptance of Student Presence during Medical Consultations from All Stakeholders” (1 year) [S$10,000]
8. NUS Provost Matching Grant for Project Title “The Relationship Jan 06 between Severely Impaired Activities of Daily Living (ADL) Function and Life Expectancy” (2 years) [S$50,000]
9. Start Up Grant from NMRC (National Medical Research Council) Oct 05 for Project Title “The Relationship between Severely Impaired Activities of Daily Living (ADL) Function and Life Expectancy” (1 year) [SS$50,000]

290
(US$1.00 = S$1.40 as of 4 Jun 10) As Co-Investigator 1. National Cancer Centre Research Fund Award for Project Title Mar 12
“Interventions to Increase Colo-rectal Cancer Screening in the Singaporean Population” (with Dr Tam Cam Ha as PI) [$49,820.00]
2. Mitsui Sumitomo Insurance Welfare Foundation Research Grant Dec 11 for Project Title “Oral health status of residents in intermediate care facilities and its relationship on clinical outcomes of medical rehabilitation and quality of life measures” (with Dr Catherine Hong of NUS Dental Faculty as PI) [$9,776.00]
3. National University Cancer Institute Health Research Endowment May 10 Fund for Project Title “Bridging the Gap: Identifying Needs in Primary and Secondary Prevention of Cancer among Singaporeans Aged 40 and Above Living in the Jurong/Clementi Districts” (with A/Prof Adeline Seow as PI) [$92,000]
4. Centre for Communications, Health and the Environment for Project Feb 10
Title “Assessing Internet technology use and diffusion among Singapore family physicians” (with Prof Fiona Chew as PI) (1 year) [US$2,800]
5. Mitsui Sumitomo Insurance Welfare Foundation Research Grant Jan 10 for Project Title “Enhancing Exercise-Mediated Longevity and Brain Function in the Elderly” (with Dr Steve Graham as PI)(3 years) [$9,975.75]
6. NMRC Ad-hoc H1N1 Grant for Project Title “A sero-epidemiology Dec 09 cohort for studying infection rates and host immune responses to the 2009 H1N1 Influenza A” (with Dr Mark Chen as PI) (1 year) [$1,180,700]
7. NMRC Bridging Grant for Project Title “A sero-epidemiology Jul 09 cohort for studying infection rates and host immune responses to the 2009 H1N1 Influenza A” (with Dr Mark Chen as PI) (1 year) [$216,440]
8. NMRC Grant for Project Title “Study of exhaled airflows and the May 09 transmission of airborne viruses for indoor aerosol infection control” (with A/Prof Julian Tang as PI) (3 years) [$996,200]
9. NMRC Grant for Project Title “Genetics of Atopy and Allergic Jul 08 Airway Disease in Singapore” (with Dr Chew Fook Tim as PI) (3 years) [S$809,400]

291
10. Start Up Grant from NMRC (National Medical Research Council) Aug 07
for Project Title “Elderly Hypertensive Patients in Public Primary Care Clinics Study” (with Dr Cheong Seng Kwing as PI) (2 years) [S$50,000]
11. Start-Up Grant from NMRC for Project Title “Retrospective Study Aug 07 of Pre-Diabetes among Hypertensives on Follow-Up in Public Primary Care Clinics” (with Dr Wong Teck Yee as PI) (2 years) [S$50,000]
12. Academic Research Fund Grant for Project Title “Testosterone and Oct 06 Leader Emergence in Small Groups” (with Drs Michael Zyphur & Jayanth Narayanan as PIs) (2 years) [S$40,600]
13. University Research Grant for Project Title “Effects of Exercise May 05 on Brain Health” (with Dr Steve Graham as PI) (3 years) [S$249,850]
14. Niche Area Programme Research Grant (NMRC) for Project Sep 05 Title “Salivary Biomarker Research” (with Prof David Koh as PI) (2 years) [S$150,000]
15. A*STAR BMRC (Biomedical Research Council) for Project Title Jul 03 “Gerontology Research Programme: Biological, Clinical, Psychological and Behavioural Predictors of Health Status in Prospectively Followed-Up Cohorts of Elderly Persons” (3 years) (with A/Prof Ng Tze Pin as PI) [S$1,395,524]
(CAD$1.00 = S$1.30 as of 17 Aug 12)
Copyright © 2022 FDOKUMEN