Functional limits of agreement applied as a novel method comparison tool for accuracy and precision...
6
Short communication Functional limits of agreement applied as a novel method comparison tool for accuracy and precision of inertial measurement unit derived displacement of the distal limb in horses Emil Olsen a,b,n , Thilo Pfau b , Christian Ritz c a Department of Large Animal Sciences, Faculty of Health and Medical Science, University of Copenhagen, Denmark b Department of Clinical Sciences and Services, Structure and Motion Laboratory, The Royal Veterinary College, North Mymms, United Kingdom c Department of Nutrition, Exercise and Sports, Faculty of Science, University of Copenhagen, Denmark article info Article history: Accepted 4 June 2013 Keywords: Position estimate Horse Inertial measurement units Accuracy Method comparison abstract Over ground motion analysis in horses is limited by a small number of strides and restraints of the indoor gait laboratory. Inertial measurement units (IMUs) are transforming the knowledge of human motion and objective clinical assessment through the opportunity to obtain clinically relevant data under various conditions. When using IMUs on the limbs of horses to determine local position estimates, conditions with high dynamic range of both accelerations and rotational velocities prove particularly challenging. Here we apply traditional method agreement and suggest a novel method of functional data analysis to compare motion capture with IMUs placed over the fetlock joint in seven horses. We demonstrate acceptable accuracy and precision at less than or equal to 5% of the range of motion for detection of distal limb mounted cranio-caudal and vertical position. We do not recommend the use of the latero-medial position estimate of the distal metacarpus/metatarsus during walk where the average error is 10% and the maximum error 111% of the range. We also show that functional data analysis and functional limits of agreement are sensitive methods for comparison of cyclical data and could be applied to differentiate changes in gait for individuals across time and conditions. & 2013 Elsevier Ltd. All rights reserved. 1. Introduction In humans, objective clinical gait analysis is widely applied (Wren et al., 2011) such as in cerebellar ataxia (Helwig et al., 2011; Serrao et al., 2011), spinal cord injury (Gil-Agudo et al., 2011; McDermott et al., 2010) and is considered crucial in the assess- ment of cerebral palsy (Chang et al., 2010). Inertial measurement units (IMUs) provide an opportunity to collect stride series with the subject moving with fewer con- straints than in a gait laboratory or on a treadmill. IMUs are increasingly applied in ambulatory monitoring of spatiotemporal kinematics in humans (Fong and Chan, 2010; Rueterbories et al., 2010; Saber-Sheikh et al., 2010; Schwesig et al., 2011) and for lameness assessment in horses (Barrey and Desbrosse, 1996; Keegan et al., 2011; Pfau et al., 2007; Thomsen et al., 2010). In order to justify the use of limb-mounted IMUs to determine displacement (local position estimate) during gait analysis in horses, it is crucial to determine accuracy and precision. Accuracy and precision for IMU derived displacement have previously been determined for upper body landmarks in horses (Pfau et al., 2005; Warner et al., 2010) and centre of mass (CoM) in humans (Esser et al., 2009) as well as foot movement in humans (Mariani et al., 2010). However, the high impact, vibrations and dynamic range of rotation observed for the distal limb in the horse (Gustas et al., 2001; Wilson et al., 2003; Witte et al., 2004) constitute a particularly challenging environment for IMU sensor fusion approaches. A recent attempt at obtaining accuracy and precision from hoof mounted IMUs revealed measurement errors above 10% for latero-medial and dorso-ventral position estimates during walk and trot (Moorman et al., 2012). While consensus amongst previous IMU validation studies (Mariani et al., 2010; Pfau et al., 2005; Schepers et al., 2010; Warner et al., 2010) provide root mean square (RMS) differences or accuracy defined as bias and limits of agreement as described by Bland and Altman (1986) and precision across all measurements Contents lists available at ScienceDirect journal homepage: www.elsevier.com/locate/jbiomech www.JBiomech.com Journal of Biomechanics 0021-9290/$ - see front matter & 2013 Elsevier Ltd. All rights reserved. http://dx.doi.org/10.1016/j.jbiomech.2013.06.004 Abbreviations: CoM, centre of mass; SD, standard deviation; IMU, inertial measurement unit; g, gravitational acceleration; RVC, The Royal Veterinary Col- lege; DMC, distal metacarpus; DMT, distal metatarsus. n Correspondence to: University of Copenhagen, Faculty of Health and Medical Sciences, Department of Large Animal Sciences, Hojbakkegaard Alle 5, 2630 Taastrup, Denmark. Tel.: +45 35332938; fax: +45 35333924. E-mail addresses: [email protected], [email protected] (E. Olsen). Journal of Biomechanics 46 (2013) 2320–2325
Transcript of Functional limits of agreement applied as a novel method comparison tool for accuracy and precision...
Short communication
Functional limits of agreement applied as a novel method comparisontool for accuracy and precision of inertial measurement unit deriveddisplacement of the distal limb in horses
Emil Olsen a,b,n, Thilo Pfau b, Christian Ritz c
a Department of Large Animal Sciences, Faculty of Health and Medical Science, University of Copenhagen, Denmarkb Department of Clinical Sciences and Services, Structure and Motion Laboratory, The Royal Veterinary College, North Mymms, United Kingdomc Department of Nutrition, Exercise and Sports, Faculty of Science, University of Copenhagen, Denmark
a r t i c l e i n f o
Article history:Accepted 4 June 2013
Keywords:Position estimateHorseInertial measurement unitsAccuracyMethod comparison
a b s t r a c t
Over ground motion analysis in horses is limited by a small number of strides and restraints of the indoorgait laboratory. Inertial measurement units (IMUs) are transforming the knowledge of human motionand objective clinical assessment through the opportunity to obtain clinically relevant data under variousconditions. When using IMUs on the limbs of horses to determine local position estimates, conditionswith high dynamic range of both accelerations and rotational velocities prove particularly challenging.Here we apply traditional method agreement and suggest a novel method of functional data analysis tocompare motion capture with IMUs placed over the fetlock joint in seven horses. We demonstrateacceptable accuracy and precision at less than or equal to 5% of the range of motion for detection of distallimb mounted cranio-caudal and vertical position. We do not recommend the use of the latero-medialposition estimate of the distal metacarpus/metatarsus during walk where the average error is 10% andthe maximum error 111% of the range. We also show that functional data analysis and functional limits ofagreement are sensitive methods for comparison of cyclical data and could be applied to differentiatechanges in gait for individuals across time and conditions.
& 2013 Elsevier Ltd. All rights reserved.
1. Introduction
In humans, objective clinical gait analysis is widely applied(Wren et al., 2011) such as in cerebellar ataxia (Helwig et al., 2011;Serrao et al., 2011), spinal cord injury (Gil-Agudo et al., 2011;McDermott et al., 2010) and is considered crucial in the assess-ment of cerebral palsy (Chang et al., 2010).
Inertial measurement units (IMUs) provide an opportunity tocollect stride series with the subject moving with fewer con-straints than in a gait laboratory or on a treadmill. IMUs areincreasingly applied in ambulatory monitoring of spatiotemporalkinematics in humans (Fong and Chan, 2010; Rueterbories et al.,2010; Saber-Sheikh et al., 2010; Schwesig et al., 2011) and for
lameness assessment in horses (Barrey and Desbrosse, 1996;Keegan et al., 2011; Pfau et al., 2007; Thomsen et al., 2010).
In order to justify the use of limb-mounted IMUs to determinedisplacement (local position estimate) during gait analysis inhorses, it is crucial to determine accuracy and precision. Accuracyand precision for IMU derived displacement have previously beendetermined for upper body landmarks in horses (Pfau et al., 2005;Warner et al., 2010) and centre of mass (CoM) in humans (Esseret al., 2009) as well as foot movement in humans (Mariani et al.,2010). However, the high impact, vibrations and dynamic range ofrotation observed for the distal limb in the horse (Gustas et al.,2001; Wilson et al., 2003; Witte et al., 2004) constitute aparticularly challenging environment for IMU sensor fusionapproaches. A recent attempt at obtaining accuracy and precisionfrom hoof mounted IMUs revealed measurement errors above 10%for latero-medial and dorso-ventral position estimates duringwalk and trot (Moorman et al., 2012).
While consensus amongst previous IMU validation studies(Mariani et al., 2010; Pfau et al., 2005; Schepers et al., 2010;Warner et al., 2010) provide root mean square (RMS) differences oraccuracy defined as bias and limits of agreement as described byBland and Altman (1986) and precision across all measurements
Contents lists available at ScienceDirect
journal homepage: www.elsevier.com/locate/jbiomechwww.JBiomech.com
Journal of Biomechanics
0021-9290/$ - see front matter & 2013 Elsevier Ltd. All rights reserved.http://dx.doi.org/10.1016/j.jbiomech.2013.06.004
Abbreviations: CoM, centre of mass; SD, standard deviation; IMU, inertialmeasurement unit; g, gravitational acceleration; RVC, The Royal Veterinary Col-lege; DMC, distal metacarpus; DMT, distal metatarsus.
n Correspondence to: University of Copenhagen, Faculty of Health and MedicalSciences, Department of Large Animal Sciences, Hojbakkegaard Alle 5, 2630 Taastrup,Denmark. Tel.: +45 35332938; fax: +45 35333924.
E-mail addresses: [email protected], [email protected] (E. Olsen).
Journal of Biomechanics 46 (2013) 2320–2325
throughout a stride, there is currently no agreement on a stan-dardized statistical method to assess differences throughout a stepcycle between 3D motion capture methods.
The aim of this study is to investigate the suitability of IMUs toquantify displacement of the distal limb in horses outside the gaitlaboratory. The objective is to compare displacement derived fromdistal limb mounted IMUs to motion capture (as the referencestandard) using functional limits of agreement.
In contrast to Olsen et al. (2012) where we investigatedaccuracy and precision of temporal gait events extracted fromlimb mounted IMUs, here we compare spatial parameters betweenmotion capture and IMUs.
2. Materials and methods
The following section briefly describes the same horses used in Olsen et al.(2012) and emphasises the differences in processing of motion capture andIMU data.
2.1. Horses
Seven horses of different breeds were used in this study: four researchThoroughbreds, two client-owned Warmblood horses and one client-owned ponyof unknown breed. There were five geldings and two mares with a mean age of4.3 years (range 2–7 years) and mean height of 1.56 m (range 1.35–1.69 m). Allprocedures were carried out at RVC Structure & Motion Laboratory's gait assess-ment facilities, approved by the ethics and welfare committee at the RVC andcomplied with the European Animal (Scientific Procedures) Act 1986.
3. Study design
3.1. Data acquisition and processing
Data were acquired and processed as described in Olsen et al.(2012). A 36 mm reflective marker was centred over each distallimb IMU and a 26 mm reflective marker was placed over theestimated location of the Centre of Mass (CoM) on both sides ofthe horse (Buchner et al., 2000). Motion was recorded in a right-handed Cartesian coordinate system with cranio-caudal (X, posi-tive forwards) latero-medial (Y, positive left) and dorso-ventral(Z, positive upwards). Motion capture was acquired with 12infrared cameras (Qualisys Oqus 300 and 500 series, Qualisys AB,Sweden). IMU kinematics were acquired using four 18 g IMUs(MTx, Xsens Technologies B.V., The Netherlands) with both motioncapture and IMUs sampling at 200 Hz. The cranial displacement ofthe CoM cranio-caudal displacement was subtracted from thedistal limb markers forward motion to align displacement frommotion capture with that of the IMUs. Synchronised motion cycledata from IMUs and motion capture were segmented into stridesusing local minima in the cranio-caudal displacement. Each stridewas interpolated to 100 equidistantly spaced points (Crane et al.,2010).
3.2. Statistical analysis
Agreement analysis corrected for repeated measures as describedby Bland and Altman (2007) was performed with accuracy definedas the mean difference (bias) between the two methods andprecision as the SD of the bias. The maximum error was calculatedas the SD divided by the maximum range of the data and theaverage error as bias divided by the maximum range. It should benoted that the method bias is inseparable from error in theorientation estimate of the sensor (Brodie et al., 2008; Pfau et al.,2005). A more comprehensive complementary analysis, which fullyappreciated the functional data structure in the entire stride, wasalso carried out. More specifically, the approach by Bland and
Table 3Results of functional data analysis tests for distal limb mounted IMUs compared to motion capture. All values are p values.
Axes Overall LF1 RF2 RH3 LH4
Cranio-caudal (X) o0.0001 0.01 0.007 0.003 0.003Latero-medial (Y) 0.03 0.42 0.10 0.05 0.05Dorso-ventral (Z) o0.0001 0.08 0.15 0.0005 0.01
1 LF: Left front limb.2 RF: Right front limb.3 RH: Right hind limb.4 LH: Left hind limb.
Table 2Agreement analysis and descriptive statistics for all hind limb position estimatesderived from distal limb mounted IMUs compared to motion capture. All values arein millimetre.
Hind limbsAxes
Agreement Descriptive Statistics
LloAa UloAb Biasc SDd Rangee Averageerrorf
Max.errorg
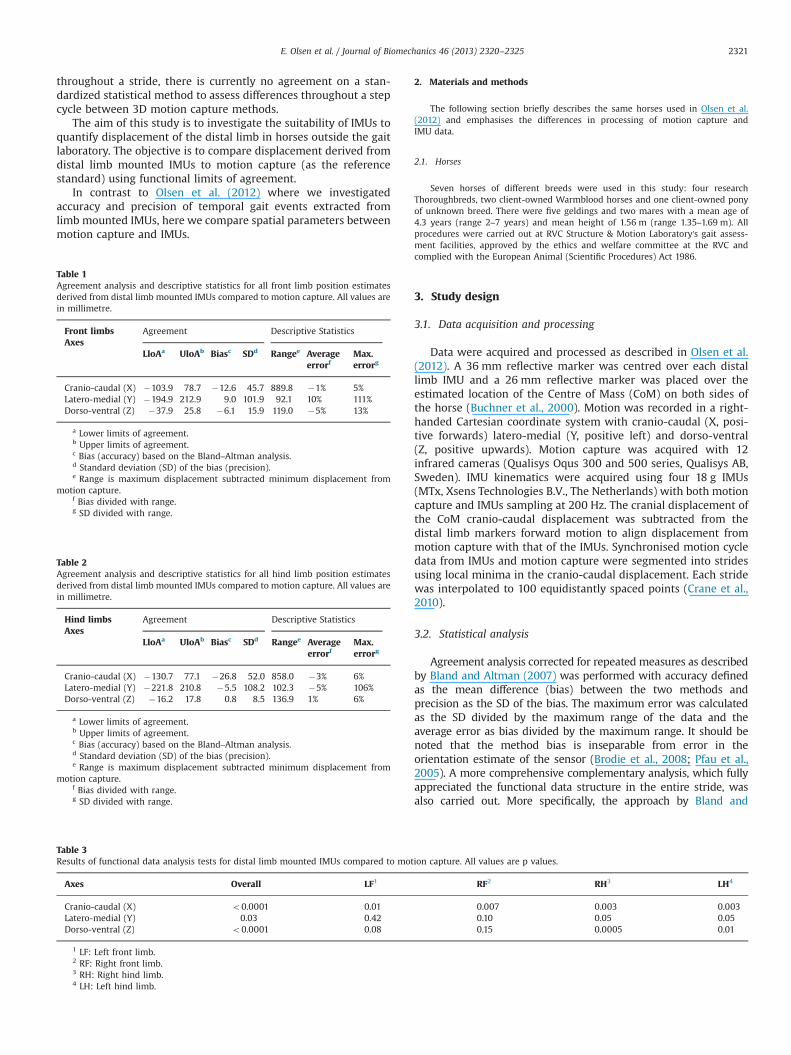
Cranio-caudal (X) !130.7 77.1 !26.8 52.0 858.0 !3% 6%Latero-medial (Y) !221.8 210.8 !5.5 108.2 102.3 !5% 106%Dorso-ventral (Z) !16.2 17.8 0.8 8.5 136.9 1% 6%
a Lower limits of agreement.b Upper limits of agreement.c Bias (accuracy) based on the Bland–Altman analysis.d Standard deviation (SD) of the bias (precision).e Range is maximum displacement subtracted minimum displacement from
motion capture.f Bias divided with range.g SD divided with range.
Table 1Agreement analysis and descriptive statistics for all front limb position estimatesderived from distal limb mounted IMUs compared to motion capture. All values arein millimetre.
Front limbsAxes
Agreement Descriptive Statistics
LloAa UloAb Biasc SDd Rangee Averageerrorf
Max.errorg
Cranio-caudal (X) !103.9 78.7 !12.6 45.7 889.8 !1% 5%Latero-medial (Y) !194.9 212.9 9.0 101.9 92.1 10% 111%Dorso-ventral (Z) !37.9 25.8 !6.1 15.9 119.0 !5% 13%
a Lower limits of agreement.b Upper limits of agreement.c Bias (accuracy) based on the Bland–Altman analysis.d Standard deviation (SD) of the bias (precision).e Range is maximum displacement subtracted minimum displacement from
motion capture.f Bias divided with range.g SD divided with range.
E. Olsen et al. / Journal of Biomechanics 46 (2013) 2320–2325 2321
Altman (2007) was extended to a functional data setting followingthe two-step procedure proposed by Faraway (1997): initiallyseparate linear mixed models with fixed effects of limb and methodand horse-specific random effects were fitted to the repeatedmeasurements data from the seven horses available at each of the100 time points in the stride. Subsequently these separate model fitswere combined into functional data estimates of the mean trends inthe strides and a functional data extension of the F-test extra-sum ofsquares statistic where the usual residual sums of squares werereplaced by integrated residual sums of squares over the entire timeperiod considered for the strides
F "!R#y!yBi$dt$!!
R#y!yAi$dt
! "=#p!q$
!R#y!yAi$dt
! "=#n!p$
#1$
where y denotes the observed values and yA and yB the predictedvalues from the two models being compared (model B is nested inmodel A), ! means summation across all strides; the integral
R… dt
is the area of the difference between observed and predicted stridesover the standardized interval [0,100]. Finally, p is the number of
parameters in model A at each time point, q is the number ofparameters in model B at each time point, and n denotes the totalnumber of strides in the data set. The functional F-test is aconvenient, fast and robust test procedure that is well-adopted forlarge datasets, but may be somewhat less powerful than otherfunctional or multivariate test procedures (Cuevas et al., 2004; Shenand Faraway, 2004). P-values were obtained using F-distributionswith degrees of freedom obtained using a Satterthwaite-type ofapproximation. More specifically, combination of separate fits wasachieved using interpolation, which was justified in view of theregular and dense design considered (100 time points per stride).This means that smoothing techniques, like smoothing splines orcubic splines, were not needed, in contrast to many other functionaldata approaches (Ramsay and Silverman, 2005). The interpolationapproach is well-suited for the stride data where the measurementerror is relatively small compared to the variation between horses(Faraway, 1997). The functional data estimates of the mean trendsper limb were used to evaluate the method bias in time and toprovide functional confidence bands in time, similar to the limits ofagreements used in a standard Bland–Altman plot. The functional
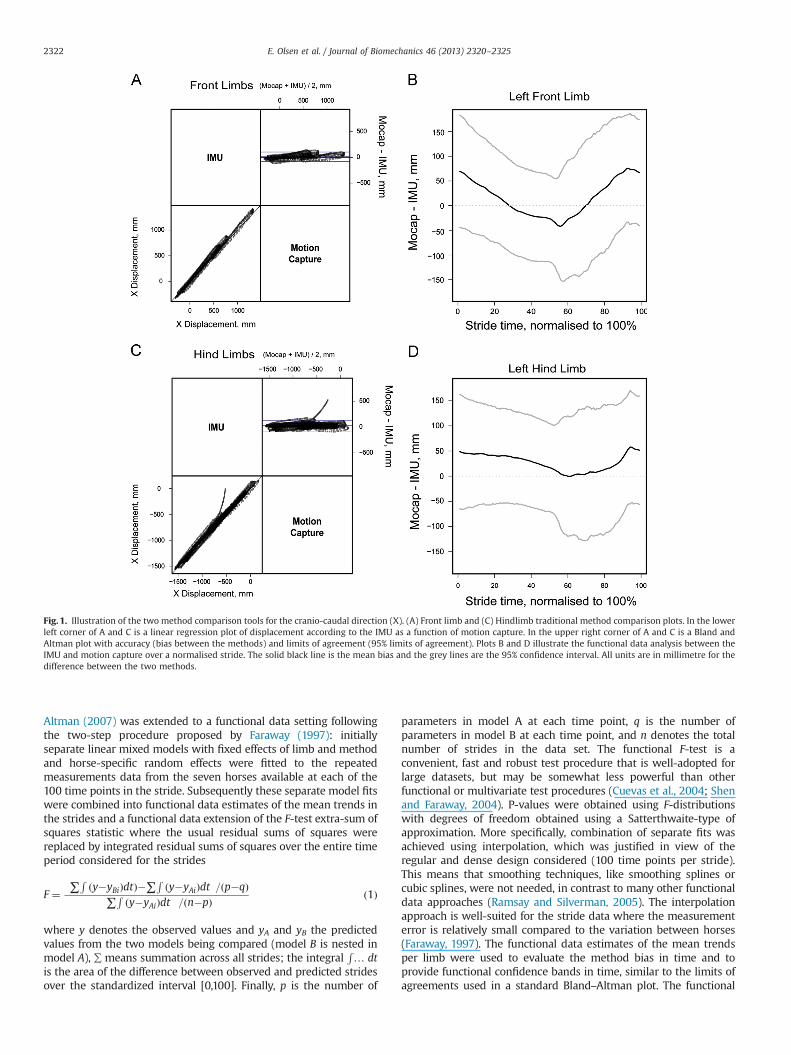
Fig. 1. Illustration of the two method comparison tools for the cranio-caudal direction (X). (A) Front limb and (C) Hindlimb traditional method comparison plots. In the lowerleft corner of A and C is a linear regression plot of displacement according to the IMU as a function of motion capture. In the upper right corner of A and C is a Bland andAltman plot with accuracy (bias between the methods) and limits of agreement (95% limits of agreement). Plots B and D illustrate the functional data analysis between theIMU and motion capture over a normalised stride. The solid black line is the mean bias and the grey lines are the 95% confidence interval. All units are in millimetre for thedifference between the two methods.
E. Olsen et al. / Journal of Biomechanics 46 (2013) 2320–23252322
F-tests were used to assess differences between the two methods,similar to the paired t-test supplementing the standard Bland–Altman procedure.
The statistical analysis was carried out using R version 2.13.1 (RCore Team, 2013). In particular, the extension package MethCompwas used for agreement analysis with repeated measures perhorse (Carstensen et al., 2012) and custom written R scriptsutilising the extension package lme4 (Bates et al., 2012).
4. Results
Outcome measures from the agreement analysis are sum-marised in Table 1 for 30 front limb steps and Table 2 for 28 hindlimb steps. The average error is between 0.6% and 9.8% for all axes.The maximum error for cranio-caudal displacement is 5.1% forfront limb and 6.1% for hind limb. For the dorso-ventral displace-ment the maximum error is 13.4% for front limbs and 6.2% for hindlimbs, whereas the latero-medial maximum error ranges from105.7% for hind limbs to 110.7% for front limbs.
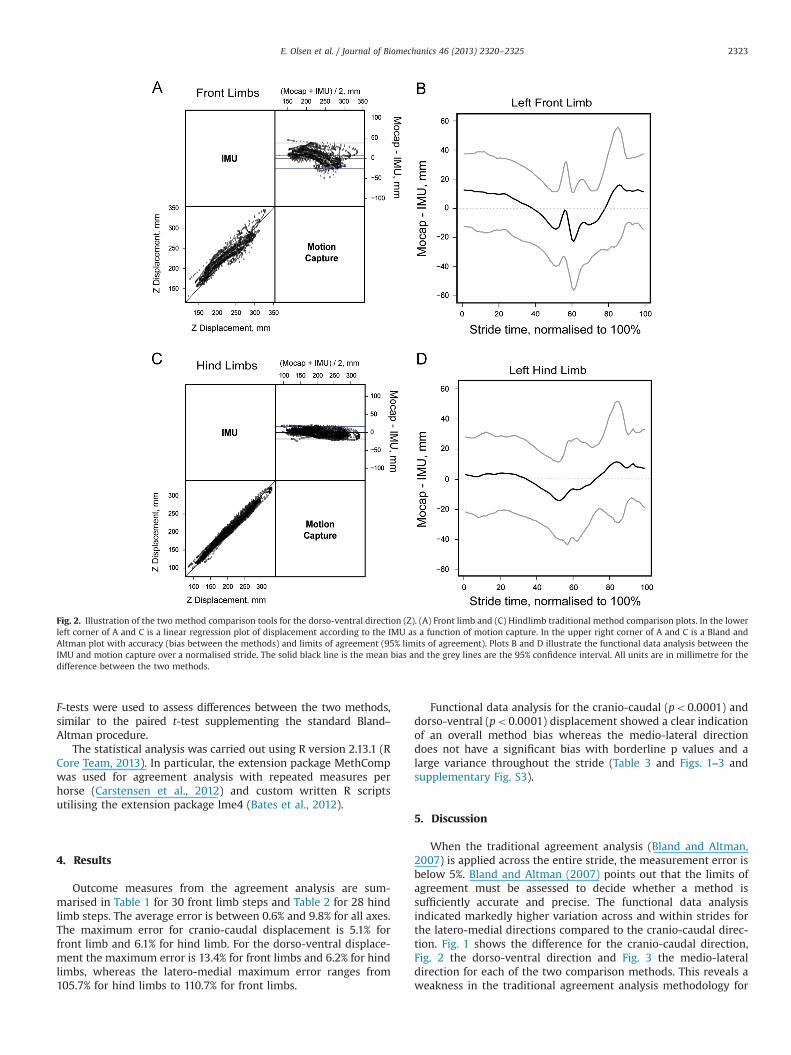
Functional data analysis for the cranio-caudal (po0.0001) anddorso-ventral (po0.0001) displacement showed a clear indicationof an overall method bias whereas the medio-lateral directiondoes not have a significant bias with borderline p values and alarge variance throughout the stride (Table 3 and Figs. 1–3 andsupplementary Fig. S3).
5. Discussion
When the traditional agreement analysis (Bland and Altman,2007) is applied across the entire stride, the measurement error isbelow 5%. Bland and Altman (2007) points out that the limits ofagreement must be assessed to decide whether a method issufficiently accurate and precise. The functional data analysisindicated markedly higher variation across and within strides forthe latero-medial directions compared to the cranio-caudal direc-tion. Fig. 1 shows the difference for the cranio-caudal direction,Fig. 2 the dorso-ventral direction and Fig. 3 the medio-lateraldirection for each of the two comparison methods. This reveals aweakness in the traditional agreement analysis methodology for
Fig. 2. Illustration of the two method comparison tools for the dorso-ventral direction (Z). (A) Front limb and (C) Hindlimb traditional method comparison plots. In the lowerleft corner of A and C is a linear regression plot of displacement according to the IMU as a function of motion capture. In the upper right corner of A and C is a Bland andAltman plot with accuracy (bias between the methods) and limits of agreement (95% limits of agreement). Plots B and D illustrate the functional data analysis between theIMU and motion capture over a normalised stride. The solid black line is the mean bias and the grey lines are the 95% confidence interval. All units are in millimetre for thedifference between the two methods.
E. Olsen et al. / Journal of Biomechanics 46 (2013) 2320–2325 2323

cyclical data where a comparison for each equidistant point duringthe stride is needed to estimate and locate the measurement error.The novel method comparison approach reveals a pattern system-atically varying throughout the stride where the IMUs eitheroverestimate or underestimate the displacement for the frontlimbs (Fig. 1B), but systematically shows a positive bias for thehind limbs (Fig. 1D). This emphasises that IMUs are currently notas accurate and precise as infrared motion capture during highimpact and extreme rotational motion such as those in the distallimb of the horse. In addition these functional data analytic testshave the capacity to detect small differences between methods orconditions for functional data and be applied in a clinical datasetas recently described by Roislien et al (2012).
Despite the differences detected with the functional dataanalysis, the accuracy reported in this study is comparable to orbetter than IMU accuracy found in the studies listed in Table S1.Neither of the studies using limb or foot mounted IMUs in humanshas described latero-medial accuracy and precision.
Previous studies with earlier sensor generations found orienta-tion estimates to be within !2.4 to +5.41 and average sensorerrors below 5% during walk for IMUs mounted on the trunk (Pfau
et al., 2005). These errors are similar to the ones in the presentstudy for the cranio-caudal and vertical positions and also here thelatero-medial axis of the distal limb mounted IMU has a markedlyhigher error. Given the high rotation rate and impact of the equinedigit (Witte et al., 2004) compared to the upper body, the errorsfound in this study are smaller than or comparable to the errorsfound in previous studies. Skin displacement of the CoM marker isa possible error source for the cranio-caudal position estimates.Faber et al (2001) found a 10–15% error in the flexion extensionassessment of the dorsal spinous processes due to skin displace-ment when reflective markers were compared to bone fixatedmarkers. To reduce the effect of skin displacement, we assumedconstant speed for each trial and fitted a linear regression to thecranio-caudal displacement of the CoM marker. The small errorpresent in the cranio-caudal direction indicates that skin displace-ment does not have a marked effect on our results. Using non-elastic materials reduced movement of the marker relative to theIMU. Limited marker movement relative to the IMU could certainlyhappen during impact and other fast oscillating events, howevervibration is greatly dampened above the fetlock joint (Gustas et al.,2001). It is not possible to separate skin and marker movement
Fig. 3. Illustration of the two method comparison tools for the latero-medial direction (Y). (A) Front limb and (C) Hindlimb traditional method comparison plots. In the lowerleft corner of A and C is a linear regression plot of displacement according to the IMU as a function of motion capture. In the upper right corner of A and C is a Bland andAltman plot with accuracy (bias between the methods) and limits of agreement (95% limits of agreement). Plots B, and D illustrate the functional data analysis between theIMU and motion capture over a normalised stride. The solid black line is the mean bias and the grey lines are the 95% confidence interval. All units are in millimetre for thedifference between the two methods.
E. Olsen et al. / Journal of Biomechanics 46 (2013) 2320–23252324
errors from measurement error of the sensor although previousstudies using the same IMUs on a pendulum (Brodie et al., 2008)yield errors between 0.8 and 1.31. A recent study using hoofmounted IMUs (Moorman et al., 2012) had similar inaccuracy inthe cranio-caudal (X) direction (1.06% for front limb and 2.89% forhind limb) with higher inaccuracies for the dorso-ventral(Z) direction (12.91% for front limbs and 10.41% for hind limbs)and latero-medial (Y) direction (16.69% for hind limbs and 18.57%for front limbs). The higher error on the latero-medial axis in thepresent study is likely due to the relatively smaller range of motionand a cross talk effect of the accelerometers and gyroscopes duringlocomotion resulting in a bias for the integration possibly exag-gerated by a small outward rotation of the sensor when alignedwith the limb axis.
The good accuracy and precision of fetlock mounted IMUs forthe vertical and cranio-caudal displacement combined with thegood accuracy and precision for gait-event detection (Olsen et al.,2012) opens great possibilities for equine gait analysis. Whencombined with a GPS (Pfau et al., 2006; Terrier and Schutz, 2005),equestrian sports could be analysed outside the gait laboratory.
Conflicts of interest
We have no conflicts of interest to disclose.
Acknowledgements
We would like to acknowledge the funding bodies; The RCVStrust, Kustos of 1881, University of Copenhagen, research schoolKLINIK and department of Large Animal Sciences as well as DanishAgency for Science Technology and Innovation. The funding bodieshave not been involved in any parts of the study or in writing ofthe paper. We would also like to thank colleagues from theStructure & Motion Laboratory; Justin Perkins for help with horses,Victoria Unt for horse handling and Sandra Starke, AleksandraBirn-Jeffrey, Sharon Warner and Joanne Gordon for help duringdata collection.
Appendix A. Supporting information
Supplementary data associated with this article can be found inthe online version at http://dx.doi.org/10.1016/j.jbiomech.2013.06.004.
References
Barrey, E., Desbrosse, F., 1996. Lameness detection using an accelerometric device.Pferdeheilkunde 12, 617–622.
Bates, D., Maechler, M., Bolker, B., 2012. lme4: Linear mixed-effects models using S4classes. R Package. 0.999999-0 ed. R Project, !http://CRAN.R-project.org".
Bland, J.M., Altman, D.G., 1986. Statistical methods for assessing agreementbetween two methods of clinical measurement. Lancet 1, 307–310.
Bland, J.M., Altman, D.G., 2007. Agreement between methods of measurement withmultiple observations per individual. Journal of Biopharmaceutical Statistics 17,571–582.
Brodie, M.A., Walmsley, A., Page, W., 2008. Dynamic accuracy of inertial measure-ment units during simple pendulum motion. Computer Methods in Biomecha-nics and Biomedical Engineering 11, 235–242.
Buchner, H.H., Obermuller, S., Scheidl, M., 2000. Body centre of mass movement inthe sound horse. Veterinary Journal 160, 225–234.
Carstensen, B., Gurrin, L., Ekstrom, C., 2012. MethComp: functions for analysis ofmethod comparison studies. R package version 1.15 ed, !http://CRAN.R-project.org/package"MethComp".
Chang, F.M., Rhodes, J.T., Flynn, K.M., Carollo, J.J., 2010. The role of gait analysis intreating gait abnormalities in cerebral palsy. Orthopedic Clinics of NorthAmerica 41, 489–506.
Crane, E.A., Cassidy, R.B., Rothman, E.D., Gerstner, G.E., 2010. Effect of registrationon cyclical kinematic data. Journal of Biomechanics 43, 2444–2447.
Cuevas, A., Febrero, M., Fraiman, R., 2004. An anova test for functional data.Computational Statistics and Data Analysis 47, 111–122.
Esser, P., Dawes, H., Collett, J., Howells, K., 2009. IMU: inertial sensing of verticalCoM movement. Journal of Biomechanics 42, 1578–1581.
Faber, M., Schamhardt, H., van Weeren, R., Barneveld, A., 2001. Methodology andvalidity of assessing kinematics of the thoracolumbar vertebral column inhorses on the basis of skin-fixated markers. American Journal of VeterinaryResearch 62, 301–306.
Faraway, J.J., 1997. Regression analysis for a functional response. Technometrics,254–261.
Fong, D.T.-P., Chan, Y.-Y., 2010. The use of wearable inertial motion sensors inhuman lower limb biomechanics studies: a systematic review. Sensors 10,11556–11565.
Gil-Agudo, A., Perez-Nombela, S., Forner-Cordero, A., Perez-Rizo, E., Crespo-Ruiz, B.,del Ama-Espinosa, A., 2011. Gait kinematic analysis in patients with a mild formof central cord syndrome. Journal of Neuroengineering and Rehabilitation 8, 7.
Gustas, P., Johnston, C., Roepstorff, L., Drevemo, S., 2001. In vivo transmission ofimpact shock waves in the distal forelimb of the horse. Equine VeterinaryJournal, 11–15.
Helwig, N.E., Hong, S., Hsiao-Wecksler, E.T., Polk, J.D., 2011. Methods to temporallyalign gait cycle data. Journal of Biomechanics 44, 561–566.
Keegan, K.G., Kramer, J., Yonezawa, Y., Maki, H., Pai, P.F., Dent, E.V., Kellerman, T.E.,Wilson, D.A., Reed, S.K., 2011. Assessment of repeatability of a wireless, inertialsensor-based lameness evaluation system for horses. American Journal ofVeterinary Research 72, 1156–1163.
Mariani, B., Hoskovec, C., Rochat, S., Bula, C., Penders, J., Aminian, K., 2010. 3D gaitassessment in young and elderly subjects using foot-worn inertial sensors.Journal of Biomechanics 43, 2999–3006.
McDermott, A., Bolger, C., Keating, L., McEvoy, L., Meldrum, D., 2010. Reliability ofthree-dimensional gait analysis in cervical spondylotic myelopathy. Gait andPosture 32, 552–558.
Moorman, V.J., Reiser Ii, R.F., McIlwraith, C.W., Kawcak, C.E., 2012. Validation of anequine inertial measurement unit system in clinically normal horses duringwalking and trotting. American Journal of Veterinary Research 73, 1160–1170.
Olsen, E., Haubro Andersen, P., Pfau, T., 2012. Accuracy and precision of equine gaitevent detection during walking with limb and trunk mounted inertial sensors.Sensors 12, 8145–8156.
Pfau, T., Robilliard, J.J., Weller, R., Jespers, K., Eliashar, E., Wilson, A.M., 2007.Assessment of mild hindlimb lameness during over ground locomotion usinglinear discriminant analysis of inertial sensor data. Equine Veterinary Journal39, 407–413.
Pfau, T., Witte, T.H., Wilson, A.M., 2005. A method for deriving displacement dataduring cyclical movement using an inertial sensor. Journal of ExperimentalBiology 208, 2503–2514.
Pfau, T., Witte, T.H., Wilson, A.M., 2006. Centre of mass movement and mechanicalenergy fluctuation during gallop locomotion in the Thoroughbred racehorse.Journal of Experimental Biology 209, 3742–3757.
R Core Team, 2013. R: A language and environment for statistical computing,3.0.0 ed. R Foundation for Statistical Computing, Vienna, Austria.
Ramsay, J.O., Silverman, B.W., 2005. Functional Data Analysis, second ed. WileyOnline Library, New York, USA.
Roislien, J., Rennie, L., Skaaret, I., 2012. Functional limits of agreement: a method forassessing agreement between measurements of gait curves. Gait and Posture 36 (3).
Rueterbories, J., Spaich, E.G., Larsen, B., Andersen, O.K., 2010. Methods for gait eventdetection and analysis in ambulatory systems. Medical Engineering and Physics32, 545–552.
Saber-Sheikh, K., Bryant, E.C., Glazzard, C., Hamel, A., Lee, R.Y., 2010. Feasibility ofusing inertial sensors to assess human movement. Manual Therapy 15, 122–125.
Schepers, H.M., van Asseldonk, E.H., Baten, C.T., Veltink, P.H., 2010. Ambulatoryestimation of foot placement during walking using inertial sensors. Journal ofBiomechanics 43, 3138–3143.
Schwesig, R., Leuchte, S., Fischer, D., Ullmann, R., Kluttig, A., 2011. Inertial sensorbased reference gait data for healthy subjects. Gait and Posture 33, 673–678.
Serrao, M., Pierelli, F., Ranavolo, A., Draicchio, F., Conte, C., Don, R., Di Fabio, R.,Lerose, M., Padua, L., Sandrini, G., Casali, C., 2012. Gait pattern in inheritedcerebellar ataxias. Cerebellum 11 (1), 194–211.
Shen, Q., Faraway, J., 2004. An F test for linear models with functional responses.Statistica Sinica 14, 1239–1258.
Terrier, P., Schutz, Y., 2005. How useful is satellite positioning system (GPS) to trackgait parameters? A review. Journal of Neuroengineering and Rehabilitation 2,28.
Thomsen, M.H., Persson, A.B., Jensen, A.T., Sørensen, H., Andersen, P.H., 2010.Agreement between accelerometric symmetry scores and clinical lamenessscores during experimentally induced transient distension of the metacarpo-phalangeal joint in horses. Equine Veterinary Journal 42, 510–515.
Warner, S.M., Koch, T.O., Pfau, T., 2010. Inertial sensors for assessment of backmovement in horses during locomotion over ground. Equine Veterinary Journal42, 417–424.
Wilson, A.M., Watson, J.C., Lichtwark, G.A., 2003. Biomechanics: a catapult actionfor rapid limb protraction. Nature 421, 35–36.
Witte, T.H., Knill, K., Wilson, A.M., 2004. Determination of peak vertical groundreaction force from duty factor in the horse (Equus caballus). Journal ofExperimental Biology 207, 3639–3648.
Wren, T.A., Gorton 3rd, G.E., Ounpuu, S., Tucker, C.A., 2011. Efficacy of clinical gaitanalysis: a systematic review. Gait and Posture 34, 149–153.
E. Olsen et al. / Journal of Biomechanics 46 (2013) 2320–2325 2325