Functional income distribution and aggregate demand in the Euro-area
39
ePub WU Institutional Repository Engelbert Stockhammer and Özlem Onaran and Stefan Ederer Functional income distribution and aggregate demand in the Euro-area Paper Original Citation: Stockhammer, Engelbert and Onaran, Özlem and Ederer, Stefan (2007) Functional income distribution and aggregate demand in the Euro-area. Department of Economics Working Paper Series, 102. Inst. für Volkswirtschaftstheorie und -politik, WU Vienna University of Economics and Business, Vienna. This version is available at: Available in ePub WU : February 2007 ePub WU , the institutional repository of the WU Vienna University of Economics and Business, is provided by the University Library and the IT-Services. The aim is to enable open access to the scholarly output of the WU.
Transcript of Functional income distribution and aggregate demand in the Euro-area

ePubWU Institutional Repository
Engelbert Stockhammer and Özlem Onaran and Stefan Ederer
Functional income distribution and aggregate demand in the Euro-area
Paper
Original Citation:Stockhammer, Engelbert and Onaran, Özlem and Ederer, Stefan (2007) Functional incomedistribution and aggregate demand in the Euro-area. Department of Economics Working PaperSeries, 102. Inst. für Volkswirtschaftstheorie und -politik, WU Vienna University of Economics andBusiness, Vienna.
This version is available at: http://epub.wu.ac.at/346/Available in ePubWU: February 2007
ePubWU, the institutional repository of the WU Vienna University of Economics and Business, isprovided by the University Library and the IT-Services. The aim is to enable open access to thescholarly output of the WU.
http://epub.wu.ac.at/

Vienna University of Economics & B.A. Department of Economics Working Paper Series
Functional income distribution and aggregate
demand in the Euro-area *
Engelbert Stockhammer†, Özlem Onaran‡ and Stefan Ederer§
Working Paper No. 102, Feb 2007
Abstract ― An increase in the wage share has contradictory effects on the subaggregates of aggregate demand. Private consumption expenditures ought to increase because wage incomes typically are associated with higher consumption propensities than capital incomes. Investment expenditures ought to be negatively affected because investment will positively depend on profits. Net exports will be negatively affected because an increase in the wage share corresponds to an increase in unit labor costs and thus a loss in competitiveness. Theoretically aggregate demand can therefore be either wage led or profit led depending on how these effects add up. The results will crucially depend on how open the economy is internationally. The paper estimates a Post-Kaleckian macro model incorporating these effects for the Euro area and finds that the Euro area is presently in a wage-led demand regime. Implications for wage policies are discussed. Keywords: distribution, demand, investment, consumption, foreign trade, macroeconomics, Keynesian economics JEL-Classification: E12, E20, E22, E25, E61
* The authors are grateful to Eckhard Hein, Michael Mesch, Werner Raza and Rudolph Zwiener for comments. Support from FWF Project Nr. P18419-G05 and the Chamber of Labor, Austria, is acknowledged. The usual disclaimers apply. † Corresponding author: Engelbert Stockhammer, Institut für Geld- und Fiskalpolitik, Vienna University of Economics and Business Administration, Augasse 2-6, A-1090 Vienna, Austria, e-mail: [email protected], tel: +43 1 31336 4509, fax: +43 1 31336 728 ‡ Vienna University of Economics and Business Administration, [email protected] § Vienna University of Economics and Business Administration, [email protected]
1. Introduction
Maintaining international competitiveness has become one of the prime policy objectives of
European politics. The Lisbon Agenda aims at making Europe the world’s most competitive
economic region. In a recent publication the European Commission (2006) argues that
„productivity increases, combined with wage moderation, should help to maintain the EU’s
competitive position in an increasingly integrated world economy“ and encourages member
states to „ensure employment-friendly labour cost developments and wage setting
mechanisms“ ( European Commission 2006, p.40). The term “employment-friendly labour
costs developments” is not defined in the text, but from the context it is clear to mean wage
moderation.5
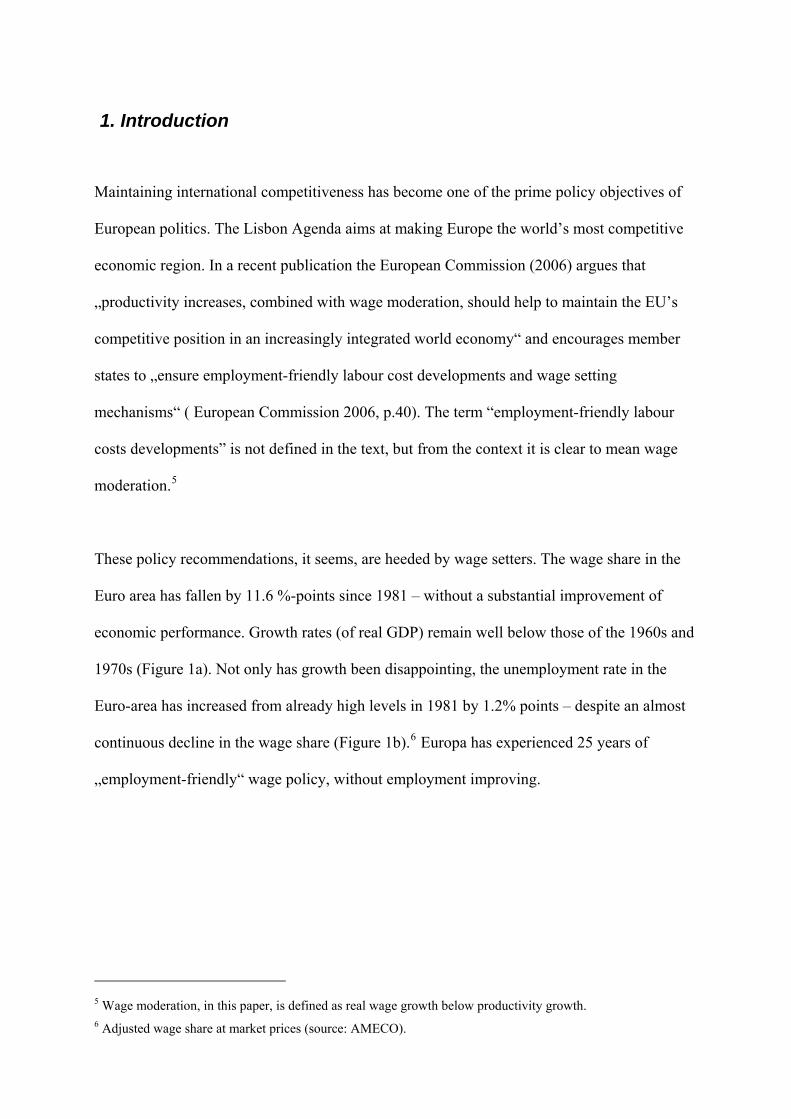
These policy recommendations, it seems, are heeded by wage setters. The wage share in the
Euro area has fallen by 11.6 %-points since 1981 – without a substantial improvement of
economic performance. Growth rates (of real GDP) remain well below those of the 1960s and
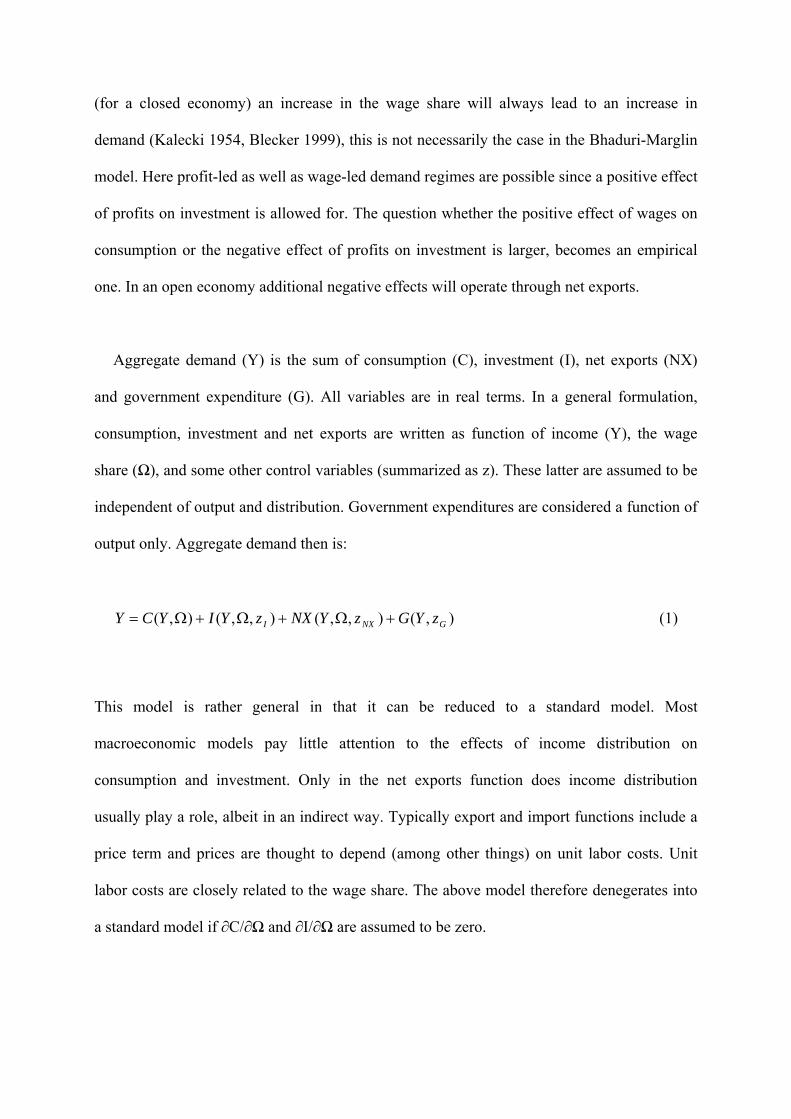
1970s (Figure 1a). Not only has growth been disappointing, the unemployment rate in the
Euro-area has increased from already high levels in 1981 by 1.2% points – despite an almost
continuous decline in the wage share (Figure 1b).6 Europa has experienced 25 years of
„employment-friendly“ wage policy, without employment improving.
5 Wage moderation, in this paper, is defined as real wage growth below productivity growth. 6 Adjusted wage share at market prices (source: AMECO).

Figure 1a. Adjusted wage share and GDP growth
50
52
54
56
58
60
62
64
66
68
70
1960
1962
1964
1966
1968
1970
1972
1974
1976
1978
1980
1982
1984
1986
1988
1990
1992
1994
1996
1998
2000
2002
2004
adju
sted
wag
e sh
are
-2
-1
0
1
2
3
4
5
6
7
8
grow
th o
f rea
l GD
P
adjusted wage sharegrowth real GDP
Figure 1b. Adjusted wage share and unemployment
50
52
54
56
58
60
62
64
66
68
70
1960
1962
1964
1966
1968
1970
1972
1974
1976
1978
1980
1982
1984
1986
1988
1990
1992
1994
1996
1998
2000
2002
2004
2006
Adj
uste
d W
age
Shar
e
0
2
4
6
8
10
12
unem
ploy
men
t rat
e
adj WSunempl.rate
While it is straightforward that wage moderation will, other things equal, improve
competitiveness and therefore ultimately net exports, it is not obvious that an improvement of

competitiveness will automatically improve growth and employment. Foreign trade is only
one component of final demand. The other components include consumption and investment
(as well as the state sector). To assess the effects of wage moderation it is necessary to
address the effects on all three components of private demand. In the Euro area, exports and
imports only account for only 13.1% and 12.6% of GDP respectively (in 2003 at current
prices), for the EU 25 the shares are 8.8% and 9.9%. This research is thus motivated by the
hypothesis that wage moderation is likely to have only moderate affects on foreign trade but
substantial effects on domestic demand.
The analysis is inspired by the work of Keynes and Kalecki. The model is a version of the
model presented by Bhaduri and Marglin (1990). It is a Post-Kaleckian macro model that
allows for wage-led as well as for profit-led demand regimes according to the relative size of
the consumption differential, the sensitivity of investment to profits and the sensitivity of net
exports to unit labor costs.
The paper is structured as follows. Section 2 presents the theoretical background and the post-
Kaleckian model, on which the empirical estimations are based. Section 3 summarizes the
empirical literature on these models. Section 4 presents the econometric results for the effect
of changes in functional income distribution on private consumption, private investment and
net exports. Section 5 summarizes the key findings and draws policy conclusions.
2. Theoretical background: wage-led und profit-led demand regimes
This section will present a Post-Keynesian model based on Bhaduri and Marglin (1990) that
forms the basis for the empirical investigation. It is used to analyze the effects of changes in
functional income distribution on aggregate demand. While in the classical Kaleckian model
(for a closed economy) an increase in the wage share will always lead to an increase in
demand (Kalecki 1954, Blecker 1999), this is not necessarily the case in the Bhaduri-Marglin
model. Here profit-led as well as wage-led demand regimes are possible since a positive effect
of profits on investment is allowed for. The question whether the positive effect of wages on
consumption or the negative effect of profits on investment is larger, becomes an empirical
one. In an open economy additional negative effects will operate through net exports.
Aggregate demand (Y) is the sum of consumption (C), investment (I), net exports (NX)
and government expenditure (G). All variables are in real terms. In a general formulation,
consumption, investment and net exports are written as function of income (Y), the wage
share (Ω), and some other control variables (summarized as z). These latter are assumed to be
independent of output and distribution. Government expenditures are considered a function of
output only. Aggregate demand then is:
),(),,(),,(),( GNXI zYGzYNXzYIYCY +Ω+Ω+Ω= (1)
This model is rather general in that it can be reduced to a standard model. Most
macroeconomic models pay little attention to the effects of income distribution on
consumption and investment. Only in the net exports function does income distribution
usually play a role, albeit in an indirect way. Typically export and import functions include a
price term and prices are thought to depend (among other things) on unit labor costs. Unit
labor costs are closely related to the wage share. The above model therefore denegerates into
a standard model if ∂C/∂Ω and ∂I/∂Ω are assumed to be zero.

The inclusion of income distribution shall briefly be motivated. In the consumption function
the basic assertion is that wage incomes (W) and profit incomes (R) are associated with
different propensities to consume. The Kaleckian assumption is that the marginal propensity
to save is higher for capital incomes than for wage income; consumption is therefore expected
to increase when the wage share rises.
Standard investment functions depend on output (Y) and the long-term real interest rate or
some other measure of the cost of capital. In our model investment is expected to decrease
when the wage share rises because future profits may be expected to fall. In addition it is
often argued that retained earnings are a privileged source of finance and may thus influence
investment expenditures.
Net exports are a negative function of domestic demand, a positive function of foreign
demand, and will depend negatively on unit labour costs (ULC), which are an indicator of
international competitiveness. ULC are by definiton closely related to the wage share. In
macroeconometric models ULC usually affect prices and prices enter the export and import
function.
Government expenditures can react to income distribution; however this is ignored in our
analysis, which focuses on the private sector. A serious treatment of the public sector is
beyond the scope of this paper.
The resulting model is of a basic private open economy type and has several
simplifications. Because of our focus on the effect of changes in the functional income
distribution the effects of fiscal policy is excluded from the analysis. Income distribution, i.e.
the wage share (Ω),7 is taken as exogenous. Thus feedbacks, for example, from growth on
income distribution via lower unemployment and a better bargaining position of labour are
ignored at this stage.8
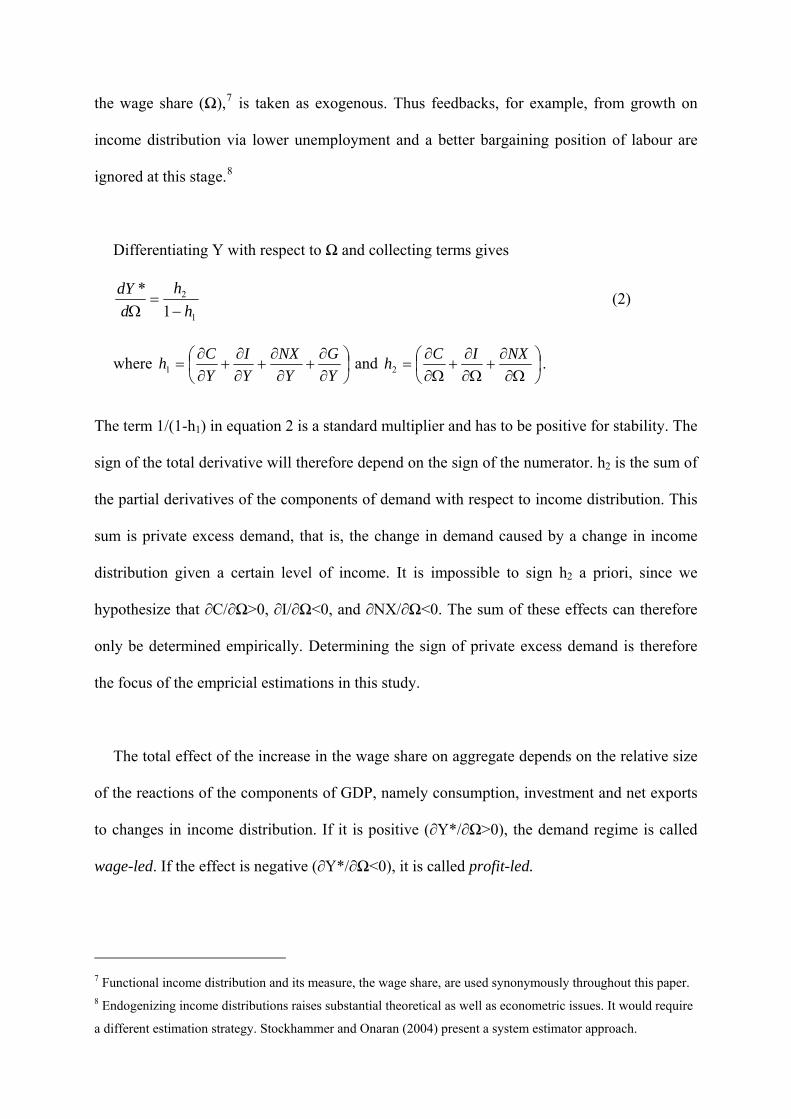
Differentiating Y with respect to Ω and collecting terms gives
1
2
1*
hh
ddY
−=
Ω (2)
where ⎟⎠⎞
⎜⎝⎛
∂∂
+∂∂
+∂∂
+∂∂
=YG
YNX
YI
YCh1 and ⎟
⎠⎞
⎜⎝⎛
Ω∂∂
+Ω∂∂
+Ω∂∂
=NXICh2 .
The term 1/(1-h1) in equation 2 is a standard multiplier and has to be positive for stability. The
sign of the total derivative will therefore depend on the sign of the numerator. h2 is the sum of
the partial derivatives of the components of demand with respect to income distribution. This
sum is private excess demand, that is, the change in demand caused by a change in income
distribution given a certain level of income. It is impossible to sign h2 a priori, since we
hypothesize that ∂C/∂Ω>0, ∂I/∂Ω<0, and ∂NX/∂Ω<0. The sum of these effects can therefore
only be determined empirically. Determining the sign of private excess demand is therefore
the focus of the empricial estimations in this study.
The total effect of the increase in the wage share on aggregate depends on the relative size
of the reactions of the components of GDP, namely consumption, investment and net exports
to changes in income distribution. If it is positive (∂Y*/∂Ω>0), the demand regime is called
wage-led. If the effect is negative (∂Y*/∂Ω<0), it is called profit-led.
7 Functional income distribution and its measure, the wage share, are used synonymously throughout this paper. 8 Endogenizing income distributions raises substantial theoretical as well as econometric issues. It would require
a different estimation strategy. Stockhammer and Onaran (2004) present a system estimator approach.

Empirically, given the high levels of international trade, one would expect net exports to
play a major role in determining the overall outcome. However, while individual countries
can increase demand by increasing exports, the world as a whole of course cannot. Therefore
it is important to distinguish between the domestic sector of the economy and the open
economy. The domestic sector in this case is defined with respect to consumption and
investment only, assuming that the net export position does not change (as would be the result
if wages were to change simultaneously in all countries). If consumption reacts more
sensitively to an increase in the wage share than investment, domestic demand will be wage-
led. Then we will integrate the effects of the foreign sector, thus changes in net exports to
obtain the aggregate effect in an open economy.
3. Related literature
The first paper in the empirical literature on the Bhaduri-Marglin models is that of Bowles
and Boyer (1995). They estimated the model by means of separate single equations for
savings, investment and net exports for six OECD economies. The exposition of the model
and the testing strategy are seminal, however the econometric methods employed are not up-
to-date. In particular, they fail to discuss the time series properties of the economic variables
and ignore the issue of unit roots. As a consequence, they do not apply difference or error
correction models that form the core of modern time series econometrics. The models are
estimated in shares rather than in log levels. No discussion of robustness is offered. Moreover,
Bowles and Boyer use the employment share as a proxy for capacity utilization. For European
countries with a high persistence of unemployment this may be a misleading indicator.

Gordon (1995a) estimates consumption and investment as a function of income distribution
for the USA. In a VAR model, various exogenous shocks are simulated. Gordon (1995b)
extends the model for an open economy and investigates reactions of aggregate demand on
changes in income distribution empirically for the USA. His conclusion is that the growth
regime of the USA is profit-led.
Hein and Krämer (1997) as well as Hein and Ochsen (2003) in their studies employ a
model for a closed economy based on Marglin and Bhaduri (1990). Hein and Ochsen (2003)
extend the model with the interest rate as exogenous variable and elaborate various
accumulation regimes, depending on the sensitivity of the savings function and the investment
function to the interest rate. In the empirical part, they estimate savings and investment
econometrically and try to characterise the accumulation regimes of France, Germany, the
USA and the UK.
Stockhammer and Onaran (2004) estimate a structural VAR model consisting of the
variables capital accumulation, capacity utilization, profit share, unemployment rate and
labour productivity growth for the USA, UK and France. Employing a VAR model, the
mutual interaction of the variables is incorporated. The goods market is simulated by a model
based on Marglin and Bhaduri (1990). It is supplemented by an equation for income
distribution, a productivity function and a function for unemployment. From the empirical
investigation it is concluded that unemployment is determined by the goods market, but that
the impact of income distribution on demand and employment is very weak. Technical
progress is shifting income distribution in favour of profits. Onaran and Stockhammer (2005)
employ a similar model for Turkey and Korea.
Naastepad (2006) presents and estimates a model for the Netherlands, in which
productivity growth is modeled explicitly. Productivity, savings, investment and exports are
estimated by single equations. She finds that “the Dutch demand regime during 1960-2000 is
(…) wage-led” (p. 24), however only narrowly so. Overall she concludes that “the growth rate
of Dutch aggregate demand is relatively insensitive to changes in real wage growth” (p. 29) in
the postwar period.
Naastepad and Storm (2006/2007) estimate a similar model for eight OECD countries that
is similar in spirit to the one used here, but differs in detail. The model estimated is strictly
derived from the theoretical one. Consequently the estimated equations are typically in ratio
form, which are not the ones favoured by modern time series econometrics. No explicit
attention is paid to the issues of unit roots. Naastepad and Storm find wage-led demand
regimes in all European countries and profit-led ones in Japan and the USA. Compared to our
findings, the estimated effects on consumption and investment are high, but those on net
exports are modest.
Ederer and Stockhammer (2007) apply a single equation approach to France and estimate
consumption, investment and net export functions. As their study is a prequel to the present
paper, the estimation strategy is similar, with some changes in the treatment of export and
imports. The result is that the French aggregate demand regime is domestically wage led, but
international trade turns the demand regime into a profit-led one.
Hein and Vogel (2007) use a similar approach for Austria, France, Germany, the
Netherlands, UK and the USA. In the estimation they largely follow Ederer and Stockhammer
(2007) with minor differences in the investment specification and some differences in the net
export function. Surprisingly, they fail to find effects of income distribution on net exports in

four out of six countries. They also fail to find effects on investment in four out of six
countries. Consequently they find profit-led demand regimes only in Austria and the
Netherlands, which are also the ones where effects on net exports had been found. The other
countries are found to be wage-led.
4. Empirical results
The model will be estimated by means of separate single equations for consumption,
investment, exports, and imports. The key differences to the literature are the following. First,
the econometric specifications differ. Following standard practice in modern econometric
modelling, error-correction models (ECM) are applied whenever feasible. Where results were
unsatisfactory and/or there was no indication of cointegration, an unrestricted autoregressive
distributed lag (ADL) model was estimated to infer which time series specification would be
appropriate. ADL models are general in that various time series specifications can be written
as restrictions on an ADL models. In all cases where the ECM specification did not work,
ADL specifications suggested that the difference form was applicable. Second, as far as
possible the specifications were chosen such as to be consistent with the standard literature
and augmented for a distributional variable. Unfortunately there are few reference models for
the Euro area (that is aggregate models working with annual data). The ECB Area-wide
Model (henceforth: AWM; Fagan, Henry and Mestre 2001), would be an obvious starting
point. However, the AWM is characterized by numerous theoretically motivated restrictions
that make it incomparable with our model.
There are two major qualifications that apply for all the results to be reported. First, functional
income distribution is assumed to be exogenous. Obviously this is not the case. Demand will

affect functional income distribution in at least two ways: mark ups typically vary
procyclically (for example if mark ups are set on normal unit labor costs) and unemployment
will typically (though usually with a time lag) have a negative effect on the wage share.
Endogenizing income distribution would require a different modelling strategy (Stockhammer
and Onaran 2004 estimate a similar model for different countries by means of a structural
VAR).
Second, the Euro-area is treated as one unit in the estimations, that is, even for the period
prior to monetary unification. It is thus assumed that a behavioral function can reasonably be
reconstructed for say the 1960s. Attention was thus paid to potential structural breaks,
however it turns out that Chow tests and experimentation with dummy variables (around the
times of EU extensions) were usually not statistically significant and did not alter results
substantially. Thus it seems that, at least statistically, the Euro-area can be treated as one area
prior to its coming into existence.
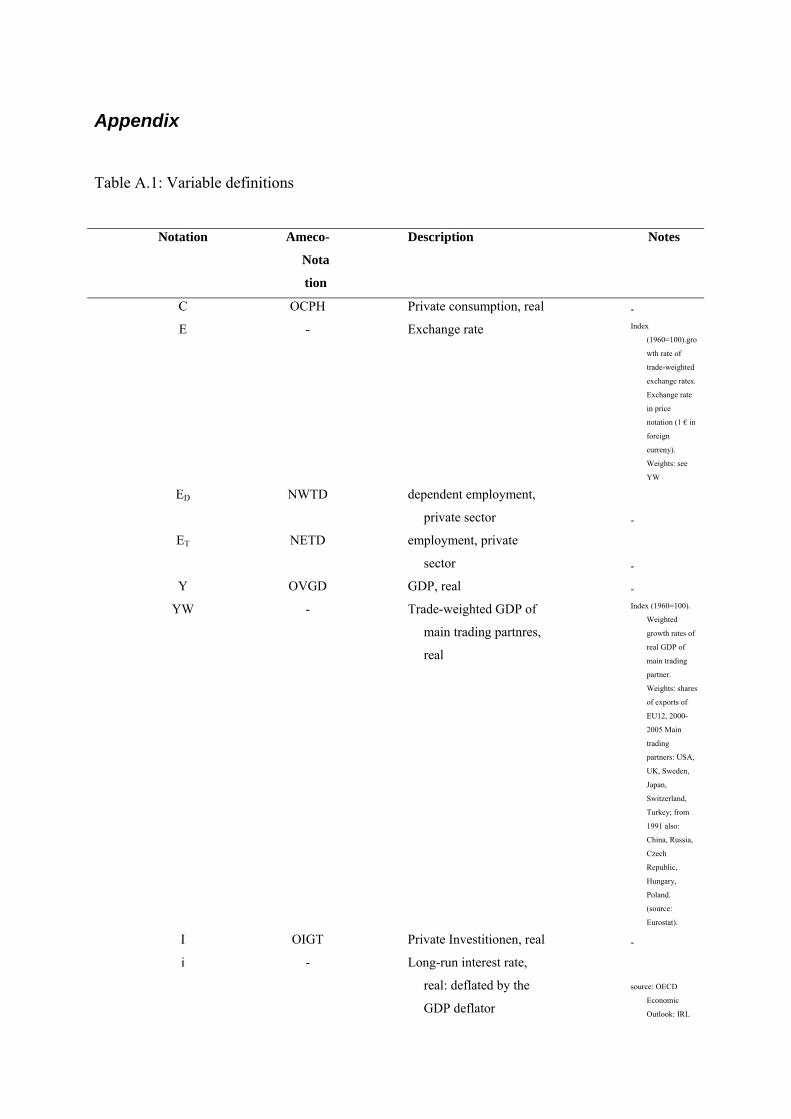
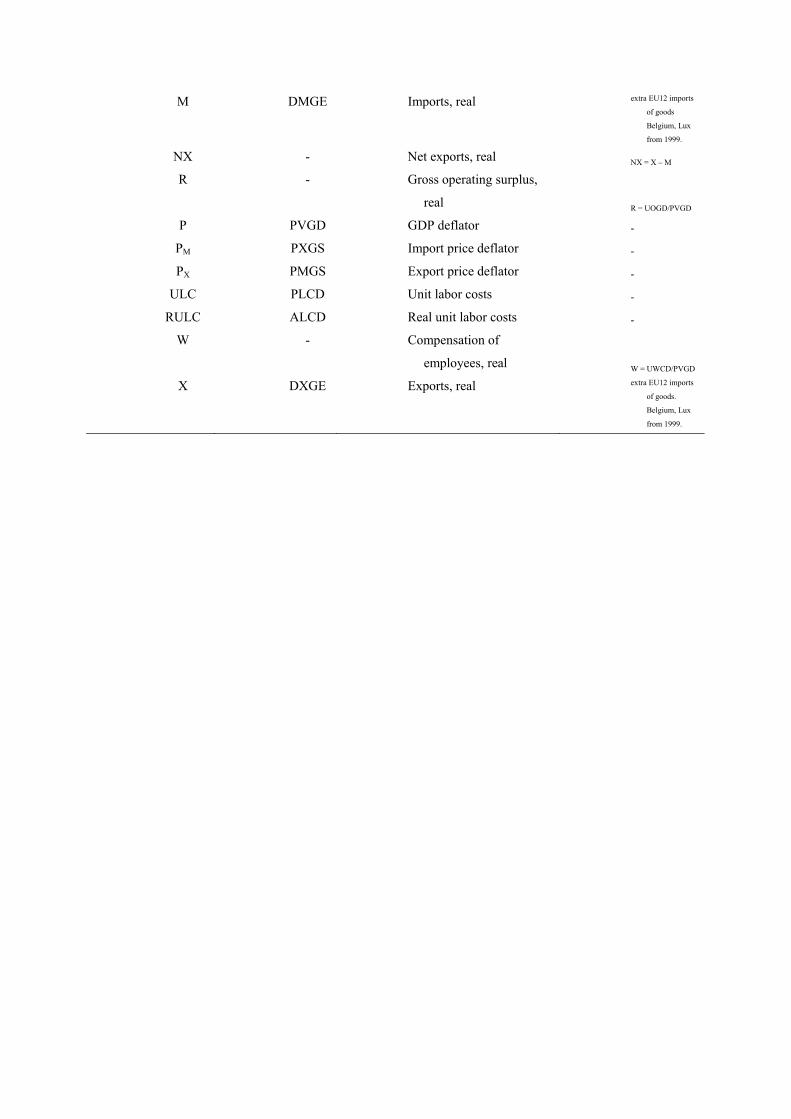
All data is taken from the AMECO database (downloaded in summer 2006), which offers
aggregate data for the Euro-area for all relevant series. C, I, NX, X, M, Y, W and R are real
consumption expenditures, investment expenditures, net exports, exports (of goods), imports
(of goods), GDP, wages and profits respectively. Wages and profits were deflated with the
GDP deflator. Variable definitions can be found in the Appendix (Table A.1). Unit root tests
suggest that all these variables are integrated of order one (I(1)). Thus ECM, cointegration,
ADL, or difference specifications are applicable.
4.1 Consumption

The consumption function estimated is of the general form ),( RWfC = . This closely
resembles standard consumption functions except that income is split into wage income and
profit income. For econometric reasons the variables enter the estimation in logarithmic form.
The difference in marginal savings propensities (between wage and profit incomes) gives the
change of a redistribution of income.
Table 1 reports the regression results for the ADL specification and several difference
specifications. The ECM specification did not give meaningful and statistically significant
results for the long run effects. Moreover, the ADF test unambiguously rejected cointegration
(in log levels). In the case of the consumption function this is somewhat surprising, since
consumption functions can usually be modeled with ECM. The ADL specification (1) clearly
indicates a specification in differences. The latter was thus applied. Moderate autocorrelation
problems persist in various difference specifications. This may be due to the fact that wages
and profits are pre-tax values. It was not possible to calculate disposable incomes for wage
and profit incomes, because various taxes cannot be assigned. The tax rates may thus be the
missing variables that show up as a serially correlated error term. A standard correction for
first order autocorrelation was thus applied to some specifications. The results are hardly
affected by this.

Table 1. Regression results for consumption equation
1 2 3 4 Dep. Variable: ln C Δln C Δln C Δln C
Variable Coeff. t-stat. Coeff. t-stat. Coeff. t-stat. Coeff. t-stat.const. 0,160 0,420 0,010 6,874 0,014 5,858 0,003 0,762ln W 0,380 4,082 ln W(-1) -0,390 -3,885 ln R 0,120 1,596 ln R(-1) -0,110 -1,607 ln C(-1) 0,980 14,614 Δln W 0,490 9,907 0,468 7,440 0,741 7,103Δln R 0,110 1,671 0,108 1,622 0,259 AR(1) 0,254 1,629 0,457 2,717
Adj, R² 1,000 0,780 0,778 0,549 DW stat. 1,620 1,450 1,996 2,137
Note: C is real private consumption, W real wages and R real profits. Specification 4 imposes that the coefficents
of wages and profits add up to one. Estimation period 1962-2005.
In the basic difference specification (specification 2) the consumption elasticity for wages and
profits are 0.49 and 0.11 respectively. The former being statistically significant at the 1%
level, the latter is not statistically significant at conventional levels, but close to the 10% level.
These elasticities may appear rather low. In the long run, one would expect a value much
closer to unity.9 However, the wage and profit variable are pre-tax (and also include social
security contributions). The tax rate has a rising trend over part of our sample period, which
may explain why gross income elasticities of consumption are below one. Correcting for first
order autocorrelation (specification 3) virtually does not affect the coefficient estimates.
Specification (4) imposes that consumption function (in differences) is homogenous of degree
1 in wages and profits. The elasticity of wages then is 0.74 and that of profits 0.26
(statistically significant at 1%).
9 Note that since the estimation is in logarithms, our estimation equation implies a consumption function that is
Cobb-Douglas. Therefore the coefficients on wages and profits add up to the elasticity of income.

The hypothesis that consumption propensities vary between profit and wage income is
confirmed. Converting elasticities into marginal effects will give different results according to
where the partial effect is evaluated. Therefore we calculate two marginal effects, one at the
mean of our sample and one at its end, which is the year 2005. At the sample mean the
marginal propensity to consume out of wages is 0.52, whereas that out of profits is 0.15,
which gives a consumption differential of 0.37.10 At the levels of 2005 the consumption
propensities are 0.58 and 0.16 respectively, which gives a consumption differential of 0.43.
This change in the consumption differential is due to the substantial shift in income
distribution since 1980. Since the coefficient estimate for the coefficient on profits is not
statistically significant different from zero, this has to be regarded as the lower bound of the
value. A redistribution of 1%-point of GDP from profits to wages would thus induce
additional consumption expenditures of 0.43 %-points of GDP in 2005 (and 0.37 at the
sample mean). The restricted version of the estimation gives a consumption differential of
0.51 in 2005 and 0.44 at the sample mean. However, the former estimate is preferred because
the restriction is expected to be valid for net rather than gross income.
4.2 Investment
The investment function estimated is of the general form ),,( iRYfI = . As the coefficients
are interpreted as the effects in one variable, keeping the other variables constant, the
coefficient estimate on profits will give the effect of an increase in profits given the level of
income (and the interest) and therefore a change in income distribution.
10 Because a lograithmic consumption function was estimated, the consumption function is of the Cobb-Douglas
type. If the “true” relation is addiditive in levels rather than in logarithms, this can only be regarded as an
approximation. An estimation in levels gives qualitatively similar results but is fraught with (serious)
autocorrelation and heteroscedasticity problems.

The investment function was estimated in an ECM form with the restriction that in the long
run the investment share in GDP is stable, that is, the long run coefficient of output on
investment is unity.11 The investment function includes the profits and the (ex post) real long
term interest rate (deflated with the GDP deflator). After experimentation with the lag
structure of the differenced variables, a structure with one lag for the short run effects was
adopted. The results are summarized in Table 2.
Table 2. Regression results for investment equation
ECM ECM with lags Dep. Variable: Δln I Δln I Variable Coeff. t-stat. Coeff. t-stat. const. -0.300 -3.248 -0.590 -4.033 Δln Y 1.890 6.248 1.590 4.885 Δln Y(-1) 0.840 2.355 Δln R 0.130 0.698 0.380 1.965 Δln R(-1) -0.180 -0.894 ln I(-1)/Y(-1) -0.140 -2.820 -0.210 -3.130 ln R(-1) 0.010 0.512 0.030 1.910 i (-1) 0.000 -0.808 Adj, R² 0.720 0.730 DW stat. 1.730 1.750
Note: I is real private investment, Y real GDP, R real profits and i the long-term real interest rate. Estimation
period 1968-2005
The regression performs reasonably well overall. In accordance with the literature (Chirinko
1993, Ford and Poret 1992) demand is playing the key role in determining investment
expenditures. The accelerator effects are well above two (1.59+0.84) in the short run and have
11 A similar investment function with the same restriction was used by Baumgartner, Breuss and Kaniovski
(2005). Hein and Vogel (2007) use different specification for different countries. They utilize the profit share
rather than profits. Naastepad and Storm (2006) estimate investment as ln(I/Y)=f(ln(R/Y),ln(Y)). The
coefficients of the latter can be readily transformed to be comparable with our results. The time series properties
of the variables, however, are inconsistent, because ln(Y) is typically I(1), whereas I/Y and R/Y supposedly are
I(0).

been restricted to one in the long run. The interest rate has the expected sign, but is not
statistically significant. The long-run elasticity of profits is 0.15 and statistically significant
only at the 10% level. Again this is line with the literature. While firm-level investment
functions usually find a larger effect of cash flow on investment (Fazzari and Mott 1986), in
aggregate investment functions this effect is more tenuous (Chirinko 1993). Our results
correspond to a marginal effect of profits on investment of 0.07.12 Since the investment to
profit ratio is stable in the sample period, the partial effects are virtually identical at the mean
and in 2005.
4.3 Net exports
As the estimation of the net export effect is probably the most sensitive part of the estimation,
two estimation methods were applied. First the net exports (as a share of GDP) were
estimated directly as a function of domestic GDP growth, the GDP growth of the most
important trading partners, nominal exchange rates and real unit labor costs
( ),,,( RULCEYYfY
NXw= ). This approach closely corresponds to the theoretical model.13
However, it is not consistent with the import and export functions as currently used in most
macroeconometric models, since in these prices rather than unit labor costs enter import and
export functions. Throughout this section unit labor costs, rather than the wage share, will be
used as explanatory variable, since this variable is the one that is relevant for competitiveness
12 This is the conversion from elasticities to partial effects: RIe
RI
IR=∂∂
.
13 The net export equations estimated by Naastepad and Storm (2006) and by Hein and Vogel (2007) are similar
to this one. The former use exports (rather than net exports) as dependent variable and relative ULC as
explanatory variable. The latter estimate the above equation without the nominal exchange rate and with the
profit share instead of RULC.

and the effects of (changes in) real unit labor costs can easily be converted into effects of
(changes in) the wage share.14
A second approach follows standard modeling practice more closely. Here domestic prices (or
export prices) enter the export and import functions. In a second estimation equation domestic
prices are estimated as a function of nominal unit labor costs and import prices. This latter
equation also allows to calculate by how much an increase in real unit labor costs (of say one
percent) will (on the average) raise domestic prices.
For the trading partners’ GDP a trade-weighted GDP based on the trade shares of the year
1990-2005 was calculated for the largest trading partners. From 1992 on these include Eastern
European countries and China, prior to 1992 only OECD countries. In the same fashion a
trade-weighted effective exchange rate was calculated.
Unfortunately export and import data for extra-EU12 trade only exists for goods, but not for
services. Thus all estimations had to be performed for goods trade only and then the results
were multiplied by a fixed factor (1.25, which is the share in the year 2005 for which data
exists) to account for trade in services. For the USA data on trade in goods and services exist
and the share of services in total exports and imports is stable (with temporary changes in the
1970s, which are presumably due to the oil price shock). Thus, the error arising from our
adjustment for EU trade is probably small.
14 Real unit labor costs are EEET
YWRULC = , where ET and EE stand for total employment and dependent
employment respectively. In the conversion differences between consumer prices and GDP-prices are ignored.
Since we are interested in medium term developments and the two indices are highly correlated over longer
periods, an additional step in lengthy transformation is avoided.

The time series properties for the variables used in the following specifications are not
straightforward. Unit root tests suggest at the 5% level that NX/Y and ln Px/Pm are I(0) as
expected, ln E is also I(0) and RULC is I(1). The latter is surprising since RULC is a also a
ratio. Ln Yw also seems to be I(0). For consistence ln Yw and ln Y are both treated as I(1). In
the case of RULC experiments with additional lags were performed.
Table 3 summarizes the results of the estimations of the net export share according to the first,
direct estimation strategy. Table 3 reports two specifications where RULC is entered in levels
and one (specification 3) where it is entered in difference form. The unit root tests suggest the
latter specificiation. However this specification implies that changes in the unit labor costs
have a one time effect on net exports, which is to say there is no long-term effect. From an
economic point of view this is not plausible. Therefore specifications 1 and 2 are preferred. In
specifications 1 and 2 all variables show the expected sign and, with the exception of the
exchange rate, are statistically significant at the 5% level. Specification 1 was performed with
an autocorrelation correction (for first order autocorrelation). Autcorrelation problems persist,
however the coefficient estimates seem to be robust. A 1% increase in real unit labor costs
leads to a 0.08% decrease of net exports (of goods). After appropriate transformation this the
effect of a 1%-point increase in the wage share leads to a 0.13%-point (of GDP) of net exports
in goods and services.15 In specification 3 RULC enter in difference form. The coefficient
estimate for RULC is not statistically significant at 10% level. The other variables are barely
affected by this change in specification. The coeffient estimate from specification 1 forms the
basis for later calculations.
15 Real unit labor costs have to be adjusted for the ratio of total employment to dependent employment. This
value is 1.27. See Marterbauer and Walterskirchen (2003) for more discussion on the relation of wage shares and
unit labor costs. These values are also summarized in Table 6.

Table 3. Regression results for net export share equation
1 2 3 Dep. Variable: NX / Y NX / Y NX / Y Variable Coeff. t-stat. Coeff. t-stat. Coeff. t-stat.const. 0.046 1.852 0.053 3.836 -0.006 -2.368Δln Y -0.185 -4.334 -0.120 -2.285 -0.201 -4.342Δln Yw 0.131 2.898 0.137 2.304 0.116 2.526ln E -0.012 -1.012 -0.014 -1.347 -0.007 -0.546RULC -0.084 -2.133 -0.095 -4.396 ΔRULC -0.147 -1.472AR (1) 0.667 5.383 0.747 7.632Adj. R² 0.719 0.462 0.708 DW stat. 1.469 0.688 1.549
Note: NX are the net exports, Y real GDP, Yw real GDP of the main trading partners, E a trade-weighted
exchange rate, RULC the real unit labour costs. Estimation period 1962-2005.
The second estimation strategy is more roundabout. In a first step exports are estimated as
function of prices (and other control variables) and in a second step prices are estimated as
function of (nominal) unit labor costs (and other control variables). Then the same procedure
is applied to imports. Table 4 summarizes the results of the export function. The explanatory
variables are export prices relative to import prices (measured in a hypothetical world
currency),16 the output of trading partners and the exchange rates. Since no support for a
cointegrating relation was found, the equation was estimated in difference form. A correction
for first order autocorrelation was applied. The coefficients have the expected signs and are
statistically significant at the 5% level or higher. The results indicate that a one percent
increase in foreign demand leads to a 1.34% increase of exports (of goods). Exports also react
strongly to the exchange rate, with an elasticity of -1.54. The coefficient on relative prices is
statistically significant at the 1% level and has an elasticity of -1.17.
Table 4. Regression results for export and import equations
1 2 3
16 Pmwc = Pm*E

Dep. Variable: Δln X Dep. Variable: Δln M Δln M
Variable Coeff. t-stat. Variable Coeff. t-stat. Coeff. t-stat.
const. 0.018 0.905 const. -0.006 -0.309 -0.034 -1.555Δln Yw 1.337 2.322 Δln Y 1.977 3.219 2.339 3.868Δln E -1.537 -5.274 Δln E(-1) 0.364 1.580 Δln Px/Pmwc -1.173 -3.173 Δln P(-1)/Pmwc(-1) 0.007 0.029 AR (1) 0.415 2.795 Δln P(-1)/Pmeu(-1) 0.183 0.941 T95 0.058 2.653
Adj. R² 0.388 Adj. R² 0.247 0.326 DW stat. 1.802 DW stat. 1.742 1.938
Note. Yw is the GDP of main trade partners, E the trade-weighted exchange rate. Px the export price deflator,
Pmwc the import price deflator in a (hypothetical, trade-weighted) world currency, Y is GDP, P the GDP-
deflator, Pmeu is the import price deflator in euros. T95 is a dummy variable that takes on the value of 1 from
1995. Estimation period 1962-2005.
For the import estimation a difference equation was applied after cointegration tests failed.
Overall, the import regression did not work very well. While domestic demand consistently
has the expected sign and is statistically significant at the (1% level), the domestic price level,
import prices and the exchange rate frequently had perverse signs and/or were statistically
insignificant. In particular, contemporaneous prices showed “perverse” signs (possibly
because of a J-curve effect). Table 4 reports two specifications. Specification 2 includes the
exchange rate and the ratio of domestic to import prices (in world currency), both lagged.
Relative prices in this specification are not statistically significant and the coefficient estimate
has a value that is economically negligible. Specification 3 includes domestic prices and
import prices (in domestic currency), both lagged. In addition a dummy variable that takes the
value of one from 1995 onwards was used.17 Since this specification was adopted after
experimentation, inference based on t-values may be misleading (Charemza and Deadman
1997, chap 2). This specification is one of the few, where the domestic price level has the
expected sign and an economically significant coefficient, though at 0.18 it is low and it is not
17 The motivation for this dummy variable is purely statistical. One possible explanation is the increased
integration with Eastern Europe after the fall of the wall.
statistically significant. Domestic GDP on the other hand is statistically significant at the 1%
level. The estimated income elasticity of imports is 2.34 which is rather high.18 The
conclusion thus is that domestic prices have a weak, if any, effect on imports. Based on our
results a coefficient estimate of zero is equally arguable.
In two auxiliary regressions the inflation (of the GDP deflator) was explained by (nominal)
ULC and import prices and export prices were explained by domestic prices and import
prices. Both estimations were performed in difference form (after ECM specifications proved
unsuccessful) and autocorrelation procedures had to be applied. An increase of nominal unit
labor costs by 1% increases domestic inflation by 0.45. An increase of domestic prices by 1%
increases export prices by 0.47. From the price equation it can be derived that nominal unit
labor costs have to increase by 1.82% such that real unit labor costs increase by 1% (because
prices would rise by 0.82%).
18 This value is high compared to the demand elasticity of exports. Our results imply that if the EU and its trade
partners grow at the same rate, the EU would experience a widening current account deficit, which is not very
plausible.

Table 5. Regression results for price equations
Dep. Variable: Δln P Dep. Variable: Δln PX Variable Coeff. t-stat. Variable Coeff. t-stat.C 0.029 3.087 C 0.000 -0.921Δln PM 0.036 2.269 Δln PM 0.510 15.943Δln ULC 0.449 7.139 Δln P 0.470 4.648AR(1) 0.887 12.038 AR(1) 0.440 3.161
Adj. R² 0.950 Adj. R² 0.940 DW stat. 2.120 DW stat. 2.150
Note: P is the GDP deflator, PM the import price deflator, PX the export price deflator and ULC the nominal
unit labour costs. Estimation period 1962-2005.
The calculation of the effects of a change in income distribution on exports and imports
involves several steps. These are summarized in Table 6. As import and export shares display
a clear trend (reflecting globalisation), the transformation from elasticities to marginal effects
will yield different results according to the point (in time) where marginal effects are
calculated. Values for mean exports and imports as well as value at the end of the period are
reported.
The total effect of a change in functional income distribution on exports includes the effect of
real unit labor costs on prices, the effect of prices on export prices. This value has to be
transformed from an elasticity into a marginal effect. 19 Then the effects of changes in the unit
labor costs have to be transformed to effects of changes in the wage share. The result of this
has to be adjusted for services. These transformations are summarized in Table 6. Overall an
increase in the wage share by 1%-point currently leads to a reduction in exports by 0.12%-
points of GDP. In the middle of the sample (roughly the 1970s) the respective effect would
have been 0.08%-points of GDP. The corresponding values of the reduction of imports are
0.04 and 0.03 %-points of GDP.
19 RULCY
MeeRULC
YMPRULCMP
1/=
∂∂

Table 6. Calculation of partial effects on net exports, exports and imports
1 2 3 4 5 6 7 8 Net exports ePRULC 1/RULC ET/ED G&S/G Effect NX/Y -0,084 1,27 1,25 -0,13 Exports eXPx ePxP X/Y 2005 -1.17 0.47 0.82 1.76 0.10 1.18 1.25 -0.12 mean -1.17 0.47 0.82 1.58 0.07 1.27 1.25 -0.08 Imports eMP M/Y 2005 0.18 0.82 1.76 0.11 1.18 1.25 0.04 mean 0.18 0.82 1.58 0.08 1.27 1.25 0.03
Note: column (1) estimates from Tables 3 and 4 respectively. Column 2 estimates from Table 5. Column 3:
∂P/∂RULC is calculated as ∂P/∂ULC (from Table 5) divided by 1-∂P/∂ULC. Column 6: ET is total employment,
ED depenent employment. Column 7: G&S: extra-EU12 exports of goods and services, G: extra-EU12 exports
of goods.
The effect of an increase in the wage share by 1%-point on the net export share thus totals -
0.16 (and was -0.11 at the mean of the period). The difference between these two values
reflects the increasing importance of international trade or globalization. Conveniently, the
differences are not large enough to modify the overall result.
4.4 Total effects
Table 7 puts together the partial results presented above. The results of the different ways to
calculate the effect on net exports are listed separately. The positive effect of an increase in
the wage share by one percentage point on private consumption is 0.37 %-points of GDP at
mean values and 0.43 %-points in 2005. Either is substantially larger than the negative effect
on investment (0.07 %-points of GDP). The domestic sector of the economy is thus clearly
wage led. Our estimations suggest that a 1 %-point increase of the wage share (assuming no
changes in government expenditures and income) leads to an increase of domestic demand by
0.3 %-points increase in GDP at sample means and and by 0.35 in 2005.

Table 7. Private excess demand (in %-points of GDP) caused by a 1%-point increase of the
wage share
Effects at mean levels, NX-share regression
Effects in 2005, X, M - regression
Effects at mean levels, X, M - regression
Consumption 0.37 0.43 0.37 Investment -0.07 -0.07 -0.07 Domestic excess demand 0.30 0.35 0.30 Net exports -0.13 -0.16 -0.11
Private excess demand (h2): 0.19 0.17 0.19
Note. Column “NX-share” estimation of net export share as a function of real unit labor costs and other control
variables (based on results in Table 3). Columns X, M-regression: based on estimation of exports and imports as
a function of domestic prices (and other control variables) and of prices as a function of unit labor costs (and
import prices) (based on results from Table 4 and 5). Private excess demand (h2) is the sum of the effects of a
change in income distribution on consumption, investment, and net exports given the level of income.
The effect of an increase of the wage share on net exports is stronger than the effect on
investment. Table 7 lists all three variants of calculating the effect on net exports. First, the
direct estimation of the net export share as a function of real unit labor costs (and standard
control variables). This method (labeled “NX-share regression” in Table 7) gives a medium
effect on net exports, which is -0.13 %-points of GDP. This estimation procedure, however, is
not how modern macroeconometric models treat foreign trade. Second, exports and imports
were regressed on the domestic price level (and other control variables) and prices were
regressed on nominal unit labor costs and import prices. The price equation allows for the
calculation of the effects of an increase in real unit labor costs. This approach is consistent
with the present modeling strategy in macroeconometic models. Since the estimations give
elasticities rather than partial effects, the elasticities have to be converted. As the import and
exports shares in GDP show a strong trend the results differ (for a given elasticity) if
evaluated at the mean or at the end of the period. In table 7 the evaluation with the current
value is referred to as “X, M-regressions, 2005 levels” and gives a value of -0.16. An increase
of the wage share by one percentage point today would thus decrease net exports by 0.16%-
point of GDP. Alternatively, column “X, M regressions, mean levels” evaluates the marginal

effect for the export and import shares at the mean values of our sample. This gives an effect
of -0.11. This can be interpreted as a one percentage point increase in the wage share in the
middle of the period, i.e. the 1970s, causing a decrease of net exports by 0.11 %-points of
GDP.
The total effect of a one percentage point increase in the wage share on private excess demand
(h2 in equation 2) ranges between +0.17 and +0.19 %-points of GDP. In all cases the effect is
positive. These are conservative estimates. The effect of domestic prices on imports is not
statistically significant and the coefficient estimate is not robust. The qualitative result of this
study is thus clear: wage moderation will overall have negative effects on (private) aggregate
demand in the Euro-area. A plausible, conservative point estimate of the total effect is 0.2 %
points of GDP. The net results at mean levels are similar to those for 2005. However the
components do differ. The decreasing wage share has led to a increase in the consumption
differential, while increases in international trade have led to stronger effect on net exports.
The fact that these two developments in opposite directions almost cancel out, is mere
coincidence.
To get the total private effects of a change in income distribution on equilibrium demand
excess demand has to be multiplied by the multiplier of equation 2, that is 11
1h−
. This is done
in Table 8. These calculations have to be interpreted with care for two reasons. First, these
results are equilibrium effects. The exogeneity assumptions outlined in section 2 seem rather
strong in this context.20 Second, more technically, the results are very sensitive to the specific
parameters applied and lack the robustness of the results for excess demand. h1 consists of the 20 Note that the private excess demand effects discussed above are by definition partial (and disequilibrium
effects). Here, however, the effects are general equilibrium effects. The assumption that other control variables
are exogenous with respect to income and income distribution, is therefore much more restrictive.
partial effects of changes in income on consumption, investment and imports. Table 1, 2 and 4
contain the relevant coefficient estimates. Again, the coefficient estimates are elasticities that
have to be converted into partial effects.21 For the case of consumption, this elasticity was
estimated to be 0.6 (Table 1). In the literature the assumption of a long-run elasticity of one is
frequently found. By assumption, the long-run demand elasticity of investment was one
(Table 2). The income elasticity of imports is 2.34 (Table 4), which is a rather high value.
Moreover, it makes a big difference if the elasticity is converted into a partial effect at the
mean import share or its 2005 value. Depending on the assumption of the long-run
consumption elasticity and on where the import elasticity is converted the private multiplier
ranges from 1.38 (with the eCY=1 and the M/Y of 2005) to 2.69 (with eCY=0.6 and the mean
M/Y).22 The latter values seem rather high. The state sector has been excluded from the
analysis in this paper. If automatic stabilizers are operating, then the values will be
accordingly smaller. Assuming an income elasticity of consumption of 0.6 the total effect of a
1%-point increase in the wage share on equilibrium income is 0.23 %-points of GDP
(evaluated at the mean import share).
YMe
YIe
YCe
YNX
YI
YCh MYYICY −+=
∂∂
+∂∂
+∂∂
=121
22 The multiplier values are 1.66 assuming e =0.6 and mean M/Y and 2.01 assuming e =1 and 2005 M/Y. CY CY
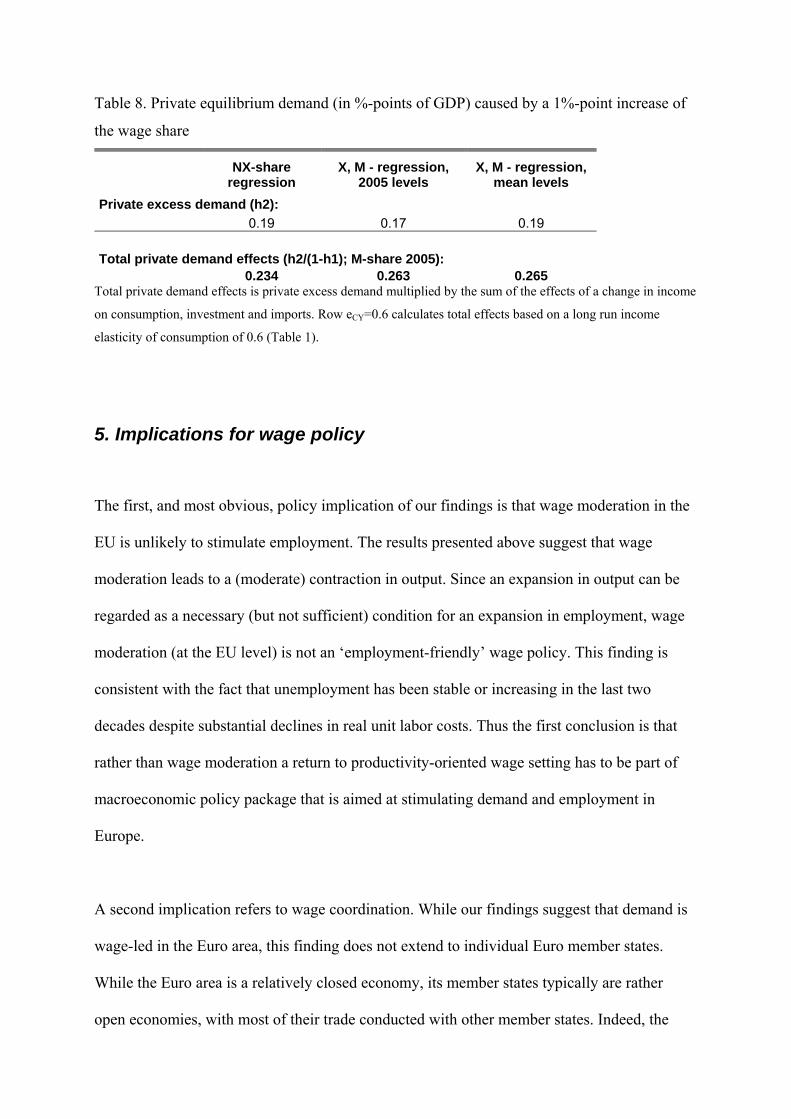
Table 8. Private equilibrium demand (in %-points of GDP) caused by a 1%-point increase of
the wage share
NX-share
regression X, M - regression,
2005 levels X, M - regression,
mean levels Private excess demand (h2): 0.19 0.17 0.19 Total private demand effects (h2/(1-h1); M-share 2005): 0.234 0.263 0.265
Total private demand effects is private excess demand multiplied by the sum of the effects of a change in income
on consumption, investment and imports. Row eCY=0.6 calculates total effects based on a long run income
elasticity of consumption of 0.6 (Table 1).
5. Implications for wage policy
The first, and most obvious, policy implication of our findings is that wage moderation in the
EU is unlikely to stimulate employment. The results presented above suggest that wage
moderation leads to a (moderate) contraction in output. Since an expansion in output can be
regarded as a necessary (but not sufficient) condition for an expansion in employment, wage
moderation (at the EU level) is not an ‘employment-friendly’ wage policy. This finding is
consistent with the fact that unemployment has been stable or increasing in the last two
decades despite substantial declines in real unit labor costs. Thus the first conclusion is that
rather than wage moderation a return to productivity-oriented wage setting has to be part of
macroeconomic policy package that is aimed at stimulating demand and employment in
Europe.
A second implication refers to wage coordination. While our findings suggest that demand is
wage-led in the Euro area, this finding does not extend to individual Euro member states.
While the Euro area is a relatively closed economy, its member states typically are rather
open economies, with most of their trade conducted with other member states. Indeed, the

parameters estimates imply that the Euro area would switch from a wage-led to a profit-led
demand regime at export and import shares of 23% to 30%.23 Most EU members have export
and import shares in this order of magnitude or even higher. It seems therefore likely that
many EU member states exhibit (individually, not collectively) profit-led demand regimes. In
other words, small open economies are likely to be profit-led, because foreign trade
constitutes a much larger share of their GDP.
If this is the case, European wage policy is in a prisoners’ dilemma-type situation. While for
each country it may be expansionary to exercise wage moderation (assuming constant wages
abroad), wage moderation in all countries will have a contractionary effect. This is likely to
generate a downward bias in wage settlements if wages are negotiated nationally. The actual
situation of course much more complicated. First, the EU consists of countries of varying
size, with some of them, most notably Germany, being large enough to make a wage-led
demand regime likely. Second, wage negotiations in fact do not take place at the national
level, but at the sectoral level or the firm level, with substantial differences in national labor
relations systems persisting (Visser 2004, Marginson and Sisson 2004). Any concrete policy
suggestion would have to take into account these complications. However, at the general level
it seems likely that wage competition fostered by trade integration and increasing FDI flows
has contributed to reduction in wage growth (Rodrik 1997, Hatzius 2000). A coordination of
wage bargaing across the Euro area (or the EU in general) therefore seems desirable.
The third conclusion concerns the macro economic policy package currently in place in the
Euro area, which is defined as a common currency directed by an independent ECB, almost 23 Both figures are based on the second, indirect estimate of the effect on exports and imports (referred to as X,
M-estimates in Table 7). If the statistically insignificant (and not robust) effect of prices on imports is taken at
face value, then the switch from a wage-led to a profit-led demand regime occurs at export and import shares of
23%. If the effect of prices on imports is assumed to be zero, the switch occurs at 30%.

exclusively concerned with price stability, and a national fiscal policies which is
(asymmetrically) severely constrained by the Stability and Growth Pact. In this setting wage
policy plays a crucial role as a shock absorber for asymmetric as well as for symmetric
shocks, which is why the ECB is consistently insisting that labor market flexibility is needed
to ensure the proper functioning of the monetary union (Alsopp and Artis 2003). However, if
demand is wage-led in the EU, then flexible wage will send perverse signals in the case of
adverse demand shocks. Rather than stimulating demand, falling wages (or more precisely
wage shares) will dampen demand further. Therefore the whole design of the policy package
in Europe has to be modified. Monetary policy would have to get reoriented to output
stabilization or fiscal policy would need more room (and coordination) for counter-cyclical
policy.
6. Literature Alsopp, C, Artis, M , 2003. The assessment: EMU, four years on. Oxford Review of Economic Policy 19
(1), 1-29
Baumgartner, J, Breuss F, Kaniovski, S, 2005. WIFO-Macromod – An econometric model of the
Austrian economy. In: OeNB (ed): Macroeconomic Models and Forcasts for Austria.
Proceedings of OeNB Workshops No. 5
Bhaduri, Amit, Marglin, Stephen, 1990. Unemployment and the Real Wage: The Economic Basis for
Contesting Political Ideologies. Cambridge Journal of Economics, 14: 375-93
Blecker, R., 1999. Kaleckian macromodels for open economies, in Deprez, J. and Harvey, J.T (eds):
Foundations of international economics: post Keynesian perspectives. Routledge, London,
New York.
Bowles, S, Boyer, R, 1995. Wages, aggregate demand, and employment in an open economy: an
empirical investigation. In: G Epstein and H Gintis (eds): Macroeconomic policy after the
conservative era. Studies in investment, saving and finance. Cambridge: University Press
Charemza, W, Deadman, D, 1997. New Directions in Econometric Practice. Edward Elgar,
Cheltenham.
Ederer, S, Stockhammer, 2007 (forthcoming). Wages and aggregate demand in France: An empirical
investigation. Hein, E, Truger, A (eds): Money, distribution, and economic policy –
alternatives to orthodox macroeconomics. Cheltenham: Edward Elgar forthcoming
European Commission 2006. Time to move up a gear. The new partnership for jobs and growth.
http://ec.europa.eu/growthandjobs/pdf/illustrated-version_en.pdf
Fagan, G, Henry, J, Mestre, R (2001). An area-wide model (AWM) for the Euro area. ECB Working
Paper 42
Fazzari, S, Mott, T, 1986. The investment theories of Kalecki and Keynes: an empirical study of firm
data, 1970-1982. Journal of Post Keynesian Economics 9, 2: 171-187
Flassbeck, H, Spiecker, F, 2005. Die deutsche Lohnpolitik sprengt die Europäische Währungsunion.
WSI Mitteilungen 12/2005, 707-13
Gordon, David, 1995. Growth distribution, and the rules of the game: social structuralist macro
foundations for a democratic economic policy. In: G Epstein and H Gintis (eds):
Macroeconomic policy after the conservative era. Studies in investment, saving and finance.
Cambridge: University Press
Gordon, David, 1995. Putting the horse (back) before the cart: disentangeling the macro relationship
between investment and saving. In: G Epstein and H Gintis (eds): Macroeconomic policy after
the conservative era. Studies in investment, saving and finance. Cambridge: University Press
Hatzius, Jan, 2000. Foreign direct investment and factor demand elasticities. European Economic
Review 44 (1), 77-143
Hein, E, and Ochsen, C., 2003. Regimes of interest rates, income shares, savings, and investment: a
Kaleckian model and empirical estimations for some advanced OECD-economies, in:
Metroeconomica, Vol. 54, 404-433
Hein, E, Krämer, H, 1997. Income shares and capital formation: patterns of recent developments.
Journal of Income Distribution 7, 1: 5-28
Hein, E, Vogel, L, 2007. Distribution and growth reconsidered – empirical results for Austria, France,
Germany, the Netherlands, the UK and the USA. IMK working paper 3/2007
Kalecki, Michal, 1954. Theory of Economic Dynamics. Reprinted in J. Osiatynski (ed): Collected Works
of Michal Kalecki, Vol. 1, Oxford: Clarendon Press
Marginson , P, Sisson, K (2004). European integration and industrial relations. Multi-level governance
in the making. Houndsmill: Palgrave MacMillan
Marglin, S, Bhaduri, A, 1990. Profit Squeeze and Keynesian Theory. In: S. Marglin and J. Schor (eds):
The Golden Age of Capitalism. Reinterpreting the Postwar Experience. Oxford: Clarendon
Marterbauer, M; Walterskirchen, E., (2003). Bestimmungsgründe der Lohnquote und realen
Lohnstückkosten. Wifo-Monatsberichte 2/03, 151-59
Naastepad, R, Storm, S (2006/7), OECD demand regimes (1960-2000), Journal of Post-Keynesian
Economics29 (2) 213-248
Naastepad, Ro (2006). Technology, demand and dstrrbution: a cumulative growth model with an
application to the Dutch productivity slowdown. Cambridge Journal of Economics 30 (3) 403-
434

Palley, Thomas, 2006. Currency Unions, the Phillips Curve, and Stabilization Policy: Some Suggestions
for Europe. Intervention 3 (2),351-370
Rodrik, Dani, 1997. Has globalization gone too far? Washington: Institute for International Economics
Schulten, Thorsten (2004). Solidarische Lohnpolitik in Europa. Zur Politischen Ökonomie der
Gewerkschaften. Hamburg: VSA-Verlag
Stockhammer, E. and O. Onaran (2004), 'Accumulation, Distribution and Employment: A Structural
VAR Approach to a Kaleckian Macro-model' Structural Change and Economic Dynamics 15
(4), 421-47
Visser, Jelle, 2004. Patterns and variations in European industrial relations. Chapter 1 in: European
Commission: Industrial relations in Europe 2004. Luxembourg: European Communities
Appendix
Table A.1: Variable definitions
Notation Ameco-
Nota
tion
Description Notes
C OCPH Private consumption, real -
E - Exchange rate Index
(1960=100).gro
wth rate of
trade-weighted
exchange rates.
Exchange rate
in price
notation (1 € in
foreign
curreny).
Weights: see
YW
ED NWTD dependent employment,
private sector -
ET NETD employment, private
sector -
Y OVGD GDP, real -
YW - Trade-weighted GDP of
main trading partnres,
real
Index (1960=100).
Weighted
growth rates of
real GDP of
main trading
partner.
Weights: shares
of exports of
EU12, 2000-
2005 Main
trading
partners: USA,
UK, Sweden,
Japan,
Switzerland,
Turkey; from
1991 also:
China, Russia,
Czech
Republic,
Hungary,
Poland.
(source:
Eurostat).
I OIGT Private Investitionen, real -
i - Long-run interest rate,
real: deflated by the
GDP deflator
source: OECD
Economic
Outlook: IRL
M DMGE Imports, real extra EU12 imports
of goods
Belgium, Lux
from 1999.
NX - Net exports, real NX = X – M
R - Gross operating surplus,
real R = UOGD/PVGD
P PVGD GDP deflator -
PM PXGS Import price deflator -
PX PMGS Export price deflator -
ULC PLCD Unit labor costs -
RULC ALCD Real unit labor costs -
W - Compensation of
employees, real W = UWCD/PVGD
X DXGE Exports, real extra EU12 imports
of goods.
Belgium, Lux
from 1999.

Table A.2. Unit root tests
Levels Differences
Variable Deterministic Lags Test stat. Significance Deterministic Lags
Test stat. Significance
ln C c,t 1 -2.054 - c 0 -2.985 *** ln W c,t 1 -2.090 - c 0 -2.405 ** ln R c,t 0 -2.161 - c 0 -5.204 *** ln I c,t 1 -2.878 * c 0 -3.823 *** ln Y c,t 0 -2.607 - c 0 -3.969 *** i c 0 -1.370 - c 0 -6.150 *** ln X c,t 0 -1.721 - c 0 -5.678 *** ln YW c,t 1 -3.125 ** c 0 -4.696 *** ln Ex c 0 -2.258 ** c 0 -5.559 *** ln Px/Pm c 1 -3.278 *** c 0 -5.529 *** ln M c,t 0 -1.632 - c 0 -6.150 *** ln P/Pm c 0 -1.027 - c 0 -5.126 *** NX/Y c 0 -2.512 ** c 1 -5.927 *** RULC c 1 -0.040 - c 0 -4.571 *** ln Px c,t 1 -0.820 - c 0 -3.182 *** ln Pm c,t 1 -1.059 - c 0 -4.081 *** ln P c,t 1 -1.855 - c 0 -0.937 - ln ULC c,t 1 -1.083 - c 0 -1.533 * Note: Critical values according to Charemza and Deadman (1997). *** = statistically
significant at 1%, ** = statistically significant at 5%, * = statistically significant at 10%.

Bisher sind in dieser Reihe erschienen: Eigl R., Experimentielle Methoden in der Mikroökonomik, No. 1, Mai 1991. Dockner E., Long N.V., International Pollution Control: Cooperative versus Non-Cooperative Strategies, No.
2, September 1991. Andraea C.A., Eigl R., Der öffentliche Sektor aus ordnungspolitischer Sicht, No. 3, Oktober 1991. Dockner E., A Dynamic Theory of Conjectural Variations, No. 4, Oktober 1991. Feichtinger G., Dockner E., Cyclical Consumption Pattern and Rational Addictions, No. 5, Oktober 1991. Marterbauer M., Die Rolle der Fiskalpolitik im Schwedischen Wohlfahrtsstaat, No. 6, Dezember 1991. Pichler E., Cost-Sharing of General and Specific Training with Depreciation of Human Capital, No. 7,
Dezember 1991. Pichler E., Union Wage Bargaining and Status, No. 8, Dezember 1991. Pichler E., Costs of Negotiations and the Structure of Bargaining - a Note, No. 9, Dezember 1991. Nowotny E., The Austrian Social Partnership and Democracy, No. 10, Dezember 1991. Pichler E., Walther H., The Economics of Sabbath, No. 11, April 1992. Klatzer E., Unger B., Will Internationalization Lead to a Convergence of National Economic Policies?,No. 12,
June 1992. Bellak C., Towards a Flexible Concept of Competitiveness, No. 13, May 1992. Koren St., Stiassny A., The Temporal Causality between Government Taxes and Spending, No. 14, August
1992. Altzinger W., Ost-West-Migration ohne Steuerungsmöglichkeiten?, No. 15, September 1992. Bellack Ch., Outsiders' Response to Europe 1992, Case of Austria, No. 16, December 1992. Guger A., Marterbauer M., Europäische Währungsunion und Konsequenzen für die Kollektiv-vertragspolitik,
No. 17, January 1993. Unger B., van Waarden F., Characteristics, Governance, Performance and Future Perspectives, No. 18,
January 1993. Scharmer F., The Validity Issue in Applied General Equilibrium Tax Models, No. 19, May 1993. Ragacs Ch., Minimum Wages in Austria: Estimation of Employment Functions, No. 20, June 1993. Ragacs Ch., Employment, Productivity, Output and Minimum Wages in Austria: A Time Series Analysis, No.
21, September 1993. Stiassny A., TVP - Ein Programm zur Schätzung von Modellen mit zeitvariierenden Parametern, No. 22,
December 1993. Gstach D., Scale Efficiency: Where Data Envelopment Analysis Outperforms Stochastic Production Function
Estimation, No. 23, December 1993. Gstach D., Comparing Structural Efficiency of Unbalanced Subsamples: A Resampeling Adaptation of Data
Envelopment Analysis, No. 24, December 1993. Klausinger H., Die Klassische Ökonomie und die Keynesianische Alternative. Revision ein Mythos?, No. 25,
December 1993. Grandner T., Gewerkschaften in einem Cournot-Duopol. Sequentielle versus simultane Lohnverhandlungen,
No. 26, April 1994. Stiasssny A., A Note on Frequency Domain Properties of Estimated VARs, No. 27, June 1994. Koren St., Stiassny A., Tax and Spend or Spend and Tax ? An International Study, No. 28, August 1994. Gstach D., Data Envelopment Analysis in a Stochastic Setting: The right answer form the wrong model?, No.
29, August 1994. Cantwell J., Bellak Ch., Measuring the Importance of International Production: The Re-Estimation of Foreign
Direct Investment at Current Values, No. 30, January 1995. Klausinger H., Pigou’ s Macroeconomics of Unemployment (1933). A Simple Model, No. 31, February 1995. Häfke Ch., Helmenstein Ch., Neural Networks in Capital Markets: An Application to Index Forecasting, No.
32, January 1995. Hamberger K., Katzmair H., Arithmetische Politik und ökonomische Moral, Zur Genologie der
Sozialwissenschaften in England, No. 33, May 1995. Altzinger W., Beschäftigungseffekte des österreichischen Osthandels, No. 34, July 1995. Bellak Ch., Austrian Manufacturing Firms Abroad - The last 100 Years, No. 35, November 1995. Stiassny A., Wage Setting, Unemployment and the Phillips Curve, No. 36, January 1996. Zagler M., Long-Run Monetary Non-Neutrality in a Model of Endogenous Growth, No. 37, June 1996. Traxler F., Bohmann G., Ragacs C., Schreckeneder B., Labour Market Regulation in Austria, No. 38,
January, 1996. Gstach D., A new approach to stochastic frontier estimation: DEA+, No. 39, August 1996. Bellak Ch., Clement W., Hofer R., Wettbewerbs- und Strukturpolitik: Theoretische Begründung und neuere
Entwicklungen in Österreich, No. 40, June 1996. Nowotny E., Dritter Sektor, Öffentliche Hand und Gemeinwirtschaft, No. 41, August 1996. Grandner T., Is Wage-Leadership an Instrument to Coordinate Union’ s Wage-Policy? The Case of
Imperfect Product Markets, No. 42, November 1996.

Pirker R., The Constitution of Working Time, No. 43, Januar 1997. Nowotny E., Konsequenzen einer Globalisierung der Weltwirtschaft für unsere Gesellschaft, No. 44, Januar
1997. Grandner T., Territoriale Evolution von Kooperation in einem Gefangenendilemma, No. 45, February 1997. Häfke Ch., Sögner L., Asset Pricing under Asymmetric Information, No. 46, February 1997. Stiassny A., Die Relevanz von Effizienzlöhnen im Rahmen von Gewerkschaftsverhandlungsmodellen, No.
47, May 1997. Stiassny A., Unsicherheit bezüglich der Preiselastizität der Güternachfrage als reale Rigidität, No. 48, May
1997. Klausinger H., Die Alternativen zur Deflationspolitik Brünings im Lichte zeitgenössischer Kritik, No. 49, June
1997. Wehinger G.D., Exchange Rate-Based Stabilization: Pleasant Monetary Dynamics?. No. 50, August 1997. Wehninger G.D., Are Exchange Rate-Based Stabilizations Expansionary? Theoretical Considerations and
the Brazilian Case, No. 51, August 1997. Huber C., Sögner L., Stern A., Selbstselektierendes Strompreisregulierungsmodell, No. 52, August 1997. Ragacs Ch., Zagler M., Economic Policy in a Model of Endogenous Growth, No. 53, October 1997. Mahlberg B., Url T., Effects of the Single Market on the Austrian Insurance Industry, No. 54, February 1998. Gstach D., Grander T., Restricted Immigration In as Two-Sector Economy, No. 55, March 1998. Sögner L., Regulation of a Complementary Imputed Good in a Competitive Environment, No. 56, March
1998. Altzinger W., Austria's Foreign Direct Investment in Central and Eastern Europe: 'Supply Based' or Marked
Driven?, No. 57, April 1998. Gstach D., Small Sample Performance of Two Approaches to Technical Efficiency Estimation in Noisy
Multiple Output Environments, No. 58, June 1998. Gstach D., Technical Efficiency in Noisy Multi-Output Settings, No. 59, June 1998. Ragacs Ch., Zagler M., Growth Theories and the Persistence of Output Fluctuations: The Case of Austria,
No. 60, October 1998. Grandner T., Market Shares of Price Setting Firms and Trade Unions, No. 61, October 1998. Bellak Ch., Explaining Foreign Ownership by Comparative and Competitive Advantage: Empirical Evidence,
No. 62, March 1999. Klausinger H., The Stability of Full Employment. A Reconstruction of Chapter 19-Keynesianism, No. 63, April
1999. Katzmair H., Der Modellbegriff in den Sozialwissenschaften. Zum Programm einer kritischen Sozio-Logik,
No. 64, June 1999. Rumler F., Computable General Equilibrium Modeling, Numerical Simulations in a 2-Country Monetary
General Equilibrium Model, No. 65, June 1999. Zagler M., Endogenous Growth, Efficiency Wages and Persistent Unemployment, No. 66, September 1999. Stockhammer E., Robinsonian and Kaleckian Growth. An Update on Post-Keynesian Growth Theories, No.
67, October 1999. Stockhammer E., Explaining European Unemployment: Testing the NAIRU Theory and a Keynesian
Approach, No. 68, February 2000. Klausinger H., Walras’ s Law and the IS-LM Model. A Tale of Progress and Regress, No. 69, May 2000. Grandner T., A Note on Unionized Firms’ Incentive to Integrate Vertically, No. 70, May 2000. Grandner T., Optimal Contracts for Vertically Connected, Unionized Duopolies, No. 71, July 2000. Heise, A., Postkeynesianische Beschäftigungstheorie, Einige prinzipielle Überlegungen, No. 72, August
2000. Heise, A., Theorie optimaler Lohnräume, Zur Lohnpolitik in der Europäischen Währungsunion, No. 73,
August 2000. Unger B., Zagler M., Institutional and Organizational Determinants of Product Innovations. No. 74, August
2000. Bellak, Ch., The Investment Development Path of Austria, No. 75, November 2000. Heise, A., Das Konzept einer nachhaltige Finanzpolitik aus heterodoxer Sicht – ein Diskussionsbeitrag, No.
76, April 2001. Kocher M., Luptacik M., Sutter M., Measuring Productivity of Research in Economics. A Cross-Country
Study Using DEA, No. 77, August 2001. Munduch, G., Pfister A., Sögner L., Stiassny A., Estimating Marginal Costs fort he Austrian Railway System,
No. 78, Februray 2002. Stückler M., Überprüfung von Gültigkeit und Annahmen der Friedman-These für Rohstoffmärkte, No. 79,
July 2002. Stückler M., Handel auf Terminkontraktmärkten, No. 80, July 2002. Ragacs Ch., Minimum Wages, Human Capital, Employment and Growth, No. 81, August 2002. Klausinger H., Walras’ Law in Stochastic Macro Models: The Example of the Optimal Monetary Instrument,
No. 82, November 2002. Gstach D., A Statistical Framework for Estimating Output-Specific Efficiencies, No. 83, February 2003.

Gstach D., Somers A., Warning S., Output specific efficiencies: The case of UK private secondary schools, No. 84, February 2003.
Kubin I., The dynamics of wages and employment in a model of monopolistic competition and efficient bargaining, No. 85. May 2003.
Bellak Ch., The Impact of Enlargement on the Race For FDI. No. 86 Jan. 2004 Bellak Ch., How Domestic and Foreign Firms Differ and Why Does it Matter?. No. 87 Jan. 2004 Grandner T., Gstach D., Joint Adjustment of house prices, stock prices and output towards short run
equilibrium, No. 88. January 2004 Currie M., Kubin I., Fixed Price Dynamics versus Flexible Price Dynamics, No. 89, January 2005 Schönfeld S., Reinstaller A., The effects of gallery and artist reputation on prices in the primary market for
art: A note, No. 90, May 2005 Böheim, R. and Muehlberger, U., Dependent Forms of Self-employment in the UK: Identifying Workers on
the Border between Employment and Self-employment. No. 91, Feb. 2006 Hammerschmidt, A., A strategic investment game with endogenous absorptive capacity. No. 92, April 2006 Onaran, Ö., Speculation-led growth and fragility in Turkey: Does EU make a difference or “ can it happen
again” ? No. 93, May 2006 Onaran, Ö., Stockhammer, E., The effect of FDI and foreign trade on wages in the Central and Eastern
European Countries in the post-transition era: A sectoral analysis. No. 94, June 2006 Burger, A., Reasons for the U.S. growth period in the nineties: non-keynesian effects, asset wealth and
productivity. No. 95, July 2006 Stockhammer, E., Is the NAIRU theory a Monetarist, New Keynesian, Post Keynesian or a Marxist theory?
No. 96, March 2006 Onaran, Ö., Aydiner-Avsar, N., The controversy over employment policy: Low labor costs and openness, or
demand policy? A sectoral analysis for Turkey. No. 97, August 2006 Klausinger, H., Oskar Morgenstern als wirtschaftspolitischer Berater in den 1930er-Jahren. No. 98, July
2006 Rocha-Akis, S., Labour tax policies and strategic offshoring under unionised oligopoly. No. 99, November
2006 Stockhammer, E., Onaran, Ö., National and sectoral factors in wage formation in Central and Eastern
Europe. No. 100, December 2006 Badinger, H., Kubin, I. Vom kurzfristigen zum mittelfristigen Gleichgewicht in einer offenen Volkswirtschaft
unter fixen und flexiblen Wechselkursen. No. 101, January 2007 Stockhammer, E., Onaran, Ö., Ederer, S. Functional income distribution and aggregate demand in the Euro-
area. No. 102, February 2007