Full Report UITM vs UMK
96
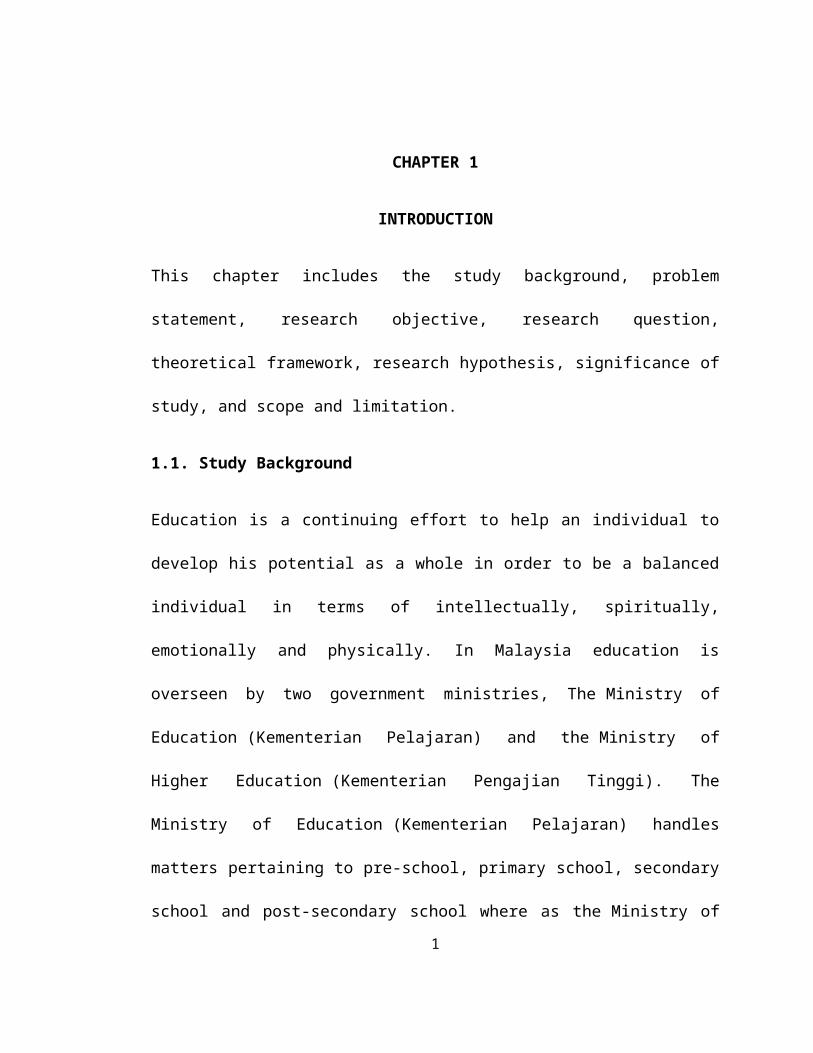
CHAPTER 1 INTRODUCTION This chapter includes the study background, problem statement, research objective, research question, theoretical framework, research hypothesis, significance of study, and scope and limitation. 1.1. Study Background Education is a continuing effort to help an individual to develop his potential as a whole in order to be a balanced individual in terms of intellectually, spiritually, emotionally and physically. In Malaysia education is overseen by two government ministries, The Ministry of Education (Kementerian Pelajaran) and the Ministry of Higher Education (Kementerian Pengajian Tinggi). The Ministry of Education (Kementerian Pelajaran) handles matters pertaining to pre-school, primary school, secondary school and post-secondary school where as the Ministry of 1
Transcript of Full Report UITM vs UMK
CHAPTER 1
INTRODUCTION
This chapter includes the study background, problem
statement, research objective, research question,
theoretical framework, research hypothesis, significance of
study, and scope and limitation.
1.1. Study Background
Education is a continuing effort to help an individual to
develop his potential as a whole in order to be a balanced
individual in terms of intellectually, spiritually,
emotionally and physically. In Malaysia education is
overseen by two government ministries, The Ministry of
Education (Kementerian Pelajaran) and the Ministry of
Higher Education (Kementerian Pengajian Tinggi). The
Ministry of Education (Kementerian Pelajaran) handles
matters pertaining to pre-school, primary school, secondary
school and post-secondary school where as the Ministry of1
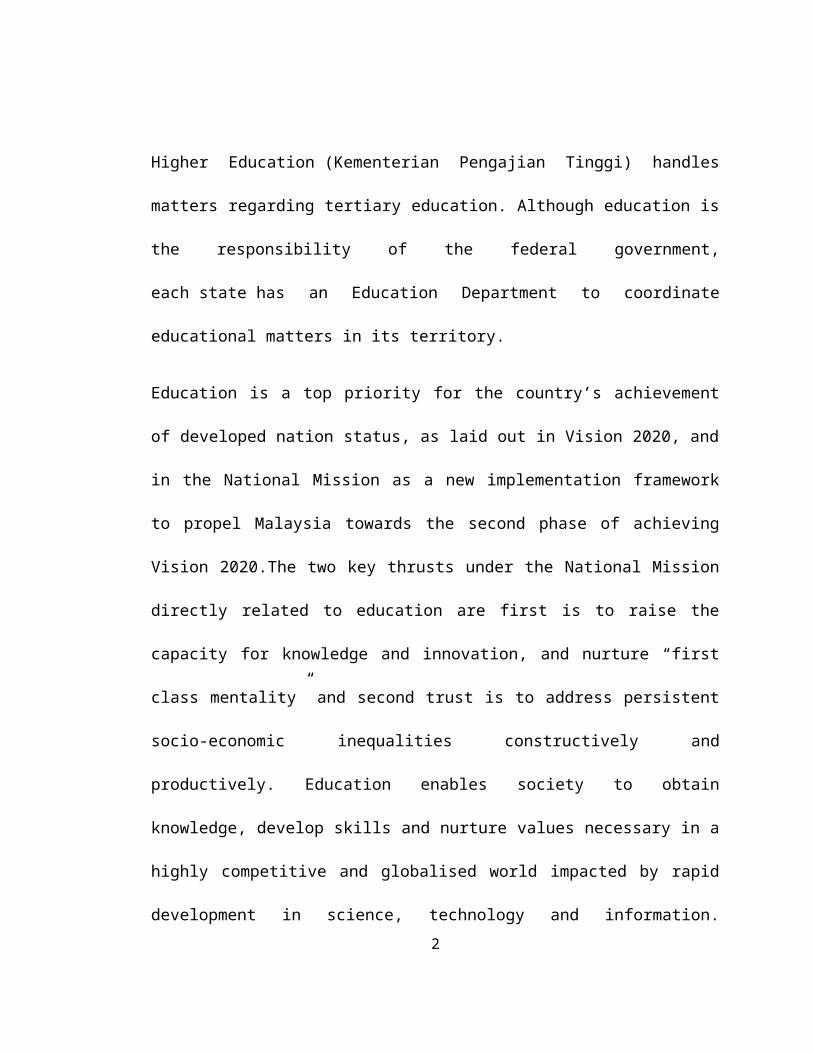
Higher Education (Kementerian Pengajian Tinggi) handles
matters regarding tertiary education. Although education is
the responsibility of the federal government,
each state has an Education Department to coordinate
educational matters in its territory.
Education is a top priority for the country’s achievement
of developed nation status, as laid out in Vision 2020, and
in the National Mission as a new implementation framework
to propel Malaysia towards the second phase of achieving
Vision 2020.The two key thrusts under the National Mission
directly related to education are first is to raise the
capacity for knowledge and innovation, and nurture “first
class mentality” and second trust is to address persistent
socio-economic inequalities constructively and
productively. Education enables society to obtain
knowledge, develop skills and nurture values necessary in a
highly competitive and globalised world impacted by rapid
development in science, technology and information.2
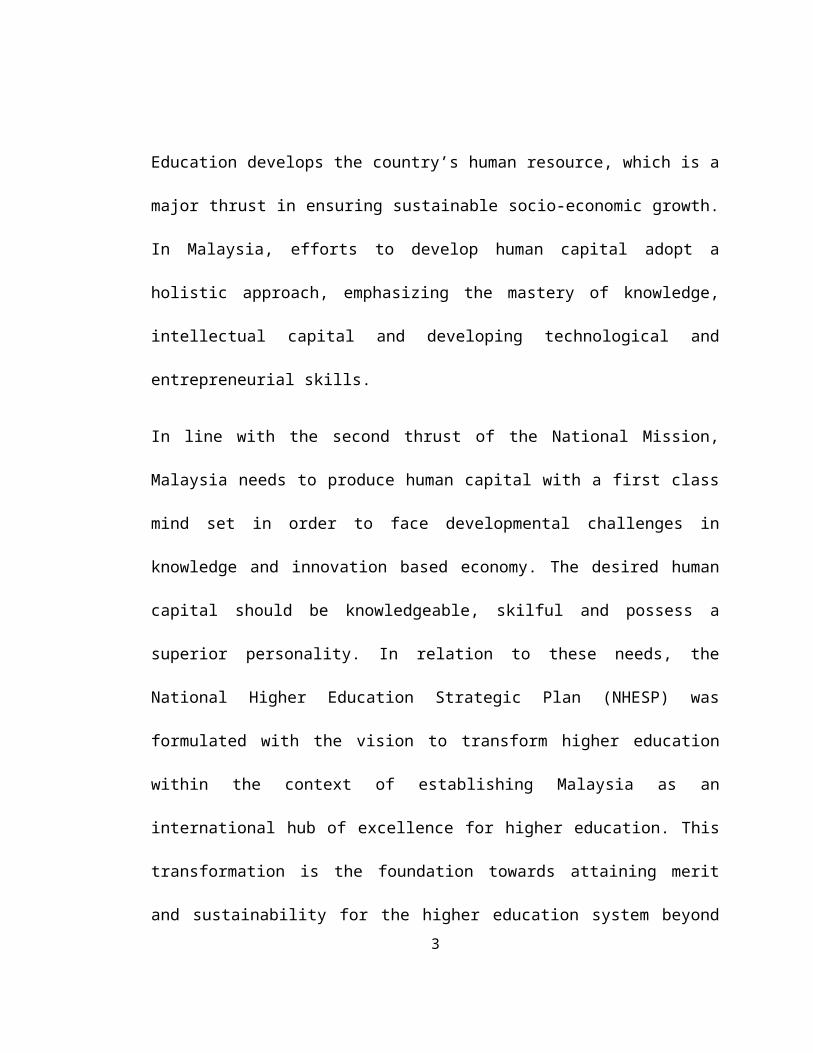
Education develops the country’s human resource, which is a
major thrust in ensuring sustainable socio-economic growth.
In Malaysia, efforts to develop human capital adopt a
holistic approach, emphasizing the mastery of knowledge,
intellectual capital and developing technological and
entrepreneurial skills.
In line with the second thrust of the National Mission,
Malaysia needs to produce human capital with a first class
mind set in order to face developmental challenges in
knowledge and innovation based economy. The desired human
capital should be knowledgeable, skilful and possess a
superior personality. In relation to these needs, the
National Higher Education Strategic Plan (NHESP) was
formulated with the vision to transform higher education
within the context of establishing Malaysia as an
international hub of excellence for higher education. This
transformation is the foundation towards attaining merit
and sustainability for the higher education system beyond3

2020.To achieve the National Mission, education at tertiary
level plays an important role to generate quality human
capital. Tertiary Education in the context of the Malaysian
education system is education after secondary education up
to the tertiary level. As we know, university is the most
important institution to provide tertiary education to
student after finishing secondary education.
The expansion of universities is one marked feature of the
social life in the present age, (Alfred North Whitehead,
1927). All countries have shared in this movement including
Malaysia. Currently, Malaysia has 20 public institutions of
higher learning (IPTA), which provides a variety of
opportunities for students to continue their studies to a
higher level. Universities was the Universiti Malaya (UM),
Universiti Sains Malaysia (USM), Universiti Kebangsaan
Malaysia (UKM), Universiti Putra Malaysia (UPM), Universiti
Teknologi Malaysia (UTM), Universiti Utara Malaysia (UUM),
Universiti Islam Antarabangsa Malaysia (UIAM),Universiti4
Malaysia Sarawak (UNIMAS),Universiti Malaysia Sabah (UMS),
Universiti Pendidikan Sultan Idris (UPSI),Universiti
Teknologi MARA(UiTM), Universiti Darul Iman Malaysia (UDM),
Universiti Malaysia Terengganu (UMT), Universiti Sains
Islam Malaysia (USIM), Universiti Teknologi Tun Hussein Onn
Malaysia (UTHM), Universiti Teknikal Malaysia Melaka
(UTeM), Universiti Malaysia Pahang (UMP), Universiti
Malaysia Perlis (UniMAP), Universiti Malaysia Kelantan
(UMK) Universiti Pertahanan Nasional Malaysia (UPNM).
The process in making decision in selecting the right
university is very difficult to student. It is because; it
will determine the successful of student in the future.
1.2. Problem Statement
According to the Falsafah Pendidikan Kebangsaan, "Education
in Malaysia is an ongoing effort towards further developing
the potential of individuals in a holistic and integrated5
approach to create stable and harmonious intellectually,
spiritually, emotionally and physically. Effort is designed
to produce Malaysian citizens who are knowledgeable,
honorable, responsible, competent and capable of achieving
well-being and contribute to the betterment of family,
community and country. "To achieve these goals,
institutions of higher education plays a very important
role.
Challenges of today, the public universities in Malaysia
are not only compete with each other to attract more
students to choose their university but they also compete
with private universities. Even so, the total enrollment at
the public university is always more than the private
university. Statistic in year 2011 show that the total
student enrolled at public university is 508256 compared to
private university which is 419752.
6

The problem is, student’s especially graduating high school
students are faced with the problem of having to decide on
future career paths. The decision whether or not to
continue with post secondary education and the choice of an
institution to attend are two critical decisions that
students make at this time in their lives (Johnson &
Chapman, 1979).Students always confusing in selecting the
best university that meet with their eligibility and
interest. Student’s result from the high school is one of
the factors that influence student in selecting a
university.
Besides that factor, there are many another factors that
influence students in selecting university. Usually,
parents, relatives, teachers, friends and community
influence student decision about education and the future
of them. Because of these influences, student may be choose
a wrong university and not meet their interest.
Consequently, they will not perform well in that university7
and after graduate they will not get a good job because of
not meet the requirement.
Students also influenced by another factors such as
‘Karnival Jom Masuk U’, schools, and advertisements in
newspaper in choose a university. But, information received
sometimes not relevant and if students make a mistake in
selection, students may face problems if the university is
not able to provide the best service.
Selecting the best university is the critical decision
because it will determine our future after graduate. The
purpose of this study is to determine the factors that
influence student’s preference of choosing IPTA. The
purpose of this study is to determine the main factors that
influence student’s preference of choosing the institution
of higher education (IPTA).
8
1.3. Research Objective
The objectives of this study are:
1) To determine whether there is significance difference
in factor financing between UiTM and UMK.
2) To determine whether there is significance difference
in factor of academic performance between UiTM and
UMK.
3) To determine whether there is significance difference
in factor of academic performance between groups of
gender.
4) To identify whether there is significance difference
in CGPA between UiTM and UMK.
5) To determine whether there is significance difference
in factor of promotion between groups of gender.
9

6) To determine whether there is significance difference
between student’s expectation level and actual level
of satisfaction towards facilities or educational
resources.
7) To investigate whether there is significance
difference in financing factors when respondents are
classified according to their parents income.
8) To determine whether there is significance difference
in factor of influencer people when respondents are
classified according highest academic qualification of
father.
1.4. Research Question
The research questions for this study are:
1) Does the factor of financing between UiTM and UMK have
significance difference?
2) Does the factor of academic performance between UiTM
and UMK have significance difference?
10

3) Does the factor of academic performance between groups
of gender have significance difference?
4) Does the CGPA between UiTM and UMK have significance
difference?
5) Does the factor of promotion between groups of gender
have significance difference?
6) Does the student’s expectation level and actual level
of satisfaction towards facilities or educational
resources have significance difference?
7) Does there is significance difference in financing
factors when respondents are classified according to
their parents income?
8) Does there is significance difference in influencer
people factors when respondents are classified
according to their highest academic qualification of
father?
11
1.5. Research Hypothesis
The research hypotheses for this study are:
1) H0: There is no significant difference in financing
factors between UiTM and UMK.
H1: There is significant difference in financing
factors between UiTM and UMK.
2) H0: There is no significance difference in factor of
academic performance between UiTM and UMK.
H1: There is significance difference in factor of
academic performance between UiTM and UMK
3) H0: There is significant difference in academic
performance between groups of gender.
H1: There is no significant difference in academic
performance between groups of gender.
4) H0: There is no significant difference in CGPA between
UiTM and UMK.
12
H1: There is a significant difference in CGPA between
UiTM and UMK.
5) H0: There is no significance difference in factor of
promotion between groups of gender.
H1: There is significance difference in factor of promotion between groups of gender.
6) H0: There is no significant difference between the
student’s expectation level and actual level of
satisfaction towards facilities or educational
resources.
H1: There is a significant difference between the
student’s expectation level and actual level of
satisfaction towards facilities or educational
resources.
7) H0 :There is no significant difference in financing
factors when respondents are classified according to
their parents income
13
H1: There is significant difference in financing
factors when respondents are classified according to
their parent’s income
8) H0: There is no significance difference in factor of
influencer people when respondents are classified
according highest academic qualification of father.
H1: There is significance difference in factor of
influencer people when respondents are classified
according highest academic qualification of father.
1.6. Significance of Study
The purpose of this study is to determine whether the
variable involved have fully significance influence to
student’s preference of choosing IPTA. This study helps the
institution of higher education to clearly understand about
student’s preference in choosing university. Therefore,
they can improve the effectiveness of their institutions to
full fill the student’s needs and requirement. 14

1.7. Scope and Limitation
The limitation of this study is focused on student’s UiTM
Kota Bharu and UMK who are already have experiences in
making decision in choosing university. We have selected 50
students of UiTM and 50 students of UMK as our respondents.
15

CHAPTER 2
LITERATURE REVIEW
To compute preferences in order to describe the influence
students by choosing IPTA, it based on four factors such as
financing, academic performances, influencer people,
background of institution and facilities, and promotion.
These five factors will be count with preferences in order
to find the factors that influence students choosing IPTA.
Therefore, to get a specific factor of influence students
is actually required of these five independent variables.
From many previous research studies about the selection of
institutions is the suitability of the course. They find
that the suitability of the course is the most
16
important factor in determining the choice of a
university (Muhammad Zaki Mustafa et al. 2012).
According to (Avery & Hoxby, 2004) some of the scholarships
and aid are meant purely to relieve liquidity constraints
that might prevent needy students from attending the
college they most prefer. These factors are helps student
to support their financial cost while studying at the
university they most prefer. The household income is an
important indicator of the socio-economic background.
Interaction between factor income with the cost of study
and financial aid directly affect the results of the
election.
According to (Avery & Hoxby, 2004) although they found
that students from di erent backgrounds do exhibit somewhatff
di erent college choice behavior, the di erences are notff ff
dramatic and much college choice behavior is shared by the
entire array of high-aptitude students. The main exceptions
17

to this rule are students whose parents have high incomes
or who themselves graduated from very selective colleges.
Such students exhibit less sensitivity to variables that
a ect college costs. This being said, the students in ourff
sample exhibit some hard-to-justify responses to aid that
they are o ered. They are excessively attracted by loansff
and work study, given the value of these types of aid
compared to grants. They are attracted by super cialfi
aspects of a grant, like its being called a scholarship
(with a name) and its being front-loaded. They are far more
sensitive to a grant’s share of the college’s comprehensive
costs than they are to the amount of the grant. All these
behaviors are deviations from the expected behavior of a
rational investor in human capital. We should note that
these peculiar behaviors are generally not shared by the
students whose parents have high incomes or who themselves
attended very selective colleges.
18

From (Holdswoth & Nind 2008) the study found that the
students’ choice preferences for particular universities
are largely determined by the quality and flexibility of
the degree or course combinations, the extent to which the
university has good accommodation options available,
whether or not employers are likely to recruit from that
university, whether the overall cost of the university is
similar or higher in comparison to other universities and
the spatial proximity of the university to their home.
“Academic Program Choice”, “Quality of Teaching and
Academics”, “Employment Prospect” and “University Choice”
were the important factors students considered in deciding
on UNIMAS for their further studies. In terms of
differences in factors influencing decision to select
UNIMAS, female respondents generally perceived these
factors to be more influential than did male respondents.
Rural respondents on the other hand tended to view these
19

factors as having more influence in making them chose
UNIMAS compared to urban respondents (Songan et el. 2010).
According to Sharifah Nurulhikmah, Noor Maizura and Mustafa
(2009) the most considered university are the university
that provide the financial support and helps to the
students, could guarantee the job opportunities and the
availability of the course. In the other hand, the least
considered criteria are the proximity or the nearness of
the university location, in town university location and
the academic fees. Second section of the findings shows
that students might choose a university based on the
influencer thought. The influencer includes parents,
teachers, friends and siblings. Nevertheless, self-opinion
is the most dominant influencer among the students.
According to Ahmad Zamri bin Khairani ,Nordin bin Abd.
Razak (2013) from the finding it can be shown that the
participants endorse items related to university’s image is
20

the easiest to agree with. This, in turn, can be
interpreted that university’s image is most important
factors that influence prospective students to choose
public universities. The findings imply that local public
unversities should potray themselves as HEIs that provide
comprehensive learning environment. The universities should
equip themselves not only in teaching and learning area but
also other aspects associated with it such as facilities,
environment, etc.
From the research by Jacqueline Liza Fernandez (2010) the
three main factors rated as extremely important reasons for
pursuing tertiary education in a public institution were
the quality of the education; lower costs; and access to
financial assistance. About 64% of the students considered
the high quality of education in public universities as an
extremely important reason for their choice, whereas 50%
rate pecuniary factors (e.g., lower costs of education and
readily available financial assistance in public 21
institutions) as extremely important considerations that
underlie their choice. More than 60% of students indicated
that the high quality of education provided by public
universities is the most important reason for choosing a
public institution.
From the previous research by Andriani Kusumawati, Venkata
K. Yanamandram and Nelson Perera (2010) the respondents in
this study exhibited many similar responses when choosing a
university as other countries. These included cost,
reputation, and proximity which were key drivers when
selecting an institute of higher education. The other
common antecedents are job prospect, parents and quality.
These results suggest that the antecedents to studying at a
public university for potential undergraduates are vary and
complex. The implication is that universities may addresses
those important attributes more effectively so that can
influence the choice process among potential students. This
study has revealed several important factors considered by 22

Indonesian students when selecting a university that both
support and contradict previous research; these factors
have different level of importance as these criteria may be
unique to Indonesia. In addition to determining what is
important to Indonesian students when they choose
universities, it will help universities to promote their
institutions and to have a greater knowledge about the
underlying motivations of students for furthering study in
higher education.
According (Raposo & Alves 2007) after having tested the
proposed model of choice process, the results show that the
model only explains 10% of data variance in what concerns
the choice of university, showing that other factors should
be used to explain the university choice process. All the
proposed effects in the choice process are significant to a
level of significance of 0.05 although they are not very
strong. Personal factors show the greatest positive
influence (0.223), whilst influence of others shows the23

greatest negative impact in the decision taken by the
student. Educational offer has a strong influence in
university reputation, since it explains 49% of variance in
reputation for Medical students it is important when
planning communications to promote individual factors, such
as proximity to home, costs and staying near the family,
but also to promote the university to teachers of secondary
education and professional counselors. It is also important
to raise current student satisfaction in order to generate
positive word of mouth. For students of Social Sciences and
Economics students, individual factors are the most
important For these students it is also important to
arrange visits to the campus, since this group shows that
previous knowledge about the institution is important in
their choice of university. As a final remark we assume
that this study helps universities to have a deeper
knowledge about the student choice process, helping
universities to improve their knowledge on how to deal with
24
the influences that can form student expectations and also
in recruitment development strategies.
From (Samsinar Md. Sidin et al. 2003) five factors,
explaining 61% of the total variance were identified. These
factors were named ‘Personal’, ‘Academic Quality and
Facilities’, ‘Factors’, ‘Campus’, ‘Socialization’, and
‘Financial aid and procedures. A ranking of means revealed
that friends and schoolmates, parents and relatives were
some of the sources of influence on students’ college
choice decision making. Newspapers were found to be more
influential relative to television and radio. Respondents
from the lower family income group are less likely to
enroll in private institutions. There is a significant bias
in students from higher income families enrolling in
private establishments. 84.3% of the students gather
college information on their own. Large proportions also
rely on friends and family members for information. As
newspapers are proven to be very influential source of25

information, college operators should utilize this media to
the fullest possible. Television and radio are proven to be
less influential in students' college choice decision. It
may well be as students usually pour through written
material in getting information on higher education.
CHAPTER 3
METHODOLOGY
In this chapter, the research plan was describe clearly
such as the plan of work and the necessary activities taken
to complete the research.
3.1. Target Population
This study was done around area of University Technology
Mara (UiTM) Campus Kota Bharu, Kelantan and University
Malaysia Kelantan. The target population for this study is
26
the undergraduate student that studying at the University
Technology Mara (UiTM) Campus Kota Bharu and University
Malaysia Kelantan only. The questionnaire was given to 100
students as the respondent.
3.2. Research Design
This study was performed to determine the factor that
influences student preferences of choosing publics
universities. A quantitative approach by using field survey
method was used in this study. This study used the single
cross-sectional design since the data were collected only
once from the respondents. The students of public
university which is University Technology Mara (UiTM)
Kelantan and University Malaysia Kelantan were chosen to be
the respondent to collect the data.
27
3.3. Data in the Research
This study used primary data because information from the
respondents was collected by using questionnaire. The
questionnaire was divided into six main sections, Section A
is demographic profile, Section B is financing, Section C
is academic performance, Section D is influencer people,
Section E is promotion and Section F is background and
facilities.
There are two types of data included in the questionnaire.
First is quantitative data, it can be measured numerically
such as the level of how disagree and agree of respondents
towards financing, academic performance, influence of
people and facilities as interval and cgpa as a ratio.
Second is qualitative data. It cannot be measured
numerically but can be divided into categorical data like
gender and age.
3.4. Research Instrument/Questionnaire
28
The decision to use a questionnaire was based on the
following advantages. First compared to other methods of
data collecting, it is relatively inexpensive. Secondly
questionnaires are suitable for large samples. Thirdly
questionnaires are relatively easy for volunteers to
complete. Lastly questionnaires take less time to complete
than other data gathering methods such as personal
interviews. The questionnaire was divided into six main
sections. The questionnaire used in this section was
adapted from instruments used in studies by Roslyn Louise
Kelly Beswick (1973). Researchers surveyed students and
others involved to determine factors of influence. Most of
the studies have focused on the United States where the
population of students, variety of institutions, and
financial environments differ greatly from the Canadian
situation.
Section A was focusing on the demographic profile of the
respondents. The respondent was ask about their gender,29

age, CGPA, financial support, parent’s education and
parent’s occupation.
In the Section B, the question about the financing in the
questionnaire is start by question 1 until 6. The score for
each item is provided on the right where the respondents
circle the answer from 0 to 10 depending on how much the
degree of importance of each item provide which is in
interval.
In the Section C, the question about the academic
performance in the questionnaire is start by question 1
until 14. The score for each item is provided on the right
where the respondents circle the answer from 0 to 10
depending on how much the degree of importance of each item
provide which is in interval.
In the Section D, the question about the list of influencer
people in the questionnaire is start by question 1 until 7.
The score for each item is provided on the right where the
30
respondents circle the answer from 0 to 10 depending on how
much the degree of importance of each item provide which is
in interval.
In the Section E, the question about the promotion of the
Public Higher Learning, the questionnaire is start by
question 1 until 6. The score for each item is provided on
the right where the respondents circle the answer from 0 to
10 depending on how much the degree of importance of each
item provide which is in interval.
In the Section F, the question is about the satisfaction
towards facilities or educational resources of the Public
Higher Learning. There is expectation and actual score. The
score for expectation is provided on the right and the
score for actual is provided on the left where the
respondents circle the answer from 0 to 10 depending on how
much the degree of importance of each item provide which is
in interval.
31

Table 3.1: Summary Table for the Research Instrument
Section Measurement scale Number of Question
Section A:
Demographic
Profile
Nominal, Ratio 11
Section B:
Financial
Interval 6
Section C:
Academic
Performance
Interval 14
Section D:
Influencer people
Interval 7
Section E:
Promotion
Interval 6
Section F:
Satisfaction
towards facilities
or educational
resources
Interval 39
32

3.5. Sampling Design
This study was used the Conveniences sampling method.
Conveniences sampling method is non-probability sampling
procedure where the selected sample represent the captive
audience. The 60 questionnaire were distributed to the
student at the University Technology Mara (UiTM) Campus
Kota Bharu, Kelantan and 60 questionnaires were distributed
at the University Malaysia Kelantan.
3.6. Sample Size Determination
The sample size for this study can be considered in
relation to factor analysis that we will utilize in the
analysis of data. We expect that there will be 5 factors
that influence students’ choice of university. The sample
size that suitable for this study is 100 respondents that
were selected from the student UiTM Kota Bharu and
University Malaysia Kelantan.
3.7. Method of Data Collection
33

The method of data collection is self-administered
questionnaire method. The permission to collect data is
obtained from the Academic Affairs (HEA) at the University
Technology Mara (UiTM) Kelantan, Campus Kota Bharu. The
questionnaire was given to the respondents and respondents
need to fill the questionnaire. The questionnaires were
designed to be as simple and clear as possible, with
targeted sections and questions. The researchers are given
the explanation about the questionnaire before respondents
answer the questionnaires.
3.8. Method of Data Analysis
Firstly is Descriptive Analysis. It is to calculate the
frequencies, study the mean scores, and also the ranking
results. In this section, descriptive analysis was conduct
on the primary data which is the questionnaires collected
by the respondents to give a brief overview. The analyses
include gender, age, current CGPA, financial aid, Parent’s
34

education and Parent’s Occupation. Bar charts and pie
charts are used to have a better and clearer understanding
to the analysis.
Secondly is checking the normality. Before applying
statistical methods that assume normality, it is necessary
to perform a normality test on the data. If the data is
normal, the analysis used the test like t-test and analysis
of variance (ANOVA). If the data is not normal, the
analysis used test like median test and kruskall-wallis.
Thirdly is checking the reliability. A reliability analysis
is to check the dimension of success factors generate
through factor analysis. It is a measurement that shows the
extent of the research and data is without bias. The
purpose to conduct reliability analysis is to ensure the
variables measure the exact value and error free.The
Cronbach’s alpha values should meet the minimum requirement
value that is 0.70. The benchmark or the acceptance of the
35

Cronbach’s alpha value should exceed 0.70. If the
reliability test on all the variables are reliable and
enable to continue further analysis.
The objectives and its statistical analysis of this study
are:
1) To determine whether there is significance difference
in factor financing between UiTM and UMK. The data is
not normally distributed, so it used non-parametric
test Mann Whitney.
2) To determine whether there is significance difference
in factor of academic performance between UiTM and
UMK. The data is not normally distributed, so it used
non-parametric test Mann Whitney.
3) To determine whether there is significance difference
in factor of academic performance between groups of
36
gender. The data is not normally distributed, so it
used non-parametric test Mann Whitney.
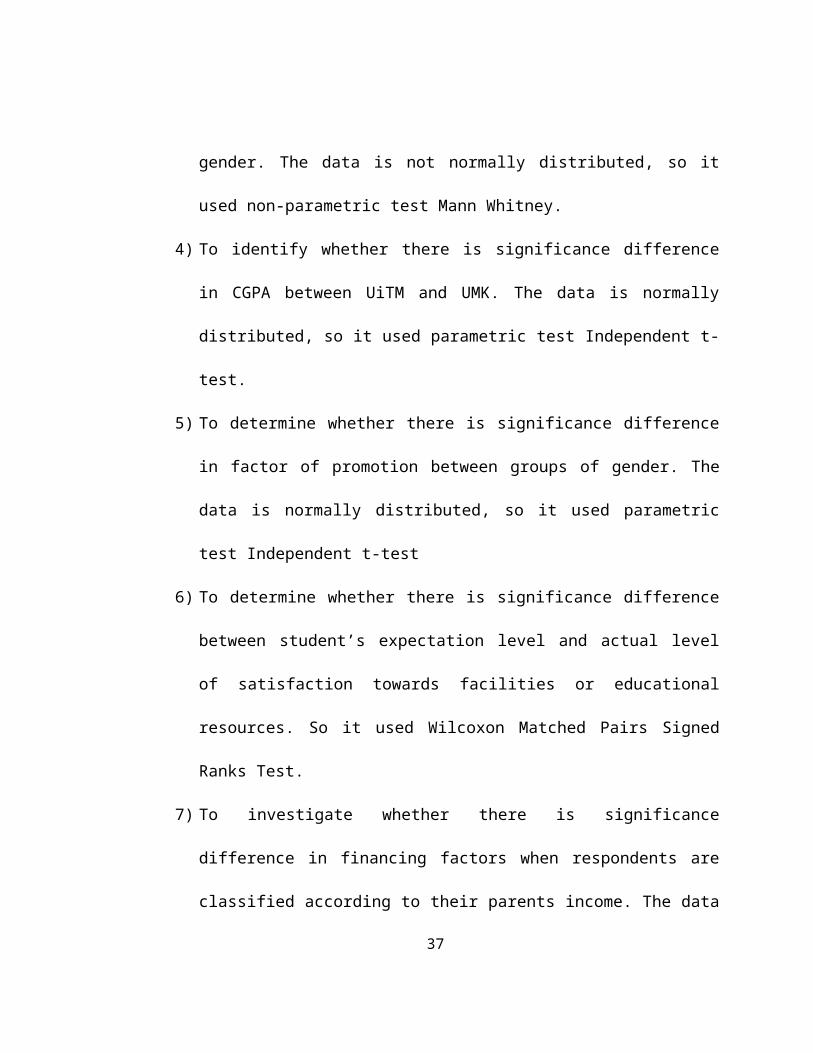
4) To identify whether there is significance difference
in CGPA between UiTM and UMK. The data is normally
distributed, so it used parametric test Independent t-
test.
5) To determine whether there is significance difference
in factor of promotion between groups of gender. The
data is normally distributed, so it used parametric
test Independent t-test
6) To determine whether there is significance difference
between student’s expectation level and actual level
of satisfaction towards facilities or educational
resources. So it used Wilcoxon Matched Pairs Signed
Ranks Test.
7) To investigate whether there is significance
difference in financing factors when respondents are
classified according to their parents income. The data
37

is not normally distributed, so it used non-parametric
test kruskal wallis.
8) To determine whether there is significance difference
in factor of influencer people when respondents are
classified according highest academic qualification of
father, The data is not normally distributed, so it
used non-parametric test kruskal wallis.
Table 3.2: Summary Table for the Method of Data Analysis
Objectives Question Scale ofMeasurement
Method
Parametric Non-Parametric
1. To determinewhether there is significancedifference in factor financing between UiTM and UMK
Section A(Question
5)
Section B(Question
1-6)
Nominal
Interval
Independentt-test SONCORRELATIN
2. To determinewhether there
Section A(Question
Nominal Independentt-test
38

is significancedifference in factor of academic performance between UiTM.
5)
Section C(Question
1-7)
Interval
3. To determinewhether there is significancedifference in factor of academic performance between groups of gender.
Section A(Question
1)
Section C(Question
1-7)
Nominal
Interval
Independentt-test
4. To identify whether there is significancedifference in CGPA between UiTM and UMK.
Section A(Question3 and
Question5)
Nominal
Ratio
Independentt-test
5. To determinewhether there is significancedifference in factor of promotion between groups of gender.
Section A(Question
1)
Section E(Question
1-6)
Nominal
Interval
Independent t-test
6. To determinewhether there is significancedifference
Section F(Question1-37)
Interval
Interval
Wilcoxon Matched Pairs Signed
39
between student’s expectation level and actual level ofsatisfaction towards facilities or educational resources.
Ranks
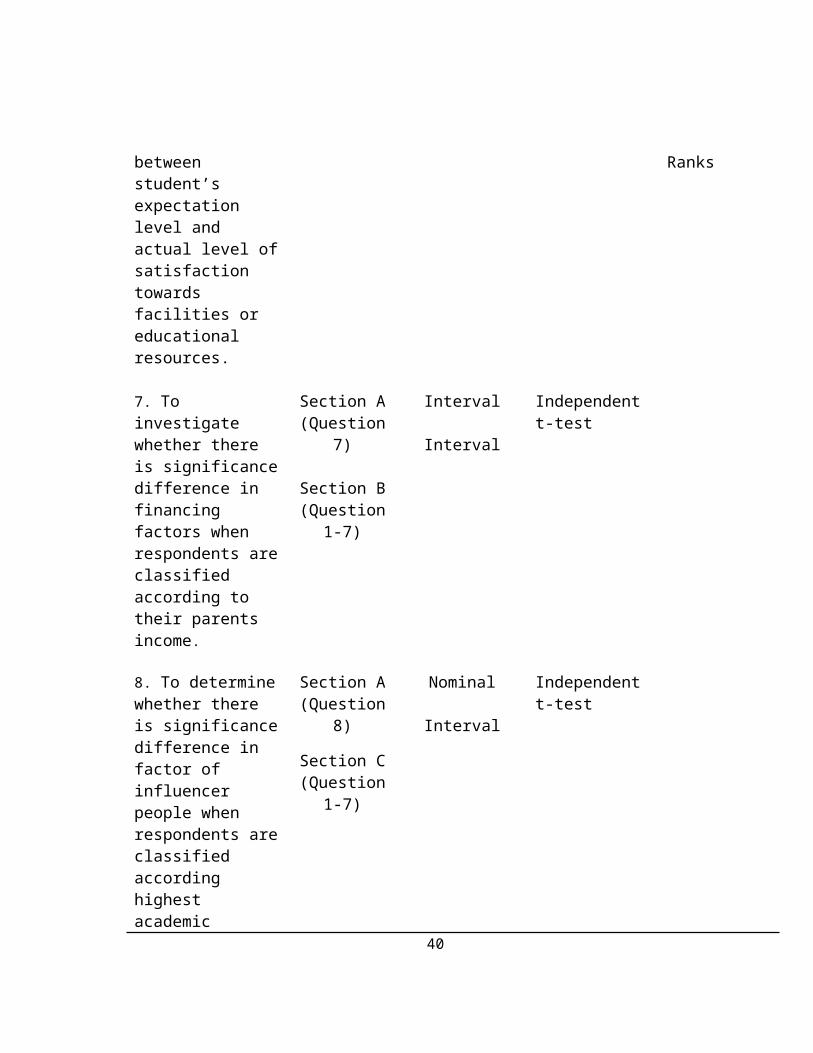
7. To investigate whether there is significancedifference in financing factors when respondents areclassified according to their parents income.
Section A(Question
7)
Section B(Question
1-7)
Interval
Interval
Independentt-test
8. To determinewhether there is significancedifference in factor of influencer people when respondents areclassified according highest academic
Section A(Question
8)
Section C(Question
1-7)
Nominal
Interval
Independentt-test
40
qualification of father.
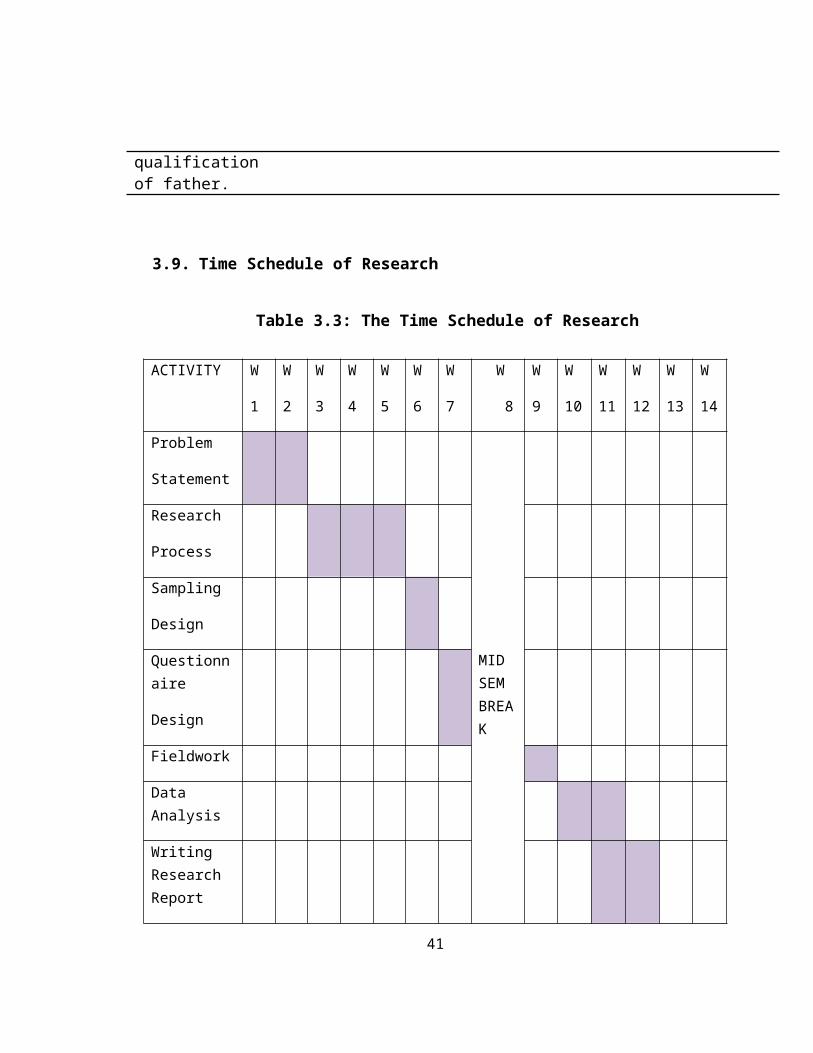
3.9. Time Schedule of Research
Table 3.3: The Time Schedule of Research
ACTIVITY W
1
W
2
W
3
W
4
W
5
W
6
W
7
W
8
W
9
W
10
W
11
W
12
W
13
W
14
Problem
Statement
MID SEM BREAK
Research
Process
Sampling
Design
Questionnaire
Design
Fieldwork
Data Analysis
Writing Research Report
41

Presentation
Submit Report
CHAPTER 4
ANALYSIS AND FINDING
This chapter provides result of data analysis and findings
of the study. This chapter divided into descriptive
analysis, reliability analysis, normality assessment and
statistical analysis based on the objectives.
4.1. Descriptive Analysis
Descriptive analysis provides simple summaries about the
sample and about the observation that have been made.
The summaries that used in this study are about the
42
nominal and ordinal data to get the initial description
of the data.
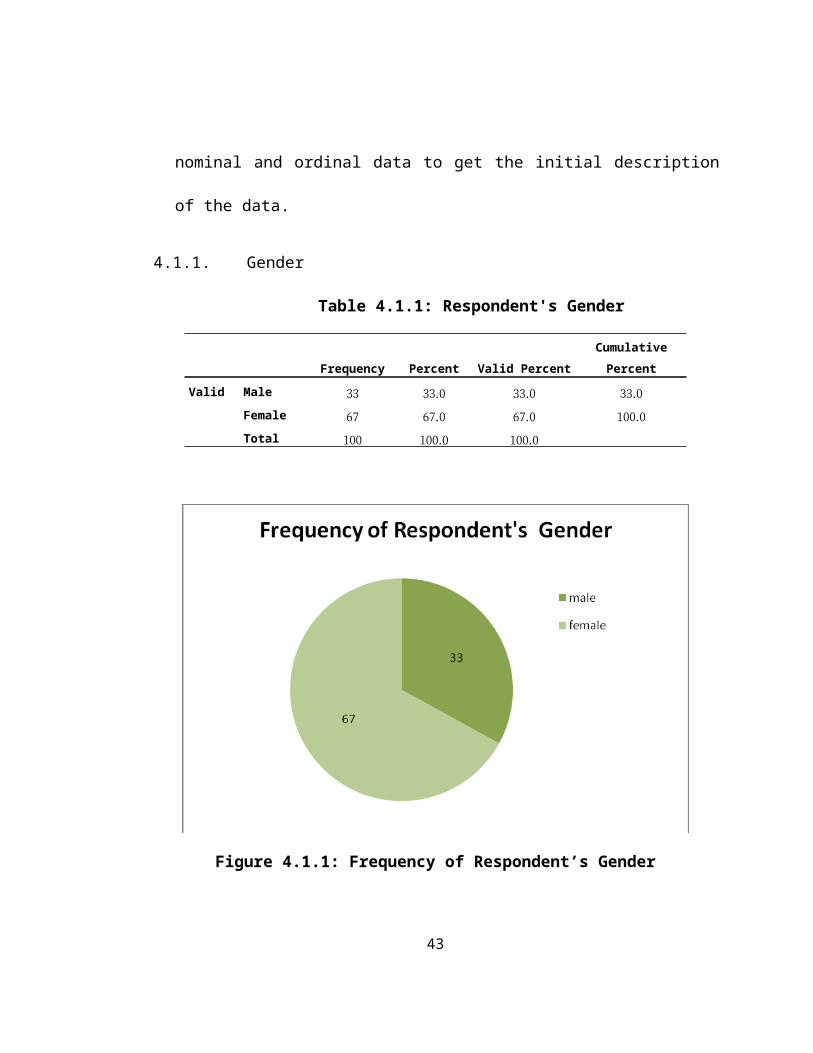
4.1.1. Gender
Table 4.1.1: Respondent's Gender
Frequency Percent Valid PercentCumulativePercent
Valid Male 33 33.0 33.0 33.0
Female 67 67.0 67.0 100.0
Total 100 100.0 100.0
Figure 4.1.1: Frequency of Respondent’s Gender
43
Based on the table above, it shows that most of our respondents is
come from 67 of female respondets. Meanwhile,the balance is 33 of
male respondents.
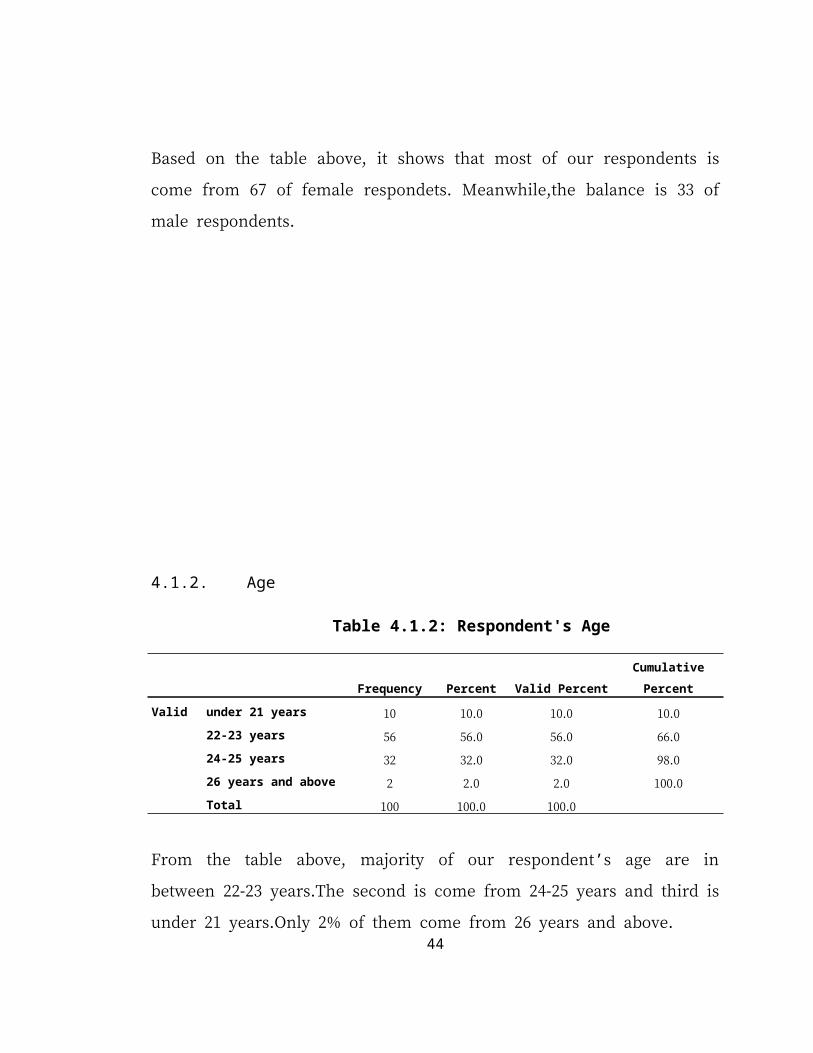
4.1.2. Age
Table 4.1.2: Respondent's Age
Frequency Percent Valid PercentCumulativePercent
Valid under 21 years 10 10.0 10.0 10.0
22-23 years 56 56.0 56.0 66.0
24-25 years 32 32.0 32.0 98.0
26 years and above 2 2.0 2.0 100.0
Total 100 100.0 100.0
From the table above, majority of our respondent s age are in’between 22-23 years.The second is come from 24-25 years and third is
under 21 years.Only 2% of them come from 26 years and above.44

Name of University
Table 4.1.3: Name of University
Frequency Percent Valid PercentCumulativePercent
Valid UiTM 50 50.0 50.0 50.0
UMK 50 50.0 50.0 100.0
Total 100 100.0 100.0
Table above shows that,our respondents are come from 50 student of
UiTM and 50 student UMK.
45

4.1.4. Financial Support
46

Figure 4.1.2: Frequency of Financial Support
Based on the graph bar above, it shows that, most our
respondents are supported by PTPTN loan which and only
minor of them supported by MARA.
47

4.1.5. Parent’s Monthly Income
Table 4.1.4: Parent’s Monthly Income
Frequency Percent Valid PercentCumulativePercent
Valid Less than RM1000 39 39.0 39.0 39.0
RM 1001-RM 3000 34 34.0 34.0 73.0
RM 3001-RM 5000 17 17.0 17.0 90.0
RM 5000 and above 10 10.0 10.0 100.0
Total 100 100.0 100.0
Based on the graph above, it shows that, most of parent’s
monthly incomes of our respondents are less than RM1000
followed by RM1001-RM3000, RM3001-RM5000 and RM5000 and
above.
48
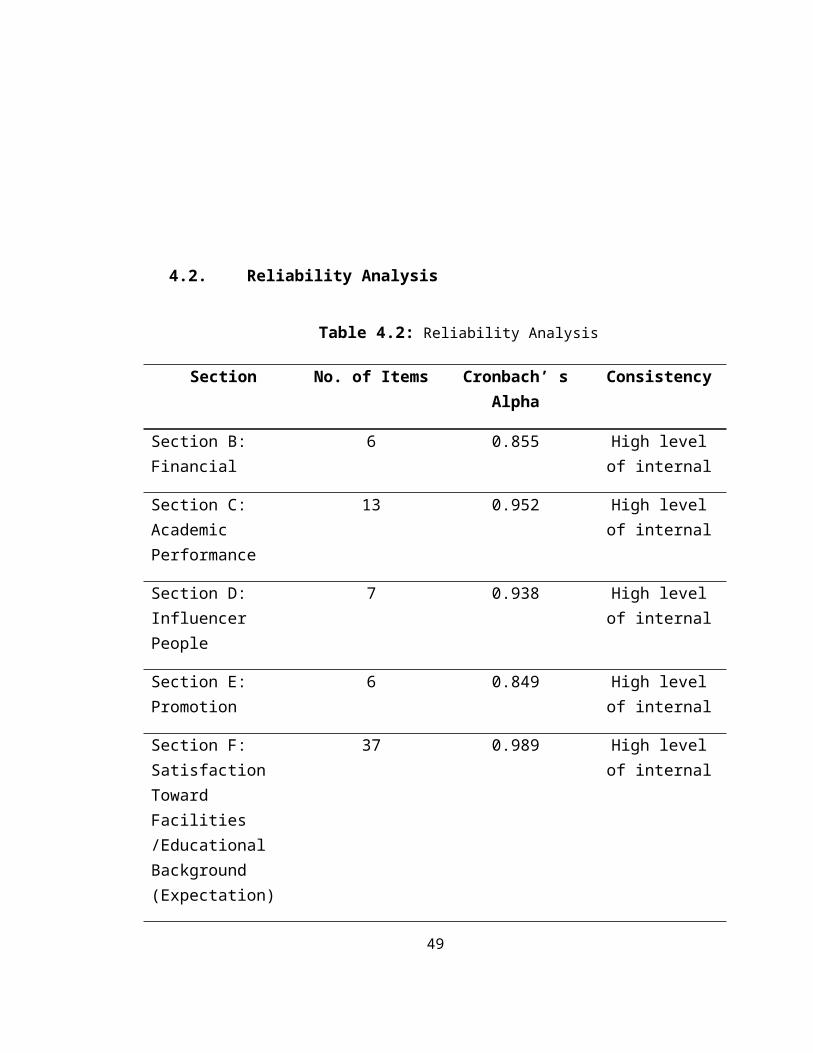
4.2. Reliability Analysis
Table 4.2: Reliability Analysis
Section No. of Items Cronbach’ sAlpha
Consistency
Section B: Financial
6 0.855 High levelof internal
Section C: Academic Performance
13 0.952 High levelof internal
Section D: Influencer People
7 0.938 High levelof internal
Section E: Promotion
6 0.849 High levelof internal
Section F: Satisfaction Toward Facilities /Educational Background (Expectation)
37 0.989 High levelof internal
49
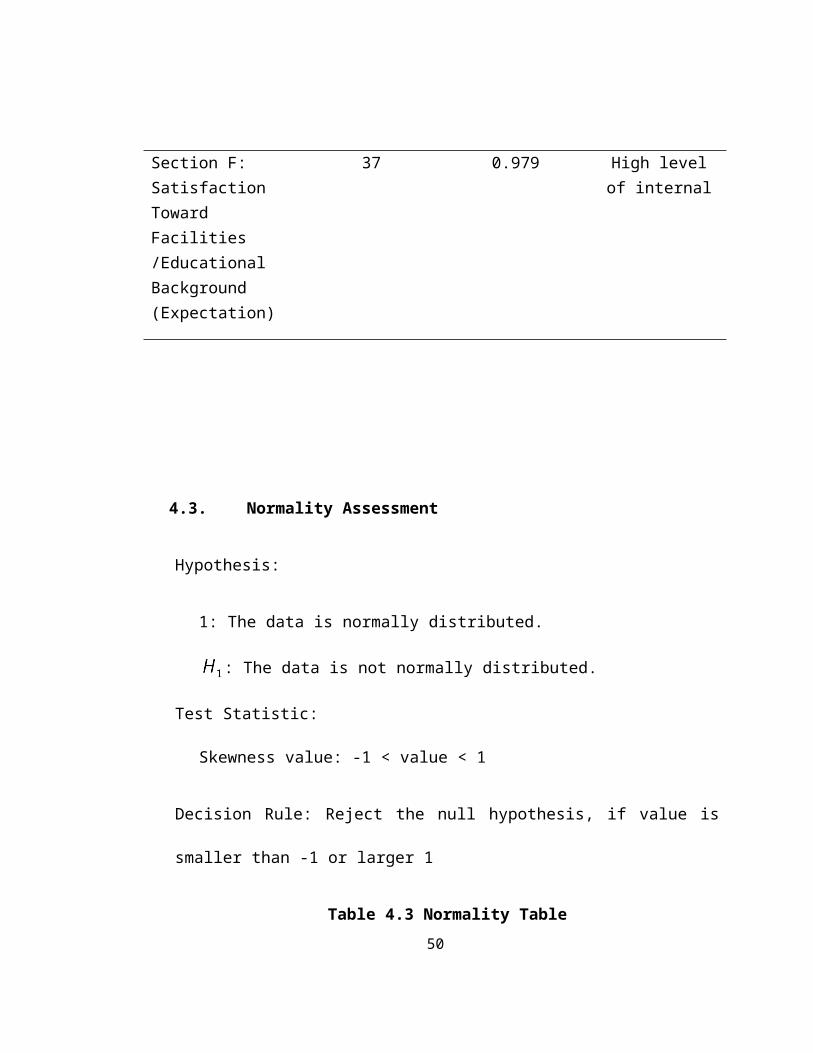
Section F: Satisfaction Toward Facilities /Educational Background (Expectation)
37 0.979 High levelof internal
4.3. Normality Assessment
Hypothesis:
1: The data is normally distributed.
: The data is not normally distributed.
Test Statistic:
Skewness value: -1 < value < 1
Decision Rule: Reject the null hypothesis, if value is
smaller than -1 or larger 1
Table 4.3 Normality Table50

Section SkewnessValue
Conclusion
Section A: Respondent’s CGPA
-0.014 Normal
Section B: Financial -0.086 Normal
Section C: Academic Performance
-0.339 Normal
Section D: Influencer People
0.192 Normal
Section E: Promotion 0.270 Normal
Section F: Satisfaction Toward Facilities /Educational Background (Expectation)
-1.657 Not Normal
Section F: Satisfaction Toward Facilities /Educational Background (Expectation)
0.545 Normal
4.4. Statistical Analysis
The objectives and its statistical analysis of this study
are
51
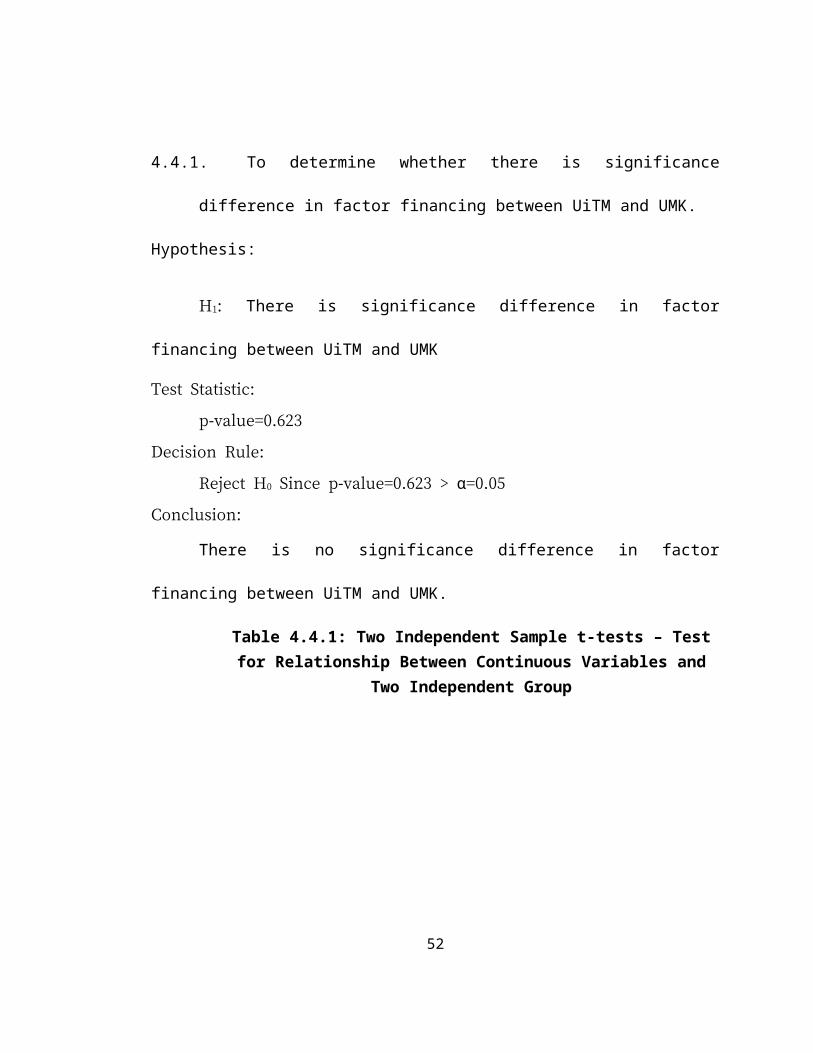
4.4.1. To determine whether there is significance
difference in factor financing between UiTM and UMK.
Hypothesis:
H1: There is significance difference in factor
financing between UiTM and UMK
Test Statistic:
p-value=0.623
Decision Rule:
Reject H0 Since p-value=0.623 > =0.05αConclusion:
There is no significance difference in factor
financing between UiTM and UMK.
Table 4.4.1: Two Independent Sample t-tests – Testfor Relationship Between Continuous Variables and
Two Independent Group
52

Levene's Test forEquality ofVariances
t-test for Equality ofMeans
F-statist
ic Sig.
t-statisti
c df
Sig.(2-
tailed)Financing factor
Equal variances assumed
0.244 0.623 10.183 98 0.000
Equal variances not assumed
10.183 96.058 0.000
4.4.2. To determine whether there is significance
difference in factor of academic performance between
UiTM and UMK.
Hypothesis:
H1: There is a significant difference in factor of
academic performance between UiTM and UMK.
Test statistic:
P-value=0.002
Critical value =0.05
Decision rule:
53

Reject H0 Since p-value=0.002 < =0.05α
Conclusion:
There is a significant difference in factor of
academic performance between UiTM and UMK.
Table 4.4.2: Two Independent Sample t-tests – Testfor Relationship Between Continuous Variables and
Two Independent Group
Levene's Test forEquality ofVariances
t-test for Equality ofMeans
F-statist
ic Sig.
t-statisti
c df
Sig.(2-
tailed)Financing factor
Equal variances assumed
9.728 0.002 11.500 98 0.000
Equal variances not assumed
11.500 89.940 0.000
To determine whether there is significance difference in
factor of academic performance between groups of gender.
Hypothesis:
H1: There is significance difference in factor of
academic performance between groups of gender.54
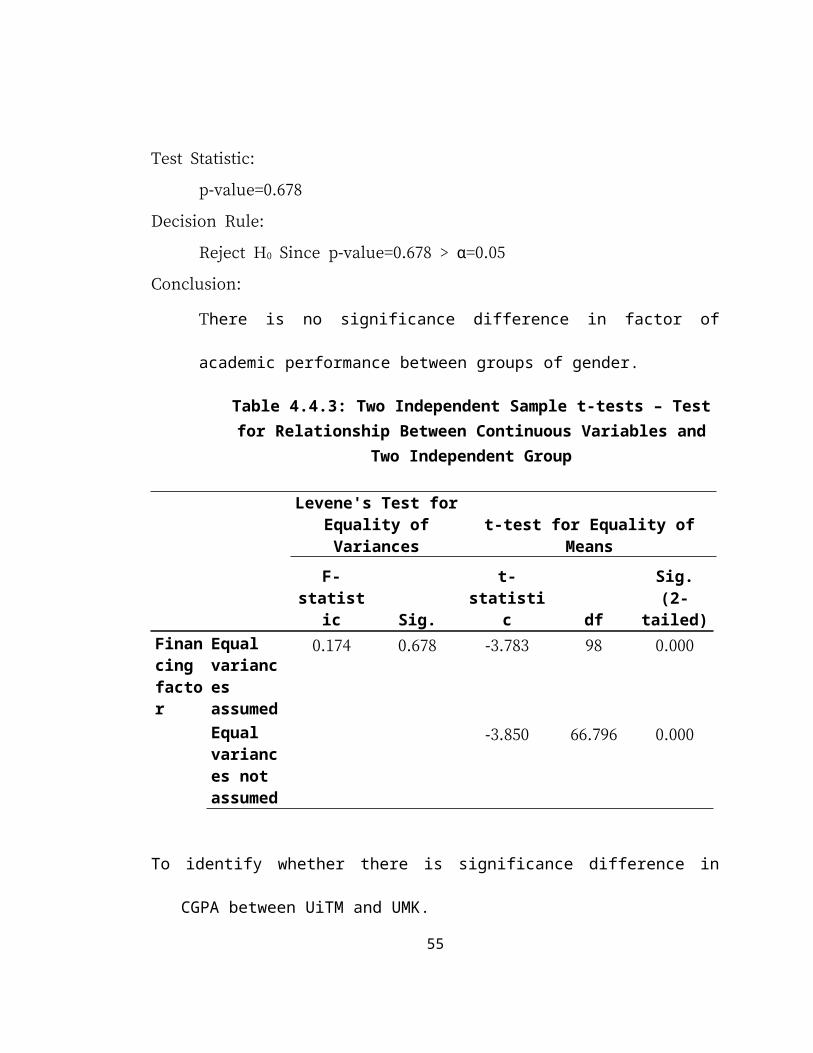
Test Statistic:
p-value=0.678
Decision Rule:
Reject H0 Since p-value=0.678 > =0.05αConclusion:
There is no significance difference in factor of
academic performance between groups of gender.
Table 4.4.3: Two Independent Sample t-tests – Testfor Relationship Between Continuous Variables and
Two Independent Group
Levene's Test forEquality ofVariances
t-test for Equality ofMeans
F-statist
ic Sig.
t-statisti
c df
Sig.(2-
tailed)Financing factor
Equal variances assumed
0.174 0.678 -3.783 98 0.000
Equal variances not assumed
-3.850 66.796 0.000
To identify whether there is significance difference in
CGPA between UiTM and UMK.
55

Hypothesis:
H1: There is significance difference in CGPA between
UiTM and UMK.
Test Statistic:
p-value=0.640
Decision Rule:
Fail to Reject H0 Since p-value=0.640 > =0.05αConclusion:
There is no significance difference in CGPA between
UiTM and UMK.
Table 4.4.4: Two Independent Sample t-tests – Testfor Relationship Between Continuous Variables and
Two Independent Group
56

Levene's Test forEquality ofVariances
t-test for Equality ofMeans
F-statist
ic Sig.
t-statisti
c df
Sig.(2-
tailed)Financing factor
Equal variances assumed
0.220 0.640 2.306 98 0.023
Equal variances not assumed
2.306 97.618 0.023
To determine whether there is significance difference in
factor of promotion between groups of gender.
Hypothesis:
H1:There is significance difference in factor of
promotion between groups of gender.
Test Statistic:
p-value=0.004
Decision Rule:
57
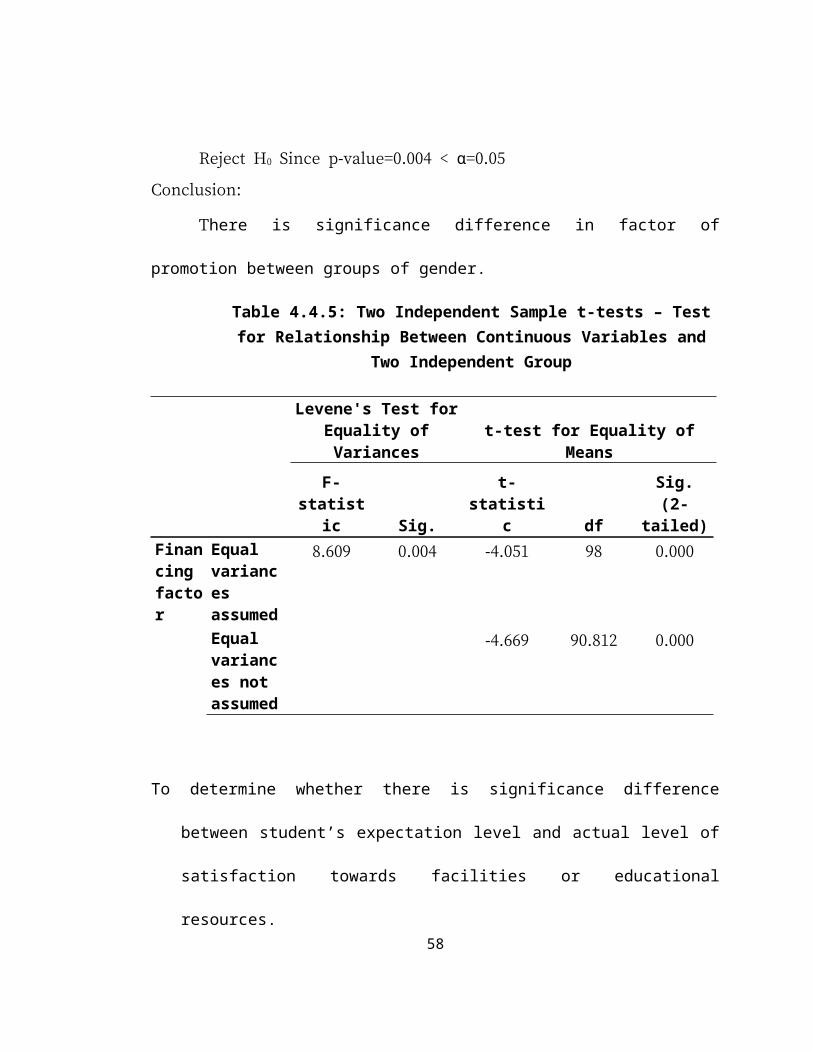
Reject H0 Since p-value=0.004 < =0.05αConclusion:
There is significance difference in factor of
promotion between groups of gender.
Table 4.4.5: Two Independent Sample t-tests – Testfor Relationship Between Continuous Variables and
Two Independent Group
Levene's Test forEquality ofVariances
t-test for Equality ofMeans
F-statist
ic Sig.
t-statisti
c df
Sig.(2-
tailed)Financing factor
Equal variances assumed
8.609 0.004 -4.051 98 0.000
Equal variances not assumed
-4.669 90.812 0.000
To determine whether there is significance difference
between student’s expectation level and actual level of
satisfaction towards facilities or educational
resources.58

Hypothesis
H1: There is a significant difference between the
student’s expectation level and actual level of
satisfaction towards facilities or educational
resources.
Test statistic:
p-value = 0.000 Critical value =0.05
Decision rule:
Reject H0 Since p-value=0.000 < =0.05α
Conclusion:
There is a significant difference between the
student’s expectation level and actual level of
satisfaction towards facilities or educational
resources.
Table 4.4.6: Wilcoxon Matched Pair Rank Test
59
Satisfaction toward Facilities/Educationalresources factor(Actual) - Satisfactiontoward Facilities/Educational resources
factor(Expected)Z -7.599a
Asymp. Sig. (2-tailed)
.000
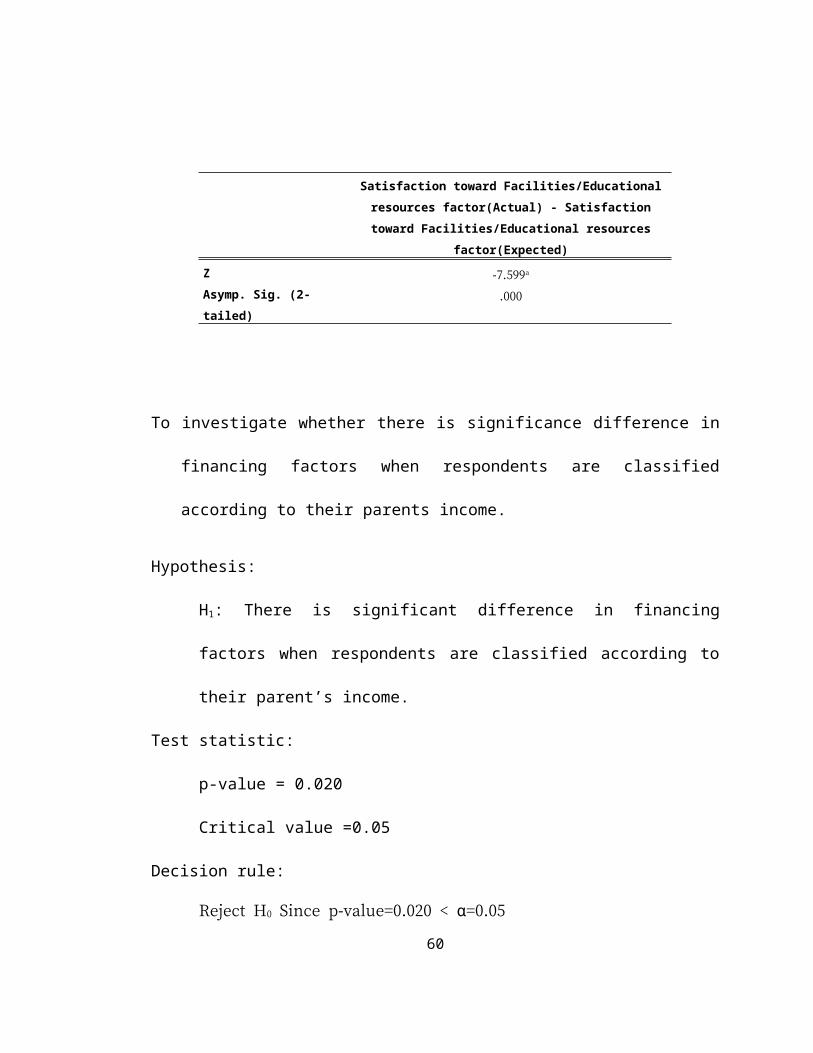
To investigate whether there is significance difference in
financing factors when respondents are classified
according to their parents income.
Hypothesis:
H1: There is significant difference in financing
factors when respondents are classified according to
their parent’s income.
Test statistic:
p-value = 0.020
Critical value =0.05
Decision rule:
Reject H0 Since p-value=0.020 < =0.05α
60

Conclusion:
The results indicate that there is significant
difference in financing factors when respondents are
classified according to their parent’s income.
Table 4.4.7: One-Way ANOVA – Test for Relationship betweenContinuous Variable and More Two Independent Group
Sum ofSquares df
MeanSquare F Sig.
Between Groups
1638.450 3 546.150 3.453 .020
Within Groups
15184.790 96 158.175
Total 16823.240 99
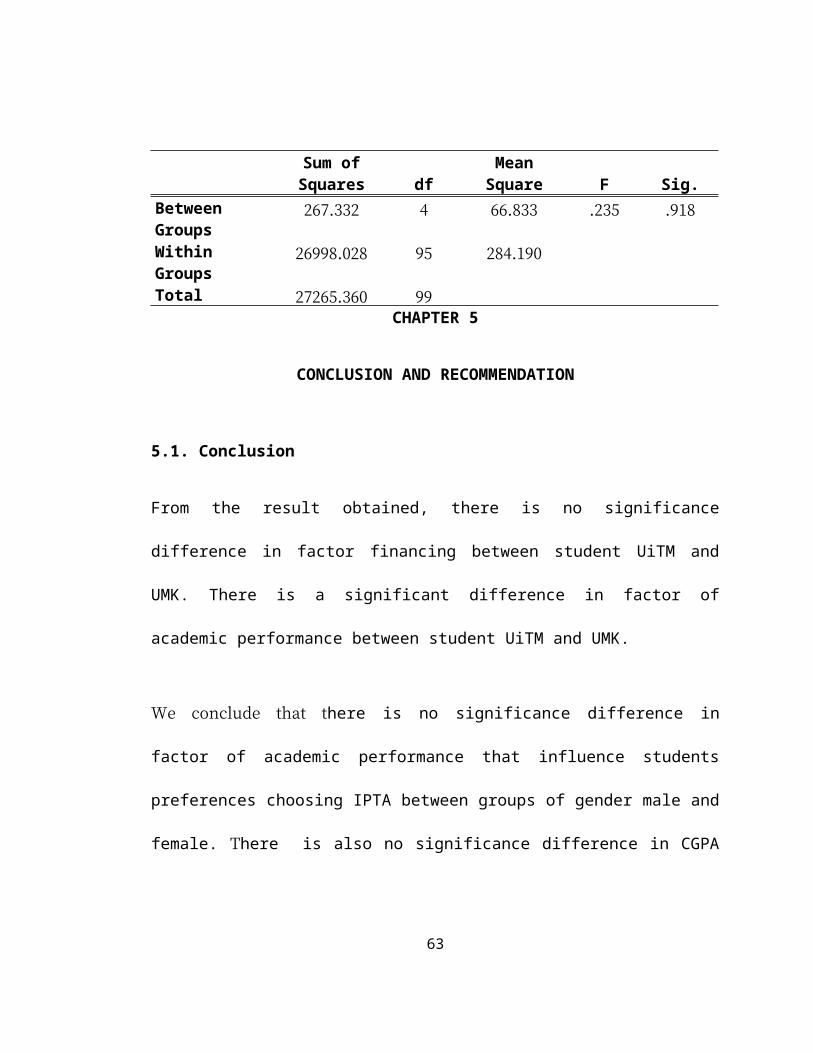
To determine whether there is significance difference in
factor of influencer people when respondents are
classified according highest academic qualification of
father
Hypothesis:
61

H1: There is significance difference in factor of
influencer people when respondents are classified
according highest academic qualification of father.
Test statistic:
p-value = 0.931
Critical value = 0.05
Decision rule:
Reject H0 Since p-value=0.000 < =0.05α .
Conclusion:
The results indicate that there is no significance
difference in factor of influencer people when
respondents are classified according highest academic
qualification of father.
Table 4.4.8: One-Way ANOVA – Test for Relationship betweenContinuous Variable and More Two Independent Group
62
Sum ofSquares df
MeanSquare F Sig.
Between Groups
267.332 4 66.833 .235 .918
Within Groups
26998.028 95 284.190
Total 27265.360 99CHAPTER 5
CONCLUSION AND RECOMMENDATION
5.1. Conclusion
From the result obtained, there is no significance
difference in factor financing between student UiTM and
UMK. There is a significant difference in factor of
academic performance between student UiTM and UMK.
We conclude that there is no significance difference in
factor of academic performance that influence students
preferences choosing IPTA between groups of gender male and
female. There is also no significance difference in CGPA
63

between students UiTM and UMK. There is significance
difference in factor of promotion between groups of gender.
We can also conclude that there is a significant difference
between the student’s expectation level and actual level of
satisfaction towards facilities or educational resources.
The results indicate that there is significant difference
in financing factors when respondents are classified
according to their parent’s income.
Lastly, the results indicate that there is no significance
difference in factor of influencer people when respondents
are classified according highest academic qualification of
father.
Recommendation
The fees and financing support are the most important
factors that influence student’s preferences of choosing
public higher learning institutions (IPTA). Discrepancies
64

in tuition fees for the same program are detected in the
institution itself. So, the government should give more
allocation to students spending. So that, it’s can help
students to lighten the burden.
In order to increase the number of PHD lecturers, the
government can provide a special fund that can help them to
further their education to the doctoral level. The
professional developments of academic staff are also
encouraged through collaboration between UiTM and UMK
lectures in research funds.
The advice and support from teachers and parents are also
important in influencing students preferences of choosing
public higher learning institution (IPTA), a complete
delivery system must be developed by the MOHE and each
university. So that, the information related to the program
of study, career prospects, the application and selection
process can be effectively communicated to them. With this
65

information, the comparison between UiTM and UMK can be
done before a decision is made by the student selection.
APPENDIX A
Dear respondent:
I am doing an academic research entitled:
Factors that Influence Student Preferences of Choosing
Public Higher Learning
Institutions (IPTA): A Case in Kota Bharu.
This study will present no risks to you because it only
examines the factors that influence student preferences of
choosing IPTA. Financially, it will not cost you anything,
and you will not be paid anything. However your
participation is likely to help me find out the factor that
influences student preferences of choosing Public Higher
Learning Institutions(IPTA).66

The information that we get, it will be made private and
confidential.
Thank you very much for your cooperation.
Kepada responden:
Saya membuat penyelidikan akademik bertajuk:
Faktor-faktor yang mempengaruhi pelajar memilih Institusi Pengajian
Tinggi Awam(IPTA): Kes di Kota Bharu.
Penyelidikan ini tidak mendatangkan risiko kepada anda kerana ia hanya untuk
memeriksa faktor-faktor yang mempengaruhi pelaja rmemilih IPTA. Secara
umumnya, ia tidak dikenakan bayaran dan anda tidak akan dibayar apa-apa.
Walaubagaimanapun, penyertaan anda membantu saya mengenalpasti faktor-
faktor yang mempengaruhi pelajar memilih IPTA.Maklumat yang diperolehi
adalah sulit dan persendirian.
Terima kasih di atas kerjasama anda.
Sincerely,
………………………………..NIK MARINI BINTI NIK MAN
BACHELOR OF SCIENCE (HONOURS) (STATISTICS)
FACULTY OF COMPUTER AND MATHEMATICAL SCIENCES
QUESTIONAIRE
67

INSTRUCTION: Please answer every question carefully. Fill
up the blank space and tick (√) the best answer that is/are
relevant to you.
ARAHAN: Sila jawab semua soalan dengan berhati-hati. Isi tempat kosong dan
tanda( ) pada jawapan yang anda rasa paling sesuai dengan anda.√
SECTION A: Demographic information
1) Gender/Jantina:
Male/Lelaki Female/Perempuan
2) Age/Umur:Under 21 year/ Bawah 21 tahun 24 -25 years/tahun
22 23 years/tahun– 26 years/tahun
3) What is your current CGPA?/Keputusan PNGK terkini?
_____________
4) Financial support/Bantuan kewangan : Jabatan Perkhidmatan Awam (JPA) MARA
PTPTN Others /Lain-lain:
__________________
5) What is the name of your university?
Nama university anda?UiTM
UMK
68

6) Is this university your first choice in your
application for admission?(in UPU application)
Adakah universiti ini pilihan pertama anda di dalam permohonan untuk
kemasukan?(Permohonan UPU)
Yes/Ya
No/Tidak (State/Nyatakan:____________________________)
7) Parent’s monthly income/Pendapatan bulanan Ibubapa:
Less than/kurang dari RM1000 RM3001 RM5000–
RM1001 RM3000– RM5000 and above/dan
keatas
8) The highest academic qualification of your father:
Tahap pendidikan tertinggi bapa anda:PMR/ SPM/STPM Master/Sarjana
Diploma PhD
Degree/Ijazah
9) The highest academic qualification of your mother:
Tahap pendidikan tertinggi ibu anda:PMR/ SPM/STPM Master/Sarjana
Diploma PhD
Degree/Ijazah
69

10)Father’s occupation/Pekerjaan Bapa:
Government Sector /Sector kerajaan Self-
employed/Bekerja sendiri
Private Sector/Sektor swasta Business/Bisnes
Others/Lain-lain
11)Mother s occupation/’ PekerjaanIbu:
Government Sector /Sector kerajaan Self-
employed/Bekerja sendiri
Private Sector/Sektor swasta Business/Bisnes
Others/Lain-lain
INSTRUCTION: You can mark your sincere response in between 1 to
10. Please remember, there is no right or wrong answers.
ARAHAN: Anda boleh tanda jawapan anda diantara 1 hingga 10. Peringatan,
tiada jawapan yang betul atau salah.
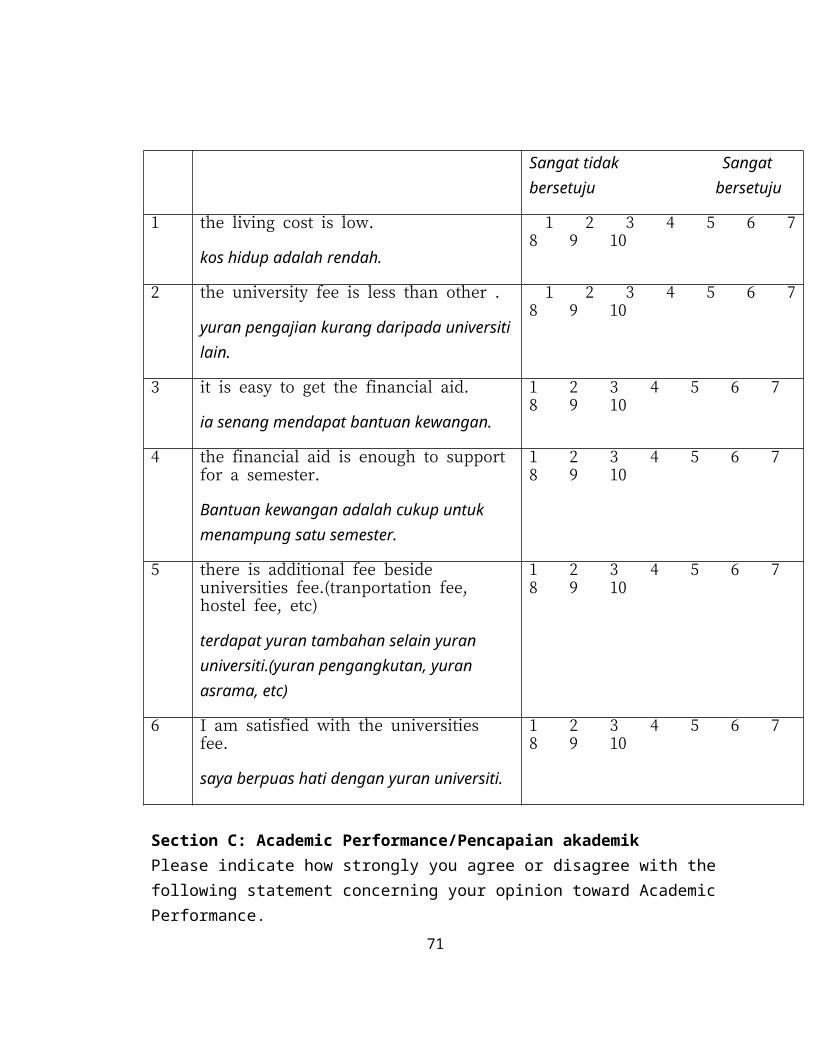
Section B: Financial/KewanganPlease indicate how strongly you agree or disagree with the following
statement concerning your opinion toward financing.
Sila nyatakan berapa skala sangat setuju atau sangat tidak
setuju dengan penyatan yang berikut berkaitan dengan pendapat
anda tentang kewangan.I choose the IPTAbecause......
Saya memilih IPTA ini kerana...
Strongly Disagree Strongly Agree
70
Sangat tidak Sangat bersetuju bersetuju
1 the living cost is low.
kos hidup adalah rendah.
1 2 3 4 5 6 78 9 10
2 the university fee is less than other .
yuran pengajian kurang daripada universiti lain.
1 2 3 4 5 6 78 9 10
3 it is easy to get the financial aid.
ia senang mendapat bantuan kewangan.
1 2 3 4 5 6 7 8 9 10
4 the financial aid is enough to support for a semester.
Bantuan kewangan adalah cukup untuk menampung satu semester.
1 2 3 4 5 6 7 8 9 10
5 there is additional fee beside universities fee.(tranportation fee, hostel fee, etc)
terdapat yuran tambahan selain yuran universiti.(yuran pengangkutan, yuran asrama, etc)
1 2 3 4 5 6 7 8 9 10
6 I am satisfied with the universities fee.
saya berpuas hati dengan yuran universiti.
1 2 3 4 5 6 7 8 9 10
Section C: Academic Performance/Pencapaian akademikPlease indicate how strongly you agree or disagree with thefollowing statement concerning your opinion toward AcademicPerformance.
71
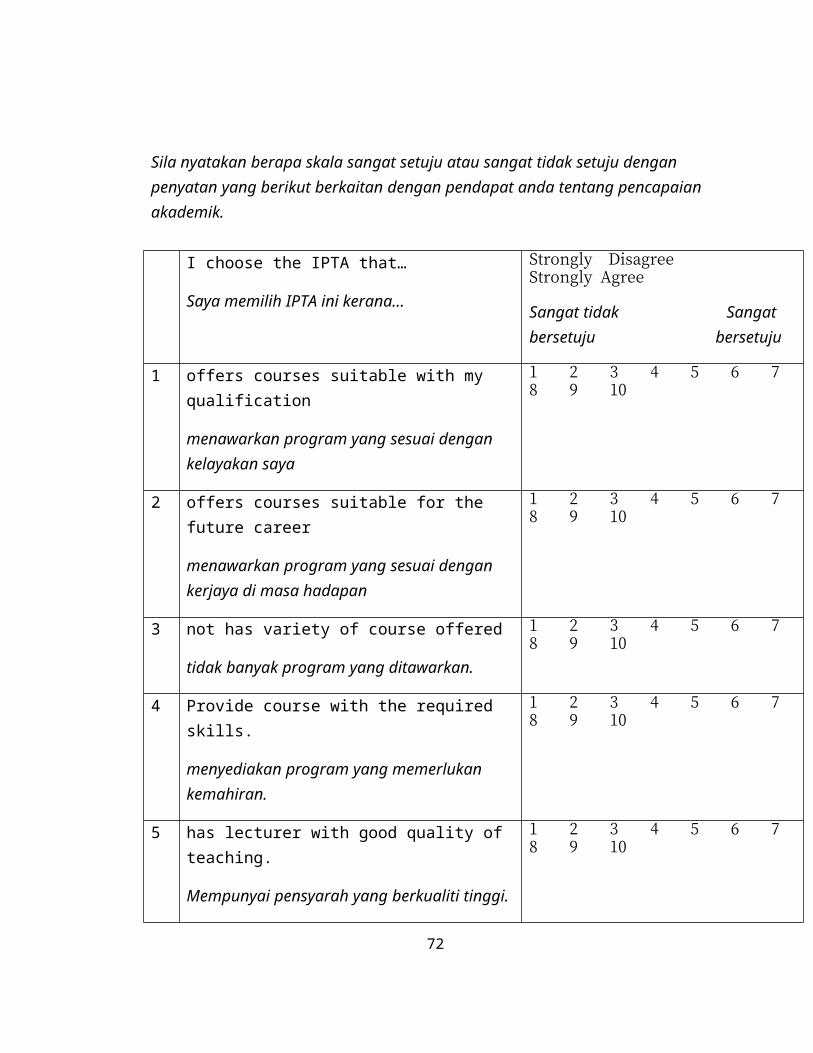
Sila nyatakan berapa skala sangat setuju atau sangat tidak setuju dengan penyatan yang berikut berkaitan dengan pendapat anda tentang pencapaian akademik.
I choose the IPTA that…
Saya memilih IPTA ini kerana...
Strongly Disagree Strongly Agree
Sangat tidak Sangat bersetuju bersetuju
1 offers courses suitable with my qualification
menawarkan program yang sesuai dengan kelayakan saya
1 2 3 4 5 6 7 8 9 10
2 offers courses suitable for the future career
menawarkan program yang sesuai dengan kerjaya di masa hadapan
1 2 3 4 5 6 7 8 9 10
3 not has variety of course offered
tidak banyak program yang ditawarkan.
1 2 3 4 5 6 7 8 9 10
4 Provide course with the required skills.
menyediakan program yang memerlukan kemahiran.
1 2 3 4 5 6 7 8 9 10
5 has lecturer with good quality of teaching.
Mempunyai pensyarah yang berkualiti tinggi.
1 2 3 4 5 6 7 8 9 10
72

6 has lecturer who are knowledgeable.
Mempunyai pensyarah yang berpengetahuan tinggi.
1 2 3 4 5 6 7 8 9 10
7 has lecturers with the experience in the field
mempunyai pensyarah yang berpengalamn dalam bidang pembelajaran
1 2 3 4 5 6 7 8 9 10
8 has lecturers who create good learning atmosphere
Mempunyai pensyarah yang mewujudkan suasana pembelajaran yang baik
1 2 3 4 5 6 7 8 9 10
has lecturers who use suitable teaching materials
Mempunyai pensyarah yang menggunakan bahan-bahan pengajaran yang sesuai
1 2 3 4 5 6 7 8 9 10
10 has lecturers who are easy for a consultation
Mempunyai pensyarah yang mudah untuk berunding
1 2 3 4 5 6 7 8 9 10
11 has lecturers with good relationship with students
Mempunyai pensyarah dengan hubungan yang baik dengan pelajar-pelajar
1 2 3 4 5 6 7 8 9 10
73
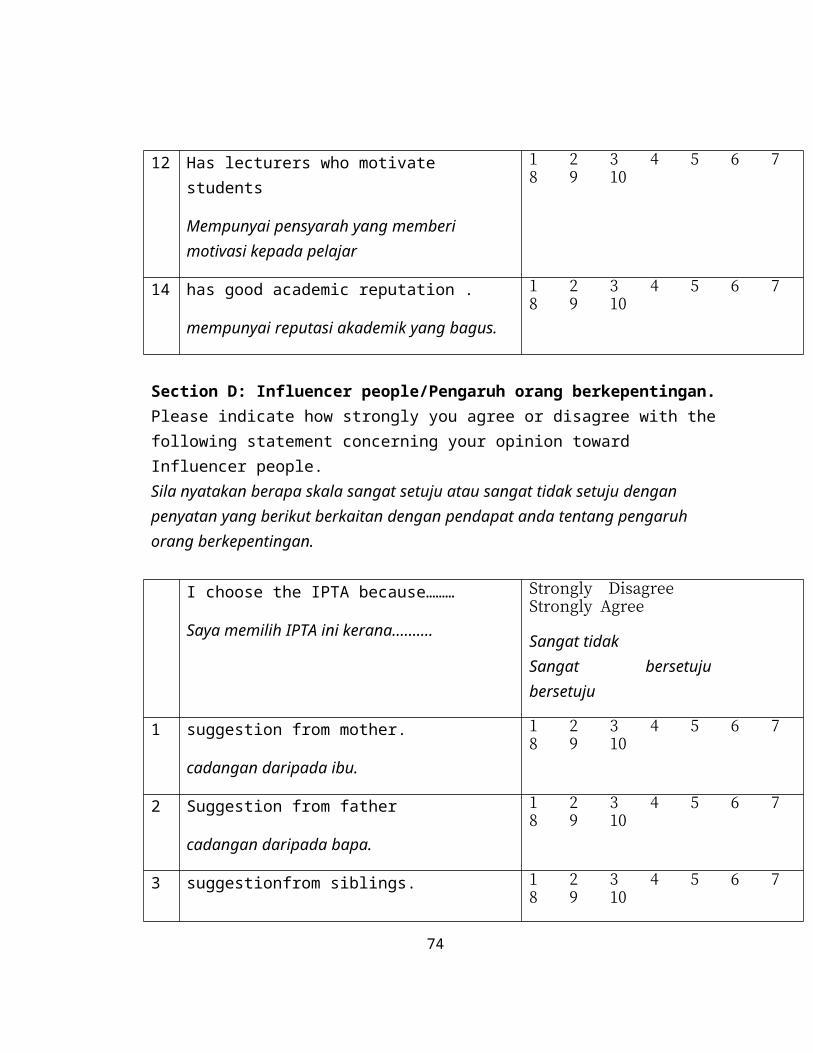
12 Has lecturers who motivate students
Mempunyai pensyarah yang memberi motivasi kepada pelajar
1 2 3 4 5 6 7 8 9 10
14 has good academic reputation .
mempunyai reputasi akademik yang bagus.
1 2 3 4 5 6 7 8 9 10
Section D: Influencer people/Pengaruh orang berkepentingan.Please indicate how strongly you agree or disagree with thefollowing statement concerning your opinion toward Influencer people.Sila nyatakan berapa skala sangat setuju atau sangat tidak setuju dengan penyatan yang berikut berkaitan dengan pendapat anda tentang pengaruh orang berkepentingan.
I choose the IPTA because………
Saya memilih IPTA ini kerana..........
Strongly Disagree Strongly Agree
Sangat tidak Sangat bersetuju bersetuju
1 suggestion from mother.
cadangan daripada ibu.
1 2 3 4 5 6 7 8 9 10
2 Suggestion from father
cadangan daripada bapa.
1 2 3 4 5 6 7 8 9 10
3 suggestionfrom siblings. 1 2 3 4 5 6 7 8 9 10
74

cadangan daripada adik-beradik.
4 suggestion from teacher.
cadangan daripada cikgu.
1 2 3 4 5 6 7 8 9 10
5 suggestion from friends.
cadangan daripada kawan-kawan
1 2 3 4 5 6 7 8 9 10
6 recommendation of former student
cadangan daripada bekas pelajar
1 2 3 4 5 6 7 8 9 10
7 suggestion from counselor
cadangan daripada kaunselor
1 2 3 4 5 6 7 8 9 10
Section E: Promotion/PromosiPlease indicate how strongly you agree or disagree with thefollowing statement concerning your opinion toward Promotion. Sila nyatakan berapa skala sangat setuju atau sangat tidak setuju dengan penyatan yang berikut berkaitan dengan pendapat anda tentang promosi.
I choose IPTA because I interested….
Saya memilih IPTA ini kerana saya berminat.....
Strongly Disagree Strongly Agree
Sangat tidak Sangat bersetuju bersetuju
1 about university publication 1 2 3 4 5
75
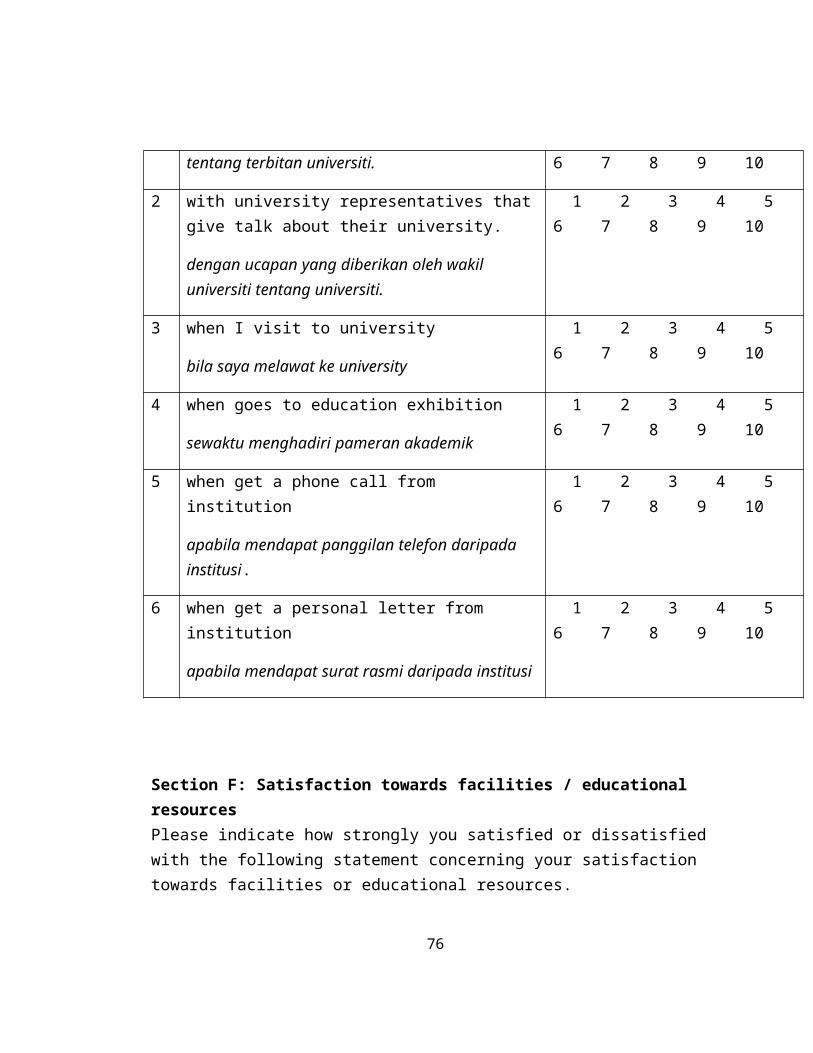
tentang terbitan universiti. 6 7 8 9 10
2 with university representatives thatgive talk about their university.
dengan ucapan yang diberikan oleh wakil universiti tentang universiti.
1 2 3 4 5 6 7 8 9 10
3 when I visit to university
bila saya melawat ke university
1 2 3 4 5 6 7 8 9 10
4 when goes to education exhibition
sewaktu menghadiri pameran akademik
1 2 3 4 5 6 7 8 9 10
5 when get a phone call from institution
apabila mendapat panggilan telefon daripada institusi.
1 2 3 4 5 6 7 8 9 10
6 when get a personal letter from institution
apabila mendapat surat rasmi daripada institusi
1 2 3 4 5 6 7 8 9 10
Section F: Satisfaction towards facilities / educational resourcesPlease indicate how strongly you satisfied or dissatisfied with the following statement concerning your satisfaction towards facilities or educational resources.
76
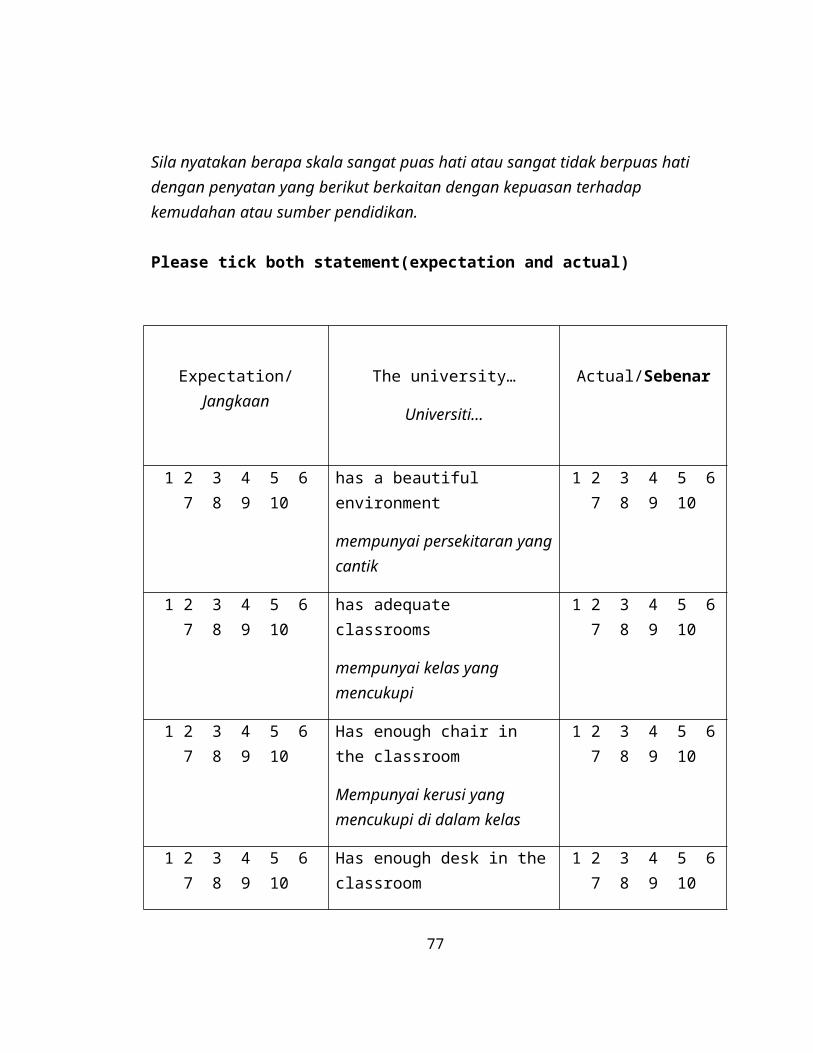
Sila nyatakan berapa skala sangat puas hati atau sangat tidak berpuas hati dengan penyatan yang berikut berkaitan dengan kepuasan terhadap kemudahan atau sumber pendidikan.
Please tick both statement(expectation and actual)
Expectation/Jangkaan
The university…
Universiti…
Actual/Sebenar
1 2 3 4 5 67 8 9 10
has a beautiful environment
mempunyai persekitaran yangcantik
1 2 3 4 5 67 8 9 10
1 2 3 4 5 67 8 9 10
has adequate classrooms
mempunyai kelas yang mencukupi
1 2 3 4 5 67 8 9 10
1 2 3 4 5 67 8 9 10
Has enough chair in the classroom
Mempunyai kerusi yang mencukupi di dalam kelas
1 2 3 4 5 67 8 9 10
1 2 3 4 5 67 8 9 10
Has enough desk in theclassroom
1 2 3 4 5 67 8 9 10
77
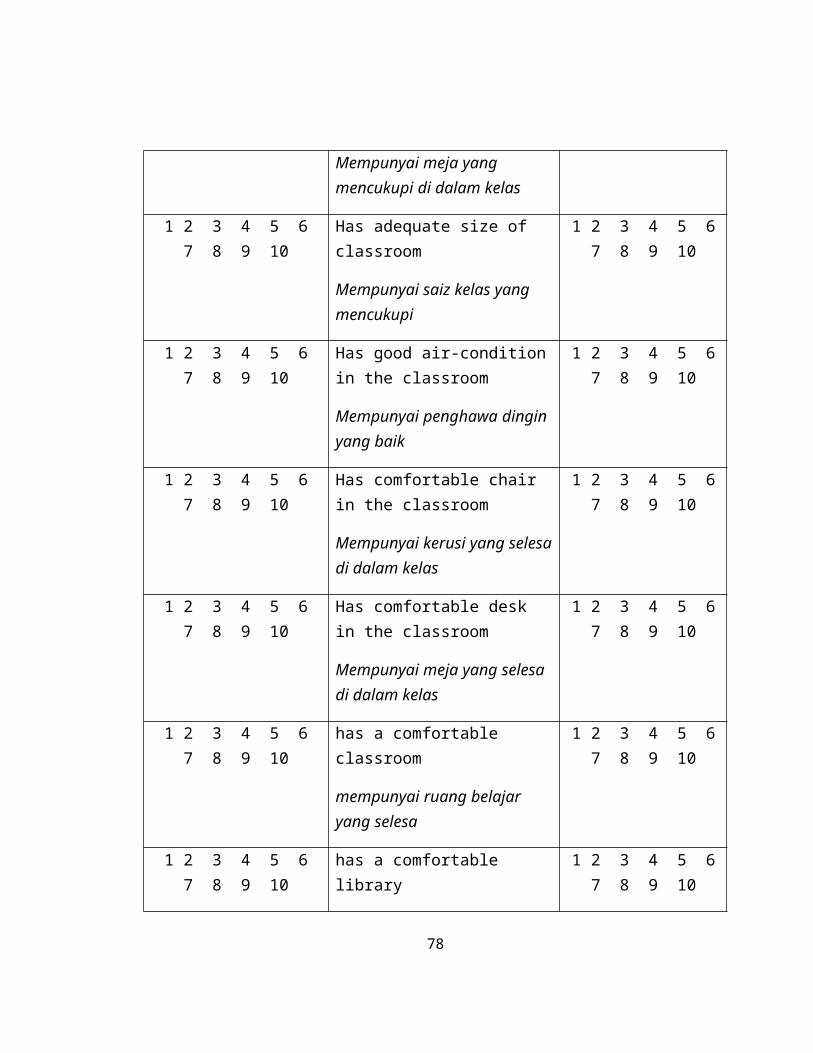
Mempunyai meja yang mencukupi di dalam kelas
1 2 3 4 5 67 8 9 10
Has adequate size of classroom
Mempunyai saiz kelas yang mencukupi
1 2 3 4 5 67 8 9 10
1 2 3 4 5 67 8 9 10
Has good air-conditionin the classroom
Mempunyai penghawa dingin yang baik
1 2 3 4 5 67 8 9 10
1 2 3 4 5 67 8 9 10
Has comfortable chair in the classroom
Mempunyai kerusi yang selesadi dalam kelas
1 2 3 4 5 67 8 9 10
1 2 3 4 5 67 8 9 10
Has comfortable desk in the classroom
Mempunyai meja yang selesa di dalam kelas
1 2 3 4 5 67 8 9 10
1 2 3 4 5 67 8 9 10
has a comfortable classroom
mempunyai ruang belajar yang selesa
1 2 3 4 5 67 8 9 10
1 2 3 4 5 67 8 9 10
has a comfortable library
1 2 3 4 5 67 8 9 10
78
mempunyai perpustakaan yang selesa
1 2 3 4 5 67 8 9 10
has a adequate material in library
mempunyai bahan yang mencukupi di perpustakaan
1 2 3 4 5 67 8 9 10
1 2 3 4 5 67 8 9 10
has a adequate references book in thelibrary
mempunyai buku rujukan yang mencukupi di perpustakaan
1 2 3 4 5 67 8 9 10
1 2 3 4 5 67 8 9 10
has enough chairs in the library
mempunyai kerusi yang mencukupi di dalam perpustakaan
1 2 3 4 5 67 8 9 10
1 2 3 4 5 67 8 9 10
Has enough desk in thelibrary
Mempunyai meja yang mencukupi di dalam perpustakaan
1 2 3 4 5 67 8 9 10
1 2 3 4 5 67 8 9 10
Size of the library can accommodate more students
1 2 3 4 5 67 8 9 10
79
Saiz perpustakaan dapat menampung ramai pelajar
1 2 3 4 5 67 8 9 10
Has library staff who are friendly
Mempunyai staf perpustakaanyang peramah
1 2 3 4 5 67 8 9 10
1 2 3 4 5 67 8 9 10
Has library staff whoare helpful
Mempunyai staf perpustakaanyang membantu
1 2 3 4 5 67 8 9 10
1 2 3 4 5 67 8 9 10
Has HEP staff who are friendly
Mempunyai staf HEP yang peramah
1 2 3 4 5 67 8 9 10
1 2 3 4 5 67 8 9 10
Has HEP staff who arehelpful
Mempunyai staf HEP yang membantu
1 2 3 4 5 67 8 9 10
1 2 3 4 5 67 8 9 10
has HEP staff who are efficient in their work
mempunyai staf HEP yang cekap dalam bekerja
1 2 3 4 5 67 8 9 10
1 2 3 4 5 67 8 9 10
Has systematic system 1 2 3 4 5 6
80

in HEP
Mempunyai system HEP yang sistematik
7 8 9 10
1 2 3 4 5 67 8 9 10
has HEP staffs who arealways available
mempunyai staff HEP yang sentiasa bersedia
1 2 3 4 5 67 8 9 10
1 2 3 4 5 67 8 9 10
Has HEA staff who are friendly
mempunyai staf HEA yang peramah
1 2 3 4 5 67 8 9 10
1 2 3 4 5 67 8 9 10
Has HEA staff who arehelpful
Mempunyai staf HEA yang membantu
1 2 3 4 5 67 8 9 10
1 2 3 4 5 67 8 9 10
Has systematic system in HEA
Mempunyai system HEA yang sistematik
1 2 3 4 5 67 8 9 10
1 2 3 4 5 67 8 9 10
has HEA staffs who arealways available
mempunyai staff HEA yang sentiasa bersedia
1 2 3 4 5 67 8 9 10
1 2 3 4 5 6 has a parking space 1 2 3 4 5 6
81

7 8 9 10 mempunyai ruang meletakkan kenderaan
7 8 9 10
1 2 3 4 5 67 8 9 10
has a good campus transportation system
mempunyai system pengangkutan yang bagus di kampus
1 2 3 4 5 67 8 9 10
1 2 3 4 5 67 8 9 10
has adequate laboratory facilities
mempunyai kemudahan makmal yang mencukupi
1 2 3 4 5 67 8 9 10
1 2 3 4 5 67 8 9 10
has adequate lab computer
mempunyai makmal komputer yang mencukupi
1 2 3 4 5 67 8 9 10
1 2 3 4 5 67 8 9 10
has adequate ICT facilities
mempunyai kemudahan ICT yang mencukupi
1 2 3 4 5 67 8 9 10
1 2 3 4 5 67 8 9 10
Has good internet/wifisystem
Mempunyai system internet yang bagus
1 2 3 4 5 67 8 9 10
1 2 3 4 5 67 8 9 10
has clean toilet 1 2 3 4 5 67 8 9 10
82
mempunyai tandas yang bersih
1 2 3 4 5 67 8 9 10
Has a comfortable surau
Mempunyai surau yang selesa
1 2 3 4 5 67 8 9 10
1 2 3 4 5 67 8 9 10
has a good sport facilities
mempunyai kemudahan sukan yang baik
1 2 3 4 5 67 8 9 10
1 2 3 4 5 67 8 9 10
has a comfortable cafeteria and good food court
mempunyai kafetaria yang selesa dan medan selera yangbaik
1 2 3 4 5 67 8 9 10
1 2 3 4 5 67 8 9 10
offer a flexible classschedule
menawarkan jadual kelas yang sesuai
1 2 3 4 5 67 8 9 10
In your opinion, what are the other factors that influence student preferences of choosing IPTA?
Pada pendapat anda, apakah factor lain yang mempengaruhi student dalam memilih IPTA?
83

APPENDIX B (Reliability)
Section B: Financial
Reliability Statistics
Cronbach's
Alpha
Cronbach's
Alpha Based on
Standardized
Items N of Items
.855 .853 6
Section C: Academic Performance
Reliability Statistics
Cronbach's Alpha
Cronbach's Alpha
Based on
Standardized
Items N of Items
.952 .955 13
84

Section D: Influencer People
Reliability Statistics
Cronbach's
Alpha
Cronbach's
Alpha Based on
Standardized
Items N of Items
.938 .939 7
Section E: Promotion
Reliability Statistics
Cronbach's
Alpha
Cronbach's
Alpha Based on
Standardized
Items N of Items
.849 .847 6
Section F: Satisfaction toward facilities/Educational background (Expectatation)
Reliability Statistics
Cronbach's Alpha
Cronbach's Alpha
Based on
Standardized Items N of Items
.989 .989 37
85
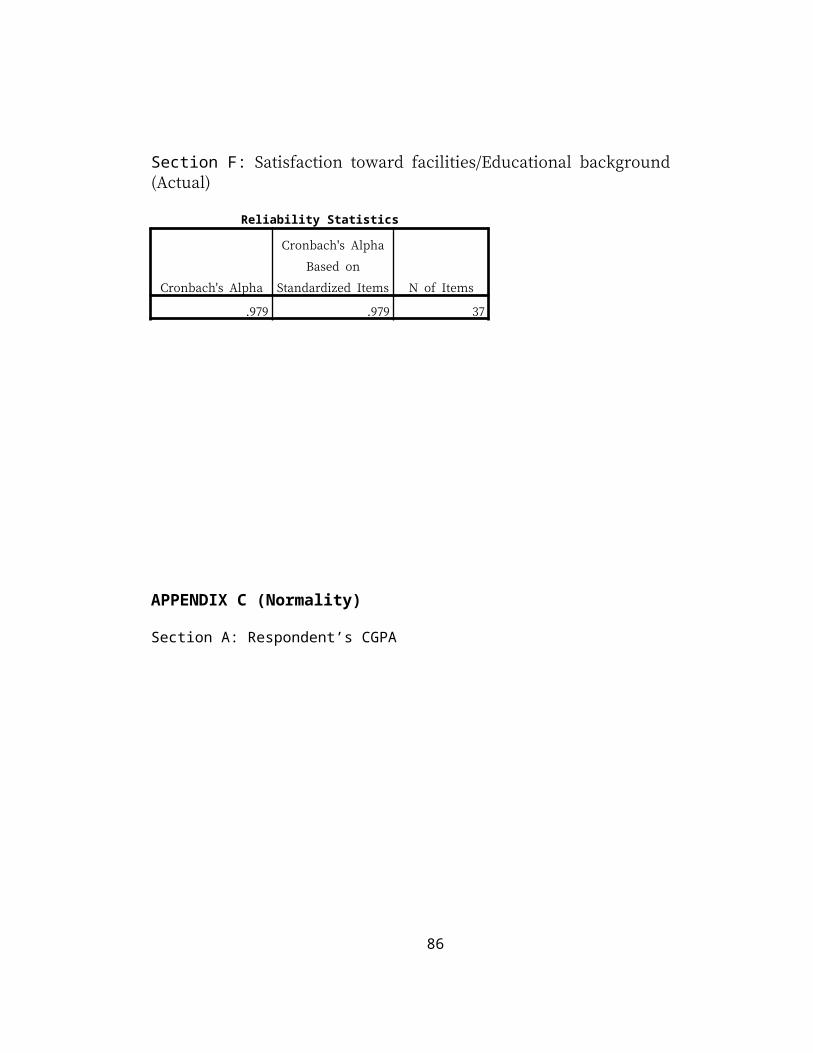
Section F: Satisfaction toward facilities/Educational background (Actual)
Reliability Statistics
Cronbach's Alpha
Cronbach's Alpha
Based on
Standardized Items N of Items
.979 .979 37
APPENDIX C (Normality)
Section A: Respondent’s CGPA
86
Descriptives
Statistic Std. Error
Respondent's CGPA Mean 3.3152 .02986
95% Confidence Interval for
Mean
Lower Bound 3.2560
Upper Bound 3.3744
5% Trimmed Mean 3.3152
Median 3.3250
Variance .089
Std. Deviation .29857
Minimum 2.70
Maximum 4.00
Range 1.30
Interquartile Range .46
Skewness -.014 .241
Kurtosis -.415 .478
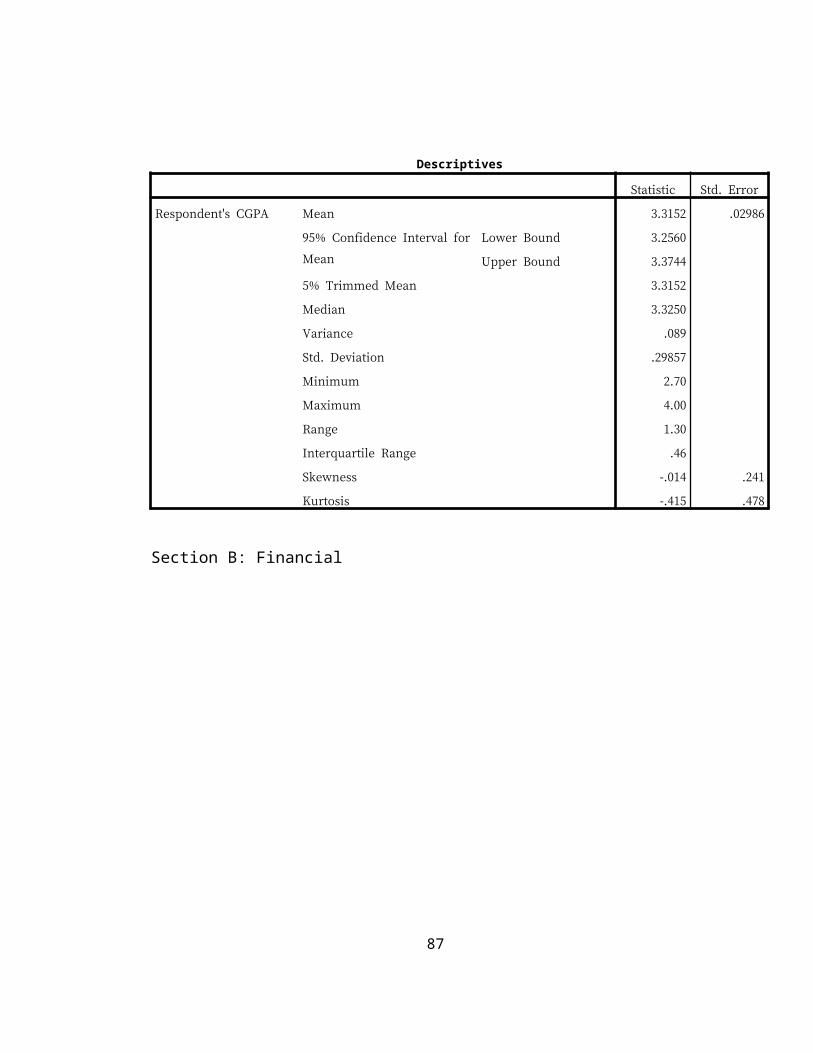
Section B: Financial
87
Descriptives
Statistic Std. Error
Financing factor Mean 34.2600 1.30358
95% Confidence Interval for
Mean
Lower Bound 31.6734
Upper Bound 36.8466
5% Trimmed Mean 34.3778
Median 32.0000
Variance 169.932
Std. Deviation 13.03579
Minimum 6.00
Maximum 58.00
Range 52.00
Interquartile Range 21.75
Skewness -.086 .241
Kurtosis -.993 .478
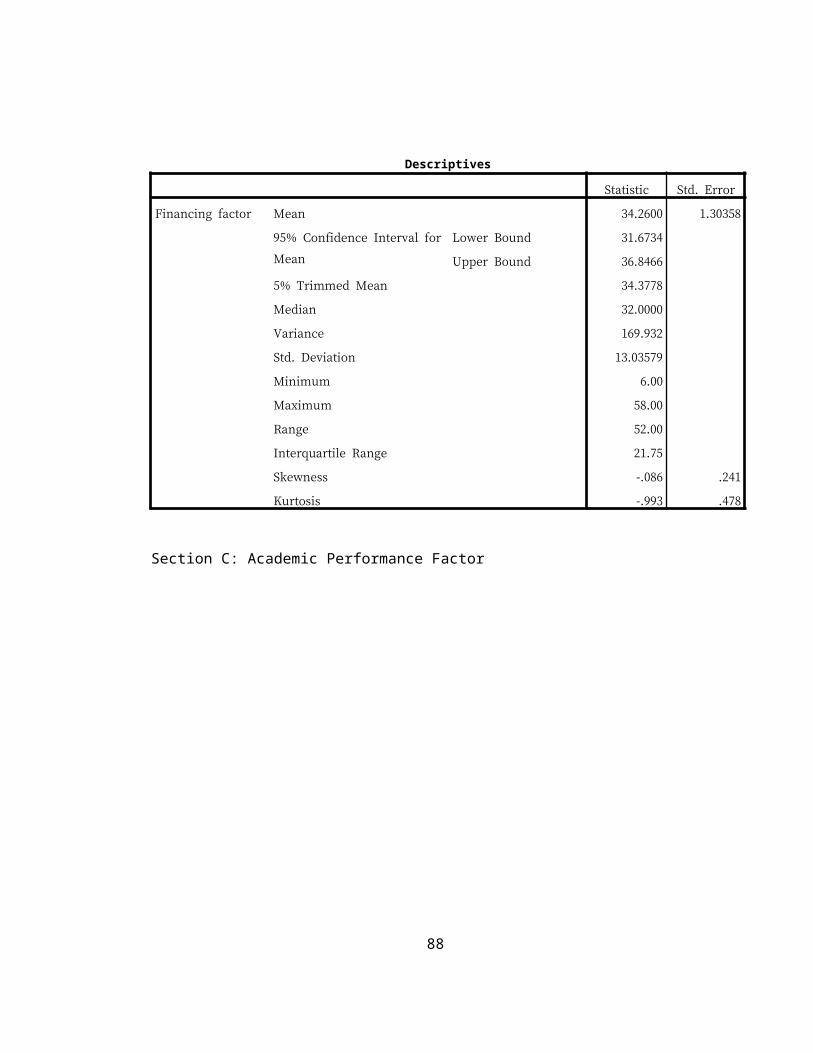
Section C: Academic Performance Factor
88
Descriptives
Statistic Std. Error
Academic Performance
factor
Mean 86.2900 2.38040
95% Confidence Interval for
Mean
Lower
Bound
81.5668
Upper
Bound
91.0132
5% Trimmed Mean 86.7333
Median 94.0000
Variance 566.632
Std. Deviation 23.80404
Minimum 29.00
Maximum 130.00
Range 101.00
Interquartile Range 39.75
Skewness -.339 .241
Kurtosis -.844 .478
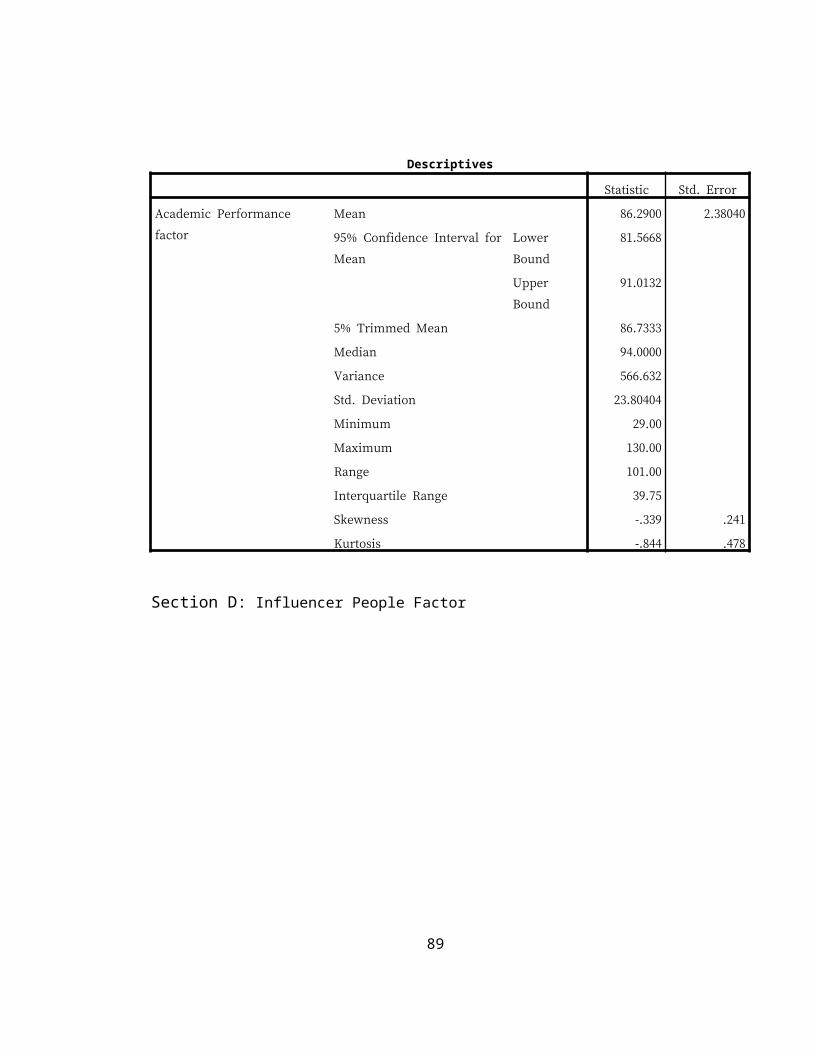
Section D: Influencer People Factor
89
Descriptives
Statistic Std. Error
Influencer People factor Mean 37.0800 1.65954
95% Confidence Interval for
Mean
Lower Bound 33.7871
Upper Bound 40.3729
5% Trimmed Mean 36.9889
Median 35.0000
Variance 275.408
Std. Deviation 16.59541
Minimum 7.00
Maximum 70.00
Range 63.00
Interquartile Range 23.00
Skewness .192 .241
Kurtosis -.726 .478
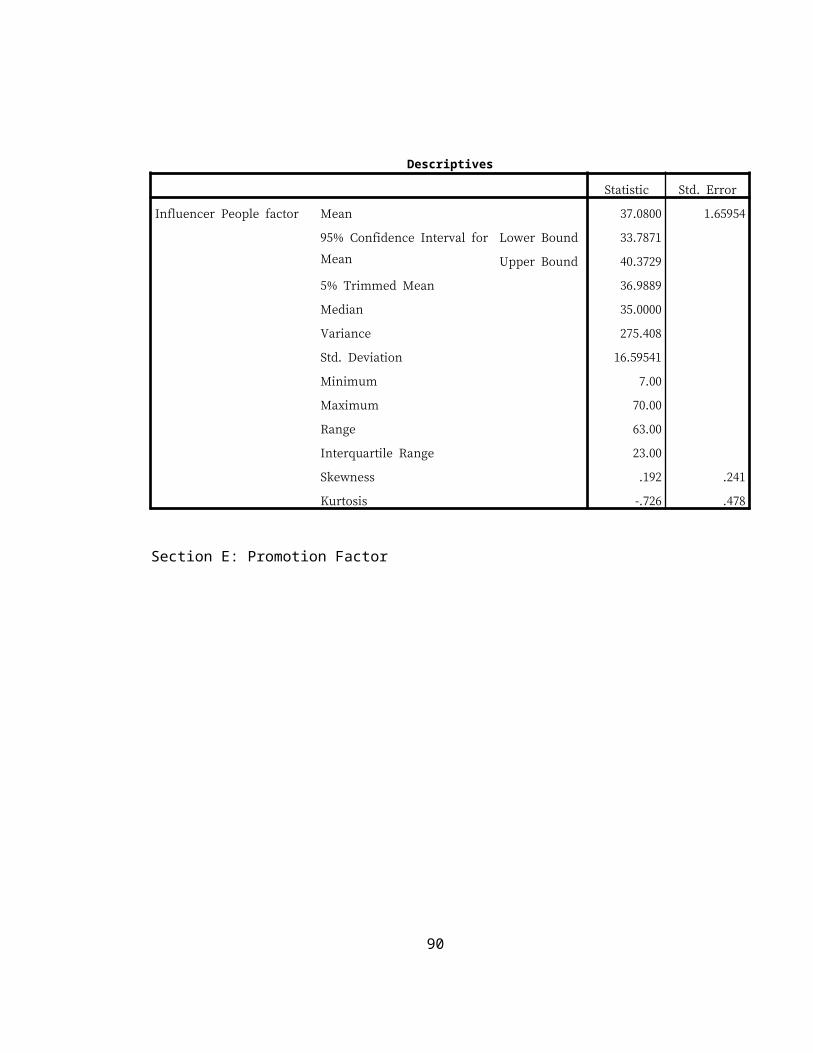
Section E: Promotion Factor
90

Descriptives
Statistic Std. Error
Promotion factor Mean 32.9500 1.13078
95% Confidence Interval for
Mean
Lower Bound 30.7063
Upper Bound 35.1937
5% Trimmed Mean 32.8333
Median 31.0000
Variance 127.866
Std. Deviation 11.30779
Minimum 6.00
Maximum 60.00
Range 54.00
Interquartile Range 15.75
Skewness .270 .241
Kurtosis -.223 .478
Section F: Satisfaction toward Facilities/Educational resources factor(Expected
91
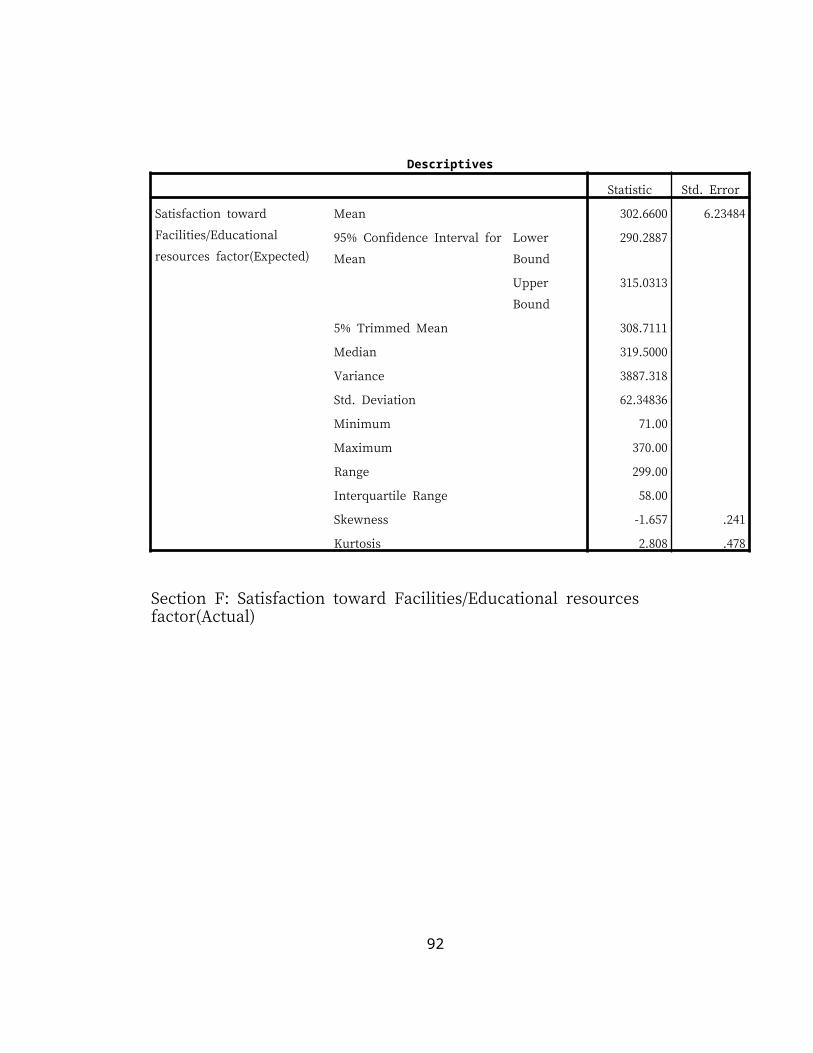
Descriptives
Statistic Std. Error
Satisfaction toward
Facilities/Educational
resources factor(Expected)
Mean 302.6600 6.23484
95% Confidence Interval for
Mean
Lower
Bound
290.2887
Upper
Bound
315.0313
5% Trimmed Mean 308.7111
Median 319.5000
Variance 3887.318
Std. Deviation 62.34836
Minimum 71.00
Maximum 370.00
Range 299.00
Interquartile Range 58.00
Skewness -1.657 .241
Kurtosis 2.808 .478
Section F: Satisfaction toward Facilities/Educational resources factor(Actual)
92
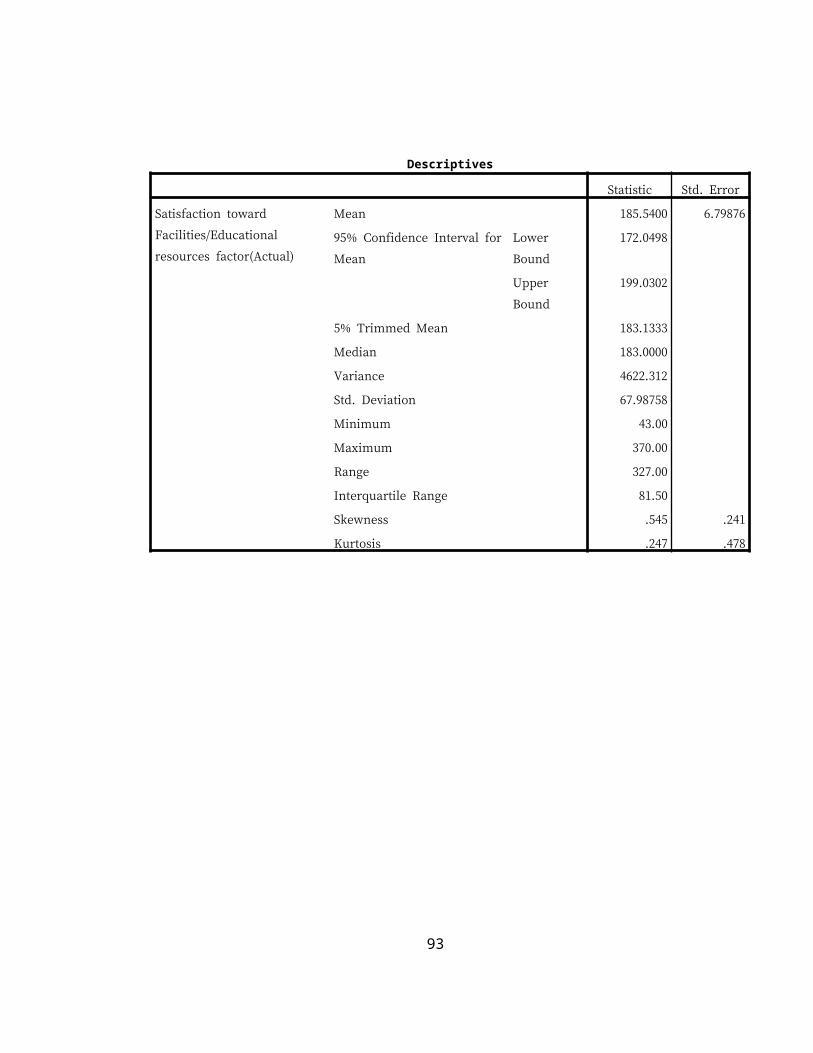
Descriptives
Statistic Std. Error
Satisfaction toward
Facilities/Educational
resources factor(Actual)
Mean 185.5400 6.79876
95% Confidence Interval for
Mean
Lower
Bound
172.0498
Upper
Bound
199.0302
5% Trimmed Mean 183.1333
Median 183.0000
Variance 4622.312
Std. Deviation 67.98758
Minimum 43.00
Maximum 370.00
Range 327.00
Interquartile Range 81.50
Skewness .545 .241
Kurtosis .247 .478
93
REFERENCES
1. Avery, C., & M.Hoxby, C. (2004). Do and Should Financial Aid Packages Affect Students' College Choices.
2. B. Khairani, A. Z., & B.Abdul Razak, N. (2013). Assessing Factors Influencing Students' Choice of Malaysian Public University. A Research Model Analysis .
3. B. R. (1973). A STUDY OF FACTORS ASSOCIATED WITH STUDENT CHOICE IN THE UNIVERSITY SELECTION PROCESS.
4. B.Mustafa, M. Z., B.Mohd Noor, K., Abdul Rahman, S. H., Hj. Nisbah, H., B.Ahmad, Z. A., A.Jalil, S., et al. (2012). Which One Is My PreferredIvoryTower? An Analysis Among Islamic Secondary School Students in Malaysia , 2 (5).
94
5. Bt. Syed Yasin, S. N., Mohamad Noor, N. M., & B.Mamat,M. (2009). Determining the Preferences among the High School Students Towards the Local Malaysian Public Universities. A Case Study .
6. BIBLIOGRAPHY J.L, F. AN EXPLORATORY STUDY OF FACTORS INFLUENCING THE DECISION OF STUDENTS TO STUDY AT UNIVERSITI SAINS MALAYSIA. Kajian Malaysia , 28.
7. K. Holdsworth PHd, D., & Nind, D. (2008). Choice Modeling New Zealand High School Seniors' Preferences for University Education. Journal of Marketing for Higher Education. , 15-2, 81-102
8. Kusumawati, A., Yanamandram, V., & P. N. (2010). Exploring Student Choice Criteria for Selecting an Indonesian Public University. A Preliminary Finding .
9. Md. Sidin, S., Hussin, S. R., & T. H. (2003). An Exploratory Study of Factors Influencing the College Choice Decision of Undergraduate Students in Malaysia.
10. P.hong, S., K.S, T., B.Abdul Rahman, M., & K.W, T. ( 2010). Factors Influencing Student Choice:A Studyof a MalaysianPublic University. Asian Journal of University Education , 6 , 75-89
11. Raposo, & M.H., A. (2007). A model of university choice: an exploratory approach.
95

96