Fuel Scale-‐Up in California: Policy and Regulatory Support
143
Public Interest Energy Research (PIER) Program DRAFT PROJECT REPORT ElectricFuel ScaleUp in California: Policy and Regulatory Support AUGUST 2011 CEC XXXXXXXXXX Prepared for: California Energy Commission Prepared by: Timothy Lipman, Maggie Witt, Brett Williams, and Matthew Bomberg University of California, Berkeley Transportation Sustainability Research Center
-
Upload
khangminh22 -
Category
Documents
-
view
3 -
download
0
Transcript of Fuel Scale-‐Up in California: Policy and Regulatory Support
Publ ic Interest Energy Research (PIER) Program
DRAFT PROJECT REPORT
Electric-‐Fuel Scale-‐Up in California: Policy and Regulatory Support
AUGUST 2011
CEC-‐XXX-‐XXXX-‐XXX
Prepared for: California Energy Commission
Prepared by: Timothy Lipman, Maggie Witt, Brett Williams, and Matthew Bomberg
University of California, Berkeley -‐ Transportation Sustainability Research Center

Prepared by: Primary Author(s): Timothy Lipman Maggie Witt Brett Williams Matthew Bomberg University of California, Berkeley Transportation Sustainability Research Center 2150 Allston Way #280 Berkeley CA 94704 tsrc.berkeley.edu Contract Number: XXX-XXX-XXX Prepared for: California Energy Commission XXXX XXXXXX Contract Manager XXXX XXXXXX Project Manager XXXX XXXXXX Office Manager Name of Office Goes Here XXXX XXXXXX Deputy Director Division Name Goes Here Melissa Jones Executive Director
DISCLAIMER
This report was prepared as the result of work sponsored by the California Energy Commission. It does not necessarily represent the views of the Energy Commission, its employees or the State of California. The Energy Commission, the State of California, its employees, contractors and subcontractors make no warrant, express or implied, and assume no legal liability for the information in this report; nor does any party represent that the uses of this information will not infringe upon privately owned rights. This report has not been approved or disapproved by the California Energy Commission nor has the California Energy Commission passed upon the accuracy or adequacy of the information in this report.

i
ACKNOWLEDGEMENTS The California Energy Commission Public Interest Energy Research (PIER) Program funded this project. We are appreciative of their timely support.
We particularly thank Philip Misemer and Erik Stokes of PIER for their guidance and assistance. Others providing provocative thoughts and insights in support of this work include Tom Turrentine and Dahlia Garas of the UC Davis PH&EV Research Center and Dan Kammen and Severin Borenstein at UC Berkeley. We would also like to thank the participants of the “Electric-Fuel Scale-Up Workshop” held in Berkeley on 15 June 2011, listed in the appendices. Thanks are due to the workshop speakers and draft reviewers for their thoughts and insights, including Matthew Crosby, Joshua Cunningham, Eric Cutter, Adam Langton, and Elise Keddie. Daniel Cowart of UC Berkeley helped with the preparation of the appendices, and he and Dana Goin of UC Berkeley were instrumental to the organization, execution, and documentation of the workshop and supported TSRC in several important ways throughout the project period. We thank Energy + Environmental Economics (E3) for their assistance with several aspects of the research project, and particularly the efforts of Eric Cutter, Jim Williams, Snuller Price, and Priya Sreedharan, who contributed substantially to the PEV emissions impact analysis in Chapter 4. Of course, the authors are responsible for the contents of this paper.
ii
PREFACE The California Energy Commission Public Interest Energy Research (PIER) Program supports public interest energy research and development that will help improve the quality of life in California by bringing environmentally safe, affordable, and reliable energy services and products to the marketplace.
The PIER Program conducts public interest research, development, and demonstration (RD&D) projects to benefit California.
The PIER Program strives to conduct the most promising public interest energy research by partnering with RD&D entities, including individuals, businesses, utilities, and public or private research institutions.
PIER funding efforts are focused on the following RD&D program areas:
• Buildings End-Use Energy Efficiency
• Energy Innovations Small Grants
• Energy-Related Environmental Research
• Energy Systems Integration
• Environmentally Preferred Advanced Generation
• Industrial/Agricultural/Water End-Use Energy Efficiency
• Renewable Energy Technologies
• Transportation
Electric-Fuel Scale-Up in California: Policy and Regulatory Support is the final report for (contract number XXX‐XX‐XXX, work authorization number [insert #] or grant number [insert #]) conducted by UC Berkeley’s Transportation Sustainability Research Center. The information from this project contributes to PIER’s Transportation Program.
For more information about the PIER Program, please visit the Energy Commission’s website at www.energy.ca.gov/research/ or contact the Energy Commission at 916-654-4878.
i
ACKNOWLEDGEMENTS The California Energy Commission Public Interest Energy Research (PIER) Program funded this project. We are appreciative of their timely support.
We particularly thank Philip Misemer and Erik Stokes of PIER for their guidance and assistance. Others providing provocative thoughts and insights in support of this work include Tom Turrentine and Dahlia Garas of the UC Davis PH&EV Research Center and Dan Kammen and Severin Borenstein at UC Berkeley. We would also like to thank the participants of the “Electric-Fuel Scale-Up Workshop” held in Berkeley on 15 June 2011, listed in the appendices. Thanks are due to the workshop speakers and draft reviewers for their thoughts and insights, including Matthew Crosby, Joshua Cunningham, Eric Cutter, Adam Langton, and Elise Keddie. Daniel Cowart of UC Berkeley helped with the preparation of the appendices, and he and Dana Goin of UC Berkeley were instrumental to the organization, execution, and documentation of the workshop and supported TSRC in several important ways throughout the project period. We thank Energy + Environmental Economics (E3) for their assistance with several aspects of the research project, and particularly the efforts of Eric Cutter, Jim Williams, Snuller Price, and Priya Sreedharan, who contributed substantially to the PEV emissions impact analysis in Chapter 4. Of course, the authors are responsible for the contents of this paper.

ii
PREFACE The California Energy Commission Public Interest Energy Research (PIER) Program supports public interest energy research and development that will help improve the quality of life in California by bringing environmentally safe, affordable, and reliable energy services and products to the marketplace.
The PIER Program conducts public interest research, development, and demonstration (RD&D) projects to benefit California.
The PIER Program strives to conduct the most promising public interest energy research by partnering with RD&D entities, including individuals, businesses, utilities, and public or private research institutions.
PIER funding efforts are focused on the following RD&D program areas:
• Buildings End-Use Energy Efficiency
• Energy Innovations Small Grants
• Energy-Related Environmental Research
• Energy Systems Integration
• Environmentally Preferred Advanced Generation
• Industrial/Agricultural/Water End-Use Energy Efficiency
• Renewable Energy Technologies
• Transportation
Electric-Fuel Scale-Up in California: Policy and Regulatory Support is the final report for (contract number XXX‐XX‐XXX, work authorization number [insert #] or grant number [insert #]) conducted by UC Berkeley’s Transportation Sustainability Research Center. The information from this project contributes to PIER’s Transportation Program.
For more information about the PIER Program, please visit the Energy Commission’s website at www.energy.ca.gov/research/ or contact the Energy Commission at 916-654-4878.
iii
ABSTRACT Advances in electric-drive technology, including lithium-ion batteries, and strong policy drivers, such as the Global Warming Solutions Act (AB 32), have contributed to a more promising market in California for the widespread introduction of plug-in electric vehicles (PEVs)—comprised of plug-in hybrids (PHVs) and battery electric vehicles (BEVs). However, significant technological, market-related, and institutional barriers remain. High battery costs, infrastructure requirements, and consumer unfamiliarity with PEVs create hurdles to the widespread commercialization of PEVs and thus shroud the extent to which the supply of electric transportation fuel (e-fuel) will need to be scaled up to meet future demand. Institutionally, uncertainties about the rate and scale of commercialization present significant challenges for strategic and regulatory planning, coordination, and policy development that will be necessary not only to support the largest possible number of PEVs, but also to maximize benefits.
This report examines the current market and policy/regulatory setting for PEV and e-fuel in California, assesses various related costs and benefits, identifies key issues and barriers to their widespread and responsible commercialization, and makes recommendations for policy development. These efforts are suggested in the interest of improving the commercialization of PEVs, thereby: helping the state meet its energy and environmental goals, providing economic vitality, and more generally helping the U.S. and the world evolve toward a more sustainable transportation future.
An additional goal of this report is to explore the argument that electricity used for PEVs should be monitored, tracked, and in various ways accounted for differently than electricity used for other uses, stemming from the fact that e-fuel substitutes directly for petroleum use and thus has the effect of significantly reducing emissions of GHGs and other pollutants in California. Differentiating e-fuel from other electricity uses would facilitate data collection and analysis of e-fuel-related investments and benefits, may be necessary for the implementation of the Low Carbon Fuel Standard program, and, lacking alternative financing schemes, would allow for the eventual make-up of road-tax revenues should PEVs become widespread.
Keywords: plug-in electric vehicle, PEV, plug-in hybrid, PHV, PHEV, battery electric vehicle, BEV, electric fuel, e-fuel, electric vehicle, EV, zero emission vehicle, ZEV, policy recommendations, metering, charging, commercialization, market penetration, battery costs, emissions
Please use the following citation for this report:
Lipman, Timothy, Maggie Witt, Brett Williams, and Matthew Bomberg. 2011. Electric-Fuel Scale-Up in California: Policy and Regulatory Support. California Energy Commission. Publication number: CEC-XXX-2011-XXX.
iv
TABLE OF CONTENTS
EXECUTIVE SUMMARY ........................................................................................................................ 1 Introduction and Project Goals ............................................................................................................ 1 Alternative-Fuel-Vehicle Lessons Learned and the Policy/Regulatory Setting for PEVs .......... 1 PEV Commercialization: Past Efforts, Present Status, and Future Prospects ............................... 5 E-Fuel Costs and Benefits ...................................................................................................................... 7 Recommendations and Conclusions ................................................................................................... 9 Appendices ............................................................................................................................................. 9
CHAPTER 1: Introduction ..................................................................................................................... 11 Project Background .............................................................................................................................. 11 Overall Project Goals ........................................................................................................................... 13 Report Organization ............................................................................................................................ 14
CHAPTER 2: Lessons Learned and Current Policy/Regulatory Setting ....................................... 15 Lessons Learned from Previous Alternative-Fuel Vehicle Efforts ................................................ 15 Current Policy and Regulatory Context ........................................................................................... 19 Opportunity for Policy Development: Metering E-Fuel ................................................................ 31 Additional Key Policy and Regulatory Considerations ................................................................. 32 Potential New Regulatory and Policy Developments .................................................................... 35
CHAPTER 3: PEV Commercialization: Past Efforts, Present Status, and Future Prospects ..... 37 A Brief History of Plug-In Electric Vehicles ..................................................................................... 37 Current Status of PEV Commercialization ....................................................................................... 39 Future Prospects: Market Penetration Scenarios ............................................................................. 44
CHAPTER 4: PEV and E-Fuel Costs and Benefits ............................................................................ 57 Lifetime Economics of PEVs Compared with Conventional Vehicles ......................................... 57 Mitigating Battery First Cost as a Barrier to PEV and E-Fuel Adoption ...................................... 63 Emissions Impacts and Values in California .................................................................................... 65 PEVs and Household Energy Use ..................................................................................................... 82 Overall Social Benefits and Costs of PEVs ....................................................................................... 84
CHAPTER 5: Recommendations and Conclusions .......................................................................... 85 Key Remaining Issues .......................................................................................................................... 85 Policy Recommendations .................................................................................................................... 86
v
Directions for Future Work ................................................................................................................ 91 Final Summary and Concluding Thoughts ...................................................................................... 92
APPENDIX A: Workshop Attendees and Summary ........................................................................ 94 Workshop Attendees ........................................................................................................................... 94 Workshop Summary ............................................................................................................................ 95 Further Detail ........................................................................................................................................ 96
APPENDIX B: AFV Commercialization Efforts - Additional Details ........................................ 101 Hybrids and Battery-Electric Vehicles ............................................................................................ 101 Plug-in Electric Vehicles .................................................................................................................... 102 Natural Gas Vehicles ......................................................................................................................... 103 Fuel Cell Electric Vehicles ................................................................................................................. 106
APPENDIX C: Codes and Standards Relevant for Automotive Battery Systems .................... 109 APPENDIX D: Review of PEV Market Forecasts ........................................................................... 110 APPENDIX E: Select Related Activities ........................................................................................... 122
Project Get Ready ............................................................................................................................... 122 The EV Project .................................................................................................................................... 122
ACRONYMS .......................................................................................................................................... 124 REFERENCES ........................................................................................................................................ 127
1
EXECUTIVE SUMMARY Introduction and Project Goals Plug-in electric vehicles (PEVs)1 are now experiencing a wave of commercial and consumer interest based on new designs for plug-in-hybrid-vehicle (PHV) architectures of various types as well as improved batteries for both PHVs and all-battery powered vehicles (BEVs). PHVs allow electric operation for a limited duration but without compromising overall vehicle range or refueling convenience, because the vehicles seamlessly operate as gasoline hybrid vehicles once the initial battery charge is depleted. BEVs operate purely on electricity, with accordantly greater potential benefits, but typically have driving ranges of around 50–100 miles and multi-hour recharge times, depending on the vehicle type and battery size.
The overall goals of this project are to summarize the current market and policy/regulatory status in California regarding PEVs, assess related costs and emission benefits, identify key issues and barriers to their widespread and responsible commercialization, and recommend next steps and directions for policy development. These efforts are suggested in the interest of improving the commercialization of PEVs, thereby: helping the state meet its energy and environmental goals, providing economic vitality, and more generally helping the U.S. and the world evolve toward a more sustainable transportation future.
An additional goal of this report is to explore the argument that electricity used for PEVs should be monitored, tracked, and in various ways accounted for differently than electricity used for other uses. The use of electricity as a vehicle fuel, or “e-fuel,” is fundamentally different than electricity for almost all other uses. This stems from the fact that e-fuel substitutes directly for petroleum and thus has the effect of significantly reducing emissions of GHGs and other pollutants in California.
The report also incorporates key outcomes of the 15 June 2011 “Electric-Fuel Scale-Up Workshop” held at UC Berkeley. Along with various other research efforts and expert interviews, the insights gained through the full-day workshop with key PEV stakeholders were helpful to achieving the above project objectives.
Alternative-Fuel-Vehicle Lessons Learned and the Policy/Regulatory Setting for PEVs Lessons learned from previous experiences with AFVs California's previous experiences with alternative-fuel vehicles (AFVs) demonstrate the important roles that infrastructure development, cost competitiveness with conventional vehicles, and public and governmental support play in the successful deployment of AFVs. These experiences indicate that the a challenge in achieving the "take-off" of PEVs lies in their development and marketing not simply as comparable but potentially superior vehicle products which will benefit over time from increasing refinement, cultural importance, and ubiquity.
1 Electrically driven vehicles (electric vehicles, EVs, or xEVs) are powered in part or wholly by electric motors and comprise hybrid EVs (hybrids, HEVs, or HVs), plug-in hybrid EVs (plug-in hybrids, PHEVs, or PHVs), battery EVs (BEVs), and fuel-cell EVs (FCEVs, FCVs, or FCHVs). Plug-in EVs (plug-ins, plug-in vehicles, or PEVs)—the focus of this report—comprise plug-in hybrids and battery EVs. Further, as fuel-cell EVs are typically hybridized with batteries, they can be (and prototypes have been) designed as PEVs.
2
To address infrastructure development needs, past government efforts have provided financial incentives and other forms of policy and regulatory support, and it is likely that future AFV programs will also rely on similar encouragement. Additionally, infrastructure development has been influenced by good planning, both of the infrastructure system itself and of vehicle deployment projects and pilots. Further, while fleet-focused pilots are informative and directly useful for niche applications of vehicles, larger-scale adoption will likely have to come from more widespread and public exposure to AFVs. Related to vehicle cost competitiveness, past programs have focused on providing rebates, tax credits, and other incentives (HOV stickers, etc.) to bring down the capital and operating costs of AFVs. To date, however, these incentives have not been sufficient to successfully overcome higher AFV costs and the increased inconvenience and anxieties that come with AFV adoption. Finally, consumer AFV adoption has been slow to occur, mostly because of public unfamiliarity, fueling inconvenience, and higher costs. Government response has been constrained by both the magnitude of the costs as well as uncertainty about technological development and potential future consumer preferences.
In the future, reconciling cost discrepancies and motivating AFV adoption and infrastructure development would benefit from further changes in the way the government and consumers value potential social and environmental benefits of AFVs. In addition, or parallel to these paradigm shifts, lies the possibility that future PEVs will develop into innovative, superior products. The responsive and smooth feel of electric drive, quiet operation, potential for low maintenance, ease of home refueling, and other potential advantages may be valued significantly by consumers. Even more values may be derived in the future, such as the use of the vehicles as mobile sources of electricity (Williams 2007) and potential providers of utility grid services via smart charging or possibly even vehicle-to-grid power (Williams and Kurani 2007). A number of these “extended value” propositions remain largely untested at the current stage of EV development, but it is clear even at this stage that there are elements of the electric-driving experience that are appealing to potential consumers, and that this can have an effect on the broader commercialization prospects for these vehicles (Shaheen et al. 2008; Martin et al. 2009).
Current policy and regulatory context The most important policies in California related to PEVs include the Zero Emission Vehicle (ZEV) Regulation that requires automakers to make zero-emission vehicles available in the market, the Global Warming Solutions Act (Assembly Bill 32) that requires reductions in California’s emissions of greenhouse gases (GHGs), the Low Carbon Fuel Standard (LCFS) that requires reductions in the carbon intensity of California vehicle fuels, and the Assembly Bill 118 program that provides funding for key PEV infrastructure developments and other alternative transportation fuels. Additional efforts include those by the California Public Utilities Commission (CPUC) and others to support and coordinate PEV infrastructure development, develop appropriate electric utility rates and related polices for PEVs, and support PEV commercialization in various other ways such as through carpool lane access. Such policies and regulations are detailed in Chapter 2 with regard to their current and potential impact on PEV commercialization efforts. There is little doubt that these regulations are having an important impact, but as discussed in this report, there are possible modifications and additional policy and regulatory development that would further aid PEV commercialization in appropriate ways.
The Zero Emission Vehicle Regulation Since it was first passed in 1990, the ZEV Regulation has spurred new vehicle designs that have resulted in fewer tailpipe emissions from vehicles and air-quality improvements around the state. Recently, the California Air Resources Board (CARB) has revised its ZEV regulations in order to help the state achieve its greenhouse-gas (GHG) emission-reduction goals, given the
3
transportation sector's significant contributions to statewide GHG emissions. In revisiting the ZEV Regulation to make this change in 2009, CARB determined that PEVs play a critical role in achieving state goals. For this reason, CARB is proposing changes to the ZEV program that would no longer allow automakers to meet ZEV production requirements with Partial Zero Emissions Vehicles (PZEVs)—conventional gas vehicles with extremely low emissions—and hybrids. Instead, ZEV requirements would have to be met with PHVs, BEVs, and fuel-cell electric vehicles (FCEVs). Clearly, this change in the ZEV Regulation is likely to contribute significantly to the growth of e-fuel. In developing these new regulations, CARB is working closely with the California Energy Commission (CEC) and the CPUC to ensure that the future need for and demand of PEVs can be met without negatively impacting California's electricity system. Additionally, this interagency collaboration is meant to maximize the energy-efficiency and economic benefits that can be gained from transitioning to PEVs.
Utility rate structures for PEV charging Utility rate structures can be designed to achieve various goals ranging from energy conservation to load shifting. Recently, utilities, regulators, and other stakeholders have considered how these rate structures may also be designed to influence PEV charging behavior.
As of the writing of this report, the three largest investor-owned utilities (IOUs) in California—Southern California Edison (SCE), Pacific Gas and Electric (PGE), and San Diego Gas and Electric (SDGE)—already offer PEV-specific rate schedules. In SCE territory, PEV owners can choose from the regular residential rate, a discounted time-of-use (TOU) PEV rate that keeps track of electricity for PEV charging with a separate meter, or a rate that charges less for electricity consumption at night when PEV owners are most likely to charge. In PGE's service territory, PEV owners are required to use special TOU rates. SDGE offers three PEV-specific rates, all of which are TOU, non-tiered, and optional for PEV owners.
In 2009, the CPUC initiated a rulemaking process to identify and, subsequently, provide rules and policy guidance to overcome the current barriers to large-scale PEV deployment. In this process, the CPUC examined current utility rate structures to decide, what, if any, changes should be made to remove barriers to PEV adoption. The final CPUC decision indicated that, while discounted and TOU PEV rates can influence charging behavior and provide incentives for PEV ownership, the rate designs currently in place are adequate for early PEV adopters (CPUC 2011). However, the decision indicates that, since this conclusion may not hold true in the medium and long-terms, the CPUC will undertake another review of rate structures in 2013 when more information is available about the load profiles of early PEV adopters, in order to determine if changes should be made to maximize the economic and energy efficiency of PEV charging.
The Low Carbon Fuel Standard The Low Carbon Fuel Standard (LCFS) was created in California to reduce GHG contributions from the state's transportation sector by decreasing the carbon content of transportation fuels. To achieve the statewide goal of reducing transportation fuel carbon intensity by 10% by 2020, the state requires fuel providers to make changes to the mix of fuels sold in the state. Electricity's comparatively low carbon intensity value incentivizes an increasing share of e-fuel. However, many issues related to meeting LCFS requirements with e-fuel remain to be resolved, including determining how transportation electricity should be tracked and allocated for LCFS compliance.
Opportunity for policy development: metering e-fuel Still needed are the specific mechanisms for tracking e-fuel that would allow various stakeholders to enjoy the benefits of PEV scale-up. Currently, most homes use single, whole-house metering, but this arrangement prevents PEV owners from taking full advantage of PEV-specific rate discounts. Additionally, because this arrangement does not track electricity for
4
PEVs separately from other electricity load, utilities or other potential beneficiaries may find it difficult to collect LCFS credits for PEV charging.
Furthermore, under current policy, PEV owners that opt to install separate meters or submeters in order to take advantage of these benefits must purchase these meters and pay for installation, which could translate to total costs of up to $1,000 or more, depending on any necessary wiring upgrades). Also, submetering lacks protocols, requirements, and standards that will be necessary for large-scale deployment.
Additional key policy and regulatory considerations While policy opportunities exist, there is evidence of current efforts to reconcile shortfalls and proactively address other key issues that may arise related to PEV charging and ownership. The current dynamism of the policy environment is not necessarily consistent in the type or rate of new policies being developed. Indeed, some policies have taken decades to develop, while others have taken shape more rapidly, spurred by AB 32 and other overarching policies and regulations. Some of the factors influencing the rate and character of new policy and regulatory considerations related to PEVs also help to describe what is different about this period of PEV commercialization compared to past experiences with PEV development and deployment. These factors include the existence of better technologies, increasing concern about climate change and energy-security, the new regime of higher gas prices, and a growing "green ethic" that focuses on eco-friendly technology and less resource use.
Potential new regulatory and policy developments There are several possibilities for future PEV-related policies and regulations. It is likely that these future developments will enhance benefits and reduce costs for both PEV owners and e-fuel suppliers.
Future policies that would benefit PEV owners and e-fuel suppliers include the following:
1) Policies distinguishing e-fuel from other uses of electricity, which would create opportunities for reduced or specially designed PEV electricity rates, and would also facilitate the fair and accurate allocation of LCFS credits.
2) Utility rate-basing of grid upgrades—particularly in neighborhood "clusters"—and related investments needed to support PEV charging and mitigate potential costs for PEV owners.
3) Vehicle "feebates" that charge fees for new vehicles that produce high levels of GHG emissions and awards rebates for new vehicle purchases that produce low levels of GHG emissions.
4) Battery and/or full PEV leasing and/or tax write-offs for interest incurred on PEV-related loans, in order to mitigate the relatively high costs of PEV batteries.
5) Extra tax benefits for PEV purchases that are coupled with purchases of solar photovoltaic systems, including community solar projects.
6) A floor on gasoline prices at $3.00 per gallon in order to ensure consumers that transitioning to e-fuel would provide lifetime-of-the-vehicle fuel cost savings.
7) Policies that better define and strengthen utilities' roles in achieving the LCFS, e.g., credits or compensation for their role in e-fuel provision, etc.
8) Since "decoupling" in California separates utility revenues from the volume of electricity sales in order to encourage conservation, future policies may also need to provide other e-fuel specific incentives for utilities.
5
PEV Commercialization: Past Efforts, Present Status, and Future Prospects A brief history of plug-in electric vehicles The earliest battery electric vehicles (BEVs) were produced in the mid-19th century with efforts in both Europe and the U.S., but practical BEVs produced in significant numbers were not available until the late 1800s and early 1900s. By 1915, however, mass-produced Ford gasoline vehicles surpassed BEVs in number, mainly because of their comparably lower price (Bellis 2006). This price difference—combined with the low cost of petroleum, and the superior performance of combustion vehicles, and the invention of the starter motor—caused BEV technology to stagnate for several decades. Then, in the late 1980s and early 1990s, the high gasoline prices and supply disruptions experienced during the oil crises in the 1970s and growing interest in social and environmental issues spurred a renewed interest in electric vehicle technology.
The number of BEVs worldwide grew substantially in the 1990s as a result of this renewed interest and new policies, like the California Zero Emission Vehicle regulation, that pushed for wider adoption of BEVs (Sperling 1995). While the number of electric vehicles of all types in use in the U.S. has increased steadily since 1995 (Davis et al. 2010), the historical record shows a distinct "peak and valley" history of PEV commercialization with periods of clear growth followed by periods of decline and stagnation. Most recently, however, the outlook for PEVs has improved markedly due to improvements in batteries, power electronics, and motors and new hybrid vehicle architectures. In fact, modern PEVs have key performance advantages over conventional combustion-engine vehicles, including those provided by the responsiveness, smooth operation, and low maintenance of electric drive.
Current status of PEV commercialization Today, a variety of different types of "electric vehicles" exist in the market or are being developed for commercial availability in the near future. Electrically driven vehicles (electric vehicles, EVs, or xEVs) are powered in part or wholly by electric motors and comprise hybrid EVs (hybrids, HEVs, or HVs), plug-in hybrid EVs (plug-in hybrids, PHEVs, or PHVs), battery EVs (BEVs), and fuel-cell EVs (FCEVs, FCVs, or FCHVs).
Plug-in EVs (plug-ins, plug-in vehicles, or PEVs)—the focus of this report—include plug-in hybrids and battery EVs. While very different in many ways, the key commonality between PHVs and BEVs is that both derive some or all of their propulsion energy from plugging in to the electricity grid or other sources of electrical energy. Several PEVs are now commercially available and additional models are expected soon (see Tables 3-1 and 3-2). The key differences between these modern PEVs and PEVs from the 1990s include: 1) the availability of relatively small-battery plug-in hybrids, 2) improved performance from the recent availability of lithium-ion based batters with much higher energy density than available in previous battery types, and 3) significant advances and cost reductions in other drivetrain components such as electric motors, power inverters, and electrically operated accessory systems.
As of the writing of this report, EPA test results are available for four major PEVs: the Nissan LEAF, the Chevy Volt, the smart fortwo electric drive (e.d.) and the Tesla Roadster. In addition to these vehicles, preliminary information is also available on the 2012 Mitsubishi i and the 2012 Prius PHV, and more than a dozen vehicles are due for release by the end of 2012, as described in Tables 3-1 and 3-2.
6
Future prospects: market penetration scenarios Challenges of forecasting PEV sales rates Future market penetration of PEVs is difficult to predict, particularly given the various factors that influence new product adoption and varied past experience with other new products—some of which started out successfully and then dropped in popularity and others that were slow to start, but then achieved market take-off. Currently, while interest in PEVs is growing, the technology is still in the innovator and early-adopter market stages, making it difficult to predict with certainty what the future rate and magnitude of PEV uptake will look like. Additionally, future PEV adoption will likely be influenced by various exogenous factors, ranging for gasoline prices, other vehicle economic considerations, driver behavior, perceptions of PEVs, government policies, incentives for PEV ownership, etc.
Are PEVs likely to be BEVs or PHVs? A critical and often neglected uncertainty in predicting and planning for PEV market penetration is the relative level of adoption of BEVs and PHVs. Each has significantly different implications, e.g., for consumer behavior, infrastructure requirements, grid impacts, adoption dynamics, and policy design and effect. Estimating relative rates of PHV and BEV adoption requires the determination of how these and other differences will influence relative adoption rates. For example, key differences between BEVs and PHVs relate to the size and cost of the vehicle batteries, the total vehicle range, the convenience of refueling/recharging infrastructure, and required consumer behavioral changes. When considering these differences, the PHV appears to face much lower barriers to commercialization, largely because the combination of electric and gasoline propulsion technologies translates to longer ranges, lower battery costs, and familiar vehicle operation and refueling methods. Thus, revenue-constrained, cost-effective policies should be aimed at PHVs as the common denominator.
In addition to considering the relative rates and magnitudes of BEV and PHV adoption, it is also important to characterize what different rates of adoption will mean for overall PEV market penetration. For example, will faster adoption of PHVs help or hinder the growth of the BEV market and the overall PEV market? Currently, it is expected that initial faster growth in PHV adoption relative to BEV adoption will "lift the tide" for all PEVs and advance e-fuel implementation, for example by increasing consumer familiarity with recharging, and the establishment of large-scale supply chains for electric-drive technologies, etc.
Review of PEV market forecasts There is much variation in the results of PEV market forecasts for the short, medium, and long term. But while these forecasts do not provide "a number," or even a narrow range to characterize the future PEV population, these forecasts nevertheless provide useful information about the various factors that are likely to influence the rate and magnitude of PEV adoption.
Factors that forecasters have most commonly identified as being key for future adoption include economic factors, factors related to public attitudes and perceptions, and political and regulatory factors. Economic factors include those that may affect the costs of conventional vehicles, PEVs, or both, e.g., oil prices and battery costs. Studies have also shown that many past and current barriers to PEV adoption are related to consumers' lack of knowledge and familiarity with the vehicles. Many people are deeply concerned by range limitations imposed by BEVs and may not fully understand the difference between PHVs and BEVs, but their attitudes towards the technologies will evolve significantly with exposure. Finally, research has shown that government policies have a track record of influencing the types of vehicles available to and chosen by consumers. For example, the ZEV Regulation significantly improved vehicle technology and decreased tailpipe emissions (CARB 2009c) and tax credits and rebates have also encouraged consumers to purchase more fuel-efficient hybrids (Beresteanu and Li 2011).
7
E-Fuel Costs and Benefits Lifetime economics of PEVs compared with conventional vehicles PEVs currently have higher first costs than conventional vehicles, but the magnitude of the cost difference varies based on the type of vehicle and size of the battery. Research shows that this cost difference is expected to diminish in the future due to the declining costs of PEV batteries resulting from technological progress, increased battery production volumes, etc. Compared to conventional vehicles, manufacturing costs for PEVs are more variable as well, because of the influence of the costs of battery packs. Despite these differences, however, vehicle lifetime costs for PEVs are very similar to conventional vehicles, mostly because of the lower per mile fuel costs of electricity compared to gasoline and also because maintenance costs for PEVs (particularly BEVs) are lower due to the vehicles' simpler drive trains and lack of moving parts.
Overcoming the "cost gap" between PEVs and conventional vehicles—particularly the gap created by higher PEV first costs—will likely be important for future PEV adoption. Federal and state vehicle purchase incentives provide a key means of closing this "gap," but it is unclear how these inventive levels will change over time and whether governments will be able to support them in the long-term.
Mitigating battery first cost as a barrier to PEV and e-fuel adoption In addition to potential government subsidies that may help close the "cost gap" created by high battery costs, several other cost mitigating strategies are being considered. These strategies include reducing battery costs directly, strategic battery production and marketing, employing various forms of cost financing, and offsetting costs with secondary valuation of batteries:
Reducing battery costs directly can be achieved by engineering innovations to reduce per-cell costs and strategies to reduce per-pack costs, e.g., by utilizing smaller battery packs commonly found in PHVs before transitioning to large, more costly battery packs found in BEVs. This incremental approach would facilitate changes in marketing, consumer behavior, and supply channels that could, over time, lead to large-scale shifts to electric fuel implementation and battery cost reductions.
Strategic approaches to battery production can also mitigate costs by spreading costs over large production volumes. Production volumes can be increased by targeting high-cell-volume applications and by standardizing battery cells or modules for use across multiple applications (or even, as Mitsubishi has done, allowing their vehicles to be sold under different badges).
Alternative financing mechanisms and battery leasing are also being considered as ways to reduce battery costs. Alternative financing options include tax credits, grants, feebates (a revenue neutral program where purchasers of efficient cars receive rebates and purchasers of inefficient cars pay a fee), and nonmonetary benefits like carpool lane and parking privileges. Battery leasing could also mitigate the battery costs by shifting total cost of ownership away from first costs and more toward lifecycle costs, thus making PEVs more attractive to potential buyers. In addition to reducing costs, battery leasing could also give battery suppliers a profit-margin incentive to produce longer lasting and more recyclable batteries.
Finally, battery costs may be mitigated by taking advantage of their secondary value, e.g., from post-vehicle repurposing into energy-storage and grid-supporting devices. PEV batteries no longer useful in PEVs vehicles could be repurposed for "second life" uses that provide customer-side-of-the-meter benefits, demand-response services, and utility-operation improvements. Additionally, second life batteries may help defer costly grid upgrades and support the profitability and penetration of wind and other renewable energy generation.
8
Emissions impacts and values in California It is generally believed that, overall, PEVs will produce environmental benefits in California by shifting emissions from relatively dirty, high-exposure vehicle tailpipes to relatively clean, low-exposure power plant stacks. However, the magnitude of the potential benefits from the transition from conventional vehicles to PEVs remains unknown, largely because of unanswered questions about the level of PEV penetration, patterns of use and charging, and interactions with the electricity grid. Not knowing these specifics of the PEV transition, in turn, makes it difficult to estimate the impacts on human health and economic productivity, particularly at smaller geographic scales.
Chapter 4 of this report summarizes an analysis undertaken to attempt to quantify the impact and value of e-fuel scale-up. The case study analyzed focuses on the nine-county San Francisco Bay Area in 2002. Four scenarios—representing different assumptions about vehicle penetration and charging activities—are used to bound estimates of displaced gasoline miles and added electric demand. Then, a series of models are employed to estimate reductions in tailpipe emissions and added power plant emissions, and to assess and monetize the impacts of these emissions changes.
The most significant findings from this case study analysis are listed below:
• The type of generation that comes online in the San Francisco Bay Area to satisfy PEV load is independent of the level of PEV penetration and charging profile. Within the range of load increments analyzed, PEVs do not to push demand for electricity out of a relatively flat region of the heat rate curve within which nearly indistinguishable natural gas peaker plants come online.
• For all air pollutants studied, the reduction in tailpipe emissions dominates any added power plant emissions. This fact, combined with the fact that tailpipe emissions (as a low source that is inherently near human populations) are prone to far less dispersion and exposure than power plant emissions (stack sources typically sited away from human populations) means that PEVs provide a clear environmental benefit to society.
• This analysis finds this benefit to be worth $750-1,500 per vehicle in an expected penetration scenarios (in which PEVs are predominantly PHVs), and $1,000-2,500 in an aggressive penetration scenario (in which BEVs comprise a significant share of PEVs). This benefit is solely due to avoided human health impacts from reduced formation of fine particulate mater and avoided GHG emissions.
• Within the Bay Area case study considered here, all counties are net environmental beneficiaries (that is, all counties experience a positive benefit of avoided human health damages). The magnitudes of benefit per county differ, but this may reflect differences in level of driving across counties more than anything else.
How can emissions benefits of PEVs be better captured? As previously stated, the transition from conventional vehicles to PEVs is expected to result in a net environmental benefit both because of the reduction GHG emissions and other criteria pollutants emitted via the tailpipes of conventional vehicles. Currently, however, the public largely enjoys these benefits as "positive externalities" that lack a monetized value and as such, they often remain unnoticed and/or undervalued. In the future, better valuing and/or monetizing the social costs and benefits of transportation fuels and technologies would likely provide a boost for PEV commercialization. Possible ways of better capturing these benefits include a cap-and-trade program and other alternatives for monetizing carbon, further efforts to internalize the costs of air pollution health and other damages, and better recognition of the
9
lessened exposure impacts of pollution from power plant electricity generation compared with motor vehicle tailpipes.
Recommendations and Conclusions Key remaining issue: differentiating e-fuel Differentiating e-fuel from other electricity uses is potentially important for a number of reasons. These include: 1) so data can be obtained to understand how much electricity is used to charge PEVs, for example to better understand the true environmental benefits of PEVs relative to other vehicle types or to characterize the costs and benefits of PEV infrastructure and related investments; 2) so that use of e-fuel in PEVs can be included in the Low Carbon Fuel Standard program, and 3) lacking alternative financing schemes, to eventually allow for road-tax makeup as PEVs become widespread. The benefits and implications of differentiating e-fuel from other electricity uses are discussed in more detail in Chapter 5.
Recommendations and Conclusions The key recommendations arising from this project analysis effort are as follows, explained in detail below:
• Recommendation 1: Differentiate electric fuel (e-fuel) from electricity for other uses • Recommendation 2: Develop requirements and protocols for e-fuel to be metered and
reported by electricity providers • Recommendation 3: Develop multi-year plans for state-level incentive programs,
including “feebates,” to provide better certainty to PEV manufacturers and consumers about the expected level of future state support
• Recommendation 4: Require EVSE and other PEV service providers who receive state funding to provide baseline data for use in state and regional analysis and planning
• Recommendation 5: Provide improved education and outreach efforts to better assist potential PEV adopters to understand the costs and benefits that they would incur by adopting PEVs of various types, clearly differentiating plug-in hybrids and battery EVs
• Recommendation 6: Explore prospects for utility ownership of submeters and EVSE and related equipment while enabling third-party solutions
• Recommendation 7: Work with automakers and other stakeholders to better understand future PEV markets
In conclusion, PEVs are becoming commercialized in many more types and body styles and by more manufacturers than has ever before been the case. It is likely that the 2011–2012 period will be considered a “water shed” time for PEVs, where the thousands of BEVs on the roads in the U.S. in 2000 will give way to tens of thousands and eventually hundreds of thousands of PEVs of various types in use by 2020 and beyond. This report examines the current setting for PEVs and e-fuel in California, including market conditions, policy and regulatory status, lessons learned from previous AFV commercialization efforts, and the current understanding of the overall “PEV value proposition,” including costs and emissions benefits. The report concludes that there are several reasons to be optimistic about the future prospects for PEVs, and that several noteworthy policies and programs in California continue to evolve in ways that are supportive, but that there are key opportunities that can be addressed through further policy developments such as those suggested herein.
Appendices The appendices include: A) a summary of the 15 June 2011 workshop in Berkeley, California that was hosted by UC Berkeley’s Transportation Sustainability Research Center (TSRC) as part of the overall research project; B) additional details on alternative-fuel vehicle

10
commercialization efforts, C) a list of codes and standards related to automotive battery systems; D) a summary of the PEV market forecasts discussed in Chapter 3, and E) a description of select related activities.
11
CHAPTER 1: Introduction Project Background Electrically driven vehicles (EVs) are powered in part or wholly by electric motors and comprise hybrid EVs (hybrids, HEVs, or HVs), plug-in hybrid EVs (plug-in hybrids, PHEVs, or PHVs), battery EVs (BEVs), and fuel-cell EVs (FCEVs, FCVs, or FCHVs). Plug-in EVs (plug-ins, plug-in vehicles, or PEVs)—the focus of this report—comprise plug-in hybrids and battery EVs. Further, as fuel-cell EVs are typically hybridized with batteries, they can be (and prototypes have been) designed as PEVs.
Plug-in electric vehicles (PEVs) are now experiencing a wave of commercial and consumer interest based on new designs for plug-in hybrid vehicle (PHV) architectures of various types as well as improved batteries for both PHVs and all-battery powered vehicles (BEVs). PHVs allow electric operation for a limited duration but without compromising overall vehicle range or refueling convenience, because the vehicles seamlessly operate as gasoline hybrid vehicles once the initial battery charge is depleted. BEVs operate purely on electricity, with accordantly greater potential benefits, but have practical driving ranges of typically around 50–100 miles depending on the vehicle type and battery size.
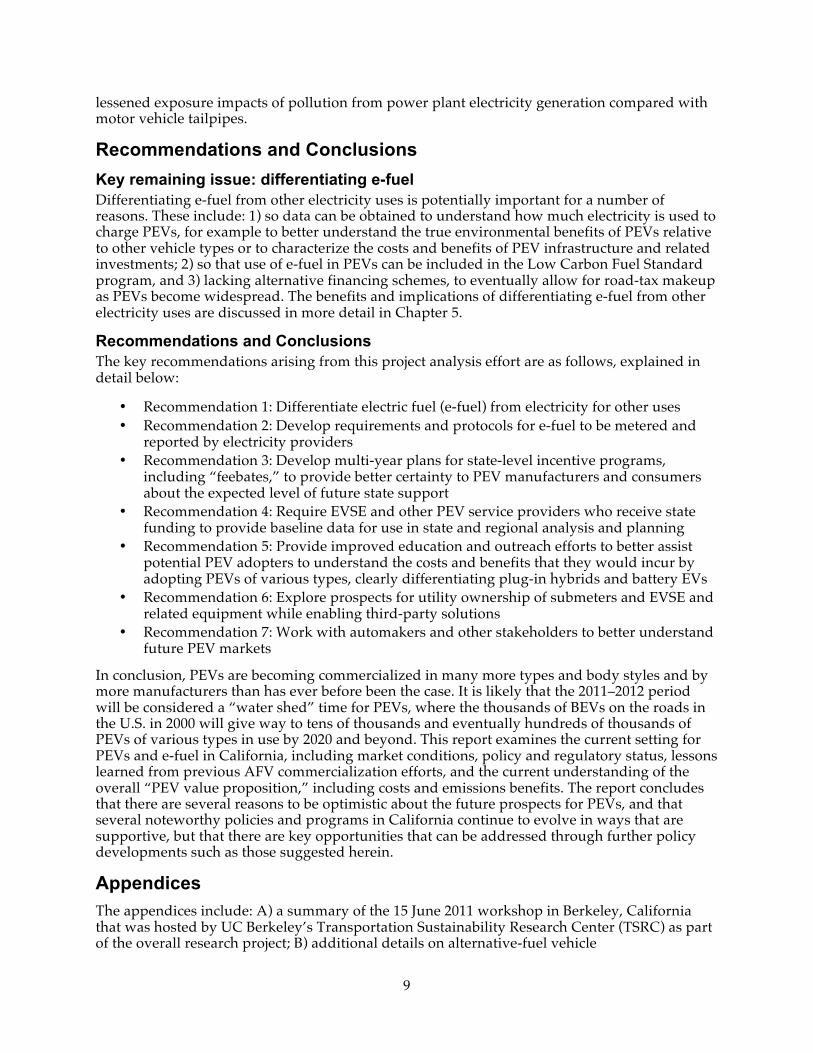
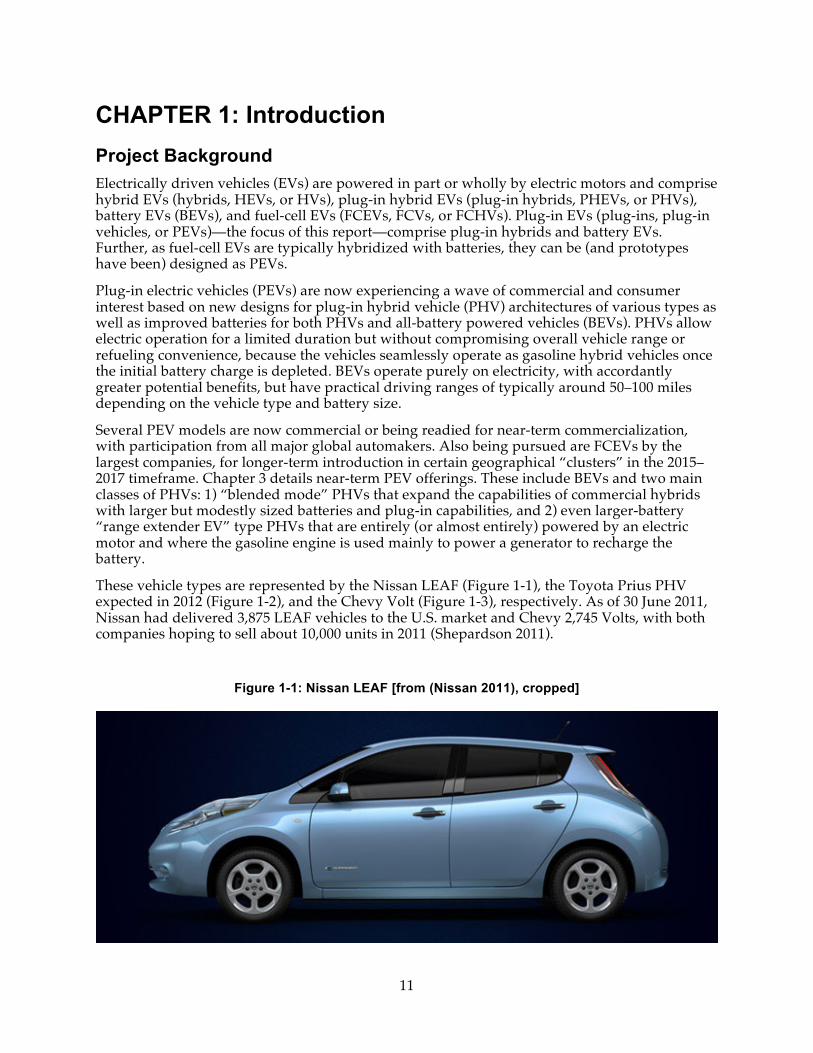
Several PEV models are now commercial or being readied for near-term commercialization, with participation from all major global automakers. Also being pursued are FCEVs by the largest companies, for longer-term introduction in certain geographical “clusters” in the 2015–2017 timeframe. Chapter 3 details near-term PEV offerings. These include BEVs and two main classes of PHVs: 1) “blended mode” PHVs that expand the capabilities of commercial hybrids with larger but modestly sized batteries and plug-in capabilities, and 2) even larger-battery “range extender EV” type PHVs that are entirely (or almost entirely) powered by an electric motor and where the gasoline engine is used mainly to power a generator to recharge the battery.
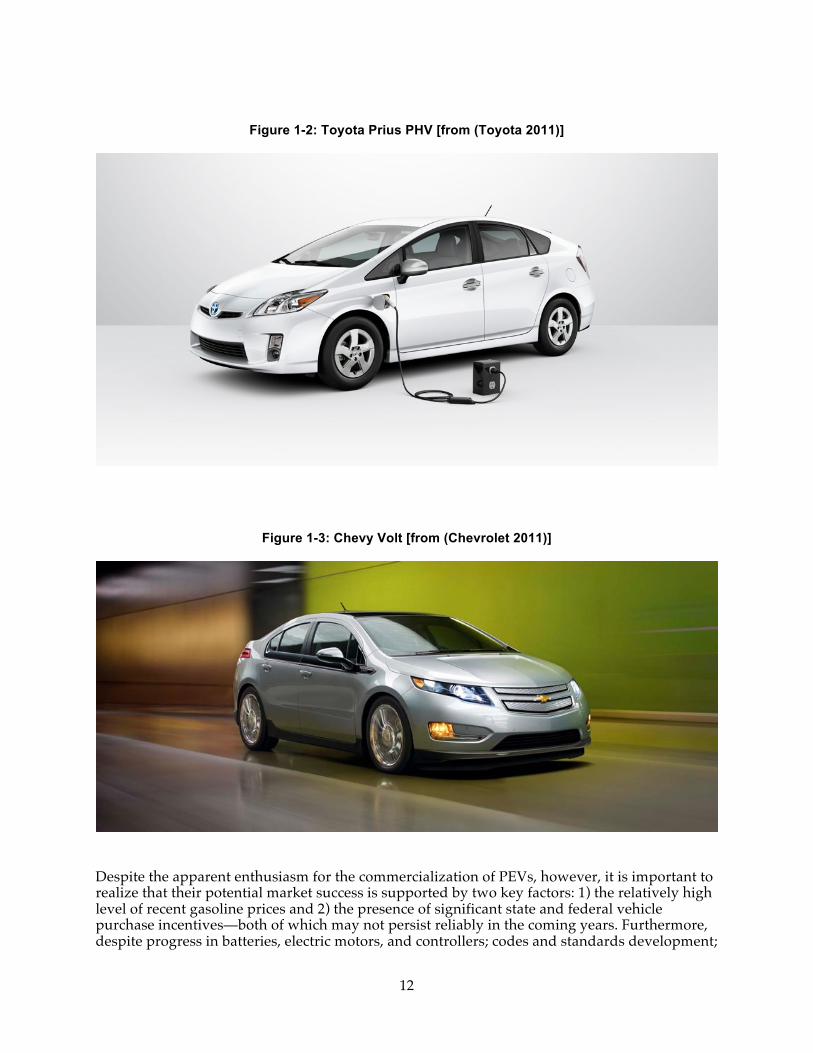
These vehicle types are represented by the Nissan LEAF (Figure 1-1), the Toyota Prius PHV expected in 2012 (Figure 1-2), and the Chevy Volt (Figure 1-3), respectively. As of 30 June 2011, Nissan had delivered 3,875 LEAF vehicles to the U.S. market and Chevy 2,745 Volts, with both companies hoping to sell about 10,000 units in 2011 (Shepardson 2011).
Figure 1-1: Nissan LEAF [from (Nissan 2011), cropped]
12
Figure 1-2: Toyota Prius PHV [from (Toyota 2011)]
Figure 1-3: Chevy Volt [from (Chevrolet 2011)]
Despite the apparent enthusiasm for the commercialization of PEVs, however, it is important to realize that their potential market success is supported by two key factors: 1) the relatively high level of recent gasoline prices and 2) the presence of significant state and federal vehicle purchase incentives—both of which may not persist reliably in the coming years. Furthermore, despite progress in batteries, electric motors, and controllers; codes and standards development;
13
and development of supportive public policies, there remain significant barriers to their widespread commercialization and opportunities for supportive policies to be further developed. In essence, the market for PEVs remains unproven beyond a group of “early adopters” and much can still be done to improve the prospects for wider market.
The Current Setting for PEVs in California California has historically been a leader within the United States (U.S.) and globally in PEV development. This continues with ongoing “Zero Emission Vehicle” (ZEV) and “Low Carbon Fuel Standard” (LCFS) regulations—major efforts to require production low emission vehicles and fuels to meet state energy and environmental goals. Additional efforts include those to support and coordinate PEV infrastructure development, develop appropriate electric utility rates and related polices for PEVs, and support PEV commercialization in various other ways such as through carpool lane access.
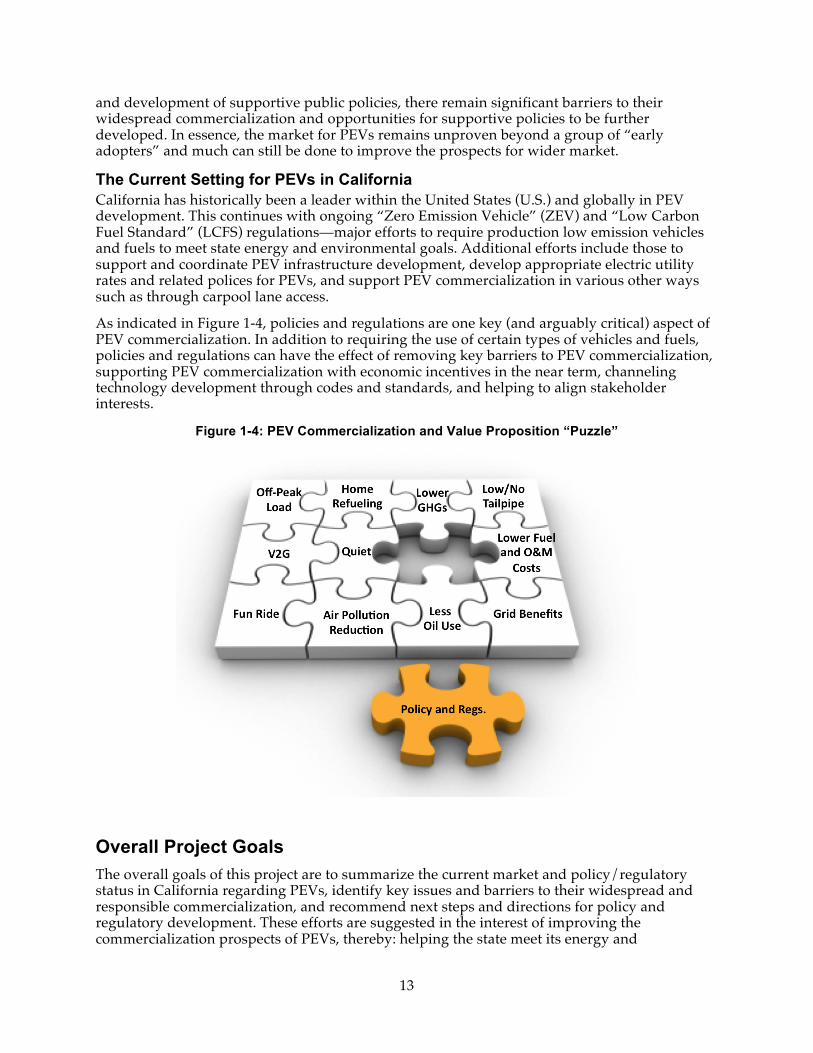
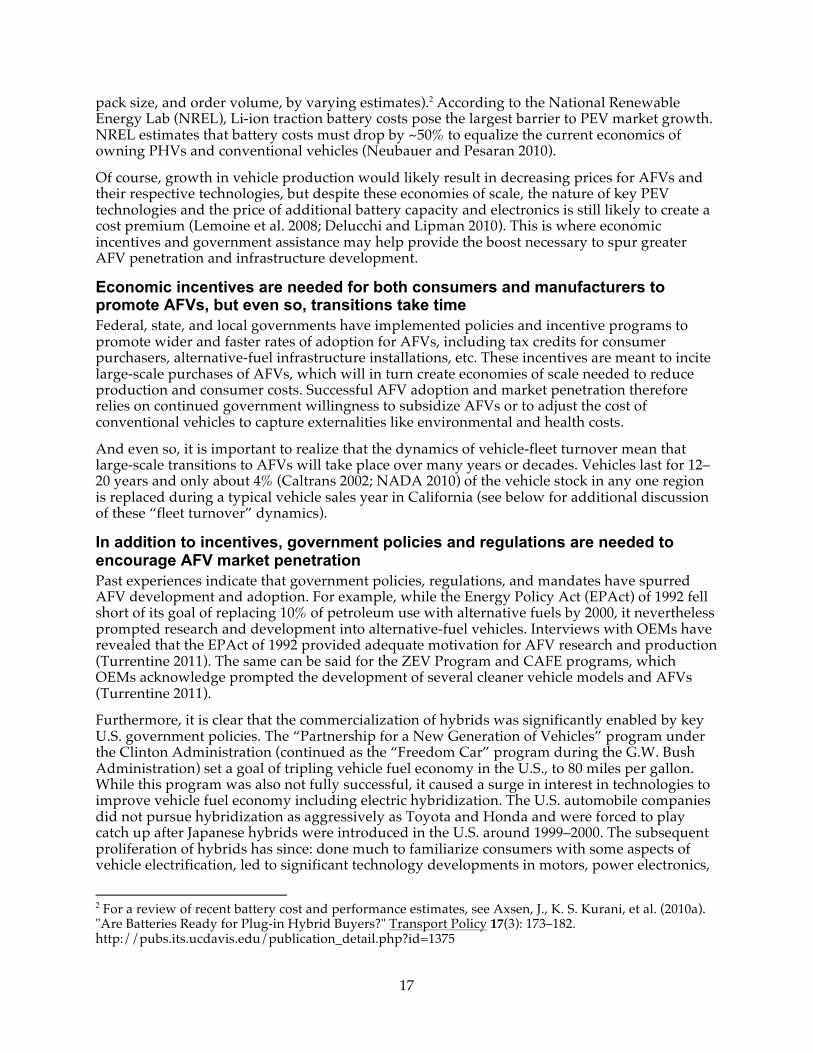
As indicated in Figure 1-4, policies and regulations are one key (and arguably critical) aspect of PEV commercialization. In addition to requiring the use of certain types of vehicles and fuels, policies and regulations can have the effect of removing key barriers to PEV commercialization, supporting PEV commercialization with economic incentives in the near term, channeling technology development through codes and standards, and helping to align stakeholder interests.
Figure 1-4: PEV Commercialization and Value Proposition “Puzzle”
Overall Project Goals The overall goals of this project are to summarize the current market and policy/regulatory status in California regarding PEVs, identify key issues and barriers to their widespread and responsible commercialization, and recommend next steps and directions for policy and regulatory development. These efforts are suggested in the interest of improving the commercialization prospects of PEVs, thereby: helping the state meet its energy and
14
environmental goals, providing economic vitality, and more generally helping the U.S. and the world evolve toward a more sustainable transportation future.
An additional goal of this report is to explore the argument that electricity used for PEVs should be monitored, tracked, and in various ways accounted for differently than electricity used for other uses. The use of electricity as a vehicle fuel, or “e-fuel,” is fundamentally different than electricity for almost all other uses. This stems from the fact that e-fuel substitutes directly for petroleum and thus has the effect of reducing emissions of greenhouse gases (GHGs) and other pollutants, whereas electricity for other uses typically increases pollution. Because California has an electricity grid that is based heavily on relatively modern natural gas power plants, and with an increasing share of renewable energy sources being incorporated, the use of e-fuel has greater benefits in California than in some other areas where the electricity grid is not as clean. This is a key reason for the state to encourage PEV commercialization, along with other benefits discussed here and elsewhere.
The report also summarizes the key outcomes of the June 15, 2011 “Electric-Fuel Scale-Up Workshop” held at UC Berkeley. Along with various other research efforts and expert interviews, the insights gained through the full-day workshop with key PEV stakeholders were helpful to achieving the above project objectives.
Report Organization This report is organized as follows. Chapter 2 discusses lessons learned from previous alternative-fuel vehicle commercialization efforts as well as the current policy and regulatory landscape for PEVs in California. Next, Chapter 3 examines past, present, and future PEV commercialization, including market penetration forecasts for PEVs in California and the U.S. Then, Chapter 4 explores the current understanding of the overall “PEV value proposition” including economic comparisons with conventional vehicles as well as environmental/energy and ”full social cost” comparisons. Chapter 5 presents key policy recommendations and overall conclusions.
The appendices include: A) a summary of the 15 June 2011 workshop in Berkeley, California that was hosted by UC Berkeley’s Transportation Sustainability Research Center (TSRC) as part of the overall research project; B) additional details on alternative-fuel vehicle commercialization efforts, C) a list of codes and standards related to automotive battery systems; D) a summary of the PEV market forecasts discussed in Chapter 3, and E) a description of select related activities.
15
CHAPTER 2: Lessons Learned and Current Policy/Regulatory Setting In order to fully understand the current regulatory and policy environment for PEVs, and the prospects for further development and improvement in these programs, it is important to examine past experiences and the series of developments that has led up to the current point. This chapter reviews lessons learned from previous experiences as well as the current status of the most important policies relevant for PEV commercialization.
Lessons Learned from Previous Alternative-Fuel Vehicle Efforts Efforts to introduce alternative fuel vehicles (AFVs)—including PEVs, fuel-cell electric vehicles (FCEVs), and natural gas vehicles (NGVs) have been underway for 20 plus years. These efforts have generated a spectrum of lessons learned about vehicle technologies, policy and incentive influences, deployment strategies, and public reception.
The following sections briefly summarize several of the key lessons learned that have emerged through commercialization experiences for several different AFVs, as they have been expressed in scholarly publications as well as in government reports and other sources. The appendices contain additional details of these previous AFV experiences.
The low price and convenient physical features of conventional fuels have made it difficult for AFVs to compete In the early 2000s, as the U.S. government evaluated progress toward alternative-fuel goals set by the Energy Policy Act of 1992, it became increasingly apparent that low gasoline prices limited consumer and commercial transitions to AFVs. A 2000 Government Accounting Office (GAO) report (GAO 2000) found that the U.S. had fallen short of its goal of replacing 10% of gasoline with alternative fuels, achieving only 3.5% alternative-fuel penetration by the target year 2000. The GAO report identified low gasoline prices as a key reason for this shortfall and cited an Energy Information Administration (EIA) prediction that, even with a doubling of the crude oil price, "alternative fuels' share of the market would not increase" since the cost of fuel is such a small fraction of the overall vehicle cost (p. 5).
In addition to its low cost, gasoline's physical properties have also contributed to its appeal as the primary transportation fuel. Gasoline is easy to store both at fueling stations and onboard vehicles, contrary to other alternative fuels. For example, hydrogen, natural gas, and batteries have high volume-to-energy ratios compared to gasoline. Thus, larger onboard tanks or other storage systems are required to provide adequate fuel for travel ranges comparable to those of conventional vehicles (DOE 2010b; 2010c).
The lack of alternative-fuel infrastructure has been a barrier to significant AFV market penetration As of the writing of this report, the U.S. Department of Energy's (DOE) Alternative Fuels and Advanced Vehicle Technology Data Center reports that there are approximately 8,300 alternative fueling stations nationwide, compared to ~160,000 to 165,000 conventional gasoline stations (DOE). This lack of AFV fueling infrastructure has and continues to make it difficult for consumers to choose AFVs over conventional cars and also provides little motivation for automakers to mass produce and market AFVs when there is not a significant consumer demand. To ameliorate problems with private capital investment and to create the stations necessary to spur greater consumer confidence, the federal government has offered tax credits for large NGV fueling equipment and stations. Under the Energy Policy Act of 2005, natural gas station developers could take credits for 30% of the cost of natural gas fueling equipment, up to
16
$30,000, and the American Recovery and Reinvestment Act of 2009 increased tax credits to 50% or $50,000.
Federal and state grant money has typically been used to help fund AFV fueling stations. For example, the California Energy Commission (CEC) has provided funding for the installation of about 3,900 new electric vehicle charging stations via Assembly Bill 118 (Baroody et al. 2010).Additionally, California's Motor Vehicle Registration Fee Program distributes revenues via local air districts for projects that reduce air pollution, including projects to develop AFV fueling stations (DOE 2010a).
Unlike natural gas and hydrogen fuels, the electricity system's infrastructure is ubiquitous throughout California, but while the basic electric fuel (e-fuel) distribution infrastructure thus largely exists, access, refueling, and billing for e-fuel is challenging. Most PEV charging is expected to occur at home, which may require homeowners to upgrade electrical wiring to enable safe and efficient charging. Some utilities offer (or have offered) discounted electricity rates for PEV charging, but eligibility for this incentive often requires homeowners to pay for and install separate meters to track electricity specifically used for charging. Additional “readiness” and installation costs, the potential for inconvenience, and customers' unfamiliarity with this arrangement have hindered PEV adoption.
To date, only a handful of public charging stations have been installed, making it difficult it for would-be PEV owners to justify purchasing PEVs if they cannot charge at home. To reconcile this, some utilities have experimented with public, sometimes high-power or “fast” charging stations. However, based on experiences from the 1990s, utilities found that public charging infrastructure was expensive, over-subsidized, and underused in most locations (Turrentine 2011). The same utilities also indicated that the cost of charging infrastructure in the 1990s was unnecessarily high because of "charging standard wars" that, in come cases, required utilities to install multiple types of chargers to accommodate different technologies (IEA 2010).
Charger costs were also an important barrier. In the 1990s, some inductive at-home chargers (not included in vehicle leases) cost ~$2,000 to purchase or ~$50 per month to lease (PRNewswire 1996). PEVs that used conductive charging included the Ford Ranger EV and the Honda EV Plus. The AVCON was the most commonly used conductive charger and costs ranged from $700 to $1,400 (CARB 2001).
The relatively higher first costs of AFVs creates a barrier to significant adoption and market growth PEVs have historically been considerably more expensive than comparable gasoline combustion vehicles, due mainly to the high cost of the battery power system, but also due to relatively high electric motor and power electronics costs in their earlier history (i.e., the early 1990s). These costs have come down considerably, as discussed further in Chapter 4 where various BEV and PHV manufacturing cost estimates are reviewed. Back in the 1990s, the DOE established a goal of $150 per kilowatt-hour (kWh) for advanced PEV batteries (then including nickel-metal-hydride, advanced-lead-acid, sodium-sulfur, and sodium-nickel-chloride types, among others, but not yet lithium-based batteries). This goal was not achieved for batteries that satisfied other key performance and durability criteria, however, thus limiting PEV commercialization due to relatively high costs (Walsh et al. 2007).
In modern PEVs using lithium-based batteries, greater battery and other components costs also increase PEV costs compared to conventional and hybrid-electric vehicles (see further discussion in Chapter 4). Battery technology has improved much in recent years in terms of performance, but costs remain relatively high (ranging from approximately $1,000 to $300 per kWh at present for battery systems, depending on battery chemistry and type, module capacity,
17
pack size, and order volume, by varying estimates).2 According to the National Renewable Energy Lab (NREL), Li-ion traction battery costs pose the largest barrier to PEV market growth. NREL estimates that battery costs must drop by ~50% to equalize the current economics of owning PHVs and conventional vehicles (Neubauer and Pesaran 2010).
Of course, growth in vehicle production would likely result in decreasing prices for AFVs and their respective technologies, but despite these economies of scale, the nature of key PEV technologies and the price of additional battery capacity and electronics is still likely to create a cost premium (Lemoine et al. 2008; Delucchi and Lipman 2010). This is where economic incentives and government assistance may help provide the boost necessary to spur greater AFV penetration and infrastructure development.
Economic incentives are needed for both consumers and manufacturers to promote AFVs, but even so, transitions take time Federal, state, and local governments have implemented policies and incentive programs to promote wider and faster rates of adoption for AFVs, including tax credits for consumer purchasers, alternative-fuel infrastructure installations, etc. These incentives are meant to incite large-scale purchases of AFVs, which will in turn create economies of scale needed to reduce production and consumer costs. Successful AFV adoption and market penetration therefore relies on continued government willingness to subsidize AFVs or to adjust the cost of conventional vehicles to capture externalities like environmental and health costs.
And even so, it is important to realize that the dynamics of vehicle-fleet turnover mean that large-scale transitions to AFVs will take place over many years or decades. Vehicles last for 12–20 years and only about 4% (Caltrans 2002; NADA 2010) of the vehicle stock in any one region is replaced during a typical vehicle sales year in California (see below for additional discussion of these “fleet turnover” dynamics).
In addition to incentives, government policies and regulations are needed to encourage AFV market penetration Past experiences indicate that government policies, regulations, and mandates have spurred AFV development and adoption. For example, while the Energy Policy Act (EPAct) of 1992 fell short of its goal of replacing 10% of petroleum use with alternative fuels by 2000, it nevertheless prompted research and development into alternative-fuel vehicles. Interviews with OEMs have revealed that the EPAct of 1992 provided adequate motivation for AFV research and production (Turrentine 2011). The same can be said for the ZEV Program and CAFE programs, which OEMs acknowledge prompted the development of several cleaner vehicle models and AFVs (Turrentine 2011).
Furthermore, it is clear that the commercialization of hybrids was significantly enabled by key U.S. government policies. The “Partnership for a New Generation of Vehicles” program under the Clinton Administration (continued as the “Freedom Car” program during the G.W. Bush Administration) set a goal of tripling vehicle fuel economy in the U.S., to 80 miles per gallon. While this program was also not fully successful, it caused a surge in interest in technologies to improve vehicle fuel economy including electric hybridization. The U.S. automobile companies did not pursue hybridization as aggressively as Toyota and Honda and were forced to play catch up after Japanese hybrids were introduced in the U.S. around 1999–2000. The subsequent proliferation of hybrids has since: done much to familiarize consumers with some aspects of vehicle electrification, led to significant technology developments in motors, power electronics,
2 For a review of recent battery cost and performance estimates, see Axsen, J., K. S. Kurani, et al. (2010a). "Are Batteries Ready for Plug-in Hybrid Buyers?" Transport Policy 17(3): 173–182. http://pubs.its.ucdavis.edu/publication_detail.php?id=1375
18
and battery systems, and helped to reduce the costs of these components through larger volumes in manufacturing.
There are additional types of policies, in addition to R&D support programs and direct vehicle purchases incentives that can also be effective stimulus for AFV commercialization. These include carpool lane access for certain types of AFVs, which have historically significantly increased the perceived and real value of hybrids in California.
The continued implementation of these types of policy programs and regulations will be important for continued growth in the AFV market. Currently, the Corporate Average Fuel Economy (CAFE), ZEV, and other national and statewide alternative-fuel and vehicle policies remain in place and new policies are being considered. For example, CARB is considering implementing a statewide "feebate" program, which is a revenue neutral program that would charge new car-buyers a fee for purchasing low gas-mileage vehicles and award a rebate for purchases of high gas-mileage vehicles. To date, it is unclear whether or not this program will be implemented, but it remains a possible future means for incentivizing and encouraging AFV production and adoption (see Chapter 5 for further discussion of this policy).
Demonstration, pilot, and fleet implementation of AFVs has historically had only limited impact on widespread deployment AFVs have been adopted at higher rates in demonstration and pilot projects and as fleet and government vehicles, but it's uncertain how or if these niche markets influence market-wide adoption. There are three key explanations for why there may be only a weak link between demonstration, pilot, and fleet deployments of AFVs and large-scale, mainstream adoption: 1) demonstration and pilot projects typically concentrate AFVs in certain areas, limiting more widespread public exposure (Zhao and Melaina 2006); 2) access to fleet and pilot vehicles and their fueling infrastructure is reserved for fleet drivers, which again, limits public experience with the vehicles; and 3) economics of fleet vehicles (typically higher mileage per year than privately-owned vehicles) are somewhat different that vehicles for broader household use.
But while some programs have not been designed with public exposure in mind, others have deliberately placed vehicles where a larger variety and number of people can see and drive them. For example, the University of California, Irvine (UCI) and Toyota jointly administer the Zero Emission Vehicle Network Enabled Transport (ZEV•NET) program, which allows Southern California commuters to drive BEVs from public transportation to their workplaces. The BEVs, Toyota RAV4-EVs, are charged while parked both at public transportation hubs, like rail stations, and at participating nearby workplaces. Once parked at workplaces, ZEV•NET vehicles can be reserved (online) for other trips throughout the day, allowing multiple people to experience the vehicles (Heling et al. 2008). Between 2003 and 2008, the ZEV•NET website recorded 20,461 vehicle reservations from 133 unique users, for a total of 63,344 vehicle-hours and 116,220 vehicle-miles traveled. The University of California, Riverside (UCR) administers a similar program, called Intellishare, which facilitates "smart" car sharing of Honda EV plus electric vehicles, building on previous work in collaboration with UC Berkeley and UC Davis (Shaheen et al. 2004).
Transitions to alternative fueled transportation systems will take time and may require the development and deployment of intermediate technologies Despite rapid improvements in technology, experts anticipate that transitioning to alternative fuels and vehicles will take several years, possibly decades. This is because of existing investments, “sunk costs,” and continual improvement in gasoline-based transportation systems. Also at play is still-developing public understanding and valuation of the preferential characteristics of AFVs (e.g., air quality improvements and greenhouse gas emissions reductions) and motor vehicle fleet turnover dynamics mentioned above (Sperling 1995). Previous experience indicates that intermediate strategies may be needed to meet short-term
19
pollution and greenhouse gas emission reduction goals while longer-term transitions are underway. These intermediate strategies should be designed to work in concert with fuel transition goals, and include efforts to improve transportation planning, expand transit systems, and increase conventional vehicle fuel efficiency while even more clean and efficient vehicle types are introduced (Zhao and Melaina 2006). Similarly, increasing differentiation between the commercialization process for plug-in gasoline hybrids and all-battery vehicles will likely become important (see Chapter 3).
Summary and conclusions of AFV lessons learned Lessons learned from previous experiences with AFVs show that infrastructure development, cost competitiveness with conventional vehicles, and public and governmental support are important for AFV market development. To supplant conventional vehicles that have had more than a century of improvement and refinement, AFVs must be significantly better in at least one key respect, and not significantly worse in any respect. Historically, AFVs of various types have all had key flaws—typically either related to their initial costs or their refueling characteristics—that have limited their commercial success. The main “success story” to date in the U.S. context is the relatively successful commercialization of hybrids, which have proliferated because they do not require a novel refueling infrastructure or changes in driver behavior and have also been supported by various government policies including purchase incentives and carpool lane access policies.
To address infrastructure development needs, past government efforts have focused on providing financial incentives for infrastructure, and it is likely that future AFV programs will also rely on these subsidies. Additionally, infrastructure development has also been influenced by good planning, both of the infrastructure system itself and of vehicle deployment projects and pilots. If vehicles are only used as fleet vehicles, it is unlikely that consumer demand will reach levels that result in high production and economies of scale. Related to cost competitiveness, past programs have focused on providing rebates, tax credits, and other incentives (HOV stickers, insurance discounts, etc.) to bring down the capital and fuel costs of AFVs and increase their convenience. In the past, however, these incentives have not been significant enough to successfully overcome higher AFV costs, behavioral change, inconvenience, and anxieties that come with AFV adoption. In the future, governments and consumers will likely have to shift their perceptions and valuations of the environmental and social benefits of AFVs before significant market penetration can be achieved.
Current Policy and Regulatory Context The Zero Emission Vehicle regulation Background The California Air Resources Board (CARB) adopted the Zero Emission Vehicle (ZEV) Regulation in 1990. The purpose of the regulation was twofold: (1) to improve air quality by reducing vehicle emissions of criteria pollutants and (2) to push the development of ZEV technology and commercial-scale deployment of ZEVs. The 1990 regulation required that, in 1998, ZEVs compose 2% of the vehicles produced by large manufacturers for sale in California. For 2001 and 2003, this requirement increased to 5% and 10% respectively (CARB 2010a).
Since 1990, ZEV regulations have been adjusted to make targets more attainable. In 1996, interim goals for 1998 and 2001 were eliminated, though the 10% by 2003 requirement remained in place. Then, in 1998, partial ZEV (PZEV) credits were awarded for extremely clean but not zero emission vehicles. The ZEV regulation was again amended in 2001 to allow large manufacturers to meet the 2003 10% ZEV requirement goal with 2% pure ZEVs, 2% Advanced Technology (AT) PZEVs (including hybrids and NGVs), and 6% PZEVs (conventional yet extremely clean vehicles) (CARB 2010a).
20
ZEV regulation and GHG emissions reductions In 2007, CARB staff proposed adjusting the ZEV regulation for 2009 and subsequent model years in order to incorporate statewide greenhouse gas (GHG) emissions reductions set by Governor Schwarzenegger’s 2005 Executive Order S-3-05 and the 2006 Global Warming Solutions Act, instituted by Assembly Bill 32 (hence the common reference to the law as “AB 32”). In the subsequent 2009 ZEV Review, CARB staff found that future ZEV commercialization is necessary to meet the AB 32 goal of reducing GHG to 1990 levels by 2020 and the Governor's target cutting GHG emissions to 80% below 1990 levels by 2050 (CARB 2009e). As a result of this finding, CARB staff recommended, and the Board ultimately adopted, the following (CARB 2009b):
(1) Shift the focus of the ZEV program from only criteria pollutants emission reductions to both criteria pollutants and GHG emission reductions.
(2) Phase PZEVs and AT PZEVs out of ZEV regulation by 2014 and 2017 respectively in order to focus on incubating PHV and pure ZEVs for large-scale market penetration, which modeling shows will be necessary for achieving current 2020 and 2050 GHG emission reduction goals.
Under these proposed changes, PHVs are referred to as transitional zero emissions vehicles, or TZEVs, since they are not pure ZEVs but nevertheless combine battery-electric and hybrid technology to significantly reduce criteria pollutant and GHG emissions.
In addition to suggesting these changes to ZEV regulation, CARB has also proposed uniting the ZEV program with the agency's smog and GHG emissions regulation programs (the latter began with AB 1493, also known as the Pavley Clean Car Standards). The resulting, overarching program, called Advanced Clean Cars, would coordinate all three programs via the package of standards being designed for the new Low-Emissions Vehicle Program, or LEV-III (CARB 2011).
Meeting future GHG goals with ZEV regulation As mentioned, CARB's 2009 ZEV Review found that significant market growth in ZEVs will be necessary to meet AB 32 goals for 2020 and the Governor's Executive Order goals for 2050. To estimate the fleet size and growth rate of the ZEVs required to meet these goals, CARB developed two possible future scenarios for California. In Scenario 1, the state reduces statewide GHG emissions to 66% below 1990 levels by 2050, ZEV sales reach ~250,000 units per year by 2025, and 100% of new vehicle sales are ZEVs by 2050. In Scenario 2, the state achieves an 80% reduction (below 1990 levels) by 2050, and achieves this with a faster rate of ZEV adoption—annual ZEV sales reach ~500,000 units by 2025 and make up 100% of new vehicles sales by 2040.
Table 2-1 and Figure 2-1 show how these scenarios could translate to ZEV Regulation compliance for the 2015 to 2025 timeframe. These goal-based, back-casting projections are important to consider when analyzing future trajectories for AFV and electric-fuel scale-up. See "Review of EV Market Forecasts" in Chapter 3 for additional information on CARB's ZEV market predictions and other market forecasts from industry, government, and academia.
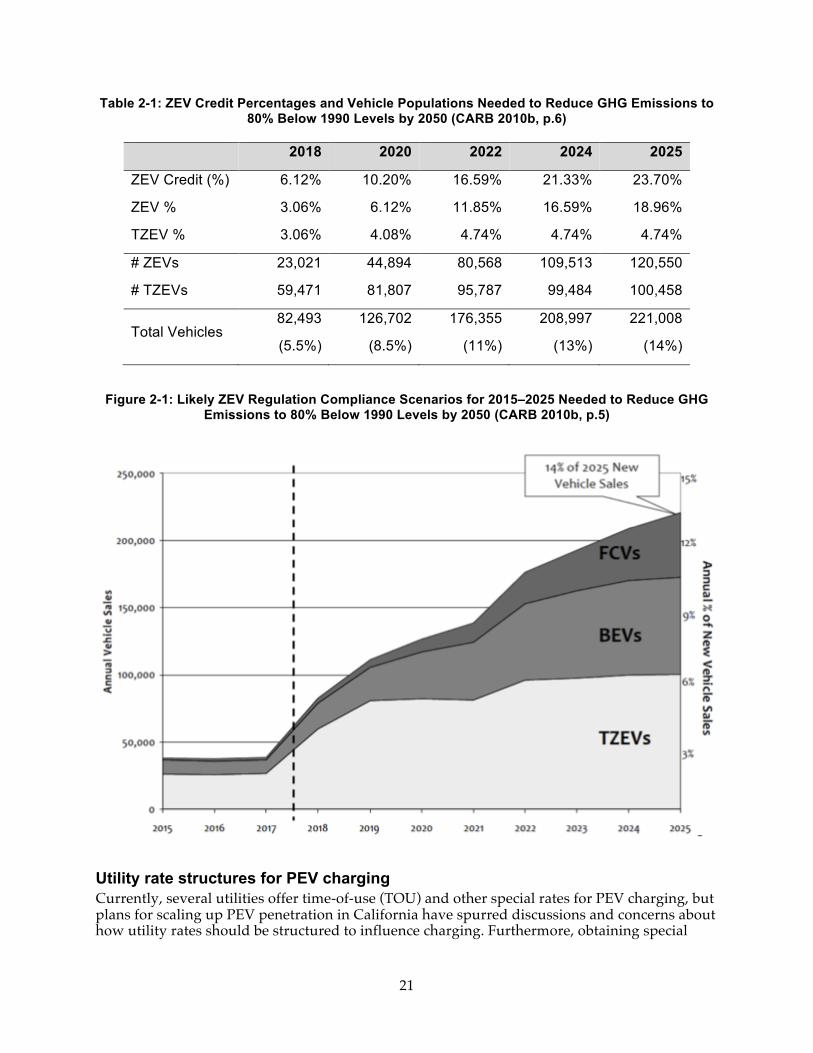
21
Table 2-1: ZEV Credit Percentages and Vehicle Populations Needed to Reduce GHG Emissions to 80% Below 1990 Levels by 2050 (CARB 2010b, p.6)
2018 2020 2022 2024 2025
ZEV Credit (%) 6.12% 10.20% 16.59% 21.33% 23.70%
ZEV % 3.06% 6.12% 11.85% 16.59% 18.96%
TZEV % 3.06% 4.08% 4.74% 4.74% 4.74%
# ZEVs 23,021 44,894 80,568 109,513 120,550
# TZEVs 59,471 81,807 95,787 99,484 100,458
Total Vehicles 82,493
(5.5%)
126,702
(8.5%)
176,355
(11%)
208,997
(13%)
221,008
(14%)
Figure 2-1: Likely ZEV Regulation Compliance Scenarios for 2015–2025 Needed to Reduce GHG Emissions to 80% Below 1990 Levels by 2050 (CARB 2010b, p.5)
Utility rate structures for PEV charging Currently, several utilities offer time-of-use (TOU) and other special rates for PEV charging, but plans for scaling up PEV penetration in California have spurred discussions and concerns about how utility rates should be structured to influence charging. Furthermore, obtaining special
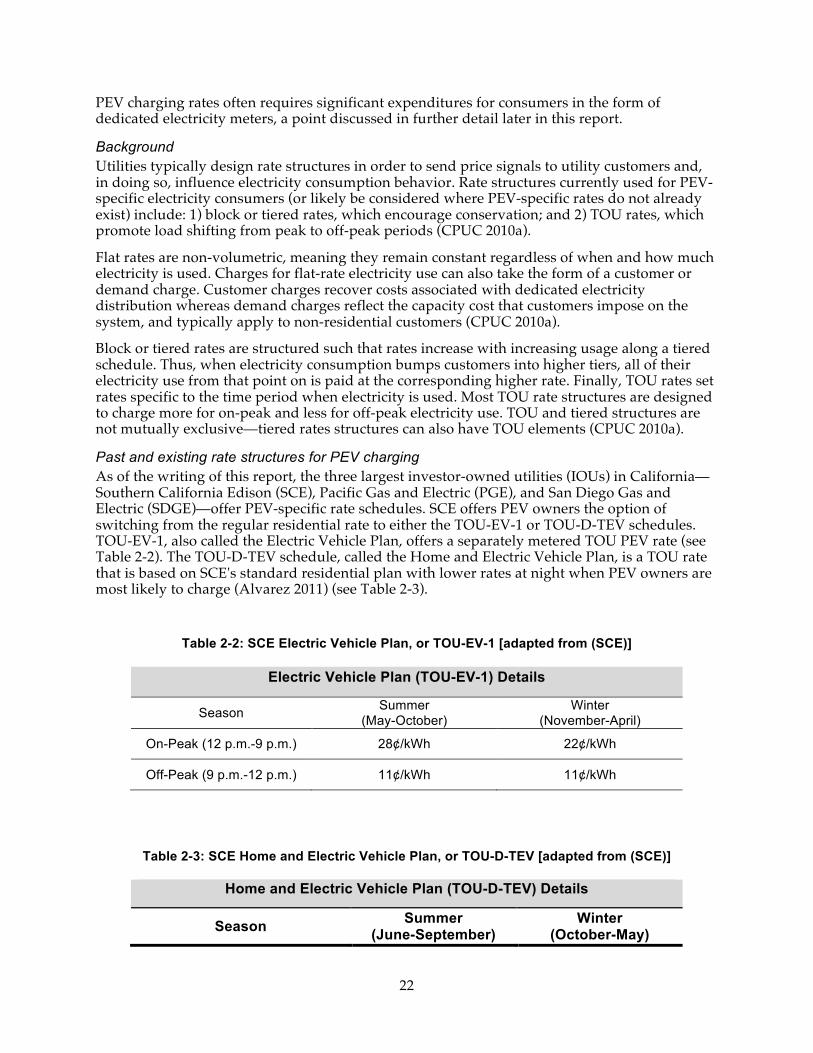
22
PEV charging rates often requires significant expenditures for consumers in the form of dedicated electricity meters, a point discussed in further detail later in this report.
Background Utilities typically design rate structures in order to send price signals to utility customers and, in doing so, influence electricity consumption behavior. Rate structures currently used for PEV-specific electricity consumers (or likely be considered where PEV-specific rates do not already exist) include: 1) block or tiered rates, which encourage conservation; and 2) TOU rates, which promote load shifting from peak to off-peak periods (CPUC 2010a).
Flat rates are non-volumetric, meaning they remain constant regardless of when and how much electricity is used. Charges for flat-rate electricity use can also take the form of a customer or demand charge. Customer charges recover costs associated with dedicated electricity distribution whereas demand charges reflect the capacity cost that customers impose on the system, and typically apply to non-residential customers (CPUC 2010a).
Block or tiered rates are structured such that rates increase with increasing usage along a tiered schedule. Thus, when electricity consumption bumps customers into higher tiers, all of their electricity use from that point on is paid at the corresponding higher rate. Finally, TOU rates set rates specific to the time period when electricity is used. Most TOU rate structures are designed to charge more for on-peak and less for off-peak electricity use. TOU and tiered structures are not mutually exclusive—tiered rates structures can also have TOU elements (CPUC 2010a).
Past and existing rate structures for PEV charging As of the writing of this report, the three largest investor-owned utilities (IOUs) in California—Southern California Edison (SCE), Pacific Gas and Electric (PGE), and San Diego Gas and Electric (SDGE)—offer PEV-specific rate schedules. SCE offers PEV owners the option of switching from the regular residential rate to either the TOU-EV-1 or TOU-D-TEV schedules. TOU-EV-1, also called the Electric Vehicle Plan, offers a separately metered TOU PEV rate (see Table 2-2). The TOU-D-TEV schedule, called the Home and Electric Vehicle Plan, is a TOU rate that is based on SCE's standard residential plan with lower rates at night when PEV owners are most likely to charge (Alvarez 2011) (see Table 2-3).
Table 2-2: SCE Electric Vehicle Plan, or TOU-EV-1 [adapted from (SCE)]
Electric Vehicle Plan (TOU-EV-1) Details
Season Summer (May-October)
Winter (November-April)
On-Peak (12 p.m.-9 p.m.) 28¢/kWh 22¢/kWh
Off-Peak (9 p.m.-12 p.m.) 11¢/kWh 11¢/kWh
Table 2-3: SCE Home and Electric Vehicle Plan, or TOU-D-TEV [adapted from (SCE)]
Home and Electric Vehicle Plan (TOU-D-TEV) Details
Season Summer (June-September)
Winter (October-May)
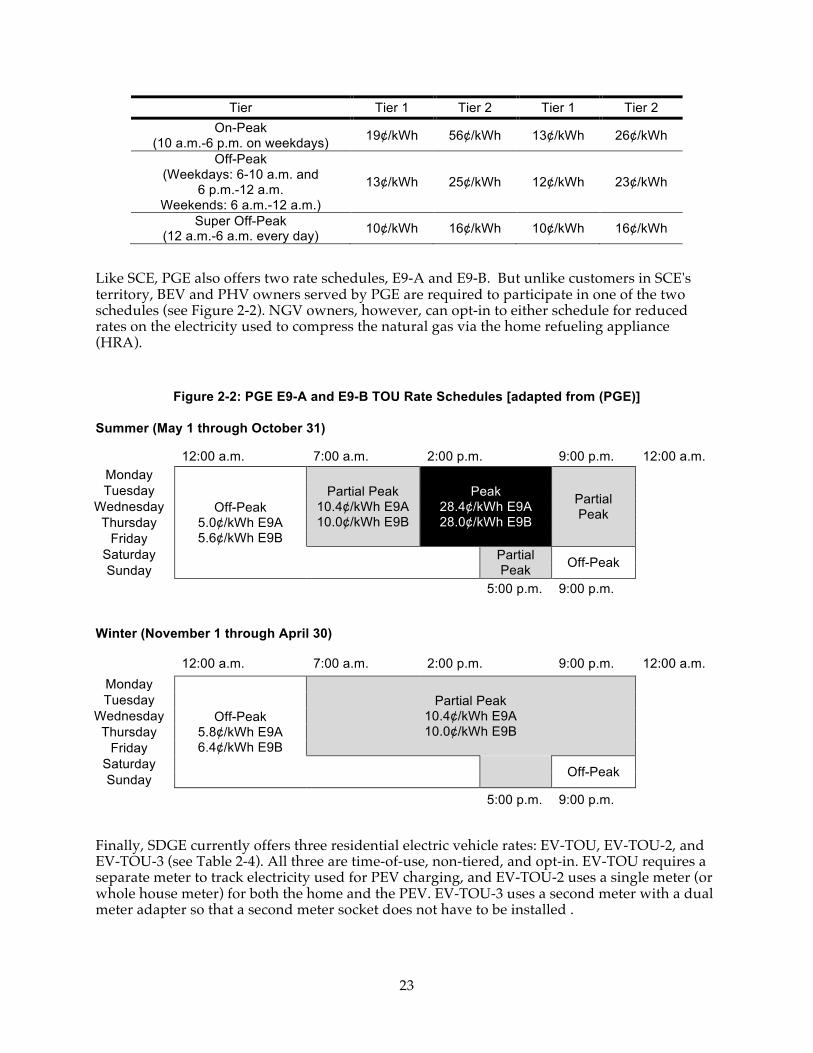
23
Tier Tier 1 Tier 2 Tier 1 Tier 2 On-Peak
(10 a.m.-6 p.m. on weekdays) 19¢/kWh 56¢/kWh 13¢/kWh 26¢/kWh
Off-Peak (Weekdays: 6-10 a.m. and
6 p.m.-12 a.m. Weekends: 6 a.m.-12 a.m.)
13¢/kWh 25¢/kWh 12¢/kWh 23¢/kWh
Super Off-Peak (12 a.m.-6 a.m. every day) 10¢/kWh 16¢/kWh 10¢/kWh 16¢/kWh
Like SCE, PGE also offers two rate schedules, E9-A and E9-B. But unlike customers in SCE's territory, BEV and PHV owners served by PGE are required to participate in one of the two schedules (see Figure 2-2). NGV owners, however, can opt-in to either schedule for reduced rates on the electricity used to compress the natural gas via the home refueling appliance (HRA).
Figure 2-2: PGE E9-A and E9-B TOU Rate Schedules [adapted from (PGE)]
Summer (May 1 through October 31)
12:00 a.m. 7:00 a.m. 2:00 p.m. 9:00 p.m. 12:00 a.m. Monday
Off-Peak 5.0¢/kWh E9A 5.6¢/kWh E9B
Partial Peak 10.4¢/kWh E9A 10.0¢/kWh E9B
Peak 28.4¢/kWh E9A 28.0¢/kWh E9B
Partial Peak
Tuesday
Wednesday Thursday
Friday Saturday Partial
Peak Off-Peak Sunday
5:00 p.m. 9:00 p.m.
Winter (November 1 through April 30)
12:00 a.m. 7:00 a.m. 2:00 p.m. 9:00 p.m. 12:00 a.m. Monday
Off-Peak 5.8¢/kWh E9A 6.4¢/kWh E9B
Partial Peak 10.4¢/kWh E9A 10.0¢/kWh E9B
Tuesday
Wednesday Thursday
Friday Saturday Off-Peak Sunday
5:00 p.m. 9:00 p.m.
Finally, SDGE currently offers three residential electric vehicle rates: EV-TOU, EV-TOU-2, and EV-TOU-3 (see Table 2-4). All three are time-of-use, non-tiered, and opt-in. EV-TOU requires a separate meter to track electricity used for PEV charging, and EV-TOU-2 uses a single meter (or whole house meter) for both the home and the PEV. EV-TOU-3 uses a second meter with a dual meter adapter so that a second meter socket does not have to be installed .
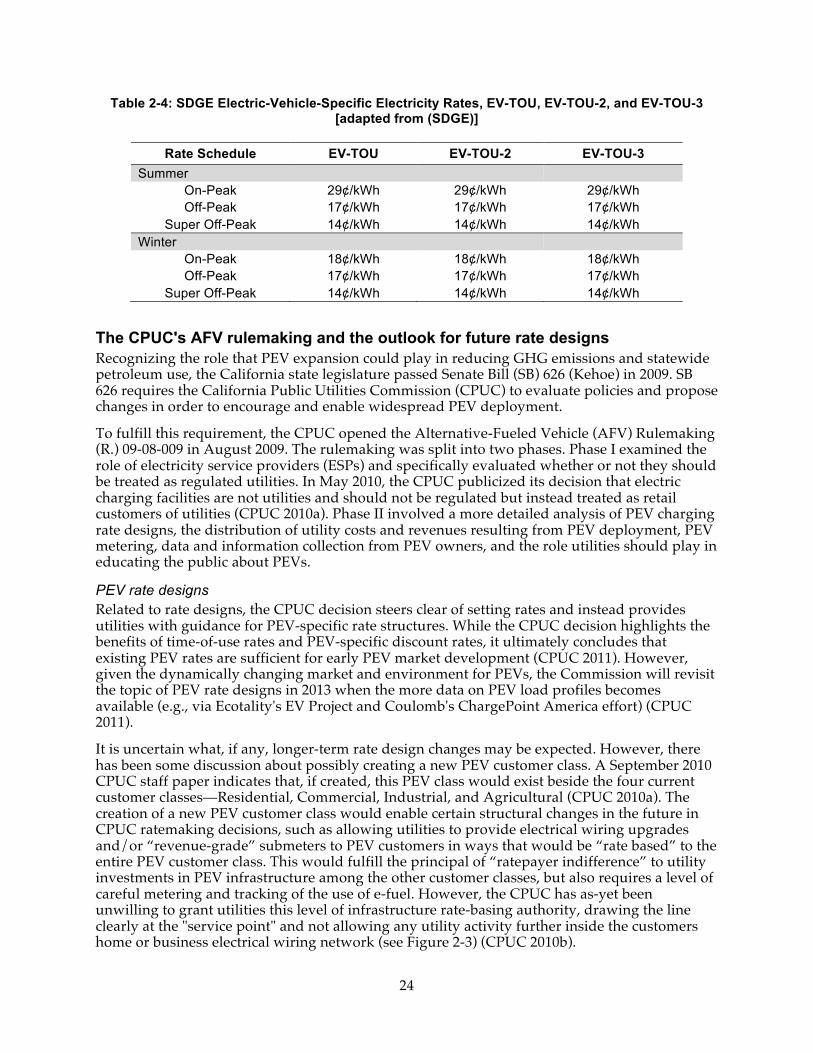
24
Table 2-4: SDGE Electric-Vehicle-Specific Electricity Rates, EV-TOU, EV-TOU-2, and EV-TOU-3 [adapted from (SDGE)]
Rate Schedule EV-TOU EV-TOU-2 EV-TOU-3 Summer
On-Peak 29¢/kWh 29¢/kWh 29¢/kWh Off-Peak 17¢/kWh 17¢/kWh 17¢/kWh
Super Off-Peak 14¢/kWh 14¢/kWh 14¢/kWh Winter
On-Peak 18¢/kWh 18¢/kWh 18¢/kWh Off-Peak 17¢/kWh 17¢/kWh 17¢/kWh
Super Off-Peak 14¢/kWh 14¢/kWh 14¢/kWh
The CPUC's AFV rulemaking and the outlook for future rate designs Recognizing the role that PEV expansion could play in reducing GHG emissions and statewide petroleum use, the California state legislature passed Senate Bill (SB) 626 (Kehoe) in 2009. SB 626 requires the California Public Utilities Commission (CPUC) to evaluate policies and propose changes in order to encourage and enable widespread PEV deployment.
To fulfill this requirement, the CPUC opened the Alternative-Fueled Vehicle (AFV) Rulemaking (R.) 09-08-009 in August 2009. The rulemaking was split into two phases. Phase I examined the role of electricity service providers (ESPs) and specifically evaluated whether or not they should be treated as regulated utilities. In May 2010, the CPUC publicized its decision that electric charging facilities are not utilities and should not be regulated but instead treated as retail customers of utilities (CPUC 2010a). Phase II involved a more detailed analysis of PEV charging rate designs, the distribution of utility costs and revenues resulting from PEV deployment, PEV metering, data and information collection from PEV owners, and the role utilities should play in educating the public about PEVs.
PEV rate designs Related to rate designs, the CPUC decision steers clear of setting rates and instead provides utilities with guidance for PEV-specific rate structures. While the CPUC decision highlights the benefits of time-of-use rates and PEV-specific discount rates, it ultimately concludes that existing PEV rates are sufficient for early PEV market development (CPUC 2011). However, given the dynamically changing market and environment for PEVs, the Commission will revisit the topic of PEV rate designs in 2013 when the more data on PEV load profiles becomes available (e.g., via Ecotality's EV Project and Coulomb's ChargePoint America effort) (CPUC 2011).
It is uncertain what, if any, longer-term rate design changes may be expected. However, there has been some discussion about possibly creating a new PEV customer class. A September 2010 CPUC staff paper indicates that, if created, this PEV class would exist beside the four current customer classes—Residential, Commercial, Industrial, and Agricultural (CPUC 2010a). The creation of a new PEV customer class would enable certain structural changes in the future in CPUC ratemaking decisions, such as allowing utilities to provide electrical wiring upgrades and/or “revenue-grade” submeters to PEV customers in ways that would be “rate based” to the entire PEV customer class. This would fulfill the principal of “ratepayer indifference” to utility investments in PEV infrastructure among the other customer classes, but also requires a level of careful metering and tracking of the use of e-fuel. However, the CPUC has as-yet been unwilling to grant utilities this level of infrastructure rate-basing authority, drawing the line clearly at the "service point" and not allowing any utility activity further inside the customers home or business electrical wiring network (see Figure 2-3) (CPUC 2010b).
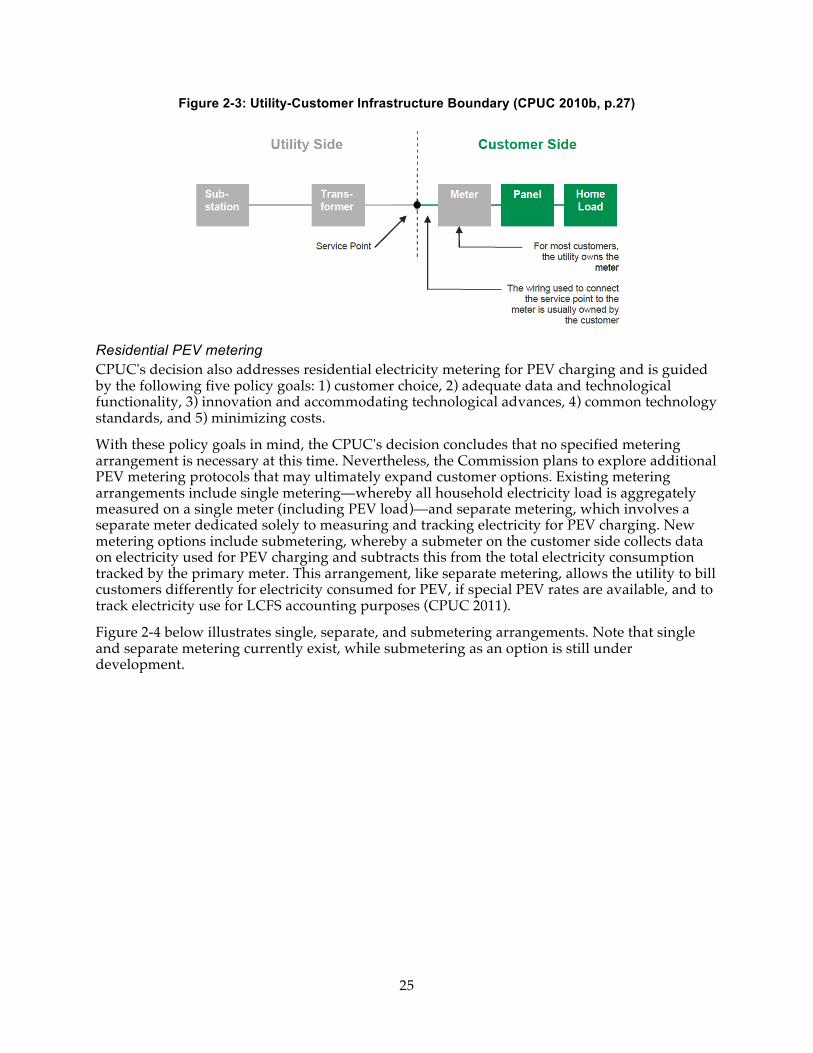
25
Figure 2-3: Utility-Customer Infrastructure Boundary (CPUC 2010b, p.27)
Residential PEV metering CPUC's decision also addresses residential electricity metering for PEV charging and is guided by the following five policy goals: 1) customer choice, 2) adequate data and technological functionality, 3) innovation and accommodating technological advances, 4) common technology standards, and 5) minimizing costs.
With these policy goals in mind, the CPUC's decision concludes that no specified metering arrangement is necessary at this time. Nevertheless, the Commission plans to explore additional PEV metering protocols that may ultimately expand customer options. Existing metering arrangements include single metering—whereby all household electricity load is aggregately measured on a single meter (including PEV load)—and separate metering, which involves a separate meter dedicated solely to measuring and tracking electricity for PEV charging. New metering options include submetering, whereby a submeter on the customer side collects data on electricity used for PEV charging and subtracts this from the total electricity consumption tracked by the primary meter. This arrangement, like separate metering, allows the utility to bill customers differently for electricity consumed for PEV, if special PEV rates are available, and to track electricity use for LCFS accounting purposes (CPUC 2011).
Figure 2-4 below illustrates single, separate, and submetering arrangements. Note that single and separate metering currently exist, while submetering as an option is still under development.
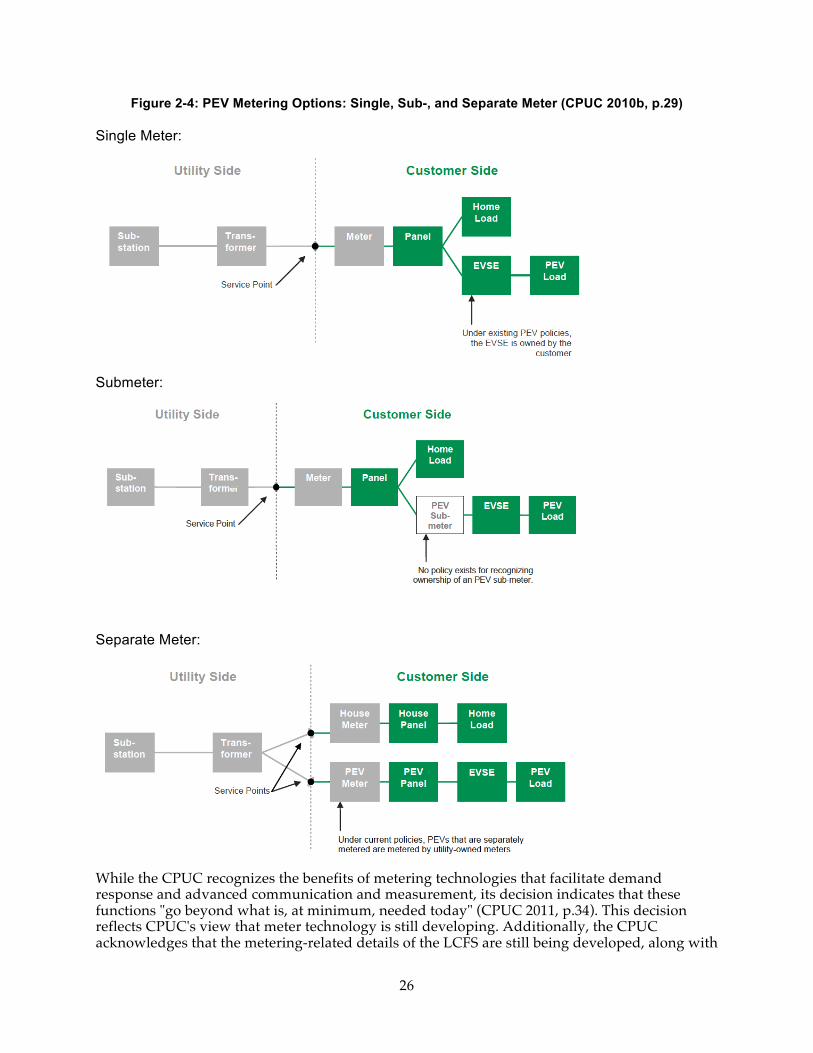
26
Figure 2-4: PEV Metering Options: Single, Sub-, and Separate Meter (CPUC 2010b, p.29)
Single Meter:
Submeter:
Separate Meter:
While the CPUC recognizes the benefits of metering technologies that facilitate demand response and advanced communication and measurement, its decision indicates that these functions "go beyond what is, at minimum, needed today" (CPUC 2011, p.34). This decision reflects CPUC's view that meter technology is still developing. Additionally, the CPUC acknowledges that the metering-related details of the LCFS are still being developed, along with
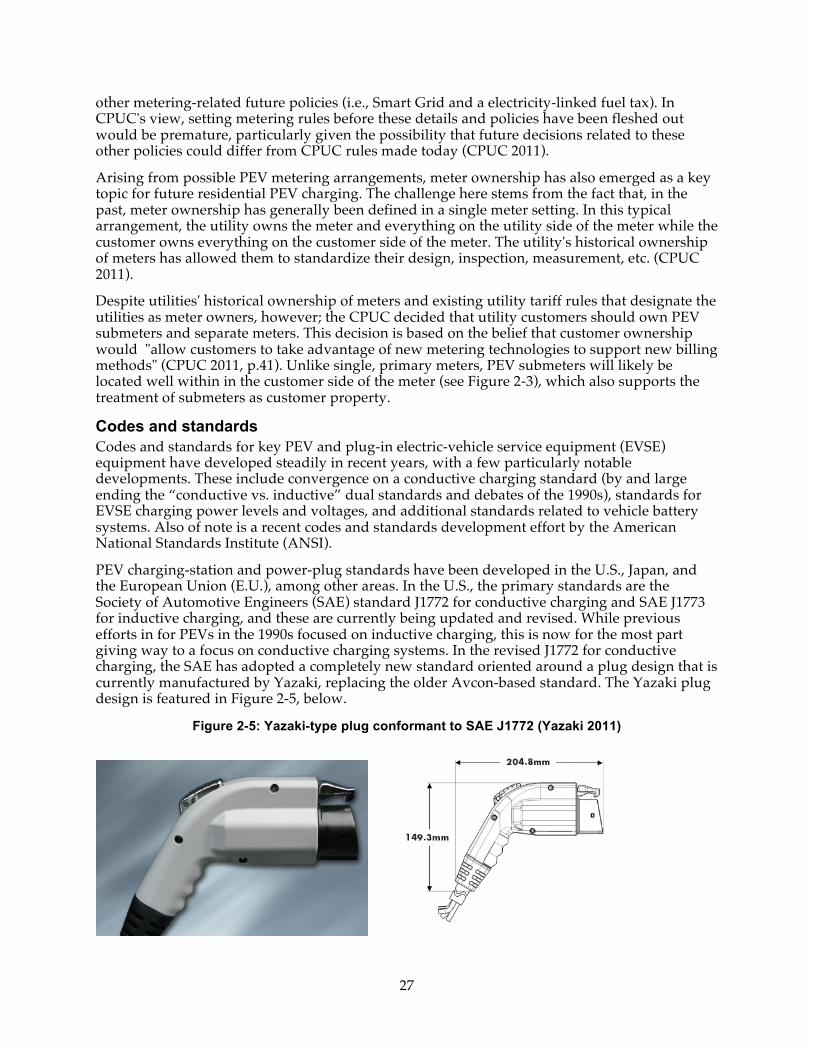
27
other metering-related future policies (i.e., Smart Grid and a electricity-linked fuel tax). In CPUC's view, setting metering rules before these details and policies have been fleshed out would be premature, particularly given the possibility that future decisions related to these other policies could differ from CPUC rules made today (CPUC 2011).
Arising from possible PEV metering arrangements, meter ownership has also emerged as a key topic for future residential PEV charging. The challenge here stems from the fact that, in the past, meter ownership has generally been defined in a single meter setting. In this typical arrangement, the utility owns the meter and everything on the utility side of the meter while the customer owns everything on the customer side of the meter. The utility's historical ownership of meters has allowed them to standardize their design, inspection, measurement, etc. (CPUC 2011).
Despite utilities' historical ownership of meters and existing utility tariff rules that designate the utilities as meter owners, however; the CPUC decided that utility customers should own PEV submeters and separate meters. This decision is based on the belief that customer ownership would "allow customers to take advantage of new metering technologies to support new billing methods" (CPUC 2011, p.41). Unlike single, primary meters, PEV submeters will likely be located well within in the customer side of the meter (see Figure 2-3), which also supports the treatment of submeters as customer property.
Codes and standards Codes and standards for key PEV and plug-in electric-vehicle service equipment (EVSE) equipment have developed steadily in recent years, with a few particularly notable developments. These include convergence on a conductive charging standard (by and large ending the “conductive vs. inductive” dual standards and debates of the 1990s), standards for EVSE charging power levels and voltages, and additional standards related to vehicle battery systems. Also of note is a recent codes and standards development effort by the American National Standards Institute (ANSI).
PEV charging-station and power-plug standards have been developed in the U.S., Japan, and the European Union (E.U.), among other areas. In the U.S., the primary standards are the Society of Automotive Engineers (SAE) standard J1772 for conductive charging and SAE J1773 for inductive charging, and these are currently being updated and revised. While previous efforts in for PEVs in the 1990s focused on inductive charging, this is now for the most part giving way to a focus on conductive charging systems. In the revised J1772 for conductive charging, the SAE has adopted a completely new standard oriented around a plug design that is currently manufactured by Yazaki, replacing the older Avcon-based standard. The Yazaki plug design is featured in Figure 2-5, below.
Figure 2-5: Yazaki-type plug conformant to SAE J1772 (Yazaki 2011)
28
The Yazaki-type plug is rated for voltages of up to 300 volts (V), meaning it is suitable for Level 1–2+ charging (see below). It has recently been improved to allow for up to 75 amperes (A) of current, or up to 18 kW at 240 V. A higher-voltage Level 3 standard for 480 V has yet to be fully adopted, although there is a plug design with power handling capability of up to 50 kW by TEPCO/CHAdeMO in Japan and a proposed J1772 “Hybrid” design for use in the U.S. See the figure below for a summary of the current status of international charge plug standards (Francfort 2010). The J1772 plug design is compliant with the JARI (Japanese) and IEC 62196 (under development for Europe) standards as well as being Underwriter Laboratories certified. It is rated for 10,000 coupling cycles (Yazaki 2011).
Also notably, the conventions for charging levels for electric vehicles have now been defined as follows in the U.S. under SAE J1772:
Level 1: 120 V alternating current (AC), 12 A, 1.44 kVA, 60 Hertz (Hz), single-phase, NEMA 5–15R plug standard. Requires 12-A maximum continuous current with 15-A (minimum) branch circuit protection.
Level 2: 208/240 VAC, 15 to 75 A, 3.2/6.7/18 kVA, 60 Hz, single-phase, SAE J1772/3 plug standard. Required safety features include grounding or electrical isolation, personnel protection from shock, a no-load make/break interlock, and a safety breakaway for the cable and connector.
Level 2+: Likely to emerge in a revised SAE J1772, this would be similar to the current Level 2 but with higher current levels for fast charging—up to 400 A at 240 VAC.
Level 3: 480 VAC, up to 400 A, 192 kVA, 60 Hz, three-phase, no plug standard yet. Same safety features required as Level 2.
In general, a modified plug is considered desirable even for Level 1 charging, as the traditional three-prong plug with exposed conductors is considered potentially somewhat hazardous for routine outdoor usage in inclement weather. The Yazaki design offers recessed conductors, with greater safety.
Also noteworthy is a recent effort to more fully develop codes and standards for PEVs and EVSE by ANSI. This “ANSI Electric Vehicle Standards Panel” effort is recently underway (in mid-2011) and has a stated objective as follows (ANSI 2011, p.1).
“The ANSI Electric Vehicles Standards Panel (EVSP) is a cross-sector coordinating body whose objective is to foster coordination and collaboration on standardization matters among public and private sector stakeholders to enable the safe, mass deployment of electric vehicles and associated infrastructure in the United States with international coordination, adaptability, and engagement.”
The ANSI EVSP consists of partner groups organized into the following working groups:
• Vehicle domain o Energy storage systems o Vehicle components o Vehicle user interface
• Infrastructure domain
o Charging systems o Infrastructure communications
29
o Infrastructure installation o Infrastructure user interface
• Support services domain
o Education and Training
Key members of the ANSI effort include representatives from SAE International, the National Fire Protection Association, the National Institute of Standards and Technology, Institute of Electrical and Electronics Engineers, the Electric Power Research Institute, various electric utility groups, automakers, PEV equipment manufacturers, and PEV service providers (ANSI 2011).
There is in fact a long list of U.S. and international battery standards for automotive applications, including SAE J1772 and J1773, many of which are available through SAE and other organizations. These include standards for performance and life testing (including abuse testing), environmental practices, battery packaging, performance rating, and monitoring/CAN-BUS interaction. In fact, there are a sufficient number of “standards” such that there are in some cases multiple competing standards in the international context, and this is the subject of continuing research and codes and standards development activities among SAE, IEEE, ISO, ANSI, and other groups. An additional issue is that there has been discussion fo additional standardization around EV battery form factors for battery module design (akin for example to the “18650” design for portable applications), but this remains a relatively undefined area in the context of the “larger format” batteries that are best used in EVs. A list of relevant standards for automotive batteries is presented in the appendices.
What these various codes and standards development efforts demonstrate is that much progress has been made in this area in recent years, particularly with regard to vehicle charging systems. However, additional codes and standards development, particularly around standardized form factors for PEV battery systems, could be beneficial in various ways. These include enhanced opportunities for economies of scale in cost reduction, potential better facilitation of battery recycling facility development and operations, and potentially enhanced opportunities for secondary-use of PEV batteries in grid support applications.
The Low Carbon Fuel Standard In January 2007, Governor Schwarzenegger signed Executive Order S-1-07, the Low Carbon Fuel Standard (LCFS). The broad goal of the LCFS is to reduce GHGs from California's transportation sector by focusing on lowering the “carbon content” of transportation fuels and by diversifying the state's transportation fuels portfolio (Crane and Prusnek 2007). To achieve this, the Order requires a 10% reduction in the carbon intensity of California's transportation fuels by 2020. Additional reductions beyond that point are yet to be determined.
The LCFS requires fuel providers to sell a mix of fuels in California characterized by declining GHG emissions intensity measured in grams of carbon-dioxide-equivalent (gCO2e) emitted per unit of fuel energy produced. The LCFS requires that these measurements include fuel-cycle emissions, meaning that total emissions include those emitted via fuel consumption and fuel production, or "upstream" emissions (Crane and Prusnek 2007). The LCFS utilizes market-based mechanisms to encourage lowest cost methods for cutting GHG emissions. For example, fuel providers can meet LCFS requirements by blending low-carbon ethanol into gasoline, purchasing credits from electric utilities that supply electric fuel for PEVs, or selling low-carbon hydrogen fuel (Crane and Prusnek 2007).
Electric fuel and the LCFS In the near-term, fuel providers are expected to comply with the LCFS by blending biofuels, like ethanol, into conventional liquid fuels. This is because vehicle fleet turnover is relatively slow,
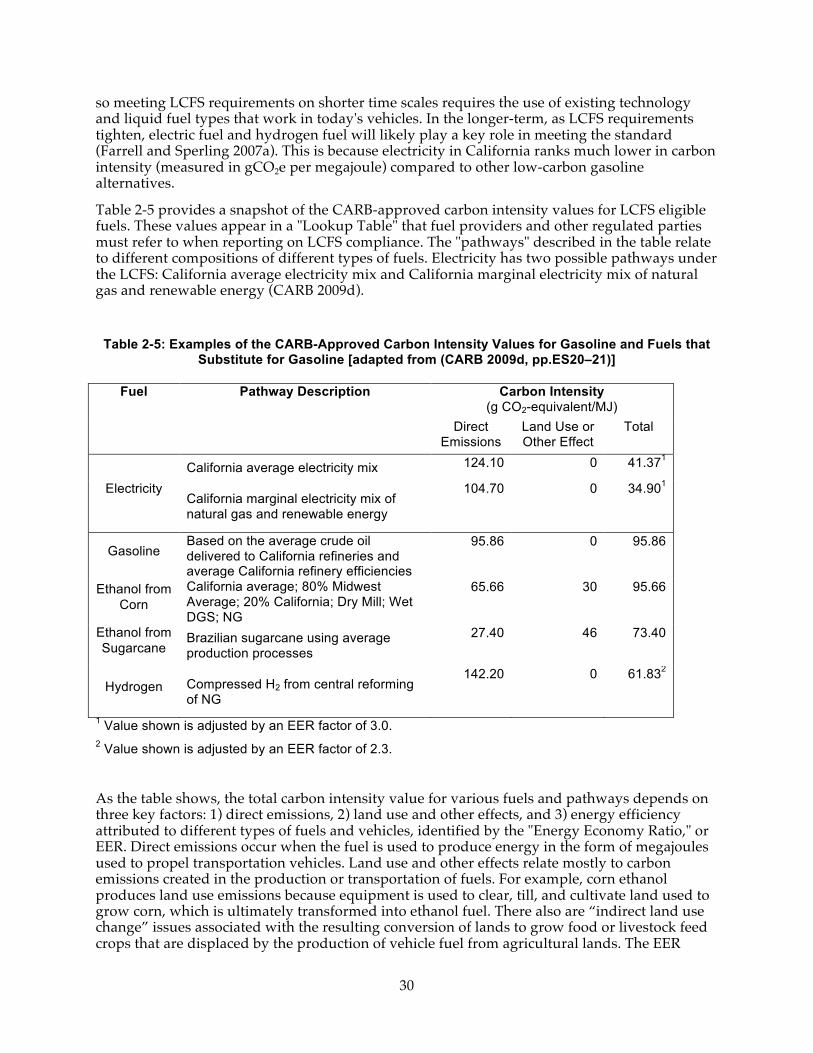
30
so meeting LCFS requirements on shorter time scales requires the use of existing technology and liquid fuel types that work in today's vehicles. In the longer-term, as LCFS requirements tighten, electric fuel and hydrogen fuel will likely play a key role in meeting the standard (Farrell and Sperling 2007a). This is because electricity in California ranks much lower in carbon intensity (measured in gCO2e per megajoule) compared to other low-carbon gasoline alternatives.
Table 2-5 provides a snapshot of the CARB-approved carbon intensity values for LCFS eligible fuels. These values appear in a "Lookup Table" that fuel providers and other regulated parties must refer to when reporting on LCFS compliance. The "pathways" described in the table relate to different compositions of different types of fuels. Electricity has two possible pathways under the LCFS: California average electricity mix and California marginal electricity mix of natural gas and renewable energy (CARB 2009d).
Table 2-5: Examples of the CARB-Approved Carbon Intensity Values for Gasoline and Fuels that Substitute for Gasoline [adapted from (CARB 2009d, pp.ES20–21)]
Fuel Pathway Description Carbon Intensity (g CO2-equivalent/MJ)
Direct Emissions
Land Use or Other Effect
Total
Electricity California average electricity mix 124.10 0 41.371
California marginal electricity mix of natural gas and renewable energy
104.70
0
34.901
Gasoline Based on the average crude oil delivered to California refineries and average California refinery efficiencies
95.86 0 95.86
Ethanol from Corn
California average; 80% Midwest Average; 20% California; Dry Mill; Wet DGS; NG
65.66 30 95.66
Ethanol from Sugarcane
Brazilian sugarcane using average production processes
27.40 46 73.40
Hydrogen Compressed H2 from central reforming of NG
142.20 0 61.832
1 Value shown is adjusted by an EER factor of 3.0. 2 Value shown is adjusted by an EER factor of 2.3.
As the table shows, the total carbon intensity value for various fuels and pathways depends on three key factors: 1) direct emissions, 2) land use and other effects, and 3) energy efficiency attributed to different types of fuels and vehicles, identified by the "Energy Economy Ratio," or EER. Direct emissions occur when the fuel is used to produce energy in the form of megajoules used to propel transportation vehicles. Land use and other effects relate mostly to carbon emissions created in the production or transportation of fuels. For example, corn ethanol produces land use emissions because equipment is used to clear, till, and cultivate land used to grow corn, which is ultimately transformed into ethanol fuel. There also are “indirect land use change” issues associated with the resulting conversion of lands to grow food or livestock feed crops that are displaced by the production of vehicle fuel from agricultural lands. The EER
31
adjusts carbon intensity numbers in order to account for powertrain efficiency improvements over gasoline engines (since gasoline is the "reference fuel" for the LCFS). These ratios are used to adjust carbon intensity values fuels used in non-internal-combustion-engine vehicles, like PEVs and FCEVs (CARB 2009d).
Measuring e-fuel for LCFS compliance Regulated parties are entities in the fuel supply chains that must comply with the LCFS by tracking and reporting fuel information to CARB. For most liquid fuels, identifying regulated parties and quantifying fuel use is relatively simple and straightforward, but e-fuel is more challenging. This is because electricity can be consumed—even in a single household—in sectors that are both regulated and unregulated by the LCFS. For this reason, proper LCFS compliance requires separate tracking of electricity used as e-fuel, likely using separate, PEV-dedicated meters (CARB 2009d). In 2010, CARB modified LCFS regulatory language to require that regulated parties use meters to measure fuel use if the meters are installed. Additionally, to reduce the costs of installing separate meters—particularly before PEVs achieve commercialization—the regulatory modifications allow CARB to approve alternative estimation methods until 1 January 2015, at which point meters will be required in all cases (Goldstene 2010).
Key issues still under consideration The LCFS officially became effective on 15 April 2010, and 2011 marks the first year that substantive requirements come into play. However, though the regulation is underway, some issues remain to be fully resolved.
For example, who or what entity should be the final recipient of LCFS credits is still being debated. Currently, regulated parties are the primary recipients of LCFS credits, but some environmental groups have proposed different arrangements that they argue would be more equitable. Several different options have been proposed and are still being considered as of the most recent regulation update from CARB (Goldstene 2010).
Additionally, uncertainty remains about the most accurate calculation of fuel-cycle emissions attributable to each fuel type. Lifecycle assessment (LCA) is used to measure the carbon intensity of transportation fuels regulated by the LCFS, but currently, there is no widely accepted LCA methodology for measuring all possible global warming impacts of transportation fuels (Farrell and Sperling 2007b).
Opportunity for Policy Development: Metering E-Fuel It is critical to develop a comprehensive system for measuring and tracking the use of e-fuel in California households that want to take advantage of what that measuring and tracking would allow. As discussed further in the policy recommendations section of this report (Chapter 5), key protocols need to be developed to provide for this level of tracking and accounting and the existing status quo is insufficient for key reasons. These include:
• PEV owners now have three choices for utility metering but all have key deficiencies: 1) having a single meter as they currently do and not distinguishing the electricity used as e-fuel from other household electricity (and either staying on the standard household rate or switching to a TOU rate); 2) paying for the cost of installing a second utility meter, and having just the e-fuel part of their monthly household electricity use put on a TOU rate; or 3) having a submeter of some sort associated with the primary utility meter.
• The problems with each of these are as follows: o 1) the single meter option is certain to lead to less-than-optimal e-fuel
pricing for households that cannot or do not switch to a full TOU rate,
32
and may provide an economic disadvantage to those that do switch to a full TOU rate but still have significant household electricity usage between Noon and 9pm;
o 2) the cost of installing a second full utility meter is not likely to be cost-effective for most households (at costs of up to $1,000 or more, depending on any wiring upgrades that may be needed), even if the utility will provide the meter for free, because of the costs of installation;
o 3) the submeter is in many ways the most attractive option but there are not yet requirements and protocols for non-utility-owned meters to be used for billing purposes (and submeters might ideally be included on EVSE and/or the vehicles themselves, rather than as distinct devices with higher costs).
• In addition, LCFS rules require “direct metering” for generation of LCFS credits from electricity, or “the regulated party may report the total electricity dispensed at each residential charging station using another method that the regulated party demonstrates to the Executive Officer’s satisfaction is substantially similar to the use of direct metering under section (c)(3)(C)1.a.” (California Code of Regulations Title 17, Division 3, Chapter 1, Subchapter 10, § 95484) However it is not yet clear what other methods for metering/e-fuel-use-estimation, other than “direct metering,” will be considered acceptable by the ARB for LCFS purposes.
What this means is that there currently is a significant policy and regulatory gap, whereby:
• Submetering should be allowed for purposes of utility billing and LCFS credit generation, as the least-cost alternative for many households, but,
• There are not yet any clear guidelines and policies for the “fidelity” levels and data requirements for submeters, including those that could be integrated into EVSE and PEVs themselves, that would be mutually satisfactory to the utilities for billing purposes under TOU rates and to the ARB for LCFS credit generation.
This issue thus represents a key policy and regulatory development need that is discussed further in Chapter 5.
Additional Key Policy and Regulatory Considerations As the above discussion makes clear, there has been a great deal of interest and attention paid to the further introduction of PEVs and e-fuel in California (and elsewhere). Key policies and regulations have been established to help mitigate or avoid concerns about the major environmental and human health impacts of personal transportation, but these are, and will continue to be, under development. The policy and regulatory context is thus highly dynamic, with progress and/or regress in key areas occurring continually. At times this happens very slowly and at other times more rapidly, as with key policy decisions and events such as the original enactments of the ZEV Regulation and AB 32. This chapter continues with discussion of a few key additional considerations and concludes with thoughts related to the development of appropriate forward-looking policies to facilitate PEV commercialization and expanded use of e-fuel.
What is different about this period of EV commercialization? It is important to note again that this is not the first time that EVs have been “re-commercialized” since their initial use early in the 20th century, and it is reasonable to ask why better success can be expected in the 2011–15 timeframe than in the 1990s. There are at least four factors that are different at this juncture, and taken together they do suggest the likelihood of greater commercialization success in this period.
33
First, EV technologies are much improved over the past 20 years, both in terms of technical and economic performance. Electric motors have become less expensive with increases in production volume, power electronics have decreased in size and cost, and battery systems are capable of higher levels of power delivered and energy stored per weight and volume, albeit still at relatively high cost. The performance of complete vehicles has generally improved along with these improvements in components, and EVs are capable of several advantages—such as the ability to refuel at home and possibly offer additional household services related to their high power capability and significant energy storage.
Second, there is greater public awareness of and concern about the issue of climate change, and this has added to continuing concerns about energy security and urban air pollution as key drivers for consumer interest. At the same time, concern about climate change seems to ebb and flow to some extent, depending on the degree of public fixation and concern on other issues (e.g. the economy, major natural disasters, etc.) and for the most part climate change remains an “invisible” problem that a large part of society still does not take seriously. On balance, however, continued concern about climate change, especially in California and other urban parts of the country where PEV commercialization is most likely, is an important market consideration.
Third, gasoline prices have fluctuated dramatically over the past several years (see next) but are typically higher than they were during the 1990s. Notoriously hard to predict, gasoline prices appear to be switching from a regime of short peaks followed by periods of relatively low prices, to a sustained regime of relatively high prices punctuated by occasional excursions to lower prices, such as during the economic slowdown from Fall 2008 through Spring 2009. Consumers can thus no longer expect to suffer through only short periods of relatively high prices if they buy low fuel economy vehicles, but rather to face those prices throughout much of the life of the vehicle. Their attitudes and purchasing patterns appear to be changing as a result (Gillingham 2010).
Fourth, PEVs fit well into an emerging cultural shift that is embracing both “high technology” and “green technology.” PEVs are more electronics-based than conventional vehicles, providing a source of appeal in addition superior energy use and environmental performance.
Taken together, these factors suggest a significantly better chance of PEV penetration beyond initial “early adopter” markets than was possible twenty years ago. Just as solar power systems have had to come of age over many years, and have only recently proliferated, EVs have also clearly needed considerable time to improve to the point where they can compete with the incumbent technology refined over more than a century. At long last potential competitiveness appears to be close, though, as this report describes, much remains to be seen.
A note about gasoline prices in the U.S. vis a vis e-fuel It is important to note that a key factor related to the sustainability of policies supportive of PEV commercialization is the relative operating costs of PEVs compared with conventional vehicles. This is driven largely by changes in gasoline prices, as electricity costs are more stable—being determined in most cases by regulatory proceedings at public utilities commissions rather than the “real time” markets that determine crude oil prices, and by extension gasoline prices.
Gasoline prices are notoriously variable (especially in the U.S. and other places where taxes are a relatively low percentage of overall sales prices compared with most parts of Europe and Asia), and difficult to predict. Figure 2-6 presents average gasoline prices over the past 6 years in the U.S., with extremes from $1.61 per gallon in late 2008 to over $4.00 per gallon just a few months before that.
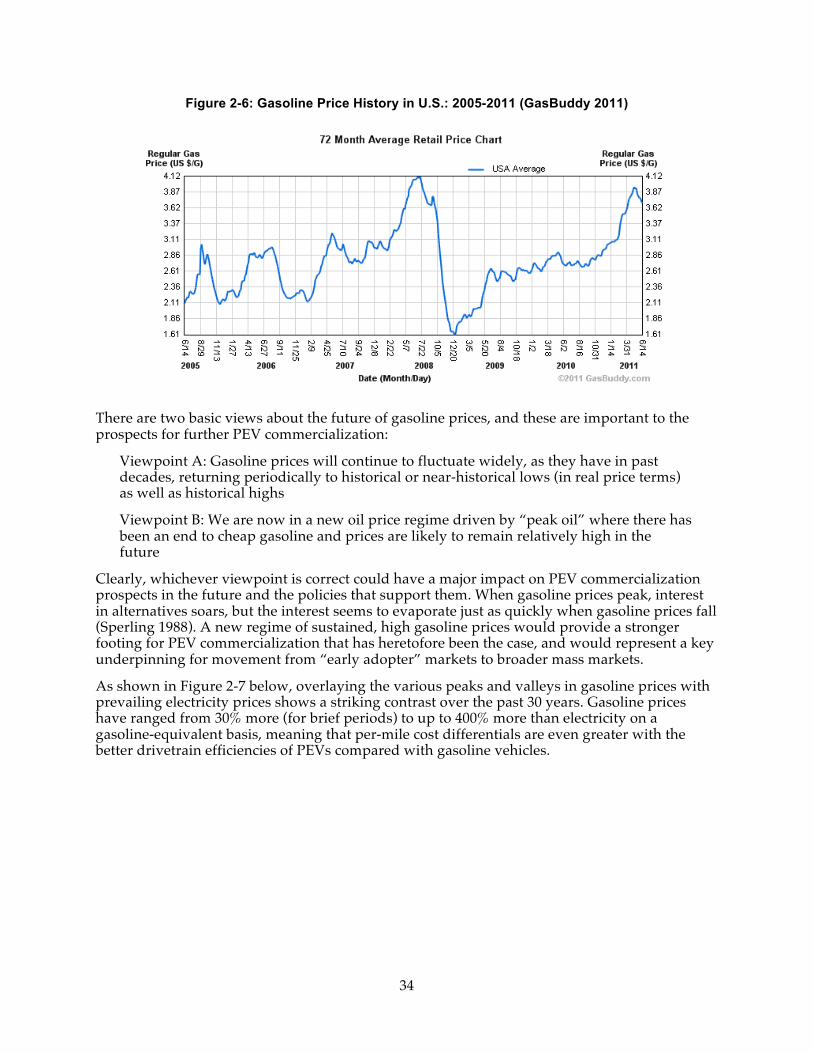
34
Figure 2-6: Gasoline Price History in U.S.: 2005-2011 (GasBuddy 2011)
There are two basic views about the future of gasoline prices, and these are important to the prospects for further PEV commercialization:
Viewpoint A: Gasoline prices will continue to fluctuate widely, as they have in past decades, returning periodically to historical or near-historical lows (in real price terms) as well as historical highs
Viewpoint B: We are now in a new oil price regime driven by “peak oil” where there has been an end to cheap gasoline and prices are likely to remain relatively high in the future
Clearly, whichever viewpoint is correct could have a major impact on PEV commercialization prospects in the future and the policies that support them. When gasoline prices peak, interest in alternatives soars, but the interest seems to evaporate just as quickly when gasoline prices fall (Sperling 1988). A new regime of sustained, high gasoline prices would provide a stronger footing for PEV commercialization that has heretofore been the case, and would represent a key underpinning for movement from “early adopter” markets to broader mass markets.
As shown in Figure 2-7 below, overlaying the various peaks and valleys in gasoline prices with prevailing electricity prices shows a striking contrast over the past 30 years. Gasoline prices have ranged from 30% more (for brief periods) to up to 400% more than electricity on a gasoline-equivalent basis, meaning that per-mile cost differentials are even greater with the better drivetrain efficiencies of PEVs compared with gasoline vehicles.
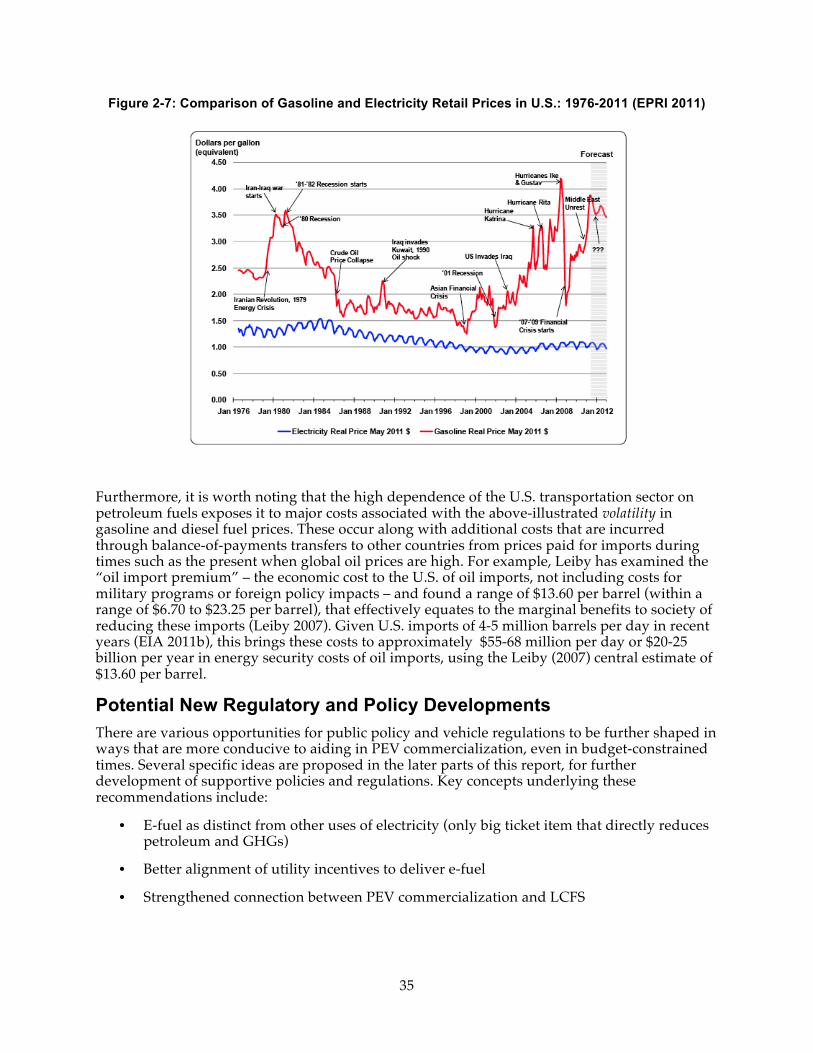
35
Figure 2-7: Comparison of Gasoline and Electricity Retail Prices in U.S.: 1976-2011 (EPRI 2011)
Furthermore, it is worth noting that the high dependence of the U.S. transportation sector on petroleum fuels exposes it to major costs associated with the above-illustrated volatility in gasoline and diesel fuel prices. These occur along with additional costs that are incurred through balance-of-payments transfers to other countries from prices paid for imports during times such as the present when global oil prices are high. For example, Leiby has examined the “oil import premium” – the economic cost to the U.S. of oil imports, not including costs for military programs or foreign policy impacts – and found a range of $13.60 per barrel (within a range of $6.70 to $23.25 per barrel), that effectively equates to the marginal benefits to society of reducing these imports (Leiby 2007). Given U.S. imports of 4-5 million barrels per day in recent years (EIA 2011b), this brings these costs to approximately $55-68 million per day or $20-25 billion per year in energy security costs of oil imports, using the Leiby (2007) central estimate of $13.60 per barrel.
Potential New Regulatory and Policy Developments There are various opportunities for public policy and vehicle regulations to be further shaped in ways that are more conducive to aiding in PEV commercialization, even in budget-constrained times. Several specific ideas are proposed in the later parts of this report, for further development of supportive policies and regulations. Key concepts underlying these recommendations include:
• E-fuel as distinct from other uses of electricity (only big ticket item that directly reduces petroleum and GHGs)
• Better alignment of utility incentives to deliver e-fuel
• Strengthened connection between PEV commercialization and LCFS
36
• Utility rate-basing of any needed grid upgrades to support EV charging even in neighborhood “clusters” (and possibly including customer main panels if older 80A services?)
• Public awareness campaign of the negative environmental impacts of future alternatives to e-fuel
• Efforts to help consumers find the “right” PEV -- or not (e.g. ZEV Co.)
• Floor on gasoline prices at $3.00 per gallon – floating tax as proposed by Prof. Borenstein at UC Berkeley
• Vehicle “feebates” – fees and rebates for vehicles depending on GHG emissions
• Battery and/or full EV leasing with tax write-off for interest on loan (as with current home mortgages)
• Extra tax benefits for EV purchases that are coupled directly with purchases of solar PV systems (including community solar concept)
Several of these ideas are explored in Chapter 5 of this report, culminating in a number of specific policy recommendations.
37
CHAPTER 3: PEV Commercialization: Past Efforts, Present Status, and Future Prospects A Brief History of Plug-In Electric Vehicles The earliest battery electric vehicles (BEVs) were produced in the mid-19th century, with efforts in both Europe and the U.S., but practical BEVs produced in significant numbers were not available until the latter part of the century. English inventor Thomas Parker is thought to have developed an improved BEV design around 1884 (Telegraph 2009), and by 1899 French inventor Camille Jenatzy broke the 100 kilometer-per-hour (kmph) barrier by reaching a top speed of 106 kmph (66 miles per hour) in a small rocket-shaped BEV powered by a 50-kilowatt (kW) motor, the fastest a personal vehicle of any type had yet traveled at that time (Britannica 2011).
Of course most of these early BEVs were fairly primitive as were all vehicles at the time, being essentially motorized carriages. More attention was paid to BEVs especially in the U.S. around the turn of the century, when by 1897 there was a fleet of electric taxis operating in New York City that was built by the Electric Carriage and Wagon Company of Philadelphia. By the early 20th century, BEVs were being built by several companies including Anthony Electric, Baker, Columbia, Edison, Riker and Studebaker, among others, and there actually was an early hybrid gasoline-electric vehicle produced by the Woods Motor Vehicle Company of Chicago in 1916 (Kirsch 2000).
The invention of the electric starter by Charles Kettering and his team in 1912 eliminated one key advantage of BEVs, which did not require the physically challenging process of hand cranking to start. By the time Ford mass-produced the gasoline vehicles in 1915, the prices of these vehicles provided a major competitive advantage over BEVs, which then were costing more than twice as much (Bellis 2006). By the late 1920s, gasoline powered vehicles began to dominate due to the discovery of petroleum reserves in the U.S., making gasoline powered vehicles cheaper to operate while traveling faster and farther than BEVs. Figure 3-1 below shows a few different models of electric vehicle available at the time from the Pope Motor Company, selling for $1,100 and $1,450 in Year 1926 $s.
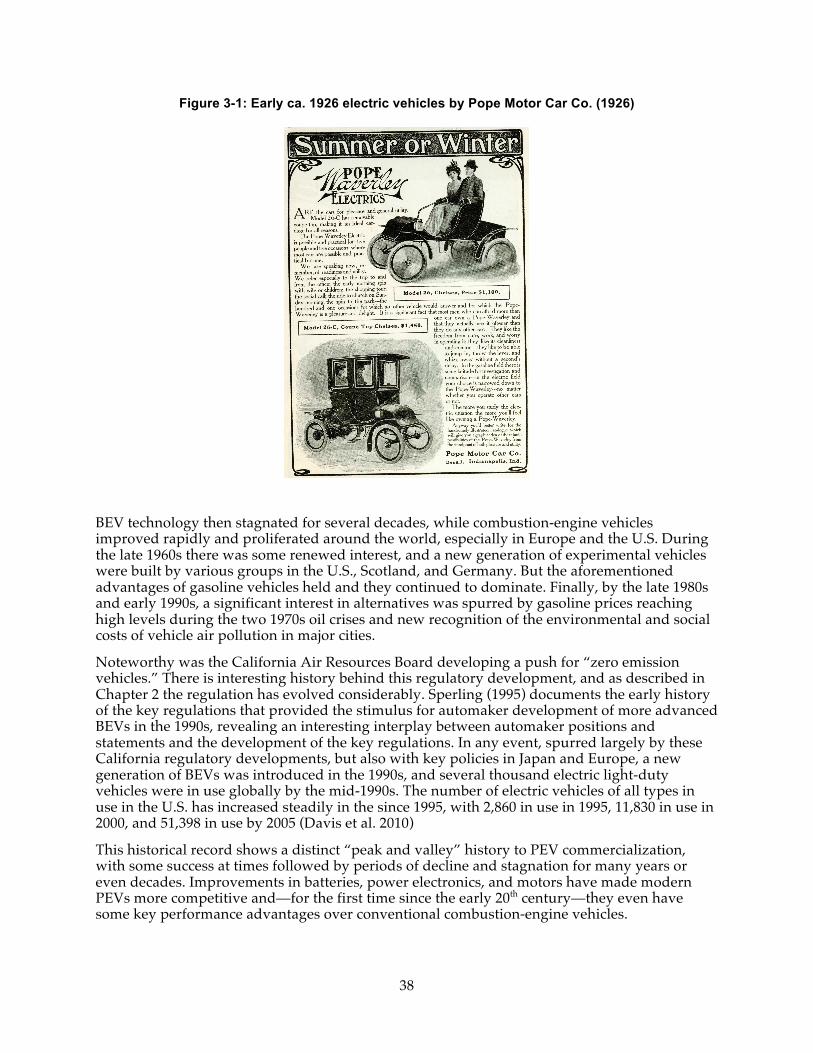
38
Figure 3-1: Early ca. 1926 electric vehicles by Pope Motor Car Co. (1926)
BEV technology then stagnated for several decades, while combustion-engine vehicles improved rapidly and proliferated around the world, especially in Europe and the U.S. During the late 1960s there was some renewed interest, and a new generation of experimental vehicles were built by various groups in the U.S., Scotland, and Germany. But the aforementioned advantages of gasoline vehicles held and they continued to dominate. Finally, by the late 1980s and early 1990s, a significant interest in alternatives was spurred by gasoline prices reaching high levels during the two 1970s oil crises and new recognition of the environmental and social costs of vehicle air pollution in major cities.
Noteworthy was the California Air Resources Board developing a push for “zero emission vehicles.” There is interesting history behind this regulatory development, and as described in Chapter 2 the regulation has evolved considerably. Sperling (1995) documents the early history of the key regulations that provided the stimulus for automaker development of more advanced BEVs in the 1990s, revealing an interesting interplay between automaker positions and statements and the development of the key regulations. In any event, spurred largely by these California regulatory developments, but also with key policies in Japan and Europe, a new generation of BEVs was introduced in the 1990s, and several thousand electric light-duty vehicles were in use globally by the mid-1990s. The number of electric vehicles of all types in use in the U.S. has increased steadily in the since 1995, with 2,860 in use in 1995, 11,830 in use in 2000, and 51,398 in use by 2005 (Davis et al. 2010)
This historical record shows a distinct “peak and valley” history to PEV commercialization, with some success at times followed by periods of decline and stagnation for many years or even decades. Improvements in batteries, power electronics, and motors have made modern PEVs more competitive and—for the first time since the early 20th century—they even have some key performance advantages over conventional combustion-engine vehicles.
39
Current Status of PEV Commercialization Today, the array of “electric vehicles” can be confusing. Electrically driven vehicles (electric vehicles, EVs, or xEVs) are powered in part or wholly by electric motors and comprise hybrid EVs (hybrids, HEVs, or HVs), plug-in hybrid EVs (plug-in hybrids, PHEVs, or PHVs), battery EVs (BEVs), and fuel-cell EVs (FCEVs, FCVs, or FCHVs). Plug-in EVs (plug-ins, plug-in vehicles, or PEVs)—the focus of this report—comprise plug-in hybrids and battery EVs. Further, as fuel-cell EVs are typically hybridized with batteries, they can be (and prototypes have been) designed as PEVs. Several major automotive original equipment manufacturers (OEMs) and smaller companies are now making plug-in hybrid, battery-electric, and fuel-cell vehicles available for sale or lease, with several additional models expected in the next few years (see below).
Battery EVs and plug-in hybrids are very different products but both are “plug-in electric vehicles” (PEVs), as they derive some or all of their propulsion energy from plugging in to electricity grids or other sources of electrical energy. Fuel-cell EVs are electric vehicles (driven entirely by electric motors) but are typically fueled entirely with hydrogen. However, because they are also typically hybridized with battery energy storage systems—to complement the operation of the fuel-cell system and allow for the capture of regenerative braking—they can be designed as PEVs as well. Thus the term “electric vehicle” or “EV” (xEV)—though historically used synonymously with all-battery electric vehicles—describes a wide range of electric-drive vehicle types.
Plug-in hybrids with true “all-electric range” (AER) allow drivers to make some trips without the engine turning on at all, within the limits of the energy stored in the battery and the power output of the electric motor(s). However, some plug-in hybrids may forgo a strict adherence to all-electric operation even when operating within the limits of the battery and motor and instead employ “blended mode” operation, where the onboard computers turn the engine to turn off and on periodically. This is typically done to optimize the use of smaller, less expensive electric-drive components (batteries and motors) within the larger propulsion system.
Several PEVs are now commercially available (Table 3-1 and Figures 3-2 through 3-4), and additional models are expected soon (Table 3-2). The most notable differences between these vehicles and the ones that were available in the 1990s include: 1) the availability of relatively small-battery plug-in hybrids, 2) improved performance from the recent availability of lithium-based batteries with much higher energy density than available in most previous battery types (such as lead acid and nickel-metal hydride), and 3) significant advances and cost reductions in other drivetrain components such as electric motors, power inverters, and electrically operated accessory systems.
Table 3-1 characterizes the 2011 PEVs tested so far by the EPA: the LEAF, the Volt, and the smart for two electric drive (smart ed). Additional, preliminary data for the early-2012 release of the Mitsubishi i is also listed.
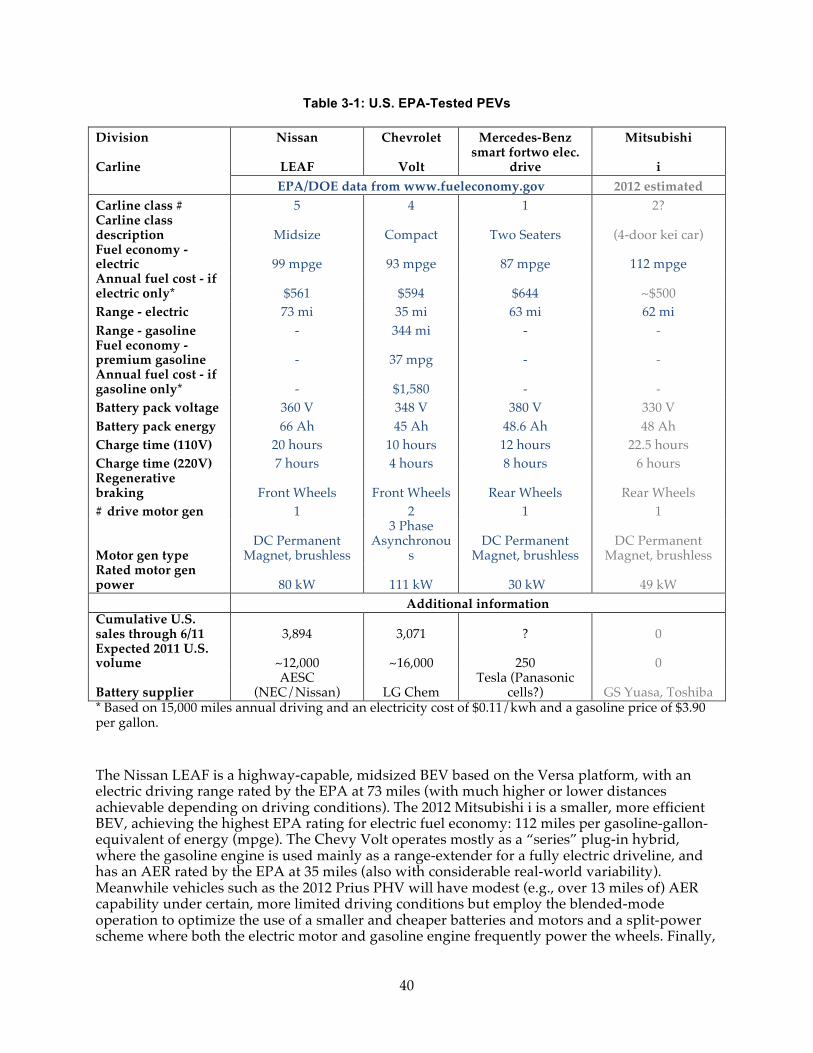
40
Table 3-1: U.S. EPA-Tested PEVs
Division Nissan Chevrolet Mercedes-Benz Mitsubishi
Carline LEAF Volt smart fortwo elec.
drive i EPA/DOE data from www.fueleconomy.gov 2012 estimated Carline class # 5 4 1 2? Carline class description Midsize Compact Two Seaters (4-door kei car) Fuel economy - electric 99 mpge 93 mpge 87 mpge 112 mpge Annual fuel cost - if electric only* $561 $594 $644 ~$500 Range - electric 73 mi 35 mi 63 mi 62 mi Range - gasoline - 344 mi - - Fuel economy - premium gasoline - 37 mpg - - Annual fuel cost - if gasoline only* - $1,580 - - Battery pack voltage 360 V 348 V 380 V 330 V Battery pack energy 66 Ah 45 Ah 48.6 Ah 48 Ah Charge time (110V) 20 hours 10 hours 12 hours 22.5 hours Charge time (220V) 7 hours 4 hours 8 hours 6 hours Regenerative braking Front Wheels Front Wheels Rear Wheels Rear Wheels # drive motor gen 1 2 1 1
Motor gen type DC Permanent
Magnet, brushless
3 Phase Asynchronou
s DC Permanent
Magnet, brushless DC Permanent
Magnet, brushless Rated motor gen power 80 kW 111 kW 30 kW 49 kW Additional information Cumulative U.S. sales through 6/11 3,894 3,071 ? 0 Expected 2011 U.S. volume ~12,000 ~16,000 250 0
Battery supplier AESC
(NEC/Nissan) LG Chem Tesla (Panasonic
cells?) GS Yuasa, Toshiba * Based on 15,000 miles annual driving and an electricity cost of $0.11/kwh and a gasoline price of $3.90 per gallon.
The Nissan LEAF is a highway-capable, midsized BEV based on the Versa platform, with an electric driving range rated by the EPA at 73 miles (with much higher or lower distances achievable depending on driving conditions). The 2012 Mitsubishi i is a smaller, more efficient BEV, achieving the highest EPA rating for electric fuel economy: 112 miles per gasoline-gallon-equivalent of energy (mpge). The Chevy Volt operates mostly as a “series” plug-in hybrid, where the gasoline engine is used mainly as a range-extender for a fully electric driveline, and has an AER rated by the EPA at 35 miles (also with considerable real-world variability). Meanwhile vehicles such as the 2012 Prius PHV will have modest (e.g., over 13 miles of) AER capability under certain, more limited driving conditions but employ the blended-mode operation to optimize the use of a smaller and cheaper batteries and motors and a split-power scheme where both the electric motor and gasoline engine frequently power the wheels. Finally,
41
it should be noted that fuel cell EVs are capable of providing longer zero-tailpipe-emission electric ranges (e.g., over 350 miles in a refined and capable mid-sized SUV), but lack hydrogen refueling infrastructure and remain in pre-commercial status (with several hundred vehicles currently being operated, and limited leasing available in a few metropolitan regions). For fuel cell EVs, the 2015–2017 timeframe is expected for wider commercialization of these vehicles, concurrent with plans to slowly expand hydrogen-refueling infrastructure in California and other places.
Some indications characterizing the early adoption of these PEVs are emerging. For example, a June 2011 Automotive News web article (Colias 2011) cites Chevrolet data to characterize the Volt adopters thus far as largely (80% or more): male with college degrees who traded in a non-GM vehicle and are very or completely satisfied with their new Volt. One-third has leased their Volts and half have installed a 240-V charger. Roughly two-thirds of the over two million Volt miles driven have been electric, and drivers have averaged 900 miles between gasoline fueling events. It further claims that LEAF consumers so far also tend to buy (90%) rather than lease, and are averaging 2 hours of recharging per night.
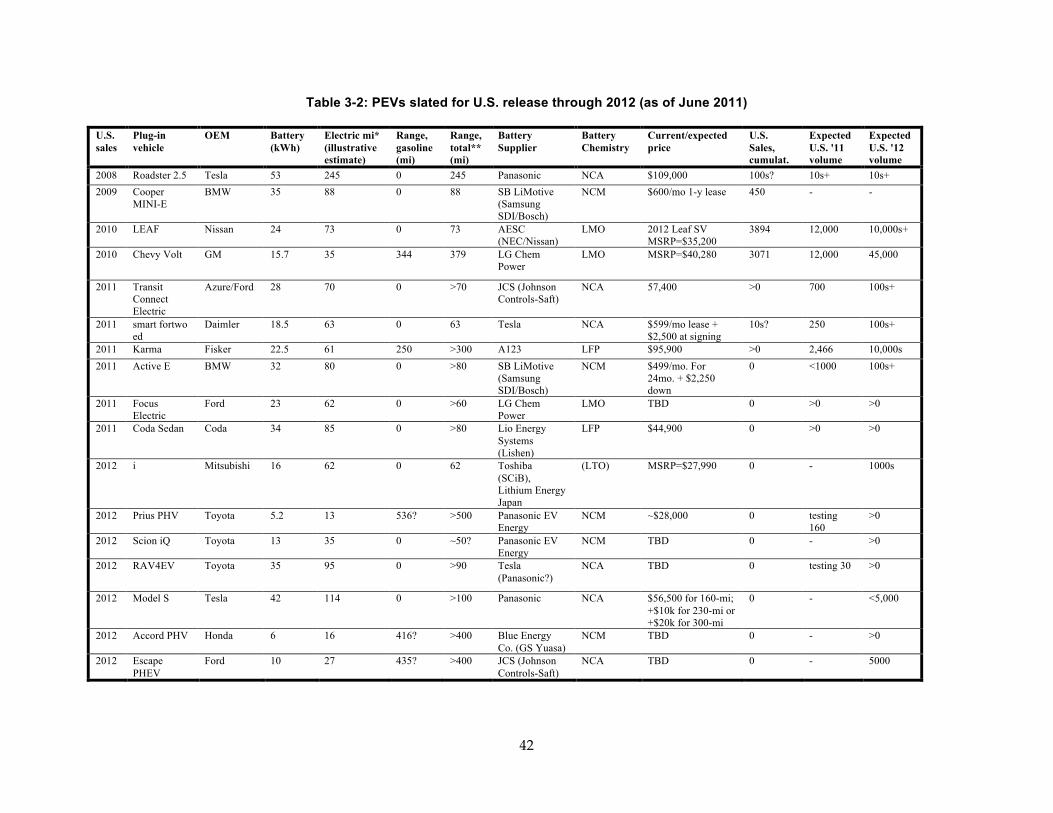
42
Table 3-2: PEVs slated for U.S. release through 2012 (as of June 2011)
U.S. sales
Plug-in vehicle
OEM Battery (kWh)
Electric mi* (illustrative estimate)
Range, gasoline (mi)
Range, total** (mi)
Battery Supplier
Battery Chemistry
Current/expected price
U.S. Sales, cumulat.
Expected U.S. '11 volume
Expected U.S. '12 volume
2008 Roadster 2.5 Tesla 53 245 0 245 Panasonic NCA $109,000 100s? 10s+ 10s+ 2009 Cooper
MINI-E BMW 35 88 0 88 SB LiMotive
(Samsung SDI/Bosch)
NCM $600/mo 1-y lease 450 - -
2010 LEAF Nissan 24 73 0 73 AESC (NEC/Nissan)
LMO 2012 Leaf SV MSRP=$35,200
3894 12,000 10,000s+
2010 Chevy Volt GM 15.7 35 344 379 LG Chem Power
LMO MSRP=$40,280 3071 12,000 45,000
2011 Transit Connect Electric
Azure/Ford 28 70 0 >70 JCS (Johnson Controls-Saft)
NCA 57,400 >0 700 100s+
2011 smart fortwo ed
Daimler 18.5 63 0 63 Tesla NCA $599/mo lease + $2,500 at signing
10s? 250 100s+
2011 Karma Fisker 22.5 61 250 >300 A123 LFP $95,900 >0 2,466 10,000s 2011 Active E BMW 32 80 0 >80 SB LiMotive
(Samsung SDI/Bosch)
NCM $499/mo. For 24mo. + $2,250 down
0 <1000 100s+
2011 Focus Electric
Ford 23 62 0 >60 LG Chem Power
LMO TBD 0 >0 >0
2011 Coda Sedan Coda 34 85 0 >80 Lio Energy Systems (Lishen)
LFP $44,900 0 >0 >0
2012 i Mitsubishi 16 62 0 62 Toshiba (SCiB), Lithium Energy Japan
(LTO) MSRP=$27,990 0 - 1000s
2012 Prius PHV Toyota 5.2 13 536? >500 Panasonic EV Energy
NCM ~$28,000 0 testing 160
>0
2012 Scion iQ Toyota 13 35 0 ~50? Panasonic EV Energy
NCM TBD 0 - >0
2012 RAV4EV Toyota 35 95 0 >90 Tesla (Panasonic?)
NCA TBD 0 testing 30 >0
2012 Model S Tesla 42 114 0 >100 Panasonic NCA $56,500 for 160-mi; +$10k for 230-mi or +$20k for 300-mi
0 - <5,000
2012 Accord PHV Honda 6 16 416? >400 Blue Energy Co. (GS Yuasa)
NCM TBD 0 - >0
2012 Escape PHEV
Ford 10 27 435? >400 JCS (Johnson Controls-Saft)
NCA TBD 0 - 5000
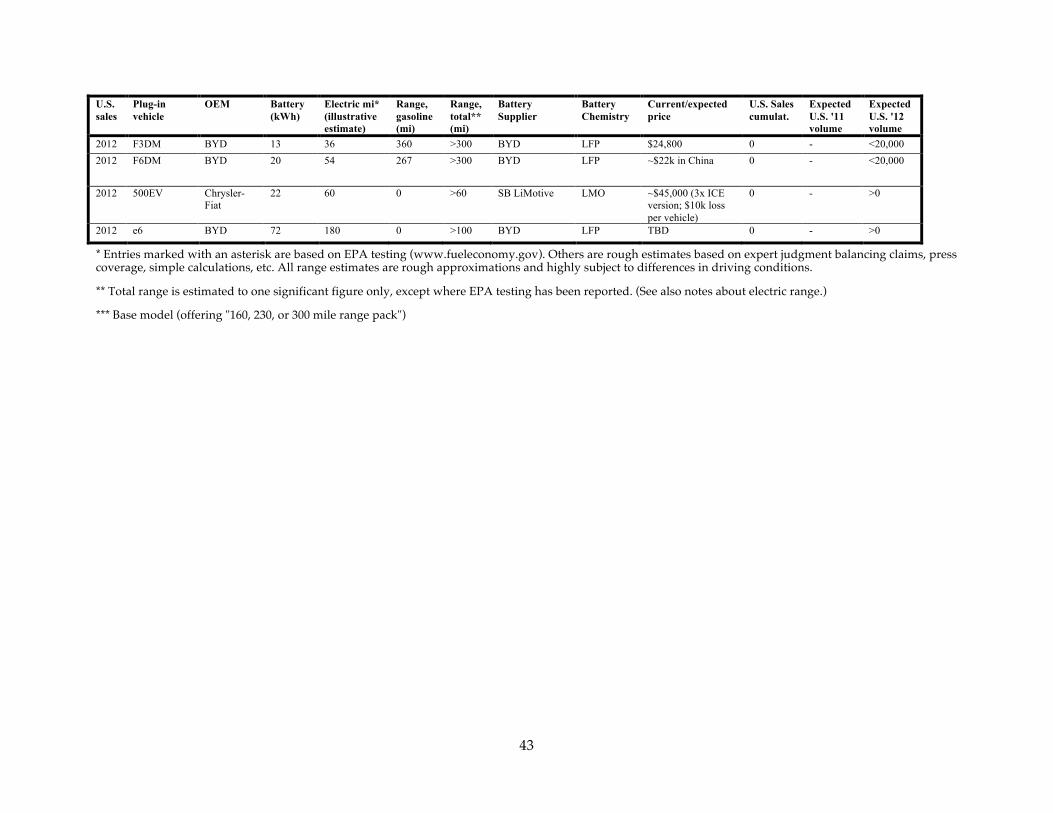
43
U.S. sales
Plug-in vehicle
OEM Battery (kWh)
Electric mi* (illustrative estimate)
Range, gasoline (mi)
Range, total** (mi)
Battery Supplier
Battery Chemistry
Current/expected price
U.S. Sales cumulat.
Expected U.S. '11 volume
Expected U.S. '12 volume
2012 F3DM BYD 13 36 360 >300 BYD LFP $24,800 0 - <20,000 2012 F6DM BYD 20 54 267 >300 BYD LFP ~$22k in China 0 - <20,000
2012 500EV Chrysler-Fiat
22 60 0 >60 SB LiMotive LMO ~$45,000 (3x ICE version; $10k loss per vehicle)
0 - >0
2012 e6 BYD 72 180 0 >100 BYD LFP TBD 0 - >0
* Entries marked with an asterisk are based on EPA testing (www.fueleconomy.gov). Others are rough estimates based on expert judgment balancing claims, press coverage, simple calculations, etc. All range estimates are rough approximations and highly subject to differences in driving conditions.
** Total range is estimated to one significant figure only, except where EPA testing has been reported. (See also notes about electric range.)
*** Base model (offering "160, 230, or 300 mile range pack")
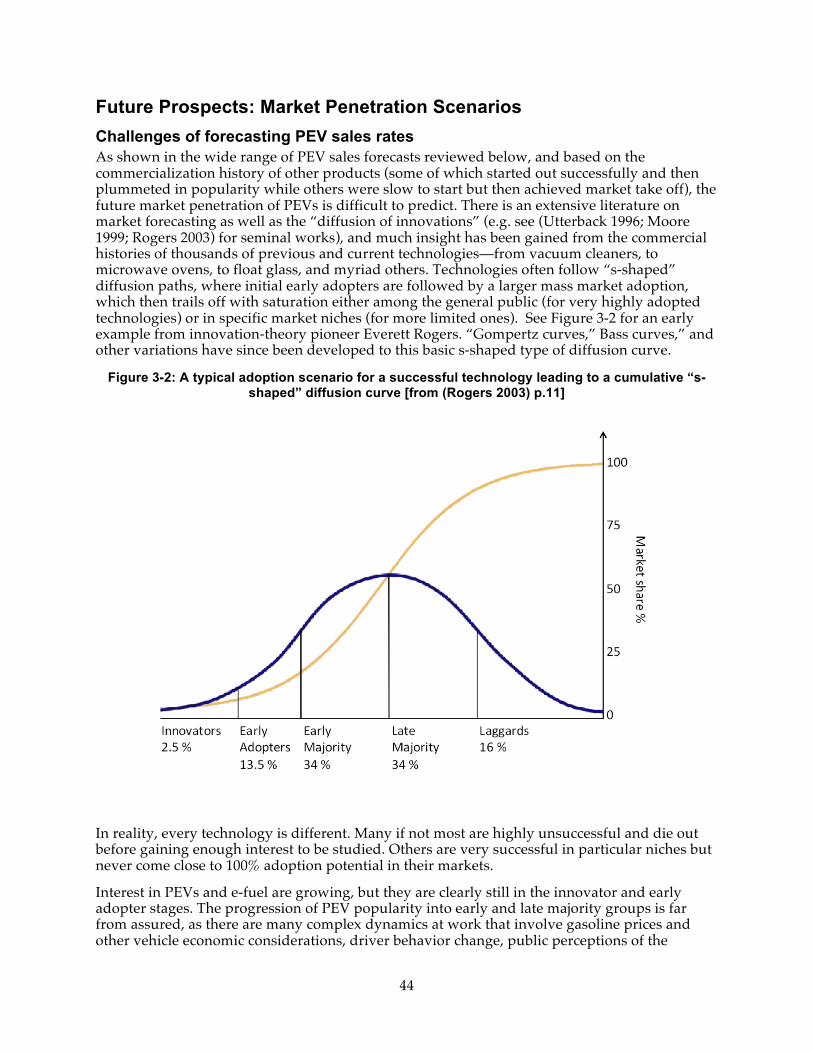
44
Future Prospects: Market Penetration Scenarios Challenges of forecasting PEV sales rates As shown in the wide range of PEV sales forecasts reviewed below, and based on the commercialization history of other products (some of which started out successfully and then plummeted in popularity while others were slow to start but then achieved market take off), the future market penetration of PEVs is difficult to predict. There is an extensive literature on market forecasting as well as the “diffusion of innovations” (e.g. see (Utterback 1996; Moore 1999; Rogers 2003) for seminal works), and much insight has been gained from the commercial histories of thousands of previous and current technologies—from vacuum cleaners, to microwave ovens, to float glass, and myriad others. Technologies often follow “s-shaped” diffusion paths, where initial early adopters are followed by a larger mass market adoption, which then trails off with saturation either among the general public (for very highly adopted technologies) or in specific market niches (for more limited ones). See Figure 3-2 for an early example from innovation-theory pioneer Everett Rogers. “Gompertz curves,” Bass curves,” and other variations have since been developed to this basic s-shaped type of diffusion curve.
Figure 3-2: A typical adoption scenario for a successful technology leading to a cumulative “s-shaped” diffusion curve [from (Rogers 2003) p.11]
In reality, every technology is different. Many if not most are highly unsuccessful and die out before gaining enough interest to be studied. Others are very successful in particular niches but never come close to 100% adoption potential in their markets.
Interest in PEVs and e-fuel are growing, but they are clearly still in the innovator and early adopter stages. The progression of PEV popularity into early and late majority groups is far from assured, as there are many complex dynamics at work that involve gasoline prices and other vehicle economic considerations, driver behavior change, public perceptions of the
45
benefits of the various PEV types, the presence of government incentives including financial subsidies and car-pool lane access, and social factors including symbolism, status, and social “halo” effects around PEV purchases. It is important to note that all types of xEVs in many ways seem well-positioned into what appear to be growing eco-consciousness and “fascination with electronics” trends as the 21st century begins to unfold. However, given the great economic and political uncertainties around PEV economics and politics, it is best to recognize that various exogenous factors can have significant and immediate impacts on the future prospects. For example, factors favoring PEV adoption might include a prolonged regime of high gasoline prices, additional oil spills, and/or advanced battery breakthroughs. Factors working against PEV adoption might include a return to relatively low (e.g., $2.50 per gallon) gasoline prices, continued difficulty in bringing advanced battery costs below $300 per kWh, and the rapid evaporation of PEV purchase incentives and other government support (e.g. carpool lane access) programs.
Are PEVs likely to be BEVs or PHVs? A critical and often neglected uncertainty in predicting and planning for PEV market penetration is the relative level of adoption of BEVs and PHVs. Each has significantly different implications, e.g., for consumer behavior, infrastructure requirements, grid impacts, adoption dynamics, and policy design and effect. Though both should, and undoubtedly will, play an important role in helping California meet its transportation and energy goals, an increased understanding of and differentiation between the two vehicle product types is necessary. Further, in economically constrained times, prioritization based on cost-effectiveness and policy precision may be particularly necessary. One important ingredient for this is a greater understanding of what the “common denominators” are amongst PEVs, discussed next, and therefore what measures provide more fundamental “rising-tide-lifts-all-boats” benefits vs. highly desirable, but less essential, progress. One analogous and commonly discussed prioritization paradigm is the “charging pyramid,” which has as its foundation residential charging, followed in ascending order by workplace charging and then public charging. The implication is that, while the way should be cleared for those so motivated to go to the peak, early efforts and public monies should concentrate on building the base.
The light-duty passenger vehicle baseline: battery EVs or plug-in hybrids? In the near term, plug-in vehicles of two basic propulsion architecture types will be available: plug-in-hybrid EVs and all-battery EVs. In addition to the electric storage systems (e.g., batteries) and electric motors used by battery EVs, plug-in hybrids utilize other fueled power systems, ranging from internal-combustion engines burning gasoline to fuel cells electrochemically converting hydrogen fuel and air into electricity and water.
Though the initial success and appeal of vehicles like the Nissan LEAF should of course not be ignored, several factors continue to reinforce the notion that plug-in hybrids face substantially lower barriers to commercialization than do battery EVs, including total vehicle range, refueling/recharging infrastructure and convenience, battery cost, and required consumer behavioral change.
Plug-in hybrids offer lesser electric-fuel and gasoline-savings capabilities per charge, but they offer greater total vehicle range capabilities, comparable to or greater than consumer expectations for conventional vehicle products. It should be noted that all vehicle products need not have equivalent range or be marketed as conventional vehicles, and different product variations could be offered on the basis of differential valuation of electric range by different market niches/segments (Kurani et al. 1996). However, because plug-in hybrids do not rely solely on electricity, they offer such electric-fuel range segmentation on an even smaller and cheaper scale with less overall consumer compromise and/or behavioral change. Further, not dependent on recharging, and thus able to utilize a sparser, cheaper, lower-power, lower-grid-impact, and less-coordinated recharging infrastructure without significant compromise, plug-in
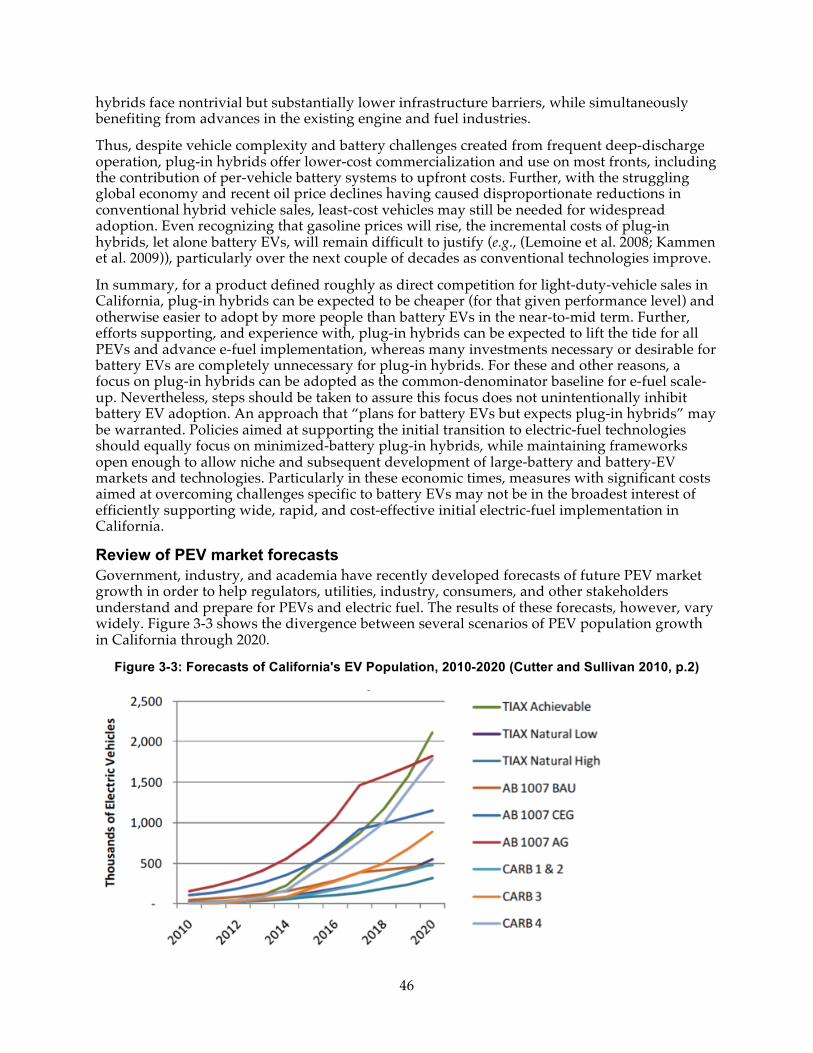
46
hybrids face nontrivial but substantially lower infrastructure barriers, while simultaneously benefiting from advances in the existing engine and fuel industries.
Thus, despite vehicle complexity and battery challenges created from frequent deep-discharge operation, plug-in hybrids offer lower-cost commercialization and use on most fronts, including the contribution of per-vehicle battery systems to upfront costs. Further, with the struggling global economy and recent oil price declines having caused disproportionate reductions in conventional hybrid vehicle sales, least-cost vehicles may still be needed for widespread adoption. Even recognizing that gasoline prices will rise, the incremental costs of plug-in hybrids, let alone battery EVs, will remain difficult to justify (e.g., (Lemoine et al. 2008; Kammen et al. 2009)), particularly over the next couple of decades as conventional technologies improve.
In summary, for a product defined roughly as direct competition for light-duty-vehicle sales in California, plug-in hybrids can be expected to be cheaper (for that given performance level) and otherwise easier to adopt by more people than battery EVs in the near-to-mid term. Further, efforts supporting, and experience with, plug-in hybrids can be expected to lift the tide for all PEVs and advance e-fuel implementation, whereas many investments necessary or desirable for battery EVs are completely unnecessary for plug-in hybrids. For these and other reasons, a focus on plug-in hybrids can be adopted as the common-denominator baseline for e-fuel scale-up. Nevertheless, steps should be taken to assure this focus does not unintentionally inhibit battery EV adoption. An approach that “plans for battery EVs but expects plug-in hybrids” may be warranted. Policies aimed at supporting the initial transition to electric-fuel technologies should equally focus on minimized-battery plug-in hybrids, while maintaining frameworks open enough to allow niche and subsequent development of large-battery and battery-EV markets and technologies. Particularly in these economic times, measures with significant costs aimed at overcoming challenges specific to battery EVs may not be in the broadest interest of efficiently supporting wide, rapid, and cost-effective initial electric-fuel implementation in California.
Review of PEV market forecasts Government, industry, and academia have recently developed forecasts of future PEV market growth in order to help regulators, utilities, industry, consumers, and other stakeholders understand and prepare for PEVs and electric fuel. The results of these forecasts, however, vary widely. Figure 3-3 shows the divergence between several scenarios of PEV population growth in California through 2020.
Figure 3-3: Forecasts of California's EV Population, 2010-2020 (Cutter and Sullivan 2010, p.2)
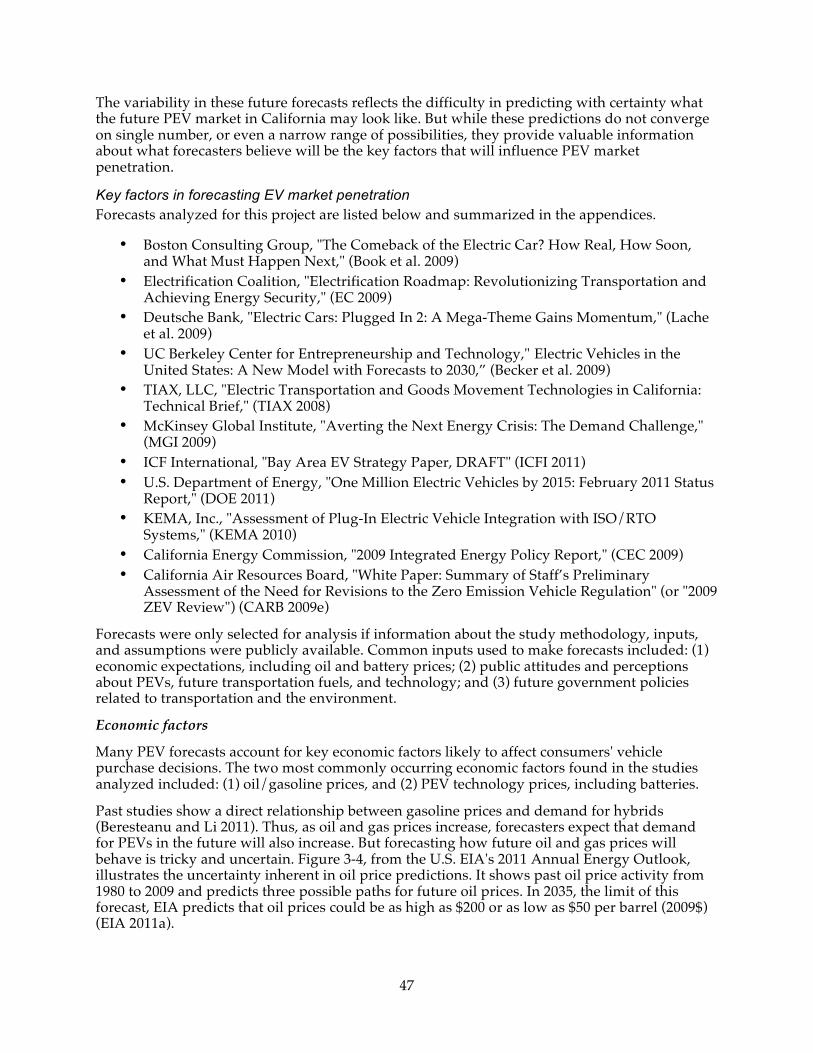
47
The variability in these future forecasts reflects the difficulty in predicting with certainty what the future PEV market in California may look like. But while these predictions do not converge on single number, or even a narrow range of possibilities, they provide valuable information about what forecasters believe will be the key factors that will influence PEV market penetration.
Key factors in forecasting EV market penetration Forecasts analyzed for this project are listed below and summarized in the appendices.
• Boston Consulting Group, "The Comeback of the Electric Car? How Real, How Soon, and What Must Happen Next," (Book et al. 2009)
• Electrification Coalition, "Electrification Roadmap: Revolutionizing Transportation and Achieving Energy Security," (EC 2009)
• Deutsche Bank, "Electric Cars: Plugged In 2: A Mega-Theme Gains Momentum," (Lache et al. 2009)
• UC Berkeley Center for Entrepreneurship and Technology," Electric Vehicles in the United States: A New Model with Forecasts to 2030,” (Becker et al. 2009)
• TIAX, LLC, "Electric Transportation and Goods Movement Technologies in California: Technical Brief," (TIAX 2008)
• McKinsey Global Institute, "Averting the Next Energy Crisis: The Demand Challenge," (MGI 2009)
• ICF International, "Bay Area EV Strategy Paper, DRAFT" (ICFI 2011) • U.S. Department of Energy, "One Million Electric Vehicles by 2015: February 2011 Status
Report," (DOE 2011) • KEMA, Inc., "Assessment of Plug-In Electric Vehicle Integration with ISO/RTO
Systems," (KEMA 2010) • California Energy Commission, "2009 Integrated Energy Policy Report," (CEC 2009) • California Air Resources Board, "White Paper: Summary of Staff’s Preliminary
Assessment of the Need for Revisions to the Zero Emission Vehicle Regulation" (or "2009 ZEV Review") (CARB 2009e)
Forecasts were only selected for analysis if information about the study methodology, inputs, and assumptions were publicly available. Common inputs used to make forecasts included: (1) economic expectations, including oil and battery prices; (2) public attitudes and perceptions about PEVs, future transportation fuels, and technology; and (3) future government policies related to transportation and the environment.
Economic factors
Many PEV forecasts account for key economic factors likely to affect consumers' vehicle purchase decisions. The two most commonly occurring economic factors found in the studies analyzed included: (1) oil/gasoline prices, and (2) PEV technology prices, including batteries.
Past studies show a direct relationship between gasoline prices and demand for hybrids (Beresteanu and Li 2011). Thus, as oil and gas prices increase, forecasters expect that demand for PEVs in the future will also increase. But forecasting how future oil and gas prices will behave is tricky and uncertain. Figure 3-4, from the U.S. EIA's 2011 Annual Energy Outlook, illustrates the uncertainty inherent in oil price predictions. It shows past oil price activity from 1980 to 2009 and predicts three possible paths for future oil prices. In 2035, the limit of this forecast, EIA predicts that oil prices could be as high as $200 or as low as $50 per barrel (2009$) (EIA 2011a).
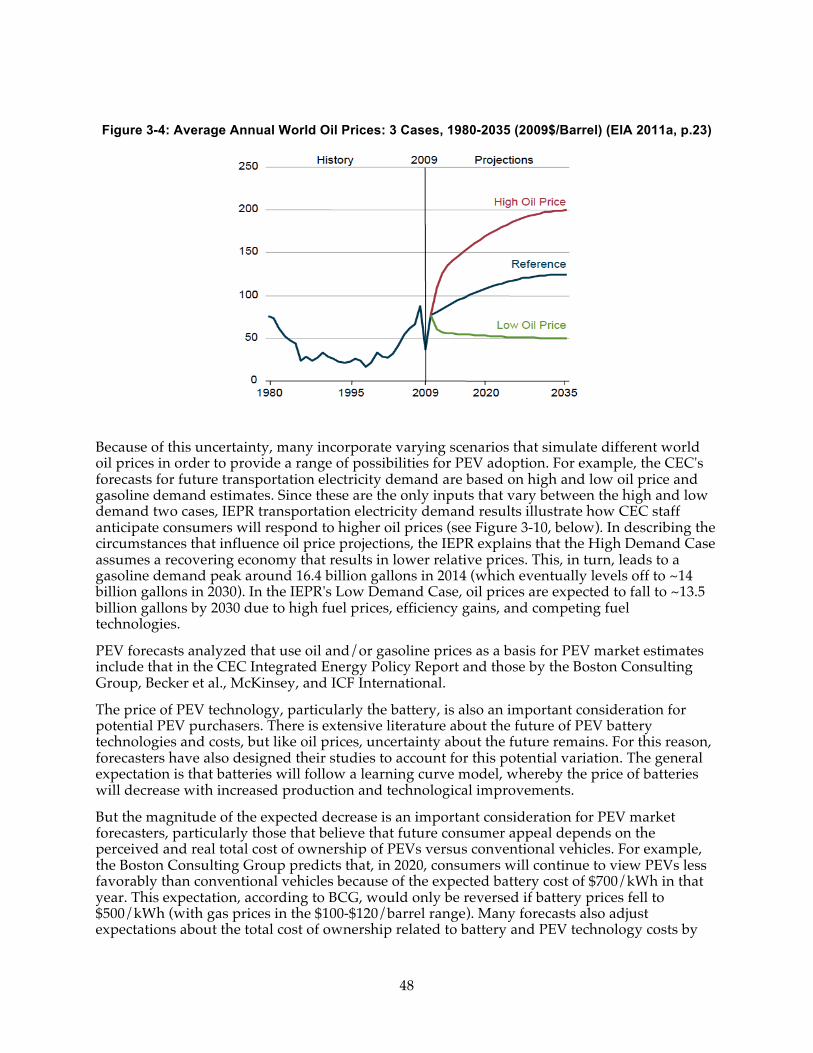
48
Figure 3-4: Average Annual World Oil Prices: 3 Cases, 1980-2035 (2009$/Barrel) (EIA 2011a, p.23)
Because of this uncertainty, many incorporate varying scenarios that simulate different world oil prices in order to provide a range of possibilities for PEV adoption. For example, the CEC's forecasts for future transportation electricity demand are based on high and low oil price and gasoline demand estimates. Since these are the only inputs that vary between the high and low demand two cases, IEPR transportation electricity demand results illustrate how CEC staff anticipate consumers will respond to higher oil prices (see Figure 3-10, below). In describing the circumstances that influence oil price projections, the IEPR explains that the High Demand Case assumes a recovering economy that results in lower relative prices. This, in turn, leads to a gasoline demand peak around 16.4 billion gallons in 2014 (which eventually levels off to ~14 billion gallons in 2030). In the IEPR's Low Demand Case, oil prices are expected to fall to ~13.5 billion gallons by 2030 due to high fuel prices, efficiency gains, and competing fuel technologies.
PEV forecasts analyzed that use oil and/or gasoline prices as a basis for PEV market estimates include that in the CEC Integrated Energy Policy Report and those by the Boston Consulting Group, Becker et al., McKinsey, and ICF International.
The price of PEV technology, particularly the battery, is also an important consideration for potential PEV purchasers. There is extensive literature about the future of PEV battery technologies and costs, but like oil prices, uncertainty about the future remains. For this reason, forecasters have also designed their studies to account for this potential variation. The general expectation is that batteries will follow a learning curve model, whereby the price of batteries will decrease with increased production and technological improvements.
But the magnitude of the expected decrease is an important consideration for PEV market forecasters, particularly those that believe that future consumer appeal depends on the perceived and real total cost of ownership of PEVs versus conventional vehicles. For example, the Boston Consulting Group predicts that, in 2020, consumers will continue to view PEVs less favorably than conventional vehicles because of the expected battery cost of $700/kWh in that year. This expectation, according to BCG, would only be reversed if battery prices fell to $500/kWh (with gas prices in the $100-$120/barrel range). Many forecasts also adjust expectations about the total cost of ownership related to battery and PEV technology costs by
49
Gasoline Price Per Gallon (or other response)
introducing subsidies or by varying battery ownership options in their models (Becker and Sidhu 2009).
The PEV forecasts analyzed that specifically consider PEV technology and battery costs include: IEPR, the CARB ZEV Review, Deutsche Bank, Becker et al., McKinsey, and ICF.
Public attitudes, perceptions, and knowledge about PEVs, future transportation fuels, and technology
Forecasters also recognize that consumer attitudes, perceptions, and knowledge of PEVs, future transportation fuels, air quality, environmental concerns, etc. are likely to influence future PEV adoption. To date, PEV market penetration has been limited because of consumers' lack of familiarity with PEVs, concerns about range anxiety, uncertainty about the costs and logistics of home charging, concerns about public charging infrastructure for "opportunity charging", and perceptions of the cost to buy and own a PEV.
Much of these barriers could be resolved with public outreach and education about PEVs, but sending clear messages to consumers is difficult when the public is often presented with conflicting and confusing information. For example, a recent Gallup and USA Today poll generated the following headlines: "Gallup poll shows 57% of Americans won't buy an electric vehicle" (Loveday 2011) and "Americans say no electric cars despite gas prices (Healey 2011). But close evaluation of this poll and its results revealed that the wording of the poll question likely influenced how people answered it. The question, "How high do you think gas prices would have to rise before you would buy an electric car that you could only drive for a limited number of miles at one time?" likely played off of already heightened sensitivity about range limitations. Also, this question may have confused people's understanding of the differences between BEVs and PHVs. Finally, while 57% of those polled indicated that they would not buy an EV regardless of gas prices, it is expected that some consumers (e.g., apartment dwellers) may not be able to easily adopt for other reasons (Williams and Kurani 2006). It is nevertheless meaningful to note how the percentage of would-be adopters increased with gasoline price hikes, despite the range limitation warning in the poll question. Figure 3-5 highlights this aspect of the poll results.
Figure 3-5: May 2011 Gallup/USA Today Poll Results [adapted from (Jacobe 2011)]
Question: How high do you think gas prices would have to rise before you would buy an electric car that you could only drive for a limited number of miles at one time?
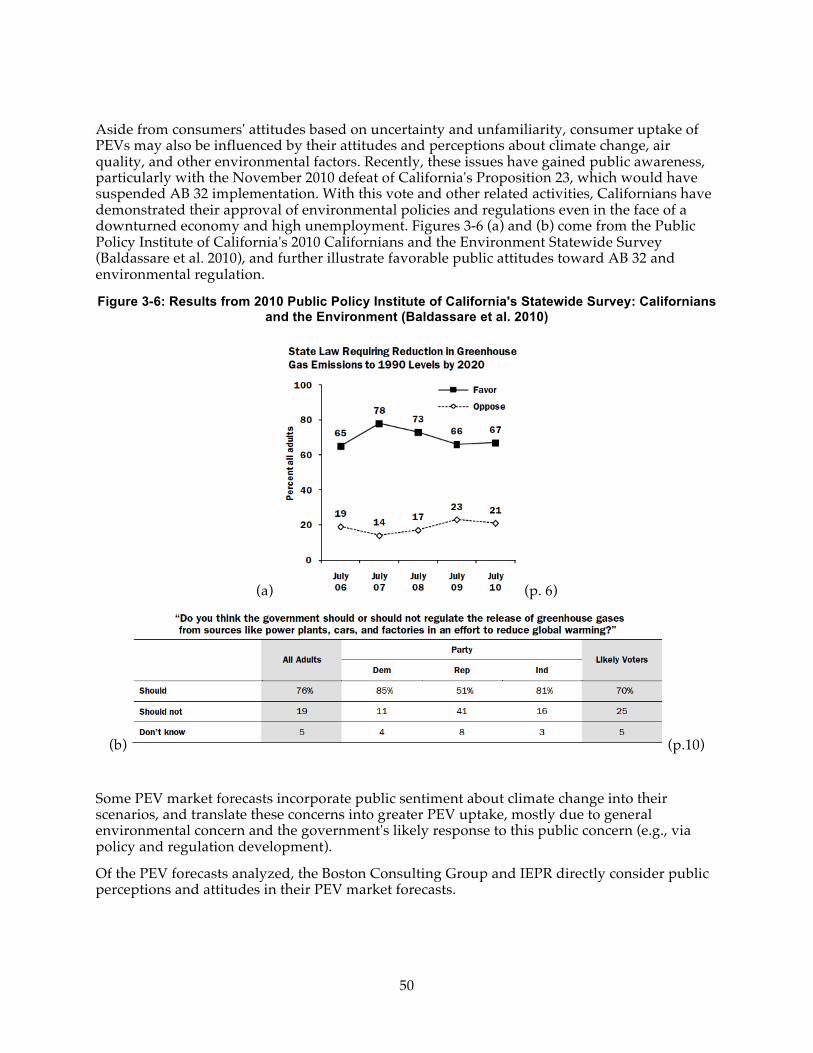
50
Aside from consumers' attitudes based on uncertainty and unfamiliarity, consumer uptake of PEVs may also be influenced by their attitudes and perceptions about climate change, air quality, and other environmental factors. Recently, these issues have gained public awareness, particularly with the November 2010 defeat of California's Proposition 23, which would have suspended AB 32 implementation. With this vote and other related activities, Californians have demonstrated their approval of environmental policies and regulations even in the face of a downturned economy and high unemployment. Figures 3-6 (a) and (b) come from the Public Policy Institute of California's 2010 Californians and the Environment Statewide Survey (Baldassare et al. 2010), and further illustrate favorable public attitudes toward AB 32 and environmental regulation.
Figure 3-6: Results from 2010 Public Policy Institute of California's Statewide Survey: Californians and the Environment (Baldassare et al. 2010)
(a) (p. 6)
(b) (p.10)
Some PEV market forecasts incorporate public sentiment about climate change into their scenarios, and translate these concerns into greater PEV uptake, mostly due to general environmental concern and the government's likely response to this public concern (e.g., via policy and regulation development).
Of the PEV forecasts analyzed, the Boston Consulting Group and IEPR directly consider public perceptions and attitudes in their PEV market forecasts.
51
Future government policies related to transportation and the environment.
Several forecasts place special emphasis on the role that government can and will play in the future PEV deployment. Government influence is expected to come in a variety of forms, ranging from mandates and laws—like the ZEV Regulation and Low Carbon Fuel Standard—to incentive programs for PEV purchasers, which research shows has provided a statistically significant stimulus for U.S. hybrid sales (Beresteanu and Li 2011). Of the studies analyzed, many designed scenarios that varied according to the level of government regulation and the types of incentives offered for PEVs.
The forecasts that explicitly used expectations about future government policies and regulations to predict future PEV deployment included: IEPR, the ZEV Review, TIAX, the Boston Consulting Group, Deutsche Bank, the Center for Entrepreneurship and Technology, McKinsey and ICF.
Examples of California-Specific PEV market forecasts This section highlights PEV/ZEV market forecasts conducted by TIAX (TIAX 2008), CEC for the 2009 Integrated Energy Policy Report (IEPR) (CEC 2009), and CARB for the 2009 ZEV Review (CARB 2009e). These forecasts were specifically chosen because they 1) focused on the California PEV market, 2) covered time scales and periods comparable to those guiding the scope of this project, 3) provide detailed information about how forecast results were generated. Both the TIAX and the 2009 IEPR market forecasts use a conventional approach that employ various inputs to generate a range of possible PEV populations for the time periods analyzed (TIAX: 2010–2010; IEPR: 2010–2030). The 2009 ZEV Review, on the other hand, starts from AB 32 and Executive Order GHG emissions reductions goals for 2020 and 2050 and determines the PEV penetration trajectory necessary to meet those targets.
TIAX (2008) In the study report, "Electric Transportation and Goods Movement Technologies in California: Technical Brief" (TIAX 2008). TIAX explains that the main the purpose of its PEV market analysis was to highlight potential differences in deployment trajectories as a result of business-as-usual versus more aggressive government policy and regulation. The study authors use 2002 as the baseline year, and from there develop PEV estimates based on natural market growth and two possible scenarios with varying governmental approaches. In the "Expected" scenario, government policies and regulations in the future follow a business-as-usual path and regulations and incentive programs previously adopted or expected are in effect. In TIAX's "Achievable" scenario, government regulations are expected to be more aggressive in order to stimulate a faster transition to PEVs. For instance, under this scenario, TIAX assumes that additional regulations or incentive programs (beyond what exists or is expected) could increase turnover of old equipment through scrapping, incentivizing purchase of newer equipment, and enacting additional fleet average emission requirement. In the achievable scenario, TIAX also places particular emphasis on government policies encouraging near-zero and zero emissions technologies along with mostly off-peak charging.
Table 3-3 shows forecasted vehicle populations in 2002 (baseline year), 2010, 2015, and 2030 for both Expected and Achievable scenarios.
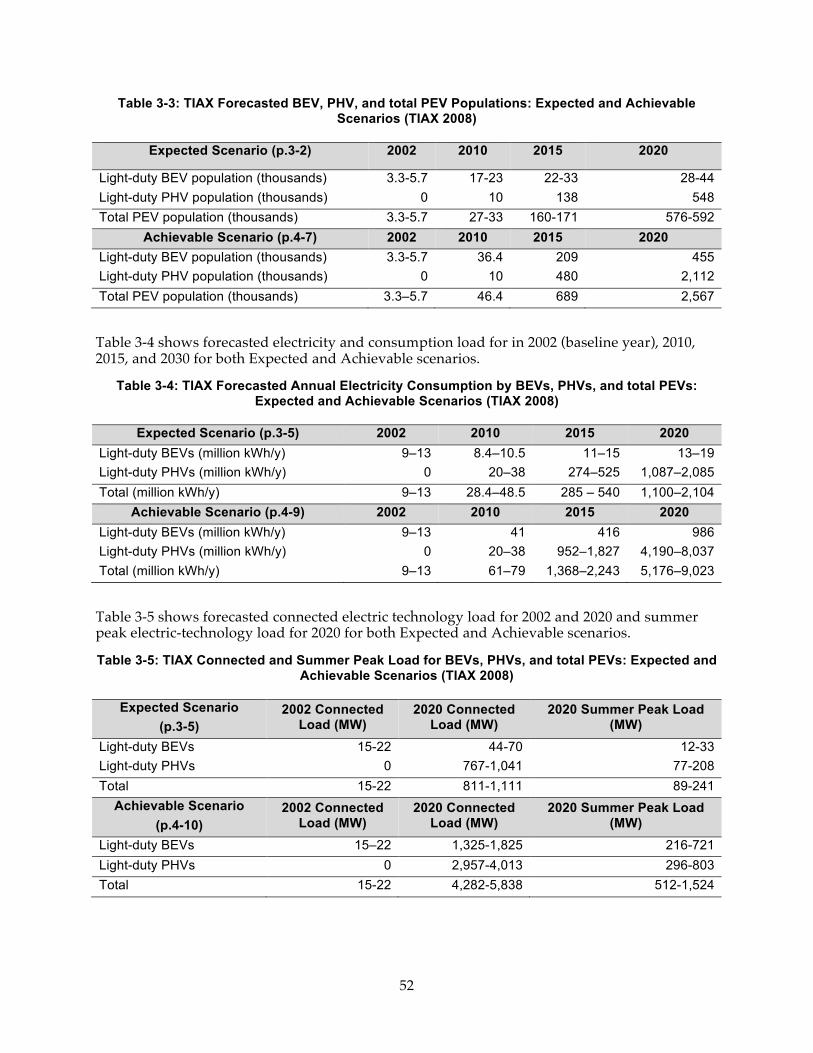
52
Table 3-3: TIAX Forecasted BEV, PHV, and total PEV Populations: Expected and Achievable Scenarios (TIAX 2008)
Expected Scenario (p.3-2) 2002 2010 2015 2020
Light-duty BEV population (thousands) 3.3-5.7 17-23 22-33 28-44 Light-duty PHV population (thousands) 0 10 138 548 Total PEV population (thousands) 3.3-5.7 27-33 160-171 576-592
Achievable Scenario (p.4-7) 2002 2010 2015 2020 Light-duty BEV population (thousands) 3.3-5.7 36.4 209 455 Light-duty PHV population (thousands) 0 10 480 2,112 Total PEV population (thousands) 3.3–5.7 46.4 689 2,567
Table 3-4 shows forecasted electricity and consumption load for in 2002 (baseline year), 2010, 2015, and 2030 for both Expected and Achievable scenarios.
Table 3-4: TIAX Forecasted Annual Electricity Consumption by BEVs, PHVs, and total PEVs: Expected and Achievable Scenarios (TIAX 2008)
Expected Scenario (p.3-5) 2002 2010 2015 2020 Light-duty BEVs (million kWh/y) 9–13 8.4–10.5 11–15 13–19 Light-duty PHVs (million kWh/y) 0 20–38 274–525 1,087–2,085 Total (million kWh/y) 9–13 28.4–48.5 285 – 540 1,100–2,104
Achievable Scenario (p.4-9) 2002 2010 2015 2020 Light-duty BEVs (million kWh/y) 9–13 41 416 986 Light-duty PHVs (million kWh/y) 0 20–38 952–1,827 4,190–8,037 Total (million kWh/y) 9–13 61–79 1,368–2,243 5,176–9,023
Table 3-5 shows forecasted connected electric technology load for 2002 and 2020 and summer peak electric-technology load for 2020 for both Expected and Achievable scenarios.
Table 3-5: TIAX Connected and Summer Peak Load for BEVs, PHVs, and total PEVs: Expected and Achievable Scenarios (TIAX 2008)
Expected Scenario (p.3-5)
2002 Connected Load (MW)
2020 Connected Load (MW)
2020 Summer Peak Load (MW)
Light-duty BEVs 15-22 44-70 12-33 Light-duty PHVs 0 767-1,041 77-208 Total 15-22 811-1,111 89-241
Achievable Scenario (p.4-10)
2002 Connected Load (MW)
2020 Connected Load (MW)
2020 Summer Peak Load (MW)
Light-duty BEVs 15–22 1,325-1,825 216-721 Light-duty PHVs 0 2,957-4,013 296-803 Total 15-22 4,282-5,838 512-1,524
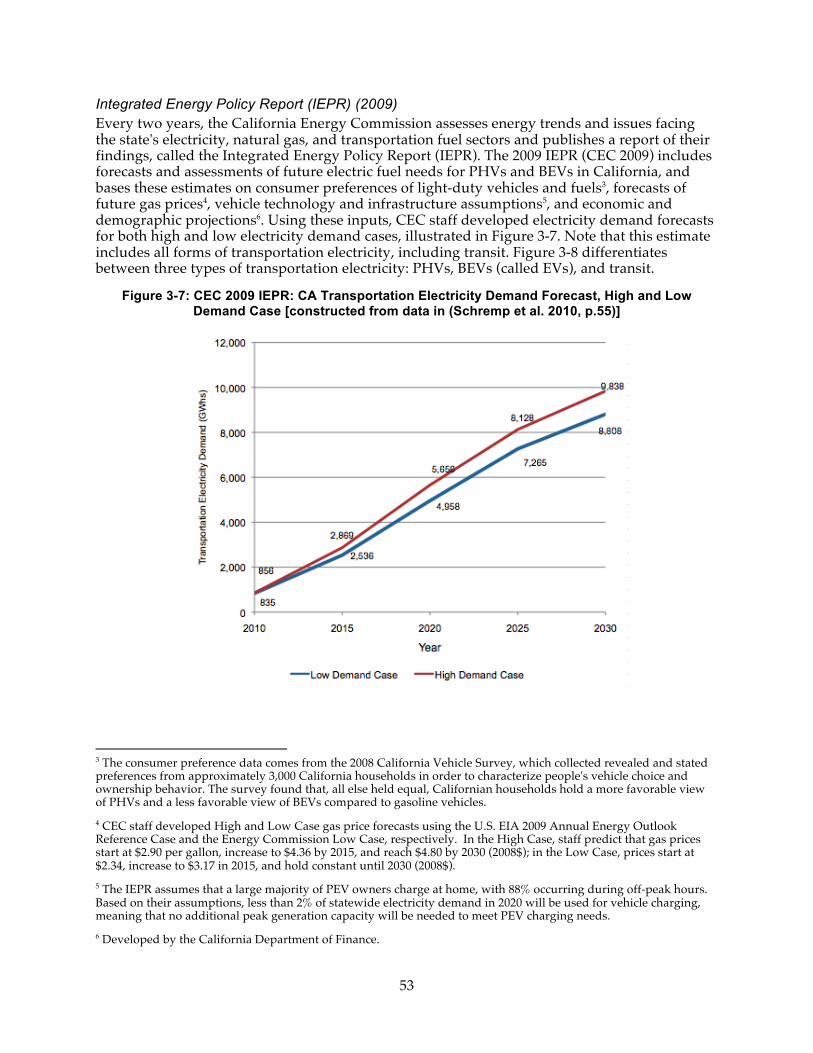
53
Integrated Energy Policy Report (IEPR) (2009) Every two years, the California Energy Commission assesses energy trends and issues facing the state's electricity, natural gas, and transportation fuel sectors and publishes a report of their findings, called the Integrated Energy Policy Report (IEPR). The 2009 IEPR (CEC 2009) includes forecasts and assessments of future electric fuel needs for PHVs and BEVs in California, and bases these estimates on consumer preferences of light-duty vehicles and fuels3, forecasts of future gas prices4, vehicle technology and infrastructure assumptions5, and economic and demographic projections6. Using these inputs, CEC staff developed electricity demand forecasts for both high and low electricity demand cases, illustrated in Figure 3-7. Note that this estimate includes all forms of transportation electricity, including transit. Figure 3-8 differentiates between three types of transportation electricity: PHVs, BEVs (called EVs), and transit.
Figure 3-7: CEC 2009 IEPR: CA Transportation Electricity Demand Forecast, High and Low Demand Case [constructed from data in (Schremp et al. 2010, p.55)]
3 The consumer preference data comes from the 2008 California Vehicle Survey, which collected revealed and stated preferences from approximately 3,000 California households in order to characterize people's vehicle choice and ownership behavior. The survey found that, all else held equal, Californian households hold a more favorable view of PHVs and a less favorable view of BEVs compared to gasoline vehicles. 4 CEC staff developed High and Low Case gas price forecasts using the U.S. EIA 2009 Annual Energy Outlook Reference Case and the Energy Commission Low Case, respectively. In the High Case, staff predict that gas prices start at $2.90 per gallon, increase to $4.36 by 2015, and reach $4.80 by 2030 (2008$); in the Low Case, prices start at $2.34, increase to $3.17 in 2015, and hold constant until 2030 (2008$). 5 The IEPR assumes that a large majority of PEV owners charge at home, with 88% occurring during off-peak hours. Based on their assumptions, less than 2% of statewide electricity demand in 2020 will be used for vehicle charging, meaning that no additional peak generation capacity will be needed to meet PEV charging needs. 6 Developed by the California Department of Finance.
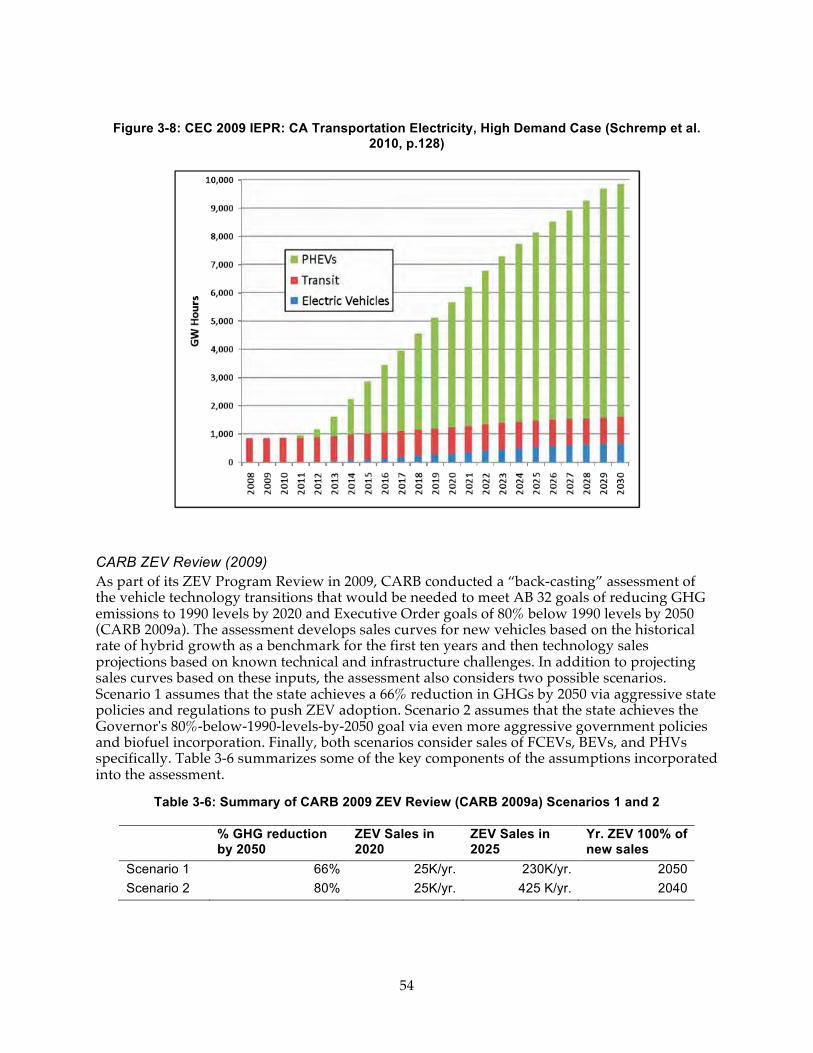
54
Figure 3-8: CEC 2009 IEPR: CA Transportation Electricity, High Demand Case (Schremp et al.
2010, p.128)
CARB ZEV Review (2009) As part of its ZEV Program Review in 2009, CARB conducted a “back-casting” assessment of the vehicle technology transitions that would be needed to meet AB 32 goals of reducing GHG emissions to 1990 levels by 2020 and Executive Order goals of 80% below 1990 levels by 2050 (CARB 2009a). The assessment develops sales curves for new vehicles based on the historical rate of hybrid growth as a benchmark for the first ten years and then technology sales projections based on known technical and infrastructure challenges. In addition to projecting sales curves based on these inputs, the assessment also considers two possible scenarios. Scenario 1 assumes that the state achieves a 66% reduction in GHGs by 2050 via aggressive state policies and regulations to push ZEV adoption. Scenario 2 assumes that the state achieves the Governor's 80%-below-1990-levels-by-2050 goal via even more aggressive government policies and biofuel incorporation. Finally, both scenarios consider sales of FCEVs, BEVs, and PHVs specifically. Table 3-6 summarizes some of the key components of the assumptions incorporated into the assessment.
Table 3-6: Summary of CARB 2009 ZEV Review (CARB 2009a) Scenarios 1 and 2
% GHG reduction by 2050
ZEV Sales in 2020
ZEV Sales in 2025
Yr. ZEV 100% of new sales
Scenario 1 66% 25K/yr. 230K/yr. 2050 Scenario 2 80% 25K/yr. 425 K/yr. 2040
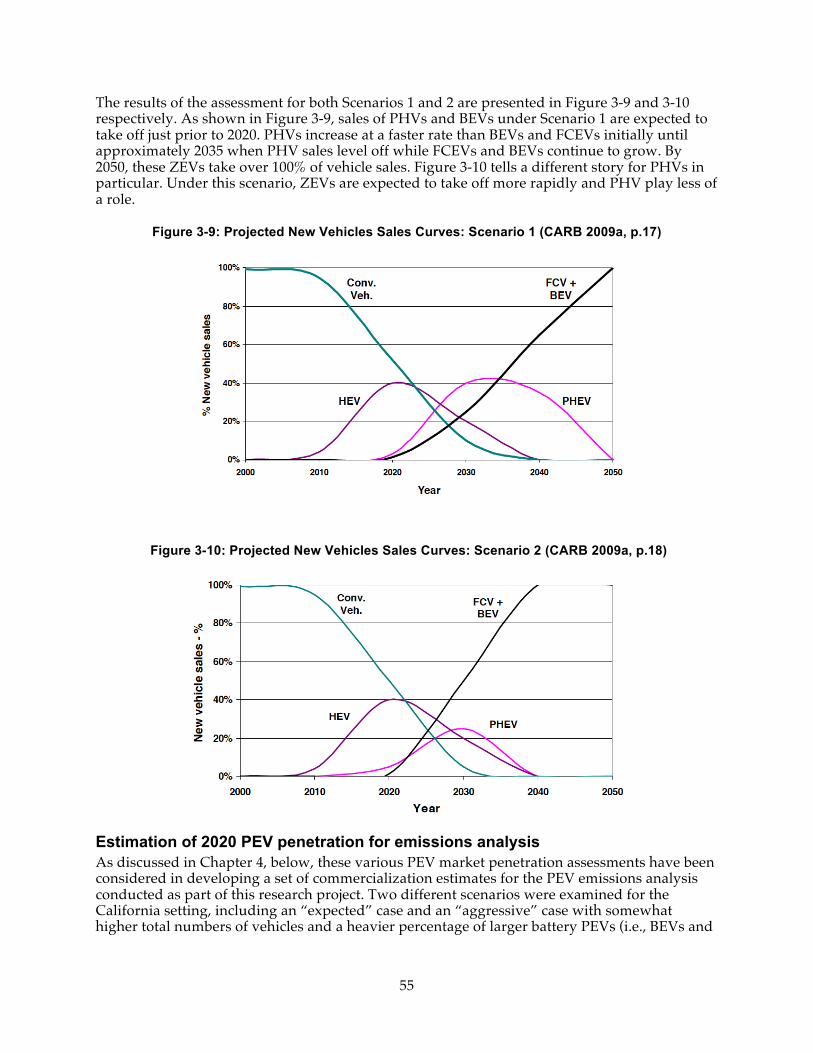
55
The results of the assessment for both Scenarios 1 and 2 are presented in Figure 3-9 and 3-10 respectively. As shown in Figure 3-9, sales of PHVs and BEVs under Scenario 1 are expected to take off just prior to 2020. PHVs increase at a faster rate than BEVs and FCEVs initially until approximately 2035 when PHV sales level off while FCEVs and BEVs continue to grow. By 2050, these ZEVs take over 100% of vehicle sales. Figure 3-10 tells a different story for PHVs in particular. Under this scenario, ZEVs are expected to take off more rapidly and PHV play less of a role.
Figure 3-9: Projected New Vehicles Sales Curves: Scenario 1 (CARB 2009a, p.17)
Figure 3-10: Projected New Vehicles Sales Curves: Scenario 2 (CARB 2009a, p.18)
Estimation of 2020 PEV penetration for emissions analysis As discussed in Chapter 4, below, these various PEV market penetration assessments have been considered in developing a set of commercialization estimates for the PEV emissions analysis conducted as part of this research project. Two different scenarios were examined for the California setting, including an “expected” case and an “aggressive” case with somewhat higher total numbers of vehicles and a heavier percentage of larger battery PEVs (i.e., BEVs and

56
larger battery PHVs). The specific estimates used are discussed in Chapter 4 in the context of other assumptions made for the PEV emissions and environmental impact assessment.
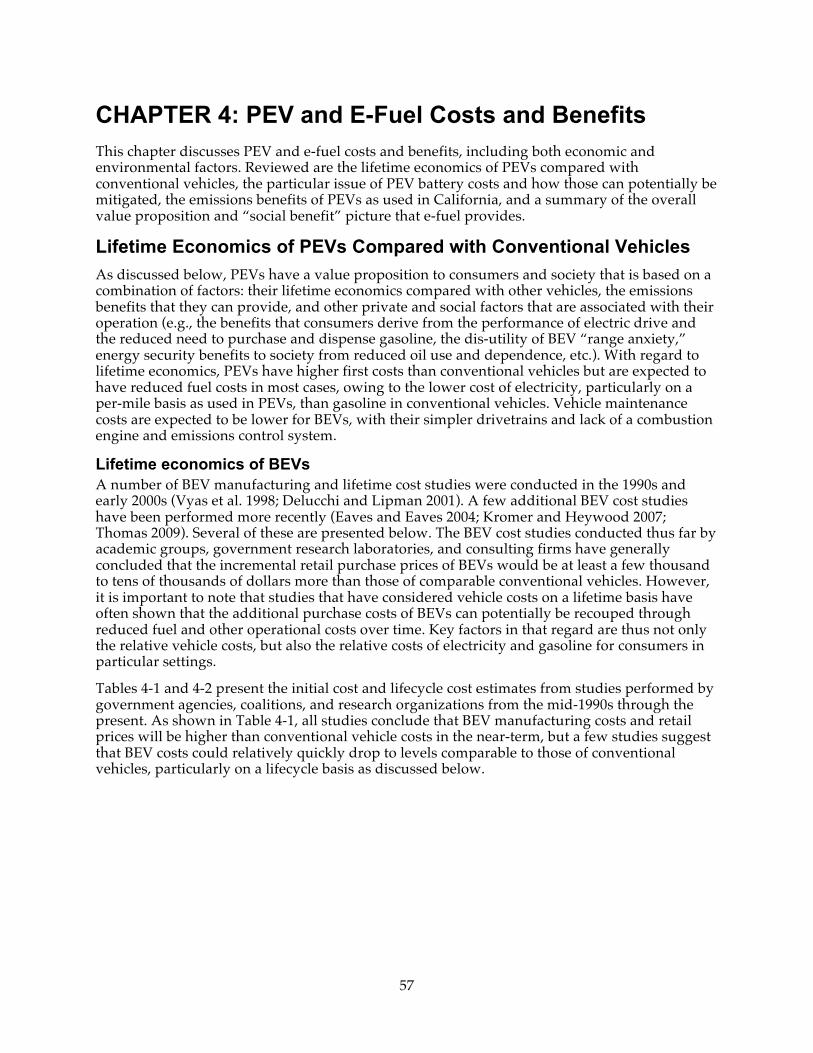
57
CHAPTER 4: PEV and E-Fuel Costs and Benefits This chapter discusses PEV and e-fuel costs and benefits, including both economic and environmental factors. Reviewed are the lifetime economics of PEVs compared with conventional vehicles, the particular issue of PEV battery costs and how those can potentially be mitigated, the emissions benefits of PEVs as used in California, and a summary of the overall value proposition and “social benefit” picture that e-fuel provides.
Lifetime Economics of PEVs Compared with Conventional Vehicles As discussed below, PEVs have a value proposition to consumers and society that is based on a combination of factors: their lifetime economics compared with other vehicles, the emissions benefits that they can provide, and other private and social factors that are associated with their operation (e.g., the benefits that consumers derive from the performance of electric drive and the reduced need to purchase and dispense gasoline, the dis-utility of BEV “range anxiety,” energy security benefits to society from reduced oil use and dependence, etc.). With regard to lifetime economics, PEVs have higher first costs than conventional vehicles but are expected to have reduced fuel costs in most cases, owing to the lower cost of electricity, particularly on a per-mile basis as used in PEVs, than gasoline in conventional vehicles. Vehicle maintenance costs are expected to be lower for BEVs, with their simpler drivetrains and lack of a combustion engine and emissions control system.
Lifetime economics of BEVs A number of BEV manufacturing and lifetime cost studies were conducted in the 1990s and early 2000s (Vyas et al. 1998; Delucchi and Lipman 2001). A few additional BEV cost studies have been performed more recently (Eaves and Eaves 2004; Kromer and Heywood 2007; Thomas 2009). Several of these are presented below. The BEV cost studies conducted thus far by academic groups, government research laboratories, and consulting firms have generally concluded that the incremental retail purchase prices of BEVs would be at least a few thousand to tens of thousands of dollars more than those of comparable conventional vehicles. However, it is important to note that studies that have considered vehicle costs on a lifetime basis have often shown that the additional purchase costs of BEVs can potentially be recouped through reduced fuel and other operational costs over time. Key factors in that regard are thus not only the relative vehicle costs, but also the relative costs of electricity and gasoline for consumers in particular settings.
Tables 4-1 and 4-2 present the initial cost and lifecycle cost estimates from studies performed by government agencies, coalitions, and research organizations from the mid-1990s through the present. As shown in Table 4-1, all studies conclude that BEV manufacturing costs and retail prices will be higher than conventional vehicle costs in the near-term, but a few studies suggest that BEV costs could relatively quickly drop to levels comparable to those of conventional vehicles, particularly on a lifecycle basis as discussed below.
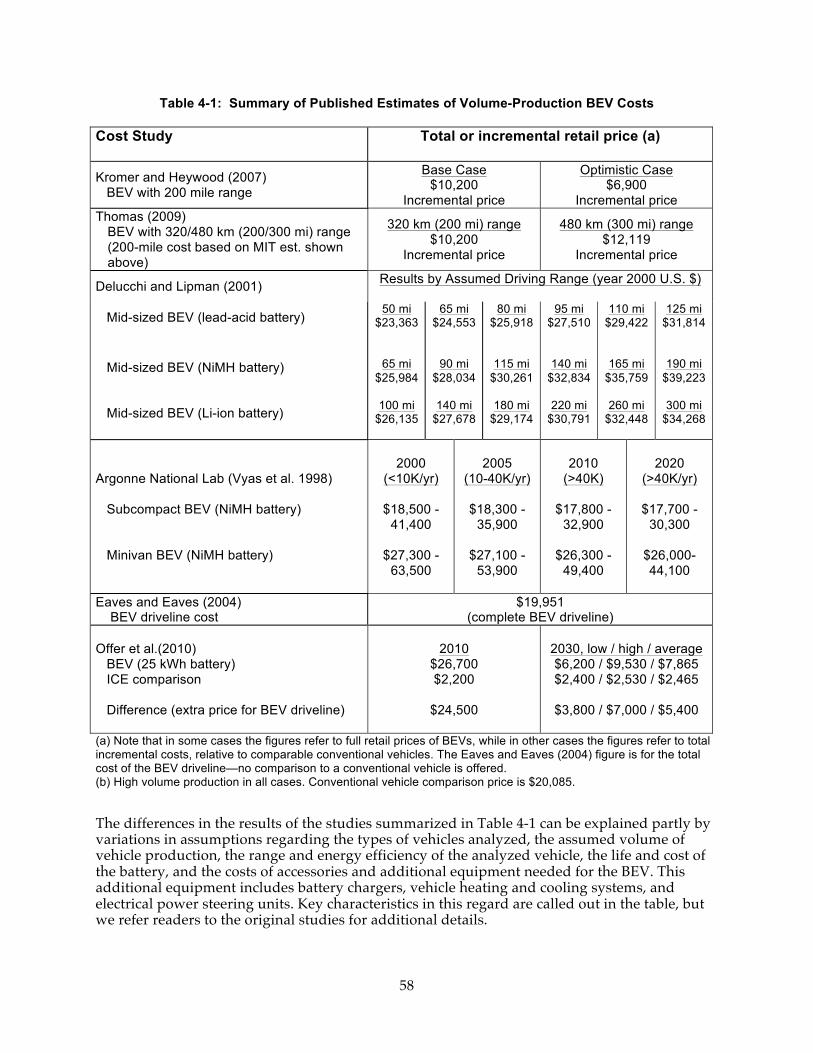
58
Table 4-1: Summary of Published Estimates of Volume-Production BEV Costs
Cost Study
Total or incremental retail price (a)
Kromer and Heywood (2007) BEV with 200 mile range
Base Case $10,200
Incremental price
Optimistic Case $6,900
Incremental price Thomas (2009)
BEV with 320/480 km (200/300 mi) range (200-mile cost based on MIT est. shown above)
320 km (200 mi) range $10,200
Incremental price
480 km (300 mi) range $12,119
Incremental price
Delucchi and Lipman (2001) Results by Assumed Driving Range (year 2000 U.S. $)
Mid-sized BEV (lead-acid battery) Mid-sized BEV (NiMH battery) Mid-sized BEV (Li-ion battery)
50 mi $23,363
65 mi $25,984
100 mi
$26,135
65 mi $24,553
90 mi $28,034
140 mi
$27,678
80 mi $25,918
115 mi $30,261
180 mi
$29,174
95 mi $27,510
140 mi $32,834
220 mi
$30,791
110 mi $29,422
165 mi $35,759
260 mi
$32,448
125 mi $31,814
190 mi $39,223
300 mi
$34,268
Argonne National Lab (Vyas et al. 1998) Subcompact BEV (NiMH battery) Minivan BEV (NiMH battery)
2000
(<10K/yr)
$18,500 - 41,400
$27,300 -
63,500
2005
(10-40K/yr)
$18,300 - 35,900
$27,100 -
53,900
2010
(>40K)
$17,800 - 32,900
$26,300 -
49,400
2020
(>40K/yr)
$17,700 - 30,300
$26,000-44,100
Eaves and Eaves (2004) BEV driveline cost
$19,951 (complete BEV driveline)
Offer et al.(2010) BEV (25 kWh battery) ICE comparison Difference (extra price for BEV driveline)
2010
$26,700 $2,200
$24,500
2030, low / high / average $6,200 / $9,530 / $7,865 $2,400 / $2,530 / $2,465
$3,800 / $7,000 / $5,400
(a) Note that in some cases the figures refer to full retail prices of BEVs, while in other cases the figures refer to total incremental costs, relative to comparable conventional vehicles. The Eaves and Eaves (2004) figure is for the total cost of the BEV driveline—no comparison to a conventional vehicle is offered. (b) High volume production in all cases. Conventional vehicle comparison price is $20,085.
The differences in the results of the studies summarized in Table 4-1 can be explained partly by variations in assumptions regarding the types of vehicles analyzed, the assumed volume of vehicle production, the range and energy efficiency of the analyzed vehicle, the life and cost of the battery, and the costs of accessories and additional equipment needed for the BEV. This additional equipment includes battery chargers, vehicle heating and cooling systems, and electrical power steering units. Key characteristics in this regard are called out in the table, but we refer readers to the original studies for additional details.
59
Overall, near-term BEV costs are estimated to be ten thousand dollars or more greater than comparable conventional vehicles, falling to a projected several thousand dollars ($3,500–$12,000) in the future in high-volume production in some studies (and depending on the size and type of battery pack assumed).
Some studies estimate the vehicle lifetime cost, which includes the costs of operating and maintaining the vehicles as well as purchasing them. As shown in Table 4-2, BEV lifecycle costs are typically somewhat higher than for conventional vehicles, but the results depend significantly on the gasoline price and (to a lesser extent) the electricity prices assumed. As discussed above, the addition of social costs adds more to the lifetime costs of conventional vehicles than BEVs—owing to lower emissions, oil-use, and noise from BEVs—by perhaps one cent per mile. This is a central estimate within a range of about one-half cent to four cents per mile on a vehicle lifetime cost basis (Delucchi and Lipman 2001).
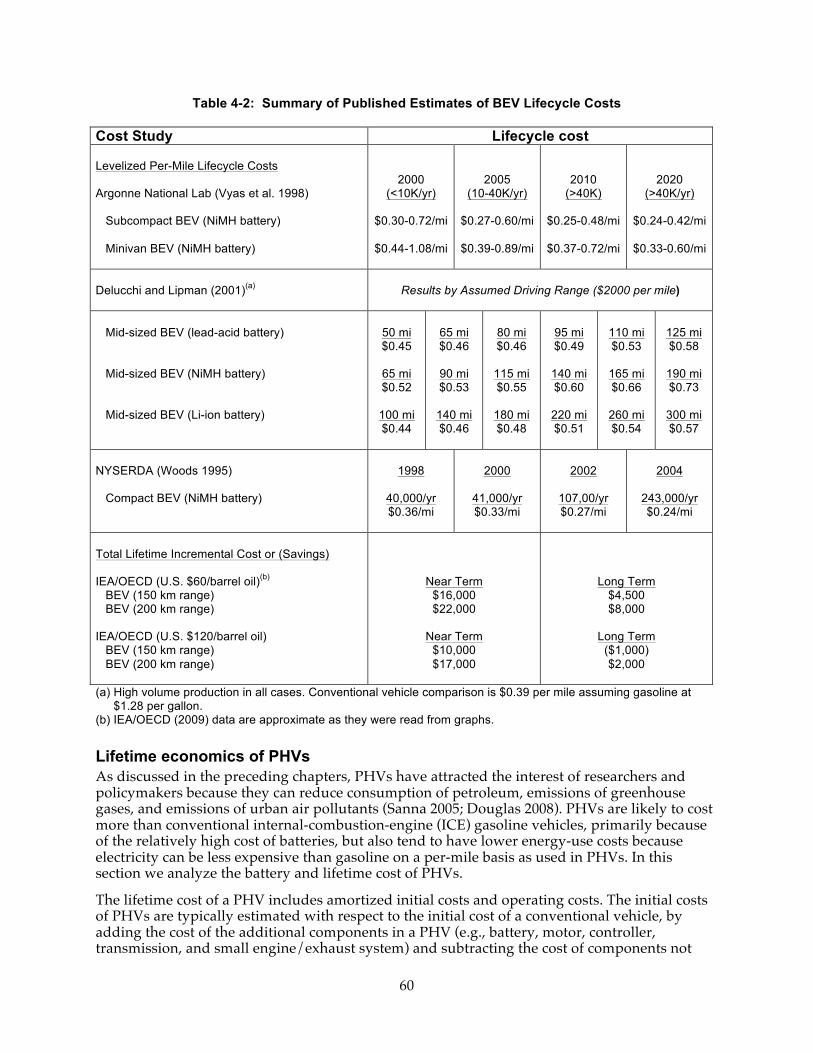
60
Table 4-2: Summary of Published Estimates of BEV Lifecycle Costs
Cost Study Lifecycle cost Levelized Per-Mile Lifecycle Costs Argonne National Lab (Vyas et al. 1998) Subcompact BEV (NiMH battery) Minivan BEV (NiMH battery)
2000 (<10K/yr)
$0.30-0.72/mi
$0.44-1.08/mi
2005 (10-40K/yr)
$0.27-0.60/mi
$0.39-0.89/mi
2010 (>40K)
$0.25-0.48/mi
$0.37-0.72/mi
2020 (>40K/yr)
$0.24-0.42/mi
$0.33-0.60/mi
Delucchi and Lipman (2001)(a)
Results by Assumed Driving Range ($2000 per mile)
Mid-sized BEV (lead-acid battery) Mid-sized BEV (NiMH battery) Mid-sized BEV (Li-ion battery)
50 mi $0.45
65 mi $0.52
100 mi $0.44
65 mi $0.46
90 mi $0.53
140 mi $0.46
80 mi $0.46
115 mi $0.55
180 mi $0.48
95 mi $0.49
140 mi $0.60
220 mi $0.51
110 mi $0.53
165 mi $0.66
260 mi $0.54
125 mi $0.58
190 mi $0.73
300 mi $0.57
NYSERDA (Woods 1995) Compact BEV (NiMH battery)
1998
40,000/yr $0.36/mi
2000
41,000/yr $0.33/mi
2002
107,00/yr $0.27/mi
2004
243,000/yr $0.24/mi
Total Lifetime Incremental Cost or (Savings) IEA/OECD (U.S. $60/barrel oil)(b)
BEV (150 km range) BEV (200 km range) IEA/OECD (U.S. $120/barrel oil) BEV (150 km range) BEV (200 km range)
Near Term $16,000 $22,000
Near Term
$10,000 $17,000
Long Term $4,500 $8,000
Long Term
($1,000) $2,000
(a) High volume production in all cases. Conventional vehicle comparison is $0.39 per mile assuming gasoline at $1.28 per gallon.
(b) IEA/OECD (2009) data are approximate as they were read from graphs. Lifetime economics of PHVs As discussed in the preceding chapters, PHVs have attracted the interest of researchers and policymakers because they can reduce consumption of petroleum, emissions of greenhouse gases, and emissions of urban air pollutants (Sanna 2005; Douglas 2008). PHVs are likely to cost more than conventional internal-combustion-engine (ICE) gasoline vehicles, primarily because of the relatively high cost of batteries, but also tend to have lower energy-use costs because electricity can be less expensive than gasoline on a per-mile basis as used in PHVs. In this section we analyze the battery and lifetime cost of PHVs.
The lifetime cost of a PHV includes amortized initial costs and operating costs. The initial costs of PHVs are typically estimated with respect to the initial cost of a conventional vehicle, by adding the cost of the additional components in a PHV (e.g., battery, motor, controller, transmission, and small engine/exhaust system) and subtracting the cost of components not
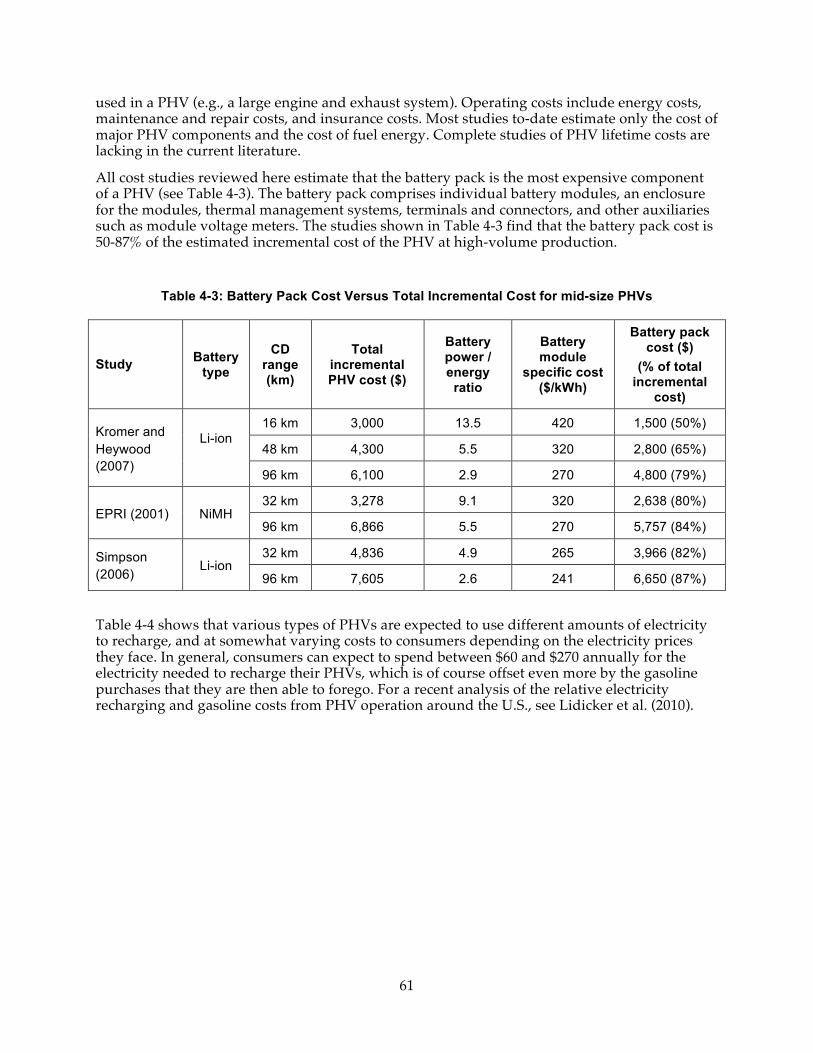
61
used in a PHV (e.g., a large engine and exhaust system). Operating costs include energy costs, maintenance and repair costs, and insurance costs. Most studies to-date estimate only the cost of major PHV components and the cost of fuel energy. Complete studies of PHV lifetime costs are lacking in the current literature.
All cost studies reviewed here estimate that the battery pack is the most expensive component of a PHV (see Table 4-3). The battery pack comprises individual battery modules, an enclosure for the modules, thermal management systems, terminals and connectors, and other auxiliaries such as module voltage meters. The studies shown in Table 4-3 find that the battery pack cost is 50-87% of the estimated incremental cost of the PHV at high-volume production.
Table 4-3: Battery Pack Cost Versus Total Incremental Cost for mid-size PHVs
Study Battery type
CD range (km)
Total incremental PHV cost ($)
Battery power / energy
ratio
Battery module
specific cost ($/kWh)
Battery pack cost ($)
(% of total incremental
cost)
Kromer and Heywood (2007)
Li-ion
16 km 3,000 13.5 420 1,500 (50%)
48 km 4,300 5.5 320 2,800 (65%)
96 km 6,100 2.9 270 4,800 (79%)
EPRI (2001) NiMH 32 km 3,278 9.1 320 2,638 (80%)
96 km 6,866 5.5 270 5,757 (84%)
Simpson (2006) Li-ion
32 km 4,836 4.9 265 3,966 (82%)
96 km 7,605 2.6 241 6,650 (87%)
Table 4-4 shows that various types of PHVs are expected to use different amounts of electricity to recharge, and at somewhat varying costs to consumers depending on the electricity prices they face. In general, consumers can expect to spend between $60 and $270 annually for the electricity needed to recharge their PHVs, which is of course offset even more by the gasoline purchases that they are then able to forego. For a recent analysis of the relative electricity recharging and gasoline costs from PHV operation around the U.S., see Lidicker et al. (2010).
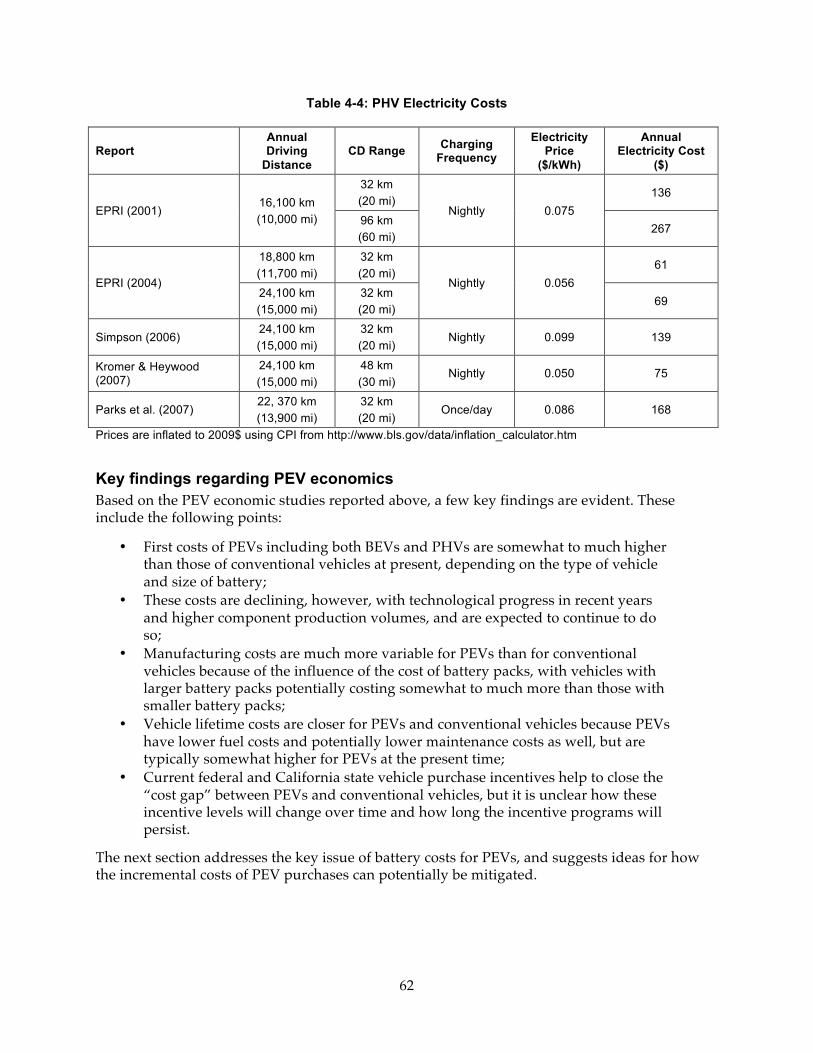
62
Table 4-4: PHV Electricity Costs
Report Annual Driving
Distance CD Range Charging
Frequency
Electricity Price
($/kWh)
Annual Electricity Cost
($)
EPRI (2001) 16,100 km (10,000 mi)
32 km (20 mi)
Nightly 0.075 136
96 km (60 mi)
267
EPRI (2004)
18,800 km (11,700 mi)
32 km (20 mi)
Nightly 0.056 61
24,100 km (15,000 mi)
32 km (20 mi)
69
Simpson (2006) 24,100 km (15,000 mi)
32 km (20 mi)
Nightly 0.099 139
Kromer & Heywood (2007)
24,100 km (15,000 mi)
48 km (30 mi)
Nightly 0.050 75
Parks et al. (2007) 22, 370 km (13,900 mi)
32 km (20 mi)
Once/day 0.086 168
Prices are inflated to 2009$ using CPI from http://www.bls.gov/data/inflation_calculator.htm
Key findings regarding PEV economics Based on the PEV economic studies reported above, a few key findings are evident. These include the following points:
• First costs of PEVs including both BEVs and PHVs are somewhat to much higher than those of conventional vehicles at present, depending on the type of vehicle and size of battery;
• These costs are declining, however, with technological progress in recent years and higher component production volumes, and are expected to continue to do so;
• Manufacturing costs are much more variable for PEVs than for conventional vehicles because of the influence of the cost of battery packs, with vehicles with larger battery packs potentially costing somewhat to much more than those with smaller battery packs;
• Vehicle lifetime costs are closer for PEVs and conventional vehicles because PEVs have lower fuel costs and potentially lower maintenance costs as well, but are typically somewhat higher for PEVs at the present time;
• Current federal and California state vehicle purchase incentives help to close the “cost gap” between PEVs and conventional vehicles, but it is unclear how these incentive levels will change over time and how long the incentive programs will persist.
The next section addresses the key issue of battery costs for PEVs, and suggests ideas for how the incremental costs of PEV purchases can potentially be mitigated.
63
Mitigating Battery First Cost as a Barrier to PEV and E-Fuel Adoption This section summarizes strategies for overcoming the significant hurdle to electric transportation fuel use presented by high battery costs. Generally speaking, strategies discussed include: reducing battery costs directly, finding appropriate markets and consumers, various forms of cost financing, and offsetting costs with secondary value—including post-vehicle stationary battery use and its possible effect on battery lease payments. Such stationary, post-vehicle “battery-to-grid” or B2G devices could not only provide valuable services needed by existing statewide grid-support markets, but could: provide customer-side-of-the meter benefits, improve utility operation, help defer costly grid upgrades, and support the profitability and penetration of wind power and other carbon-reduction measures.
Battery size Though large-battery plug-in vehicles would likely provide greater emissions and energy-dependence reductions, as discussed previously, spurring commercialization through policy support of lower-cost, lower-barrier technologies—e.g., small-battery, blended-mode plug-in hybrids—may lead to easier and quicker adoption of electric-fuel technologies. Not dependent on recharging, and thus able to utilize a sparser, cheaper, and less coordinated recharging infrastructure without significant compromise, plug-in hybrids face nontrivial but significantly lower infrastructure barriers while simultaneously benefiting from advances in the existing engine and fuel industries. With initial adoption of these electric-fuel technologies, the accordant changes in marketing, consumer behavior, supply channels, etc. may facilitate larger-scale shifts to electric-fuel implementation over time.
Additionally, policies that support road-load reductions produce efficient vehicle platforms, thereby reducing the power, energy, size, and cost of the batteries and other electric-fuel technologies required.
Production volume and markets Per unit battery costs can be reduced through materials and process improvements, and by spreading costs over a larger volume of production. Production volume can be increased by targeting high-volume applications and through standardization of battery cells or modules for use across multiple applications. Automakers and suppliers are pursuing strategies to expand the production volume of electric-drive technologies through supply to various partners and otherwise competitors, even to the extent of one automaker producing vehicles to be branded and sold by another.
Previous studies find that one-third (Williams and Kurani 2006), possibly up to one-half (Axsen and Kurani 2008), of Californians appear pre-adapted to early plug-in vehicle adoption or otherwise able to use plug-in vehicles. They represent the maximum, though not immutable, initial market potential, from which light-duty plug-in vehicle sales will likely be drawn, forming the buy-down base for the incremental costs of the required innovations.
Beyond this private-vehicle market segment, various opportunities exist for supporting commercialization in organizational fleets. Fleets have long been thought of as a promising mechanism by which alternative-fuel vehicles might somehow gain a foothold and increase volume. While significant overall progress in alt.-fuel vehicle commercialization remains elusive in fleets, a discussion of the suitability of using fleets as plug-in-vehicle niches is presented by Williams and Lipman (2009)—upon which this section is based—using several high-tech strategic marketing principles of particular relevance to electric-fuel commercialization. These marketing principles are expanded in a discussion of early adopters and consumer willingness/ability to pay. Collectively, this discussion informs how to better support the dynamics of electric-fuel innovation and commercialization.
64
Financing mechanisms Consumers pay for cars and their use in various ways, each presenting a leverage point for policies hoping to support electric-fuel use. Tax credits, grants, feebates (i.e., revenue- and potentially vehicle-size-neutral rebates on efficient vehicles coupled with fees on inefficient ones), and non-monetary benefits such as carpool and parking privileges are all policies in active use that can be targeted to encourage electric-fuel use and ameliorate battery first cost hurdles. Additionally, a form of state-backed (but perhaps not directly subsidized) low-interest loan program for PEV or battery purchases might be contemplated.
Further, various creative financial frameworks could help consumers pay for plug-in vehicles. One example (Lemoine 2008), goes beyond the net-present-value of cycle-life cash flows and uses a “real options” framework that values future streams of fuel choice options provided by plug-in hybrids, which, if accounted for and incorporated into new business models, reportedly raises the break-even battery price ~$100/kWh. In another illustrative example (BerkeleyFIRST 2008), municipalities are developing financing to pay for home solar installations to be repaid by the homeowner via property-tax assessments, thereby: dramatically reducing consumer upfront cost and credit implications and transferring the debt to low-rate equity/mortgage financing. Such systems could be adapted directly or analogously to help finance home electrical service upgrades and recharging facilities, if not battery and plug-in vehicle technologies.
Battery leasing Battery leasing is a potentially powerful mechanism that could allow plug-ins to compete on a favorable basis, shifting the terms of the business case from upfront, capital costs to lifecycle costs. It could give battery suppliers a profit-margin incentive to develop long-lasting, recyclable batteries and drivers piece-of-mind, consistent “fuel” charges, and the incentive to maximize zero-tailpipe-emission, efficient electric-fuel use. A leased battery also need not last the life of the car, but could be periodically replaced without disrupting the service contract with the consumer, e.g., during routine maintenance at increasingly longer intervals as the technology matures. Depending on the business model, challenges include multiple-party coordination for product development, standardization, marketing, sales, and service/warranty. Additional challenges stem from (among other sources): variable use by different customers with different use and charging patterns, and multiple battery chemistries and requirements.
Strategies for the electric-fuel transition Working in concert, several strategies discussed in this section could be employed to alter the early commercialization picture for electric-fuel vehicles in California. Like the vehicles they help, these strategies straddle automotive and electrical-energy worlds, embracing their convergence. They include: battery downsizing, standardization, and leasing, with repurposing/down-cycling into stationary use for building and grid-support services.
Williams and Lipman (2011, forthcoming) show that strategies for capturing “second-life” battery value in stationary applications, could in principle help to reduce the estimated initial lease prices of new plug-in vehicle batteries. Such post-vehicle, stationary “battery-to-grid” (B2G) devices could not only provide valuable services needed by existing statewide grid-support markets, but could: provide customer-side-of-the meter benefits, offer demand-response services, improve utility operation, help defer costly grid upgrades, and support the profitability and penetration of wind power and other carbon-reduction measures.
Third-party or other non-conventional ownership arrangements and battery leasing might not only align incentives for battery improvements and full and responsible use, but may allow the net-present-value of these and other battery services to be accounted for in the initial vehicle transaction, lowering costs, and easing initial design and commercialization expectations.
65
Of course, the full realization of benefits is predicated upon several assumptions and pre-conditions, requiring coordination, standardization, and granting second-life B2G units access to several existing and future markets. Initial policy steps already identified that would allow or improve the strategies like those described here include modifying certificating procedures to include battery storage devices as CAISO generating units, further rewarding fast-response units in proportion to their operational and other benefits, and providing investment incentives (Hawkins 2008).
Additionally, further analysis should weigh the benefits of implementing household/building B2G (in both the current context and the context of the coming “smart grid” wherein household device control may be implemented for other reasons anyway) vs. spatially aggregating B2G units into “battery-pack power plants” or demand-response units, which should have economies of capital, operational, and transactional scale and simplify certain challenges.
Given the many potential benefits to the grid, third-party ownership and/or rate-based utility investment in such batteries may be justified, or even encouraged by state and national policy (though the CPUC seems to be moving in the opposite direction—see Chapter 2)—strengthening ever-tightening connections between transportation and stationary energy and helping to launch a new era of electric-fuel technologies. Estimation of the full range of ratepayer benefits from utility involvement in electric-fuel vehicles in general will be important to the further development of these possibilities, but initial evaluation indicates ratepayer benefit could be considerable, through higher off-peak grid utilization, greater acceptance of intermittent renewables, and additional grid-support services. To meet its various challenging policy goals (e.g., carbon reduction), California could leverage PEV-related grid-storage benefits to help launch electric-fuel-vehicle implementation.
As battery costs are expected to fall over time, efforts should focus on reducing barriers to adoption in the near term in order to increase consumer experience and familiarity; establish markets, supply chains, and infrastructure; and to build production volumes. Battery lease models offer one mechanism for helping to establish a framework for capturing battery values throughout their life cycle. Private and public involvement, through vehicle incentives (Chapter 2), battery leasing and the establishment of stationary applications for plug-in-vehicle batteries, in conjunction with other efforts to help provide recharging and electric power metering infrastructure, could be important to improving the likelihood of success of the current attempts to commercialize electric-fuel vehicles.
Emissions Impacts and Values in California This section examines the emission-related costs and benefits of PEVs in California. It is widely regarded that in California PEVs will produce environmental benefits by shifting emissions from relatively dirty, high exposure vehicle tailpipes to relatively clean, low-exposure power plant stacks. Yet the magnitude and incidence of these benefits remain open questions, with several key complexities involved.
In fact, a wide variety of factors such as level of PEV penetration, patterns of use and charging, and interactions with the electric grid will determine how much and where emissions are reduced. The size and location of emissions reductions in turn determine impacts on human health and economic productivity. In the best case, relatively clean power plants with few people nearby or downwind will come online as a result of PEV charging. The possibility exists, however, that PEV electric demand causes dirtier or high exposure generators to online. In this case, reduced tailpipe emissions, at least within a local hotspot, could be offset by added stack emissions.
66
To understand the environmental impacts of e-fuel scale-up, this project develops and analyzes a case study of the nine-county San Francisco Bay Area in 2020. Four scenarios—representing different assumptions about vehicle penetration and charging activities—are used to bound estimates of displaced gasoline miles and added electric demand. A series of models, described later in this section, are then employed to estimate reductions in tailpipe emissions and added power plant emissions, and to assess and monetize the impacts of these emissions changes. Emissions are estimated at the county level to account for the spatial dependence of environmental impacts.
This chapter does not present a full-fledged benefit-cost assessment, or even a full treatment of the range of benefits to society from PEV adoption. In particular, the analysis here does not integrate the private costs of PEV ownership discussed above, and misses some major types of environmental damages from gasoline vehicles that will be mitigated by PEV adoption. The more humble goals of this report section are: 1) to assess the magnitude of two major categories of environmental benefit from PEVs and compare the social benefit to levels of subsidy being offered for PEVs, and 2) to consider the distribution of benefits across counties and determine whether the siting of electric generators and pollution dispersion patterns will make some counties net environmental losers (as the region as a whole is a net beneficiary from PEV adoption). In pursuit of the first goal, this chapter considers human health damages from emissions of criteria air pollutants (CAPs) as well as climate change contributing greenhouse gas emissions (GHGs). The second goal, meanwhile, is addressed through the use of an impact assessment model that models atmospheric air quality dynamics and human dose-response, and also monetizes impacts.
The analysis presented here is the joint work of a project team consisting of the Transportation Sustainability Research Center (TSRC) and Energy and Environmental Economics, Inc. (E3).
Modeling framework Figure 4-1 below illustrates the flow of work in this analysis. In the first stages, PEV market penetration levels (discussed below) and PEV usage and vehicle design characterizations (summarized in Table 4-5 below) were combined to determine an annual electric vehicle miles traveled (VMT) in California. Annual electric VMT then formed the basis for two branches of analysis corresponding to reduced tailpipe emissions and added stack emissions. Changes in both criteria air pollutants including oxides of nitrogen, volatile organic compounds, oxides of sulfur, and ultrafine particulates (NOx, VOCs, SOx, and PM2.5) and greenhouse gases including carbon dioxide and methane (CO2 and CH4, expressed as CO2e) were considered.
To estimate added power plant emissions, annual electric VMT was allocated to the 8760 hours of the year according to different charging profiles (assumptions about the time-of-day that users will charge PEVs, discussed below). A grid dispatch model (the PLEXOS production simulation model, discussed below) was then used to determine which power plants would come online as a result of PEV charging. Finally, ARB emission factors for existing generators were used to determine added emissions due to PEV charging; to account for modeling uncertainty and for compatibility with the risk assessment model used in this analysis, power plant emissions were aggregated to the county level.7
7 Grid dispatch modeling results can be believed with greater confidence at higher levels of aggregation (See section on PLEXOS model).
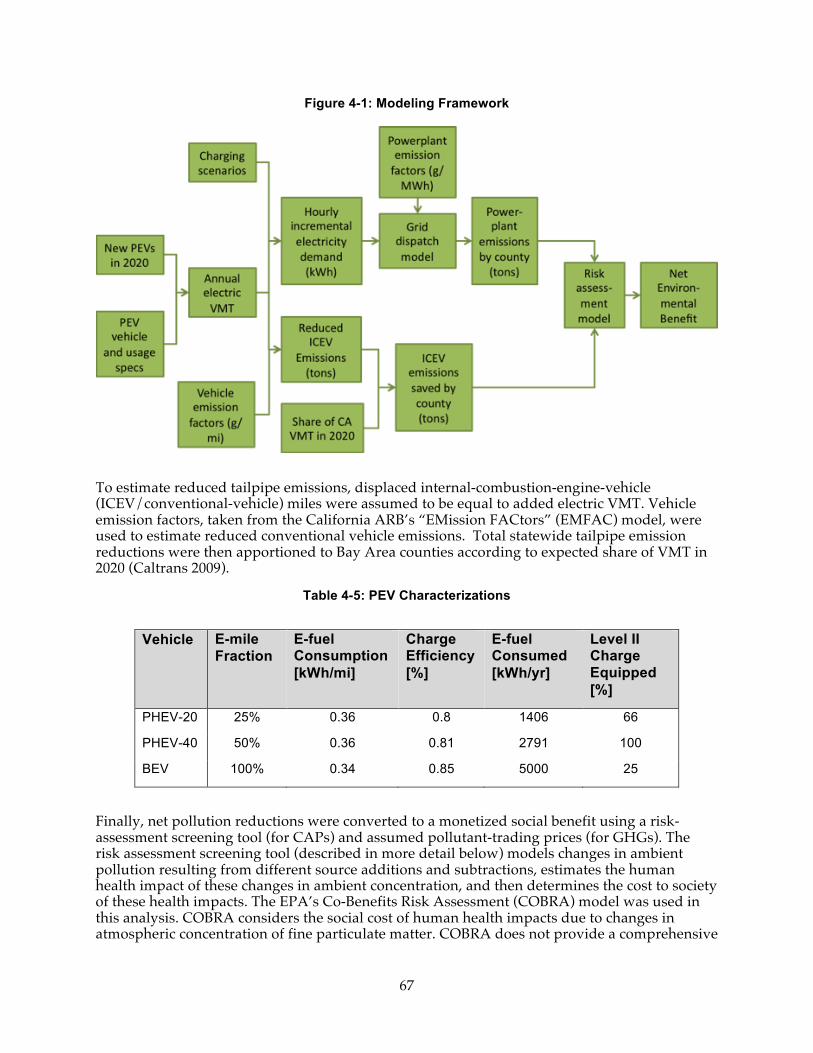
67
Figure 4-1: Modeling Framework
To estimate reduced tailpipe emissions, displaced internal-combustion-engine-vehicle (ICEV/conventional-vehicle) miles were assumed to be equal to added electric VMT. Vehicle emission factors, taken from the California ARB’s “EMission FACtors” (EMFAC) model, were used to estimate reduced conventional vehicle emissions. Total statewide tailpipe emission reductions were then apportioned to Bay Area counties according to expected share of VMT in 2020 (Caltrans 2009).
Table 4-5: PEV Characterizations
Vehicle E-mile Fraction
E-fuel Consumption[kWh/mi]
Charge Efficiency [%]
E-fuel Consumed [kWh/yr]
Level II Charge Equipped [%]
PHEV-20 25% 0.36 0.8 1406 66
PHEV-40 50% 0.36 0.81 2791 100
BEV 100% 0.34 0.85 5000 25
Finally, net pollution reductions were converted to a monetized social benefit using a risk-assessment screening tool (for CAPs) and assumed pollutant-trading prices (for GHGs). The risk assessment screening tool (described in more detail below) models changes in ambient pollution resulting from different source additions and subtractions, estimates the human health impact of these changes in ambient concentration, and then determines the cost to society of these health impacts. The EPA’s Co-Benefits Risk Assessment (COBRA) model was used in this analysis. COBRA considers the social cost of human health impacts due to changes in atmospheric concentration of fine particulate matter. COBRA does not provide a comprehensive
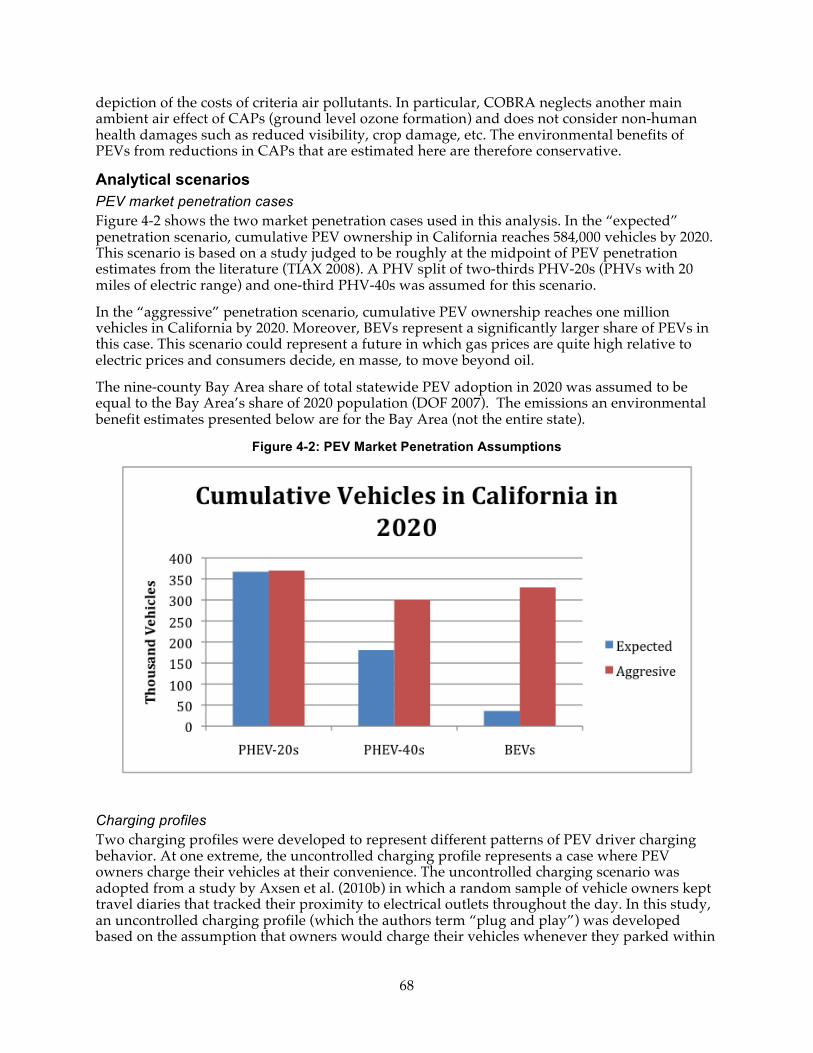
68
depiction of the costs of criteria air pollutants. In particular, COBRA neglects another main ambient air effect of CAPs (ground level ozone formation) and does not consider non-human health damages such as reduced visibility, crop damage, etc. The environmental benefits of PEVs from reductions in CAPs that are estimated here are therefore conservative.
Analytical scenarios PEV market penetration cases Figure 4-2 shows the two market penetration cases used in this analysis. In the “expected” penetration scenario, cumulative PEV ownership in California reaches 584,000 vehicles by 2020. This scenario is based on a study judged to be roughly at the midpoint of PEV penetration estimates from the literature (TIAX 2008). A PHV split of two-thirds PHV-20s (PHVs with 20 miles of electric range) and one-third PHV-40s was assumed for this scenario.
In the “aggressive” penetration scenario, cumulative PEV ownership reaches one million vehicles in California by 2020. Moreover, BEVs represent a significantly larger share of PEVs in this case. This scenario could represent a future in which gas prices are quite high relative to electric prices and consumers decide, en masse, to move beyond oil.
The nine-county Bay Area share of total statewide PEV adoption in 2020 was assumed to be equal to the Bay Area’s share of 2020 population (DOF 2007). The emissions an environmental benefit estimates presented below are for the Bay Area (not the entire state).
Figure 4-2: PEV Market Penetration Assumptions
Charging profiles Two charging profiles were developed to represent different patterns of PEV driver charging behavior. At one extreme, the uncontrolled charging profile represents a case where PEV owners charge their vehicles at their convenience. The uncontrolled charging scenario was adopted from a study by Axsen et al. (2010b) in which a random sample of vehicle owners kept travel diaries that tracked their proximity to electrical outlets throughout the day. In this study, an uncontrolled charging profile (which the authors term “plug and play”) was developed based on the assumption that owners would charge their vehicles whenever they parked within
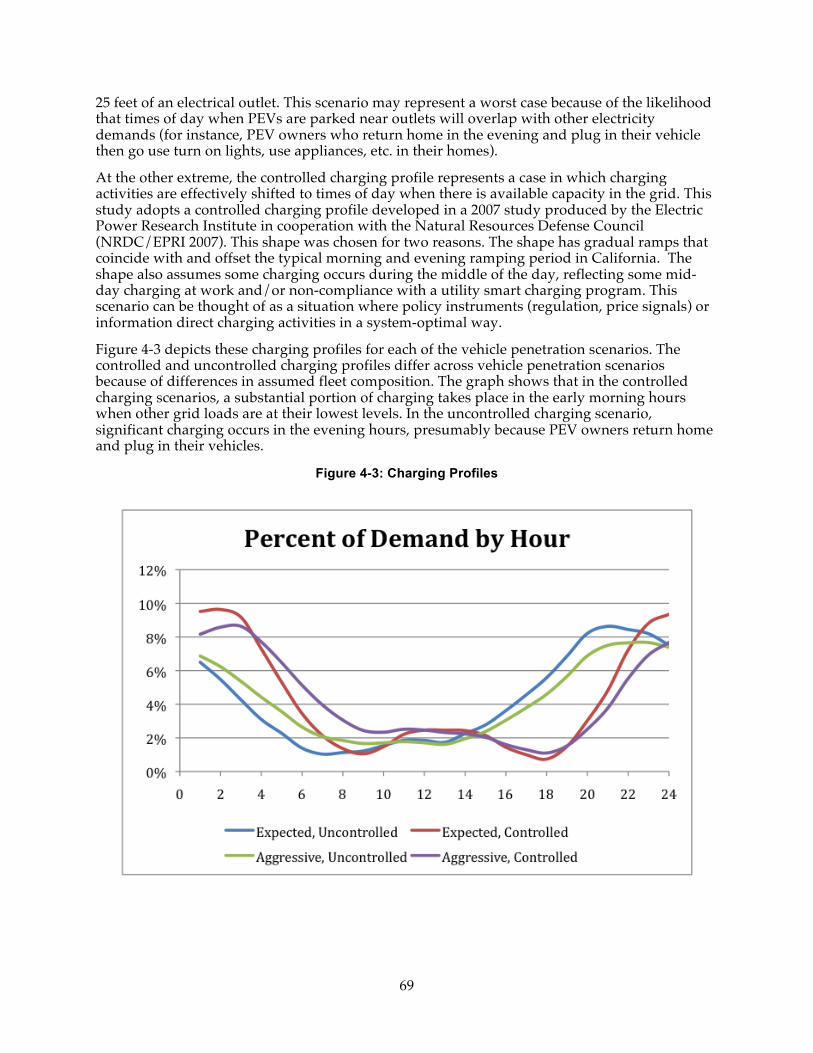
69
25 feet of an electrical outlet. This scenario may represent a worst case because of the likelihood that times of day when PEVs are parked near outlets will overlap with other electricity demands (for instance, PEV owners who return home in the evening and plug in their vehicle then go use turn on lights, use appliances, etc. in their homes).
At the other extreme, the controlled charging profile represents a case in which charging activities are effectively shifted to times of day when there is available capacity in the grid. This study adopts a controlled charging profile developed in a 2007 study produced by the Electric Power Research Institute in cooperation with the Natural Resources Defense Council (NRDC/EPRI 2007). This shape was chosen for two reasons. The shape has gradual ramps that coincide with and offset the typical morning and evening ramping period in California. The shape also assumes some charging occurs during the middle of the day, reflecting some mid-day charging at work and/or non-compliance with a utility smart charging program. This scenario can be thought of as a situation where policy instruments (regulation, price signals) or information direct charging activities in a system-optimal way.
Figure 4-3 depicts these charging profiles for each of the vehicle penetration scenarios. The controlled and uncontrolled charging profiles differ across vehicle penetration scenarios because of differences in assumed fleet composition. The graph shows that in the controlled charging scenarios, a substantial portion of charging takes place in the early morning hours when other grid loads are at their lowest levels. In the uncontrolled charging scenario, significant charging occurs in the evening hours, presumably because PEV owners return home and plug in their vehicles.
Figure 4-3: Charging Profiles
70
Description of component models PLEXOS production simulation model The power plant emission impacts were estimated using the PLEXOS production simulation model. This tool contains a detailed nodal model of the entire Western Electricity Coordinating Council (WECC) region including individual generators, transmission lines, loads, and fuel prices. The PLEXOS model dispatches the system at least cost, subject to constraints such as transmission limits using an optimization algorithm, and reports CO2 emissions and generation for each plant in 2008 and 2020. The PLEXOS dispatch is used to estimate ‘cost-based’ electricity market prices, emissions levels of generators, and feasibility of the overall dispatch, which are then used to verify that sufficient resources exist on the system for reliable operation.
The project team used PLEXOS model runs performed by Energy and Environmental Economics and PLEXOS Solutions for the CPUC’s Greenhouse Gas Modeling of California’s Electricity Sector to 2020 Report (E3 2010b). As part of that study, two model runs were performed for 2020 AB 32 compliant scenarios, one with an additional 500 MW of electric load. The different output of individual generators between the two runs is used to estimate how each generator will respond to an increase in load. For this study, the increase in the output of each individual generator is increased proportionally to meet the PEV charging requirements.
Production simulation can model how the electric grid will respond to changes such as increased renewables penetration or the addition of new transmission lines. Changes in generation by type or by region are useful metrics for comparison between scenarios. Changes in the modeled output of a specific plant are not necessarily representative, as there are numerous localized factors and differences in plant operations than cannot be incorporated in such a large-scale model. The project team therefore chose to aggregate the generation impacts at the county level for this study.
Emission factors Two sources of emission factors were used for this analysis. The EMFAC2007 model was used to determine emission rates for light-duty passenger vehicles (CARB 2006). EMFAC takes into account a variety of factors that determine vehicle emissions including year, month, and season, ambient temperature, relative humidity, vehicle population, mileage accrual, and travel speeds. For this analysis, a 2020 model run of vehicles in the Bay Area was used to obtain average emission rates.
There are two approaches to applying emissions factors for power plants: plant-specific and generic. In this analysis we applied generic emissions factors for plant types based on CARB recommended emissions factors for existing power plants (E3 2010a). Units with a heat rate above 9000 British thermal units (BTU) per kWh were assumed to be peaker natural gas units and those below were assumed to be baseload natural gas units. These emission factors were matched to the specific plants that the PLEXOS model indicated would come online through the year as a result of PEV charging.
COBRA impact assessment screening tool The COBRA model was used to assess and monetize the impacts of net reductions in criteria air pollutants. COBRA estimates the impact of air pollutant emission changes on ambient particulate-matter concentrations, translates changes in PM concentrations into health effects, then monetizes these health effects. The model takes as its input changes in emissions of PM2.5 and PM precursors by county by source type. Source type (e.g. natural-gas combustion electricity generation, light-duty passenger vehicles) is used to characterize stack height (which in turn affects dispersion of the pollutants). A built-in source-receptor matrix that takes into account factors like prevailing winds that affect dispersion is used to determine the impact of emissions from a given source on all other counties in the U.S. The COBRA model determines
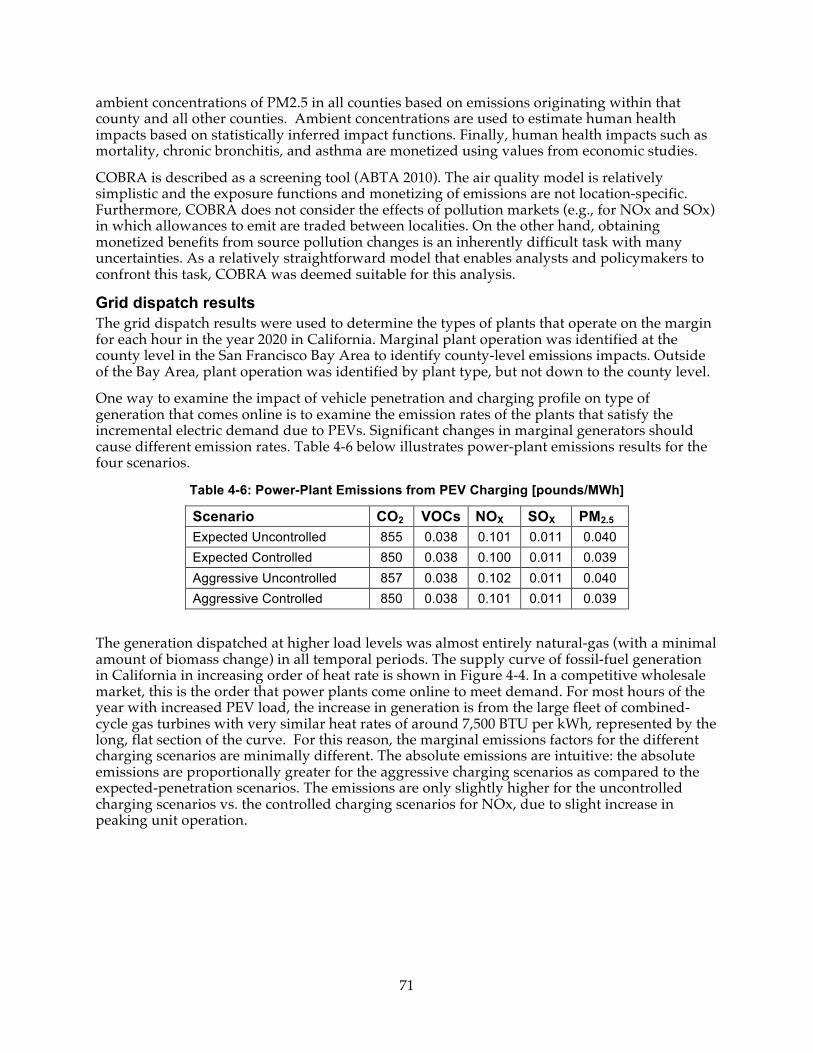
71
ambient concentrations of PM2.5 in all counties based on emissions originating within that county and all other counties. Ambient concentrations are used to estimate human health impacts based on statistically inferred impact functions. Finally, human health impacts such as mortality, chronic bronchitis, and asthma are monetized using values from economic studies.
COBRA is described as a screening tool (ABTA 2010). The air quality model is relatively simplistic and the exposure functions and monetizing of emissions are not location-specific. Furthermore, COBRA does not consider the effects of pollution markets (e.g., for NOx and SOx) in which allowances to emit are traded between localities. On the other hand, obtaining monetized benefits from source pollution changes is an inherently difficult task with many uncertainties. As a relatively straightforward model that enables analysts and policymakers to confront this task, COBRA was deemed suitable for this analysis.
Grid dispatch results The grid dispatch results were used to determine the types of plants that operate on the margin for each hour in the year 2020 in California. Marginal plant operation was identified at the county level in the San Francisco Bay Area to identify county-level emissions impacts. Outside of the Bay Area, plant operation was identified by plant type, but not down to the county level.
One way to examine the impact of vehicle penetration and charging profile on type of generation that comes online is to examine the emission rates of the plants that satisfy the incremental electric demand due to PEVs. Significant changes in marginal generators should cause different emission rates. Table 4-6 below illustrates power-plant emissions results for the four scenarios.
Table 4-6: Power-Plant Emissions from PEV Charging [pounds/MWh]
Scenario CO2 VOCs NOX SOX PM2.5 Expected Uncontrolled 855 0.038 0.101 0.011 0.040 Expected Controlled 850 0.038 0.100 0.011 0.039 Aggressive Uncontrolled 857 0.038 0.102 0.011 0.040 Aggressive Controlled 850 0.038 0.101 0.011 0.039
The generation dispatched at higher load levels was almost entirely natural-gas (with a minimal amount of biomass change) in all temporal periods. The supply curve of fossil-fuel generation in California in increasing order of heat rate is shown in Figure 4-4. In a competitive wholesale market, this is the order that power plants come online to meet demand. For most hours of the year with increased PEV load, the increase in generation is from the large fleet of combined-cycle gas turbines with very similar heat rates of around 7,500 BTU per kWh, represented by the long, flat section of the curve. For this reason, the marginal emissions factors for the different charging scenarios are minimally different. The absolute emissions are intuitive: the absolute emissions are proportionally greater for the aggressive charging scenarios as compared to the expected-penetration scenarios. The emissions are only slightly higher for the uncontrolled charging scenarios vs. the controlled charging scenarios for NOx, due to slight increase in peaking unit operation.
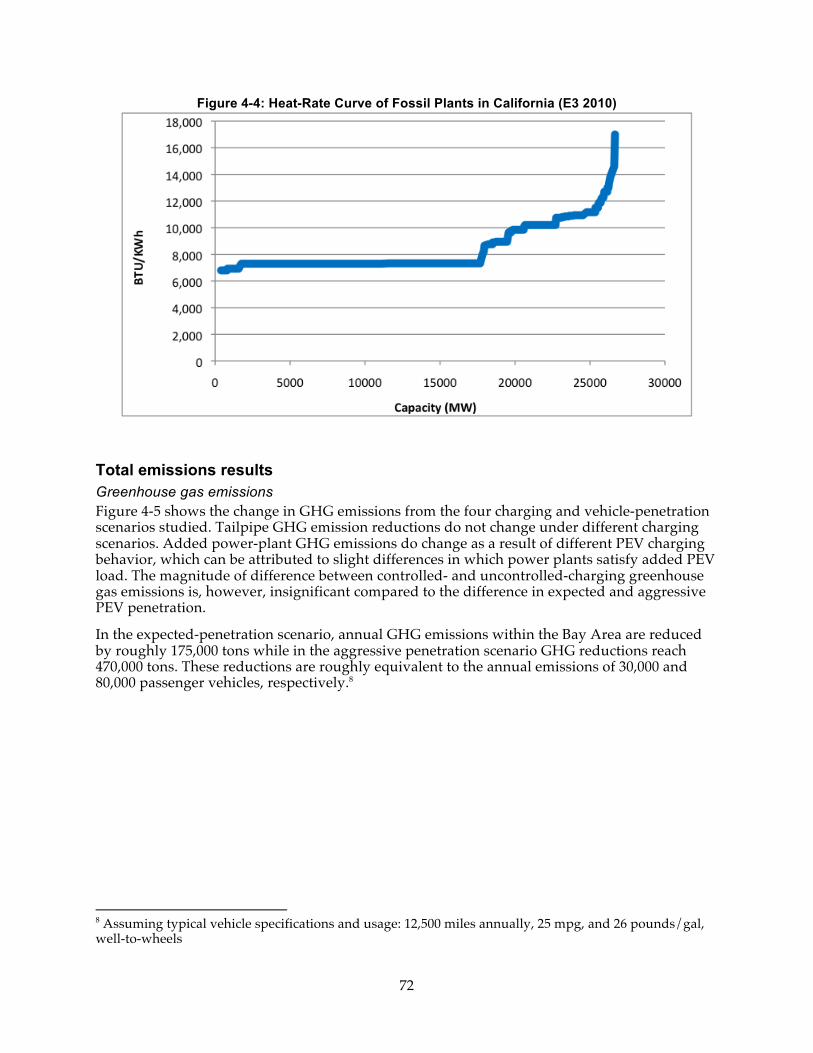
72
Figure 4-4: Heat-Rate Curve of Fossil Plants in California (E3 2010)
Total emissions results Greenhouse gas emissions Figure 4-5 shows the change in GHG emissions from the four charging and vehicle-penetration scenarios studied. Tailpipe GHG emission reductions do not change under different charging scenarios. Added power-plant GHG emissions do change as a result of different PEV charging behavior, which can be attributed to slight differences in which power plants satisfy added PEV load. The magnitude of difference between controlled- and uncontrolled-charging greenhouse gas emissions is, however, insignificant compared to the difference in expected and aggressive PEV penetration.
In the expected-penetration scenario, annual GHG emissions within the Bay Area are reduced by roughly 175,000 tons while in the aggressive penetration scenario GHG reductions reach 470,000 tons. These reductions are roughly equivalent to the annual emissions of 30,000 and 80,000 passenger vehicles, respectively.8
8 Assuming typical vehicle specifications and usage: 12,500 miles annually, 25 mpg, and 26 pounds/gal, well-to-wheels
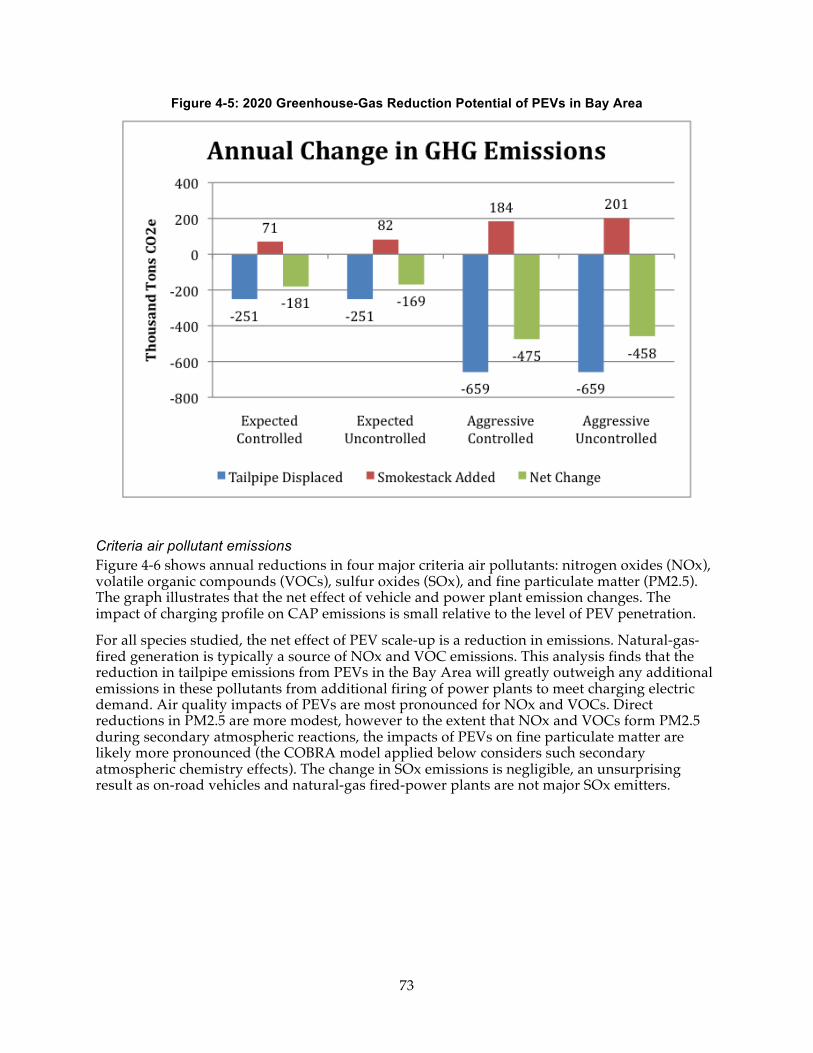
73
Figure 4-5: 2020 Greenhouse-Gas Reduction Potential of PEVs in Bay Area
Criteria air pollutant emissions Figure 4-6 shows annual reductions in four major criteria air pollutants: nitrogen oxides (NOx), volatile organic compounds (VOCs), sulfur oxides (SOx), and fine particulate matter (PM2.5). The graph illustrates that the net effect of vehicle and power plant emission changes. The impact of charging profile on CAP emissions is small relative to the level of PEV penetration.
For all species studied, the net effect of PEV scale-up is a reduction in emissions. Natural-gas-fired generation is typically a source of NOx and VOC emissions. This analysis finds that the reduction in tailpipe emissions from PEVs in the Bay Area will greatly outweigh any additional emissions in these pollutants from additional firing of power plants to meet charging electric demand. Air quality impacts of PEVs are most pronounced for NOx and VOCs. Direct reductions in PM2.5 are more modest, however to the extent that NOx and VOCs form PM2.5 during secondary atmospheric reactions, the impacts of PEVs on fine particulate matter are likely more pronounced (the COBRA model applied below considers such secondary atmospheric chemistry effects). The change in SOx emissions is negligible, an unsurprising result as on-road vehicles and natural-gas fired-power plants are not major SOx emitters.
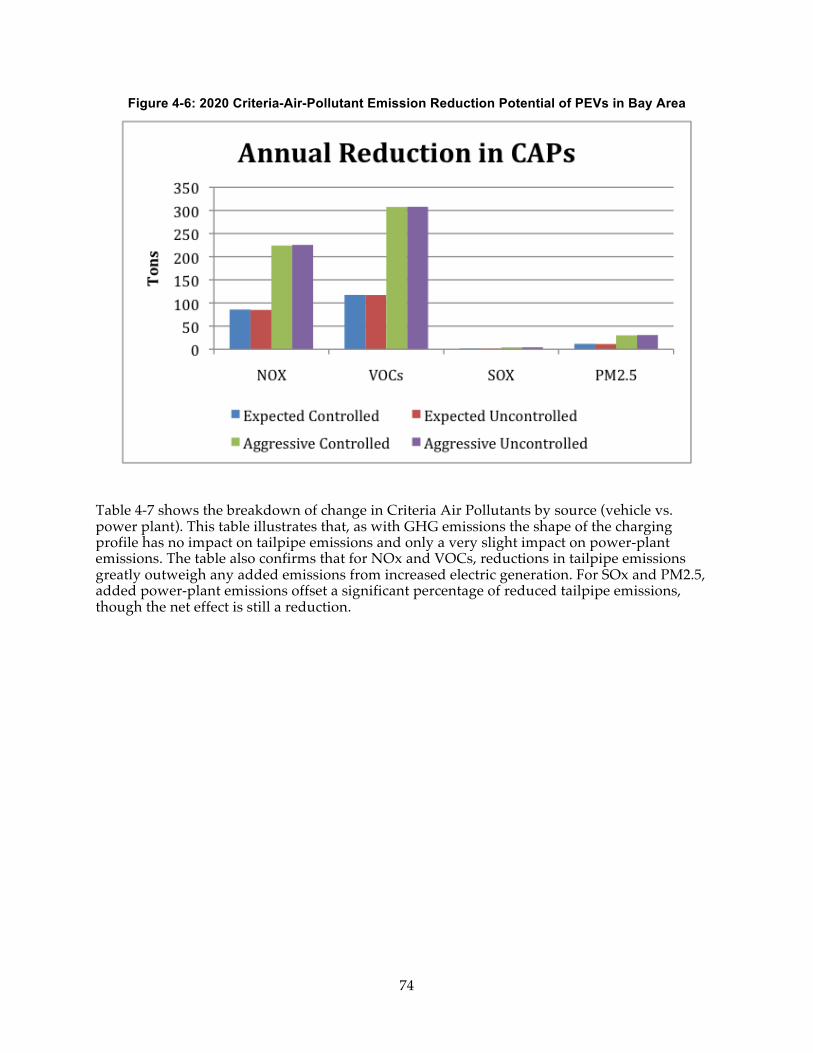
74
Figure 4-6: 2020 Criteria-Air-Pollutant Emission Reduction Potential of PEVs in Bay Area
Table 4-7 shows the breakdown of change in Criteria Air Pollutants by source (vehicle vs. power plant). This table illustrates that, as with GHG emissions the shape of the charging profile has no impact on tailpipe emissions and only a very slight impact on power-plant emissions. The table also confirms that for NOx and VOCs, reductions in tailpipe emissions greatly outweigh any added emissions from increased electric generation. For SOx and PM2.5, added power-plant emissions offset a significant percentage of reduced tailpipe emissions, though the net effect is still a reduction.
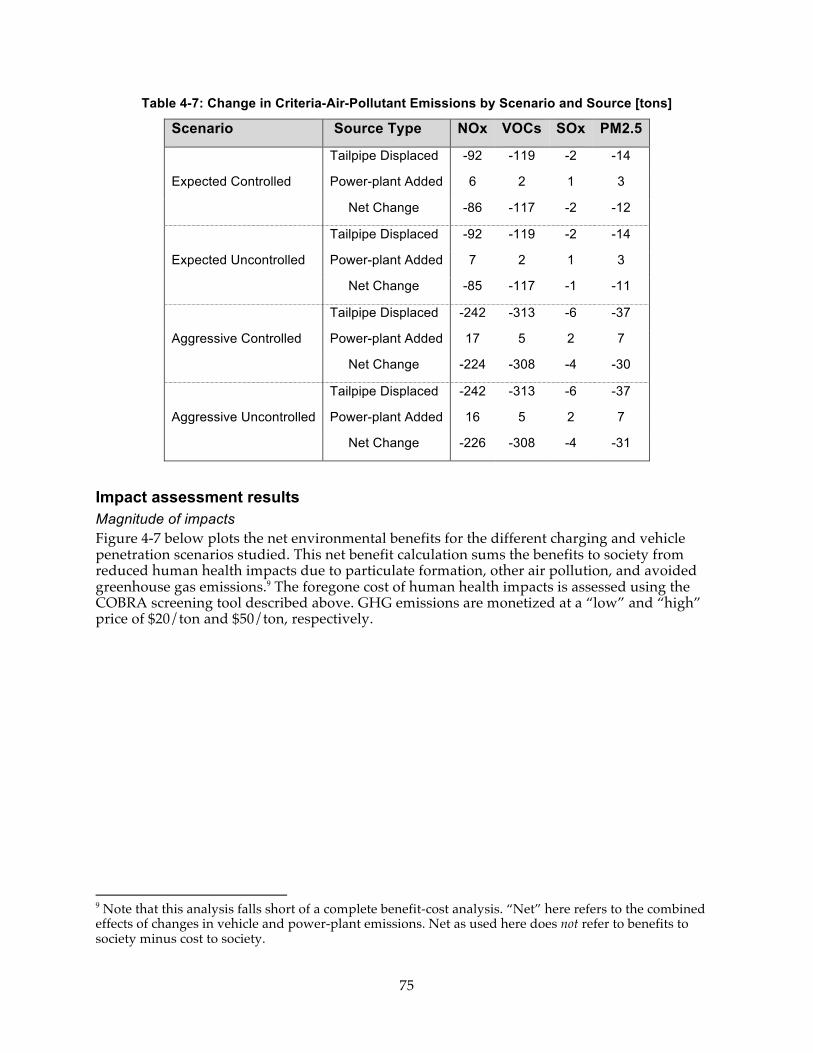
75
Table 4-7: Change in Criteria-Air-Pollutant Emissions by Scenario and Source [tons]
Scenario Source Type NOx VOCs SOx PM2.5
Expected Controlled
Tailpipe Displaced -92 -119 -2 -14
Power-plant Added 6 2 1 3
Net Change -86 -117 -2 -12
Expected Uncontrolled
Tailpipe Displaced -92 -119 -2 -14
Power-plant Added 7 2 1 3
Net Change -85 -117 -1 -11
Aggressive Controlled
Tailpipe Displaced -242 -313 -6 -37
Power-plant Added 17 5 2 7
Net Change -224 -308 -4 -30
Aggressive Uncontrolled
Tailpipe Displaced -242 -313 -6 -37
Power-plant Added 16 5 2 7
Net Change -226 -308 -4 -31
Impact assessment results Magnitude of impacts Figure 4-7 below plots the net environmental benefits for the different charging and vehicle penetration scenarios studied. This net benefit calculation sums the benefits to society from reduced human health impacts due to particulate formation, other air pollution, and avoided greenhouse gas emissions.9 The foregone cost of human health impacts is assessed using the COBRA screening tool described above. GHG emissions are monetized at a “low” and “high” price of $20/ton and $50/ton, respectively.
9 Note that this analysis falls short of a complete benefit-cost analysis. “Net” here refers to the combined effects of changes in vehicle and power-plant emissions. Net as used here does not refer to benefits to society minus cost to society.
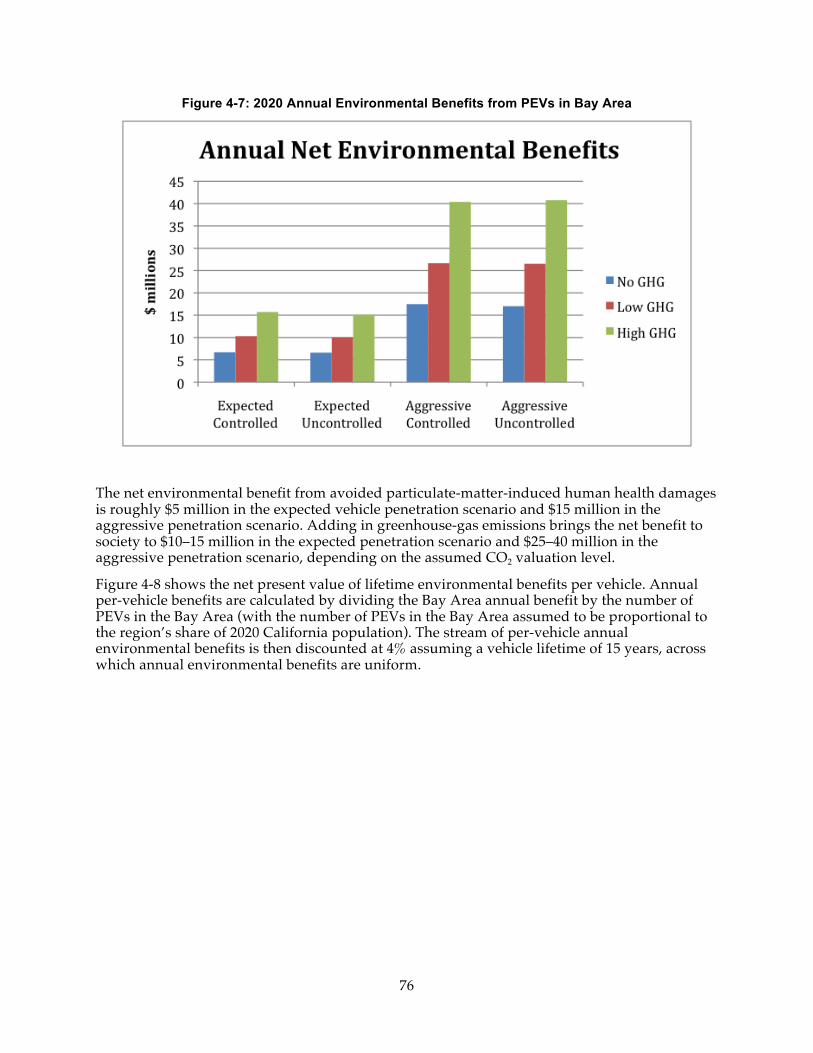
76
Figure 4-7: 2020 Annual Environmental Benefits from PEVs in Bay Area
The net environmental benefit from avoided particulate-matter-induced human health damages is roughly $5 million in the expected vehicle penetration scenario and $15 million in the aggressive penetration scenario. Adding in greenhouse-gas emissions brings the net benefit to society to $10–15 million in the expected penetration scenario and $25–40 million in the aggressive penetration scenario, depending on the assumed CO2 valuation level.
Figure 4-8 shows the net present value of lifetime environmental benefits per vehicle. Annual per-vehicle benefits are calculated by dividing the Bay Area annual benefit by the number of PEVs in the Bay Area (with the number of PEVs in the Bay Area assumed to be proportional to the region’s share of 2020 California population). The stream of per-vehicle annual environmental benefits is then discounted at 4% assuming a vehicle lifetime of 15 years, across which annual environmental benefits are uniform.
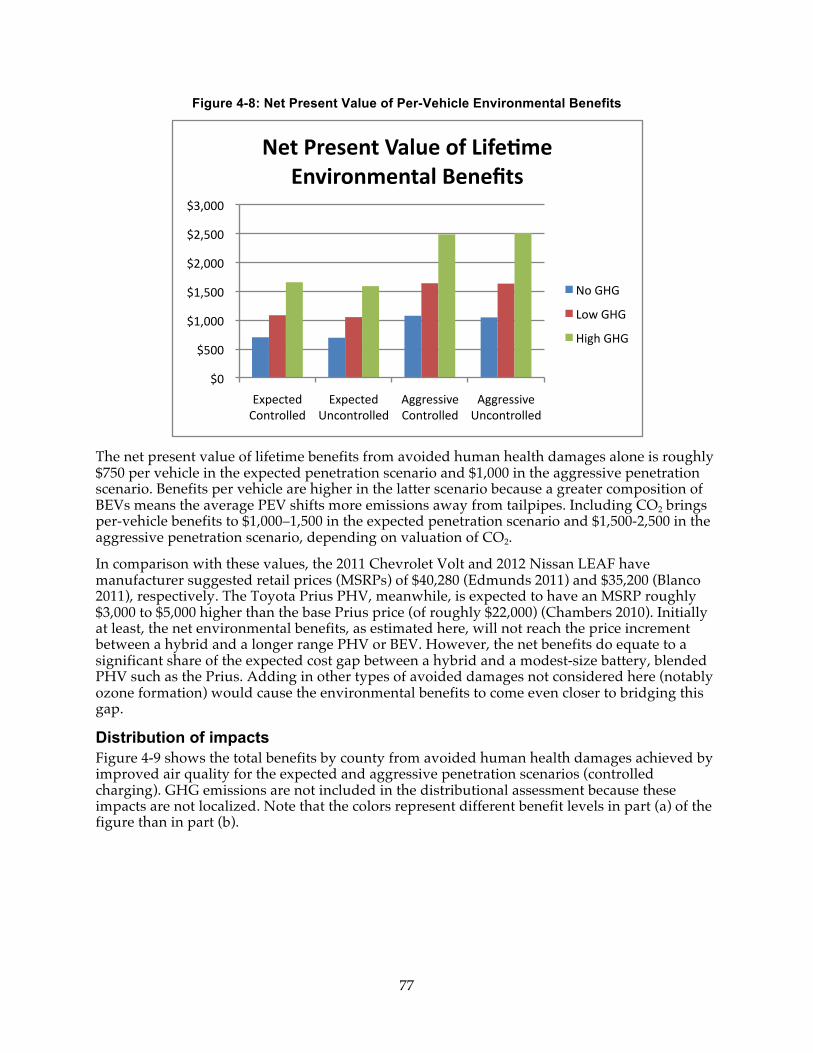
77
Figure 4-8: Net Present Value of Per-Vehicle Environmental Benefits
!"##
!$""##
!%&"""##
!%&$""##
!'&"""##
!'&$""##
!(&"""##
)*+,-.,/#
012.3144,/#
)*+,-.,/##
52-12.3144,/#
6773,889:,##
012.3144,/#
6773,889:,#
52-12.3144,/#
!"#$%&"'"(#$)*+,"$-.$/0."12"$
3(40&-(2"(#*+$5"("6#'$
;1#<=<#
>1?#<=<#
=97@#<=<#
The net present value of lifetime benefits from avoided human health damages alone is roughly $750 per vehicle in the expected penetration scenario and $1,000 in the aggressive penetration scenario. Benefits per vehicle are higher in the latter scenario because a greater composition of BEVs means the average PEV shifts more emissions away from tailpipes. Including CO2 brings per-vehicle benefits to $1,000–1,500 in the expected penetration scenario and $1,500-2,500 in the aggressive penetration scenario, depending on valuation of CO2.
In comparison with these values, the 2011 Chevrolet Volt and 2012 Nissan LEAF have manufacturer suggested retail prices (MSRPs) of $40,280 (Edmunds 2011) and $35,200 (Blanco 2011), respectively. The Toyota Prius PHV, meanwhile, is expected to have an MSRP roughly $3,000 to $5,000 higher than the base Prius price (of roughly $22,000) (Chambers 2010). Initially at least, the net environmental benefits, as estimated here, will not reach the price increment between a hybrid and a longer range PHV or BEV. However, the net benefits do equate to a significant share of the expected cost gap between a hybrid and a modest-size battery, blended PHV such as the Prius. Adding in other types of avoided damages not considered here (notably ozone formation) would cause the environmental benefits to come even closer to bridging this gap.
Distribution of impacts Figure 4-9 shows the total benefits by county from avoided human health damages achieved by improved air quality for the expected and aggressive penetration scenarios (controlled charging). GHG emissions are not included in the distributional assessment because these impacts are not localized. Note that the colors represent different benefit levels in part (a) of the figure than in part (b).
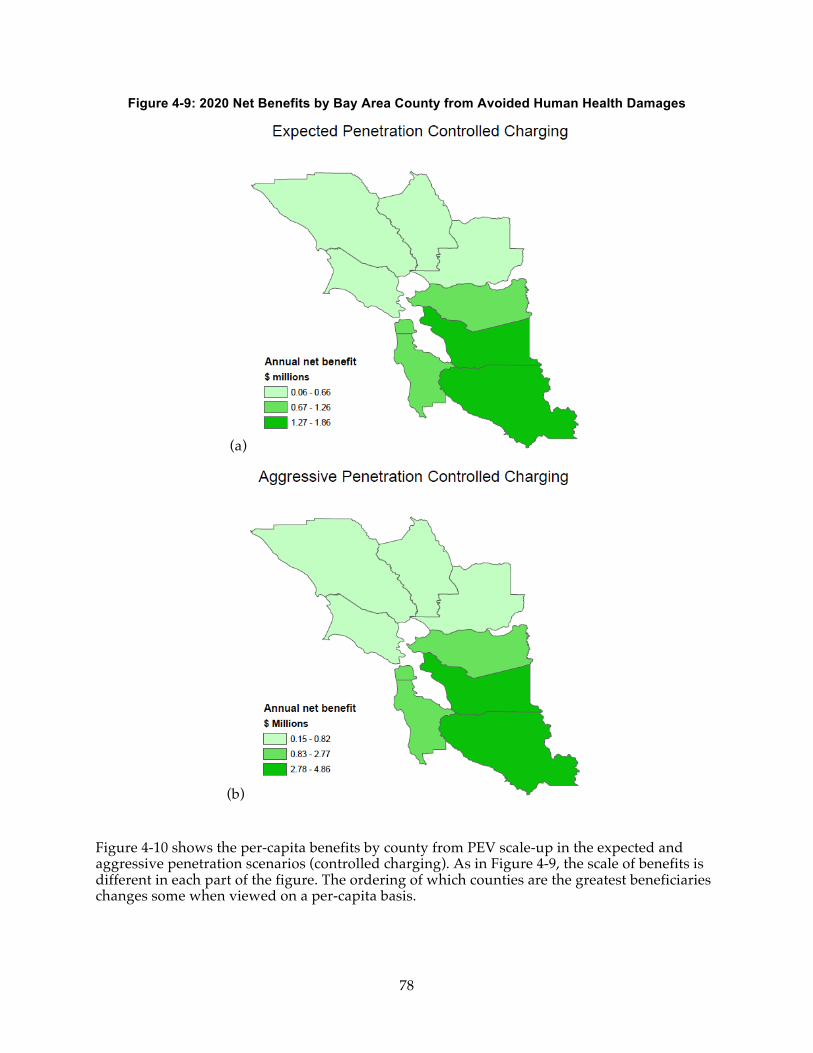
78
Figure 4-9: 2020 Net Benefits by Bay Area County from Avoided Human Health Damages
(a)
(b)
Figure 4-10 shows the per-capita benefits by county from PEV scale-up in the expected and aggressive penetration scenarios (controlled charging). As in Figure 4-9, the scale of benefits is different in each part of the figure. The ordering of which counties are the greatest beneficiaries changes some when viewed on a per-capita basis.
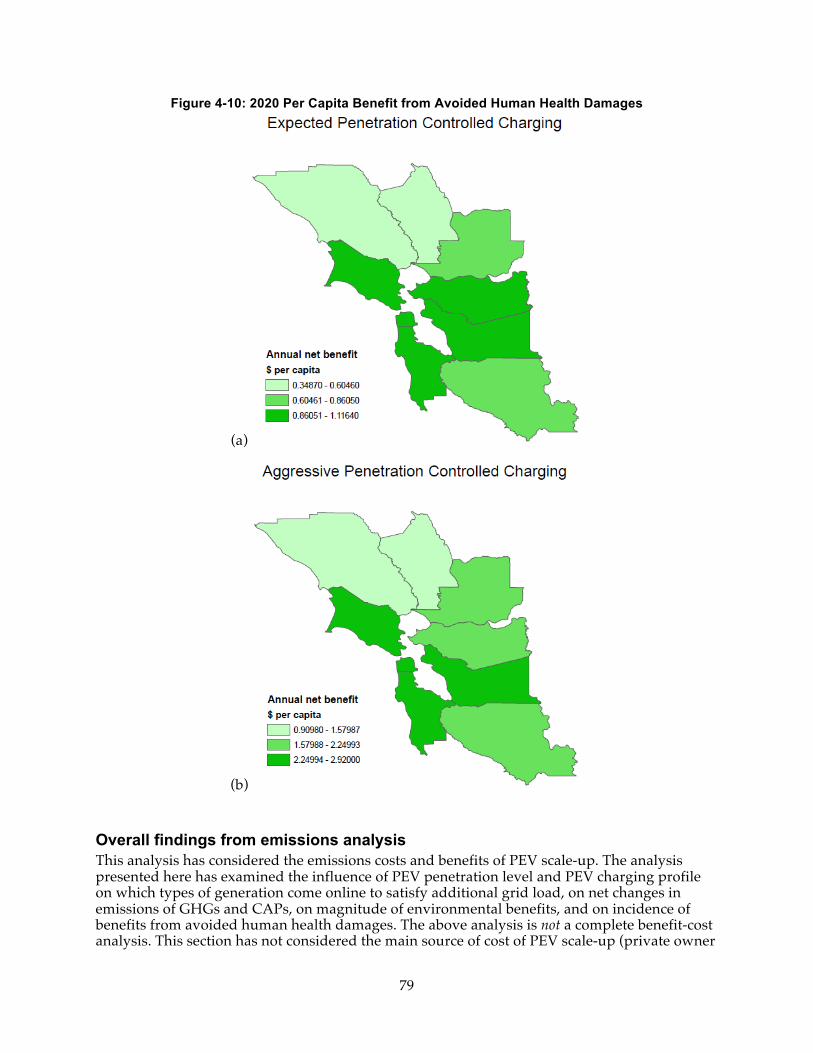
79
Figure 4-10: 2020 Per Capita Benefit from Avoided Human Health Damages
(a)
(b)
Overall findings from emissions analysis This analysis has considered the emissions costs and benefits of PEV scale-up. The analysis presented here has examined the influence of PEV penetration level and PEV charging profile on which types of generation come online to satisfy additional grid load, on net changes in emissions of GHGs and CAPs, on magnitude of environmental benefits, and on incidence of benefits from avoided human health damages. The above analysis is not a complete benefit-cost analysis. This section has not considered the main source of cost of PEV scale-up (private owner
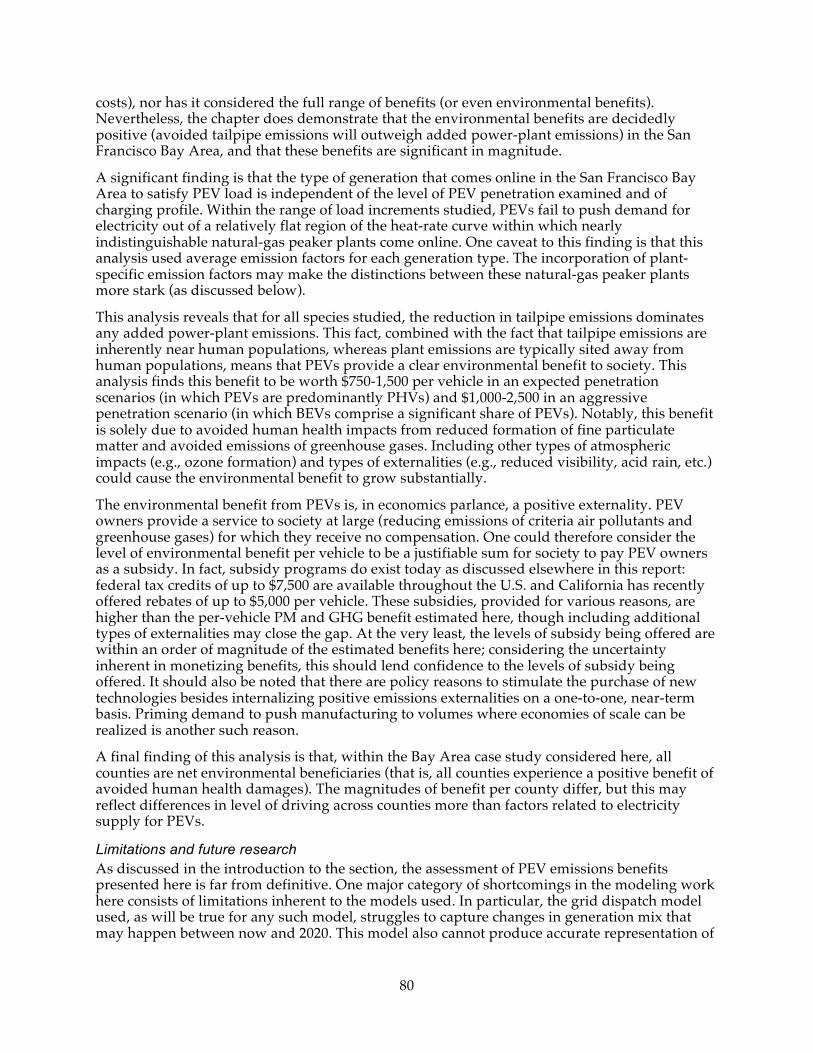
80
costs), nor has it considered the full range of benefits (or even environmental benefits). Nevertheless, the chapter does demonstrate that the environmental benefits are decidedly positive (avoided tailpipe emissions will outweigh added power-plant emissions) in the San Francisco Bay Area, and that these benefits are significant in magnitude.
A significant finding is that the type of generation that comes online in the San Francisco Bay Area to satisfy PEV load is independent of the level of PEV penetration examined and of charging profile. Within the range of load increments studied, PEVs fail to push demand for electricity out of a relatively flat region of the heat-rate curve within which nearly indistinguishable natural-gas peaker plants come online. One caveat to this finding is that this analysis used average emission factors for each generation type. The incorporation of plant-specific emission factors may make the distinctions between these natural-gas peaker plants more stark (as discussed below).
This analysis reveals that for all species studied, the reduction in tailpipe emissions dominates any added power-plant emissions. This fact, combined with the fact that tailpipe emissions are inherently near human populations, whereas plant emissions are typically sited away from human populations, means that PEVs provide a clear environmental benefit to society. This analysis finds this benefit to be worth $750-1,500 per vehicle in an expected penetration scenarios (in which PEVs are predominantly PHVs) and $1,000-2,500 in an aggressive penetration scenario (in which BEVs comprise a significant share of PEVs). Notably, this benefit is solely due to avoided human health impacts from reduced formation of fine particulate matter and avoided emissions of greenhouse gases. Including other types of atmospheric impacts (e.g., ozone formation) and types of externalities (e.g., reduced visibility, acid rain, etc.) could cause the environmental benefit to grow substantially.
The environmental benefit from PEVs is, in economics parlance, a positive externality. PEV owners provide a service to society at large (reducing emissions of criteria air pollutants and greenhouse gases) for which they receive no compensation. One could therefore consider the level of environmental benefit per vehicle to be a justifiable sum for society to pay PEV owners as a subsidy. In fact, subsidy programs do exist today as discussed elsewhere in this report: federal tax credits of up to $7,500 are available throughout the U.S. and California has recently offered rebates of up to $5,000 per vehicle. These subsidies, provided for various reasons, are higher than the per-vehicle PM and GHG benefit estimated here, though including additional types of externalities may close the gap. At the very least, the levels of subsidy being offered are within an order of magnitude of the estimated benefits here; considering the uncertainty inherent in monetizing benefits, this should lend confidence to the levels of subsidy being offered. It should also be noted that there are policy reasons to stimulate the purchase of new technologies besides internalizing positive emissions externalities on a one-to-one, near-term basis. Priming demand to push manufacturing to volumes where economies of scale can be realized is another such reason.
A final finding of this analysis is that, within the Bay Area case study considered here, all counties are net environmental beneficiaries (that is, all counties experience a positive benefit of avoided human health damages). The magnitudes of benefit per county differ, but this may reflect differences in level of driving across counties more than factors related to electricity supply for PEVs.
Limitations and future research As discussed in the introduction to the section, the assessment of PEV emissions benefits presented here is far from definitive. One major category of shortcomings in the modeling work here consists of limitations inherent to the models used. In particular, the grid dispatch model used, as will be true for any such model, struggles to capture changes in generation mix that may happen between now and 2020. This model also cannot produce accurate representation of
81
change of dispatch of individual plants, because differences between plant heat rates is small and representation of transmission constraints poor. Similarly, the risk assessment model used in this analysis relies on a relatively simplistic air-quality model and employs dose-response functions and valuations of impacts that are not location-specific.
Another major limitation of the analysis here is the use of average power-plant emission factors (within categories of generators). The project team was unable to use plant-specific emission factors in this analysis due to the difficulty of matching emission factors to generators for the entire state. Plant-specific emission factors are important in capturing the impacts of older generators that have been grandfathered into pollution control regulation. Several of the highest impact natural-gas generators in the U.S. are located in or near the Bay Area. To the extent that these generators come online as a result of PEV load, this analysis may overstate the environmental benefit from PEVs (though probably not enough to offset additional types of environmental benefit that were excluded from this analysis, as discussed below).
A third limitation of this section is the lack of sensitivity analysis surrounding tailpipe emission reductions. As this analysis revealed, the net environmental benefit from PEVs is in large part determined by the displaced gasoline consumption; future work should provide bounds on tailpipe emissions that consider different fleet compositions in 2020.
A final important limitation of this analysis is the failure to consider environmental damages foregone from criteria air pollutant emission reductions outside of human health from PM formation. One of the greatest benefits from PEVs is likely to come from reduced formation of smog and ground-level ozone; these compounds are formed as a result of emissions of NOx and VOCs reacting in the presence of sunlight. Not only is PEV adoption likely to reduce net emissions of ozone precursors; if charging happens overnight, PEVs could also shift these emissions to times of day when their contribution to ozone formation is greatly diminished. Unfortunately, the atmospheric chemistry of ozone formation is difficult to model. Aside from ozone formation, a variety of other environmental externalities including but not limited to reduced visibility, crop damages, lost recreation services, and corrosion of materials were omitted from this analysis. Inclusion of these categories would better enhance the comparison between net environmental benefits and levels of subsidy offered to offset private ownership cost.
How can emissions benefits of PEVs be better captured? One key benefit of PEVs is their ability to reduce externalities (e.g., from criteria air pollutants, GHGs, roadway noise, and water/soil contamination—through reduced improper motor oil disposal, pollution from contaminant fluid releases from poor vehicle maintenance and accidents, etc.). It would be of assistance for PEV commercialization if these benefits were better internalized, so that comparisons between PEV and conventional vehicles better reflected the fully burdened “social” costs and benefits of vehicle use. However, this is difficult to do in practice as PEV environmental and energy benefits differ significantly, depending on vehicle type and class, utility service area for recharging, the “alternative” conventional vehicle that would have been purchased instead of the PEV, driver behavior, and other factors.
Below are a few ideas for capturing these benefits, at least partially, in ways that could aid PEV commercialization and expanded use of e-fuel. However, because of the many different types of emissions and impacts related to shifts from gasoline/diesel combustion to the use of e-fuel.
First, under the Global Warming Solutions Act (AB 32), California is pursuing a “cap-and-trade” program that will include the major commercial and industrial sectors that contribute the majority of California’s annual inventory of GHG emissions. The ARB is required to finalize the cap-and-trade regulations by October 28, 2011, with implementation starting in 2012 and full compliance required by 2013. Bound by the regulations (relevant to PEVs and e-fuel) are major fuel suppliers and electric power entities, who would have to contribute to the GHG emission
82
reductions specified in the AB 32 scoping plan. The program is currently mired in litigation but has received key support from recent Supreme Court and other Federal court decisions. What is currently at issue is whether or not California carefully enough considered alternative programs to cap-and-trade for meeting the goals of AB 32, along with concerns of “gaming” of the system and other issues related to implementation and the issuance of emission allowances (Kahn 2011).
An additional opportunity to capture the emission benefits of PEVs includes through a vehicle “feebate” program, discussed later in this report, where purchasers of new vehicles would either pay a fine or receive a rebate based on the emissions performance (GHG and possibly even air-pollution emissions as well) of the vehicles they purchase. This would provide a stimulus for consumers to purchase cleaner, more efficient vehicles, including PEVs, and help to capture their environmental benefits in an economic sense. As discussed extensively in Bunch et al. (2011) this type of program would provide a more comprehensive and effective way of moving consumers into lower emission vehicles than the current patchwork array of incentive programs that has been available in California in recent years for clean fuel vehicles.
Additionally, various other types of programs could help to provide economic rewards for the purchase of PEVs and use of e-fuel, in line with their expected environmental benefits. These could include registration fee reductions, access to carpool lanes, and reduced fees for PEV operation in areas with “congestion charges” or “high-occupancy toll” charges. We suggest that for these programs to be most acceptable to the general public, they should be as clear and transparent as possible.
PEVs and Household Energy Use Along with the emissions benefits that PEVs can provide, it is worth noting that they also tend to reduce primary energy use by being more efficient than conventional vehicles. This can have various additional benefits associated with myriad economic and environmental impacts of energy production, imports from other countries, and energy end-use. As shown in Figure 4-11 below, typical passenger cars in the U.S. have used about 550 gallons per year since the early 1970s. Vehicles have tended to become heavier, more powerful, and with more features during this period, but have remained relatively constant in terms of energy use until recent changes in CAFE legislation are expected to result in lower gasoline usage per vehicle on average.
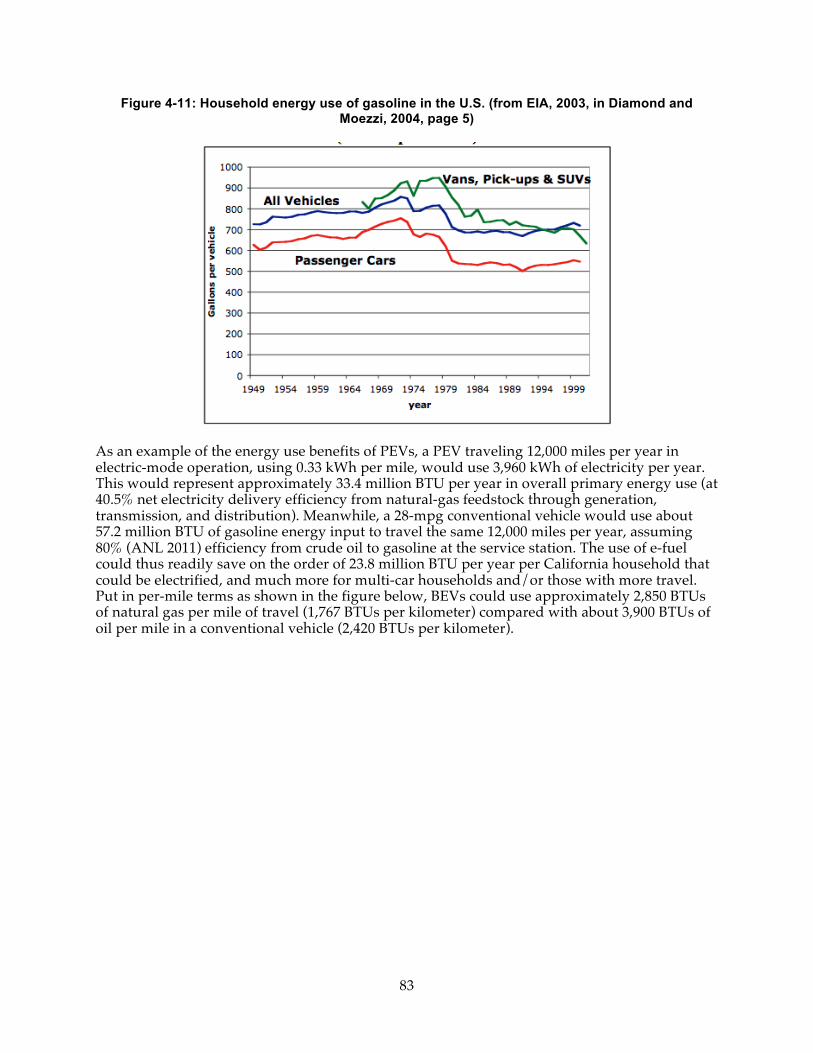
83
Figure 4-11: Household energy use of gasoline in the U.S. (from EIA, 2003, in Diamond and Moezzi, 2004, page 5)
As an example of the energy use benefits of PEVs, a PEV traveling 12,000 miles per year in electric-mode operation, using 0.33 kWh per mile, would use 3,960 kWh of electricity per year. This would represent approximately 33.4 million BTU per year in overall primary energy use (at 40.5% net electricity delivery efficiency from natural-gas feedstock through generation, transmission, and distribution). Meanwhile, a 28-mpg conventional vehicle would use about 57.2 million BTU of gasoline energy input to travel the same 12,000 miles per year, assuming 80% (ANL 2011) efficiency from crude oil to gasoline at the service station. The use of e-fuel could thus readily save on the order of 23.8 million BTU per year per California household that could be electrified, and much more for multi-car households and/or those with more travel. Put in per-mile terms as shown in the figure below, BEVs could use approximately 2,850 BTUs of natural gas per mile of travel (1,767 BTUs per kilometer) compared with about 3,900 BTUs of oil per mile in a conventional vehicle (2,420 BTUs per kilometer).
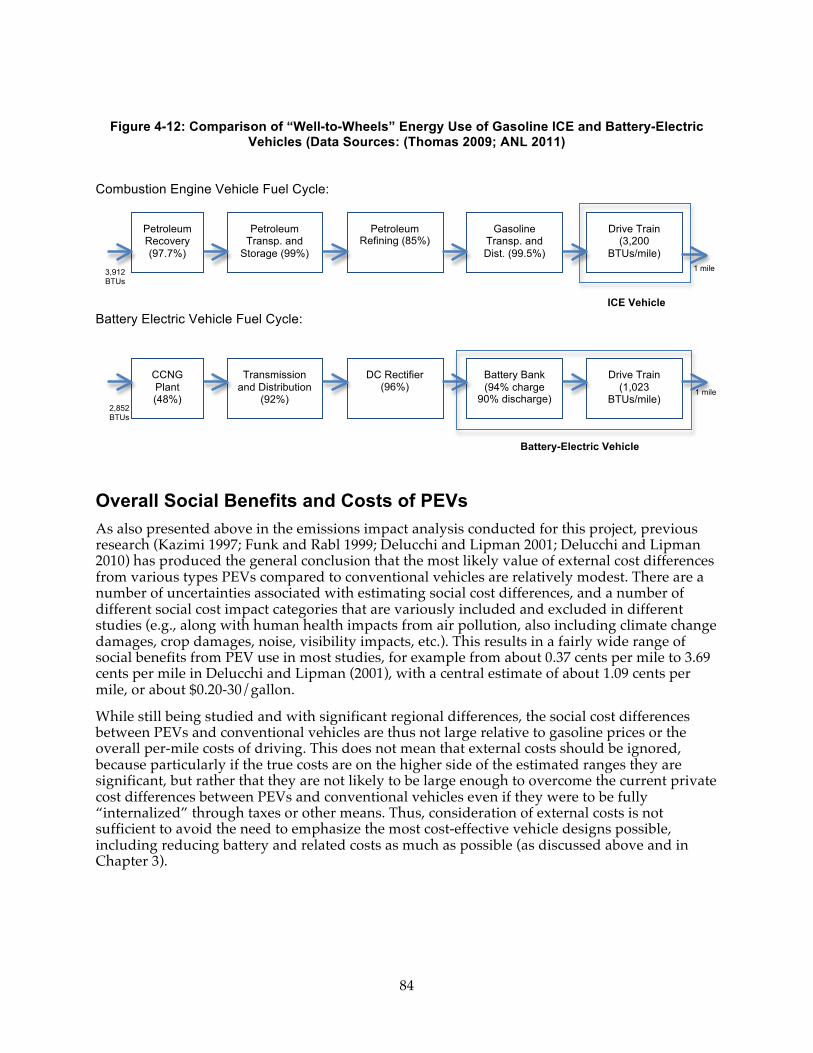
84
Figure 4-12: Comparison of “Well-to-Wheels” Energy Use of Gasoline ICE and Battery-Electric Vehicles (Data Sources: (Thomas 2009; ANL 2011)
Combustion Engine Vehicle Fuel Cycle:
Battery Electric Vehicle Fuel Cycle:
Overall Social Benefits and Costs of PEVs As also presented above in the emissions impact analysis conducted for this project, previous research (Kazimi 1997; Funk and Rabl 1999; Delucchi and Lipman 2001; Delucchi and Lipman 2010) has produced the general conclusion that the most likely value of external cost differences from various types PEVs compared to conventional vehicles are relatively modest. There are a number of uncertainties associated with estimating social cost differences, and a number of different social cost impact categories that are variously included and excluded in different studies (e.g., along with human health impacts from air pollution, also including climate change damages, crop damages, noise, visibility impacts, etc.). This results in a fairly wide range of social benefits from PEV use in most studies, for example from about 0.37 cents per mile to 3.69 cents per mile in Delucchi and Lipman (2001), with a central estimate of about 1.09 cents per mile, or about $0.20-30/gallon.
While still being studied and with significant regional differences, the social cost differences between PEVs and conventional vehicles are thus not large relative to gasoline prices or the overall per-mile costs of driving. This does not mean that external costs should be ignored, because particularly if the true costs are on the higher side of the estimated ranges they are significant, but rather that they are not likely to be large enough to overcome the current private cost differences between PEVs and conventional vehicles even if they were to be fully “internalized” through taxes or other means. Thus, consideration of external costs is not sufficient to avoid the need to emphasize the most cost-effective vehicle designs possible, including reducing battery and related costs as much as possible (as discussed above and in Chapter 3).
Petroleum Recovery (97.7%)
Petroleum Transp. and
Storage (99%)
Petroleum Refining (85%)
Gasoline Transp. and Dist. (99.5%)
Drive Train (3,200
BTUs/mile)
3,912 BTUs
CCNG Plant (48%)
Transmission and Distribution
(92%)
DC Rectifier (96%)
Battery Bank (94% charge
90% discharge)
Drive Train (1,023
BTUs/mile) 1 mile
1 mile
ICE Vehicle
2,852 BTUs
Battery-Electric Vehicle
85
CHAPTER 5: Recommendations and Conclusions Based on the analysis conducted for this research report, the outcomes of the “E-Fuel Scale-Up Workshop” at UC Berkeley, and additional information provided through expert interviews conducted during the course of the project, this chapter discusses several key remaining issues and provides recommendations for policy and regulatory development.
Key Remaining Issues Key issues and questions facing the scale-up of e-fuel and PEVs in California include:
• outstanding questions about submetering electric fuel from the perspectives of EVSE supply, utility billing and investment, and environmental monitoring and compliance;
• requirements for utility investment in grid distribution upgrades in some areas to support neighborhood PEV charging, and the question of which expenses should be rate-based generally vs. possibly allocated to a new “PEV user” customer class;
• the issue that at some point it is appropriate for EV drivers to pay contributions for road user taxes, as are currently assessed on the price of gasoline, and how this should best be accomplished;
• continued issues with battery costs and battery system performance, with BEV ranges limited to 100 miles or less in “affordable” vehicles and PHVs having relatively small batteries of less than 10 kWh for best cost-effectiveness in GHG reduction;
• uncertainty about future PEV incentive programs; and • the extent to which some of the environmental and other social benefits of EVs remain
“externalized” and could be further “internalized” with additional policy development. Given these and other issues, the use of electricity as a transportation fuel in California faces unique challenges, while offering unique benefits (see Chapter 4). Thus, an important and fundamental question confronting the use of electric fuel is the extent to, and manner in which, it should be treated differently by utilities and regulators than electricity used for other purposes.
Should e-fuel be treated differently? On the one hand, it could be argued that “electricity is electricity” and that PEVs should be considered another electricity-using device that consumers may or may not purchase, along with flat-screen televisions and hair dryers. As discussed throughout this report, however, e-fuel is different in a number of key ways. Foremost, e-fuel substitutes directly for petroleum, instead of simply representing additional electricity use. This substitution is particularly beneficial in California and other regions where much electricity is generated with relatively well-controlled natural-gas power plants that can approach 50% efficiency levels in generation, along with increasing amounts of renewable electricity required by state renewable portfolio standard (RPS) programs. Chapter 4 analyzes the emissions benefits of petroleum substitution using a Bay Area example.
Further, while e-fuel is not alone in representing a type of electricity use that reduces energy consumption (and especially fossil-fuel based energy use) in an overall sense, it could have a very large impact in doing so while most other substitutions of this sort are more modest. For example, using a microwave oven might reduce the use of a gas oven, but changes in annual energy use and environmental impact are much more modest than the use of e-fuel in place of gasoline for virtually all households in California. Statistics show that annual per capita use of
86
electricity is about $300–350 per person in California, and household natural gas accounts for about $125–150 per capita per year. Household gasoline use (at a reference of $3.50 per gallon) is about $2,000 per vehicle per year (Diamond and Moezzi 2004). Using e-fuel in place of gasoline can displace on the order of half of vehicle GHG emissions in California, as discussed in Chapter 4.
Thus, one important recommendation emerging from this report is to clearly recognize that electricity used as e-fuel represents and important shift in household energy use patterns, in a way that provides net energy efficiency and environmental benefits—at least as e-fuel is expected to be used in California. This recognition supports the first two of the six policy recommendations presented below.
Policy Recommendations Key recommendations arising from this analysis, explained in detail below, include:
• Recommendation 1: Differentiate electric fuel (e-fuel) from electricity for other uses • Recommendation 2: Develop requirements and protocols for e-fuel to be metered and
reported by electricity providers • Recommendation 3: Develop multi-year plans for state-level incentive programs,
including “feebates,” to provide better certainty to PEV manufacturers and consumers about the expected level of future state support
• Recommendation 4: Require EVSE and other PEV service providers who receive state funding to provide baseline data for use in state and regional analysis and planning
• Recommendation 5: Provide improved education and outreach efforts to better assist potential PEV adopters to understand the costs and benefits that they would incur by adopting PEVs of various types, clearly differentiating plug-in hybrids and battery EVs
• Recommendation 6: Explore prospects for utility ownership of submeters and EVSE and related equipment while enabling third-party solutions
• Recommendation 7: Work with automakers and other stakeholders to better understand future PEV markets
It is hoped that achieving these objectives will improve the prospects for e-fuel and PEV commercialization in California by providing better alignment among key policy activities, filling important remaining gaps, and providing additional information and certainty to the growing PEV market to assist with both automaker and electric utility planning activities and consumer purchasing decisions.
Recommendation 1: Differentiate electric fuel (e-fuel) from electricity for other uses As discussed above and at various places in this report, the use of electricity as e-fuel would represent a major shift in the way that households and vehicle fleets use energy, shifting hundreds to thousands of dollars per year per vehicle away from the use of oil and toward other feedstocks used to produce electricity, including an increasing share of renewable resources in California.
We recommend the differential treatment of electricity used as a transportation fuel (e-fuel) and urge additional efforts to distinguish e-fuel from other uses of electricity. We recommend using various means (discussed in Recommendation 2 below) to measure and track e-fuel so that it can be more easily: 1) incorporated into targeted utility TOU rates; 2) included in the LCFS program with appropriate credits generated and allocated to the appropriate parties; and 3) eventually bear its “fair share” of road user taxes currently levied on the price of gasoline fuel. A more comprehensive measurement and accounting effort would also assist in a multitude of
87
state planning efforts (including energy-use planning for the state’s “Integrated Energy Policy Report”).
An additional key aspect of this recommendation is that accounting for the sale of e-fuel in each utility service territory would also enable incentives to be established for utility e-fuel sales, potentially through the LCFS program among other possible mechanisms. For example, the opportunity might emerge to create targeted rate bases, customer “classes,” or other means whereby e-fuel-related investments could be financed appropriately and fairly. A slightly higher rate of return (for the regulated utilities) might be allowed in order to help to realize energy-use, environmental, and other benefits of e-fuel. A related thought is that some amount of the additional revenue allowed for e-fuel sales could be required to be directed to carefully organized and extensive utility programs to help inform customers of the utility issues associated with installing household EVSE.
While we fully support the notion of decoupling to remove utility resistance to implementation of demand-side-management and other energy-efficiency measures, an “overlay” of recoupling for e-fuel on top of the decoupled regime, or other measures to specifically encourage the expansion of e-fuel sales should be considered in order to more successfully realize the various associated petroleum-displacement benefits in California.
We recommend that key state agencies (CPUC, CEC, CARB, and DGS) coordinate on a systematic statewide effort to both explore utility incentives for e-fuel sales, as well as to develop protocols for e-fuel sales reporting by both investor and publically-owned utilities, on a regular (e.g., quarterly or annual) basis.
Recommendation 2: Develop requirements and protocols for e-fuel to be metered and reported by electricity providers Following directly from Recommendation 1, we recommend that requirements and protocols be developed in conjunction with electric utilities and other groups to develop appropriate procedures for measuring, collecting, and reporting e-fuel sales (and other transfers if electricity is given away for free) from both primary utility meters as well as the full range of submeters that may be employed in the future.
CARB has indicated that alternatives to direct submetering may be allowable for LCFS compliance purposes through 1 January 2015, but has not yet defined what would constitute appropriate alternative means for this purpose. And clearly, electric utilities will need a “revenue grade” level of submetering for billing purposes.
What complicates this issue is that submeters could be included in any of a variety of types of systems/applications—as “add-ons” to the primary meter (potentially with a wireless connection/data transfer capability), on household and public EVSEs, and onboard the vehicles themselves. Ideally, submeters in any of these locations could be designed and calibrated to be acceptable for both utility billing and other (e.g., LCFS program e-fuel tracking) uses. However, these specifications and protocols need to be developed in ways that would be mutually agreeable to electric utilities and state regulators. This is a key area for CPUC and other agency regulatory activity in the near future, to help facilitate PEV customer access to appropriate utility rate schedules specific to PEVs.
Some of the key remaining issues that need to be addressed include:
• What are the technical requirements for submeters to be appropriate and adequate for utility billing purposes as well as tracking of LCFS credits, including submeters that are integrated into EVSE and/or the vehicles themselves?
88
• How can the data collected from primary meters and submeters for tracking e-fuel use be used in appropriate ways to better assess environmental benefits of PEVs (especially PHVs) and progress toward meeting AB 32 goals, in ways that protect privacy and require minimal administrative effort?
• How can differentiated data by electricity use (e-fuel versus other household uses) be used in additional ways, such as for utility infrastructure upgrade planning purposes, to better assess the effectiveness of demand-side management programs for household electricity use, and to better target energy-use management efforts in the future?
We suggest that regulated electricity providers be required to monitor and report on the use of e-fuel on a regular (e.g., quarterly) basis to key state agencies and that an appropriately aggregated (anonymous) data set also be provided for additional research and analysis purposes. We further suggest that other electricity providers be encouraged to adopt the same policy in the statewide interest.
Recommendation 3: Develop multi-year plans for state-level incentive programs, including “feebates,” to provide better certainty to PEV manufacturers and consumers about the expected level of future state support The state incentive programs for PEVs offered to-date have presumably had a stimulating effect on the early PEV market in California. However, a few aspects of this type of program are important to note. First, of the “early adopters” that have taken advantage of these programs, it is valid to ask how many would have made PEV purchases even in the absence of incentives. On the other hand, it is likely to be the case that purchase incentives will be even more important to the next, more “early majority” segments of the market, and this is an argument for continuing these incentive programs. Second, incentive programs have been of relatively short duration and uncertain future, weakening the signal to manufacturers and consumers alike. Incentive funds can become exhausted partway through the program year (as has recently become the case in California in mid-2011), leading to potential consumer frustration for those that just miss out on incentive opportunities that they may have expected. Third, government funds are relatively scarce, particularly during the current economic downturn, and maintaining incentive programs over a longer period of time, as would benefit the PEV market, may prove challenging.
Given these considerations, we recommend further examination of a more comprehensive vehicle “feebate” program in California, that would both incentivize PEVs and other low-GHG-emitting vehicles as well as be designed to be revenue neutral, thus not drawing on the state general fund. The revenues to fund the rebate side of the program would come from fees charged to higher-than-average GHG-emitting vehicles, with a number of potential program designs possible to achieve this (Bunch et al. 2011).
There are many nuanced considerations to feebate programs, but also a number of clear benefits. The benefits include that feebate programs:
• have been shown in other places (and have been modeled in California) to produce significant GHG emission reductions benefits over time [e.g., see (Bunch et al. 2011)];
• can be designed to be revenue neutral, even accounting for the expected administrative costs of the program; and
• can be used in support of other federal and state efforts to improve vehicle fuel economy and reduce vehicle emissions (e.g., the California Pavley Law and ZEV regulations and U.S. CAFE program).
While the prospects for a California feebates program are examined further, more near-term efforts to continue EV and other AFV purchase incentives are being planned. These are
89
appropriate to help “seed” the use of cleaner vehicles with some initial level of public support during an interim period when they can be more commercially viable without subsidies. Proposed incentives that are placed in a longer term planning context (again to provide more robust signals about future costs for consumers and manufacturers) could help to smooth PEV commercialization by providing better certainty and reducing market risks. Enhanced longer-term planning activities (potentially aided by legislation with plans over 5–7 years) could also help to avoid “buyers remorse” for those who miss out on exhausted rebate programs, or are expecting to see rebate programs continued that are then discontinued due to political issues. We note here that programs such as feebates and other types of “special taxes” are now subject to the approval of a two-thirds “super majority” of each house of the State Legislature for passage, subsequent to the passage of Proposition 26 in California in the November 2010 election.
In summary, a more comprehensive feebates program could offer major GHG reduction benefits as well as helping to provide key stimulus for PEVs (both direct economic and social “halo” effects). In absence of that more ambitious type of program, a more consistent and longer-term plan for limited direct vehicle purchase rebates would provide a more convincing market signal for producers and consumers of PEVs and e-fuel.
Recommendation 4: Require EVSE and other PEV service providers who receive state funding to provide baseline data for use in state and regional analysis and planning It is critical during this key e-fuel scale-up phase (2011–2015) that state and regional planners, policymakers, and researchers have access to current data on household and public EVSE installations and usage, to the best extent possible (and with appropriate privacy and other protections built-in). While the state or regions cannot compel private installations of EVSE to be accompanied by data reporting provisions, awards of state or regional (e.g., air-quality-district or metropolitan-planning-organization) funding could be accompanied by requirements to provide key basic EVSE usage information in a timely fashion. This would then allow assessments of real-world charging behavior, what type of EVSE are most well utilized, and other characteristics necessary for effective private and public planning. This would assist with both improving the economics of e-fuel proliferation (e.g., making sure that EVSE installations do not represent “stranded assets”) as well as helping to make sure that that the public perceives clear value in publicly funded EVSE installations and PEV activities.
On a related note, CPUC currently requires utility notification when PEVs are purchased, but the utilities are not required to make these data available to the state planning and research community. Federally funded programs also have data provision requirements, but for a critical period (up through 2013 for the “EV Project” for example) data are only being reported to government laboratories and are again not accessible for near-term planning and decision-making.
We recommend that California state and regional entities who provide incentives or cost-sharing for the provision of EVSE and EVs require the providers to provide baseline data—e.g., regarding the basic purchase, installation, and/or usage details—to regional and statewide agencies for planning purposes. These data could be made available under appropriate conditions to assist with key analysis and planning efforts to better direct and optimize future efforts. These data could be complied by a lead state agency (such as the CEC or CARB) for use in statewide planning and decision-making as well as research efforts by universities and research laboratories, with the appropriate privacy protections and other caveats.
Recommendation 5: Provide improved education and outreach efforts to better assist potential PEV adopters to understand the costs and benefits that they
90
would incur by adopting PEVs of various types, clearly differentiating plug-in hybrids and battery EVs A key complication with the current status of PEV commercialization is that there is a wider range of PEV vehicle types and models either currently available or soon to be available than has ever before been the case. Furthermore, there are additional complexities associated with household EVSE installations (Level 2 versus Level 1 charging, potential wiring upgrades needed depending on the age of the house, overall installation costs, etc.) that most interested PEV purchasers are not likely to fully understand.
A more coordinated and “neutral” (not favoring any one manufacturer or installer of EVSE equipment) information source would be helpful to better inform consumers of the types of EVs becoming available, the advantages and disadvantages of installing different levels of EVSE equipment, and the environmental and other social benefits of PEVs and e-fuel relative to other vehicle types.
Additional benefits of an expanded education and outreach effort would be to help to differentiate between PHVs and BEVs so consumers better understand the benefits and limitations of each major vehicle type, a distinction that is of importance but not well understood by engaged policymakers, let alone the general public. Indeed, there is evidence that considerable confusion abounds. For example, “A survey released in March by research firm Synovate says that of nearly 1,900 vehicle shoppers polled, 58 percent didn't realize that plug-in hybrid EVs can run in all-electric mode. More than a quarter thought all hybrid EVs need to be plugged in.” (Colias 2011)
We recommend a campaign based largely around web-based information (examples) with realistic data and information about current and expected vehicle types to become available in the market, types and costs of installation of EVSE equipment, economic costs and benefits, and environmental and social benefits of EVs and e-fuel, relative to conventional alternatives.
Also of use are associated education efforts to better inform consumers of the potential benefits that they may derive from the use of PEVs and e-fuel. One example, originating from UC Berkeley, is the “Virtual Vehicle Company.” It uses smart phone applications to collect driving data for use in web simulations that help consumers answer “What if I had been driving a PEV?” and to explore what types of PEV would best integrate into their driving patterns and lifestyles.10 This type of innovative effort can help to streamline the consumer adoption experience, helping the “right consumers find the right vehicles” and speed the scale-up of e-fuel.
Recommendation 6: Explore prospects for utility ownership of submeters and related equipment while enabling third-party solutions An additional recommendation is that we urge the CPUC and other agencies to examine in greater detail the issue of utility ownership of submeters and related e-fuel equipment11 that could then be leased en masse to consumers at potentially reduced costs, to help to enable the benefits of e-fuel metering discussed in Recommendations 1 and 2. While the concept of the
10 See the following website for more details on the Virtual Vehicle Company effort: http://www.vevdrive.com/ 11 Indeed, previous research conceptually explored utility ownership of PEV batteries to facilitate the creation and capture of value from post-vehicle, secondary use as stationary energy storage. [Williams, B. D. and T. E. Lipman (2009). Strategies for Transportation Electric Fuel Implementation in California: Overcoming Battery First-Cost Hurdles; CEC-500-2009-091; California Energy Commission Public Interest Energy Research (PIER) Transportation Program: Sacramento, http://www.energy.ca.gov/2009publications/CEC-500-2009-091/CEC-500-2009-091.PDF]
91
“bright line” at the utility meter with regard to utility involvement is appealing in its clarity, it is not yet completely clear why this should necessarily be the case as long as there are provisions for competition between utility ownership and third-party solutions. In fact, it can be argued that purchasing or leasing from the utility could help to lower barriers to e-fuel use and more comprehensive monitoring and data availability for use in strategic planning, policy assessment, and analysis. We stress that third-party solutions meeting the applicable requirements (to be developed per Recommendation 2) should also be encouraged, again to encourage competition and consumer choice in the marketplace.
Recommendation 7: Work with automakers and other stakeholders to better understand future PEV markets While difficult to do, gaining a better understanding of PEV markets in California—“early,” “niche,” and “mass,” would help to inform how further policies and regulations could best be designed to support expanded use of e-fuel. PEV and e-fuel product types and prices are constantly evolving and each period time essentially represents a unique set of circumstances for PEVs and e-fuel to be incorporated into household and organizational fleets. Furthermore, efforts to coordinate EVSE need and availability would be greatly aided by a better sense of e-fuel-relevant demographic, geographic, and other factors driving PEV markets.
We recommend that state and regional agencies coordinate on various market analysis activities, including, for example, a “2012 Statewide Survey of Plug-In Electric Vehicle Markets” that could include three key components: 1) an initial Delphi study of industry experts to gain their sense of the current status of PEV development and expectations for technology evolution through 2025; 2) a statewide telephone survey with thousands of samples (e.g., n=5000), conducted in (at least) English and Spanish, designed to describe key PEV types to participants and understand their opinions of the vehicles and willingness to consider their purchase at key price points; and 3) a series of focus groups around the state to explore attitudes toward PEVs in “mainstream” California, as well as perceived ties to air pollution, energy security, and global warming. The focus groups could also explore the future role of both monetary and non-monetary (e.g., carpool lane use) incentives in helping to get consumers to consider and actually purchase or lease various types of PEVs. Such efforts should explicitly recognize and analyze distinct regions within California with varying conditions and cultural contexts, and should strive to be both geographically and demographically representative. The data and findings from the study should be widely available and disseminated for use by policymakers, researchers, and industry groups.
Directions for Future Work Future directions for policy analysis and development around PEVs include pursuing the above recommendations as well as conducting continued basic and applied research in several areas. Given the rapid pace of technology development for PEVs and e-fuel, an evolving set of external circumstances (that currently involve relatively high gasoline prices and emerging social focus on “green technologies), and the additional forces around global and regional competition for jobs and economic development, it is clear the proliferation of PEVs and the concept of e-fuel are heading toward a new level of recognition and mainstream impact.
Despite these forces, however, there are several reasons to be cautious about the prospects for e-fuel, and these should be the focus of continued research efforts. These areas include:
- How knowledgeable are Californians who purchase new vehicles about the different types of PEVs and their attributes?
- How sensitive are consumer markets for PEVs to changing fuel prices?
92
- What are the potential grid impacts of the projected levels of PEV market penetration and e-fuel use, and what investments are needed and appropriate to support further e-fuel scale-up in the 2015–2030 timeframe?
- How can policy incentives and credits around PEVs (e.g., LCFS credits, ZEV credits, RECs, etc.) be better aligned and facilitated in ways that encourage PEV support among automotive OEMs and energy providers?
- How do the environmental and social impacts of different types of PEVs vary around the different regions of California and variations in the way that vehicle charging behavior is constrained to be mostly during off-peak hours?
- How can the “extended value proposition” concepts around PEVs, including smart charging and secondary use of PEV batteries for grid-support applications, be effectively explored and encouraged for their potential benefits in the larger e-fuel scale-up picture?
There are thus several key areas for additional research around the use of e-fuel in California, reaching beyond the current status of market development and research documented in this report. Several different stakeholder groups have interest in these research topics (including state agencies, environmental groups, utility and other energy service providers, automotive OEMs, EVSE providers, etc.), and various research groups at universities, national laboratories, and other research institutions are well positioned to continue to examine and further define the key dimensions of these research topics. We can thus expect additional progress to be made in the future, building on the past two decades of work already completed.
Final Summary and Concluding Thoughts In conclusion, PEVs are becoming commercialized in many more types and body styles and by more manufacturers that has ever before been the case. It is likely that the 2011–2012 period will be considered a “water shed” time for PEVs, where the thousands of BEVs on the roads in the U.S. in 2000 will give way to tens of thousands and eventually hundreds of thousands of PEVs of various types in use by 2020 and beyond.
This report has examined the current setting for PEVs and e-fuel in California, including market conditions, policy and regulatory status, lessons learned from previous AFV commercialization efforts, and the current understanding of the overall “PEV value proposition,” including costs and emissions benefits. The report also documents an “Electric-Fuel Scale-Up Workshop” that was held at UC Berkeley in June 2011. Based on the project analysis and the outcomes of the workshop, several key policy and regulatory development recommendations are made.
These recommendations include:
• Recommendation 1: Differentiate electric fuel (e-fuel) from electricity for other uses • Recommendation 2: Develop requirements and protocols for e-fuel to be metered and
reported by electricity providers • Recommendation 3: Develop multi-year plans for state-level incentive programs,
including “feebates,” to provide better certainty to PEV manufacturers and consumers about the expected level of future state support
• Recommendation 4: Require EVSE and other PEV service providers who receive state funding to provide baseline data for use in state and regional analysis and planning
• Recommendation 5: Provide improved education and outreach efforts to better assist potential PEV adopters to understand the costs and benefits that they would incur by adopting PEVs of various types, clearly differentiating plug-in hybrids and battery EVs
• Recommendation 6: Explore prospects for utility ownership of submeters and EVSE and related equipment while enabling third-party solutions
93
• Recommendation 7: Work with automakers and other stakeholders to better understand future PEV markets
Finally, we note that the current time of mid-2011 is marked with a somewhat complicated set of circumstances in California that include a prolonged economic downturn and continued uncertainty about the future state economy, extraordinary other recent events affecting PEV commercialization (especially the Japanese earthquake in March 2011), relatively high gasoline prices, and in historical terms what seems to be a relatively high level of public awareness and concern about environmental issues. As we have noted throughout this report, these factors all cut in various ways for and against PEV commercialization.
What would be more beneficial than anything at this juncture, but is particularly hard to achieve given the current state of affairs, is a sense of certainty about future market conditions for PEVs and e-fuel. This would provide a more solid foundation for manufacturer planning and consumer purchase decisions. To an extent, additional policy and regulatory developments have the opportunity provide the clear, informed, informative, and consistent signals of support for PEV and e-fuel implementation that are so critical to their continuing prosperity.
In conclusion, there are several reasons to be optimistic about the future market prospects for PEVs. These include significant technical and economic improvements in key PEV technologies, a relatively high price regime for gasoline and diesel fuels in recent years and projected forward, and the significant public awareness of climate change and other environmental and energy security issues posed by continued high reliance on conventional fossil fuels. Furthermore, there are several noteworthy policies and programs in California that continue to evolve in ways that are supportive of PEV commercialization. However, additional opportunities can be addressed through further policy developments such as those suggested above. These and related key measures can best be targeted and developed with close coordination between state, regional, and local agencies and municipalities, as well as electricity providers, automakers, and other industry stakeholder groups.
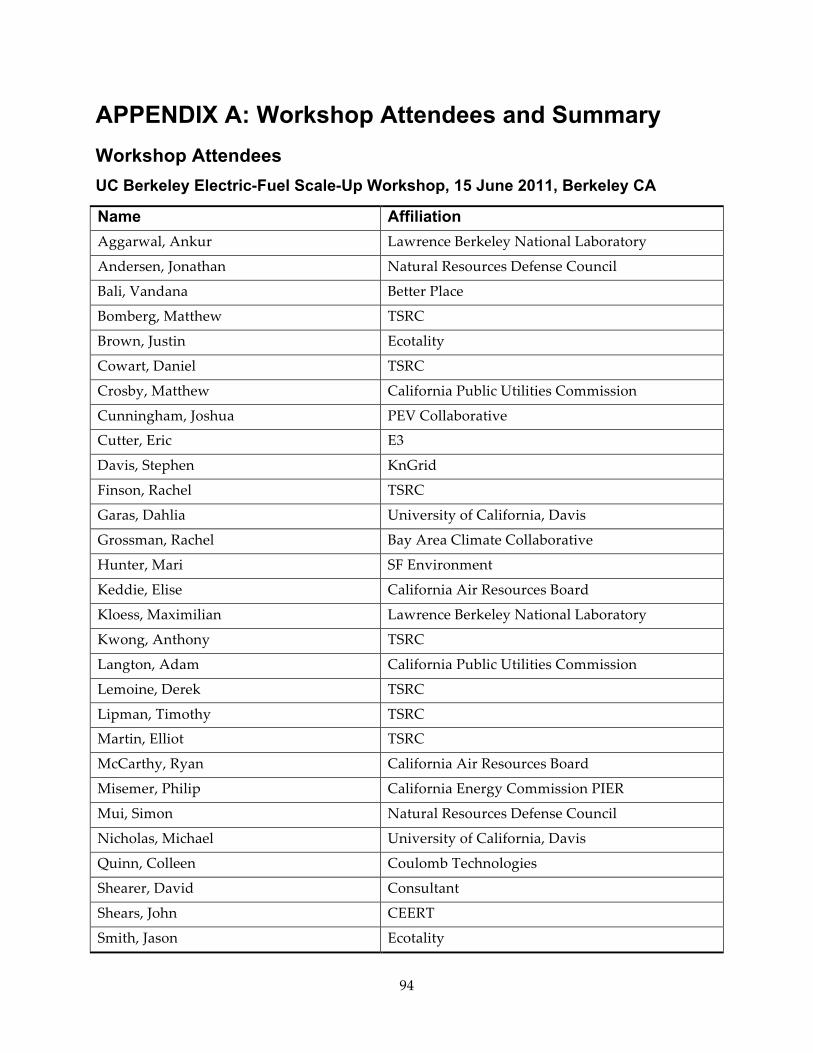
94
APPENDIX A: Workshop Attendees and Summary Workshop Attendees UC Berkeley Electric-Fuel Scale-Up Workshop, 15 June 2011, Berkeley CA
Name Affiliation Aggarwal, Ankur Lawrence Berkeley National Laboratory
Andersen, Jonathan Natural Resources Defense Council
Bali, Vandana Better Place
Bomberg, Matthew TSRC
Brown, Justin Ecotality
Cowart, Daniel TSRC
Crosby, Matthew California Public Utilities Commission
Cunningham, Joshua PEV Collaborative
Cutter, Eric E3
Davis, Stephen KnGrid
Finson, Rachel TSRC
Garas, Dahlia University of California, Davis
Grossman, Rachel Bay Area Climate Collaborative
Hunter, Mari SF Environment
Keddie, Elise California Air Resources Board
Kloess, Maximilian Lawrence Berkeley National Laboratory
Kwong, Anthony TSRC
Langton, Adam California Public Utilities Commission
Lemoine, Derek TSRC
Lipman, Timothy TSRC
Martin, Elliot TSRC
McCarthy, Ryan California Air Resources Board
Misemer, Philip California Energy Commission PIER
Mui, Simon Natural Resources Defense Council
Nicholas, Michael University of California, Davis
Quinn, Colleen Coulomb Technologies
Shearer, David Consultant
Shears, John CEERT
Smith, Jason Ecotality
95
Sprei, Frances Stanford University
Priya, Sreedharan E3
Stokes, Erik California Energy Commission PIER
Tutt, Eileen California Electric Transportation Coalition
Williams, Brett TSRC
Williams, Jim E3
Witt, Maggie TSRC
Yang, Christopher University of California, Davis
Zhang, Li University of California, Irvine
Workshop Summary The E-Fuel Scale-Up workshop took place on June 15th, 2011 at the David Brower Center in Berkeley California. Individuals in attendance had a wide range of affiliations including research institutions, non-profit organizations and collaborative groups, private companies, and regulatory agencies. The purpose of the workshop was to advance collective understandings about e-fuel and future e-fuel scale-up as a result of transitions from conventional vehicles to PEVs. Presentations and discussions from the workshop have also helped to shape and inform the development of this report. Key questions addressed, and the discussion points prompted by these questions, are listed below:
What are the likely environmental and human health benefits of e-fuel use in California compared to the use of gasoline? Workshop presentations and discussion focused primarily on the environmental and human health benefits resulting from reduced GHG emissions and emissions of pollutants found in tailpipe emissions. Matt Bomberg of TSRC presented results from the emissions impacts and valuation study and provided insights on how valuation studies could be used to justify government incentive programs that appropriately capture the environmental and human health externalities of PEV purchases.
What stands in the way of California’s adoption of 1 million PEVs? This question led to discussions of cost gaps that currently exist between conventional vehicles and PEVs. Workshop participants discussed how different financing and battery leasing strategies could be utilized in the future to mitigate PEV and battery first costs and the role that utilities could play in the future to assist in minimizing the cost gap. Participants also discussed the role that nonmonetary perks could have on PEV adoption and agreed that more research should be done on the effect of incentives, like rebates, on the rate of early and mainstream market adoption. Better understanding the role of these incentives could help government and regulators identify an appropriate level for rebates or other incentives and justify establishing longer-term rebate programs with more sustainable funding sources.
What is the current policy and regulatory context for e-fuel and PEV use in California? Key points of discussion here included the California's ZEV regulation and recently proposed changes, California's Low Carbon Fuel Standard, and the recently announced proposed decision on the CPUC's Alternative Fueled Vehicle Proceeding. Elise Keddie from CARB presented specifically on the ZEV regulation and emphasized upcoming changes that promise
96
to heighten the program's focus on PHVs, BEVs, and FCEVs. This will be accomplished by phasing out hybrids and low emissions conventional vehicles that, in CARB's view, have already achieved commercialization. Discussions of the Low Carbon Fuel Standard mostly revolved around lingering questions of how electricity for PEV charging will be tracked and who will benefit from LCFS credits. Finally, Matt Crosby and Adam Langton from the CPUC provided a comprehensive overview of the Commission's ongoing rulemaking regarding Alternative Fueled Vehicles, which was spurred by new legislation calling for the evaluation of barriers and opportunities for accelerated PEV adoption in California in order to deliver GHG and other emissions reductions. Mr. Crosby and Mr. Langton focused on the contents of the recently proposed decision, which the Commission is likely to vote on in the near-term. The decision includes setting up processes for PEV notification and for the evaluation of different PEV metering options throughout the state. Currently, the CPUC views existing PEV charging rate structures as adequate for near-term, early adopters, but intends to revisit this in 2013.
Should electricity used as "e-fuel" be treated differently from electricity for other uses? Whether or not electricity used as for PEV charging should be treated differently from electricity for other uses remains a fundamental question—one that arises in a discussion of "good load" versus "bad load"—terms raised in the presentation by Eric Cutter of E3—and the quandary of how electricity for PEV charging will be viewed by utilities given "decoupling." Decoupling separates utility revenues from the quantity of electricity sold by the utility in order to eliminate any disincentives on the part of the utility to encourage energy conservation and efficiency. While decoupling makes sense for most electricity uses, however, it seems counter-intuitive for e-fuel, which is actually a preferred alternative to gasoline. This, in turn, places e-fuel and PEVs in a "good load" category, which can only be distinguished from "bad load" if it is perceived and tracked differently from electricity for other uses.
There are several compelling arguments for the treatment of e-fuel as different from electricity used for other purposes. First, compared to gasoline, electricity as an "e-fuel" significantly reduces the amount of fuel needed for vehicle propulsion as a result of the superior efficiencies that can be achieved by PEV drivetrains. Second, in most households in California, electricity is much less carbon intensive than gasoline since most electricity comes from cleaner burning natural-gas power plants that can achieve much higher efficiencies than typical combustion engines. Third, e-fuel will likely play a key role in achieving the goals set out by the Low Carbon Fuel Standard which seeks to reduce emissions contributions from the transportation sector by decreasing the carbon intensity of the state's transportation fuel mix. If e-fuel is not distinguished from electricity for other purposes and tracked separately, it will be difficult—if not impossible—for the state to identify how much of the transportation fuel mix has been offset by electricity. And fourth, separate tracking would seem to be necessary for the eventual implementation of a make-up road tax on e-fuel, though alternatives discussed include a tire tax, increased DMV fees, and VMT-based fees.
Further Detail Prepared by Daniel Cowart
The E-Fuel Scale-Up workshop took place on June 15th, 2011 at the David Brower Center in Berkeley California. Individuals in attendance had a wide range of affiliations including research institutions, non-profit organizations and collaborations, private companies, and regulatory agencies. Tim Lipman of TSRC planted some “big ideas” for later discussion. He discussed the importance of PEV commercialization, barriers of PEV penetration, gasoline price as an unpredictable variable, and the place of policy to address said barriers. Brett Williams of TSRC facilitated introductions and summarized related TSRC work on the valuation of
97
repurposing used PEV batteries into distributed energy storage appliances providing various grid services.
Elise Keddie of CARB summarized the air-quality and emissions situation in California. She discussed the necessity of ZEV market penetration to meet CARB goals, noting that if 100% of the vehicles on the road were hybrids by 2030 the goals still would not be met; 87% of all vehicles must be FCEVs or BEVs. She introduced CARB’s ZEV Program and its OEM production requirements. Several thousand ZEVs currently on the road are proving their technical viability, and the rapid progress of battery and fuel-cell technology along with early stages of a charging infrastructure is making the market ripe for early ZEV commercialization. She stated it was the belief of CARB that a “critical mass” of ZEVs by 2025 was required to reach 2050 goals. This critical point would be the inflection point on the cost curve. It is anticipated that 14% of new vehicle sales will be BEVs, FCEVs, and PHVs by 2025. The topic of ZEV incentives sparked much discussion of their effectiveness and how they should be handled. The effect of reducing the rebate and whether the amount is a large factor was debated Non-monetary perks (e.g. free parking for ZEVs) were cited as effective in Sweden, but backlash at the removal of perks was a cause of worry, as evidenced by the recent cessation of hybrid HOV lane access. Reports of auto dealers undermining if not effectively “stealing” rebates was discussed. The third-party distribution of the rebate was well accepted as providing many benefits, from more reliable handling of funds to a simplified refund process. The new HOV program for PHVs was also presented. It will only apply for PHEVs that meet the highest emissions standards, and a new line of green stickers will replace the old yellow stickers. The Chevy Volt does not qualify for the upcoming green sticker, but dealers may still use this as a sales pitch. The Low Carbon Fuel Standard was mentioned, and that CARB was developing a methodology for metering and determining credits for electricity as a low-carbon fuel. Finally, The EV Project was discussed, including data collection and testing EVSE revenue systems.
Maggie Witt of TSRC began her presentation on forecasted PEV penetration rates by noting that since 2007 the number of PEVs on the road has doubled. She discussed the large range of forecasts that have been made and the different metrics and analytical techniques used to arrive at each forecast. The CARB 2009 ZEV Review proposed two scenarios for ZEV adoption aimed at meeting future goals (i.e., “backcasting”). The first scenario is less aggressive, with greater penetration of hybrids and PHVs during the transition to a 100% ZEV population in passenger vehicles and 66% GHG reduction by 2050. The second, more aggressive, scenario involves significantly fewer PHV sales in the transition period than the first scenario, leading to an 80% GHG reduction and 100% ZEV population by 2040. Factors used to determine penetration rates were described, including battery and gasoline costs, public perspectives of PEVs, and the regulatory environment. Public perspective is influenced by misleading questionnaires, mis-information, and politics. The GHG control measures, PEV subsidies, and LCFS credits need to be considered when forecasting the penetration of PEVs. The presentation concluded discussion of the two penetration scenarios considered for the TSRC study of emission reductions (described next).
Matthew Bomberg of TSRC began by describing the methodology required to gain an accurate picture of the environmental impact from e-fuel scale-up. With emissions moving from tailpipe to smokestack, both the location of power plants (spatial) and the charging behavior of the population (temporal) need to be evaluated. It is generally accepted that charging at night is preferable, but the actual anticipated impact of this is less well quantified. Working in cooperation with E3, no significant emissions benefit was found at the PEV penetration levels analyzed. The location and amount of emissions benefit remains essentially constant regardless of charging pattern. However, factors such as ground level ozone formation, which depends on sunlight, were not considered. This, along with the relatively consistent heat-rates of plants in the Bay Area (making it hard to know exactly which power plant will be dispatched at a given time), indicate that more analysis is needed. When taking into account the cost of carbon, the
98
emissions benefit of e-fuel covers up to 33% of the first life cost gap. Another important consideration presented was the spatial variability of air-quality benefits, opening up issues of environmental justice.
Adam Langton and Matthew Crosby of the CPUC continued the workshop by discussing the 4,400 GWh load increase expected from PEV penetration by the year 2020. The next issue addressed was the recent regulatory changes affecting the creation of PEV charging infrastructure. This ranged from charger owners and operators not being considered a public utility themselves, to metering options for PEVs and MOUs with automakers to give addresses of new PEV owners to the utility. The options available for metering were expounded upon, discussing the advantages and disadvantages of using a single meter for both house and PEV, two separate meters, each owned by the utility, or utilizing a customer-side submeter to dissociate home load and PEV load. There was a great deal of discussion about submetering and the potential of disaggregating a household’s energy usage. Since most customers are charged on a tiered rate, separating out the PEV load would allow it to avoid the tiered system. If high-power chargers are to be installed in residential units, a demand charge may have to be instated (a fee for maximum power draw that is normally used for industrial consumers). A submeter would also incur a substantial capital cost on the consumer, which could deter sales of chargers or PEVs. If the consumer could rent the submeter, the cost could be reduced. Another attractive feature of having PEV charging metered separately is to allow for a make-up road tax. Ideas includes taxing electricity used for PEV charging, increasing DMV fees, instating a tire tax, and taxing mileage. There was also a concern that the CPUC’s proposal, though meant to limit unfair competition, would cut out a large potential investor in infrastructure, the utility.
In following with the talk, Maggie Witt continued discussing the current policy and regulatory context. She discussed AB 32, AB118, SB626, Executive Order S-01-07, and CARB’s ZEV regulations. Some of the key issues discussed were distinguishing between “good load” and “bad load” in metering, accounting for LCFS, and meter ownership. The topic of education and outreach was also discussed. The federal goal of one million EVs on the road by 2015 is a tall order that several programs, including The EV Project, are working towards. Several individuals discussed PEV readiness on the local government level. Also discussed was the potential of PEV backlash, where popular opinion could be swayed to view PEV infrastructure as a waste of taxpayer money if chargers were placed poorly and were not used. One means of attempting to avoid this negative outlook would be to advertise the placement of PEVs as an experimental study. Another suggestion was to put PEV chargers near currently existing gas stations. The discussion of gas stations brought the group back to the new “EV gas tax” that would need to be developed, and the ideas brought forth earlier were again discussed.
Joshua Cunningham of the PEV Collaborative summarized the Collaborative, its 2010 strategic plan, its membership, and its two-year project plan, including mission statement, goals, and the structure and planning of committees expected to achieve these goals. The PEV Collaborative has six goals: positive consumer experience with PEVs, PEV ownership prices competitive with gasoline vehicles, integration of PEV charging into the grid, increased air quality and energy security due to PEVs, creation of jobs and economic benefits, and movement of PEVs into the mainstream market. A breakdown of the working groups being formed and their function was given. The conclusion of the presentation dealt with the 2010 strategic plan, its goals, stakeholders, funding, and list of tasks. The results of the strategic plan were then discussed, noting that the project was well balanced between the many stakeholders involved. It was made clear that the Collaborative does not lobby specific bills, but they do communicate with policymakers regarding the necessity of PEVs, which would affect the voting on and writing of transportation-related bills indirectly. Discussion then turned to the current state government’s position on PEVs, and there was shared hesitance due to the governor’s lack of an official stance on PEVs.
99
Eric Cutter of E3 gave the final presentation of the workshop on the positive load growth that will be caused by PEVs. E3 sees PEV penetration as a necessary tool to make deep cuts in carbon emissions. It is anticipated that cap-and-trade will not be the policy vehicle to deliver the required reductions, particularly for transportation, but that other policies such as renewable portfolio standards will carry the torch. Two examples of utilities exercising very different strategies in power generation were given. BC Hydro, the first utility, had a very strong hydroelectric portion of its portfolio and was actively transitioning from natural gas to renewables. The next stage for this utility is to electrify current fossil fuel uses, such as transportation. The second example, Duke Energy Carolinas, is predominately nuclear and coal. Next, it was suggested that that without possible “recoupling” of load increase and revenue, rates could increase for customers to pay for grid upgrades to handle the extra load and the cost of the new power generation. It is critical that PEV load be seen as a positive load growth to the system in the eyes of regulation. This is because PEV load has environmental benefit and can, under the right regulatory environment, increase utility profit. With the recoupling of revenue for the positive growth, it should be structured so that this load growth does not count against energy efficiency, GHG, or RPS targets. Utilities should be conscious that their PEV rates are above the cost of supply but still below the cost of gasoline. Utilities can also derive benefit from PEV and charging technology to mitigate peak load impacts.
The presentation continued with a look at projected PEV penetration rates around the Bay Area, with some zip codes having adoption as high as 23%. Level 2 chargers can easily match the peak load of a small household. This combination of high adoption and demanding charging equipment will become a strain on some parts of the grid soon, however there is more that can be done than simply building more infrastructure. Smart charging is one technology that would give a win-win-win situation for society, the utility, and ratepayers simultaneously. The greatest hurdle to electrification is combating the more than 20 years of policy focused on load growth as a negative trend. This policy’s history is heavily laden with litigation and is a Pandora’s box that utilities do not want to revisit. It is necessary that an unprecedented level of coordination between automakers, utilities, government and regulatory bodies, and consumers be achieved to proceed with new policy creation. This will be destabilizing for oil companies and confront the auto industry with new challenges, so resistance is to be expected. To beat the “chicken and egg” dilemma to infrastructure and PEV adoption, socialization of infrastructure costs could be necessary. The presentation concluded with a discussion of the question of inclusion or exclusion of the new PEV load under the GHG cap and trade system, and there was a lot of discussion about the purchasing of allowances and LCFS credits.
Brett Williams asked for closing thoughts from the attendees. Concern was stated about the gaps in research, primarily the lack of concrete charging behavior data; only with that data in hand can real statements about grid impact and infrastructure upgrades be made. Next was an insistence that we focus on the local government level to achieve real results. Another hurdle mentioned was battery cost, and suggesting whether the utility could help in this realm by either buying new or used batteries. Questions were raised about how much of early EV demand had been influenced by incentive programs, what will happen when these incentives are pulled, and what factors do consumers really weigh when deciding if they should go electric—not just in California but throughout the U.S. It was also mentioned that technological funding must be increased if we ever want to see vehicles robust enough for the mainstream market. A suggestion was made to try a high “media profile” project, such as a city phasing out Crown Victoria’s and replacing them with PEVs. Market sustainability was addressed; without a means of lowering the first buyer cost, the PEV market will crash when the incentives are withdrawn. A measure suggested was trying to find value in the battery after its first life in the vehicle. The next comment reasserted that the new PEV load must be metered separately due to its unique nature of being “good” load with environmental benefit. It was suggested that the ISO participate in these workshops; PEVs could be critical in the stabilization of renewables such as wind. A comment questioned if electricity and e-fuel really should be treated separately.

100
Speaking more to the technical feasibility and risks of residential charging instead of metering issues, it was suggested that the cost of such infrastructure, on a per-customer basis, be investigated. In lieu of PEVs that have longer range themselves, it was suggested that perhaps membership in a car share program would alleviate the issue of not having a long-range vehicle for the occasional trip outside of the city. The final comment reasserted many points made earlier, and also stressed the need of getting the utilities behind this movement with some sort of incentive structure.
In summary, several themes from the workshop emerged, including:
The effect of incentives on consumers’ decision to buy:
• Is the attractiveness of the PEV a strong function of the amount of the rebate?
• Non-monetary perks (e.g. free parking for PEVs)
• Waiving/lowering sales tax in lieu of a government check
Metering Issues with PEVs
• Benefits and drawbacks to each configuration of metering
• Is it desirable to bill PEV load separately? “Good load” vs. “bad load”
• A system must be established for PEVs to begin paying for road repair
• alternatives include: e-fuel tax, tire tax, changes in DMV fees, VMT-based tax
• If there is to be a second meter or a submeter, does ownership lie with the consumer or the utility? Investigate possibility of leasing submeters.
• Fast chargers in residential zones could pose a great strain on the grid.
Policy changes to aid PEV penetration
• Recouple revenue and load growth for PEVs
• PEV load is different because environmental benefit is being derived
• Smart charging is a technology that provides win-win-win benefits
• Breaking “chicken and egg” barrier to infrastructure and PEV adoption may require socialization of initial costs
Possible further study
• Rigorous charging-behavior data collection and study to better understand grid impact.
• Grid analysis to determine the proper extent of fast charger use.
• Market surveys to determine the effect of incentives on the early adopters and the mainstream market. Also to determine the effect of the removal of said incentives.
• Consumer study of the most important factors weighed when considering using PEVs (and on the national level, to compare to research of California’s market)
101
APPENDIX B: AFV Commercialization Efforts - Additional Details Hybrids and Battery-Electric Vehicles International experiences: 1990s Between October 2007 and June 2010, the International Energy Agency (IEA)—with sponsorship from the governments of Switzerland, Sweden, Austria, Great Britain, and the U.S.—led a study of the lessons learned from hybrid and battery electric vehicle (BEV) deployments in Europe, Japan, and the U.S. in the 1990s. Data for the study was collected via interviews and eight workshops in five countries. Study participants included original equipment manufacturers (OEMs), government agencies, universities, and IEA representatives. UC Davis's Tom Turrentine served as the agent for this study.
Key topics assessed included the following:
• Incentive programs like tax breaks, high occupancy vehicle (HOV) lane access, free parking, etc.;
• Deployment approaches, including mandates and procurement programs; • Retail programs, including market planning, fleets, and dealerships; • Infrastructure and utility lessons about slow versus fast charging and billing challenges; • Market research practices like modeling and demonstrations; and • Possible commercial approaches, including pay-as-you-drive batteries and leasing
options (Turrentine 2011a).
Lessons learned by OEMs During the IEA-sponsored workshops, OEMs Peugeot, General Motors, Nissan, Toyota, Volvo, and Esoro outlined several key lessons learned from their experiences in the 1990s.
Among these lessons learned, the IEA study revealed a clear split in the reactions of U.S. OEMs versus Japanese OEMs to the California's 1990 Zero Emission Vehicle regulation that required that automakers' new vehicle fleets include two percent ZEVs by 1998 and ten percent by 2003 (ZEV regulation is discussed in greater detail in the next section). In the 1990s, the California market was more important to Toyota, Honda, and Nissan than it was to U.S. OEMs like General Motors, Ford, and Chrysler that made large profits by selling SUVs and light-duty trucks (Turrentine 2011b). For this reason, Japanese OEMs complied with the mandate by developing ZEVs suitable for mass-production, while U.S. OEMs opted to produce ZEVs that complied with the law but would never be suitable for mass-production. Additionally, while Japanese automakers depended heavily on exports to the U.S., they had much less control or influence over laws in the U.S. than the big three U.S. automakers mentioned above. Thus, while U.S. OEMs filed lawsuits fighting the ZEV regulation, Japanese OEM's moved forward with new vehicle designs that would meet ZEV requirements. These new designs included early Toyota hybrids.
The following lists other lessons learned noted by OEMs.
• Batteries for hybrids and BEVs were and are expensive, and thus require subsidies; • OEMs must produce a minimum 20,000 units per year in order to earn a profit, but
selling this many vehicles may be challenge in years to come (i.e. Peugeot built factory for 20,000 units per year, but sold only 2,000 in its best year); and
102
• Three OEMs explained that they were unable to sustain long-term research and development for BEVs when company profits fall.
Lessons learned by regulators From the regulatory perspective, CARB found it difficult to justify compelling automakers to implement technologies that needed long-term research and development and lacked near-term benefits. Despite this challenge and the overall boldness of the regulation, the agency acknowledged that the ZEV regulation proved beneficial by spurring the development of 24 much cleaner vehicles across California’s fleet. The ZEV regulation also resulted in research and development investments in batteries and helped prepare CARB and the market for future GHG controls. CARB noted that the Advanced Technology Partial ZEV provision was instrumental in motivating technology development (Turrentine 2011a).
Lessons learned by utilities Based on experiences in the 1990s, many utilities—including EDF (France), La Rochelle (France), Mendrisio (Switzerland), and Stockholm and Gotenberg (Sweden) found that public "fast" charging infrastructure was expensive, over-subsidized, and underused in most locations where household charging was available (Turrentine 2011b). Utilities were particularly vocal about this because many of them funded, at least partially, the cost of fast charging stations. Utilities also indicated a need to simplify the purchase of BEVs and the necessary charging infrastructure, and U.S. utilities in particular noted that "charging standard wars" resulted in increased problems and expenses for BEV charging infrastructure (IEA 2010).
Research conclusions The IEA study concluded that systematic co-operation is needed between OEMs, government, and the power industry in order to build relationships and the foundation necessary for larger-scale electric vehicle deployment. Careful timing of the rollout of vehicles, infrastructure, incentives, taxes and tax rates should also be considered. Study participants noted that there is a particular need to bridge the gap between early market and the commercialized market with better public education about BEVs and electric transportation (Turrentine 2011a).
Plug-in Electric Vehicles California experiences: 1990-2003 Significant efforts to produce practical plug-in electric vehicles (PEVs) for consumer use began in the 1990s following the passage of the aforementioned California ZEV regulation. In response to this regulation, major auto manufacturers began researching and producing early PEVs, including the Honda EV Plus, GM EV1, Ford Ranger pickup EV, Nissan Altra EV, Chevy S-10 EV, and Toyota RAV4 EV. These vehicles were made available to consumers via short-term leases, most of which expired and were not renewed in the early 2000s.
Despite the short-term and low-volume rate of PEV adoption in the 1990s, experiences in California nevertheless provided key insights into aspects of PEV rollout and scale-up, including infrastructure, electric fuel costs, incentives for PEV leases and charger installations, and the role of utilities and "authorized charger service providers."
PEV charging infrastructure PEV chargers in the 1990s used either inductive chargers (power transferred via a magnetic field) or conductive chargers (power transferred via direct connection/wiring). PEVs charged inductively included General Motor's EV1, Chevy's S-10 EV, Toyota's RAV4 EV, and Nissan's Alta EV. The most commonly used inductive charger was the MagneCharge, produced by
103
General Motors' subsidiary Delco Electronics. Edison EV (previously Clean Fuel Connection, Inc.) and Sacramento Municipal Utility District contracted with General Motors as "authorized charger service providers" to provide charger installation and maintenance services. At-home chargers (not included in vehicle leases) cost ~$2,000 to purchase or ~$50-55 per month to lease (PRNewsWire 1996). EVs charged conductively included the Ford Ranger EV and the Honda EV Plus. The AVCON was the most commonly used conductive charger and costs ranged from $700 to $1,400 (CARB 2001).
Ultimately, the inconsistency in PEV charging hardware translated to higher public costs, since CARB installed many public chargers and thus took care to provide both types of chargers in order to avoid favoritism. In 2001, CARB responded to this inefficiency by making conductive chargers the industry standard in California. Of the two systems, CARB staffers recommended the conductive system because of its durability, lower cost, and ability to provide power back to the grid more easily (a future goal for PEVs) (CARB 2001). CARB's decision about charger standardization became effective in 2003.
PEV charging electricity rates In the 1990s, many utilities offered discounted electricity rates for off-peak electricity users with time-of-use (TOU) meters. These meters cost ~$235 to install, but could reduce the price-per-kilowatt-hour charge by half in some regions (EPRI 2001). In addition, Edison EV, the authorized charger service provider in California, offered to install timers for EV leasers with TOU meters that turned EV chargers on during off-peak hours and off during peak hours.
Table B-1 below contrasts residential peak electricity rates versus EV charging, off-peak rates in the Pacific Gas and Electric (PGE), Southern California Edison (SCE), Los Angeles Department of Water and Power (LADWP), and Sacramento Municipal Utility District (SMUD) regions in 2000 (Kempton et al. 2001).
Table B-1: TOU Rates (2000) Relevant for EV Charging in PGE, SCE, LADWP, and SMUD Regions (Kempton et al. 2001, p.63)
Utility Rate Schedule Peak Rate ($/kWh)
EV Charging Rate (Off-Peak, $/kWh)
PGE E-7 $0.32 $0.04 SCE TOU-D-1 $0.49 $0.04 LADWP Rate B $0.14 $0.01 SMUD Rate R Optional TOU $0.16 $0.04
PEV leasing incentives In the 1990s, two key incentives were created to encourage PEV leasing in California: 1) a 10 percent federal tax credit and (2) a $5,000 "buy-down" credit for PEVs leased in the South Coast Air Quality Management District region (including Los Angeles, Orange, Riverside and parts of San Bernardino Counties).
Natural Gas Vehicles Widely used in stationary applications, natural gas has been considered a viable alternative transportation fuel because of its higher octane number, low emissions, low price, and abundant reserves (Liu et al. 2008). The Energy Policy Act of 1992 denotes both compressed natural gas (CNG) and liquefied natural gas (LNG) as "alternative fuels," making them eligible for alternative-fuel tax credits (covered in greater detail below) (U.S. DOE n.d.a). Both kinds of fuels can be used to provide propulsion energy for natural gas vehicles (NGVs).
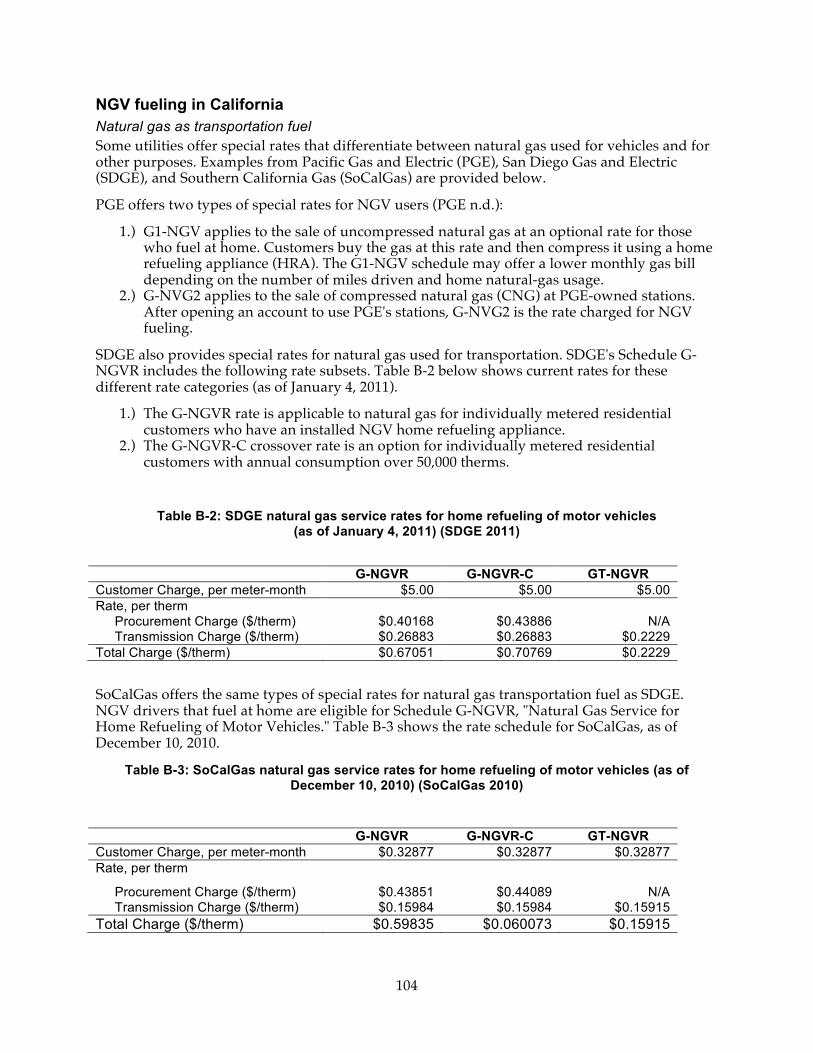
104
NGV fueling in California Natural gas as transportation fuel Some utilities offer special rates that differentiate between natural gas used for vehicles and for other purposes. Examples from Pacific Gas and Electric (PGE), San Diego Gas and Electric (SDGE), and Southern California Gas (SoCalGas) are provided below.
PGE offers two types of special rates for NGV users (PGE n.d.):
1.) G1-NGV applies to the sale of uncompressed natural gas at an optional rate for those who fuel at home. Customers buy the gas at this rate and then compress it using a home refueling appliance (HRA). The G1-NGV schedule may offer a lower monthly gas bill depending on the number of miles driven and home natural-gas usage.
2.) G-NVG2 applies to the sale of compressed natural gas (CNG) at PGE-owned stations. After opening an account to use PGE's stations, G-NVG2 is the rate charged for NGV fueling.
SDGE also provides special rates for natural gas used for transportation. SDGE's Schedule G-NGVR includes the following rate subsets. Table B-2 below shows current rates for these different rate categories (as of January 4, 2011).
1.) The G-NGVR rate is applicable to natural gas for individually metered residential customers who have an installed NGV home refueling appliance.
2.) The G-NGVR-C crossover rate is an option for individually metered residential customers with annual consumption over 50,000 therms.
Table B-2: SDGE natural gas service rates for home refueling of motor vehicles (as of January 4, 2011) (SDGE 2011)
G-NGVR G-NGVR-C GT-NGVR Customer Charge, per meter-month $5.00 $5.00 $5.00 Rate, per therm
Procurement Charge ($/therm) $0.40168 $0.43886 N/A Transmission Charge ($/therm) $0.26883 $0.26883 $0.2229
Total Charge ($/therm) $0.67051 $0.70769 $0.2229
SoCalGas offers the same types of special rates for natural gas transportation fuel as SDGE. NGV drivers that fuel at home are eligible for Schedule G-NGVR, "Natural Gas Service for Home Refueling of Motor Vehicles." Table B-3 shows the rate schedule for SoCalGas, as of December 10, 2010.
Table B-3: SoCalGas natural gas service rates for home refueling of motor vehicles (as of December 10, 2010) (SoCalGas 2010)
G-NGVR G-NGVR-C GT-NGVR Customer Charge, per meter-month $0.32877 $0.32877 $0.32877 Rate, per therm
Procurement Charge ($/therm) $0.43851 $0.44089 N/A Transmission Charge ($/therm) $0.15984 $0.15984 $0.15915
Total Charge ($/therm) $0.59835 $0.060073 $0.15915
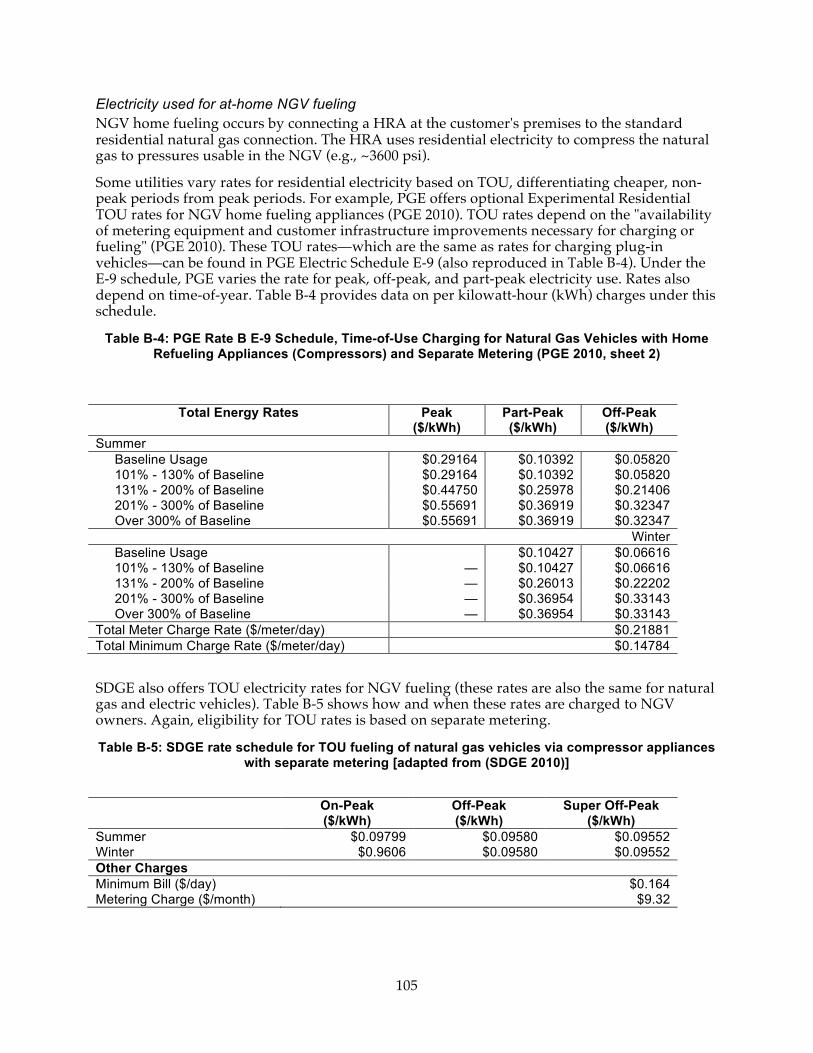
105
Electricity used for at-home NGV fueling NGV home fueling occurs by connecting a HRA at the customer's premises to the standard residential natural gas connection. The HRA uses residential electricity to compress the natural gas to pressures usable in the NGV (e.g., ~3600 psi).
Some utilities vary rates for residential electricity based on TOU, differentiating cheaper, non-peak periods from peak periods. For example, PGE offers optional Experimental Residential TOU rates for NGV home fueling appliances (PGE 2010). TOU rates depend on the "availability of metering equipment and customer infrastructure improvements necessary for charging or fueling" (PGE 2010). These TOU rates—which are the same as rates for charging plug-in vehicles—can be found in PGE Electric Schedule E-9 (also reproduced in Table B-4). Under the E-9 schedule, PGE varies the rate for peak, off-peak, and part-peak electricity use. Rates also depend on time-of-year. Table B-4 provides data on per kilowatt-hour (kWh) charges under this schedule.
Table B-4: PGE Rate B E-9 Schedule, Time-of-Use Charging for Natural Gas Vehicles with Home Refueling Appliances (Compressors) and Separate Metering (PGE 2010, sheet 2)
Total Energy Rates Peak ($/kWh)
Part-Peak ($/kWh)
Off-Peak ($/kWh)
Summer Baseline Usage $0.29164 $0.10392 $0.05820 101% - 130% of Baseline $0.29164 $0.10392 $0.05820 131% - 200% of Baseline $0.44750 $0.25978 $0.21406 201% - 300% of Baseline $0.55691 $0.36919 $0.32347 Over 300% of Baseline $0.55691 $0.36919 $0.32347
Winter Baseline Usage $0.10427 $0.06616 101% - 130% of Baseline — $0.10427 $0.06616 131% - 200% of Baseline — $0.26013 $0.22202 201% - 300% of Baseline — $0.36954 $0.33143 Over 300% of Baseline — $0.36954 $0.33143
Total Meter Charge Rate ($/meter/day) $0.21881 Total Minimum Charge Rate ($/meter/day) $0.14784
SDGE also offers TOU electricity rates for NGV fueling (these rates are also the same for natural gas and electric vehicles). Table B-5 shows how and when these rates are charged to NGV owners. Again, eligibility for TOU rates is based on separate metering.
Table B-5: SDGE rate schedule for TOU fueling of natural gas vehicles via compressor appliances with separate metering [adapted from (SDGE 2010)]
On-Peak ($/kWh)
Off-Peak ($/kWh)
Super Off-Peak ($/kWh)
Summer $0.09799 $0.09580 $0.09552 Winter $0.9606 $0.09580 $0.09552 Other Charges Minimum Bill ($/day) $0.164 Metering Charge ($/month) $9.32
106
NGV incentives in California Income tax credits Income Tax Credits for Alternatively Fueled Vehicles (AFVs). The Energy Policy Act of 2005 provided income tax credits for newly purchased AFVs. These tax credits apply toward 50 percent of the incremental cost of the vehicles and 30 percent additional if the vehicles meet tight emissions standards (NGV America n.d.). Tax credits were available 31 December 2005 through 31 December 2010 and required that NGVs were purchased and placed into service in the same tax year.
Income Tax Credits of Alternative Fuel Infrastructure. The Energy Policy Act of 2005 also provided income tax credits of 30 percent of the cost of natural-gas fueling equipment, up to $30,000 for large stations and $1,000 for home refueling appliances. Under the American Recovery and Reinvestment Act of 2009, tax credits were increased for 2009 and 2010 to $50,000 or 50 percent of the cost for large stations and $2,000 or 50 percent for home refueling appliances. Like the income tax credits explained above, the infrastructure tax credit expired 31 December 2010 (NGV America n.d.).
Excise Tax Credit to the Seller of CNG or LNG. The Energy Policy Act of 2005 also provided an excise tax credit of $0.50 per gasoline-gallon-equivalent for sellers of CNG or LNG used for motor fuel. The excise tax credit was in effect 31 December 2006 through 31 December 2009.
Other incentives Related to installation and infrastructure costs, the South Coast Air Quality Management District (SCAQMD) provides up to $1,000 toward the purchase and installation of qualified Phill™ NGV home fueling appliances (U.S. DOE n.d.a). Other incentive programs include eligibility for HOV stickers and 10 percent car insurance discounts through Farmers Insurance (DriveClean.ca.gov n.d.).
Fuel Cell Electric Vehicles The following provides information about past experience fuel cell electric vehicles (FCEVs), including experience with hydrogen generation and storage, costs, infrastructure, incentives, and standards.
FCEV hydrogen generation and storage Hydrogen fuel is generated via steam reforming of natural gas and electrolysis of water. Today, steam reforming is most common, accounting for ~95 percent of the nine million tons of hydrogen produced in the U.S. each year (U.S. DOE n.d.b). However, the U.S. DOE is exploring other ways of producing hydrogen that rely less on fossil fuels and produce fewer greenhouse gas emissions. These alternative hydrogen production methods include fermentation, biological water splitting, photo-electrochemical water splitting, conversion of biomass and wastes, solar thermal water splitting, and renewable electrolysis (U.S. DOE n.d.c). While research into these alternative hydrogen production methods is underway, uncertainty about the future of FCEVs can be limiting.
In addition to generation, hydrogen storage for mobile applications is also challenging. Hydrogen's high volume-to-energy ratio requires larger tanks to store large quantities of fuel for ranges comparable to conventional vehicles (U.S. DOE n.d.c).
FCEV costs Fuel cell and onboard hydrogen storage capital costs may challenge future FCEV adoption and market penetration. Despite recent dramatic improvements, fuel cells are still relatively
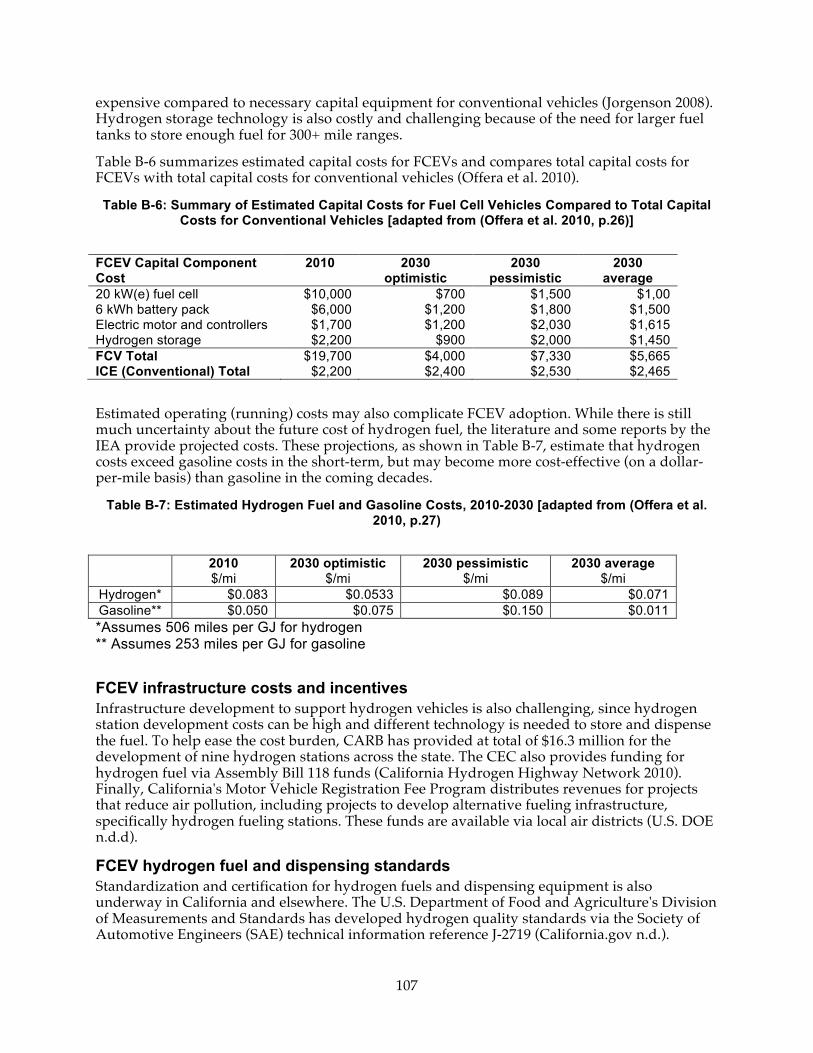
107
expensive compared to necessary capital equipment for conventional vehicles (Jorgenson 2008). Hydrogen storage technology is also costly and challenging because of the need for larger fuel tanks to store enough fuel for 300+ mile ranges.
Table B-6 summarizes estimated capital costs for FCEVs and compares total capital costs for FCEVs with total capital costs for conventional vehicles (Offera et al. 2010).
Table B-6: Summary of Estimated Capital Costs for Fuel Cell Vehicles Compared to Total Capital Costs for Conventional Vehicles [adapted from (Offera et al. 2010, p.26)]
FCEV Capital Component Cost
2010 2030 optimistic
2030 pessimistic
2030 average
20 kW(e) fuel cell $10,000 $700 $1,500 $1,00 6 kWh battery pack $6,000 $1,200 $1,800 $1,500 Electric motor and controllers $1,700 $1,200 $2,030 $1,615 Hydrogen storage $2,200 $900 $2,000 $1,450 FCV Total $19,700 $4,000 $7,330 $5,665 ICE (Conventional) Total $2,200 $2,400 $2,530 $2,465
Estimated operating (running) costs may also complicate FCEV adoption. While there is still much uncertainty about the future cost of hydrogen fuel, the literature and some reports by the IEA provide projected costs. These projections, as shown in Table B-7, estimate that hydrogen costs exceed gasoline costs in the short-term, but may become more cost-effective (on a dollar-per-mile basis) than gasoline in the coming decades.
Table B-7: Estimated Hydrogen Fuel and Gasoline Costs, 2010-2030 [adapted from (Offera et al. 2010, p.27)
2010 $/mi
2030 optimistic $/mi
2030 pessimistic $/mi
2030 average $/mi
Hydrogen* $0.083 $0.0533 $0.089 $0.071 Gasoline** $0.050 $0.075 $0.150 $0.011 *Assumes 506 miles per GJ for hydrogen ** Assumes 253 miles per GJ for gasoline
FCEV infrastructure costs and incentives Infrastructure development to support hydrogen vehicles is also challenging, since hydrogen station development costs can be high and different technology is needed to store and dispense the fuel. To help ease the cost burden, CARB has provided at total of $16.3 million for the development of nine hydrogen stations across the state. The CEC also provides funding for hydrogen fuel via Assembly Bill 118 funds (California Hydrogen Highway Network 2010). Finally, California's Motor Vehicle Registration Fee Program distributes revenues for projects that reduce air pollution, including projects to develop alternative fueling infrastructure, specifically hydrogen fueling stations. These funds are available via local air districts (U.S. DOE n.d.d).
FCEV hydrogen fuel and dispensing standards Standardization and certification for hydrogen fuels and dispensing equipment is also underway in California and elsewhere. The U.S. Department of Food and Agriculture's Division of Measurements and Standards has developed hydrogen quality standards via the Society of Automotive Engineers (SAE) technical information reference J-2719 (California.gov n.d.).

108
Furthermore, SAE J-2600 and J-2799 have been used to develop nozzle certification and filling communication hardware. Finally, to comply with SB 1505 (Environmental and Energy Standards for Hydrogen Production), CARB is developing regulations for producing hydrogen transportation fuel, which will include standards for renewable energy, greenhouse gases, and criteria pollutants (CARB 2010).

109
APPENDIX C: Codes and Standards Relevant for Automotive Battery Systems Source: Electropaedia, “Battery and Energy Technologies: International Standards and Testing Applicable to Batteries,” http://www.mpoweruk.com/standards.htm#automotive
110
APPENDIX D: Review of PEV Market Forecasts Forecasts summarized below:
Study Scale Year 1 Book et al. (Boston Consulting Group) U.S. 2009 2 Electrification Coalition U.S. 2009 3 Lache et al. (Deutsche Bank) U.S./World 2009 4 Becker et al. (UCB Center for Entrepreneurship & Tech.) U.S. 2009 5 TIAX, LLC California 2009 6 McKinsey Global Institute World 2009
7 ICF International, Inc. Bay Area/CA 2011
8 U.S. Department of Energy U.S. 2011 9 KEMA, Inc. U.S. 2010 10 California Energy Commission IEPR California 2009 11 California Air Resources Board ZEV Review California 2009
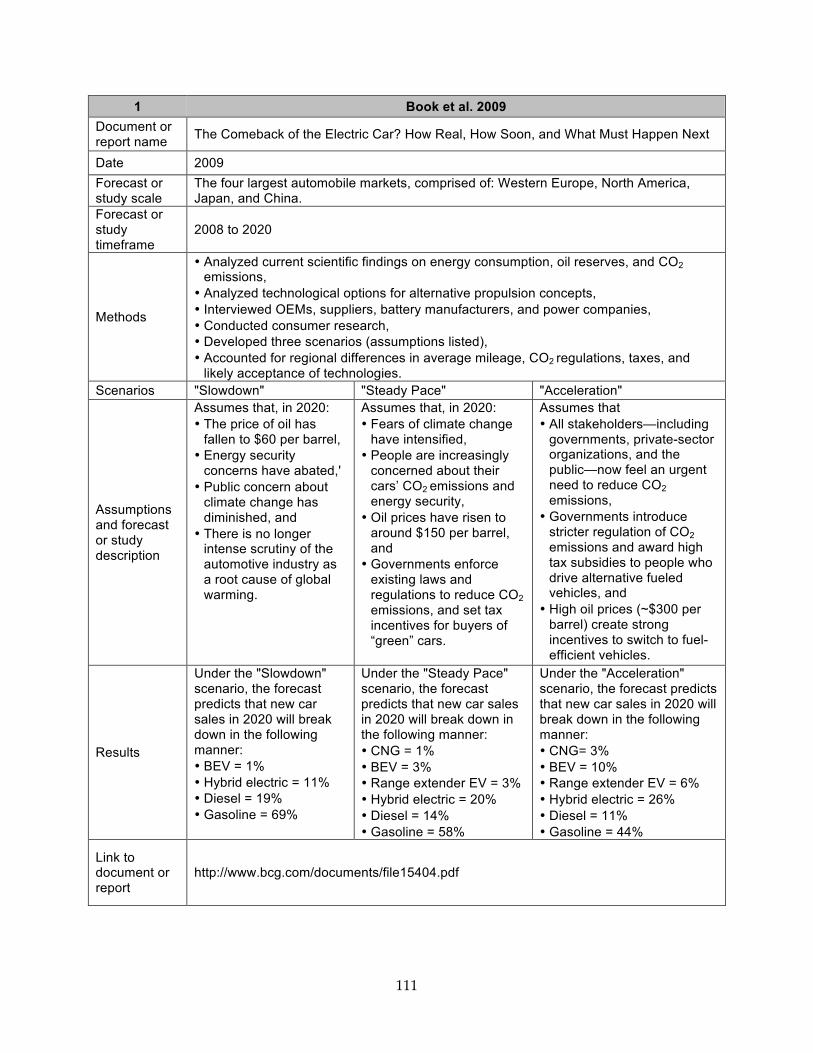
111
1 Book et al. 2009 Document or report name The Comeback of the Electric Car? How Real, How Soon, and What Must Happen Next
Date 2009 Forecast or study scale
The four largest automobile markets, comprised of: Western Europe, North America, Japan, and China.
Forecast or study timeframe
2008 to 2020
Methods
• Analyzed current scientific findings on energy consumption, oil reserves, and CO2 emissions,
• Analyzed technological options for alternative propulsion concepts, • Interviewed OEMs, suppliers, battery manufacturers, and power companies, • Conducted consumer research, • Developed three scenarios (assumptions listed), • Accounted for regional differences in average mileage, CO2 regulations, taxes, and
likely acceptance of technologies. Scenarios "Slowdown" "Steady Pace" "Acceleration"
Assumptions and forecast or study description
Assumes that, in 2020: • The price of oil has
fallen to $60 per barrel, • Energy security
concerns have abated,' • Public concern about
climate change has diminished, and
• There is no longer intense scrutiny of the automotive industry as a root cause of global warming.
Assumes that, in 2020: • Fears of climate change
have intensified, • People are increasingly
concerned about their cars’ CO2 emissions and energy security,
• Oil prices have risen to around $150 per barrel, and
• Governments enforce existing laws and regulations to reduce CO2 emissions, and set tax incentives for buyers of “green” cars.
Assumes that • All stakeholders—including
governments, private-sector organizations, and the public—now feel an urgent need to reduce CO2 emissions,
• Governments introduce stricter regulation of CO2 emissions and award high tax subsidies to people who drive alternative fueled vehicles, and
• High oil prices (~$300 per barrel) create strong incentives to switch to fuel-efficient vehicles.
Results
Under the "Slowdown" scenario, the forecast predicts that new car sales in 2020 will break down in the following manner: • BEV = 1% • Hybrid electric = 11% • Diesel = 19% • Gasoline = 69%
Under the "Steady Pace" scenario, the forecast predicts that new car sales in 2020 will break down in the following manner: • CNG = 1% • BEV = 3% • Range extender EV = 3% • Hybrid electric = 20% • Diesel = 14% • Gasoline = 58%
Under the "Acceleration" scenario, the forecast predicts that new car sales in 2020 will break down in the following manner: • CNG= 3% • BEV = 10% • Range extender EV = 6% • Hybrid electric = 26% • Diesel = 11% • Gasoline = 44%
Link to document or report
http://www.bcg.com/documents/file15404.pdf
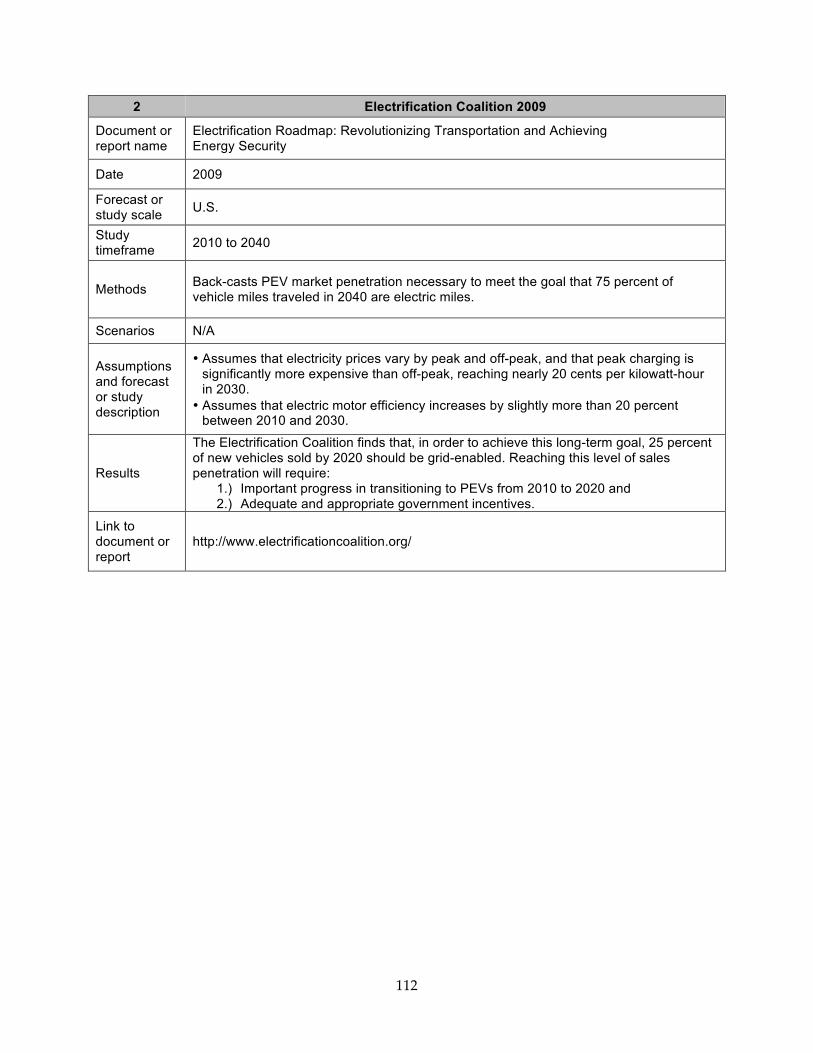
112
2 Electrification Coalition 2009
Document or report name
Electrification Roadmap: Revolutionizing Transportation and Achieving Energy Security
Date 2009
Forecast or study scale U.S.
Study timeframe 2010 to 2040
Methods Back-casts PEV market penetration necessary to meet the goal that 75 percent of vehicle miles traveled in 2040 are electric miles.
Scenarios N/A
Assumptions and forecast or study description
• Assumes that electricity prices vary by peak and off-peak, and that peak charging is significantly more expensive than off-peak, reaching nearly 20 cents per kilowatt-hour in 2030.
• Assumes that electric motor efficiency increases by slightly more than 20 percent between 2010 and 2030.
Results
The Electrification Coalition finds that, in order to achieve this long-term goal, 25 percent of new vehicles sold by 2020 should be grid-enabled. Reaching this level of sales penetration will require:
1.) Important progress in transitioning to PEVs from 2010 to 2020 and 2.) Adequate and appropriate government incentives.
Link to document or report
http://www.electrificationcoalition.org/
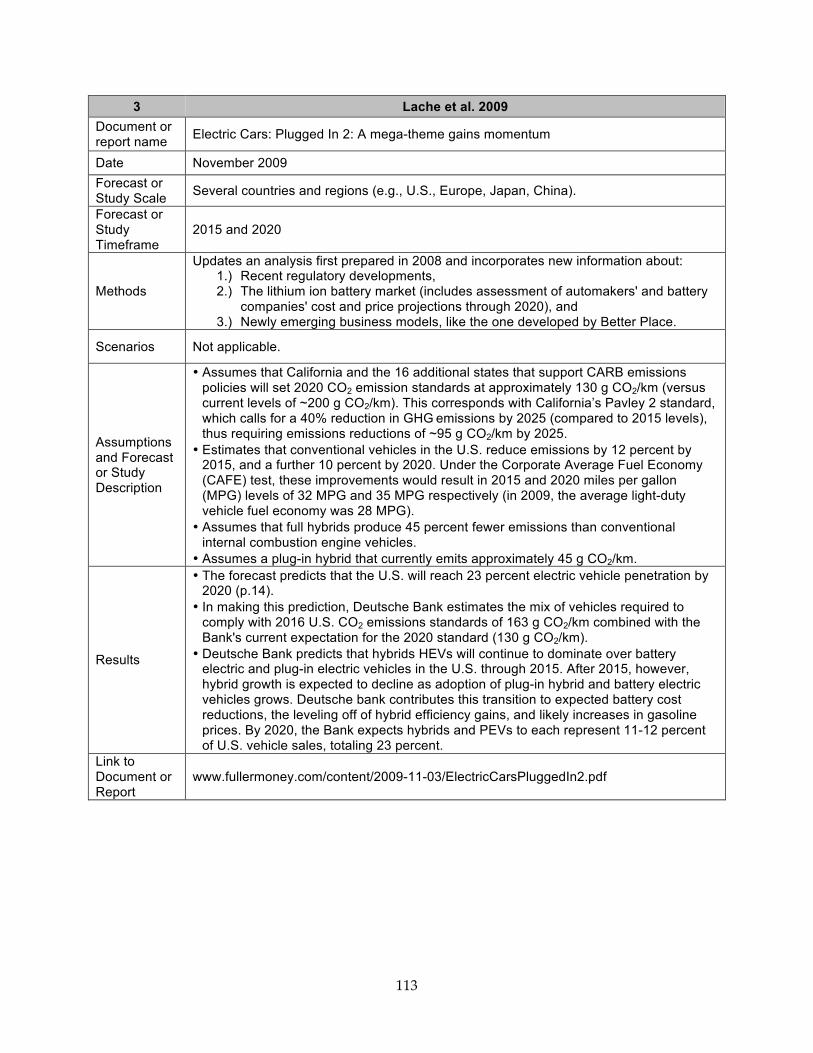
113
3 Lache et al. 2009 Document or report name Electric Cars: Plugged In 2: A mega-theme gains momentum
Date November 2009 Forecast or Study Scale Several countries and regions (e.g., U.S., Europe, Japan, China).
Forecast or Study Timeframe
2015 and 2020
Methods
Updates an analysis first prepared in 2008 and incorporates new information about: 1.) Recent regulatory developments, 2.) The lithium ion battery market (includes assessment of automakers' and battery
companies' cost and price projections through 2020), and 3.) Newly emerging business models, like the one developed by Better Place.
Scenarios Not applicable.
Assumptions and Forecast or Study Description
• Assumes that California and the 16 additional states that support CARB emissions policies will set 2020 CO2 emission standards at approximately 130 g CO2/km (versus current levels of ~200 g CO2/km). This corresponds with California’s Pavley 2 standard, which calls for a 40% reduction in GHG emissions by 2025 (compared to 2015 levels), thus requiring emissions reductions of ~95 g CO2/km by 2025.
• Estimates that conventional vehicles in the U.S. reduce emissions by 12 percent by 2015, and a further 10 percent by 2020. Under the Corporate Average Fuel Economy (CAFE) test, these improvements would result in 2015 and 2020 miles per gallon (MPG) levels of 32 MPG and 35 MPG respectively (in 2009, the average light-duty vehicle fuel economy was 28 MPG).
• Assumes that full hybrids produce 45 percent fewer emissions than conventional internal combustion engine vehicles.
• Assumes a plug-in hybrid that currently emits approximately 45 g CO2/km.
Results
• The forecast predicts that the U.S. will reach 23 percent electric vehicle penetration by 2020 (p.14).
• In making this prediction, Deutsche Bank estimates the mix of vehicles required to comply with 2016 U.S. CO2 emissions standards of 163 g CO2/km combined with the Bank's current expectation for the 2020 standard (130 g CO2/km).
• Deutsche Bank predicts that hybrids HEVs will continue to dominate over battery electric and plug-in electric vehicles in the U.S. through 2015. After 2015, however, hybrid growth is expected to decline as adoption of plug-in hybrid and battery electric vehicles grows. Deutsche bank contributes this transition to expected battery cost reductions, the leveling off of hybrid efficiency gains, and likely increases in gasoline prices. By 2020, the Bank expects hybrids and PEVs to each represent 11-12 percent of U.S. vehicle sales, totaling 23 percent.
Link to Document or Report
www.fullermoney.com/content/2009-11-03/ElectricCarsPluggedIn2.pdf
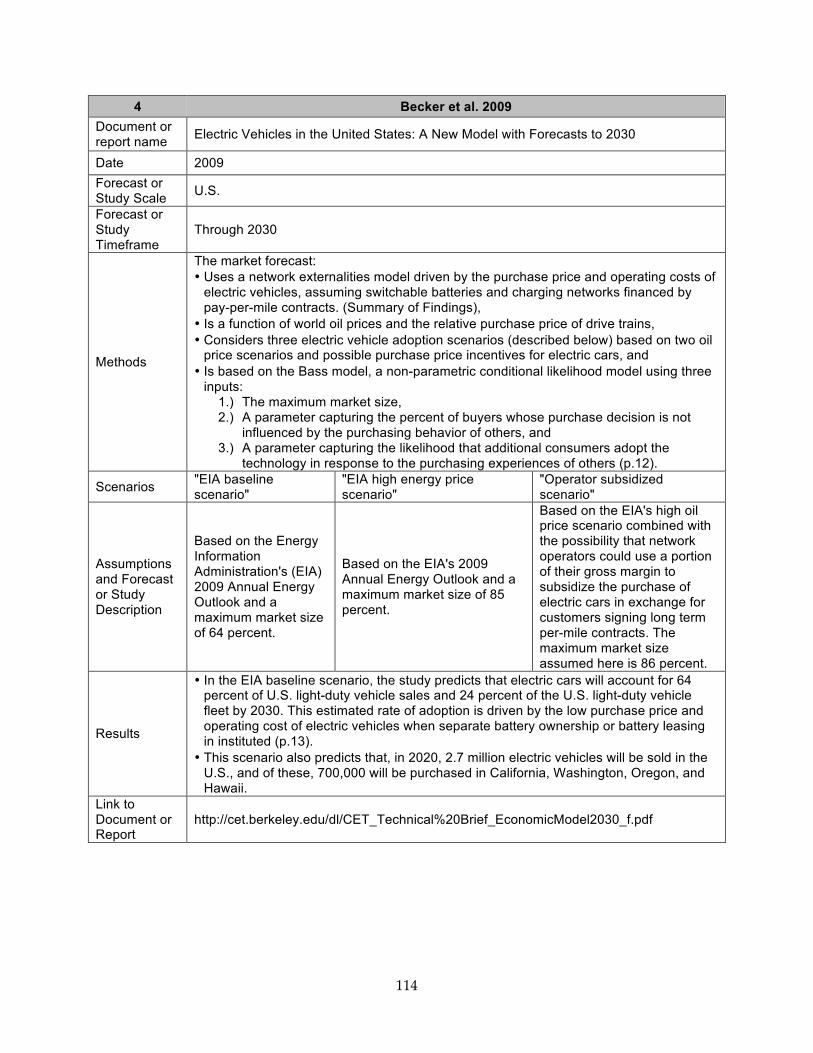
114
4 Becker et al. 2009 Document or report name Electric Vehicles in the United States: A New Model with Forecasts to 2030
Date 2009 Forecast or Study Scale U.S.
Forecast or Study Timeframe
Through 2030
Methods
The market forecast: • Uses a network externalities model driven by the purchase price and operating costs of
electric vehicles, assuming switchable batteries and charging networks financed by pay-per-mile contracts. (Summary of Findings),
• Is a function of world oil prices and the relative purchase price of drive trains, • Considers three electric vehicle adoption scenarios (described below) based on two oil
price scenarios and possible purchase price incentives for electric cars, and • Is based on the Bass model, a non-parametric conditional likelihood model using three
inputs: 1.) The maximum market size, 2.) A parameter capturing the percent of buyers whose purchase decision is not
influenced by the purchasing behavior of others, and 3.) A parameter capturing the likelihood that additional consumers adopt the
technology in response to the purchasing experiences of others (p.12).
Scenarios "EIA baseline scenario"
"EIA high energy price scenario"
"Operator subsidized scenario"
Assumptions and Forecast or Study Description
Based on the Energy Information Administration's (EIA) 2009 Annual Energy Outlook and a maximum market size of 64 percent.
Based on the EIA's 2009 Annual Energy Outlook and a maximum market size of 85 percent.
Based on the EIA's high oil price scenario combined with the possibility that network operators could use a portion of their gross margin to subsidize the purchase of electric cars in exchange for customers signing long term per-mile contracts. The maximum market size assumed here is 86 percent.
Results
• In the EIA baseline scenario, the study predicts that electric cars will account for 64 percent of U.S. light-duty vehicle sales and 24 percent of the U.S. light-duty vehicle fleet by 2030. This estimated rate of adoption is driven by the low purchase price and operating cost of electric vehicles when separate battery ownership or battery leasing in instituted (p.13).
• This scenario also predicts that, in 2020, 2.7 million electric vehicles will be sold in the U.S., and of these, 700,000 will be purchased in California, Washington, Oregon, and Hawaii.
Link to Document or Report
http://cet.berkeley.edu/dl/CET_Technical%20Brief_EconomicModel2030_f.pdf
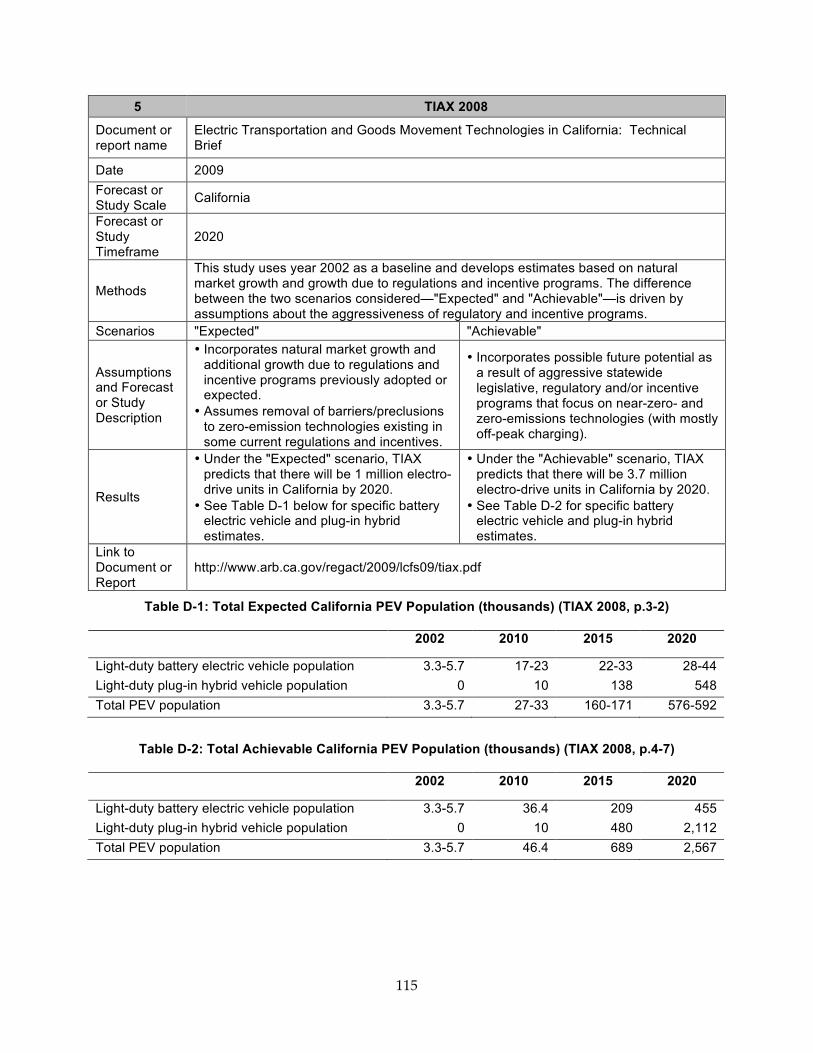
115
5 TIAX 2008
Document or report name
Electric Transportation and Goods Movement Technologies in California: Technical Brief
Date 2009 Forecast or Study Scale California
Forecast or Study Timeframe
2020
Methods
This study uses year 2002 as a baseline and develops estimates based on natural market growth and growth due to regulations and incentive programs. The difference between the two scenarios considered—"Expected" and "Achievable"—is driven by assumptions about the aggressiveness of regulatory and incentive programs.
Scenarios "Expected" "Achievable"
Assumptions and Forecast or Study Description
• Incorporates natural market growth and additional growth due to regulations and incentive programs previously adopted or expected.
• Assumes removal of barriers/preclusions to zero-emission technologies existing in some current regulations and incentives.
• Incorporates possible future potential as a result of aggressive statewide legislative, regulatory and/or incentive programs that focus on near-zero- and zero-emissions technologies (with mostly off-peak charging).
Results
• Under the "Expected" scenario, TIAX predicts that there will be 1 million electro-drive units in California by 2020.
• See Table D-1 below for specific battery electric vehicle and plug-in hybrid estimates.
• Under the "Achievable" scenario, TIAX predicts that there will be 3.7 million electro-drive units in California by 2020.
• See Table D-2 for specific battery electric vehicle and plug-in hybrid estimates.
Link to Document or Report
http://www.arb.ca.gov/regact/2009/lcfs09/tiax.pdf
Table D-1: Total Expected California PEV Population (thousands) (TIAX 2008, p.3-2)
2002 2010 2015 2020
Light-duty battery electric vehicle population 3.3-5.7 17-23 22-33 28-44 Light-duty plug-in hybrid vehicle population 0 10 138 548 Total PEV population 3.3-5.7 27-33 160-171 576-592
Table D-2: Total Achievable California PEV Population (thousands) (TIAX 2008, p.4-7)
2002 2010 2015 2020
Light-duty battery electric vehicle population 3.3-5.7 36.4 209 455 Light-duty plug-in hybrid vehicle population 0 10 480 2,112 Total PEV population 3.3-5.7 46.4 689 2,567
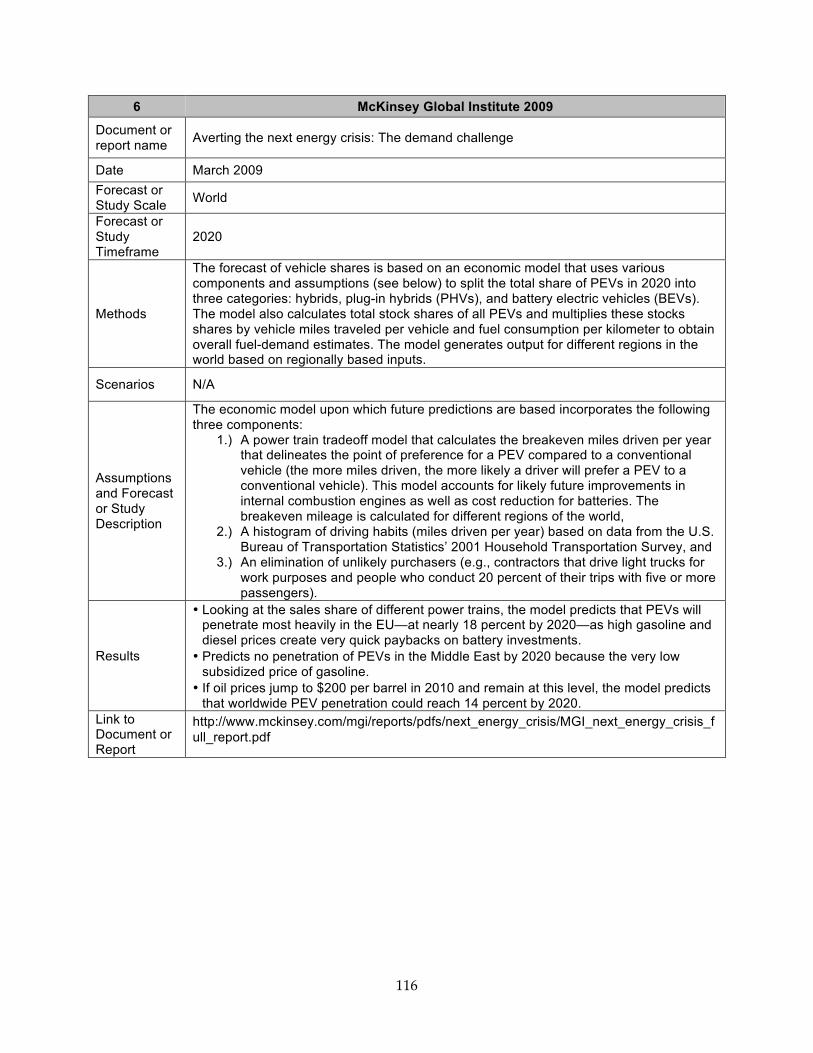
116
6 McKinsey Global Institute 2009
Document or report name Averting the next energy crisis: The demand challenge
Date March 2009 Forecast or Study Scale World
Forecast or Study Timeframe
2020
Methods
The forecast of vehicle shares is based on an economic model that uses various components and assumptions (see below) to split the total share of PEVs in 2020 into three categories: hybrids, plug-in hybrids (PHVs), and battery electric vehicles (BEVs). The model also calculates total stock shares of all PEVs and multiplies these stocks shares by vehicle miles traveled per vehicle and fuel consumption per kilometer to obtain overall fuel-demand estimates. The model generates output for different regions in the world based on regionally based inputs.
Scenarios N/A
Assumptions and Forecast or Study Description
The economic model upon which future predictions are based incorporates the following three components:
1.) A power train tradeoff model that calculates the breakeven miles driven per year that delineates the point of preference for a PEV compared to a conventional vehicle (the more miles driven, the more likely a driver will prefer a PEV to a conventional vehicle). This model accounts for likely future improvements in internal combustion engines as well as cost reduction for batteries. The breakeven mileage is calculated for different regions of the world,
2.) A histogram of driving habits (miles driven per year) based on data from the U.S. Bureau of Transportation Statistics’ 2001 Household Transportation Survey, and
3.) An elimination of unlikely purchasers (e.g., contractors that drive light trucks for work purposes and people who conduct 20 percent of their trips with five or more passengers).
Results
• Looking at the sales share of different power trains, the model predicts that PEVs will penetrate most heavily in the EU—at nearly 18 percent by 2020—as high gasoline and diesel prices create very quick paybacks on battery investments.
• Predicts no penetration of PEVs in the Middle East by 2020 because the very low subsidized price of gasoline.
• If oil prices jump to $200 per barrel in 2010 and remain at this level, the model predicts that worldwide PEV penetration could reach 14 percent by 2020.
Link to Document or Report
http://www.mckinsey.com/mgi/reports/pdfs/next_energy_crisis/MGI_next_energy_crisis_full_report.pdf
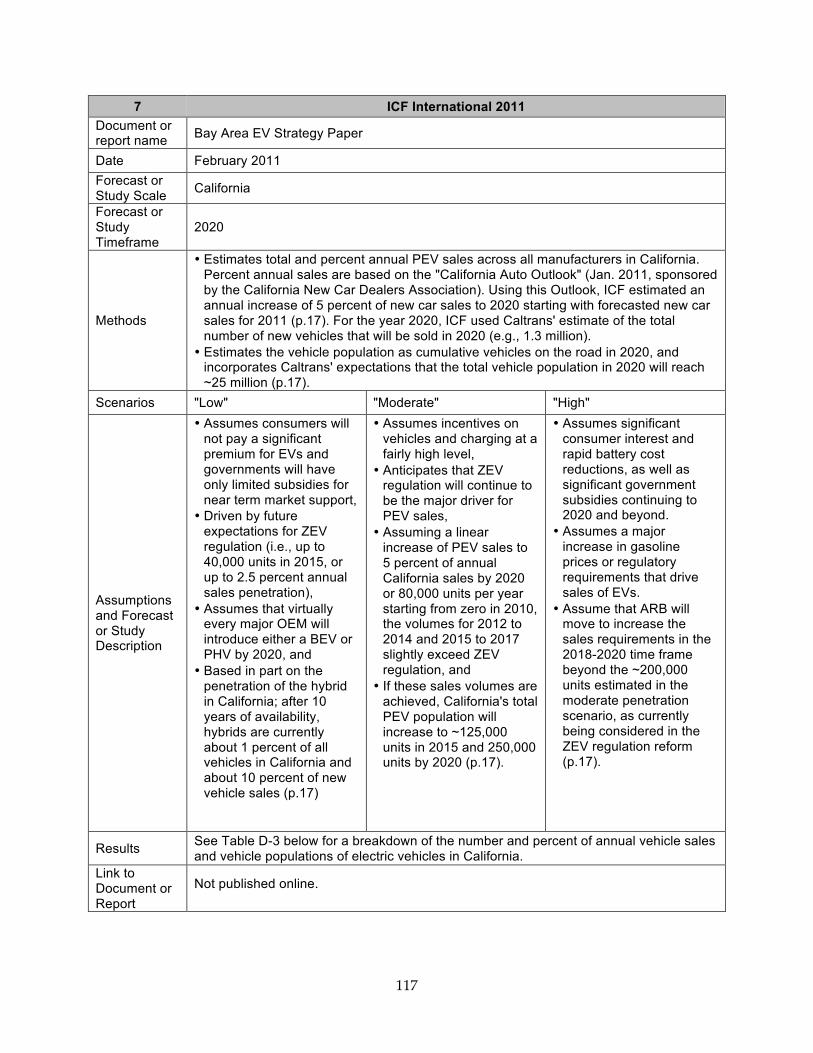
117
7 ICF International 2011 Document or report name Bay Area EV Strategy Paper
Date February 2011 Forecast or Study Scale California
Forecast or Study Timeframe
2020
Methods
• Estimates total and percent annual PEV sales across all manufacturers in California. Percent annual sales are based on the "California Auto Outlook" (Jan. 2011, sponsored by the California New Car Dealers Association). Using this Outlook, ICF estimated an annual increase of 5 percent of new car sales to 2020 starting with forecasted new car sales for 2011 (p.17). For the year 2020, ICF used Caltrans' estimate of the total number of new vehicles that will be sold in 2020 (e.g., 1.3 million).
• Estimates the vehicle population as cumulative vehicles on the road in 2020, and incorporates Caltrans' expectations that the total vehicle population in 2020 will reach ~25 million (p.17).
Scenarios "Low" "Moderate" "High"
Assumptions and Forecast or Study Description
• Assumes consumers will not pay a significant premium for EVs and governments will have only limited subsidies for near term market support,
• Driven by future expectations for ZEV regulation (i.e., up to 40,000 units in 2015, or up to 2.5 percent annual sales penetration),
• Assumes that virtually every major OEM will introduce either a BEV or PHV by 2020, and
• Based in part on the penetration of the hybrid in California; after 10 years of availability, hybrids are currently about 1 percent of all vehicles in California and about 10 percent of new vehicle sales (p.17)
• Assumes incentives on vehicles and charging at a fairly high level,
• Anticipates that ZEV regulation will continue to be the major driver for PEV sales,
• Assuming a linear increase of PEV sales to 5 percent of annual California sales by 2020 or 80,000 units per year starting from zero in 2010, the volumes for 2012 to 2014 and 2015 to 2017 slightly exceed ZEV regulation, and
• If these sales volumes are achieved, California's total PEV population will increase to ~125,000 units in 2015 and 250,000 units by 2020 (p.17).
• Assumes significant consumer interest and rapid battery cost reductions, as well as significant government subsidies continuing to 2020 and beyond.
• Assumes a major increase in gasoline prices or regulatory requirements that drive sales of EVs.
• Assume that ARB will move to increase the sales requirements in the 2018-2020 time frame beyond the ~200,000 units estimated in the moderate penetration scenario, as currently being considered in the ZEV regulation reform (p.17).
Results See Table D-3 below for a breakdown of the number and percent of annual vehicle sales and vehicle populations of electric vehicles in California.
Link to Document or Report
Not published online.
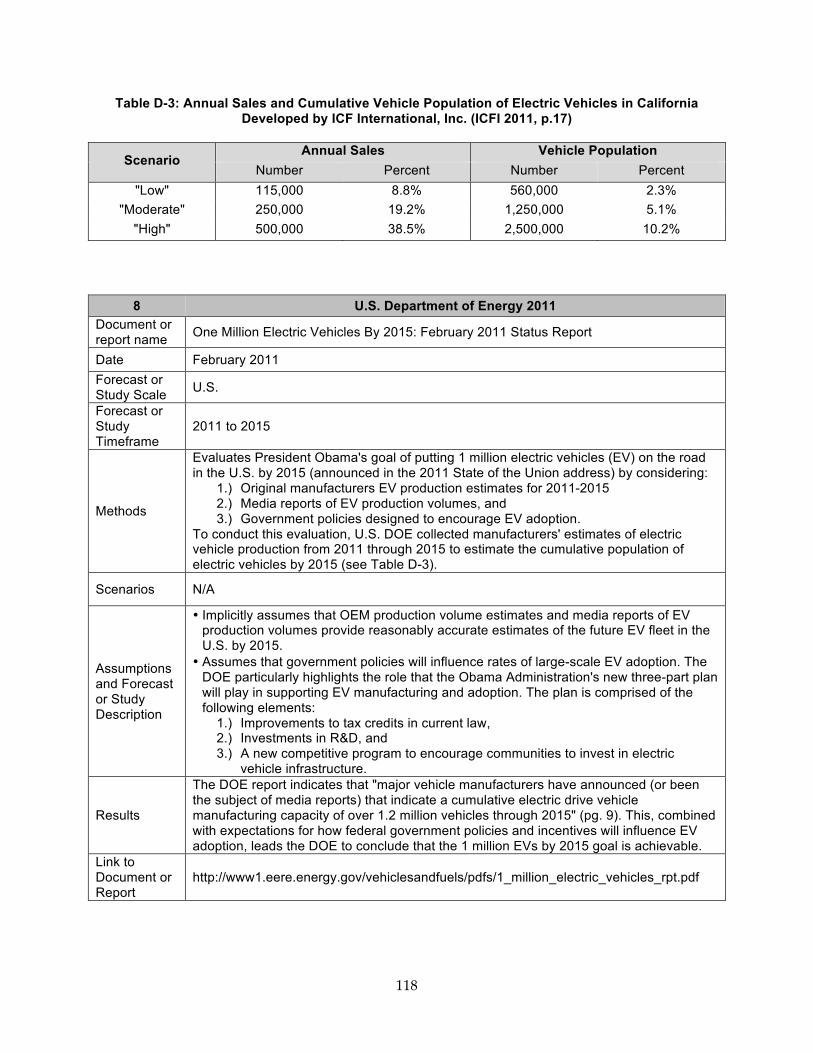
118
Table D-3: Annual Sales and Cumulative Vehicle Population of Electric Vehicles in California Developed by ICF International, Inc. (ICFI 2011, p.17)
Scenario Annual Sales Vehicle Population
Number Percent Number Percent "Low" 115,000 8.8% 560,000 2.3%
"Moderate" 250,000 19.2% 1,250,000 5.1% "High" 500,000 38.5% 2,500,000 10.2%
8 U.S. Department of Energy 2011 Document or report name One Million Electric Vehicles By 2015: February 2011 Status Report
Date February 2011 Forecast or Study Scale U.S.
Forecast or Study Timeframe
2011 to 2015
Methods
Evaluates President Obama's goal of putting 1 million electric vehicles (EV) on the road in the U.S. by 2015 (announced in the 2011 State of the Union address) by considering:
1.) Original manufacturers EV production estimates for 2011-2015 2.) Media reports of EV production volumes, and 3.) Government policies designed to encourage EV adoption.
To conduct this evaluation, U.S. DOE collected manufacturers' estimates of electric vehicle production from 2011 through 2015 to estimate the cumulative population of electric vehicles by 2015 (see Table D-3).
Scenarios N/A
Assumptions and Forecast or Study Description
• Implicitly assumes that OEM production volume estimates and media reports of EV production volumes provide reasonably accurate estimates of the future EV fleet in the U.S. by 2015.
• Assumes that government policies will influence rates of large-scale EV adoption. The DOE particularly highlights the role that the Obama Administration's new three-part plan will play in supporting EV manufacturing and adoption. The plan is comprised of the following elements:
1.) Improvements to tax credits in current law, 2.) Investments in R&D, and 3.) A new competitive program to encourage communities to invest in electric
vehicle infrastructure.
Results
The DOE report indicates that "major vehicle manufacturers have announced (or been the subject of media reports) that indicate a cumulative electric drive vehicle manufacturing capacity of over 1.2 million vehicles through 2015" (pg. 9). This, combined with expectations for how federal government policies and incentives will influence EV adoption, leads the DOE to conclude that the 1 million EVs by 2015 goal is achievable.
Link to Document or Report
http://www1.eere.energy.gov/vehiclesandfuels/pdfs/1_million_electric_vehicles_rpt.pdf
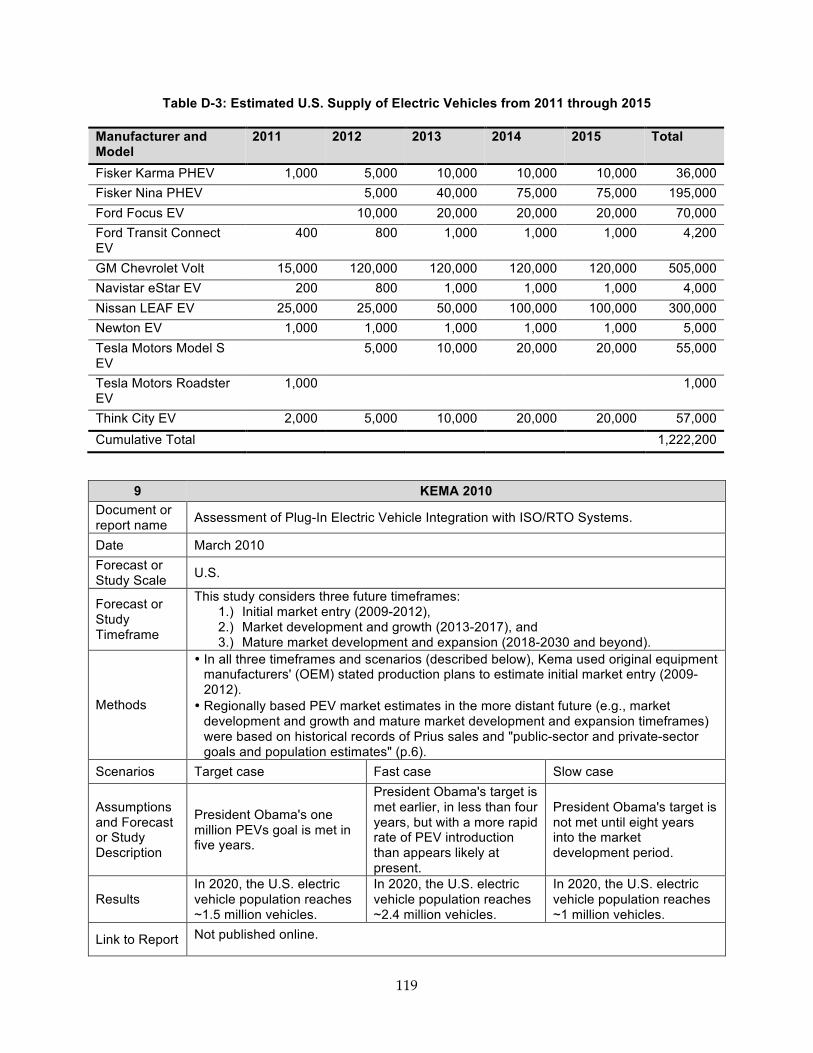
119
Table D-3: Estimated U.S. Supply of Electric Vehicles from 2011 through 2015
Manufacturer and Model
2011 2012 2013 2014 2015 Total
Fisker Karma PHEV 1,000 5,000 10,000 10,000 10,000 36,000 Fisker Nina PHEV 5,000 40,000 75,000 75,000 195,000 Ford Focus EV 10,000 20,000 20,000 20,000 70,000 Ford Transit Connect EV
400 800 1,000 1,000 1,000 4,200
GM Chevrolet Volt 15,000 120,000 120,000 120,000 120,000 505,000 Navistar eStar EV 200 800 1,000 1,000 1,000 4,000 Nissan LEAF EV 25,000 25,000 50,000 100,000 100,000 300,000 Newton EV 1,000 1,000 1,000 1,000 1,000 5,000 Tesla Motors Model S EV
5,000 10,000 20,000 20,000 55,000
Tesla Motors Roadster EV
1,000 1,000
Think City EV 2,000 5,000 10,000 20,000 20,000 57,000 Cumulative Total 1,222,200
9 KEMA 2010 Document or report name Assessment of Plug-In Electric Vehicle Integration with ISO/RTO Systems.
Date March 2010 Forecast or Study Scale U.S.
Forecast or Study Timeframe
This study considers three future timeframes: 1.) Initial market entry (2009-2012), 2.) Market development and growth (2013-2017), and 3.) Mature market development and expansion (2018-2030 and beyond).
Methods
• In all three timeframes and scenarios (described below), Kema used original equipment manufacturers' (OEM) stated production plans to estimate initial market entry (2009-2012).
• Regionally based PEV market estimates in the more distant future (e.g., market development and growth and mature market development and expansion timeframes) were based on historical records of Prius sales and "public-sector and private-sector goals and population estimates" (p.6).
Scenarios Target case Fast case Slow case
Assumptions and Forecast or Study Description
President Obama's one million PEVs goal is met in five years.
President Obama's target is met earlier, in less than four years, but with a more rapid rate of PEV introduction than appears likely at present.
President Obama's target is not met until eight years into the market development period.
Results In 2020, the U.S. electric vehicle population reaches ~1.5 million vehicles.
In 2020, the U.S. electric vehicle population reaches ~2.4 million vehicles.
In 2020, the U.S. electric vehicle population reaches ~1 million vehicles.
Link to Report Not published online.
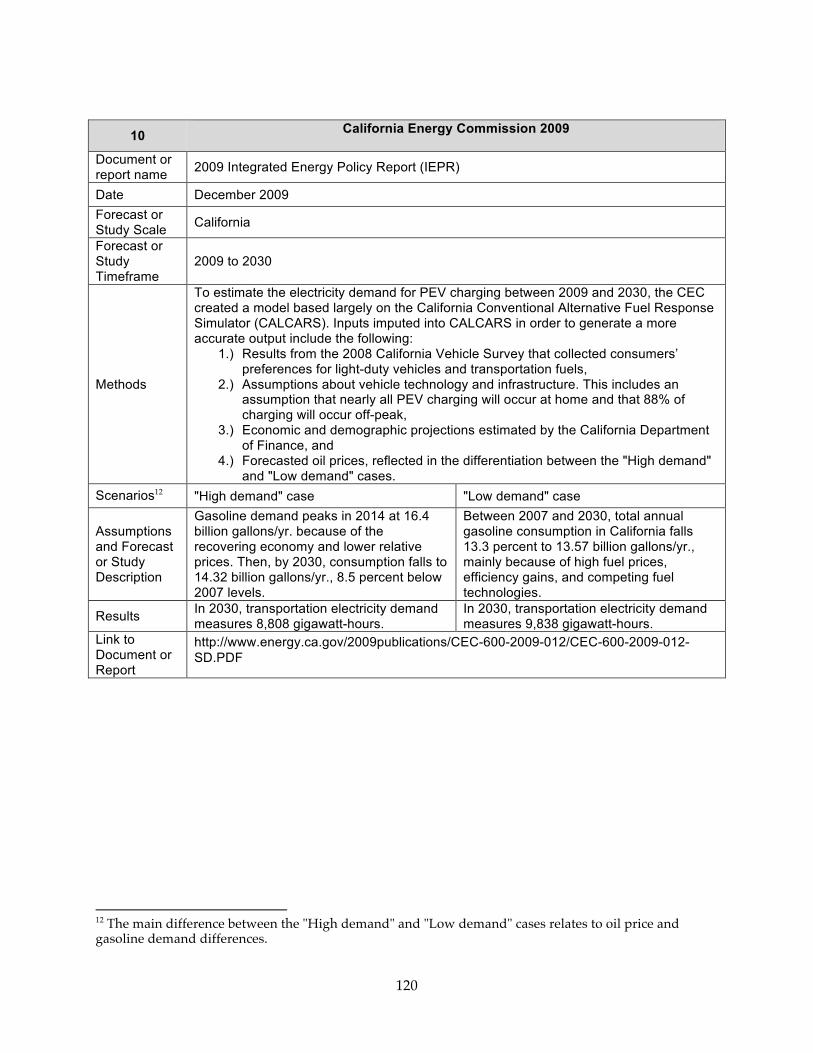
120
10 California Energy Commission 2009
Document or report name 2009 Integrated Energy Policy Report (IEPR)
Date December 2009 Forecast or Study Scale California
Forecast or Study Timeframe
2009 to 2030
Methods
To estimate the electricity demand for PEV charging between 2009 and 2030, the CEC created a model based largely on the California Conventional Alternative Fuel Response Simulator (CALCARS). Inputs imputed into CALCARS in order to generate a more accurate output include the following:
1.) Results from the 2008 California Vehicle Survey that collected consumers’ preferences for light-duty vehicles and transportation fuels,
2.) Assumptions about vehicle technology and infrastructure. This includes an assumption that nearly all PEV charging will occur at home and that 88% of charging will occur off-peak,
3.) Economic and demographic projections estimated by the California Department of Finance, and
4.) Forecasted oil prices, reflected in the differentiation between the "High demand" and "Low demand" cases.
Scenarios12 "High demand" case "Low demand" case
Assumptions and Forecast or Study Description
Gasoline demand peaks in 2014 at 16.4 billion gallons/yr. because of the recovering economy and lower relative prices. Then, by 2030, consumption falls to 14.32 billion gallons/yr., 8.5 percent below 2007 levels.
Between 2007 and 2030, total annual gasoline consumption in California falls 13.3 percent to 13.57 billion gallons/yr., mainly because of high fuel prices, efficiency gains, and competing fuel technologies.
Results In 2030, transportation electricity demand measures 8,808 gigawatt-hours.
In 2030, transportation electricity demand measures 9,838 gigawatt-hours.
Link to Document or Report
http://www.energy.ca.gov/2009publications/CEC-600-2009-012/CEC-600-2009-012-SD.PDF
12 The main difference between the "High demand" and "Low demand" cases relates to oil price and gasoline demand differences.
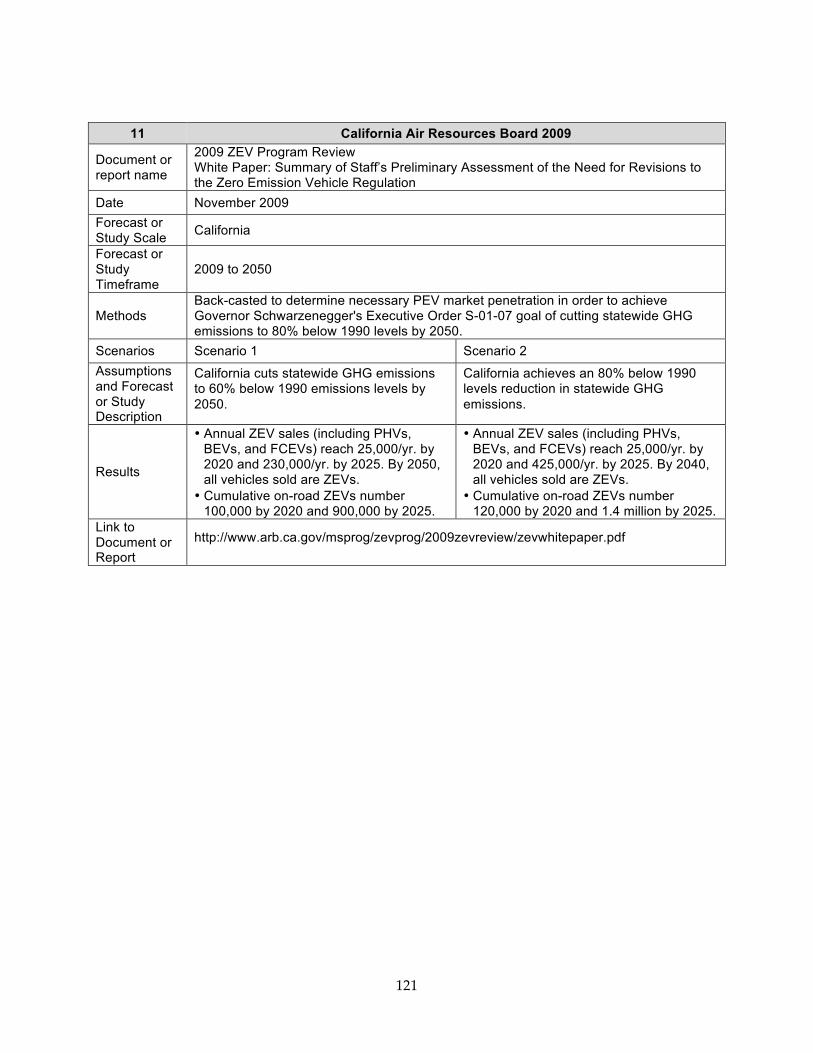
121
11 California Air Resources Board 2009
Document or report name
2009 ZEV Program Review White Paper: Summary of Staff’s Preliminary Assessment of the Need for Revisions to the Zero Emission Vehicle Regulation
Date November 2009 Forecast or Study Scale California
Forecast or Study Timeframe
2009 to 2050
Methods Back-casted to determine necessary PEV market penetration in order to achieve Governor Schwarzenegger's Executive Order S-01-07 goal of cutting statewide GHG emissions to 80% below 1990 levels by 2050.
Scenarios Scenario 1 Scenario 2 Assumptions and Forecast or Study Description
California cuts statewide GHG emissions to 60% below 1990 emissions levels by 2050.
California achieves an 80% below 1990 levels reduction in statewide GHG emissions.
Results
• Annual ZEV sales (including PHVs, BEVs, and FCEVs) reach 25,000/yr. by 2020 and 230,000/yr. by 2025. By 2050, all vehicles sold are ZEVs.
• Cumulative on-road ZEVs number 100,000 by 2020 and 900,000 by 2025.
• Annual ZEV sales (including PHVs, BEVs, and FCEVs) reach 25,000/yr. by 2020 and 425,000/yr. by 2025. By 2040, all vehicles sold are ZEVs.
• Cumulative on-road ZEVs number 120,000 by 2020 and 1.4 million by 2025.
Link to Document or Report
http://www.arb.ca.gov/msprog/zevprog/2009zevreview/zevwhitepaper.pdf
122
APPENDIX E: Select Related Activities Prepared by Daniel Cowart
Project Get Ready Project Get Ready (PGR) is a non-profit initiative led by the Rocky Mountain Institute (RMI). The project focuses on facilitating the planning and implementation of PEV charging infrastructure in U.S. cities. PGR collects and disseminates lessons learned and experience gained from aiding early-adopter cities.
Evaluation of U.S. EV readiness In October 2010, PGR and Roland Berger Strategy Consultants released a report evaluating the EV readiness of America’s 50 largest metro areas. Cities' "readiness" was based on several criteria, including (but not limited to) the following:
1. existence and/or planning for PEV charging infrastructure, 2. smart grid (advanced metering infrastructure) penetration, 3. carbon intensity of the local electricity supply, 4. regulatory environment related to PEVs, 5. availability of purchasing and operating incentives for PEVs, 6. consumer readiness (education, advertisement, and public opinion), and 7. the operating environment, e.g., energy prices, average commuter mileage, and regional
gas prices.
The report listed several California cities as “leaders” in PEV readiness, including San Francisco, Los Angeles, Sacramento, Riverside, San Diego, and San Jose. Leaders, as defined in the report, are the most likely to participate in the first wave of "e-mobility."
PGR's past successes In November 2010, PGR aided the development of Virginia’s Initial EV Plan. This plan includes strategies for changing policies, creating connections with appropriate partners, presenting incentives to attract potential PEV consumers, and outlining PEV charger installation plans and subsequent grid upgrades across the state. Virginia is already benefitting from the EV Plan. Several battery, electric-motor, and charging-station manufacturers are located in Virginia, and the resulting work designing, deploying, and converting vehicles has boosted state’s economy. Virginia is also the location of several early adopters of PEVs and central Virginia is currently involved in a large-scale smart grid demonstration.
PGR also aided in the creation of the Orlando Utility Commission (OUC) EV Strategy in February 2011. As a utility, the strategy is slightly different and focuses more on quantitative aspects of PEV adoption, such as the grid impact that PEV charging and the quantification of the profit that can be derived from PEV penetration. The OUC is considering the demographics of early adopters as they make short-, mid-, and long-term plans for PEV penetration. Currently, Orlando is a "leader" by PGR standards. Its plan anticipates that there will be 16,000 PEVs on Florida roads by 2020, which equates to 5 percent of the state's fleet. To achieve this, OUC, like Virginia, is partnering with vehicle manufacturers.
The EV Project The EV Project, managed by ECOtality, is funded by the U.S. Department of Energy. Its goal is to deploy and subsidize residential, commercial, and direct current (DC) fast chargers for PEVs. In return for free or deeply discounted chargers, ECOtality will:

123
• collect charging behavior data, • evaluate the effectiveness of various charging infrastructure designs, and • experiment with different revenue systems for public charging stations.
Using this data, the EV Project will then compile lessons learned from the first deployment of Chevy Volts and Nissan Leafs that can then be considered as PEV penetration expands. In all, 14,000 chargers will be deployed in 18 major cities in California, Oregon, Washington, Arizona, Texas, Tennessee and Washington D.C. The EV Project chargers are expected to support the deployment of 8,300 PEVs.
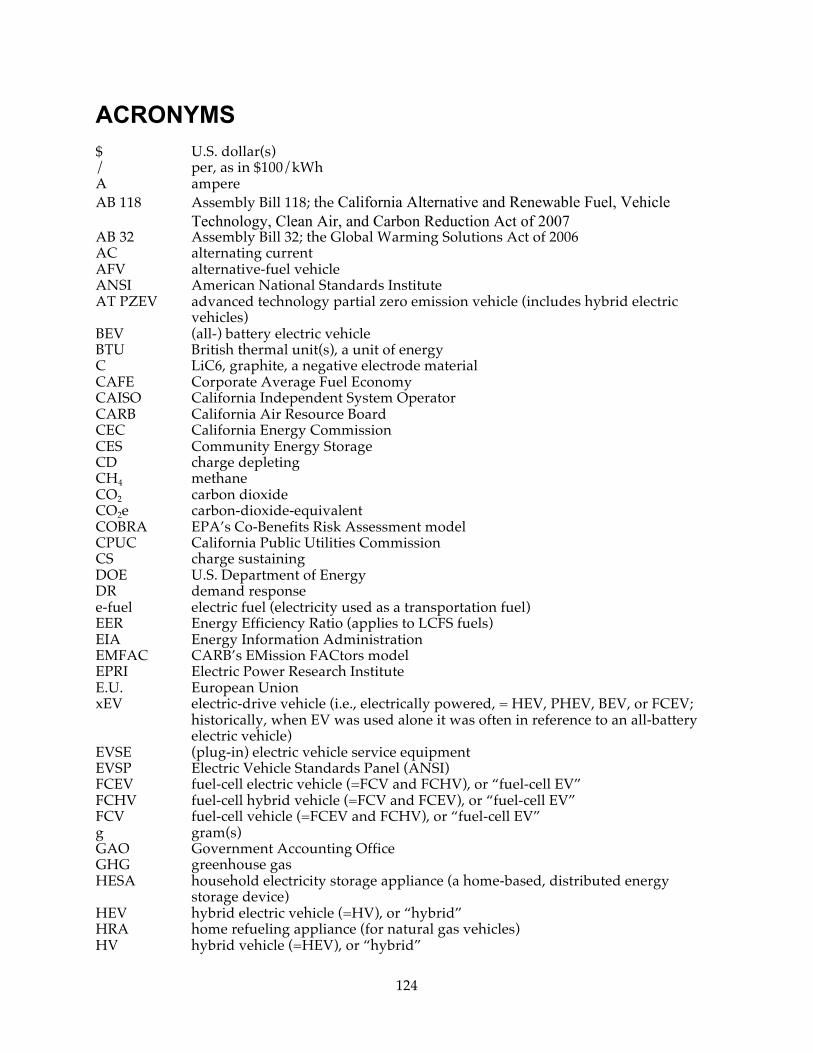
124
ACRONYMS $ U.S. dollar(s) / per, as in $100/kWh A ampere AB 118 Assembly Bill 118; the California Alternative and Renewable Fuel, Vehicle
Technology, Clean Air, and Carbon Reduction Act of 2007 AB 32 Assembly Bill 32; the Global Warming Solutions Act of 2006 AC alternating current AFV alternative-fuel vehicle ANSI American National Standards Institute AT PZEV advanced technology partial zero emission vehicle (includes hybrid electric
vehicles) BEV (all-) battery electric vehicle BTU British thermal unit(s), a unit of energy C LiC6, graphite, a negative electrode material CAFE Corporate Average Fuel Economy CAISO California Independent System Operator CARB California Air Resource Board CEC California Energy Commission CES Community Energy Storage CD charge depleting CH4 methane CO2 carbon dioxide CO2e carbon-dioxide-equivalent COBRA EPA’s Co-Benefits Risk Assessment model CPUC California Public Utilities Commission CS charge sustaining DOE U.S. Department of Energy DR demand response e-fuel electric fuel (electricity used as a transportation fuel) EER Energy Efficiency Ratio (applies to LCFS fuels) EIA Energy Information Administration EMFAC CARB’s EMission FACtors model EPRI Electric Power Research Institute E.U. European Union xEV electric-drive vehicle (i.e., electrically powered, = HEV, PHEV, BEV, or FCEV;
historically, when EV was used alone it was often in reference to an all-battery electric vehicle)
EVSE (plug-in) electric vehicle service equipment EVSP Electric Vehicle Standards Panel (ANSI) FCEV fuel-cell electric vehicle (=FCV and FCHV), or “fuel-cell EV” FCHV fuel-cell hybrid vehicle (=FCV and FCEV), or “fuel-cell EV” FCV fuel-cell vehicle (=FCEV and FCHV), or “fuel-cell EV” g gram(s) GAO Government Accounting Office GHG greenhouse gas HESA household electricity storage appliance (a home-based, distributed energy
storage device) HEV hybrid electric vehicle (=HV), or “hybrid” HRA home refueling appliance (for natural gas vehicles) HV hybrid vehicle (=HEV), or “hybrid”
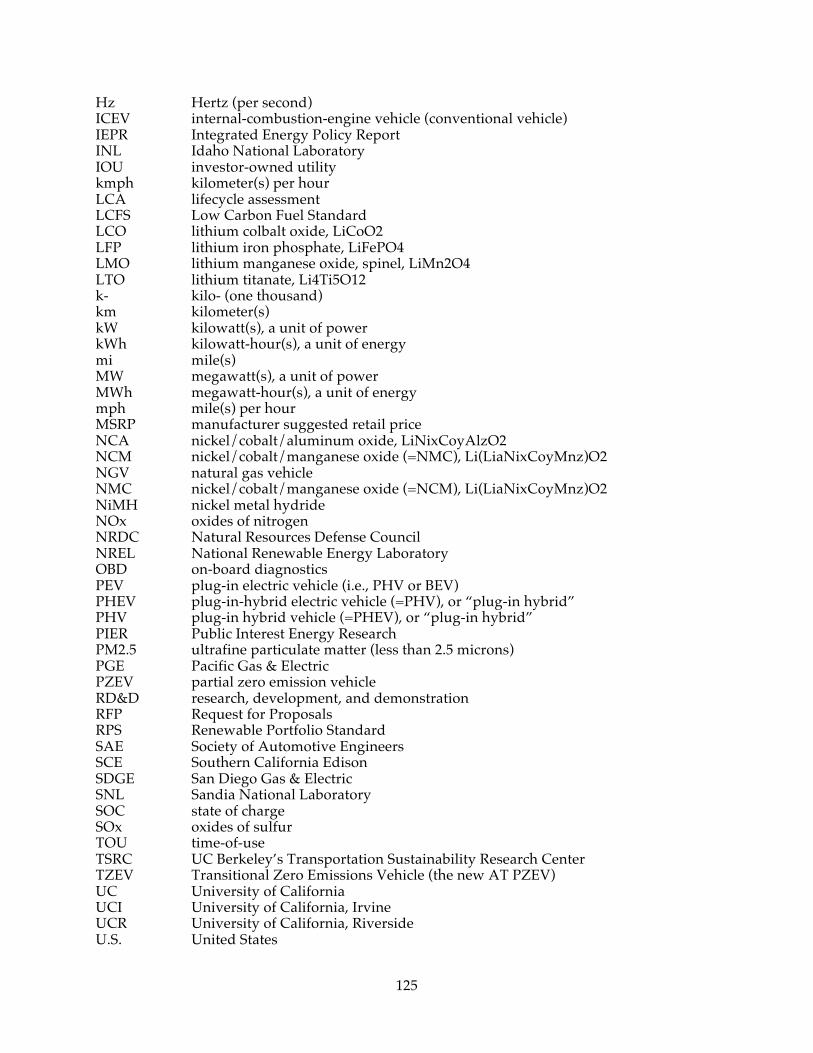
125
Hz Hertz (per second) ICEV internal-combustion-engine vehicle (conventional vehicle) IEPR Integrated Energy Policy Report INL Idaho National Laboratory IOU investor-owned utility kmph kilometer(s) per hour LCA lifecycle assessment LCFS Low Carbon Fuel Standard LCO lithium colbalt oxide, LiCoO2 LFP lithium iron phosphate, LiFePO4 LMO lithium manganese oxide, spinel, LiMn2O4 LTO lithium titanate, Li4Ti5O12 k- kilo- (one thousand) km kilometer(s) kW kilowatt(s), a unit of power kWh kilowatt-hour(s), a unit of energy mi mile(s) MW megawatt(s), a unit of power MWh megawatt-hour(s), a unit of energy mph mile(s) per hour MSRP manufacturer suggested retail price NCA nickel/cobalt/aluminum oxide, LiNixCoyAlzO2 NCM nickel/cobalt/manganese oxide (=NMC), Li(LiaNixCoyMnz)O2 NGV natural gas vehicle NMC nickel/cobalt/manganese oxide (=NCM), Li(LiaNixCoyMnz)O2 NiMH nickel metal hydride NOx oxides of nitrogen NRDC Natural Resources Defense Council NREL National Renewable Energy Laboratory OBD on-board diagnostics PEV plug-in electric vehicle (i.e., PHV or BEV) PHEV plug-in-hybrid electric vehicle (=PHV), or “plug-in hybrid” PHV plug-in hybrid vehicle (=PHEV), or “plug-in hybrid” PIER Public Interest Energy Research PM2.5 ultrafine particulate matter (less than 2.5 microns) PGE Pacific Gas & Electric PZEV partial zero emission vehicle RD&D research, development, and demonstration RFP Request for Proposals RPS Renewable Portfolio Standard SAE Society of Automotive Engineers SCE Southern California Edison SDGE San Diego Gas & Electric SNL Sandia National Laboratory SOC state of charge SOx oxides of sulfur TOU time-of-use TSRC UC Berkeley’s Transportation Sustainability Research Center TZEV Transitional Zero Emissions Vehicle (the new AT PZEV) UC University of California UCI University of California, Irvine UCR University of California, Riverside U.S. United States

126
V volt(s) VMT vehicle miles traveled VOCs volatile organic compounds WECC Western Electricity Coordinating Council xEV electric-drive vehicle (i.e., electrically powered, = HEV, PHV, BEV, or FCEV;
when EV is used alone it historically was in reference to an all-battery electric vehicle)
y year(s) ZEV zero emission vehicle
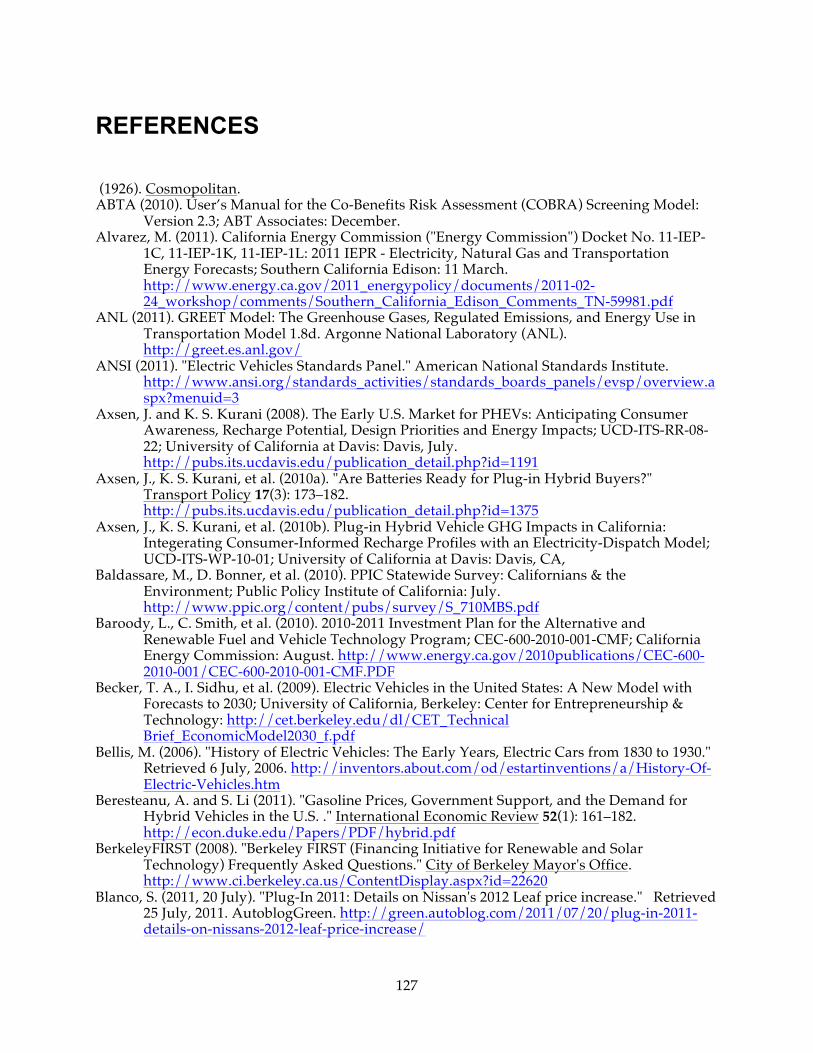
127
REFERENCES
(1926). Cosmopolitan. ABTA (2010). User’s Manual for the Co-Benefits Risk Assessment (COBRA) Screening Model:
Version 2.3; ABT Associates: December. Alvarez, M. (2011). California Energy Commission ("Energy Commission") Docket No. 11-IEP-
1C, 11-IEP-1K, 11-IEP-1L: 2011 IEPR - Electricity, Natural Gas and Transportation Energy Forecasts; Southern California Edison: 11 March. http://www.energy.ca.gov/2011_energypolicy/documents/2011-02-24_workshop/comments/Southern_California_Edison_Comments_TN-59981.pdf
ANL (2011). GREET Model: The Greenhouse Gases, Regulated Emissions, and Energy Use in Transportation Model 1.8d. Argonne National Laboratory (ANL). http://greet.es.anl.gov/
ANSI (2011). "Electric Vehicles Standards Panel." American National Standards Institute. http://www.ansi.org/standards_activities/standards_boards_panels/evsp/overview.aspx?menuid=3
Axsen, J. and K. S. Kurani (2008). The Early U.S. Market for PHEVs: Anticipating Consumer Awareness, Recharge Potential, Design Priorities and Energy Impacts; UCD-ITS-RR-08-22; University of California at Davis: Davis, July. http://pubs.its.ucdavis.edu/publication_detail.php?id=1191
Axsen, J., K. S. Kurani, et al. (2010a). "Are Batteries Ready for Plug-in Hybrid Buyers?" Transport Policy 17(3): 173–182. http://pubs.its.ucdavis.edu/publication_detail.php?id=1375
Axsen, J., K. S. Kurani, et al. (2010b). Plug-in Hybrid Vehicle GHG Impacts in California: Integerating Consumer-Informed Recharge Profiles with an Electricity-Dispatch Model; UCD-ITS-WP-10-01; University of California at Davis: Davis, CA,
Baldassare, M., D. Bonner, et al. (2010). PPIC Statewide Survey: Californians & the Environment; Public Policy Institute of California: July. http://www.ppic.org/content/pubs/survey/S_710MBS.pdf
Baroody, L., C. Smith, et al. (2010). 2010-2011 Investment Plan for the Alternative and Renewable Fuel and Vehicle Technology Program; CEC-600-2010-001-CMF; California Energy Commission: August. http://www.energy.ca.gov/2010publications/CEC-600-2010-001/CEC-600-2010-001-CMF.PDF
Becker, T. A., I. Sidhu, et al. (2009). Electric Vehicles in the United States: A New Model with Forecasts to 2030; University of California, Berkeley: Center for Entrepreneurship & Technology: http://cet.berkeley.edu/dl/CET_Technical Brief_EconomicModel2030_f.pdf
Bellis, M. (2006). "History of Electric Vehicles: The Early Years, Electric Cars from 1830 to 1930." Retrieved 6 July, 2006. http://inventors.about.com/od/estartinventions/a/History-Of-Electric-Vehicles.htm
Beresteanu, A. and S. Li (2011). "Gasoline Prices, Government Support, and the Demand for Hybrid Vehicles in the U.S. ." International Economic Review 52(1): 161–182. http://econ.duke.edu/Papers/PDF/hybrid.pdf
BerkeleyFIRST (2008). "Berkeley FIRST (Financing Initiative for Renewable and Solar Technology) Frequently Asked Questions." City of Berkeley Mayor's Office. http://www.ci.berkeley.ca.us/ContentDisplay.aspx?id=22620
Blanco, S. (2011, 20 July). "Plug-In 2011: Details on Nissan's 2012 Leaf price increase." Retrieved 25 July, 2011. AutoblogGreen. http://green.autoblog.com/2011/07/20/plug-in-2011-details-on-nissans-2012-leaf-price-increase/
128
Book, M., M. Groll, et al. (2009). The Comeback of the Electric Car? How Real, How Soon, and What Must Happen Next; Boston Consulting Group: http://www.bcg.com/documents/file15404.pdf
Britannica (2011). "Camille Jenatzy." Encyclopædia Britannica Retrieved 2011, 7 July. Encyclopædia Britannica Online. http://www.britannica.com/EBchecked/topic/1295389/Camille-Jenatzy
Bunch, D. S., D. L. Greene, et al. (2011). Potential Design, Implementation, and Benefits of a Feebate Program for New Passenger Vehicles in California; University of California, Davis: February.
Caltrans (2002). California Motor Vehicle Stock, Travel and Fuel Forecast; California Department of Transportation: Division of Transportation System Information: November. http://www.dot.ca.gov/hq/tsip/smb/documents/mvstaff/mvstaff02.pdf
Caltrans (2009). 2008 California Motor Vehicle Stock, Travel and Fuel Forecast; California Department of Transportation: Division of Transportation System Information: June. http://www.dot.ca.gov/hq/tsip/smb/documents/mvstaff/mvstaff08.pdf
CARB (2001). "ARB Amends ZEV Rule: Standardizes Chargers & Addresses Automaker Mergers." CARB Press Release 28 June. Retrieved 28 January, 2011. California Air Resources Board. http://www.arb.ca.gov/newsrel/nr062801.htm
CARB (2006). EMFAC2007 2.3. California Air Resources Board. http://www.arb.ca.gov/msei/onroad/latest_version.htm
CARB (2009a). Attachment B: 2050 Greenhouse Gas Emissions Analysis: Staff Modeling in Support of the Zero Emission Vehicle Regulation; California Air Resources Board: 25 November. http://www.arb.ca.gov/msprog/zevprog/2009zevreview/attachment_b_2050ghg.pdf
CARB (2009b). CARB Resolution 09-66; California Air Resources Board: December 9. http://www.arb.ca.gov/msprog/zevprog/2009zevreview/res09_66.pdf
CARB (2009c). Overview of the California Zero Emission Vehicle Program; California Air Resources Board: 21 September. http://www.arb.ca.gov/msprog/zevprog/factsheets/overview.pdf
CARB (2009d). Staff Report: Initial Statement of Reasons: Proposed Regulation to Implement the Low Carbon Fuel Standard: Volume I; California Air Resources Board: 5 March. http://www.arb.ca.gov/fuels/lcfs/030409lcfs_isor_vol1.pdf
CARB (2009e). White Paper: Summary of Staff’s Preliminary Assessment of the Need for Revisions to the Zero Emission Vehicle Regulation; California Air Resources Board: 25 November. http://www.arb.ca.gov/msprog/zevprog/2009zevreview/zevwhitepaper.pdf
CARB (2010a). "Zero-Emission Vehicle Legal and Regulatory Activities - Background." 17 March. Retrieved 20 June, 2011. California Air Resources Board. http://www.arb.ca.gov/msprog/zevprog/background.htm
CARB (2010b). ZEV Regulation 2010 Staff Proposal; California Air Resources Board: 16 November. http://www.arb.ca.gov/msprog/levprog/leviii/meetings/111610/zev_workshop_presentation_final.pdf
CARB (2011). "Advanced Clean Cars." Retrieved 25 June, 2011. California Air Resources Board. http://www.arb.ca.gov/msprog/clean_cars/clean_cars.htm
CEC (2009). 2009 Integrated Energy Policy Report; CEC-100-2009-003-CMF; California Energy Commission: http://www.energy.ca.gov/2009_energypolicy/
Chambers, N. (2010). "Toyota to Sell Plug-in Prius Starting Spring 2012; Estimates $3-5K Premium Over Base Prius." September. PluginCars. http://www.plugincars.com/toyota-sell-plug-prius-starting-spring-2012-estimates-3-5k-premium-over-base-prius-73014.html
Chevrolet (2011). The 2011 Volt: Photos & Videos, Chevrolet. http://www.chevrolet.com/volt/pictures/
129
Colias, M. (2011, 20 June). "EVs rev up for Act 2." Retrieved 7 July, 2011. Automotive News. http://www.autonews.com/apps/pbcs.dll/article?AID=/20110620/RETAIL07/306209975/1261
CPUC (2010a). Revenue Allocation and Rate Design: Facilitating Plug-In Electric Vehicle Integration; California Public Utilities Commission: 10 September. http://docs.cpuc.ca.gov/efile/RULINGS/123311.pdf
CPUC (2010b). The Utility Role in Supporting Plug-In Electric Vehicle Charging; California Public Utilities Commission: Energy Division: 30 August. http://docs.cpuc.ca.gov/EFILE/RULINGS/122657.PDF
CPUC (2011). Phase 2 Decision Establishing Policies to Overcome Barriers to Electric Vehicle Deployment and Complying with Public Utilities Code Section 740.2, Draft (Rev. 3); California Public Utilities Commission (CPUC): 14 Jul. http://docs.cpuc.ca.gov/word_pdf/AGENDA_DECISION/139101.pdf
Crane, D. and B. Prusnek (2007). The Role of a Low Carbon Fuel Standard in Reducing Greenhouse Gas Emissions and Protecting Our Economy; The Governor Office White Paper: 8 January. http://www.arb.ca.gov/fuels/lcfs/lcfs_wp.pdf
Cutter, E. and M. Sullivan (2010). Beyond Emissions: The Utility Shareholder and Ratepayer Benefits of Plug-in Hybrid and Electric Vehicles. Advanced Workshop in Regulation and Competition: 23rd Annual Western Conference, Monterey, CA, 23–25 June 2010.
Davis, S. C., S. W. Diegel, et al. (2010). Transportation Energy Data Book: Edition 29; ORNL-6985; Oak Ridge National Laboratory: July.
Delucchi, M. A. and T. E. Lipman (2001). "An analysis of the retail and lifecycle cost of battery-powered electric vehicles." Transportation Research Part D: Transport and Environment 6(6): 371–404. http://www.sciencedirect.com/science/article/pii/S1361920900000316
Delucchi, M. A. and T. E. Lipman (2010). Lifetime Cost of Battery, Fuel-Cell, and Plug-in Hybrid Electric Vehicles. Electric and Hybrid Vehicles. G. Pistoia. Amsterdam, Elsevier: 19–60. http://www.sciencedirect.com/science/article/pii/B9780444535658000026
Diamond, R. and M. Moezzi (2004). Changing Trends: A Brief History of the US Household Consumption of Energy, Water, Food, Beverages and Tobacco; LBNL55011; Lawrence Berkeley National Laboratory (LBNL): Berkeley CA, http://epb.lbl.gov/homepages/rick_diamond/LBNL55011-trends.pdf
DOE. "Data, Analysis & Trends: Infrastructure." Retrieved 18 July, 2011. U.S. Department of Energy. http://www.afdc.energy.gov/afdc/data/infrastructure.html
DOE (2010a). "California Incentives and Laws for Hydrogen Fuel Cells." 19 February. Retrieved 27 December, 2010. U.S. Department of Energy. http://www.afdc.energy.gov/afdc/progs/ind_state_laws.php/CA/HY
DOE (2010b). "Hydrogen Production." Retrieved 21 December, 2010. U.S. Department of Energy. http://www.afdc.energy.gov/afdc/fuels/hydrogen_production.html
DOE (2010c). "What is a Natural Gas Vehicle?" Retrieved 18 December, 2010. U.S. Department of Energy. http://www.afdc.energy.gov/afdc/vehicles/natural_gas_what_is.html
DOE (2011). One Million Electric Vehicles By 2015: February 2011 Status Report; U.S. Department of Energy: February. http://www.energy.gov/media/1_Million_Electric_Vehicle_Report_Final.pdf
DOF (2007). Population Projections for California and Its Counties 2000-2050; California Department of Finance: Sacramento, CA, July.
Douglas, J. (2008). "Plug-In Hybrids on the Horizon: Building a Business Case." EPRI Journal. E3 (2010a). Economic Modeling Tools: E3 RES Calculator 2 Jun 2010. California Air Resources
Board (CARB). http://www.arb.ca.gov/research/econprog/econmodels/econmodels.htm
E3 (2010b). Greenhouse Gas Modeling of California’s Electricity Sector to 2020; Energy and Environmental Economics, Inc.: October. http://www.ethree.com/documents/GHG 3.11.10/CPUC_GHG_Revised_Report_v3b_March2010.pdf
130
Eaves, S. and J. Eaves (2004). "A cost comparison of fuel-cell and battery electric vehicles." Journal of Power Sources 130(1-2): 208–212. http://www.sciencedirect.com/science/article/pii/S0378775303012175
EC (2009). Electrification Roadmap: Revolutionizing Transportation and Achieving Energy Security; Electrification Coalition November. http://www.electrificationcoalition.org/sites/default/files/SAF_1213_EC-Roadmap_v12_Online.pdf
Edmunds (2011). "2011 Chevy Volt." Retrieved 1 June, 2011. Edmunds. http://www.edmunds.com/chevrolet/volt/2011/
EIA (2011a). Annual Energy Outlook 2011; DOE/EAI-0383(2011); U.S. Energy Information Administration: April. http://www.eia.gov/forecasts/aeo/pdf/0383(2011).pdf
EIA (2011b, 29 June). "U.S. Imports of Crude Oil and Petroleum Products." http://www.eia.gov/dnav/pet/hist/LeafHandler.ashx?n=pet&s=mttimus1&f=a
EPRI (2001). Comparing the Benefits and Impacts of Hybrid Electric Vehicle Options; 1000349; Electric Power Research Institute: Palo Alto, CA, July.
EPRI (2004). Advanced Batteries for Electric-Drive Vehicles: A Technology and Cost-Effectiveness Assessment for Battery Electric Vehicles, Power Assist Hybrid Electric Vehicles, and Plug-In Hybrid Electric Vehicles; 1009299; Electric Power Research Institute: Palo Alto, CA, May.
Farrell, A. E. and D. Sperling (2007a). Getting the Carbon Out; San Francisco Chronicle 18 May. http://www.energy.ca.gov/low_carbon_fuel_standard/FERRELL_SPERLING_SFCHRON_OP-ED.PDF
Farrell, A. E. and D. Sperling (2007b). A Low-Carbon Fuel Standard for California, Part 1: Technical Analysis; UCD-ITS-RR-07-07; Institute of Transportation Studies: University of California, Davis, http://pubs.its.ucdavis.edu/publication_detail.php?id=1082
Francfort, J. (2010). Electric Vehicle Charging Levels and Requirements Overview. Clean Cities Webinar, 15 December 2010; Idaho National Laboratory.
Funk, K. and A. Rabl (1999). "Electric versus conventional vehicles: social costs and benefits in France." Transportation Research Part D: Transport and Environment 4(6): 397-411. http://www.sciencedirect.com/science/article/pii/S1361920999000188
GAO (2000). Energy Policy Acy of 1992: Limited Progress in Acquiring Alternative Fuel Vehicles and Reaching Fuel Goals; U.S. General Accounting Office: February. http://www.gao.gov/archive/2000/rc00059.pdf
GasBuddy (2011). "Historical Price Charts: 72 Month Average Retail Price Chart." GasBuddy. http://www.gasbuddy.com/gb_retail_price_chart.aspx?time=24
Gillingham, K. (2010). Identifying the Elasticity of Driving: Evidence from a Gasoline Price Shock in California; Stanford University: Sep. http://www.stanford.edu/~kgilling/Gillingham_IdentifyingElasticityofDriving.pdf
Goldstene, J. N. (2010). Memorandum to Mary D. Nichols, CARB Chairwoman: Low Carbon Fuel Standard Regulation Update; California Air Resources Board: 19 May. http://www.arb.ca.gov/fuels/lcfs/LCFS_Regulation_Update.pdf
Hawkins, D. (2008). DRAFT Frequently Asked Questions about markets for energy storage, California Independent System Operator (CAISO). http://www.caiso.com/1fd5/1fd57358220a0.pdf
Healey, J. R. (2011, 24 May). "Americans Say No to Electric Cars Despite Gas Prices." Retrieved 5 June, 2011. USA Today. http://www.usatoday.com/NEWS/usaedition/2011-05-25-noelectriccar_ST_U.htm
Heling, M. G., J.-D. Saphores, et al. (2008). User Characteristics and Reponses to a Shared-Use Station Car Program: An Analysis of ZEV•NET in Orange County, CA; UCI-ITS-WP-08-1; University of California, Irvine: Institute of Transportation Studies: Irvine, CA, http://www.its.uci.edu/its/publications/papers/ITS/UCI-ITS-WP-08-1.pdf
ICFI (2011). DRAFT Bay Area EV Strategy Paper; ICF International: February.
131
IEA (2010). Transforming Innovation into Realistic Market Implementation Programmes: Workshop Summary. IEA Experts Group on R&D: Priority Setting and Evaluation, 27–28 April 2010; International Energy Agency. http://www.iea.org/work/2010/transform/Summary_Report.pdf
IEA/OECD (2009). Transport Energy and CO2: Moving Toward Sustainability, International Energy Agency, Organization for Economic Cooperation and Development:
Jacobe, D. (2011). "In U.S., High Gas Prices May Make Many Get Fuel-Efficient Cars." Retrieved 13 June, 2011. Gallup. http://www.gallup.com/poll/147746/High-Gas-Prices-May-Fuel-Efficient-Cars.aspx
Kahn, D. (2011). "California Delays Cap-And-Trade Auctions, Citing Potential Gaming." 30 Jun. Retrieved 30 Jun, 2011. The New York Times. http://www.nytimes.com/cwire/2011/06/30/30climatewire-california-delays-cap-and-trade-auctions-cit-96440.html
Kammen, D. M., S. M. Arons, et al. (2009). Cost-Effectiveness of Greenhouse Gas Emission Reductions from Plug-in Hybrid Electric Vehicles. Plug-in Electric Vehicles: What Role for Washington? D. B. Sandalow. Washington D.C., Brookings Institution: 170–191.
Kazimi, C. (1997). "Evaluating the Environmental Impact of Alternative-Fuel Vehicles." Journal of Environmental Economics and Management 33(2): 163-185. http://www.sciencedirect.com/science/article/pii/S0095069697909840
KEMA (2010). Assessment of Plug-in Electric Vehicle Integration with ISO/RTO Systems KEMA: March. http://www.isorto.org/atf/cf/%7B5B4E85C6-7EAC-40A0-8DC3-003829518EBD%7D/IRC_Report_Assessment_of_Plug-in_Electric_Vehicle_Integration_with_ISO-RTO_Systems_03232010.pdf
Kirsch, D. A. (2000). The Electric Vehicle and the Burden of History, Rutgers University Press: New Brunswick, New Jersey, and London.
Kromer, M. A. and J. B. Heywood (2007). Electric Powertrains: Opportunities and Challenges in the U.S. Light-Duty Vehicle Fleet; LFEE 2007-03 RP; Sloan Automotive Laboratory: Massachusetts Institute of Technology, May.
Kurani, K. S., T. Turrentine, et al. (1996). "Testing Electric Vehicle Demand in 'Hybrid Households' Using a Reflexive Survey." Transportation Research D 1(2).
Lache, R., D. Galves, et al. (2009). Electric Cars: Plugged In 2: A mega-theme gains momentum; Deutsche Bank: 3 November. http://www.fullermoney.com/content/2009-11-03/ElectricCarsPluggedIn2.pdf
Leiby, P. N. (2007). Estimating the Energy Security Benefits of Reduced U.S. Oil Imports; ORNL/TM-2007/028; Oak Ridge National Laboratory: Oak Ridge, TN, 28 February. http://www.epa.gov/otaq/renewablefuels/ornl-tm-2007-028.pdf
Lemoine, D. M. (2008). Valuing Plug-in Hybrid Electric Vehicles' Battery Capacity Using a Real Options Framework; 08-015; USAEE: 31 Dec. http://ssrn.com/abstract=1322164
Lemoine, D. M., D. M. Kammen, et al. (2008). "An innovation and policy agenda for commercially competitive plug-in hybrid electric vehicles." Environmental Research Letters 3(1): 1–8.
Lidicker, J. R., T. E. Lipman, et al. (2010). "Economic Assessment of Electric-Drive Vehicle Operation In California and the United States." Transportation Research Record(2191): 50–58.
Loveday, E. (2011, 31 May). "Gallup Poll Shows 57% of Americans Won't Buy an Electric Vehicle." Retrieved 5 June, 2011. AutoblogGreen. http://green.autoblog.com/2011/05/31/gallup-poll-shows-57-of-americans-wont-buy-an-electric-vehicle/
Martin, E., S. A. Shaheen, et al. (2009). "Behavioral response to hydrogen fuel cell vehicles and refueling: Results of California drive clinics." International Journal of Hydrogen Energy 34(20): 8670–8680.
MGI (2009). Averting the next energy crisis: The demand challenge; McKinsey Global Institute: March.
132
http://www.mckinsey.com/mgi/reports/pdfs/next_energy_crisis/MGI_next_energy_crisis_full_report.pdf
Moore, G. A. (1999). Crossing the Chasm: Marketing and Selling High-Tech Products to Mainstream Customers, revised ed.; HarperBusiness: New York.
NADA (2010). NADA Data: State of the Industry Report 2010; National Automobile Dealers Association Industry Analysis: McLean, VA, http://www.nada.org/Publications/NADADATA/default.htm
Neubauer, J. and A. Pesaran (2010). NREL’s PHEV/EV Li-ion Battery Secondary-Use Project. Advanced Automotive Batteries Conference Orlando, Florida, 17–21 May 2010; National Renewable Energy Laboratory. http://www.nrel.gov/docs/fy10osti/48042.pdf
Nissan (2011). gallery: the car, Nissan USA. http://www.nissanusa.com/leaf-electric-car/index?dcp=ppn.63023882.&dcc=0.240189300 - /leaf-electric-car/gallery/view/car/7
NRDC/EPRI (2007). Environmental Assessment of Plug-In Hybrid Electric Vehicles Volume 1: Nationwide Greenhouse Gas Emissions; 1015325; Electric Power Research Institute and National Resources Defense Council: Jul. http://my.epri.com/portal/server.pt?space=CommunityPage&cached=true&parentname=ObjMgr&parentid=2&control=SetCommunity&CommunityID=405
Offer, G. J., D. Howey, et al. (2010). "Comparative analysis of battery electric, hydrogen fuel cell and hybrid vehicles in a future sustainable road transport system." Energy Policy 38(1): 24–29. http://www.sciencedirect.com/science/article/pii/S0301421509006260
Parks, K., P. Denholm, et al. (2007). Costs and Emissions Associated with Plug-In Hybrid Electric Vehicle Charging in the Xcel Energy Colorado Service Territor; NREL/TP-640-41410; National Renewable Energy Laboratory: May.
PGE. "Electric Vehicle Charging Rate and Economics." Retrieved June 25, 2011. Pacific Gas & Electric. http://www.pge.com/about/environment/pge/electricvehicles/fuelrates/index.shtml
PRNewswire (1996). "Price & Introduction Date of GM's EV1 Electric Announced." 15 October. Retrieved 28 January, 2011. The Free Library. http://www.thefreelibrary.com/Price+%26+Introduction+Date+of+GM's+EV1+Electric+Announced-a018766098
Rogers, E. M. (2003). Diffusion of innovations, 5th ed.; Free Press: New York. Sanna, L. (2005). "Driving the Solution: The Plug-In Hybrid Vehicle." EPRI Journal SCE. "Your EV Rate Options." Retrieved June 25, 2011. Southern California Edison.
http://www.sce.com/PowerandEnvironment/PEV/rate-charging-options.htm Schremp, G., A. Bahreinian, et al. (2010). Transportation Energy Forecasts and Analyses for the
2009 Integrated Energy Policy Report; CEC-600-2010-002-SF; California Energy Commission: May. http://www.energy.ca.gov/2010publications/CEC-600-2010-002/CEC-600-2010-002-SF.PDF
SDGE. "Electric Vehicle Rates FAQs." Retrieved June 25, 2011. San Diego Gas & Electric. http://www.sdge.com/environment/cleantransportation/evfaq-print.html
SDGE. "Service for Residential Customers with Electric Vehicles." Retrieved June 25, 2011. San Diego Gas & Electric. http://www.sdge.com/documents/customer/totalrates/050109/schedule_ev.pdf
Shaheen, S. A., E. Martin, et al. (2008). "Dynamics In Behavioral Response to a Fuel Cell Vehicle Fleet and Hydrogen Fueling Infrastructure: An Exploratory Study." Transportation Research Record(2058): 155–162.
Shaheen, S. A., D. Sperling, et al. (2004). "California's Zero-Emission Vehicle Mandate: Linking Clean-Fuel Cars, Carsharing and Station Car Strategies." Transportation Research Record(1791): 113–120.
Shepardson, D. (2011). "GM restarts Volt production." 19 Jul. Retrieved 19 Jul, 2011. Detroit News. http://detnews.com/article/20110719/AUTO01/107190386/GM-restarts-Volt-production
133
Simpson, A. (2006). Cost-Benefit Analysis of Plug-In Hybrid Electric Vehicle Technology. 22nd International Battery, Hybrid and Fuel Cell Electric Vehicle Symposium and Exhibition, Yokohama, Japan, 23–28 October 2006; National Renewable Energy Laboratory. http://www.nrel.gov/vehiclesandfuels/vsa/pdfs/40485.pdf
Sperling, D. (1988). New transportation fuels : a strategic approach to technological change, University of California Press: Berkeley.
Sperling, D. (1995). Future Drive: Electric Vehicles And Sustainable Transportation, Island Press: Washington D.C.
Telegraph, T. (2009). "World's first electric car built by Victorian inventor in 1884." 24 April. Retrieved 14 July, 2009. The Telegraph. http://www.telegraph.co.uk/news/newstopics/howaboutthat/5212278/Worlds-first-electric-car-built-by-Victorian-inventor-in-1884.html
Thomas, C. E. (2009). "Fuel cell and battery electric vehicles compared." International Journal of Hydrogen Energy 34(15): 6005–6020. http://www.sciencedirect.com/science/article/pii/S0360319909008696
TIAX (2008). Electric Transportation and Goods Movement Technologies in California: Technical Brief; TIAX: http://www.arb.ca.gov/regact/2009/lcfs09/tiax.pdf
Toyota (2011). The first-ever prius plug-in hybrid: photo gallery, Toyota. http://www.toyota.com/upcoming-vehicles/prius-plug-in/photo-gallery.html
Turrentine, T. (2011). Market Deployment of EVs & HEVs: “Lessons Learned”. Transportation Research Board 2011 Annual Meeting, 23–27 January 2011; International Energy Agency. https://http://www.iea.org/work/2010/transform/turrentine.pdf
Utterback, J. (1996). Mastering the Dynamics of Innovation, Harvard Busines press: Cambridge MA.
Vyas, A., R. Cuenca, et al. (1998). An Assessment of Electric Vehicle Life Cycle Costs to Consumers; 982182; Society of Automotive Engineers: Warrendale, Pennsylvania, 30 November.
Walsh, M. P., F. R. Kalhammer, et al. (2007). Status and Prospects for Zero Emissions Vehicle Technology; ARB Independent Expert Panel 2007: 13 April. http://www.arb.ca.gov/msprog/zevprog/zevreview/zev_panel_report.pdf
Williams, B. D. (2007). Commercializing Light-Duty Plug-In/Plug-Out Hydrogen-Fuel-Cell Vehicles: "Mobile Electricity" Technologies, Early California Household Markets, and Innovation Management. PhD PhD Dissertation, University of California at Davis.
Williams, B. D. and K. S. Kurani (2006). "Estimating the early household market for light-duty hydrogen-fuel-cell vehicles and other "Mobile Energy" innovations in California: A constraints analysis." Journal of Power Sources 160(1): 446-453. http://www.sciencedirect.com/science/article/B6TH1-4JRVB7F-2/2/d258d1944768b491ae39493d1506d00c
Williams, B. D. and K. S. Kurani (2007). "Commercializing light-duty plug-in/plug-out hydrogen-fuel-cell vehicles: "Mobile Electricity" technologies and opportunities." Journal of Power Sources 166(2): 549-566. http://www.sciencedirect.com/science/article/B6TH1-4MV7531-2/2/5595dc45642a0083cf840733d77c6354
Williams, B. D. and T. E. Lipman (2009). Strategies for Transportation Electric Fuel Implementation in California: Overcoming Battery First-Cost Hurdles; CEC-500-2009-091; California Energy Commission Public Interest Energy Research (PIER) Transportation Program: Sacramento, http://www.energy.ca.gov/2009publications/CEC-500-2009-091/CEC-500-2009-091.PDF
Woods, T. (1995). Zero-emission vehicle technology assessment. Final report; NYSERDA--95-11; Other: ON: TI95017409; TRN: TRN: 95:006914; http://www.osti.gov/bridge/servlets/purl/104997-TMF6kx/webviewable/

134
Yazaki (2011). AC Charge Couple Connector; Yazaki North America, Inc.: http://www.yazaki-na.com/uploads/AC Charge Coupler Connector.pdf
Zhao, J. and M. W. Melaina (2006). "Transition to hydrogen-based transportation in China: Lessons learned from alternative fuel vehicle programs in the United States and China." Energy Policy 34(11): 1299–1309. http://www.sciencedirect.com/science/article/pii/S0301421505003459