Fuel-Flexible Combustion System for Co-production Plant Applications
54
Fuel-Flexible Combustion System for Co-production Plant Applications Semi-Annual Report June 2005 December 2005 Matt Mosbacher, Joel Haynes, Jonathan Janssen, Justin Brumberg, Tim Lieuwen, Suresh Menon, Jerry Seitzman, Ashock Anand, Patrick May January 2006 DE-FC26-03NT41776 GE Global Research 1 Research Circle Niskayuna, NY 12309
-
Upload
independent -
Category
Documents
-
view
2 -
download
0
Transcript of Fuel-Flexible Combustion System for Co-production Plant Applications

Fuel-Flexible Combustion System for Co-production Plant Applications
Semi-Annual Report
June 2005
December 2005
Matt Mosbacher, Joel Haynes, Jonathan Janssen, Justin Brumberg, Tim Lieuwen, Suresh Menon, Jerry Seitzman, Ashock Anand,
Patrick May
January 2006
DE-FC26-03NT41776
GE Global Research 1 Research Circle
Niskayuna, NY 12309
2
DISCLAIMER This report was prepared as an account of work sponsored by an agency of the United States Government. Neither the United States Government nor any agency thereof, nor any of their employees, makes any warranty, express or implied, or assumes any legal liability or responsibility for the accuracy, completeness, or usefulness of any information, apparatus, product, or process disclosed, or represents that its use would not infringe privately owned rights. Reference herein to any specific commercial product, process, or service by trade name, trademark, manufacturer, or otherwise does not necessarily constitute or imply its endorsement, recommendation, or favoring by the United States Government or any agency thereof. The views and opinions of authors expressed herein do not necessarily state or reflect those of the United States Government or any agency thereof.
3
Abstract
Future high-efficiency, low-emissions generation plants that produce electric power, transportation fuels, and/or chemicals from fossil fuel feed stocks require a new class of fuel-flexible combustors. In this 36-month program, a validated combustor approach will be developed which will enable single-digit NOx operation of future generation plants with low-Btu off gas and high-hydrogen fuels, with the flexibility of process-independent backup with both natural gas and liquid fuels. This combustion technology will overcome the limitations of current syngas gas turbine combustion systems, which are designed on a site-by-site basis, and enable improved future co-generation plant designs. In this capacity, a fuel-flexible combustor will enhance the efficiency and productivity of future co-production plants.
This report discusses the development and design of a hybrid combustor that utilizes a diffusion flame approach for syngas fuels with a lean premixed swirl concept for natural gas fuels for both syngas and natural gas fuels at FA+e gas turbine conditions. A technology matrix and chemical kinetic models are used to evaluate various combustion technologies and to select the combustor concept. The results of this technology evaluation have been presented in prior project reports. A systems analysis of a co-production plant in conjunction with chemical kinetic analysis is conducted to determine the desired combustor operating conditions for the burner concepts. The hybrid nozzle is sized to accommodate syngas fuels ranging from ~100 to 280 btu/scf and with a diffusion tip geometry optimized for Early Entry Co-generation Plant (EECP) fuel compositions. The swozzle concept utilizes existing GE DLN design methodologies to eliminate flow separation and enhance fuel-air mixing. The prototype design is optimized using 3D reacting CFD calculations for 1/16th sector models of the burners. CFD is performed using the commercial Fluent package with non-reacting flow and non-premixed reacting flow models. Additionally, a discussion of fundamental laminar flame speed measurements for syngas fuels and developing methods for advanced numerical simulations are presented.
4
Table of Contents
DISCLAIMER ........................................................................................................................... 2 Abstract ...................................................................................................................................... 3 Table of Contents ....................................................................................................................... 4 List of Graphics.......................................................................................................................... 6
1 Introduction ............................................................................................................................ 8 1.2 Task 2 (Fuel Flexible Combustor Design Approaches) ................................................. 8 1.3 Task 3 (Syngas Flame characterization)......................................................................... 8 1.4 Task 4 (Systems Plant Performance Modeling) ............................................................. 9 1.5 Task 5 (Fuel Flexible Combustor Prototype Design)..................................................... 9 1.6 Task 6 (Syngas Methodology for Advanced CFD tools) ............................................... 9
Executive Summary ..................................................................................................................... 11 2 Experimental ........................................................................................................................ 14
2.2 Task 3 (Syngas Fuel Flame Characterization).............................................................. 14 2.2.1 Apparatus ............................................................................................................. 14
2.2.1.1 Laminar flame speed measurement .................................................................. 14 2.2.1.2 Strained laminar flame measurement ............................................................... 14
2.2.2 Experimental and operating data.......................................................................... 17 2.2.2.1 Laminar flame speed measurements ................................................................ 17 2.2.2.2 Strained laminar flame measurements.............................................................. 17
2.2.3 Data Reduction..................................................................................................... 19 2.3 Task 4 (Systems Modeling).......................................................................................... 21 2.4 Task 5 (Prototype Design)............................................................................................ 22
2.4.1 Apparatus ............................................................................................................. 22 2.4.2 Experimental and operating data.......................................................................... 24
2.5 Task 6 (Advanced CFD tools)...................................................................................... 25 2.5.1 Apparatus ............................................................................................................. 25
2.5.1.1 Syngas Methodology for Advanced CFD tools................................................ 25 2.5.1.2 LES Mathematical Formulation ....................................................................... 26 2.5.1.3 LES Subgrid Closure Methods......................................................................... 27
3 Results and Discussion......................................................................................................... 28 3.2 Task 3 (Syngas Fuel Flame Characterization).............................................................. 28
3.2.1 Atmospheric Pressure Laminar Flame Speed Measurements .............................. 28 3.2.1.1 Method Comparison......................................................................................... 28 3.2.1.2 Model Comparisons Effect of Preheating ........................................................ 30 3.2.1.3 Elevated Pressure Strained Laminar Flame Measurements.............................. 31
3.3 Task 4 (Systems Modeling).......................................................................................... 33 3.4 Task 5 (Prototype Design)............................................................................................ 35
3.4.1 Hybrid Diffusion Nozzle...................................................................................... 35 3.4.1.1 Flame Shape and Exit Profile........................................................................... 35 3.4.1.2 Temperature Profiles ........................................................................................ 36 3.4.1.3 Emissions ......................................................................................................... 36
3.4.2 Premixed Swozzle ................................................................................................ 38 3.5 Task 6 (Syngas Methodology for Advanced CFD Tools)............................................ 38

5
3.5.1 Chemical Mechanism Validation ......................................................................... 38 3.5.2 LES study ............................................................................................................. 41
4 Conclusions.......................................................................................................................... 50 4.2 Task 3 (Syngas fuel flame characterization) ................................................................ 50 4.3 Task 4 (Systems Modeling).......................................................................................... 50 4.4 Task 5 (Prototype Design)............................................................................................ 51 4.5 Task 6 (Syngas Methodology for Advanced CFD Tools)............................................ 52
5 References............................................................................................................................ 53
6
List of Graphics Figure 2.2-1: Schematic of the experimental setup for laminar flame speed measurements. ...... 14 Figure 2.2-2: Schematic of high-pressure stagnation flame burner with N2 coflow. ................... 15 Figure 2.2-3: Pressure vessel for housing the high-pressure flame experiments. ........................ 16 Figure 2.2-4: Image of flame emission for a fuel mixture H2:CO=95:5 at an equivalence ratio
φ=0.61 The color scale is black and dark blue for low intensities, and green, yellow and red for higher intensities............................................................................................................. 17
Figure 2.2-5: Image of flame emission from a stagnation flame at p=5.0 atm for a fuel mixture H2:CO=10:90 at an equivalence ratio φ=0.6; average inflow velocity ~4SL; L/D=0.5. ....... 18
Figure 2.2-6: Velocity measurements along the centerline of a stagnation flame for 90% CO and 10% H2 fuel mixture, φ=0.6, p=5.0 atm at seven flow rates. The flow direction is right to left in this figure, i.e., cold reactants are present at 3.75 mm, while there are hot products at 1.5 mm.................................................................................................................................. 18
Figure 2.2-7: Measured flame speeds for H2:CO 50:50 and 5:95 fuel compositions................... 20 Figure 2.2-8: Measured flame speeds corresponding to results shown in Figure 2.2-6. .............. 20 Figure 2.3-1: EECP Combined Cycle Schematics ....................................................................... 21 Figure 2.3-2: Fuel Matrix ............................................................................................................. 22 Figure 2.4-1: Temperature as a function of mixture fractions...................................................... 24 Figure 3.2-1: Laminar premixed syngas burning velocities in a 1-d stagnation flame as a function
of strain rate for two reactant compositions. ........................................................................ 29 Figure 3.2-2: Laminar burning velocities as a function of equivalence ratio for premixed flame
with a fuel composition of 50% CO and 50% H2, with 20% CO2 dilution by volume (H2:CO:CO2=40:40:20)........................................................................................................ 29
Figure 3.2-3: Flame speeds for a 50:50 H2:CO fuel composition for various preheat temperatures and three mechanisms: GRI (solid lines), Davis (short dash) and Chen (long dash). .......... 30
Figure 3.2-4: Flame speeds for a 95:5 H2:CO composition with 20% CO2 dilution for various preheat temperatures and three mechanisms: GRI (solid lines), Davis (short dash) and Chen (long dash)............................................................................................................................ 31
Figure 3.2-5: Strained flame speed measurements for three H2:CO fuel mixtures at φ=0.6, p=5.0 atm. The points represent the experimental values at various strains. The lines are linear fits extrapolated to zero strain. ................................................................................................... 32
Figure 3.2-6: Solid lines (GRI), dotted (Davis), dashed with symbol (Chen). Comparison of measured and predicted laminar flame speed measurements for three undiluted H2:CO mixtures at φ=0.6 and 5 atm. The experimental values are extrapolated to zero strain as shown in figure 3.2-5. .......................................................................................................... 33
Figure 3.5-1: Flame speed calculation with PREMIX for two syngas compositions: a) ILVA (H2:CO:CO2:N2=8.6:26.6:14.3:51) and b) TAMPA (H2:CO:CO2:N2:H2O= 37.2:46.6:13.3:2.6:0.3). ........................................................................................................ 39
Figure 3.5-2: PSR comparisons for two syngas compositions: a) mole fraction of H for PSI (H2:CO:CO2:N2:H2O=24:40:9:4:23) and b) temperature for PUMPE (H2:CO:CO2:N2= 61.9:26.2:2.8:8.7). ................................................................................................................ 40
Figure 3.5-3: Comparison of laminar flame (PREMIX) predictions obtained with the 5-step and 10-step mechanisms for a 50:50 H2:CO mixture with φ=0.6. .............................................. 40

7
Figure 3.5-4: Comparison of the axial (u) velocity profiles obtained by DNS of a vortex interacting with an atmospheric-pressure, laminar flame of 50:50 H2:CO fuel composition with an equivalence ratio of 0.6. Results are shown for two times during the interaction: a) at t=200 and b) t=1000 time step iterations (
�t=0.317 10-7 sec). ......................................... 41
8
1 Introduction
1.2 Task 2 (Fuel Flexible Combustor Design Approaches)
The purpose of this task is to develop a technology scorecard to select two conceptual configurations for a low emissions fuel flexible combustor that burns natural gas and syngas fuels. This task was completed during the January-December 2004 reporting periods. Two combustor prototypes: a hybrid of a diffusion burner for syngas and premixed swirl burner for natural gas and a trapped vortex combustor for both syngas and natural gas were selected for further consideration. The methods and processes used in developing the technology scorecard along with preliminary modeling results from evaluating technologies for a fuel flexible combustor in Task 2 were presented in the previous reports. Details of the chemical kinetics calculations employed in Task 2 and the results thereof are presented in the January-May 2005 reporting period and published in the 2005 ASME Turbo-Expo (Iyer et al., 2005).
1.3 Task 3 (Syngas Flame characterization)
Combustor design tools for synthetic gas fuels will require simplified models for predicting combustor stability performance based on reduced order (e.g., time-averaged) quantities. To address the feasibility of synthetic gas for fuel-flexible gas turbine combustion, one must be able to accurately predict flame behavior, i.e. combustor stability limits, under preheating and high-pressure conditions, which effect the chemical kinetics, species transport properties, and flame speeds. Typical syngas fuels are multi-species mixtures with widely varying fuel combustibles and diluent compositions, thus further complicating the combustion and analysis processes (Zhu et al., 1988).
Experimental measurements of flame speeds for ranges of synthetic gas compositions,
and under ranges of temperature, pressure and strain are obtained to study the previously mentioned effects. Laminar flame speed (SL) is defined as the velocity of steady, one-dimensional propagation of a planar, adiabatic, unstrained laminar flame into a uniform premixed fuel-air mixture at rest. The laminar flame speed is an important parameter, because it contains fundamental information regarding reactivity, diffusivity, and exothermicity of a combustible mixture that can be used to develop an H2/CO chemical kinetic mechanism and provide insight into fundamental flame physics. Despite its importance, there is substantial scatter in the data of laminar burning velocities (see review by Andrews and Bradley, 1972; Egolfopoulus et al., 1989) due to the difficulty in experimentally achieving planar, adiabatic, steady, unstrained laminar flames.
In conjunction with the experimental data, computational chemical kinetic studies are
also being used to identify appropriate chemical mechanisms to model synthetic gas mixtures as functions of fuel composition, strain rate, pressure, and temperature. Three kinetic mechanisms have been explored. The first mechanism is GRI Mech 3.0, a well-tested mechanism that has been validated extensively for methane chemistry, and therefore also includes H2/O2/air and CO/O2/air mechanisms. The second mechanism was developed recently for H2/CO combustion
9
(Davis et al., 2004) that is built on the kinetic model of Mueller et al. (1999) with rate parameters and efficiencies that have been revised over the last few years. This “full” mechanism involves 11 chemically reactive species (as well as various diluents) and 30 kinetic steps. The other mechanism was developed under this program by J. Y. Chen. It is a reduced mechanism, with 5 steps and 9 reactive species.
1.4 Task 4 (Systems Plant Performance Modeling)
This task identifies critical plant level requirements by reviewing the DOE Co-generation plant program plan and EECP Phase 1 report. A Quality Flow Down (QFD) method is utilized to establish combustor level requirements flowing down from plant level requirements. This task provides combined cycle performance evaluations of various conceptual combustor designs to help downselect the combustor technologies for further development of a low emissions fuel flexible combustor. Results from the performance analysis are also used determine the fuel flexible combustor operating conditions for operation in existing conventional gas turbine power systems.
1.5 Task 5 (Fuel Flexible Combustor Prototype Design)
The purpose of this task is to design and fabricate two prototypes of a fuel flexible combustor and operate them in a single nozzle combustion test rig under heavy-duty gas turbine operating conditions. The prototypes are designed from the downselected technologies in Task-2 with operating conditions estimated from Task 4 results and current industrial gas turbine cycle conditions. This report discusses the design and calculations for the first prototype, which is a hybrid of a lean premixed DLN burner for natural gas and a diffusion burner with diluents injection for syngas.
1.6 Task 6 (Syngas Methodology for Advanced CFD tools)
Advanced CFD methodologies, including DNS and LES techniques, are currently in development to apply the syngas kinetic mechanisms and thermo-physical information to complex reacting flows in combustors. Therefore, current studies include DNS and LES studies. The former is intended to examine the application of the reduced order mechanisms required for LES studies. The second study is intended to develop and explore capabilities to predict extinction phenomena in practical combustor geometries.
Flow features inside a gas turbine combustor are investigated by Large Eddy Simulation
computations. The configuration and test conditions were provided by GE for this study. Special emphasis is placed on the mixing characteristics and the accurate representation of the chemical state space by reduced reaction mechanisms. LES computations are started on the exit plane of the diffuser cap and throughout the simulations injection of fuel and diluents from the holes are handled with special care. Results show that the effective mixing of fuel and oxidizer occur on

10
the downstream due to the existence of a diluent stream and flame starts at this location. A recirculation zone exists on the inner section of the combustor which carries the hot products upstream and causes pre heating.
11
Executive Summary
Current commercially available combustion system cannot meet the fuel flexible requirements targeted by this program, which are low emissions capability, multi-fuel flexibility, and fuel flexibility with respect to a wide range of heating values for syngas fuels. The goal of this program is to evaluate and improve upon existing leading combustor designs that can partially meet these requirements and to develop new technologies as appropriate to meet performance requirements and expand operability limits. The success and resultant quality of the fuel-flexible combustion system are enhanced by the Design for Six Sigma (DFSS) quality process, which is a statistically based methodology focused on flowing performance specifications and tolerances from the high level of customer or Co-production plant objectives down to the low level of component parts. The current process capability of each component flows back up to understand the influence of its variability on system performance. Using this methodology with a conceptual plant model and market driven inputs from Texaco will ensure that the combustion system is indeed flexible enough for highly efficient operation.
As a result of evaluating existing and advanced technology using the Six Sigma process,
two concepts are selected that can meet the program performance requirements: prototype 1, a hybrid of a diffusion combustor for syngas and lean premixed swirl combustor for natural gas; and prototype 2, a trapped vortex combustor for both natural gas and syngas. The hybrid combustor successfully incorporates the low-NOx performance of GE’s most advanced premixed combustion systems with a new version of an Integrated Gasification Combined Cycle (IGCC) diffusion nozzle for syngas fuels. This concept will provide a fuel-flexible combustor design capable of single-digit NOx and CO emissions, greatly enhanced fuel flexibility (100-280 BTU/scf), multi-fuel firing capability (syngas and natural gas for backup firing with low emissions), and co-firing capability as well. However, the unique challenges of low-NOx operation on high-hydrogen fuel, F-class operation of low Btu/scf fuels, and changing market demands, such as increased turndown or part load operation, may require the introduction and refinement of some of our most advanced technology. Thus the TVC combustor concept is being developed concurrently with the hybrid concept.
In the present report, fundamental flame characterization of low heating value syngas fuels, co-production plant systems analysis, the process of design of a hybrid combustor concept, and methodologies for advanced CFD calculations with syngas flames are presented. These activities cover tasks three through six of the broad program. The results of Task 2, which is includes the technology evaluation methods and scores, has been presented in previous progress reports.
Experimental apparatus for measuring laminar flame speed in unstretched and stretched
flames at atmospheric and elevated pressures are presented. A premixed Bunsen flame atmospheric set-up is used for to measure laminar flame speeds. The flame speed is estimated by measuring the luminous flame surface area using optical techniques and dividing the volume flow rate of reactants by the measured flame area. A stagnation flow set-up is built for studying laminar flames under stretched conditions and at high-pressures through inclusion of a pressure vessel. Results are presented for laminar flame speeds for different proportions of H2/CO fuels premixed with air at different equivalence ratios on the lean side. These results are used to
12
further verify previous experiments and to better estimate the accuracy of the measurement system. Additionally, the measurements are compared with predictions using three chemical mechanisms for syngas oxidation, two of them are detailed mechanisms and the third one is a reduced mechanism developed in this program. The reduced mechanism shows good agreement with experimental data in terms of CO addition and CO2 dilution, but marginal agreement with pre-heating the reactant species. Measurements at elevated pressures are obtained to demonstrate the high-pressure capability of the stagnation flame setup. Numerical predictions using the previously mentioned chemical kinetic mechanisms are in good agreement with experimental data at high-pressure. Further refinement of the experimental system is needed to increase flame stability at higher pressures and to broaden the range of operating conditions that can provide useful data for comparison with the chemical kinetic predictions. As demonstrated, the flame speed measurement systems can provide useful data for further development of a reduced chemistry mechanism for syngas combustion.
A systems evaluation is performed for the co-generation EECP plant to determine plant
efficiencies and combustor operating conditions. Transfer functions for NOx are developed using the methods developed for the technology selection. The systems analysis is performed using the transfer functions for the hybrid diffusion/lean premixed and trapped vortex combustor concepts. The analysis shows that the co-generation efficiencies are almost identical for both the concepts. However, the hybrid concept is unable to give less than 9 ppm NOx based on nitrogen dilution alone. Nitrogen is the preferred diluents because it is available at high pressure as a product of the air separation unit in the EECP plant cycle. The hybrid is able to meet 9 ppm NOx with sufficient steam addition. For the EECP fuel composition the addition of steam is not large enough to affect the combustor life or to derate the firing temperature. The advantage of the TVC concept is that no diluent addition is required to meet the emissions requirements.
The design of a hybrid of a diffusion flame burner for syngas and a premixed swirl burner for natural gas is discussed in this report. Chemical kinetics analyses are used to determine the relative proportions of fuel, air and steam diluents for obtaining the desired combustor exit temperature and NOx emissions for the diffusion flame burner. The syngas and diluents manifold passages are sized to accommodate syngas fuels ranging from sub-100 to 310 btu/scf. The diffusion tip is currently sized for EECP fuel composition. The orientation of the diffusion jets is optimized using 3D reacting CFD calculations for 1/16th sector model of the burner. CFD is performed using the commercial Fluent package using non-premixed combustion models. Detailed analysis of the mixing process and temperature history in the combustion chamber is performed based on the CFD predictions. The correlation between NOx formation and the mixing process is highlighted. NOx is calculated by solving a separate transport equation with source terms from the thermal and N2O intermediate mechanisms. The effect of turbulence-chemistry interaction on NOx is also evaluated by considering source terms with and without the interaction term. The premixed swirl burner is designed following existing methodologies for GE’s DLN swozzles. CFD calculations are performed to verify that the air swirls to the required swirl number without generating recirculation zones. The fuel injection points for natural gas are located in the swirl vanes and the burner tube wall to achieve maximum fuel-air homogeneity. The injection strategy is verified with CFD mixing studies.
13
Methodologies are being developed for advanced combustor CFD calculations with syngas fuels. Direct numerical simulations (DNS) have been presented in previous reports to show the effect of flame vortex interactions on the wrinkling of premixed H2/CO flames. This initial study assisted in the development and validation of the reduced chemical kinetic mechanism for syngas combustion. Further refinement and validation of the reduced syngas mechanism with new experimental data is presented. The performance of the mechanism is also validated against simplified reactor models and high-order chemistry mechanisms. Finally, the reduced syngas mechanism is also compared to the previous DNS simulations flame vortex interactions that used more complex chemistry. Excellent agreement is obtained between the DNS simulations using both the reduced and complete chemistry mechanisms. Large eddy simulations (LES) of the combustor concepts are also performed using the Linear Eddy Model (LEM) for subgrid species transport and chemistry calculations. LES of syngas flames in the prototype concept are discussed in this report.
14
2 Experimental
2.2 Task 3 (Syngas Fuel Flame Characterization)
2.2.1 Apparatus
2.2.1.1 Laminar flame speed measurement
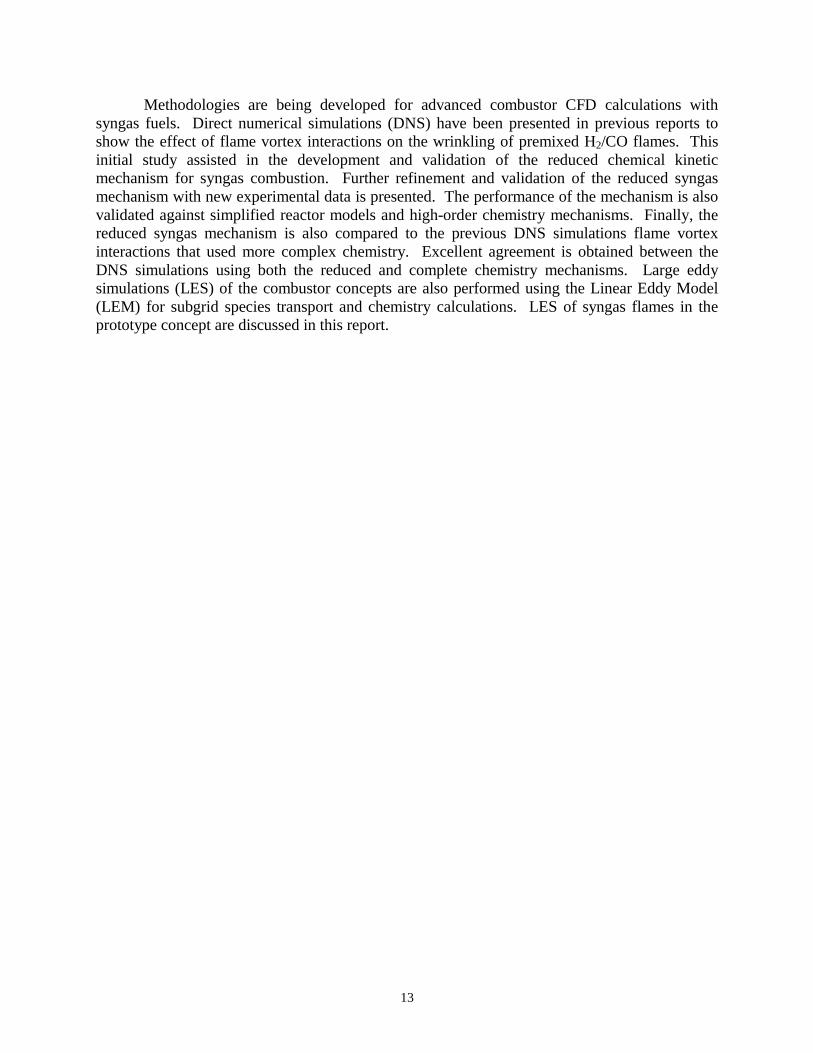
The schematic of the atmospheric pressure experiment for laminar flame speed (SL) measurement is shown in Figure 2.2-1. This Bunsen-type flame permits rapid determination of flame speed, or equivalently, measurement of flame speeds for a wide range of mixtures and conditions in a short time. The gas mixing arrangement shown allows simple control over the equivalence ratio (φ) with ± 1% accuracy on each flowrate. Various burners are employed; each is a straight cylindrical stainless steel tube, with inner diameters (D) ranging from 4.5 to 18 mm. The incoming flow is laminar, with exit Reynolds numbers, ReD, below 2000 and that the exit velocity profile is fully developed. The reactants are preheated by electrical resistance tape wrapped around the burner. Digital images of the flame emission are recorded by a 12-bit intensified CCD camera (576 × 384 pixels) and a 105 mm, f/4.5 UV camera lens.
Figure 2.2-1: Schematic of the experimental setup for laminar flame speed measurements.
2.2.1.2 Strained laminar flame measurement
Strained flame measurements at elevated pressure are being made with a stagnation flow
configuration. This configuration, like the more common opposed flow, allows for stretch corrected SL measurements of a one-dimensional flame. Furthermore, it is advantageous over the opposed flow arrangement for determining laminar flame speeds for the following reasons:
Air
Fuel mixture
flow meter
Mixing
Bypass
H2
CO
CO2
Pressure Gauge
Mixing
ICCD Cam era
Com puter
Premixed flame
Temperature controller
Heati ng tape
TC1
TC2
15
(1) the use of a solid wall leads to more stable flames (Egolfopoulus et al., 1997), (2) problems related to heating of the upper burner are eliminated, (3) since only one burner is used, fuel consumption is halved, and (4) ease of operation of a single jet especially at higher pressures.
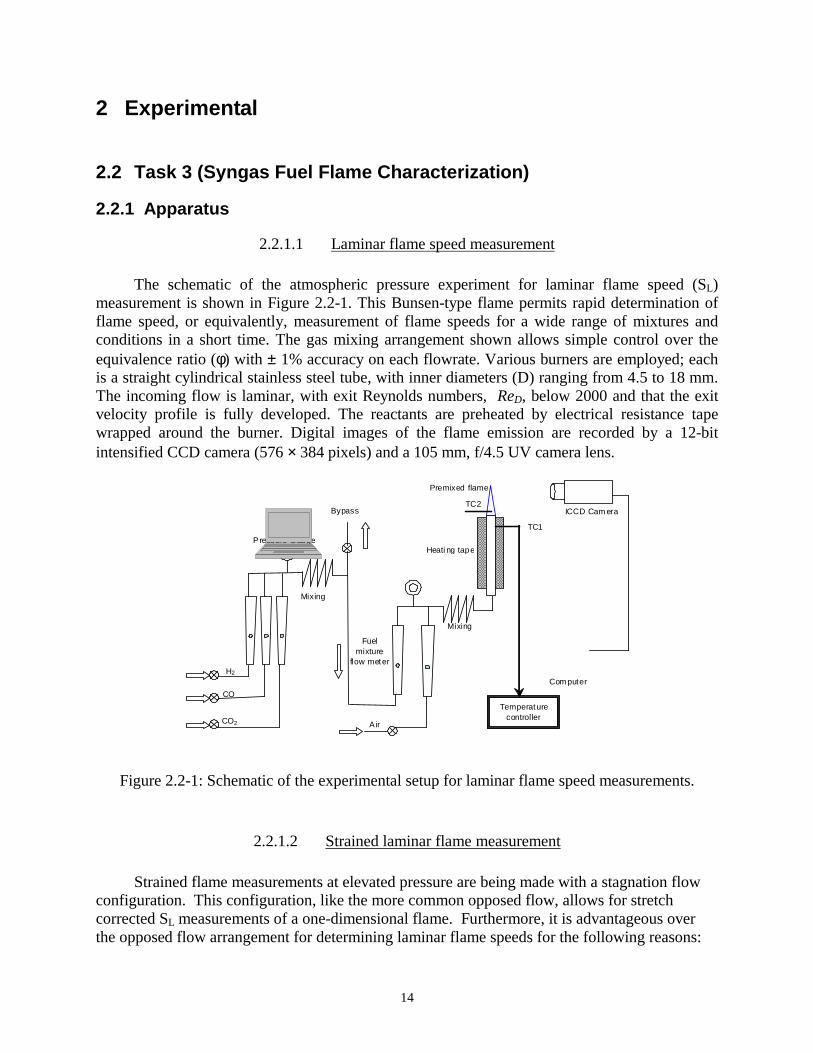
A general schematic of the stagnation flow burner is shown in Figure 2.2-2. Fuel (H2, CO and CO2 mixtures) and air flows are monitored with rotameters and the fuel/air mixture is premixed in the mixing section ahead of the burner in a manner like that of Figure 2.2-1. The burner is a smoothly contoured nozzle with the exit diameter of 0.5inch and the contraction ratio of 36. The purpose of having a contoured nozzle is to get a top hat velocity profile at the burner exit so that the flame stretch will be uniform throughout the flame area. Moreover, the high contraction ratio contoured nozzle ensures laminar flow even at high Reynolds number based on the burner exit diameter. Flow straighteners have been used before the contoured nozzle to remove any unsteadiness in the incoming flow. The contoured nozzle is surrounded by a N2 coflow. A small amount of N2 coflow is used to lift the flame edge and also to reduce shear layer development between the jet and the surrounding. Care has been taken to reduce the size of the wake region created due to the finite thickness of the contoured nozzle at the burner exit.
Figure 2.2-2: Schematic of high-pressure stagnation flame burner with N2 coflow.
To date, stainless steel plates and plugs have been used to produce the stagnation zone. The
flat plates are 1.5” diameter and 0.25” thick, while the plugs are produced from a stainless steel rod (1.5” diameter), with the end first formed into a hemisphere. Then the end is removed to produce a small flat region such a way that the diameter of the flat region is equal to that of the nozzle exit diameter (D). The distance (L) between the burner exit and the stagnation plate or plug can be adjusted depending on the burning velocity of the fuel mixture and the desired strain
16
rate. As the burning velocity increases, decreasing the distance between the burner exit and the stagnation plate or plug leads to a stable stagnation flame. For atmospheric pressure studies, a stagnation plate with an L/D ratio of 1 was used, and the strain rates are varied by varying the inlet velocity. For high pressure studies, it was not possible to get a stable flame with an L/D of 1, even for mixtures with low burning velocity. Instead plugs with L/D of 0.5 produce more stable flames. The L/D parameter can influence the measured burning velocity (~5%) at lower pressures (Egolfopoulus et al., 1997). Since the flame thickness decreases drastically with increasing pressure, it can be assumed that the effect of finite domain (decreasing L/D ratio) is negligible on the measured burning velocity at high pressure.
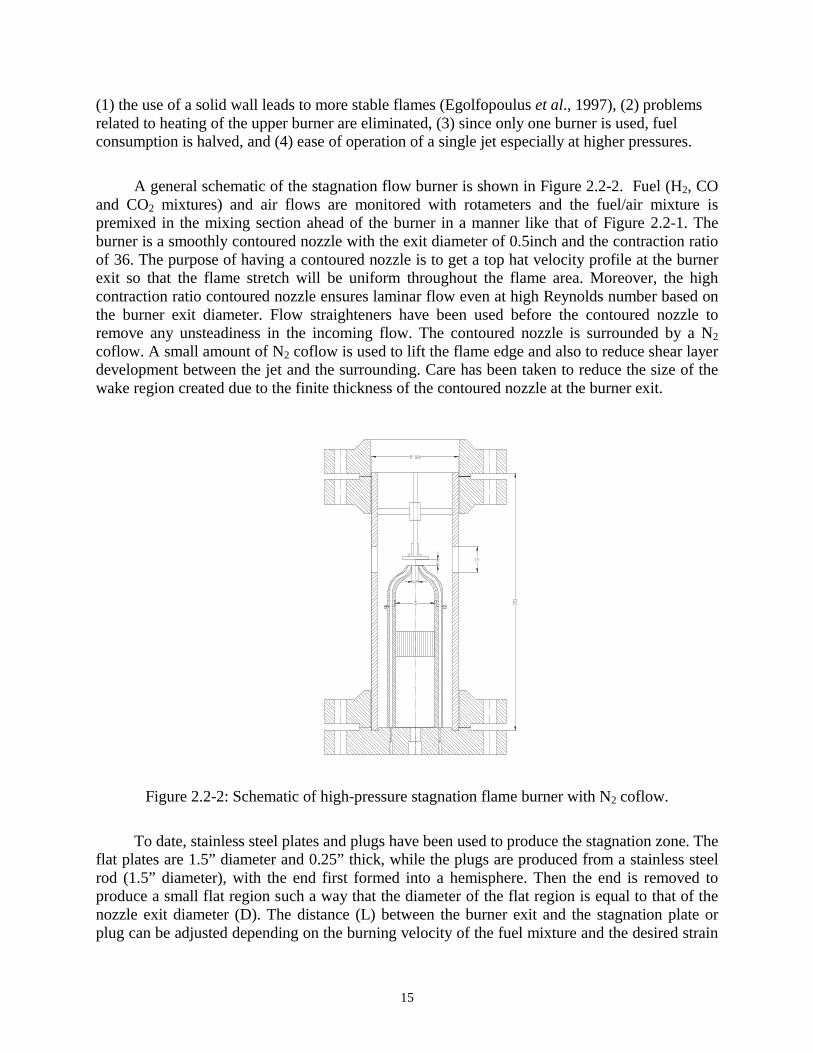
This entire system is placed in a N2 ventilated high pressure vessel Figure 2.2-1. The high-
pressure, cylindrical, stainless steel vessel is 6 inches in diameter and ~18 inches long and designed to withstand pressures of 30 atm and wall temperatures of ~600 °F. The interior walls of the pressure vessel are cooled with a nitrogen co-flow. The vessel is designed for optical access to allow application of laser Doppler velocimetry (LDV), Particle Image Velocimetry (PIV), flame imaging and chemiluminescence measurements. A retractable spark plug has been mounted in the pressure vessel wall for ignition.
Figure 2.2-3: Pressure vessel for housing the high-pressure flame experiments.
17
2.2.2 Experimental and operating data
2.2.2.1 Laminar flame speed measurements
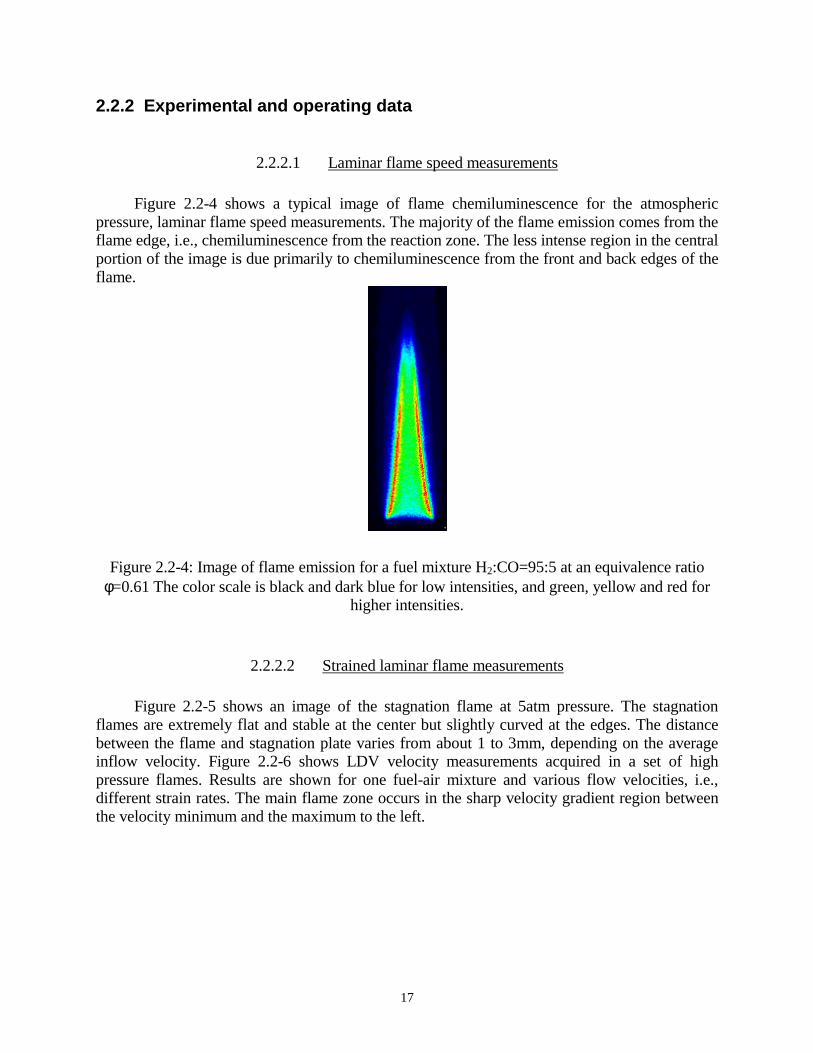
Figure 2.2-4 shows a typical image of flame chemiluminescence for the atmospheric pressure, laminar flame speed measurements. The majority of the flame emission comes from the flame edge, i.e., chemiluminescence from the reaction zone. The less intense region in the central portion of the image is due primarily to chemiluminescence from the front and back edges of the flame.
Figure 2.2-4: Image of flame emission for a fuel mixture H2:CO=95:5 at an equivalence ratio φ=0.61 The color scale is black and dark blue for low intensities, and green, yellow and red for
higher intensities.
2.2.2.2 Strained laminar flame measurements
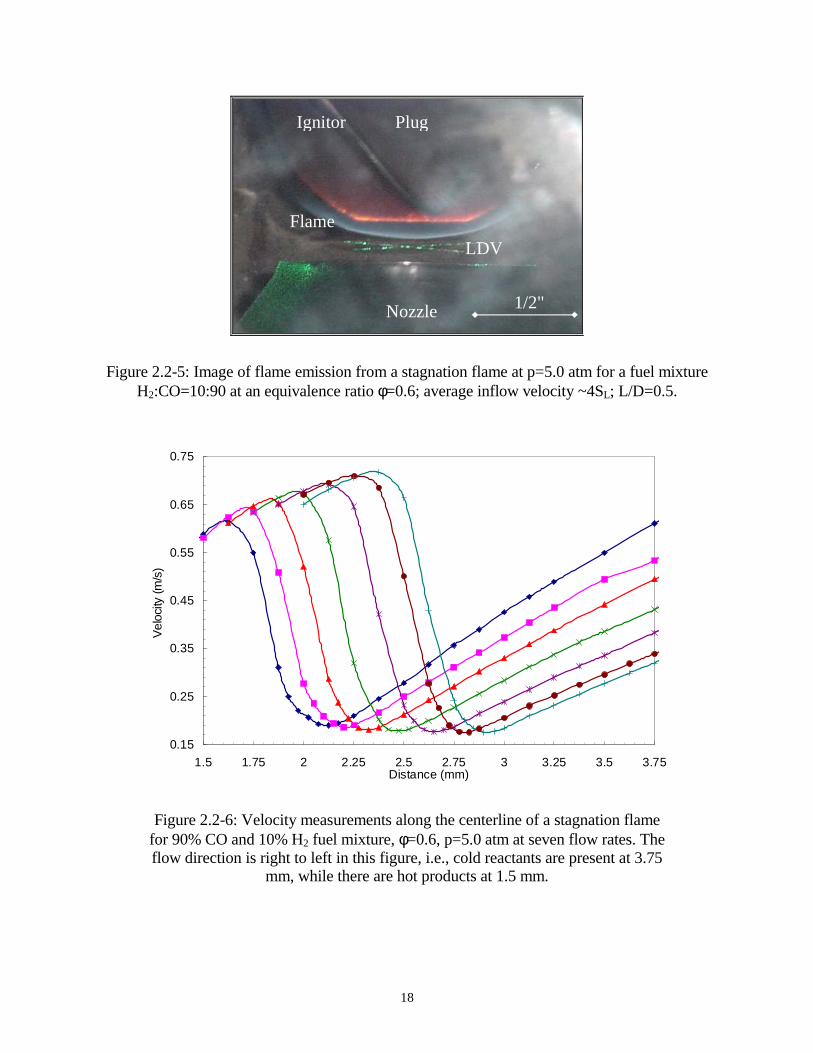
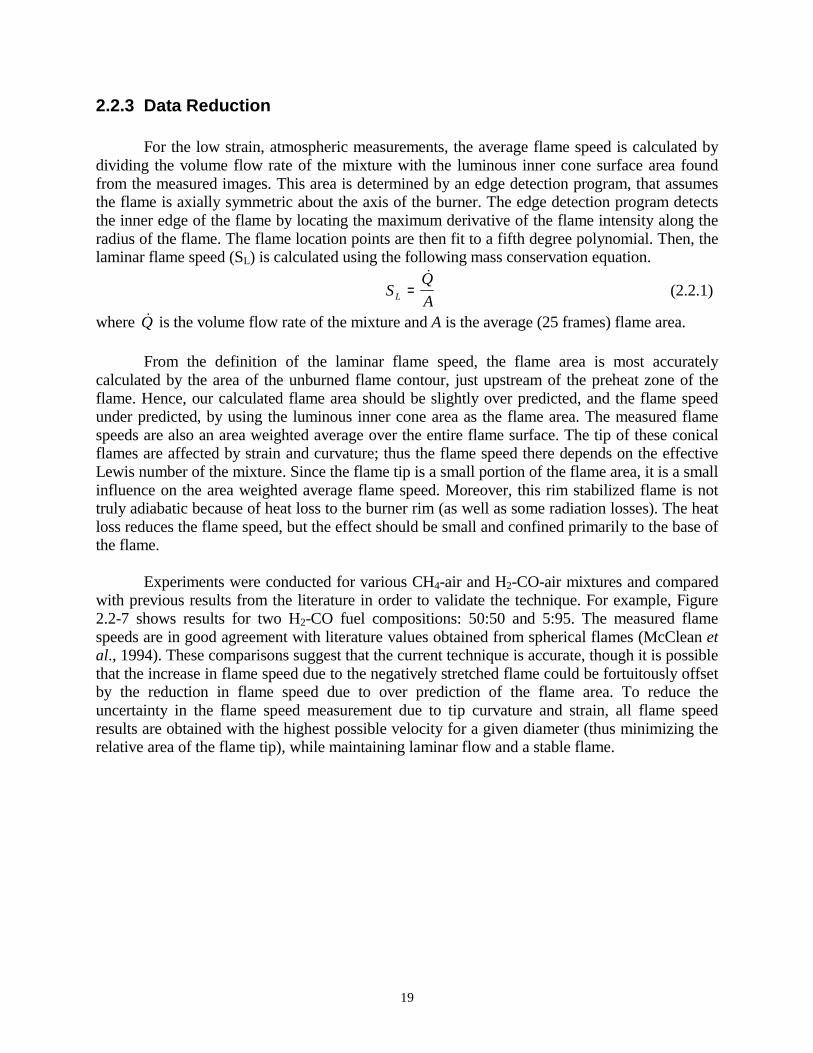
Figure 2.2-5 shows an image of the stagnation flame at 5atm pressure. The stagnation flames are extremely flat and stable at the center but slightly curved at the edges. The distance between the flame and stagnation plate varies from about 1 to 3mm, depending on the average inflow velocity. Figure 2.2-6 shows LDV velocity measurements acquired in a set of high pressure flames. Results are shown for one fuel-air mixture and various flow velocities, i.e., different strain rates. The main flame zone occurs in the sharp velocity gradient region between the velocity minimum and the maximum to the left.
18
Figure 2.2-5: Image of flame emission from a stagnation flame at p=5.0 atm for a fuel mixture H2:CO=10:90 at an equivalence ratio φ=0.6; average inflow velocity ~4SL; L/D=0.5.
Figure 2.2-6: Velocity measurements along the centerline of a stagnation flame
for 90% CO and 10% H2 fuel mixture, φ=0.6, p=5.0 atm at seven flow rates. The flow direction is right to left in this figure, i.e., cold reactants are present at 3.75
mm, while there are hot products at 1.5 mm.
Nozzle
Plug Ignitor
Flame
LDV
1/2"
0.15
0.25
0.35
0.45
0.55
0.65
0.75
1.5 1.75 2 2.25 2.5 2.75 3 3.25 3.5 3.75Distance (mm)
Vel
ocity
(m/s
)
19
2.2.3 Data Reduction
For the low strain, atmospheric measurements, the average flame speed is calculated by dividing the volume flow rate of the mixture with the luminous inner cone surface area found from the measured images. This area is determined by an edge detection program, that assumes the flame is axially symmetric about the axis of the burner. The edge detection program detects the inner edge of the flame by locating the maximum derivative of the flame intensity along the radius of the flame. The flame location points are then fit to a fifth degree polynomial. Then, the laminar flame speed (SL) is calculated using the following mass conservation equation.
SQ
AL =&
(2.2.1)
where &Q is the volume flow rate of the mixture and A is the average (25 frames) flame area. From the definition of the laminar flame speed, the flame area is most accurately
calculated by the area of the unburned flame contour, just upstream of the preheat zone of the flame. Hence, our calculated flame area should be slightly over predicted, and the flame speed under predicted, by using the luminous inner cone area as the flame area. The measured flame speeds are also an area weighted average over the entire flame surface. The tip of these conical flames are affected by strain and curvature; thus the flame speed there depends on the effective Lewis number of the mixture. Since the flame tip is a small portion of the flame area, it is a small influence on the area weighted average flame speed. Moreover, this rim stabilized flame is not truly adiabatic because of heat loss to the burner rim (as well as some radiation losses). The heat loss reduces the flame speed, but the effect should be small and confined primarily to the base of the flame.
Experiments were conducted for various CH4-air and H2-CO-air mixtures and compared
with previous results from the literature in order to validate the technique. For example, Figure 2.2-7 shows results for two H2-CO fuel compositions: 50:50 and 5:95. The measured flame speeds are in good agreement with literature values obtained from spherical flames (McClean et al., 1994). These comparisons suggest that the current technique is accurate, though it is possible that the increase in flame speed due to the negatively stretched flame could be fortuitously offset by the reduction in flame speed due to over prediction of the flame area. To reduce the uncertainty in the flame speed measurement due to tip curvature and strain, all flame speed results are obtained with the highest possible velocity for a given diameter (thus minimizing the relative area of the flame tip), while maintaining laminar flow and a stable flame.
20
Figure 2.2-7: Measured flame speeds for H2:CO 50:50 and 5:95 fuel compositions.
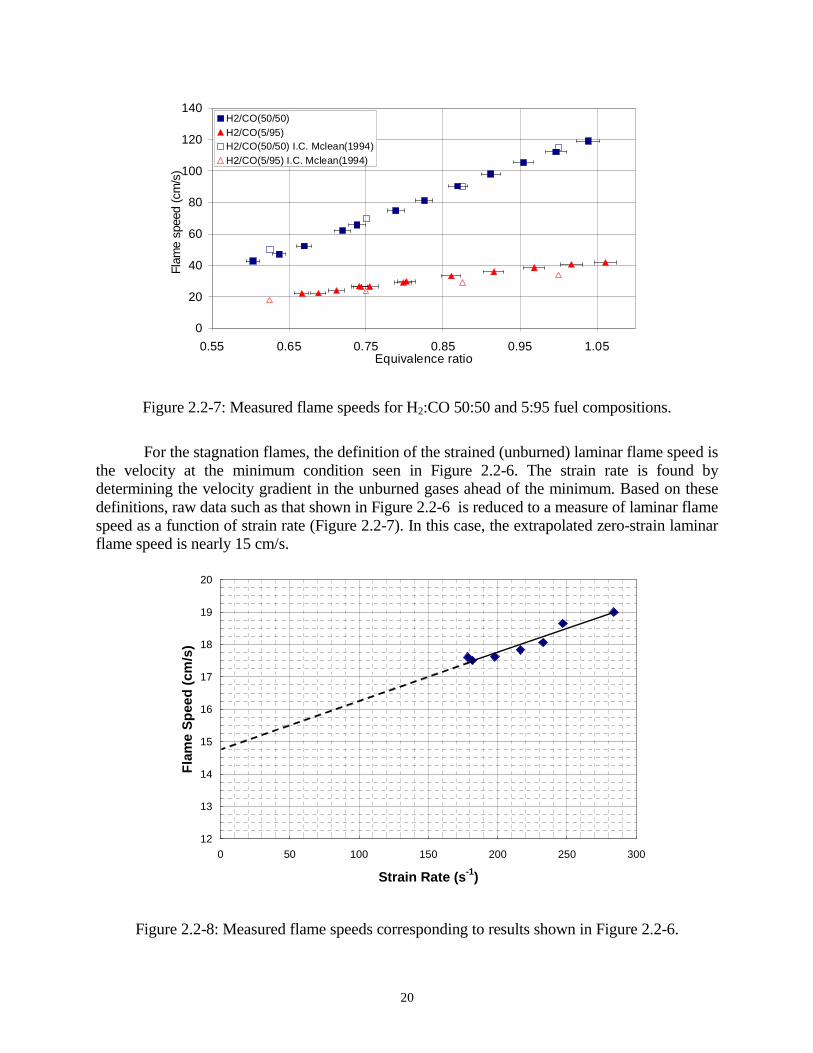
For the stagnation flames, the definition of the strained (unburned) laminar flame speed is
the velocity at the minimum condition seen in Figure 2.2-6. The strain rate is found by determining the velocity gradient in the unburned gases ahead of the minimum. Based on these definitions, raw data such as that shown in Figure 2.2-6 is reduced to a measure of laminar flame speed as a function of strain rate (Figure 2.2-7). In this case, the extrapolated zero-strain laminar flame speed is nearly 15 cm/s.
Figure 2.2-8: Measured flame speeds corresponding to results shown in Figure 2.2-6.
0
20
40
60
80
100
120
140
0.55 0.65 0.75 0.85 0.95 1.05Equivalence ratio
Flam
e sp
eed
(cm
/s)
H2/CO(50/50)H2/CO(5/95)H2/CO(50/50) I.C. Mclean(1994)H2/CO(5/95) I.C. Mclean(1994)
12
13
14
15
16
17
18
19
20
0 50 100 150 200 250 300
Strain Rate (s-1)
Fla
me
Sp
eed
(cm
/s)
21
2.3 Task 4 (Systems Modeling)
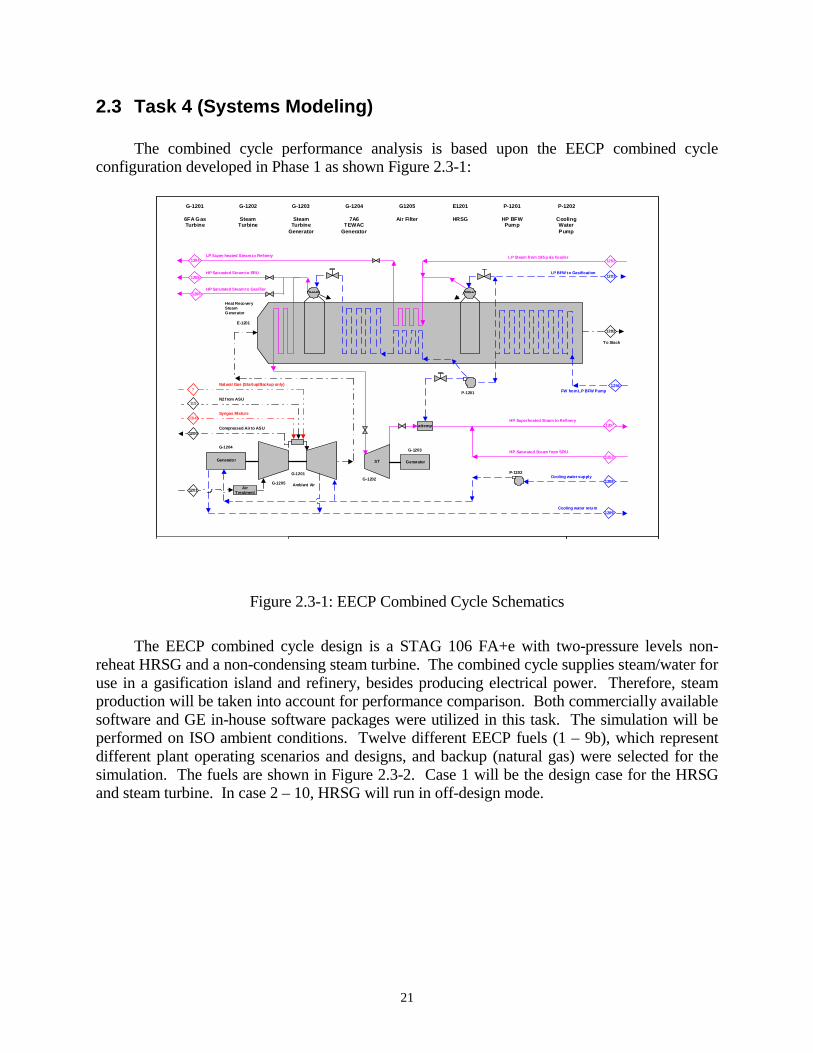
The combined cycle performance analysis is based upon the EECP combined cycle configuration developed in Phase 1 as shown Figure 2.3-1:
Figure 2.3-1: EECP Combined Cycle Schematics
The EECP combined cycle design is a STAG 106 FA+e with two-pressure levels non-
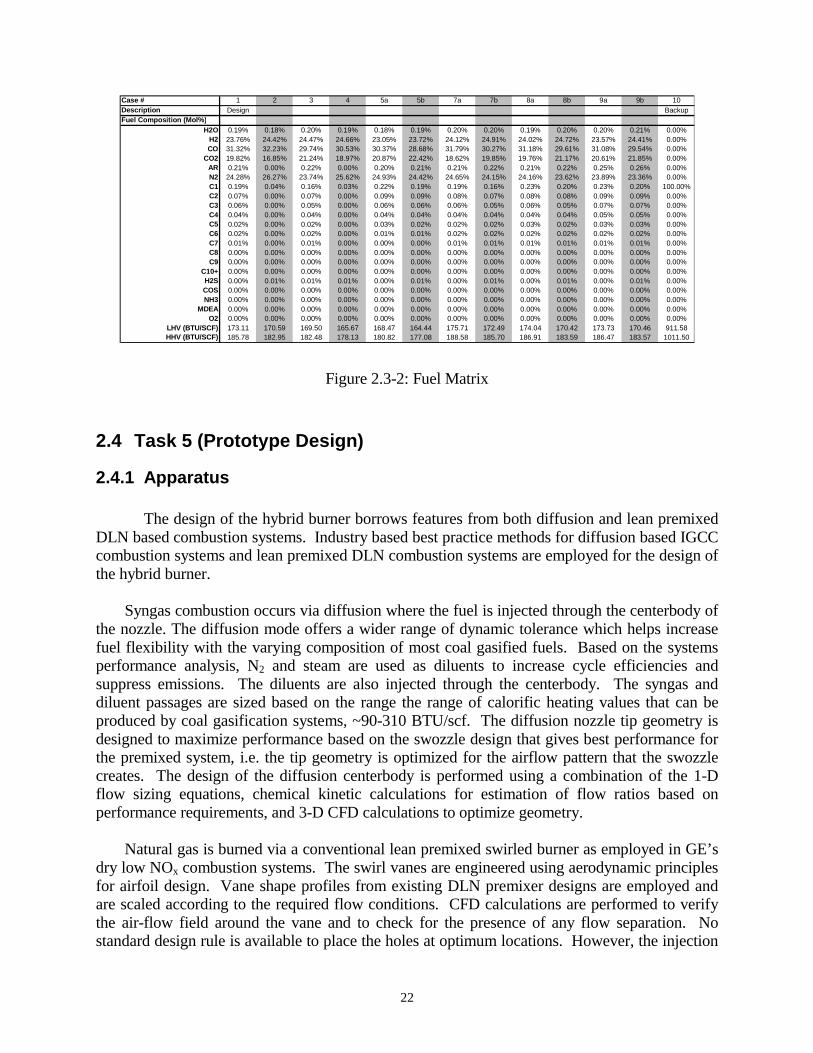
reheat HRSG and a non-condensing steam turbine. The combined cycle supplies steam/water for use in a gasification island and refinery, besides producing electrical power. Therefore, steam production will be taken into account for performance comparison. Both commercially available software and GE in-house software packages were utilized in this task. The simulation will be performed on ISO ambient conditions. Twelve different EECP fuels (1 – 9b), which represent different plant operating scenarios and designs, and backup (natural gas) were selected for the simulation. The fuels are shown in Figure 2.3-2. Case 1 will be the design case for the HRSG and steam turbine. In case 2 – 10, HRSG will run in off-design mode.
LEGEND
To Stack
Heat RecoverySteamGenerator
attemp
ST Generator
AirT reatment
N2 from ASU
G-1201
Generator
1200
10046
115
Syngas Mixture
Compressed Air to ASU
Ambient Air
1203
12521204
1205
1207
1254
1253
LP BFW to Gasificat ion
LP Super heated Steam to Refinery
HP Saturated Steam to SRU
1206HP Saturated Steam to Gasifier
LP Steam from 185 psia header
FW from LP BFW Pump
HP Superheated Steam to Refinery
HP Saturated Steam from SRU
G-1201
6FA GasTurbine
G-1202
SteamTurbine
G-1202
G-1203G-1204
G-1205
P-1201
E-1201
G-1203
SteamTurbine
Generator
G-1204
7A6TEWAC
Generator
G1205
Air Filter
E1201
HRSG
P-1201
HP BFWPump
Cooling water retu rn
Cooling water supplyP-1202
P-1202
CoolingWaterPump
?Natural Gas (Startup/Backup only)
1208
1209
1202
1201
22
Figure 2.3-2: Fuel Matrix
2.4 Task 5 (Prototype Design)
2.4.1 Apparatus
The design of the hybrid burner borrows features from both diffusion and lean premixed DLN based combustion systems. Industry based best practice methods for diffusion based IGCC combustion systems and lean premixed DLN combustion systems are employed for the design of the hybrid burner.
Syngas combustion occurs via diffusion where the fuel is injected through the centerbody of
the nozzle. The diffusion mode offers a wider range of dynamic tolerance which helps increase fuel flexibility with the varying composition of most coal gasified fuels. Based on the systems performance analysis, N2 and steam are used as diluents to increase cycle efficiencies and suppress emissions. The diluents are also injected through the centerbody. The syngas and diluent passages are sized based on the range the range of calorific heating values that can be produced by coal gasification systems, ~90-310 BTU/scf. The diffusion nozzle tip geometry is designed to maximize performance based on the swozzle design that gives best performance for the premixed system, i.e. the tip geometry is optimized for the airflow pattern that the swozzle creates. The design of the diffusion centerbody is performed using a combination of the 1-D flow sizing equations, chemical kinetic calculations for estimation of flow ratios based on performance requirements, and 3-D CFD calculations to optimize geometry.
Natural gas is burned via a conventional lean premixed swirled burner as employed in GE’s
dry low NOx combustion systems. The swirl vanes are engineered using aerodynamic principles for airfoil design. Vane shape profiles from existing DLN premixer designs are employed and are scaled according to the required flow conditions. CFD calculations are performed to verify the air-flow field around the vane and to check for the presence of any flow separation. No standard design rule is available to place the holes at optimum locations. However, the injection
Case # 1 2 3 4 5a 5b 7a 7b 8a 8b 9a 9b 10Description Design BackupFuel Composition (Mol%)
H2O 0.19% 0.18% 0.20% 0.19% 0.18% 0.19% 0.20% 0.20% 0.19% 0.20% 0.20% 0.21% 0.00%H2 23.76% 24.42% 24.47% 24.66% 23.05% 23.72% 24.12% 24.91% 24.02% 24.72% 23.57% 24.41% 0.00%CO 31.32% 32.23% 29.74% 30.53% 30.37% 28.68% 31.79% 30.27% 31.18% 29.61% 31.08% 29.54% 0.00%
CO2 19.82% 16.85% 21.24% 18.97% 20.87% 22.42% 18.62% 19.85% 19.76% 21.17% 20.61% 21.85% 0.00%AR 0.21% 0.00% 0.22% 0.00% 0.20% 0.21% 0.21% 0.22% 0.21% 0.22% 0.25% 0.26% 0.00%N2 24.28% 26.27% 23.74% 25.62% 24.93% 24.42% 24.65% 24.15% 24.16% 23.62% 23.89% 23.36% 0.00%C1 0.19% 0.04% 0.16% 0.03% 0.22% 0.19% 0.19% 0.16% 0.23% 0.20% 0.23% 0.20% 100.00%C2 0.07% 0.00% 0.07% 0.00% 0.09% 0.09% 0.08% 0.07% 0.08% 0.08% 0.09% 0.09% 0.00%C3 0.06% 0.00% 0.05% 0.00% 0.06% 0.06% 0.06% 0.05% 0.06% 0.05% 0.07% 0.07% 0.00%C4 0.04% 0.00% 0.04% 0.00% 0.04% 0.04% 0.04% 0.04% 0.04% 0.04% 0.05% 0.05% 0.00%C5 0.02% 0.00% 0.02% 0.00% 0.03% 0.02% 0.02% 0.02% 0.03% 0.02% 0.03% 0.03% 0.00%C6 0.02% 0.00% 0.02% 0.00% 0.01% 0.01% 0.02% 0.02% 0.02% 0.02% 0.02% 0.02% 0.00%C7 0.01% 0.00% 0.01% 0.00% 0.00% 0.00% 0.01% 0.01% 0.01% 0.01% 0.01% 0.01% 0.00%C8 0.00% 0.00% 0.00% 0.00% 0.00% 0.00% 0.00% 0.00% 0.00% 0.00% 0.00% 0.00% 0.00%C9 0.00% 0.00% 0.00% 0.00% 0.00% 0.00% 0.00% 0.00% 0.00% 0.00% 0.00% 0.00% 0.00%
C10+ 0.00% 0.00% 0.00% 0.00% 0.00% 0.00% 0.00% 0.00% 0.00% 0.00% 0.00% 0.00% 0.00%H2S 0.00% 0.01% 0.01% 0.01% 0.00% 0.01% 0.00% 0.01% 0.00% 0.01% 0.00% 0.01% 0.00%COS 0.00% 0.00% 0.00% 0.00% 0.00% 0.00% 0.00% 0.00% 0.00% 0.00% 0.00% 0.00% 0.00%NH3 0.00% 0.00% 0.00% 0.00% 0.00% 0.00% 0.00% 0.00% 0.00% 0.00% 0.00% 0.00% 0.00%
MDEA 0.00% 0.00% 0.00% 0.00% 0.00% 0.00% 0.00% 0.00% 0.00% 0.00% 0.00% 0.00% 0.00%O2 0.00% 0.00% 0.00% 0.00% 0.00% 0.00% 0.00% 0.00% 0.00% 0.00% 0.00% 0.00% 0.00%
LHV (BTU/SCF) 173.11 170.59 169.50 165.67 168.47 164.44 175.71 172.49 174.04 170.42 173.73 170.46 911.58HHV (BTU/SCF) 185.78 182.95 182.48 178.13 180.82 177.08 188.58 185.70 186.91 183.59 186.47 183.57 1011.50
23
strategy for the hybrid swozzle is used to maximize fuel jet penetration into each vane section, and thereby reducing emissions through increased mixing. The design of the hybrid swozzle is an iterative balance of maximizing jet momentum and penetration, fuel hole size, and hole placement. Proper injection hole sizing and placement are critical design parameters and are extremely difficult to quantitatively determine. The mixing strategy is therefore validated using CFD and iteratively optimized until the desired mixing is achieved.
The CFD calculations are performed using the commercially available Fluent software
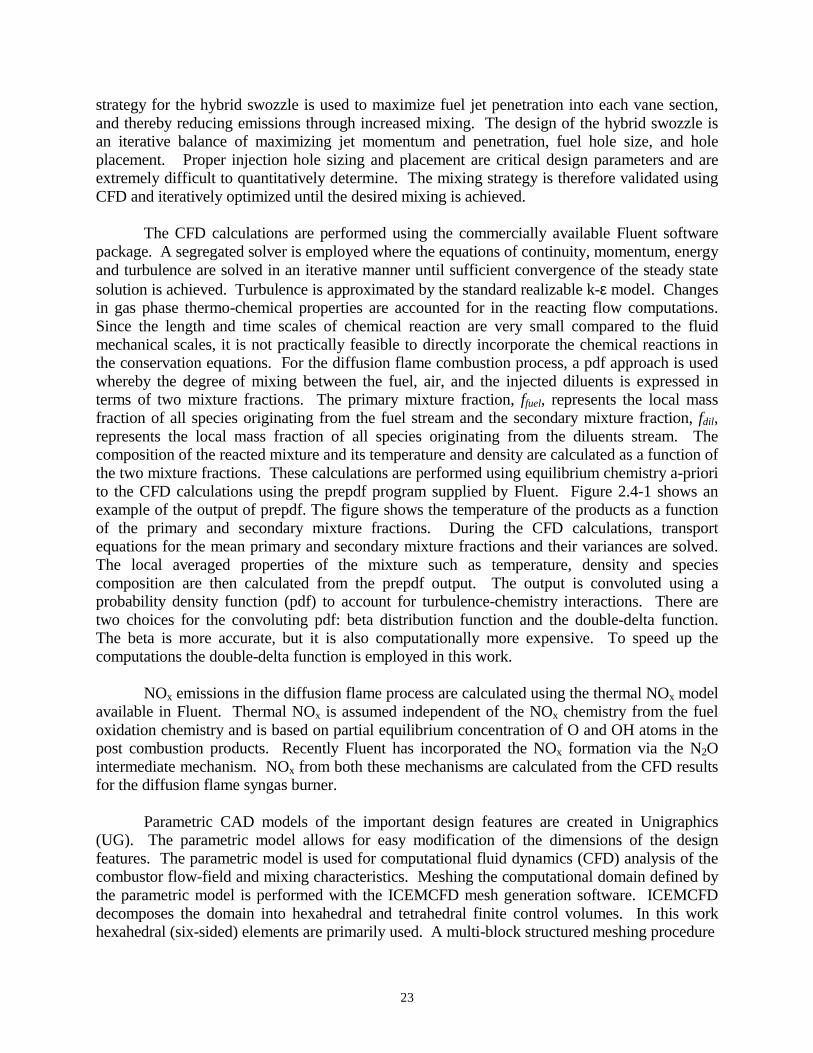
package. A segregated solver is employed where the equations of continuity, momentum, energy and turbulence are solved in an iterative manner until sufficient convergence of the steady state solution is achieved. Turbulence is approximated by the standard realizable k-ε model. Changes in gas phase thermo-chemical properties are accounted for in the reacting flow computations. Since the length and time scales of chemical reaction are very small compared to the fluid mechanical scales, it is not practically feasible to directly incorporate the chemical reactions in the conservation equations. For the diffusion flame combustion process, a pdf approach is used whereby the degree of mixing between the fuel, air, and the injected diluents is expressed in terms of two mixture fractions. The primary mixture fraction, ffuel, represents the local mass fraction of all species originating from the fuel stream and the secondary mixture fraction, fdil, represents the local mass fraction of all species originating from the diluents stream. The composition of the reacted mixture and its temperature and density are calculated as a function of the two mixture fractions. These calculations are performed using equilibrium chemistry a-priori to the CFD calculations using the prepdf program supplied by Fluent. Figure 2.4-1 shows an example of the output of prepdf. The figure shows the temperature of the products as a function of the primary and secondary mixture fractions. During the CFD calculations, transport equations for the mean primary and secondary mixture fractions and their variances are solved. The local averaged properties of the mixture such as temperature, density and species composition are then calculated from the prepdf output. The output is convoluted using a probability density function (pdf) to account for turbulence-chemistry interactions. There are two choices for the convoluting pdf: beta distribution function and the double-delta function. The beta is more accurate, but it is also computationally more expensive. To speed up the computations the double-delta function is employed in this work.
NOx emissions in the diffusion flame process are calculated using the thermal NOx model available in Fluent. Thermal NOx is assumed independent of the NOx chemistry from the fuel oxidation chemistry and is based on partial equilibrium concentration of O and OH atoms in the post combustion products. Recently Fluent has incorporated the NOx formation via the N2O intermediate mechanism. NOx from both these mechanisms are calculated from the CFD results for the diffusion flame syngas burner.
Parametric CAD models of the important design features are created in Unigraphics
(UG). The parametric model allows for easy modification of the dimensions of the design features. The parametric model is used for computational fluid dynamics (CFD) analysis of the combustor flow-field and mixing characteristics. Meshing the computational domain defined by the parametric model is performed with the ICEMCFD mesh generation software. ICEMCFD decomposes the domain into hexahedral and tetrahedral finite control volumes. In this work hexahedral (six-sided) elements are primarily used. A multi-block structured meshing procedure
24
Figure 2.4-1: Temperature as a function of mixture fractions
is used. The edges and faces of the blocks are associated to the appropriate curves and surfaces of the parametric CAD model. The hexahedral volume mesh is then created from the multiple blocks. Quadrilateral surface elements are defined so that boundary conditions can be assigned for the CFD analysis.
2.4.2 Experimental and operating data A hybrid burner was designed with three central circuits for low btu fuel and diluents.
The design also has a swirler for natural gas premixing. For syngas operation, no fuel is injected through the swirl vanes. The fuel and the diluents are brought in through the manifolds in the centerbody. The fuel and diluents are issued as jets via holes drilled at the tip of the centerbody. The diffusion nozzle circuitss are designed so that the combustion nozzle can be used with either O2-enhanced or with traditional air-gasification units, thus providing N2 and steam or only steam as the diluents, respectively. For this work, EECP fuel produced by an O2-enhanced gasifier is used for the design calculations. All passages are designed based on the range of calorific heating values that can be produced by coal gasification systems, ~90-310 BTU/scf which consists of all the fuels listed in the previous reports under Task 1 and 2 and for the diluent requirements to meet the emissions target.
The pressure drops across the fuel and diluent passages are optimized for the EECP fuels,
but the diffusion tip geometry is still flexible enough to operate over the entire range of syngas fuels without significant pumping/volumetric flow losses or dynamic effects. The flow requirements for sizing the air, fuel, and diluent holes are determined by calculating the air/fuel
25
and diluent/fuel mass ratios required to meet performance targets and then scaling the results of the systems performance analysis to 7FA+e GT system operating flow conditions. The volumetric and mass-flow ratios are determined from detailed chemical kinetic analysis, which has been described in previous reports and in Iyer et al., 2005.
Physical sizing limitations are imposed on the design such that the hybrid nozzle can be retrofitted into existing 7F-class and larger gas turbine combustion systems. The size of the centerbody is fixed based on the manifold sizes required to flow the syngas and diluents. The area of the annular passage between the centerbody and the burner tube is decided based on the flow rate of combustion air for one burner of a 7FA+e GT and the velocity specification in the burner tube for DLN combustion systems. The velocity is specified according to existing design practice for DLN combustors and it is chosen so that the premixed natural gas-air mixture does not flashback in the burner tube and the lean premixed flame does not blow-out during normal operating conditions for the premixed mode. The diameter of the burner tube is easily calculated from the annulus area. The combustion liner diameter is chosen so that the hot gas residence time and the ratio of the cross-section area of the liner to the cross-section area of the burner tube is approximately the same as in the full can of the 7FA+e GT. Note that we are designing a single burner of an array of burners in the actual machine.
The CFD optimization experiments are performed on a 1/16th sector model representing
one hole in each row of holes. The premixed passage is approximated by specifying axial and tangential velocity components to the air stream. Velocity components are specified according to the air swirl angle in the design of experiments. The inlet mass flow rates are specified for the air, syngas, and diluents inlets. The airflow is fixed according to the 7FA+e airflow for one burner. The fuel and diluents flow rates such that the desired combustor exit temperature and the 9 ppm NOx emissions target are achieved. The ratios of the flows are estimated from reactor network calculations. The molar composition of the fuel for the CFD calculations is 0.47% CH4, 23.05% H2, 30.37% CO, 21.05% CO2, and 25.13% N2. The LHV of the fuel is 168 btu/scf.
2.5 Task 6 (Advanced CFD tools)
2.5.1 Apparatus
2.5.1.1 Syngas Methodology for Advanced CFD tools
Accurate prediction of the scalar and velocity fields inside the combustion chamber of a practical gas turbine engine is a challenging task in that it requires the solution of a 3 dimensional, highly unsteady turbulent reactive flow. Even though there are reliable models for the flow (Pope, 2000) and chemistry (Pope, 1997 and Maas and Pope, 1992) alone, interaction of these processes with each other still remains as a task which needs to be studied further. In the first half of this year we employed direct numerical simulations (DNS) to study flame-turbulence interactions using relatively detailed reaction kinetics for syngas. These studies confirmed the integration of the models within our solver. However, for the full scale combustor, DNS is not feasible and therefore, we employ large-eddy simulation (LES) to study this flow.
26
Large Eddy Simulation (LES) methodology has been employed here as the computational
tool for reactive flows. In LES, scales larger than the grid size are computed directly and smaller scales are modeled (Menon and Calhoon, 1996 and Kim et al., 1999). Current efforts focus on the use of LES to predict flow inside gas turbine combustors. LES has been studied extensively for different combustion regimes in realistic (Sankaran and Menon, 2004, Pitsch, 2005 and Mahesh et al. 2000), and simplified geometries (Kempf et al., 2006), for which it is possible to get experimental data (Weigand et al., 2006, Meier et al., 2006 and Meyer et al., 2005) for validation purposes.
As oversimplified (e.g., single-step) global reaction models are not expected to be
reliable to predict the flame dynamics over a wide range of operating conditions, our work also involves evaluation of multi-step, but reduced kinetic mechanisms designed especially for CO-H2 combustion. In the previous (and current) period, a 10-step, 14-species mechanism was evaluated. In the current period, we have also tested a 5-step, 9-species mechanism and employed these mechanisms in an LES computation. The LES computation was performed on the combustor geometry that was provided by GE Global Research. All test conditions for the LES were chosen from the data provided by GE researchers. Results described in this report are still preliminary in some respects, since these simulations take time to complete and to obtain statistical stationary data for analysis. Nevertheless, some interesting observations can be made from the current data.
2.5.1.2 LES Mathematical Formulation The LES equations are obtained by using a top hat filtering operation of the Navier
Stokes equations and the following resultant equations for continuity, momentum, total energy and species conservation are obtained:
0~
=∂
∂+
∂∂
i
i
x
u
t
ρρ (2.5.1)
[ ] 0~~~
=+−+∂∂+
∂∂ sgs
ijijijjii
i puuxt
u ττδρρ (2.5.2)
[ ] 0~~)~
(~
=++−++∂∂+
∂∂ sgs
ijsgsijijii
i
HuqupExt
E στρρ (2.5.3)
msgsjm
sgsjm
j
mmjm
j
m
x
YDuY
xt
Y ωρρρρ ~~
~~~
&=
Θ+Φ+
∂∂
+∂∂+
∂∂
(2.5.4)
Here, ~ represents Favre averaging operator and is calculated for a given quantity f~
as ρρf , where the over bar stands for volume averaging. Filtering operation introduced new terms into the set of governing equations and they represent the effect of the scales smaller than the grid size, on the resolved variables. These terms are denoted with the sgs superscript and are,
27
the sub-grid shear stress tensor
−= jijisgsij uuuu ~~ρτ , sub-grid heat
flux [ ] [ ]iiiisgsi uppuuEEuH ~~~ −+−= ρ , sub-grid viscous stress jijjij
sgsi uu ττσ ~−= , sub-grid mass
flux [ ]jmjmsgsjm uYuY ~~−=Φ ρ , and sub-grid diffuse mass flux [ ]jmmjmm
sgsjm VYVY
~~−=Θ ρ , respectively.
Total energy is given as ( ) sgskk kuueE ++= ~~
21~~
and the filtered pressure is calculated by the
filtered equation of state by neglecting the effect of the sub-grid scale temperature as TRp~ρ= ,
where e~ is the filtered internal energy, sgsk the sub-grid scale kinetic energy and R gas constant.
2.5.1.3 LES Subgrid Closure Methods
Since the major effect of the small scales is to provide dissipation for the energy cascade from large scales through the inertial range, an eddy viscosity type sub-grid model appears to be suitable for the calculation of sub-grid stresses, heat flux and species flux. Based on this formulation spatial and temporal evolution of the sub-grid kinetic energy sgsk is required in order to evaluate the eddy viscosity coefficient and the unclosed sub-grid scale terms. For this purpose an additional transport equation for sgsk have been solved which is in the form of;
( )
∂∂
∂∂+−=
∂∂+
∂∂
i
sgs
t
t
i
sgssgssgsi
i
sgs
x
k
xDPku
xt
k
Pr~ υρρρ
(2.5.5)
Here, sgsP represents the production term and sgsD is the dissipation term, and are given
as;j
isgsij
sgs
x
uP
∂∂
−=~
τ and( )
∆=
32
sgssgs k
cD ρε , respectively. Based on these theoretical
assumptions, sub-grid scale terms are closed as;
ijsgs
ijkkijTsgs kSSij
δρδυρτ3
2
3
1~2 +
−−= (2.5.6)
it
Tsgs
x
HH
i ∂∂−=
~
Pr
υρ (2.5.7)
The sub-grid eddy viscosity is then obtained as ( ) ∆= 32
sgst kcυυ . Within this formulation
there appears two coefficients, εc υc , whose values are taken 0.067 and 0.916 as constants at present, even though a dynamic approach to evaluate these coefficients exist. We plan to switch to the dynamic approach at a latter stage when the solution is well established. LES governing equations as are solved using a finite-volume scheme that is nominally second-order accurate in space and time. A fourth-order accurate scheme is also available, which will be used for the final

28
set of simulation during data acquisition for statistical analysis. All simulations are conducted in parallel using MPI on Intel PC cluster.
3 Results and Discussion
3.2 Task 3 (Syngas Fuel Flame Characterization)
3.2.1 Atmospheric Pressure Laminar Flame Speed Measurements
One of the prime objectives of the present work is to measure the flame speed for the syngas (H2-CO) compositions with varying levels of CO2 dilution and preheating under lean conditions. This will allow validation or improvement of the models used to compute syngas flame properties. Numerous H2:CO compositions were examined, ranging from 5-95% H2 and CO, along with H2:CO mixtures with upto 20% CO2 dilution. Most of these results were presented in the last report. A new set of flames at similar conditions to the mixtures previously reported are re-measured for verification and comparison purposes. In addition, both the previous and new data for the atmospheric were compared to the two H2-CO mechanisms described above.
3.2.1.1 Method Comparison
In previous reports, results were presented for atmospheric-pressure flame speeds of a wide range of reactant compositions. Since those measurements were obtained in a Bunsen flame that is not truly one-dimensional, there was some question about the accuracy of the results. Therefore, one of the first things done during the current reporting period was to measure flame speeds in the 1-d stagnation burner at a few atmospheric-pressure conditions.
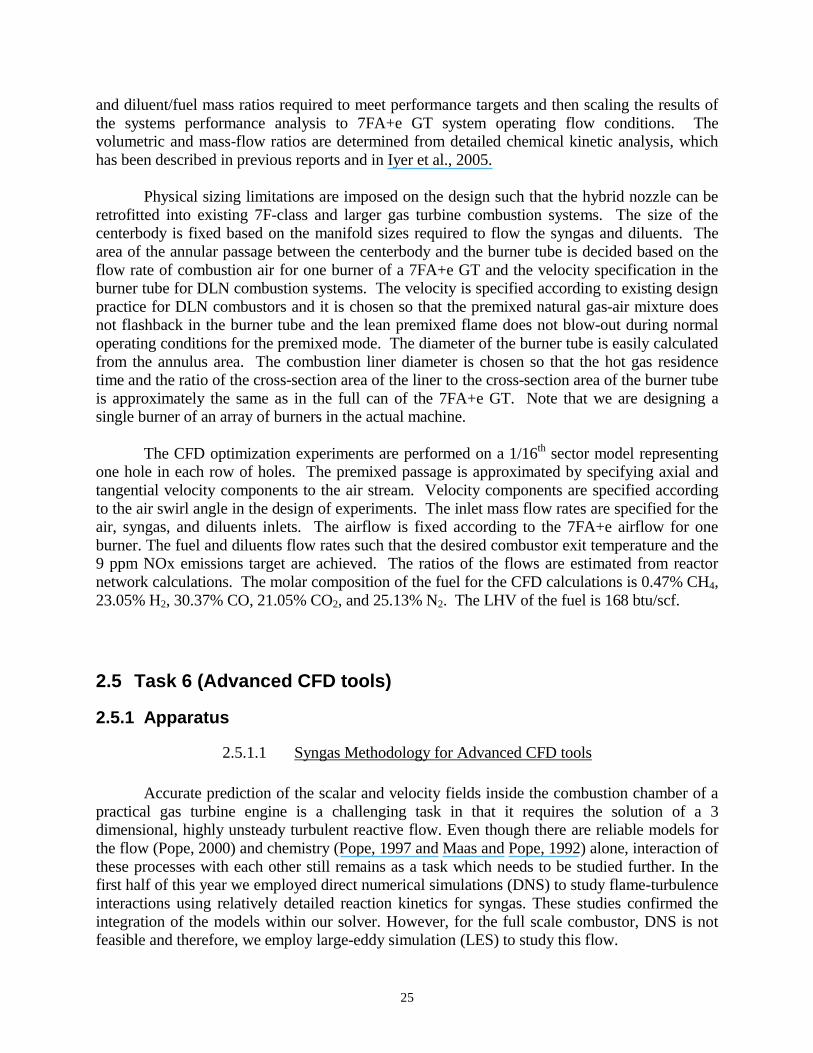
Figure 3.2-1 shows results for two reactant compositions: 1) a somewhat lean, high CO
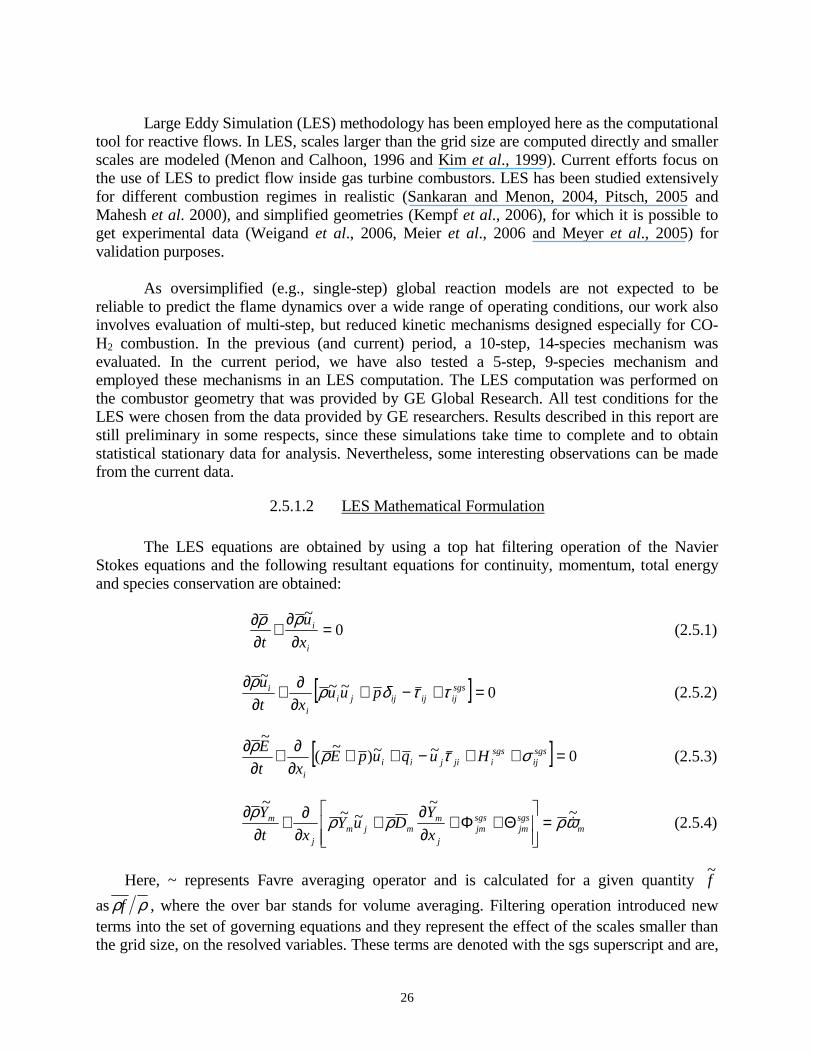
content mixture (5% H2 and 0.8 equivalence ratio) and 2) a very lean, high H2 content mixture (50% H2 and 0.6 equivalence ratio). The former mixture exhibits little strain dependence, while the ultralean, high H2 mixture has stronger strain dependence. Figure 3.2-2 shows a comparison of measured flame speeds for a typical diluted syngas mixture (H2:CO:CO2 = 40:40:20). Results are shown for the conical (Bunsen) and stagnation flame experiments. The agreement is well within the measurement uncertainty of the fuel reactant composition. Thus we conclude that the previously reported laminar flame speeds can be considered reliable.
29
Figure 3.2-1: Laminar premixed syngas burning velocities in a 1-d stagnation flame as a
function of strain rate for two reactant compositions.
25
50
75
100
0.55 0.65 0.75 0.85 0.95Equivalence ratio
Fla
me
spee
d (c
m/s
)
Conical flame
Stagnation flame
Figure 3.2-2: Laminar burning velocities as a function of equivalence ratio for premixed flame with a fuel composition of 50% CO and 50% H2, with 20% CO2
dilution by volume (H2:CO:CO2=40:40:20).
0.3
0.35
0.4
0.45
0.5
0 50 100 150 200 250 300 350
Strain rate (s-1)
Fla
me
Spe
ed (m
/s)
0.3
0.35
0.4
0.45
0.5
5:95 H2:COφ=0.8
50:50 H2:COφ=0.6
30
3.2.1.2 Model Comparisons Effect of Preheating
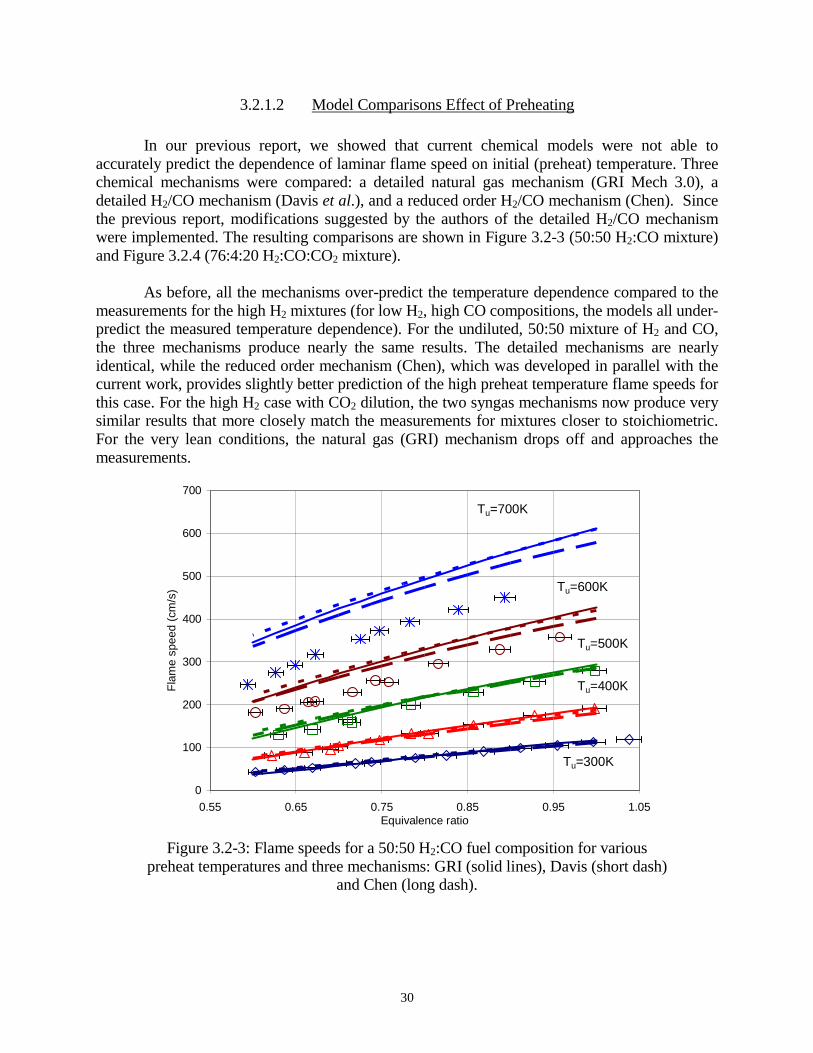
In our previous report, we showed that current chemical models were not able to accurately predict the dependence of laminar flame speed on initial (preheat) temperature. Three chemical mechanisms were compared: a detailed natural gas mechanism (GRI Mech 3.0), a detailed H2/CO mechanism (Davis et al.), and a reduced order H2/CO mechanism (Chen). Since the previous report, modifications suggested by the authors of the detailed H2/CO mechanism were implemented. The resulting comparisons are shown in Figure 3.2-3 (50:50 H2:CO mixture) and Figure 3.2.4 (76:4:20 H2:CO:CO2 mixture).
As before, all the mechanisms over-predict the temperature dependence compared to the
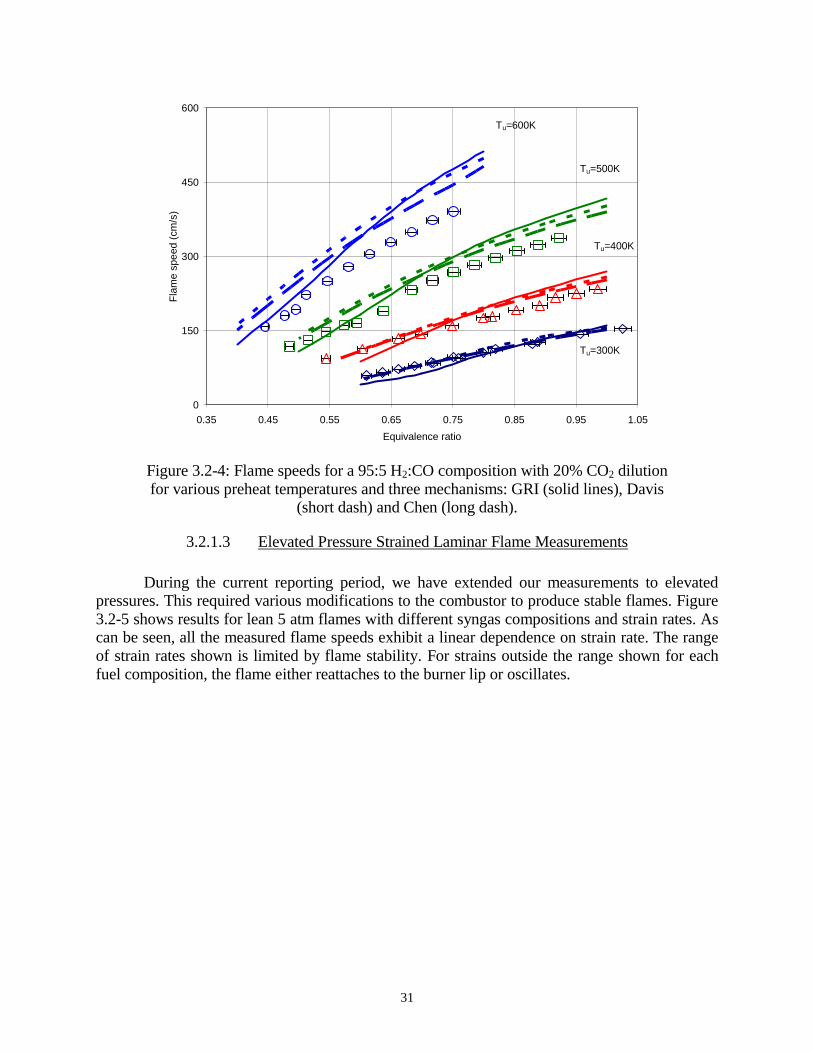
measurements for the high H2 mixtures (for low H2, high CO compositions, the models all under-predict the measured temperature dependence). For the undiluted, 50:50 mixture of H2 and CO, the three mechanisms produce nearly the same results. The detailed mechanisms are nearly identical, while the reduced order mechanism (Chen), which was developed in parallel with the current work, provides slightly better prediction of the high preheat temperature flame speeds for this case. For the high H2 case with CO2 dilution, the two syngas mechanisms now produce very similar results that more closely match the measurements for mixtures closer to stoichiometric. For the very lean conditions, the natural gas (GRI) mechanism drops off and approaches the measurements.
0
100
200
300
400
500
600
700
0.55 0.65 0.75 0.85 0.95 1.05Equivalence ratio
Fla
me
spee
d (c
m/s
)
Tu=700K
Tu=600K
Tu=500K
Tu=400K
Tu=300K
Figure 3.2-3: Flame speeds for a 50:50 H2:CO fuel composition for various preheat temperatures and three mechanisms: GRI (solid lines), Davis (short dash)
and Chen (long dash).
31
0
150
300
450
600
0.35 0.45 0.55 0.65 0.75 0.85 0.95 1.05
Equivalence ratio
Fla
me
spee
d (c
m/s
)
Tu=400K
Tu=300K
Tu=500K
Tu=600K
Figure 3.2-4: Flame speeds for a 95:5 H2:CO composition with 20% CO2 dilution for various preheat temperatures and three mechanisms: GRI (solid lines), Davis
(short dash) and Chen (long dash).
3.2.1.3 Elevated Pressure Strained Laminar Flame Measurements
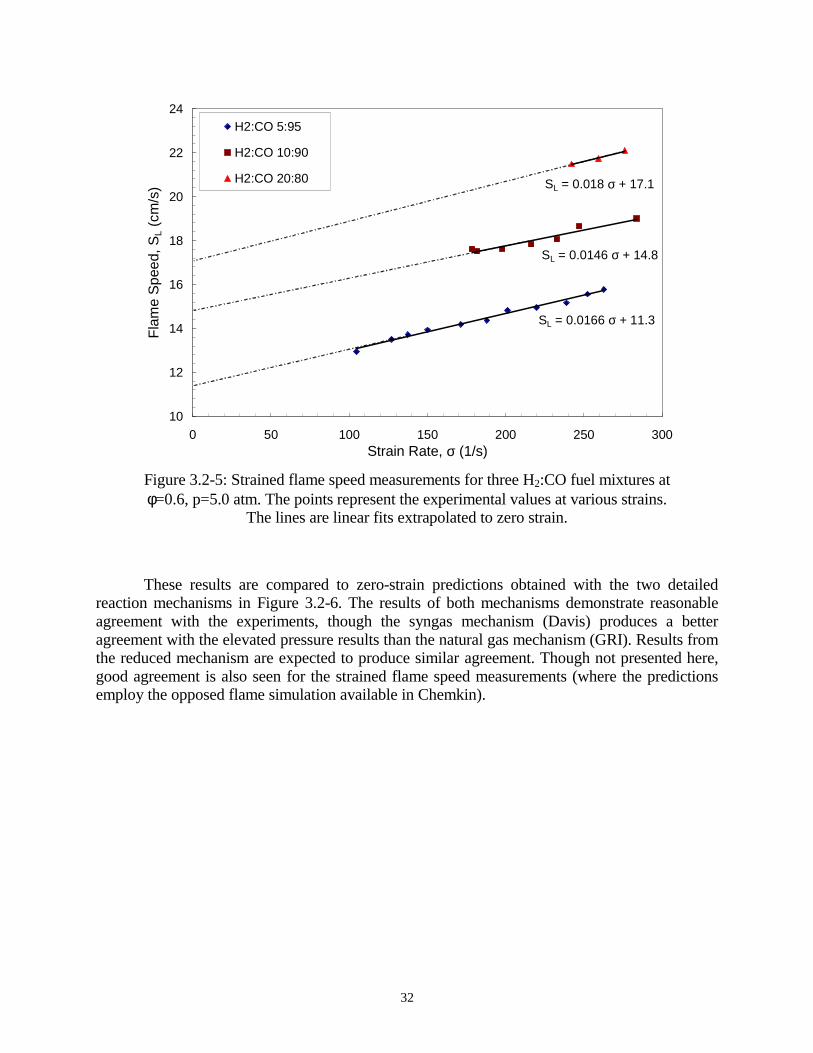
During the current reporting period, we have extended our measurements to elevated pressures. This required various modifications to the combustor to produce stable flames. Figure 3.2-5 shows results for lean 5 atm flames with different syngas compositions and strain rates. As can be seen, all the measured flame speeds exhibit a linear dependence on strain rate. The range of strain rates shown is limited by flame stability. For strains outside the range shown for each fuel composition, the flame either reattaches to the burner lip or oscillates.
32
SL = 0.0146 σ + 14.8
SL = 0.0166 σ + 11.3
SL = 0.018 σ + 17.1
10
12
14
16
18
20
22
24
0 50 100 150 200 250 300Strain Rate, σ (1/s)
Fla
me
Spe
ed, S
L (c
m/s
)
H2:CO 5:95
H2:CO 10:90
H2:CO 20:80
Figure 3.2-5: Strained flame speed measurements for three H2:CO fuel mixtures at φ=0.6, p=5.0 atm. The points represent the experimental values at various strains.
The lines are linear fits extrapolated to zero strain.
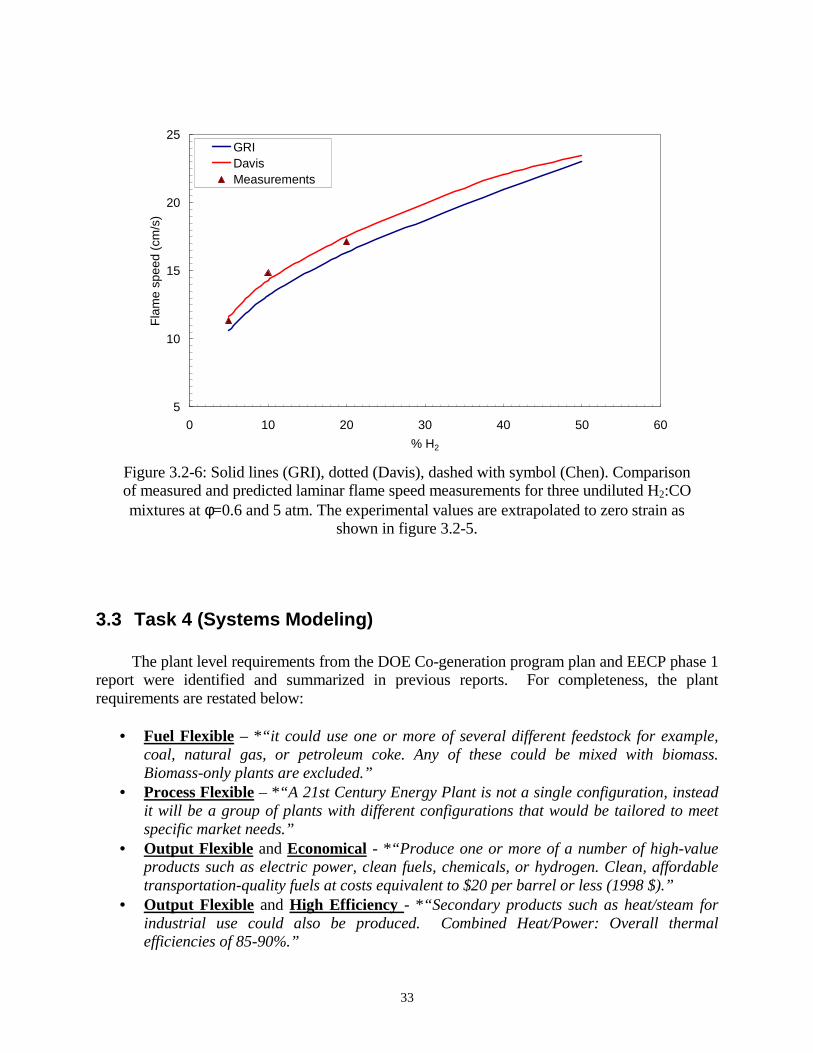
These results are compared to zero-strain predictions obtained with the two detailed reaction mechanisms in Figure 3.2-6. The results of both mechanisms demonstrate reasonable agreement with the experiments, though the syngas mechanism (Davis) produces a better agreement with the elevated pressure results than the natural gas mechanism (GRI). Results from the reduced mechanism are expected to produce similar agreement. Though not presented here, good agreement is also seen for the strained flame speed measurements (where the predictions employ the opposed flame simulation available in Chemkin).
33
5
10
15
20
25
0 10 20 30 40 50 60
% H2
Fla
me
spee
d (c
m/s
)GRIDavisMeasurements
Figure 3.2-6: Solid lines (GRI), dotted (Davis), dashed with symbol (Chen). Comparison of measured and predicted laminar flame speed measurements for three undiluted H2:CO mixtures at φ=0.6 and 5 atm. The experimental values are extrapolated to zero strain as
shown in figure 3.2-5.
3.3 Task 4 (Systems Modeling) The plant level requirements from the DOE Co-generation program plan and EECP phase 1
report were identified and summarized in previous reports. For completeness, the plant requirements are restated below:
• Fuel Flexible – *“it could use one or more of several different feedstock for example,
coal, natural gas, or petroleum coke. Any of these could be mixed with biomass. Biomass-only plants are excluded.”
• Process Flexible – *“A 21st Century Energy Plant is not a single configuration, instead it will be a group of plants with different configurations that would be tailored to meet specific market needs.”
• Output Flexible and Economical - *“Produce one or more of a number of high-value products such as electric power, clean fuels, chemicals, or hydrogen. Clean, affordable transportation-quality fuels at costs equivalent to $20 per barrel or less (1998 $).”
• Output Flexible and High Efficiency - *“Secondary products such as heat/steam for industrial use could also be produced. Combined Heat/Power: Overall thermal efficiencies of 85-90%.”
34
• Low Air Polluant Emissions – *“Eliminating environmental issues associated with the utilization of fossil fuels – Emissions of air pollutants such as sulfur dioxide, nitrogen oxides, and mercury would be reduced to essentially zero levels.”
• High Efficiency, Process Flexible and Fuel Flexible - *“Emissions of carbon dioxide, a greenhouse gas, would be dramatically reduced because of the higher efficiency. The plant design would also include the option for capturing and sequestering carbon dioxide. Carbon dioxide emissions reduced by 40-50% by efficiency improvements; reduced to zero [net] if coupled with carbon sequestration.”
• High Efficiency - *“The plants would be designed to use as much of the energy in the fuel as possible. Power Generating efficiencies greater than 60% using coal and greater than 75% using natural gas.”
• Economical - “Costs of electricity competitive with market clearing prices at the time of deployment.” * Quotes from DOE Co-generation Program Plan.
The critical combustor level requirements are established as the following:
• Fuel Flexible – exceed current +/- 10% Wobbie Index variation without hardware modification.
• Co-Firing capability – capable of operation on syngas and NG simultaneously over a wide range of load.
• Low NOx emission – less than 9 ppmvd @ 15% O2, comparable to standard DLN combustor.
• Diluent reduction – uses less diluent than diffusion type combustor for NOx abatement. • Air extraction capability – supply air to ASU. • Hardware life – exceed 24000 hrs, which is same as standard DLN combustor.
A Quality Flow Down analysis was performed to rank the importance of the combustor level requirements and there effects on critical plant performance. The importance of the combustor requirements are indicated by the order in which they are listed. The methodology and results for this analysis have been presented in previous reports.
Results of the EECP fuels diffusion and premixed combustor cases hybrid nozzle and
TVC concepts are summarized and presented in previous reports. The project objectives of Task 4 were completed in the previous reporting period. In these validation runs, the EECP diffusion combustor cases included steam and nitrogen as diluents. The important finding in this plant analysis is that the 9 ppm NOx requirement is only is satisfied by using both steam and nitrogen as diluents. Results for the premixed natural gas DLN and premixed natural gas and EECP Trapped Vortex Combustor (TVC) systems are the same as shown in previous reports. These systems do not include diluent augmentation as none is required to meet the NOx emissions limit. The co-generation efficiency for a TVC system is lower than that for the diffusion combustor, due to the additional steam injection in the diffusion combustor. However, the advantage of the TVC system is that NOx emissions are lower even without diluent injection (for natural gas and EECP fuels).
35
For this report, additional diffusion and TVC combustor system analysis are performed to verify the previous analysis and for use in optimizing the performance of the prototype designs. The outputs of the performance analysis are used to estimate the optimal combustor operating conditions. Additionally, the analysis helps establish the appropriate full-scale scaling requirements for the design of both combustion systems.
3.4 Task 5 (Prototype Design)
3.4.1 Hybrid Diffusion Nozzle In previous reports (EPACTS protected sections), preliminary CFD calculations have
been performed to investigate mixing and the flow-field phenomenon. The results show a flowfield comprised of recirculation zones due to the swirling air and fuel flows. Mixing of the fuel, air, and diluent streams are studied by looking at the diluents/fuel/air mass ratio distributions along different cross-sections at downstream axial locations in the combustor. The generated iso-surfaces of stoichiometric fuel-air distribution represent the flame zone. The shape and the length of the flame zone provide us with information of the rate of mixing between the fuel and the air streams. The calculations showed drastically different flame shapes implying a strong correlation of the diffusion flame zone to the geometric parameters being studied. The changes in the flame shape also influence the exit temperature profile and the thermal NOx emissions at the combustor exit.
Drawing from these previous investigations, a design of experiments was conducted as
described in section 2.4.2. The influencing geometry variables were examined, resulting in an 8 experiment DOE to examine the combustion characteristics of the hybrid nozzle design. CFD calculations of the combustor flowfield are performed for the eight different combinations of geometric parameters for the hybrid burner operated on syngas. Geometric parameters include the orientation of the fuel and the diluents jets in terms of swirl and radial angles. The degree of swirl in the air stream is also included as a parameter. The response of the hybrid nozzle combustion characteristics for each of the 8 geometry sets are estimated and used to generate perturbation plots for each of the geometry variables. The final combustor geometry is selected by analyzing the perturbation plots to obtain the optimized variable settings that meet the critical combustor design criteria. The final configuration is selected based on an optimum compromise between the requirements for lower NOx, flame length, pattern factor, and gas temperature impinging on the diffusion tip. The optimized design of the diffusion tip geometry is then validated using CFD.
3.4.1.1 Flame Shape and Exit Profile Analysis of the three dimensional flame surfaces defined by the fuel/air stoichiometric contour as functions of static temperature for the 8 geometry cases show significant differences in the flame structure. The flame shape and flame length depend on the orientation of the fuel and diluents jets and the swirl imparted on the combustion are by the swozzle assembly. An
36
optimized flame shape and length determine the combustor exit temperature distribution which is critical for combustor performance in terms of hardware life, emissions levels, combustion efficiency, and pattern factor (hot-gas uniformity) for entry of the hot gas into the turbine. A pareto/perturbation analysis was used to determine the geometry parameters that most effectively influence flame length and shape. In the pareto/perturbation analysis, the results of the design variables are analyzed as a function of their minimum and maximum values in DOE to investigate their corresponding effects on flame structure. The angles of the syngas and diluent jets are significant parameters affecting the flame length. These effects are expected since increasing or decreasing the angles of the jets helps the fuel/diluents mix slower or faster with the combustion air. The diluent splits and the air swirl angle are also other significant parameters that affect the flame length. A uniform pattern factor, or exit plane temperature profile, is desirable to reduce the heat load on the turbine. From the analysis, the angles of the syngas jet have a large impact on pattern factor. This is because the syngas jet angles also significantly affects the flame length. Under ideal cases the flame should be as short as possible to allow for more post-combustion mixing of the hot gases to create a more uniform temperature distribution. Air swirl angles also affect the pattern factor. In general, the geometry influence on pattern factor is similar to the responses for flame shape and length. The geometry that produces a smaller flame length generates a lower pattern factor. Typically these are the observed trends for diffusion flame combustion in gas turbine systems since the process is mixing rate limited, i.e. the mixing length determines the flame characteristics.
3.4.1.2 Temperature Profiles The swirling flow induces a flow recirculation in the dump zone of the combustor. The recirculating gas is comprised of the hot gas combustion products. The hot gases impinge on the diffusion tip, which can impose large thermal loads and potentially lead to failure of the diffusion tip. Therefore it is necessary to minimize the temperature of the recirculating gases. Axial temperature distribution plots of the CFD results were examined. The figures show the presence of a central recirculation zone and hot gases impinging on the diffusion tip. Temperature at the diffusion tip varied as a function of the geometry with longer flame length geometry resulting in lower tip temperatures, but greater pattern factors (as indicated by the flame shape analysis). Thus in terms of obtaining lower recirculation zone temperatures for lower tip temperature and increased hardware reliability, the optimal tip configuration conflicts with the optimal design settings for shorter flame lengths and pattern factor. It appears that variables that lead to shorter flame lengths and lower pattern factors tend to increase the gas temperatures impinging on the diffusion tip.
3.4.1.3 Emissions
Profiles of thermal NOx, which is the pathway for NOx formation since diffusion flames burn at stoichiometric conditions, at the exit plane of the diffusion combustor system indicate a maximum at the centerline and decrease radially outward. This trend is expected as thermal NOx
37
is a strong function of temperature and the pattern factor at the exit plane. This is also indicated in the 8 geometry cases tested, since the shortest flame lengths and correspondingly lowest pattern factors produced the lowest thermal NOx and the longest flame lengths and highest pattern factors produced the highest NOx levels. Cross-sectional mass averaged emissions profiles along the axial length of the combustion chamber are used to provide insight into the history of NOx formation. For the short flame length cases the averaged NOx levels increase with axial distance upto the corresponding axial location of peak flame temperature and then reach either a steady state level based on the hot-product gas temperature or slightly lower level as the hot-products cool downstream near the combustor exit plane. The geometries that result in longer flame lengths produce NOx at a linear rate as a function of axial distance, all the way upto the axial location of peak flame temperature and even to the combustor exit plane. These results are consistent with thermal NOx theory and experimental observations, which state that flames with higher peak flame temperatures tend to produce more NOx since the thermal NOx pathway depends on the maximum temperatures and the corresponding flow residence times. Thus for the diffusion combustor the NOx emissions are directly related to flame length and pattern factor, with flames of shorter length and lower pattern factor being more desirable. However, these factors lead to higher temperatures at the diffusion tip and pose hardware life risks due to the high thermal loads. The temperature history, and therefore NOx formation, in the combustion chamber is a function of the mixing between the fuel, air and diluents streams. Faster mixing leads to faster decrease of the maximum temperatures in the combustion chamber. The mixing in the diffusion nozzle design is investigated by examining the maximum fuel mixture fraction as a function of the axial distance in the combustion chamber. The fuel mixture fraction is the mass fraction of all species originating from the fuel stream. Maximum fuel mixture fraction is 1 at axial distance of zero, which is close to the point of fuel injection. The mixture fraction decreases as the fuel stream mixes with the combustion air and the diluents streams. The geometries with shorter flames show rapid decreases in mixture fraction immediately downstream of the injection tip. This implies a very short axial extent of the flame and hence faster combustion, which reduces the residence times for NOx formation. Correspondingly, the longer flame length geometries show the slowest fuel/air mixing rate. The mixing between the diluents and the fuel and air streams is another important parameter the effects NOx formation. In a similar manner, mixing rate effects on NOx formation are examined by comparing the minimum ratios of the mass of the diluents to the fuel stream as a function axial distance. Results indicate that fast diluent-fuel mixing is critical to mitigate NOx formation. This is the desired and expected trend based off of diluent augmentation theory. Faster diluent mixing lowers the peak flame temperature and thus lowers emissions. For the 8 cases studied, the maximum temperatures and thermal NOx characteristics depend on the combination of the mixing between the fuel and air streams and the diluents and fuel streams. Note: the shortest flame length did not always produce the most rapid diluent-fuel mixing. In short, NOx formation is a direct function of the temperature history in the combustor, which is determined by the fuel, air, and diluent mixing rates. These rates are controlled by the diffusion tip geometry.
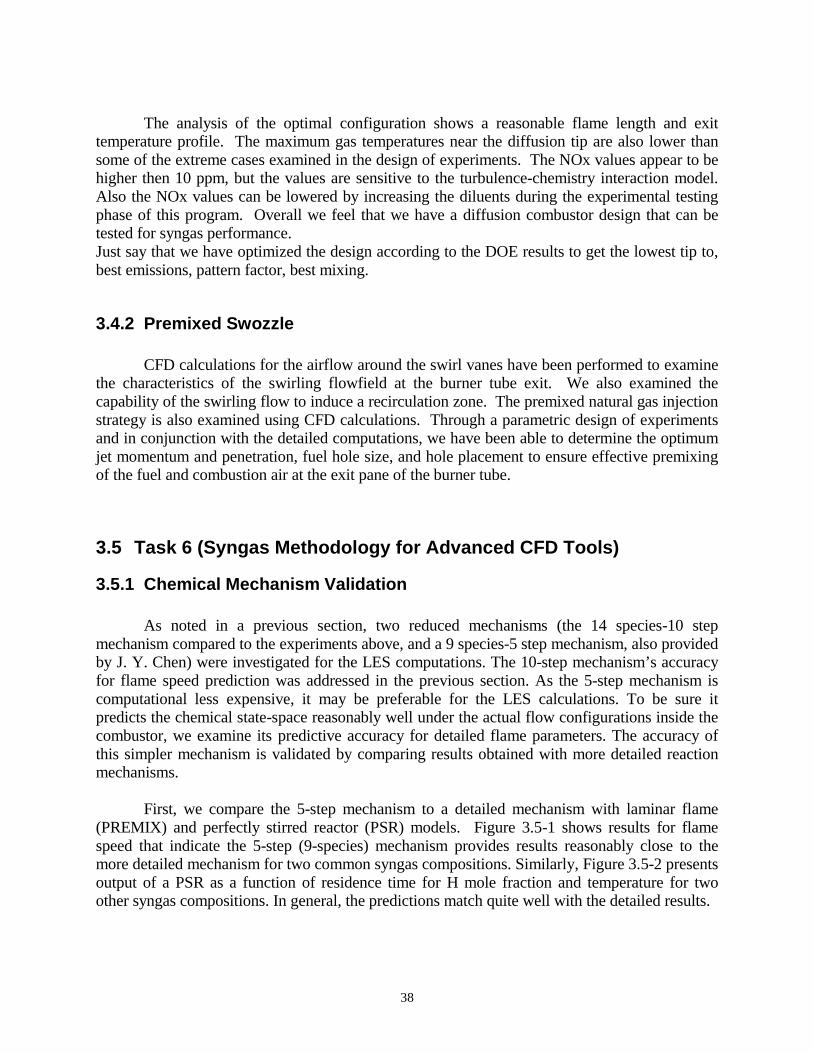
38
The analysis of the optimal configuration shows a reasonable flame length and exit temperature profile. The maximum gas temperatures near the diffusion tip are also lower than some of the extreme cases examined in the design of experiments. The NOx values appear to be higher then 10 ppm, but the values are sensitive to the turbulence-chemistry interaction model. Also the NOx values can be lowered by increasing the diluents during the experimental testing phase of this program. Overall we feel that we have a diffusion combustor design that can be tested for syngas performance. Just say that we have optimized the design according to the DOE results to get the lowest tip to, best emissions, pattern factor, best mixing.
3.4.2 Premixed Swozzle CFD calculations for the airflow around the swirl vanes have been performed to examine the characteristics of the swirling flowfield at the burner tube exit. We also examined the capability of the swirling flow to induce a recirculation zone. The premixed natural gas injection strategy is also examined using CFD calculations. Through a parametric design of experiments and in conjunction with the detailed computations, we have been able to determine the optimum jet momentum and penetration, fuel hole size, and hole placement to ensure effective premixing of the fuel and combustion air at the exit pane of the burner tube.
3.5 Task 6 (Syngas Methodology for Advanced CFD Tools)
3.5.1 Chemical Mechanism Validation
As noted in a previous section, two reduced mechanisms (the 14 species-10 step mechanism compared to the experiments above, and a 9 species-5 step mechanism, also provided by J. Y. Chen) were investigated for the LES computations. The 10-step mechanism’s accuracy for flame speed prediction was addressed in the previous section. As the 5-step mechanism is computational less expensive, it may be preferable for the LES calculations. To be sure it predicts the chemical state-space reasonably well under the actual flow configurations inside the combustor, we examine its predictive accuracy for detailed flame parameters. The accuracy of this simpler mechanism is validated by comparing results obtained with more detailed reaction mechanisms.
First, we compare the 5-step mechanism to a detailed mechanism with laminar flame (PREMIX) and perfectly stirred reactor (PSR) models. Figure 3.5-1 shows results for flame speed that indicate the 5-step (9-species) mechanism provides results reasonably close to the more detailed mechanism for two common syngas compositions. Similarly, Figure 3.5-2 presents output of a PSR as a function of residence time for H mole fraction and temperature for two other syngas compositions. In general, the predictions match quite well with the detailed results.
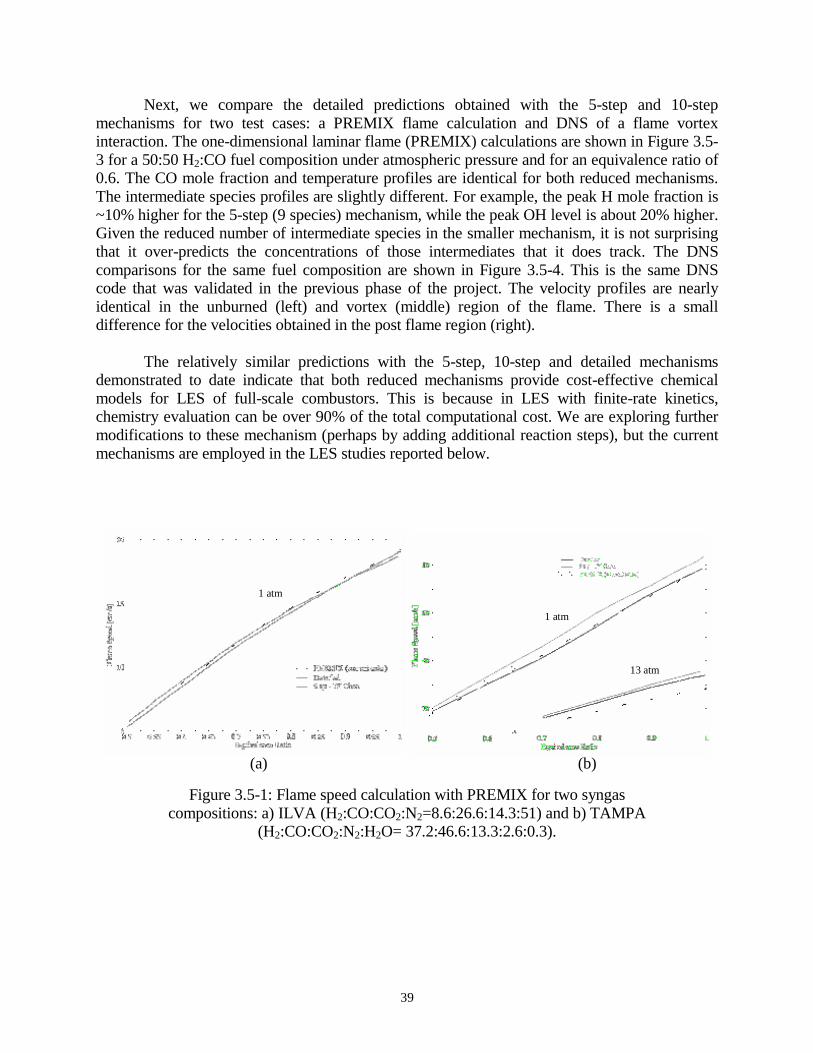
39
Next, we compare the detailed predictions obtained with the 5-step and 10-step mechanisms for two test cases: a PREMIX flame calculation and DNS of a flame vortex interaction. The one-dimensional laminar flame (PREMIX) calculations are shown in Figure 3.5-3 for a 50:50 H2:CO fuel composition under atmospheric pressure and for an equivalence ratio of 0.6. The CO mole fraction and temperature profiles are identical for both reduced mechanisms. The intermediate species profiles are slightly different. For example, the peak H mole fraction is ~10% higher for the 5-step (9 species) mechanism, while the peak OH level is about 20% higher. Given the reduced number of intermediate species in the smaller mechanism, it is not surprising that it over-predicts the concentrations of those intermediates that it does track. The DNS comparisons for the same fuel composition are shown in Figure 3.5-4. This is the same DNS code that was validated in the previous phase of the project. The velocity profiles are nearly identical in the unburned (left) and vortex (middle) region of the flame. There is a small difference for the velocities obtained in the post flame region (right).
The relatively similar predictions with the 5-step, 10-step and detailed mechanisms
demonstrated to date indicate that both reduced mechanisms provide cost-effective chemical models for LES of full-scale combustors. This is because in LES with finite-rate kinetics, chemistry evaluation can be over 90% of the total computational cost. We are exploring further modifications to these mechanism (perhaps by adding additional reaction steps), but the current mechanisms are employed in the LES studies reported below.
1 atm
13 atm
1 atm
(a) (b)
Figure 3.5-1: Flame speed calculation with PREMIX for two syngas compositions: a) ILVA (H2:CO:CO2:N2=8.6:26.6:14.3:51) and b) TAMPA
(H2:CO:CO2:N2:H2O= 37.2:46.6:13.3:2.6:0.3).
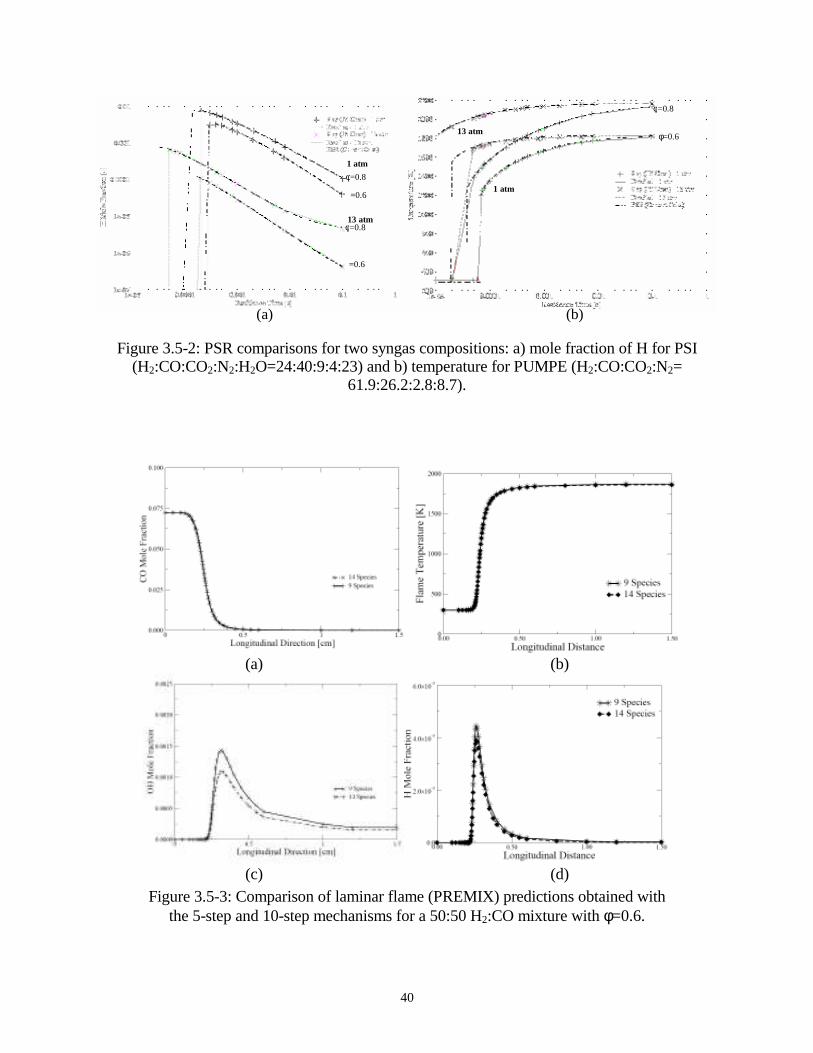
40
1 atm
13 atm
1 atm
13 atm φ=0.8
=0.6
φ=0.8
=0.6
φ=0.8
φ=0.6
(a) (b)
Figure 3.5-2: PSR comparisons for two syngas compositions: a) mole fraction of H for PSI (H2:CO:CO2:N2:H2O=24:40:9:4:23) and b) temperature for PUMPE (H2:CO:CO2:N2=
61.9:26.2:2.8:8.7).
(a) (b)
(c) (d)
Figure 3.5-3: Comparison of laminar flame (PREMIX) predictions obtained with the 5-step and 10-step mechanisms for a 50:50 H2:CO mixture with φ=0.6.
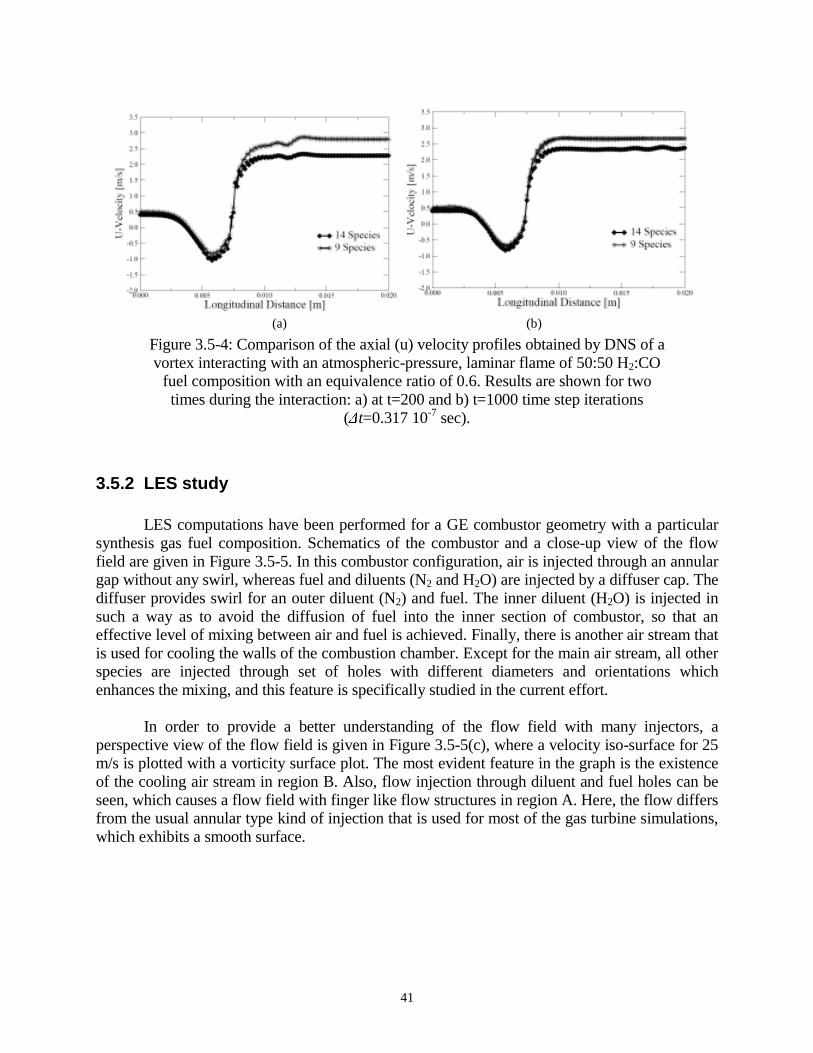
41
(a) (b)
Figure 3.5-4: Comparison of the axial (u) velocity profiles obtained by DNS of a vortex interacting with an atmospheric-pressure, laminar flame of 50:50 H2:CO
fuel composition with an equivalence ratio of 0.6. Results are shown for two times during the interaction: a) at t=200 and b) t=1000 time step iterations
(�
t=0.317 10-7 sec).
3.5.2 LES study
LES computations have been performed for a GE combustor geometry with a particular synthesis gas fuel composition. Schematics of the combustor and a close-up view of the flow field are given in Figure 3.5-5. In this combustor configuration, air is injected through an annular gap without any swirl, whereas fuel and diluents (N2 and H2O) are injected by a diffuser cap. The diffuser provides swirl for an outer diluent (N2) and fuel. The inner diluent (H2O) is injected in such a way as to avoid the diffusion of fuel into the inner section of combustor, so that an effective level of mixing between air and fuel is achieved. Finally, there is another air stream that is used for cooling the walls of the combustion chamber. Except for the main air stream, all other species are injected through set of holes with different diameters and orientations which enhances the mixing, and this feature is specifically studied in the current effort.
In order to provide a better understanding of the flow field with many injectors, a
perspective view of the flow field is given in Figure 3.5-5(c), where a velocity iso-surface for 25 m/s is plotted with a vorticity surface plot. The most evident feature in the graph is the existence of the cooling air stream in region B. Also, flow injection through diluent and fuel holes can be seen, which causes a flow field with finger like flow structures in region A. Here, the flow differs from the usual annular type kind of injection that is used for most of the gas turbine simulations, which exhibits a smooth surface.
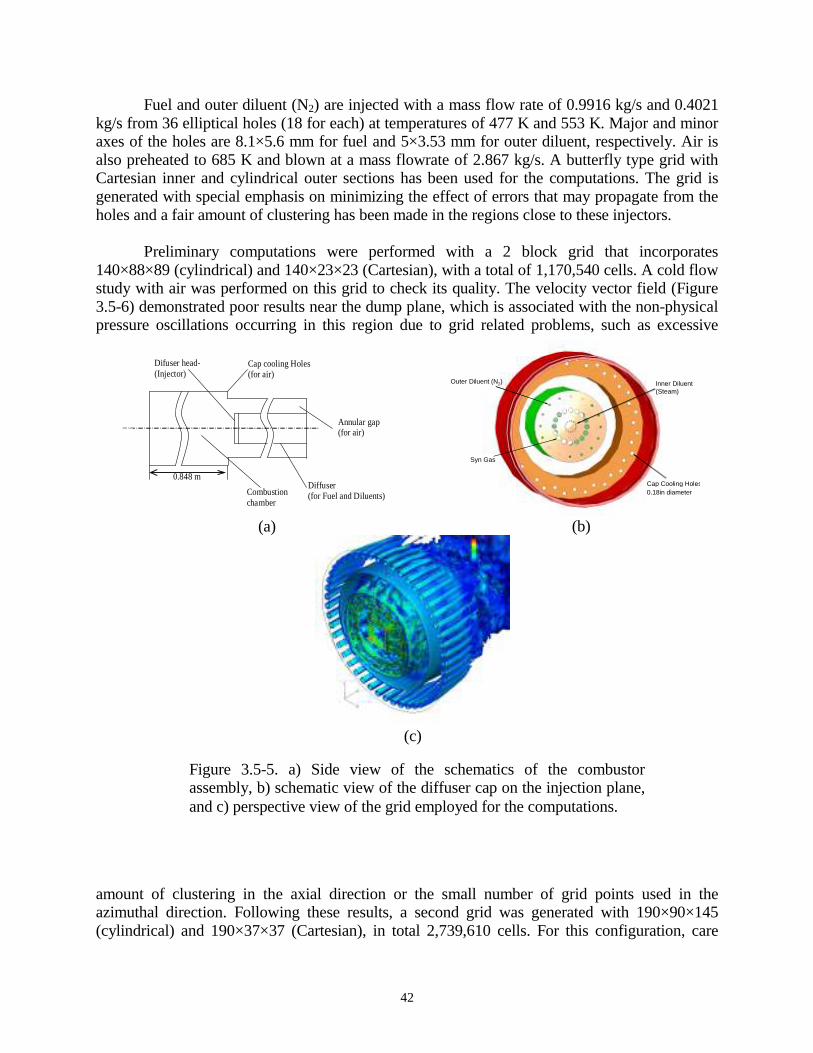
42
Diffuser (for Fuel and Diluents)
Annular gap (for air)
Cap cooling Holes (for air)
Combustion chamber
Difuser head-(Injector)
0.848 m
(a)
Cap Cooling Holes0.18in diameter
Outer Diluent (N2) Inner Diluent (Steam)
Syn Gas
(b)
(c)
Figure 3.5-5. a) Side view of the schematics of the combustor assembly, b) schematic view of the diffuser cap on the injection plane, and c) perspective view of the grid employed for the computations.
Fuel and outer diluent (N2) are injected with a mass flow rate of 0.9916 kg/s and 0.4021 kg/s from 36 elliptical holes (18 for each) at temperatures of 477 K and 553 K. Major and minor axes of the holes are 8.1×5.6 mm for fuel and 5×3.53 mm for outer diluent, respectively. Air is also preheated to 685 K and blown at a mass flowrate of 2.867 kg/s. A butterfly type grid with Cartesian inner and cylindrical outer sections has been used for the computations. The grid is generated with special emphasis on minimizing the effect of errors that may propagate from the holes and a fair amount of clustering has been made in the regions close to these injectors.
Preliminary computations were performed with a 2 block grid that incorporates
140×88×89 (cylindrical) and 140×23×23 (Cartesian), with a total of 1,170,540 cells. A cold flow study with air was performed on this grid to check its quality. The velocity vector field (Figure 3.5-6) demonstrated poor results near the dump plane, which is associated with the non-physical pressure oscillations occurring in this region due to grid related problems, such as excessive
amount of clustering in the axial direction or the small number of grid points used in the azimuthal direction. Following these results, a second grid was generated with 190×90×145 (cylindrical) and 190×37×37 (Cartesian), in total 2,739,610 cells. For this configuration, care
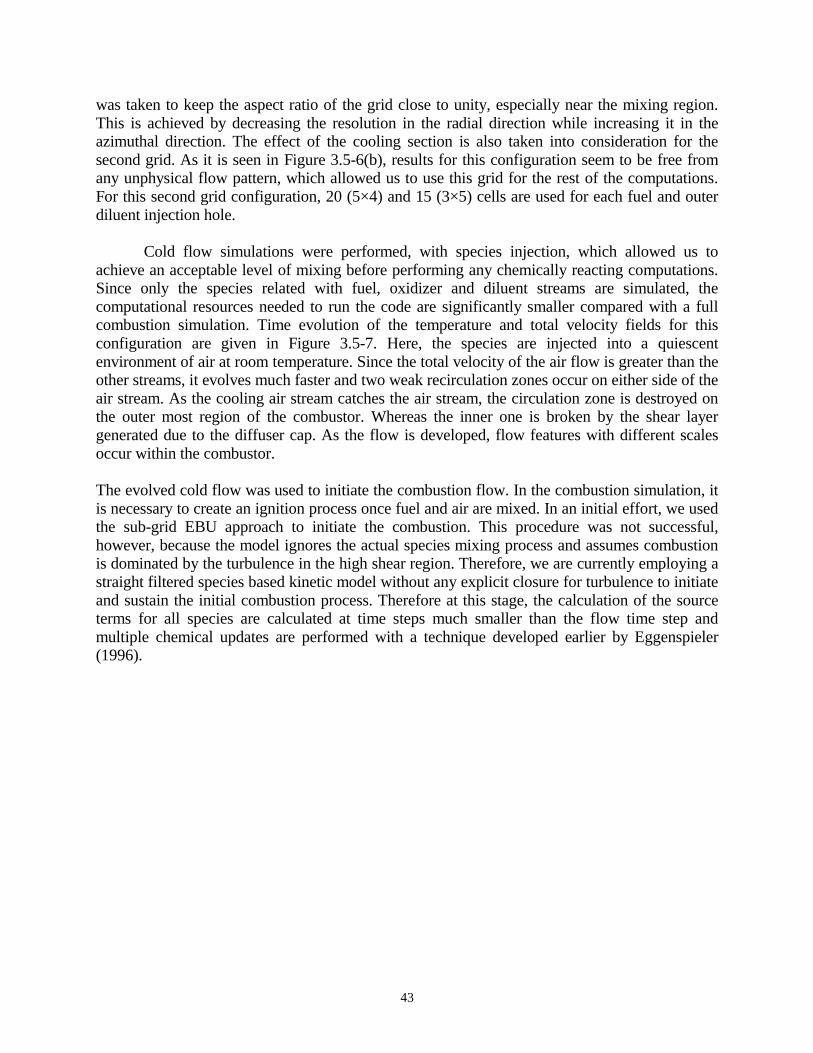
43
was taken to keep the aspect ratio of the grid close to unity, especially near the mixing region. This is achieved by decreasing the resolution in the radial direction while increasing it in the azimuthal direction. The effect of the cooling section is also taken into consideration for the second grid. As it is seen in Figure 3.5-6(b), results for this configuration seem to be free from any unphysical flow pattern, which allowed us to use this grid for the rest of the computations. For this second grid configuration, 20 (5×4) and 15 (3×5) cells are used for each fuel and outer diluent injection hole.
Cold flow simulations were performed, with species injection, which allowed us to achieve an acceptable level of mixing before performing any chemically reacting computations. Since only the species related with fuel, oxidizer and diluent streams are simulated, the computational resources needed to run the code are significantly smaller compared with a full combustion simulation. Time evolution of the temperature and total velocity fields for this configuration are given in Figure 3.5-7. Here, the species are injected into a quiescent environment of air at room temperature. Since the total velocity of the air flow is greater than the other streams, it evolves much faster and two weak recirculation zones occur on either side of the air stream. As the cooling air stream catches the air stream, the circulation zone is destroyed on the outer most region of the combustor. Whereas the inner one is broken by the shear layer generated due to the diffuser cap. As the flow is developed, flow features with different scales occur within the combustor.
The evolved cold flow was used to initiate the combustion flow. In the combustion simulation, it is necessary to create an ignition process once fuel and air are mixed. In an initial effort, we used the sub-grid EBU approach to initiate the combustion. This procedure was not successful, however, because the model ignores the actual species mixing process and assumes combustion is dominated by the turbulence in the high shear region. Therefore, we are currently employing a straight filtered species based kinetic model without any explicit closure for turbulence to initiate and sustain the initial combustion process. Therefore at this stage, the calculation of the source terms for all species are calculated at time steps much smaller than the flow time step and multiple chemical updates are performed with a technique developed earlier by Eggenspieler
(1996).
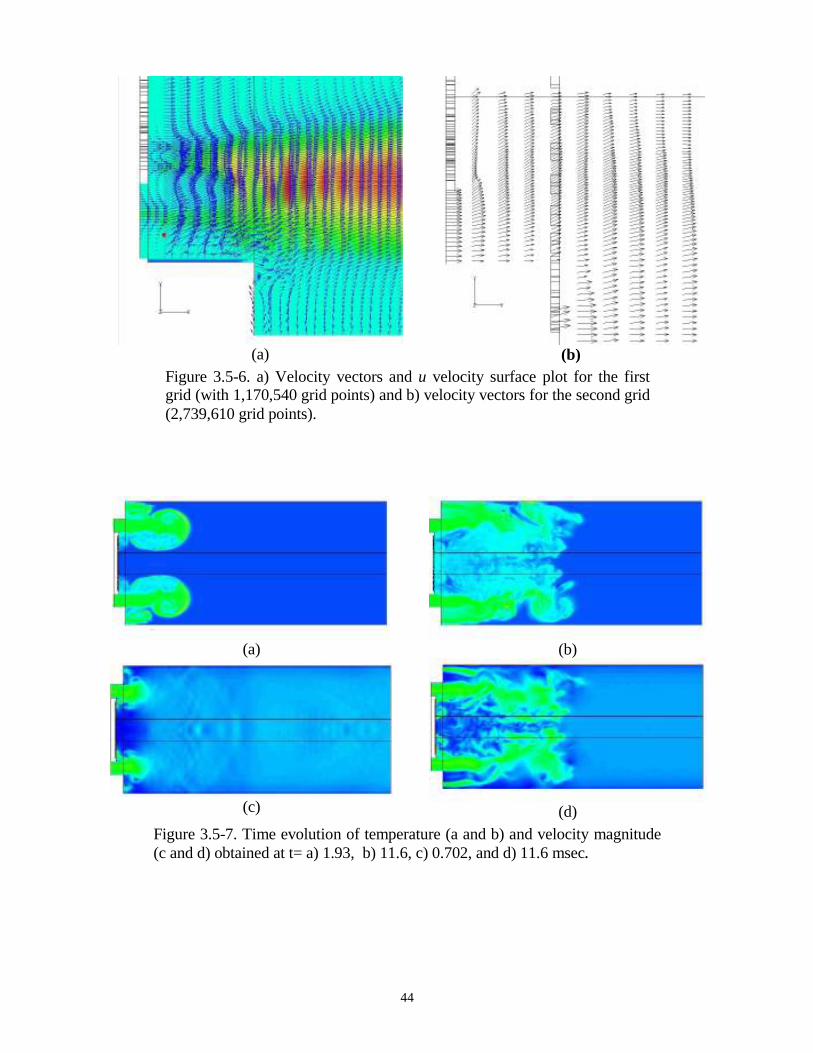
44
(a)
(b)
(c)
(d)
Figure 3.5-7. Time evolution of temperature (a and b) and velocity magnitude (c and d) obtained at t= a) 1.93, b) 11.6, c) 0.702, and d) 11.6 msec.
(a) (b)
Figure 3.5-6. a) Velocity vectors and u velocity surface plot for the first grid (with 1,170,540 grid points) and b) velocity vectors for the second grid (2,739,610 grid points).

45
Instantaneous CO2, H2O, O2 and N2 contour plots obtained at t=24 msec are given in
Figure 3.5-8(a-d), respectively. The fuel composition simulated contains CO2; thus it exhibits a peak near the fuel stream. As the flow evolves, the CO2 is convected by the bulk flow to the walls of combustor. Since CO2 is also a combustion product, it exhibits another peak downstream in the shear layer. Due to the non-premixed nature of the combustor, it is not possible for O2 to penetrate the shear layer and co-exist with the fuel on the core section of the combustor. It has to be consumed on the shear layer where most of the combustion processes occur. This is also the case for our simulation. For our simulation, cold flow computations were performed with species injection without any reaction rate calculations, and the composition within the combustor was initialized as air at 300 K. Even though this helped to obtain a good flow evolution and diffusion of fuel along the shear layer, O2 on the inner section could not be swept out due to the existence of a reverse flow in this region. However, the flow is still evolving and these conclusions are preliminary. It is expected that further simulation of this flow may change this view and therefore, the simulation is still underway. On average, due to the combustion processes occurring there, the O2 content is still decreasing.
As shown in Figure 3.5-8 (b), H2O is injected from the inner section up to the shear layer.
It is then convected by the bulk flow in the form of pockets and remains inside the shear layer. The variation is similar to CO2; as H2O is also a combustion product, it does not vanish downstream but rather is produced. It reaches in its maximum value slightly inside the shear layer. The N2 mass fraction variation is given in Figure 3.5-8 (d). In general it is close to its level inside the air except for the region close to the injection plane and along the shear layer. Existence of streams with different N2 concentrations (inner diluent 0%; outer diluent 100 %; fuel 10 %; air 79 % N2) and combustion is the main reason for this.
A close up view of the injection plane of the CO2, H2O, O2 and N2 mass fraction contour
is shown in Figure 3.5-9, along with instantaneous velocity vectors. The results indicate three recirculation zones close to the injection plane. The first (i) is located on the inner section, which is mostly due to the injection of inner diluent and the swirl injection of the fuel and diluent streams. The other two recirculation zones are (ii) in-between the fuel and diluent streams, and (iii) slightly downstream region of the cooling air stream. The innermost recirculation zone is the larges of the three and causes the hot products to come back and heat the incoming streams. Zone (iii) is associated with the dump plane geometry; existence of the cooling air injected in this region pushes the circulation zone in the downstream direction, until it is dissipated by the shear layer that spreads into that region. In the meanwhile, a secondary bubble is created on top of the cooling air stream, which eventually will be pushed and dissipated as the previous one. Hence, existence of the cooling air stream prevents existence of a dead region close to the dump plane and prevents extensive spreading of the combustion region by cooling this region. Once the effect of the inner diluent vanishes, the bulk flow moves in the positive y direction. In this
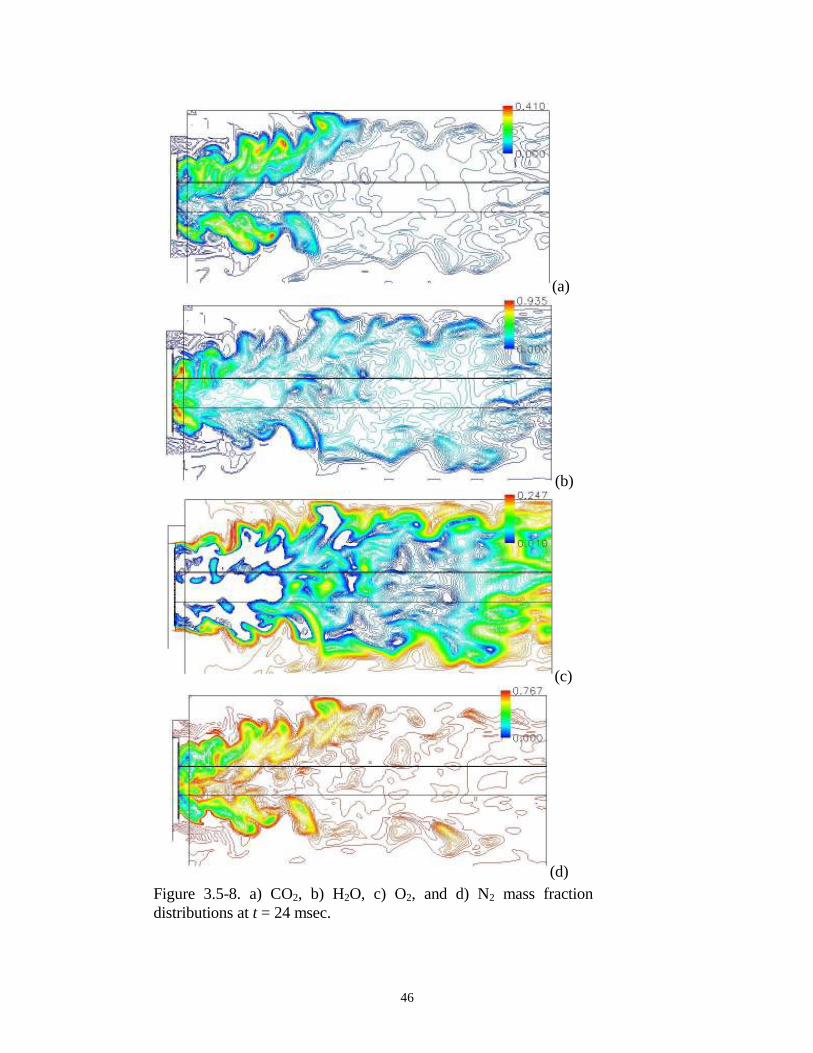
46
(a)
(b)
(c)
(d) Figure 3.5-8. a) CO2, b) H2O, c) O2, and d) N2 mass fraction distributions at t = 24 msec.
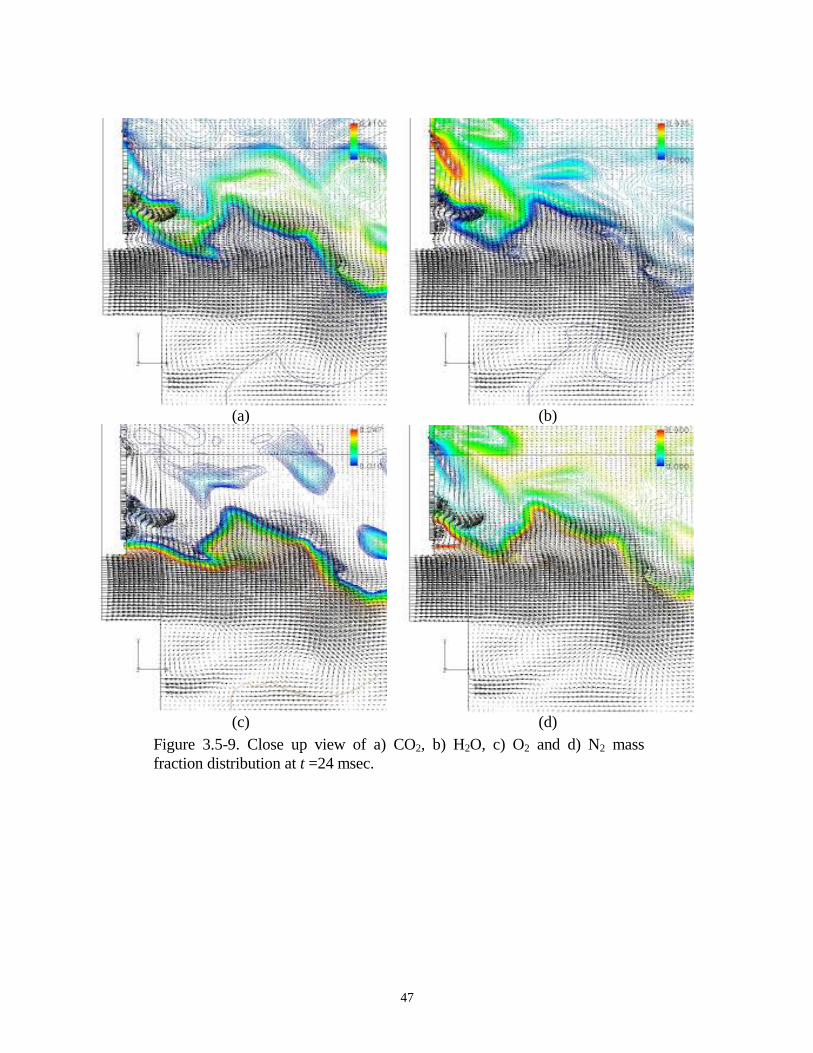
47
(a)
(b)
(c)
(d)
Figure 3.5-9. Close up view of a) CO2, b) H2O, c) O2 and d) N2 mass fraction distribution at t =24 msec.
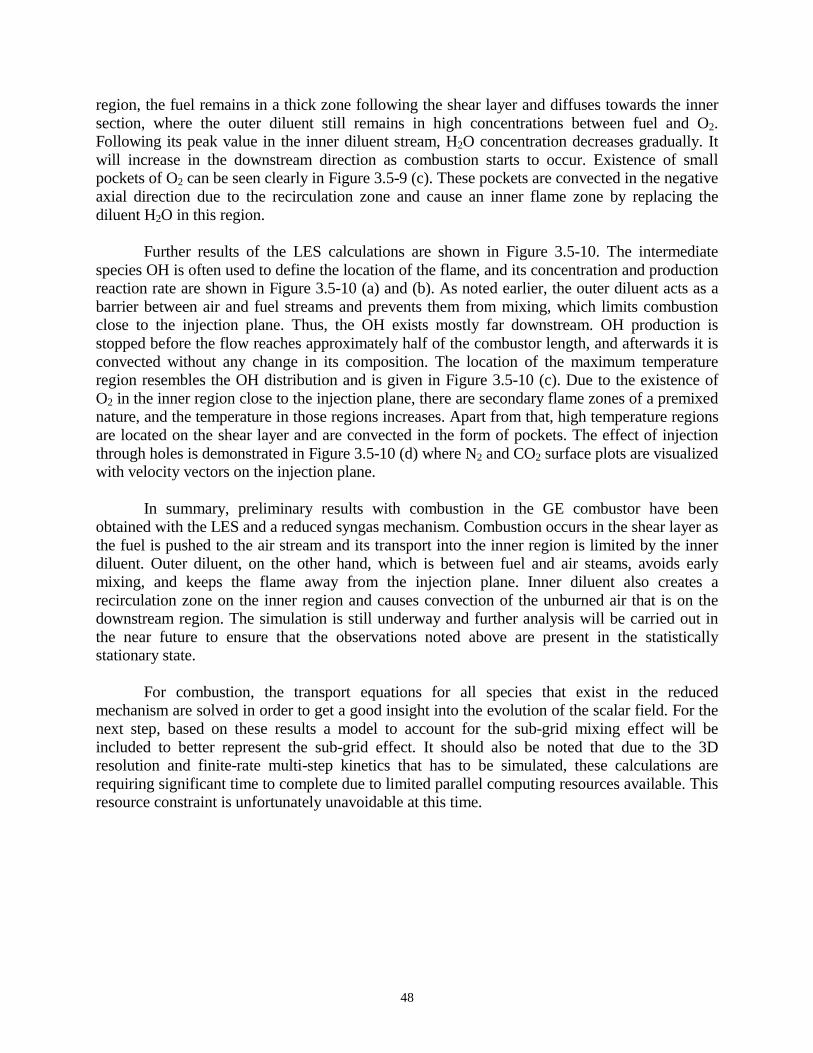
48
region, the fuel remains in a thick zone following the shear layer and diffuses towards the inner section, where the outer diluent still remains in high concentrations between fuel and O2. Following its peak value in the inner diluent stream, H2O concentration decreases gradually. It will increase in the downstream direction as combustion starts to occur. Existence of small pockets of O2 can be seen clearly in Figure 3.5-9 (c). These pockets are convected in the negative axial direction due to the recirculation zone and cause an inner flame zone by replacing the diluent H2O in this region.
Further results of the LES calculations are shown in Figure 3.5-10. The intermediate
species OH is often used to define the location of the flame, and its concentration and production reaction rate are shown in Figure 3.5-10 (a) and (b). As noted earlier, the outer diluent acts as a barrier between air and fuel streams and prevents them from mixing, which limits combustion close to the injection plane. Thus, the OH exists mostly far downstream. OH production is stopped before the flow reaches approximately half of the combustor length, and afterwards it is convected without any change in its composition. The location of the maximum temperature region resembles the OH distribution and is given in Figure 3.5-10 (c). Due to the existence of O2 in the inner region close to the injection plane, there are secondary flame zones of a premixed nature, and the temperature in those regions increases. Apart from that, high temperature regions are located on the shear layer and are convected in the form of pockets. The effect of injection through holes is demonstrated in Figure 3.5-10 (d) where N2 and CO2 surface plots are visualized with velocity vectors on the injection plane.
In summary, preliminary results with combustion in the GE combustor have been
obtained with the LES and a reduced syngas mechanism. Combustion occurs in the shear layer as the fuel is pushed to the air stream and its transport into the inner region is limited by the inner diluent. Outer diluent, on the other hand, which is between fuel and air steams, avoids early mixing, and keeps the flame away from the injection plane. Inner diluent also creates a recirculation zone on the inner region and causes convection of the unburned air that is on the downstream region. The simulation is still underway and further analysis will be carried out in the near future to ensure that the observations noted above are present in the statistically stationary state.
For combustion, the transport equations for all species that exist in the reduced
mechanism are solved in order to get a good insight into the evolution of the scalar field. For the next step, based on these results a model to account for the sub-grid mixing effect will be included to better represent the sub-grid effect. It should also be noted that due to the 3D resolution and finite-rate multi-step kinetics that has to be simulated, these calculations are requiring significant time to complete due to limited parallel computing resources available. This resource constraint is unfortunately unavoidable at this time.
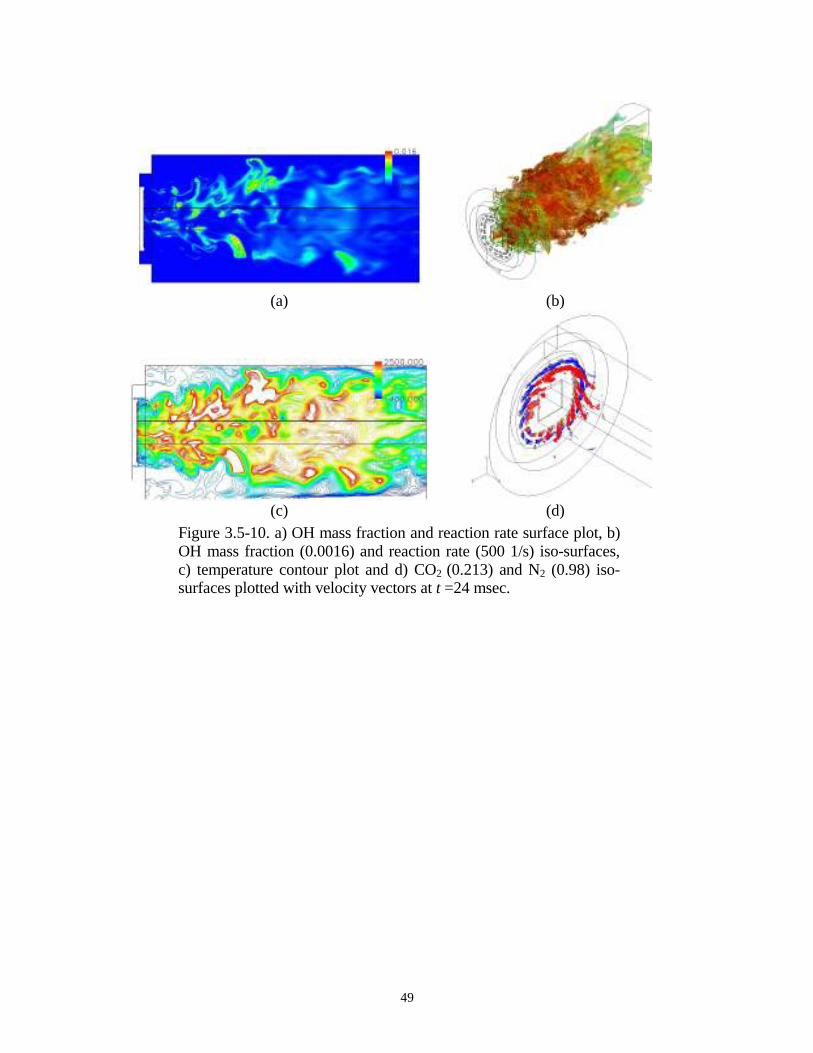
49
(a)
(b)
(c)
(d)
Figure 3.5-10. a) OH mass fraction and reaction rate surface plot, b) OH mass fraction (0.0016) and reaction rate (500 1/s) iso-surfaces, c) temperature contour plot and d) CO2 (0.213) and N2 (0.98) iso-surfaces plotted with velocity vectors at t =24 msec.
50
4 Conclusions
4.2 Task 3 (Syngas fuel flame characterization) Results were presented for laminar flame speed measurements at atmospheric pressure and
elevated pressured for different compositions of H2/CO fuel mixtures. The experimental data was compared with one-dimensional premixed flame calculations using three chemical mechanisms: GRI 3.0, Davis mechanism for H2/CO oxidation and a 5-step reduced chemical mechanism (Chen mechanism) that was developed as part of this program. The effect of CO2 dilution and preheating on the laminar flame speed was evaluated both experimentally and numerically. The GRI 3.0 prediction for CO2 dilution agreed well with experiments for stochiometric flames, but not for lean flames. The Davis mechanism showed good agreement for lean flames, but not for stochiometric flames. The reduced mechanism showed good agreement for all the mixtures. All the mechanisms showed good agreement (within 10-20%) for high the H2 content fuel. All mechanism show comparable agreement for the high CO content fuels. With respect to the effect of preheat, all the mechanisms overpredicted the temperature dependence of the laminar flame speed. The GRI 3.0 predictions provided the closest scaling. The Davis and Chen mechanism predictions were nearly identical. The temperature dependence of the CO + OH reaction step needs to be closely examined to further develop the reduced mechanism. First results from high-pressure, atmospheric temperature test of the system show promise. The data set is limited due to flame stability issues that need to be resolved to extend the operating range of the system. However, comparison of the experimental data with numerical predictions using the reduced chemistry mechanism shows excellent agreement. Further measurements of flame speed at high-pressure, high-temperature conditions are needed to verify/develop the chemistry mechanisms at desired gas turbine operating conditions.
4.3 Task 4 (Systems Modeling) The Co-generation plant system combined with the combustor level requirements have
been defined and ranked. The most important requirements are improved system level efficiency, dual fuel flexibility (co-firing capability), allowance for enhanced fuel variability (Wobbie index), and low emissions (<9 ppm NOx and CO). The system level evaluation has shown that the Co-generation efficiency is higher for the diffusion combustor concept than the TVC concept. According to the systems evaluation, the hybrid diffusion concept is not able to meet the 9 ppm NOx requirement with syngas fuels and N2 diluent addition. In this cycle format, there is not enough available N2 from the air separation unit to provide the required dilution of the flame temperature. Steam augmentation is included to meet the emissions requirements.
The additional steam augmentation also increases the overall plant efficiency. Another
problem with steam diluent addition is the concern for the gas turbine hot gas path (HGP) life, which is expected to be shorter when steam injection is used at lower temperature conditions in order to maintain the same expected HGP life. However, the H2 content in the EECP syngas are lower than typical syngas due to part of the syngas is converted to hydrocarbon liquid products in
51
the upstream Fisher Tropsch process. As a consequence, the H2 content in EECP syngas is lower than normal and therefore the H2O content in the exhaust is lower than normal operation, even with supplemental steam injection. Hence, the diffusion combustor cases do not require operating at lower temperature within these EECP syngas cases and the system evaluation shows a better co-generation efficiency than TVC cases. However, the TVC system shows ~10% increase in plant efficiency when the combustion system is in operation with natural gas.
4.4 Task 5 (Prototype Design) The purpose of this task is to design two prototypes of a fuel flexible combustor selected
from the technologies listed in Task-2. The combustors are to operate them at heavy-duty industrial gas turbine operating conditions. This report discussed the design and calculations for the first prototype, which is a hybrid of a lean premixed DLN burner for natural gas and a diffusion burner for syngas with diluents injection for NOx abatement.
Important geometric parameters of the diffusion burner were identified through a design of
experiments study in conjunction with CFD calculations of the diffusion burner geometry and flowfield. Results show the different possible flame structures from the range of possible tip geometries and their corresponding effect on NOx emissions, mixing, and the exit temperature profiles. Critical parameters by which to guide the combustor design were identified: NOx, flame length, exit temperature pattern factor, mixing rates, and temperature of gases impinging on diffusion tip. Cases with shorter flame lengths predicted lower NOx values in general thereby underlining the importance of high temperature residence times on thermal NOx formation. Thus, the emissions performance of the nozzle concept is a strong function of the maximum temperatures in the combustor and mixing of the fuel, air, and diluents. The optimized design is a compromise between fuel-air and fuel-diluents mixing to achieve the optimal flame structure for low NOx performance. The optimal combination of the diffusion combustor design variables was selected to obtain low NOx while satisfying the requirements of a short flame length, low diffusion tip temperatures and a flat exit temperature profile. CFD analysis of the design was performed to verify that the combustor requirements are satisfied.
Design of the swozzle for natural gas operation was performed through a parametric study
using CFD calculations to determine the air flow-field and mixing at the burner tube exit plane. The shape and dimensions of the vane surface contour was decided based on GE methodology for DLN style premixers. Air-side CFD for the flow around the vane was performed to evaluate the swirling flow characteristics. The velocity profiles coming out of the vanes were found to be consistent with expectations for a lean premixed burner. An optimal strategy for premixed fuel injection was developed and validated with excellent fuel air mixing capability.
Currently the hybrid combustion nozzle is in the process of being manufactured and
preparation of the test facility for high-pressure combustion experiments with syngas and natural gas is in progress.
52
4.5 Task 6 (Syngas Methodology for Advanced CFD Tools)
A reduced 5-step 9 species chemical kinetic mechanism for syngas combustion has been developed. The physics of the mechanism have been established through validation with the experimental data obtained in Task 3. The reduced mechanism predicts flame behavior relatively well over a wide range of fuel compositions and equivalence ratios. However, the mechanism has not been fully validated against high-pressure data and fails to accurately predict the influence of pre-heating. Future plans include comparing predictions using the reduced mechanism with more high-pressure data and investigating the discrepancy with pre-heat. The accuracy of the reduced kinetic mechanism to predict detailed flame structure has been investigated by comparison of results obtained from detailed kinetic mechanisms for simplified reactor models and DNS simulations of flame vortex interaction. The reduced kinetic mechanism gives results similar to those obtained with the more detailed kinetic mechanisms. The velocity profiles and estimated flame structure are nearly identical for both the reduced and detailed mechanisms. The advantage of the reduced mechanisms is in computational costs, which is desirable for LES of full-scale combustors.
Large eddy simulations (LES) were performed for the hybrid nozzle prototype combustor geometry under conditions similar to an industrial gas turbine. The LES solves for the flow structures at a scale larger than the grid size. The sub-grid convection, diffusion and chemical reactions of species are calculated using a one-dimensional linear eddy model (LEM). Calculations are performed for an overall lean swirling syngas/air flame using the reduced kinetic mechanisms. Vortex breakdown and hot products recirculation are predicted. The flame is predicted stable and forms in the shear layer between the air/outer/diluent/syngas passage. The cap cooling air minimizes heat transfer at the combustor dump plane and helps establish recirculation of the hot products. As per the design requirement, the inner diluent jet helps with flame lift-off and to keep the diffusion tip cool. Future work will implement the LES with the reduced chemical mechanism developed for syngas and using sub-grid methods for 3D analysis and comparison with experimental data that will be obtained as part of Task 5.
53
5 References Andrews, G. E., and Bradley, D. (1972). “Determination of burning velocities – Critical review.” Combustion and Flame 18: 133-153. Davis, S.G., Joshi, A.V., Wang, H., and Egolfopoulos, F.N, Proc. Comb. Inst. 30: 1283-1292 (2004). Egolfopoulos, F. N., Cho, P., and Law, C. K. (1989). “Laminar flame speeds of Methane-Air mixtures under reduced and elevated pressures,” Combustion and Flame 76: 375-391. Egolfopoulos, F. N., Zhang, H., and Zhang, Z. (1997). “Wall effects on propagation and extinction of steady, strained, laminar premixed flames,” Combustion and Flame 109: 237-252. Iyer, V. A., Haynes, J., Anand, A., and May, P. (2005). “Evaluation of Emissions Performance of Existing Combustion Technologies for Syngas Combustion,” Proceedings of ASME Turbo Expo 2005, GT2005-68513, June 6-9, 2005, Reno-Tahoe, Nevada, USA.
Kempf, A., Lindstedt, R.P., Janicka, J., “Large-Eddy Simulation of a Bluff Body Stabilized Nonpremixed Flame”, Combustion and Flame, Article in press.
Kim, W.-W., Menon, S., and Mongia, H. C., “Large-Eddy Simulation of a Gas Turbine Combustor Flow" Combustion Science and Technology, Vol. 143, 1999, pp. 25-62.
Maas, U., and Pope, S.B., “Simplifying Chemical Kinetics: Intrinsic Low-Dimensional Manifolds in Composition Space” Combustion and Flame, Vol. 88, 1992, pp.239-264. Mahesh, K., Constantinescu, G. and Moin, P., “Large-Eddy Simulations of Gas Turbine Combustors”, Center for Turbulence Research Annual Research Briefs, 2000. McLean, I. C., Smith, D. B., and Taylor, S. C. (1994). "The use of carbon monoxide/hydrogen burning velocities to examine the rate of the CO + OH reaction." Proceedings of the Combustion Institute 25: 749-757.
Meier, W., Duan, X.R., Weigand, P., “Investigations of Swirl Flames in a Gas Turbine Model Combustor II. Turbulence-Chemistry Interactions”, Combustion and Flame, Article in press.
Menon, S. and Calhoon, W., “Sub-grid Mixing and Molecular Transport Modeling for Large-Eddy Simulations of Turbulent Reacting Flows" Proceedings of the Combustion Institute, Vol. 26, 1996, pp. 59-66.
Meyer, T.R., Roy, S., Lucht, R.P. and Gord, J.R., “Dual-Pump Dual-Broadband CARS for Exhaust-Gas Temperature and CO2-O2-N2 Mole-Fraction Measurements in Model Gas-Turbine Combustor”, Combustion and Flame, Vol. 142, 2005, pp. 52-61.
54
Mueller, M.A., Yetter, R.A., and Dryer, F.L., International Journal of Chemical Kinetics 31: 705-724 (1999).
Pitsch, H., “A Consistent Level Set Formulation for Large Eddy Simulation of Premixed Turbulence”, Combustion and Flame, Vol. 143, 2005, pp. 587-598.
Pope, S.B., “Computationally Efficient Implementation of Combustion Chemistry Using in situ Adaptive Tabulation” Combustion Theory and Modelling, Vol. 1, 1997, pp. 41-63.
Pope, S.B., Turbulent Flows. Cambridge University Press, 2000.
Sankaran, V. and Menon, S., “Sub-grid Combustion Modeling of 3-D Premixed Flames in the Thin-Reaction-Zone Regime,” Proceedings of the Combustion Institute, Vol. 30, 2004.
Weigand, P., Meier, W., Duan, X.R., Stricker, W., Aigner, M., “Investigations of Swirl Flames in a Gas Turbine Model Combustor II. Flow Field, Structures, Temperature and Species Distributions”, Combustion and Flame, Article in press
Zhu, D. L., Egolfopoulos, F. N., and Law, C. K. (1988). “Experimental and numerical determination of laminar flame speeds of methane/(Ar, N2, CO2) – air mixtures as function of stochiometry, pressure, and flame temperature.” Proceedings of the Combustion Institute 22: 1537-1545.