Frontal Brain Asymmetry and Reward Responsiveness: A Source-Localization Study
9
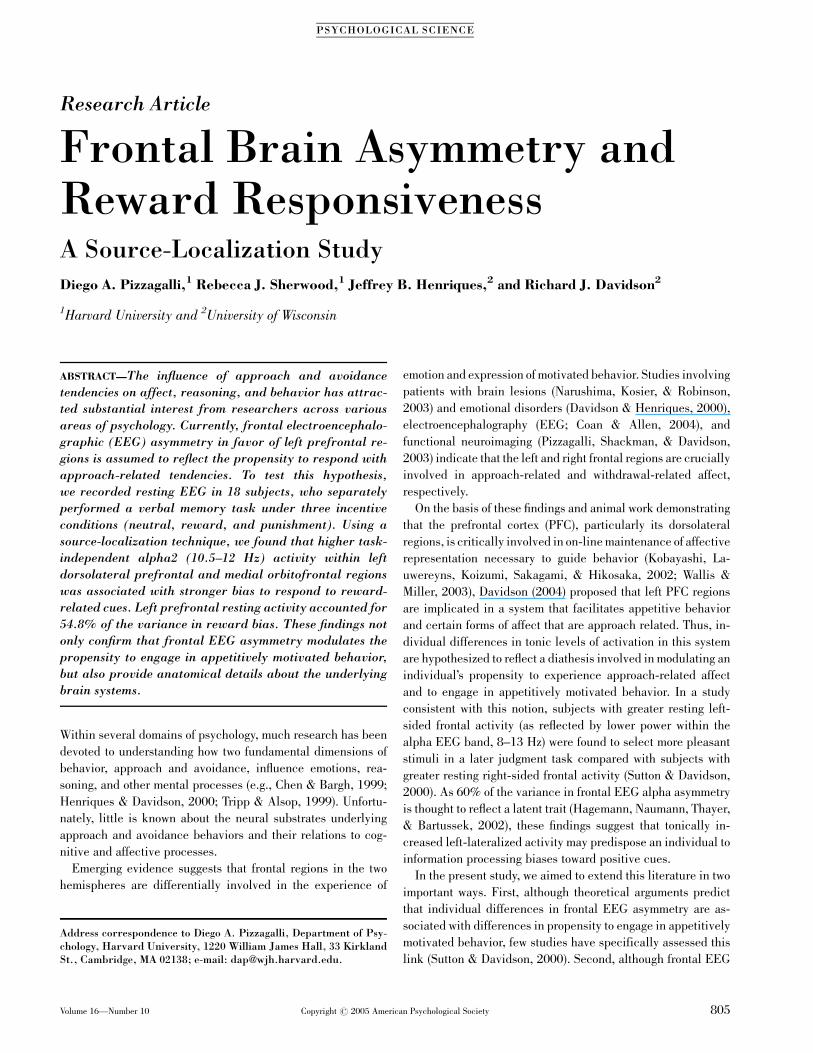
Research Article Frontal Brain Asymmetry and Reward Responsiveness A Source-Localization Study Diego A. Pizzagalli, 1 Rebecca J. Sherwood, 1 Jeffrey B. Henriques, 2 and Richard J. Davidson 2 1 Harvard University and 2 University of Wisconsin ABSTRACT—The influence of approach and avoidance tendencies on affect, reasoning, and behavior has attrac- ted substantial interest from researchers across various areas of psychology. Currently, frontal electroencephalo- graphic (EEG) asymmetry in favor of left prefrontal re- gions is assumed to reflect the propensity to respond with approach-related tendencies. To test this hypothesis, we recorded resting EEG in 18 subjects, who separately performed a verbal memory task under three incentive conditions (neutral, reward, and punishment). Using a source-localization technique, we found that higher task- independent alpha2 (10.5–12 Hz) activity within left dorsolateral prefrontal and medial orbitofrontal regions was associated with stronger bias to respond to reward- related cues. Left prefrontal resting activity accounted for 54.8% of the variance in reward bias. These findings not only confirm that frontal EEG asymmetry modulates the propensity to engage in appetitively motivated behavior, but also provide anatomical details about the underlying brain systems. Within several domains of psychology, much research has been devoted to understanding how two fundamental dimensions of behavior, approach and avoidance, influence emotions, rea- soning, and other mental processes (e.g., Chen & Bargh, 1999; Henriques & Davidson, 2000; Tripp & Alsop, 1999). Unfortu- nately, little is known about the neural substrates underlying approach and avoidance behaviors and their relations to cog- nitive and affective processes. Emerging evidence suggests that frontal regions in the two hemispheres are differentially involved in the experience of emotion and expression of motivated behavior. Studies involving patients with brain lesions (Narushima, Kosier, & Robinson, 2003) and emotional disorders (Davidson & Henriques, 2000), electroencephalography (EEG; Coan & Allen, 2004), and functional neuroimaging (Pizzagalli, Shackman, & Davidson, 2003) indicate that the left and right frontal regions are crucially involved in approach-related and withdrawal-related affect, respectively. On the basis of these findings and animal work demonstrating that the prefrontal cortex (PFC), particularly its dorsolateral regions, is critically involved in on-line maintenance of affective representation necessary to guide behavior (Kobayashi, La- uwereyns, Koizumi, Sakagami, & Hikosaka, 2002; Wallis & Miller, 2003), Davidson (2004) proposed that left PFC regions are implicated in a system that facilitates appetitive behavior and certain forms of affect that are approach related. Thus, in- dividual differences in tonic levels of activation in this system are hypothesized to reflect a diathesis involved in modulating an individual’s propensity to experience approach-related affect and to engage in appetitively motivated behavior. In a study consistent with this notion, subjects with greater resting left- sided frontal activity (as reflected by lower power within the alpha EEG band, 8–13 Hz) were found to select more pleasant stimuli in a later judgment task compared with subjects with greater resting right-sided frontal activity (Sutton & Davidson, 2000). As 60% of the variance in frontal EEG alpha asymmetry is thought to reflect a latent trait (Hagemann, Naumann, Thayer, & Bartussek, 2002), these findings suggest that tonically in- creased left-lateralized activity may predispose an individual to information processing biases toward positive cues. In the present study, we aimed to extend this literature in two important ways. First, although theoretical arguments predict that individual differences in frontal EEG asymmetry are as- sociated with differences in propensity to engage in appetitively motivated behavior, few studies have specifically assessed this link (Sutton & Davidson, 2000). Second, although frontal EEG Address correspondence to Diego A. Pizzagalli, Department of Psy- chology, Harvard University, 1220 William James Hall, 33 Kirkland St., Cambridge, MA 02138; e-mail: [email protected]. PSYCHOLOGICAL SCIENCE Volume 16—Number 10 805 Copyright r 2005 American Psychological Society
Transcript of Frontal Brain Asymmetry and Reward Responsiveness: A Source-Localization Study
Research Article
Frontal Brain Asymmetry andReward ResponsivenessA Source-Localization StudyDiego A. Pizzagalli,1 Rebecca J. Sherwood,1 Jeffrey B. Henriques,2 and Richard J. Davidson2
1Harvard University and 2University of Wisconsin
ABSTRACT—The influence of approach and avoidance
tendencies on affect, reasoning, and behavior has attrac-
ted substantial interest from researchers across various
areas of psychology. Currently, frontal electroencephalo-
graphic (EEG) asymmetry in favor of left prefrontal re-
gions is assumed to reflect the propensity to respond with
approach-related tendencies. To test this hypothesis,
we recorded resting EEG in 18 subjects, who separately
performed a verbal memory task under three incentive
conditions (neutral, reward, and punishment). Using a
source-localization technique, we found that higher task-
independent alpha2 (10.5–12 Hz) activity within left
dorsolateral prefrontal and medial orbitofrontal regions
was associated with stronger bias to respond to reward-
related cues. Left prefrontal resting activity accounted for
54.8% of the variance in reward bias. These findings not
only confirm that frontal EEG asymmetry modulates the
propensity to engage in appetitively motivated behavior,
but also provide anatomical details about the underlying
brain systems.
Within several domains of psychology, much research has been
devoted to understanding how two fundamental dimensions of
behavior, approach and avoidance, influence emotions, rea-
soning, and other mental processes (e.g., Chen & Bargh, 1999;
Henriques & Davidson, 2000; Tripp & Alsop, 1999). Unfortu-
nately, little is known about the neural substrates underlying
approach and avoidance behaviors and their relations to cog-
nitive and affective processes.
Emerging evidence suggests that frontal regions in the two
hemispheres are differentially involved in the experience of
emotion and expression of motivated behavior. Studies involving
patients with brain lesions (Narushima, Kosier, & Robinson,
2003) and emotional disorders (Davidson & Henriques, 2000),
electroencephalography (EEG; Coan & Allen, 2004), and
functional neuroimaging (Pizzagalli, Shackman, & Davidson,
2003) indicate that the left and right frontal regions are crucially
involved in approach-related and withdrawal-related affect,
respectively.
On the basis of these findings and animal work demonstrating
that the prefrontal cortex (PFC), particularly its dorsolateral
regions, is critically involved in on-line maintenance of affective
representation necessary to guide behavior (Kobayashi, La-
uwereyns, Koizumi, Sakagami, & Hikosaka, 2002; Wallis &
Miller, 2003), Davidson (2004) proposed that left PFC regions
are implicated in a system that facilitates appetitive behavior
and certain forms of affect that are approach related. Thus, in-
dividual differences in tonic levels of activation in this system
are hypothesized to reflect a diathesis involved in modulating an
individual’s propensity to experience approach-related affect
and to engage in appetitively motivated behavior. In a study
consistent with this notion, subjects with greater resting left-
sided frontal activity (as reflected by lower power within the
alpha EEG band, 8–13 Hz) were found to select more pleasant
stimuli in a later judgment task compared with subjects with
greater resting right-sided frontal activity (Sutton & Davidson,
2000). As 60% of the variance in frontal EEG alpha asymmetry
is thought to reflect a latent trait (Hagemann, Naumann, Thayer,
& Bartussek, 2002), these findings suggest that tonically in-
creased left-lateralized activity may predispose an individual to
information processing biases toward positive cues.
In the present study, we aimed to extend this literature in two
important ways. First, although theoretical arguments predict
that individual differences in frontal EEG asymmetry are as-
sociated with differences in propensity to engage in appetitively
motivated behavior, few studies have specifically assessed this
link (Sutton & Davidson, 2000). Second, although frontal EEG
Address correspondence to Diego A. Pizzagalli, Department of Psy-chology, Harvard University, 1220 William James Hall, 33 KirklandSt., Cambridge, MA 02138; e-mail: [email protected].
PSYCHOLOGICAL SCIENCE
Volume 16—Number 10 805Copyright r 2005 American Psychological Society
asymmetry has been typically found at midfrontal (F3/4), ante-
rior frontal (Fp1/2), or lateral frontal (F7/8) sites, little is known
about underlying intracerebral sources.
To address these two issues, we investigated relations between
baseline EEG data and recently published behavioral data from
our laboratory. In a behavioral study, Henriques and Davidson
(2000) studied the effect of incentives on performance during a
verbal memory task and found that healthy control subjects
changed their pattern of responding in both the reward and the
punishment conditions, compared with a neutral condition; this
strategy led to maximization of earnings. Of primary importance
for the current study is the finding that even among these healthy
subjects, substantial individual differences in reward bias
emerged. To test the hypothesis that individual differences in
reward bias are related to differences in resting left prefrontal
activation, we used low-resolution electromagnetic tomography
(LORETA; Pascual-Marqui et al., 1999) to compute the intra-
cerebral electrical sources underlying EEG alpha activity re-
corded at the scalp.
METHOD
Participants
Eighteen subjects (38.6 � 13.6 years; 10 females) recruited
from the community participated. Subjects were right-handed
(Chapmans’ Handedness Inventory score between 13 and 17;
Chapman & Chapman, 1987), were free of psychotropic medica-
tions, and had no current or past Axis I pathology in themselves
or first-degree relatives. Subjects gave informed written consent
to a protocol approved by the local institutional review board.
Task and Procedure
Data for the present study were derived from a larger study of
depression involving measurement of resting brain electric
(EEG) and metabolic (positron emission tomographic, PET)
activity, structural magnetic resonance imaging (MRI), and
neuropsychological assessment. Unlike prior studies on this
sample that have compared EEG, PET, and structural MRI data
of control and depressed subjects (Pizzagalli et al., 2002, 2004),
the current study tested whether, in control subjects, intrace-
rebral electrical sources underlying scalp-recorded EEG alpha
activity were linked to an individual’s propensity to respond with
approach-related tendencies, a topic not investigated before.
Signal Detection Task
After completing the state and trait forms of the Positive and
Negative Affect Schedule (PANAS; Watson, Clark, & Tellegen,
1988), subjects received instructions for a signal detection task,
which consisted of a verbal recognition task performed under
three payoff contingencies: neutral, reward, and punishment
(Henriques & Davidson, 2000). Six blocks (two for each con-
dition) were presented according to an order randomized across
subjects. At the beginning of each block, subjects were informed
of the payoff contingencies. Each block consisted of three parts:
First, 24 five- and six-letter target words were presented in
lowercase (height 5 1.0–1.5 cm) for 400 ms each (interstimulus
interval, ISI 5 200 ms). Immediately thereafter, a color dis-
tractor task (20 trials) was presented to prevent rehearsal of the
target words. For this task, subjects were instructed to determine
whether two circles displayed consecutively for 100 ms (ISI 5
2,000 ms) were of the same color. Finally, in the discrimination
task, 24 target and 24 distractor words were presented for 700
ms each in a randomized order, and subjects were instructed to
press one of two buttons to indicate whether or not each word had
been presented before. For each trial, visual feedback of ‘‘cor-
rect response’’ or ‘‘incorrect response’’ was provided. In the
neutral condition, accuracy feedback was displayed, but there
were no monetary consequences. In the reward condition, sub-
jects earned $0.10 for each correct identification of a target. In
the punishment condition, subjects lost $0.10 (from an initial
credit of $2.50) for each missed target identification. For both
the reward and the punishment conditions, accuracy feedback
was displayed along with the amount of money the subject had
earned thus far in the block.
EEG Data
The EEG recording involved 10 (5 eyes-closed, 5 eyes-open)
contiguous 3-min trials, as previously described (Pizzagalli
et al., 2004). For 12 subjects, the signal detection task was
performed in the morning, and the EEG recording occurred in
the afternoon of the same day. Because of scheduling issues
related to the PET measurement, 6 subjects underwent EEG
recording at a later session (on average, 13.5 days later).
Data Acquisition
Signal Detection Task
NeuroStim software (Neurosoft, Inc., El Paso, TX) was used to
present the signal detection task on a computer.
EEG Data
A Grass Model 12 Neurodata system using Model 12C pream-
plifiers was used to amplify the EEG and electro-oculogram
(EOG) data using a bandpass of 1 through 300 Hz and a 60-Hz
notch filter. Data were then digitally low-pass filtered at 100 Hz
and digitized on-line at 250 Hz. EEG data were recorded from
28 scalp sites (10/20 system plus FC3/4, FC7/8, CP5/6, PO3/4,
and FPz; reference: left ear) using a modified Lycra electrode
cap (Electro-Cap International, Inc., Eaton, OH; impedances
< 5 KO). Horizontal and vertical EOGs were recorded through
two additional channels (< 20 KO).
Data Reduction and Analysis
Signal Detection Task
For each subject, hit rate (HR) and false alarm rate (FAR)
were determined. Following Snodgrass and Corwin (1988), we
806 Volume 16—Number 10
Frontal Electroencephalography and Reward Responsiveness
computed response bias (RB) as follows: RB 5 FAR/[1 � (HR �FAR)]. This formula creates a range of RB scores from 0.0 (con-
servative) to 1.0 (liberal), with a score of .5 indicating no bias. RB
was computed for each block and then averaged within payoff
condition. Finally, to adjust for individual differences in baseline
response, we calculated a difference score between RB in each
payoff contingency and the neutral condition (Henriques & Dav-
idson, 2000). We refer to these difference scores as reward bias
(reward� neutral) and punishment bias (punishment� neutral).
EEG Data
After artifact detection, all available artifact-free 2,048-ms EEG
epochs (on average, 151.7 epochs per condition across subjects,
SD 5 99.6) were extracted from the eyes-closed trials and
subjected to conventional spectral analyses. On the basis of
prior research implicating baseline alpha activity in predicting
performance on affective (e.g., Sutton & Davidson, 2000;
Wheeler, Davidson, & Tomarken, 1993) and cognitive (e.g.,
Glass & Riding, 1999) tasks, as well as the potential functional
dissociation between lower and upper alpha activity (Kubicki,
Herrmann, Fichte, & Freund, 1979), we restricted analyses to
alpha1 (8.5–10.0 Hz) and alpha2 (10.5–12.0 Hz) bands. Resting
alpha activity was used as an inverse indicator of activation
(Shagass, 1972), in accordance with a large body of literature on
individual differences in tonic frontal EEG asymmetry (for re-
views, see Coan & Allen, 2004; Harmon-Jones, 2003). Thus,
stronger intracerebral sources of alpha activity were interpreted
as decreased activity.
In the next step, LORETA (Pascual-Marqui et al., 1999) was
used to estimate intracerebral electrical sources underlying
alpha1 and alpha2 activity recorded at the scalp. LORETA
computes current density (i.e., the amount of electrical current
flowing through a solid) without assuming any number of active
sources.1 The LORETA solution space (i.e., the locations in
which sources can be found) is composed of 2,394 cubic ele-
ments (‘‘voxels,’’ 7 � 7 � 7 mm) and is limited to cortical gray
matter and hippocampi, as defined by a digitized MRI available
from the Montreal Neurologic Institute (MNI; Montreal, Quebec,
Canada). Following established procedures (Pizzagalli et al.,
2004), we normalized LORETA activity to a total power of 1
before the statistical analyses.
Statistical Analyses
The main goal of this study was to assess links between frontal
EEG asymmetry and reward responsiveness. Accordingly, a
correlational approach was used.
Whole-Brain Analyses
Because LORETA data were not normally distributed across
subjects and voxels, Spearman’s rank correlations between
current density and reward bias (reward� neutral) and between
current density and punishment bias (punishment � neutral)
were computed at each voxel. Findings were considered sig-
nificant at p < .005, as prior studies using permutation proce-
dures have shown that this threshold provides adequate
protection against Type I errors (Pizzagalli et al., 2002).
Specificity Analyses
To assess the specificity of findings in terms of condition (reward
vs. punishment), laterality (left vs. right), and band (alpha1 vs.
alpha2), we used the Meng test for dependent correlations
(Meng, Rosenthal, & Rubin, 1992). As in prior studies (Pizza-
galli et al., 2004), current density was first averaged across
voxels within a cluster and then entered in further analyses.
For the laterality tests, homologous clusters were defined by
reversing the x (left-right) coordinate.
RESULTS
Whole-Brain Analyses
For alpha1, only one voxel in the posterior cingulate gyrus (x 5
�3, y 5 �25, z 5 36; Brodmann’s area, BA, 31) showed a
significant correlation between current density and reward bias
(r 5 �.65, p < .005). No significant findings emerged for
punishment bias. Because of the limited spatial extent of this
finding, no further analyses were performed with alpha1.
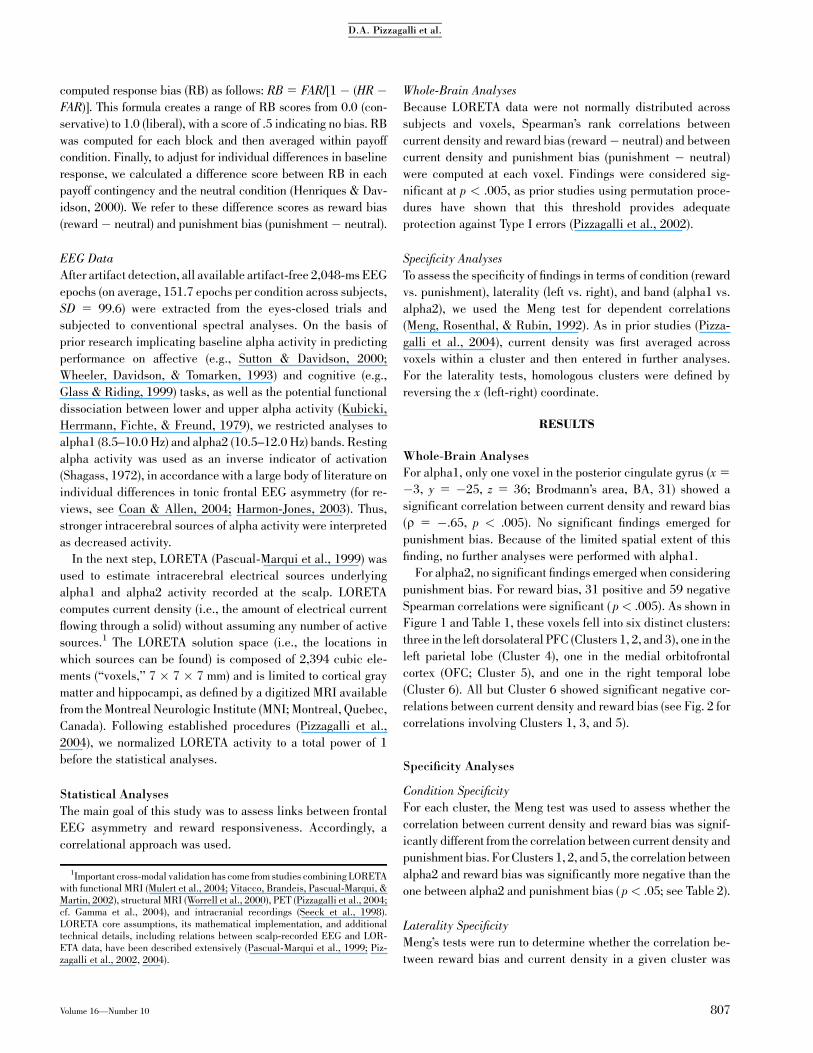
For alpha2, no significant findings emerged when considering
punishment bias. For reward bias, 31 positive and 59 negative
Spearman correlations were significant ( p< .005). As shown in
Figure 1 and Table 1, these voxels fell into six distinct clusters:
three in the left dorsolateral PFC (Clusters 1, 2, and 3), one in the
left parietal lobe (Cluster 4), one in the medial orbitofrontal
cortex (OFC; Cluster 5), and one in the right temporal lobe
(Cluster 6). All but Cluster 6 showed significant negative cor-
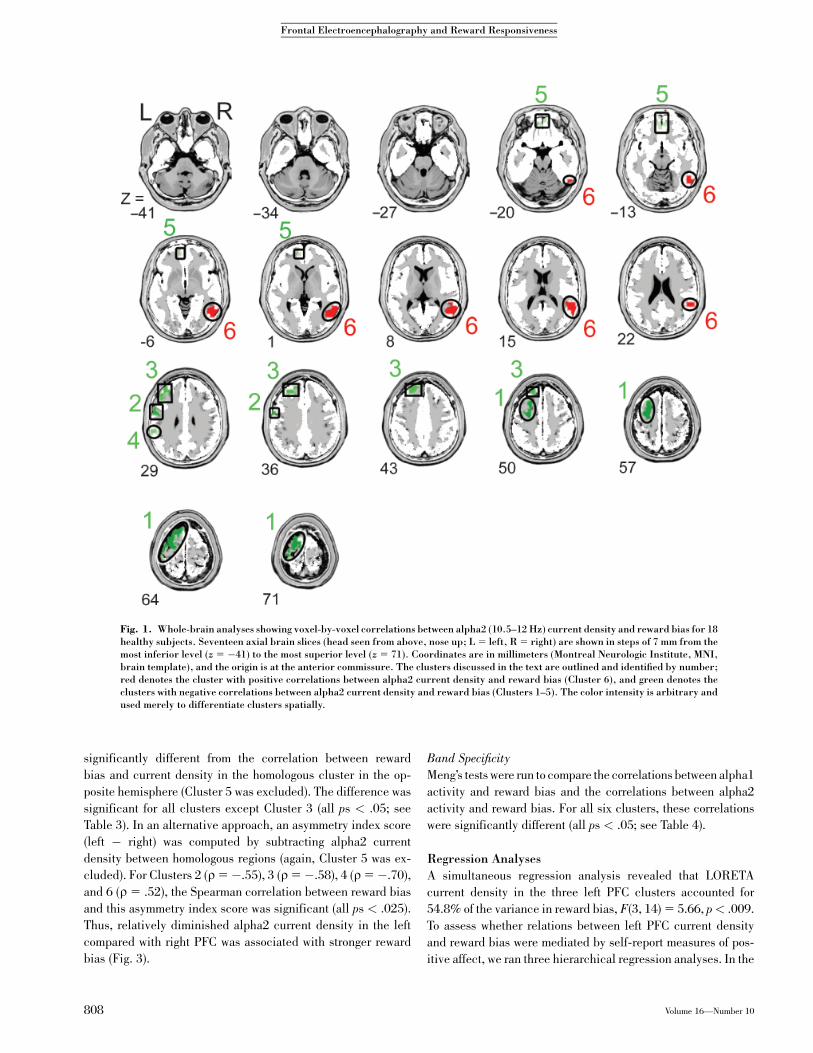
relations between current density and reward bias (see Fig. 2 for
correlations involving Clusters 1, 3, and 5).
Specificity Analyses
Condition Specificity
For each cluster, the Meng test was used to assess whether the
correlation between current density and reward bias was signif-
icantly different from the correlation between current density and
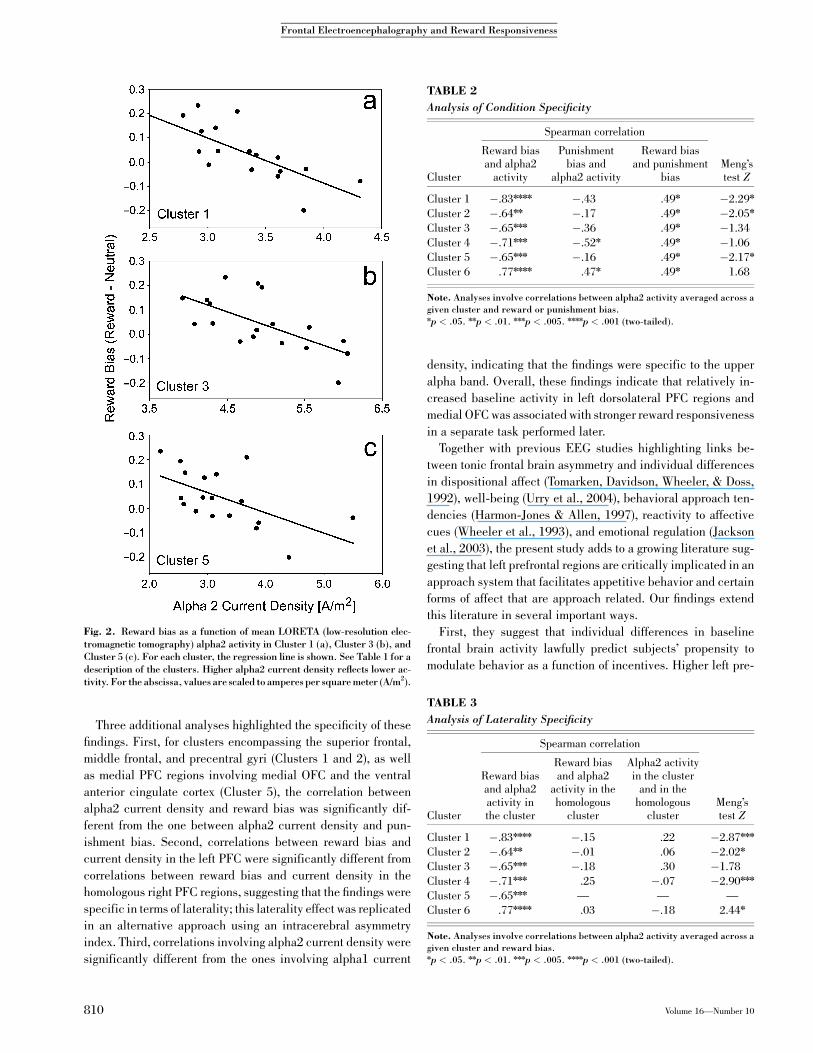
punishment bias. For Clusters 1, 2, and 5, the correlation between
alpha2 and reward bias was significantly more negative than the
one between alpha2 and punishment bias ( p< .05; see Table 2).
Laterality Specificity
Meng’s tests were run to determine whether the correlation be-
tween reward bias and current density in a given cluster was
1Important cross-modal validation has come from studies combining LORETAwith functional MRI (Mulert et al., 2004; Vitacco, Brandeis, Pascual-Marqui, &Martin, 2002), structural MRI (Worrell et al., 2000), PET (Pizzagalli et al., 2004;cf. Gamma et al., 2004), and intracranial recordings (Seeck et al., 1998).LORETA core assumptions, its mathematical implementation, and additionaltechnical details, including relations between scalp-recorded EEG and LOR-ETA data, have been described extensively (Pascual-Marqui et al., 1999; Piz-zagalli et al., 2002, 2004).
Volume 16—Number 10 807
D.A. Pizzagalli et al.
significantly different from the correlation between reward
bias and current density in the homologous cluster in the op-
posite hemisphere (Cluster 5 was excluded). The difference was
significant for all clusters except Cluster 3 (all ps < .05; see
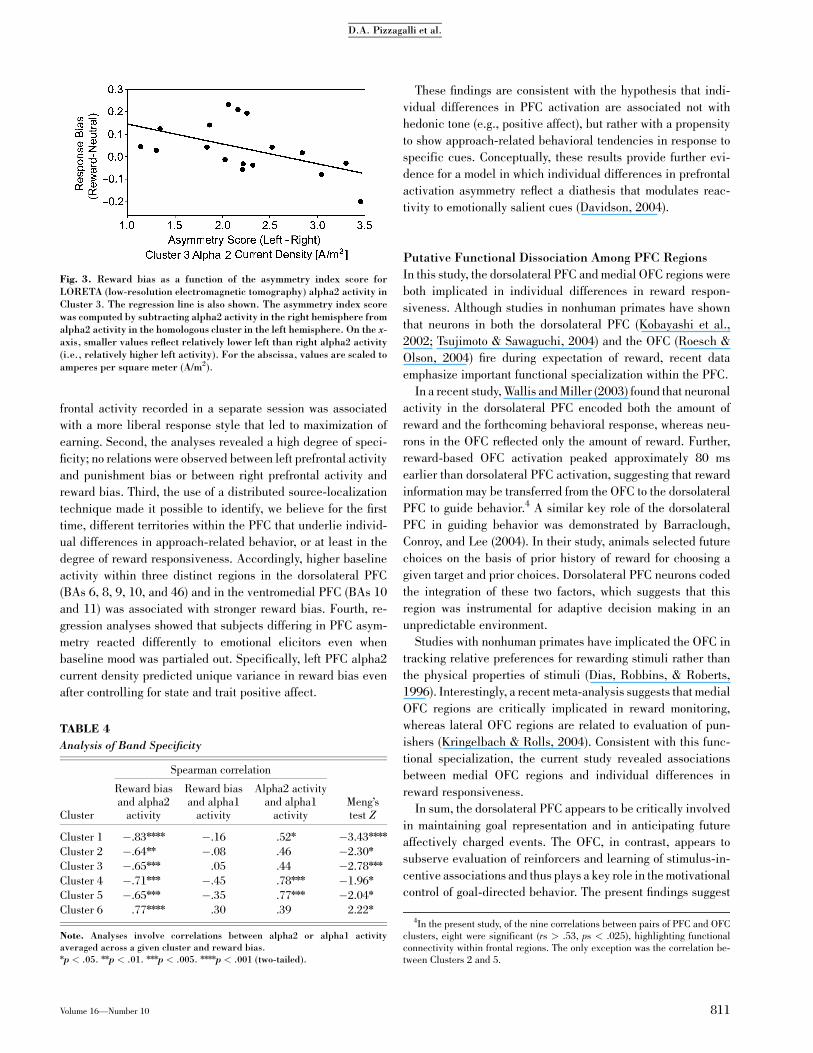
Table 3). In an alternative approach, an asymmetry index score
(left � right) was computed by subtracting alpha2 current
density between homologous regions (again, Cluster 5 was ex-
cluded). For Clusters 2 (r 5�.55), 3 (r 5�.58), 4 (r 5�.70),
and 6 (r 5 .52), the Spearman correlation between reward bias
and this asymmetry index score was significant (all ps < .025).
Thus, relatively diminished alpha2 current density in the left
compared with right PFC was associated with stronger reward
bias (Fig. 3).
Band Specificity
Meng’s tests were run to compare the correlations between alpha1
activity and reward bias and the correlations between alpha2
activity and reward bias. For all six clusters, these correlations
were significantly different (all ps < .05; see Table 4).
Regression Analyses
A simultaneous regression analysis revealed that LORETA
current density in the three left PFC clusters accounted for
54.8% of the variance in reward bias, F(3, 14) 5 5.66, p< .009.
To assess whether relations between left PFC current density
and reward bias were mediated by self-report measures of pos-
itive affect, we ran three hierarchical regression analyses. In the
Fig. 1. Whole-brain analyses showing voxel-by-voxel correlations between alpha2 (10.5–12 Hz) current density and reward bias for 18healthy subjects. Seventeen axial brain slices (head seen from above, nose up; L 5 left, R 5 right) are shown in steps of 7 mm from themost inferior level (z 5 �41) to the most superior level (z 5 71). Coordinates are in millimeters (Montreal Neurologic Institute, MNI,brain template), and the origin is at the anterior commissure. The clusters discussed in the text are outlined and identified by number;red denotes the cluster with positive correlations between alpha2 current density and reward bias (Cluster 6), and green denotes theclusters with negative correlations between alpha2 current density and reward bias (Clusters 1–5). The color intensity is arbitrary andused merely to differentiate clusters spatially.
808 Volume 16—Number 10
Frontal Electroencephalography and Reward Responsiveness

first, state Positive Affect (PA) scores were entered in the first
step, and current density in the three left PFC clusters was
entered in the second step. The second analysis was the same
except that trait, rather than state, PA scores were entered in the
first step. In the third regression analysis, state PA was entered
in the first step, trait PA was entered in the second step, and
current density was entered in the third step. Results showed
that left PFC current density continued to explain unique var-
iance in reward bias even when controlling for state PA scores,
DR2 5 .45, DF(3, 13) 5 4.61, p 5 .021; trait PA scores, DR2 5
.36, DF(3, 13) 5 3.76, p 5 .038; or both, DR2 5 .37, DF(3, 12)
5 3.53, p 5 .049.
Control Analyses
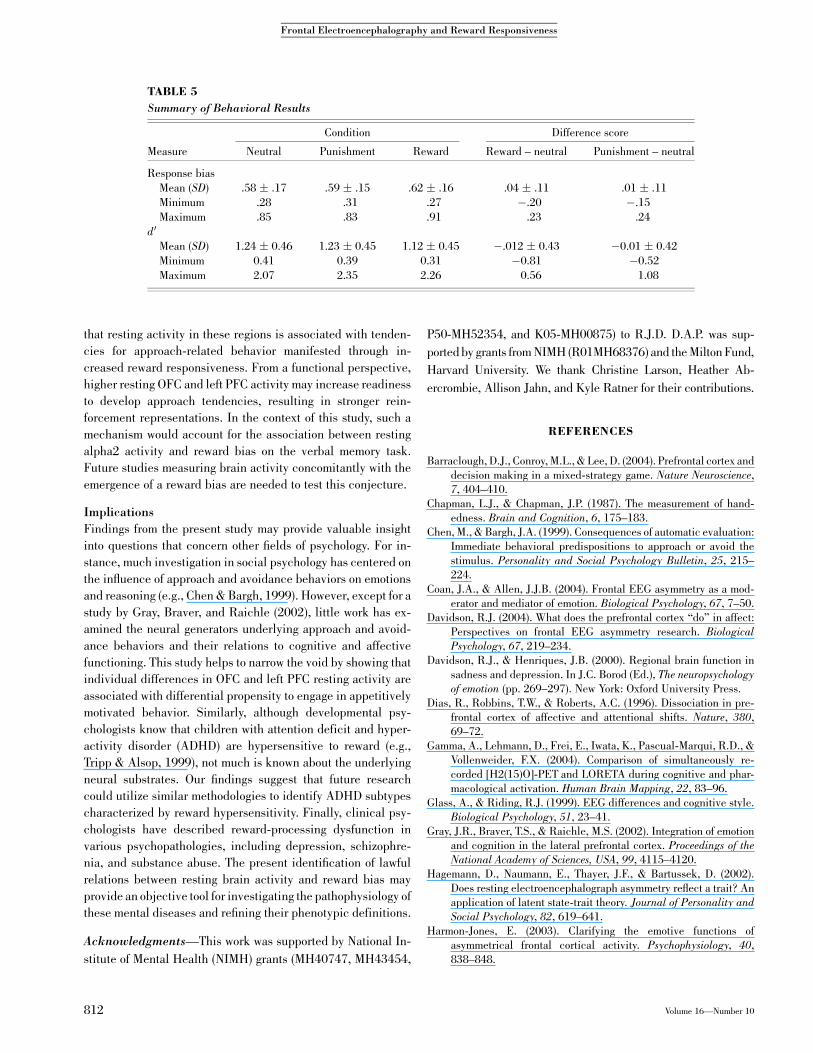
Behavioral Data
Additional analyses were run to fully explore links between
LORETA and behavioral data (Table 5). First, reward and
punishment bias had similar means, variances, and ranges, in-
dicating that the correlational findings reported earlier were not
due to differences among the conditions in task strategies or
psychometric properties. Second, no differences in d0 (Mac-
millan & Creelman, 1991) emerged among the neutral, reward,
and punishment conditions, suggesting there were no differ-
ences in the ability to accurately distinguish words presented
during the verbal memory task (all pair-wise |ts|(17) < 1.66, all
ps > .10). Finally, for all conditions, no significant correlations
emerged between RB and d0 (neutral: r 5 �.33; reward: r 5
�.14; punishment: r 5 �.36; all ps > .14).
EEG Data
Fisher tests revealed no differences in correlations between
behavioral and LORETA data for subjects performing the verbal
memory task on the day of the EEG recording versus a later time
(|Z|< 1.53, n.s.). Moreover, no significant differences in alpha2
or behavioral data were seen between male (n 5 8) and female
(n 5 10) participants, or among subjects performing the pun-
ishment (n 5 8), reward (n 5 6), or neutral (n 5 4) condition
first. Thus, the links between EEG and behavioral data were not
affected by gender or counterbalancing.
DISCUSSION
The goals of the present study were to investigate (a) whether
resting EEG alpha activity was associated with reward bias in a
separate verbal memory task performed under varying incentive
(monetary) conditions and (b) the EEG sources that underlie
approach-related behavioral tendencies. Using a promising
source-localization technique to estimate intracerebral sources
underlying scalp-recorded brain electric activity, we found that
alpha2 current density in three left dorsolateral PFC regions, the
medial OFC, and the left parietal lobe2 was negatively corre-
lated with reward bias, suggesting that higher activity in these
regions (reflected in lower alpha2 current density) was associ-
ated with a stronger reward bias on the task. Thus, subjects with
increased resting medial OFC and left PFC activity had a higher
propensity to define an ambiguous stimulus as a target when
reward was involved than did subjects with lower activity within
these regions.3
TABLE 1
Summary of Regions Showing Significant Correlations Between Reward Bias and Alpha2 (10.5–12 Hz)
Current Density
Region (cluster number) Highest correlation Coordinates (x, y, z) BA Side Number of voxels Mean correlation
1: middle frontal gyrus �.84nnnn �24, �11, 50 6 Left 31 �.77nnnn
2: precentral gyrus �.69nnn �59, 3, 29 6 Left 4 �.66nnn
3: superior frontal gyrus �.77nnnn �17, 38, 50 8 Left 14 �.68nnn
4: inferior parietal lobule �.72nnn �59, �39, 29 40 Left 2 �.71nnn
5: orbital gyrus �.68nnn �3, 52, �20 11 Medial 8 �.66nnn
6: superior temporal gyrus .75nnn 60, �53, 8 22 Right 31 .69nnn
Note. Coordinates given are in millimeters (Montreal Neurologic Institute, MNI, brain template), with the origin at the anteriorcommissure; x ranges from negative on the left to positive on the right, y ranges from negative in posterior regions to positive inanterior regions, and z ranges from negative in inferior regions to positive in superior regions. For each cluster, the number of voxelsexceeding the statistical threshold ( p < .005) is reported; the mean Spearman correlation is averaged across all voxels belonging tothe cluster. Cluster 1 is in left middle-superior frontal and precentral gyri, Brodmann’s areas (BAs) 6 and 8 (10.63 cm3); Cluster 2 isin left precentral gyrus, BA 6 (1.37 cm3); Cluster 3 is in left superior-middle frontal gyrus, BAs 8, 9, 10, and 46 (4.80 cm3); Cluster 4 isin the left inferior parietal lobule, BA 40 (0.69 cm3); Cluster 5 is in orbital and medial frontal gyri, as well as the ventral anteriorcingulate cortex, BAs 10 and 11 (2.74 cm3); Cluster 6 is in right inferior-middle-superior temporal gyri, inferior parietal lobule, andmiddle occipital, supramarginal, and fusiform gyri, BAs 3, 19, 21, 22, 37, 39, and 40 (10.63 cm3).nnnp < .005. nnnnp < .001.
2Because we had no a priori hypotheses for the involvement of left parietalregions in reward bias, we do not discuss the role of this region in this processfurther.
3This study found no relations between right PFC activity and punishment,although such relations are expected from the approach-withdrawal model(Davidson, 2004; Harmon-Jones, 2003). Although the reasons for this nullfinding are not entirely clear, it is possible that the punishment manipulation wasnot powerful enough to induce withdrawal-related tendencies (subjects couldavoid monetary loss through correct target identification).
Volume 16—Number 10 809
D.A. Pizzagalli et al.
Three additional analyses highlighted the specificity of these
findings. First, for clusters encompassing the superior frontal,
middle frontal, and precentral gyri (Clusters 1 and 2), as well
as medial PFC regions involving medial OFC and the ventral
anterior cingulate cortex (Cluster 5), the correlation between
alpha2 current density and reward bias was significantly dif-
ferent from the one between alpha2 current density and pun-
ishment bias. Second, correlations between reward bias and
current density in the left PFC were significantly different from
correlations between reward bias and current density in the
homologous right PFC regions, suggesting that the findings were
specific in terms of laterality; this laterality effect was replicated
in an alternative approach using an intracerebral asymmetry
index. Third, correlations involving alpha2 current density were
significantly different from the ones involving alpha1 current
density, indicating that the findings were specific to the upper
alpha band. Overall, these findings indicate that relatively in-
creased baseline activity in left dorsolateral PFC regions and
medial OFC was associated with stronger reward responsiveness
in a separate task performed later.
Together with previous EEG studies highlighting links be-
tween tonic frontal brain asymmetry and individual differences
in dispositional affect (Tomarken, Davidson, Wheeler, & Doss,
1992), well-being (Urry et al., 2004), behavioral approach ten-
dencies (Harmon-Jones & Allen, 1997), reactivity to affective
cues (Wheeler et al., 1993), and emotional regulation (Jackson
et al., 2003), the present study adds to a growing literature sug-
gesting that left prefrontal regions are critically implicated in an
approach system that facilitates appetitive behavior and certain
forms of affect that are approach related. Our findings extend
this literature in several important ways.
First, they suggest that individual differences in baseline
frontal brain activity lawfully predict subjects’ propensity to
modulate behavior as a function of incentives. Higher left pre-
Fig. 2. Reward bias as a function of mean LORETA (low-resolution elec-tromagnetic tomography) alpha2 activity in Cluster 1 (a), Cluster 3 (b), andCluster 5 (c). For each cluster, the regression line is shown. See Table 1 for adescription of the clusters. Higher alpha2 current density reflects lower ac-tivity. For the abscissa, values are scaled to amperes per square meter (A/m2).
TABLE 2
Analysis of Condition Specificity
Cluster
Spearman correlation
Meng’stest Z
Reward biasand alpha2
activity
Punishmentbias and
alpha2 activity
Reward biasand punishment
bias
Cluster 1 �.83nnnn �.43 .49n �2.29n
Cluster 2 �.64nn �.17 .49n �2.05n
Cluster 3 �.65nnn �.36 .49n �1.34
Cluster 4 �.71nnn �.52n .49n �1.06
Cluster 5 �.65nnn �.16 .49n �2.17n
Cluster 6 .77nnnn .47n .49n 1.68
Note. Analyses involve correlations between alpha2 activity averaged across agiven cluster and reward or punishment bias.np < .05. nnp < .01. nnnp < .005. nnnnp < .001 (two-tailed).
TABLE 3
Analysis of Laterality Specificity
Cluster
Spearman correlation
Meng’stest Z
Reward biasand alpha2activity inthe cluster
Reward biasand alpha2
activity in thehomologous
cluster
Alpha2 activityin the cluster
and in thehomologous
cluster
Cluster 1 �.83nnnn �.15 .22 �2.87nnn
Cluster 2 �.64nn �.01 .06 �2.02n
Cluster 3 �.65nnn �.18 .30 �1.78
Cluster 4 �.71nnn .25 �.07 �2.90nnn
Cluster 5 �.65nnn — — —
Cluster 6 .77nnnn .03 �.18 2.44n
Note. Analyses involve correlations between alpha2 activity averaged across agiven cluster and reward bias.np < .05. nnp < .01. nnnp < .005. nnnnp < .001 (two-tailed).
810 Volume 16—Number 10
Frontal Electroencephalography and Reward Responsiveness
frontal activity recorded in a separate session was associated
with a more liberal response style that led to maximization of
earning. Second, the analyses revealed a high degree of speci-
ficity; no relations were observed between left prefrontal activity
and punishment bias or between right prefrontal activity and
reward bias. Third, the use of a distributed source-localization
technique made it possible to identify, we believe for the first
time, different territories within the PFC that underlie individ-
ual differences in approach-related behavior, or at least in the
degree of reward responsiveness. Accordingly, higher baseline
activity within three distinct regions in the dorsolateral PFC
(BAs 6, 8, 9, 10, and 46) and in the ventromedial PFC (BAs 10
and 11) was associated with stronger reward bias. Fourth, re-
gression analyses showed that subjects differing in PFC asym-
metry reacted differently to emotional elicitors even when
baseline mood was partialed out. Specifically, left PFC alpha2
current density predicted unique variance in reward bias even
after controlling for state and trait positive affect.
These findings are consistent with the hypothesis that indi-
vidual differences in PFC activation are associated not with
hedonic tone (e.g., positive affect), but rather with a propensity
to show approach-related behavioral tendencies in response to
specific cues. Conceptually, these results provide further evi-
dence for a model in which individual differences in prefrontal
activation asymmetry reflect a diathesis that modulates reac-
tivity to emotionally salient cues (Davidson, 2004).
Putative Functional Dissociation Among PFC Regions
In this study, the dorsolateral PFC and medial OFC regions were
both implicated in individual differences in reward respon-
siveness. Although studies in nonhuman primates have shown
that neurons in both the dorsolateral PFC (Kobayashi et al.,
2002; Tsujimoto & Sawaguchi, 2004) and the OFC (Roesch &
Olson, 2004) fire during expectation of reward, recent data
emphasize important functional specialization within the PFC.
In a recent study, Wallis and Miller (2003) found that neuronal
activity in the dorsolateral PFC encoded both the amount of
reward and the forthcoming behavioral response, whereas neu-
rons in the OFC reflected only the amount of reward. Further,
reward-based OFC activation peaked approximately 80 ms
earlier than dorsolateral PFC activation, suggesting that reward
information may be transferred from the OFC to the dorsolateral
PFC to guide behavior.4 A similar key role of the dorsolateral
PFC in guiding behavior was demonstrated by Barraclough,
Conroy, and Lee (2004). In their study, animals selected future
choices on the basis of prior history of reward for choosing a
given target and prior choices. Dorsolateral PFC neurons coded
the integration of these two factors, which suggests that this
region was instrumental for adaptive decision making in an
unpredictable environment.
Studies with nonhuman primates have implicated the OFC in
tracking relative preferences for rewarding stimuli rather than
the physical properties of stimuli (Dias, Robbins, & Roberts,
1996). Interestingly, a recent meta-analysis suggests that medial
OFC regions are critically implicated in reward monitoring,
whereas lateral OFC regions are related to evaluation of pun-
ishers (Kringelbach & Rolls, 2004). Consistent with this func-
tional specialization, the current study revealed associations
between medial OFC regions and individual differences in
reward responsiveness.
In sum, the dorsolateral PFC appears to be critically involved
in maintaining goal representation and in anticipating future
affectively charged events. The OFC, in contrast, appears to
subserve evaluation of reinforcers and learning of stimulus-in-
centive associations and thus plays a key role in the motivational
control of goal-directed behavior. The present findings suggest
Fig. 3. Reward bias as a function of the asymmetry index score forLORETA (low-resolution electromagnetic tomography) alpha2 activity inCluster 3. The regression line is also shown. The asymmetry index scorewas computed by subtracting alpha2 activity in the right hemisphere fromalpha2 activity in the homologous cluster in the left hemisphere. On the x-axis, smaller values reflect relatively lower left than right alpha2 activity(i.e., relatively higher left activity). For the abscissa, values are scaled toamperes per square meter (A/m2).
TABLE 4
Analysis of Band Specificity
Cluster
Spearman correlation
Meng’stest Z
Reward biasand alpha2
activity
Reward biasand alpha1
activity
Alpha2 activityand alpha1
activity
Cluster 1 �.83nnnn �.16 .52n �3.43nnnn
Cluster 2 �.64nn �.08 .46 �2.30n
Cluster 3 �.65nnn .05 .44 �2.78nnn
Cluster 4 �.71nnn �.45 .78nnn �1.96n
Cluster 5 �.65nnn �.35 .77nnn �2.04n
Cluster 6 .77nnnn .30 .39 2.22n
Note. Analyses involve correlations between alpha2 or alpha1 activityaveraged across a given cluster and reward bias.np < .05. nnp < .01. nnnp < .005. nnnnp < .001 (two-tailed).
4In the present study, of the nine correlations between pairs of PFC and OFCclusters, eight were significant (rs > .53, ps < .025), highlighting functionalconnectivity within frontal regions. The only exception was the correlation be-tween Clusters 2 and 5.
Volume 16—Number 10 811
D.A. Pizzagalli et al.
that resting activity in these regions is associated with tenden-
cies for approach-related behavior manifested through in-
creased reward responsiveness. From a functional perspective,
higher resting OFC and left PFC activity may increase readiness
to develop approach tendencies, resulting in stronger rein-
forcement representations. In the context of this study, such a
mechanism would account for the association between resting
alpha2 activity and reward bias on the verbal memory task.
Future studies measuring brain activity concomitantly with the
emergence of a reward bias are needed to test this conjecture.
Implications
Findings from the present study may provide valuable insight
into questions that concern other fields of psychology. For in-
stance, much investigation in social psychology has centered on
the influence of approach and avoidance behaviors on emotions
and reasoning (e.g., Chen & Bargh, 1999). However, except for a
study by Gray, Braver, and Raichle (2002), little work has ex-
amined the neural generators underlying approach and avoid-
ance behaviors and their relations to cognitive and affective
functioning. This study helps to narrow the void by showing that
individual differences in OFC and left PFC resting activity are
associated with differential propensity to engage in appetitively
motivated behavior. Similarly, although developmental psy-
chologists know that children with attention deficit and hyper-
activity disorder (ADHD) are hypersensitive to reward (e.g.,
Tripp & Alsop, 1999), not much is known about the underlying
neural substrates. Our findings suggest that future research
could utilize similar methodologies to identify ADHD subtypes
characterized by reward hypersensitivity. Finally, clinical psy-
chologists have described reward-processing dysfunction in
various psychopathologies, including depression, schizophre-
nia, and substance abuse. The present identification of lawful
relations between resting brain activity and reward bias may
provide an objective tool for investigating the pathophysiology of
these mental diseases and refining their phenotypic definitions.
Acknowledgments—This work was supported by National In-
stitute of Mental Health (NIMH) grants (MH40747, MH43454,
P50-MH52354, and K05-MH00875) to R.J.D. D.A.P. was sup-
ported by grants from NIMH (R01MH68376) and the Milton Fund,
Harvard University. We thank Christine Larson, Heather Ab-
ercrombie, Allison Jahn, and Kyle Ratner for their contributions.
REFERENCES
Barraclough, D.J., Conroy, M.L., & Lee, D. (2004). Prefrontal cortex and
decision making in a mixed-strategy game. Nature Neuroscience,
7, 404–410.
Chapman, L.J., & Chapman, J.P. (1987). The measurement of hand-
edness. Brain and Cognition, 6, 175–183.
Chen, M., & Bargh, J.A. (1999). Consequences of automatic evaluation:
Immediate behavioral predispositions to approach or avoid the
stimulus. Personality and Social Psychology Bulletin, 25, 215–
224.
Coan, J.A., & Allen, J.J.B. (2004). Frontal EEG asymmetry as a mod-
erator and mediator of emotion. Biological Psychology, 67, 7–50.
Davidson, R.J. (2004). What does the prefrontal cortex ‘‘do’’ in affect:
Perspectives on frontal EEG asymmetry research. BiologicalPsychology, 67, 219–234.
Davidson, R.J., & Henriques, J.B. (2000). Regional brain function in
sadness and depression. In J.C. Borod (Ed.), The neuropsychologyof emotion (pp. 269–297). New York: Oxford University Press.
Dias, R., Robbins, T.W., & Roberts, A.C. (1996). Dissociation in pre-
frontal cortex of affective and attentional shifts. Nature, 380,
69–72.
Gamma, A., Lehmann, D., Frei, E., Iwata, K., Pascual-Marqui, R.D., &
Vollenweider, F.X. (2004). Comparison of simultaneously re-
corded [H2(15)O]-PET and LORETA during cognitive and phar-
macological activation. Human Brain Mapping, 22, 83–96.
Glass, A., & Riding, R.J. (1999). EEG differences and cognitive style.
Biological Psychology, 51, 23–41.
Gray, J.R., Braver, T.S., & Raichle, M.S. (2002). Integration of emotion
and cognition in the lateral prefrontal cortex. Proceedings of theNational Academy of Sciences, USA, 99, 4115–4120.
Hagemann, D., Naumann, E., Thayer, J.F., & Bartussek, D. (2002).
Does resting electroencephalograph asymmetry reflect a trait? An
application of latent state-trait theory. Journal of Personality andSocial Psychology, 82, 619–641.
Harmon-Jones, E. (2003). Clarifying the emotive functions of
asymmetrical frontal cortical activity. Psychophysiology, 40,
838–848.
TABLE 5
Summary of Behavioral Results
Measure
Condition Difference score
Neutral Punishment Reward Reward – neutral Punishment – neutral
Response bias
Mean (SD) .58 � .17 .59 � .15 .62 � .16 .04 � .11 .01 � .11
Minimum .28 .31 .27 �.20 �.15
Maximum .85 .83 .91 .23 .24
d0
Mean (SD) 1.24 � 0.46 1.23 � 0.45 1.12 � 0.45 �.012 � 0.43 �0.01 � 0.42
Minimum 0.41 0.39 0.31 �0.81 �0.52
Maximum 2.07 2.35 2.26 0.56 1.08
812 Volume 16—Number 10
Frontal Electroencephalography and Reward Responsiveness

Harmon-Jones, E., & Allen, J.J.B. (1997). Behavioral activation sen-
sitivity and resting frontal EEG asymmetry: Covariation of puta-
tive indicators related to risk for mood disorders. Journal ofAbnormal Psychology, 106, 159–163.
Henriques, J.B., & Davidson, R.J. (2000). Decreased responsiveness to
reward in depression. Cognition & Emotion, 14, 711–724.
Jackson, D.C., Mueller, C.J., Dolski, I., Dalton, K.M., Nitschke, J.B.,
Urry, H.L., Rosenkranz, M.A., Ryff, C.D., Singer, B.H., & Dav-
idson, R.J. (2003). Now you feel it, now you don’t: Frontal brain
electrical asymmetry and individual differences in emotion reg-
ulation. Psychological Science, 14, 612–617.
Kobayashi, S., Lauwereyns, J., Koizumi, M., Sakagami, M., & Hiko-
saka, O. (2002). Influence of reward expectation on visuospatial
processing in macaque lateral prefrontal cortex. Journal of Neu-rophysiology, 87, 1488–1498.
Kringelbach, M.L., & Rolls, E.T. (2004). The functional neuroanatomy
of the human orbitofrontal cortex: Evidence from neuroimaging
and neuropsychology. Progress in Neurobiology, 72, 341–372.
Kubicki, S., Herrmann, W.M., Fichte, K., & Freund, G. (1979). Re-
flections on the topics: EEG frequency bands and regulation of
vigilance. Pharmakopsychiatrie Neuropsychopharmakologie, 12,
237–245.
Macmillan, N.A., & Creelman, D.C. (1991). Detection theory: A user’sguide. New York: Cambridge University Press.
Meng, X., Rosenthal, R., & Rubin, D.B. (1992). Comparing correlated
correlation coefficients. Psychological Bulletin, 111, 172–175.
Mulert, C., Jager, L., Schmitt, R., Bussfeld, P., Pogarell, O., Moller, H.J.,
Juckel, G., & Hegerl, U. (2004). Integration of fMRI and simul-
taneous EEG: Towards a comprehensive understanding of locali-
zation and time-course of brain activity in target detection.
NeuroImage, 22, 83–94.
Narushima, K., Kosier, J.T., & Robinson, R.G. (2003). A reappraisal of
poststroke depression, intra- and inter-hemispheric lesion loca-
tion using meta-analysis. Journal of Neuropsychiatry and ClinicalNeurosciences, 15, 422–430.
Pascual-Marqui, R.D., Lehmann, D., Koenig, T., Kochi, K., Merlo,
M.C., Hell, D., & Koukkou, M. (1999). Low resolution brain
electromagnetic tomography (LORETA) functional imaging in
acute, neuroleptic-naive, first-episode, productive schizophrenia.
Psychiatry Research: Neuroimaging, 90, 169–179.
Pizzagalli, D.A., Nitschke, J.B., Oakes, T.R., Hendrick, A.M., Horras,
K.A., Larson, C.L., Abercrombie, H.C., Schaefer, S.M., Koger,
J.V., Benca, R.M., Pascual-Marqui, R.D., & Davidson, R.J. (2002).
Brain electrical tomography in depression: The importance of
symptom severity, anxiety and melancholic features. BiologicalPsychiatry, 52, 73–85.
Pizzagalli, D.A., Oakes, T.R., Fox, A.S., Chung, M.K., Larson, C.L.,
Abercrombie, H.C., Schaefer, S.M., Benca, R.M., & Davidson,
R.J. (2004). Functional but not structural subgenual prefrontal
cortex abnormalities in melancholia. Molecular Psychiatry, 9,
393–405.
Pizzagalli, D.A., Shackman, A.J., & Davidson, R.J. (2003). The func-
tional neuroimaging of human emotion: Asymmetric contributions
of cortical and subcortical circuitry. In K. Hugdahl & R.J. Dav-
idson (Eds.), The asymmetrical brain (pp. 511–532). Cambridge,
MA: MIT Press.
Roesch, M.R., & Olson, C.R. (2004). Neuronal activity related to re-
ward value and motivation in primate frontal cortex. Science, 304,
307–310.
Seeck, M., Lazeyras, F., Michel, C.M., Blanke, O., Gericke, C.A., Ives,
J., Delavelle, J., Golay, X., Haenggeli, C.A., de Tribolet, N., &
Landis, T. (1998). Non-invasive epileptic focus localization
using EEG-triggered functional MRI and electromagnetic tomo-
graphy. Electroencephalography and Clinical Neurophysiology,
106, 508–512.
Shagass, C. (1972). Electrical activity of the brain. In N.S. Greenfield &
R.A. Sternbach (Eds.), Handbook of psychophysiology (pp. 263–
328). New York: Holt, Rinehart, and Winston.
Snodgrass, J.G., & Corwin, J. (1988). Pragmatics of measuring recog-
nition memory: Applications to dementia and amnesia. Journalof Experimental Psychology: General, 117, 34–50.
Sutton, S.K., & Davidson, R.J. (2000). Prefrontal brain electrical
asymmetry predicts the evaluation of affective stimuli. Neuro-psychologia, 38, 1723–1733.
Tomarken, A.J., Davidson, R.J., Wheeler, R.E., & Doss, R.C. (1992).
Individual differences in anterior brain asymmetry and funda-
mental dimensions of emotion. Journal of Personality and SocialPsychology, 62, 676–687.
Tripp, G., & Alsop, B. (1999). Sensitivity to reward frequency in boys
with attention deficit hyperactivity disorder. Journal of ClinicalChild Psychology, 28, 366–375.
Tsujimoto, S., & Sawaguchi, T. (2004). Neuronal representation of re-
sponse-outcome in the primate prefrontal cortex. Cerebral Cortex,
14, 47–55.
Urry, H.L., Nitschke, J.B., Dolski, I., Jackson, D.C., Dalton, K.M.,
Mueller, C.J., Rosenkranz, M.A., Ryff, C.D., Singer, B.H., &
Davidson, R.J. (2004). Making a life worth living: Neural corre-
lates of well-being. Psychological Science, 15, 367–372.
Vitacco, D., Brandeis, D., Pascual-Marqui, R., & Martin, E. (2002).
Correspondence of event-related potential tomography and func-
tional magnetic resonance imaging during language processing.
Human Brain Mapping, 17, 4–12.
Wallis, J.D., & Miller, E.K. (2003). Neuronal activity in primate
dorsolateral and orbital prefrontal cortex during performance of a
reward preference task. European Journal of Neuroscience, 18,
2069–2081.
Watson, D., Clark, L.A., & Tellegen, A. (1988). Development and val-
idation of brief measures of positive and negative affect: The
PANAS scales. Journal of Personality and Social Psychology, 54,
1063–1070.
Wheeler, R.E., Davidson, R.J., & Tomarken, A.J. (1993). Frontal brain
asymmetry and emotional reactivity: A biological substrate of af-
fective style. Psychophysiology, 30, 82–89.
Worrell, G.A., Lagerlund, T.D., Sharbrough, F.W., Brinkmann, B.H.,
Busacker, N.E., Cicora, K.M., & O’Brien, T.J. (2000). Localization
of the epileptic focus by low-resolution electromagnetic tomo-
graphy in patients with a lesion demonstrated by MRI. BrainTopography, 12, 273–282.
(RECEIVED 8/24/04; REVISION ACCEPTED 11/30/04;FINAL MATERIALS RECEIVED 12/1/04)
Volume 16—Number 10 813
D.A. Pizzagalli et al.