Ethics in scientific results application: Gene and life forms patenting
Upload
unibocconiCategory
view
2download
0
FROM PUBLISHING TO PATENTING: HOW TO
BECOME AN ACADEMIC INVENTOR?
S. Breschi1, F. Lissoni1,2 , F. Montobbio1,3
1 Cespri, Università Bocconi, Milan, Italy
2 Università degli studi di Brescia (corr. author: [email protected]), Italy
3 Università degli studi dell�Insubria, Varese Italy
Abstract: The paper contributes to ongoing debate on the relationship between publishing and patenting in university. By applying event history analysis to patent and publication data for a sample of Italian academic scientists, we show that more productive scientists are more likely to become academic inventors, to no detriment of their orientation towards basic research. Research co-operation with industry is a useful predictor of patenting, when IPRs are owned by business companies. Keywords: academic inventors; university patenting; open science; scientific productivity
JEL codes: O34; O31; C41
Financial support from the Italian Ministry of Education and Research (PRIN 2003133821_003) and Università degli studi dell�Insubria is gratefully acknowledged. Francesco Lissoni also benefited from a Fubright Visiting Scholarship, and the kind hospitality of the Sloan School of Management, MIT. Paolo Guatta and Elena Andreolli, and Valerio Sterzi provided skilful research assistance. The dissertation works by Alessandro Cattalini, Paolo Floriello, and Andrea Plebani have also provided valuable data.
2
1. Introduction
The creation and management of intellectual property rights (IPRs) on the results of academic
research is nowadays a major policy issue. University patenting has attracted most of the attention, as
a result of the impressive growth of patents granted to academic institutions in the US since the
approval of the Bayh-Dole Act in 1980, and the related increase of university revenues coming from
patent licensing (Mowery et al., 2004; AUTM, 2003). While no other developed country has
experienced a similar university patent explosion, the US example has been impressive enough to
generate a wave of policy measures in all countries, aimed at increasing university-industry
technology transfer and promoting the creation of clear-cut IPRs over the results of public funded
research (OECD, 2003).
Evaluating this policy trend requires a better understanding of two distinct issues. First, it is not yet
entirely clear whether pushing the faculty to patent the results of their research lead to a genuine
increase in the technology transfer efforts, or to a diversion from basic science to more applied
targets1. In order to shed light on the existence of a possible trade-off between basic research and
technology transfer, one needs to investigate the effects of patenting on the academic researchers�
core activity, namely the publication of scientific papers on refereed journals.
Second, more information on European countries have to be gathered, in order to avoid that the sheer
imitation of the US experience will clash against the institutional specificities of different countries.
To date, only the above mentioned OECD report has collected some cross-section data for a few
European countries, but they are limited to one year of observation, and to patents owned directly by
universities and public labs2. For countries such as Germany, where for long IPRs over academic
research results were assigned to professors, these statistics may be deceptive. Besides, in the
absence of a strong tradition of universities� involvement in IPR matters, it is most likely that
researchers receiving at least partial funding from business companies will leave all the IPRs over
their research to those companies. Therefore, assessing the contribution of academia to business-
owned patents helps evaluating the extent of university-industry transfer links already in place.
Finally, longitudinal data are required to evaluate trends.
1 By �genuine technology transfer effort� we mean here an additional research effort aimed at developing promising inventions already obtained, as �proofs of concept� or �prototypes�, by curiosity-driven, or basic research (that is, �normal� academic science). US legislators passing the Bayh-Dole Act aimed precisely at creating the right system of incentives to solicit that effort, under the presumption that a lack of it was undermining the more general goal of promoting innovation by funding science (Jensen and Thursby, 2001). The same presumption seems nowadays to underline the EU policy-makers who believe in the existence of a �European Paradox�, that is of a strong European science base, not coupled to effective technology transfer means (Dosi, Llerena and Sylos-Labini, 2005). 2 Similar data for the case of Finland have been collected by Meyer (2003) and Meyer et al. (2003). For the case of Belgium, see also Saragossi and van Pottelsberghe (2003).

3
This paper belongs to a series of two aimed at to these two research issues for the Italian case. It is
based upon a dataset containing all the patent applications from Italian academic inventors addressed
to the European Patent Office, from 1978 to 1999; and on a dataset on publications authored by those
academic inventors and a matched sample of academic scientists with no patents in their CV. In
particular, we aim at checking whether more productive scientists are more or less prone to
patenting, and whether the orientation towards basic research is at odds with or favours patenting.
We are also interested in understanding whether the relationship between publishing and patenting
varies across disciplines, and between university-owned and business-owned patents; and whether
research co-operation with industry is a pre-requisite for patenting.
By applying event history (survival) analysis to our data, we reach the conclusion that more
productive scientists are more likely to become academic inventors, to no detriment of their
orientation towards basic research. Research co-operation with industry is a useful predictor of
patenting only when IPRs are owned by business companies. Environmental factors, such as the
presence of other academic inventors in the department, help explaining the propensity to patent.
In section 2 we discuss the existing literature on the academic patenting and its relationship to
scientific research and publishing. In section 3 we present our data, while in section 4 we report
results of our analysis. Section 5 concludes.
2. Patenting and publishing: complementarities and trade-offs
The relationship between patenting and publishing may be investigated at two different levels, one
which refers to the dissemination of research results, the other to the research objectives pursued by
scientists.
At the dissemination level, one has to explore whether scientific papers and patents are
complementary or alternative means for the diffusion of research results. Publishing in peer-reviewed
journals has been for long the chief dissemination channels of scientific research results. Well before
publication counts started being used as measures of scientific productivity, both for policy
evaluation and recruitment purposes, scientists circulated their writings both to diffuse their theories
and discoveries, and get credit for them (Chartier, 2003). The history of patents is no shorter, and it
is at least since the XVII century that obtaining a patent over a new technology required disclosing
the latter�s details (MacLeod, 2002). However, it has been argued that patents are nowadays the
results of an incentive system at odds with the priority reward system which has governed the
scientific community since the XVIII century, as described by Merton (1973). Even if both systems
put a prize on keeping research results secret for a while (until the submission of a scientific paper to
a journal or conference, or the application for a patent), they have very different disclosure rules and

4
attitudes towards cooperation. The priority reward system encourages scientists to disclose fully their
research achievements, via the publication of data, intense codification efforts (neat theorizing and
establishment of clear experimental routines), teaching duties, and repeated interaction/discussion
with peers (Dasgupta and David, 1994). The IPR-based system, on the contrary, may encourage
incomplete and selective disclosure. Patent-intensive firms rely heavily on secrecy to appropriate the
returns from non-patentable knowledge assets, many of which are produced or acquired along the
development phase of a patented invention (Cohen et al., 2000). As long as secrecy complements
patenting, academic scientists who are more committed to patent-oriented research may find it
difficult to publish all of their research results3.
At a more practical level, commitment to patenting may push academic inventors to delay the
publication of their research results, since placing them in the public domain before filing for a patent
would go against the novelty requirement as defined by most patent offices4.
Both the reduced propensity to publish and the publication delay effects may be stronger for patents
resulting from industry-sponsored research, especially when the scientists give away the IPRs over
his research to the sponsor as part of research contract5.
At the research objectives level, propositions on the relationship between publishing and patenting
derive from more fundamental visions of the relationship between science and technology.
A common concern regards the contents of academic enquiry, which could be diverted from �basic�
towards �applied� research. While the former can be portrayed as the unconstrained exploration of
nature and theory, the latter�s objectives are limited by the need to achieve results with some degree
of the �industrial applicability�, a crucial pre-requisite for patent applications to be successful. Lack
of commitment toward basic research may result either in a lower rate of publications in refereed
academic journals, or in less ambitious publications, with a lower impact on the progress of both
science and technology. Although never modelled theoretically, the possible existence of a basic-
applied science trade-off has been a long standing concern of both policy-makers and scientists (Bok,
2003).
3 More threats to the overall quantity and quality of scientific publications comes from the increasing cost of accessing research tools (Heller and Eisenberg, 1998), or the scientists� bias when testing products and technologies owned by their business sponsors (as in clinical tests; Campbell et al., 2002). 4 In principle, the publication delay may be mitigated by the so-called �grace period� rule, as in the US and Japan. The rule allows academic researchers to publish in advance their soon-to-be-patented inventions, as long as the publication occurs not too early (6 to 12 months before the patent application date). However, the European Patent Office does not allow for any grace period, so that any firm or inventor applying for a US or Japanese patent, but foreseeing to extend it to Europe, cannot exploit the rule (Kneller, 2001). 5 An additional issue relates to patenting of so-called research tools, such as scientific instruments, genetic sequences, and other seminal results. Exclusive licensing and fragmented IPR property over these kind of inventions may prevent research teams with lesser means from accessing to new research fields, or scare off scientists with fears of infringing some hidden patent. On this point, see the classic paper by Heller and Eisenberg (1998), and the more recent empirical work by Murray and Stern (2005) and Sampat (2005).

5
Alternatively, it has been proposed that close contacts between academic scientists and industry may
indeed be beneficial to basic research. The history of science-technology relationships is punctuated
by close contacts between scientists and industry, which have provided scientists with financial
resources and free access to expensive scientific instruments, as well as with �focussed� research
questions, data, and technical expertise. Answers to research questions raised by technology may be
at the same time economically valuable and scientifically relevant, up to the point of opening up new
research avenues and disciplines: as far as an academic scientist�s patenting record is a good proxy
of the scientist�s involvement with industry at such an high level (rather than mere consultancy) we
should expect a positive association between patents and publications (both in quantity and quality)6.
One further argument suggests that R&D-oriented business companies, especially those active in
science-based technologies, are as responsive as academic institutions to scientists� publications.
Their R&D staff screen academic publications routinely, publish actively, and participate to
conferences and workshops, thus joining the academic community, and sharing its judgements on
individual scientists� reputation (Hicks and Katz, 1996; for a survey: Iversen and Kaloudis,1999). It
follows that any academic scientists wishing to access the financial and cognitive resources of large
business companies must not give up its publication activity, but on the contrary must keep it up at
high levels even before producing a patentable invention
Under this perspective, we may expect more productive scientists to exhibit both a strong publication
record and a high propensity to appear as inventors on patent documents (whether or not they retain
the IPRs over their inventions). At the same time, collaboration with industry may enhance a
scientist�s productivity.
In a companion paper, we explore the effects of patenting on academic scientists� subsequent
publication record (Breschi et al., 2005). Here we do the opposite exercise, and check whether a
scientist�s publication record may explain her propensity to patent, that is to turn her into an
�academic inventor�. In particular, we test whether more productive scientists are more or less prone
to patenting, and whether the orientation towards basic research bears any relationship with
patenting.
We test for the influence of previous collaboration with industry, by including among the
determinants of propensity to patent the number of a scientist�s papers co-authored with industrial
researchers.
We are also interested in understanding whether the relationship between publishing and patenting
varies across disciplines, and between university-owned and business-owned patents. We expect the
6 The classic reference on �cognitive� resources is Rosenberg, 1982, ch. 8. For some recent empirical evidence, see Mansfield (1995, 1998) and Siegel et al. (2003)

6
probability to observe a positive relationship between publishing and patenting to be higher in
scientific fields wherein basic research is more readily exploitable by industry (the classical example
being Molecular Biology).
We pursue these research targets by treating patents as discrete events, which may or may not occur
at any point in a scientist�s career, and may possibly be explained by the scientist�s publication
record and a number of control variables. By applying a semiparametric survival analysis model, we
estimate the impact of each publication-based variable on the patenting hazard rate.
3. Data
The core data of this paper come from the EP-INV database, which contains all patent applications to
the European Patent Office (EPO) that designate at least one inventor with an Italian address, from
1978 to early 1999. The EP-INV database contains information on 30243 inventors and 38868 patent
applications.
Little more than 1400 of these applications come from 919 �academic inventors�, namely university
researchers and professors who appear both as designated inventors in the EP-INV dataset and in the
complete list of academic staff of science and engineering departments on active duty in year 2000
(27844 full professors, associate professors, or assistant professor) provided to us by MIUR, the
Italian Ministry of Education and Research. For a full description of the matching methodology and
contents of the dataset, see Balconi et al. (2004).
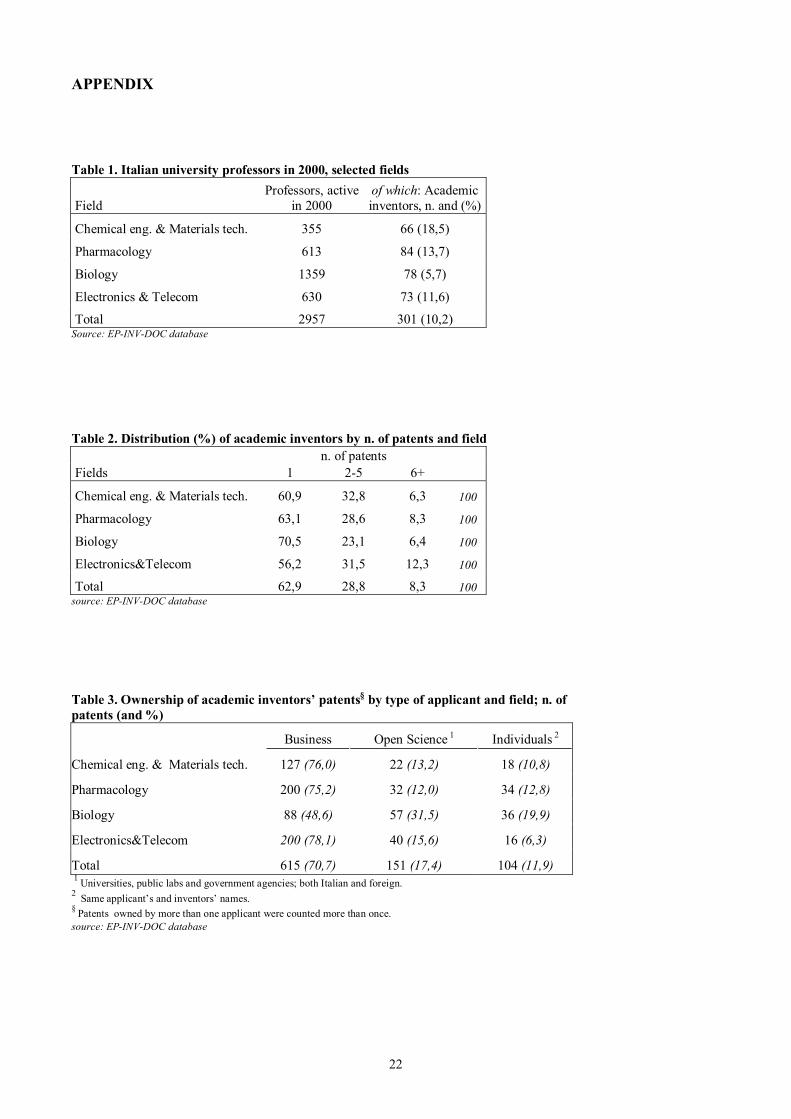
In this paper we focus on a few disciplines with a very high share of academic inventors over the
total number of professors. These can be found in fields such as Chemical Engineering (e.g.
technology of materials, such as macromolecular compounds), Biology, Pharmacology, and
Electronics (including Telecommunications), for a total of 301 academic inventors and 552 patents
(table 1). Many patents are the result of teamwork, with academic and non-academic inventors
working together. As for the distribution of patents over time, 75 of them date back to 1979-1985,
while the others are quite uniformly distributed over the remaining years. Most of the selected
inventors are full professors, born between 1940 and 1960 (more details in Breschi et al., 2005).
{TABLE 1 HERE}

7
A control sample was then built, by matching each academic inventor to a professor in the same
discipline, with the same academic ranking, and of a similar age7. Each academic inventor was
matched to a colleague never designated as inventors of patents applied for either at EPO or the US
Patent and Trademark Office8. When possible, controls were chosen among the academic inventors�
department colleagues or from university of similar size and importance, or from the same region.
We decided not to adopt stricter matching rules at the level of university/department (such as
choosing controls only from the same departments of the inventors), as they would have greatly
reduced the sample. For the same reason, we did not match our data on the basis of gender. The rules
we followed for matching inventors and controls at the university level provide satisfactory results:
as far as summary statistics of university size are concerned, we do not find systematic differences
between inventors and controls (see table A2 in the Appendix)9.
3.1 Patent data
The distribution of patents across academic inventors is highly skewed; most professors have signed
only one patent, and very few more than five (table 2). Most patents belong to business companies,
as a result of contractual funding, with little meaningful differences across fields, with the exception
of Biology, which records a higher number of both individual and university-owned patents (table 3).
We cannot be sure that all academic inventors signed their patents when they were already working
in a university: some patents may be the outcome of former jobs as industrial researchers or
employees of large public labs. However, we suspect these patents to be very few, as Italian
professors usually start pursuing the academic career right after graduating.
{TABLE 2 HERE}
7 The choice of discipline, rank, and age as matching variables follow the best-established results of quantitative studies in the sociology of science (e.g. Long et al., 1993). 8 For academic inventors born in between 1950 and 1970, we allowed for no more than 5 years of age difference with the controls. For professors born before 1950 the maximum age difference was 7 years. For academic inventors born after 1970 (just one) the maximum age difference reduced to 3 years. Exceptionally (no more than 10 cases) we matched a full professor (inventor) with an associate professor (control), or an associate professor with an assistant professor; in these cases the age criteria were stricter (maximum age difference: 3 and 5 years, respectively). 9 On how university and department affiliations may affect scientific productivity, see Allison and Long (1987, 1990). The Italian evaluation system of academic activities does not rank systematically universities and departments according

8
As for IPRs over public-funded research, in principle these belong to the sponsors (most often the
MIUR ministry, the National Research Council, and, in the past, ENEA, the National Agency for
Alternative Energy). However, until recently, the decision to take the first step towards patenting was
usually left to individual grant recipients and, if taken, the step was often met with passive
bureaucratic resistance by the funding institutes.
{TABLE 3 HERE}
A similar explanation applies to the scarcity of patents owned by the universities: until recently,
universities decided to take care of the application procedure and expenses to reward, often
symbolically, some brilliant researcher, rather than as the outcome of a consistent exploitation
strategy. As a result, few patent applications from public-funded research are completed, and even
less are extended outside the national level (so they do not appear in our dataset). It also happens that
many professors take the shortcut of patenting in their own names: this explain the presence of a few
inventors� own patents10. Finally, some �Open Science� patents come from international
collaborations, and are owned or co-owned by US and European universities or consortia.
Table A3 in the Appendix lists the most important applicants as well as the ownership concentration
ratios, by field. More than one third of the patents in the Electronics and Telecom field are in the
hands of ST Microelectronics, the largest semiconductor company in Italy and one of the very few
large hi-tech companies in Italy11. As for the other fields, ownership is so sparse that the National
Research Council (CNR) and the University of Rome, despite holding very few patents, turn out to
be ranked highly among patent applicants.
to the quality of their research. In the absence of better measures, we can measure the university size with the total number of professors (in hard science). 10 Inventors� own patents, however, are less than suggested by table 3. In fact, whenever an �individual� patent results from teamwork, all co-inventors figure as co-applicants. 11 In particular, ST Microelectronics has a long cooperation record with, among others, some researchers from the Department of Electronic Engineering of the University of Pavia (Balconi, Borghini and Moisello, 2003). The multinational group ENI plays a similar role in Chemical Engineering, although it has not close relationships with a single university.

9
It should be noticed that, in a few cases, the CNR and the universities enter table A4 as co-applicants
along with business companies, as a result of public-funded co-operative research projects. In this
case we assign the patent to the �business� category.
3.2 Institutional and personal data
Most information on individual professors and their institutions come directly from the MIUR list,
which contains the professors� date of birth, as well as their discipline, affiliation, and academic
ranking (assistant professor, associate professor, and full professor).
Disciplines are defined according to a classification created for administrative purposes; it is very
detailed and allows some compression into broader categories, which are referred to as �fields� (see
table A1 in the Appendix)12. It is hardly common for a professor to change discipline over his career,
and when this happens, movements can be safely assume to occur within the same field.
Affiliation refers to the university employing professors in year 2000. For each university we know
the size of the scientific faculty (NUNIj: n. of professors in hard sciences in university j in year
2000); we expect larger university to be better equipped in dealing with technology transfer issues, as
they may have some administrative staff devoted to manage intellectual property rights. We also
calculate the weight of the university in a specific field (USSDWj: n. of professors in university j / n.
of professors in Italy, by field) as well as the weight of the field within the university (SSDUWj: n. of
professors in a given field in university j / n. of professors in university j, for each field): we consider
the former as a proxy of the strength or prestige of the professor�s department within his own
university, and the latter as a proxy of the strength or prestige of the professor�s university in the
Italian academic system, in the professor�s field. Strenght or prestige may influence the availability
of research funds, from which the opportunity to invent may follow.
In the absence of longitudinal data on both the professors� affiliation, and the faculty size of
universities, we will make use of NUNI, USSDW and SSDUW as control variables throughout our
analysis, for all years comprised between 1978 and 1999. We justify this use of our data by pointing
out that academic mobility is a very limited phenomenon in Italy, and it is often confined to the very
early stages of a professor�s career. As for the absolute size of university faculties, this has increased
greatly over the years, but the same cannot be said of relative size: public universities in Milan,
Rome, and a few other large cities have remained the dominant institutions despite all changes. We
12 The MIUR list includes only those professors and researchers with tenured position (from now on, we will refer to them simply as �professors�). Thus our data miss fixed-term appointees who, at the time, had been working in one or more universities for one or more years, as well as all the PhD students, post-doc fellows, and technicians. In the current Italian system, assistant professor (called �researcher�) and associate professor positions, despite being only the first two steps of the academic career, are not offered as fixed-term appointments, but as tenured ones. The main differences with the position of full professor lie in wage and administrative power.

10
assume our variables to capture effectively the effects on academic patenting of university size
ranking, and to influence positively the propensity of a professor to sign a patent as inventor.
Other control variables we obtain from the MIUR list are the AGE and GENDER of professors
(GENDER equals 1 for women professors).
By combining our patent data and information on affiliation (in 2000), we have produced two
additional control variables: SHAREINV, which measures the percentage of inventors among each
professor�s colleagues (in the same university and field), at each point in time; CUMPATUNI, which
measures the stock of patents held by each professor�s university at each point in time. We expect
both of them to influence positively a professor�s propensity to sign a patent as inventor.
The main drawback of our data is the absence of information on either the graduation year or the
starting date of our professors� careers. This will force us to make some rules-of-thumb assumptions
when dealing with the entry date in our longitudinal dataset (see sections 3.3 and section 4 below).
However, for a subset of 139 academic inventors, additional data are available on their graduation
year (which allows to set a more precise entry date in our longitudinal dataset) and on whether they
hold a PhD, and when it was completed (from which we build a PHD dummy which takes value 1
from the PhD grant year onward). When limiting our analysis to academic inventors we will make
use of these more precise pieces of information.
3.3 Publication data
For academic inventors and their controls we collected scientific publications from the 2003 web
edition of the ISI Science Citation Index (SCI), starting from articles published in 1975.
For each professor we compute the average number of publications (AVG_PUB) at each point in
time, as the stock of publications divided by the years of activity. We expect AVG_PUB to influence
positively the academic researchers� propensity to patent, at least in those fields where science leads
more directly to invention.
Calculating the number of years of activity requires setting a starting date for a professor�s career. In
the absence of information on either the graduation year or the first year as assistant professor, we set
the starting date as the minimum between the 30th birth-year and the first year of publication activity.
This choice will possibly lead to overestimating the publication activity of professors with no papers
in the early stages of their career, as those years may be dropped from our analysis. This possibility
is most likely to occur for non-inventors, who record a higher number of zero-publication years (see
figure 1) and appear in general to be less productive than inventors (table 4). As we will find (section

11
4) that AVG_PUB indeed is most often positively related to patenting, we conclude that this
measurement problem does not undermine our conclusions.
{FIGURE 1 HERE}
{TABLE 4 HERE}
To test for the possibility that patenting occurs as a consequence of an intense research effort, which
produces jointly publishable and patentable results, we compute DELTA_PUB as the difference
between the yearly scientific production of a professor, and his current AVG_PUB value. We also
compute the 1- and 2-lagged values of DELTA_PUB.
Information on a professor�s research targets (basic vs. applied) come from a reclassification,
produced by CHI Research, of about 90% ISI-recorded journals (Hamilton, 2003). Journals are
assigned a score from 1 to 4 on the basis of their contents and scientific field, with score 1 for the
most applied kind of research and score 4 for the most basic13. We calculate AVG_BASIC and
DELTA_BASIC as the equivalents of AVG_PUB and DELTA_PUB for the journals with score 3
and 4.
Finally, in order to assess the extent of pre-existing research co-operation between academic
researchers and industry, we have calculated S_COPAT: for each in point in time, it represents the
share of cumulated publications co-authored by each professor with industrial researchers affiliated
to companies with at least one EPO patent application (not just Italian ones, but worldwide).
Information on the affiliation of professors� co-authors come again from ISI-Web of Science, while
13 The classification distinguishes between biomedical fields and all the other disciplines. In the first case, the scores
correspond to the following definitions of the journals� contents: l = "clinical observation" (eg. Journal of the American Medical Association) 2 = "clinical observation and investigation" (eg New England J. of Medicine) 3 = "clinical investigation" (eg Journal of Clinical Investigation) 4 = "basic biomedical research" (eg Journal of Biological Chemistry) In the second case the correspondence is: l = "applied technology" (eg Dyes and Pigments) 2 = "engineering science -technological science" (Journal of AOAC International) 3 = "applied research -targeted basic research" (Analytical Chemistry) 4 = "basic scientific research" (J. of the American Chemical Society)

12
information on worldwide patent applications to EPO come from the K4I dataset on EPO patents
(K4I, 2005).
4. Analysis
In order to explore the relationship between publication activity and patenting, we estimate the
patenting hazard rate of our subjects, that is the probability that a professor will patent in the current
year, conditional upon her not having patented so far (the time unit is the year).
As we do not have any a priori hypothesis on the functional form of the hazard function, we choose
to apply Cox semiparametric approach, which does not impose any parametric specification on the
baseline hazard function (that is, on the relationship between time and the probability of the event to
occur; Kalbfleisch and Prentice, 2002). This means adopting a proportional hazard model such as:
)exp()()|( 0 iiii xthxth β=
where h(ti|xi) is the hazard rate at time t for professor i, conditional upon a set of covariates xi, which
include both time-invariant characteristics of the professor (such as GENDER) and time-varying
ones (such as all variable related to the number of publications).
We first estimate the hazard function for a single patenting event, that is we choose professors as the
subjects of our exercise and let them in our sample at the latest between the starting year of their
career14 and 1978 (the opening year of the EPO, European Patent Office); academic inventors exit
the sample when they sign their first patent. In other words, we assume professors to be at risk of
patenting only from the opening of EPO in 1978, or from when they start their career (if later); and
not be anymore at risk once they sign their first patent. Time �at risk� runs from the entry in the
sample15.
{TABLE 5 HERE}
14 For our definition of �start� of a professor�s career see section 3.3 above 15 This means that we assume no left truncation in our data, as 1978 is the earliest possible entry year for all our professors, no matter whether they started their career before then. In other words, we disregard all patents taken at national offices before the opening of EPO as a relevant event for our analysis (none of our professors signed any US patent before 1978). We justify this treatment of our data by observing that very few professors have more than one patent, so the risk of ignoring some previous patenting activity is low; and that the equivalent of a EPO patent before 1978 should be not just any national patent, but a patent extended to all the most important EPO countries, which makes the risk of ignoring it even smaller.

13
We then proceed to check whether our results hold for repeated patenting events. In this case, the
professors enter our sample first in 1978 (or when they start their career, if later) and never exit, as
they are always at risk of patenting; however, after any patent the time �at risk� re-starts from 1, as
we assume each patenting event to be distinct from the previous one. Technically, this means
assuming that any professor with n>1 patents will enter our analysis as (n+1) distinct subjects, each
observed from time 1 onward. As we expect the recurrence times of all events concerning the same
professor to be highly correlated (that is, they not to be independent observations), we allow for
professor-specific random effects (frailty model; Lancaster, 1979). In other words, we assume the
hazard function for all mi observations referred to professor i to be:
)exp()(),|( 0 ijijiiijij xthxth βαα = with j=1�mi
where αi is a parameter common to all observations. As we do not have any a priori on the
probability density function of α i , we simply adopt the Gamma specification built in STATA, the
software package we used for our analysis. Estimates of the hazard function under the assumption of
a Gamma-distributed frailty parameter include an estimate of the distribution variance (θ), upon
which all standard errors of the parameters for the covariates are conditional. The �frailty�
assumption, that is the assumption of random effects at the professor level, is not rejected as long as
θ ≠ 0.
We finally check our results for a sample limited to the academic inventors only, for a number of
which we know both when they started their academic career and whether they hold a PhD.
Table 6 reports our estimates for the coefficients of the single-event hazard function. Equation (1)
suggests a positive association between patenting and publishing at two levels: first, professors who
experience an above-average publishing activity in year t-1 are more at risk of patenting the
following year; second, more productive professors are more at risk of patenting.
The first relationship derives from the positive and significant coefficient of DELTA_PUBt-1, which
implies that the hazard rate increases of about 11% with any additional paper published with the
respect to a professor�s average. It is hard to assign to this estimate a causal interpretation; rather, it
suggests that patenting and publishing are not alternative activities, and that patenting does not
impose any significant publication delay to academic inventors.
The second relationship is suggested by the positive value of the AVG-PUB coefficient, which
suggests that by adding one paper to a professor�s average productivity we obtain a 12% increase of
the hazard ratio.

14
One more relationship between publishing and patenting is the result of a �coauthorship� effects. As
suggested by the coefficient of S_COPAT (which ranges from 0 to 1), a 1% increase in the stock of
publications co-authored with industrial researchers (whose employers have at least one EPO patent)
increases the hazard rate of about 4%. This effect may be stronger than it looks at first sight:
publications are count data, and one or two publications more with industrial co-authors may mean
much more than a mere 1% increase in S_COPAT (for example, a mere 5% increase in S_COPAT
means a 19% increase of the hazard rate).
No age effects are observed, while a limited gender effect is detectable (all other things equal, the
hazard ratio for women is 8% less than that of men). As many studies in the sociology of science
have pointed out a negative gender effect on scientific productivity, what we have here is an
additional gender effect on the probability of patenting: women may be less likely to patent insofar
they have a lower publication record (Long at al., 1993), and because they are at a disadvantage in
patenting the results of their research.
{TABLE 6 HERE}
At the level of institution, the share of academic inventors over the total number of a professor�s
department colleagues (SHAREINV), exerts some positive effect on the hazard rate, albeit a very
limited one (a 50% higher share of academic inventors in the department means only a 1,5%
increase of the hazard ratio). No other variable at the institution level is significant.
None of the field dummies appears significant (pharmaceutical is the reference case). This excludes a
direct effect of a professor�s scientific field on the hazard rate. However, we tested for some indirect
effect, by interacting the field dummies with all the publication-related covariates. Neither the
interactions with DELTA-PUB nor those with AVG_BASIC appear to be significantly different from
each other.
On the contrary, scientific fields affect significantly the impact of S_COPAT on the hazard rate.
Equation (2) suggests that the highest effect is recorded in the Pharmaceutical field (baseline
coefficient 3.51) , and the lowest in the Chemical field (where the effect appears to be negative: 3.51-
8.52=-5.1).

15
In equation (3) we check whether our results still hold when considering only the publications on
journals more oriented to basic science. While the effect of the number of publication at time t-1
(DELTA_BASICt-1) seems confirmed, the same does not apply to the average number of
publications (AVG_BASIC).
{TABLE 7 HERE}
In table 7 we run separate regressions for patents owned by Business companies and patents assigned
to Open Science institutions (such as universities or public consortia16). As for impact of publications
on the hazard rates, no major differences from table 5 stand out, although the effect on the hazard
rate of a professor�s publications at time t-1 (DELTA_PUBt-1) may be somewhat smaller for the case
of Business-owned patents. When only basic science publications are considered no effect of
DELTA_BASIC t-1 is visible for Business patents. As for the effect of AVG_BASIC, this does not
appear to be significant for Open Science patents. None of these differences, however, appear to be
of major importance.
More strikingly (although not surprisingly), coauthorship with industrial researchers seem to affect
only the hazard rate for Business patents, with the same sign and possibly higher coefficients than we
observed for all patents.
At the same time, the field dummy for Biology appears to be significant for the Open Science
patents. This reflects the uneven distribution of patents between the Business and Open Science
category, with the latter hosting a larger proportion of patents by Biology professors.
An additional dummy variable (POSTPAT) takes value 1 for all inventors, starting on the year of
their first patent. It controls for the possibility that some inventors with Business patents may also
patent for an Open Science institution (or vice versa), and that one patenting experience may affect
the hazard rate for the other one. Its lag of significance reflect the low number (18) of academic
inventors with both kinds of patents.
Finally, we observe that a major difference in the effect of gender, with the disadvantage of women
totally confined to Business patents.
In table 8 we check for the robustness of our results by considering multiple events, that is by
modelling the hazard rate for both the first patents and the following ones.
16 We also add to this category the few patents assigned to individual inventors, as they do not originate from ties with industry and are most likely to result from some tacit arrangement between the academic inventor and her university�s administration

16
No major difference appear from the previous table. The loss of significance of the Biology field
dummy for the Open Science patents may be explained by the limited number of Biology professors
signing more than one patent, so that when counting all events the distribution of patents across
fields is less uneven.
As for the loss of significance of DELTA_PUBt-1 for Business Patents, this is due to the fact that
multiple Business patents most often appear at a very short time distance (usually at no more than 1
or two years of distance), as they are clearly the result of the same research project; exploration of
the data suggest that in these case no further increases of publication activity occurs after the first
patent.
The POSTPAT dummy used in table 7 is here replaced by STOCKPATt-1, that is the number of
patents signed by the inventor up to t-1. This variable affects only the hazard rate for Open Science
patents.
{TABLE 8 HERE}
Finally, table 9 reproduces equation (1) of table 8 only for a subset of 134 academic inventors, whose
BA and PhD graduation years we recovered through interviews. The exclusion of the non-inventors
gives much more weight, in the regression, to patenting events beyond the first one.
The role of AVG_PUB is confirmed, but the time structure of DELTA_PUB looks somehow altered,
as it is now the coefficient for current publications (DELTA) to affect significantly the hazard rate.
{TABLE 9 HERE}
The gender effect disappear, while the field dummies enter the regression in a different way (for ease
of exposition, Biology is now the reference case). We first notice that both the dummies for
Electronics and Pharmaceuticals affect directly, as a result of the higher number of multiple patents
by academic inventors in the two fields. The field variable again interact with S_COPAT, but now it
coauthorship within the field of Biology that seems to affect most the hazard rate (Chemicals is still

17
the field whether coauthorship matters less). In addition, the field dummies interact with the PhD
dummy: holding a PhD affects more heavily the hazard rate for Biology professors than for any other
else.
5. Discussion and conclusions
The results of the analysis conducted in section 4 suggest that no major trade-off exists between
patenting and publishing: academic inventors do not publish less than their colleagues with no
patents, and do not show a bias towards more applied, less basic science. If possible, our results
indicate the opposite, that is the existence of a positive link, by which more productive professors are
more likely to end up signing one or more patents. In this respect, our results confirm the results
obtained by Stephan et al. (2004) for the US case, while are at odds with Agrawal�s and Henderson�s
(2002) findings in their case study of MIT.
We also find that professors who register, in a given year, an higher-than-average productivity are
more likely to patent in the following year, which suggests patents to be most often the by-product of
a fertile research project. If confirmed, this interpretation may also suggest that professors manage to
publish (some of) their research results even before patenting, thus avoiding too long a publication
delay. This association between patenting and publishing in the short run is in line with findings by
Azoulay et al. (2004) and Markiewitz and DiMinin (2004). Contrarily to the latter, however, we do
not find evidence of a weaker publishing-patenting association for business-owned patents as
opposed to university-owned ones.
Scientific collaboration with industry, in the form of co-authored papers, affect the probability to
patent with Business companies, possibly as a result of the same research from which the co-
authored papers emerge. Academic fields such as Biology and Pharmaceutical, whose research
results are more directly exploitable by industry, are those for which the effect is stronger. This
results is in line with the broader literature on the importance of university-industry scientific
partnership in the Pharmaceutical industry, and more generally in the science-based technology fields
(Cockburn and Henderson, 1998).
Further research is needed to confirm and extend the results obtained so far. More accurate
information on the CVs of both academic inventors and their colleagues is needed (especially on the
level of their post-graduate education), as well measures of prestige and productivity at the
department level. While common and easily available in the US, these data have to built from scratch
from Italy (some attempts to build a general database have been under way by initiative of the
Conference of Italian Universities� Rectors, but no longitudinal data are available).

18
If further work with richer data will confirm the results obtained so far, we will have proven that
even in a weak system of innovation such as Italy, academic patenting is a non-negligible
phenomenon, which does not occur to the immediate detriment of research. It remains to be seen
whether academic inventors� research results, being protected by patents, are less likely to serve as
the basis to further research by other scientists, who may be put off by the risk of infringement or the
licensing costs (see footnote 3).

19
References
Agrawal A., Henderson R. (2002), �Putting Patents in Context: Exploring Knowledge Transfer from MIT�, Management Science 48, pp. 44-60
AUTM (2003), Licensing Survey 2003, Association of University Technology Managers, Northbrook IL
Azoulay P., Ding W., Stuart T.(2004), �The Effect of Academic Patenting on (Public) Research Output�, paper presented at the NBER Summer Institute: Academic Science and Entrepreneurship: Dual Engines of Growth?, 23 July, Cambridge MA
Balconi M., Borghini S., Moisello A. (2003), �Ivory Tower vs Spanning University: il caso dell�Università di Pavia�, in Bonaccorsi A. (ed.), Il sistema della ricerca pubblica in Italia, Franco Angeli
Balconi M., Breschi S., Lissoni F. (2004) �Networks of inventors and the role of academia: an exploration of Italian patent data� , Research Policy 33, pp. 127-145
Bok D. (2003), �Universities in the Marketplace�, Princeton University Press.
Breschi S., Lissoni F., Montobbio F. (2004), �Open Science and University Patenting: A Bibliometric Analysis of the Italian Case�, paper presented at the 4th EPIP Conference on European Policy and Intellectual Property, Paris Dauphine University, Paris, France, 1-2 October 2004.
Campbell E.G. et al. (2002), �Data Witholding in Academic Genetics: Evidence From a National Survey�, Journal of the American Medical Association 287, pp. 473-480
Chartier R. (2003), �Foucault�s Chiasmus. Authorship between Science and Literature in the Seventeenth and Eighteenth Centuries� in: Biagioli M., Galison P. (eds), Scientific Authorship, Routdlege
Cockburn I.M., Henderson R.M. (1998), �Absorptive capacity, coauthoring behavior, and the organization of research in drug discovery�, Journal of Industrial Economics XLVI, pp.157-182
Cohen W.M, Nelson R.R, Walsh J.P. (2000), �Protecting Their Intellectual Assets: Appropriability Conditions and Why U.S. Manufacturing Firms Patent (or Not), NBER Working Paper w7552, February
Dasgupta P., David P.A. (1994), �Toward a New Economics of Science�, Research Policy 23, pp. 487-521
Dosi G., Llerena P., Sylos-Labini M. (2005) �Science-Technology-Industry Links and the �European Paradox�: Some Notes on the Dynamics of Scientific and Technological Research in Europe�, LEM Papers Series 2005/02, Scuola Superiore Sant�Anna, Pisa
Hamilton K.S. (2003), Subfield and Level Classification of Journals, CHI No. 2012-R, CHI Research Inc.
Heller M. A., Eisenberg R.S. (1998), �Can Patents Deter Innovation? The Anticommons in Biomedical Research�, Science 280 (May) pp. 698-701

20
Hicks D.M., S.J. Katz, (1996), �Where is Science Going?�, Science, Technology and Human Values 21, pp. 379-406.
Iversen E.J., Kaloudis A. (1999), �The changing role of patents and publishing in basic and applied modes of organised research�, STEP Report series 1999/06
Jensen R.,Thursby M. (2001), �Proofs and Prototypes for Sale: The Licensing of University Inventions�, American Economic Review 91/1, pp.240-258
K4I (2005), EP-INV dataset, http://www.k4i.it
Kalbfleisch, J.D., Prentice R.L. (2002), The Statistical Analysis of Failure Time Data, John Wiley & Sons, New York
Kneller R. (2001), �Technology Transfer: A Review for Biomedical Researchers�, Clinical Cancer Research 7, pp. 761-774
Long J. S., Allison P. D., McGinnis R. (1993), �Rank Advancement in Academic Careers: Sex Differences and the Effects of Productivity�, American Sociological Review 58, pp. 703-722.
MacLeod C. (2002), Inventing the Industrial Revolution: The English Patent System 1660-1800, Cambridge University Press
Mansfield E. (1995), Academic research underlying industrial innovations: sources, characteristics, and financing Review of Economics and Statistics 77, pp. 55-65
Mansfield E. (1998), �Academic research and industrial innovation: An update of empirical findings�, Research Policy 26, pp. 773-776
Markiewicz K.R., Di Minin A. (2004), �Commercializing the Laboratory: The Relationship Between Faculty Patenting and Publishing�, Econ 222 / PHDBA 297-T: Seminar On Innovation, Haas School of Business
Merton R.K. (1973), �The Normative Structure of Science�, in: Storer N. W. (ed.), The sociology of science: Theoretical and empirical investigations, University of Chicago Press
Meyer M., 2003. Academics patents as an indicator of useful research? A new approach to measure academic inventiveness. Research Evaluation, vol 12, numero 1, pg 17-27.
Meyer M., Sinilainen T., Utecht J.T., 2003. Toward hybrid Triple Helix Indicators: A study of university-related patents and a survey of academic inventors. Scientometrics, vol 58, pg 321-350.
Mowery D., Nelson R.R., Sampat B. N., Ziedonis A. (2004), Ivory Tower and Industrial Innovation: University-Industry Technology Transfer Before and After the Bayh-Dole Act in the United States, Stanford University Press
Murray F., Stern S. (2004), �Do Formal Intellectual Property Rights Hinder the Free Flow of Scientific Knowledge? Evidence from Patent-Paper Pairs�, paper presented at the NBER Summer Institute: Academic Science and Entrepreneurship: Dual Engines of Growth?, 23 July, Cambridge MA
OECD (2003), Turning Science into Business: Patenting and Licensing at Public Research Organisations, OECD, Paris
21
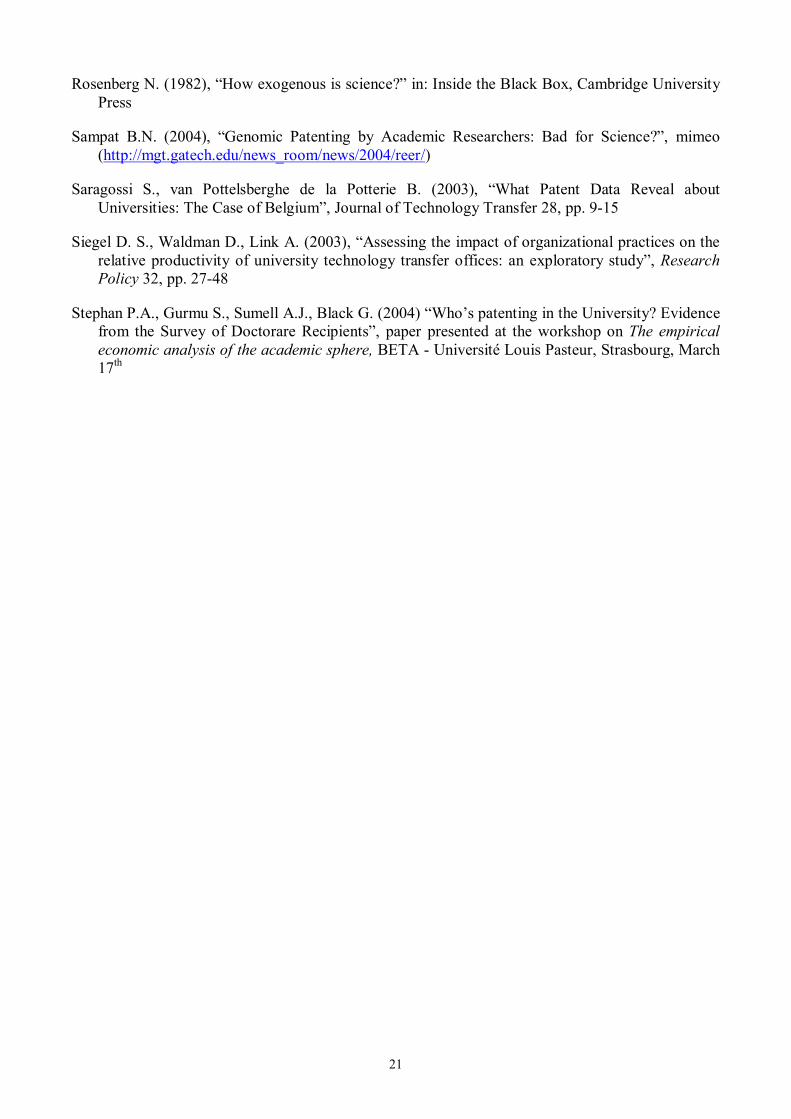
Rosenberg N. (1982), �How exogenous is science?� in: Inside the Black Box, Cambridge University Press
Sampat B.N. (2004), �Genomic Patenting by Academic Researchers: Bad for Science?�, mimeo (http://mgt.gatech.edu/news_room/news/2004/reer/)
Saragossi S., van Pottelsberghe de la Potterie B. (2003), �What Patent Data Reveal about Universities: The Case of Belgium�, Journal of Technology Transfer 28, pp. 9-15
Siegel D. S., Waldman D., Link A. (2003), �Assessing the impact of organizational practices on the relative productivity of university technology transfer offices: an exploratory study�, Research Policy 32, pp. 27-48
Stephan P.A., Gurmu S., Sumell A.J., Black G. (2004) �Who�s patenting in the University? Evidence from the Survey of Doctorare Recipients�, paper presented at the workshop on The empirical economic analysis of the academic sphere, BETA - Université Louis Pasteur, Strasbourg, March 17th
22
APPENDIX
Table 1. Italian university professors in 2000, selected fields
Field Professors, active
in 2000 of which: Academic inventors, n. and (%)
Chemical eng. & Materials tech. 355 66 (18,5)
Pharmacology 613 84 (13,7)
Biology 1359 78 (5,7)
Electronics & Telecom 630 73 (11,6)
Total 2957 301 (10,2) Source: EP-INV-DOC database
Table 2. Distribution (%) of academic inventors by n. of patents and field n. of patents Fields 1 2-5 6+
Chemical eng. & Materials tech. 60,9 32,8 6,3 100
Pharmacology 63,1 28,6 8,3 100
Biology 70,5 23,1 6,4 100
Electronics&Telecom 56,2 31,5 12,3 100
Total 62,9 28,8 8,3 100 source: EP-INV-DOC database
Table 3. Ownership of academic inventors� patents§ by type of applicant and field; n. of patents (and %)
Business Open Science 1 Individuals 2
Chemical eng. & Materials tech. 127 (76,0) 22 (13,2) 18 (10,8)
Pharmacology 200 (75,2) 32 (12,0) 34 (12,8)
Biology 88 (48,6) 57 (31,5) 36 (19,9)
Electronics&Telecom 200 (78,1) 40 (15,6) 16 (6,3)
Total 615 (70,7) 151 (17,4) 104 (11,9) 1 Universities, public labs and government agencies; both Italian and foreign. 2 Same applicant�s and inventors� names. § Patents owned by more than one applicant were counted more than once. source: EP-INV-DOC database

23
Figure 1 - Distribution of publications per year, academic inventors vs controls; 1980-1999
0
0,05
0,1
0,15
0,2
0,25
0,3
0,35
0,4
0 1 2 3 4 5 6 7 8 9 10 11 12 13
Publication Counts
Obs
erve
d pr
obab
ilitie
s
InventorsNon inventors
Table 4. Publications per year, inventors vs controls, 1975-2003; by field
N Mean Std Median
Inventors
Chem.eng. & Materials tech. ** 63 2,0 1,75 1,5
Pharmacology * 83 2,2 1,21 2,0
Biology * 78 2,5 2,10 2,0
Electronic&Telecom * 72 1,7 1,04 1,4
All Fields 296 2,1 1,60 1,8
Controls
Chem.eng. & Materials tech. 63 1,3 1,10 1,1
Pharmacology 83 1,7 1,11 1,6
Biology 78 1,8 1,27 1,5
Electronics&Telecom 72 1,3 1,18 1,0
All Fields 296 1,6 1,28 1,3 * - ** Inventor-control distribution difference significant at .90 - .95 (Kolmogorov-Smirnov test) (1) Only professor aged 24-70 in current years source: elaborations on EP-INV-DOC database and ISI Science Citation Index

24
Table 5. Descriptive analysis
Name Description Obs. Mean Std. Dev. Min Max
DELTA_PUB j,t
Difference between the yearly scientific production of a professors and his current Avg_Pub value 14538 .5121545 1.910365 -22 38.8
AVG_PUB j,t
Average number of publications at each point in time 14855 1.411994 1.388881 0 24
DELTA_BASICj,t
Difference between the yearly scientific production (basic science) of a professors and his current Avg_Pub value 14538 .3622659 1.485924 -8 23.16
AVG_BASIC j,t
Average number of publications (basic science) at each point in time 14855 1.007724 1.15956 0 13.68966
AGE j,t Age of professors j at any time (time-variant) 14855 42.66254 10.71546 22 77
GENDER j.
Dummy variable equals 1 for woman professors 14855 .2098283 .4071997 0 1
SHAREINV j,t
Share of academic inventors over the total number of a professor�s department colleagues 14855 9.294453 11.02468 0 100
CUMPATUNI j,t Measures the stock of patents held by each professor�s university at each point time 14855 43.90596 53.75198 0 226
NUNI j.
n. of professors in hard science in university j in year 2000 14855 893.599 520.2939 18 2128
USSDW j.
n. of professors in university j/n. of professors in Italy, by field 14855 5.59148 4.110059 .3424658 33.33333
SSDUW j.
n. of professors in a given field in university j/n. of professors in university j, for each field 14855 2.103362 1.987298 .1104972 15.04425

25
Table 6 First patent (single event) � Estimated coefficients of the proportional hazard function (Cox model) (1) (2) (3)
DELTA_PUBt -0,01
(0,936) -0,01
(0,028)
DELTA_PUBt-1 0,10
(0,035)*** 0,10
(0,035)***
AVG_PUBt 0,11
(0,052)** 0,12
(0,051)***
DELTA_BASICt 0,03
(0,038)
DELTA1_BASIC t-1 0,10
(0,039)***
AVG_BASIC t 0,09
(0,059)
AGE t -0,08 (0,09)
-0,08 (0,009)
-0,01 (0,312)
GENDER -0,28
(0,166)* -0,27
(0,160)* -0,31
(0,160)*
S_COPAT t 2,54
(0,407)*** 3,51
(0,273)*** 3,43
(0,271)***
S_COPAT t*DELEC -1,00
(0,443)** -0,70
(0,427)
S_COPAT t *DCHEM -8,52
(4,042)* -8,03
(4,769)*
S_COPAT t *DBIOL -1,38
(0,746)* -1,30
(0,735)*
SHAREINV 0,03
(0,009)*** 0,03
(0,008)*** 0,03
(0,008)***
CUMPATUNI t 0,001
(0,002) 0,0001 (0,002)
0,0007 (0,001)
NUNI t 0,001
(0,0001) -0,0001 (0,0001)
-0,0001 (0,0001)
USSDW t 0,02
(0,020) 0,02
(0,018) 0,03
(0,019)
SSDUW t 0,009
(0,032) 0,001
(0,031) 0,004
(0,031)
ELECTRONICS dummy -0,01
(0,173)
CHEMICAL dummy -0,14
(0,200)
BIOLOGY dummy -0,02
(0,164) Wald chi-sq 79,74 351,66 353,66 Log-likelihood -1755,99 -1755,99 -1754,42
*** 99% sign ** 95% * 90% Breslow method for ties / Std errors adjusted for clustering on inventor Obs. 9855 (592 subjects; 296 events)

26
Table 7 First patent (single event) � Estimated coefficients of the proportional hazard function (Cox model), by applicant type
Business company (1) Open Science institution (2) (1) (2) (3) (4)
DELTA_PUB -0,02
(0,041) -0,06
(0,059)
DELTA1_PUB 0,07
(0,040)* 0,11
(0,055)*
AVG_PUB 0,15
(0,052)** 0,14
(0,077)*
DELTA_BASIC 0,02
(0,044) 0,04
(0,068)
DELTA1_BASIC 0,07
(0,047) 0,13
(0,056)***
AVG_BASIC 0,13
(0,070)* 0,09
(0,090)
AGE t -0,01
(0,010) -0,01
(0,011) 0,11
(0,016) 0,10
(0,016)
GENDER -0,56
(0,189)*** -0,60
(0,189)*** 0,20
(0,265) 0,18
(0,265)
S_COPAT t 4,19
(0,304)*** 4,11
(0,304)*** 0,97
(0,761) 0,92
(0,768)
S_COPAT t*DELEC -1,36
(0,436)*** -1,09
(0,434)**
S_COPAT t *DCHEM -7,98
(4,336)* 7,52
(4,56)*
S_COPAT t *DBIOL -1,65
(0,784)** -1,60
(0,776)**
POSTPAT -0,40
(0,317) -0,38
(0,317) -0,28
(0,304) -0,22
(0,302)
SHAREINV 0,03
(0,008)*** 0,03
(0,008)*** 0,02
(0,011) 0,02
(0,010)
CUMPATUNI 0,001
(0,002) 0,001
(0,001) -0,0009 (0,003)
-0,0009 (0,003)
NUNI -0,0003 (0,0002)
-0,003 (0,0002)
0,0002 (0,000)
0,0002 (0,0002)
USSDW 0,03
(0,020) 0,02
(0,020) -0,04
(0,032) -0,02
(0,033)
SSDUW -0,04
(0,034) -0,04
(0,035) 0,04
(0,047) 0,04
(0,047)
DELEC 0,45
(0,334) 0,58
(0,342)
DCHEM 0,12
(0,432) 0,21
(0,445)
DBIOL 0,87
(0,293)*** 0,88
(0,290)*** Wald chi-sq 279,61 368,90 77,81 78,52 Log-likelihood -1288,30 -1397,17 -572,41 -571,79
*** 99% sign ** 95% * 90%; Breslow method for ties / Std errors adjusted for clustering on inventor (1) Obs. 10650 (592 subjects; 235 events); (2) Obs. 10650 (592 subjects; 94 events, including INDIVIDUAL patents)

27
Table 8 All patents (multiple events) � Estimated coefficients of the proportional hazard function (Cox model), by applicant type
All applicants (1) Business companies (2) Open Science inst.(3)
DELTA_PUB 0,02
(0,022) -0,01
(0,025) 0,06
(0,037)
DELTA1_PUB 0,05
(0,022)** 0,02
(0,025) 0,08
(0,038)**
AVG_PUB 0,14
(0,037)*** 0,15
(0,046)*** 0,31
(0,111)***
AGE -0,01
(0,006) -0,01
(0,008) -0,01
(0,015)
GENDER -0,39
(0,145)*** -0,71
(0,194)*** 0,27
(0,361)
S_COPAT_ 0,54
(0,804) -0,29
(0,972) -0,47
(1,316)
S_COPAT_ELEC -1,98
(1,107)* -3,16
(1,215)***
S_COPAT _CHEM 1,98
(0,672)*** 2,73
(0,810)***
S_COPAT_BIOL -0,02
(0,916) -0,56
(1,108)
STOCKPAT 0,03
(0,015)** 0,02
(0,016) 0,07
(0,034)**
SHAREINV 0,02
(0,004)*** 0,03
(0,005)*** 0,02
(0,010)
CUMPATUNI 0,003
(0,001)** 0,00
(0,001)** 0,00
(0,003)
NUNI -0,0001 (0,000)
-0,0003 (0,000)*
0,0007 (0,000)**
USSDW 0,01
(0,013) 0,03
(0,017)* -0,05
(0,047)
SSDUW -0,03
(0,030) -0,07
(0,040)* 0,03
(0,081)
DELEC 0,24
(0,498)
DCHEM -0,14
(0,468)
DBIOL 0,45
(0,499)
Theta 0,36
(0,141)*** 1,06
(0,258)*** 6,42
(1,448)*** Wald chi-sq 190,86 137,73 57,38 Log-likelihood 3494,5334 -2926,0318 -968,62769 N. of subjects 1143 1144 1147 N. of failures 561 472 163 N. of obs. 11482 11482 11482 N. of groups 592 592 592
*** 99% sign ** 95% * 90%

28
Table 9. All patents (multiple events) � Estimated coefficients of the
proportional hazard function (Cox model); inventors only
DELTA_PUB 0,05
(0,025)**
DELTA1_PUB 0,01
(0,028)
AVG_PUB 0,07
(0,030)**
S_COPAT_ 4,56
(1,571)***
S_COPAT_ELEC -2,99
(1,623)*
S_COPAT _CHEM -6,49
(3,916)*
S_COPAT_FARM -4,35
(1,771)**
PHD 0,86
(0,207)***
PHDELEC -0,81
(0,391)**
PHDCHEM -1,04
(0,399)***
PHDFARM -0,86
(0,384)**
AGE 0,00
(0,011)
GENDER -0,21
(0,179)
L1STOCKPAT 0,04
(0,028)
SHAREINV 0,02
(0,004)***
CUMPATUNI -0,00001 (0,002)
NUNI 0,00001 (0,0003)
USSDW 0,02
(0,021)
SSDUW -0,03
(0,049)
DELEC 0,74
(0,214)***
DCHEM 0,28
(0,259)
DFARM 0,51
(0,216)** Wald chi2(22) 219,56 Log pseudo-likelihood -1234,8218 N. of subjects 384 N. of failures 254 N. of obs. 2541
*** 99% sign ** 95% * 90%

29
Table A1. Disciplines (SSD) and fields; conversion table Bio-chemistry (E05A) Biology Molecular biology (E05B) Biology Applied biology (E06X) Biology Human physiology (E04B) Biology Materials science and technology (I14A) Chemical engineering & Materials technology Macromolecular compounds (I14B) Chemical engineering & Materials technology Applied physics-chemistry (I15A) Chemical engineering & Materials technology Chemical engineering (I15B) Chemical engineering & Materials technology Industrial chemistry (I15E) Chemical engineering & Materials technology Electronics (K01X) Electronics&Telecommunications Electromagnetic fields (K02X) Electronics&Telecommunications Telecommunications (K03X) Electronics&Telecommunications Pharmaceutical Chemistry (C07X) Pharmacology Applied Pharmacology (C08X) Pharmacology
Table A2. Institutional and personal variables, inventor vs. control sample year 2000
University size 1 Weight of the discipline
in the univ. 2 University weight in the
discipline 3
Controls Inventors Controls Inventors Controls Inventors
Chemical eng. & Materials tech. 909 * 784 1,2 1,5 * 8,9 8,9
Pharmacology 947 * 910 2,0 2,1 4,9 * 4,6
Biology 896 * 869 2,6 3.0 * 3,9 4,0 *
Electronics&Telecom 834 939 * 2,7 * 2,0 5,2 5,7 *
All fields 898 * 879 2,0 2,2 * 5,5 5,6 * 1 n. of professors in the university (all scientific discipline); avg values 2 n. of professors in the discipline in the univ. / n. of professors in the university (%); avg values 3 n. of professors in the discipline in the univ. / n. of professors in the discipline, all Italian univ. (%); avg values * Mean value significantly higher at .90 (t test) source: elaborations on EP-INV database and ISI Science Citation Index
Table A3. Personal variables, inventor vs. control sample year 2000
Gender 1 Age2 Controls Inventors Controls Inventors Chemical eng. & Materials tech. 14 (22,2%) 9 (14,3%) 51.55 51.60 Pharmacology 32 (38,6%) 27 (32,5%) 51.84 51.26 Biology 29 (37,2%) 20 (25,6%) 50.83 50.79 Electronics&Telecom 5 (6,9%) 2 (2,8%) 47.77 47.95 All fields 80 (27,0%) 58 (19,6%) 50.52 50.40
1 n. of females (and % of total professors in the discipline) 2 avg values source: elaborations on EP-INV database and ISI Science Citation Index

30
Table A4. Top applicants of patents by academic inventors and patent concentration index, by field
Field/Applicant n. of
patents % over
field
Chemical eng. & Materials technology ENI Group 34 21,1Montedison Group 16 9,9Novartis AG 9 5,6CNR (National Research Council) 9 5,6Sisas Spa 8 5,0
Herfindhal index (1-100) 6,91
Pharmacology Mediolanum Farmaceutici 19 8,4SkyePharma PLC 17 7,5Pfizer 14 6,2CNR (National Research Council) 11 4,8Lisapharma 8 3,5
Herfindhal index (1-100) 2,96
Biology Istituto Angeletti 13 7,8CNR (National Research Council) 11 6,6MIUR (Ministry of Education & Research) 6 3,6
Herfindhal index (1-100) 2,13
Electronics&Telecom ST Microelectronics 91 37,4 Optical Technologies 14 5,8 Selenia industrie elettroniche 12 4,9 Siemens AG 12 4,9 Universita degli studi di Roma �La Sapienza� 11 4,5
Herfindhal index (1-100) 15,55NB. Patents owned by more than one applicant were counted more than once; total number of patents in
this table > actual total number source: EP-INV database
Copyright © 2022 FDOKUMEN