Individual differences in personality traits reflect structural variance in specific brain regions
Upload
independentCategory
view
0download
0
S
MF
a
ARRAA
JOOC
KEUFPM
1
psisdstFain2BvvEik
(
0d
Research Policy 41 (2012) 692– 703
Contents lists available at SciVerse ScienceDirect
Research Policy
j our nal ho me p ag e: www.elsev ier .com/ locate / respol
patial differences in the quality of university patenting: Do regions matter?
anuel Acosta, Daniel Coronado ∗, M. Ángeles Martínezacultad de Ciencias Económicas y Empresariales, Departamento De Economía General, University of Cadiz, Duque de Nájera, 8, 11002-Cadiz, Spain
r t i c l e i n f o
rticle history:eceived 30 September 2008eceived in revised form 28 October 2011ccepted 5 January 2012vailable online 28 January 2012
EL classification:313229
a b s t r a c t
This paper uses patent citation data to analyze the quality of university technology across Europeanregions. The empirical analysis draws on a panel dataset of 4580 European university-owned patentsclassified by 202 European regions over the period 1998–2004. The methodology involves a multi-level framework to identify the effects of factors at three hierarchical levels (individual, university, andregional) on the quality of university patenting. The results suggest that regional factors, such as the levelof development, industrial potential, and regional higher education R&D expenditure, do not play anysignificant role in determining the quality of European university patents. We instead find that the factorsaffecting patent quality stem from their specific characteristics. We also find that university size does notexplain the quality of patents. However, there is significant unobserved heterogeneity at the university
eywords:uropean regionsniversity patentsorward patent citationatent qualityultilevel models
level in all models, suggesting that differences in other university characteristics explain a substantialpart of the variance in patent quality.
© 2012 Elsevier B.V. All rights reserved.
. Introduction
In this paper, we explore the quality of university-ownedatents produced in European regions and the reasons whyome regions would produce university patents of a better qual-ty. This kind of analysis is important for several reasons. First,ome characteristics of university knowledge, such as nature,iversity, and quality, are significant factors in determining thetrength of knowledge spillovers and engagement with indus-ry (Feldman and Audretsch, 1999; Mansfield and Lee, 1996;eldman and Desrochers, 2003; Fritsch and Slavtchev, 2007; Baend Koo, 2008; Perkmann et al., 2011). Second, although theres already some research on the production of university tech-ological knowledge across European regions (Geuna and Nesta,006; Saragossi and Van Pottelsberghe de la Potterie, 2003;aldini et al., 2006; Azagra-Caro et al., 2003; Acosta et al., 2009),ery little is known about its quality. Finally, from a politicaliewpoint, a regional focus is suitable, as most governments in
uropean regions—as well as many universities—have the capac-ty to take steps to improve the quality of university technologicalnowledge.∗ Corresponding author. Tel.: +34 956 015415; fax: +34 956 015398.E-mail addresses: [email protected] (M. Acosta), [email protected]
D. Coronado), [email protected] (M.Á. Martínez).
048-7333/$ – see front matter © 2012 Elsevier B.V. All rights reserved.oi:10.1016/j.respol.2012.01.002
The methodology in this paper relies on forward patent citations(FPC) as a proxy for quality. As explained later, a large num-ber of papers focusing on the quality of university patents haveused this particular indicator (Henderson et al., 1998; Moweryand Ziedonis, 2002; Jaffe and Trajtenberg, 2002; Mowery et al.,2002; Sampat et al., 2003; Gay et al., 2005; Sapsalis et al.,2006; Sapsalis and Van Pottelsberghe de la Potterie, 2007; Gayet al., 2008). However, most of these studies have analyzedFPC at a single level (using the characteristics of the patentsthemselves). In contrast, the statistical procedure in this paperinvolves a multilevel random effects Poisson model to iden-tify the effects of factors at three separate hierarchical levels(individual, university, and regional) on the quality of univer-sity patenting. Our results are based on a new panel datasetof 4580 European university-owned patents and 8669 forwardpatent citations (excluding self-citations) classified by region inthe EU-15 and covering the period 1998–2004. Note that thispaper only concerns the quality of university-owned patents,and thus represents part of a broader body of work on aca-demic patenting. We therefore adopt a partial viewpoint in thatwe do not analyze the factors affecting the quality of the entireuniverse of academic patents. Universities, as well as firms and
public research centers, etc., can own patents produced by aca-demic inventors. Following the terminology in Lissoni et al.(2008), “university patenting” refers to university-owned patentswhereas “academic patenting” comprises both university-owned
ch Pol
af
woiw6sr
2
le1ia2tpaeatstaLsus
tasaksimsrha
mhtviOuel
ptvi(Uai
M. Acosta et al. / Resear
nd university-invented patents. By design, we analyze only theormer in this paper.1
The paper is organized as follows. In the following section,e review the literature explaining why study of the production
f university knowledge and its quality at the regional level ismportant. Sections 3 and 4 present the methodological frame-
ork. Section 5 describes the data-collection process and Section presents the results. The final section includes our main conclu-ions, several policy implications, and some suggestions for futureesearch.
. The technological role of universities in regions
The importance of universities in encouraging regional techno-ogical change has been reported in several well-known studies ofconomically successful regions (Markusen et al., 1986; Saxenian,994; Sternberg and Tamasy, 1999; Wever and Stam, 1999) and
n studies that have used national/regional systems of innovations a framework (Lundvall et al., 2002; Goldfarb and Henrekson,003; Gittelman, 2006). This is because regional innovation sys-ems are a suitable framework for better understanding the generalrocess of innovation, and they provide some relevant clues tossist our understanding of the role of universities and the knowl-dge production of universities in a regional context. Here, wessume that universities provide a number of different func-ions in regional innovation systems that affect the productiveystem. For example, by conducting R&D activities, universi-ies generate scientific and technological knowledge that theyre able to transfer through tacit or codified channels to firms.ikewise, through the teaching and training of students, univer-ities provide firms with a better-qualified workforce. Moreover,niversities may serve as ‘incubators’ for knowledge-intensivepin-offs.
Some of these ideas encompassed in the concept of the innova-ion system are also included in the ‘triple helix’ model (Etzkowitznd Leydesdorff, 1997, 2000; Leydesdorff, 2000). The central the-is of the triple helix relies on the idea that the university can playn essential role in the process of innovation, and thus strengthennowledge-based societies. In these types of models, different pos-ibilities are proposed concerning the relationship between thenstitutional spheres—university, industry, and government—that
ay help generate alternative strategies for “economic growth andocial transformation” (Etzkowitz and Leydesdorff, 2000). From aegional perspective, academia plays an important role in the tripleelix as a source of innovation for regional development (Etzkowitznd Klofsten, 2005).
As discussed, the positive effects of universities in regionsay arise through a variety of university outputs that potentially
ave important impacts on regional economic development. Inhis paper, we focus on just one of these outputs: namely, uni-ersity patents. University patenting may have an influence onnnovation in regions in two different but complementary ways.n one hand, there is a potential direct contribution when a
niversity produces useful newly patented technological knowl-dge with potential application to industrial processes. Throughicensing, this newly patented knowledge may then transfer to1 Geuna and Nesta (2006) concluded that the number of university-inventedatents (patents where at least one of the inventors is from a university but wherehe owner of the patent is a firm) is higher than the number of patents owned by uni-ersities. Lissoni et al. (2008) provide figures to show that university-owned patentsn France, Italy and Sweden constitute no more than 10% of all academic patentsmost patent ownership lies with firms), though this can be as high as 69% in theS. Recently, some European countries have introduced legislative changes in anttempt to retain the rights of invention where universities produce the knowledgencluded in patents; see Geuna and Rossi (2011) for a discussion.
icy 41 (2012) 692– 703 693
private firms, thereby increasing private innovation and induc-ing regional economic growth. Furthermore, patents are valuablebecause their licensing helps to generate employment, especiallyamong graduates, with the creation of a spin-off firm to exploit thepatent.
On the other hand, the production of a patent may have anindirect contribution to regional innovation because of the flow oftechnological knowledge between universities and firms. This flowof knowledge can take place through a variety of interaction chan-nels between academics and firms (by reading the patent, or viadirect conversation or informal meetings with the inventors, etc.).The flow of knowledge has important potential benefits for regionsbecause of spillovers from university to industry (see, for instance,Agrawal and Cockburn, 2003; Anselin et al., 1997, 2000; Calderiniand Scellato, 2005; Fischer and Varga, 2003; Jaffe, 1989; Maursethand Verspagen, 2002; Verspagen and Schoenmakers, 2000). Theproliferation of a literature illustrating the importance of phys-ical proximity for knowledge flows and for the promotion anddevelopment of innovation, allied with the high degree of self-government enjoyed by many European regions, makes it clearthat the study of knowledge from universities is relevant, not onlyin the national or supranational context, but also at the regionallevel.
However, though most studies stressing the importance of uni-versities at a regional scale have analyzed the effects of scientificand technological knowledge on the innovation of firms, relativelylittle is known about the importance of the quality of knowl-edge production in universities. Tornquist and Kallsen (1994) andMansfield and Lee (1996) are two of the earliest studies to drawattention to the relevance of quality in this respect. Of these,the former concluded that the major drivers of commercially rel-evant activities of universities at the institutional level includetotal R&D expenditure, industry funding, academic quality, andthe overall level of patenting at the institutions. According toTornquist and Kallsen (1994), both the quality of institutions andthe quantity of outputs are relevant for the production of com-mercial activities by universities. In the latter study, Mansfieldand Lee (1996) developed a model to test the effects of facultyquality and geographical location on firm support for academicresearch. Their results showed that in order to develop innova-tions, and by holding distant constant, the mean proportion ofR&D supported by firms is higher at universities with a good todistinguished department than at universities with a lower-rateddepartment.
Subsequent work has generally shown a positive relationshipbetween the academic quality of the organization and the likeli-hood of its involvement with commercial activities and technologytransfer (e.g. Thursby and Kemp, 2002; Rogers et al., 2000; Foltzet al., 2003; Friedman and Silberman, 2003; Lach and Schankerman,2004; Turk-Bicakci and Brint, 2005). Most of this research has foundthe positive effect of the quality of the institutions when pro-moting the interaction between universities and firms. However,the empirical evidence is not straightforward. For example, somestudies have not found any effect from the variable for ‘quality’(D’Este and Patel, 2007), while others have found both positiveand no effects (Giuliani and Arza, 2009), and yet others no effectat all (Ponomariov, 2008). Moreover, to our best knowledge onlyFritsch and Slavtchev (2007) have addressed the importance of thequality of university outputs from a regional point of view. Here,Fritsch and Slavtchev (2007) suggest that the strength of a univer-sity’s impact on the innovative performance of private-sector firmsmay differ considerably according to the quality of their research.Their empirical analysis in a German context instead shows thatit is both the amount and quality of the research done at uni-
versities that is important for their contribution to the innovationsystem.
6 ch Pol
3
vpoutdtoi
3c
ptditicpacs
-
-
-
-
94 M. Acosta et al. / Resear
. A multilevel theoretical framework
Much of the relevant literature dealing with the quality of uni-ersity patents employs the particular characteristics of individualatents as explanatory factors. However, the presence of higher-rder hierarchical structures with different characteristics (theniversity and the region in which the patent is produced) point tohe multilevel nature of the factors influencing the quality of pro-uction of university patents. In this section, we take into accounthis nested hierarchical nature of the factors affecting the qualityf patents by grouping the potential causes at three distinct levelsn a theoretical multilevel framework.
.1. First level of explanatory factors affecting quality: individualharacteristics of patents
Henderson et al. (1998) was one of the first attempts to useatent citation to examine changes in the quality of patents issuedo US universities before and after the Bayh–Dole Act in 1980. Theirata contained information on patents assigned to universities dur-
ng the period 1965–1988 and in subsequent patents that citedhese university patents through to the end of 1992. Their modelsncluded dummy variables for application years and technologi-al areas to explain the importance and generality of universityatents. Subsequent research on university patenting in the USnd Europe has identified a number of factors capturing individualharacteristics in explaining the quality of university patenting. Weummarize these factors as follows:
Collaboration. We expect any collaboration between inventorsfrom different institutions involved in a patented invention toimprove quality for two main reasons. First, these inventorstypically have relatively more resources to develop inventions.Second, the flow of knowledge should be greater when there areseveral inventors involved. For example, Gay et al. (2005) foundthat, on average, the citation rate is lower for patents belongingto individuals. Accordingly, we expect quality to be higher whenmore than one institution shares ownership of the patent.Technological knowledge base. The evolutionary and cumula-tive character of the technology in a patent usually correlateswith quality. This factor indicates the existing technologicalknowledge embodied in the prior patents upon which the inven-tion depends. The number of patents cited for the universitypatent that we are analyzing usually captures this effect. Over-all, the literature finds the positive effect of this variable (Jaffeand Trajtenberg, 2002; Sapsalis et al., 2006; Sapsalis and VanPottelsberghe de la Potterie, 2007; Gay et al., 2008).
Scientific knowledge base. This refers to the scientific knowledgeincorporated in a patent, and is usually captured by the num-ber of scientific articles cited in the patent. Several recent studieshave found that the greater the relation with the scientific sector,the higher the technological quality (Gittelman and Kogut, 2003;Burke and Reitzig, 2007; Lee et al., 2007).
Concentration/diversification. Although there is debate in theliterature about whether technological concentration (or special-ization) or diversification is the best strategy for firms, cities, orcountries to promote innovation (Feldman and Audretsch, 1999),to our knowledge there is no evidence concerning the possiblerelation between the concentration/diversification of universitytechnological knowledge and quality. Both options appear rea-sonable. On one hand, the concentration of effort in developing
a particular form of technology may lead to better technologicalquality. On the other hand, a technology with many applicationsin different fields is probably also of good quality and economicvalue.icy 41 (2012) 692– 703
- International presence. As Putnam (1996) and Lee et al. (2007)suggest, because the application for patent protection in othercountries imposes additional costs, applicants are more likely todo this for inventions that are more valuable. The usual variablefor capturing international presence is ‘family patents’ (the groupof patents protecting the same innovation is usually referred toas its ‘family’). Putnam (1996) first proposed the inclusion ofa ‘family size’ variable, subsequently employed in a number ofother studies. For instance, Sapsalis and Van Pottelsberghe de laPotterie (2007) found the positive effect of this variable on quality.Another way to consider the international presence of universitytechnological knowledge is separating the capacity to introducethe invention with a patent in markets where technological com-petition may be stronger, such as in the US or Japan.
3.2. Second level of explanatory factors: university characteristics
Mowery and Sampat (2004) argue that research organizationsvary in their structure, size, and strategy; consequently, we shouldnot consider them as homogeneous entities. The literature account-ing for this situation stresses the importance of the particularcharacteristics of universities on variables such as patent pro-duction, research productivity, technology transfer, etc. However,while none of this literature has quality as its main objective, itdoes provide some clues on how university factors affect universityoutputs. In this regard, several empirical papers have stressed theeffects of university-level characteristics in patenting and licensingactivities. For instance, in his review article, Baldini (2006) provideda long list of factors, including higher average faculty salaries, alarger staff for technology licensing, greater R&D funding, a betterentrepreneurial climate, greater experience of technology transferoffices, and a more supportive environment inside the university,etc.
Drawing on a broad literature review, Ponomariov (2008) givesseveral reasons supporting the hypothesis that the characteristicsof the institutional environment affect the productivity of univer-sity scientists. Some of these university-level factors are the stimulithat surround individuals, the recognition of the scientists andtheir efforts, the presence of the institutional resources needed topromote better interaction with the private sector, and a favor-able organizational climate. In a recent paper, Fini et al. (2011)provide arguments suggesting that universities can enhance thecreation of academic spin-offs through the provision of supportmechanisms at the university level (including external collabora-tion, patent regulations, the existence of a TTO, etc.). However, thecreation of academic spin-offs may also depend on the local context,which encompasses both factor endowments and specific policiestargeted to support entrepreneurship.
Particularly relevant from a political viewpoint is how thesize of universities influences university outputs. For example,Schartinger et al. (2002), in a study of 309 Austrian universitydepartments, found that department size is a significant determi-nant of industry–university knowledge and technology transfer.Likewise, Carlsson and Fridh (2002) investigated technology trans-fer in the US using data from 170 universities, hospitals, andresearch institutes. One of their more important findings was thesignificant relation between institution size and the total numberof patents. Friedman and Silberman (2003) also found that univer-sity size was a relevant factor in explaining the number of inventiondisclosures in 83 US universities.
Elsewhere, Landry et al. (2007) analyze the effect of univer-sity size on knowledge transfer in a survey of 1554 researchers
funded by the Natural Sciences and Engineering Research Councilof Canada. Their findings indicated the importance of the size ofuniversities on technology transfer, but only in a few fields. Finally,in an Italian study, Giuliani and Arza (2009) concluded that size
ch Pol
dsvNs
3r
iihhwfIfssp
ecatouwetdrs(siacs
arosabereq
4a
4
4
cl(fa(
M. Acosta et al. / Resear
oes not appear to have any effect on university–firm linkages. Toummarize, we expect that the particular characteristics of a uni-ersity influence the quality of patents produced in that university.onetheless, given the somewhat ambiguous results for university
ize in the extant literature, we place particular focus on this factor.
.3. Third level of explanatory causes: characteristics of theegional innovation system
The reason for considering the characteristics of the regionalnnovation system as the third level of explanatory causes for qual-ty in the production of university patents relies on the followingypothesis: That a strong industrial sector in a region, supported byigh-technology activities or with well-trained human resources,ill demand university technology of a greater quality than regions
ar behind in their level of knowledge in technology and innovation.n addition, other characteristics of the regional innovation systemrom the demand side (the level of income) or from the supply side,uch as the amount of resources devoted to higher education R&D,hould have a positive effect, not only on the quantity of technologyroduced in universities, but also on its quality.
Unfortunately, the use of the relevance of the surroundingconomic environment as a factor explaining the innovative orommercial capacities of universities is not common in the liter-ture on university patenting, with only a few studies consideringhis variable. For instance, Baldini et al. (2006) in their analysisf university patents in Italy include the geographical location ofniversities to differentiate the level of industrial developmenthere the university is situated. The findings indicated the positive
ffect of geographical location, although it was not always sta-istically significant. In contrast, Saragossi and Van Pottelsberghee la Potterie (2003) found that patenting activity is higher inegions in Belgium where there are collaborating institutionspecializing in a given field of research. A recent study by Koo2007) tackles a related topic, namely the endogenous relation-hip between spillovers and the role of (demand side) regional andndustrial attributes. Koo (2007) provides substantial evidence thatgglomeration, industry structure, small establishments, and localompetition play important roles in the localization of technologypillovers.
However, yet other studies stress that there are serious doubtsbout whether the potential demand for university knowledgeemains local. This is particularly the case for centers or universitiesf ‘excellence’. For instance, Cooke’s (2004, 2005) comprehen-ive study of bioscience megacenters reported instances wherecademic and public laboratory scientists evolved ‘dynamic capa-ilities’ that attracted entrepreneurs from different locations tongage in tacit knowledge exchange. Our main interest in includingegional effects in our model is to understand whether the specificconomic characteristics of a region play a role in determining theuality of university patenting.
. A multilevel hierarchical model to account for factorsffecting the quality of university patents
.1. Variables
.1.1. Dependent variable: FPC as a proxy for qualityPatent citation analysis relies on the premise that patents
ited by subsequent patents tend to contain relevant techno-ogical knowledge upon which many succeeding inventions rely
Thomas and Breitzman, 2006). In support, some early studiesound evidence of a relation between forward patent citationsnd economic/technological value. For instance, Carpenter et al.1981) concluded that patents related to significant new technicalicy 41 (2012) 692– 703 695
products received significantly more citations than a control group.Similarly, Trajtenberg (1990) found a close association betweencitation-based patent indices and independent measures of thesocial value of innovations in a particular field (computed tomogra-phy scanners), and that estimates of the social value of the inventionwere highly correlated with the incidence of subsequent citations.
In other work, Albert et al. (1991) compared patent citationcounts with expert ratings of the technological importance of thepatents. In this particular study, the groups of very frequentlycited patents rated significantly higher than patents receiving lowcitation counts, supporting the use of patent citation analysis asa method of assessing technological importance. Thomas (1999)analyzed the relationship between the technological impact ofUS patents—also using patent citation analysis—and the renewaldecisions made by their owners. He found a significant positiverelationship between these variables across time.
Harhoff et al. (1999) also showed that patents renewed to fullterm were significantly more highly cited, while in a follow-upstudy, Harhoff et al. (2003) confirmed that the number of referencesin the patent literature, along with the number of citations a patentreceives, and its value are positively related. Lastly, Lanjouw andSchankerman (2004) developed a composite index of patent qual-ity using the multiple characteristics of patents. The term ‘quality’therein emphasized both the technological and value dimensionsof an innovation: they found that patent quality is strongly associ-ated with variations in the market value of firms, with an especiallylarge effect in the pharmaceutical and other health-related sectors.
All this literature confirms the correlation between technolog-ical significance, as measured by forward patent citations, and theeconomic/technological value of a patent. However, these studiesalso recognize that the relationship between citations and quality isnot straightforward and there is no economic quantification of therelation between value and the citation received. Further, a recentanalysis by Bessen (2008) found that although patent citations sig-nificantly correlated with patent value, patent citation statisticsmight be potentially more meaningful as measures of the valueof the underlying technology.
In addition to the relation between quality and forward patentcitation, several difficulties that complicate the use of citationcounts as measures of patent quality are well established in theliterature (Mowery and Ziedonis, 2002; Gay et al., 2005; Marco,2007). First, there is the matter of the temporal effects, such thatrecent patents have less time for citation than older patents: theresult is the truncated distribution of citations. Second, there is thecomplication of self-citation (those made by an assignee of theirown earlier patents). Finally, there are differences in the propen-sity of patent citations across technological fields. For the most part,the empirical literature addresses these problems by including sev-eral control variables in the econometric models and by excludingself-citation from the analysis.
4.1.2. Independent variablesAccording to the established theoretical framework, the inde-
pendent variables should account for three levels of influence (inaddition to several covariates used to control for any temporal andsectoral effects).
Variables at the first level capture individual fixed characteris-tics for each university patent:
- Collaboration. Collaboration in developing a patented invention iscaptured by two dummy variables. First, APLIE indicates whetherone or more companies share the ownership of the patent and
takes a value of one when there is private participation in devel-oping the patent and zero otherwise. Second, APLIU takes a valueof one if more than one university owns the patent and zerootherwise.
6 ch Pol
-
-
-
-
ivtlneFeaatcsra
rqigol(eaHadaabatv
ecrtsomti
l
-
96 M. Acosta et al. / Resear
Technological knowledge base. The presence of the technologicalknowledge embodied in the prior patents upon which the inven-tion relies is included in BPC, which is the number of patents citedin each university patent.
Scientific knowledge base. We capture the scientific knowledgeincorporated in a patent with NPC, the number of scientific arti-cles cited in the patent.
Concentration/diversification. We capture any concentra-tion/diversification effects using the variable NSEC, which isthe number of economic sectors in which a patent has potentialapplication.
International presence. We use PRIUSJP to capture the role of inter-national presence. This is a binary variable that takes a valueof one if the first patent granted is in the US or Japan and zerootherwise.
Variables at the second level capture the university character-stics. However, because of the lack of data, the only explanatoryariable we consider in our analysis is the size of the university. Inhis respect, several proxy variables are common in the empiricaliterature. For example, Giuliani and Arza (2009) specify the totalumber of publications appearing in the ISI Web of Knowledge Sci-nce Citation Index for all departments in each university, whereasriedman and Silberman (2003) employ the number of faculties inach university. Alternatively, Landry et al. (2007) used binary vari-bles to classify universities into three categories (small, medium,nd large) according to the amount of funding they received. Unfor-unately, we do not have information about the infrastructureharacteristics of European universities (or any other direct mea-ure of size, such as the number of employees). Consequently, as aough measure of scale, we employ the number of students enrolledt the university.
Variables at the third level consider the characteristics of theegional innovation system that potentially influence the regionaluality of university technology. On the demand side, we first
nclude a general indicator of income to identify how important theeneral level of regional development is in determining the qualityf university patents. The variable OBJ1 distinguishes regions withess than 75% of gross domestic product (GDP) per capita (GDPpc)Objective 1 regions) from the remaining regions. If the regionalconomic environment matters for technological quality, this vari-ble should provide a significantly negative estimated coefficient.owever, a region may well be a non-Objective 1 region (with
high GDPpc) for several reasons that have little to do with theemand for quality technology from universities (e.g. regions with
strong tourism sector). In order to consider this circumstance, wedditionally consider the region’s industrial potential as capturedy the (log) level of gross industrial domestic product (GIP). This is
proxy for the industrial capacity of the region and, consequently,he regional potential to demand technology from universities. Thisariable also accounts for the (industrial) size of regions.
On the supply side, we capture the capacity of universities inach region to produce quality patents using regional ‘Higher Edu-ation R&D’ expenditure. We include this variable (in logs) as aesource variable to proxy for the strength of the university systemo produce outputs. We expect that greater monetary resourceshould lead not only to more university patents, but also to patentsf better quality. Millions of Purchasing Power Standards (PPS)easure university R&D regional funding (RDU) in 1995 prices. As
he production of patents takes time, we lag the funding measuren our specification by two years (following Foltz et al., 2003).
Finally, in addition to the variables included at each of the three
evels, we control for any sectoral and temporal effects:Sectoral effects. In order to take into account the likelihood thata patent belonging to a high-technology field is cited more
icy 41 (2012) 692– 703
frequently, we include a dummy variable (SECHT) that takes avalue of one for high-technology sectors and zero otherwise.
- Temporal effects. Clearly, the citation of patents is not immediate:that is, there is a lag between when the patent opens to the pub-lic and its first citation. In addition, older patents generally havemore citations because they have been available for citation forlonger. In order to control for this, it is common in the analysisof count events (such as forward patent citations) to introducea variable that reflects the amount of time for when we observethe dependent variable events. This variable is the log of expo-sure (time) in the regression part of the model with its coefficientconstrained to be unity.
4.2. Model
In this section, we establish an econometric model to studywhether the main features of the regional innovation system, alongwith the patent and university features, affect the quality of univer-sity technological knowledge, as measured by the count of forwardpatent citations for each university patent. The standard startingpoint in the literature is a function where a set of regressors cap-turing characteristics of the patent in subsequent patent citationsand some other variables explain FPC. We are particularly inter-ested in the role of regional economic environment in producinguniversity technology. Therefore, following our theoretical frame-work, in the next paragraphs we present a model that takes intoaccount the nested hierarchical nature of factors influencing thequality of university patenting.
Given the nature of the dependent variable (forward patent cita-tions are count data), the base empirical specification is usually thePoisson model, where the number of events has a Poisson distri-bution and its conditional mean depends on a set of regressors,such that: �i = E(yi|xi) = exp(xiˇ). In our analysis the explanatoryvariables have three hierarchical levels. The first level of individ-ual effects captures the characteristics of patents. This group ofexplanatory variables assigns each particular feature of the patentto each observation of the dependent variable. The second levelclusters all patents produced in the same university. As such, thevalues of the explanatory variables at this level are the same forall observations of the dependent variable belonging to the sameuniversity. The third level gathers all patents in the same region.Accordingly, the values of the regional explanatory variables areidentical for all observations of the dependent variable belongingto the same region. This hierarchical structure suggests extendingthe simple Poisson regression to a multilevel model with nestedunobserved effects for several levels of heterogeneity (individual,university, and regional).
The adoption of a multilevel model to analyze factors at threehierarchical nested levels has several advantages in avoiding poten-tial endogeneity problems in simple cross-sectional regressionmodels caused by the omission of variables and intragroup corre-lations. First, the multilevel model takes into account unobservedfactors affecting the quality of university patents at the universitylevel (incentives for researchers, policy patents, characteristics ofthe TTOs, etc.) and the regional level (demand for quality tech-nology produced in universities). Second, there may be influencesrelated to the neighborhood where the patent is produced. Forexample, patents produced in the same university may be influ-enced by identical incentives, transfer office characteristics, etc.(i.e. the possibility of intragroup correlation between observationsfor the same university or region). Consequently, the decision touse hierarchical analysis has three main objectives: (i) evaluat-
ing regional heterogeneity in the quality of university patents; (ii)evaluating the effect of university heterogeneity on the quality ofuniversity patents; and (iii) correctly estimating confidence inter-vals for the estimated coefficients after considering the random
ch Pol
eutmi1
q(sa
ϕveoaBUtStAt�3
cotScC
5
(asnrbttoatpv(p
iu
atS
eIcta
M. Acosta et al. / Resear
ffects arising from the aggregation of patents by university andniversities by region. Importantly, failure to take into accounthe clustering of data could result in serious biases when we esti-
ate the effects of the aggregate explanatory variables on thendividual-specific response variables (see, for example, Moulton,990; Antweiler, 2001, and Wooldridge, 2003).
The following conditional mean models (FPC) as proxy foruality on the individual (P), university (U), and regionalR) characteristics in the context of a nested random Pois-on model. We specify the model with a random interceptnd fixed slopes E(FPCpur |Rr , Uur, Ppur, �(2)
ur , �(3)r ) = exp( + ˇRr +
Uur + �Ppur + �(3)r + �(2)
ur ), where p indexes patents, u indexes uni-ersities, and r indexes regions. Each level considers the fixedffect of each covariate and the random effect of each cluster ofbservations. We then consider that the three levels of covari-tes comprise patent characteristics, Ppur = (APLIU, APLIE, BPC,PCS, NPC, PRIUSJP, FAMS), a university variable capturing size,ur = (SIZE), and regional covariates, Rr = (OBJ1, GIP, RDU). In addi-
ion, the model controls for sectoral and temporal effects withECHT and a time exposure variable. Note that these explana-ory variables consider each of the different levels of the model.lternatively, �(2)
ur |X, �(3)r ≈ N(0, ϕ(2)) is a random coefficient cap-
uring unobserved heterogeneity over universities (Level 2), and(3)r |X ≈ N(0, ϕ(3)) is a random intercept varying over regions (Level). We assume both random effects are independent.
The log-likelihood for the multilevel Poisson model has nolosed form, and so must be approximated. The estimation of allf the multilevel Poisson models in the next section is with adap-ive Gaussian quadrature, using the seven-quadrature points in thetata Version 11 statistical package. The technical details of the pro-edure can be found in Raudenbush and Bryk (2002), Pinheiro andhao (2006), and Rabe-Hesketh and Skrondal (2008).
. Data
In our empirical analysis, we use forward patent citationsexcluding self-citations) from 4580 European university patentsnd 202 European regions over the period 1998 to 2004. The rea-on for gathering only European patents in our sample is to avoidational distortions arising from the dissimilar patent applicationequirements in different countries. We consider that a patentelongs to a university when the name of the university appears inhe list of applicants. When more than one university appeared onhe list of applicants, we identified university patents with a sharedwnership with other European universities in the EU-15. We thenpplied a full count method assigning the patent to all universitieshat appear as owner of the patent. Of the 4580 university-ownedatents, 128 patents were in collaboration with other EU-15 uni-ersities. Using the full count method, the result was 4708 patents=4580 + 128) and 8852 forward patent citations across 202 Euro-ean regions and 388 universities.2
We regionalize the number of forward patent citations as anndicator of the quality of a patent according to the patent citedsing the following four steps.
First, we identified all of the universities in each region. To
void problems with the university name, we included those insti-utions included in the European Indicators, Cyberspace, and thecience–Technology–Economy–System Project and the Worldwide2 The fractional and full count methods are widely used. In a fractional count,very patent would have the same unitary weight distributed among all its owners.n contrast, in a full count, each link between regions is rated one, such that regionalollaborations are simply the number of patents where the owners of the collabora-ive regions are located. As discussed in Okubo and Zitt (2004), both methods havedvantages and disadvantages.
icy 41 (2012) 692– 703 697
Web of Universities.3 Second, we gathered all of the patents fromeach university located in the same region. A patent was assignedto a university (and in consequence, a region) when the name ofthe university appeared in the list of applicants of the patent. As aresult, the name of the university was the criterion for detecting auniversity patent.
Third, the summation of all citations for university patents inthe same region gives a measure of the quality of the universitytechnological knowledge produced in that region. The regions forour analysis are the territorial units from Eurostat in each country atthe NUTS (Nomenclature of Territorial Units for Statistics) II level ofaggregation in the EU-15. We chose this level of analysis because itis well known, and because a NUTS II level is a territorial unit withsome degree of administrative and policy authority. The regionaldata is also available to cope with our analysis.
Fourth, in order to separate FPC by sectors, we applied aneconomic concordance table developed by Schmoch et al. (2003)between the four-digit level of the International Patent Classifica-tion (IPC) codes and the 44 industrial sectors. Using this equivalencetable, we changed the original IPC data (at the four-digit level) to theClassification of Economic Activities in the European Community(NACE) at the two-digit level based on the industrial sector wherethe patent originated. To avoid duplication, when a patent includedmore than one IPC code, we considered only the primary IPC cate-gory. Once we identified the NACE sectors, it was also possible toidentify the high- and medium-high-technology sectors accordingto the OECD classification.
Regarding the statistical sources, we retrieved the main datafor the analysis from the Derwent Innovation Index® (ThomsonReuters). The regional variables included in our models are directlyfrom Eurostat. We gathered information about the size of the uni-versities from different sources depending on the country wherethe university is located.4 Table 1 summarizes the data.
6. Results
6.1. Some figures on the regional distribution of the quality ofuniversity patenting across European regions
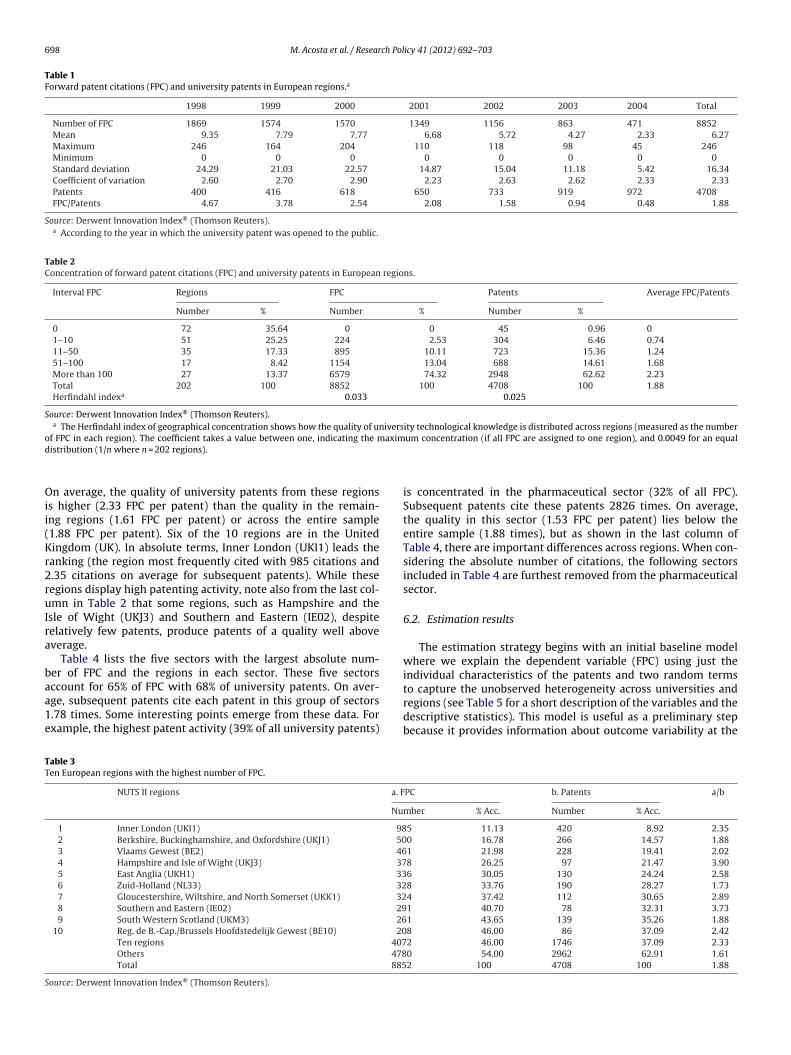
Table 2 presents the regional distribution of FPC and univer-sity patent counts from 1998 to 2004 for the European regions. Inthe lowest interval, 72 of the 202 NUTS II regions do not have anyFPC, even though these regions account for 45 university-ownedpatents. In the highest interval, only 27 regions have more than100 FPC. We can highlight two features from this table. First, qual-ity (as based on the FPC measure) is strongly concentrated: 74.3%of the FPC is from university patents produced in only 13% of theregions. Second, as shown by the Herfindahl index in the bottomrow of Table 2, FPC has a higher regional concentration than patents.Dividing FPC by patents (the last column in Table 2), we obtain theaverage FPC for each interval. Across the entire sample, each univer-sity patent is on average cited 1.88 times in subsequent patents: forthe 13% of regions with relatively more FPC, each university patentis on average cited 2.23 times.
Table 3 presents the 10 European regions with the highest num-
ber of FPC. As expected, most FPC stems from university patentsproduced in regions where there is very high patenting activ-ity: these 10 regions account for 46% of FPC with 37% of patents.3 The website www.univ.cc has links to 7884 universities across 190 countries.4 Including Instituto Nacional de Estadística (Spain), Higher Education Statistics
Agency (United Kingdom), and Ministero dellıIstruzione, dellıUniversitá e DellaRicerca (Italy). For the other EU countries, we gathered the information directlyfrom university websites (the links to which, classified by country, can be found athttp://www.univ.cc/).
698 M. Acosta et al. / Research Policy 41 (2012) 692– 703
Table 1Forward patent citations (FPC) and university patents in European regions.a
1998 1999 2000 2001 2002 2003 2004 Total
Number of FPC 1869 1574 1570 1349 1156 863 471 8852Mean 9.35 7.79 7.77 6.68 5.72 4.27 2.33 6.27Maximum 246 164 204 110 118 98 45 246Minimum 0 0 0 0 0 0 0 0Standard deviation 24.29 21.03 22.57 14.87 15.04 11.18 5.42 16.34Coefficient of variation 2.60 2.70 2.90 2.23 2.63 2.62 2.33 2.33Patents 400 416 618 650 733 919 972 4708FPC/Patents 4.67 3.78 2.54 2.08 1.58 0.94 0.48 1.88
Source: Derwent Innovation Index® (Thomson Reuters).a According to the year in which the university patent was opened to the public.
Table 2Concentration of forward patent citations (FPC) and university patents in European regions.
Interval FPC Regions FPC Patents Average FPC/Patents
Number % Number % Number %
0 72 35.64 0 0 45 0.96 01–10 51 25.25 224 2.53 304 6.46 0.7411–50 35 17.33 895 10.11 723 15.36 1.2451–100 17 8.42 1154 13.04 688 14.61 1.68More than 100 27 13.37 6579 74.32 2948 62.62 2.23Total 202 100 8852 100 4708 100 1.88Herfindahl indexa 0.033 0.025
Source: Derwent Innovation Index® (Thomson Reuters).a The Herfindahl index of geographical concentration shows how the quality of university technological knowledge is distributed across regions (measured as the number
o aximd
Oii(Kr2ruIra
baa1e
TT
S
f FPC in each region). The coefficient takes a value between one, indicating the mistribution (1/n where n = 202 regions).
n average, the quality of university patents from these regionss higher (2.33 FPC per patent) than the quality in the remain-ng regions (1.61 FPC per patent) or across the entire sample1.88 FPC per patent). Six of the 10 regions are in the Unitedingdom (UK). In absolute terms, Inner London (UKI1) leads theanking (the region most frequently cited with 985 citations and.35 citations on average for subsequent patents). While theseegions display high patenting activity, note also from the last col-mn in Table 2 that some regions, such as Hampshire and the
sle of Wight (UKJ3) and Southern and Eastern (IE02), despiteelatively few patents, produce patents of a quality well aboveverage.
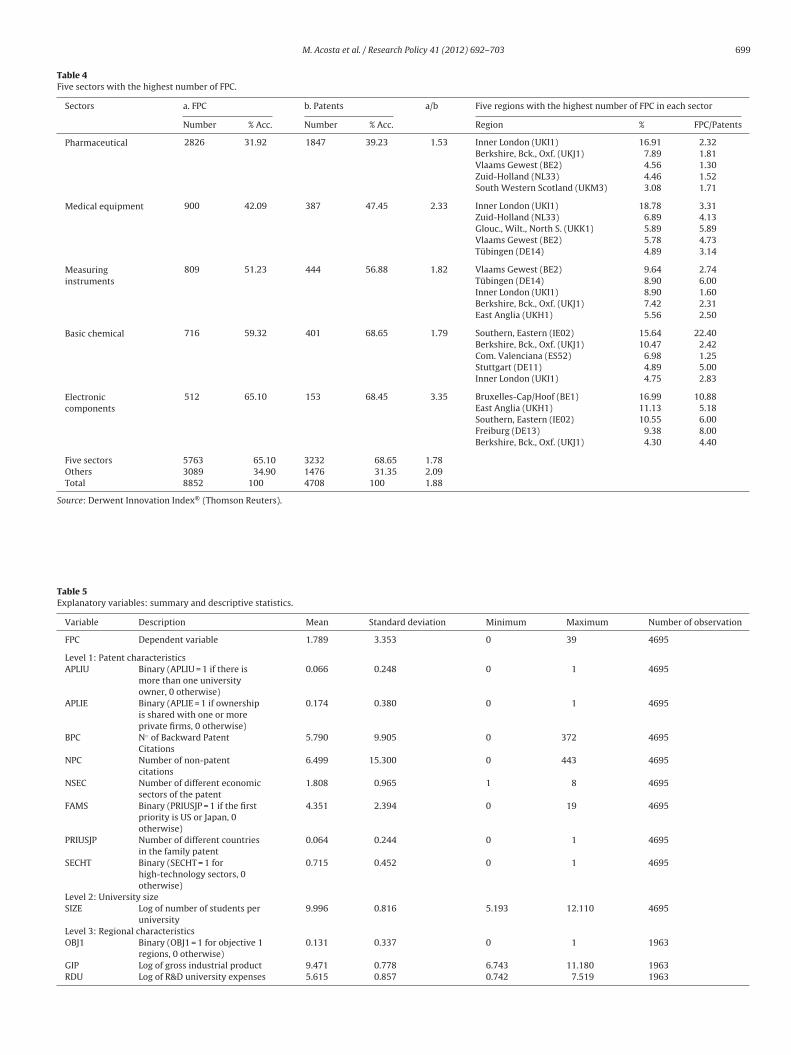
Table 4 lists the five sectors with the largest absolute num-er of FPC and the regions in each sector. These five sectors
ccount for 65% of FPC with 68% of university patents. On aver-ge, subsequent patents cite each patent in this group of sectors.78 times. Some interesting points emerge from these data. Forxample, the highest patent activity (39% of all university patents)able 3en European regions with the highest number of FPC.
NUTS II regions a. F
Nu
1 Inner London (UKI1) 982 Berkshire, Buckinghamshire, and Oxfordshire (UKJ1) 503 Vlaams Gewest (BE2) 464 Hampshire and Isle of Wight (UKJ3) 375 East Anglia (UKH1) 336 Zuid-Holland (NL33) 327 Gloucestershire, Wiltshire, and North Somerset (UKK1) 328 Southern and Eastern (IE02) 299 South Western Scotland (UKM3) 26
10 Reg. de B.-Cap./Brussels Hoofdstedelijk Gewest (BE10) 20Ten regions 407Others 478Total 885
ource: Derwent Innovation Index® (Thomson Reuters).
um concentration (if all FPC are assigned to one region), and 0.0049 for an equal
is concentrated in the pharmaceutical sector (32% of all FPC).Subsequent patents cite these patents 2826 times. On average,the quality in this sector (1.53 FPC per patent) lies below theentire sample (1.88 times), but as shown in the last column ofTable 4, there are important differences across regions. When con-sidering the absolute number of citations, the following sectorsincluded in Table 4 are furthest removed from the pharmaceuticalsector.
6.2. Estimation results
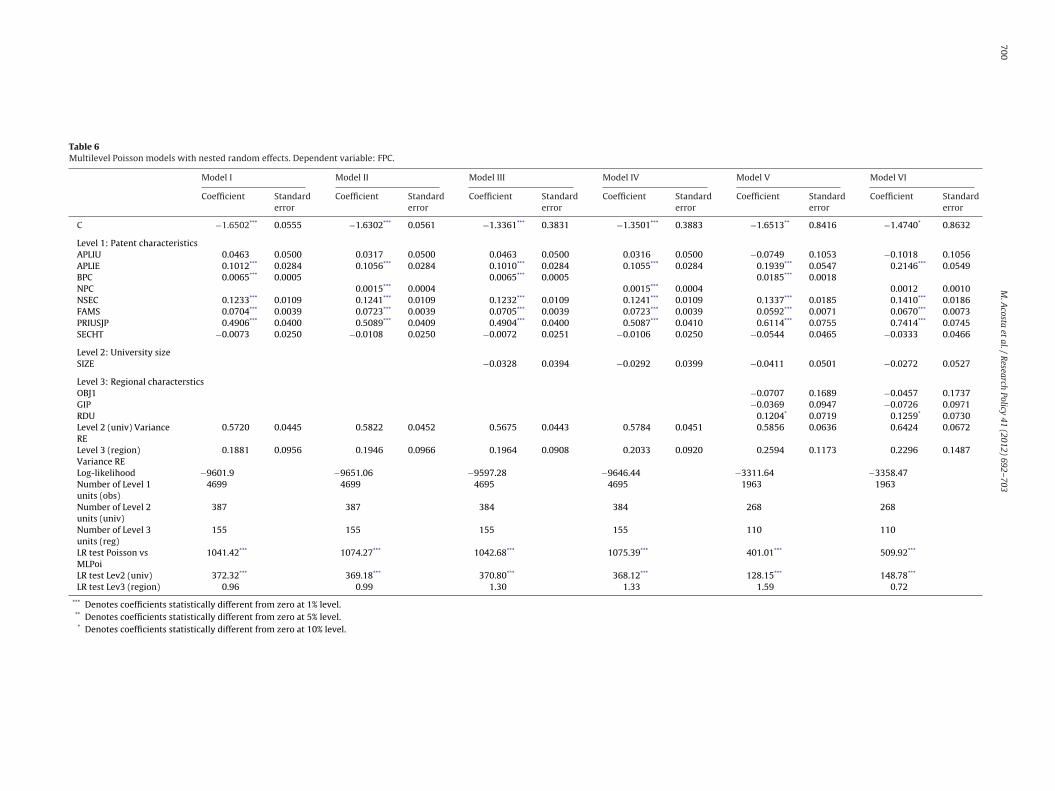
The estimation strategy begins with an initial baseline modelwhere we explain the dependent variable (FPC) using just theindividual characteristics of the patents and two random terms
to capture the unobserved heterogeneity across universities andregions (see Table 5 for a short description of the variables and thedescriptive statistics). This model is useful as a preliminary stepbecause it provides information about outcome variability at thePC b. Patents a/b
mber % Acc. Number % Acc.
5 11.13 420 8.92 2.350 16.78 266 14.57 1.881 21.98 228 19.41 2.028 26.25 97 21.47 3.906 30.05 130 24.24 2.588 33.76 190 28.27 1.734 37.42 112 30.65 2.891 40.70 78 32.31 3.731 43.65 139 35.26 1.888 46.00 86 37.09 2.422 46.00 1746 37.09 2.330 54.00 2962 62.91 1.612 100 4708 100 1.88
M. Acosta et al. / Research Policy 41 (2012) 692– 703 699
Table 4Five sectors with the highest number of FPC.
Sectors a. FPC b. Patents a/b Five regions with the highest number of FPC in each sector
Number % Acc. Number % Acc. Region % FPC/Patents
Pharmaceutical 2826 31.92 1847 39.23 1.53 Inner London (UKI1) 16.91 2.32Berkshire, Bck., Oxf. (UKJ1) 7.89 1.81Vlaams Gewest (BE2) 4.56 1.30Zuid-Holland (NL33) 4.46 1.52South Western Scotland (UKM3) 3.08 1.71
Medical equipment 900 42.09 387 47.45 2.33 Inner London (UKI1) 18.78 3.31Zuid-Holland (NL33) 6.89 4.13Glouc., Wilt., North S. (UKK1) 5.89 5.89Vlaams Gewest (BE2) 5.78 4.73Tübingen (DE14) 4.89 3.14
Measuringinstruments
809 51.23 444 56.88 1.82 Vlaams Gewest (BE2) 9.64 2.74Tübingen (DE14) 8.90 6.00Inner London (UKI1) 8.90 1.60Berkshire, Bck., Oxf. (UKJ1) 7.42 2.31East Anglia (UKH1) 5.56 2.50
Basic chemical 716 59.32 401 68.65 1.79 Southern, Eastern (IE02) 15.64 22.40Berkshire, Bck., Oxf. (UKJ1) 10.47 2.42Com. Valenciana (ES52) 6.98 1.25Stuttgart (DE11) 4.89 5.00Inner London (UKI1) 4.75 2.83
Electroniccomponents
512 65.10 153 68.45 3.35 Bruxelles-Cap/Hoof (BE1) 16.99 10.88East Anglia (UKH1) 11.13 5.18Southern, Eastern (IE02) 10.55 6.00Freiburg (DE13) 9.38 8.00Berkshire, Bck., Oxf. (UKJ1) 4.30 4.40
Five sectors 5763 65.10 3232 68.65 1.78Others 3089 34.90 1476 31.35 2.09Total 8852 100 4708 100 1.88
Source: Derwent Innovation Index® (Thomson Reuters).
Table 5Explanatory variables: summary and descriptive statistics.
Variable Description Mean Standard deviation Minimum Maximum Number of observation
FPC Dependent variable 1.789 3.353 0 39 4695
Level 1: Patent characteristicsAPLIU Binary (APLIU = 1 if there is
more than one universityowner, 0 otherwise)
0.066 0.248 0 1 4695
APLIE Binary (APLIE = 1 if ownershipis shared with one or moreprivate firms, 0 otherwise)
0.174 0.380 0 1 4695
BPC N◦ of Backward PatentCitations
5.790 9.905 0 372 4695
NPC Number of non-patentcitations
6.499 15.300 0 443 4695
NSEC Number of different economicsectors of the patent
1.808 0.965 1 8 4695
FAMS Binary (PRIUSJP = 1 if the firstpriority is US or Japan, 0otherwise)
4.351 2.394 0 19 4695
PRIUSJP Number of different countriesin the family patent
0.064 0.244 0 1 4695
SECHT Binary (SECHT = 1 forhigh-technology sectors, 0otherwise)
0.715 0.452 0 1 4695
Level 2: University sizeSIZE Log of number of students per
university9.996 0.816 5.193 12.110 4695
Level 3: Regional characteristicsOBJ1 Binary (OBJ1 = 1 for objective 1
regions, 0 otherwise)0.131 0.337 0 1 1963
GIP Log of gross industrial product 9.471 0.778 6.743 11.180 1963RDU Log of R&D university expenses 5.615 0.857 0.742 7.519 1963
700M
. A
costa et
al. /
Research
Policy 41 (2012) 692– 703
Table 6Multilevel Poisson models with nested random effects. Dependent variable: FPC.
Model I Model II Model III Model IV Model V Model VI
Coefficient Standarderror
Coefficient Standarderror
Coefficient Standarderror
Coefficient Standarderror
Coefficient Standarderror
Coefficient Standarderror
C −1.6502*** 0.0555 −1.6302*** 0.0561 −1.3361*** 0.3831 −1.3501*** 0.3883 −1.6513** 0.8416 −1.4740* 0.8632
Level 1: Patent characteristicsAPLIU 0.0463 0.0500 0.0317 0.0500 0.0463 0.0500 0.0316 0.0500 −0.0749 0.1053 −0.1018 0.1056APLIE 0.1012*** 0.0284 0.1056*** 0.0284 0.1010*** 0.0284 0.1055*** 0.0284 0.1939*** 0.0547 0.2146*** 0.0549BPC 0.0065*** 0.0005 0.0065*** 0.0005 0.0185*** 0.0018NPC 0.0015*** 0.0004 0.0015*** 0.0004 0.0012 0.0010NSEC 0.1233*** 0.0109 0.1241*** 0.0109 0.1232*** 0.0109 0.1241*** 0.0109 0.1337*** 0.0185 0.1410*** 0.0186FAMS 0.0704*** 0.0039 0.0723*** 0.0039 0.0705*** 0.0039 0.0723*** 0.0039 0.0592*** 0.0071 0.0670*** 0.0073PRIUSJP 0.4906*** 0.0400 0.5089*** 0.0409 0.4904*** 0.0400 0.5087*** 0.0410 0.6114*** 0.0755 0.7414*** 0.0745SECHT −0.0073 0.0250 −0.0108 0.0250 −0.0072 0.0251 −0.0106 0.0250 −0.0544 0.0465 −0.0333 0.0466
Level 2: University sizeSIZE −0.0328 0.0394 −0.0292 0.0399 −0.0411 0.0501 −0.0272 0.0527
Level 3: Regional charactersticsOBJ1 −0.0707 0.1689 −0.0457 0.1737GIP −0.0369 0.0947 −0.0726 0.0971RDU 0.1204* 0.0719 0.1259* 0.0730Level 2 (univ) VarianceRE
0.5720 0.0445 0.5822 0.0452 0.5675 0.0443 0.5784 0.0451 0.5856 0.0636 0.6424 0.0672
Level 3 (region)Variance RE
0.1881 0.0956 0.1946 0.0966 0.1964 0.0908 0.2033 0.0920 0.2594 0.1173 0.2296 0.1487
Log-likelihood −9601.9 −9651.06 −9597.28 −9646.44 −3311.64 −3358.47Number of Level 1units (obs)
4699 4699 4695 4695 1963 1963
Number of Level 2units (univ)
387 387 384 384 268 268
Number of Level 3units (reg)
155 155 155 155 110 110
LR test Poisson vsMLPoi
1041.42*** 1074.27*** 1042.68*** 1075.39*** 401.01*** 509.92***
LR test Lev2 (univ) 372.32*** 369.18*** 370.80*** 368.12*** 128.15*** 148.78***
LR test Lev3 (region) 0.96 0.99 1.30 1.33 1.59 0.72
*** Denotes coefficients statistically different from zero at 1% level.** Denotes coefficients statistically different from zero at 5% level.* Denotes coefficients statistically different from zero at 10% level.
ch Pol
ucipwI
vmtctrtoecpfWb2
tiHiwc
faacvtiini
itwpnvorplTv(cssf
ta
ms
M. Acosta et al. / Resear
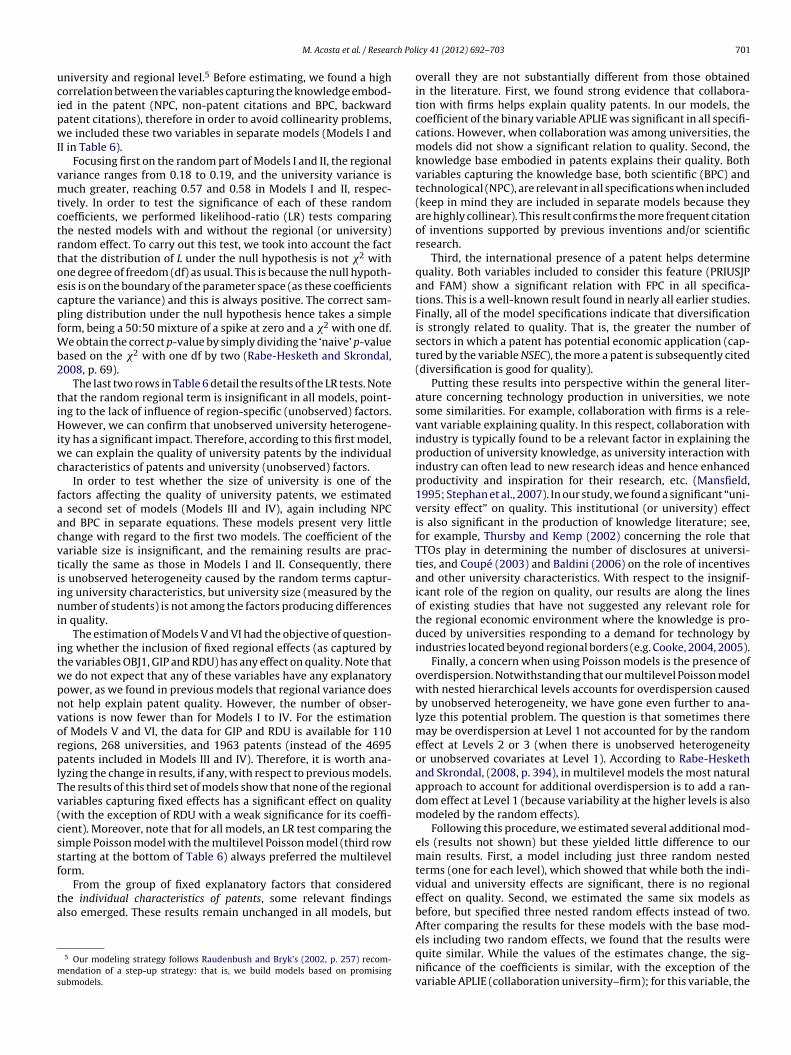
niversity and regional level.5 Before estimating, we found a highorrelation between the variables capturing the knowledge embod-ed in the patent (NPC, non-patent citations and BPC, backwardatent citations), therefore in order to avoid collinearity problems,e included these two variables in separate models (Models I and
I in Table 6).Focusing first on the random part of Models I and II, the regional
ariance ranges from 0.18 to 0.19, and the university variance isuch greater, reaching 0.57 and 0.58 in Models I and II, respec-
ively. In order to test the significance of each of these randomoefficients, we performed likelihood-ratio (LR) tests comparinghe nested models with and without the regional (or university)andom effect. To carry out this test, we took into account the facthat the distribution of L under the null hypothesis is not �2 withne degree of freedom (df) as usual. This is because the null hypoth-sis is on the boundary of the parameter space (as these coefficientsapture the variance) and this is always positive. The correct sam-ling distribution under the null hypothesis hence takes a simpleorm, being a 50:50 mixture of a spike at zero and a �2 with one df.
e obtain the correct p-value by simply dividing the ‘naive’ p-valueased on the �2 with one df by two (Rabe-Hesketh and Skrondal,008, p. 69).
The last two rows in Table 6 detail the results of the LR tests. Notehat the random regional term is insignificant in all models, point-ng to the lack of influence of region-specific (unobserved) factors.owever, we can confirm that unobserved university heterogene-
ty has a significant impact. Therefore, according to this first model,e can explain the quality of university patents by the individual
haracteristics of patents and university (unobserved) factors.In order to test whether the size of university is one of the
actors affecting the quality of university patents, we estimated second set of models (Models III and IV), again including NPCnd BPC in separate equations. These models present very littlehange with regard to the first two models. The coefficient of theariable size is insignificant, and the remaining results are prac-ically the same as those in Models I and II. Consequently, theres unobserved heterogeneity caused by the random terms captur-ng university characteristics, but university size (measured by theumber of students) is not among the factors producing differences
n quality.The estimation of Models V and VI had the objective of question-
ng whether the inclusion of fixed regional effects (as captured byhe variables OBJ1, GIP and RDU) has any effect on quality. Note thate do not expect that any of these variables have any explanatoryower, as we found in previous models that regional variance doesot help explain patent quality. However, the number of obser-ations is now fewer than for Models I to IV. For the estimationf Models V and VI, the data for GIP and RDU is available for 110egions, 268 universities, and 1963 patents (instead of the 4695atents included in Models III and IV). Therefore, it is worth ana-
yzing the change in results, if any, with respect to previous models.he results of this third set of models show that none of the regionalariables capturing fixed effects has a significant effect on qualitywith the exception of RDU with a weak significance for its coeffi-ient). Moreover, note that for all models, an LR test comparing theimple Poisson model with the multilevel Poisson model (third rowtarting at the bottom of Table 6) always preferred the multilevelorm.
From the group of fixed explanatory factors that consideredhe individual characteristics of patents, some relevant findingslso emerged. These results remain unchanged in all models, but
5 Our modeling strategy follows Raudenbush and Bryk’s (2002, p. 257) recom-endation of a step-up strategy: that is, we build models based on promising
ubmodels.
icy 41 (2012) 692– 703 701
overall they are not substantially different from those obtainedin the literature. First, we found strong evidence that collabora-tion with firms helps explain quality patents. In our models, thecoefficient of the binary variable APLIE was significant in all specifi-cations. However, when collaboration was among universities, themodels did not show a significant relation to quality. Second, theknowledge base embodied in patents explains their quality. Bothvariables capturing the knowledge base, both scientific (BPC) andtechnological (NPC), are relevant in all specifications when included(keep in mind they are included in separate models because theyare highly collinear). This result confirms the more frequent citationof inventions supported by previous inventions and/or scientificresearch.
Third, the international presence of a patent helps determinequality. Both variables included to consider this feature (PRIUSJPand FAM) show a significant relation with FPC in all specifica-tions. This is a well-known result found in nearly all earlier studies.Finally, all of the model specifications indicate that diversificationis strongly related to quality. That is, the greater the number ofsectors in which a patent has potential economic application (cap-tured by the variable NSEC), the more a patent is subsequently cited(diversification is good for quality).
Putting these results into perspective within the general liter-ature concerning technology production in universities, we notesome similarities. For example, collaboration with firms is a rele-vant variable explaining quality. In this respect, collaboration withindustry is typically found to be a relevant factor in explaining theproduction of university knowledge, as university interaction withindustry can often lead to new research ideas and hence enhancedproductivity and inspiration for their research, etc. (Mansfield,1995; Stephan et al., 2007). In our study, we found a significant “uni-versity effect” on quality. This institutional (or university) effectis also significant in the production of knowledge literature; see,for example, Thursby and Kemp (2002) concerning the role thatTTOs play in determining the number of disclosures at universi-ties, and Coupé (2003) and Baldini (2006) on the role of incentivesand other university characteristics. With respect to the insignif-icant role of the region on quality, our results are along the linesof existing studies that have not suggested any relevant role forthe regional economic environment where the knowledge is pro-duced by universities responding to a demand for technology byindustries located beyond regional borders (e.g. Cooke, 2004, 2005).
Finally, a concern when using Poisson models is the presence ofoverdispersion. Notwithstanding that our multilevel Poisson modelwith nested hierarchical levels accounts for overdispersion causedby unobserved heterogeneity, we have gone even further to ana-lyze this potential problem. The question is that sometimes theremay be overdispersion at Level 1 not accounted for by the randomeffect at Levels 2 or 3 (when there is unobserved heterogeneityor unobserved covariates at Level 1). According to Rabe-Heskethand Skrondal, (2008, p. 394), in multilevel models the most naturalapproach to account for additional overdispersion is to add a ran-dom effect at Level 1 (because variability at the higher levels is alsomodeled by the random effects).
Following this procedure, we estimated several additional mod-els (results not shown) but these yielded little difference to ourmain results. First, a model including just three random nestedterms (one for each level), which showed that while both the indi-vidual and university effects are significant, there is no regionaleffect on quality. Second, we estimated the same six models asbefore, but specified three nested random effects instead of two.After comparing the results for these models with the base mod-
els including two random effects, we found that the results werequite similar. While the values of the estimates change, the sig-nificance of the coefficients is similar, with the exception of thevariable APLIE (collaboration university–firm); for this variable, the
7 ch Pol
eicfr
7
sasugtmnu
waitetsi
cweuawnquFrteta
ovpapfwtomieaipwh
ivt
02 M. Acosta et al. / Resear
stimated coefficient displayed weaker significance (at the 5% leveln these four models instead of the 1% level in the main models). Theoefficients for the regional covariates remain insignificant. There-ore, accounting for additional overdispersion in the hierarchicalegression model serves to confirm our previous findings.
. Conclusion
In this paper, we used FPC as a measure of the quality of univer-ity technological knowledge. Based on a preliminary descriptivenalysis, our results show that quality (as measured by FPC) istrongly concentrated in just a few regions (74% of FPC stem fromniversity patents produced in only 13% of the regions). In theroup of ten regions with the highest number of FPC, six are inhe UK, where there is strong university patenting activity. Our
ain research question was to determine whether the regional eco-omic environment is the cause of the differences in the quality ofniversity technological knowledge across European regions.
Given the nature of the variable capturing quality (FPC count),e estimated several random effects Poisson models supported on
hierarchical framework that took into account three levels: thendividual characteristics of patents, the university influences, andhe regional economic environment. After controlling for sectoralffects and time exposure (recent patents have less time for cita-ion), we found that the regional economic environment does noteem to play any role in explaining the quality of patents producedn universities.
The estimated models showed that the random regional termsapturing the influence of region-specific (unobserved) factorsere insignificant. However, all of the models exhibited the pres-
nce of a strong university effect. The random term capturingnobserved university heterogeneity is highly significant. The onlyvailable explanatory variable to capture university characteristicsas size, as measured by the number of students, but the lack of sig-ificance suggests that the size of a university does not influence theuality of university patents. Therefore, other (as yet unidentified)niversity characteristics affect the quality of university patents.inally, several individual characteristics of patents significantlyelate to quality. These include patents developed in collabora-ion with firms, the scientific and technological knowledge basembodied in patents, the international presence of a patent, andhe number of sectors in which a patent has potential economicpplication.
Despite not having obtained any evidence of a regional effect,ur empirical results still suggest some policy implications for uni-ersities. Several patent characteristics in our models show thatatents developed in collaboration with firms, including those with
better knowledge base and more economic applications, andatents first applied in the US or Japan, have higher quality. There-ore, greater attention to and support of these issues by universitiesill increase quality. This means that for universities to obtain
he best quality in their patenting activity is not just a questionf money, but also good organization. This includes the imple-entation of a ‘technology watch’ to correctly identify previous
nventions and scientific papers where a patent should be based, thencouragement of patents developed in collaboration with firmsnd those intended to have an international presence, and reward-ng (maybe with greater resources) the development of broaderatents (those with more potential applications). These are all areashere individual universities and their technology transfer officesave much control.
Future empirical research should address several additionalssues. First, our main concern stems from the black box of uni-ersity factors affecting the quality of university patenting. Inhis respect, it is necessary to gather data in advance about the
icy 41 (2012) 692– 703
particular characteristics of universities as they relate to humanresources, patent policies, incentives, etc. The literature on patentproduction has to some extent contributed to this purpose sug-gesting, for example, the role of the presence of start scientists orefficient technology transfer offices. The question is whether thesefactors affect patent quality.
Second, our explanation of the lack of significance of theregional economic environment is worthy of further investigation.For instance, this may be because universities do not respond toregional demand rather than to the global demand for the special-ized technology produced in universities. The opposite may also bepossible when the region is too large, and universities are only pro-viding technological support to firms that are geographically close;that is, the influence on quality stems from the local environment.To clarify this point, we could undertake a similar analysis usingsmaller territorial units (say, NUTs III regions instead of NUTs II).Lastly, we should consider more carefully the impact of the diver-sification/specialization of technological knowledge production inuniversities on quality, as this issue has important strategic policyimplications.
Acknowledgements
This research was supported by a grant from the Ministeriode Educación y Ciencia (SEJ2005-08972/ECON) and the Junta deAndalucía (P06-SEJ-02087 and P08-SEJ-03981). An earlier draft ofthis paper was presented at the 48th Congress of the EuropeanRegional Science Association (Liverpool). The authors express theirthanks to colleagues at this conference for their helpful suggestions.The authors are also very grateful to two anonymous reviewers fortheir constructive and insightful comments.
References
Albert, M.B., Avery, D., Narin, F., McAllister, P., 1991. Direct validation of cita-tion counts as indicators of industrially important patents. Research Policy 20,251–259.
Acosta, M., Coronado, D., León, D., Martínez, M.A., 2009. The production of univer-sity technological knowledge in European regions: evidence from patent data.Regional Studies 43, 1167–1181.
Agrawal, A., Cockburn, I., 2003. The anchor tenant hypothesis: exploring the role oflarge, local, R&D-intensive firms in regional innovation systems. InternationalJournal of Industrial Organization 21, 1227–1253.
Anselin, L., Varga, A., Acs, Z.J., 1997. Local geographic spillovers between univer-sity research and high technology innovations. Journal of Urban Economics 42,422–448.
Anselin, L., Varga, A., Acs, Z.J., 2000. Geographic and sectoral characteristics of aca-demic knowledge externalities. Papers in Regional Science 79, 435–443.
Antweiler, W., 2001. Nested random effects estimation in unbalanced panel data.Journal of Econometrics 101, 295–313.
Azagra-Caro, J.M., Fernandez-de-Lucio, I., Gutierrez-Gracia, A., 2003. Universitypatents: output and input indicators. . .of what? Research Evaluation 12, 5–16.
Bae, J., Koo, J., 2008. The nature of local knowledge and new firm formation. Industrialand Corporate Change 18, 473–496.
Baldini, N., 2006. University patenting and licensing activity: a review of the litera-ture. Research Evaluation 15, 197–207.
Baldini, N., Grimaldi, R., Sobrero, M., 2006. Institutional changes and the commer-cialization of academic knowledge: a study of Italian universities’ patentingactivities between 1965 and 2002. Research Policy 35, 518–532.
Bessen, J., 2008. The value of U.S. patents by owner and patent characteristics.Research Policy 37, 932–945.
Burke, P.F., Reitzig, M., 2007. Measuring patent assessment quality—analyzing thedegree and kind of (in)consistency in patent offices’ decision making. ResearchPolicy 36, 1404–1430.
Calderini, M., Scellato, G., 2005. Academic research, technological specialization andthe innovation performance in European regions: an empirical analysis in thewireless sector. Industrial and Corporate Change 14, 279–305.
Carlsson, B., Fridh, A., 2002. Technology transfer in United States universities: asurvey and statistical analysis. Journal of Evolutionary Economics 12, 199–232.
Carpenter, M.P., Narin, F., Wolf, P., 1981. Citation rates to technologically importantpatents. World Patent Information 3, 160–163.
Cooke, P., 2004. Regional knowledge capabilities, embeddedness of firms and indus-try organisation: bioscience megacentres and economic geography. EuropeanPlanning Studies 12, 625–641.
ch Pol
C
C
D
E
E
E
F
F
F
F
F
F
F
G
G
G
G
G
G
G
G
H
H
H
J
J
K
L
L
L
L
L
L
L
M
M. Acosta et al. / Resear
ooke, P., 2005. Rational drug design, the knowledge value chain and biosciencemegacentres. Cambridge Journal of Economics 29, 325–341.
oupé, T., 2003. Science is golden: academic R&D and university patents. Journal ofTechnology Transfer 28, 31–46.
’Este, P., Patel, P., 2007. University–industry linkages in the UK: what are the fac-tors underlying the variety of interactions with industry? Research Policy 36,1295–1313.
tzkowitz, H., Klofsten, M., 2005. The innovating region: toward a theory ofknowledge-based regional development. R&D Management 35, 243–255.
tzkowitz, H., Leydesdorff, L., 1997. University and the Global Knowledge Economy.A Triple Helix of University–Industry–Government Relations. Pinter Publishers,London.
tzkowitz, H., Leydesdorff, L., 2000. The dynamics of innovation: from national sys-tem and ‘Mode 2’ to a triple helix of university–industry–government relations.Research Policy 29, 109–123.
eldman, M.P., Audretsch, D.B., 1999. Innovation in cities: science-based diver-sity, specialization and localized competition. European Economic Review 43,409–429.
eldman, M., Desrochers, P., 2003. Research universities and local economic devel-opment: lessons from the history of the Johns Hopkins University. Industry andInnovation 10, 5–24.
ini, R., Grimaldi, R., Santoni, S., Sobrero, M., 2011. Complements or substitutes?The role of universities and local context in supporting the creation of academicspin-offs. Research Policy 40, 1113–1127.
ischer, M., Varga, A., 2003. Spatial knowledge spillovers and university research:evidence from Austria. Annals of Regional Science 37, 303–322.
oltz, J.D., Kim, K., Barham, B., 2003. A dynamic analysis of university agriculturalbiotechnology patent production. American Journal of Agricultural Economics85, 187–197.
riedman, J., Silberman, J., 2003. University technology transfer: do incentives, man-agement and location matter? Journal of Technology Transfer 28, 17–30.
ritsch, M., Slavtchev, V., 2007. Universities and innovation in space. Industry andInnovation 14, 201–218.
ay, C., Latham, W., Le Bas, C., 2008. Collective knowledge, prolific inventors and thevalue of inventions an empirical study of French German and British patents inthe US 1975–1999. Economics of Innovation and New Technology 17, 5–22.
ay, C., Le Bas, C., Patel, P., Touach, K., 2005. The determinants of patent citations:an empirical analysis of French and British patents in the US. Economics ofInnovation & New Technology 14, 339–350.
euna, A., Nesta, L.J.J., 2006. University patenting and its effects on academicresearch: the emerging European evidence. Research Policy 35, 790–807.
euna, A., Rossi, F., 2011. Changes to university IPR regulations in Europe and theimpact on academic patenting. Research Policy 40, 1068–1076.
ittelman, M., 2006. National institutions, public–private knowledge flows, andinnovation performance: a comparative study of the biotechnology industry inthe US and France. Research Policy 35, 1052–1068.
ittelman, M., Kogut, B., 2003. Does good science lead to valuable knowledge?Biotechnology firms and the evolutionary logic of citation patterns. Manage-ment Science 49, 366–382.
iuliani, E., Arza, V., 2009. What drives the formation of valuable university–industrylinkages? Insights from the wine industry. Research Policy 38, 906–921.
oldfarb, B., Henrekson, M., 2003. Bottom-up versus top-down policies towardsthe commercialization of university intellectual property. Research Policy 32,639–658.
arhoff, D., Narin, F., Scherer, F.M., Vopel, K., 1999. Citation frequency and the valueof patented inventions. Review of Economics & Statistics 81, 511–515.
arhoff, D., Scherer, F.M., Vopel, K., 2003. Citations family size, opposition and thevalue of patent rights. Research Policy 32, 1343–1363.
enderson, R., Jaffe, A.B., Trajtenberg, M., 1998. Universities as a source of commer-cial technology: a detailed analysis of university patenting, 1965–1988. Reviewof Economics & Statistics 80, 119–128.
affe, A., 1989. Real effects of academic research. American Economic Review 79,957–970.
affe, A., Trajtenberg, M., 2002. Patents, Citations and Innovations: A Window on theKnowledge Economy. MIT Press, Cambridge, MA.
oo, J., 2007. Determinants of localized technology spillovers: role of regional andindustrial attributes. Regional Studies 41, 995–1011.
ach, S., Schankerman, M., 2004. Royalty sharing and technology licensing in uni-versities. Journal of the European Economic Association 2, 252–264.
andry, R., Amara, N., Ouimet, M., 2007. Determinants of knowledge transfer: evi-dence from Canadian university researchers in natural sciences and engineering.Journal of Technology Transfer 32, 561–592.
anjouw, J.O., Schankerman, M., 2004. Patent quality and research productiv-ity: measuring innovation with multiple indicators. Economic Journal 114,441–465.
ee, Y.-G., Lee, J.-D., Song, Y.-I., Lee, S.-J., 2007. An in-depth empirical analysis ofpatent citation counts using zero-inflated count data model: the case of KIST.Scientometrics 70, 27–39.
eydesdorff, L., 2000. The triple helix: an evolutionary model of innovations.Research Policy 29, 243–256.
issoni, F., Llerena, P., McKelvey, M., Sanditov, B., 2008. Academic patenting in
Europe: new evidence from the KEINS database. Research Evaluation 17, 87–102.undvall, B.A., Johnson, B., Andersen, E.S., Dalum, B., 2002. National systems of pro-duction, innovation and competence building. Research Policy 31, 213–231.
ansfield, E., 1995. Academic research underlying industrial innovations: sources,characteristics, and financing. Review of Economics and Statistics 77, 55–65.
icy 41 (2012) 692– 703 703
Mansfield, E., Lee, J.Y., 1996. The modern university: contributor to industrial inno-vation and recipient of industrial R&D support. Research Policy 25, 1047–1058.
Marco, A.C., 2007. The dynamics of patent citations. Economics Letters 94, 290–296.Markusen, A.R., Hall, P., Glasmeier, A., 1986. High Tech America: The What, How,
Where and Why of the Sunrise Industries. Allen and Unwin, Boston.Maurseth, P.B., Verspagen, B., 2002. Knowledge spillovers in Europe: a patent cita-
tions analysis. Scandinavian Journal of Economics 104, 531–545.Moulton, B.R., 1990. An illustration of a pitfall in estimating the effects of aggregate
variables on micro units. Review of Economics and Statistics 72, 334–338.Mowery, D.C., Sampat, B.N., Ziedonis, A.A., 2002. Learning to patent: institutional
experience, learning, and the characteristics of U.S. university patents after theBayh–Dole Act, 1981–1992. Management Science 48, 73–90.
Mowery, D.C., Ziedonis, A.A., 2002. Academic patent quality and quantity before andafter the Bayh–Dole Act in the United States. Research Policy 31, 399–418.
Mowery, D.C., Sampat, B.N., 2004. Universities in national innovation systems. In:Fagerberg, J., Mowery, D.C., Nelson, R.R. (Eds.), The Oxford Handbook of Innova-tion. Oxford University Press, Oxford.
Okubo, Y., Zitt, M., 2004. Searching for research integration across Europe: a closerlook at international and inter-regional collaboration in France. Science andPublic Policy 31, 213–226.
Perkmann, M., King, Z., Pavelin, S., 2011. Engaging excellence? Effects of fac-ulty quality on university engagement with industry. Research Policy 40,539–552.
Pinheiro, J.C., Chao, E.C., 2006. Efficient Laplacian and adaptive Gaussian quadraturealgorithms for multilevel generalized linear mixed models. Journal of Compu-tational and Graphical Statistics 15, 58–81.
Ponomariov, B.L., 2008. Effects of university characteristics on scientists’ interac-tions with the private sector: an exploratory assessment. Journal of TechnologyTransfer 33, 485–503.
Putnam, J. 1996. The value of International Patent Protection. PhD Thesis, Yale Uni-versity.
Rabe-Hesketh, S., Skrondal, A., 2008. Multilevel and Longitudinal Modeling UsingStata. Stata Press, College Station, TX.
Raudenbush, S.W., Bryk, A.S., 2002. Hierarchical Linear Models: Applications andData Analysis Methods. Sage, Thousand Oaks CA.
Rogers, E.M., Yin, J., Hoffmann, J., 2000. Assessing the effectiveness of technologytransfer offices at US research universities. The Journal of the Association ofUniversity Technology Managers 12, 47–80.
Sampat, B.N., Mowery, D.C., Ziedonis, A.A., 2003. Changes in university patent qualityafter the Bayh–Dole Act: a re-examination. International Journal of IndustrialOrganization 21, 1371–1390.
Sapsalis, E., Van Pottelsberghe de la Potterie, B., 2007. The institutional sources ofknowledge and the value of academic patents. Economics of Innovation and NewTechnology 16, 139–157.
Sapsalis, E., Van Pottelsberghe de la Potterie, B., Navon, R., 2006. Academic versusindustry patenting: an in-depth analysis of what determines patent value.Research Policy 35, 1631–1645.
Saragossi, S., Van Pottelsberghe de la Potterie, B., 2003. What patent data reveal aboutuniversities: the case of Belgium. Journal of Technology Transfer 28, 47–51.
Saxenian, A., 1994. Regional Advantage: Culture and Competition in Silicon Valleyand Route 128. Harvard University Press, Cambridge.
Schartinger, D., Rammer, C., Fischer, M., Frshlich, J., 2002. Knowledge interactionsbetween universities and industry in Austria: sectoral patterns and determi-nants. Research Policy 31, 303–328.
Schmoch, U., Laville, F., Patel, P., Frietsch, R., 2003. Linking technologies areas toindustrial sectors. Fraunhofer Institute for Systems and Innovation Research(Karlsruhe, Germany), Observatoire des Sciences et des Techniques (OST) (Paris,France), University of Sussex, Science and Policy Research Unit (SPRU) (Brighton,United Kingdom).
Sternberg, R., Tamasy, C., 1999. Munich in Germany’s N1 high technology region:empirical evidence, theoretical explanations, and the role of small firm/largefirm relationships. Regional Studies 33, 367–377.
Stephan, P., Gurmu, S., Sumell, A.J., Grant, B., 2007. Who’s patenting in the Univer-sity? Evidence from the survey of doctorate recipients. Economics of Innovationand New Technology 16, 71–99.
Thomas, P., 1999. The effect of technological impact upon patent renewal decisions.Technology Analysis & Strategic Management 11, 181–197.
Thomas, P., Breitzman, A., 2006. A method for identifying hot patents and link-ing them to government-funded scientific research. Research Evaluation 15,145–152.
Thursby, J., Kemp, S., 2002. Growth and productive efficiency of university intellec-tual property licensing. Research Policy 31, 109–124.
Tornquist, K.M., Kallsen, L.A., 1994. Out of the ivory tower: characteristics of insti-tutions meeting the research needs of industry. Journal of Higher Education 65,523–539.
Trajtenberg, M., 1990. A penny for your quotes: patent citations and the value ofinnovations. RAND Journal of Economics 21, 172–187.
Turk-Bicakci, L., Brint, S., 2005. University–industry collaboration: patterns ofgrowth for low- and middle-level performers. Higher Education 49, 61–89.
Verspagen, B., Schoenmakers, W., 2000. The Spatial Dimension of KnowledgeSpillovers in Europe: Evidence from Firm Patenting Data. Technische Univer-
siteit Eindhoven, The Netherlands.Wever, E., Stam, E., 1999. Cluster of high technology SMEs: the Dutch case. RegionalStudies 33, 391–400.
Wooldridge, J.M., 2003. Cluster-sample methods in applied econometrics. AmericanEconomic Review 93, 133–138.
Copyright © 2022 FDOKUMEN