Fresh Surgical Specimens Yield Breast Stem/Progenitor Cells and Reveal Their Oncogenic Abnormalities
9
ORIGINAL ARTICLE – BREAST ONCOLOGY Fresh Surgical Specimens Yield Breast Stem/Progenitor Cells and Reveal Their Oncogenic Abnormalities SuEllen J. Pommier, PhD 1 , Ariel Hernandez, BS 1 , Esther Han, MD 2 , Kristen Massimino, MD 2 , Patrick Muller, BS 1 , Brian Diggs, PhD 2 , Erin Chamberlain, BS 4 , Jennifer Murphy, MD 3 , Juliana Hansen, MD 3 , Arpana Naik, MD 1 , John Vetto, MD 1 , and Rodney F. Pommier, MD 1 1 Division of Surgical Oncology, Department of Surgery, Oregon Health & Science University, Portland, OR; 2 Division of General Surgery, Department of Surgery, Oregon Health & Science University, Portland, OR; 3 Division of Plastic Surgery and Reconstruction, Department of Surgery, Oregon Health & Science University, Portland, OR; 4 Oregon Health & Science University, Medical School, Portland, OR ABSTRACT Background. The process by which breast cancer stem cells arise is unknown. It may be that the benign stem cells in breast tissue are transformed into malignant stem cells through the acquisition of genetic abnormalities. In this study, we collected and compared benign and malignant breast stem/progenitor cells to determine whether specific genetic abnormalities occur in breast cancer stem/progen- itor cells within the human body. Methods. Fresh surgical specimens from benign and malignant breast tissues were obtained directly from the operating room and examined. Cells variably expressing stem cell-associated surface markers CD49f and CD24 were collected by fluorescence-activated cell sorting. The frequencies of these cells in benign and malignant breast tissues were ascertained. Oncogenetic mutation analyses were performed and expression of stem cell-associated genes was measured. Results. The frequencies of stem/progenitor cells were similar between benign and malignant tissues. Stem cell-associated gene expression also was similar between benign and malignant stem cells. Genetic mutations in the PIK/AKT pathway were found in 73% of the tumors’ stem cells, specifically within two subpopulations. No mutations were found in stem/progenitor cell subpopulations from benign breast tissue. Conclusions. The results of this study suggest that, fol- lowing malignant transformation, breast cancer stem/ progenitor cells retain their stem cell functions and relative frequencies. In addition, they develop malignant capabili- ties by acquiring mutations in genes critical for maintaining normal cellular metabolism and proliferation. Cancer stem cell theory proposes that tumor biology is driven by cancer stem and progenitor cells present in the tumor. 1–5 In culture, these cells are refractory to treatment and may be responsible for the high recurrence rate observed in both estrogen receptor negative or positive (ER - or ER ? ) breast cancers. 6–8 The process by which cancer stem cells arise is unknown. It is not known whether stem cells are present in all breast cancers or to what extent they contribute to the overall number of tumor cells. One possible mechanism by which cancer stem cells may form is through the malignant transformation of normal stem cells via acquisition of somatic genetic abnormalities. In this proposed model, breast stem cells would initiate breast cancer and orchestrate tumor progression. They would retain some or all stem cell functional capacities but through mutational events would acquire malignant capa- bilities as well. Attempts to identify and isolate breast stem cells have relied upon expression of cell surface markers. Although a Electronic supplementary material The online version of this article (doi:10.1245/s10434-011-1892-z) contains supplementary material, which is available to authorized users. Ó The Author(s) 2011. This article is published with open access at Springerlink.com First Received: 20 February 2011; Published Online: 12 July 2011 S. J. Pommier, PhD e-mail: [email protected] Ann Surg Oncol (2012) 19:527–535 DOI 10.1245/s10434-011-1892-z
-
Upload
independent -
Category
Documents
-
view
0 -
download
0
Transcript of Fresh Surgical Specimens Yield Breast Stem/Progenitor Cells and Reveal Their Oncogenic Abnormalities
ORIGINAL ARTICLE – BREAST ONCOLOGY
Fresh Surgical Specimens Yield Breast Stem/Progenitor Cellsand Reveal Their Oncogenic Abnormalities
SuEllen J. Pommier, PhD1, Ariel Hernandez, BS1, Esther Han, MD2, Kristen Massimino, MD2, Patrick Muller, BS1,
Brian Diggs, PhD2, Erin Chamberlain, BS4, Jennifer Murphy, MD3, Juliana Hansen, MD3, Arpana Naik, MD1,
John Vetto, MD1, and Rodney F. Pommier, MD1
1Division of Surgical Oncology, Department of Surgery, Oregon Health & Science University, Portland, OR; 2Division of
General Surgery, Department of Surgery, Oregon Health & Science University, Portland, OR; 3Division of Plastic Surgery
and Reconstruction, Department of Surgery, Oregon Health & Science University, Portland, OR; 4Oregon Health &
Science University, Medical School, Portland, OR
ABSTRACT
Background. The process by which breast cancer stem
cells arise is unknown. It may be that the benign stem cells
in breast tissue are transformed into malignant stem cells
through the acquisition of genetic abnormalities. In this
study, we collected and compared benign and malignant
breast stem/progenitor cells to determine whether specific
genetic abnormalities occur in breast cancer stem/progen-
itor cells within the human body.
Methods. Fresh surgical specimens from benign and
malignant breast tissues were obtained directly from the
operating room and examined. Cells variably expressing
stem cell-associated surface markers CD49f and CD24
were collected by fluorescence-activated cell sorting. The
frequencies of these cells in benign and malignant breast
tissues were ascertained. Oncogenetic mutation analyses
were performed and expression of stem cell-associated
genes was measured.
Results. The frequencies of stem/progenitor cells were
similar between benign and malignant tissues. Stem
cell-associated gene expression also was similar between
benign and malignant stem cells. Genetic mutations in the
PIK/AKT pathway were found in 73% of the tumors’ stem
cells, specifically within two subpopulations. No mutations
were found in stem/progenitor cell subpopulations from
benign breast tissue.
Conclusions. The results of this study suggest that, fol-
lowing malignant transformation, breast cancer stem/
progenitor cells retain their stem cell functions and relative
frequencies. In addition, they develop malignant capabili-
ties by acquiring mutations in genes critical for maintaining
normal cellular metabolism and proliferation.
Cancer stem cell theory proposes that tumor biology is
driven by cancer stem and progenitor cells present in the
tumor.1–5 In culture, these cells are refractory to treatment
and may be responsible for the high recurrence rate
observed in both estrogen receptor negative or positive
(ER- or ER?) breast cancers.6–8 The process by which
cancer stem cells arise is unknown. It is not known whether
stem cells are present in all breast cancers or to what extent
they contribute to the overall number of tumor cells. One
possible mechanism by which cancer stem cells may form
is through the malignant transformation of normal stem
cells via acquisition of somatic genetic abnormalities. In
this proposed model, breast stem cells would initiate breast
cancer and orchestrate tumor progression. They would
retain some or all stem cell functional capacities but
through mutational events would acquire malignant capa-
bilities as well.
Attempts to identify and isolate breast stem cells have
relied upon expression of cell surface markers. Although a
Electronic supplementary material The online version of thisarticle (doi:10.1245/s10434-011-1892-z) contains supplementarymaterial, which is available to authorized users.
� The Author(s) 2011. This article is published with open access
at Springerlink.com
First Received: 20 February 2011;
Published Online: 12 July 2011
S. J. Pommier, PhD
e-mail: [email protected]
Ann Surg Oncol (2012) 19:527–535
DOI 10.1245/s10434-011-1892-z
definitive marker profile is not yet known, research in the
mouse and human mammary gland indicates that benign
breast stem cells do not express cell surface markers CD31 or
CD45 but do express CD49f and CD24 (lin-CD49f?CD24?
cells).9–13 In contrast, malignant breast stem cells have been
distinguished from benign breast stem cells by a variance in
the cell surface marker profile.14 They reportedly express
CD44 but do not express CD24 (lin-CD44?CD24-).
However, the CD44?CD24- expression profile may not be
an absolute requirement of breast cancer stem cells.15
In this study, we sought to determine whether certain
cancer-associated genetic abnormalities are also in breast
cancer stem/progenitor populations. If so, this would
suggest that these abnormalities are involved in the
initiation of breast cancers that progress to clinical
detection. Two genes commonly disrupted in breast can-
cers are PIK3CA and AKT1. The frequency of PIK3CA
mutations is 8–40%, with mutations residing primarily in
two hotspots of the gene, exons 20 (E545K) and 9
(H1047R).16–19 A recent study observed PIK3CA muta-
tions in matched samples of in situ and invasive tumors,
suggesting that this mutation may occur early in breast
cancer development.20 PIK3CA encodes the p110alpha
catalytic subunit of phosphoinositol-3-kinase (PI3K).21
When defective, it increases the catalytic activity of PI3K
and the phosphorylation of AKT1 inducing oncogenic
transformation.22–24 AKT1 mutations are rarer in breast
cancer, with a frequency of 2–8%.25–27 Mutations in exon
2 (E17K), of the AKT1 gene, are similar to the PIK3CA
mutations in that they result in constitutive activation of
AKT1. The biological consequences of AKT1 activation
are increased cell proliferation, survival, and motility.28
Coexistent mutations in AKT1 and PIK3CA are report-
edly infrequent in breast cancer.29,30
Much of what is known about human breast cancer stem
cells has been achieved through the in vitro study of breast
cancer cell lines. This study was designed to achieve an in
vivo genetic examination of uncultured stem/progenitor
cells, freshly obtained from surgical specimens.
METHODS
Benign and Cancer Breast Tissue Procurement
This study was approved by the institutional review
board. Patients with invasive ductal carcinomas were
enrolled. Cancer specimens were collected at the time of
the mastectomy or lumpectomy, before any adjuvant
treatment. Pathologically confirmed benign breast tissue
specimens were obtained from women undergoing reduc-
tion mammoplasty. Two breast cancer cell lines, HCC1954
and T47D, were included in this study.
Collection of Breast Cancer Stem/Progenitor Cells
(FACS)
All specimens were minced and digested in mammary
epithelial cell-specific medium containing 19 collagenase/
hyaluronidase (Epicult, StemCell Technologies). Cell lines
were cultured in Roswell Park Memorial Institute-1640
supplemented with 10% serum and 0.05% Gentamicin.
Approximately 106 cells were labeled with fluorochrome-
conjugated monoclonal antibodies against human CD45
(FITC), CD31 (FITC), CD24 (PE), CD49f (PE-Cy 5), and
CD44 (PE-Cy7). Isotype control testing indicated no non-
specific binding. Subpopulations were separated based on
surface antibody labeling and collected by discriminatory
gating. The CD31?, CD45? endothelial cells and leuko-
cytes were removed (lin-). Cells were sorted into four
lineage negative (lin-) populations: CD49f?CD24?,
CD49f?CD24-, CD49f-CD24?, and CD49f-CD24-..
Mammosphere Production
Mammospheres were initiated from four breast cancer
samples. Mammospheres, spherical structures enriched for
stem/progenitor cells,31 were initiated from disassociated
tumors or from stem/progenitor cell sub-populations iso-
lated by FACS. In both cases, 104 cells/2 ml were
cultivated in Mammocult Basal medium and 10% prolif-
eration supplement (StemCell Technologies), supple-
mented with 0.2% heparin, and 10-3 M hydrocortisone on
nonadherent plates at 37�C, 5% CO2. After 7 days, mam-
mospheres were prepared for genetic analysis as described
below..
Isolation of Genomic DNA and RNA
mRNA was collected from all FACS samples by stan-
dard spin column protocol (RNeasy Mini Kit, Qiagen).
cDNA was produced by reverse transcription using random
hexamers (Superscript III First Strand Kit, Invitrogen).
Adequate amounts of genomic DNA were isolated from
FACS samples by Whole Genomic DNA (wgDNA)
amplification (REPLI-g, Qiagen)..
Human Stem Cell Pluripotency Gene Expression
An average of 50 ng of cDNA, 15 ll TaqMan’s PreAmp
Master Mix (29) (Applied Biosystems) and 7.5 ll of
TaqMan Human Stem Cell Pluripotency PreAmp Pool
(Applied Biosystems) were combined. cDNA was ampli-
fied for 14 cycles (95�C 10 min, 95�C 15 s, 60�C 4 min).
528 S. J. Pommier et al.
Upon completion, 27.5 ll of preamplified cDNA was
amplified as per manufacturer protocol on a TaqMan
Human Stem Cell Pluripotency Array Micro Fluidic Card
(384 TaqMan Low Density Array, Applied Biosystems)
(see Supplemental Material 1).
Genomic Mutation Analysis with the Sequenom
MassArray Panel
wgDNA obtained from the four FACS cell populations of
benign and breast cancer samples was examined using a
multiplex PCR Sequenom MassARRAY system (Sequenom
Inc). Samples of 10 ng of DNA were tested for 410 mutations
in 30 human oncogenes (see Supplemental Material 2).
Statistical Methods
Quantitative Sequenom MassArray results were obtained
through MALDI-TOF mass spectroscopy. The gene muta-
tion status between groups was analyzed for statistically
significant differences by Fisher’s exact test or chi-squared
analysis using the Statview software (SAS Institute
Inc., Cary, NC). The fold change in gene expression for a
tested gene was calculated by 2-DDCt.32 The gene expres-
sion differences between groups were determined by v2
analysis.
RESULTS
Thirteen invasive ductal breast cancer and 14 benign
breast specimens were examined. Patient and tissue char-
acteristics are displayed in Table 1.
FACS Results
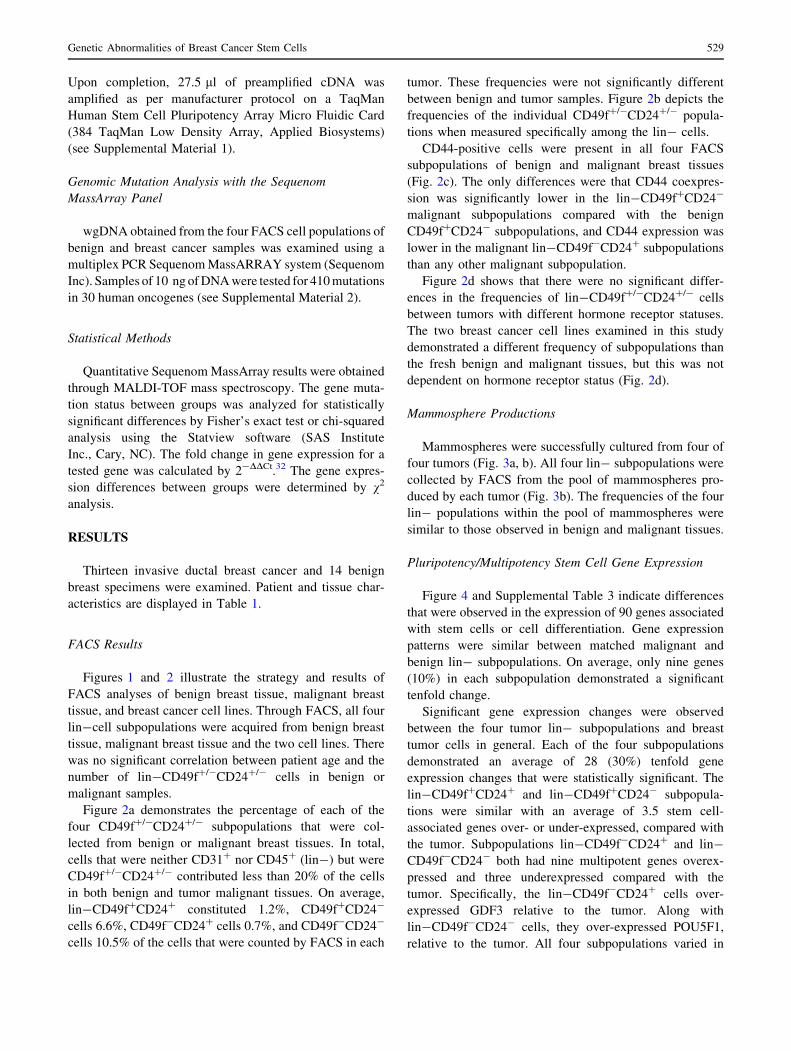
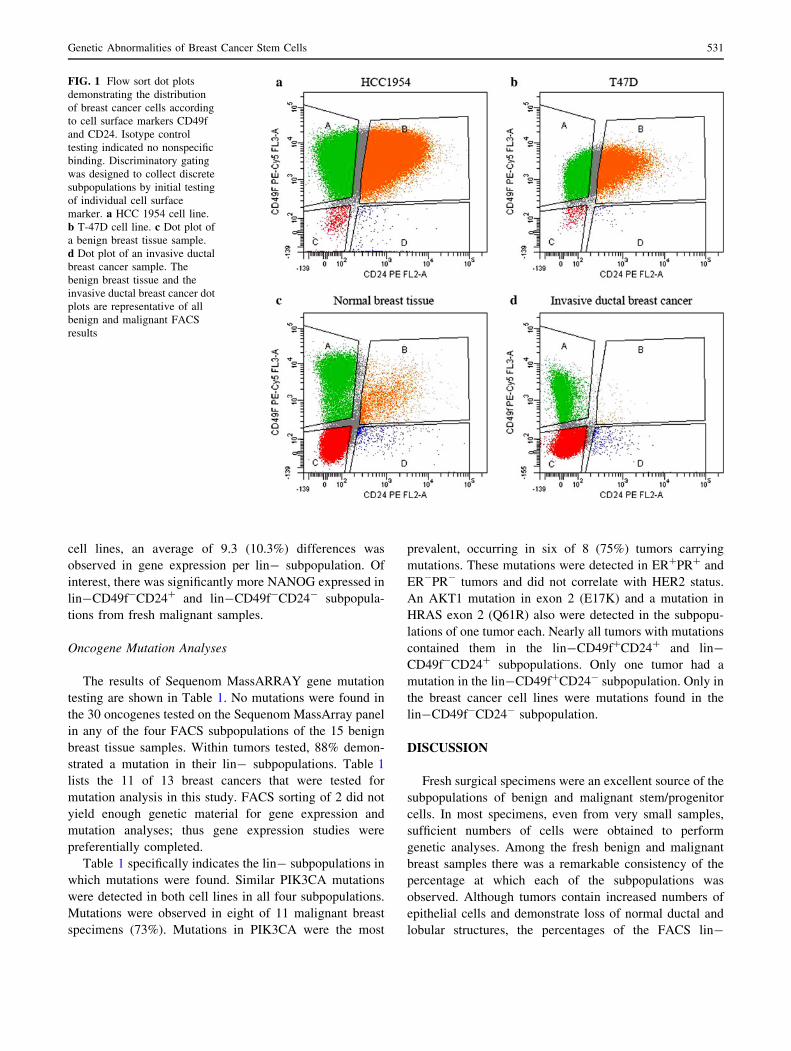
Figures 1 and 2 illustrate the strategy and results of
FACS analyses of benign breast tissue, malignant breast
tissue, and breast cancer cell lines. Through FACS, all four
lin-cell subpopulations were acquired from benign breast
tissue, malignant breast tissue and the two cell lines. There
was no significant correlation between patient age and the
number of lin-CD49f?/-CD24?/- cells in benign or
malignant samples.
Figure 2a demonstrates the percentage of each of the
four CD49f?/-CD24?/- subpopulations that were col-
lected from benign or malignant breast tissues. In total,
cells that were neither CD31? nor CD45? (lin-) but were
CD49f?/-CD24?/- contributed less than 20% of the cells
in both benign and tumor malignant tissues. On average,
lin-CD49f?CD24? constituted 1.2%, CD49f?CD24-
cells 6.6%, CD49f-CD24? cells 0.7%, and CD49f-CD24-
cells 10.5% of the cells that were counted by FACS in each
tumor. These frequencies were not significantly different
between benign and tumor samples. Figure 2b depicts the
frequencies of the individual CD49f?/-CD24?/- popula-
tions when measured specifically among the lin- cells.
CD44-positive cells were present in all four FACS
subpopulations of benign and malignant breast tissues
(Fig. 2c). The only differences were that CD44 coexpres-
sion was significantly lower in the lin-CD49f?CD24-
malignant subpopulations compared with the benign
CD49f?CD24- subpopulations, and CD44 expression was
lower in the malignant lin-CD49f-CD24? subpopulations
than any other malignant subpopulation.
Figure 2d shows that there were no significant differ-
ences in the frequencies of lin-CD49f?/-CD24?/- cells
between tumors with different hormone receptor statuses.
The two breast cancer cell lines examined in this study
demonstrated a different frequency of subpopulations than
the fresh benign and malignant tissues, but this was not
dependent on hormone receptor status (Fig. 2d).
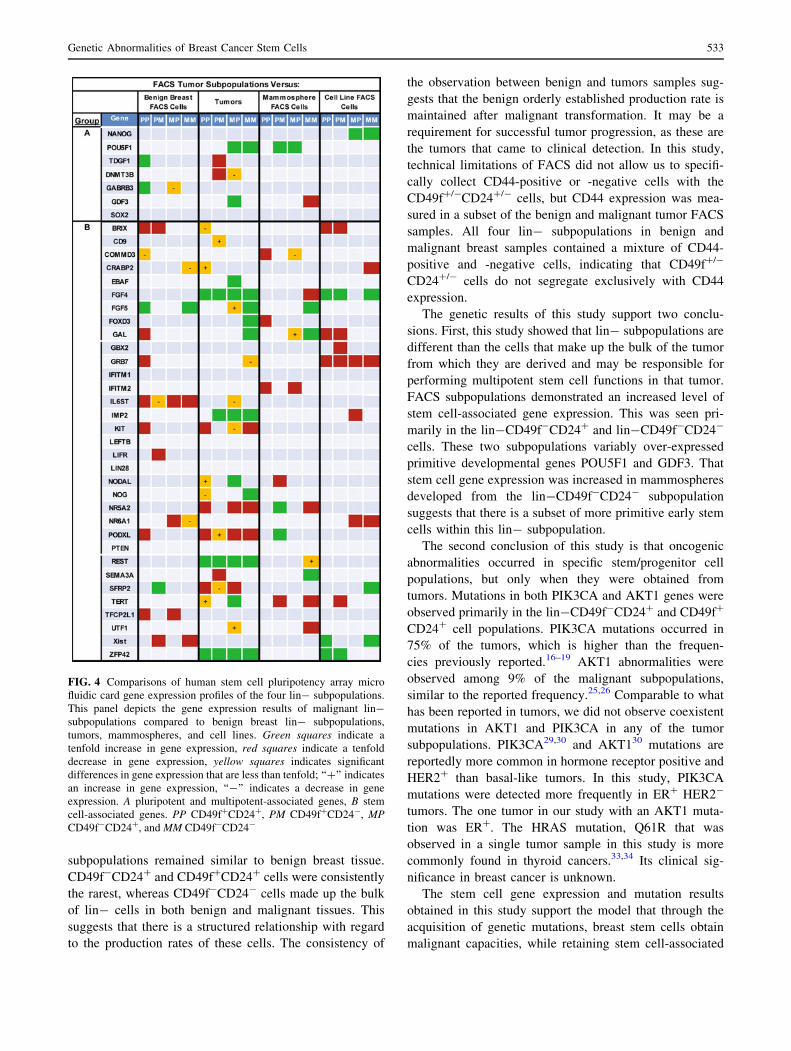
Mammosphere Productions
Mammospheres were successfully cultured from four of
four tumors (Fig. 3a, b). All four lin- subpopulations were
collected by FACS from the pool of mammospheres pro-
duced by each tumor (Fig. 3b). The frequencies of the four
lin- populations within the pool of mammospheres were
similar to those observed in benign and malignant tissues.
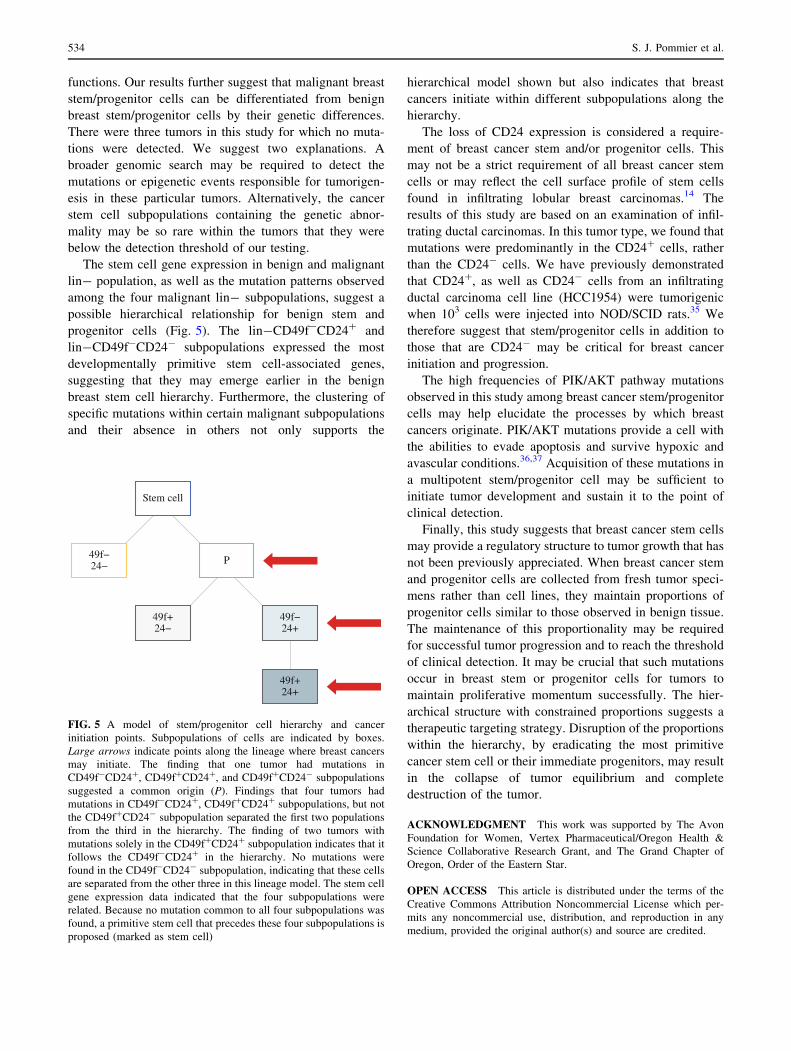
Pluripotency/Multipotency Stem Cell Gene Expression
Figure 4 and Supplemental Table 3 indicate differences
that were observed in the expression of 90 genes associated
with stem cells or cell differentiation. Gene expression
patterns were similar between matched malignant and
benign lin- subpopulations. On average, only nine genes
(10%) in each subpopulation demonstrated a significant
tenfold change.
Significant gene expression changes were observed
between the four tumor lin- subpopulations and breast
tumor cells in general. Each of the four subpopulations
demonstrated an average of 28 (30%) tenfold gene
expression changes that were statistically significant. The
lin-CD49f?CD24? and lin-CD49f?CD24- subpopula-
tions were similar with an average of 3.5 stem cell-
associated genes over- or under-expressed, compared with
the tumor. Subpopulations lin-CD49f-CD24? and lin-
CD49f-CD24- both had nine multipotent genes overex-
pressed and three underexpressed compared with the
tumor. Specifically, the lin-CD49f-CD24? cells over-
expressed GDF3 relative to the tumor. Along with
lin-CD49f-CD24- cells, they over-expressed POU5F1,
relative to the tumor. All four subpopulations varied in
Genetic Abnormalities of Breast Cancer Stem Cells 529
their stem cell-associated gene expression patterns, but all
over-expressed FGF4, REST, and ZFP42.
Two of the four mammosphere samples were selected
for genetic analyses after FACS. When the gene expression
of malignant lin- subpopulations was compared with the
matched FACS lin- subpopulations of mammospheres, an
average of 14 (15.6%) changes per subpopulation was seen.
In general, stem cell gene expression was slightly increased
in the mammosphere subpopulations (Fig. 4), whereas
differentiation-associated gene expression was decreased
(Supplemental Table 3). Of note, GDF3 expression was
increased in the lin-CD49f-CD24- mammosphere-
derived cells, whereas POU5F1 was underexpressed in the
mammosphere lin-CD49f-CD24? cells.
When FACS malignant lin- subpopulations were
compared with the FACS lin- subpopulations of the two
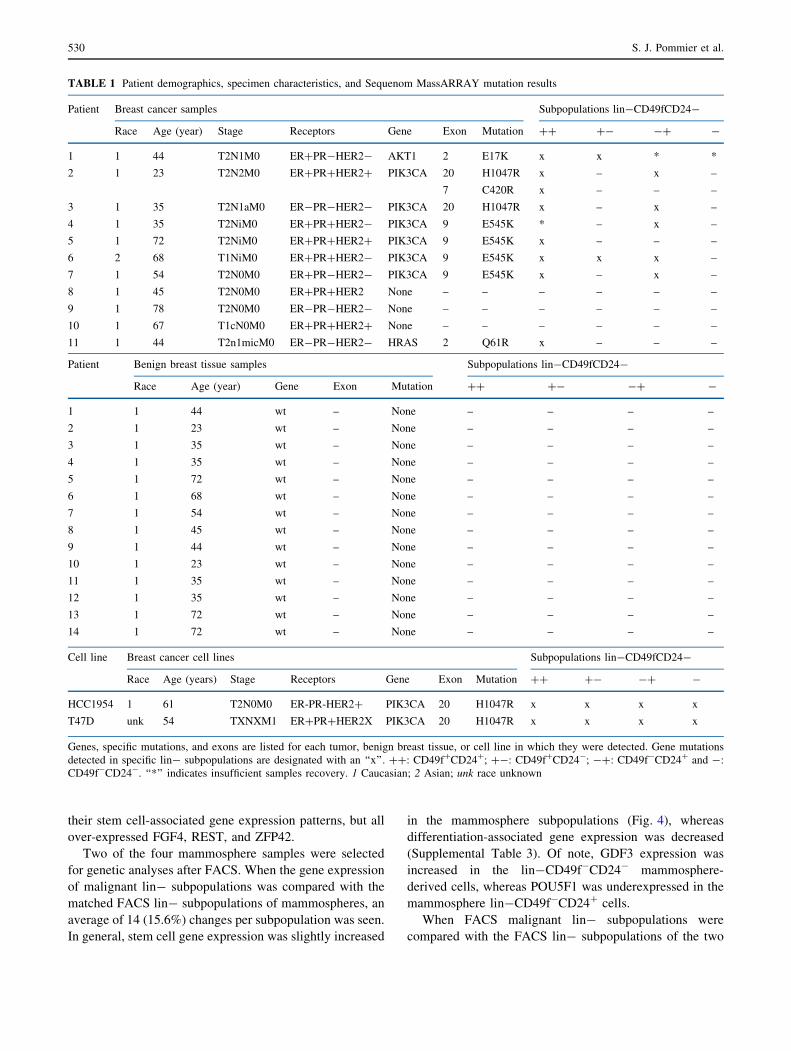
TABLE 1 Patient demographics, specimen characteristics, and Sequenom MassARRAY mutation results
Patient Breast cancer samples Subpopulations lin-CD49fCD24-
Race Age (year) Stage Receptors Gene Exon Mutation ?? ?- -? -
1 1 44 T2N1M0 ER?PR-HER2- AKT1 2 E17K x x * *
2 1 23 T2N2M0 ER?PR?HER2? PIK3CA 20 H1047R x – x –
7 C420R x – – –
3 1 35 T2N1aM0 ER-PR-HER2- PIK3CA 20 H1047R x – x –
4 1 35 T2NiM0 ER?PR?HER2- PIK3CA 9 E545K * – x –
5 1 72 T2NiM0 ER?PR?HER2? PIK3CA 9 E545K x – – –
6 2 68 T1NiM0 ER?PR?HER2- PIK3CA 9 E545K x x x –
7 1 54 T2N0M0 ER?PR-HER2- PIK3CA 9 E545K x – x –
8 1 45 T2N0M0 ER?PR?HER2 None – – – – – –
9 1 78 T2N0M0 ER-PR-HER2- None – – – – – –
10 1 67 T1cN0M0 ER?PR?HER2? None – – – – – –
11 1 44 T2n1micM0 ER-PR-HER2- HRAS 2 Q61R x – – –
Patient Benign breast tissue samples Subpopulations lin-CD49fCD24-
Race Age (year) Gene Exon Mutation ?? ?- -? -
1 1 44 wt – None – – – –
2 1 23 wt – None – – – –
3 1 35 wt – None – – – –
4 1 35 wt – None – – – –
5 1 72 wt – None – – – –
6 1 68 wt – None – – – –
7 1 54 wt – None – – – –
8 1 45 wt – None – – – –
9 1 44 wt – None – – – –
10 1 23 wt – None – – – –
11 1 35 wt – None – – – –
12 1 35 wt – None – – – –
13 1 72 wt – None – – – –
14 1 72 wt – None – – – –
Cell line Breast cancer cell lines Subpopulations lin-CD49fCD24-
Race Age (years) Stage Receptors Gene Exon Mutation ?? ?- -? -
HCC1954 1 61 T2N0M0 ER-PR-HER2? PIK3CA 20 H1047R x x x x
T47D unk 54 TXNXM1 ER?PR?HER2X PIK3CA 20 H1047R x x x x
Genes, specific mutations, and exons are listed for each tumor, benign breast tissue, or cell line in which they were detected. Gene mutations
detected in specific lin- subpopulations are designated with an ‘‘x’’. ??: CD49f?CD24?; ?-: CD49f?CD24-; -?: CD49f-CD24? and -:
CD49f-CD24-. ‘‘*’’ indicates insufficient samples recovery. 1 Caucasian; 2 Asian; unk race unknown
530 S. J. Pommier et al.
cell lines, an average of 9.3 (10.3%) differences was
observed in gene expression per lin- subpopulation. Of
interest, there was significantly more NANOG expressed in
lin-CD49f-CD24? and lin-CD49f-CD24- subpopula-
tions from fresh malignant samples.
Oncogene Mutation Analyses
The results of Sequenom MassARRAY gene mutation
testing are shown in Table 1. No mutations were found in
the 30 oncogenes tested on the Sequenom MassArray panel
in any of the four FACS subpopulations of the 15 benign
breast tissue samples. Within tumors tested, 88% demon-
strated a mutation in their lin- subpopulations. Table 1
lists the 11 of 13 breast cancers that were tested for
mutation analysis in this study. FACS sorting of 2 did not
yield enough genetic material for gene expression and
mutation analyses; thus gene expression studies were
preferentially completed.
Table 1 specifically indicates the lin- subpopulations in
which mutations were found. Similar PIK3CA mutations
were detected in both cell lines in all four subpopulations.
Mutations were observed in eight of 11 malignant breast
specimens (73%). Mutations in PIK3CA were the most
prevalent, occurring in six of 8 (75%) tumors carrying
mutations. These mutations were detected in ER?PR? and
ER-PR- tumors and did not correlate with HER2 status.
An AKT1 mutation in exon 2 (E17K) and a mutation in
HRAS exon 2 (Q61R) also were detected in the subpopu-
lations of one tumor each. Nearly all tumors with mutations
contained them in the lin-CD49f?CD24? and lin-
CD49f-CD24? subpopulations. Only one tumor had a
mutation in the lin-CD49f?CD24- subpopulation. Only in
the breast cancer cell lines were mutations found in the
lin-CD49f-CD24- subpopulation.
DISCUSSION
Fresh surgical specimens were an excellent source of the
subpopulations of benign and malignant stem/progenitor
cells. In most specimens, even from very small samples,
sufficient numbers of cells were obtained to perform
genetic analyses. Among the fresh benign and malignant
breast samples there was a remarkable consistency of the
percentage at which each of the subpopulations was
observed. Although tumors contain increased numbers of
epithelial cells and demonstrate loss of normal ductal and
lobular structures, the percentages of the FACS lin-
FIG. 1 Flow sort dot plots
demonstrating the distribution
of breast cancer cells according
to cell surface markers CD49f
and CD24. Isotype control
testing indicated no nonspecific
binding. Discriminatory gating
was designed to collect discrete
subpopulations by initial testing
of individual cell surface
marker. a HCC 1954 cell line.
b T-47D cell line. c Dot plot of
a benign breast tissue sample.
d Dot plot of an invasive ductal
breast cancer sample. The
benign breast tissue and the
invasive ductal breast cancer dot
plots are representative of all
benign and malignant FACS
results
Genetic Abnormalities of Breast Cancer Stem Cells 531
TumorBenign
25
20
15
10
1.2 1.7
6.6 7.3
0.7 0.8
10.5
15.9
5
Lin negative subpopulations
aAverage percentage ofsubpopulations in whole tissue
CD49f+/CD24+ CD49f+/CD24− CD49f−/CD24+ CD49f−/CD24−
TumorBenign
70
10
20
30
40
50
60
5.1 6.4
28.4
25.4
3.3 3.0
48.055.0
Lin negative subpopulations
bAverage percentage of totallin negative subpopulations
CD49f+/CD24+ CD49f+/CD24− CD49f−/CD24+ CD49f−/CD24−
TumorBenign
100
80
60
40
57.7
73.0
45.5
63.5
31.3
46.4
47.139.4
20
90
70
50
30
10
Lin negative subpopulations
cAverage percentage of lin negative subpopulations with CD44 co-expression
CD49f+/CD24+ CD49f+/CD24− CD49f−/CD24+ CD49f−/CD24−
T47-DHCC 1954
ER +ER −
120
20
40
60
80
100
4.7 6.0
74.3
70.2
Lin negative subpopulations
dAverage percentage of lin negative subpopulations
CD49f+/CD24+
31.0
22.5
5.2
10.5
CD49f+/CD24−
2.7 4.5 2.9 2.5
CD49f−/CD24+
47.5548.9
0.41.9
CD49f−/CD24−
FIG. 2 Percentage of FACS cells collected from benign breast
tissues, malignant breast tissues, and malignant breast cell lines.
a Average percentages of the lin- subpopulations collected from
benign and malignant tissue specimens. b Average percentages of
specific lin- subpopulations among the total lin- subpopulations
collected from benign and malignant breast tissues. c Average
percentage of lin- subpopulations that demonstrated coexpression of
CD44. d Average percentages of lin- subpopulations in ER? tumors,
ER- tumors, as well as in the ER? T-47D cell line and ER-
HCC1954 cell line
80
70
60
50
40
30
20
107.1
16.2
2.7
45.7
MammospheresMammosphere lin negative subpopulations
aAverage percentage of lin-negativesubpopulations in mammospheres
b
CD49f+/CD24+ CD49f+/CD24− CD49f−/CD24+ CD49f−/CD24−
FIG. 3 Two methods of examining lin- subpopulations in mam-
mospheres. a All tumor lin- subpopulations developed into
mammospheres and in the same ratios as the lin- subpopulations
in benign and malignant tissues (see Fig. 2 for comparison).
b Representative images of mammospheres produced on day 7 from
the FACS lin- populations
532 S. J. Pommier et al.
subpopulations remained similar to benign breast tissue.
CD49f-CD24? and CD49f?CD24? cells were consistently
the rarest, whereas CD49f-CD24- cells made up the bulk
of lin- cells in both benign and malignant tissues. This
suggests that there is a structured relationship with regard
to the production rates of these cells. The consistency of
the observation between benign and tumors samples sug-
gests that the benign orderly established production rate is
maintained after malignant transformation. It may be a
requirement for successful tumor progression, as these are
the tumors that came to clinical detection. In this study,
technical limitations of FACS did not allow us to specifi-
cally collect CD44-positive or -negative cells with the
CD49f?/-CD24?/- cells, but CD44 expression was mea-
sured in a subset of the benign and malignant tumor FACS
samples. All four lin- subpopulations in benign and
malignant breast samples contained a mixture of CD44-
positive and -negative cells, indicating that CD49f?/-
CD24?/- cells do not segregate exclusively with CD44
expression.
The genetic results of this study support two conclu-
sions. First, this study showed that lin- subpopulations are
different than the cells that make up the bulk of the tumor
from which they are derived and may be responsible for
performing multipotent stem cell functions in that tumor.
FACS subpopulations demonstrated an increased level of
stem cell-associated gene expression. This was seen pri-
marily in the lin-CD49f-CD24? and lin-CD49f-CD24-
cells. These two subpopulations variably over-expressed
primitive developmental genes POU5F1 and GDF3. That
stem cell gene expression was increased in mammospheres
developed from the lin-CD49f-CD24- subpopulation
suggests that there is a subset of more primitive early stem
cells within this lin- subpopulation.
The second conclusion of this study is that oncogenic
abnormalities occurred in specific stem/progenitor cell
populations, but only when they were obtained from
tumors. Mutations in both PIK3CA and AKT1 genes were
observed primarily in the lin-CD49f-CD24? and CD49f?
CD24? cell populations. PIK3CA mutations occurred in
75% of the tumors, which is higher than the frequen-
cies previously reported.16–19 AKT1 abnormalities were
observed among 9% of the malignant subpopulations,
similar to the reported frequency.25,26 Comparable to what
has been reported in tumors, we did not observe coexistent
mutations in AKT1 and PIK3CA in any of the tumor
subpopulations. PIK3CA29,30 and AKT130 mutations are
reportedly more common in hormone receptor positive and
HER2? than basal-like tumors. In this study, PIK3CA
mutations were detected more frequently in ER? HER2-
tumors. The one tumor in our study with an AKT1 muta-
tion was ER?. The HRAS mutation, Q61R that was
observed in a single tumor sample in this study is more
commonly found in thyroid cancers.33,34 Its clinical sig-
nificance in breast cancer is unknown.
The stem cell gene expression and mutation results
obtained in this study support the model that through the
acquisition of genetic mutations, breast stem cells obtain
malignant capacities, while retaining stem cell-associated
FIG. 4 Comparisons of human stem cell pluripotency array micro
fluidic card gene expression profiles of the four lin- subpopulations.
This panel depicts the gene expression results of malignant lin-
subpopulations compared to benign breast lin- subpopulations,
tumors, mammospheres, and cell lines. Green squares indicate a
tenfold increase in gene expression, red squares indicate a tenfold
decrease in gene expression, yellow squares indicates significant
differences in gene expression that are less than tenfold; ‘‘?’’ indicates
an increase in gene expression, ‘‘-’’ indicates a decrease in gene
expression. A pluripotent and multipotent-associated genes, B stem
cell-associated genes. PP CD49f?CD24?, PM CD49f?CD24-, MPCD49f-CD24?, and MM CD49f-CD24-
Genetic Abnormalities of Breast Cancer Stem Cells 533
functions. Our results further suggest that malignant breast
stem/progenitor cells can be differentiated from benign
breast stem/progenitor cells by their genetic differences.
There were three tumors in this study for which no muta-
tions were detected. We suggest two explanations. A
broader genomic search may be required to detect the
mutations or epigenetic events responsible for tumorigen-
esis in these particular tumors. Alternatively, the cancer
stem cell subpopulations containing the genetic abnor-
mality may be so rare within the tumors that they were
below the detection threshold of our testing.
The stem cell gene expression in benign and malignant
lin- population, as well as the mutation patterns observed
among the four malignant lin- subpopulations, suggest a
possible hierarchical relationship for benign stem and
progenitor cells (Fig. 5). The lin-CD49f-CD24? and
lin-CD49f-CD24- subpopulations expressed the most
developmentally primitive stem cell-associated genes,
suggesting that they may emerge earlier in the benign
breast stem cell hierarchy. Furthermore, the clustering of
specific mutations within certain malignant subpopulations
and their absence in others not only supports the
hierarchical model shown but also indicates that breast
cancers initiate within different subpopulations along the
hierarchy.
The loss of CD24 expression is considered a require-
ment of breast cancer stem and/or progenitor cells. This
may not be a strict requirement of all breast cancer stem
cells or may reflect the cell surface profile of stem cells
found in infiltrating lobular breast carcinomas.14 The
results of this study are based on an examination of infil-
trating ductal carcinomas. In this tumor type, we found that
mutations were predominantly in the CD24? cells, rather
than the CD24- cells. We have previously demonstrated
that CD24?, as well as CD24- cells from an infiltrating
ductal carcinoma cell line (HCC1954) were tumorigenic
when 103 cells were injected into NOD/SCID rats.35 We
therefore suggest that stem/progenitor cells in addition to
those that are CD24- may be critical for breast cancer
initiation and progression.
The high frequencies of PIK/AKT pathway mutations
observed in this study among breast cancer stem/progenitor
cells may help elucidate the processes by which breast
cancers originate. PIK/AKT mutations provide a cell with
the abilities to evade apoptosis and survive hypoxic and
avascular conditions.36,37 Acquisition of these mutations in
a multipotent stem/progenitor cell may be sufficient to
initiate tumor development and sustain it to the point of
clinical detection.
Finally, this study suggests that breast cancer stem cells
may provide a regulatory structure to tumor growth that has
not been previously appreciated. When breast cancer stem
and progenitor cells are collected from fresh tumor speci-
mens rather than cell lines, they maintain proportions of
progenitor cells similar to those observed in benign tissue.
The maintenance of this proportionality may be required
for successful tumor progression and to reach the threshold
of clinical detection. It may be crucial that such mutations
occur in breast stem or progenitor cells for tumors to
maintain proliferative momentum successfully. The hier-
archical structure with constrained proportions suggests a
therapeutic targeting strategy. Disruption of the proportions
within the hierarchy, by eradicating the most primitive
cancer stem cell or their immediate progenitors, may result
in the collapse of tumor equilibrium and complete
destruction of the tumor.
ACKNOWLEDGMENT This work was supported by The Avon
Foundation for Women, Vertex Pharmaceutical/Oregon Health &
Science Collaborative Research Grant, and The Grand Chapter of
Oregon, Order of the Eastern Star.
OPEN ACCESS This article is distributed under the terms of the
Creative Commons Attribution Noncommercial License which per-
mits any noncommercial use, distribution, and reproduction in any
medium, provided the original author(s) and source are credited.
Stem cell
49f−24− P
49f+24−
49f−24+
49f+24+
FIG. 5 A model of stem/progenitor cell hierarchy and cancer
initiation points. Subpopulations of cells are indicated by boxes.
Large arrows indicate points along the lineage where breast cancers
may initiate. The finding that one tumor had mutations in
CD49f-CD24?, CD49f?CD24?, and CD49f?CD24- subpopulations
suggested a common origin (P). Findings that four tumors had
mutations in CD49f-CD24?, CD49f?CD24? subpopulations, but not
the CD49f?CD24- subpopulation separated the first two populations
from the third in the hierarchy. The finding of two tumors with
mutations solely in the CD49f?CD24? subpopulation indicates that it
follows the CD49f-CD24? in the hierarchy. No mutations were
found in the CD49f-CD24- subpopulation, indicating that these cells
are separated from the other three in this lineage model. The stem cell
gene expression data indicated that the four subpopulations were
related. Because no mutation common to all four subpopulations was
found, a primitive stem cell that precedes these four subpopulations is
proposed (marked as stem cell)
534 S. J. Pommier et al.
REFERENCES
1. Huang EH, Heidt DG, Li CW, et al. Cancer stem cells: a new
paradigm for understanding tumor progression and therapeutic
resistance. Surgery. 2007;141:415–9.
2. Clarke MF, Dick JE, Dirks PB, et al. Cancer stem cells-per-
spective on current status and future directions: AACR Workshop
of Cancer Stem Cells. Cancer Res. 2006;66:9339–44.
3. Wicha MS, Liu S, Dontu G. Cancer stem cells: an old idea—a
paradigm shift. Cancer Res. 2006;66:1883–90.
4. Dontu, G, Al-Hajj M, Abdallah WM, et al. Stem cells in normal
breast development and breast cancer. Cell Prolif. 2003;36(Suppl
1):59–72.
5. Dulbecco R, Henahan M, Armstrong B. Cell types and mor-
phogenesis in the mammary gland. Proc Natl Acad Sci USA.
1982;79:7346–50.
6. Shafee N, Smith CR, Wei S, et al. Cancer stem cells contribute to
cisplatin resistance in Brca1/p53-mediated mouse mammary
tumors. Cancer Res. 2008;68:3243–50.
7. Phillips TM, McBride WH, Pajonk F. The response of CD29(-/
low)/CD44? breast cancer-initiating cells to radiation. J NatlCancer Inst. 2006;98:1777–85.
8. Early Breast Cancer Trialists’ Collaborative Group (EBCTCG).
Effects of chemotherapy and hormonal therapy for early breast
cancer on recurrence and 15-year survival: an overview of the
randomized trials. Lancet. 2005;365:1687–717.
9. Stingl J, Eirew P, Ricketson I, et al. Purification and unique
properties of mammary epithelial stem cells. Nature. 2006;1038:
1–5.
10. Shackleton M, Vaillant F, Simpson KJ, et al. Generation of a
functional mammary gland from a single stem cell. Nature.
2006;439:84–8.
11. Stingl, J. Detection and analysis of mammary gland stem cells. JPathol. 2009;217:229–41.
12. Villadsen R, Fridriksdottir AJ, Ronnov-Jessen L, et al. Evidence
for a stem cell hierarchy in the adult human breast. J Cell Biol.2007;177:87–101.
13. Gudjonsson T, Villadsen R, Nielsen HL, et al. Isolation,
immortalization and characterization of human breast epithelial
cell lines with stem cell properties. Genes Dev. 2002;16:693–706.
14. Al-Hajj M, Wicha MS, Benito-Hernandez A, et al. Prospective
identification of tumorigenic breast cancer cells. Proc Natl AcadSci USA. 2003;100:3983–8.
15. Grimshaw MJ, Cooper L, Papazisis K, et al. Mammosphere
culture of metastatic breast cancer cells enriches for tumorigenic
breast cancer cells. Breast Cancer Res. 2008;10:R52.
16. Samuels Y, Wang Z, Bardelli A, et al. High frequency of
mutations of the PIK3CA gene in human cancers. Science.2004;302:554.
17. Bachman KE, Argani P, Samuels Y, et al. The PIK3CA gene is
mutated with high frequency in human breast cancers. CancerBiol Ther. 2004;3:772–5.
18. Karakas B, Bachman KE, Park BH. Mutation of the PIK3CA
oncogene in human cancers. Br J Cancer. 2006;94:455–9.
19. Michelucci A, Di Cristofano C, Lami A, et al. PIK3CA in breast
carcinoma: a mutational analysis of sporadic and hereditary
cases. Diagn Mol Pathol. 2009;18:200–5.
20. Dunlap J, Le C, Shukla A, et al. Phosphatidylinositol-3-kinase
and AKT1 mutations occur early in breast carcinoma. BreastCancer Res Treat. 2010;120:409–18.
21. Isakoff SJ, Engelman JA, Irie HY, et al. Breast Cancer-associated
PIK3CA mutations are oncogenic in mammary epithelial cells.
Cancer Res. 2005;65:10992–1000.
22. Vivanco I, Sawyers CL. The phosphatidylinositol 3-kinase AKT
pathway in human cancer. Nat Rev Cancer. 2002;2:489–501.
23. Kang S, Bader AG, Vogt PK. Phosphatidylinositol 3-kinase
mutations identified in human cancer are oncogenic. Proc NatlAcad Sci USA. 2004;103:802–7.
24. Samuels Y, Diaz LA Jr, Schmidt-Kittler O, et al. Mutant PIK3CA
promotes cell growth and invasion of human cancer cells. CancerCell. 2005;7:561–73.
25. Carpen JD, Faber AL, Horn C, et al. A transforming mutation in
the pleckstrin homology domain of AKT1 in cancer. Nature.2007;448:439–44.
26. Bleeker FE, Felicioni L, Buttitta F, et al. AKT1 (E17K) in human
solid tumours. Oncogene. 2008;27:5648–50.
27. Kim MS, Jeong EG, Yoo NJ, et al. Mutational analysis of
oncogenic AKT E17K mutation in common solid cancers and
acute leukaemias. Br J Cancer. 2008;98:1533–5.
28. Samuels Y, Ericson K. Oncogenic PI3K and its role in cancer.
Curr Opin Oncol. 2006;18:77–82.
29. Saal LH, Holm K, Maurer M, et al. 2005 PIK3CA mutations
correlate with hormone receptors, node metastasis, and ERBB2,
and are mutually exclusive with PTEN loss in human breast
carcinoma. Cancer Res. 2005;65:2554–9.
30. Stemke-Hale K, Gonzalez-Angulo AM, Lluch A, et al. An inte-
grative genomic and proteomic analysis of PIK3CA, PTEN, and
AKT mutations in breast cancer. Cancer Res. 2008;68:6084–91.
31. Dontu G, Abdalla WM, Foley JM, et al. In vitro propagation and
transcriptional profiling of human mammary stem/progenitor
cells. Genes Dev. 2003;17:1253–70.
32. Livak KJ, Schmittingen TD. Analysis of relative gene expression
data using real-time quantitative PCR and 2-DDCt method.
Methods. 2001;25:402–8.
33. Hollestelle A, Elstrodt F, Nagel JHA, et al. Phosphatidylinositol-
3-OH kinase of RAS pathway mutations in human breast cancer
cell lines. Mol Cancer Res. 2007;5:195–201.
34. Rivera M, Ricarte-Filho RM, Knauf J, et al. Molecular geno-
typing of papillary thyroid carcinoma follicular variant according
to its histological subtypes (encapsulated vs infiltrative) reveals
distinct BRAF and RAS mutation patterns. Mod Pathol. 2010;
23:1191–200.
35. Pommier SJ, Quan GG, Christante D, et al. Characterizing the
HER2/neu status and metastatic potential of breast cancer stem/
progenitor cells. Ann Surg Oncol. 2009;17:613–23.
36. Cantley LC. The phosphoinositide 3-kinase pathway. Science.2002;296:1655–7.
37. Katso R, Okkenhaug K, Ahmadi K, et al. Cellular function of
phosphoinositide 3-kinases: implications for development,
homeostasis, and cancer. Annu Rev Cell Dev Biol. 2001;17:
615–75.
Genetic Abnormalities of Breast Cancer Stem Cells 535