Abundance, spatial variance and occupancy: arthropod species distribution in the Azores

Free energy simulations of single and double ion occupancyin gramicidin A
Turgut Baştuğ and Serdar Kuyucaka�
School of Physics, University of Sydney, New South Wales 2006, Australia
�Received 1 November 2006; accepted 25 January 2007; published online 14 March 2007�
Simultaneous occupancy of the two binding sites in gramicidin A by monovalent cations is a wellknown property of this channel, but the energetic feasibility of this process in molecular dynamicssimulations has not been established so far. Here the authors study the energetics of single anddouble ion occupancy in gramicidin A by constructing the potential of mean force for single and pairof cations. As representatives of small and large ions, they consider both Na+ and K+ ions in thecalculations. Binding constants of ions are estimated from the free energy profiles. Comparisonswith the experimental results indicate 3–4 kT discrepancy in the binding energies. They also studythe coordination of the ions in their respective binding sites and the dynamic behavior of the channelwater during the double ion binding process. © 2007 American Institute of Physics.�DOI: 10.1063/1.2710267�
I. INTRODUCTION
Most ion channels are occupied by multiple ions, whichis of crucial importance for enabling fast permeation whilemaintaining a strict selectivity. The crystal structure of theKcsA potassium channel has provided a lucid example ofhow nature has achieved this feat in practice.1–3 The sameprinciple is employed in many other biological ion channelswhere selective permeation is essential. Typically ions areattracted to a binding site which works as a selectivity filter.The potential well at the binding site is usually quite deep sothat a single ion would be permanently bound there. How-ever, the presence of multiple ions and the repulsive Cou-lomb interaction among them plays a destabilizing role, thusfacilitating fast permeation.
The gramicidin A �gA� channel deviates from this scriptcommon to most biological ion channels in important ways.The binding sites at either end of the channel are energeti-cally just deep enough to hold a single monovalent cation.Thus at low concentrations, when the probability for simul-taneous occupation of both binding sites is quite low, gAfunctions as a single ion channel �for reviews of the physi-ology of the gA channel, see Refs. 4 and 5�. At higher con-centrations though, both binding sites in the channel can beoccupied by monovalent cations. Because the binding sitesare well separated ��20 � by a single-file column of water,the role of Coulomb repulsion in permeation is marginal. Theweaker ion-channel and ion-ion interactions, coupled withthe simplicity of the gA structure, confer the gA system adistinct advantage for testing theoretical models of ion chan-nels. Discrepancies that would be hard to detect in biologicalion channels due to the overwhelmingly large Coulomb in-teractions among the ions and charges in the channel proteincould be more easily detected in the more benign environ-
ment of gA. Thus the gA channel continues to play an im-portant role in testing the methods and models employed inthe description of ion channels.
The structure of gA has been known for a long time—theinitial left-handed �-helical dimer model proposed by Urry6
was later refined �shown to be right handed� using solution7
and solid state NMR.8 At present there are two high-resolution structures of gA that are commonly used in com-putational studies, namely, PDB:1MAG �Ref. 9� andPDB:1JNO.10 In the absence of any other channel structure,gA had been seen as a prototype ion channel and extensivelystudied using various computational methods �for reviewssee Refs. 11–14�. Due to insufficient computational power,initial models of gA attempting to account for its conduc-tance tended to be more phenomenological, and when micro-scopic methods such as molecular dynamics �MD� simula-tions were employed, comparison of their predictions withthe permeation properties of gA was rather limited. The re-cent demonstration of the breakdown of continuum electro-statics in the gA channel15,16 has ruled out application ofphenomenological models that rely on continuum solutionsof the Poisson equation, which put further pressure on appli-cation of microscopic simulation methods to gA. Fortunatelydevelopments in cluster technology have improved the timeimpasse faced by MD simulations, and already several MDstudies of the permeation properties of the gA channel haveappeared in literature.17–21 So far the focus of all these stud-ies has been permeation of a single K+ ion, and the energybarrier it faces at the center of gA, though Ca2+ and Cl− ionsare also considered more recently.21 In the face of all theavailable data in gA, this is quite a limited application of theMD method. The study of other monovalent cations, organiccations,22 and especially double ion occupancy of gA wouldprovide valuable complementary information.
The experimental evidence for double occupancy of gAis wide and varied. For the larger cations �e.g., K+, Rb+, andCs+�, double occupancy was inferred from saturation ofa�Electronic mail: [email protected]
THE JOURNAL OF CHEMICAL PHYSICS 126, 105103 �2007�
0021-9606/2007/126�10�/105103/12/$23.00 © 2007 American Institute of Physics126, 105103-1
Downloaded 14 Mar 2007 to 129.78.208.4. Redistribution subject to AIP license or copyright, see http://jcp.aip.org/jcp/copyright.jsp

channel currents23–27 and tracer flux ratio measurements.28–30
Double occupancy of the smaller Na+ and Li+ ions is lessprobable and therefore harder to establish from flux measure-ments alone. Initial indication for double occupancy of Na+
came from streaming potential measurements.31,32 Solid evi-dence for double occupancy of all alkali metal cations waseventually obtained from NMR experiments.33,34
There have been very few theoretical studies of doubleion occupancy in gA.35,36 In the only MD study,36 the freeenergies for single and double occupancy were calculated forNa+ ions, and the double occupancy free energies for otherions relative to that of Na+ were determined using the freeenergy perturbation method. The free energies of binding forsingle and double Na+ ions were found to be +2 and+8 kcal/mol, respectively. That is, a pair of Na+ ions did notbind to gA, but more surprisingly even a single Na+ ioncould not bind to gA. This discrepancy may be due to insuf-ficient sampling arising from limited computational time.The relative free energies of double occupancy, on the otherhand, being less susceptible to such errors, were found to beconsistent with the experimental observations. Namely, thedouble occupancy of gA was more probable for the largerions relative to the smaller ones. The problem with the bind-ing of Na+ ion to gA was considered in a later paper,37 butneither the position of the binding site nor the free energy ofbinding could be satisfactorily explained.
It is clear from the above review that double ion occu-pancy and Na+ ion binding remain as outstanding problemsfor MD simulations of the gA channel. Here we addressthese problems by constructing the potential of mean force�PMF� for K+ and Na+ ions, both singly and as a pair. Forthis purpose we use both umbrella sampling and steered MDsimulations. The binding constants for single and double oc-cupancy of gA are estimated from the respective PMF’s andcompared to the results with the available experimental data.We also study the coordination of the ions in their respectivebinding sites and the dynamic behavior of the channel waterduring the double binding process.
II. METHODS
A. Model system and MD simulations
In previous MD simulation of the gA channel,17,20,21 weemployed the 1MAG structure for the gA dimer9 with 48lipids per layer. Here we wish to carry out longer MD simu-lations of the system in order to check the convergence of theresults. Reducing the number of lipids is an obvious way toachieve this, e.g., ten lipids per layer have been suggested tobe adequate.38 Also we employ the 1JNO structure for gA,10
which has been shown to relax to equilibrium faster.38 Todetermine the optimal number of lipids, we have constructedseveral model systems using the VMD suit of software.39 Ini-tially a bilayer of dimyristoylphosphatidylcholine moleculeswith 128 lipids per layer is constructed and the 1JNO struc-ture of gA �Ref. 10� is embedded in the middle of this sys-tem. The lipids at the periphery of this system are graduallyremoved—while preserving a rectangular shape—to obtainfour systems with 64, 32, 16, and 10 lipids per layer. Duringthe initial phase, the gA atoms are constrained to their initial
positions. Each system is hydrated with about 50 water mol-ecules per lipid and placed in an orthorhombic periodic box.Following an energy minimization of 10 000 steps, they areequilibrated with surface-tension coupling until the surfacearea converged to the experimental lipid density of 60 Å2 perlipid.40 In the remaining simulations, the periodic box isfixed in the x and y directions and a pressure coupling of1 atm is applied in the z direction. At this stage, a number ofwater molecules are replaced with K+ and Cl− ions so thatthe solution has the physiological concentration of about150 mM. The restraints applied to the gA atoms are thengradually relaxed in MD simulations lasting 2 ns, followedby 1 ns equilibration. To test the suitability of these systemsfor free energy simulations, we have calculated the free en-ergy of translocating a K+ ion to the gA center using thermo-dynamic integration.41 For the systems with 16, 32, and 64lipids per layer, the calculated free energies are found toconverge, exhibiting minimal hysteresis, but a large hyster-esis effect is observed in the system with ten lipids. There-fore, in the present work we have used the gA system with16 lipids per layer. The dimensions of this system in the x, y,and z directions are 38, 32, and 72 Å, and it contains 1540water molecules with four pairs of KCl ions.
MD simulations are carried out using the NAMD code,Version 2.5 �Ref. 42� with the PARAM27 version of theCHARMM force field,43 which provides a complete set of pa-rameters for all the atoms in the system and uses the TIP3Pwater model. An NpT ensemble is used with periodic bound-ary conditions. The pressure is kept at 1 atm using theLangevin piston method with a damping coefficient of5 ps−1.44 Similarly, temperature is maintained at 298 Kthrough Langevin damping with a coefficient of 5 ps−1. Elec-trostatic interactions are computed using the particle-meshEwald algorithm. The list of nonbonded interactions is trun-cated at 13.5 Å, and a switching cutoff distance of 10 Å isused for the Lennard-Jones interactions. A time step of 2 fs isemployed in all simulations. Trajectory data are written at1 ps intervals during both equilibration and production runs.
B. Potential of mean force and binding constants
The PMF of K+ and Na+ ions along the gA channel axisis calculated using umbrella sampling45 together with theweighted histogram analysis method �WHAM�.46 As themethod was explained in some detail earlier,17,20 we give abrief account here stressing only the differences in thepresent work. Using an umbrella potential, we sample anion’s position at equal intervals along the channel axis duringMD simulations of the system. The biased ion distributionsobtained from the production runs are then unbiased andcombined using WHAM. In all cases, the ion coordinates aremeasured with respect to the center of mass of gA. We findthat due to fluctuations in the system, the equilibrated struc-tures do not exhibit a clear symmetry around z=0, which isalso reflected in the calculated PMF’s. One way to deal withthis problem is to use the symmetrized ion densities in theconstruction of the PMF,18,19 i.e., �sym�z�= ���z�+��−z�� /2,which we also adopt here.
We employ umbrella potentials with a force constant of
105103-2 T. Baştuğ and S. Kuyucak J. Chem. Phys. 126, 105103 �2007�
Downloaded 14 Mar 2007 to 129.78.208.4. Redistribution subject to AIP license or copyright, see http://jcp.aip.org/jcp/copyright.jsp
10 kcal/mol/Å2 at 0.5 Å intervals. Outside the pore�z�11 Å�, where the changes in the PMF are smaller, theforce constant is reduced to 7 kcal/mol/Å2 to improve theoverlap of ion distributions between neighboring windows.For z�15 Å, an additional biasing potential with a forceconstant of 1 kcal/mol Å2 is applied in the radial direction toprevent large excursions of the ion from the central axis.Comparison of the PMF results with and without a radialconstraint indicates a negligible shift in energy. To avoidpotential equilibration problems associated with dragging ofan ion in the channel, we have replaced individual watermolecules in the pore with a K+ ion.18,20 This way we obtainten configurations with the ion placed at regular intervalsalong the channel axis. The K+ ion in each configuration thenneeds to be pushed by at most 1 Å to either side in order togenerate the full set of windows required in the PMF calcu-lations. Outside the channel, where equilibration is not aproblem, the ion is pushed along the central axis. A total of81 windows covering the range �−20,20� Å are employedfor the single ion PMF’s. For the K+ PMF, the system isequilibrated for 200 ps and the trajectory data for ion posi-tions are collected for 1.5 ns for each window. The simula-tion systems for the Na+ PMF are obtained from those for theK+ PMF by substituting all the K+ ions with Na+. The simu-lation system for each window is then equilibrated for 0.7 ns,followed by a 1 ns production run.
The construction of the double ion PMF is not asstraightforward as in the single ion case. An obvious methodis to put the first ion in one of the binding sites and constructa PMF for the second ion on the other side. However, duringa 0.5 ns per window simulation of this process, the boundion is observed to leave the binding site when the second oneapproaches the other binding site. A simple way to deal withthis problem is to apply a small restraining force on thebound ion to prevent it from leaving the binding site. Wehave found that a minimal 2 kcal/mol Å2 harmonic restraintis adequate for this purpose. A more suitable method in sucha nonequilibrium situation is to use Jarzynski’s equality47 insteered MD �SMD� simulations.48 Here a harmonic force isapplied to an ion in bulk via a stiff spring, whose referencepoint is pulled to the binding site along the z axis at a con-stant velocity v, i.e., zref�t�=z0+vt. For each SMD path, thework done W is calculated from the integral of the force onthe spring, and the free energy change is determined from theensemble average of the work done for several SMD paths ase−��F= �e−�W�, where �=1/kBT is the inverse temperature.In SMD simulations, we use a spring constant of k=20 kcal/mol Å2 and a pulling velocity of v=2.5 Å/ns.PMF is determined from the average of ten SMD trajecto-ries. Tests involving steering of an ion over a Gaussian bar-rier indicate that these parameters are adequate for reproduc-ing the potential energy profile. For comparison, we considerboth umbrella sampling and SMD methods in PMF calcula-tions for the binding of a second K+ ion to gA.
An alternative method that is especially suitable for find-ing the binding sites for double occupancy and analyzingtheir structure at equilibrium is to move the ions symmetri-cally so that they are bound to the channel simultaneously.The umbrella potential for the two ions is taken as
U =k
2��z1 − z10�2 + �z2 − z20�2� , �1�
where z1 and z2 refer to the ion positions and z10 and z20 arethe window positions. The windows are placed symmetri-cally by setting z10=Z0−z0 and z20=Z0+z0, where Z0 refersto the gA center of mass and 2z0 is the distance between thetwo windows. We use a similar transformation for the ioncoordinates, i.e., z1=Z−z and z2=Z+z, where Z is the centerof mass of the two ions and 2z is the distance between them.Substituting the above values of ion positions in Eq. �1�, theumbrella potential can be written as
U = k�Z − Z0�2 + k�z − z0�2. �2�
Equation �2� shows that, taking half the distance between theions as the reaction coordinate, the two-ion PMF can be un-biased just like in the case of a singlen ion PMF �but with anincreased force constant�.
Simulation systems for the double ion PMF are con-structed in a manner similar to the single ion case. Two K+
ions are placed at the binding sites at z= ±11 Å, and thesystem is equilibrated for 0.7 ns while the ions are restrainedwith the usual umbrella potentials. The ions are then movedsimultaneously in 0.5 Å steps to z= ±16 Å and to z= ±9.5 Å, generating a total of 14 windows. The system isequilibrated for 0.7 ns at each window. The initial system hasseven water molecules in the pore but one of the water mol-ecules escapes when the ions are pushed in beyond ±10 Å.The PMF is calculated from a 1 ns production run for eachwindow. The simulation systems for Na+ are again obtainedfrom those of K+ by substitution followed by 0.7 ns equili-bration for each window. Because Na+ can go further into thechannel, an additional window at z= ±9 Å is included in thePMF calculation.
Accuracy of the one-dimensional �1D�-PMF calculationsin the bulk region is checked via independent free energycalculations using the thermodynamic integration method. Inthis method, the free energy difference is obtained from
�G = �0
1 �H�����
�
d� , �3�
where H���= �1−��H0+�H1, with H0 and H1 representingthe Hamiltonians of the initial and final states, respectively.Here the initial state is taken as a K+ ion in the bulk and awater molecule in the binding site of gA, and in the finalstate these two are interchanged. In order to reduce fluctua-tions in the free energy calculations, we perform the alchemi-cal transformation via an intermediate state with no charge,which we choose as a water molecule with the partialcharges set to zero �denoted as W0�. Thus we perform twocalculations, �G�K+→W0� and �G�W0→W�, whose sumgives the desired free energy change for the K+→W trans-formation. Note that a similar transformation, W→W0
→K+, is carried out in the binding site simultaneously to findthe ionic free energy difference between the channel andbulk water. The integral in Eq. �3� is performed using aGaussian quadrature with seven points, which has beenfound to be sufficiently accurate.21 The system is equilibrated
105103-3 Simulations of ion occupancy in gramicidin A J. Chem. Phys. 126, 105103 �2007�
Downloaded 14 Mar 2007 to 129.78.208.4. Redistribution subject to AIP license or copyright, see http://jcp.aip.org/jcp/copyright.jsp

for 200 ps and the integrals are evaluated from 1 ns of pro-duction runs.
Binding constant of an ion can be estimated from theintegral of the PMF, W�r� in the vicinity of the pore
K = �pore
e−�W�r�−W0�/kTdr , �4�
where W0 is the reference value of the PMF in bulk, which isset to zero in practice. The exponential function in Eq. �4�has very large values in the binding site and remains rela-tively small outside. This is demonstrated in Fig. 1, whichshows the values of the integrand for the PMF of a K+ iongiven in Fig. 2�b�, and its integral from 0 to z �solid anddashed lines, respectively�. The major contribution to the in-tegral is seen to come from the binding site, which covers therange of 9–12 Å. Further, in the binding site the ion’s offaxis motion is quite restricted. The PMF steeply rises beyond2–3 Å due to the repulsive Lennard-Jones forces from thepeptide atoms, and again any contribution to the integral be-yond that range is negligible. Thus, to a good approximation,the integral in Eq. �4� can be evaluated using a 1D-PMF
K = �R2�z1
z2
e−W�z�/kTdz , �5�
where R is an effective radius for the ion in the binding site,which can be determined by sampling the radial position ofthe bound ion during MD simulations. The integration limitsz1 and z2 are chosen in the bulk region where W vanishes.For the present PMF’s, an adequate choice is ±15 Å �choos-ing a larger value gives essentially the same result�. Theabove approximation is quite reasonable when other factorsaffecting the calculation are considered, e.g., a typical 1 kTuncertainty in the PMF translates to a factor of 3 uncertaintyin the binding constant.
III. RESULTS AND DISCUSSION
In presenting the single and double ion PMF’s, we donot apply any correction factors arising from the system sizeand lipid polarization, which have been estimated from con-tinuum methods in previous work.18,19 Our purpose here is totest the predictive power of MD force fields, and such cor-rections should ideally be calculated within the MD frame-work to be reliable. For example, we have studied the finitesize effect on the free energy barrier of ions in gA by sys-tematically increasing the system size in MD simulations.We have calculated the free energy barrier at the center of thechannel with respect to the bulk solution using the thermo-dynamic integration method.49 Our results indicate no sig-nificant change—the energy barrier increases by 1 kT, whichis the accuracy limit of the calculations. This result is to becontrasted with the continuum estimate of the finite size ef-fect, which predicted a decrease in the barrier height by
FIG. 1. The value of the integrand in Eq. �4� along the channel �z� axis�solid line�, and the result of the integral for the interval �0,z� �dashed line�,obtained using the PMF of a K+ ion given in Fig. 2�b�.
FIG. 2. PMF profiles of a K+ ion along the central axis of the gramicidin Achannel obtained using the raw ion densities �A� and the symmetrized ones�B�. The ion density is symmetrized using �sym�z�= ���z�+��−z�� /2. Thedotted, dashed, and solid lines show the PMF obtained from 0.5 ns, 1 ns,and 1.5 ns MD simulations for each window.
105103-4 T. Baştuğ and S. Kuyucak J. Chem. Phys. 126, 105103 �2007�
Downloaded 14 Mar 2007 to 129.78.208.4. Redistribution subject to AIP license or copyright, see http://jcp.aip.org/jcp/copyright.jsp

−2.7 kT.18 The second effect considers corrections for theneglected polarization interaction from continuum electro-statics, but only for the lipid molecules. As pointed outbefore,50 a self-consistent treatment of the polarization inter-action is very important, and a partial incorporation of polar-izability may introduce even larger errors than completelyneglecting it. Thus a fully polarizable MD force field is re-quired for assessing the effect of the polarization interactionon the energetics of ion permeation. We also note that theseeffects are shown to be most important when the ion is at thecenter of the channel but they become negligible at the bind-ing site and outside,18 which is the main focus of this study.
A. Potential of mean force of ions
Due to large system size, we could not properly addressconvergence issues in previous PMF calculations of K+ ionsin gA.17,20 Using a smaller system has allowed us to runmuch longer simulations so that convergence of the PMF canbe studied. We choose the K+ ion PMF for this purpose as inthe previous studies to provide a justification for them aswell. We have extended the MD simulations up to 1.5 ns foreach window in the construction of the K+ PMF. To study theconvergence of the results, we construct three PMF’s usingthe trajectory data from the simulation intervals, 0–0.5, 0–1,and 0–1.5 ns. In Fig. 2�a�, the PMF’s obtained using the rawion densities are shown. There is a few kilotesla asymmetrybetween the left and right sides of the PMF’s, and most ofthe contributions to the asymmetry come from the peripheryof the binding sites. There is no clear convergence patterneven after 1.5 ns simulation, which suggests that the asym-metry in the PMF is due to slow fluctuations in the systemand will require much longer simulations to converge to asymmetric profile. An obvious source of this asymmetry isthe slow fluctuations of the gA center of mass with respect tothe lipid bilayer �up to an angstrom�. Indeed, the gA center ofmass nearly coincides with the bilayer one in the initial PMFbut it is observed to drift upwards relative to the bilayer insubsequent PMF’s, which is consistent with the increase ofasymmetry in the PMF, Fig. 2�a�. Such a drift is seen to leadto asymmetries in the carbonyl orientations, especially thoseof Leu10, Leu12, and Leu14, which point out of the channeland hence do not make stabilizing hydrogen bonds with theother residues. These leucine residues play an important rolein the binding of ions, thus asymmetries in their orientationslead to asymmetries in the PMF.
Because much longer MD simulations are not feasibleeven with this smaller system, we use the symmetrized iondensities to remedy this problem.18 As shown in Fig. 2�b�,the symmetrized PMF’s have converged to within 1 kT ev-erywhere except the central part. Fluctuations at the centerwhere the two gA monomers are linked are much largerwhich explains the slower convergence of the PMF there.Otherwise, the results in Fig. 2�b� demonstrate that usingsymmetrized ion densities, a reliable PMF can be obtainedfrom 0.5 ns MD simulations, which justifies earlier K+
PMF’s.A second issue is the validity of the above 1D-PMF re-
sults in the bulk region. Because the ion is free to move off
axis in bulk, this may cause the 1D-PMF to diverge in longsimulations. Our simulations are relatively short and the ionremains in the vicinity of the central axis during the PMFcalculations. Thus we expect the 1D-PMF to be quite a rea-sonable approximation. This is supported by the convergenceof the PMF to a flat value outside the channel. Neverthelessthere may still be an offset in the calculated bulk free energydue to the 1D approximation, which needs to be checked. Wehave recently tested the validity of the 1D-PMF results bycomparing them with independent free energy calculationsobtained from thermodynamic integration and free energyperturbation.21 The free energy difference for transferring aK+ ion from bulk to the gA center was found to be consistentwith that obtained from the 1D-PMF. Because the gA bind-ing site provides a more relevant reference point in thepresent work, here we perform a similar free energy differ-ence calculation for transferring a K+ ion from bulk �z=20 Å� to the binding site �z=11.3 Å�. The calculations arecarried out using the thermodynamic integration method asdescribed in Sec. II. In Fig. 3, we show the running averagesof the free energy differences in the forward and reversedirections, and the average of the two. As explained in Sec.II, an intermediate state �W0� is used in the transformationand the curves labeled K show the K+→W0 leg of the trans-formation, and those labeled W show the W0→W leg. Therunning averages show that the forward and reverse free en-ergies fluctuate around the average free energies within a1 kT band as one would expect. Further the average freeenergies remain stable and have converged to well-definedvalues. The total free energy change for translocating a K+
ion from bulk to the binding site is given by the sum of theend points of the solid curves in Fig. 3, which yields −7.3+2.7=−4.6 kT. This is in good agreement with −4.5 kT ob-
FIG. 3. Running averages of the free energy differences �G+ �dashed line�and −�G− �dotted lines� for transferring a K+ ion from bulk to the bindingsite of gA and the reverse process, respectively. The curve labeled K showsthe K+→W0 leg of the transformation, and W shows the W0→W leg. Foreach leg, �G is obtained from the average of the two curves and depictedwith the solid lines. The total free energy is obtained by adding the endpoints of the solid lines.
105103-5 Simulations of ion occupancy in gramicidin A J. Chem. Phys. 126, 105103 �2007�
Downloaded 14 Mar 2007 to 129.78.208.4. Redistribution subject to AIP license or copyright, see http://jcp.aip.org/jcp/copyright.jsp
tained from the 1D-PMF in Fig. 2�b�, confirming that thebulk reference value is correctly calculated in the present1D-PMF calculations.
It is instructive to compare the present K+ PMF withsome of the earlier ones. The central barrier is 21 kT, whichis consistent with all other PMF calculations when no cor-rection factors are invoked.17–20 The binding sites, however,exhibit differences depending on which gA structure is used.Of the two binding sites at z=9.6 and 11.3 Å, we find theouter site deeper with an energy of −4.5 kT. A similar resultwith a binding energy of −3 kT is obtained in a recent cal-culation where the 1JNO structure is used.18 In contrast whenthe 1MAG structure is employed, the inner binding sitecomes out deeper with an energy of −7 kT.20 In x-ray dif-fraction experiments, Tl+ ions are found to bind at 9.6 Å.51
NMR experiments, on the other hand, indicate a delocalizedbinding site for K+ distributed over the leucine 10-12-14 car-bonyl groups,52,53 which suggests a broader energy well cov-ering both binding sites. Despite long equilibration times, thePMF’s obtained using the 1MAG and 1JNO structures aresomewhat different with the former yielding a lower bindingenergy while the barriers remain the same. After long equili-bration, the only important difference that remains betweenthe two structures is the orientation of the Trp9 side chains.38
Thus our results suggest that the Trp9 rotamer state in the1MAG structure provides a slightly better environment forbinding of K+ ions but does not influence its permeation,consistent with previous observations.54
The binding constants of cations with gA have been welldetermined from NMR experiments, which provide valuablechecks on the binding energies obtained from PMF’s. Weestimate the binding constant of K+ from the PMF in Fig.2�b� using Eq. �5�. The effective pore radius for a K+ ion inthe binding site is determined from MD simulations as R�2 Å, by measuring its radial distribution with respect tothe channel axis. Evaluating the integral numerically be-tween ±15 Å and substituting in Eq. �5�, we obtain K=1.8 M−1. The experimental values obtained from NMR areK=52.6 M−1 �Ref. 55�, and 60 M−1,34 which are 30 timeslarger, indicating a deeper binding site than calculated here.In a similar MD simulation,18 the K+ binding constant wasestimated as K=2.9 M−1 and agreement with the NMR dataof Hinton et al.55 was claimed, which was quoted as1.4–52.6 M−1. We note that the NMR data of Hinton et al.55
are 52.6 M−1, and the value of 1.4 M−1 was determined fromearlier streaming potential measurements,31 which is not asreliable. Also in this estimate of the binding constant,18 R=8 Å was used for the radius. This is a rather large value andexplains how a larger binding constant was obtained in Ref.18 although the binding site was shallower �−3 kT� than thepresent PMF �−4.5 kT�. To see the effect of a deeper well onthe binding constant, we use the PMF in Ref. 20, which hasa well depth of −7 kT and yields K=17.5 M−1—closer to theNMR values. The above examples make the exponential de-pendence of the binding constant on the well depth veryclear and suggest that in order to achieve agreement with theexperimental data, a well depth of about −8 kT is required inthe K+ PMF. We remark that the same well depth of −8 kTwas obtained when the PMF was obtained from a fit to the
available conductance data for K+ ions using Brownian dy-namics simulations.15 In this work,15 the barrier height andwell depth in the PMF were treated as parameters, and theiroptimal values were determined from a best fit to all theavailable permeation data. Congruence of two completelyindependent estimates for the binding energy of K+ givesfurther confidence on the extracted value of −8 kT.
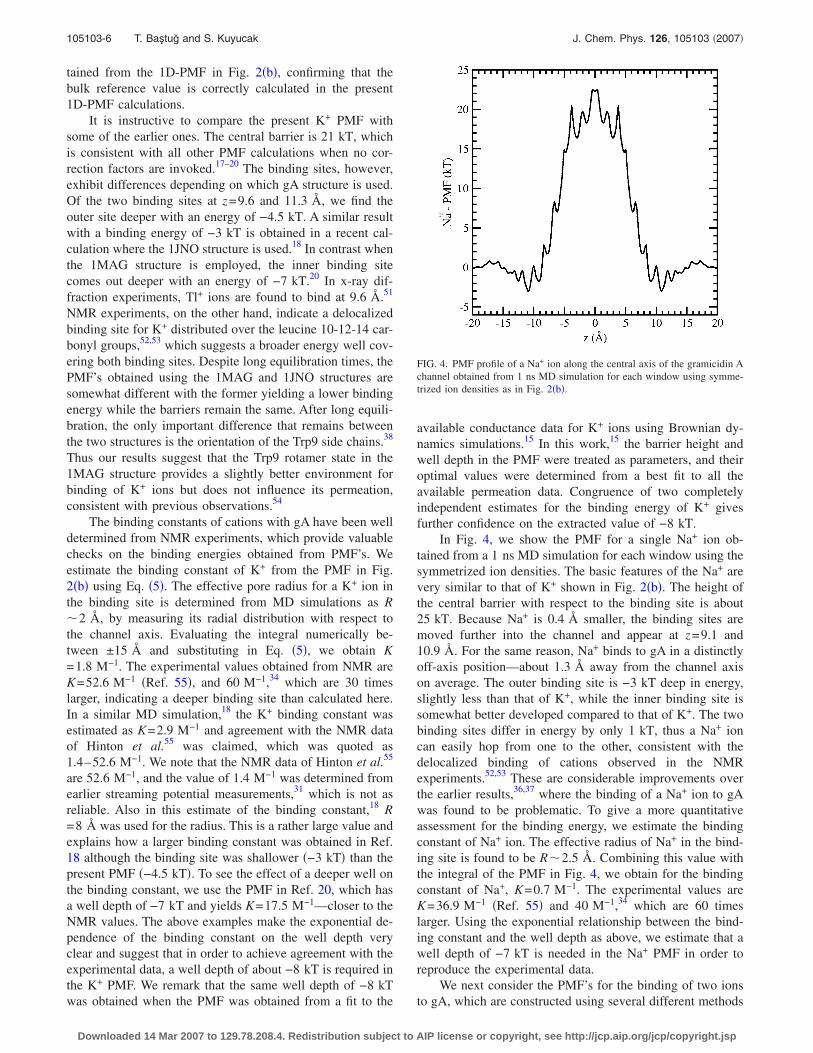
In Fig. 4, we show the PMF for a single Na+ ion ob-tained from a 1 ns MD simulation for each window using thesymmetrized ion densities. The basic features of the Na+ arevery similar to that of K+ shown in Fig. 2�b�. The height ofthe central barrier with respect to the binding site is about25 kT. Because Na+ is 0.4 Å smaller, the binding sites aremoved further into the channel and appear at z=9.1 and10.9 Å. For the same reason, Na+ binds to gA in a distinctlyoff-axis position—about 1.3 Å away from the channel axison average. The outer binding site is −3 kT deep in energy,slightly less than that of K+, while the inner binding site issomewhat better developed compared to that of K+. The twobinding sites differ in energy by only 1 kT, thus a Na+ ioncan easily hop from one to the other, consistent with thedelocalized binding of cations observed in the NMRexperiments.52,53 These are considerable improvements overthe earlier results,36,37 where the binding of a Na+ ion to gAwas found to be problematic. To give a more quantitativeassessment for the binding energy, we estimate the bindingconstant of Na+ ion. The effective radius of Na+ in the bind-ing site is found to be R�2.5 Å. Combining this value withthe integral of the PMF in Fig. 4, we obtain for the bindingconstant of Na+, K=0.7 M−1. The experimental values areK=36.9 M−1 �Ref. 55� and 40 M−1,34 which are 60 timeslarger. Using the exponential relationship between the bind-ing constant and the well depth as above, we estimate that awell depth of −7 kT is needed in the Na+ PMF in order toreproduce the experimental data.
We next consider the PMF’s for the binding of two ionsto gA, which are constructed using several different methods
FIG. 4. PMF profile of a Na+ ion along the central axis of the gramicidin Achannel obtained from 1 ns MD simulation for each window using symme-trized ion densities as in Fig. 2�b�.
105103-6 T. Baştuğ and S. Kuyucak J. Chem. Phys. 126, 105103 �2007�
Downloaded 14 Mar 2007 to 129.78.208.4. Redistribution subject to AIP license or copyright, see http://jcp.aip.org/jcp/copyright.jsp

as described in Sec. II. Because SMD simulations usingJarzynski’s equality are relatively new, we first demonstrateits reliability for determining ionic PMF’s in a simple testcase that involves binding of a single K+ ion to gA. In Fig. 5,the PMF obtained from SMD by pulling an external ion tothe left-binding site is compared to that obtained from um-brella sampling and WHAM �Fig. 2�a��. The SMD-PMFclosely tracks that of WHAM and reproduces the bindingenergies within 1 kT, which is within the statistical accuracyof the simulations.
To study double occupancy, we perform a similar set ofSMD simulations as above but now with a K+ ion present inthe right-binding site. In Fig. 6�a�, we show the positions ofthe steered and bound ions against the SMD reference pointfor each of the ten SMD simulations. It is seen that the boundion leaves the right-binding site in some cases as the steeredion approaches the left site. The PMF obtained from theSMD simulations using Jarzynski’s equality is shown in Fig.6�b� �solid line�. In the same plot we also show a similarPMF but obtained using umbrella sampling and WHAM,where a 4 kT/Å2 harmonic restraint is applied on the boundion �dashed line�. There is very little difference between thetwo PMF’s, which indicates that restraining of the bound ionin WHAM did not influence the binding of the second K+ ionmuch. The PMF’s reveal that the second K+ ion cannot bindto the usual binding locations at 9.6 and 11.3 Å but has ashallow �−1 kT deep� binding site around 13 Å. The bindingconstant estimated from the PMF is K=0.1 M−1 while theexperimental value determined from NMR is K=3 M−1.34
Thus the binding constant is overestimated by a factor of 30as in the case of a single K+ ion, indicating a similar under-estimate of the binding energy by 3–4 kT.
Results of a similar study for the double occupancy ofNa+ ions from SMD simulations are presented in Fig. 7.Positions of the steered and bound ions from ten SMD simu-lations are shown in Fig. 7�a�. In contrast to the K+ case inFig. 6�b�, here none of the bound Na+ ions leave the bindingsite during the steering process, even when the steered ion is
moved into the pore beyond the binding site. As explainedbelow, this is due to the off-axis binding of Na+ ions, whichallows exit of pore water without much hindrance. The PMFobtained from the SMD simulations �Fig. 7�b�� shows thatthe second Na+ ion binds nearly at the same distance�z=−11.1 Å� and with a similar energy �−2.5 kT� as the firstone. The PMF yields a binding constant of K=0.3 M−1, to becompared with the NMR value of K=4 M−1.34 The reduceddiscrepancy compared to the binding of a single Na+ ion isagain the result of off-axis binding of Na+ ions, which unlikein the case of K+, does not hinder the binding of a secondNa+ ion.
An alternative way to study double occupancy is to bindthe two ions simultaneously in a symmetric fashion as de-scribed in Sec. II. The PMF’s for simultaneous binding oftwo K+ and two Na+ ions are shown in Fig. 8. As one might
FIG. 5. Comparison of the PMF profile for binding of a single K+ ion to gAobtained from SMD simulations with that of WHAM �Fig. 2�a��.
FIG. 6. �Color� SMD simulations for double K+ occupancy. In �A�, thepositions of the steered and bound ions are plotted against the SMD refer-ence point for each of the ten SMD simulations. Color is used to helpdistinguish among different K+ trajectorie; otherwise it has no significance.In �B�, we show the PMF profiles of the second K+ ion determined from theSMD simulations �solid line� and WHAM �dashed line�.
105103-7 Simulations of ion occupancy in gramicidin A J. Chem. Phys. 126, 105103 �2007�
Downloaded 14 Mar 2007 to 129.78.208.4. Redistribution subject to AIP license or copyright, see http://jcp.aip.org/jcp/copyright.jsp

expect, these PMF’s are roughly bracketed between those ofsingle and double ion cases. Discussing the K+ ions first �Fig.8, solid line�, the PMF shows that the two ions can bind togA simultaneously at z= ±11.5 Å, slightly further out thanthat of a single K+ ion �Fig. 2�b��. The binding energy is−3 kT, which is in between the single and double ion results.Because this PMF is based on the distance between the twoions, it provides no information on whether the binding oc-curs in a symmetric fashion or not. PMF’s obtained from theindividual ion densities—though they do not have a directphysical interpretation—could shed light on this question.From the individual PMF’s �not shown�, we find that there isa slight asymmetry during the binding of two K+ ions butonce the ions are bound, this asymmetry disappears. Whenthe ions are in the binding sites, there are seven water mol-ecules between them in the channel. One of the water mol-ecules escapes when the ions are pushed to ±10 Å. Due tosingle filing in the pore region, water molecules cannot es-cape when the ions are pushed further in, which leads to a
FIG. 7. �Color� Similar to Fig. 6 but for double Na+ occupancy. In �B� onlythe SMD result for PMF is shown.
FIG. 8. PMF profiles for simultaneous binding of two K+ ions �solid line�and two Na+ ions �dashed line� to gA.
FIG. 9. �Color� Fractional distribution of ion-oxygen distances for the oxy-gens of water, leucine �10, 12, and 14� and tryptophan �11, 13, and 15�,when a single K+ ion is in the left-binding site �A�, and when two K+ ionsare simultaneously bound at the right �B� and left �C� binding sites. In orderto have similar scales with the Leu and Trp oxygens, the radial distributionfunction is shown for water oxygens �i.e., the distribution function is nor-malized by 4�r2�r�.
105103-8 T. Baştuğ and S. Kuyucak J. Chem. Phys. 126, 105103 �2007�
Downloaded 14 Mar 2007 to 129.78.208.4. Redistribution subject to AIP license or copyright, see http://jcp.aip.org/jcp/copyright.jsp
steeply rising PMF after 9 Å. The role of pore water andcarbonyl dipoles in the binding process is further discussedbelow. The PMF for simultaneous binding of two Na+ ions�Fig. 8, dashed line� is very similar to those for single anddouble ion cases—the binding locations and energies are al-most the same. Interestingly, the individual PMF’s �notshown� exhibit a much larger asymmetry in this case, whicharises from different binding configurations of the two Na+
ions as discussed further below.
B. Coordination of ions
In order to gain a better understanding of the PMF re-sults, we study how the ions are coordinated in their respec-tive binding sites �Figs. 8 and 9� and the deflections in theorientations of the carbonyl dipoles upon cation binding�Table I�. Both K+ and Na+ ions are coordinated by theneighboring Leu and Trp carbonyl groups and about threewater molecules. We find that the Trp9 carbonyl oxygen islocated farther than the second hydration shell, and thereforein the following we restrict the carbonyl groups to Leu10,Leu12, and Leu14 and Trp11, Trp13, and Trp15. In Fig. 9,we show the K+–O distance distribution for the Leu and Trpoxygens and the radial distribution function �RDF� for thewater oxygens �the latter quantity is chosen to prevent thewater distribution from dominating the graph�. The top partshows the results for a K+ ion bound in the left-binding site�A�, while the lower two panels show the results for doublyoccupied channel with two K+ ions simultaneously bound atthe right �B� and left �C� binding sites. The average radialdistances of the ions from the channel axis are r=0.4 Å �A�,1.1 Å �B�, and 0.7 Å �C�. Thus the K+ ions assume a moreoff-axis position in double occupancy. Integrating the waterRDF gives first hydration shells of 3.0 molecules for �A� and2.75 for �B� and �C�, that is, 2 K+ ions are slightly lesshydrated by water molecules compared to a single K+ ion. Inall cases, the Leu10 and Leu12 oxygens remain firmly in the
first hydration shell but for the Trp15 oxygen this is true onlyin the single ion case. In double occupancy, the K+ ions areslightly farther away and more off axis, which leads to abroader distribution for the Trp15 oxygen. The other carbo-nyl oxygens remain mostly in the second shell. One notableexception is the Leu14 oxygen, which is widely distributedin case �B�. The K+ ion is more off axis in this case, and anexamination of the trajectory data shows that it interactsmore strongly with the Leu14 oxygen. Inspection of the av-erage dipole deflection angles in Table I provides furtherevidence for this argument—there is an appreciable deflec-tion of the Leu14 dipole in case �B� compared to the others.The only other appreciable deflection of carbonyl dipolesupon cation binding occurs for Leu12 and Leu12�, whichrange from 11° to 15°. These are larger than the experimentalvalues indicating less than 10° deflection,52,53 but the situa-tion gets worse when the K+ ion is in the inner binding site21
where larger deflections occur.In Fig. 10, we present a similar study for Na+ ions. The
average radial distances of the ions from the channel axis arer=1.3 Å �A�, 1.3 Å �B�, and 0.5 Å �C�. In double occupancy,the Na+ ion on the left side takes a more central position,which leads to it being slightly less well coordinated by thecarbonyl groups. In all cases, the integration of the waterRDF gives 3.0 molecules in the first hydration shell, so thereis no difference between the three cases in that respect. Be-cause the Na+ ions are farther in the pore compared to K+,the Trp15 oxygen, besides Leu10, remains in the first hydra-tion shell in all cases. We remark that in every case studied,the Leu10 oxygen provides the strongest coordination for thebound cation consistent with the NMR experiments.57,58 Thehydration shell is completed by the Leu12 oxygen for the ionin the left-binding site �both A and C�, which results in alarge deflection of the Leu12� dipole �21°–22°� �Table I�.The Na+ ion on the right side, on the other hand, completesits hydration shell with the Leu14 oxygen, which has to de-
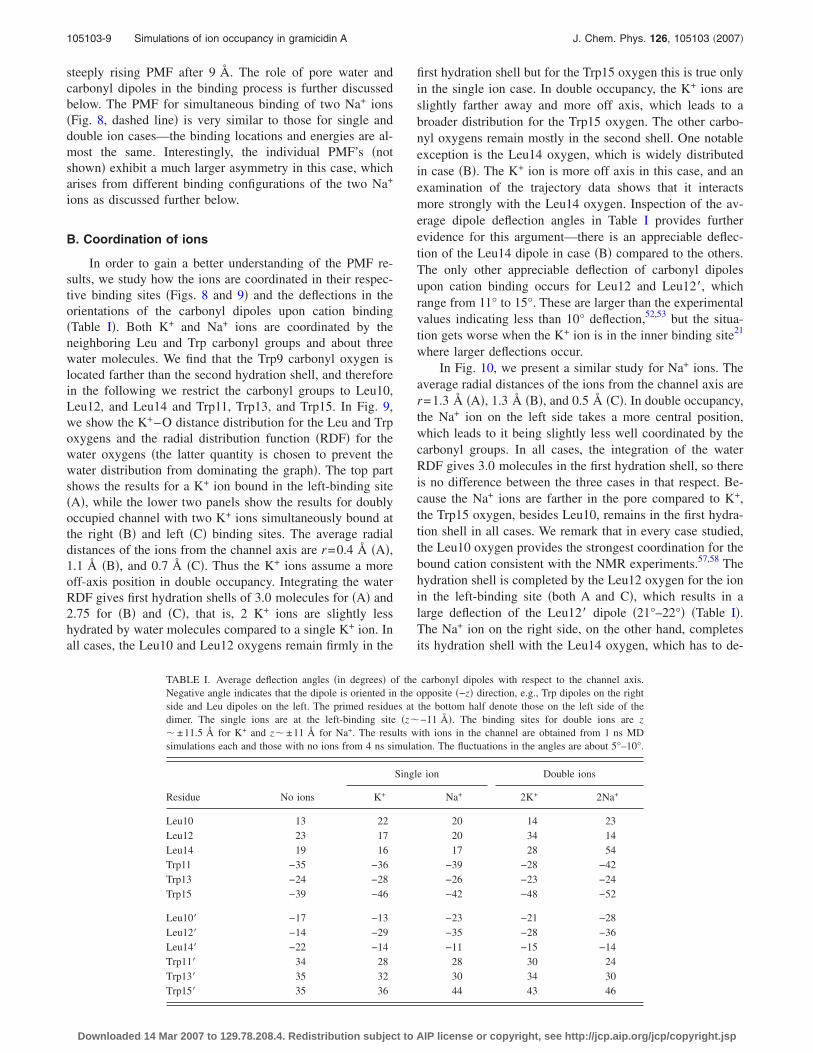
TABLE I. Average deflection angles �in degrees� of the carbonyl dipoles with respect to the channel axis.Negative angle indicates that the dipole is oriented in the opposite �−z� direction, e.g., Trp dipoles on the rightside and Leu dipoles on the left. The primed residues at the bottom half denote those on the left side of thedimer. The single ions are at the left-binding site �z�−11 Å�. The binding sites for double ions are z� ±11.5 Å for K+ and z� ±11 Å for Na+. The results with ions in the channel are obtained from 1 ns MDsimulations each and those with no ions from 4 ns simulation. The fluctuations in the angles are about 5°–10°.
Residue No ions
Single ion Double ions
K+ Na+ 2K+ 2Na+
Leu10 13 22 20 14 23Leu12 23 17 20 34 14Leu14 19 16 17 28 54Trp11 −35 −36 −39 −28 −42Trp13 −24 −28 −26 −23 −24Trp15 −39 −46 −42 −48 −52
Leu10� −17 −13 −23 −21 −28Leu12� −14 −29 −35 −28 −36Leu14� −22 −14 −11 −15 −14Trp11� 34 28 28 30 24Trp13� 35 32 30 34 30Trp15� 35 36 44 43 46
105103-9 Simulations of ion occupancy in gramicidin A J. Chem. Phys. 126, 105103 �2007�
Downloaded 14 Mar 2007 to 129.78.208.4. Redistribution subject to AIP license or copyright, see http://jcp.aip.org/jcp/copyright.jsp

flect a considerable amount �35°� to achieve this. As pointedout above, such large deflections of the carbonyl dipoles arenot consistent with experiments.52,53 The distribution func-tions in Fig. 10 provide an explanation for the asymmetry ofthe individual PMF’s of Na+ ions mentioned above. TheLeu14 oxygen coordinates the Na+ ion on the left slightlybetter than does the Leu12 oxygen the Na+ ion on the right—the average distances are 2.42 Å in the former and 2.58 Å inthe latter. Using these figures to compute the Coulomb inter-action between Na+ and Leu-oxygen yields −7 kT in favor ofthe Na+ ion on the right side, which compares favorably withthe −5 kT difference found in the binding energies of indi-vidual PMF’s.
An interesting feature of the gA channel is that the di-poles of water molecules are all aligned along the channelaxis with or without an ion in the binding site. When an ionis in the binding site, the water dipoles are clearly alignedalong the electric field of the ion but in the absence of an ion,the dipoles can spontaneously flip directions in a subnano-second time interval.56 Simultaneous binding of two cationspresents a similar situation, and many such flips of the waterdipoles are observed during the construction of the two-ionPMF’s. As an example, we show in Fig. 11�a� the timecourse of the water dipole moments when two cations arebound to the channel symmetrically as in Fig. 8. Of the sevenwater molecules, dipole moments of 1 or 2 are aligned with
one ion and the rest with the other one. Thus there is still anet dipole moment associated with the water column in thechannel but it is reduced compared to the single ion case. InFig. 11�a�, we show the average of the dipole projectionsover seven water molecules. For the K+ ion, the water di-poles remain oriented in the −z direction but in the case ofthe Na+ ion, the dipoles are seen to change directions twicein a 0.2 ns interval.
We next address whether the water dipole moments con-tribute to the asymmetry of the two-ion PMF’s. For this pur-pose, we calculate the time average of �cos �� shown in �A�for each PMF window and plot the result as a function of thewindow position �Fig. 11�b��. It is seen that even when theions are away from the binding sites, the average dipole mo-ment of water in the channel is less than the maximal valuedue to spontaneous flip of the dipoles. As the ions get closerto the binding sites, the net dipole moment of water column
FIG. 10. �Color� Same as Fig. 9 but for Na+ ions.
FIG. 11. �A� Time course of the water dipole moment projections to thechannel axis �denoted by cos ��, when two K+ or two Na+ ions are simulta-neously bound to gA as in Fig. 8. Average of cos � for the seven watermolecules in the channel is calculated at each snapshot and plotted againstsimulation time. �B� The time average of �cos �� plotted in �A� is calculatedfor each PMF window and plotted as a function of the window position.
105103-10 T. Baştuğ and S. Kuyucak J. Chem. Phys. 126, 105103 �2007�
Downloaded 14 Mar 2007 to 129.78.208.4. Redistribution subject to AIP license or copyright, see http://jcp.aip.org/jcp/copyright.jsp
is diminished because of the cancellations. We find no con-clusive evidence for correlations between the asymmetries inthe PMF’s and the average dipole orientations of water in thechannel. For example, the largest asymmetry in the indi-vidual K+ PMF’s occurs at z=12.5 Å, favoring the ion on theright, and the average dipole orientation of water moleculesis negative �Fig. 11�b��, which would suggest a correlationbetween the two quantities. However, in the case of Na+
PMF’s an even larger asymmetry occurs at z=11 Å, favoringagain the ion on the right but the water dipole moments areoriented in the positive direction in this case. Thus the resultsof the MD simulations suggest that the water molecules inthe channel do not play a significant role in the asymmetricbinding of two cations to the channel.
IV. CONCLUSIONS
The present study of single and double ion occupancy ingramicidin A complements our previous work on free energysimulations of ion permeation in gA.17,20,21 The previous re-sults for single K+ PMF’s are extended to Na+ ion and longersimulations are carried out to address the convergence issues.The present results for single cation PMF’s indicate that thecentral barrier of �20 kT �Figs. 1 and 2� is overestimated byabout 15 kT compared to the estimates obtained from experi-mental data.15 This is a significant discrepancy that wouldlead to suppression of the channel conductance by many or-ders of magnitude compared to the experimental values. Themost plausible source for the missing stabilization energy fora cation at the center of the channel is the polarization inter-action. The force fields currently employed in MD simula-tions do not incorporate the polarization interaction explicitlybut take its effect into account in a mean field approximationby increasing the partial charges on atoms from their gasphase values. Such an approximate treatment of polarizationappears to have worked well in bulk water because theseforce fields have been optimized under bulk conditions. Butthere is no guarantee that they will work as well in a lipidenvironment because lipids have very different polarizationcharacteristics compared to bulk water. This expectation isreinforced by a recent semimicroscopic model calculation ofthe ionic free energies in the gA channel that explicitly in-cluded polarization interaction: it has been much more suc-cessful in accounting for the ionic free energies compared tothe microscopic MD simulations that employed rigid forcefields.59
The binding constants for single ion occupancy of gA,estimated from the respective PMF’s, are one to two ordersof magnitude smaller than the experimental values, whichsuggests that the binding energies are underestimated by3–4 kT. Similar discrepancies are found for double ion bind-ing to gA. On the positive side, we have shown that doubleion binding to gA is energetically feasible, which is an im-provement over earlier MD studies that predicted otherwise.Although the problems in binding of cations either singly ordoubly are not as severe as translocation problems, they arealso harder to rectify because the corrections suggested sofar18,19 for remedy of the latter have a negligible impact atthe binding sites. Again the only obvious source for the miss-
ing binding energy of ions is the polarization interaction, andits explicit inclusion in MD force fields may also help toresolve these discrepancies. We hope that the results docu-mented here and in previous papers will further stimulateconstruction of polarizable force fields for MD simulationsof membrane proteins.
ACKNOWLEDGMENTS
This work was supported by grants from the AustralianResearch Council. Calculations were carried out using theBarossa cluster at the Australian Center for Advanced Com-puting and Communications and the SGI Altix clusterat the Supercomputer Facility of the Australian NationalUniversity.
1 D. A. Doyle, J. M. Cabral, R. A. Pfuetzner, A. Kuo, J. M. Gulbis, S. L.Cohen, B. T. Chait, and R. MacKinnon, Science 280, 69 �1998�.
2 J. H. Morais-Cabral, Y. Zhou, and R. MacKinnon, Nature �London� 414,37 �2001�.
3 Y. Zhou, J. H. Morais-Cabral, A. Kaufman, and R. MacKinnon, Nature�London� 414, 43 �2001�.
4 O. S. Andersen and R. E. Koeppe, Physiol. Rev. 72, 89 �1992�.5 B. Hille, Ionic Channels of Excitable Membranes, 3rd ed. �Sinauer As-sociates Inc., Sunderland, MA, 2001�.
6 D. W. Urry, Proc. Natl. Acad. Sci. U.S.A. 68, 672 �1971�.7 A. S. Arseniev, I. L. Barsukov, V. F. Bystrov, A. L. Lomize, and Y. A.Ovchinnikov, FEBS Lett. 186, 168 �1985�.
8 R. R. Ketchem, W. Hu, and T. A. Cross, Science 261, 1457 �1993�.9 R. R. Ketchem, B. Roux, and T. A. Cross, Structure �London� 5, 1655�1997�.
10 L. E. Townsley, A. W. Tucker, S. Sham, and J. F. Hinton, Biochemistry40, 11676 �2001�.
11 M. B. Partenskii and P. C. Jordan, Q. Rev. Biophys. 25, 477 �1992�.12 B. Roux and M. Karplus, Annu. Rev. Biophys. Biomol. Struct. 23, 731
�1994�.13 S. Kuyucak, O. S. Andersen, and S. H. Chung, Rep. Prog. Phys. 64, 1427
�2001�.14 B. Roux, Acc. Chem. Res. 35, 366 �2002�.15 S. Edwards, B. Corry, S. Kuyucak, and S. H. Chung, Biophys. J. 83,
1348 �2002�.16 P. C. Jordan, Biophys. J. 83, 1235 �2002�.17 T. W. Allen, T. Bastug, S. Kuyucak, and S. H. Chung, Biophys. J. 84,
2159 �2003�.18 T. W. Allen, O. S. Andersen, and B. Roux, Proc. Natl. Acad. Sci. U.S.A.
101, 117 �2004�.19 T. W. Allen, O. S. Andersen, and B. Roux, Biophys. J. 90, 3447 �2006�.20 T. Bastug, A. Gray-Weale, S. M. Patra, and S. Kuyucak, Biophys. J. 90,
2285 �2006�.21 T. Bastug and S. Kuyucak, Biophys. J. 90, 3941 �2006�.22 S. B. Hladky and D. A. Haydon, Biophys. J. 73, 1699 �1997�.23 S. B. Hladky and D. A. Haydon, Biochim. Biophys. Acta 274, 294
�1972�.24 S. B. Hladky and D. A. Haydon, Curr. Top. Membr. Transp. 21, 327
�1984�.25 E. Neher, J. Sandblom, and G. Eisenman, J. Membr. Biol. 40, 97 �1978�.26 G. Eisenman, J. Sandblom, and E. Neher, Biophys. J. 22, 307 �1978�.27 J. Sandblom, G. Eisenman, and J. Hagglund, J. Membr. Biol. 71, 61
�1983�.28 L. V. Schagina, A. E. Grinflet, and A. A. Lev, Nature �London� 273, 243
�1978�.29 L. V. Schagina, A. E. Grinflet, and A. A. Lev, J. Membr. Biol. 73, 203
�1983�.30 B. W. Urban, S. B. Hladky, and D. A. Haydon, Biochim. Biophys. Acta
602, 331 �1980�.31 D. G. Levitt, S. R. Elias, and J. M. Hautman, Biochim. Biophys. Acta
512, 436 �1978�.
105103-11 Simulations of ion occupancy in gramicidin A J. Chem. Phys. 126, 105103 �2007�
Downloaded 14 Mar 2007 to 129.78.208.4. Redistribution subject to AIP license or copyright, see http://jcp.aip.org/jcp/copyright.jsp

32 P. A. Rosenberg and A. Finkelstein, J. Gen. Physiol. 72, 327 �1978�.33 D. W. Urry, T. L. Trapane, C. M. Venkatachalam, and R. B. McMichens,
Methods Enzymol. 171, 286 �1989�.34 N. J. Jing, K. U. Prasad, and D. W. Urry, Biochim. Biophys. Acta 1238,
1 �1995�.35 S. S. Sung and P. C. Jordan, J. Phys. Chem. 92, 2362 �1988�.36 B. Roux, B. Prodhom, and M. Karplus, Biophys. J. 68, 876 �1995�.37 T. B. Woolf and B. Roux, Biophys. J. 72, 1930 �1997�.38 T. W. Allen, O. S. Andersen, and B. Roux, J. Am. Chem. Soc. 125, 9868
�2003�.39 W. Humphrey, A. Dalke, and K. Schulten, J. Mol. Graphics 14, 33
�1996�.40 J. F. Nagle and S. Tristram-Nagle, Biochim. Biophys. Acta 1469, 159
�2000�.41 T. Bastug, S. M. Patra, and S. Kuyucak, Chem. Phys. Lipids 141, 197
�2006�.42 L. Kale, R. Skeel, M. Bhandarkar, R. Brunner, A. Gursoy, N. Krawetz, J.
Phillips, A. Shinozaki, K. Varadarajan, and K. Schulten, J. Comput. Phys.151, 283 �1999�.
43 A. D. MacKerell, Jr., D. Bashford, M. Bellott et al., J. Phys. Chem. B102, 3586 �1998�.
44 S. Feller, Y. Zhang, R. Pastor, and B. Brooks, J. Chem. Phys. 103, 4613�1995�.
45 G. M. Torrie and J. P. Valleau, J. Comput. Phys. 23, 187 �1977�.46 S. Kumar, D. Bouzida, R. H. Swensen, P. A. Kollman, and J. M. Rosen-
berg, J. Comput. Chem. 13, 1011 �1992�.47 C. Jarzynski, Phys. Rev. Lett. 78, 2690 �1997�.48 S. Park and K. Schulten, J. Chem. Phys. 120, 5946 �2004�.49 T. Bastug and S. Kuyucak, Chem. Phys. Lett. 425, 320 �2006�.50 K. A. Duca and P. C. Jordan, J. Phys. Chem. 102, 9127 �1998�.51 G. A. Olah, H. W. Huang, W. Liu, and Y. Wu, J. Mol. Biol. 218, 847
�1991�.52 F. Tian, K. C. Lee, W. Hu, and T. A. Cross, Biochemistry 35, 11959
�1991�.53 F. Tian and T. A. Cross, J. Mol. Biol. 285, 1993 �1999�.54 A. E. Dorigo, D. G. Anderson, and D. D. Busath, Biophys. J. 76, 1897
�1999�.55 J. F. Hinton, W. L. Whaley, D. Shingu, R. E. Koeppe, and F. S. Milett,
Biophys. J. 50, 539 �1986�.56 S. W. Chiu, S. Subramaniam, and E. Jakobsson, Biophys. J. 76, 1939
�1999�.57 R. Smith, D. E. Thomas, A. Atkins, F. Separovic, and B. A. Cornell,
Biochim. Biophys. Acta 1026, 161 �1990�.58 F. Separovic, J. Gehrmann, T. Milne, B. A. Cornell, S. Y. Lin, and R.
Smith, Biophys. J. 67, 1495 �1994�.59 V. L. Dorman and P. C. Jordan, Biophys. J. 86, 3529 �2004�.
105103-12 T. Baştuğ and S. Kuyucak J. Chem. Phys. 126, 105103 �2007�
Downloaded 14 Mar 2007 to 129.78.208.4. Redistribution subject to AIP license or copyright, see http://jcp.aip.org/jcp/copyright.jsp
Copyright © 2022 FDOKUMEN


![Differential Occupancy of Somatodendritic and Postsynaptic 5HT1A Receptors by Pindolol: A Dose-Occupancy Study with [11C]WAY 100635 and Positron Emission Tomography in Humans](https://static.fdokumen.com/doc/165x107/631c4aedd5372c006e045dcf/differential-occupancy-of-somatodendritic-and-postsynaptic-5ht1a-receptors-by-pindolol-1675040353.jpg)


![Differential Occupancy of Somatodendritic and Postsynaptic 5HT1A Receptors by Pindolol A Dose-Occupancy Study with [11C]WAY 100635 and Positron Emission Tomography in Humans](https://static.fdokumen.com/doc/165x107/6345cad4f474639c9b05018f/differential-occupancy-of-somatodendritic-and-postsynaptic-5ht1a-receptors-by-pindolol-1684244678.jpg)