Fraction Images Derived From Terra MODIS Data for Mapping Burned Area in Acre State, Brazilian...
11
Fraction images derived from Terra Modis data for mapping burnt areas in Brazilian Amazonia Y. E. SHIMABUKURO*{, V. DUARTE{, E. ARAI{, R. M. FREITAS{, A. LIMA{, D. M. VALERIANO{, I. F. BROWN{ and M. L. R. MALDONADO{ {Instituto Nacional de Pesquisas Espaciais (INPE), Av. dos Astronautas, 1758, Sa ˜ o Jose ´ dos Campos, SP, 12227-010, Brazil {Woods Hole Research Center and Universidade Federal do Acre (UFAC), Parque Zoobotanico, Rio Branco, Acre, 69915-900, Brazil (Received 6 September 2007; in final form 22 December 2007 ) The objective of this paper is to present a method for mapping burnt areas in Brazilian Amazonia using Terra MODIS data. The proposed approach is based on image segmentation of the shade fraction images derived from MODIS, using a non-supervised classification algorithm followed by an image editing procedure for minimizing misclassifications. Acre State, the focus of this study, is located in the western region of Brazilian Amazonia and undergoing tropical deforestation. The extended dry season in 2005 affected this region creating conditions for extensive forest fires in addition to fires associated with deforestation and land management. The high temporal resolution of MODIS provides information for studying the resulting burnt areas. Landsat 5 TM images and field observations were also used as ground data for supporting and validating the MODIS results. Multitemporal analysis with MODIS showed that about 6500 km 2 of land surface were burnt in Acre State. Of this, 3700 km 2 corresponded to the previously deforested areas and 2800 km 2 corresponded to areas of standing forests. This type of information and its timely availability are critical for regional and global environmental studies. The results showed that daily MODIS sensor data are useful sources of information for mapping burnt areas, and the proposed method can be used in an operational project in Brazilian Amazonia. 1. Introduction Land-cover fires are a global phenomenon that occurs in the tropical forests of Brazil and Indonesia, the temperate forests of the United States and Europe, the boreal forests of Siberia, China, and Canada, the tropical savannas of Africa, and the agricultural lands of the United States and Europe (Levine 1996). These fires play an important role in the emission of greenhouse gases and aerosols affecting the radiation balance, in altering patterns of cloud condensation, and in land-use practices that can result in land-cover changes. Information on the location and extent of the areas affected by fire is necessary to assess the effects of biomass burning on atmospheric chemistry, ecosystem functioning, and human health. Satellite sensor data have been used in the last decades and provide a unique source of spatial information in detecting, monitoring, and characterizing land- cover fires for global change researchers (Justice and Korontzi 2001). Satellite *Corresponding author. Email: [email protected] International Journal of Remote Sensing Vol. 30, No. 6, 20 March 2009, 1537–1546 International Journal of Remote Sensing ISSN 0143-1161 print/ISSN 1366-5901 online # 2009 Taylor & Francis http://www.tandf.co.uk/journals DOI: 10.1080/01431160802509058
-
Upload
independent -
Category
Documents
-
view
2 -
download
0
Transcript of Fraction Images Derived From Terra MODIS Data for Mapping Burned Area in Acre State, Brazilian...
Fraction images derived from Terra Modis data for mapping burnt areasin Brazilian Amazonia
Y. E. SHIMABUKURO*{, V. DUARTE{, E. ARAI{, R. M. FREITAS{,
A. LIMA{, D. M. VALERIANO{, I. F. BROWN{ and M. L. R. MALDONADO{{Instituto Nacional de Pesquisas Espaciais (INPE), Av. dos Astronautas, 1758, Sao Jose
dos Campos, SP, 12227-010, Brazil
{Woods Hole Research Center and Universidade Federal do Acre (UFAC), Parque
Zoobotanico, Rio Branco, Acre, 69915-900, Brazil
(Received 6 September 2007; in final form 22 December 2007 )
The objective of this paper is to present a method for mapping burnt areas in
Brazilian Amazonia using Terra MODIS data. The proposed approach is based
on image segmentation of the shade fraction images derived from MODIS, using
a non-supervised classification algorithm followed by an image editing procedure
for minimizing misclassifications. Acre State, the focus of this study, is located in
the western region of Brazilian Amazonia and undergoing tropical deforestation.
The extended dry season in 2005 affected this region creating conditions for
extensive forest fires in addition to fires associated with deforestation and land
management. The high temporal resolution of MODIS provides information for
studying the resulting burnt areas. Landsat 5 TM images and field observations
were also used as ground data for supporting and validating the MODIS results.
Multitemporal analysis with MODIS showed that about 6500 km2 of land
surface were burnt in Acre State. Of this, 3700 km2 corresponded to the
previously deforested areas and 2800 km2 corresponded to areas of standing
forests. This type of information and its timely availability are critical for
regional and global environmental studies. The results showed that daily MODIS
sensor data are useful sources of information for mapping burnt areas, and the
proposed method can be used in an operational project in Brazilian Amazonia.
1. Introduction
Land-cover fires are a global phenomenon that occurs in the tropical forests of
Brazil and Indonesia, the temperate forests of the United States and Europe, the
boreal forests of Siberia, China, and Canada, the tropical savannas of Africa, and
the agricultural lands of the United States and Europe (Levine 1996). These fires
play an important role in the emission of greenhouse gases and aerosols affecting the
radiation balance, in altering patterns of cloud condensation, and in land-use
practices that can result in land-cover changes. Information on the location and
extent of the areas affected by fire is necessary to assess the effects of biomass
burning on atmospheric chemistry, ecosystem functioning, and human health.
Satellite sensor data have been used in the last decades and provide a unique
source of spatial information in detecting, monitoring, and characterizing land-
cover fires for global change researchers (Justice and Korontzi 2001). Satellite
*Corresponding author. Email: [email protected]
International Journal of Remote Sensing
Vol. 30, No. 6, 20 March 2009, 1537–1546
International Journal of Remote SensingISSN 0143-1161 print/ISSN 1366-5901 online # 2009 Taylor & Francis
http://www.tandf.co.uk/journalsDOI: 10.1080/01431160802509058

remote sensing is the only technology which allows consistent and extensive data
collection at global scales. Its application for the detection and monitoring fires at
local and continental scales has been developed over many years, using a number of
different sensors and systems such as Landsat Thematic Mapper (TM) (Brustet et al.
1992), National Oceanic and Atmospheric Administration (NOAA) Advanced Very
High Resolution Radiometer (AVHRR) (Setzer and Pereira 1991), the Defense
Meteorological Satellite Program (DMSP) satellite (Cahoon et al. 1992), and the
Geostationary Operational Environmental Satellite (GOES) (Prins and Menzel
1994).
Satellite images acquired by moderate- and coarse-spatial-resolution systems
(where pixel spacing is equal or greater than 250 m), such as the Terra and Aqua
MODIS (Moderate Resolution Imaging Spectroradiometer) system, constitute a
useful source of information for monitoring the Earth surface over large areas. The
MODIS sensor system has enhanced spatial, spectral, and temporal characteristics
that provide daily observations of earth surface conditions. It also offers high
geolocation accuracy, which is a prerequisite for multitemporal analysis to monitor
burnt areas. The rapid changes in spectral signature of burnt areas in some
ecosystems, combined with fires occurring over large and remote areas, require a
moderate spatial resolution with high temporal resolution for burnt area mapping at
regional or global scale.
Using a moderate or low spatial resolution sensor data increases the so-called
‘mixture problem’, i.e. the pixel value is a mixture of reflectance from different
targets within each pixel. Several techniques, such as modelling and empirical
estimations, have been applied to depict subpixel heterogeneity in land cover from
remotely sensed data (DeFries et al. 2000). Fraction images derived from different
remote sensing data have provided consistent results for monitoring deforestation
(Shimabukuro et al. 1998), land-cover change (Carreiras et al. 2002), and vegetation
classification (DeFries et al. 2000). Fraction images, derived from a linear spectral
mixing model, constitute synthetic bands containing information on end-member
proportions. The generation of these fraction images is an alternative approach for
reducing the dimensionality of image data and enhancing specific information for
digital image processing (Aguiar et al. 1999). The objective of this paper is to present
a method for mapping burnt areas using the shade fraction image derived from daily
Terra MODIS data.
2. Study area
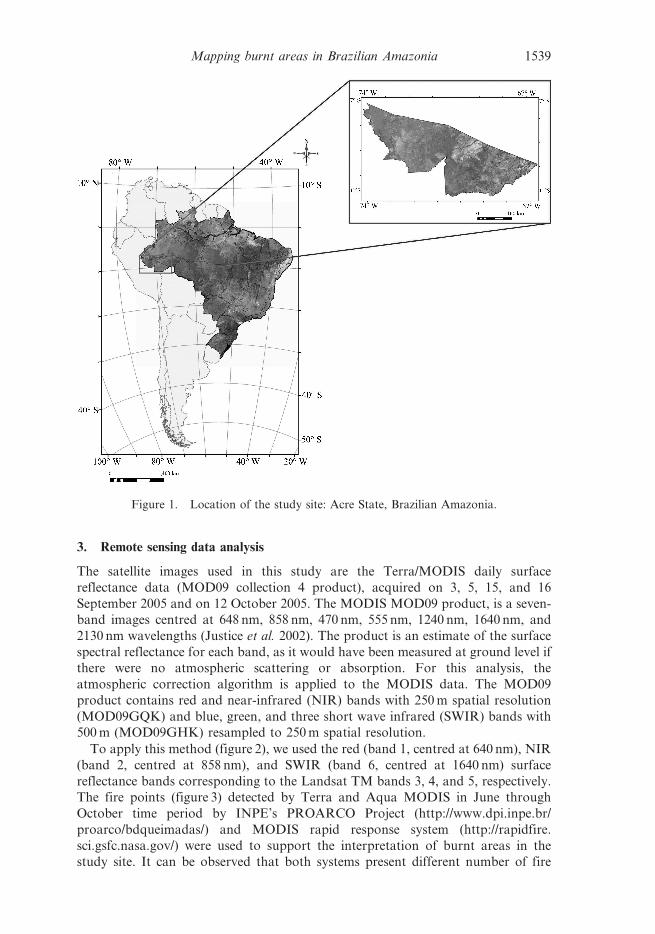
Acre State, located in the western region of Brazilian Amazonia (figure 1), served as
the site for this study. According to IBGE vegetation map (IBGE 1992), the study
site is primarily covered by moist tropical forests (‘Floresta Ombrofila Aberta’) that
has been partially deforested during the last decades. The climate in Acre is classified
as Am (tropical monsoon with the driest month somewhat below 60 mm) in the
Koppen system. Average monthly temperatures range from 24 to 27uC. Yearly rain
is about 2100 mm, with a dry season from June to September. Rainfall for the period
1 April–30 September averaged 489 mm for the period of 2001 to 2004 in the region
of 8 to 12u S and 66 to 70uW, as derived from the Global Precipitation Climatology
Project (NASA 2006). In 2005 the same area averaged only 301 mm, a 38% drop
from the previous years. This extended drought provoked a large number of fires,
including fires that penetrated into standing forests (Brown et al. 2006a).
1538 Y. E. Shimabukuro et al.
3. Remote sensing data analysis
The satellite images used in this study are the Terra/MODIS daily surface
reflectance data (MOD09 collection 4 product), acquired on 3, 5, 15, and 16
September 2005 and on 12 October 2005. The MODIS MOD09 product, is a seven-
band images centred at 648 nm, 858 nm, 470 nm, 555 nm, 1240 nm, 1640 nm, and
2130 nm wavelengths (Justice et al. 2002). The product is an estimate of the surface
spectral reflectance for each band, as it would have been measured at ground level if
there were no atmospheric scattering or absorption. For this analysis, the
atmospheric correction algorithm is applied to the MODIS data. The MOD09
product contains red and near-infrared (NIR) bands with 250 m spatial resolution
(MOD09GQK) and blue, green, and three short wave infrared (SWIR) bands with
500 m (MOD09GHK) resampled to 250 m spatial resolution.
To apply this method (figure 2), we used the red (band 1, centred at 640 nm), NIR
(band 2, centred at 858 nm), and SWIR (band 6, centred at 1640 nm) surface
reflectance bands corresponding to the Landsat TM bands 3, 4, and 5, respectively.
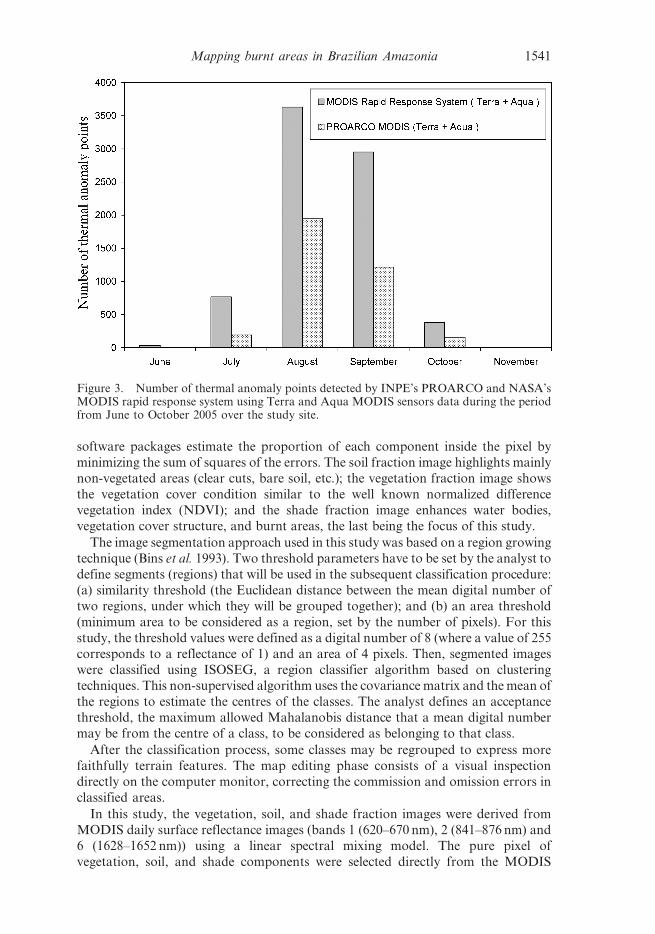
The fire points (figure 3) detected by Terra and Aqua MODIS in June through
October time period by INPE’s PROARCO Project (http://www.dpi.inpe.br/
proarco/bdqueimadas/) and MODIS rapid response system (http://rapidfire.
sci.gsfc.nasa.gov/) were used to support the interpretation of burnt areas in the
study site. It can be observed that both systems present different number of fire
Figure 1. Location of the study site: Acre State, Brazilian Amazonia.
Mapping burnt areas in Brazilian Amazonia 1539
points due to their methodological approaches. MODIS rapid response system
presents higher number of fire points when comparing to PROARCO dataset that is
more conservative trying to prevent the commission errors. It means that these
datasets can not be considered for burnt areas estimation. However, both datasets
show the occurrence of fire points during the period analysed and then any of them
can be used as the support for mapping burnt areas as proposed in this study. The
INPEs DETER (Detection of Deforested Areas in Real Time Project, Shimabukuro
et al. 2006) 2004 dataset (http://www.obt.inpe.br/deter/) for Acre State was used toidentify the land-cover types affected by the fires. Two Landsat 5 TM scenes (path/
row 002/67) acquired on 11 September and 13 October 2005 and field observations
performed during the fire season were used as ground data for supporting and
validating the MODIS results (Brown et al. 2006b).
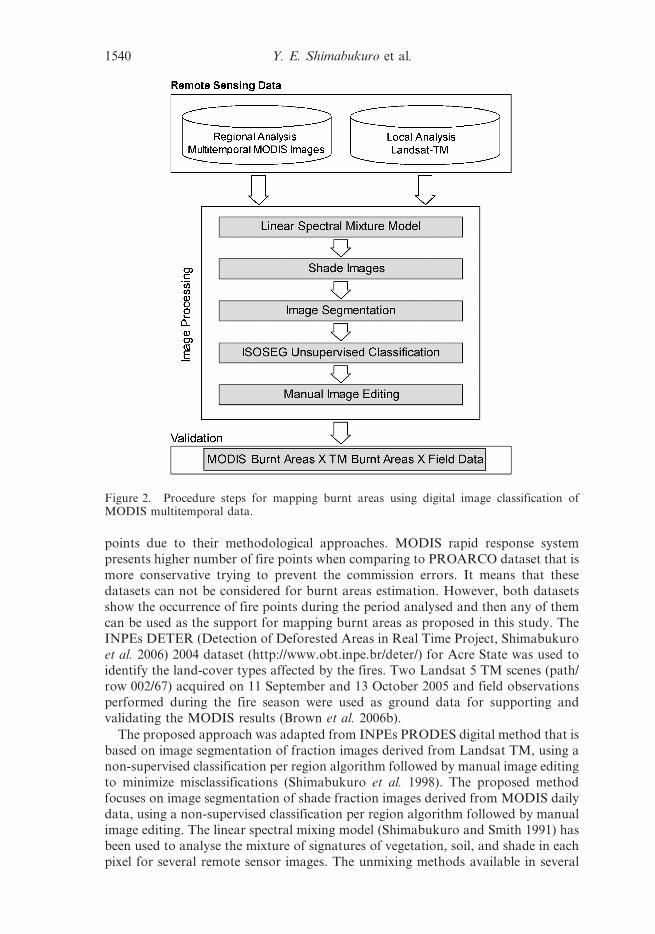
The proposed approach was adapted from INPEs PRODES digital method that is
based on image segmentation of fraction images derived from Landsat TM, using a
non-supervised classification per region algorithm followed by manual image editing
to minimize misclassifications (Shimabukuro et al. 1998). The proposed method
focuses on image segmentation of shade fraction images derived from MODIS daily
data, using a non-supervised classification per region algorithm followed by manualimage editing. The linear spectral mixing model (Shimabukuro and Smith 1991) has
been used to analyse the mixture of signatures of vegetation, soil, and shade in each
pixel for several remote sensor images. The unmixing methods available in several
Figure 2. Procedure steps for mapping burnt areas using digital image classification ofMODIS multitemporal data.
1540 Y. E. Shimabukuro et al.
software packages estimate the proportion of each component inside the pixel by
minimizing the sum of squares of the errors. The soil fraction image highlights mainly
non-vegetated areas (clear cuts, bare soil, etc.); the vegetation fraction image shows
the vegetation cover condition similar to the well known normalized difference
vegetation index (NDVI); and the shade fraction image enhances water bodies,
vegetation cover structure, and burnt areas, the last being the focus of this study.
The image segmentation approach used in this study was based on a region growing
technique (Bins et al. 1993). Two threshold parameters have to be set by the analyst to
define segments (regions) that will be used in the subsequent classification procedure:
(a) similarity threshold (the Euclidean distance between the mean digital number of
two regions, under which they will be grouped together); and (b) an area threshold
(minimum area to be considered as a region, set by the number of pixels). For this
study, the threshold values were defined as a digital number of 8 (where a value of 255
corresponds to a reflectance of 1) and an area of 4 pixels. Then, segmented images
were classified using ISOSEG, a region classifier algorithm based on clustering
techniques. This non-supervised algorithm uses the covariance matrix and the mean of
the regions to estimate the centres of the classes. The analyst defines an acceptance
threshold, the maximum allowed Mahalanobis distance that a mean digital number
may be from the centre of a class, to be considered as belonging to that class.
After the classification process, some classes may be regrouped to express more
faithfully terrain features. The map editing phase consists of a visual inspection
directly on the computer monitor, correcting the commission and omission errors in
classified areas.
In this study, the vegetation, soil, and shade fraction images were derived from
MODIS daily surface reflectance images (bands 1 (620–670 nm), 2 (841–876 nm) and
6 (1628–1652 nm)) using a linear spectral mixing model. The pure pixel of
vegetation, soil, and shade components were selected directly from the MODIS
Figure 3. Number of thermal anomaly points detected by INPE’s PROARCO and NASA’sMODIS rapid response system using Terra and Aqua MODIS sensors data during the periodfrom June to October 2005 over the study site.
Mapping burnt areas in Brazilian Amazonia 1541

images (image endmember procedure) to run the unmixing algorithm in order to
generate the corresponding fraction images. The shade fraction image was the main
source for mapping burnt areas. This fraction image highlights burnt areas, water
bodies, and cloud shadows due to the spectral similarity among these three targets
(low spectral responses in all electromagnetic wavelengths). The multitemporal
shade images were segmented and classified in order to produce the map of burnt
Figure 4. (a) Colour composite (R-B6, G-B2, B-B1) of MODIS mosaic formed based on thehighest shade proportion values derived from MODIS images analysed in this study; (b)classification of total burnt areas (shown in red) in Acre State over the shade fraction mosaic.
1542 Y. E. Shimabukuro et al.
areas. Then, image editing was performed directly in the computer monitor using the
MODIS R6 G2 B1 (similar to TM R5 G4 B3) colour composite as a reference to
correct the digital classification. This procedure corrects the misclassification of
water bodies and cloud shadows that have similar spectral responses and are
highlighted in the shade fraction images similar to the burnt areas. Therefore, this
procedure minimizes the commission and omission errors produced by digital image
classifiers (Almeida-Filho and Shimabukuro 2002). The same procedure was also
applied to the Landsat 5 TM images to map burnt areas. Then, a qualitative and
quantitative evaluation of MODIS classification was performed by comparing it to
the TM classification for a local area. In addition, over a hundred forest and pasture
fires were observed during fieldwork campaigns and provided qualitative informa-
tion as to fire occurrence (Brown et al. 2006a).
4. Results and discussion
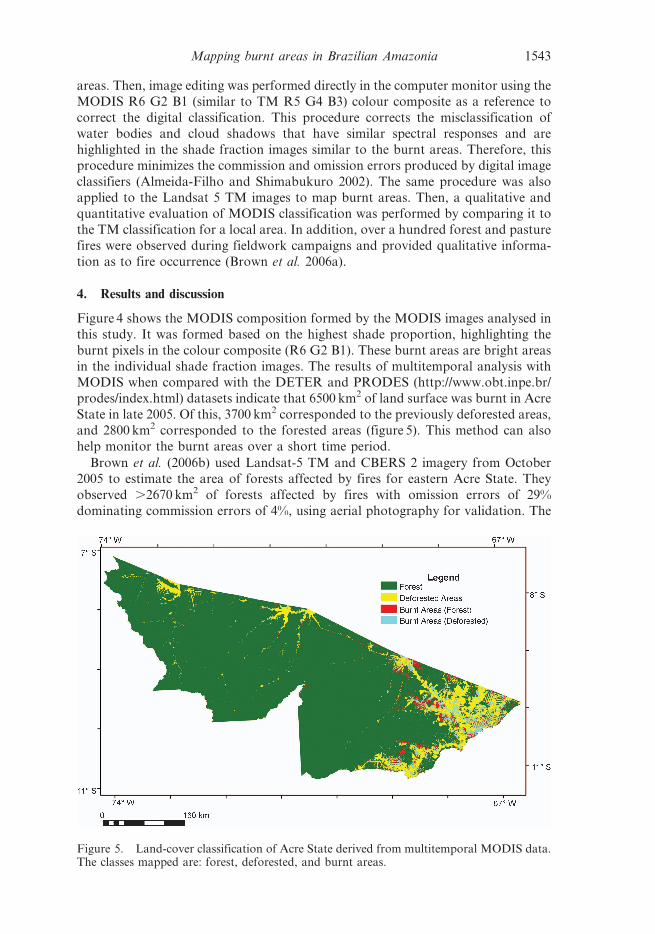
Figure 4 shows the MODIS composition formed by the MODIS images analysed in
this study. It was formed based on the highest shade proportion, highlighting the
burnt pixels in the colour composite (R6 G2 B1). These burnt areas are bright areas
in the individual shade fraction images. The results of multitemporal analysis with
MODIS when compared with the DETER and PRODES (http://www.obt.inpe.br/
prodes/index.html) datasets indicate that 6500 km2 of land surface was burnt in Acre
State in late 2005. Of this, 3700 km2 corresponded to the previously deforested areas,
and 2800 km2 corresponded to the forested areas (figure 5). This method can also
help monitor the burnt areas over a short time period.
Brown et al. (2006b) used Landsat-5 TM and CBERS 2 imagery from October
2005 to estimate the area of forests affected by fires for eastern Acre State. They
observed .2670 km2 of forests affected by fires with omission errors of 29%
dominating commission errors of 4%, using aerial photography for validation. The
Figure 5. Land-cover classification of Acre State derived from multitemporal MODIS data.The classes mapped are: forest, deforested, and burnt areas.
Mapping burnt areas in Brazilian Amazonia 1543
observed total area is consistent with the estimate from the MODIS imagery,
however, large compensating omission and commission errors resulted in this close
approximation. While the combination of Landsat/CBERS images can provide
more accurate estimates of burnt area than the method using MODIS images
described here, the Landsat/CBERS approach required a much greater investment
in operator time and was dependent upon relatively infrequent imagery—a 16- and
26-day repeat cycle for Landsat 5 and CBERS 2, respectively—that can be
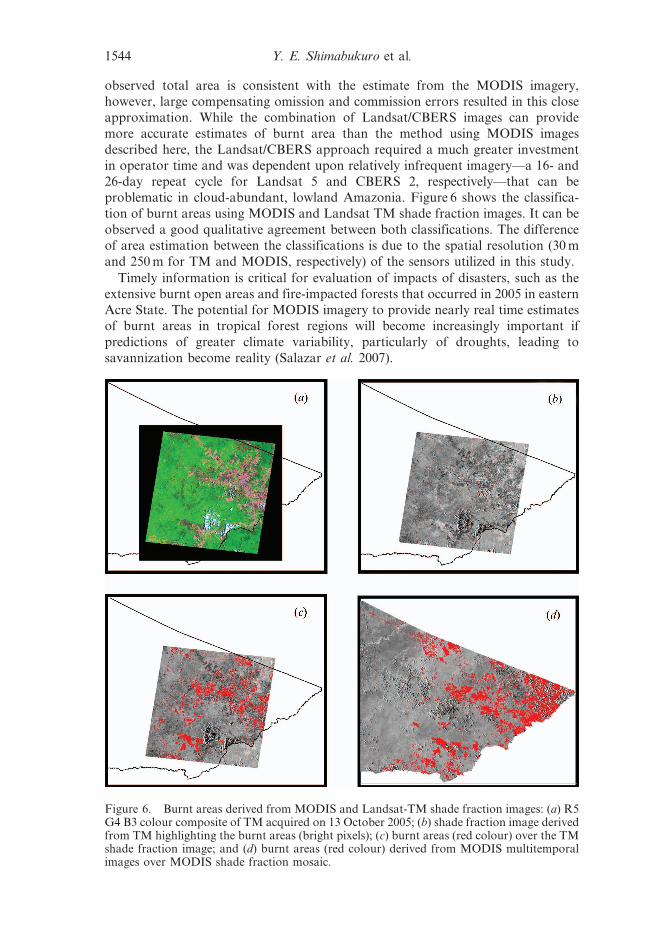
problematic in cloud-abundant, lowland Amazonia. Figure 6 shows the classifica-
tion of burnt areas using MODIS and Landsat TM shade fraction images. It can be
observed a good qualitative agreement between both classifications. The difference
of area estimation between the classifications is due to the spatial resolution (30 m
and 250 m for TM and MODIS, respectively) of the sensors utilized in this study.
Timely information is critical for evaluation of impacts of disasters, such as the
extensive burnt open areas and fire-impacted forests that occurred in 2005 in eastern
Acre State. The potential for MODIS imagery to provide nearly real time estimates
of burnt areas in tropical forest regions will become increasingly important if
predictions of greater climate variability, particularly of droughts, leading to
savannization become reality (Salazar et al. 2007).
Figure 6. Burnt areas derived from MODIS and Landsat-TM shade fraction images: (a) R5G4 B3 colour composite of TM acquired on 13 October 2005; (b) shade fraction image derivedfrom TM highlighting the burnt areas (bright pixels); (c) burnt areas (red colour) over the TMshade fraction image; and (d) burnt areas (red colour) derived from MODIS multitemporalimages over MODIS shade fraction mosaic.
1544 Y. E. Shimabukuro et al.
5. Conclusions
The method described in this paper can be used to digitally classify burnt areas in
Terra MODIS images of the Amazonian region. The increase in shade proportion
present in a forested pixel provides the information to detect the effects of fire on the
forest canopy. Similarly, the increase in shade proportion in a grassland pixel
indicates the effects of fire over deforested areas. The results of multitemporal
analysis with MODIS showed that 6500 km2 of land surface were burnt in Acre
State in 2005. Of this, 3700 km2 corresponded to the previously deforested areas,
and 2800 km2 corresponded to the forested areas. This information is critical for
regional and global environmental studies and for efforts to control such burning in
the future. The results demonstrated that MODIS sensor daily data are important
sources of timely information for mapping burnt areas and can be used at the
regional level in Brazilian Amazonia. The map of burnt areas produced with good
total accuracy by the proposed method will be useful for evaluating the future
MODIS burnt areas product that will be delivered by the MODLAND Group. The
next step of this research is to apply the proposed method for the entire Amazonia
as part of DETER (http://www.obt.inpe.br/deter/) and PANAMAZONIA (http://
www.dsr.inpe.br/panamazon.htm) projects developed at the Brazilian Institute for
Space Research (INPE).
Acknowledgements
This study is part of the Large-Scale Biosphere Atmosphere Experiment in
Amazonia (LBA) and was partially supported by the National Institute for Space
Research (INPE), the Federal University of Acre (UFAC), the Land Cover Land
Use Program of NASA, the Moore Foundation, USAID, and the Conservation,
Food & Health Foundation. This is part of a joint project between INPE, UFAC,
and the Woods Hole Research Center. The authors would like to thank the
anonymous reviewers for their comments that improved the manuscript.
References
AGUIAR, A.P.D., SHIMABUKURO, Y.E. and MASCARENHAS, N.D.A., 1999, Use of synthetic
bands derived from mixing models in the multispectral classification of remote sensing
images. International Journal of Remote Sensing, 20, pp. 647–657.
ALMEIDA-FILHO, R. and SHIMABUKURO, Y.E., 2002, Digital processing of a Landsat-TM
time-series for mapping and monitoring degraded areas caused by independent gold
miners, Roraima State, Brazilian Amazon. Remote Sensing of Environment, 79, pp.
42–50.
BINS, L.S., ERTHAL, G.J. and FONSECA, L.M.G., 1993, Um Metodo de Classificacao Nao
Supervisionada por Regioes. In SIBGRAPI VI, Recife, PE, Anais, pp. 65–68.
BROWN, I.F., MOULARD, E., NAKAMURA, J., SCHROEDER, W., MALDONADO, M.,
VASCONCELOS, S. and SELHORST, D., 2006b, Report on mapping of areas of fire
risk in eastern Acre: a first approximation. (In Portuguese) Report commissioned by
the Public Ministry and Environmental Institute of the State of Acre. Available online
at: http://www.seiam.ac.gov.br (accessed 4 November 2008).
BROWN, I.F., SCHROEDER, W., SETZER, A., MALDONADO, M., PANTOJA, N., DUARTE, A. and
MARENGO, J., 2006a, Monitoring fires in southwestern Amazonian rain forests. EOS
Transactions, 87, pp. 253–259.
BRUSTET, J.M., VICKOS, J.B., FONTAN, J., PODAIRE, A. and LAVENU, F., 1992,
Characterization of active fires in West African savannas by analysis of satellite
Mapping burnt areas in Brazilian Amazonia 1545

data: Landsat Thematic Mapper. In Global Biomass Burning, Atmospheric, Climatic,
and Biospheric Implications, J. Levine (Eds), pp. 53–60. (Cambridge, MA: MIT
Press).
CAHOON, D.R., STOCKS, B.J., LEVINE, J.S., COFER, W.R. and O’NEILL, K.P., 1992, Seasonal
distribution of African savanna fire. Nature, 359, pp. 812–815.
CARREIRAS, J.M.B., SHIMABUKURO, Y.E. and PEREIRA, J.M.C., 2002, Fraction images
derived from SPOT-4 VEGETATION data to assess land-cover change over the State
of Mato Grosso, Brazil. International Journal of Remote Sensing, 23, pp. 4979–4983.
DEFRIES, R.S., HANSEN, M.C. and TOWNSHEND, J.R.G., 2000, Global continuous fields of
vegetation characteristics: a linear mixture model applied to multi-year 8 km AVHRR
data. International Journal of Remote Sensing, 21, pp. 1389–1414.
IBGE—FUNDACAO INSTITUTO BRASILEIRO DE GEOGRAFIA E ESTATISTICA, 1992, Manual
Tecnico da Vegetacao Brasileira. Serie Manuais Tecnicos em Geociencias 1 (Rio de
Janeiro: IBGE—Fundacao Instituto Brasileiro de Geografia e Estatıstica).
JUSTICE, C.O. and KORONTZI, S., 2001, A review of the status of satellite fire monitoring and
the requirements for global environmental change research. In Global and Regional
Vegetation Fire Monitoring from Space: Planning a Coordinated International
Effort, F.J. Ahern, J.G. Goldammer and C.O. Justice (Eds), pp. 1–18 (New York:
SPB Academic Publishing).
JUSTICE, C.O., TOWNSHEND, J.R.G., VERMOTE, E., WOLFE, R., EL SALEOUS, N. and ROY, D.,
2002, An overview of MODIS Land data processing and product status Remote
Sensing of Environment, 83, pp. 3–15.
LEVINE, J.S., 1996, FireSat and the global monitoring of biomass burning. In Biomass Burning
and Global Change, vol. 1, J.S. Levine (Eds), pp. 107–132 (Cambridge, MA: The MIT
Press).
NASA, 2006, Global Precipitation Climatology Project. Rainfall Analysis Tool. Available
online athttp://disc2.nascom.nasa.gov/Giovanni/tovas/rain.GPCP.2.shtml (accessed
10 October 2008).
PRINS, E.M. and MENZEL, W.P., 1994, Trends in South American biomass burning detected
with the GOES visible infrared spin scan radiometer atmospheric sounder from 1983
to 1991. Journal of Geophysical Research, 99, pp. 16719–16735.
SALAZAR, L.F., NOBRE, C.A. and OYAMA, M.D., 2007, Climate change consequences on the
biome distribution in tropical South America. Geophysical Research Letters, 34, pp.
L09708.
SETZER, A.W. and PEREIRA, M.C., 1991, Amazonia biomass burnings in 1987 and an estimate
of their tropospheric emissions. Ambio, 20, pp. 19–22.
SHIMABUKURO, Y.E. and SMITH, J.A., 1991, The least-squares mixing models to generate
fraction images derived from remote sensing multispectral data. IEEE Transactions on
Geoscience and Remote Sensing, 29, pp. 16–20.
SHIMABUKURO, Y.E., BATISTA, G.T., MELLO, E.M.K., MOREIRA, J.C. and DUARTE, V., 1998,
Using shade fraction image segmentation to evaluate deforestation in Landsat
Thematic Mapper images of the Amazon region. International Journal of Remote
Sensing, 19, pp. 535–541.
SHIMABUKURO, Y.E., DUARTE, V., ANDERSON, L.O., VALERIANO, D.M., ARAI, E.,
FREITAS, R., RUDORFF, B.F.T. and MOREIRA, M.A., 2006, Near real time detection
of deforestation in the Brazilian Amazon using MODIS imagery. Revista Ambiente e
Agua, 1, pp. 37–47.
1546 Mapping burnt areas in Brazilian Amazonia