Foundation Course: a note on labour market
11
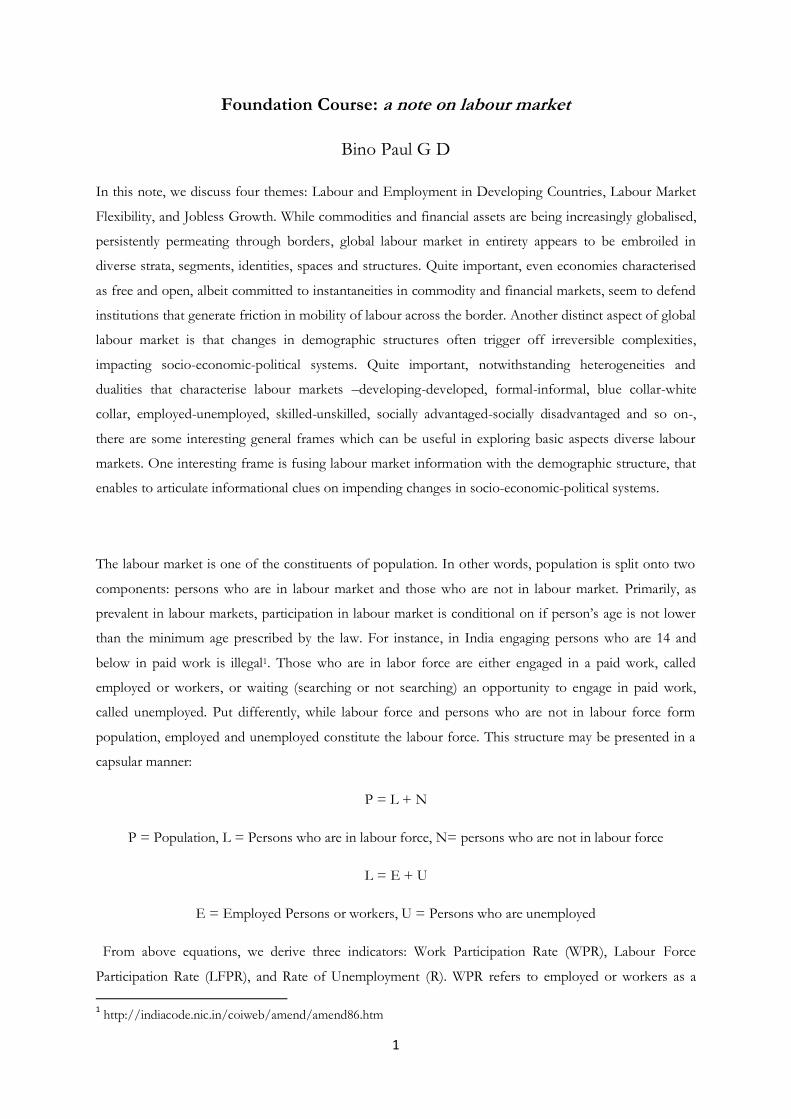
1 Foundation Course: a note on labour market Bino Paul G D In this note, we discuss four themes: Labour and Employment in Developing Countries, Labour Market Flexibility, and Jobless Growth. While commodities and financial assets are being increasingly globalised, persistently permeating through borders, global labour market in entirety appears to be embroiled in diverse strata, segments, identities, spaces and structures. Quite important, even economies characterised as free and open, albeit committed to instantaneities in commodity and financial markets, seem to defend institutions that generate friction in mobility of labour across the border. Another distinct aspect of global labour market is that changes in demographic structures often trigger off irreversible complexities, impacting socio-economic-political systems. Quite important, notwithstanding heterogeneities and dualities that characterise labour markets –developing-developed, formal-informal, blue collar-white collar, employed-unemployed, skilled-unskilled, socially advantaged-socially disadvantaged and so on-, there are some interesting general frames which can be useful in exploring basic aspects diverse labour markets. One interesting frame is fusing labour market information with the demographic structure, that enables to articulate informational clues on impending changes in socio-economic-political systems. The labour market is one of the constituents of population. In other words, population is split onto two components: persons who are in labour market and those who are not in labour market. Primarily, as prevalent in labour markets, participation in labour market is conditional on if person’s age is not lower than the minimum age prescribed by the law. For instance, in India engaging persons who are 14 and below in paid work is illegal 1 . Those who are in labor force are either engaged in a paid work, called employed or workers, or waiting (searching or not searching) an opportunity to engage in paid work, called unemployed. Put differently, while labour force and persons who are not in labour force form population, employed and unemployed constitute the labour force. This structure may be presented in a capsular manner: P = L + N P = Population, L = Persons who are in labour force, N= persons who are not in labour force L = E + U E = Employed Persons or workers, U = Persons who are unemployed From above equations, we derive three indicators: Work Participation Rate (WPR), Labour Force Participation Rate (LFPR), and Rate of Unemployment (R). WPR refers to employed or workers as a 1 http://indiacode.nic.in/coiweb/amend/amend86.htm
Transcript of Foundation Course: a note on labour market
1
Foundation Course: a note on labour market
Bino Paul G D
In this note, we discuss four themes: Labour and Employment in Developing Countries, Labour Market
Flexibility, and Jobless Growth. While commodities and financial assets are being increasingly globalised,
persistently permeating through borders, global labour market in entirety appears to be embroiled in
diverse strata, segments, identities, spaces and structures. Quite important, even economies characterised
as free and open, albeit committed to instantaneities in commodity and financial markets, seem to defend
institutions that generate friction in mobility of labour across the border. Another distinct aspect of global
labour market is that changes in demographic structures often trigger off irreversible complexities,
impacting socio-economic-political systems. Quite important, notwithstanding heterogeneities and
dualities that characterise labour markets –developing-developed, formal-informal, blue collar-white
collar, employed-unemployed, skilled-unskilled, socially advantaged-socially disadvantaged and so on-,
there are some interesting general frames which can be useful in exploring basic aspects diverse labour
markets. One interesting frame is fusing labour market information with the demographic structure, that
enables to articulate informational clues on impending changes in socio-economic-political systems.
The labour market is one of the constituents of population. In other words, population is split onto two
components: persons who are in labour market and those who are not in labour market. Primarily, as
prevalent in labour markets, participation in labour market is conditional on if person’s age is not lower
than the minimum age prescribed by the law. For instance, in India engaging persons who are 14 and
below in paid work is illegal1. Those who are in labor force are either engaged in a paid work, called
employed or workers, or waiting (searching or not searching) an opportunity to engage in paid work,
called unemployed. Put differently, while labour force and persons who are not in labour force form
population, employed and unemployed constitute the labour force. This structure may be presented in a
capsular manner:
P = L + N
P = Population, L = Persons who are in labour force, N= persons who are not in labour force
L = E + U
E = Employed Persons or workers, U = Persons who are unemployed
From above equations, we derive three indicators: Work Participation Rate (WPR), Labour Force
Participation Rate (LFPR), and Rate of Unemployment (R). WPR refers to employed or workers as a
1 http://indiacode.nic.in/coiweb/amend/amend86.htm
2
proportion of total population2. Another variant of WPR, defined by International Labour Organisation
(ILO), is employment-to-population ratio. LFPR is the ratio of labour force to population. R may be
defined as unemployed as a proportion of labour force.
WPR =
LFPR =
R =
Further, E is classified into three categories: self employed (S), regular wage-salaried employees
(R), and casual work (C)3. Drawing cues from National Sample Survey (NSS) of Ministry of
Statistics Programme and Implementation, S consists of own account worker, employer, and
working as a helper in household enterprises. R subsumes whole range of employment for which
workers are paid in regular intervals (for example monthly) for a continuous engagement in paid
work. On the other hand, workers who belong to category C are engaged in paid activities that
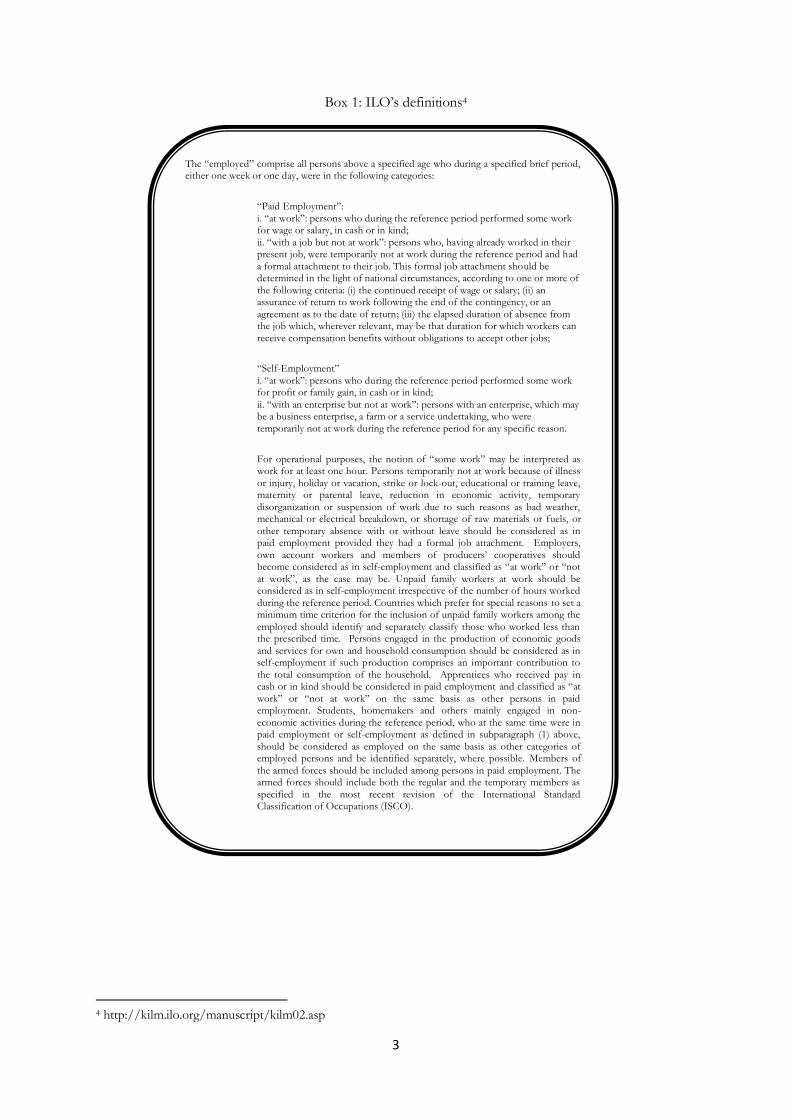
lack continuity. Box 1 presents International Labour Organisation’s (ILO) definitions of
employment.
2http://censusindia.gov.in/Metadata/Metada.htm 3 http://atlmri.org/index.php/downloads/doc_download/14-india-labour-market-report-2008
3
Box 1: ILO’s definitions4
4 http://kilm.ilo.org/manuscript/kilm02.asp
The “employed” comprise all persons above a specified age who during a specified brief period, either one week or one day, were in the following categories:
“Paid Employment”:
i. “at work”: persons who during the reference period performed some work for wage or salary, in cash or in kind;
ii. “with a job but not at work”: persons who, having already worked in their present job, were temporarily not at work during the reference period and had
a formal attachment to their job. This formal job attachment should be determined in the light of national circumstances, according to one or more of
the following criteria: (i) the continued receipt of wage or salary; (ii) an assurance of return to work following the end of the contingency, or an
agreement as to the date of return; (iii) the elapsed duration of absence from the job which, wherever relevant, may be that duration for which workers can
receive compensation benefits without obligations to accept other jobs;
“Self-Employment”
i. “at work”: persons who during the reference period performed some work for profit or family gain, in cash or in kind;
ii. “with an enterprise but not at work”: persons with an enterprise, which may be a business enterprise, a farm or a service undertaking, who were
temporarily not at work during the reference period for any specific reason.
For operational purposes, the notion of “some work” may be interpreted as work for at least one hour. Persons temporarily not at work because of illness
or injury, holiday or vacation, strike or lock-out, educational or training leave, maternity or parental leave, reduction in economic activity, temporary
disorganization or suspension of work due to such reasons as bad weather, mechanical or electrical breakdown, or shortage of raw materials or fuels, or
other temporary absence with or without leave should be considered as in paid employment provided they had a formal job attachment. Employers,
own account workers and members of producers’ cooperatives should become considered as in self-employment and classified as “at work” or “not
at work”, as the case may be. Unpaid family workers at work should be considered as in self-employment irrespective of the number of hours worked
during the reference period. Countries which prefer for special reasons to set a minimum time criterion for the inclusion of unpaid family workers among the
employed should identify and separately classify those who worked less than the prescribed time. Persons engaged in the production of economic goods
and services for own and household consumption should be considered as in self-employment if such production comprises an important contribution to
the total consumption of the household. Apprentices who received pay in cash or in kind should be considered in paid employment and classified as “at
work” or “not at work” on the same basis as other persons in paid employment. Students, homemakers and others mainly engaged in non-
economic activities during the reference period, who at the same time were in paid employment or self-employment as defined in subparagraph (1) above,
should be considered as employed on the same basis as other categories of employed persons and be identified separately, where possible. Members of
the armed forces should be included among persons in paid employment. The armed forces should include both the regular and the temporary members as
specified in the most recent revision of the International Standard Classification of Occupations (ISCO).
4
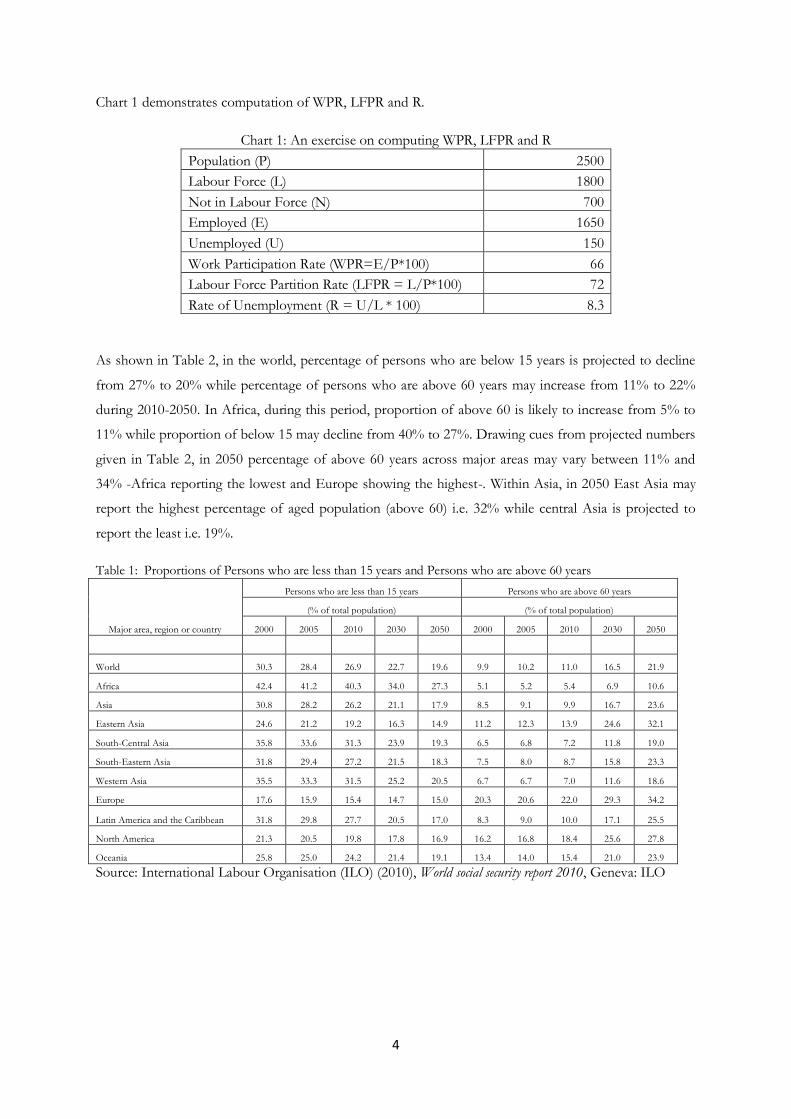
Chart 1 demonstrates computation of WPR, LFPR and R.
Chart 1: An exercise on computing WPR, LFPR and R
Population (P) 2500
Labour Force (L) 1800
Not in Labour Force (N) 700
Employed (E) 1650
Unemployed (U) 150
Work Participation Rate (WPR=E/P*100) 66
Labour Force Partition Rate (LFPR = L/P*100) 72
Rate of Unemployment (R = U/L * 100) 8.3
As shown in Table 2, in the world, percentage of persons who are below 15 years is projected to decline
from 27% to 20% while percentage of persons who are above 60 years may increase from 11% to 22%
during 2010-2050. In Africa, during this period, proportion of above 60 is likely to increase from 5% to
11% while proportion of below 15 may decline from 40% to 27%. Drawing cues from projected numbers
given in Table 2, in 2050 percentage of above 60 years across major areas may vary between 11% and
34% -Africa reporting the lowest and Europe showing the highest-. Within Asia, in 2050 East Asia may
report the highest percentage of aged population (above 60) i.e. 32% while central Asia is projected to
report the least i.e. 19%.
Table 1: Proportions of Persons who are less than 15 years and Persons who are above 60 years
Major area, region or country
Persons who are less than 15 years Persons who are above 60 years
(% of total population) (% of total population)
2000 2005 2010 2030 2050 2000 2005 2010 2030 2050
World 30.3 28.4 26.9 22.7 19.6 9.9 10.2 11.0 16.5 21.9
Africa 42.4 41.2 40.3 34.0 27.3 5.1 5.2 5.4 6.9 10.6
Asia 30.8 28.2 26.2 21.1 17.9 8.5 9.1 9.9 16.7 23.6
Eastern Asia 24.6 21.2 19.2 16.3 14.9 11.2 12.3 13.9 24.6 32.1
South-Central Asia 35.8 33.6 31.3 23.9 19.3 6.5 6.8 7.2 11.8 19.0
South-Eastern Asia 31.8 29.4 27.2 21.5 18.3 7.5 8.0 8.7 15.8 23.3
Western Asia 35.5 33.3 31.5 25.2 20.5 6.7 6.7 7.0 11.6 18.6
Europe 17.6 15.9 15.4 14.7 15.0 20.3 20.6 22.0 29.3 34.2
Latin America and the Caribbean 31.8 29.8 27.7 20.5 17.0 8.3 9.0 10.0 17.1 25.5
North America 21.3 20.5 19.8 17.8 16.9 16.2 16.8 18.4 25.6 27.8
Oceania 25.8 25.0 24.2 21.4 19.1 13.4 14.0 15.4 21.0 23.9
Source: International Labour Organisation (ILO) (2010), World social security report 2010, Geneva: ILO
5
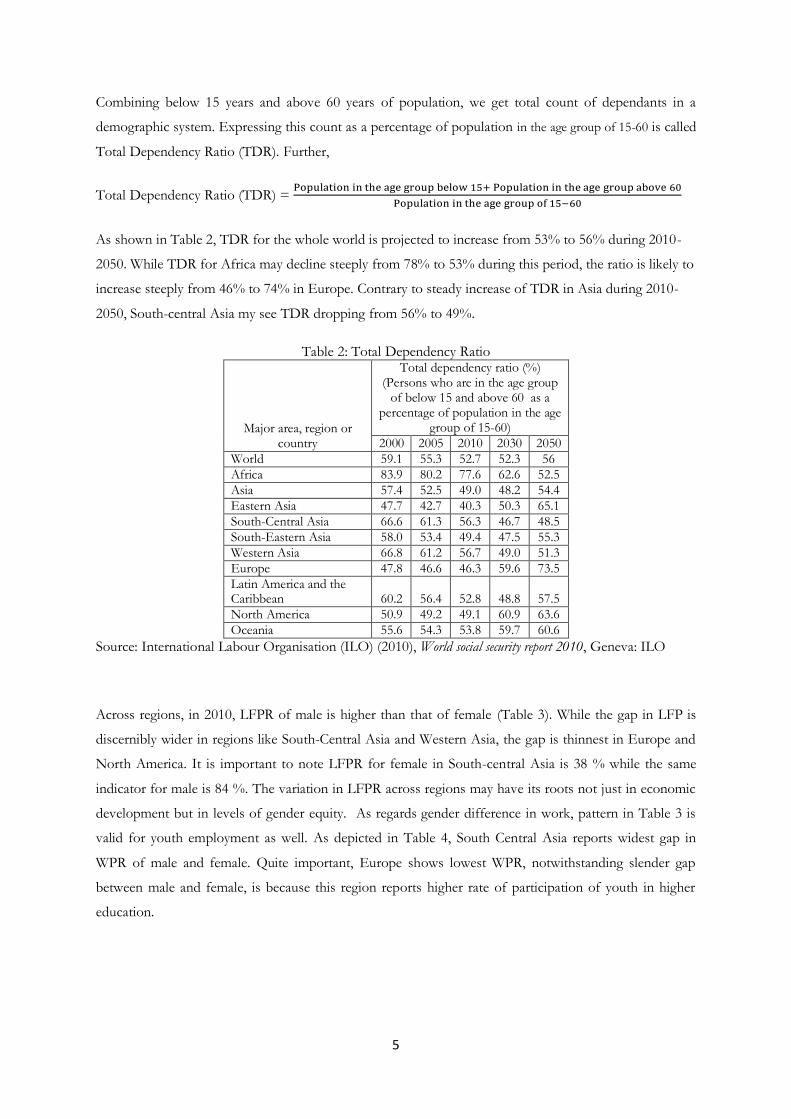
Combining below 15 years and above 60 years of population, we get total count of dependants in a
demographic system. Expressing this count as a percentage of population in the age group of 15-60 is called
Total Dependency Ratio (TDR). Further,
Total Dependency Ratio (TDR) =
As shown in Table 2, TDR for the whole world is projected to increase from 53% to 56% during 2010-
2050. While TDR for Africa may decline steeply from 78% to 53% during this period, the ratio is likely to
increase steeply from 46% to 74% in Europe. Contrary to steady increase of TDR in Asia during 2010-
2050, South-central Asia my see TDR dropping from 56% to 49%.
Table 2: Total Dependency Ratio
Major area, region or country
Total dependency ratio (%) (Persons who are in the age group
of below 15 and above 60 as a percentage of population in the age
group of 15-60)
2000 2005 2010 2030 2050
World 59.1 55.3 52.7 52.3 56
Africa 83.9 80.2 77.6 62.6 52.5
Asia 57.4 52.5 49.0 48.2 54.4
Eastern Asia 47.7 42.7 40.3 50.3 65.1
South-Central Asia 66.6 61.3 56.3 46.7 48.5
South-Eastern Asia 58.0 53.4 49.4 47.5 55.3
Western Asia 66.8 61.2 56.7 49.0 51.3
Europe 47.8 46.6 46.3 59.6 73.5
Latin America and the Caribbean 60.2 56.4 52.8 48.8 57.5
North America 50.9 49.2 49.1 60.9 63.6
Oceania 55.6 54.3 53.8 59.7 60.6
Source: International Labour Organisation (ILO) (2010), World social security report 2010, Geneva: ILO
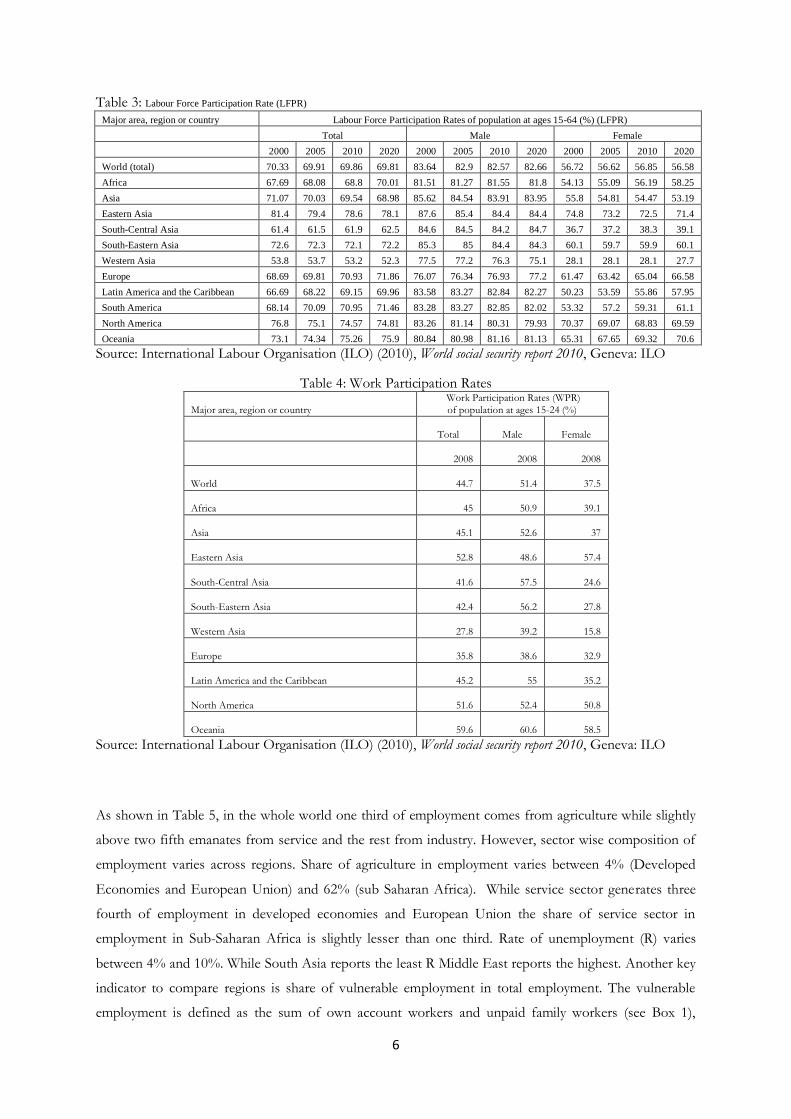
Across regions, in 2010, LFPR of male is higher than that of female (Table 3). While the gap in LFP is
discernibly wider in regions like South-Central Asia and Western Asia, the gap is thinnest in Europe and
North America. It is important to note LFPR for female in South-central Asia is 38 % while the same
indicator for male is 84 %. The variation in LFPR across regions may have its roots not just in economic
development but in levels of gender equity. As regards gender difference in work, pattern in Table 3 is
valid for youth employment as well. As depicted in Table 4, South Central Asia reports widest gap in
WPR of male and female. Quite important, Europe shows lowest WPR, notwithstanding slender gap
between male and female, is because this region reports higher rate of participation of youth in higher
education.
6
Table 3: Labour Force Participation Rate (LFPR) Major area, region or country Labour Force Participation Rates of population at ages 15-64 (%) (LFPR)
Total Male Female
2000 2005 2010 2020 2000 2005 2010 2020 2000 2005 2010 2020
World (total) 70.33 69.91 69.86 69.81 83.64 82.9 82.57 82.66 56.72 56.62 56.85 56.58
Africa 67.69 68.08 68.8 70.01 81.51 81.27 81.55 81.8 54.13 55.09 56.19 58.25
Asia 71.07 70.03 69.54 68.98 85.62 84.54 83.91 83.95 55.8 54.81 54.47 53.19
Eastern Asia 81.4 79.4 78.6 78.1 87.6 85.4 84.4 84.4 74.8 73.2 72.5 71.4
South-Central Asia 61.4 61.5 61.9 62.5 84.6 84.5 84.2 84.7 36.7 37.2 38.3 39.1
South-Eastern Asia 72.6 72.3 72.1 72.2 85.3 85 84.4 84.3 60.1 59.7 59.9 60.1
Western Asia 53.8 53.7 53.2 52.3 77.5 77.2 76.3 75.1 28.1 28.1 28.1 27.7
Europe 68.69 69.81 70.93 71.86 76.07 76.34 76.93 77.2 61.47 63.42 65.04 66.58
Latin America and the Caribbean 66.69 68.22 69.15 69.96 83.58 83.27 82.84 82.27 50.23 53.59 55.86 57.95
South America 68.14 70.09 70.95 71.46 83.28 83.27 82.85 82.02 53.32 57.2 59.31 61.1
North America 76.8 75.1 74.57 74.81 83.26 81.14 80.31 79.93 70.37 69.07 68.83 69.59
Oceania 73.1 74.34 75.26 75.9 80.84 80.98 81.16 81.13 65.31 67.65 69.32 70.6
Source: International Labour Organisation (ILO) (2010), World social security report 2010, Geneva: ILO
Table 4: Work Participation Rates
Major area, region or country
Work Participation Rates (WPR)
of population at ages 15-24 (%)
Total Male Female
2008 2008 2008
World 44.7 51.4 37.5
Africa 45 50.9 39.1
Asia 45.1 52.6 37
Eastern Asia 52.8 48.6 57.4
South-Central Asia 41.6 57.5 24.6
South-Eastern Asia 42.4 56.2 27.8
Western Asia 27.8 39.2 15.8
Europe 35.8 38.6 32.9
Latin America and the Caribbean 45.2 55 35.2
North America 51.6 52.4 50.8
Oceania 59.6 60.6 58.5
Source: International Labour Organisation (ILO) (2010), World social security report 2010, Geneva: ILO
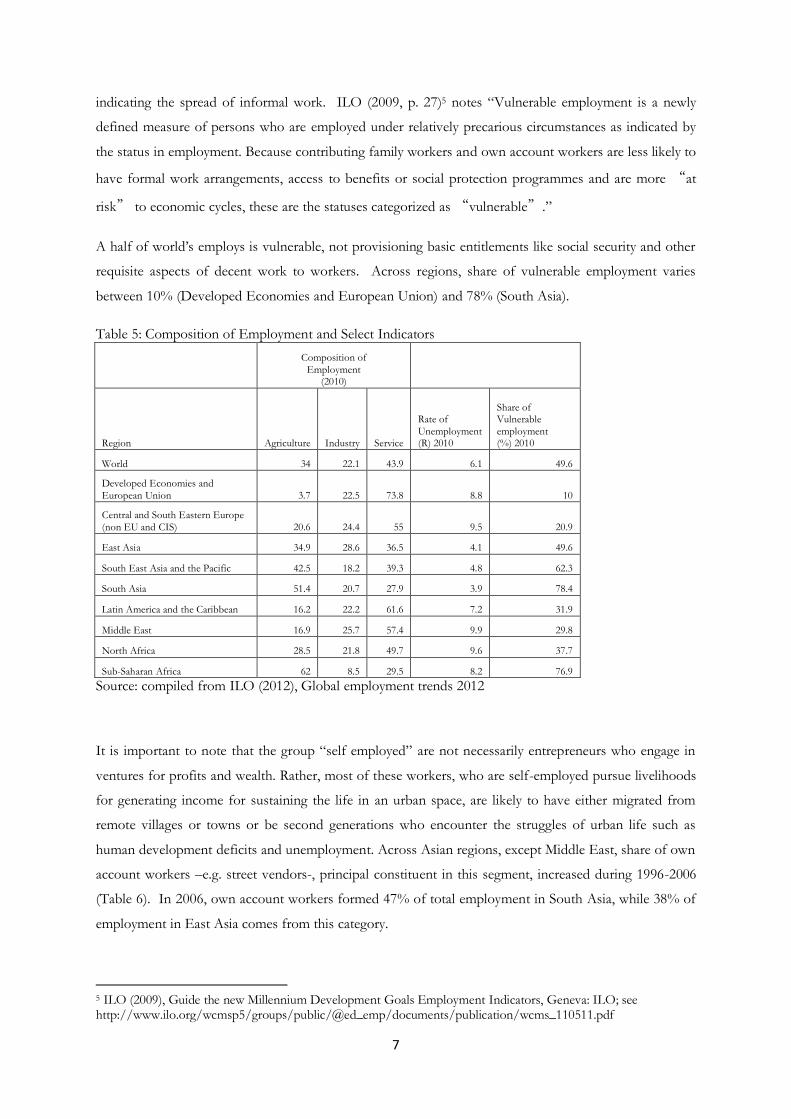
As shown in Table 5, in the whole world one third of employment comes from agriculture while slightly
above two fifth emanates from service and the rest from industry. However, sector wise composition of
employment varies across regions. Share of agriculture in employment varies between 4% (Developed
Economies and European Union) and 62% (sub Saharan Africa). While service sector generates three
fourth of employment in developed economies and European Union the share of service sector in
employment in Sub-Saharan Africa is slightly lesser than one third. Rate of unemployment (R) varies
between 4% and 10%. While South Asia reports the least R Middle East reports the highest. Another key
indicator to compare regions is share of vulnerable employment in total employment. The vulnerable
employment is defined as the sum of own account workers and unpaid family workers (see Box 1),
7
indicating the spread of informal work. ILO (2009, p. 27)5 notes “Vulnerable employment is a newly
defined measure of persons who are employed under relatively precarious circumstances as indicated by
the status in employment. Because contributing family workers and own account workers are less likely to
have formal work arrangements, access to benefits or social protection programmes and are more “at
risk” to economic cycles, these are the statuses categorized as “vulnerable”.”
A half of world’s employs is vulnerable, not provisioning basic entitlements like social security and other
requisite aspects of decent work to workers. Across regions, share of vulnerable employment varies
between 10% (Developed Economies and European Union) and 78% (South Asia).
Table 5: Composition of Employment and Select Indicators
Composition of
Employment (2010)
Region Agriculture Industry Service
Rate of
Unemployment (R) 2010
Share of Vulnerable
employment (%) 2010
World 34 22.1 43.9 6.1 49.6
Developed Economies and
European Union 3.7 22.5 73.8 8.8 10
Central and South Eastern Europe
(non EU and CIS) 20.6 24.4 55 9.5 20.9
East Asia 34.9 28.6 36.5 4.1 49.6
South East Asia and the Pacific 42.5 18.2 39.3 4.8 62.3
South Asia 51.4 20.7 27.9 3.9 78.4
Latin America and the Caribbean 16.2 22.2 61.6 7.2 31.9
Middle East 16.9 25.7 57.4 9.9 29.8
North Africa 28.5 21.8 49.7 9.6 37.7
Sub-Saharan Africa 62 8.5 29.5 8.2 76.9
Source: compiled from ILO (2012), Global employment trends 2012
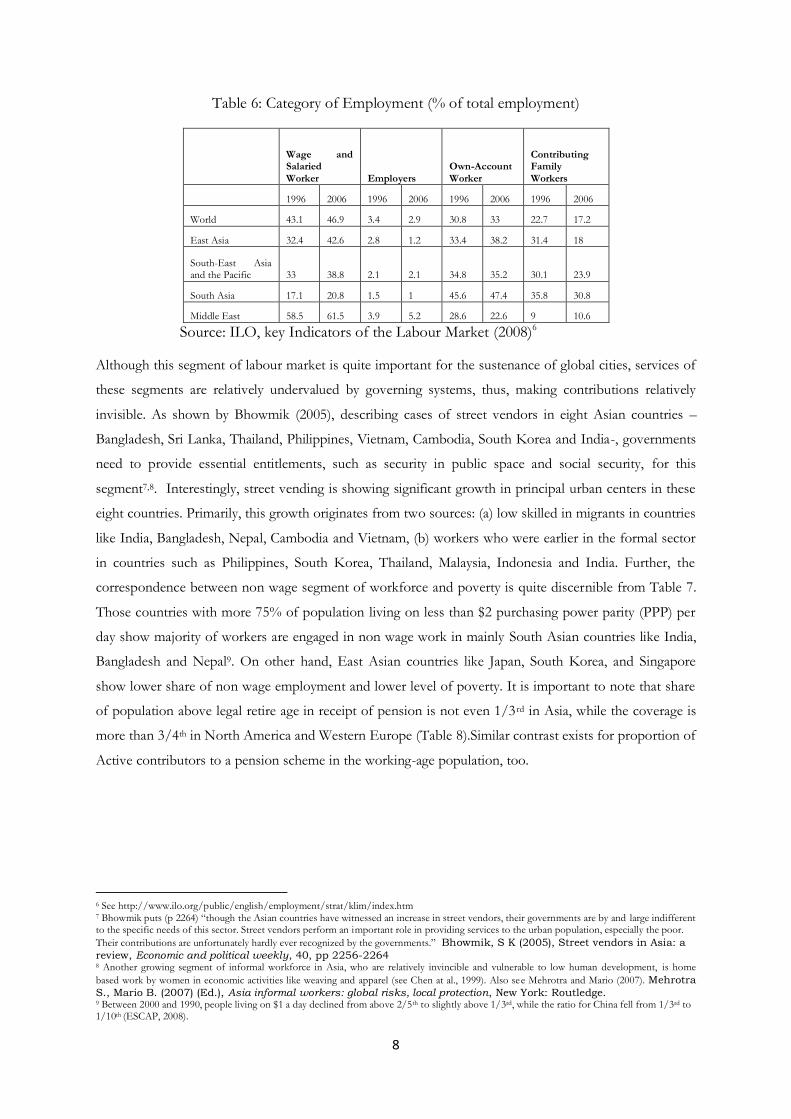
It is important to note that the group “self employed” are not necessarily entrepreneurs who engage in
ventures for profits and wealth. Rather, most of these workers, who are self-employed pursue livelihoods
for generating income for sustaining the life in an urban space, are likely to have either migrated from
remote villages or towns or be second generations who encounter the struggles of urban life such as
human development deficits and unemployment. Across Asian regions, except Middle East, share of own
account workers –e.g. street vendors-, principal constituent in this segment, increased during 1996-2006
(Table 6). In 2006, own account workers formed 47% of total employment in South Asia, while 38% of
employment in East Asia comes from this category.
5 ILO (2009), Guide the new Millennium Development Goals Employment Indicators, Geneva: ILO; see http://www.ilo.org/wcmsp5/groups/public/@ed_emp/documents/publication/wcms_110511.pdf
8
Table 6: Category of Employment (% of total employment)
Wage and Salaried
Worker Employers
Own-Account
Worker
Contributing Family
Workers
1996 2006 1996 2006 1996 2006 1996 2006
World 43.1 46.9 3.4 2.9 30.8 33 22.7 17.2
East Asia 32.4 42.6 2.8 1.2 33.4 38.2 31.4 18
South-East Asia and the Pacific 33 38.8 2.1 2.1 34.8 35.2 30.1 23.9
South Asia 17.1 20.8 1.5 1 45.6 47.4 35.8 30.8
Middle East 58.5 61.5 3.9 5.2 28.6 22.6 9 10.6
Source: ILO, key Indicators of the Labour Market (2008)6
Although this segment of labour market is quite important for the sustenance of global cities, services of
these segments are relatively undervalued by governing systems, thus, making contributions relatively
invisible. As shown by Bhowmik (2005), describing cases of street vendors in eight Asian countries –
Bangladesh, Sri Lanka, Thailand, Philippines, Vietnam, Cambodia, South Korea and India-, governments
need to provide essential entitlements, such as security in public space and social security, for this
segment7,8. Interestingly, street vending is showing significant growth in principal urban centers in these
eight countries. Primarily, this growth originates from two sources: (a) low skilled in migrants in countries
like India, Bangladesh, Nepal, Cambodia and Vietnam, (b) workers who were earlier in the formal sector
in countries such as Philippines, South Korea, Thailand, Malaysia, Indonesia and India. Further, the
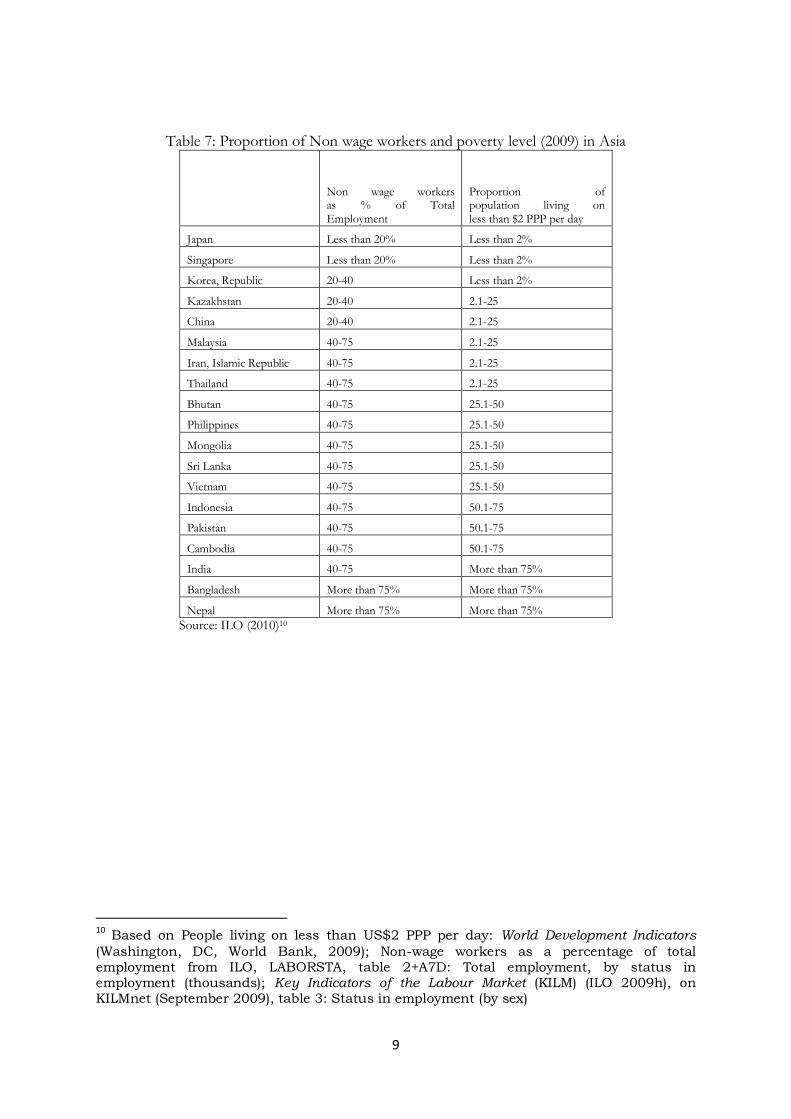
correspondence between non wage segment of workforce and poverty is quite discernible from Table 7.
Those countries with more 75% of population living on less than $2 purchasing power parity (PPP) per
day show majority of workers are engaged in non wage work in mainly South Asian countries like India,
Bangladesh and Nepal9. On other hand, East Asian countries like Japan, South Korea, and Singapore
show lower share of non wage employment and lower level of poverty. It is important to note that share
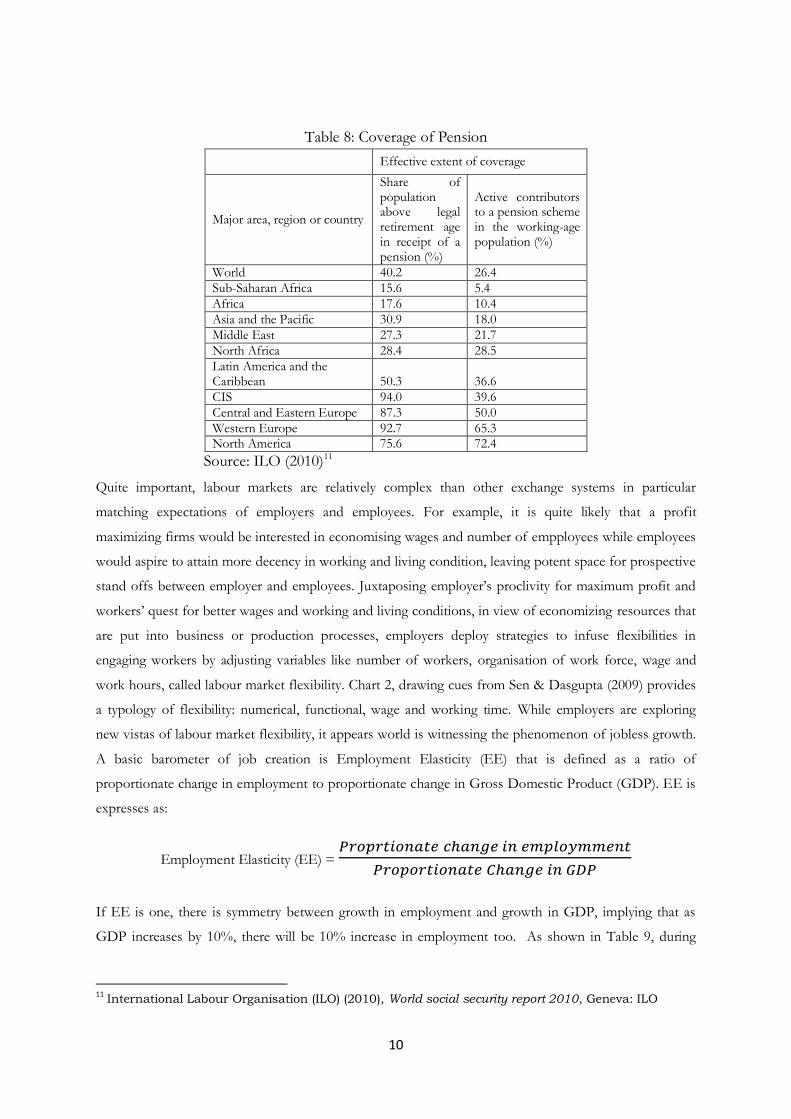
of population above legal retire age in receipt of pension is not even 1/3rd in Asia, while the coverage is
more than 3/4th in North America and Western Europe (Table 8).Similar contrast exists for proportion of
Active contributors to a pension scheme in the working-age population, too.
6 See http://www.ilo.org/public/english/employment/strat/klim/index.htm 7 Bhowmik puts (p 2264) “though the Asian countries have witnessed an increase in street vendors, their governments are by and large indifferent to the specific needs of this sector. Street vendors perform an important role in providing services to the urban population, especially the poor.
Their contributions are unfortunately hardly ever recognized by the governments.” Bhowmik, S K (2005), Street vendors in Asia: a
review, Economic and political weekly, 40, pp 2256-2264 8 Another growing segment of informal workforce in Asia, who are relatively invincible and vulnerable to low human development, is home
based work by women in economic activities like weaving and apparel (see Chen at al., 1999). Also see Mehrotra and Mario (2007). Mehrotra
S., Mario B. (2007) (Ed.), Asia informal workers: global risks, local protection, New York: Routledge. 9 Between 2000 and 1990, people living on $1 a day declined from above 2/5th to slightly above 1/3rd, while the ratio for China fell from 1/3rd to 1/10th (ESCAP, 2008).
9
Table 7: Proportion of Non wage workers and poverty level (2009) in Asia
Non wage workers as % of Total Employment
Proportion of population living on less than $2 PPP per day
Japan Less than 20% Less than 2%
Singapore Less than 20% Less than 2%
Korea, Republic 20-40 Less than 2%
Kazakhstan 20-40 2.1-25
China 20-40 2.1-25
Malaysia 40-75 2.1-25
Iran, Islamic Republic 40-75 2.1-25
Thailand 40-75 2.1-25
Bhutan 40-75 25.1-50
Philippines 40-75 25.1-50
Mongolia 40-75 25.1-50
Sri Lanka 40-75 25.1-50
Vietnam 40-75 25.1-50
Indonesia 40-75 50.1-75
Pakistan 40-75 50.1-75
Cambodia 40-75 50.1-75
India 40-75 More than 75%
Bangladesh More than 75% More than 75%
Nepal More than 75% More than 75%
Source: ILO (2010)10
10 Based on People living on less than US$2 PPP per day: World Development Indicators
(Washington, DC, World Bank, 2009); Non-wage workers as a percentage of total employment from ILO, LABORSTA, table 2+A7D: Total employment, by status in employment (thousands); Key Indicators of the Labour Market (KILM) (ILO 2009h), on KILMnet (September 2009), table 3: Status in employment (by sex)
10
Table 8: Coverage of Pension
Effective extent of coverage
Major area, region or country
Share of population above legal retirement age in receipt of a pension (%)
Active contributors to a pension scheme in the working-age population (%)
World 40.2 26.4
Sub-Saharan Africa 15.6 5.4
Africa 17.6 10.4
Asia and the Pacific 30.9 18.0
Middle East 27.3 21.7
North Africa 28.4 28.5
Latin America and the Caribbean 50.3 36.6
CIS 94.0 39.6
Central and Eastern Europe 87.3 50.0
Western Europe 92.7 65.3 North America 75.6 72.4
Source: ILO (2010)11
Quite important, labour markets are relatively complex than other exchange systems in particular
matching expectations of employers and employees. For example, it is quite likely that a profit
maximizing firms would be interested in economising wages and number of empployees while employees
would aspire to attain more decency in working and living condition, leaving potent space for prospective
stand offs between employer and employees. Juxtaposing employer’s proclivity for maximum profit and
workers’ quest for better wages and working and living conditions, in view of economizing resources that
are put into business or production processes, employers deploy strategies to infuse flexibilities in
engaging workers by adjusting variables like number of workers, organisation of work force, wage and
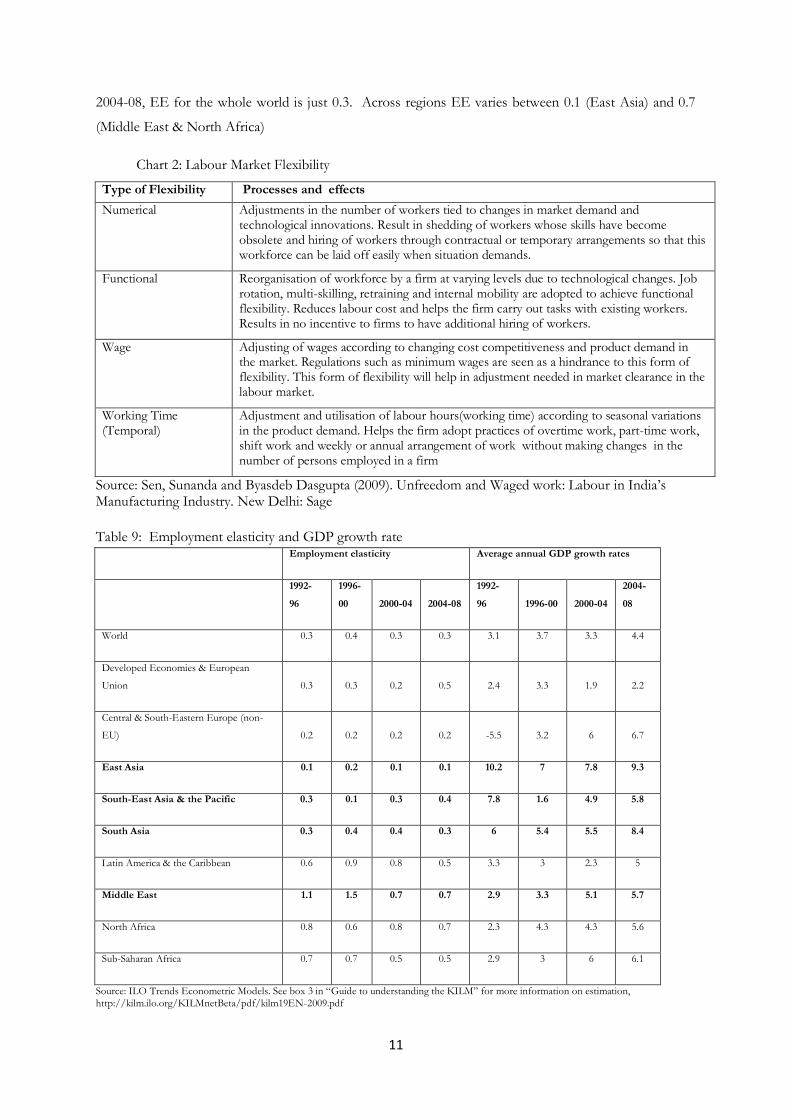
work hours, called labour market flexibility. Chart 2, drawing cues from Sen & Dasgupta (2009) provides
a typology of flexibility: numerical, functional, wage and working time. While employers are exploring
new vistas of labour market flexibility, it appears world is witnessing the phenomenon of jobless growth.
A basic barometer of job creation is Employment Elasticity (EE) that is defined as a ratio of
proportionate change in employment to proportionate change in Gross Domestic Product (GDP). EE is
expresses as:
Employment Elasticity (EE) =
If EE is one, there is symmetry between growth in employment and growth in GDP, implying that as
GDP increases by 10%, there will be 10% increase in employment too. As shown in Table 9, during
11 International Labour Organisation (ILO) (2010), World social security report 2010, Geneva: ILO
11
2004-08, EE for the whole world is just 0.3. Across regions EE varies between 0.1 (East Asia) and 0.7
(Middle East & North Africa)
Chart 2: Labour Market Flexibility
Type of Flexibility Processes and effects
Numerical Adjustments in the number of workers tied to changes in market demand and technological innovations. Result in shedding of workers whose skills have become obsolete and hiring of workers through contractual or temporary arrangements so that this workforce can be laid off easily when situation demands.
Functional Reorganisation of workforce by a firm at varying levels due to technological changes. Job rotation, multi-skilling, retraining and internal mobility are adopted to achieve functional flexibility. Reduces labour cost and helps the firm carry out tasks with existing workers. Results in no incentive to firms to have additional hiring of workers.
Wage Adjusting of wages according to changing cost competitiveness and product demand in the market. Regulations such as minimum wages are seen as a hindrance to this form of flexibility. This form of flexibility will help in adjustment needed in market clearance in the labour market.
Working Time (Temporal)
Adjustment and utilisation of labour hours(working time) according to seasonal variations in the product demand. Helps the firm adopt practices of overtime work, part-time work, shift work and weekly or annual arrangement of work without making changes in the number of persons employed in a firm
Source: Sen, Sunanda and Byasdeb Dasgupta (2009). Unfreedom and Waged work: Labour in India’s Manufacturing Industry. New Delhi: Sage
Table 9: Employment elasticity and GDP growth rate Employment elasticity Average annual GDP growth rates
1992-
96
1996-
00 2000-04 2004-08
1992-
96 1996-00 2000-04
2004-
08
World 0.3 0.4 0.3 0.3 3.1 3.7 3.3 4.4
Developed Economies & European
Union 0.3 0.3 0.2 0.5 2.4 3.3 1.9 2.2
Central & South-Eastern Europe (non-
EU) 0.2 0.2 0.2 0.2 -5.5 3.2 6 6.7
East Asia 0.1 0.2 0.1 0.1 10.2 7 7.8 9.3
South-East Asia & the Pacific 0.3 0.1 0.3 0.4 7.8 1.6 4.9 5.8
South Asia 0.3 0.4 0.4 0.3 6 5.4 5.5 8.4
Latin America & the Caribbean 0.6 0.9 0.8 0.5 3.3 3 2.3 5
Middle East 1.1 1.5 0.7 0.7 2.9 3.3 5.1 5.7
North Africa 0.8 0.6 0.8 0.7 2.3 4.3 4.3 5.6
Sub-Saharan Africa 0.7 0.7 0.5 0.5 2.9 3 6 6.1
Source: ILO Trends Econometric Models. See box 3 in “Guide to understanding the KILM” for more information on estimation,
http://kilm.ilo.org/KILMnetBeta/pdf/kilm19EN-2009.pdf