
FORMULATING A CHANGE STRATEGY - DiVA-Portal
76
FORMULATING A CHANGE STRATEGY How to introduce a tracking system in an organization VINCENT CASTELLANO SOFIA PALMBORG Master of Science Thesis Stockholm, Sweden 2015
-
Upload
khangminh22 -
Category
Documents
-
view
3 -
download
0
Transcript of FORMULATING A CHANGE STRATEGY - DiVA-Portal

FORMULATING A CHANGE STRATEGY How to introduce a tracking system in an organization
VINCENT CASTELLANO SOFIA PALMBORG
Master of Science Thesis
Stockholm, Sweden 2015

FORMULERING AV EN FÖRÄNDRINGSSTRATEGI
Hur ett spårningssystem kan införas i en organisation
VINCENT CASTELLANO SOFIA PALMBORG
Examensarbete Stockholm, Sverige 2015

FORMULATING A CHANGE STRATEGY How a tracking system can be introduced in an
organization
by
Vincent Castellano Sofia Palmborg
Master of Science Thesis INDEK 2015:66
KTH Industrial Engineering and Management
Industrial Management
SE-100 44 STOCKHOLM

FORMULERING AV EN FÖRÄNDRINGSSTRATEGI Hur ett spårningssystem kan införas i en organisation
av
Vincent Castellano Sofia Palmborg
Examensarbete INDEK 2015:66
KTH Industriell teknik och management
Industriell ekonomi och organisation
SE-100 44 STOCKHOLM

Master of Science Thesis INDEK 2015:66
FORMULATING A CHANGE STRATEGY How to introduce a tracking system in an
organization
Vincent Castellano
Sofia Palmborg
Approved
2015-06-10
Examiner
Pernilla Ulfvengren
Supervisor
Matti Kaulio
Commissioner
Carlsberg Sverige
Contact person
Henrik Pettersson
Abstract Carlsberg desires to increase the traceability of their goods and this can be achieved with a
tracking system. Therefore, this research aimed to create a model suitable to use when
formulating a change strategy to implement a new technology in an organization. This model was
then applied on Carlsberg to investigate how they should introduce a tracking system in their
distribution system. The research was conducted in two phases, where the first phase included to
create the suitable change model and to identify the current state in Carlsberg. This was achieved
by collecting data from literature, observations and interviews. In phase two the model was
applied to Carlsberg and thus, the change strategy to introduce a tracking system in Carlsberg
was formulated. In this phase, data collection methods were literature and interviews with
stakeholders and specialized consulting agencies in change management of IT systems. The
research resulted in a model based on three questions that must be answered to create a change
strategy; "What is the required change?", "How to build up the change process?" and "How will
the change be measured?”
In order to transform from the current state to the desired future, Carlsberg needs to introduce a
tracking system with associated informational support, in the form of a website. This introduction
results in changed work tasks and new features for truck drivers, administrative staff and
collaboration partners. To succeed with this change, it is crucial that the stakeholders are willing
to change. Carlsberg can increase the stakeholder’s willingness by a number of activities that
have been identified in this research. Risks with the introduction of the tracking system have been
identified and since this is a new system, start-up problems are likely to occur. These can be
minimized through testing the system with a small group of truck drivers. Also, the introduction
to the entire organization should then be done in one cross-dock at the time, partly to minimize
the risk but also to be able to focus the resources. During and after the tracking system has been
introduced in the organization, the change process needs to be measured in order to demonstrate
that the desired improvements are met. Short-term measurements aim to motivate stakeholders
for further implementation efforts and long-term measurements to consolidate the change in the
organization.
Keywords: Tracking System, Sociotechnical System and Change Management.

Examensarbete INDEK 2015:66
FORMULERING AV EN FÖRÄNDRINGSSTRATEGI
Hur ett spårningssystem kan införas i en organisation
Vincent Castellano
Sofia Palmborg
Godkänt
2015-06-10
Examinator
Pernilla Ulfvengren
Handledare
Matti Kaulio
Uppdragsgivare
Carlsberg Sverige
Kontaktperson
Henrik Pettersson
Sammanfattning Carlsberg vill öka spårbarheten på sina varor och detta kan uppnås med ett spårningssystem.
Denna forskning har därför syftat till att skapa en modell lämplig för att använda vid
utformningen av en förändringsstrategi ämnad till att införa en ny teknik i en organisation.
Modell applicerades sedan på Carlsberg för att undersöka hur de ska införa ett spårningssystem i
sitt distributionssystem. Forskningen genomfördes i två faser, där den första fasen inkluderade att
skapa en lämplig modell för förändringsarbete och analysera den nuvarande situationen i
Carlsberg. Detta uppnåddes genom att samla in information från litteratur, observationer och
intervjuer. I fas två applicerades denna modell på Carlsberg och därmed formulerades
förändringsstrategi för att införa ett spårningssystem i organisationen. I denna fas var metoder för
datainsamling litteratur samt intervjuer med intressenter och specialiserade konsultbyråer i
förändringsarbete av IT-system. Forskningen resulterade i en modell som bygger på tre frågor
som måste besvaras för att skapa en förändringsstrategi; "Vilken förändring krävs?", "Hur ska
förändringsprocessen utformas?" och "Hur kan förändringen mätas?"
För att transformeras från det nuvarande läget till den önskade framtiden måste Carlsberg införa
ett spårningssystem med tillhörande informationsstöd, i form av en hemsida. Införandet leder till
förändrade arbetsuppgifter och nya funktioner för lastbilsförare, administrativ personal och
samarbetspartners. För att lyckas med denna förändring, är det viktigt att de berörda parterna är
villiga att förändras. Carlsberg kan öka intressenternas vilja genom en rad aktiviteter som har
identifierats i denna forskning. Även risker med införandet av spårningssystemet har identifierats
och eftersom detta är ett nytt system, kan uppstartsproblem förekomma. Dessa kan minimeras
genom testning av systemet med en liten grupp av lastbilsförare. Dessutom bör införandet till
hela organisationen sedan ske i en distributionslokal åt gången, dels för att minimera risken men
också för att kunna fokusera resurserna. Under och efter spårningssystemet har införts i
organisationen, behöver förändringsarbetet mätas för att visa att de önskade förbättringarna är
uppfyllda. Kortsiktiga mätvärden syftar till att motivera intressenter för ytterligare
förändringsarbete och långsiktiga mätvärden att befästa förändringen i organisationen.
Nyckelord: Spårningssystem, Sociotekniskt System och Förändringsledning.

Acknowledgements We want to thank everyone who have made this research possible and helped us during this
journey.
Firstly, we want to thank Carlsberg for a warm welcome and access to both equipment and
information. Especially Henrik Pettersson, our supervisor at Carlsberg, for his support and help
with important contacts for the research.
At the Royal Institute of Technology, we would like to thank our supervisor Matti Kaulio for his
support and help with structure for the thesis. Also, we would like to thank Pernilla Ulfvengren
who, together with Matti Kaulio, has led rewarding seminars and given us feedback.
Finally, we want to thank all our interviewees for their time and thoughts. Without their
information, the research would not have been possible.
Vincent Castellano & Sofia Palmborg
Stockholm, 2015-06-10

Table of Contents Part 1: Building the Foundation
1. Introduction .............................................................................................................................. 2
1.1 Background ............................................................................................................................ 2
1.2 Problem Formulation .............................................................................................................. 3
1.3 Objective and Research Question .......................................................................................... 3
1.4 Delimitations .......................................................................................................................... 4
1.5 Outline .................................................................................................................................... 4
2. Theoretical Framework ............................................................................................................ 6
2.1 Tracking Systems ................................................................................................................... 6
2.2 The Sociotechnical System .................................................................................................... 7
2.3 Change Management .............................................................................................................. 7
2.4 The Change Model ............................................................................................................... 12
3. Methodology .......................................................................................................................... 16
3.1 Research Design ................................................................................................................... 16
3.2 Data Collection ..................................................................................................................... 17
3.3 Data Analysis ....................................................................................................................... 20
3.4 Quality of Research .............................................................................................................. 21
Part 2: Formulating the Change Strategy
4. What is the required change? ................................................................................................. 24
4.1 The Current State ................................................................................................................. 24
4.2 The Future State ................................................................................................................... 26
4.3 The Required Change ........................................................................................................... 26
5. How to build up the change process? ..................................................................................... 28
5.1 Stakeholder Management ..................................................................................................... 28
5.2 Risk Assessment ................................................................................................................... 37
5.3 Resources and Budgeting ..................................................................................................... 38
5.4 The Change Process ............................................................................................................. 39
6. How will the change be measured? ........................................................................................ 42
Part 3: Discussion and Conclusion
7. Discussion .............................................................................................................................. 45
7.1 Reflections on Research Question 1 ..................................................................................... 45
7.2 Reflections on Research Question 2 ..................................................................................... 47
7.3 Reflections on Research Question 3 ..................................................................................... 48

7.4 Reflections on Research Question 4 ................................................................................... 499
7.5 Reflections on methods and limitations ............................................................................... 49
7.6 Reflections on ethics and sustainability ............................................................................... 50
8. Conclusion .............................................................................................................................. 51
8.1 The Change Model ............................................................................................................... 51
8.2 The Change Strategy for Carlsberg ...................................................................................... 52
8.3 General Learnings ................................................................................................................ 54
8.4 Future Research .................................................................................................................... 55
List of Figures Figure 1. Carlsberg’s distribution system for Sales of Distribution. Source: Jonas Kudermann,
Carlsberg (modified) ........................................................................................................................ 3 Figure 2. An example of a force-field analysis (Carman, 2013). ................................................... 11
Figure 3. The model for formulating the change strategy. ............................................................. 13 Figure 4. The case studies in this research. ................................................................................... 16
Figure 5. The research process for this research. .......................................................................... 17 Figure 6. The conducted observational studies for this research. ................................................. 20 Figure 7. The data analysis method of this research. ..................................................................... 21
Figure 8. The current sociotechnical system for Carlsberg Sweden. ............................................. 24 Figure 9. The new sociotechnical system for Carlsberg Sweden. .................................................. 26
Figure 10. The force-field analysis for the SoD partners. .............................................................. 29 Figure 11. The force-field analysis for administration. ................................................................. 31
Figure 12. The force-field analysis for the sponsors. ..................................................................... 32 Figure 13. The force-field analysis for the truck drivers. ............................................................... 33
Figure 14. The risks identified in the project. ................................................................................ 37 Figure 15. The change strategy. ..................................................................................................... 51
List of Tables Table 1. A comparison between the change management models ETHICS and Eight Stage
Process. ............................................................................................................................................ 9 Table 2. Five methods for managing resistance (Kotter & Schlesinger, 2008). ............................ 12 Table 3. The number of conducted interviews with stakeholders in this research. ........................ 18
Table 4. The conducted interviews with management consultants in this research....................... 19
Table 5. Stakeholder’s willingness to change ................................................................................ 28
Table 6. Actions to reduce the most critical risks in the project. ................................................... 38 Table 7. The key roles identified in the project. ............................................................................. 39 Table 8. The preparation work of the change process. .................................................................. 40 Table 9. The introduction part of the change process. ................................................................... 40 Table 10. The KPIs that should be measured during and after the implementation. ..................... 42
Table 11. Actions to reduce the most critical risks in the project. ................................................. 53 Table 12. The key roles identified in the project. ........................................................................... 53 Table 13. The KPIs that should be measured during and after the implementation. ..................... 54

List of Abbreviations CSI Customer Satisfaction Index
HHT Handheld Terminal
KPI Key Performance Index
IT Information Technology
SoD Sales of Distribution
TS Tracking System
Nomenclature Change strategy Refers to the strategy for future organizational improvements. The
change strategy includes why the change is conducted, what the
change should result in and how the change should be managed as
well as measured.
Change process Refers to the process of actions in order to manage the change. The
change process is divided into the preparation work and the
introduction.
Preparation Work Refers to the first part of the change process. The actions included
here should be carried out before the introduction of the tracking
system.
Introduce/Introduction Refers to the actual entry of the tracking system in the organization.
This is when the new technology for the first time is presented for
the user and they have the ability to interact with it.
Implementation Refers to the execution of the change strategy and includes, but is
not limited to, the execution of the change process. In the
implementation, the change strategy is followed in order to meet
the desired result.
Stakeholders Refers to the groups of individuals which are directly affected of
the introduction of the tracking system.

1
Part 1: Building the Foundation
This part of the report presents the introduction, methodology and theoretical framework of this
research. Thus, it builds the foundation of the research and makes it possible for the reader to
understand how the analysis has been conducted.

2
1. Introduction This chapter aims to describe the background of the research, the company under investigation
as well as the problem that is investigated. After this, the aim and research questions are
presented and the delimitations stated. Lastly, the outline of the report is presented to get an
overview of the following chapters.
1.1 Background Traceability is the ability to track information about a product through all stages, from production
to the final customer. With the development of IT, new methods for tracking of goods have
developed. Today, a tracking system can be built on for example barcode or QR-code scanning,
RFID-tags and GPS transmitters. The main task of the technology is to track where the goods are,
what it contains as well as when and where it has been moved. Using a tracking system enables
fast access to relevant and reliable information. Results of this can be improved warehouse
management and a more effective distribution. It can also serve as a competitive edge for the
company (Bhatt et. al., 2013).
The humans working with distribution of goods interact with a tracking system. Such system can
be considered a sociotechnical system since it is a technical system that works alongside a social
system (Geels, 2002; Hughes, 1983; Emery & Trist, 1969). According to Hughes (1983), the
social and technical system needs to integrate and assist each other in order for the system to be
effective. The usage of a tracking system is thus not only dependent on the technical availability,
but the technology also needs to benefit the humans actually working with it (Leitch & Warren,
2010; Dolota, 2009; Mumford & Ward, 1968).
This research examines the case company Carlsberg, who wants to introduce a tracking system in
their organization. When introducing a new technology in an organization, change management
needs to be considered. Especially since many change initiatives does not reach the desired
results (Kotter, 2008; Todnem By, 2005). Change management is used to transform the
organization from the current state to the desired future state (Todnem By 2005; Mumford,
1999). Paton and McCalman (2008) argue that change management is never a choice between
technological, organizational or people-oriented solutions. Instead, the three aspects need to be
combined in a best fit, integrated strategy to produce results (Paton & McCalman, 2008).
1.1.2 Company Information The brewer J.C. Jacobsen founded Carlsberg in Copenhagen, Denmark 1847. Today, Carlsberg
Group is the leading brewery company in Europe and the fourth largest on the world market
(Carlsberg Group, 2015a). Their global portfolio includes over 500 brands (Carlsberg Group,
2013) and their main markets are Western and Eastern Europe as well as Asia (Carlsberg Group,
2015b). For Carlsberg, the customer is of greatest importance and they strive to have a customer
focused logistics in world class (Interviews, Carlsberg).
In Sweden, Carlsberg distributes their beverages on pallets that are transported from their
production site, with associated warehouse, in Falkenberg. The pallets are distributed to the
customer through strategically located cross-docks around Sweden. Currently, Carlsberg operates
14 cross-docks in Sweden. At the cross-docks, the pallets are sorted for the local distribution rout.
They are then distributed to customers, mainly different Systembolaget, grocery stores,
restaurants and bars, in smaller distribution trucks. However, Carlsberg does not only distribute

3
their own beverages, but they also conduct something called Sales of Distribution. In the Sales of
Distribution, they distribute beverages for the external companies Altia, KGA and Skanlog to the
customers (Interviews, Carlsberg). These are in the remainder of the report referred to as SoD
partners (Sales of Distribution partners). The chain of Carlsberg’s Sales of Distribution can be
seen in Figure 1.
Figure 1. Carlsberg’s distribution system for Sales of Distribution. Source: Jonas Kudermann, Carlsberg (modified)
The Sales of Distribution makes the distribution process more complex, since it includes several
parties. The beverages from the distribution partners also arrive to the cross-docks and are sorted
and distributed together with Carlsberg’s own beverages. However, delivering together also
results in important synergies as reduced delivery costs and fewer transports which also have a
positive environmental aspect (Interviews, Carlsberg).
1.2 Problem Formulation Carlsberg wants to improve the efficiency of their distribution system and gain a competitive
advantage on the market. This can be achieved by increasing the traceability of their goods and it
is therefore desirable for Carlsberg to introduce a tracking system for pallets in the organization.
However, Carlsberg have no set standard of how to manage the introduction of a new technology
in the organization. Therefore no standard can be followed when introducing a tracking system.
Also, Carlsberg have in the past experienced failure in organizational changes, partly because the
inter-functional view has not been considered and because follow-ups have been lacking. Lastly,
the many stakeholders in Carlsberg’s Sales of Distribution make the change strategy complex and
it is important for them to keep their customer focus when executing the change.
1.3 Objective and Research Question The objective of this research is to investigate how to formulate and apply a change model
aiming to introduce a new technology in an organization. This in order to provide the studied case
company with a change strategy that can be used when introducing a tracking system.
The objective will be reached by answering the following research questions:
1. Which factors are important to consider when introducing a new technology in an
organization and how can these be combined into a change model?
2. How should this change model be structured in order to introduce a tracking system in the
studied case company?
3. What can be learnt regarding introducing a new technology in an organization?
4. To what extent is the developed change strategy generalizable to other change projects?

4
1.4 Delimitations Carlsberg Group has about 47 000 employees and 100 breweries (Carlsberg Group, 2013), and
additionally many more warehouses and distribution organs around the globe. The size of the
organization results in complexity and since this research has a limited time scope; certain
delimitations have been made in order to fulfil the objective.
Firstly, this research only considers Carlsberg in Sweden. The change strategy is thereby firstly
suited for Sweden. Alternative countries that Carlsberg is working in may need special adoptions
to fit the local company business structure and culture.
Secondly, this research focuses on the first part of the change strategy, namely the preparation. It
is in this phase the change strategy is created. In the next two phases, the implementation and
consolidation, the change strategy is executed respectively consolidated into the organization.
The focus on preparation was chosen in order to finish the research within the time scope.
Thirdly, some generalizations and group formations has been made when analyzing stakeholders
and cross-docks in the sociotechnical system. This since it is not possible to consider each
stakeholder and cross-dock separately. Therefore, the profiles that have been created are assumed
to represent all individuals with a similar role or interface with the tracking system. Concerning
the cross-docks, it is assumed that they operate in similar ways dependent on the size of the unit.
The cross-docks have been separated into large and small cross-docks. One large unit in Årsta
and one small unit in Västerås have been analyzed in depth. Thus, not all cross-docks in Sweden
have been analyzed in this research.
The last delimitation is associated to the technology; the tracking system. It has been included in
the project towards Carlsberg to define the technology and formulate the requirement
specification that has been used to create the technology. However, in this thesis it is assumed
that the technology is ready for usage. Therefore, the development of the tracking system itself is
not considered in this research, instead the research focuses on formulating a plan for strategic
change. The actual outcome and results of the change is not included in the thesis since the
change has not yet been conducted.
1.5 Outline This report is divided into three main parts; “Building the Foundation”, “Formulating the Change
process” and “Conclusions and Discussion”.
The first part, “Building the Foundation”, consists of three chapters; the Introduction, the
Theoretical Framework and the Methodology. In the Introduction, the research is framed and this
chapter describes the background, problem, objective, research questions and delimitation of the
research. In the Theoretical framework, keywords are defined and current research in areas of
interest is described. This chapter outlines the theoretical foundation of the research and presents
the model that has been created and used as a basis to formulate the change strategy. Following
this, the Methodology of the research is presented and discussed. In this, the research process
gives the reader an overview of the approach of the research, while the data collection and
analysis gives a deeper understanding of the chosen methods. Lastly, it is reflected on how the
chosen methods have affected the quality of the research.
5
In the second part, “Formulating the Change Strategy”, empirical findings are analyzed and
discussed together with findings from literature. Throughout this part, a change strategy suitable
for a tracking system in Carlsberg is built up. Thus, the findings in this part of the report fulfill
the aim of this research.
The final part of this report, “Conclusions and Discussion” summarizes the main findings in this
research. Within this, contribution to knowledge and future research are discussed.
6
2. Theoretical Framework This chapter provides the reader with an overview of the investigated area of interest and the
theoretical foundation of the research. This is done by explaining the keywords Tracking System,
Sociotechnical System and Change Management. Current research, as well as justifications
regarding the importance of previous research for this research, is presented and models for
managing change are presented and discussed. These are then combined and developed into a
change model that will be further used in order to formulate the change strategy for Carlsberg.
2.1 Tracking Systems A tracking system can be used to obtain traceability of goods. Traceability is “the ability to track
forward the movement through specified stage(s) of the extended supply chain and trace
backward the history, application or location of that which is under consideration” (GS1, 2012).
The goal of traceability is to enable access to relevant and reliable information as rapidly as
possible. This information can then be assimilated and analyzed in order to make good decisions.
There are three basic building blocks that need to be considered in a comprehensive product
traceability solution (Bhatt et. al., 2013):
Premises identification - where is it?
Product identification - what is it?
Movement tracking - when and where did it move?
Signed papers were long the main way to confirm deliveries of goods. However, with the
development of IT, the standard for delivery confirmation has evolved. In the early 1970’s, a
barcode-standard called the UPC (Universal Product Code) was set in North America and in
1977, the standard EAN (European Article Number) was launched in Europe. The two standards
were in 2005 combined to GS1, the global traceability standard (GS1, 2015a). Today, barcodes
are commercially used for tracking goods. In order to use barcodes for the purpose of traceability,
the barcodes are scanned in different point of the delivery flow and this information is updated
and available in the system. Within the GS1 standard, there are several standardized barcodes.
One example is the SSCC (Serial Shipping Container Code) which is used in cargo tracking,
warehouse management and more efficient handling of transport (GS1, 2015b). The modern
version of the barcode is the QR-code which can store a larger amount of information than the
traditional barcode.
Another technology used to obtain traceability is the RFID-system, in which a small microchip is
attached on the package. Similar to the barcodes, the tags needs to be scanned at different points
in the delivery flow to see the packages movements. This means that the position of the package
is only readable at special points and that the movement in between the measurement points is
unreadable (Angulo et. al., 2013). If it is a requirement of constant tracking, a GPS transmitter
can be used. This technology enable a direct feed of the real position and thus gives a more
correct data, but is also more expensive.
It is in this research investigated how a tracking system based on barcode scanning can be used to
incorporate traceability in Carlsberg. This is the solution that Carlsberg has decided to use since
all of the pallets in the distribution system are already marked with SSCC barcodes of GS1
standard. To scan the barcodes, an existing hand terminal including a new IT solution is used.

7
2.2 The Sociotechnical System Emery and Trist (1969) introduced the concept of sociotechnical systems by studying enterprises
as a system. Their earliest analysis was conducted on the production systems in coal mining in
1948 and they analyzed whether the enterprises should be constructed as a ‘closed’ or ‘open’
system with respect to its external environment. In the closed system, the parts grow towards
maximum homogeneity and a steady state can only be achieved through cessation of all activity.
This view causes limitations of the system and therefore, the alternative concept of the open
system was considered. The open system may spontaneously reorganize towards a state of greater
complexity and the steady state can be achieved at a level where work can still be conducted. By
studying the open system, Emery and Trist (1969) found that the technological components of the
system play a key mediating role and the system can therefore not simply be referred to as a
social system. Instead, they referred to the open system as the socio-technical system (Emery &
Trist, 1969).
Hughes (1983) developed the theory of the sociotechnical system, by studying the development
of electrification in the western society between 1880 and 1930. He states that traditionally, a
technical system includes machinery, processes, procedures and physical arrangement while a
social system includes people and their habitual attributes, behavioral styles, values and
relationships. The sociotechnical system is a combination between the two and in order for a
sociotechnical system to be effective the social and technical system must integrate and assist
each other (Galvin & Sunikka-Blank, 2014; Hughes, 1983). Leitch and Warren (2010) argue that
if a technical system is created at the expense of a social system, the results obtained will be sub-
optimal.
The sociotechnical system is a network of human and non-human actors (Whilborg &
Söderholm, 2013). When mapping a sociotechnical system, a set of elements are linked together
and aligned to each other to illustrate their interaction. It is only when the sociotechnical system
is mapped and understood that there is possible to parse out the ethical issues and motivation
factors of the different actors (Geels, 2002). Some actors then appear to take on critical roles and
these are by Hughes identified as system builders (Whilborg & Söderholm, 2013).
The origin of the sociotechnical system is based on studies of machines together with human
beings in industrial workplaces settings, as for example coal mines (Emery & Trist, 1969). Even
though IT incorporation differs somewhat from this original production-based industrial setting,
it can still be considered a sociotechnical system. This since the technologies and artefacts play
an important role in fulfilling certain societal functions. The technology itself does nothing, but
only in the association with humans does it fulfill functions (Whilborg & Söderholm, 2013;
Geels, 2005).
2.3 Change Management Change management can be defined as “the process of renewing the organization’s direction,
structure and capabilities continuously to serve the ever-changing needs of internal and external
customers” (Moran & Brightman, 2001). With change management, the organization can be
transitioned from the current state to the desired future state (Todnem By, 2005; Mumford 1999).
It is suggested by Paton and McCalman (2008) that change management is a combined best fit,
integrated strategy between technological, organizational and people-oriented solutions.

8
The rate of change is higher today than ever before and the need for change management has
therefore increased (Moran & Brightman, 2001). The organization’s future survival, development
and strategic direction can be determined by successful change management (Wang & Sun,
2012). However, change initiatives are rarely successful and a common statement is that about 70
percent of all organizational change initiatives fails (e.g. Todnem By, 2005; Kotter, 2008).
Although it is argued that there is no existing support for this number because of a lack of
empirical evidence (Hughes, 2011), it is a fact that many change initiatives does not turn out the
desired way.
Changes in sociotechnical systems are continuous and complex processes (Whilborg &
Söderström, 2013). It can be described as the process of reweaving elements in the system, in
other words shifting assemblies of associations and substitutions. Change in one element in the
network can trigger change in other elements (Geels, 2002). Hughes (1983) derived the idea
about the seamless web, which means that the technology itself cannot reach a sustainable
development of a sociotechnical system. Instead, he suggests that the social, non-technical issues
need to be considered in an early stage in order for the transition to be successful. This theory
was later confirmed by Geels (2002) who defines technological transitions as “major, long-term
changes in the way societal functions are fulfilled” and states that technological transitions do not
only involve changes in technology but also in for example user practice, infrastructure and
symbolic meaning or culture. Often, new technologies mismatch the established socio-
institutional framework. Instead, users need to integrate new technologies in their practices,
organizations and routines. To do this, learning, adjustment and ‘domestication’ is necessary
(Geels, 2002).
Hughes (1983) underlines that it is hard to adapt a sociotechnical system to technical changes due
to the systems inertial, which he further develops to the momentum concept. Initially, a technical
system builds up a momentum due to investments in resources e.g. machinery and tools.
Furthermore, the non-physical components, such as organizations and supportive functions
contribute to add even more momentum to the system. Dolota (2009) suggests that it is essential
for the success of the new technology that the existing actors in the sociotechnical system are
flexible and eager to adopt the new requirements of the technology. The momentum properties in
the system need to be identified and handled in a proper way for the change to carry out.
2.3.1 Models for Managing Change Change management is a subject containing a lot of research and Geels (2002) states that “since
transitions are a complex and multi-faceted research topic, researchers are likely to disagree on
how to best investigate them”. Due to the various opinions regarding what factors influence
change the most, there are many different models for managing change. The specifics of these
models differ, but according to Wang and Sun (2012) most of them consists of three phases; the
preparation, the implementation and consolidation.
This research aims to formulate a change strategy for introducing a tracking system in Carlsberg.
Therefore, the focus lies upon the first phase of change strategy, the preparation, or the creation
of the change strategy, in which all three phases is planned. The result of the research is therefore
a change strategy that is designed to be used in the close future at Carlsberg to begin phase two;
implementation. The implementation corresponds to the actual execution of the change strategy.
9
The last phase; consolidation is carried out when the change have been executed and the change
is consolidated in the organization.
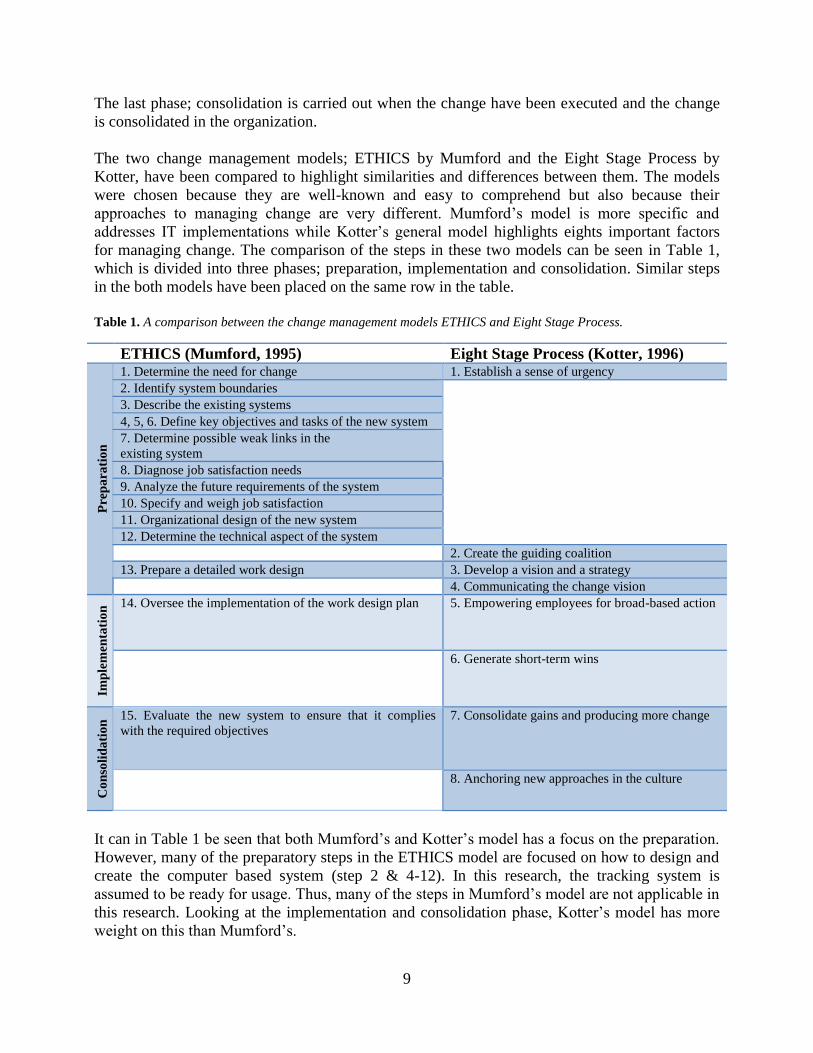
The two change management models; ETHICS by Mumford and the Eight Stage Process by
Kotter, have been compared to highlight similarities and differences between them. The models
were chosen because they are well-known and easy to comprehend but also because their
approaches to managing change are very different. Mumford’s model is more specific and
addresses IT implementations while Kotter’s general model highlights eights important factors
for managing change. The comparison of the steps in these two models can be seen in Table 1,
which is divided into three phases; preparation, implementation and consolidation. Similar steps
in the both models have been placed on the same row in the table.
Table 1. A comparison between the change management models ETHICS and Eight Stage Process.
ETHICS (Mumford, 1995) Eight Stage Process (Kotter, 1996)
Pre
pa
rati
on
1. Determine the need for change 1. Establish a sense of urgency
2. Identify system boundaries
3. Describe the existing systems
4, 5, 6. Define key objectives and tasks of the new system
7. Determine possible weak links in the
existing system
8. Diagnose job satisfaction needs
9. Analyze the future requirements of the system
10. Specify and weigh job satisfaction
11. Organizational design of the new system
12. Determine the technical aspect of the system
2. Create the guiding coalition
13. Prepare a detailed work design 3. Develop a vision and a strategy
4. Communicating the change vision
Imp
lem
enta
tio
n 14. Oversee the implementation of the work design plan 5. Empowering employees for broad-based action
6. Generate short-term wins
Co
nso
lid
ati
on
15. Evaluate the new system to ensure that it complies
with the required objectives
7. Consolidate gains and producing more change
8. Anchoring new approaches in the culture
It can in Table 1 be seen that both Mumford’s and Kotter’s model has a focus on the preparation.
However, many of the preparatory steps in the ETHICS model are focused on how to design and
create the computer based system (step 2 & 4-12). In this research, the tracking system is
assumed to be ready for usage. Thus, many of the steps in Mumford’s model are not applicable in
this research. Looking at the implementation and consolidation phase, Kotter’s model has more
weight on this than Mumford’s.

10
Mumford’s model is based on the conclusion that the development of information systems is an
organizational issue that is fundamentally concerned with the process of change rather than just a
pure technological issue. Mumford argues that the foundation of the implementation of a
computer based system is to understand the participants. Throughout the model, it is important to
involve the stakeholders in the development of the system in order to see their point of view and
engage them in the process. This since the technology needs to be accepted by the participants in
order for it to be successfully implemented (Mumford, 1995). To involve the stakeholders is
important also in Kotter’s eight stage process and he states that a successful change needs to
begin with a desire to change among employees (Kotter, 1996).
Shared between the two models is also the importance to determine the need for change by
understanding the problems in the current system (Mumford, step 1 & 3; Kotter, step 1).
Accompanying this, it is also important to analyze and present the vision of the future (Mumford,
step 9; Kotter, step 3). This vision should present the picture of the future in order to lead to a
general direction for change, motivate change and help coordinate action. The current state in
combination with the future makes it possible to understand what needs to be changed in order to
transform the organization. Based on this, it is possible to prepare a strategy or a work design
plan for the change (Mumford, step 13; Kotter, step 3). When all the needed actions have been
planned for, the change is implemented based on the decided strategy (Mumford, step 13; Kotter,
step 5 & 7).
According to Kotter (step 2), it is also important to have an effective team that leads the change,
and in this guiding coalition four major characteristics needs to be fulfilled; position power,
expertise, credibility and leadership. Kotter (step 4) also states the importance of communicating
and permeating the change vision in the affected organization. Another aspect that Kotter (step 6)
underlines is the importance of short-term wins to create credibility in a long change process. The
wins should be visible, unambiguous and clearly related to the change effort. Therefore, key
performance indicators should be identified and measured continuously throughout the change
process.
To consolidate the change, it needs to be evaluated and results needs to be shown (Mumford, step
15; Kotter, step 7-8). It needs to be evaluated that the system compiles with the required
objectives and this can be achieved by comparing the expected results with the actual outcome
(Mumford, step 15). This is similar to Kotter (step 7), in which the short-term wins are shown to
the organization in order to produce even more change (Kotter, 1996). Lastly, Kotter (step 8)
states that the new approaches needs to be anchored in the culture, of which there is no similar
step in Mumford’s model.
2.3.2 Stakeholder Management It has been concluded that the stakeholders are important to consider during change (e.g. Leitch
& Warren, 2010; Dolota, 2009; Kotter, 1996; Mumford, 1995; Mumford & Ward, 1968). The
central purpose of stakeholder management is to enable managers to understand stakeholders and
strategically manage them (Frooman, 1999). According to Fassin (2012), stakeholder
management can be seen from a strategic or a normative view. The aim from a strategic
perspective is to urge corporations to consider the impact that their actions and decisions will
have on the various stakeholders. Looking at the normative view, a firm should consider the
rights and expectations of its various stakeholders (Fassin, 2012). According to Frooman (1999),

11
it is important to take the needs and divergence of the various stakeholders into account in an
organization.
Individually, primary stakeholders may have influence within the firm and when grouped
together, their influence increases (Fassin, 2012). In order to understand which people or groups
that are the users of the system as well as their behaviors and their needs, different profiles can be
mapped out (Tang et. al., 2010). Jaquet-Chiffelle (2008) distinguishes between individual
profiling and group profiling. Individual profiling is when data from a single person is collected
to describe a single person. Group profile is when data is collected from a group of people who
share a common attribute. This data is then used to describe the group. An example of a common
attribute is different sorts of interfaces of a technical system, which results in different needs
(Custers, 2004). A group profile can be applied on an individual person whose data matches the
profile. This is called indirect individual profiling since the profile was generating using data
from other people. Indirect group profiling is based on the same principle but in this case the
group profile is applied on a group rather than on an individual. A direct group profiling on other
hand is when the generated profile is projected on the group which it was mined from (Jaquet-
Chiffelle, 2008).
This research is based on stakeholder management and the different usage and interface of the
tracking system is considered the common attribute in this research. People are sorted by
different roles and user interface in the sociotechnical system of the tracking system.
Stakeholders from each profile are consulted and direct group profiling will then be used to
project the data on each group of stakeholders.
2.3.3 Increasing Momentum According to both Kotter (1996) and Mumford (1995), it is important that the stakeholders are
willing to change in order for the change to be successful. Kotter (1996) states that in order to
empower employees for broad-based action, any barrier that prevents the implementation needs
to be removed (Kotter, 1996). This corresponds to the momentum concept that was discussed in
Chapter 2.3. Support in the organization adds momentum to the system and thereby ease the
change. The force-field analysis was developed by Kurt Lewin (1952) and the general idea of the
model is to identify forces for and against change in the current state. The driving forces must
outweigh the restraining forces for the change to happen (Cameron & Green, 2012) and an
example of the force-field analysis can be seen in Figure 2 (Carman, 2013).
Figure 2. An example of a force-field analysis (Carman, 2013).

12
In Figure 2, the planned change is represented as the transition from the current state in the
middle to the desired state to the right. The driving forces for change are presented to the left and
the restraining forces to the right. The use of two columns results in an easy overlook over the
affecting forces. By this, it is possible to understand the forces that maintain current behavior and
identify those that would have to be modified in order to motivate change. The field theory makes
it possible for individuals or groups themselves to map out and understand the forces affecting
them, in order to modify their own behavior (Burnes & Cooke, 2013).
When the forces have been identified, they are individually listed from one to five, where one is
weak force and five is a critical force that needs to be overseen. Also, it can be decided whether
any of the forces are possible to change, and if so, how. Progress can increase if an opposing
force can be reduced or/and if a driving force can be strengthened. The force field analysis will
target groups for an intervention and well carried out analysis will reveal opponents and allies,
which can then be handled with a corrective action (Werner & DeSimone, 2011). In order to
reduce resisting forces, countermeasures need to be taken against them. Kotter and Schlesinger
(2008) suggest methods for managing resistance, as seen in Table 2.
Table 2. Five methods for managing resistance (Kotter & Schlesinger, 2008).
Method How to Use When to Use Advantages Drawbacks
Education Communicate the
desired changes and
reasons for them
Employees lack
information about the
change’s implication
Once persuaded,
people often help to
implement the change
Time consuming if
lots of people are
involved
Participation Involve potential
resistors in designing
and implementing the
change
Change initiators lack
sufficient information
to design the change
People feel more
committed to making
the change happen
Time consuming, and
employees may
design inappropriate
change
Facilitation Provide skills, training
and emotional support
People are resisting
because they fear they
can’t make the needed
adjustments
No other approach
works as well with
adjustment problems
Can be time
consuming and
expensive, can still
fail
Negotiation Offer incentives for
making the change
People will lose out in
the change and have
considerable power to
resist
It’s a relatively easy
way to defuse major
resistance
Can be expensive and
open managers to the
possibility of
blackmail
Coercion Threaten loss of jobs or
promotion
opportunities; fire or
transfer those who
can’t or won’t change
Speed is essential and
change initiators
possess considerable
power
It works quickly and
can overcome any
kind of resistance
Can spark intense
resentment toward
change initiators
As seen in Table 2 there are five methods for managing resistance; education, participation,
facilitation, negotiation and coercion. Each of these methods is suitable to use in different
situation. The methods are considered when analyzing different types of resistances among the
stakeholders of the tracking system.
2.4 The Change Model It has been concluded that change management models can be divided into three phases;
preparation, implementation and consolidation (Wang & Sun, 2012). This research is focused
upon finalizing the first step; preparation, which represent the stage where the change strategy is
formed and planned. The implementation represents the actual introduction of the change in the
13
organization, in other words the execution of the change strategy. The final step of the change
strategy is the consolidation, where the change is consolidated in the organization.
By combining the change management models ETHICS by Mumford and Eight Stage Process by
Kotter, it has been concluded that it is important to identify the current and future state in order to
understand what the required change is. The change process is then built up by needed actions to
transform the organizations from the current to the future state. In this, it is the key to identify the
stakeholders and increase their willingness to change (Kotter, 1996; Mumford, 1995). However,
from the researches knowledge in project management it is known that also the risk assessment
and deciding resources and budgeting are needed to success with a change project. This needs to
be added to the models in order to make Kotter’s and Mumford’s model applicable to a change
project in which a new technology is introduced in an organization. In the risk assessment,
potential risks with the change needs to be identified to include actions to reduce the risks in the
change process. When all the needed actions are decided, resources and budgeting can be decided
(DeLayne Stroud, 2012). It is also important to measure short- and long-term results of the
change (Kotter, 1996).
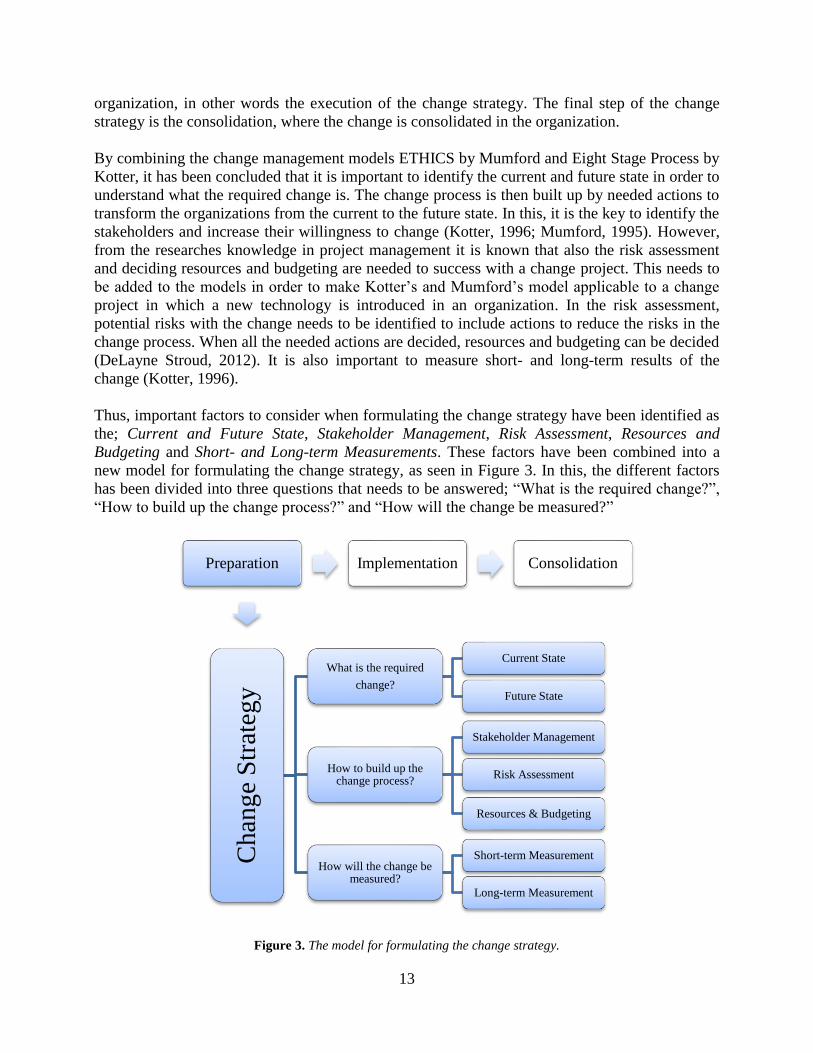
Thus, important factors to consider when formulating the change strategy have been identified as
the; Current and Future State, Stakeholder Management, Risk Assessment, Resources and
Budgeting and Short- and Long-term Measurements. These factors have been combined into a
new model for formulating the change strategy, as seen in Figure 3. In this, the different factors
has been divided into three questions that needs to be answered; “What is the required change?”,
“How to build up the change process?” and “How will the change be measured?”
Figure 3. The model for formulating the change strategy.
Preparation Implementation Consolidation
Ch
ang
e S
trat
egy
What is the required
change?
Current State
Future State
How to build up the change process?
Stakeholder Management
Risk Assessment
Resources & Budgeting
How will the change be measured?
Short-term Measurement
Long-term Measurement

14
As seen in Figure 3, the answer to the three stated questions builds up the change strategy. The
model is constructed so that the work should begin in the top left column and then worked down
through the different areas to formulate the change strategy. Following is a more detailed
explanation of what to consider in each step of the model.
The required change is understood by examining the current and desired future state. In this, the
current state is mapped and analyzed in order to understand the problems and underlying need for
change. The future state then presents the vision of the future. The combination of these makes it
possible to identify needed changes in existing processes, procedures, resources and
documentation to accomplish the desired future (DeLayne Stroud, 2012; Kotter 1996; Mumford,
1995).
After this the largest part, the change process, is built up by mapping stakeholders, resources,
risks and budgeting. Within this stage, a stakeholder analysis needs to be performed, in order to
understand how the different stakeholders are affected and foresee their willingness to change.
Their willingness to change needs to be high for the change to be successful. This is the most
critical point due to the need of collaboration from the beginning of the implementation
(DeLayne Stroud, 2012; Kotter, 1995; Mumford 1995). Since the stakeholders share common
attributes depending on their usage and interface of the tracking system, profiling can be used to
group them. The stakeholders can then be analyzed with a force-field analysis (Lewin, 1952) in
order to understand the driving and restraining forces affecting them. Actions to reduce the
restraining forces should be decided and executed before the implementation begins to ensure a
smooth implementation process (DeLayne Stroud, 2012). Methods for reducing resistance are
education, participation, facilitation, negotiation and coercion (Kotter & Schlesinger, 2008).
After the stakeholders have been mapped the risk assessment can be performed and in this the
potential risks with the change strategy are analyzed. The risks are found by brainstorming and
divergent thinking. After identifying the risks, they are scaled by both probability and impact
they would have on the project. Activities to mitigate the risks should then be identified and taken
before the implementation starts (DeLayne Stroud, 2012). When formulating the change strategy,
it should be decided who is responsible to take these actions and when to do them. Especially in
larger projects, resources and budgeting need to be stated. This needs to be noticed the sponsors,
so that the right resources and money can be assigned to the change project. This is done in
connection between the time and resources, thus a faster change process requires more resources.
The work plan can be used to assign every action with a responsible person as well as other
resources that are needed for the actions (DeLayne Stroud, 2012). This is why the resources &
budgeting is done last. The team that will lead the change, or the guiding coalition (Kotter, 1996)
need to be assigned. Also, the time needed for completion of the change should be estimated and
the budget for the change project formed.
Lastly, the change process needs to be measured in order to ensure that the desired results are
met. “You can't manage what you can't measure” (Drucker, 1998) means that it is not possible to
know if the implementation of the change was successful, if it is not defined what that implies.
That does not mean that everything should be measured, but some short- and long-term
measurements should be included in the change strategy. By doing this, it can be concluded when
specific targets are reached. To have clear measures is also important in order to motivate the
change. In this research, the short-term measurements are associated with the short-term wins in

15
the eight stage model (Kotter, 1996). Thus, the short-term measurements are aiming to motivate
further change and are therefore important to consider in the phase implementation. The long-
term measurements on the other hand are associated with the phase consolidation, since they aim
to show results that the technology work and thus consolidate the technology in the organization.

16
3. Methodology This chapter describes the methods used in this research. Firstly, an overview of the research
process is presented. After this, all the data collection methods of this process are explained in
depth. The data analysis methods are then presented and lastly the quality of the research is
discussed.
The theoretical framework presented in Chapter 2 is the foundation for this research and aims to
answer the first research question. Thus, a change model that can be used when introducing a
new technology in an organization has been identified. The most important factor is the
stakeholders in the system and they are therefore a large focus in the rest of the report (Whilborg
& Söderholm, 2013; Fassin, 2012; Dolota 2009; Frooman 1999; Kotter, 1996). However, it is
also important to investigate the risk assessment, the needed resources and budgeting and the
short- and long-term measurements. The remainder of the report aims to answer the remaining
research questions and thus fulfill the objective of the research.
3.1 Research Design A case can be an individual, a group, an institution or a community and it is possible to study
single cases or multiple cases (Gillham, 2010). Case studies are sometimes referred to as small
sample studies (Scapens, 1990). Eisenhardt (1989) describes a case study as a research strategy
that focuses on understanding the dynamics presented in a single setting. Case studies are suitable
to use when it is interesting to understand a phenomenon in a certain context (Collis & Hussey,
2013).
In order to reach the objective the change model found in the theoretical framework will be
applied to introduce a tracking system in Carlsberg. In order to successfully create change
strategy for a new technology, it is vital to understand both the technology, organization and the
individuals that are going to be affected by the change (Paton & McCalman, 2008). The approach
of this research is to use profiling to group users and stakeholders to small sample studies, or in
other words case studies (Scapens, 1990), in order to thoroughly analyze the context as well as
their needs and wants. Therefore, this research has resulted in several case studies, each
consisting of one stakeholder profile, according to Figure 4. The case studies can be categorized
as experimental, since this type of research examines the difficulties in changing procedures and
techniques in an organization and evaluating the benefits (Collis & Hussey, 2013).
Figure 4. The case studies in this research.

17
Case studies typically combine data collection methods such as archives, interviews,
questionnaires and observations (Eisenhardt, 1989; Gillham, 2010; Collis & Hussey, 2013). Data
accumulated by different methods but bearing on the same issue are part of what is called the
multi-method approach (Gillham, 2010), or a triangulation method (Collis & Hussey, 2013). In
this research, a multi-method approach has been used. Also, the research has been divided into
two phases, in which phase 1 was completed before phase 2 began. Figure 5 illustrates the
research process that has been used for this research.
Figure 5. The research process for this research.
In Figure 5, the two phases of the research can be seen. Phase 1 was focused on gathering
information in order to understand and map the current system. After mapping the current state,
phase 2 was initiated. In this phase, focus laid on gathering information in order to create the
change strategy. The different methods of data collection; interviews, observations, literature and
consultant advisory, are represented in the light blue squares. Data analysis is represented in the
dark blue squares. Results, which consist of the change model and the final change strategy, are
represented by the green squares. The data collection and analysis will be discussed in more
depth in the following chapters.
3.2 Data Collection In order to create a change strategy for successful implementation of a tracking system in
Carlsberg, it needs to be accepted by employees in different positions of the company. In order to
satisfy the different stakeholders, a qualitative approach has been used in this research.
Qualitative data are normally transient and understood within context (Collis & Hussey, 2013). It
is suitable to use in order to understand what “real life” is like, since it focuses on naturally
occurring, ordinary events in natural setting. It is therefore valuable to use qualitative data for
research that seeks to explore real organizational goals, linkages and processes in organizations
(Skinner et. al., 2000). Data triangulation means that data are collected at different times or from
different sources in the study of the phenomena (Collis & Hussey, 2013). By using data
triangulation it is possible to reduce the bias in the data sources (Jick, 1979). All data collection
methods are described in depth in the following chapter.

18
3.2.1 Interviews To identify the current as well as the desired future state in the process of tracking pallets in
Carlsberg, several employees affected by the change have been interviewed in this research.
Semi-structured interviews are suitable when the research aims to understand the respondents
“world” in order to influence it (Easterby-Smith et. al., 2012). In this research, it was desired to
gain an in-depth understanding about the current situation in order to improve it, and the
interviews were therefore semi-structured. Both researchers were present during both face-to-face
and telephone interviews. This was done in order for one to have the main role as leader of the
conversation and for the other to document the interview. All the interviews were conducted in
Swedish since it is was the native language for both the researcher and the interviewees.
Interviews were conducted both in phase 1 and phase 2 of the research. In total, 17 employees
from Carlsberg, 8 employees from other companies and 2 researchers from KTH has been
interviewed. The number of interviewees from each stakeholder group can be seen in Table 3 and
details of each interview, such as position, location and length, can be seen in Appendix 1.
Table 3. The number of conducted interviews with stakeholders in this research.
Stakeholder Group Number of Interviewees Length per Interview
SoD Partners 6 30-90 min
Administration 11 30-60 min
Sponsors 2 30-60 min
Truck Drivers 4 15-60 min
The first phase of interviews was conducted in the beginning of the research and the interviews
followed different guidelines depending on interviewee. The guidelines for the interviews can be
found in Appendix 2-5. This phase of interviews was conducted in parallel with the observations,
in order to map and understand the current system. Also, the desired future state was identified
and stakeholders were mapped and divided into case studies. During this phase of interviews,
some driving and restraining forces for the change as well as risks were identified. The
interviewees were chosen due to general knowledge of the company, with focus on distribution
and logistics, but also from other parts such as customer service, planning and warehouse. Also,
each SoD partner was interviewed to get their point of view.
In phase 1, in addition to the interviews with different stakeholders, two researchers from KTH
and two representatives from the company GS1 were interviewed. At GS1, the interviewees were
one business manager and one head of standards & implementation. Since all Carlsberg pallets
are marked with GS1 standard barcodes, it was desirable to get their view on the project as well
as their general knowledge of barcode scanning early on in the research. The last people
interviewed in this phase were two researchers from KTH. One of the researchers is working
within industrial management and was able to give her insights on implementing new
technologies in organizations. The other one is working in computer science and communication
and shared his knowledge about IT systems, the tracking system used in this research as well as
how to implement it in the organization.
The second phase of interviews was conducted in the middle of the research. In these interviews,
focus laid upon formulating the change strategy. In this, all identified stakeholders were
interviewed with questions targeting how they will be affected by the change, what driving and

19
restraining forces they perceive with change as well as what risks they can identify. These
findings complemented the findings in phase one. The interview guidelines were slightly
reformulated amongst the different stakeholders since directed questions enhanced the
information received. However, the basic content was the same and is seen in Appendix 6.
3.2.2 Consultant Advisory In order to strengthen the research and the quality of the change strategy, three semi-structured
interviews with change management consultants have been conducted. The three interviewees are
management consultants in the large consultancy companies ForeFront and Tieto. These two
companies were chosen since they both work with IT-solutions and implementation of these in
organizations. Further, the three persons have been recommended to interview with respect to the
research by representatives from the companies. Two of the persons have long experience and
one shorter experience of change project and IT implementation in different kinds of businesses.
The interviewees and information about the interview can be seen in Table 4.
Table 4. The conducted interviews with management consultants in this research.
Reference Company Position In company Location Length
Consultant 1 Tieto Senior Service Delivery Manager 11 years Stockholm 60 min
Consultant 2 Tieto Business Developer 1,5 years Stockholm 60 min
Consultant 3 ForeFront Manager of Business Transformation 5 years Stockholm 60 min
The three interviewees are seen as impartial since ForeFront and Tieto does not have any
connection to Carlsberg. Neither do the three interviewees have any contact with Carlsberg or
any personal gain in the project. By interviewing a more junior and two senior consultants with
different genders, a wider perspective could be covered. Also, it was possible to highlight what a
junior and a senior person working in the field considers important. Before the interview, the
interviewees were briefly informed about the research. This in order to relate the general
questions asked during the interview to their own conducted work with similarities with this
research. The interview guidelines for these interviews can be seen in Appendix 7.
3.2.3 Observations Observations includes three main elements; watching what people do, listening to what they say
and sometimes asking them clarifying questions. Participant observations means that the
researchers are involved in the operations rather than to watch from the outside (Gillham, 2010).
Participant observations have been conducted for each organization that will use the tracking
system. These are Carlsberg Distribution together with the truck drivers, Carlsberg Warehouse,
Altia Sweden, KGA Logistics and Skanlog, as presented in Figure 6.
.

20
Figure 6. The conducted observational studies for this research.
By identifying the needs and wants for each organization, it is possible to create value for all the
parties. In the observations in Figure 6, the organizations were visited and asked questions about
their current operations. In addition to the semi-structured interviews described in Chapter 3.2.1,
a tour around the warehouse was performed and the operations were viewed in action. Also, early
on in the research, two truck drivers from the large cross-dock in Årsta were observed in the
work during one full day. This was done in order to get an in-depth understanding about their
daily work. By combining the interviews and the observations, the entire process of the
distributed goods could be mapped, from order to final consumer.
3.3 Data Analysis There is no clear and accepted set of conventions for analyzing qualitative data corresponding to
those observed with quantitative data. However, whichever method(s) used to analyze qualitative
data, it will involve data reduction in which irrelevant data is discarded over time. When using a
theoretical framework, this will provide categories into which the data can be fitted (Collis &
Hussey, 2013). The theoretical framework in this research has been used to reduce and analyze
the data collected. The data collection as well as analysis has been based on the change model
found in Chapter 2.4. This model is in turn based on theory around managing change in a
sociotechnical system and takes into consideration change models by Kotter (1996) and Mumford
(1995).
Phase 1 in the research consisted of two steps of analysis. The first step in the analysis was to
map the process by conducting interviews and observations in the different organization involved
in Carlsberg’s distribution. In the theoretical framework, profiling was considered a suitable
method to map the different roles in the system to groups. Therefore, the second step in the
analysis was to identify users and stakeholders by using profiles. Each identified profile was then
considered a case study.
In a qualitative project, looking at and through each case is the basis of analytic interpretations
and generalizations. There are two approaches to case analysis; cross-case and within-case, where
within-case analysis identifies presence of key element and cross-case analysis is used to identify
commonalities between cases. Neither across-case nor within-case approaches alone enables
interpretation of an experience both through its parts and as a whole (Ayres et. al., 2003).
Therefore, both cross-case and within-case analysis has been used in phase 2 of this research, as
visualized in Figure 7. When analyzing both cross-case and within-case, is it possible to

21
understand whether or not the picture is understood correctly. If the gathered data converge
(agree) it is possible to be reasonably comfortable that the picture is true. If they do not agree the
picture is more complicated than expected (Gillham, 2010).
Figure 7. The data analysis method of this research.
In the cross- and within-case analysis, each stakeholder group has been analyzed through a force
field analysis. The concept of the force field analysis was presented in chapter 2.3.3. In these
force field analyses, data from interviews and observations have been analyzed to find driving
and restraining forces for the change according to each stakeholder profile. The driving and
restraining forces was then rated with a strength varying between 1 and 5. This rating has been
made based on how much the interviewees emphasized each force. A force that seemed very
important to the interviewee was rated 5 while a strength that did not seem so important was rated
1. The force field analysis was validated by representatives from each stakeholder group. Forces
that were specific for that stakeholder have been analyzed individually and shared forces were
analyzed together.
3.4 Quality of Research The criteria validity, reliability and generalizability need to be considered in order to evaluate the
quality of a research (Collis & Hussey, 2009). The three criteria in relation to this research are
discussed individually in the following three subsections.
3.4.1 Validity Validity is the criteria that refer to which extent the research findings accurately reflect the
phenomena under study (Collis & Hussey, 2009). The validity of a qualitative research is
normally high, since the data is normally transient and understood within a context. To increase
the validity in this research, methodological triangulation has been used. Interviews and
observations have been conducted with employees working in several positions in the
organization and also stakeholders working in other companies. Interviews have also been
conducted with impartial interviewees, such as researchers from KTH and management
consultants. Thus, the findings from all interviews together with the observations form a holistic
view of the phenomena under study.
3.4.2 Reliability Reliability refers to the absence of variance in results if the research were to be repeated.
Qualitative processes generally have low reliability (Collis & Hussey, 2009). In order to

22
strengthen the validity in this research, the methodology has been written as transparent as
possible. In this, how the interviews were conducted and with whom are presented. No
transcriptions were made, which might lower the reliability further. However, since so many
interviews were conducted in a limited amount of time, it was considered that it would take too
much of the time to transcribe the interviews. By interviewing impartial consultants from two
different management consultant firms, the reliability of the research increases. This since their
statements was consistent with each other as well as with the empirical findings in this research.
3.4.3 Generalizability Generalizability refers to if the research findings can be extended to other cases or other settings
(Collis & Hussey, 2009). The change model presented in Chapter 2.4 is considered to be
generalizable to many change projects. Thus, the generalizability of this model is high. This since
it based on research from several researchers and well-grounded theory. For example, the change
model is based on Mumford´s (1995) model ETICHS, which is specified for implementing of
computer based systems, and Kotter’s (1996) more general eight-stage model for leading change.
It is however specified for implementing a new technology for usage of people in an organization
and thus, best suited for this type of change.
In this research the general model is adopted and investigated in order to create a change strategy
based on the condition associated with technology and people. Thus this research dos not directly
investigate a larger organizational change and could thus not be proven generalizability in these
kind of change projects.
In the remainder of the research empirical finding from Carlsberg have been applied to this model
in order to formulate the change strategy for a specific context. The final conclusion is therefore a
specific case study for creating a change strategy for a tracking system in Carlsberg, which has
low generalizability. It can be argued that it is possible to apply this change strategy to other parts
of Carlsberg or other distribution companies that are to start using a tracking system or a similar
technology. However, the change strategy may then need special adoption to the specific context.
In what extent this change strategy is generalizable will be further discussed in Chapter 7.

23
Part 2: Formulating the Change Strategy
In this chapter, the change strategy is formulated based on the change model presented in
Chapter 2.4. The change strategy is based on the answering the three questions “What is the
required change?”, “How to build up the change process?” and “How will the change be
measured?” These questions will thus be answered in the following chapters.

24
4. What is the required change? The first step when formulating the change strategy is to understand the required change. The
required change is built upon an analysis of the current state where the areas in need of
improvements is detected. The next step is to formulate the desired future state with the desired
improvements. By comparing these two states, the required change for transforming the
organization from the current state to the desired future state can be detected.
4.1 The Current State As stated in chapter 2.4, the first step of formulating the change strategy is to identify the current
state. Consultant 2 (Tieto) suggests that conducting a current state analysis is one of the key
success factors in a change project, since it makes it possible to see the problems in the
organization. When planning a change project it is important to dig in to the underlying reasons
for change to ensure that the correct problem is solved (Consultant 3, ForeFront). In the
distribution of beverages in Carlsberg, the goods are produced by a supplier, distributed on trucks
through cross-docks and delivered to customers. Thus, the distribution flow in Carlsberg have
three major actors; Supplier, Distributor and Customer. These actors shall not be mistaken as the
stakeholders in the change process of the tracking system, which are discussed later in the report.
The major actors have been the focus of the current state analysis in this research and the
illustrative mapping of the current sociotechnical system for Carlsberg can be seen in Figure 8.
Figure 8. The current sociotechnical system for Carlsberg Sweden.
In Figure 8, the flows of physical goods, orders and information between the actors are
illustrated. Also, the incorrect deliveries and lost returns are presented. When a delivery is
delivered to either the wrong cross-dock, the wrong customer or if the wrong product is delivered
to the wrong customer, it is considered an incorrect delivery. This results in an unnecessary
retrieval of the delivery in order to later deliver it to the right customer or in order to deliver the
right product. In some cases the deliveries even goes missing if they are delivered incorrect, since
there is no way to prove that the pallets were unloaded to the wrong customer. The losses in
returns occur due to lack of information and poor standardization of handling of returns.
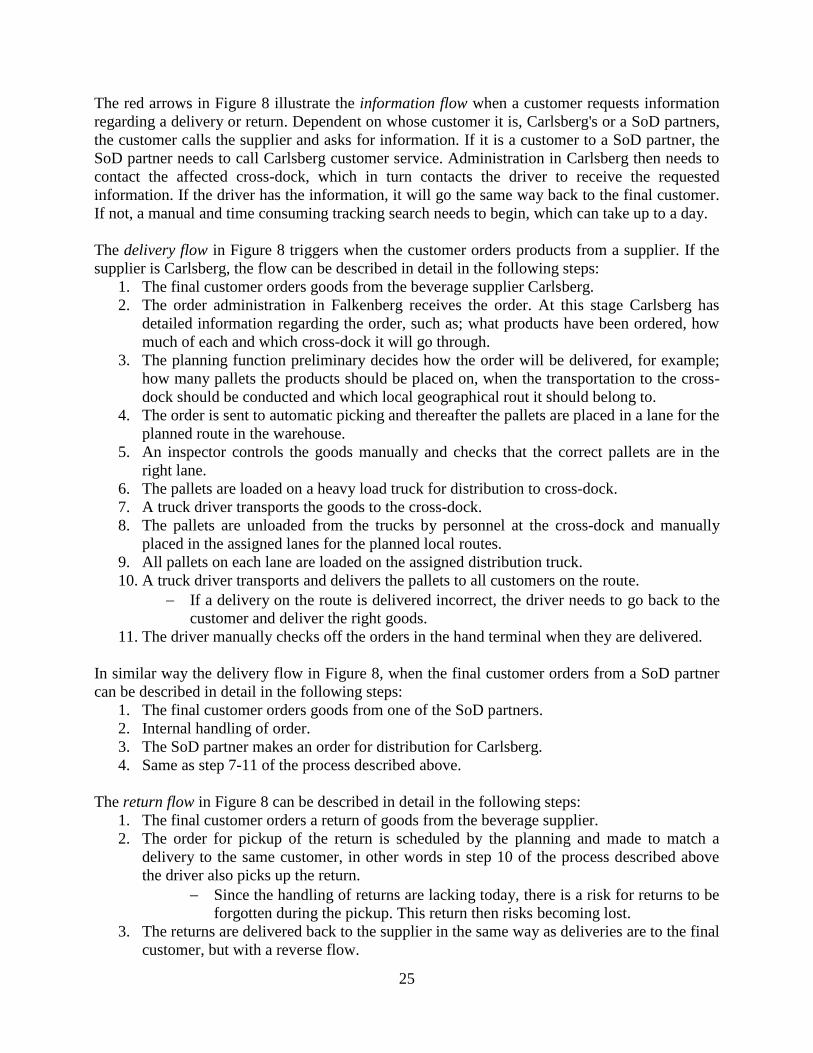
25
The red arrows in Figure 8 illustrate the information flow when a customer requests information
regarding a delivery or return. Dependent on whose customer it is, Carlsberg's or a SoD partners,
the customer calls the supplier and asks for information. If it is a customer to a SoD partner, the
SoD partner needs to call Carlsberg customer service. Administration in Carlsberg then needs to
contact the affected cross-dock, which in turn contacts the driver to receive the requested
information. If the driver has the information, it will go the same way back to the final customer.
If not, a manual and time consuming tracking search needs to begin, which can take up to a day.
The delivery flow in Figure 8 triggers when the customer orders products from a supplier. If the
supplier is Carlsberg, the flow can be described in detail in the following steps:
1. The final customer orders goods from the beverage supplier Carlsberg.
2. The order administration in Falkenberg receives the order. At this stage Carlsberg has
detailed information regarding the order, such as; what products have been ordered, how
much of each and which cross-dock it will go through.
3. The planning function preliminary decides how the order will be delivered, for example;
how many pallets the products should be placed on, when the transportation to the cross-
dock should be conducted and which local geographical rout it should belong to.
4. The order is sent to automatic picking and thereafter the pallets are placed in a lane for the
planned route in the warehouse.
5. An inspector controls the goods manually and checks that the correct pallets are in the
right lane.
6. The pallets are loaded on a heavy load truck for distribution to cross-dock.
7. A truck driver transports the goods to the cross-dock.
8. The pallets are unloaded from the trucks by personnel at the cross-dock and manually
placed in the assigned lanes for the planned local routes.
9. All pallets on each lane are loaded on the assigned distribution truck.
10. A truck driver transports and delivers the pallets to all customers on the route.
If a delivery on the route is delivered incorrect, the driver needs to go back to the
customer and deliver the right goods.
11. The driver manually checks off the orders in the hand terminal when they are delivered.
In similar way the delivery flow in Figure 8, when the final customer orders from a SoD partner
can be described in detail in the following steps:
1. The final customer orders goods from one of the SoD partners.
2. Internal handling of order.
3. The SoD partner makes an order for distribution for Carlsberg.
4. Same as step 7-11 of the process described above.
The return flow in Figure 8 can be described in detail in the following steps:
1. The final customer orders a return of goods from the beverage supplier.
2. The order for pickup of the return is scheduled by the planning and made to match a
delivery to the same customer, in other words in step 10 of the process described above
the driver also picks up the return.
Since the handling of returns are lacking today, there is a risk for returns to be
forgotten during the pickup. This return then risks becoming lost.
3. The returns are delivered back to the supplier in the same way as deliveries are to the final
customer, but with a reverse flow.

26
4.2 The Future State When the current state has been identified, the next step is to formulate a desired future.
According to Consultant 3 (ForeFront), the desired future state can be different for the different
stakeholders in the organization. The future state in this research has been formulated by
combining the desires from the first phase interviewees. In this case, the opinions regarding the
desired future state has been similar among the employees. In the desired future state, Carlsberg
will have full control over their deliveries and returns. Firstly, it is desired to not have any
incorrect deliveries or lost returns, since this is seen as a waste of resources. Further, Carlsberg
wants direct feedback of where in the flow the goods are located. Carlsberg also wants to make
this information available for the SoD partners, so that they can give instant information to their
customers. This will result in a new service that Carlsberg can use as a competitive edge on the
market to attract more partners. The service is also requested from the SoD partners, who desire
more information about the delivery flow in order to inform their customers.
4.3 The Required Change In order to meet the future state, a tracking system accompanied with a website containing
information regarding deliveries and returns is to be introduced. This results in a change in the
sociotechnical system due to the new adoptions needed for the system to function. The tracking
system that is introduced is based on scanning barcodes of GS1 standard that are attached to
pallets with beverages. Each pallet has an individual barcode consisting of information regarding
that specific pallet, and can therefore be identified in the system. The scanning is conducted with
a hand held terminal, HHT, by truck drivers and warehouse personnel. In Figure 9, the new
sociotechnical system has been illustrated.
Figure 9. The new sociotechnical system for Carlsberg Sweden.
As seen in the Figure 9, the incorrect deliveries and lost returns is excluded in the desired future
state. This can be done due to the additional scanning of the pallets in step 5, 7, 8 and 10 of the
delivery flow, which is described below. The scanning will ensure that only the correct deliveries
are delivered to the right customer. Also, the handling of returns will improve due to the scanning
system. This since the suppliers will have updated information regarding which returns have been
picked up from which customer.

27
The red arrows in Figure 9 illustrate the information flow when a final customer requests
information regarding a delivery or return. Since the future state includes a website that collects
information about the deliveries and returns directly from the truck drivers, the suppliers will
have updated information regarding this. Therefore, they can give direct feedback to customers
when they are asked about deliveries and returns. Thus, the information flow is minimized and
faster in relation to the current state.
The delivery flow in Figure 9 triggers when the customer orders products from a supplier. If the
supplier is Carlsberg, the flow can be described in detail in the following steps:
1. The final customer orders goods from the beverage supplier Carlsberg.
2. The order administration in Falkenberg receives the order. At this stage Carlsberg has
detailed information regarding the order, such as; what products have been ordered, how
much of each, which cross-dock will it go through.
3. The planning function decides how the order will be delivered, for example; how many
pallets the products should be placed on, when the transportation to the cross-dock should
be done and which local geographical rout it should belong to.
4. The order is sent to automatic picking and thereafter the pallets are placed in a lane for the
planned route in the warehouse.
5. The pallets are scanned and loaded on a heavy load truck for distribution to cross-dock.
6. A truck driver transports the goods to the cross-dock.
7. The pallets are unloaded from the trucks by personnel at the cross-dock, scanned and
placed in the assigned lanes for the planned local routes.
8. All pallets are on each lane are scanned again when loaded on the assigned distribution
truck.
9. A truck driver transports the pallets to all customers on the route.
10. The driver scans the pallets when they are delivered.
The delivery flow for when a final customer orders from a SoD partner can also be seen in Figure
9 and is describe in detail in the following steps:
1. The final customer orders goods from one of the SoD partners
2. Internal handling of order.
3. The SoD partner makes an order for distribution for Carlsberg.
4. Same as step 6-10 of the process described above.
The return flow in Figure 9 can be described in detail in the following steps:
1. The final customer orders a return of goods from the beverage supplier.
2. The order for pickup of the return is scheduled by the planning and made to match a
delivery to the same customer, in other words in step 9 of the process described above the
driver also picks up the return.
3. The returns are scanned in order to confirm the pickup.
4. The returns are delivered back to the supplier in the same way as deliveries are to the final
customer, but with a reverse flow.

28
5. How to build up the change process? The second step in formulating the change strategy is to map out how to conduct the change, in
other words to build up the change process. This plan is based upon the required change and is
then mainly dependent on the stakeholder requirements, since it is the stakeholders that are
affected by the change. It is also important to handle the risks associated with the implementation
and to consider the resources and budget that are needed to follow through with the change when
building up the change process.
5.1 Stakeholder Management Change needs to be accepted by the stakeholders in order to be successful (Leitch & Warren,
2010; Paton & McCalman, 2008; Geels, 2002; Kotter, 1996; Hughes, 1983; Mumford & Ward,
1968). The consultants interviewed in this research supports this and states that to consider the
stakeholders is a success factor in many change projects (Consultant 1-2, Tieto & Consultant 3,
ForeFront). Consultant 3 (ForeFront) argues that stakeholder analysis is often underestimated and
that it is a factor in the preparation that is very important to consider. Also, Consultant 2 (Tieto)
suggests that it is essential to analyze what the different stakeholder’s desire and Consultant 1
(Tieto) states that it is vital to get all the key people onboard on the project.
Based on the analysis of the required change, four stakeholder profiles have been identified as
important. These are; the SoD partners, the truck drivers, the administration (which includes all
in-house administration such as customer service and administration in the warehouse in
Falkenberg and the cross-docks) and the sponsors (which includes the upper management that
have issued and will finance the project). The customer is not considered a stakeholder since they
are not directly affected by the change. This since their expectation is to get the correct deliveries
on time, not dependent of how Carlsberg is succeeding with this. Also, the website will not be
used by the customer, but only Carlsberg and the SoD partners on request from Carlsberg.
The four identified profiles are analyzed in the following chapters. For each profile, a force field
analysis is presented. The forces in these have been identified through interviews and
observations and validated by representatives from the stakeholder profiles. The strength of the
force has been estimated based on how much weight the stakeholder’s have laid on the forces. In
the force field analysis, the forces are presented together with a strength that has been rated from
one to five. One is a weak force that will not have a high impact on the change and five is a
strong force that is vital to oversee. After respective force field analysis, the chosen actions to
increase the driving forces or decrease the restraining factors are presented in order to increase
the willingness to change. A compilation of the stakeholder’s willingness to change and potential
increase of willingness due to taken actions can be seen in Table 5. In the following chapters, an
in depth force field analysis for each stakeholder with the associated actions to increase the
willingness is presented.
Table 5. Stakeholder’s willingness to change
Stakeholder Current willingness to change Willingness to change with suggested actions
SoD Partners 11 13.5
Administration 11 15
Sponsors 14 19
Truck Drivers 2 7

29
5.1.1 SoD Partners In the current system, the SoD partners distinguish a lack of updates and information regarding
deliveries, including slow confirmations that the goods are delivered, as a severe problem. Also,
the insufficient handling of returns is problematic and the SoD partners are not adequately
informed when returns are picked up and distributed back to them. Many of the returns take a
very long time to return to their warehouse and some goes missing. The most important returns
that they want to get better control over are emptied beer barrels, which are worth a pawn of 500
SEK, and full goods returns, which are unused deliveries that are sent back to the supplier for
different reasons.
The problems experienced in the current state can be improved by the transition to the future
state. However, in order for the change to the desired future state to succeed, the SoD partners
need to make a system updates in order to send additional data to Carlsberg in order to secure that
the required information is in the tracking system. Thus, they need to change the type of
information they send to Carlsberg and they may also have to change when they send the
information. The data needed is for example pallet ID, order number and number of pallets sent
by the delivery truck. They also need to change the way they are currently following up their
deliveries and they therefore need to change some administrative routines. Instead of calling
Carlsberg by phone as they do today, they should incorporate the routine of visiting the website
in firsthand. The driving and restraining forces for the suggested change experienced by the SoD
partners have been mapped in Figure 10.
Figure 10. The force-field analysis for the SoD partners.
As seen in Figure 10, the SoD partners sees the increase in available information as well as the
easy access to information on the website as a driving force for managing the change. Their
current customer will through this get information faster and easier from the SoDs and thus, their
customer satisfaction will increase. Also, the SoD partners believe that they will become a more
attractive supplier and gain more customers since the tracking system results higher delivery
accuracy. The last driver implies that the relationship between Carlsberg and the SoD partners is
likely to improve with the tracking system. This is mainly because the lack of information today
can create frustration and thereby harm the current relationship.
One restraining force experienced by the SoD partners is that they have to make some upgrade in
their system in order to send additional information to Carlsberg. This is a necessary investment
for the SoD partners to go through with in order for the tracking system to function for them.
Since the SoD partners have been involved in the design of the system, they are aware of what
changes they need to make internally. They are willing to do this since they consider the driving
forces stronger than this resistor. The second restraining force, changed routines, is in some form

30
shared by all stakeholders but dependent on the degree of change. The SoD partners does not
need to change their routines much, thus the weak restraining factor.
Currently, the driving forces for the SoD partners are worth plus 15 and the restraining forces are
worth minus 4. This results in a total of plus 11, which means that the driving forces are strong
enough to result in change. However, increasing the willingness further will ease the change
process. The total willingness to change can increase through the following actions:
Increasing the driving forces
Competitive edge, by communicating how the tracking system can be used of the SoD as
an own selling argument (+0.5).
Improved relationship with Carlsberg, by communicating how a closer cooperation favors
both actors (+0.5).
Decreasing the restraining force
Change in system, by facilitating the change and creating a requirement specification for
the needed upgrade (+1).
Changed routines, by the methods education, participation and facilitation as further
discussed in Chapter 5.1.5 (+0.5).
Accompanying the actions are estimations of how much the driving and restraining forces will
increase through the actions. The driving forces will increase towards a maximum while the
restraining forces will increase towards 0. The estimations have been found through interviews
with stakeholders and observations based on how important they consider it to increase or
decrease the specific force. This estimation can be seen in the parenthesis after the stated action.
Thus, by conducting all the above mentioned actions, the total willingness to change will increase
with 2.5 to a total of plus 13.5.
5.1.2 Administration In the current system, administration experiences problems with unprofessional customer service
and complaints from customers and SoD partners due to insufficient handling of returns. Time
spent to find “lost” pallets are also a problem, as well as inaccurate loadings and unloadings of
pallets which in turn causes incorrect deliveries. These problems are caused by poor control over
the flow of goods and lack of assurance regarding which pallets have been delivered and not.
Administration needs to change administrative routines and learn how to utilize the website in
order for the transition to the future state to be successful. The driving and restraining forces for
administration for the change can be seen in Figure 11.

31
Figure 11. The force-field analysis for administration.
As seen in Figure 11, sponsors support is important in order to increase administrations
motivation for the project. Also, administration considers it a driving force that they after the
change have access to a website where they can access information regarding all of Carlsberg´s
deliveries. This will increase their work efficiency since they no longer need to manually search
for lost deliveries and returns. Less incorrect deliveries will lower their stress caused by manual
search for pallets. Also, less time spent searching for deliveries and less time spent in the phone
talking to the customer will release more time to other work assignments. Lastly, the easier
accessible information will result in a more professional service level towards SoD partners,
which is especially important for the administration within customer service.
During the implementation of the tracking system, unexpected start-up problems may occur and
administration will be highly affected by these. Further the administration positioned at the cross-
dock will have the responsibility to educate the truck drivers, which increase the workload over a
time. Finally they will need to change some routines to utilize the savings of the system as much
as possible, one example is the morning routines of checking the warehouse should be exchanged
to checking the website.
Currently, the driving forces for the administration are worth plus 21 and the restraining forces
are worth minus 10. This results in a total of plus 11, which means that the driving forces are
strong enough to motivate change. The total willingness to change can be further increased
through:
Increasing the driving forces
Decreased stress, by educating administration about how stress affects health and
wellbeing, both in work and at home (+0.5).
Professional SoD partner service, by communicating how important the SoD partners
consider the system (+1).
Decreasing the restraining forces
Start-up problems, through initial use of the system in a test group, who will find many of
the problems in order to improve the system before the real implementation (+2).
Responsibility to introduce system to drivers, by supplying administration with finished
manuals and programs for workshops (+1).
Changed routines, by the methods education, participation and facilitation as further
discussed in Chapter 5.1.5 (+0.5).

32
The increase in the driving and restraining forces has been estimated through interviews and
observations. By conducting all the above mentioned actions, it is estimated that the total
willingness to change will increase with 5 to a total of plus 16.
5.1.3 Sponsors The focus for the sponsors in the current state is mainly to lower costs and increase
competitiveness. They want to remove the extra costs that occur due to incorrect deliveries and
lost returns. Also, there is a desire to increase the competitiveness by extend Carlsberg’s services.
This in turn can result in increased amount of SoD partners or final customers.
The sponsors will not personally be highly affected by the change in their daily work. However,
they do have to make the investment for the change initiative to follow through and also assign
employees to be liable for the implementation as well as monitoring of the system. They will also
be directly affected by the degree of success of the change since they are the one that issue and
approve the project. A force field analysis for the sponsors can be seen in Figure 12.
Figure 12. The force-field analysis for the sponsors.
The largest driver for the sponsors as seen in Figure 12 is the economic benefits associated to the
tracking system. This is due to fewer incorrect deliveries and lost returns which in turn save
money for Carlsberg. Also, the tracking system will ensure that the drivers deliver the right
products to the right customer. Combining this with the access of additional information will
result in a more effective distribution for Carlsberg. Also, the higher accuracy of deliveries will
result in a competitive edge for Carlsberg, which in turn can attract more SoD partners and higher
distribution volumes. The tracking system is also considered an additional service towards the
SoD partners which will improve their customer satisfaction index as well as the relationship
between Carlsberg and the SoD partners.
The sponsors will finance and issue the project, which means that they will pay an initial as well
as a continuous cost for the tracking system. Also, the sponsors will be affected by the start-up
problems that can occur during implementation since they can have high impact on the result of
the change project. Initially, the sponsors will also be affected by the changes in the system and
they need information in order to understand how the system functions, as discussed in Chapter
5.1.5.
Currently, the driving forces for the sponsors are worth of plus 22 and the restraining forces are
worth minus 8. This results in a total driving force of plus 14. This implies that the willingness to

33
change is strong in this stakeholder group. However, the total willingness to change can be
furthered increased through:
Increasing the driving force
Improved relationship with SoDs, by proving the SoD partners positive attitude towards
the tracking system and explaining that the SoDs sees this as a competitive edge that also
they can beneficial from (+2).
Decreasing the restraining force
Initial costs, by proving the savings associated with the system and provide them with
important financial numbers such as the time and level of payback (+1).
Start-up problems, through initial use of the system in a test group, who will find many of
the problems in order to improve the system before the real implementation (+2).
The increase in the driving and restraining forces has been estimated through interviews and
observations. By conducting all the above mentioned actions, it is estimated that the total
willingness to change will increase with 5 to a total of plus 19. In a way, the sponsors have
already decided to fulfill the change project of the tracking system. Since, they have already
taken a positive position against the change. It is thereby beneficial to lay a smaller amount of
resources to increase the willingness for the sponsors and instead transfer these resources to the
drivers thus they need it more, as can be seen in Chapter 5.1.4. However, sponsors willingness to
change is highly important so it is important to not oversee their engagement (Consultant 3,
ForeFront).
5.1.4 Truck Drivers In the current state, all deliveries are checked manually in a high pace by the truck drivers and
because of this, stress can result in incorrect deliveries. They consider incorrect deliveries a
problem in the current state, since this in turn results in unsatisfied customers. Also, since not all
truck drivers load their own truck, they consider it a problem that there is a lack of information
transfer regarding which pallets that has been loaded on the trucks.
In the future state, the truck drivers are the stakeholder that needs to change the most, since they
are the ones that will update information to the website by scanning pallets. The truck drivers are
affected by the driving and restraining forces in Figure 13.
Figure 13. The force-field analysis for the truck drivers.
As seen in Figure 13, a driving force is that the tracking system will ensure that the correct
deliveries are loaded on the trucks and thus the driver will get increased control of what

34
deliveries are on his/her truck. Also, the scanning will lower the risk for the driver to unload
incorrect deliveries and therefore help the truck drivers to avoid mistakes. The driver will with
the tracking system have an extra confirmation that goods have been delivered and can therefore
prove deliveries in a better way, in the event of a dispute. Also, since the incorrect deliveries will
be reduced, the customer satisfaction is likely to increase. This is a driving force for the truck
drivers since they have mostly customer contact. Thus, if the customers are satisfied they will get
fewer complaints. If administration in the cross-dock fully support this project, the truck drivers
are likely to support it as well which makes this an important driving force.
The truck drivers experience several restraining forces with the tracking system. Firstly, the
additional scanning will increase the workload for the truck drivers. Secondly, the scanning will
be time consuming which might result in them having to work longer during the day. The truck
drivers are the stakeholders that will notice the largest amount of changed routines with the new
system. The risk for technical problems during usages will increase since the truck drivers will be
more dependent on the technology and internet access. The truck drivers will also be more
dependent on intact barcode that are possible to scan.
Currently, the driving forces for the drivers are worth plus 16 and the restraining forces are worth
minus 14. This results in a total willingness to change of plus 2. This can be compared with the
SoD and administration where the total willingness is both plus 11, and sponsors that has a
willingness of plus 14. It is obvious that the truck drivers are the stakeholders that might resists
change the most. Thus, they will require increased motivation. Since the truck drivers are the
stakeholder group that is least willing to change, a larger amount of resources should be spent on
increasing the total driving force for them. The total willingness to change can be increased
through:
Increasing the driving forces
Decreased risk for incorrect deliveries, by explaining how this will result in a better
service and fewer work tasks as manually searching for incorrect deliveries (+0.5).
Increased ability to prove deliveries, by explaining how the system can help the truck
drivers prove their deliveries in case of a dispute (+0.5).
Increased customer satisfaction, by communicating how the system can help the truck
drivers to provide the customer with better information, which in turn will lead to higher
professionalism (+0.5).
Decrease the restraining forces
Additional work, by facilitating the usage of the system and have communication channels
where feedback for improvements is brought to the right person for development (+1).
Time consuming, by explaining how the small amount of time for every extra scanning is
compensated by the guarantee that all deliveries are correct from the beginning (+1).
Changed routines, by the methods education, facilitation and participation which are
further discussed in Chapter 5.1.5 (+1).
Increased risk for technical problem, by close communication with the person responsible
for the systems operation for continuous upgrades (+0.5).
By taking the actions it is estimated that the willingness to change will improve by 5 to a total of
plus 7, which has been estimated through interviews and observations. This is still the lowest

35
willingness among the different stakeholders, but will probably be enough to ensure a smooth
change. The actions to decrease the restraining forces affect the total willingness more than the
actions to increase drivers. Therefore, focus lays on managing resistance, as discussed in Chapter
5.1.5. In addition to the restraining forces, the truck drivers will experience some ramp up time
before they will feel comfortable with the system and are fully effective working with it. This
period of time can also be reduced by using the method facilitation by Kotter and Schlesinger
(2008) which is discussed in Chapter 5.1.5. However, Driver 1 (Carlsberg) suggests that after one
day’s usage of the tracking system, the learning process should be completed and they should be
able to work almost fully effective. This since it is a relatively easy technology to work with.
5.1.5 Managing Restraining Forces People tend to react negatively to change (Carbery & Garavan, 2005) and this is often because
they do not fully understand the change and how they will benefit from it. The initial change in
the system that will result in changed routines for all stakeholders is a shared restraining force
that can be reduced with the methods education, participation and facilitation presented by Kotter
and Schlesinger (2008).
Kotter and Schlesinger (2008) suggest education, in form of information sharing, as a method to
increase momentum towards change. This should be used when employees lack information
about the change’s implications and is done by communicating the desired changes and reasons
for them. The advantage with this method is that once employees are persuaded, they often help
to implement the change. Englund (2015) suggest that communicating what the basis of change is
and why the change should be conducted is one of the most important factors in the
preoperational work, in order for everyone to understand why their work should change. She also
emphasizes that when combining collecting information with educating employees, it is
important to avoid creating too high expectations on the new system. This since if the system
cannot fulfill the expectations during implementation, the employees will gain a negative reaction
towards the change (Englund, 2015).
Throughout this research, employees have been informed about the change as well as reasons
behind change during meetings and interviews. Most of the stakeholders have been interviewed
face-to-face in order to get a better insight of their attitude towards the change. In order to
continue with the education and information, the stakeholders will receive different kinds of
information sheet dependent on their interface to the tracking system. However, the entire
organization should be informed about this change project. This since it is a large project that is
going to affect every employee directly or indirectly. To communicate to an entire company can
be difficult and time consuming (Kotter & Schlesinger, 2008), especially if the education is
handled face to face. However, there are other more effective communication channels that can
be used for this in Carlsberg such as the company’s intranet or by presenting at the yearly big
meetings (Interviews, Carlsberg).
Potential resistors to the change can be involved in the design of the change process. This method
to manage resistance is called participation and makes people feel more committed to making the
change happen. However, it is a time consuming method to reduce resistance and employees
might design inappropriate change (Kotter & Schlesinger, 2008).

36
Participation has been used throughout this research and the employees have been able to affect
the change strategy. During the change process, a number of employees should be selected to
become change agents. The change agents’ purpose is to participate during the implementation
and motivate others. It is recommended that the change agents are carefully chosen based on their
network in the company and their position to the change, since they will be responsible to talk
about the change to their colleagues in their daily work. The change agents should receive regular
updates regarding the change and be involved in the change process in order to mediate the
information to others (Kotter, 1996). When it comes to technological changes, there will always
be late adopters. These individuals will stand against the change the most and it will be up to the
change agents to help motivate the change for these individuals (Consultant 1, Tieto).
The method facilitation includes providing skills, training and emotional support. This method
should be used when people are resisting because they fear they cannot make the needed
adjustment. Facilitation is the best method to use when employees experience adjustment
problems; however it is time consuming, expensive and might still fail (Kotter & Schlesinger,
2008). The SoD partners requests training in the website in order to be able to use it. This training
should teach them how to use the website, what kind of information they can retrieve from it and
what information they themselves need to insert. The SoD partners suggest that someone that is
skilled in the system educates one representative from each SoD partner, which in turn can spread
the knowledge internally (Interviews, SoD).
Administration needs a similar training in the website in order to handle the different functions.
The training for administration and SoD partners should be performed during one regular visit to
the different locations. It is important that the person getting the training has the same interface
with the system as those who will use it (Interviews, Carlsberg). In other words, if both customer
service and distribution will use the website it is important to educate one representative from
each group.
Lastly, the truck drivers needs training in how the new application functions, how they scan the
pallets, what they have to change in their daily routine as well as how they give feedback about
the system (Interviews, Carlsberg). This training can preferably be conducted in workshop form
since they then can discuss and talk to each other during the training. The workshop leaders
should be someone that is well grounded in the system, preferably the change agents who has
been active in the creation of the change process.
It is important that the training and the implementation of the tracking system are close in time, if
not the risk of forgetting the training increases (Consultant 3, ForeFront). In addition to the
practical training, the SoD partners, administration and truck drivers requests a small handbook
or a manual that can be used to easily overlook the functions on the website and in the HHT. This
should be received in connection with the training and consist of the most important instructions
(Interviews, Carlsberg). The manuals are different depending on the interface with the tracking
system. If the manuals are printed outside the company, increased foresight is necessary. This
since it takes time for them to process as well as print the order.
5.1.6 Communication Communication is a part of the three above mentioned methods of reducing resistance; education,
participation and facilitation. However, communication is not only a way to reduce resistance but

37
is vital to make employees feel informed, involved and to increase the transparency in the change
process (V. Möller, Carlsberg; Kotter, 1996). Also, communication can be used to increase
driving forces among the stakeholders. Thus, it is important to communicate with all
stakeholders. In order for communication to work smoothly, communication channels for sharing
information should be decided in beforehand. It should be possible to share information both
from the top-down and from the bottom-up to make all employees feel involved. Communication
channels suitable for this project are for example regular meetings and the intranet for updates
and feedback. Also, the truck drivers can include potential questions or problems with the
tracking system in their daily communication with the administration at the cross-dock and via
mobile phone. Further communication channels are key persons in the projects, as further
explained in Chapter 5.3.
5.2 Risk Assessment Consultant 3 (ForeFront) and Consultant 1 (Tieto) highlights the importance to take in account
the risks in the implementation and try to facilitate the high priority risks. When identifying the
risks it has been important to use divergent thinking, discussions with the stakeholders to see
their viewpoint and material from the earlier conducted interviews (Consultant 3, ForeFront). By
doing so, the risks that have been identified are presented in Figure 14. The probability and the
impact of the risks have been estimated through qualified estimations by the researchers.
Risk 1. Resources does not have the needed time due to unplanned events
2. The sponsors stop engage in the work due to other engagements
3. Unforeseen problems results in time delays
4. SoD partners take too much time to upgrade their system
5. Start-up problems with the system occur, which affects the roll out
of the implementation
6. Not every HHT is updated with the new software in time
7. The drivers thinks that the scanning takes too long time and does
not want to use it because of this
8. The competence for pedagogical education does not exists in every
cross-dock
9. Communication problem occurs due to distance between sponsors,
administration and drivers
10. All cross-docks does not see the benefits with the tracking system
11. Carlsberg does not conduct adequate follow-ups
12. The website is not user-friendly
13. The HHT application is not user-friendly
14. The truck drivers are not motivated to use the tracking system
properly
Figure 14. The risks identified in the project.
The risks in Figure 14 have then been analyzed in order to identify the major risks that need to be
handled in order to ensure a smooth implementation. It is a balance between the actions that
should be done in relation to the time and money the actions will demand. Therefore, it is also
important to estimate which risks are not so critical and therefore can be handled when and if
they appear (Consultant 1, Tieto). The identified actions are important to conduct before the
introduction of the tracking system in the organization. This so that the unexpected problems that
arises during the implementation is small enough to be handled with simple problem solving. The

38
actions that should facilitate the implementation have been prioritized by the focus of medium
risks, found in the yellow area (if there were any high risks, they would have been prioritized
first). These risks and actions can be seen in Table 6.
Table 6. Actions to reduce the most critical risks in the project.
Risk Action to reduce the risk
2. The sponsors stop engage in the work due to other
engagements Clearly explain the benefits of this project and how every
sponsor will benefit from it. Also, book the needed time
in their schedule and facilitate the implementation so it is
as easy as possible for them. 4. SoD partners take too much time to upgrade their
system Help them prepare for the system upgrade and help them
with the change. 5. Start-up problems with the system occur, which
affects the roll out of the implementation Use a testing group to identify bugs for updates. Try the
system and implementation in one distribution city at a
time to maintain the focus. 9. Communication problem occurs due to distance
between sponsors, administration and drivers Establish communication channels and regular occurring
meetings with an agenda to go through any problem. 11. Carlsberg does not conduct adequate follow-ups Clearly state the importance of follow-ups for the
sponsors and other responsible in the project. 14. The truck drivers are not motivated to use the
tracking system properly Complete the identified actions to increase the truck
driver’s willingness to change.
The actions presented in Table 6 should be carried out before the implementation process or
before the risk occurs. Therefore, these actions are added to the change process and it is thereby
important to make the risk assessment in preparation of the change.
5.3 Resources and Budgeting M. Englund (ForteFront) states that it is important to have the right sponsors during the change
project. This because a strong internal sponsor can help by pushing out the changes through the
organization and also facilitate the change. So when identifying the resources it is important to
engage the right resources, who have both the competence and the needed authority (Consultant
3, ForeFront). If the needed competence does not exist inside the company and it is too
complicated to develop in-house it can be a good idea to search for the right competence outside
the company, for example at a consultancy (Interviews, Carlsberg).
When the right persons have been brought in the project it is important to secure that the time and
money needed is reserved for the implementation. In this context, it means that the people
engaged in the project need to have time to spend at the project. In order to secure the needed
time for the project, the time span needs to be estimated and about 10 percent time should be
added in order to handle unplanned events (Consultant 1, Tieto). The time schedule is then used
to book the needed resources. In a larger change project, the time estimations should be mapped
in order to inform the sponsors, since an increased time span equals a higher cost for the project.
By doing a strategic change process, the implementation time can be minimized and thus save
money (Consultant 3, ForeFront).
A lot of human resources results in a large amount of knowledge and ability. However, large
groups also results in increased costs and complexity. It is therefore important to find a balance
between the needed resources and the size of the group (Consultant 2, Tieto). For this project,

39
four key roles have been identified. An overview of the different roles and their responsibility for
this change project can be seen in Table 7. A more detailed explanation of their responsibilities
can be seen in Appendix 8.
Table 7. The key roles identified in the project.
Role Responsibility
Project Leader Overall responsibility over the project
Implementation Manager Overall responsibility over the implementation at the specific cross-dock
Operation Manager Responsible of the running of the tracking system, communication with the
developers and future developments
Change Agents Drivers and administrators with deeper knowledge who will works as communication
channels and advocate the change
SoD Manager Responsible person at SoD partners for their development
The first identified role according to Table 7 is the project leader, who is responsible for the
overall change strategy and development of the project. It is also the project leader’s
responsibility to identify the implementations managers which is the responsible persons in
respective distribution city. The implementation managers have the responsible to inform and
train both the personnel on the administration and driver group. In addition to this responsibility,
it is recommended that the implementation manager takes upon another roll as a change agent,
together with a driver. The change agent's role is to have a deeper understanding of the tracking
system in order to be able to respond to questions or take fault reports and forward them to the
operation manager who in turn will have the responsible over the running of the system. Another
important assignment the change agents have is to advocate the change to the other stakeholders.
The operation manager will manage the operation of the system and have the communication
responsibility with the software developer and be responsible for the future updates of the system.
5.4 The Change Process The change process is built upon the required change and the analysis chapters for the
stakeholders, risk assessment and resources & budgeting. The action plan has been constructed
by thinking about which actions needs to be conducted in order to reach the future state (Exodea,
2012). The result is a change process in which actions have been ranked from 1st to 8th stage,
depending on which actions should be carried out first. This ensures that the correct actions are
taken in the right order to secure a smooth implementation. As with the risks, it needs to be
prioritized what actions needs to be included in the planning and what can be handled when it
appears (Consultant 1, Tieto). Some actions in the table have not been necessary or possible to
plan in beforehand, such as testing of the software and the website. This is however important
actions to conduct and they are therefore included in the table but not further discussed in the
report. Other actions have been analyzed in depth and more information can be found in earlier
chapters in the report, as stated in the tables presented below.
The change process for the tracking system has been separated into two parts, preparation work
and introduction. The first part, preparation work, represent the actions in 1st to 4th stage and
these actions are made before introducing the tracking system in the organization. The
introduction is the actual entry of the tracking system in the organization and includes the actions
in the 5th to 8th stage. The preparation work actions can be seen in Table 8, the action is marked
with blue dependent on in which stage they should be carried out.

40
Table 8. The preparation work of the change process.
Action 1st 2nd 3rd 4th More info
Identify key persons; change agents, implementation manager, operation
manager and SoD manager
5.3
Create a sense of urgency by educating stakeholders about why the
change is happening
4 & 5.1.5
Identify in which city the implementation should roll out first and the next
coming
Prepare key persons for their role in the implementation with the methods
participation and facilitation
5.1.5
Establish communication channels 5.1.6
Decrease the restraining forces for all stakeholders 5.1.1-5.1.4
Increase the driving forces for all stakeholders 5.1.1-5.1.4
Take action against identified risks 5.2
Ask the SoD partners to upgrade their systems in order to receive the
necessary data
Test the software so it is compatible with the hand terminal and so it got
access to all needed information
Test the website
Create educational material and user manuals 5.1.5
When the actions in Table 8 have been conducted, the tracking system is tested and the
stakeholders are prepared for the introduction. Thereafter, the tracking system can be introduced
in the organization, following the actions presented in Table 9.
Table 9. The introduction part of the change process.
Action 5th 6th 7th 8th More info
Update every stakeholder about the change, what it means and when the
actions will be carried out to prepare them for change 4.3 & 5.1
Download and install software on all hand terminals
Plan for a workshop 5.1.5
Train implementation managers and change agents 5.1.5
Develop communication and feedback channels between the drivers and
the implementation manager 5.1.6
Develop communication and feedback channels between the
administration and implementation manager 5.1.6
Conduct the workshop with the drivers and administrations and hand out
manuals 5.1.5
Start using the tracking system in the daily work as soon the workshops
are conducted and conduct follow-ups regularly
The introductions should be started by conducting a test round, in which one controlled group of
truck drivers tests the tracking system for the first time. This in order to find all start-up problems

41
that is associated with the start-up of a new system before the large, official implementation
(Consultant 3, ForeFront). The start-up problems can then be illuminated, in order for the
operation manager to develop the tracking system before the official implementation is started.
The test round and the official implementation is carried out in the same way and the process for
this can be seen in Table 9. The system is dependent that all pallets in a cross-dock are scanned,
since this gives a complete chain of information. Therefore, it is important that all drivers in one
specific cross-dock start to use the tracking system simultaneously in order for the system to be
reliable.
The change process presented in Table 8 and Table 9 should be used to ensure as smooth
introduction as possible. However, there will always emerge unexpected problem during projects.
Consultant 1 (Tieto) says that a framework of the change process is extremely important so that
the small problems that emerge can be handled with some common problem solving.

42
6. How will the change be measured? The last step in formulating the change strategy is to decide how the change will be measured.
This is based on which key performance indicators that will be affected by the proposed change
project. Also, how they will be affected by the change is discussed.
“You can’t manage what you can’t measure” (Drucker, 1998) implies that it is important to have
defined measurements of the change process in order to manage it. Kotter (1996) states that a
change strategy needs short-term wins in order to create credibility. These results should be
measurable and visible for the employees, for them to understand how the change is progressing.
When constructing the change strategy, it is important to include measurements on every part of
the change in order to confirm if the implementation was successful or not. Therefore, it needs to
be planned beforehand how to measure the degree of success for each activity (M. Bygren,
Tieto).
In Table 10, all KPIs that should be measured during the change process of the tracking system
are illustrated. These should be measured either short- or long-term, or both. The short-term
measurements aims to measure KPIs that are used in the implementation to motivate further
implementation work in the different cross-docks. The long-term measurements on the other hand
aims to measure the progress and improvements related to the tracking system, and are primarily
interesting for the sponsors. Also, the long-term measurements are primarily used to consolidate
the change in the organization when the change has been conducted and the tracking system is up
and running.
Table 10. The KPIs that should be measured during and after the implementation.
Key Performance Indicator (KPI) Short-term Long-term
PO6 (delivery in time) X
PO7 (correct delivery to customer) X
Number of complaints X
Number of reclaims X
Number of incorrect deliveries X X
Time spent looking for pallets X X
Number of external shippings X
Number of cross-docks with tracking system X
Costs X
Cost savings X
During the implementation, short-term measurements should be used to motivate further change
(Consultant 1, Tieto; Kotter, 1996). The first KPI is the number of cross-docks that have
managed to implement the tracking system. Also, the time spent on looking for lost deliveries and
returns should be estimated both before and during implementation. Lastly, the number of
incorrect deliveries should also be measured in the short-term.
Carlsberg have stated some key performance indicators (KPIs) that they want to improve with the
tracking system. They work for obtaining the “perfect order” and within this they have, among
else, the KPIs PO6 and PO7. PO6 measures if the customer gets the delivery in time and PO7 if
the correct items are delivered to the right customer. These measurements can be directly affected
by the tracking system and will improve through the change process. Another KPI that Carlsberg
43
measures is the customer satisfaction index (CSI). This measurement number is however a “soft”
KPI that will be difficult to directly relate to the usage of the tracking system (Consultant 3,
ForeFront). However, in order to directly relate the improvement of the tracking system the
measurement that is used is the amount of complains that is directly related to complain against
deliveries and the number of reclaims.
Several other KPIs that can be directly related to the tracking system will be measured in the
long-term. Firstly, the number of incorrect deliveries will be measured. This is discussed on
meetings every morning and any effect on this measurement will therefore be detected rapidly.
Also, the time spent on looking for lost deliveries and returns will be measured from estimations.
This time is not measured today, but the amount of time spent on it should be estimated both
before and after the implementation in order to measure the improvement. Further, the number of
external shippings should be measured, since these also are expected to be lowered due to the
tracking system. The last long-term measurement that should be used is the costs and savings due
to the change. In this, several factors such as the increased costs for the truck drivers since using
the scanners will take longer time due to the additional task. Savings should balance or overcome
the cost. The savings occur due to for example a decrease in incorrect deliveries and external
shippings, which are also measured and should decrease with the tracking system.
Follow-ups should be used to inform the stakeholders about the progress of the project and thus
include information regarding the measurements. They should be conducted during, after
completion of parts in the project and after the finalization of the change in all cross-docks. This
in order to clearly state what have been done so far, how it went, what can be done better at the
next cross-dock and measurements of the outcome. This gives the participants a sense of
belonging and also state when the implementation is over. The follow-ups can also be used to
consolidate the change and bring up any feedback (Consultant 1, Tieto & Consultant 3,
ForeFront). During the implementation, follow-ups should be conducted by the project leader
who gathers information in order to analyze and forward it to the right stakeholders.

44
Part 3: Discussion and Conclusion
This part of the report presents the discussion and conclusion of this research. In this part, the
main findings are summarized and discussed in relation to the objective and research questions.
Also, it is reflected upon chosen methods, limitations, ethics and sustainability. Lastly, it is
presented how the research can be further developed.

45
7. Discussion In this chapter the answer and reflections to the research questions are discussed. Further, the
used methods are discussed and the limitations of the research are presented. It is then discussed
how the research have considered and affected ethics and sustainability.
7.1 Reflections on Research Question 1 The first research question was “Which factors are important to consider when introducing a new
technology in an organization and how can these be combined into a change model?” The
important factors were found to be the:
Current and Future State
Stakeholder Management
Risk Assessment
Resources and Budgeting
Short- and Long-term Measurements
These factors were found through a literature review in combination with the researchers’ earlier
knowledge about project management. To understand the current state and to identify the desired
future state are two factors that are important in change management and therefore, the finding of
these factors is well-grounded in theory. The importance of the factor “stakeholders” is also well-
grounded in both theory about sociotechnical systems and change management. This factor was
found as the most important factor to consider in the analyzed change project. The stakeholders
have therefore been in focus throughout the research.
The factors risk assessment and resources and budgeting holds a smaller role in theory regarding
change management. It is therefore not thoroughly motivated in the theoretical framework why
these factors were considered important. However, these are important to consider in project
management. Also, from the consultant interviews it was found that risk assessment actually is an
important factor to consider when creating the change process. This in order to brainstorm and
scan the projects in order to find the risks that could affect the outcome of the project. Further,
both resources and budgeting are necessary to consider in project management, they were
included in the model for formulating a change strategy. It was also requested by Carlsberg to
consider these factors in the change strategy.
The last factor, measurements, is identified as an important factor to consider in for example
Kotter’s change management model. However, the theoretical weight on this subject is also
lacking in the report. More weight could have been laid on this subject, but it was chosen not to.
This because it was considered that measurements are mainly associated with consolidating the
change after it has been performed, which has not been in focus in this research. However, the
measurements were to some extent considered. This since it was found during the research
important to identify both short-term measurements that could be used as motivation for the
change and long-term measurements to confirm the success of the project.
Through the combination of these factors, the change model presented in chapter 2.4 was
formulated. This has been influenced by literature, the specific case study as well as the

46
researchers’ knowledge regarding project management. This model was then applied to the case
study at Carlsberg to answer research question 2.
Input to the model have been gathered from several sources in literature, for example Mumford’s
change model that is adopted for all implementation of IT-systems and Kotter’s change model
that is a general for all change projects. It can be argued that Mumford’s model from 1995 with
focus on how to implement a computer based system is old and therefore irrelevant. Since 1995,
the use of IT in the society has increased and therefore people may be more used to adapting to
new IT solutions. However, it is seen as relevant to use since many of the steps still needs to be
conducted in order to motivate employees in using a new IT system. Although, it is possibly an
easier process to increase the motivation since people are more used to IT change. Kotter’s model
is also almost 20 years old but is still seen as relevant for this research. This since it is often
referred to in newer research and because the steps are considered important by the researchers
for change projects today.
What differs from existing models and the model formulated in this research, is that it takes into
consideration the risk assessment and resources and budgeting, which is not discussed in neither
Kotter’s or Mumford’s model. This is however important to consider when introducing a new
technology in an organization, since it is highly important for the sponsors of the company. It was
not considered suitable to use only one of the identified models in earlier literature, since they are
not considering all the important factors.
The formulated model was suitable to apply on Carlsberg and no changes in the model have been
needed in the process of this research. However, depending on the nature of the project,
additional factors may be important to add in the change model presented in chapter 2.4. An
example of this is change projects where the creation of the introduced technology or
organizational strategy is included. In these projects the process of creating the software or
strategy needs to be added.
By considering and planning the change model accurately, the execution of change is likely to be
successful. However, the definition of a successful change can be varying and it is hard to
conduct an entirely flawless change project. Instead in this research, the rate of success is
associated with the degree that the project reaches the desired outcome. A change project to
introduce a new technology in an organization is considered successful when it is finished within
the estimated time and budget and achieves the predetermined goals. The goals with the
examined change project have been discussed in the report, but needs to be further developed by
the project team that will lead the execution of the change strategy. It needs to be taken into
consideration that it can be difficult to define the exact goals before a change strategy is executed.
Thus, changing circumstances in long change project may lead to necessary redefinitions of the
goals.
The definition of a change project is also important to consider. For example, a construction
project where a house is built is not seen as a change project since it involves doing something
entirely from the beginning. Instead a change project is a project in which exist current processes
and procedures needs adoption due to a change.

47
7.2 Reflections on Research Question 2 The second research question was “How should this change model be structured in order to
introduce a tracking system in the studied case company?” The answer to this question is
presented in Chapter 4-6 and summarized in Chapter 8.1.
In Chapter 5.1, the stakeholders were divided into four profiles; SoD partners, administration,
sponsors and truck drivers. When deciding these profiles, the truck drivers and SoD partners ware
obvious choices. However, the division of administration and sponsors were more unclear and
here, delimitations were made. Administration could have been divided into more profiles, such
as planning, cross-dock administration and sales. However, it was chosen to merge all of these
roles to one since they have a similar interface with the tracking system and had similar point of
views regarding the change. The sponsors were defined as those employees that will not have
contact with the tracking system in the daily work. However, they will finance and support the
project on an upper level and were therefore important to analyze. As stated before, the customers
(such as Systembolaget, restaurants and bars) were not included in the stakeholder analysis. This
since they are not involved in the change project. It could however have been profitable to get
their point of view in order to understand how their satisfaction can be improved by the tracking
system and use this information as a driving force for the stakeholders. It was chosen not to do
this due to the limited time.
The strengths of the driving and restraining forces have been estimated by the researchers
through taking into consideration how important every factor is for the individual stakeholders.
When conducting a qualitative research it can be hard to transform qualitative data to quantitative
data. This transformation has been improved through comparing the forces against each other and
then validating the strengths with the stakeholders. The possible increase of the willingness has
been estimated in collaboration with the stakeholders. Some of the identified forces correlate with
each other and therefore the increase of one force may have an effect on several forces. This
means that one action can have an effect on several forces and thus have a larger effect. One
could therefore argue that some of the forces should be jointed in order to give a more even-
handed result. However, all identified forces have been expressed by the stakeholders to have a
motivating force by itself and will therefore individually affect the stakeholder’s willingness and
it is because of this it has been chosen to separate them.
It has been identified as important to increase the stakeholder’s willingness to change and
therefore, actions have been identified to do this. These actions should be taken before the
implementation in order for the stakeholders to be willing to change. However, it can be
discussed how high the willingness to change should, or need to be in order for the change to be
successful. The theory regarding the force field analysis simply states that the driving forces
should be greater than the restraining forces in order for change to happen. In the research at
Carlsberg, the truck drivers have the lowest willingness to change with a current strength of two,
with the potential to increase it to seven. Since their willingness is positive, it is high enough to
change according to the theory. However, they are the least willing to change among the analyzed
stakeholders. It is therefore recommended that the main focus of increasing the willingness
should be directed to the truck drivers.
The change process in Chapter 5.4 is sorted by which actions that should according to the
researchers be completed first, in which some of the actions can be done simultaneously.

48
However, not all actions in one stage need to be completed before the next stage. The change
processes presented is recommended, but in the end it is up to the project leader to identify which
actions that actually needs to be done in that exact order and which actions that can be moved.
In Chapter 6, several KPIs were chosen to be measured during and after the introduction of a
tracking system. Carlsberg’s customer satisfaction index (CSI) is likely to increase by using the
tracking system and this is a focus area for Carlsberg to improve in. With the tracking system,
both Carlsberg and the researchers believe that this index will increase and it should therefore be
an important KPI. However, in this research this CSI index has been excluded, due to the low
ability to directly relate an increase or decrease to the tracking system. CSI is a long time
measurement dependent on feelings and experiences by the customer. This measurement is
affected by a wide range of factors as delivery, advertisement, service and new products
etc. Therefore, it will not be possible to draw direct parallels between the implementation of the
tracking system and the measured KPIs.
It has been identified that Carlsberg are not doing adequate follow-ups in their change projects.
This leads to lacking motivation for further change since it is not clearly stated how the change
project is proceeding. Also, it is not presented when the change projects are considered done and
how they went. This has been touched upon in the research. However, it could have had a larger
focus since it is important to motivate and consolidate the change. It was chosen not to focus
more on this because it is considered to apply mostly to the consolidation part of change
management.
7.3 Reflections on Research Question 3 The third research question was “What can be learnt regarding introducing a new technology in
an organization?” This research has found that the stakeholders that will use the technology are
the most important factor to consider. This since the technology fulfills no purpose without the
user.
It is often assumed that everyone has similar opinions about a proposed change and that if one
person is positive, everyone will be. In this, it is often forgotten that more people are affected by
the change than expected. Within this, the inter-functional view is not always considered in
proposed changes. For example, in this research it was obvious that the truck drivers would be
affected by the change. However, after interviews it was also discovered that administrational
function such as planning was more affected than originally considered. Another thing that has
been learnt is that all stakeholders, even though they are overall positive to the change, will
experience restraining forces to change. It is important to identify which restraining forces this is
in order to evaluate their importance and if necessary identify actions to reduce them.
During the research one thing that appeared is that inadequate communication may be a reason
why many change projects fails. This could be because that the person in conduct sees the project
and its reasons as obvious meanwhile the stakeholders not at all sees the change in the same way
as the conductor, which may cause uncertainty and misunderstanding during the process. The
researchers thinks that communication needs to be adopted to the situation and is thereby hard to
preplan. However in the change process some communication channels that have been identified
to be particular important have been stated, as for example in order to receive the feedback from
the truck drivers and forwarder it to the programmers for continues updates.

49
7.4 Reflections on Research Question 4 The fourth research question was “To what extent is the developed change strategy generalizable
to other change projects?” Some parts of the change strategy that has been developed for
Carlsberg can in fact be used on other, similar companies. For example the force field analyzes
created for the different stakeholder profiles “administration”, “sponsors” and “truck driver” are
possible to generalize to other distribution companies. In this, some of the forces may have to be
excluded and the strength of some may have to be modified. The force field analysis for the “SoD
partners” is more difficult to generalize since it is based on a business relation between Carlsberg
and the SoD partners, which may not function the same way in other companies. In addition to
the force field, the principles and templates used when creating the risk assessment and deciding
resources and budgeting can be generalized to other change project. However, the specific
content of these analyzes needs to be adapted to the circumstances.
Throughout this research, it has been learnt that all change project will need special adoption to
the type of change and the context of the company. Also, even though it can be possible to
generalize the different force field analyzes, it is strongly recommended to consult representative
from the stakeholder groups in the affected company anyway. This since the change can be
grounded in the company when talking to stakeholder and also since new forces might surface
when letting the stakeholders express their opinion. Thus, the force field analyzes created for
Carlsberg may be used as guidelines to other distribution companies, but should not be used as
absolute truths.
7.5 Reflections on methods and limitations Methodological triangulation has been used to collect and analyze data. A limitation of this is that
replication of the research become more difficult. The reliability of this research is considered
low and it is therefore difficult to replicate the research. This depends mainly on the many
different interviews and observations. The fact that the researchers have worked in close contact
with Carlsberg, in their Swedish headquarters in Solna, causes additional difficulties to replicate
the research. This since daily contact with employees at Carlsberg may have affected the results.
Another limitation of methodological triangulation is that the research is time consuming. In this
research, over 30 interviews and additionally 5 observational studies have been conducted. This
was time consuming and it was therefore necessary to make other delimitations in the
methodology. For example, it was chosen not to transcribe the interviews since there was not
enough time available for this.
Methodological triangulation with qualitative data was chosen since it gives an accurate view of
the phenomena under research. Thus, the validity of the research is high due to the chosen
methods. Since the research aims to research how a tracking system can be introduced in
Carlsberg, it was considered more important to have high validity than reliability.
A limitation of the research is that a time plan for the change strategy has not been possible to
estimate due to the uncertainties regarding available resources from Carlsberg. However, the time
span for specific actions could have been possible to estimate. This has not been done since it is
considered preferable to do this together with the responsible person for the specific action.

50
7.6 Reflections on ethics and sustainability In this research, all participation has been voluntary. This means that no one has been forced to
take part of the research and no rewards have been given to participant. Also, all participants
have been allowed anonymity in the report if they desired. The interviewed truck drivers wanted
this and have therefore been kept anonymous throughout the report.
When Carlsberg start using a tracking system, it is likely to result in a higher effectiveness in the
distribution system. Thus, an ethical issue is that it may lead to an excess of resources and
therefore result in layoffs. An example of this is that today one employee check of all goods
manually before loading in Falkenberg, which with a tracking system will be unnecessary.
However, the aim of implementing a tracking system is not to lay off employees, but rather to
reallocate the resources to other, more long-term beneficial, tasks.
Another ethical issue that has been touched upon during this research is whether or not truck
drivers would be too controlled in their daily work with a tracking system. This since it could be
possible to track when the truck drivers were at what location. However, since the time for
scanning will not be stated on the website representatives from Carlsberg that works close to the
union does not consider this to be a problem.
There are three parts of the sustainability concept; social, environmental and economic. The
introduction of a tracking system in Carlsberg will have small impact on all three. It has in this
research been attempted to increase the impact on social sustainability by considering the
opinions from many stakeholders. Also, suggestions for increasing stakeholder willingness to
change have been stated in the report. If the stakeholders are willing to change, it is more likely
that their rights and desired has been taken into consideration. The tracking system will also lead
to more available information for administration, which in turn can lead to better working
conditions and lowered stress on employees. Thus, the social sustainability is affected positively.
The environmental sustainability will be improved since less incorrect deliveries and returns
minimize the number of additional transports and external shippings. However, it is unclear how
large the actual effect on the emissions this will have and it is probably low compared to the
company’s emissions for transport today. A lower number of additional transports also have a
positive effect on Carlsberg’s finances. This, together with a higher customer satisfaction and
other benefits that will come from the tracking system, will in the long run have a positive effect
on Carlsberg’s economic sustainability.

51
8. Conclusion In this chapter, the final conclusions of this research are presented. This chapter provides the
reader with advice on how to conduct the implementation of a tracking system in Carlsberg
Sweden.
The objective of this research was to investigate how to formulate and apply a change model
aiming to introduce a new technology in an organization. This in order to provide the studied case
company with a change strategy that can be used when introducing a tracking system. In chapter
8.1, the change model is presented and in chapter 8.2 the results from applying it to Carlsberg are
summarized.
8.1 The Change Model The conducted research shows that there are three important areas that need to be handled in
general when conducting a change. These are the Required Change, the Change Process and the
Measurements and have been used to build up the change model, which can be seen in Figure 15.
Figure 15. The change strategy.
The first step in formulating the change strategy is to identify the required change. This is done
by mapping the current state in order to create a future state, based on desirable improvements. It
is then possible to identify what changes needs to be conducted in order to transform the
organization from the current to the future state. It might be necessary to change processes,
procedures, resources and documentation.
Step two is to build up the change process based on needed actions. The actions are identified by
conducting a stakeholder analysis, a risk assessment and mapping the needed resources and
budgeting. In this, the stakeholder analysis is of great importance since this aims to increase the
Chan
ge
Str
ateg
y
What is the required
change?
Current State
Future State
How to build up the change process?
Stakeholder Management
Risk Assessment
Resources & Budgeting
How will the change be measured?
Short-term Measurement
Long-term Measurement

52
willingness for change in the organization. That the willingness to change is high is often a
success factor in change projects and thus important to plan for. In the stakeholder analysis, the
stakeholder should be consulted in order to understand the effect the change will have upon them.
In this, driving and restraining forces as well as actions to increase drivers and decrease
restrainers should be identified. Also, potential risks with the project needs to be identified and
actions to reduce those risks included in the change process. The risks are identified through
brainstorming and divergent thinking together with the stakeholders. They are then scaled by the
probability that they will occur as well as the impact they would have on the project. These
actions together with the actions to increase the willingness are the foundation of the change
process. When the stakeholder analysis and the risk assessment are done, resources and budgeting
to perform the identified actions can be decided. By doing this, the correct resources can be
assigned to the project.
The third step is to measures the progress of the project. This is done in order to ensure that the
implementation has reached the desired objectives both in short- and long-term measurements.
Short-term measurements are mainly used to motivate further action in the change process while
long-term measurements aims to measure the progress and improvements related to the change.
8.2 The Change Strategy for Carlsberg By applying the model to Carlsberg, from the top left corner and working down, a change
strategy for implementing a tracking system in the organization has been formulated. The content
of the change strategy can be summarized in the following steps:
1. In the current state in Carlsberg, problems are related to difficulties to track goods, which
in turn results in incorrect deliveries and lost returns. Also, the lengthy informational flow
towards customers wants to be shortened in order to increase Carlsberg’s professionalism.
The future state, where Carlsberg have no wrong deliveries or lost returns and have
control over their delivery chain is reached by implementing a new tracking system that is
used to scan pallets, accompanied with a website containing information regarding
deliveries and returns. This technology will change the distribution process and lead to
changed routines for all stakeholders.
2. In the research, the most important factor to ensure a smooth implementation has been
identified as engagement and involvement of the stakeholders. Three of the four identified
stakeholders; the SoD partners, the administration and the sponsors are motivated to
conduct the change. However, the truck drivers are the ones that will make sure that the
needed information is in the system since they will scan the barcodes on the pallets. Their
workload will increase and they do not directly see all the benefits with the system.
Therefore, they are the least willingness to change. In order to ensure a smooth
implementation, it is important to focus on increase the truck driver’s willingness to
change. This can be done by:
Increasing the driving forces
Decreased risk for incorrect deliveries, by explaining how this will result in a
better service and fewer work tasks as manually searching for incorrect deliveries.
Increased ability to prove deliveries, by explaining how the system can help the
truck drivers prove their deliveries in case of a dispute.

53
Increased customer satisfaction, by communicating how the system can help the
truck drivers to provide the customer with better information, which in turn will
lead to higher professionalism.
Decrease the restraining forces
Additional work, by facilitating the usage of the system and have communication
channels where feedback for improvements is brought to the right person for
development.
Time consuming, by explaining how the small amount of time for every extra
scanning is compensated by the guarantee that all deliveries are correct from the
beginning.
Changed routines, by the methods education, facilitation and participation which
are further discussed in Chapter 5.1.5.
Increased risk for technical problem, by close communication with the person
responsible for the systems operation for continuous upgrades.
3. Six of the identified risks have been evaluated to be the most critical for the project.
Therefore, actions to reduce these risks should be performed before the implementation
starts. These six risks and their corresponding actions can be seen in Table 11.
Table 11. Actions to reduce the most critical risks in the project.
Risk Action to reduce the risk
2. The sponsors stop engage in the work due
to other engagements Clearly explain the benefits of this project and how
every sponsor will benefit from it. Also, book the needed
time in their schedule and facilitate the implementation
so it is as easy as possible for them. 4. SoD partners take too much time to
upgrade their system Help them prepare for the system upgrade and help them
with the change. 5. Start-up problems with the system occur,
which affects the roll out of the
implementation
Use a testing group to identify bugs for updates. Try the
system and implementation in one distribution city at a
time to maintain the focus. 9. Communication problem occurs due to
distance between sponsors, administration
and drivers
Establish communication channels and regular occurring
meetings with an agenda to go through if any problem.
11. Carlsberg does not conduct adequate
follow-ups Clearly state the importance of follow-ups for the
sponsors and other responsible in the project. 14. The truck drivers are not motivated to use
the tracking system properly Complete the identified actions to increase the truck
driver’s willingness to change.
4. The needed resources to succeed with the implementation of the tracking system consist
of five key roles. A short explanation of these roles can be seen in Table 12.
Table 12. The key roles identified in the project.
Role Responsibility
Project Leader Overall responsibility over the project
Implementation Manager Overall responsibility over the implementation at the specific cross-dock
Operation Manager Responsible of the running of the tracking system, communication with the
developers and future developments
Change Agents Drivers and administrators with deeper knowledge who will works as

54
communication channels and advocate the change
SoD Manager Responsible person at SoD partners for their development
5. Before and after the implementation of the tracking system, the measurements presented
in Table 13 should be measured. The progress of the change needs to be presented to the
stakeholders during follow-ups. In these, it should be stated what has been done so far,
how it went, what can be done better next time and measurements of the outcome. By
doing this, the stakeholders get a sense of belonging and it is possible to consolidate the
change and bring up feedback.
Table 13. The KPIs that should be measured during and after the implementation.
Key Performance Indicator (KPI) Short-term Long-term
PO6 (delivery in time) X
PO7 (correct delivery to customer) X
Number of complaints X
Number of reclaims X
Number of incorrect deliveries X X
Time spent looking for pallets X X
Number of external shippings X
Number of cross-docks with tracking system X
Costs X
Cost savings X
8.3 General Learnings During the research, the change model presented in chapter 2.4 have been questioned and
confirmed by input from interviews and observations. It have been learnt that the most important
part, which often is underestimated in a change project, is to consider and involve the
stakeholders. By doing this, it is possible to increase their willingness to change. This is the factor
that can make a project successful or not completed due to uncommitted people. Further, when
the new technology has been introduced in the company, stakeholder’s willingness is still
important since they need to use and adapt the new technology to their daily work routines.
It have been stated that the change model is generalizable to other change projects that is similar
to the examined, such as when a new technology or organizational strategy is going to be
implemented in an organization. The generalizability of the model is high since it is based on two
different change models with different approaches. Mumford’s change model is adopted for all
implementation of IT-system and Kotter’s change model is general for all change projects.
However, for example projects where something is created as software the change model needs to
be extended to include the building process.
Regarding the applied change strategy for Carlsberg, it is partly generalizable. The force field
analyzes for the stakeholders can be generalizable to other distribution companies that wants to
introduce a tracking system. This since the drivers, administration and sponsors are affected by
similar forces. The relationship between the SoD partners and Carlsberg is seen as specific and
may therefore not be generalizable. However, the force field analyzes should not be seen as truths
since new forces may emerge when consulting stakeholders. They may instead be used as
guidelines. Further, the change process can be used as a guideline for another distribution

55
company, but it will need special adoption. It is therefore concluded that the formulated change
strategy for Carlsberg is not fully generalizable.
8.4 Future Research This research is relevant for understanding how to implement a new technology in an
organization. It the theoretical framework, a change model was formed based on findings from
literature. This model was the applied to the case of introducing a tracking system in Carlsberg
Sweden. Therefore, the final change strategy is company specific and may not be directly applied
to other settings. Thus, validating the general model for different implementation projects is
future research. Further, this research have brought up the three stages in an implementation
process; preparation, implementation and consolidation. However, the focus have been on the
first part; preparation. It would in future research be interesting to validate the applied change
strategy by following it when implementing the tracking system in Carlsberg Sweden. Thereby,
room for improvement and further development can be found. Future research should also
consider developing the methods to consolidate the change in Carlsberg.

56
References Angulo, Ignacio, et. al. “Towards a Traceability System Based on RFID Technology to Check the
Content of Pallets within Electronic Devices Supply Chain.” International Journal of Antennas
and Propagation (2013).
Ayres, Lioness, Karen Kavanaugh, and Kathleen A. Knafl. “Within-case and across-case
approaches to qualitative data analysis.” Qualitative health research 13.6 (2003): 871-883.
Bhatt, Tejas, et al. "Making Traceability Work across the Entire Food Supply Chain." Journal of
food science 78.s2 (2013): B21-B27.
Burnes, Bernard and Cooke, Bill “Kurt Lewin's Field Theory: A Review and Re‐evaluation.”
International Journal of Management Reviews 15.4 (2013): 408-425.
Cameron, Esther and Green, Mike “Making sense of change management: a complete guide to
the models tools and techniques of organizational change” Kogan Page Publishers (2012).
Carbery, Ronan, and Thomas N. Garavan. “Organisational restructuring and downsizing: issues
related to learning, training and employability of survivors.” Journal of European Industrial
Training 29.6 (2005): 488-508.
Carlsberg Group “Annual Report” (2013).
Carlsberg Group “Carlsberg at a glance” (2015a) [Online] Available at:
http://www.carlsberggroup.com/Company/Strategy/Pages/Facts.aspx [30 Jan 2015].
Carlsberg Group “The Carlsberg Group around the world” (2015b) [Online] Available at:
http://www.carlsberggroup.com/Markets/Pages/Around_the_world.aspx [28 Jan 2015].
Carman, Michael (Michael Carman Consulting) “Force Field Analysis” (2013) [Online]
Available at: http://www.mcarmanconsulting.com/forcefieldanalysis.php [16 April 2015].
Collis, Jill, and Hussey, Roger “Business research” Pan Macmillan (2013).
Custers, B.H.M. “The Power of Knowledge” Tilburg:Wolf Legal Publishers (2004).
DeLayne Stroud, Jeff “The Implementation Plan – Getting Beyond the Quick Fix” (2012)
[Online] Aviable at: http://www.isixsigma.com/implementation/deployment-structure/
implementation-plan-getting-beyond-quick-fix/ [6 Mars 2015].
Dolata, U. “Technological innovations and sectoral change: Transformative capacity,
adaptability, patterns of change: An analytical framework” Research Policy, Vol. 38(6) (2009)
pp.1066–1076.
Drucker, Peter F. “Management’s new paradigms.“ Forbes Magazine 10 (1998): 98.
Easterby-Smith, Mark, Richard Thorpe, and Paul Jackson “Management research” Sage (2012).

57
Eisenhardt, Kathleen M. “Building theories from case study research.” Academy of management
review 14.4 (1989): 532-550.
Emery, F. E. and Trist E. L. “Socio-technical systems” in Emery, Fred Edmund. Systems
thinking. Penguin Books (1969) pp. 281-296.
Exodea Consulting “Planning” (2012) [Online] Avaliable at:
www.exodea.com/index.php?option=com_content&view=article&id=64&Itemid=101 [17 Mars
2015]
Fassin, Yves “Stakeholder management, reciprocity and stakeholder responsibility.” Journal of
Business Ethics 109.1 (2012): 83-96.
Frooman, Jeff “Stakeholder influence strategies.” Academy of management review 24.2 (1999):
191-205.
Galvin, Ray, and Sunikka-Blank, Minna “The UK homeowner-retrofitter as an innovator in a
socio-technical system.” Energy Policy 74 (2014): 655-662.
Geels, Frank W. “Technological transitions as evolutionary reconfiguration processes: a multi-
level perspective and a case-study” Research policy 31.8 (2002): 1257-1274.
Geels, Frank W. “Technological transitions and system innovations: a co-evolutionary and socio-
technical analysis.” Edward Elgar Publishing (2005).
Gillham, Bill “Case Study Research Methods.” London, GBR: Continuum International
Publishing, (2010).
GS1 “Business Process and System Requirements for Full Supply Chain Traceability”. GS1
Standards Document, GS1 Global Traceability Standard. Issue 1.3.0, November (2012).
GS1 “How we got here” (2015a) [Online] Avaliable at: http://www.gs1.org/about/how-we-got-
here [2 April 2015]
GS1 “Serial Shipping Container Code (SSCC)”. The Global Language of Business (2015b).
Hughes, Mark “Do 70 per cent of all organizational change initiatives really fail?.” Journal of
Change Management 11.4 (2011): 451-464.
Hughes, T. P. “Networks of Power: Electrification in Western Society, 1880-1930.” Baltimore:
Johns Hopkins University Press (1983).
Jaquet-Chiffelle, David Olivier. “Reply: Direct and Indirect Profiling in the Light of Virtual
Persons. To: Defining Profiling: A New Type of Knowledge?” In Hildebrandt, Mireille;
Gutwirth, Serge. Profiling the European Citizen. Springer Netherlands (2008) pp. 17–45.
Kotter, John P. “Leading change: Why transformation efforts fail.” Harvard business review 73.2
(1995): 59-67.

58
Kotter, John P. “Leading change.” Harvard Business Press, (1996).
Kotter, John P. “Force for change: How leadership differs from management.” Simon and
Schuster, (2008).
Kotter, John P., and Schlesinger, Leonard A. “Choosing strategies for change.” Harvard business
review 86.7/8 (2008): 130.
Leitch, Shona, and Warren, Matthew J. “ETHICS: The Past, Present and Future of Socio-
Technical Systems Design.” Springer Berlin Heidelberg (2010).
Lewin, Kurt “Field Theory in social Science.” Social Science Paperbacks: London (1952).
Moran, John W. and Brightman, Baird K. “Leading organizational change”, Career Development
International (2001), Vol. 6 Iss 2 pp. 111 – 119.
Mumford, Enid “Effective systems design and requirements analysis: the ETHICS approach.”
Macmillan, (1995).
Mumford, Enid “Dangerous decisions: problem solving in tomorrow's world.” Springer Science
& Business Media, (1999).
Mumford, E., Ward, T.B. “Computers: Planning for People.” Batsford Limited (1968), UK.
Paton, Robert A., and McCalman, James “Change management: A guide to effective
implementation.” Sage (2008).
Scapens, Robert W. “Researching management accounting practice: the role of case study
methods.” The British Accounting Review 22.3 (1990): 259-281.
Skinner, Denise; Tagg, Clare and Holloway, Jacky. “Managers and Research The Pros and Cons
of Qualitative Approaches.” Management Learning 31.2 (2000): 163-179.
Tang, Lei; Wang, Xufei and Liu, Huan “Understanding Emerging Social Structures — A Group
Profiling Approach”, Technical Report, TR-10-002, School of Computing, Informatics, and
Decision Systems Engineering, Arizona State University, Tempe, AZ, 85287 (2010).
Todnem By, Rune. “Organisational change management: A critical review.” Journal of Change
Management 5.4 (2005): 369-380.
Wang, G. G. and Sun, J. Y. “Change Management” in The Encyclopedia of Human Resource
Management: Short Entries (eds W. J. Rothwell and R. K. Prescott), Pfeiffer: A Wiley Imprint
(2012), San Francisco, CA.
Werner, Jon M. and DeSimone, Randy L. “Human resource development.” Cengage Learning,
(2011).
Wihlborg, Elin, and Söderholm, Kristina “Mediators in action: Organizing sociotechnical system
change.” Technology in Society 35.4 (2013): 267-275.

1
Appendix 1: Detailed interview information
Name Company Position / Field of Research Location Length
Henrik Pettersson Carlsberg Regional Distribution Manager Solna 60 min
Jonas Kudermann Carlsberg Customer Supply Chain Director Solna 60 min
Kenneth Hjelm Carlsberg Business Process Manager Logistics Solna 30 min
Jan Aas Carlsberg Supply Chain System Manager Telephone 30 min
Lars Norenius Carlsberg Warehouse Process Manager Årsta 30 min
Roger Åkesson Carlsberg Terminal Manager Årsta 30 min
Jonas Tångring Carlsberg Head of Manual Warehouse Falkenberg 60 min
Mark Jensen Carlsberg CEO Sweden Stockholm 30 min
Veronika Möller Carlsberg EDI Responsible Stockholm 60 min
Daniel Elander Carlsberg Distribution Manager, East Stockholm 60 min
Emil Bengtsson Carlsberg Sales Falkenberg 60 min
Josephine Torstensson Carlsberg Sales Falkenberg 60 min
Mikael Nielsen Carlsberg Delivery Planner Falkenberg 60 min
Jimmy Pettersson Carlsberg Truck Driver and Administration Västerås 60 min
Driver 1 Carlsberg Truck Driver Årsta 15 min
Driver 2 Carlsberg Truck Driver Årsta 15 min
Driver 3 Carlsberg Truck Driver Årsta 15 min
Peter Jönsson GS1 Business Manager Stockholm 120 min
Mats Björkqvist GS1 Head of Standards & Implementation Stockholm 120 min
Lena Christensson-Jones Altia Customer Service Manager Brunna 60 min
Håkan Björklund Altia Transport Manager Brunna 60 min
Linnea Lektér KGA Transport Manager Karlskoga 90 min
Roger Törnkvist KGA CEO Karlskoga 90 min
Jenny Lindblom KGA Sales Supervisor Telephone 30 min
Dennis Norström Skanlog Customer Service Manager Eskilstuna 60 min
Lena Mårtensson KTH Industrial Management Stockholm 60 min
Björn Thuresson KTH Computer Science and Communication Stockholm 60 min

1
Appendix 2: Interview guidelines (Carlsberg)
The following questions were asked during the interviews with employees at Carlsberg (the
interviews were held in Swedish):
Vad har du för roll/ansvarsområden?
Vad gör din avdelning på Carlsberg?
Vad tror du om detta projekt?
Vad ser du för problem med dagens distributionssystem?
Hur hade lösningen hjälp dig i ditt dagliga arbete?
Ser du några fördelar som kan medbringas ett spårningssystem?
Ser du några nackdelar med ett spårningssystem?
Vad för funktioner skapar värde för er?
Övriga synpunkter?

1
Appendix 3: Interview guidelines (SoD)
The following questions were asked during the interviews with the SoD partners (the interviews
were held in Swedish):
Initialt, vad tror ni om detta?
Ser ni själva några fördelar som kan medbringas ett spårningssystem?
Vad för funktioner skapar värde för er?
Hur tar de emot orders? Hur registreras dem? I vad för system?
Vad använder de för standard för streckkoder, vad finns lagrat i dagens streckkod?
Har de POn som är kopplat till orden, produkterna, kunden och leveransadress?
Vilken info ger de till Carlsberg? Är det någon känslig information som de inte vill ge
vidare till Carlsberg? (någon av SoD rapporterar ju bara vikten på leveransen och ej antal
pallar, problem)
Vad har de för leverantörer från lager till Carlsberg? Hur får ni leveransbekräftelse från
dem? Märker de om några pallar?
Hur fungerar ert system för fraktsedlar? Vilken information vill ni ha gällande
leveransbekräftelsen?
(Fick vi svar på hela deras informationsflöde?)

1
Appendix 4: Interview guidelines (GS1)
The following questions were asked during the interview with GS1 (the interview was held in
Swedish):
Använder Carlsberg GS1 streckkoder/era standardiserade streckkoder?
Hur fungerar skapandet av en streckkod, hur lång är processen?
Kostar en standardiserad kod något?
Man kan inte blanda informationen i en streckkod, vad innebär det?
Är det ni som skapar streckkoderna eller kan företaget/Carlsberg skapa egna utifrån sina
PO: nr?
Om de är standardiserade, betyder det att alla med ett GS1 system kan läsa av
streckkoden?
Finns det streckkoder som inte är kopplade till era standardiseringar? Varför används isf
dessa? Finns det några fördelar/nackdelar med detta?
Krävs någon speciell streckkods-skanner/system för avläsning?
Dubbelpallar som ska delas, en dubbelpall har två likadana streckkoder, går det att ha den
informationen i koden eller systemet så att det måste skannas två pallar för att den
leveransen ska vara godkänd?
Till vilken information kan man koppla en streckkod till? Vad har den för begränsningar?
När måste man gå över till tex QR-kod?
Tips om ett bra benchmarkingföretag utöver posten?
1
Appendix 5: Interview guidelines (KTH)
The following questions were asked during the interviews with the professors at KTH, Björn
Thuresson and Lena Mårtensson (the interviews were held in Swedish):
Björn Thuresson
Vad är du professor inom idag?
Kan du kort beskriva hur du har arbetat med införandet av IT system tidigare?
Spontana tankar kring vårt exjobb?
Vad är skillnaden på att inför ett IT system jämfört med en annan förändring?
Hur motiverar man människor att börja använda systemet?
Hur förankrar man systemet i företaget?
Har du arbetat enligt några modeller som finns i litteraturen (typ Mumfords ETHICS)?
Har du konkreta tips på hur man skriver användarmanualer/håller i utbildningar etc.?
Vår lösning ska programmeras av extern part och vi har då skrivit ihop en
kravspecifikation på hur hemsidan ska se ut/vilken information den ska innehålla.
Konkreta tips på hur man designar en sådan hemsida för att det ska bli enkelt för
användarna att förstå/använda den? Vi tänker oss typ en liknande Posten hemsida där man
kan skriva in ett Pall-ID för att söka upp pallen.
Lena Mårtensson
Vad tycker du om vårt upplägg?
Kan du kort beskriva tidigare forskning du har genomfört inom förändringsarbete?
Vi har valt att använda eight-stage process av John Kotter samt force field analysis av
Kurt Lewin
o Är du bekant med dessa modeller?
o Anser du att det är bra modeller för oss att använda i denna forskning?
o Har du exempel på andra modeller som du anser är bra?
Hur motiverar man en förändring i alla led av företaget?
Vad anser du att man ska använda för metoder i ett sådant här arbete?
Har du förslag på forskning/forskare som du tror kan vara passande i vårt arbete?
Har du förslag på ytterligare personer vi kan intervjua på KTH?
1
Appendix 6: Interview guidelines (phase 2)
The following questions were asked during the interviews in phase 2 (the interviews were held in
Swedish):
Presentation av intervjupersonen:
Vad har du för roll/ansvarsområden?
Hur länge har du arbetat på företaget?
Frågor om spårningssystemet:
Hur ser du på denna förändring?
Vad för problem i ditt dagliga arbete kommer detta system förbättra, kommer det
försämra något i ditt arbete? (tex. bättre för att lättare att göra rätt, sämre för att det
medför mer arbete)
Vad kommer detta system förändra i ditt dagliga arbete? (rutiner, arbetssätt etc.)
Vad ser du för för- och nackdelar med detta nya system?
o Varför är detta positivt resp. negativt?
Vilka kortsiktiga/långsiktiga resultat ser du med detta projekt?
Hur tror du Carlsbergs framtid påverkas av implementeringen av detta system?
o Mer eller mindre konkurrenskraftiga?
o Mer eller mindre effektiva?
o Hur påverkas kundrelationerna?
Vilka risker ser du med implementeringen av detta system? Finns det något som du tror
kan förbises eller som man måste fokusera extra på i processen?
o Hur tror du att man kan minimera dessa risker?
Vad behöver ni för att en implementering av detta slag ska vara möjligt? (introduktion av
systemet/workshops, en handbok som beskriver funktionen, handledning av en person)
Vilka personer skulle vara passande för att leda implementeringen och vilka
egenskaper/kunskaper är viktiga hos dessa människor?
Skulle du vilja ha en större del i denna planering? tex vara först ut med användandet av
det nya systemet?
Anser du att dina krav/önskemål på systemet är likadana som övriga chaufförers krav i
landet? Finns samma behov hos chaufförer på din x-dock?
Allmänna frågor:
Har du varit involverad i någon större förändring på ert företag tidigare?
o Hur hanterades denna?
o Vad hade man kunna gjort annorlunda?
Fick du vara med att påverka?

1
Appendix 7: Interview guidelines (consultant
advisory) The following questions were asked during the interviews with the consultants (the interviews
were held in Swedish):
Har du själv drivit några implementeringsarbeten? Eller har du medverkat i
implementerings-arbeten? Och i så fall vad var din roll i det arbetet?
o Vad har det vart för sorts implementeringsarbete?
Hur planerar du inför en implementering?
o Vilka steg/faktorer är det som är viktiga?
o Finns det några steg/faktorer som är mindre viktiga och som du därför kanske inte
planerar inför utan tar det som det kommer?
Har du vart med i ett speciellt lyckat implementeringsarbete?
o Vad var det som gjorde att det vart särskilt lyckat?
Har du vart med om ett implementeringsarbete som inte vart så lyckat eller nådde upp till
målen?
o Varför uppnåddes inte målen?
o Vad var dina lärdomar från det? Vad skulle kunna ha gjorts bättre?
Om du själv har genomfört implementeringar, utgår du då ifrån en standardiserad modell
vid planeringen eller gör du vid varje nytt arbete en ny implementeringsplan från scratch?
o Om du har en modell, vad är det för modell? (hens egna, företagets eller välkänd)
Vad skulle du vilja belysa när det gäller implementeringsarbeten?

1
Appendix 8: Key roles and their responsibilities
Role Responsibility
Project Leader
Overall responsibility over the strategy of the project
Identify key persons, Implementation manager, Operation manager, SoD
manager
Encourage the SoD partners for the system upgrade needed
Decides who and when a cross-dock makes the implementation
Ensures that the implementation model is followed
Implementation
Manager
Overall responsibility over the implementation process at the specific cross-dock
Inform and arrange for the education of both administration and drivers
Identify and nominate change agents
Receive feedback and further it too right person
Operation Manager
Responsible of the running of the TS, communication with the developers and future
developments/improvements
Ensure so that the software can be downloaded to HHT
Responsible for all start-up problem associated to the software
Receive feedback
Responsible over the development of the software and communication with the
software developer
Change Agents
Persons with deeper knowledge at every cross-dock. Who will works as communication
channels and advocate the change
Have a deeper knowledge of the system in order to educate and answer questions
from others
Advocate the change and help the implementation process
Receive feedback and further it to the right person
SoD-Manager
Responsible person at SoD partners for their development
Responsible for updating their system
Inform all affected at the company
Education of the affected
Receive feedback and forward it to the project leader