FORGING AHEAD - Pepsi-Cola Products Philippines, Inc.
74
Pepsi-Cola Products Philippines, Inc. 2009 ANNUAL REPORT FORGING AHEAD
-
Upload
khangminh22 -
Category
Documents
-
view
0 -
download
0
Transcript of FORGING AHEAD - Pepsi-Cola Products Philippines, Inc.

Pepsi-Cola Products Philippines, Inc.
2009 ANNUAL REPORT
FORGING AHEAD

Cover Story
The supply chain. One element feeds – or is
fed by the other – in a cyclical process that
delivers a compelling message: We are all
interconnected. PCPPI’s supply chain is as much
a resource chain, or a chain reaction of benefits
that its business brings to Pepsi customers,
business partners, host communities and the
national community.
The product design analyst helps bring about
health drinks that, in turn, infuses energy
on people for strength and grace – like a
lady stretching nerve and muscle in a yoga
session. People exchange ideas in a meeting
for a responsive company like PCPPI, and for
community engagement. And, every day, Pepsi
products come out of the production lines
– for its date with the marketplace and the
community.
For a shared, safe tomorrow – made sustainable
by our concerted efforts to make a difference in
this Planet – we keep Forging Ahead.
FORGING AHEADWe are forging ahead – with our customers, business partners and our host communities. Pepsi-Cola Products Philippines, Inc. (PCPPI) makes giant strides entering new markets, while keeping existing ones, even amidst the turbulence and uncertainty in the market that shook the world a couple of years ago. Our new product lines, holding high the banner of health and wellness – are developing new markets that have quickly become our new growth drivers.
Thus, PCPPI forges ahead with a clear-minded focus on growth and profitability, using every corporate muscle and sinew in operations, marketing, distribution, and finance with one unwavering purpose: consistently bring higher shareholder value to the Company’s investors.
With investor support, profitability and sustainability assured, PCPPI has further strengthened its growing customer base, broadened its partnership alliance and deepened productive community engagement.
With a creditable performance recorded in 2009, the momentum has been set for PCPPI and its stakeholders to move inexorably ahead.
2 Message to Stockholders
6 Management’s Discussion and Analysis
19 Corporate Governance
23 Corporate Social Responsibility
29 Board of Directors
32 Management Team
35 Statement of Management’s Responsibility
36 Audited Financial Statements
ContentS
�
2
We are pleased to report that your
Company continued to perform
creditably during the past fiscal year,
sustaining growth in operations and profitability for
seven straight years.
Net income after tax grew by 5% to P800 million,
generated from a double-digit rise in net sales to
P14.2 billion, and derived from a marked reduction
in operating expenses. Net income margin remained
healthy.
Our gains acquired more significance when viewed
against the business conditions in which these
were achieved. Economic indicators worldwide
have deteriorated since the start of 2008, triggered
by the overheating of the US financial sector and
the resulting meltdown of global markets -- in a
magnitude that has not been reached since the
Great Depression of the 1930s. Asian economies
showed severe signs of stress and slowed down
considerably.
The Philippines was not exempted from this
vicious cycle. Your Company had to contend
with inflationary pressures and changing demand
patterns from a carbonated soft drinks (CSD) market
that was shrinking on shifts in product preferences,
and reeling under reduced consumer purchasing
power. Intensified pricing and marketing strategies
launched by competitors to protect and even grow
their share of the volatile CSD segment would daunt
the fainthearted, but the Company matched these
with equally strong moves that enabled it to grow its
volume and market share during the period.
MeSSage to StockholderS
On the non-carbonated beverages (NCB) front, the
thrust of tapping the growth potential of this product
category, with health and wellness as platform,
was intensified during the period. New variants
that carry distinct health benefits on stronger juice
content, hydration superiority, and vitamin content
were introduced. NCB products were launched in
new territories, in various packaging formats.
The economic constraints notwithstanding, the
past fiscal year proved to be rewarding for your
Company. The improvement in financial position is
credited mainly to initiatives in sales and marketing,
cost control, and operational enhancement. These
were undertaken to counter the difficult business
conditions that had initially placed our operations in
a consolidation mode at the start of the fiscal year.
These initiatives not only conferred on the Company
the needed resilience to weather the slump, but they
also injected sufficient stimulus to actively pursue
the key directional thrusts to which PCPPI has been
committed.
Significant headway was gained in the overall thrust
of driving affordability and availability of our product
portfolio. Various initiatives were undertaken
on brand positioning, new products, packaging
innovation, production capability enhancements,
distribution expansion, and pricing – all driven by
the key strategy of actively managing product mix to
respond to changes in consumer preferences and
market dynamics.
2

�
The economic conStraintS
notwithStanding, the paSt
fiScal year proved to be
rewarding for your company.
the improvement in financial
poSition iS credited mainly
to initiativeS in SaleS and
marketing, coSt control, and
operational enhancement. ”
“

�
Your Company continued to invest heavily in
enhancing CSD and NCB production capabilities.
After the enhancements in Cebu in the previous
fiscal year, capacity improvements in Iloilo and San
Fernando, Pampanga were pursued to enable us to
meet increasing demand, particularly for NCBs.
While vigorously pursuing these various revenue-
enhancement measures, the Company remained
on a strict cost-control mode throughout the year.
The result was a notable decrease in total operating
expenses, achieved amidst inflationary pressures.
We will continue to pursue our growth objectives
for the current fiscal year. A strong and committed
workforce -- with a dedicated and aggressive
management team -- will serve as our cornerstone.
The ranks will consistently be strengthened through
values formation, training, teambuilding, and
employee engagement programs.
I wish to thank all of our employees for their
focus, hard work, and discipline during this past
year’s operation, without which your Company
would not have been able to achieve its creditable
performance.
I also wish to thank my fellow Board members
for their sound advice during the past year and
shall count on their continuing counsel. This year,
we welcome to the Board of Directors Mr. John
Sigalos, Chief Financial Officer of PepsiCo’s Asia
“We will continue to purSue
our growth objectiveS for the
current fiScal year.
a Strong and committed
workforce -- with a dedicated
and aggreSSive management
team -- will Serve aS our
cornerStone.”

�
Pacific Region, and Mr. Sunil D’Souza, Country
Manager for the Philippines of PepsiCo, who will
surely make valuable contributions to the Company.
Mr. Sigalos replaces Mr. Rahul Bhatnagar, who has
assumed a new assignment in another PepsiCo
location. We thank Mr. Bhatnagar for his past
service to the Company and wish him all the best in
his new posting.
Mr. D’Souza replaces Mr. Varun Berry, who has
been appointed as the Chief Executive Officer of
a PepsiCo dairy joint venture in the Middle East.
Special mention must be made of Mr. Berry’s
invaluable contributions and service during his
eight years as Country Manager of PepsiCo in the
Philippines. We would like to express our deepest
appreciation for his involvement in our operations
and wish him all the best in his new assignment.
And, most importantly, our gratitude goes to our
customers for their loyalty, our partners, suppliers,
and distributors for their contributions -- and our
shareholders for their trust and confidence.
With the support of all our stakeholders, we are
confident that the succeeding years will be equally
rewarding for the Company.
Micky yONg
Chairman and Chief Executive Officer
Mountain Dew exhilarates with its rare great citrus taste.

�
Management’S DiScuSSion and AnalySiS
Performance at a glance
Your Company concluded the fiscal year 2009 on a high note, with clearly positive results amidst the global economic downturn,
attributable to the Company’s strategic moves to DRIVE AFFORDABILITY, ENSURE AVAILABILITY AND RESPOND QUICKLY TO CONSUMER SHIFTS TO AND PREFERENCE FOR FUNCTIONAL BEVERAGES.
While the corporate moves were mainly market-driven, the combination of marketing savvy, operational excellence, financial planning and people motivation enabled PCPPI to post a 19% growth rate in its operating income, which stood at P1.1 billion, compared to last year’s P963.5 million.
Such operating income was derived from net sales of P14.23 billion, a 10% jump from the 2008 figure of P12.98 billion. In turn, this hefty net sales figure yielded a gross profit of P4.2 billion, up from last year’s P4.1 billion.
While we increased revenues, we kept our expenses at manageable levels consistent with our productivity goals. It is noteworthy that, in 2009, our operating expenses were kept at 21% of net sales, an improvement from a year ago’s cost performance of 24% of net sales. PCPPI management’s targeted and prudent marketing program initiated in 2009 has indeed achieved significant results.
Thus, the twin strategies of maintaining a healthy revenue mix and an effective cost management have generated positive impact on our net income. More specifically, for the fiscal year June 2009, our EBIT (Earnings before Interest and Tax) grew by 17% to P1.2 billion, while EBITDA (Earnings before Interest, Tax, Depreciation and Amortization) grew by 12% to P2.2 billion. On the other hand, net income grew by
0� 0� 07 08 090
�
�0
��
20
gross Revenues(Peso in Billions)
10.58
12.80
15.06 15.2816.60
cSD-NcB Mix
0� 0� 07 08 090
0.�
�.0
�.�
2.�
2.0
EBiTDA(Peso in Billions)
1.61
2.06
2.37
1.982.21
09
2�%
7�%
20%
80%
08
8�%
�7%
07
��%
8�%
0�
9�%
7%
0�
cSD
NcB
7
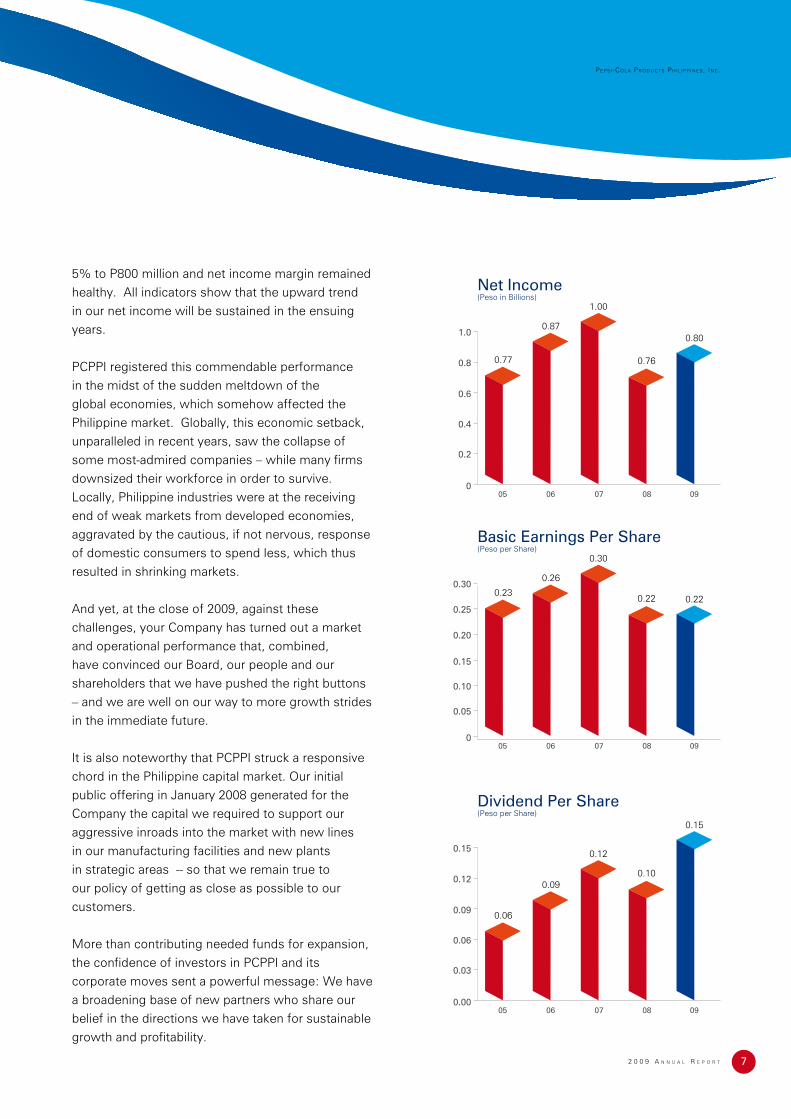
5% to P800 million and net income margin remained healthy. All indicators show that the upward trend in our net income will be sustained in the ensuing years.
PCPPI registered this commendable performance in the midst of the sudden meltdown of the global economies, which somehow affected the Philippine market. Globally, this economic setback, unparalleled in recent years, saw the collapse of some most-admired companies – while many firms downsized their workforce in order to survive. Locally, Philippine industries were at the receiving end of weak markets from developed economies, aggravated by the cautious, if not nervous, response of domestic consumers to spend less, which thus resulted in shrinking markets.
And yet, at the close of 2009, against these challenges, your Company has turned out a market and operational performance that, combined, have convinced our Board, our people and our shareholders that we have pushed the right buttons – and we are well on our way to more growth strides in the immediate future.
It is also noteworthy that PCPPI struck a responsive chord in the Philippine capital market. Our initial public offering in January 2008 generated for the Company the capital we required to support our aggressive inroads into the market with new lines in our manufacturing facilities and new plants in strategic areas -- so that we remain true to our policy of getting as close as possible to our customers.
More than contributing needed funds for expansion, the confidence of investors in PCPPI and its corporate moves sent a powerful message: We have a broadening base of new partners who share our belief in the directions we have taken for sustainable growth and profitability.
0� 0� 07 08 090
0.2
0.�
0.�
�.0
0.8
Net income(Peso in Billions)
0.77
0.87
1.00
0.76
0.80
0� 0� 07 08 090
0.0�
0.�0
0.��
0.�0
0.2�
0.20
0.23
0.26
0.30
0.22 0.22
0� 0� 07 08 090.00
0.0�
0.0�
0.09
0.��
0.�2
Dividend Per Share(Peso per Share)
0.06
0.09
0.12
0.10
0.15
Basic Earnings Per Share(Peso per Share)

8

A distinct and strong presence in the carbonated soft drinks market,
and a whole new exciting array of healthful non-carbonated drinks
riding the crest of a new generation of users created by the recent
market phenomenon with a passion for wellness and health.
9

�0
PCPPI’s strong PerformanCe was drIven by the suCCessful
exeCutIon of our strategIC moves whICh InCluded effeCtIvely
PreservIng and defendIng our market share In the Carbonated
soft drInks lInes -- Cola and non-Cola -- and aggressIvely taPPIng
the brIght growth ProsPeCts of the non-Carbonated beverages
ProduCt lInes, usIng the fast exPandIng health and wellness seCtor
as our growth Platform.
our deCIsIon to target the broad Consumer market oPened several
wIndows of oPPortunIty for PCPPI, valIdatIng our ConsIdered
assumPtIons that thIs large Customer base wIll resPond favorably
to our sImultaneous strategIes of new ProduCt InnovatIon, target-
sPeCIfIC and ComPellIng PaCkagIng and a dramatIC shIft In our
dIstrIbutIon strategy.
OvERALL StRateGy

��
WE PROTEcTED AND DEfENDED OUR MARkET ShARE iN ThE cARBONATED SOfT DRiNkS cATEgORy.
WE iNcREASED OUR PRODUcTiON cAPAciTy.
In the cola market where competition is fierce and unforgiving,
PCPPI managed to keep its market share with, in a manner of
speaking, “man-to-man guarding.” And while PCPPI is defending
its cola territory, your Company was very aggressive in pushing
such winning flavors as 7Up and Pepsi Max, and penetrating
the same market with Mountain Dew, generating enthusiastic
response from target markets.
Since our marketing offensive had no let up, our
operations group was equally upbeat: We added
production capacity in our San Fernando plant in
Central Luzon as well as Cebu and Iloilo plants
in the Visayas region. We also enhanced our
NCB production capacity in Metro Manila. This
allowed us to stay as close as possible to where
our consumers are and thus save on hauling
costs and improve margins.

�2
Gatorade, the world’s number one in hydration, will lead the pack in
penetrating an expanding market made up of health and wellness
conscious customers. Equally famous Tropicana Juicy Pulp and
Tropicana Twister have generated a strong following with its strong juice
proposition. And to complete the health and wellness “product team,”
your Company offers anti-oxidant rich Lipton, flavored vitamin water
Propel, and energy-boosting Sting – each one creating new customer
loyalties among young and old.
We enhanced the appeal of these NCBs with formats that are affordable
to the price-conscious mass markets. With the completion of our
expansion projects in San Fernando, Pampanga and Cebu that made our CSD bottling lines capable of producing
NCB products, we launched Gatorade, Tropicana and Lipton in affordable returnable glass bottles (RGB) 8-oz
format. Likewise, Sting was launched in RGB 8-oz and 330 ml polyethylene terephthalate (PET) formats.
PCPPI has therefore rightly decided to use these NCBs for aggressive market penetration and development,
triggering shifts in customer preferences -- and even creating whole new markets distinct from the CSDs.
Health and wellness consciousness has been one of the customer patterns noted in
many market scanning and research. The “bawal ang magkasakit” slogan took hold of
the young and old. PCPPI has greatly capitalized on this market phenomenon with its
new NCBs, which are experiencing dramatic growths.
Such remarkable growth has had twin impacts – first, on NCBs growing share in our
product mix and, second, on NCBs as our spearhead in creating new users. Notably,
NCBs’ share in our revenue mix has grown steadily within the last three years from
17% to 26%.
It must be quickly added, though, that this should be viewed from the broader perspective of how our two
product categories -- CSDs and NCBs – have been performing in the marketplace, chipping away from other
players’ current market share – and, significantly so, creating new markets.
WiTh hEALTh AND WELLNESS AS OUR PLATfORM, WE hAvE TAPPED ThE APPEAL AND fAME Of OUR NON-cARBONATED BEvERAgES.

��
Driven by its bid to have dominance in new products, PCPPI introduced new product innovations to match
fast-changing consumer preferences. We have introduced, for example, Tropicana Twister Summer Blends and
Gatorade Tiger. We have also created buzz in the market through new, high-impact packaging formats. For
example, we introduced Pepsi Max Black Long Neck PET and Pepsi Maxisms. The same is true for Pepsi PET
Canvass, Mountain Dew Long Neck PET, Mountain Dew 750 ml RGB, 7Up Fido and New Mirinda Look.
Never in recent history has PCPPI introduced so many products, product variants and innovations in packaging
and exciting designs as in the last three years culminating in the year 2009! The Pepsi brand and all associated
brands have created excitement and the “wow effect” among targeted markets.
And this market excitement was easily translatable to sales. In fact, so that
customer awareness moves decisively and easily to a “buy” decision RGBs have
been reintroduced in new and smaller sizes. The strong comeback of RGBs made
these new product offerings affordable since the bottles are used and reused
many times.
The bottle, by the way, immediately goes back home – that is, after the content
has been consumed. “Home,” in this sense, is a nearby PCPPI plant or warehouse
of outsourced distributors. This is all part of a distribution and production system
where distribution channels and production plants are as close as possible to the
customer.
WE NURTURED AND STRENgThENED BRAND EqUiTy ThROUgh NEW PRODUcTS AND PAckAgiNg iNNOvATiONS.

��
Our distribution network goes deep and wide with our innovative
– short of revolutionary – strategies which have a mix of modern
trade channels, third party wholesale network and, recently, the
highly energized “entrepreneurial distribution system (EDS).”
Modern trade channels consist mostly of selling directly to
supermarkets, restaurants and convenience stores chains. Third
party wholesale networks are PCPPI’s channels to retail outlets.
And the EDS – which has become the Company’s distribution
backbone – consists of independent contractors who have the
wherewithal, plus financial and operational capability, to perform
multi-function tasks in the distribution game. They service sales
routes with their own fleet of trucks, do direct selling to retail
outlets and collect returnable glass bottles.
To date, PCPPI has close to 1,000 contractors taking care of and
servicing close to 2,000 routes countrywide.
Our three-pronged strategy in distribution has yielded very
positive results. The first strategy was to enter into strategic
partnership with EDS operators and key modern trade outlets,
wholesalers and distributors.
Second, we introduced a strategic edge to our route
management resulting in new routes opened and developed,
reconfigured existing routes, and deepened outlet penetration in
both new and existing routes.
Third, we invested in returnable glass bottles, plastic shells and
in-store refrigeration equipment – all keyed to support these
outlets with affordable products in shelves and equipment that
keep them cool and refreshing.
WE ExPANDED AND DEEPENED OUR MARkET REAch ThROUgh iNNOvATivE DiSTRiBUTiON STRATEgiES.
��
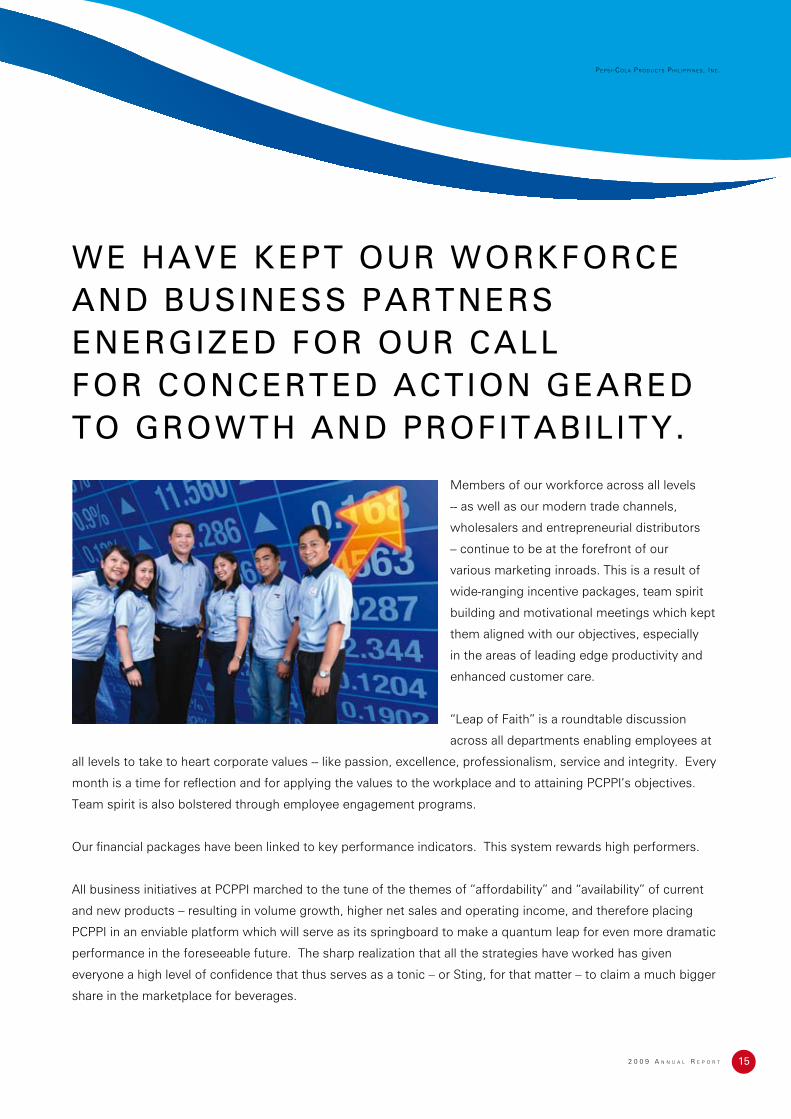
Members of our workforce across all levels
-- as well as our modern trade channels,
wholesalers and entrepreneurial distributors
– continue to be at the forefront of our
various marketing inroads. This is a result of
wide-ranging incentive packages, team spirit
building and motivational meetings which kept
them aligned with our objectives, especially
in the areas of leading edge productivity and
enhanced customer care.
“Leap of Faith” is a roundtable discussion
across all departments enabling employees at
all levels to take to heart corporate values -- like passion, excellence, professionalism, service and integrity. Every
month is a time for reflection and for applying the values to the workplace and to attaining PCPPI’s objectives.
Team spirit is also bolstered through employee engagement programs.
Our financial packages have been linked to key performance indicators. This system rewards high performers.
All business initiatives at PCPPI marched to the tune of the themes of “affordability” and “availability” of current
and new products – resulting in volume growth, higher net sales and operating income, and therefore placing
PCPPI in an enviable platform which will serve as its springboard to make a quantum leap for even more dramatic
performance in the foreseeable future. The sharp realization that all the strategies have worked has given
everyone a high level of confidence that thus serves as a tonic – or Sting, for that matter – to claim a much bigger
share in the marketplace for beverages.
WE hAvE kEPT OUR WORkfORcE AND BUSiNESS PARTNERS ENERgizED fOR OUR cALLfOR cONcERTED AcTiON gEARED TO gROWTh AND PROfiTABiLiTy.

��
PCPPI has in place a business risk management
program that conjures up all possible scenarios
that would adversely affect our operations and our
markets. It is our well-considered policy that PCPPI can
effectively deal with -- and have the upper hand over -- all
imaginable risks if we are forward-looking, and have the
built-in capability and readiness for any eventuality or
contingency.
Therefore, all PCPPI policies, programs and procedures
spanning all our operations within and outside our
organization have been established and are constantly
reviewed for the Company to steer clear of unwanted
risks, practicing the maxim: “An ounce of prevention is
worth a pound of cure.”
WE hAvE ThE BUiLT- iN cAPABiLiTy AND PREPAREDNESS fOR ANy cONcEivABLE BUSiNESS RiSk.

�7
We have also taken into consideration socio-political
risks, ever aware that the Company operates within an
environment unique to PCPPI, and also have in place
contingent measures for pre-emptive action vis-à-vis
those risks. Other risks that PCPPI has always prepared
for are risks unique to an ongoing business concern, and
more specific risks applicable to companies in the food
and beverage industry. Therefore, we deal with risks that
concern our production operations, our markets, and the
financial community within which we operate and grow.
We have also taken into consideration the vulnerable
points of the food and beverage industry to which we
belong, and we have a program of calibrated responses
to deal with any conceivable risk. We wish to stress to
our shareholders and all other stakeholders that PCPPI
has such foresight, capacity and preparedness at all
times for all possible business risks.
Maximum cola taste – and no sugar at all.
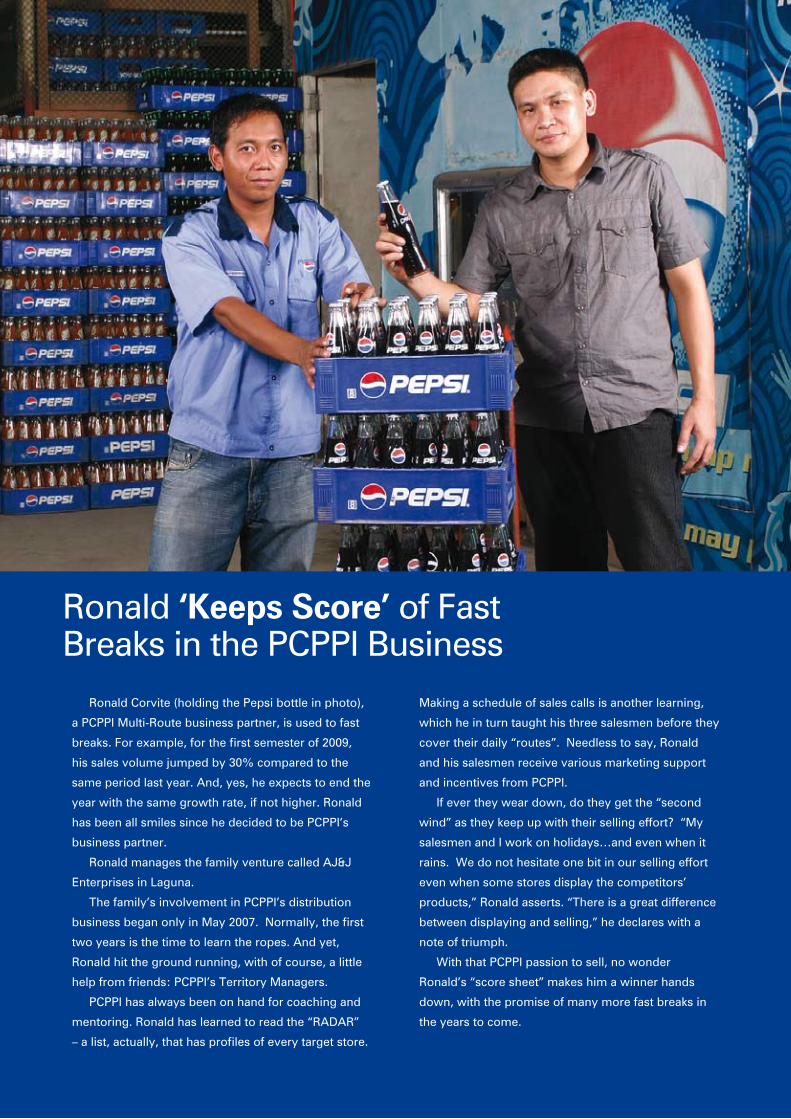
Ronald corvite (holding the Pepsi bottle in photo),
a PcPPi Multi-Route business partner, is used to fast
breaks. For example, for the first semester of 2009,
his sales volume jumped by �0% compared to the
same period last year. And, yes, he expects to end the
year with the same growth rate, if not higher. Ronald
has been all smiles since he decided to be PcPPi’s
business partner.
Ronald manages the family venture called AJ&J
Enterprises in Laguna.
The family’s involvement in PcPPi’s distribution
business began only in May 2007. Normally, the first
two years is the time to learn the ropes. And yet,
Ronald hit the ground running, with of course, a little
help from friends: PcPPi’s Territory Managers.
PcPPi has always been on hand for coaching and
mentoring. Ronald has learned to read the “RADAR”
– a list, actually, that has profiles of every target store.
Ronald ‘Keeps Score’ of fastBreaks in the PcPPi Business
Making a schedule of sales calls is another learning,
which he in turn taught his three salesmen before they
cover their daily “routes”. Needless to say, Ronald
and his salesmen receive various marketing support
and incentives from PcPPi.
if ever they wear down, do they get the “second
wind” as they keep up with their selling effort? “My
salesmen and i work on holidays…and even when it
rains. We do not hesitate one bit in our selling effort
even when some stores display the competitors’
products,” Ronald asserts. “There is a great difference
between displaying and selling,” he declares with a
note of triumph.
With that PcPPi passion to sell, no wonder
Ronald’s “score sheet” makes him a winner hands
down, with the promise of many more fast breaks in
the years to come.
�9
The highest standards of PCPPI’s Corporate
Governance rests on its Board of Directors,
whose decisions shape policies, set standards,
prescribe practices, formulate strategies, provide
key directions -- and organize Board committees to
ensure effectiveness, transparency, relevance and
consistency with the Company’s vision, mission
and objectives as they lead and grow the business.
The same policy-making body makes use of the
managerial talent and leadership of each Director,
the consequence of which is the generation of well-
thought out Board decisions and actions.
The Board has an Executive Committee and three
Oversight Committees which contribute to the
collective thinking and judgment of the Board. Each
committee is charged with oversight over specific
areas of our business.
The Manual of Corporate Governance, adopted on
June 21, 2007, provides details on the standards by
which we conduct sound corporate governance, based
on our own internal standards of corporate conduct
and consistent with relevant laws and regulatory rules
set by government and regulatory agencies.
Corporate Governance
we are driven by a PASSion to defend and grow our buSineSS, and thuS giving uS the energy to give our beSt. ExCEllEnCE markS every pepSi product and Service that delightS our cuStomerS who, in turn, reSpond with loyalty to our productS and our company. at all timeS, ProfESSionAliSM iS demonStrated by our people, earning our StakeholderS’ reSpect and inSpiring their truSt in uS. our brand of SErviCE iS diStinct for itS high quality and reSponSiveneSS to the cuStomer’S every need. and, your company iS governed by the higheSt StandardS of inTEGriTy, aS we remain true to our commitmentS whether people are looking or not, and aS we exact the higheSt StandardS in ourSelveS and our corporate conduct -- expecting the Same fidelity to Such StandardS from the people who work for and with uS.
at pcppi, we have adopted a corporate governance policy, born of -- and conSiStent with -- our corporate viSion and miSSion. we are guided by theSe core valueS: paSSion, excellence, profeSSionaliSm, Service and integrity – pepSi, in Short.

20
audit Committee. This Committee assists the
Board in its fiduciary responsibilities, as it provides
an independent and objective assurance to our
management and shareholders that business
operations are carried according to approved
standards and goals, and the Company’s resources
are preserved and are productive.
The Audit Committee, made up of Directors who
have exposure to or training in accounting and
financial management, meets at least every quarter,
and submits reports to the Board.
Compensation and Remuneration Committee.
This Committee, based on objective and impartial
studies, utilizes a formal and transparent framework
in determining the remuneration of the members of
the Board and the Company’s key executives. This
Committee’s decisions on compensation issues
are consistent with the requirements of objectivity,
fairness and relevance. This Committee meets at
least once a year.
Nomination Committee. This Committee ensures
that PCPPI’s Board of Directors is made up of
visionary, ethical and competent business leaders
who can contribute to the vast range of ideas
and to reach decisions that will protect and grow
the business. This Committee also makes sure
that the designated Board members address the
higher purposes of the Company as a responsible
enterprise which has positive value on the
communities where it operates. The Committee
meets at least once a year.
executive Committee. The Executive Committee
is responsible for developing and monitoring the
Company’s overall management policies. The
Executive Committee reviews the detailed financial
and operating performance of the Company every
month and reviews progress against the relevant
Annual Operating Plan and Operating Targets,
monitors the Company’s progress against key
initiatives, pricing strategies and plans, sales and
marketing plans, capital expenditure planning and
key decisions on organization structure and people.
This Committee meets at least four times a year.
Our Manual on Corporate Governance -- while it
governs the Board’s decisions and actions through
time and is made up of best practices in corporate
governance -- is a dynamic document. The Manual
is reviewed regularly so that the Company will
continue to be one which remains relevant to the
communities it serves and one that continually
seeks the greater good even as it continues with the
enterprise of running and growing the business.
2�
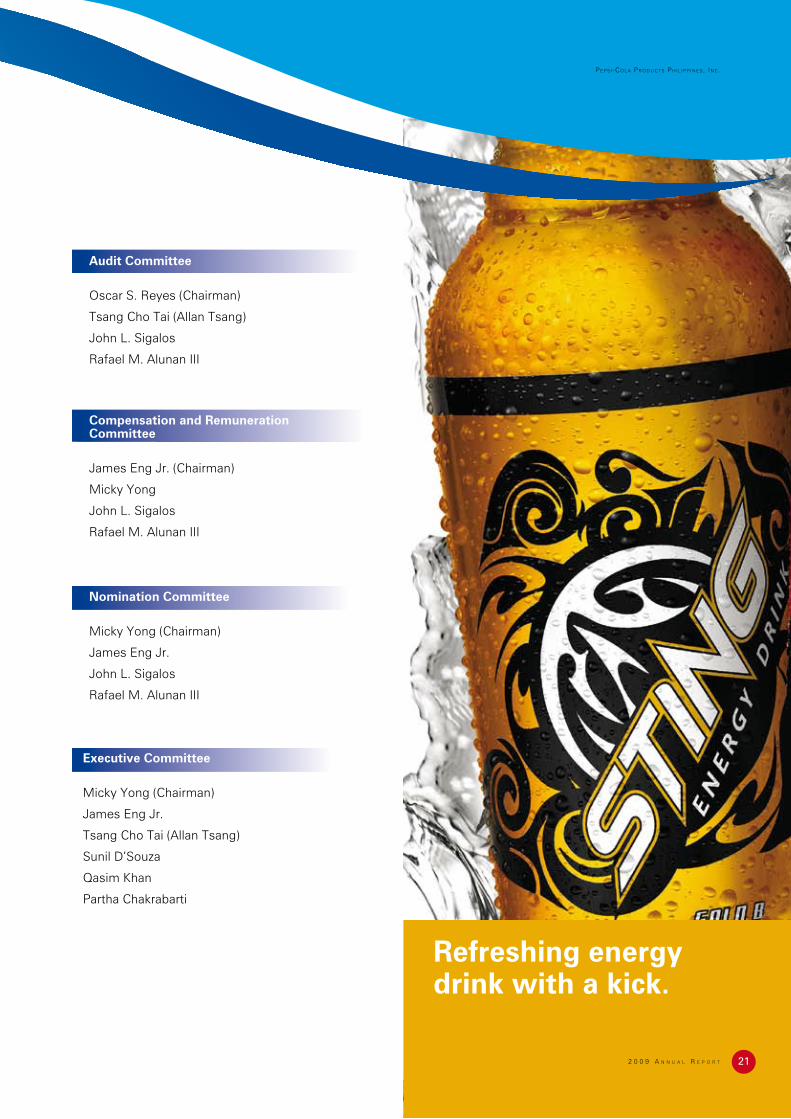
audit Committee
Oscar S. Reyes (Chairman)
Tsang Cho Tai (Allan Tsang)
John L. Sigalos
Rafael M. Alunan III
Nomination Committee
Micky Yong (Chairman)
James Eng Jr.
John L. Sigalos
Rafael M. Alunan III
Compensation and Remuneration Committee
James Eng Jr. (Chairman)
Micky Yong
John L. Sigalos
Rafael M. Alunan III
executive Committee
Micky Yong (Chairman)
James Eng Jr.
Tsang Cho Tai (Allan Tsang)
Sunil D’Souza
Qasim Khan
Partha Chakrabarti
Refreshing energy drink with a kick.

“No regrets.”
That’s what Joseph Bayona said. Not when he’s
now driving his truck; not after he resigned from his
ten-year tour of duty as a policeman -- and not when
he entered the PcPPi business. Now that Joseph
is earning P�,200 to P�,�00 on the average daily, it’s
not hard to imagine why the word “regrets” does not
belong in his vocabulary.
Joseph is a PcPPi single route entrepreneurial
distribution system operator. Driving his own truck,
he picks up stocks from the PcPPi warehouse at the
break of dawn, and sells the products to his assigned
stores. At sundown, he concludes his sales activities,
collects his earnings and calls it a day.
This PcPPi venture is, in a true sense, the Bayona
family business. On Joseph’s off-days, his wife
Aracelli takes over the truck and drives it herself.
Joseph admits that his wife is a “better” salesman.
With several sari-sari stores throughout downtown
The ‘No Regrets’ venturewith a failsafe Partner
iloilo city, the Bayonas sell hundreds of cases per day
– and cases translate to pesos as well-earned income.
No wonder, it was easy to send their two daughters
to a private school, with the eldest taking up a rather
expensive nursing course.
Joseph has a “partner” in his business. This
“partner”, a Territory Manager assigned by PcPPi,
works with them in enlisting new stores in their
growing business – from merchandizing materials to
boost sales, or giving them financial incentives for a
job well done. “PcPPi is always around to support
me,” Joseph beams.
This partnership with PcPPi is “pang-matagalan”
(for the long haul), Joseph says. What’s his next plan?
Buy one more truck, as soon as the company gives
him another selling territory. Joseph, the dreamer,
has no regrets indeed. And PcPPi is around to inspire
him to continue dreaming and growing.
One truck at a time.

2�
PCPPI, through the many years it has been
in existence, has continually kept faith and
worked with individuals, organizations and
communities which host its facilities and operations.
Doing Well and Doing Good. Also, in a larger sense,
PCPPI has aligned its “doing well” and “doing good”
goals with the larger national community in the
Philippines, as it involves itself in the larger issues of
creating employment, preserving the environment
– and helping protect Planet Earth.
Interestingly, in many cases, its business in
producing and marketing beverages (doing well) and
its socio-economic engagement in promoting the
well-being of people and communities (doing good)
are actually interwoven into the overall corporate
activities of the enterprise. Therefore, our Corporate
Social Responsibility (CSR) program is integrated into
our business operations.
We touch lives at every link of the supply chain.
Through the entire range of processes of the
supply chain, from product development to actual
production and quality control; from the additional
route, warehouses, and haulers required to distribute
these products to the entire gamut of marketing and
selling – the Company creates businesses and jobs
for those producing inputs for production, for all the
employees who keep faith with and have chosen to
carve their future with PCPPI, and for the business
partners who with entrepreneurial flair continue to
forge alliance with the Company as they grow their
own enterprises.
The labor-intensive and geographically-dispersed
nature of the whole supply chain built a great number
of businesses and jobs around PCPPI’s operations.
Corporate Social reSponSibility
INSERT PRODUCTION LINE PHOTO WITH PEOPLE

2�
If we were to maintain the compounded annual
growth rate in gross revenues at 12% of the past
five years going forward, this could potentially bring
about the generation of 5,000 direct and indirect
jobs yearly. This is aside from the numerous jobs
to be created by 48,000 outlets and sari-sari stores
required to sell additional products. These jobs have
a multiplier effect on many more businesses fired by
an unflagging entrepreneurial energy.
Our plants and distribution network reach small
towns, bringing livelihood to a good number of
residents in the countryside. This network includes
the EDS operators who service the sales routes with
their own fleet of trucks, aside from direct selling
efforts to retail outlets all the way to the modern
trade channels, sari-sari stores, and carinderias.
Everyone has more stories to tell of lives touched
and communities engaged. To us, this is one
unified CSR which we at PCPPI are committed to,
heart and soul.
We promote health and wellness in our products.
In a real sense, we are in the business of delighting
our customers, empowering them in their pursuit
of happiness – and, most important, help promote
their health and wellness. In a larger context, we
contribute to a healthier, robust and productive
population.
As a response to the demand for more healthy
beverages, we have strengthened our functional
beverage offerings with sharper, more powerful
platforms in our NCB brands.
Gatorade is one example, with its scientifically
proven formulation for hydration perfected by over
40 years of research. Propel has been successfully
positioned as a value-added water that strengthens
immunity defense through fortification. Sting
enables multi-tasking consumers so they can
sustain their energy levels. Tropicana, with its “Real
Juice from Real Fruit” proposition, is making inroads
in the market.
People need to be nourished in various ways—
ranging from what they drink to how they live. In
these areas, PCPPI is making a big difference
-- through our carefully and creatively developed
products. As new technologies and ingredients
become available, we bring a wider array of healthful
choices to our customers. That health comes with
great tasting beverages is a bonus PCPPI brings to
every customer.
Wellness photo

2�
Sustainable supply chain to support
environmental goals. PCPPI has committed itself
to take a leadership role in the country in developing
a sustainable supply chain platform that will
address the challenges posed by climate change
and resource shortage, while remaining a profitable
enterprise.
We have pledged the Company to use renewable
energy in all manufacturing plants within five years.
We will also reduce energy consumption by at least
20% and water by at least 40% in our manufacturing
operations.
It makes good business sense to deal with climate
change and global warming. This recent climate
phenomenon has caused the rapid depletion of
our ozone layer that then results in warming Planet
Earth. Thus temperature has risen, erratic weather
patterns ensued and drought occurred leading to
agricultural shortages. Floods plagued low-lying
areas.
Preserving our immediate environment and
protecting Planet earth. Your Company has a
number of initiatives in favor of the environment and
our only planet. Aside from our yearly commitment
to plant trees in different locations, we have
specifically addressed the quality of marine life in a
number of lakes and bays.
Our Muntinlupa facility has become a staging point
for our participation in reducing the pollution in the
lake Laguna de Bay. Specifically, we implemented
measures in minimizing pollutants that find their way
into the Lake, and contributed as well to the Lake’s
clean environment through faithful compliance
with – if not exceeding -- all effluent standards
and regulatory requirements of the Laguna Lake
Development Authority (LLDA). It is with a sense of
satisfaction that we received news that the Laguna
Lake received the highest “green” rating for its 2007
environmental performance.

2�
All these raised the cost of sugar, utilities and
certain raw material inputs – which then affected
the Company. We have thus decided to confront the
challenges to create a supply chain that is resilient to
climate change, and to find innovative schemes that
will reduce the carbon footprint in the manufacturing
operations.
Co-generation schemes for renewable energy.
PCPPI has committed itself to replace the use of
fossil fuels with renewable sources of energy in its
manufacturing infrastructure. Within five years, the
Company seeks to have co-generation, tri-generation
or even quad-generation facilities that run on
renewable energy -- such as biomass, solar, wind
and biogas.
These facilities will produce electricity, steam
for bottle washing operations, carbon dioxide for
production and chilled water for refrigeration and
cold storage – and PCPPI’s energy costs will be
reduced significantly.
PCPPI is now working closely with renewable
energy experts, financing companies, suppliers of
generators, biomass burning equipment and carbon
dioxide equipment, and project developers to make
this pledge a reality.
Reduce energy and water consumption. PCPPI
will reduce the use of electrical energy by 20% in its
manufacturing operations by the year 2010. In fact,
we have been exploring a number of energy savings
programs.
The Company has teamed up with highly reputable
local and multinational companies in developing
and installing energy savings systems that can
accurately measure the power consumption of
large motors, stabilize the inflow of electric current
and reduce energy consumption. The Company
will also install smart micro grids, power stabilizers
and similar devices as part of the greater effort at
reducing energy use.
27
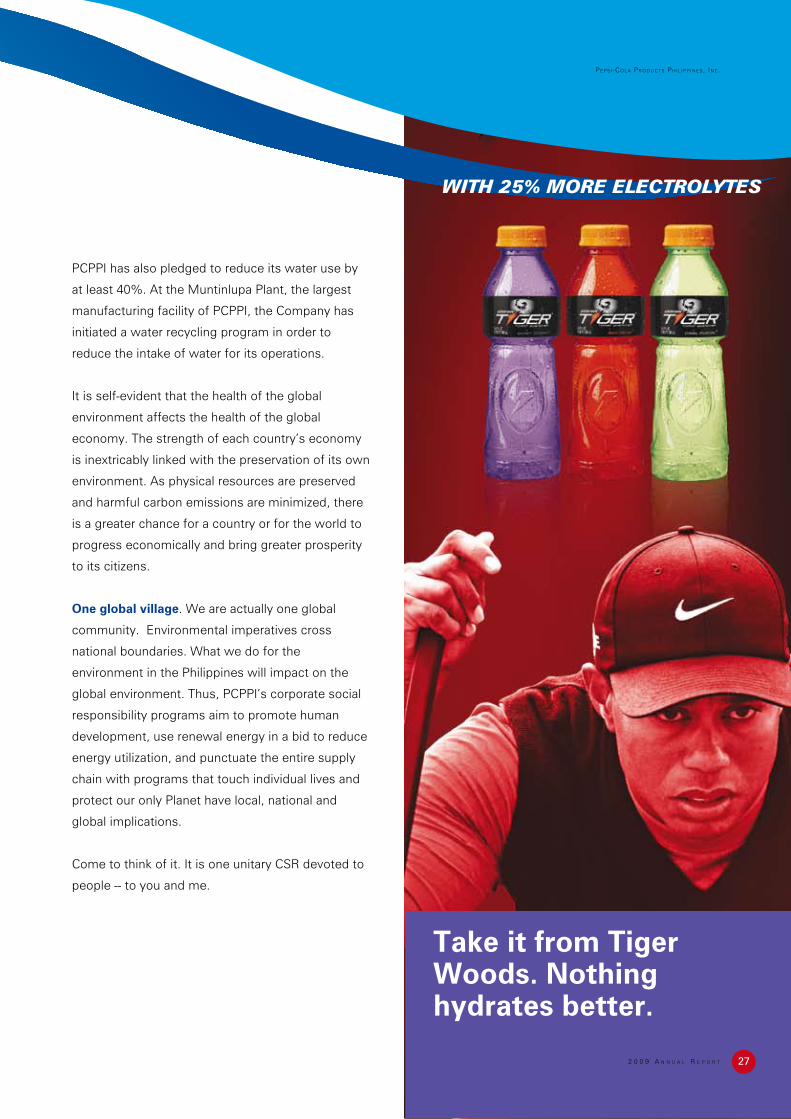
PCPPI has also pledged to reduce its water use by
at least 40%. At the Muntinlupa Plant, the largest
manufacturing facility of PCPPI, the Company has
initiated a water recycling program in order to
reduce the intake of water for its operations.
It is self-evident that the health of the global
environment affects the health of the global
economy. The strength of each country’s economy
is inextricably linked with the preservation of its own
environment. As physical resources are preserved
and harmful carbon emissions are minimized, there
is a greater chance for a country or for the world to
progress economically and bring greater prosperity
to its citizens.
One global village. We are actually one global
community. Environmental imperatives cross
national boundaries. What we do for the
environment in the Philippines will impact on the
global environment. Thus, PCPPI’s corporate social
responsibility programs aim to promote human
development, use renewal energy in a bid to reduce
energy utilization, and punctuate the entire supply
chain with programs that touch individual lives and
protect our only Planet have local, national and
global implications.
Come to think of it. It is one unitary CSR devoted to
people -- to you and me.
take it from tiger Woods. Nothing hydrates better.
WITH 25% MORE ELECTROLYTES

it began with just one truck.
The trucker recalls the early days of his partnership
with PcPPi, a sense of pride notable in his voice.
francis Borja (he with the dark shirt in the photo),
��, and owner of fOB Trucking, has been “hauling”
PcPPi products for �9 years, from the Manila Plant
to satellite offices throughout Luzon. How an
office-bound certified public accountant (CPA) from
Nueva Ecija became a successful and never-say-die
businessman is an inspiring story of entrepreneurial
flair, determination, a full dose of optimism – and a
PcPPi system that ignites the spirit of enterprise.
Francis’s first job was being part of an audit team
of Sgv (Sycip, gorres, velayo & co.) right after
college. he worked there for three years. That alone
speaks of his top-notch mind as one trained what a
management school calls “the language of business”
– numbers and more numbers.
Now he counts numbers of vehicles added to his
trucking business.
What does business growth look like to francis? it
Francis’s Success Formula: have Truck, Partner with PcPPi
was starting with a single truck and then growing the
business with a full fleet of 25 trucks!
“As the PcPPi business grows, my business
grows.” That’s how francis views his success secret.
His first entrepreneurial venture is linked with PCPPI.
“The officers in PCPPI are very supportive. When
the gasoline prices were fluctuating like crazy, PCPPI
helped me deal with a cost component that’s the
biggest in my business, next to the cost of the truck,”
francis recalls, saying it like a smart cPA.
“Because of PcPPi’s support policy for its partners,
we easily coped with changing business conditions.”
This cPA-turned-entrepreneur made another
calculated move: he set up his own maintenance
shop in Nueva Ecija to keep his fleet fit and running
for the PcPPi business.
francis is a proud father of two. And he is prouder
now that his two lovely daughters have acquired a
good education. One of them is now a certified nurse.
it all began with just one truck. All it took is a guy
like francis and a partner like Pepsi.

29
Board of DirectorS
MICKy yONG
Mr. Yong is PCPPI’s Chairman of the Board and
Chief Executive Officer (CEO). He has held the
office of CEO since 2002. Notably, Mr. Yong has
been Director of the Company since the Guoco
Group Limited and its subsidiaries (“Guoco Group”)
acquired controlling interest in PCPPI in 1997. On
the other hand, at the Guoco Group since 1989,
Mr. Yong has served as President of Guoco Assets
(Philippines) Inc., which is the Group’s principal
investment vehicle in the Philippines. Mr. Yong held
various positions in other Guoco companies -- as
Country Manager and Director of Dao Heng Bank
Philippines, and Director of First Lepanto Taisho
Insurance, Tutuban Properties Inc., Guoco Securities
Philippines, and several other corporations under
the Guoco umbrella. Mr. Yong holds a Bachelor of
Business Administration degree from the University
of Singapore .
SUNIL D’SOUZa (Elected board member on June 5, 2009)
Mr. D’Souza is Country Manager for the Philippines
of PepsiCo. He has been with PepsiCo for the past
eight years, and had held the position of Sales
Director for the Philippines prior to his current
appointment. He holds a Bachelor of Engineering
degree from the Pondicherry Engineering
College, Pondicherry (University of Madras), and a
management degree from the Calcutta-based Indian
Institute of Management.
VaRUN BeRRy (Resigned as director on June 5, 2009)
Mr. Berry is currently the Chief Executive Officer
of a PepsiCo dairy joint venture in the Middle East.
Earlier, he was PepsiCo’s Country Manager for the
Philippines for eight years, until he was replaced
in June 2009 by Mr. D’Souza. Mr. Berry first joined
PepsiCo in India in 1993, and has since then held
various marketing and operating roles within the
worldwide organization. Prior to joining PepsiCo, he
was Marketing Manager of Unilever. He holds an
MBA and a Bachelor of Engineering degree from the
Panjab University-Chandigarh.
JaMeS eNG JR.
Mr. Eng is the Executive Director of the Guoco
Group Limited. Since his appointment to the post,
he has been responsible for group staff support
functions for the entire Guoco Group, which he
joined in 1994. Before joining the Group, Mr. Eng
worked with Hiram Walker, a division of Allied-
Lyons – and his postings included New York, Miami,
London, Hong Kong and Windsor, Canada. He also
worked with Brout, Issacs & Co., CPAs, in New York
City where he handled the Management Services
Division. He was also Management Consultant in
New York for Computer Methods Corporation. He
holds a Bachelor of Business Administration degree
from the University of North Carolina.

�0
tSaNG ChO taI (Allan Tsang)
Mr. Tsang who is the Chief Financial Officer of
the Guoco Group Limited, is a fellow member
of the Hong Kong Institute of Certified Public
Accountants and the Association of Chartered
Certified Accountants. He is also Associate Member
of the Institute of Chartered Accountants in England
and Wales. Mr. Tsang was an associate of an
international firm of accountants before joining the
Guoco Group in 1989.
JOhN L. SIGaLOS (Elected board member on February 5, 2009)
Mr. Sigalos is PepsiCo’s Chief Financial Officer
for the Asia-Pacific region. He has handled
various positions in PepsiCo for the past 12 years,
including being Chief Financial Officer of PepsiCo
Thailand and Vice-President for Non-Carbonated
Beverages in PepsiCo’s China business unit. He
holds an MBA from the Wharton School, University
of Pennsylvania, with dual major in Finance and
Strategic Management, over a Bachelor of Arts
degree in East Asian studies (cum laude) from Yale
University .
RahUL BhatNaGaR (Resigned as director on February 2, 2009)
Mr. Bhatnagar is the Chief Finance Officer of the
Worldwide Concentrate Operations of PepsiCo.
Previously, he was the Vice-President and Chief
Financial Officer for the Asian Region of PepsiCo for
six years, where he led the finance function for both
beverages and food throughout the Asian region
– until he was replaced by Mr. Sigalos in February
2009. He joined PepsiCo in 1996 as CFO of the
India beverage business. Prior to joining PepsiCo,
he spent two years as CFO of Seagram India. Before
that, he spent seven years with Nestle India in the
finance function in various leadership roles, the
last of which was as the Financial Controller of the
business. He started his career as a management
consultant in India and the United States. He holds
an MBA degree from the Wharton School, an honors
Bachelor of Arts degree in Economics from St.
Stephen’s College, Delhi University and is a member
of the Institute of Chartered Accountants in India .
tIMOthy e. MINGeS
Mr. Minges, the President of PepsiCo Asia Pacific,
has been with PepsiCo for 25 years – which included
15 years in Asia with various assignments in China,
Thailand, Indonesia and India. He is also Director
of Kirin-Tropicana, Inc. in Japan, Serm Suk PLC
in Thailand and P. T. Indofood Frito-Lay Makmur
in Indonesia. He holds a Bachelor of Science in
Accounting from Miami University in Oxford, Ohio.
QaSIM KhaN
Mr. Khan, currently the General Manager of
PepsiCo’s North Asia Pakistan Philippines Business
Unit, has been connected with PepsiCo for the
last 21 years. He occupied various executive and
managerial roles in different PepsiCo regional
offices. Prior to joining PepsiCo, he worked for
Procter & Gamble. He holds an MBA and Marketing
degrees (with honors) from Michigan State
University.

��
JOSe M. PeRIQUet JR.
Mr. Periquet is the President and Chief Executive
Officer of the Metropolitan Insurance Company,
Inc., a position he has held since 1999. He has been
employed by Metropolitan Insurance since 1985,
when he joined as Acting President and Manager.
He joined AIG in New York in 1967 and was later
assigned to AIU (Philippines) Inc., where he held
the position of Senior Vice-President and Director.
Mr. Periquet is also a director of MIC Holdings
Inc., Bradstock Insurance Brokers Inc. and the
Athenaeum Condominium Corporation. Mr. Periquet
holds a Bachelor’s degree in Economics from
Ateneo de Manila University and a Master’s degree
in Economics from Fordham University.
RaFaeL M. aLUNaN III
Mr. Alunan served in the Cabinets of two Philippine
Presidents -- President Fidel V. Ramos and President
Corazon C. Aquino. He was President Ramos’s
Secretary of the Interior and Local Government,
and served as Secretary of Tourism of President
Aquino. He was President of Maynilad Water
Services, Inc. and Manila Hotel; Consultant on
Government Relations for San Miguel Corporation;
and a member of the Board of Trustees and Board
of Regents of the De La Salle University System.
Mr. Alunan is currently the President of the Lopez
Group Foundation Inc. and Trustee of First Philippine
Conservation Inc. and Bayan Academy . He also
heads the Lopez Group’s Lifelong Wellness System.
A columnist of the BusinessWorld; and a Senior
Fellow of the President Ramon Magsaysay School of
Public Governance. Mr. Alunan holds two Bachelor’s
degrees in Business Administration and History-
Political Science from the De La Salle University. He
also has a Master’s degree in Public Administration
from the John F. Kennedy School of Government in
Harvard University .
OSCaR S. ReyeS
Mr. Reyes was Country Chairman and President
of Pilipinas Shell Petroleum Corporation for many
years. Previous to that, he held various positions in
the global petroleum company covering operations,
finance, legal and corporate affairs functions in a
number of Shell companies here and elsewhere
around the globe. Currently, he is the Chairman of
Link Edge Inc. Mr. Reyes has been a director of
the Philippine Long Distance Telephone Company
since 2004, Bank of the Philippine Islands since
2003, Sun Life of Canada Philippines Inc. since
2006, Manila Water Company since 2005, SMART
Communications Inc. since 2006, and Director
of Ayala Land, Inc. since 2009, among other
companies. Mr. Reyes also served as Executive
Vice-President and General Manager of the
Philippine Petroleum Corporation. Mr. Reyes holds
a Bachelor of Arts in Economics (cum laude) from
Ateneo de Manila University. He also participated in
the Program for Management Development at the
Harvard Business School .
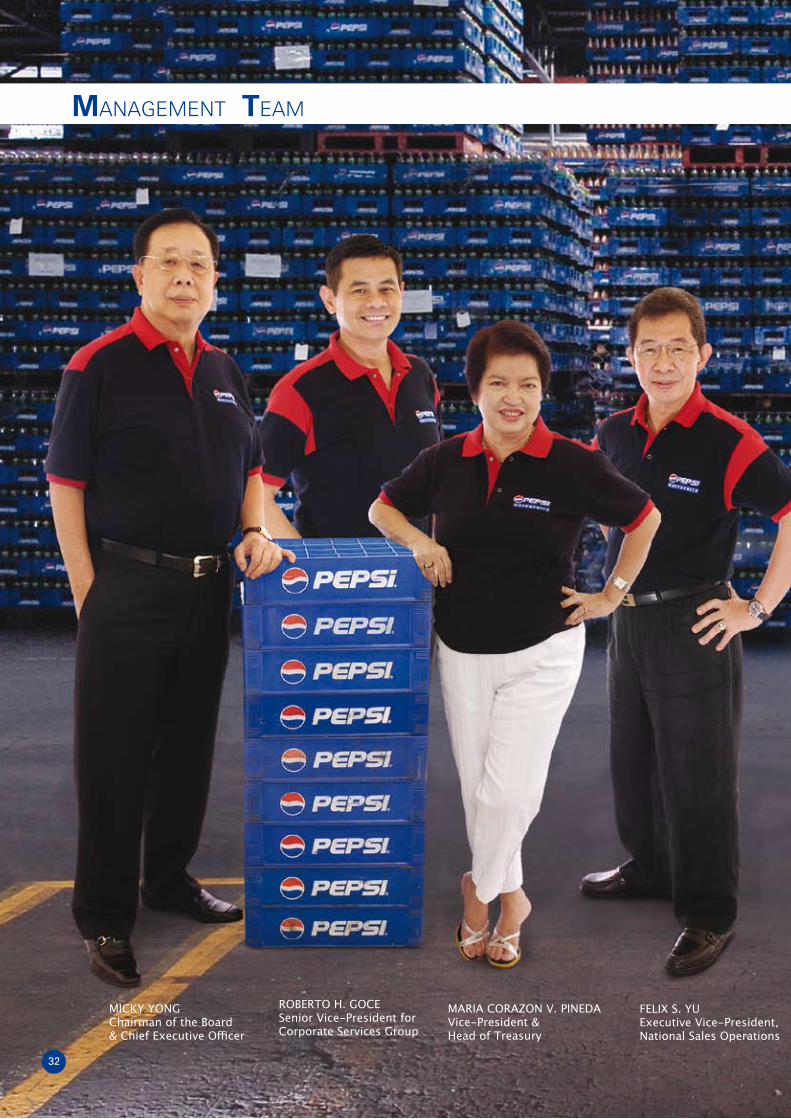
Management Team
Micky yongchairman of the Board & Chief Executive Officer
Maria corazon V. PinedaVice-President & Head of Treasury
Felix S. yu executive Vice-President, national Sales operations
roBerTo H. goceSenior Vice-President for corporate Services group
�2

Management Team
celerino T. grecia iiiVice-President for Human resourcesand legal
ParTHa cHakraBarTi Senior Vice-President and Chief Financial Officer
daniel d. gregorio, Jr. Senior Vice-President for Manufacturing and logistics
��

Alice’s eyes are fixed on a brighter future, even if
there is a slow down in the Philippine economy.
Alice galenzoga (the lady in the photo) is the
owner of Jezjon Enterprises, one of PcPPi’s third party
delivery (TPD) operators in cagayan de Oro city. TPD
is one PcPPi delivery innovation. Time was when a
company salesman went around with a PcPPi truck
checking on PcPPi’s outlets. That’s not so anymore.
Now, a Pre-Seller gets the orders of his assigned
stores, and the TPD partner, an entrepreneur like
Alice, delivers the product the next day.
Business was brisk during the first four years of
her business, Alice recalls. however, income slowed
down somehow in 2007 when fuel prices shot up
and became unstable. But with her steely resolve,
Alice continues with her venture of delivering PcPPi
products. She has a nobler reason.
Thinking of herself less and considering her
employees more, Alice is glad that she can provide
an honest and decent source of livelihood for her
three employees who have been with her from the
alice’s Mood Perks Up as PcPPi Prepares her for the Next Boom
start. Alice is one of many businessmen who get a
sense of fulfillment in empowering and helping others.
Alice’s husband is a seaman – and she regularly
receives his pay from his employers abroad. They
have two children. And they are building a future
together.
Alice has been in this PcPPi business for seven
years now – with well enough revenues by which to
manage the livelihood and salaries of her driver and
two helpers -- not to mention paying the costs of fuel,
repairs and maintenance to run the business. She has
a simple goal: Augment the income of her seaman-
husband.
Meanwhile, PcPPi continues to support Alice with
the Company’s package of support – from fleet card,
credit and discounts. This explains Alice’s optimism.
She is confident that volume will again rise, and
profits soar.
“Things will surely improve,” she says, with a glint
in her eye.

��
alice’s Mood Perks Up as PcPPi Prepares her for the Next Boom
Statement of Management’S reSpoSibility
for the financial StatementS
The management of PEPSI-COLA PRODUCTS PHILIPPINES, INC. is responsible for all information and representations contained in accompanying financial statements, which comprise the balance sheets as at June 30, 2009 and 2008, and the statements of income, statements of changes in equity and statements of cash flows for each of the three years in the period ended June 30, 2009. The financial statements have been prepared in conformity with Philippine Financial Reporting Standards and reflect amounts that are based on the best estimates and informed judgment of management with an appropriate consideration to materiality.
In this regard, management maintains a system of accounting and reporting which provides for the necessary internal controls to ensure that transactions are properly authorized and recorded, assets are safeguarded against unauthorized use or disposition and liabilities are recognized. The management likewise discloses to the Company’s audit committee and to its external auditor: (i) all significant deficiencies in the design or operation of internal controls that could adversely affect its ability to record, process and report financial data; (ii) material weaknesses in the internal controls; and (iii) any fraud that involves management or other employees who exercise significant roles in internal controls.
The Board of Directors reviews the financial statements before such statements are approved and submitted to the Stockholders of the Company.
Manabat Sanagustin & Co., CPAs, the independent auditors appointed by the Stockholders, has examined the financial statements of the Company in accordance with Philippine Standards on Auditing and has expressed its opinion on the fairness of presentation upon completion of such examination, in its report to the Board of Directors and Stockholders.
MICKY YONGChairman of the Board and Chief Executive Officer
PARTHA CHAKRABARTISenior Vice-President and Chief Financial Officer
September 22, 2009
pepSi-cola productS philippineS, inc.

��
report of independent AuditorS
pepSi-cola productS philippineS, inc.
The Board of Directors and Stockholders Pepsi-Cola Products Philippines, Inc.
We have audited the accompanying financial statements of Pepsi-Cola Products Philippines, Inc., which comprise the balance sheets as at June 30, 2009 and 2008, and the statements of income, statements of changes in equity and statements of cash flows for each of the three years in the period ended June 30, 2009, and a summary of significant accounting policies and other explanatory notes.
Management’s Responsibility for the Financial Statements
Management is responsible for the preparation and fair presentation of these financial statements in accordance with Philippine Financial Reporting Standards. This responsibility includes: designing, implementing and maintaining internal control relevant to the preparation and fair presentation of financial statements that are free from material misstatement, whether due to fraud or error; selecting and applying appropriate accounting policies; and making accounting estimates that are reasonable in the circumstances.
Auditors’ Responsibility
Our responsibility is to express an opinion on these financial statements based on our audits. We conducted our audits in accordance with Philippine Standards on Auditing. Those standards require that we comply with ethical requirements and plan and perform the audit to obtain reasonable assurance whether the financial statements are free from material misstatement.
An audit involves performing procedures to obtain audit evidence about the amounts and disclosures in the financial statements. The procedures selected depend on the auditors’ judgment, including the assessment of the risks of material misstatement of the financial statements, whether due to fraud or error. In making those risk assessments, the auditors consider internal control relevant to the entity’s preparation and fair presentation of the financial statements in order to design audit procedures that are appropriate in the circumstances, but not for the purpose of expressing an opinion on the effectiveness of the entity’s internal control. An audit also includes evaluating the appropriateness of accounting policies used and the reasonableness of accounting estimates made by management, as well as evaluating the overall presentation of the financial statements.
We believe that the audit evidence we have obtained is sufficient and appropriate to provide a basis for our audit opinion.
Opinion
In our opinion, the financial statements present fairly, in all material respects, the financial position of Pepsi-Cola Products Philippines, Inc. as of June 30, 2009 and 2008, and its financial performance and its cash flows for each of the three years in the period ended June 30, 2009, in accordance with Philippine Financial Reporting Standards.
September 22, 2009Makati City, Metro Manila

�7
Balance SheetS
pepSi-cola productS philippineS, inc.
(amountS in thouSandS)
June 30 Note 2009 2008 aSSetS Current assets Cash and cash equivalents 5 P413,088 P590,326 Receivables - net 6 987,965 882,075 Inventories 7, 11 703,963 678,933 Due from associates - net 14 89,737 84,877 Due from a related party 14 26,717 135,652 Prepaid expenses and other current assets 71,928 113,252 total Current assets 2,293,398 2,485,115 Noncurrent assets Investments in associates 8 527,723 525,502 Bottles and cases - net 9, 11 2,441,198 1,972,654 Property, plant and equipment - net 10, 11 3,156,001 2,861,459 Other noncurrent assets - net 143,941 138,039 total Noncurrent assets 6,268,863 5,497,654 P8,562,261 P7,982,769 LIaBILItIeS aND eQUIty Current Liabilities Notes payable 7, 9, 10, 11 P50,000 P147,100 Accounts payable and accrued expenses 7, 12, 14, 24 2,138,380 2,079,994 Income tax payable 156,456 - total Current Liabilities 2,344,836 2,227,094 Noncurrent Liabilities Accrued retirement cost - net of current portion 24 131,830 186,577 Deferred tax liabilities - net 13 375,723 289,712 total Noncurrent Liabilities 507,553 476,289 total Liabilities 2,852,389 2,703,383 equity Capital stock 25 554,066 554,066 Additional paid-in capital 25 1,197,369 1,197,369 Effect of dilution of ownership (1,018) (1,018) Retained earnings 26 3,959,455 3,528,969 total equity 5,709,872 5,279,386 P8,562,261 P7,982,769 See Notes to the Financial Statements.

�8
StatementS of income
pepSi-cola productS philippineS, inc.
(amountS in thouSandS)
years ended June 30 Note 2009 2008 2007 Net SaLeS 15, 22 P14,232,045 P12,980,886 P12,916,212 COSt OF GOODS SOLD 14, 16, 19, 20, 24, 27 10,042,738 8,874,106 8,766,162 GROSS PROFIt 4,189,307 4,106,780 4,150,050 OPeRatING eXPeNSeS Selling and distribution 14, 17, 19, 20, 24, 27 1,902,574 1,830,309 1,599,571 General and administrative 14, 18, 19, 20, 24, 27 620,850 648,080 587,081 Marketing expenses 14 520,916 664,935 468,291 3,044,340 3,143,324 2,654,943 INCOMe FROM OPeRatIONS 1,144,967 963,456 1,495,107 FINaNCe aND OtheR INCOMe (eXPeNSe) Interest income 5, 14 17,234 22,581 18,050 Equity in net earnings of associates 8 2,221 20,028 6,792 Interest expense 11 (21,972) (35,713) (52,439) Other income - net 38,979 30,567 52,117 36,462 37,463 24,520 INCOMe BeFORe INCOMe taX 1,181,429 1,000,919 1,519,627 INCOMe taX eXPeNSe 13 381,739 240,222 518,241 Net INCOMe P799,690 P760,697 P1,001,386 Basic/Diluted earnings Per Share 21 P0.22 P0.22 P0.30 See Notes to the Financial Statements.

�9
StatementS of ChangeS in Equity
pepSi-cola productS philippineS, inc.
(amountS in thouSandS)
years ended June 30 Note 2009 2008 2007 CaPItaL StOCK Balance at beginning of year P554,066 P496,948 P496,948 Issuance during the year 25 - 57,118 - Balance at end of year 554,066 554,066 496,948 aDDItIONaL PaID-IN CaPItaL Balance at beginning of year 1,197,369 59,473 59,473 Issuance during the year 25 - 1,275,622 - Transaction cost on initial public offering 25 - (137,726) - Balance at end of year 1,197,369 1,197,369 59,473 eFFeCt OF DILUtION OF OWNeRShIP (1,018) (1,018) (1,018) ReVaLUatION INCReMeNt ON LaND Balance at beginning of year - - 274,569 Transfer to retained earnings - - (274,569) Balance at end of year - - - RetaINeD eaRNINGS Balance at beginning of year 3,528,969 2,768,272 1,892,317 Net income for the year 799,690 760,697 1,001,386 Transfer from revaluation increment on land - - 274,569 Dividends declared 26 (369,204) - (400,000) Balance at end of year 3,959,455 3,528,969 2,768,272 P5,709,872 P5,279,386 P3,323,675 See Notes to the Financial Statements.
�0
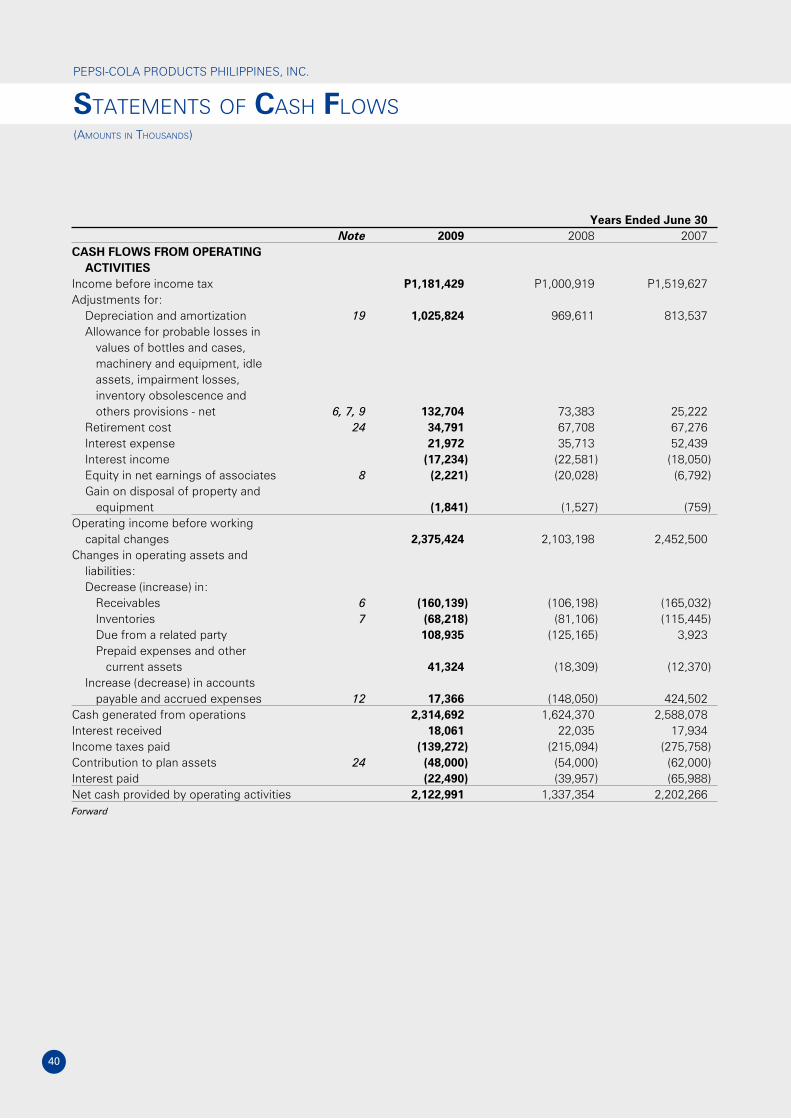
StatementS of CaSh flowS
pepSi-cola productS philippineS, inc.
(amountS in thouSandS)
years ended June 30 Note 2009 2008 2007CaSh FLOWS FROM OPeRatING aCtIVItIeS Income before income tax P1,181,429 P1,000,919 P1,519,627Adjustments for: Depreciation and amortization 19 1,025,824 969,611 813,537 Allowance for probable losses in values of bottles and cases, machinery and equipment, idle assets, impairment losses, inventory obsolescence and others provisions - net 6,7,9 132,704 73,383 25,222 Retirement cost 24 34,791 67,708 67,276 Interest expense 21,972 35,713 52,439 Interest income (17,234) (22,581) (18,050) Equity in net earnings of associates 8 (2,221) (20,028) (6,792) Gain on disposal of property and equipment (1,841) (1,527) (759)Operating income before working capital changes 2,375,424 2,103,198 2,452,500Changes in operating assets and liabilities: Decrease (increase) in: Receivables 6 (160,139) (106,198) (165,032) Inventories 7 (68,218) (81,106) (115,445) Due from a related party 108,935 (125,165) 3,923 Prepaid expenses and other current assets 41,324 (18,309) (12,370) Increase (decrease) in accounts payable and accrued expenses 12 17,366 (148,050) 424,502Cash generated from operations 2,314,692 1,624,370 2,588,078Interest received 18,061 22,035 17,934Income taxes paid (139,272) (215,094) (275,758)Contribution to plan assets 24 (48,000) (54,000) (62,000)Interest paid (22,490) (39,957) (65,988)Net cash provided by operating activities 2,122,991 1,337,354 2,202,266Forward

��
years ended June 30 Note 2009 2008 2007CaSh FLOWS FROM INVeStING aCtIVItIeS Proceeds from disposal of property and equipment 10 P5,370 P17,681 P5,269Net additions to: Property, plant and equipment 10 (833,864) (1,309,518) (918,905) Bottles and cases 9 (994,669) (693,180) (697,858) Investments in associates 8 - - (81,015)Net increase in amounts due from associates 8 (4,860) (4,850) (632)Increase in other noncurrent assets (5,902) 386 (88,646)Net cash used in investing activities (1,833,925) (1,989,481) (1,781,787)
CaSh FLOWS FROM FINaNCING aCtIVItIeS Cash dividends paid 26 (369,204) (400,000) (99,367)Net proceeds from (repayments of): Notes payable 11 (97,100) 98,500 - Long-term debt - (283,333) (166,667)Proceeds from issuance of shares of stocks - 1,195,014 - Net cash provided by (used in) financing activities (466,304) 610,181 (266,034)
Net INCReaSe (DeCReaSe) IN CaSh aND CaSh eQUIVaLeNtS (177,238) (41,946) 154,445CaSh aND CaSh eQUIVaLeNtS at BeGINNING OF yeaR 590,326 632,272 477,827CaSh aND CaSh eQUIVaLeNtS at eND OF yeaR 5 P413,088 P590,326 P632,272 See Notes to the Financial Statements.

�2
noteS to the financial StatementS
pepSi-cola productS philippineS, inc.
(amountS in thouSandS, except number of ShareS and par value per Share and when otherwiSe Stated)
1. Reporting entity
Pepsi-Cola Products Philippines, Inc. (the “Company”) was registered with the Philippine Securities and Exchange Commission (SEC) on March 8, 1989, primarily to engage in manufacturing, sales and distribution of carbonated soft-drinks (CSD) and non-carbonated beverages (NCB) to retail, wholesale, restaurants and bar trades. The registered office address and principal place of business of the Company is Km. 29, National Road, Tunasan, Muntinlupa City.
2. Basis of Preparation
Statement of ComplianceThe financial statements of the Company have been prepared in accordance with Philippine Financial Reporting Standards (PFRS). PFRS includes statements named PFRS and Philippine Accounting Standards (PAS), including Philippine Interpretations from International Financial Reporting Interpretations Committee (IFRIC), issued by the Financial Reporting Standards Council.
The financial statements of the Company as of and for the years ended June 30, 2009 and 2008 and the statement of income, statement of changes in equity, and statement of cash flows for the year ended June 30, 2007 were approved and authorized for issue by the Company’s Board of Directors (BOD) on September 22, 2009.
Basis of MeasurementThe financial statements have been prepared on a historical cost basis.
Functional and Presentation CurrencyThe financial statements are measured using the currency of the primary economic environment in which the Company operates. The financial statements are presented in Philippine peso, which is also the Company’s functional currency and all values are rounded to the nearest thousand, except number of shares and par value per share and when otherwise indicated.
Use of Estimates and JudgmentsThe preparation of the financial statements in accordance with PFRS requires management to make estimates and judgments that affect the application of accounting policies and the amounts reported in the financial statements. The estimates and judgments used in the accompanying financial statements are based on management’s evaluation of relevant facts and circumstances as of the date of the Company’s financial statements. Actual results may differ from these estimates. Estimates and underlying assumptions are reviewed on an ongoing basis and are based on historical experiences and other factors, including expectations of future events that are believed to be reasonable under the circumstances. Revisions to accounting estimates are recognized in the period in which the estimates are revised and in any future periods affected.
In particular, information about significant areas of estimation uncertainty and critical judgments in applying accounting policies that have the most significant effect on the amounts recognized in the financial statements are as follows:
LeasesThe Company has entered into various lease agreements as lessee. The Company has determined that the lessor retains all significant risks and rewards of ownership of these properties which are leased out under operating lease agreements. Rent expense pertaining to these leased properties amounted to P153 million in 2009, P162 million in 2008 and P113 million in 2007 (see Notes 16, 17 and 18).

��
Functional CurrencyBased on the economic substance of the underlying circumstances relevant to the Company, the functional currency has been determined to be the Philippine peso. It is the currency that mainly influences the sales price of goods and the cost of providing these goods.
ContingenciesThe Company is currently involved in various legal proceedings. The estimate of the probable costs for the resolution of these claims has been developed in consultation with outside counsel handling the Company’s defense relating to these matters and is based upon an analysis of potential results. The Company currently does not believe that these proceedings will have a material adverse effect on its financial statements. It is possible, however, that future results of operations could be materially affected by changes in the estimates or in the effectiveness of the strategies relating to these proceedings (see Note 27).
Estimating Allowance for Impairment Losses on ReceivablesThe Company maintains an allowance for impairment losses at a level considered adequate to provide for potential uncollectible receivables. The Company performs regular review of the age and status of these accounts, designed to identify accounts with objective evidence of impairment and provides these with the appropriate allowance for impairment losses. The review is accomplished using a combination of specific and collective assessment approaches, with the impairment losses being determined for each risk grouping identified by the Company. The amount and timing of recorded expenses for any period would differ if the Company made different judgments or utilized different methodologies. An increase in the allowance for impairment losses would increase recorded operating expenses and decrease current assets. As of June 30, 2009 and 2008, allowance for impairment losses on receivables amounted to P150 million and P102 million, respectively. Receivables, net of allowance for impairment losses, amounted to P988 million and P882 million as of June 30, 2009 and 2008, respectively (see Note 6). No allowance for impairment losses is necessary for the Company’s due from a related party and due from associates as of June 30, 2009 and 2008.
Estimating Net Realizable Value of Inventories In determining the net realizable value of inventories, the Company considers inventory obsolescence based on specific identification and as determined by management for inventories estimated to be unsaleable in the future. The Company reduces the cost of inventories to a recoverable value at a level considered adequate to reflect market decline in value of the recorded inventory. The Company reviews, on a continuous basis, the product movement, changes in consumer demands and introduction of new products to identify inventories which are to be written down to net realizable values. The carrying amount of inventories was reduced to its net realizable value by P18 million and P9 million in 2009 and 2008, respectively. The net realizable value of inventories amounted to P704 million and P679 million as of June 30, 2009 and 2008, respectively (see Note 7).
Estimating Useful Lives of the Excess of Cost of Containers over Deposit ValuesThe excess of the acquisition costs of the returnable bottles and cases over their deposit values is deferred and amortized over their estimated useful lives (EUL) principally determined by their historical breakage and trippage. A reduction in the EUL of excess of cost over deposit value would increase the recorded amortization and decrease noncurrent assets. As of June 30, 2009 and 2008, accumulated amortization of excess of cost over deposit values of returnable bottles and cases amounted to P3.2 billion and P2.7 billion, respectively. The carrying amounts of bottles and cases amounted to P2.4 billion and P2.0 billion as of June 30, 2009 and 2008, respectively (see Note 9).
Estimating Allowance for Unusable ContainersAn allowance for unusable containers is maintained based on specific identification and as determined by management to cover bottles and shells that are no longer considered fit for use in the business, obsolete or in excess of the Company’s needs. As of June 30, 2009 and 2008, allowance for unusable containers amounted to P17 million and P7 million, respectively (see Note 9).
��
Estimating Useful Lives of Property, Plant and EquipmentThe Company reviews annually the EUL of property, plant and equipment based on the period over which the assets are expected to be available for use and updates those expectations if actual results differ from previous estimates due to physical wear and tear and technical or commercial obsolescence. It is possible that future results of operations could be materially affected by changes in these estimates brought about by changes in the factors mentioned. A reduction in the EUL of property, plant and equipment would increase the recorded depreciation and amortization expenses and decrease noncurrent assets.
The EUL are as follows:
Number of Years Buildings and leasehold improvements 20 or term of the lease, whichever is shorter Machinery and other equipment 3 - 10 Furniture and fixtures 10
As of June 30, 2009 and 2008, the carrying amounts of property, plant and equipment amounted to P3.2 billion and P2.9 billion, respectively (see Note 10).
Estimating Allowance for Impairment Losses on Nonfinancial AssetsThe Company assesses impairment on property, plant and equipment and investments in associates whenever events or changes in circumstances indicate that the carrying amounts of these assets may not be recoverable. The factors that the Company considers important which could trigger an impairment review include the following:
• significant underperformance relative to the expected historical or projected future operating results;
• significant changes in the manner of use of the acquired assets or the strategy for overall business; and
• significant negative industry or economic trends.
If any impairment indicator exists, the asset’s recoverable amount is estimated. Determining the recoverable value of the assets requires estimation of cash flows expected to be generated from continued use and ultimate disposal of such assets. An impairment loss is recognized whenever the carrying amount of an asset exceeds its recoverable amount. Impairment losses would increase recorded operating expenses and decrease the noncurrent assets. As of June 30, 2009 and 2008, none of these impairment indicators exist on the Company’s property, plant and equipment and investments in associates. An impairment loss amounting to P15 million (included under “Selling and Distribution Expenses” in the statements of income) was recognized for marketing equipment (included as part of machinery and other equipment under “Property, plant and equipment” account in the balance sheets) in fiscal year 2007. The related allowance was fully written-off in fiscal year 2007. As of June 30, 2009 and 2008, the carrying amounts of property, plant and equipment amounted to P3.2 billion and P2.9 billion, respectively (see Note 10). Investments in associates amounted to P528 million and P526 million as of June 30, 2009 and 2008, respectively (see Note 8).
Estimating Realizability of Deferred Tax AssetsThe Company reviews the carrying amounts of deferred tax assets at each balance sheet date and reduces deferred tax assets to the extent that it is no longer probable that sufficient taxable profit will be available to allow all or part of the deferred tax assets to be utilized. The Company’s assessment on the recognition of deferred tax assets is based on the forecasted taxable income of the subsequent reporting periods. This forecast is based on the Company’s past results and future expectations on revenues and expenses. The Company has no unrecognized deferred tax assets as of June 30, 2009 and 2008. As of June 30, 2009 and 2008, the Company has net deferred tax liabilities amounting to P376 million and P290 million, respectively (see Note 13).
pepSi-cola productS philippineS, inc.
(amountS in thouSandS, except number of ShareS and par value per Share and when otherwiSe Stated)
noteS to the financial StatementS

��
Estimating Retirement Benefits LiabilityThe determination of the retirement benefits liability and retirement benefits cost is dependent on the selection of certain assumptions used by the actuary in calculating such amounts. Those assumptions include, among others, discount rates, expected returns on plan assets and salary increase rate. Actual results that differ from the Company’s assumptions, subject to the 10% corridor test, are accumulated and amortized over future periods and therefore, generally affect the recognized expense and recorded obligations in such future periods. As of June 30, 2009 and 2008, the Company has unrecognized net actuarial gains amounting to P7 million and P89 million, respectively (see Note 24).
3. SignificantAccountingPolicies
The following explains the significant accounting policies which have been adopted in the preparation of the financial statements:
Adoption of Interpretation and Amendments to StandardsThe accounting policies adopted are consistent with those of the previous financial year, except for the following Philippine interpretation which became effective on January 1, 2008 and amendments to existing standards which became effective on July 1, 2008:
• Philippine Interpretation IFRIC-14, PAS 19 - The Limit on a Defined Benefit Asset, Minimum Funding Requirements and their Interaction, provides general guidance on how to assess the limit in PAS 19, Employee Benefits, on the amount of the surplus that can be recognized as an asset. It also explains how the pension asset or liability may be affected when there is a statutory or contractual minimum funding requirement. The adoption of this interpretation did not have a significant impact on the Company’s financial statements.
• Amendments to PAS 39, Financial Instruments: Recognition and Measurement, and PFRS 7, Financial Instruments: Disclosures, which are effective beginning July 1, 2008, permit an entity to reclassify nonderivative financial assets, other than those designated at fair value through profit or loss upon initial recognition, out of the trading category in certain circumstances. The amendments also permit an entity to transfer from the available-for-sale category to the loans and receivables category a financial asset that otherwise would have met the definition of loans and receivables, if the entity has the intention and ability to hold that financial asset for the foreseeable future. The adoption of these amendments to the standards did not have a significant effect on the Company’s financial statements.
New Standard, Revised Standard, Amendments to Standards and Interpretation Not Yet AdoptedThe following are the new standard, revised standard, amendments to standards and interpretation which have been approved and are not yet effective and have not been applied in preparing these financial statements:
• PFRS 8, Operating Segments. This will be effective for financial years beginning on or after January 1, 2009 and will replace PAS 14, Segment Reporting. This PFRS adopts a management approach in reporting segment information. The information reported would be that which management uses internally for evaluating the performance of operating segments and allocating resources to those segments. It is required for adoption only by entities whose debt or equity instruments are publicly traded, or are in the process of filing with the SEC for the purposes of issuing any class of instruments in a public market. The requirements of the standard will be applied in the Company’s financial statements upon its adoption on July 1, 2009.

��
• Revised PAS 1, Presentation of Financial Statements. The revised standard will be effective for financial years beginning on or after January 1, 2009. The revised standard introduces “total comprehensive income” (i.e., changes in equity during a period, other than those changes resulting from transactions with owners in their capacity as owners), which is presented either in: (a) one statement (i.e., a statement of comprehensive income); or (b) two statements (i.e., an income statement and a statement beginning with profit or loss and displaying components of other comprehensive income). Certain requirements are also required by Revised PAS 1 that are not required by the original standard. The requirements of the revised standard will be included in the Company’s financial statements upon its adoption on July 1, 2009.
• Improvements to PFRS 2008 will be effective for financial years beginning on or after January 1, 2009. The improvements discusses 35 amendments and is divided into two parts: a) Part I includes 24 amendments that result in accounting changes for presentation, recognition or measurement purposes; and b) Part II includes 11 terminology or editorial amendments that the International Accounting Standards Board expects to have either no or only minimal effects on accounting. The Company expects that the improvements to standards will not have significant impact on the Company’s financial statements upon its adoption on July 1, 2009.
• Amendments to PFRS 7, Improving Disclosures about Financial Instruments. This will be effective for annual periods beginning on or after January 1, 2009. These amendments enhance disclosures over fair value measurements relating to financial instruments, specifically in relation to disclosures over the inputs used in valuations techniques and the uncertainty associated with such valuations and improves disclosures over liquidity risk to address current diversity in practice in how such disclosure requirements are being interpreted and applied, proposing quantitative disclosures based on how liquidity risk is managed and strengthening the relationship between quantitative and qualitative liquidity risk disclosures. The requirements of the amendments to standard will be included in the Company’s financial statements upon its adoption on July 1, 2009.
• Philippine Interpretation IFRIC-17, Distributions of Noncash Assets to Owners. This will be effective for annual periods beginning on or after July 1, 2009. This interpretation provides guidance on the accounting for non-reciprocal distributions of non-cash assets to owners acting in their capacity as owners. It also applies to distributions in which the owners may elect to receive either the non-cash asset or a cash alternative. The liability for the dividend payable is measured at the fair value of the assets to be distributed. This interpretation is not expected to have any significant impact on the Company’s financial statements upon its adoption on July 1, 2009.
Financial InstrumentsDate of Recognition. The Company recognizes a financial asset or a financial liability in the balance sheets when it becomes a party to the contractual provisions of the instrument. The Company determines the classification of its financial assets and liabilities on initial recognition and, where allowed and appropriate, re-evaluates this designation at each balance sheet date. In the case of a regular way purchase or sale of financial assets, recognition and derecognition, as applicable, is done using settlement date accounting. Regular way purchases or sales of financial assets require delivery of assets within the time frame generally established by regulations in the market place.
Initial Recognition of Financial Instruments. Financial instruments are recognized initially at fair value, which is the fair value of the consideration given (in case of an asset) or received (in case of a liability). The fair value of the consideration given or received is determined by reference to the transaction price or other market prices. If such market prices are not reliably determinable, the fair value of the consideration is estimated as the sum of all future cash payments or receipts, discounted using the prevailing market rate of interest for similar instruments with similar maturities. The initial measurement of financial instruments, except for those designated at fair value through profit and loss (FVPL), includes transaction cost.
pepSi-cola productS philippineS, inc.
(amountS in thouSandS, except number of ShareS and par value per Share and when otherwiSe Stated)
noteS to the financial StatementS

�7
Subsequent to initial recognition, the Company classifies its financial assets in the following categories: held-to-maturity (HTM) investments, available-for-sale (AFS) financial assets, FVPL financial assets, and loans and receivables. Financial liabilities are classified as financial liabilities at FVPL or other financial liabilities. The classification depends on the purpose for which the investments are acquired and whether they are quoted in an active market. As of June 30, 2009 and 2008, the Company has no financial assets and financial liabilities at FVPL, HTM investments and AFS financial assets.
Cash and Cash Equivalents. Cash includes cash on hands and in banks. Cash equivalents are short-term, highly liquid investments that are readily convertible to known amounts of cash with original maturities of three months or less from dates of acquisition and that are subject to an insignificant risk of change in value.
Loans and Receivables. Loans and receivables are nonderivative financial assets with fixed or determinable payments that are not quoted in an active market. They are not entered into with the intention of immediate or short-term resale and are not designated as AFS financial assets or financial asset at FVPL. Loans and receivables are carried at cost or amortized cost, less impairment in value. Amortization is determined using the effective interest method. Gains and losses are recognized in income when the loans and receivables are derecognized or impaired, as well as through amortization process.
The Company’s trade and other receivables, due from associates and due from a related party are included in this category.
Other Financial Liabilities. This category pertains to financial liabilities that are not held for trading or not designated as at FVPL upon the inception of the liability. These include liabilities arising from operations or borrowings.
The financial liabilities are recognized initially at fair value and are subsequently carried at amortized cost, taking into account the impact of applying the effective interest method of amortization (or accretion) for any related premium, discount and any directly attributable transaction costs.
Included in this category are the Company’s notes payable and accounts payable and accrued expenses that meet the above definition (other than liabilities covered by other accounting standards, such as income tax payable and accrued retirement cost).
Derecognition of Financial InstrumentsFinancial Assets. A financial asset (or, where applicable a part of a financial asset or part of a group of similar financial assets) is derecognized when:
• the rights to receive cash flows from the financial asset have expired;• the Company retains the right to receive cash flows from the financial asset, but has assumed an obligation
to pay them in full without material delay to a third party under a ‘pass-through’ arrangement; or• the Company has transferred its rights to receive cash flows from the financial asset and either (a) has
transferred substantially all the risks and rewards of the financial asset, or (b) has neither transferred nor retained substantially all the risks and rewards of the financial asset, but has transferred control of the financial asset.
When the Company has transferred its rights to receive cash flows from a financial asset and has neither transferred nor retained substantially all the risks and rewards of the financial asset nor transferred control of the financial asset, the financial asset is recognized to the extent of the Company’s continuing involvement in the financial asset. Continuing involvement that takes the form of a guarantee over the transfer of the financial asset is measured at the lower of the original carrying amount of the financial asset and the maximum amount of consideration that the Company could be required to repay.

�8
Financial Liabilities. A financial liability is derecognized when the obligation under the liability is discharged or cancelled or has expired.
When an existing financial liability is replaced by another from the same lender on substantially different terms, or the terms of an existing liability are substantially modified, such modification is treated as a derecognition of the carrying value of the original liability and the recognition of a new liability at fair value, and any resulting difference is recognized in the statements of income.
Offsetting Financial InstrumentsFinancial assets and financial liabilities are offset and the net amount is reported in the balance sheets if, and only if there is a currently enforceable legal right to offset the recognized amounts and there is an intention to settle on a net basis, or to realize the financial asset and settle the financial liability simultaneously.
InventoriesInventories are valued at the lower of cost and net realizable value. The cost of inventories includes expenditure incurred in acquiring the inventories, production or conversion costs and other costs incurred in bringing them to their existing location and condition. In the case of manufactured inventories and work in process, cost includes an appropriate share of production overheads based on normal operating capacity. Net realizable value of inventories other than spare parts and supplies, is the estimated selling price in the ordinary course of business, less estimated cost of completion and selling expenses. For the spare parts and supplies, net realizable value is the estimated selling price less cost to sell.
Investments in AssociatesAssociates are those entities in which the Company has significant influence, but not control, over the financial and operating policies and which are neither subsidiaries nor joint ventures. The financial statements include the Company’s share of the total recognized earnings and losses of associates on an equity accounted basis, from the date that significant influence commences until the date that significant influence ceases. Distributions received from the associates reduce the carrying amount of the investments. Income and expense resulting from transactions between the Company and the associates are eliminated to the extent of the interest in the associates. When the Company’s share of losses exceeds the cost of the investment in an associate, the carrying amount of that interest is reduced to nil and recognition of further losses is discontinued except to the extent that the Company has incurred legal or constructive obligations or made payments on behalf of the associate.
The Company’s investment includes goodwill that represents the excess of acquisition cost of investment over the fair value of the net identifiable assets of the investee companies at the date of acquisition, net of impairment in value, if any. The financial statements of the associates are prepared for the same reporting period as the Company’s financial statements.
Bottles and CasesBottles and cases include returnable glass bottles and cases stated at deposit values and the excess of the acquisition costs of returnable bottles and cases over their deposit values. These are deferred and amortized using the straight-line method over their estimated useful lives (5 years for returnable bottles and 7 years for cases) determined principally by their actual historical breakage and trippage. An allowance is provided for excess, unusable and obsolete returnable bottles and cases based on the specific identification method.
Property, Plant and EquipmentProperty, plant and equipment are carried at cost (which comprises its purchase price and any directly attributable cost in bringing the asset to working condition and location for its intended use) less accumulated depreciation, amortization and impairment losses, if any.
pepSi-cola productS philippineS, inc.
(amountS in thouSandS, except number of ShareS and par value per Share and when otherwiSe Stated)
noteS to the financial StatementS

�9
Subsequent costs that can be measured reliably are added to the carrying amount of the asset when it is probable that future economic benefits associated with the asset will flow to the Company. The cost of day-to-day servicing of an asset is recognized as expense in the period in which it is incurred.
Construction in progress represents plant and equipment under construction and is stated at cost. This includes cost of construction and other direct costs. Construction in progress is not depreciated until such time that the relevant assets are completed and put into operational use.
Depreciation commences once the assets become available for use. Depreciation is computed on a straight-line basis over the EUL of the assets. Leasehold improvements are amortized over the EUL of the improvements or the term of the lease, whichever is shorter.
The EUL and depreciation and amortization methods are reviewed at each balance sheet date to ensure that the period and depreciation and amortization methods are consistent with the expected pattern of economic benefits from those assets.
When an asset is disposed of, or is permanently withdrawn from use and no future economic benefits are expected from its disposal, the cost and accumulated depreciation, amortization and impairment losses, if any, are removed from the accounts and any resulting gain or loss arising from the retirement or disposal is recognized in the statements of income.
ImpairmentFinancial AssetsA financial asset is assessed at each reporting date to determine whether there is any objective evidence that it is impaired. A financial asset is considered to be impaired if objective evidence indicates that one or more events have had a negative effect on the estimated future cash flows of that asset.
An impairment loss in respect of a financial asset measured at amortized cost is calculated as the difference between its carrying amount, and the present value of the estimated future cash flows discounted at the original effective interest rate.
Individually, significant financial assets are tested for impairment on an individual basis. The remaining financial assets are assessed collectively in groups that share similar credit risk characteristics. All impairment losses are recognized in the statements of income.
Reversal of an impairment loss previously recognized is recorded when the decrease can be objectively related to an event occurring after the impairment event. Such reversal is recognized in the statements of income. However, the increased carrying amount is only recognized to the extent it does not exceed what the amortized cost would have been had the impairment not been recognized.
Nonfinancial AssetsThe carrying amounts of the Company’s nonfinancial assets such as investments in associates, bottles and cases, and property, plant and equipment are reviewed at each balance sheet date to determine whether there is any indication of impairment. If any such indication exists, the asset’s recoverable amount is estimated.
An impairment loss is recognized in the statements of income whenever the carrying amount of an asset or its cash generating unit exceeds its recoverable amount.
�0
The recoverable amount of a nonfinancial asset is the greater of the asset’s fair value less costs to sell and its value in use. The fair value less costs to sell is the amount obtainable from the sale of the asset in an arm’s length transaction. In assessing value in use, the estimated future cash flows are discounted to their present value using a pre-tax discount rate that reflects current market assessments of the time value of money and the risks specific to the asset. For an asset that does not generate cash flows largely independent of those from other assets, the recoverable amount is determined for the cash-generating unit to which the asset belongs.
An impairment loss is reversed if there has been a change in the estimates used to determine the recoverable amount. An impairment loss is reversed only to the extent that the asset’s carrying amount does not exceed the carrying amount that would have been determined, net of depreciation or amortization, if no impairment loss had been recognized. Reversals of impairment are recognized in the statements of income.
Capital StockCapital stock is classified as equity. Incremental costs directly attributable to the issue of shares are recognized as a deduction from equity, net of any tax effect.
Revenue RecognitionRevenue is recognized to the extent that it is probable that the economic benefits will flow to the Company and the revenue can be measured reliably. Revenue from the sale of goods is measured at the fair value of the consideration received or receivable, net of returns and discounts. Revenue is recognized when the significant risks and rewards of ownership have been transferred to the buyer, recovery of the consideration is probable, the associated costs and possible return of goods can be estimated reliably, and there is no continuing involvement with the goods. Transfer of risks, and rewards of ownership coincides with the delivery of the products to the customers.
Cost and Expense RecognitionCosts and expenses are recognized in the statements of income as they are incurred.
Advertising and Marketing CostsAdvertising and marketing costs are charged to operations in the year such costs are incurred.
Finance Income and ExpensesFinance income comprises of interest income on bank deposits and money market placements, dividend income and foreign currency gains. Interest income is recognized in the statements of income as it accrues, using the effective interest method. Dividend income is recognized on the date that the Company’s right to receive payment is established.
Finance expenses comprise interest expense on borrowings and foreign currency losses. All finance expenses are recognized in the statements of income as they accrue.
LeasesLeases in which a significant portion of the risks and rewards of ownership is retained by the lessor are classified as operating leases. Payments made under operating leases are recognized in the statements of income on a straight-line basis over the term of the lease.
pepSi-cola productS philippineS, inc.
(amountS in thouSandS, except number of ShareS and par value per Share and when otherwiSe Stated)
noteS to the financial StatementS

��
Borrowing CostsBorrowing costs are generally expensed as incurred. Borrowing costs are capitalized if they are directly attributable to the acquisition or construction of a qualifying asset. The capitalization of borrowing costs (a) commences when the activities to prepare the assets are in progress and expenditures and borrowing costs are being incurred; (b) is suspended during extended periods in which active development, improvement and construction of the assets are interrupted; and (c) ceases when substantially all the activities necessary to prepare the assets are complete. These costs are amortized using the straight-line method over the EUL of the related property, plant and equipment to which it is capitalized.
Provisions and ContingenciesA provision is a liability of uncertain timing or amount. It is recognized when the Company has a present obligation (legal or constructive) as a result of a past event; it is probable that an outflow of resources embodying economic benefits will be required to settle the obligation; and a reliable estimate can be made of the amount of the obligation.
Provisions are revisited at each balance sheet date and adjusted to reflect the current best estimate. If the effect of the time value of money is material, provisions are determined by discounting the expected future cash flows at a pretax rate that reflects the current market assessment of the time value of money, and, where appropriate, the risks specific to the liability. Where discounting is used, the increase in the provision due to the passage of time is recognized as interest expense.
Contingent liabilities are not recognized in the financial statements. These are disclosed unless the possibility of an outflow of resources embodying economic benefits is remote. Contingent assets are not recognized in the financial statements but are disclosed when an inflow of economic benefits is probable.
Income TaxesIncome tax expense for the period comprises current and deferred tax. Income tax expense is recognized in the statements of income except to the extent that it relates to items recognized directly in equity, in which case it is recognized in equity.
Current TaxCurrent tax is the expected tax payable on the taxable income for the year, using tax rates enacted or substantively enacted at the balance sheet date, and any adjustment to tax payable in respect of previous years.
Deferred TaxDeferred tax is provided using the balance sheet liability method. Deferred tax assets and liabilities are recognized for the future tax consequences attributable to temporary differences between the carrying amounts of assets and liabilities for financial reporting purposes and the amounts used for taxation purposes and the carryforward tax benefits of the net operating loss carryover (NOLCO) and the excess of minimum corporate income tax (MCIT) over the regular corporate income tax (RCIT). The amount of deferred tax provided is based on the expected manner of realization or settlement of the carrying amount of assets and liabilities, using tax rates enacted or substantively enacted at the balance sheet date. A deferred tax asset is recognized only to the extent that it is probable that future taxable profits will be available against which the deductible temporary differences and the carryforward benefits of NOLCO and MCIT can be utilized. Deferred tax assets are reduced to the extent that it is no longer probable that the related tax benefit will be realized.

�2
Retirement PlanThe Company has a funded, noncontributory defined benefit retirement plan covering substantially all of its regular and full time employees. Retirement costs are actuarially determined using the projected unit credit method which reflect services rendered by employees to the date of valuation and incorporates assumptions concerning employees’ projected salaries. Actuarial gains and losses that exceed 10% of the greater of the present value of the Company’s defined benefit obligation and the fair value of the plan assets are amortized over the expected average working lives of the participating employees.
The defined benefit liability is the aggregate of the present value of the defined benefit obligation and actuarial gains and losses not recognized reduced by past service cost not yet recognized and the fair value of plan assets out of which the obligations are to be settled directly. If such aggregate is negative, the asset is measured at the lower of such aggregate or the aggregate of the cumulative unrecognized net actuarial losses and past service cost and the present value of any economic benefits available in the form of refunds from the plan or reductions in the future contributions of the plan (the asset ceiling test).
The Company recognizes past service cost as an expense on a straight-line basis over the average vesting period. The Company recognizes past service cost immediately to the extent that the benefits are already vested following the introduction of, or changes to, the plan.
Foreign Currency TransactionsThe functional and presentation currency of the Company is the Philippine peso. Transactions in foreign currencies are recorded in Philippine peso based on the prevailing exchange rates at the date of the transactions. Foreign currency denominated monetary assets and liabilities are translated using the exchange rates prevailing at the balance sheet date. Exchange gains or losses arising from translation of foreign currency denominated items at rates different from those at which they were previously recorded are credited or charged to current operations.
Earnings Per Share (EPS)Basic EPS is computed by dividing the net income by the weighted average number of common shares outstanding during the period, with retroactive adjustments for any stock dividends declared.
Diluted EPS is calculated by dividing the net income attributable to common shareholders by the weighted average number of common shares outstanding during the year adjusted for the effects of any dilutive potential common shares.
Dividends on Common SharesCash dividends on common shares are recognized as a liability and deducted from equity when approved by the BOD of the Company. Dividends for the year that are approved after the balance sheet date are dealt with as a nonadjusting event after balance sheet date.
Segment ReportingThe Company’s operating business is organized and managed according to the nature of the products provided, with each segment representing a strategic business unit that offers different products and serves different markets.
Subsequent EventsPost year-end events that provide additional information about the Company’s position at the balance sheet date (adjusting events) are reflected in the financial statements. Post year-end events that are not adjusting events are disclosed in the notes to the financial statements when material.
pepSi-cola productS philippineS, inc.
(amountS in thouSandS, except number of ShareS and par value per Share and when otherwiSe Stated)
noteS to the financial StatementS

��
4. Financial Risk Management
The Company has exposure to the following risks from its use of financial instruments:
• Credit risk• Liquidity risk• Market risk
This note presents information about the Company’s exposure to each of the above risks, the Company’s objectives, policies and processes for measuring and managing risks, and the Company’s management of capital. Further quantitative disclosures are included throughout these financial statements, mainly in Note 23 to the financial statements.
The main purpose of the Company’s dealings in financial instruments is to fund its operations and capital expenditures.
The BOD has overall responsibility for the establishment and oversight of the Company’s risk management framework. The BOD has established the Executive Committee (EXCOM), which is responsible for developing and monitoring the Company’s risk management policies. The EXCOM identifies all issues affecting the operations of the Company and reports regularly to the BOD on its activities.
The Company’s risk management policies are established to identify and analyze the risks faced by the Company, to set appropriate risk limits and controls, and to monitor risks and adherence to limits. Risk management policies and systems are reviewed regularly to reflect changes in market conditions and the Company’s activities. All risks faced by the Company are incorporated in the annual operating budget. Mitigating strategies and procedures are also devised to address the risks that inevitably occur so as not to affect the Company’s operations and forecasted results. The Company, through its training and management standards and procedures, aims to develop a disciplined and constructive control environment in which all employees understand their roles and obligations.
The Audit Committee performs oversight over financial management functions, specifically in the areas of managing credit, liquidity, market and other risks of the Company. The Audit Committee directly interfaces with the internal audit function, which undertakes reviews of risk management controls and procedures and ensures the integrity of internal control activities which affect the financial management system of the Company. The results of procedures performed by Internal Audit are reported to the Audit Committee.
Credit RiskCredit risk represents the risk of loss the Company would incur if credit customers and counterparties fail to perform their contractual obligations. The Company’s credit risk arises principally from the Company’s trade receivables.
The Plant Credit Committees have established a credit policy under which each new customer is analyzed individually for creditworthiness before standard credit terms and conditions are granted. The Company’s review includes the requirements of updated credit application documents, credit verifications through confirmation that there is no credit violations and that the account is not included in the negative list, and analyses of financial performance to ensure credit capacity. Credit limits are established for each customer, which serve as the maximum open amount at which they are allowed to purchase on credit, provided that credit terms and conditions are observed.
The credit limit and status of each customer’s account are first checked before processing a credit transaction. Customers that fail to meet the Company’s conditions in the credit checking process may transact with the Company only on cash basis.

��
It is the Company’s policy to conduct an annual credit review through identification and summarization of under-performing customers and review and validation of credit violation reports. Based on the summary, the Plant Credit Committees may upgrade, downgrade, suspend and cancel credit lines.
Most of the Company’s customers have been transacting with the Company for several years, and losses have occurred from time to time. Customer credit risks are monitored through annual credit reviews conducted on a per plant basis. Results of credit reviews are grouped and summarized according to credit characteristics, such as geographic location, aging profile and credit violations. Historically, credit violations have been attributable to bounced checks, and denied, fictitious or absconded credit accounts.
Collateral securities are required for credit limit applications that exceed certain thresholds (see Note 23). The Company has policies for acceptable collateral securities that may be presented upon submission of credit applications.
Liquidity RiskLiquidity risk is the risk that the Company will encounter difficulty in meeting financial obligations as they fall due. The Company manages liquidity risk by forecasting projected cash flows and maintaining a balance between continuity of funding and flexibility. Treasury controls and procedures are in place to ensure that sufficient cash is maintained to cover daily operational and working capital requirements, as well as capital expenditures and debt service payments. Management closely monitors the Company’s future and contingent obligations and sets up required cash reserves as necessary in accordance with internal requirements.
In addition, the Company has the following credit facilities:
• The total commitment as of June 30, 2009 and 2008 under the line of credit is P2.9 billion and P2 billion, respectively, of which the Company had drawn P219 million and P411 million, respectively, under letters of credit and short-term loans. All facilities under the omnibus line bear interest at floating rates consisting of a margin over current Philippine treasury rates; and
• P580 million and P480 million domestic bills purchased line, which are available as of June 30, 2009 and 2008, respectively.
Market RiskMarket risk is the risk that changes in market prices, such as commodity prices, foreign exchange rates, interest rates and other market prices will affect the Company’s income or the value of its holdings of financial instruments. The objective of market risk management is to manage and control market risk exposures within acceptable parameters, while optimizing the return.
The Company is subject to various market risks, including risks from changes in commodity prices, interest rates and currency exchange rates.
Commodity PricesThe risk from commodity price changes relates to the Company’s ability to recover higher product costs through price increases to customers, which may be limited due to the competitive pricing environment that exists in the Philippine beverage market and the willingness of consumers to purchase the same volume of beverages at higher prices. The Company’s most significant commodity exposure is to the Philippine sugar price.
pepSi-cola productS philippineS, inc.
(amountS in thouSandS, except number of ShareS and par value per Share and when otherwiSe Stated)
noteS to the financial StatementS
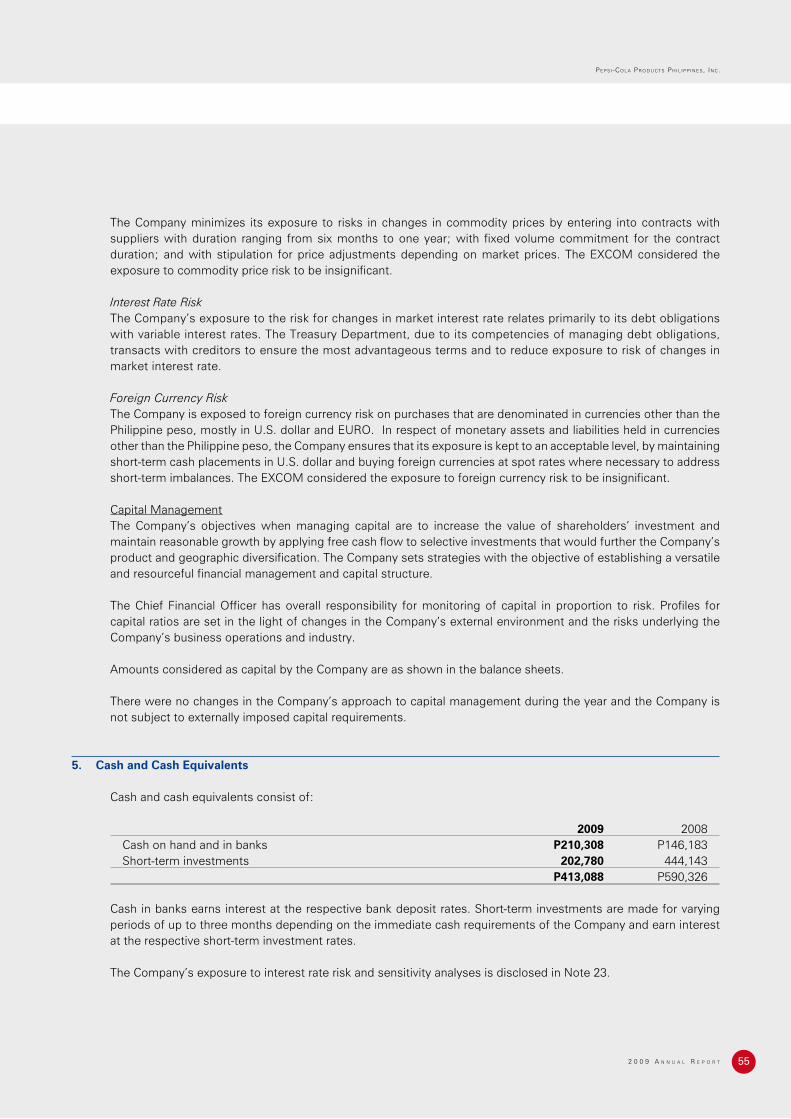
��
The Company minimizes its exposure to risks in changes in commodity prices by entering into contracts with suppliers with duration ranging from six months to one year; with fixed volume commitment for the contract duration; and with stipulation for price adjustments depending on market prices. The EXCOM considered the exposure to commodity price risk to be insignificant.
Interest Rate RiskThe Company’s exposure to the risk for changes in market interest rate relates primarily to its debt obligations with variable interest rates. The Treasury Department, due to its competencies of managing debt obligations, transacts with creditors to ensure the most advantageous terms and to reduce exposure to risk of changes in market interest rate.
Foreign Currency RiskThe Company is exposed to foreign currency risk on purchases that are denominated in currencies other than the Philippine peso, mostly in U.S. dollar and EURO. In respect of monetary assets and liabilities held in currencies other than the Philippine peso, the Company ensures that its exposure is kept to an acceptable level, by maintaining short-term cash placements in U.S. dollar and buying foreign currencies at spot rates where necessary to address short-term imbalances. The EXCOM considered the exposure to foreign currency risk to be insignificant.
Capital ManagementThe Company’s objectives when managing capital are to increase the value of shareholders’ investment and maintain reasonable growth by applying free cash flow to selective investments that would further the Company’s product and geographic diversification. The Company sets strategies with the objective of establishing a versatile and resourceful financial management and capital structure.
The Chief Financial Officer has overall responsibility for monitoring of capital in proportion to risk. Profiles for capital ratios are set in the light of changes in the Company’s external environment and the risks underlying the Company’s business operations and industry.
Amounts considered as capital by the Company are as shown in the balance sheets.
There were no changes in the Company’s approach to capital management during the year and the Company is not subject to externally imposed capital requirements.
5. Cash and Cash equivalents
Cash and cash equivalents consist of:
2009 2008 Cash on hand and in banks P210,308 P146,183 Short-term investments 202,780 444,143 P413,088 P590,326
Cash in banks earns interest at the respective bank deposit rates. Short-term investments are made for varying periods of up to three months depending on the immediate cash requirements of the Company and earn interest at the respective short-term investment rates.
The Company’s exposure to interest rate risk and sensitivity analyses is disclosed in Note 23.

��
6. Receivables
Receivables consist of:
Note 2009 2008 Trade 23 P1,081,531 P917,272 Others 56,731 66,885 1,138,262 984,157 Less allowance for impairment losses 150,297 102,082 P987,965 P882,075
Trade receivables are non-interest bearing and are generally on a 30 to 60 days term. Other receivables consist mainly of receivables from employees and freight and insurance claims.
The movements in allowance for impairment losses on receivables are as follows:
2009 2008 trade Others Trade Others Balance at beginning of year P75,226 P26,856 P57,565 P9,826 Impairment losses recognized during the year 53,118 304 20,778 20,499 Write-offs during the year (2,832) (2,375) (3,117) (3,469) Balance at end of year P125,512 P24,785 P75,226 P26,856
The Company’s exposure to credit risk related to trade and other receivables is disclosed in Note 23.
7. Inventories
Inventories consist of:
Note 2009 2008 Finished goods: 11 At cost P325,527 P359,021 At net realizable value 322,427 358,140 Work in process: 11 At cost 9,475 10,812 At net realizable value 9,475 10,812 Raw and packaging materials: 11 At cost 286,956 227,376 At net realizable value 272,242 218,985 Spare parts and supplies: At cost 99,935 91,086 At net realizable value 99,819 90,996 Total inventories at lower of cost or net realizable value P703,963 P678,933
pepSi-cola productS philippineS, inc.
(amountS in thouSandS, except number of ShareS and par value per Share and when otherwiSe Stated)
noteS to the financial StatementS

�7
Under the terms of agreements covering liabilities under trust receipts, certain inventories have been released to the Company in trust for certain local banks. The Company is accountable to these banks for the trusteed inventories (see Note 11).
In addition, the Company’s notes payable are secured by mortgage trusts indentures on various assets, which include P284 million and P230 million of inventories as of June 30, 2009 and 2008.
8. Investments in associates
Investments in associates consist of:
Percentage (%) of Ownership 2009 2008 2009 2008 Acquisition cost: Nadeco Realty Corporation (NRC) 40% 40% P232,508 P232,508 Nadeco Holdings Corporation (NHC) 40% 40% 132 132 232,640 232,640 Effect of dilution of ownership in NRC (1,018) (1,018) 231,622 231,622 Accumulated equity in net earnings: Balance at the beginning of the year 293,880 273,852 Equity in net earnings for the year 2,221 20,028 Balance at the end of the year 296,101 293,880 P527,723 P525,502
The financial reporting date of NRC and NHC is June 30. The application of the equity method of accounting is based on the Company’s beneficial interest in the net profits and net assets of NRC and NHC in accordance with their respective articles of incorporation.
As of June 30, 2009 and 2008, the undistributed earnings of the associates included in the Company’s retained earnings amounting to P296 million and P294 million, respectively, are not available for distribution to stockholders unless declared by the associates.
The following are the summarized comparative financial information pertaining to the Company’s associates:
as of June 30, 2009 assets Liabilities equity Revenues Net Income NRC P730,118 P211,048 P519,070 P10,580 P1,994 NHC (consolidated) 730,622 211,305 519,317 10,581 2,377
As of June 30, 2008 Assets Liabilities Equity Revenues Net Income NRC P730,056 P212,980 P517,076 P34,348 P19,941 NHC (consolidated) 730,609 213,669 516,940 34,349 20,235

�8
9. Bottles and Cases
Bottles and cases consist of:
Note 2009 2008 Deposit values of returnable bottles and cases on hand - net of allowance for unusable containers of P16,714 in 2009 and P7,386 in 2008 11 P440,948 P305,576 Excess of cost over deposit values of returnable bottles and cases - net of accumulated amortization 11 1,992,778 1,635,490 2,433,726 1,941,066Bottles and shells in transit 7,472 31,588 P2,441,198 P1,972,654
The rollforward of excess of cost over deposit values of returnable bottles and cases is as follows:
2009 2008 Gross carrying amount: Balance at beginning of year P4,317,702 P3,633,724 Additions 843,070 683,978 Balance at the end of year 5,160,772 4,317,702 accumulated amortization: Balance at beginning of year 2,682,212 2,291,810 Amortization for the year 490,031 379,599 Other movements (4,249) 10,803 Balance at the end of year 3,167,994 2,682,212 Carrying amount: Balance at beginning of year P1,635,490 P1,341,914 Balance at end of year P1,992,778 P1,635,490
A portion of the Company’s bottles and cases with a total collateral value of P4 billion based on original cost of bottles as of June 30, 2009 and 2008 are mortgaged and placed in trust under two mortgage trust indentures to secure the Company’s outstanding notes payable (see Note 11).
pepSi-cola productS philippineS, inc.
(amountS in thouSandS, except number of ShareS and par value per Share and when otherwiSe Stated)
noteS to the financial StatementS

�9
10. Property, Plant and equipment
The movements in this account are as follows: Buildings and Machinery and Leasehold Construction Furniture Other equiptment Improvements in Progress and Fixtures total Gross carrying amount: July 1, 2007 P4,904,988 P566,897 P455,952 P24,651 P5,952,488 Additions 728,216 88,536 491,299 1,467 1,309,518 Disposals/write-offs (56,545) (5,624) (11,964) - (74,133) Transfers 714,098 8,463 (723,051) 490 - June 30, 2008/July 1, 2008 6,290,757 658,272 212,236 26,608 7,187,873 Additions 715,130 116,021 - 2,713 833,864 Disposals/write-offs (92,842) (11,126) - (162) (104,130) Transfers 179,483 (492) (178,924) (67) - June 30, 2009 7,092,528 762,675 33,312 29,092 7,917,607 accumulated depreciation and amortization: July 1, 2007 3,393,519 380,588 - 20,274 3,794,381 Depreciation and amortization 553,149 36,115 - 748 590,012 Disposals/write-offs (52,874) (5,105) - - (57,979) June 30, 2008/July 1, 2008 3,893,794 411,598 - 21,022 4,326,414 Depreciation and amortization 498,218 36,497 - 1,078 535,793 Disposals/write-offs (92,447) (7,994) - (160) (100,601) June 30, 2009 4,299,565 440,101 - 21,940 4,761,606 Carrying amount: June 30, 2008 P2,396,963 P246,674 P212,236 P5,586 P2,861,459 June 30, 2009 P2,792,963 P322,534 P33,312 P7,152 P3,156,001
A substantial portion of the Company’s property, plant and equipment and certain parcels of land owned by NRC with a total collateral value of P1.4 billion as of June 30, 2009 and 2008 are mortgaged and placed in trust under two mortgage trust indentures to secure the Company’s outstanding notes payable (see Notes 11 and 14).
During the fiscal years 2009 and 2008, the Company has completed the expansion of certain plants located in key and strategic locations. It will continue to invest to complete the remaining expansion projects lined up.
Change in EUL of Marketing EquipmentDuring the fiscal year 2009, the Company reassessed the EUL of its marketing equipment. The said equipment, which is included as part of property, plant and equipment under “Machinery and Other Equipment” account, with previous EUL of five years is now expected to remain in operations for seven years from the date of purchase. The effect of change in depreciation expense for the current and future years is as follows:
2009 2010 2011 2012 After 2012 Increase (decrease) in depreciation expense (P91,548) (P70,604) (P48,103) (P19,312) P229,567

�0
11. Notes Payable
This account represents short-term loans from various local banks which are payable in lump sum on their respective maturity dates up to November 14, 2009 (up to July 10 in 2008). Interest rates on the said loans are repriced monthly based on negotiated rates or prevailing market rates. The short-term loans are secured by mortgage trust indentures on inventories, bottles and cases, and real estate, which include certain restrictions and requirements.
Interest rates range from 6.00% to 6.50% for 2009, 6.00% to 6.25% for 2008, and 7.00% to 8.00% for 2007. Interest expense on notes payable recognized in the statements of income amounted to P22 million, P36 million and P52 million for 2009, 2008 and 2007, respectively.
Information about the Company’s exposure to interest rate risk and liquidity risk is disclosed in Note 23.
12. accounts Payable and accrued expenses
Accounts payable and accrued expenses consist of:
Note 2009 2008 Trade payables 7, 14 P1,228,174 P1,485,148 Accrued advertising and marketing 147,319 89,026 Non-trade payables 104,505 125,582 Accrued retirement cost - current 24 82,324 40,785 Other accrued expenses 576,058 339,453 P2,138,380 P2,079,994
The Company’s other accrued expenses consist mainly of accruals for salaries and wages, other employee benefits, utilities and other operating expenses.
The Company’s exposure to liquidity risk related to trade and other payables is disclosed in Note 23.
13. Income taxes
The components of the income tax expense are as follows:
2009 2008 2007 Current tax expense and final taxes on interest income: Current period P324,832 P81,302 P363,235 Prior period - (171,236) - Deferred tax expense from origination and reversal of temporary differences and others 56,907 330,156 155,006 P381,739 P240,222 P518,241
pepSi-cola productS philippineS, inc.
(amountS in thouSandS, except number of ShareS and par value per Share and when otherwiSe Stated)
noteS to the financial StatementS

��
Deferred tax liabilities - net are attributable to the following:
2009 2008 Allowance for probable losses in values of bottles and cases, idle assets, impairment losses, inventory obsolescence and other provisions P80,712 P68,584 Accrual for retirement costs 64,246 70,709 Past service cost 34,079 35,187 Excess MCIT - 29,104 179,037 203,584 Bottles and cases (396,075) (368,195) Marketing equipment (158,685) (125,101) (554,760) (493,296) (P375,723) (P289,712)
In 2009, the Company applied the MCIT (incurred in 2008) amounting to P29 million as tax credit against its regular corporate income tax.
In 2008, the Company received a ruling from the Bureau of Internal Revenue (BIR) which allowed acceleration of deductions on marketing equipment and bottles and cases.
The reconciliation of the income tax expense computed at the statutory income tax rate to the income tax expense shown in the statements of income is as follows:
2009 2008 2007 Income before income tax P 1,181,429 P1,000,919 P1,519,627 Tax rate at 32.5% in 2009 and 35% in 2008 and 2007 P383,964 P350,322 P531,869 Additions to (reductions in) income tax resulting from the tax effects of: Nondeductible expenses 1,704 2,757 2,528 Change in tax rate 1,192 (51,607) (45) Interest income subjected to final tax (4,358) (6,565) (4,979) Equity in net earnings of associates (722) (7,010) (2,377) Transaction cost charged to equity - (48,204) - Others (41) 529 (8,755) P381,739 P240,222 P518,241
On May 24, 2005, Republic Act No. 9337 entitled “An Act Amending the National Internal Revenue Code, as Amended, with Salient Features” (Act), was passed into a law effective November 1, 2005. The Act includes the following significant revisions to the rules of taxation, among others:
a. Reduction in the corporate income tax rate from 35% to 30% starting January 1, 2009 and onwards; and
b. Reduction in unallowable interest rate from 42% to 33% beginning January 1, 2009.

�2
14. Related Party transactions
Related party relationship exists when one party has ability to control, directly or indirectly, through one or more intermediaries, the other party or exercise significant influence over the other party in making the financial and operating decisions. Such relationship also exists between and/or among entities which are under common control with the reporting enterprises, or between and/or among the reporting enterprises and their key management personnel, directors, or its stockholders.
The Company has significant related party transactions which are summarized as follows:
a. The Company has Exclusive Bottling Agreements with PepsiCo, Inc. (“PepsiCo”), stockholder, which has 29.49% beneficial interest in the Company, up to year 2017 and Pepsi Lipton International Limited (“Pepsi Lipton”), a joint venture of PepsiCo and Unilever N.V., up to year 2012. Under the agreements, the Company is authorized to bottle, sell and distribute Pepsi and Lipton beverage products in the Philippines. In addition, PepsiCo and Pepsi Lipton shall supply the Company with the main raw materials (concentrates) in the production of these beverage products and share in the funding of certain marketing programs. The agreements may be renewed by mutual agreement between the parties. Under the agreements, PepsiCo and Pepsi Lipton have the right to terminate the contracts under certain conditions, including failure to comply with terms and conditions of the appointment subject to written notice and rectification period, change of ownership control of the Company, change of ownership control of an entity which controls the Company, discontinuance of bottling beverages for 30 consecutive days, occurrence of certain events leading to the Company’s insolvency or bankruptcy, change in management and control of the business, among others. Total net purchases from PepsiCo, amounted to P2.6 billion, P2.4 billion and P2.4 billion for the years ended June 30, 2009, 2008 and 2007, respectively. Total purchases from Pepsi Lipton for the years ended June 30, 2009 and 2008 amounted to P81 million and P94 million, respectively. There are no Pepsi Lipton transactions in 2007.
The Company has a cooperative advertising and marketing program with PepsiCo and Pepsi Lipton that sets forth the agreed advertising and marketing activities and participation arrangement during the years covered by the bottling agreements. In certain instances, the Company pays for the said expenses and claim reimbursement from PepsiCo. For the years ended June 30, 2009, 2008 and 2007, the Company incurred marketing expenses amounting to P521 million, P665 million and P468 million, respectively. The Company’s receivable from PepsiCo amounted to P27 million and P136 million as of June 30, 2009 and 2008, respectively.
b. On April 11, 2007, the Company entered into a Performance Agreement with PepsiCo to meet certain marketing and investment levels from 2007 to 2017, as required by the bottling agreement with PepsiCo. The agreement requires the Company to: (1) spend a specified percentage with a minimum amount for the beverage products; (2) make certain investments based on a minimum percentage of the Company’s sales to expand the Company’s manufacturing capacity; (3) invest in a minimum number of coolers per year to support distribution expansion; and (4) expand the Company’s distribution capabilities in terms of the number of active routes, the number of new routes and the number of trucks used for distribution support.
c. Certain parcels of land properties of NRC, an associate, were mortgaged to secure a portion of the Company’s notes payable. The Company leases these parcels of land where some of its bottling plants are located. Lease expenses recognized amounted to P9.6 million, P11 million and P3 million for the years ended June 30, 2009, 2008 and 2007, respectively. The Company has advances to NRC amounting to P38 million which bears interest at a fixed rate of 10% per annum. The Company also has outstanding net receivables from NRC amounting to P50 million and P46 million as of June 30, 2009 and 2008, respectively, which are unsecured, noninterest bearing and payable on demand.
pepSi-cola productS philippineS, inc.
(amountS in thouSandS, except number of ShareS and par value per Share and when otherwiSe Stated)
noteS to the financial StatementS

��
d. The Company has outstanding working capital advances to NHC, an associate, amounting to P2 million and P1 million as of June 30, 2009 and 2008, respectively, and which are unsecured, noninterest bearing and payable on demand.
In addition to their salaries, the Company also provides noncash benefits to key management personnel and contributes to a defined benefit retirement plan on their behalf.
The compensation and benefits of key management personnel are as follows:
2009 2008 2007 Short-term employee benefits P70,721 P78,304 P66,168 Post-employment benefits 3,754 3,721 3,511 P74,475 P82,025 P69,679
15. Net Sales
Net sales consist of:
2009 2008 2007 Gross sales P16,600,329 P15,283,095 P15,062,155 Less sales returns and discounts 2,368,284 2,302,209 2,145,943 P14,232,045 P12,980,886 P12,916,212
16. Cost of Goods Sold
Cost of goods sold consists of:
Note 2009 2008 2007 Materials and supplies used 14 P7,547,548 P6,617,972 P6,679,823 Delivery and freight 769,511 713,597 646,252 Depreciation and amortization 19 754,666 654,400 561,242 Rental and utilities 14, 27 268,318 261,934 248,264 Personnel expenses 20, 24 249,359 258,737 249,715 Others 453,336 367,466 380,866 P10,042,738 P8,874,106 P8,766,162

��
17. Selling and Distribution expenses
Selling and distribution expenses consist of:
Note 2009 2008 2007 Distribution P470,626 P438,582 P400,295 Personnel expenses 20, 24 408,061 434,600 376,829 Depreciation 19 233,383 269,348 211,031 Delivery and freight 230,101 193,776 192,488 Rental and utilities 14, 27 122,723 131,703 108,413 Others 437,680 362,300 310,515 P1,902,574 P1,830,309 P1,599,571
18. General and administrative expenses
General and administrative expenses consist of:
Note 2009 2008 2007 Personnel expenses 20, 24 P291,069 P344,817 P301,052 Outside services 106,881 73,883 72,714 Rental and utilities 14, 27 90,154 88,838 69,285 Others 19 132,746 140,542 144,030 P620,850 P648,080 P587,081
19. Depreciation and amortization
Depreciation and amortization are distributed as follows:
Note 2009 2008 2007 Cost of goods sold 16 P754,666 P654,400 P561,242 Selling and distribution 17 233,383 269,348 211,031 General and administrative 18 37,775 45,863 41,264 P1,025,824 P969,611 P813,537
20. Personnel expenses
Note 2009 2008 2007 Salaries and wages P913,698 P970,446 P860,320 Retirement cost 24 34,791 67,708 67,276 P948,489 P1,038,154 P927,596
pepSi-cola productS philippineS, inc.
(amountS in thouSandS, except number of ShareS and par value per Share and when otherwiSe Stated)
noteS to the financial StatementS

��
The above amounts are distributed as follows:
Note 2009 2008 2007 Cost of goods sold 16 P249,359 P258,737 P249,715 Selling and distribution 17 408,061 434,600 376,829 General and administrative 18 291,069 344,817 301,052 P948,489 P1,038,154 P927,596
During the current year, the Company modified the income statement classification of personnel expenses on certain employees to appropriately reflect the way in which economic benefits are derived from the services provided. Comparative amounts were reclassified for consistency which resulted in the following increases (decreases):
Note 2008 2007 Cost of goods sold 16 P9,735 P6,126 Selling and distribution 17 45,904 28,889 General and administrative 18 (55,639) (35,015)
21. Basic/Diluted earnings Per Share (ePS)
Basic EPS is computed as follows:
2009 2008 2007 Net income (a) P799,690 P760,697 P1,001,386 Weighted average number of shares outstanding (b)* 3,693,772,279 3,471,648,925 3,312,989,386 Basic/Diluted EPS (a/b) P0.22 P0.22 P0.30
* Weighted average number of shares outstanding is based on the total issuance during the period multiplied by the number of months outstanding over one year and number of shares outstanding throughout the year.
As of June 30, 2009, 2008 and 2007, the Company has no dilutive debt or equity instruments.
22. Segment Information
As discussed in Note 1, the Company is engaged in the manufacture, sales and distribution of CSD and NCB. The Company’s main products under its CSD category include brands like Pepsi-Cola, 7Up, Mountain Dew and Mirinda. The NCB brand category includes Gatorade, Tropicana/Twister, Lipton and the recently introduced Sting energy drink and Propel fitness water. The Company operates under two (2) reportable business segments, the CSD and NCB categories, and only one (1) reportable geographical segment which is the Philippines. Thus, a secondary geographic reporting format is not applicable.

��
Analysis of financial information by business segment is as follows:
Carbonated Soft Drinks Noncarbonated Beverages Combined (In 000,000’s) 2009 2008 2007 2009 2008 2007 2009 2008 2007 Net Sales External sales P12,547 P12,390 P12,736 P4,053 P2,893 P2,326 P16,600 P15,283 P15,062 Sales discounts and returns (1,953) (1,985) (1,962) (415) (317) (184) (2,368) (2,302) (2,146) Net sales P10,594 P10,405 P10,774 P3,638 P2,576 P2,142 P14,232 P12,981 P12,916 Result Segment result* P3,118 P3,292 P3,462 P1,071 P815 P688 P4,189 P4,107 P4,150 Unallocated expenses (3,044) (3,143) (2,655) Interest and financing expenses (22) (36) (52) Interest income 17 23 18 Equity in net earnings of associates 2 20 7 Other income - net 40 30 51 Income tax expense (382) (240) (518) Net income P800 P761 P1,001 Other Information Segment assets: P7,890 P7,319 P6,049 Investments in associates 528 526 505 Other noncurrent assets 144 138 138 Deferred tax assets - - 40 Combined total assets P8,562 P7,983 P6,732 Segment liabilities: P2,270 P2,266 P2,339 Notes payable 50 147 49 Long-term debt - - 283 Income tax payable 156 - 338 Dividends payable and others - - 400 Deferred tax liabilities - net 376 290 - Combined total liabilities P2,852 P2,703 P3,409 Capital expenditures: P1,828 P2,003 P1,617 Depreciation and amortization and impairment losses of property, plant and equipment 1,026 970 814 Noncash items other than
depreciation and amortization 133 46 25
* Segment expenses were allocated based on the percentage of each reportable segment’s net sales over total net sales.
There were no intersegment sales recognized between the two reportable segments.
Assets and liabilities of the Company are not specifically identifiable or allocated to each particular segment.
pepSi-cola productS philippineS, inc.
(amountS in thouSandS, except number of ShareS and par value per Share and when otherwiSe Stated)
noteS to the financial StatementS

�7
23. Financial Instruments
Credit RiskThe carrying amounts of the financial assets represent the Company’s maximum credit exposure. The maximum exposure to credit risk as at June 30 is as follows:
2009 2008 Receivables - net P987,965 P882,075 Cash in banks and cash equivalents 273,673 475,764 P1,261,638 P1,357,839
The aging of trade receivables is as follows:
June 30, 2009 June 30, 2008 Gross amount Impairment Gross Amount Impairment Current P649,654 P - P518,732 P - Past due 0-30 days 229,850 - 211,240 - Past due 31-60 days 51,808 - 69,315 - More than 60 days 150,219 125,512 117,985 75,226 P1,081,531 P125,512 P917,272 P75,226
Various collateral securities such as bank guarantees, time deposits, surety bonds, real estate and/or chattel mortgages are held by the Company for trade receivables exceeding certain amounts.
Liquidity RiskThe following are the contractual maturities of financial liabilities, including estimated interest payments and excluding the impact of netting agreements:
as of June 30, 2009 Carrying Contractual 6 Months amount Cash Flow or less Financial liabilities Notes payable P50,000 P50,124 P50,124 Accounts payable and accrued expenses 1,977,426 1,977,426 1,977,426 P2,027,426 P2,027,550 P2,027,550
As of June 30, 2008 Carrying Contractual 6 Months Amount Cash Flow or less Financial liabilities Notes payable P147,100 P147,890 P147,890 Accounts payable and accrued expenses 1,968,299 1,968,199 1,968,199 P2,115,399 P2,116,089 P2,116,089
Interest Rate RiskThe interest rates profile of the Company’s interest-bearing financial instruments is as follows:
2009 2008Financial assets P222,553 P463,947Financial liabilities (50,000) (147,100) P172,553 P316,847

�8
Sensitivity AnalysisA 2% increase in interest rates would have increased equity and profits for the years ended June 30, 2009 and 2008 by P2.3 million and P4.1 million, respectively.
A 2% decrease in interest rates for the years ended June 30, 2009 and 2008 would have had the equal but opposite effect, on the basis that all other variables remain constant.
Fair ValuesThe fair values of the financial assets and liabilities approximate the carrying amounts due to the short-term nature of these financial instruments or the interest rates that they carry approximate interest rates for comparable instruments in the market.
24. Retirement Plan
The Company has a funded, noncontributory defined benefit retirement plan covering substantially all of its regular and full time employees. A trustee bank is administering the retirement plan. Annual cost is determined using the projected unit credit method. The Company’s latest actuarial valuation date is June 30, 2009. The actuarial valuation is made on an annual basis.
The reconciliation of the assets and liabilities recognized in the balance sheets is shown below:
2009 2008 Present value of defined benefit obligation P382,590 P333,886 Fair value of plan assets 175,708 195,117 Unfunded obligations 206,882 138,769 Unrecognized net actuarial gains 7,272 88,593 Accrued retirement cost P214,154 P227,362
The current portion of accrued retirement cost which is included under “Accounts payable and accrued expense” account in the balance sheets amounted to P82 million and P41 million as of June 30, 2009 and 2008, respectively.
The components of retirement cost recognized in the statements of income are as follows:
2009 2008 2007 Current service cost P26,619 P35,469 P39,394 Interest cost 32,742 33,649 38,452 Past service cost - 13,977 - Expected return on plan assets (20,905) (15,387) (13,539) Amortization of unrecognized net actuarial loss (gain) (3,665) - 2,969 Net retirement cost P34,791 P67,708 P67,276 Actual return on plan assets P12,363 P3,725 P7,241
The Company’s retirement cost is allocated between “Cost of goods sold” account in the statements of income which amounted to P6 million, P14 million and P25 million in 2009, 2008 and 2007, respectively, and “Operating expenses” account in statements of income which amounted to P28 million, P53 million and P42 million in 2009, 2008 and 2007, respectively.
pepSi-cola productS philippineS, inc.
(amountS in thouSandS, except number of ShareS and par value per Share and when otherwiSe Stated)
noteS to the financial StatementS

�9
The changes in the present value of defined benefit obligation are as follows:
2009 2008 Balance at beginning of year P333,886 P366,031 Current service cost 26,619 35,469 Interest cost 32,742 33,649 Past service cost - 13,977 Benefits paid (76,351) (11,062) Actuarial loss (gain) 65,694 (104,178) Balance at end of year P382,590 P333,886
The movements in the fair value of plan assets are shown below:
2009 2008 Balance at beginning of year P195,117 P148,454 Contributions 48,000 54,000 Benefits paid (76,351) (11,062) Expected return 20,905 15,387 Net actuarial loss (11,963) (11,662) Balance at end of year P175,708 P195,117
The Company’s plan assets comprise of 99% investment in fixed income securities and 1% investments in shares of stocks both in 2009 and 2008.
Principal actuarial assumptions used in determining retirement cost at the balance sheet date (expressed as weighted averages) are as follows:
Annual rates 2009 2008 Discount rate 9.25% 10.00% Expected rate of return on plan assets 4.75% 10.00% Rate of future salary increase 5.00% 5.00%
The historical information of the amounts is as follows:
2009 2008 2007 2006 Present value of the defined benefit obligation P382,590 P333,886 P366,031 P409,055 Fair value of plan assets 175,708 195,117 148,454 111,472 Deficit in the plan (206,882) (138,769) (217,577) (297,583) Experience adjustments on plan liabilities loss (gain) 20,706 (5,603) (42,167) - Experience adjustments on plan assets loss (11,963) (11,662) (19,246) -

70
25. Capital Stock
This account consists of:
2009 2008 2007 Shares amount Shares Amount Shares Amount Authorized - P0.15 par value 5,000,000,000 P750, 000 5,000,000,000 P750, 000 5,000,000,000 P750, 000 Issued and outstanding: Balance at beginning of year 3,693,772,279 P554,066 3,312,989,386 P496,948 3,312,989,386 P496,948 Issuance during the year - - 380,782,893 57,118 - - Balance at end of year 3,693,772,279 P554,066 3,693,772,279 P554,066 3,312,989,386 P496,948
On February 1, 2008, the Company’s initial public offering of 1,142,348,680 shares at P3.50 per share culminated with the listing and trading of its shares of stocks under the First Board of the Philippine Stock Exchange, Inc. Of the total shares offered, 380,782,893 shares pertain to the primary offering, which resulted in an increase in capital stock amounting to P57 million and additional paid-in capital of P1.2 billion, net of P138 million transaction cost that is accounted for as a reduction in equity.
26. Retained earnings
The BOD approved several declarations of cash dividends amounting to P369 million in 2009 and P400 million in 2007. There were no cash dividends declarations in 2008. Details of the declarations are as follows:
Payable to Date of Dividend Per Stockholders of Declaration Share Record as of Date of Payment June 21, 2007 0.12 June 21, 2007 August 20, 2007 September 30, 2008 0.10 October 15, 2008 November 7, 2008
27. Commitments and Contingencies
a. The Company leases, from third parties and NRC, certain parcels of land where it’s bottling plants and warehouses are located for a period of one to twenty-five years and are renewable for another one to twenty-five years. None of these leases includes contingent rentals. Rent expense pertaining to these leased properties amounted to P73 million in 2009, P69 million in 2008 and P61 million in 2007 (see Notes 14, 16, 17 and 18).
Future rental commitments under such noncancelable operating leases are as follows:
2009 2008 2007 Less than one year P63,803 P74,020 P62,676 Between one and five years 204,332 239,534 470,329 More than five years 197,321 227,138 41,748 P465,456 P540,692 P574,753
b. The Company is a party to a number of lawsuits and claims relating to tax, labor and other issues arising out of the normal course of its business. Management and its tax and legal counsels believe that the outcome of these lawsuits and claims will not materially affect the financial position, financial performance or liquidity of the Company.
pepSi-cola productS philippineS, inc.
(amountS in thouSandS, except number of ShareS and par value per Share and when otherwiSe Stated)
noteS to the financial StatementS

Corporate information
Corporate address
Pepsi-Cola Products Philippines, Inc.Km. 29 National Road, Tunasan,Muntinlupa City 1773 Metro ManilaTrunk line: (632) 850-7901Web Site: www.pepsiphilippines.com
Stock transfer agent
Stock Transfer Service, Inc.5th Floor, Phinma Plaza19 Plaza Drive, Rockwell Center,Makati City, Metro ManilaTel: (632) 898-7555; (632) 898-7590Fax: (632) 898-7597
Investor Relations
Partha ChakrabartiSenior Vice-President and Chief Financial Officer
Km. 29 National Road, Tunasan,Muntinlupa City 1773 Metro Manila
Stock Code
Philippine Stock Exchange - PIP
A joint project of Corporate Planning and Reporting Group and Corporate Communications.
Concept and Design Studio � Designs inc.Writer & Editor Dante M. velascoPhotography Doods Tanabe Rogelio R. Tayamora (contributor)

Pepsi-cola Products Philippines, inc.km. 29 National Road, Tunasan,
Muntinlupa city �77� Metro Manila