
Project Report LIDAR Data Collection and Processing for the ...
Upload
khangminh22Category
view
3download
0
Methods Ecol Evol. 2022;00:1–13. | 1wileyonlinelibrary.com/journal/mee3
Received: 16 November 2021 | Accepted: 4 February 2022
DOI: 10.1111/2041-210X.13830
A P P L I C A T I O N
treetop: A Shiny- based application and R package for extracting forest information from LiDAR data for ecologists and conservationists
Carlos Alberto Silva1 | Andrew T. Hudak2 | Lee A. Vierling3 | Ruben Valbuena4 | Adrian Cardil5,6 | Midhun Mohan7 | Danilo Roberti Alves de Almeida8 | Eben N. Broadbent9 | Angelica M. Almeyda Zambrano10 | Ben Wilkinson11 | Ajay Sharma12 | Jason B. Drake13 | Paul B. Medley13 | Jason G. Vogel14 | Gabriel Atticciati Prata10 | Jeff W. Atkins15 | Caio Hamamura16 | Daniel J. Johnson14 | Carine Klauberg17
1Forest Biometrics and Remote Sensing Laboratory (Silva Lab), School of Forest, Fisheries, and Geomatics Sciences, University of Florida, Gainesville, FL, USA; 2USDA Forest Service, Rocky Mountain Research Station, Moscow, ID, USA; 3Department of Natural Resources and Society, College of Natural Resources, University of Idaho, Moscow, ID, USA; 4Swedish University of Agricultural Sciences, Umeå, Sweden; 5Department of Agriculture and Forest Engineering, University of Lleida, Lleida, Spain; 6Tecnosylva. Parque Tecnológico de León, León, Spain; 7Department of Geography, University of California (UC Berkeley), Berkeley, CA, USA; 8Department of Forest Sciences, University of São Paulo, “Luiz de Queiroz” College of Agriculture (USP/ESALQ), Piracicaba, Brazil; 9Spatial Ecology and Conservation Lab, School of Forest, Fisheries, and Geomatics Sciences, University of Florida, Gainesville, FL, USA; 10Spatial Ecology and Conservation Lab, Department of Tourism, Recreation and Sport Management, University of Florida, Gainesville, FL, USA; 11Geomatics Program, School of Forest, Fisheries, and Geomatics Sciences, University of Florida, Gainesville, FL, USA; 12West Florida Research and Education Center, School of Forest, Fisheries, and Geomatics Sciences, University of Florida, Milton, FL, USA; 13USDA Forest Service, National Forests in Florida, Tallahassee, FL, USA; 14School of Forest, Fisheries, and Geomatics Sciences, University of Florida, Gainesville, FL, USA; 15USDA Forest Service, Southern Research Station, New Ellenton, SC, USA; 16Federal Institute of Education, Science and Technology of São Paulo, Sao Paulo, SP, Brazil and 17Federal University of São João Del Rei – UFSJ, Sete Lagoas, Brazil
This is an open access article under the terms of the Creative Commons Attribution License, which permits use, distribution and reproduction in any medium, provided the original work is properly cited.© 2022 The Authors. Methods in Ecology and Evolution published by John Wiley & Sons Ltd on behalf of British Ecological Society.
CorrespondenceCarlos Alberto SilvaEmail: [email protected]
Funding informationUSDA Forest Service, Grant/Award Number: PRO00031122; Strategic Environmental Research and Development Program, Grant/Award Number: RC20- 1346, RC19- 1064 and RC- 2243
Handling Editor: Laura Graham
Abstract1. Individual tree detection (ITD) and crown delineation are two of the most rele-
vant methods for extracting detailed and reliable forest information from LiDAR (Light Detection and Ranging) datasets. However, advanced computational skills and specialized knowledge have been normally required to extract forest infor-mation from LiDAR.
2. The development of accessible tools for 3D forest characterization can facilitate rapid assessment by stakeholders lacking a remote sensing background, thus fostering the practical use of LiDAR datasets in forest ecology and conservation. This paper introduces the treetop application, an open- source web- based and R package LiDAR analysis tool for extracting forest structural information at the tree level, including cutting- edge analyses of properties related to forest ecol-ogy and management.
3. We provide case studies of how treetop can be used for different ecological applications, within various forest ecosystems. Specifically, treetop was em-ployed to assess post- hurricane disturbance in natural temperate forests, forest

2 | Methods in Ecology and Evolu on SILVA et AL.
1 | t r e e to p : AN OPEN- SOURCE TOOL
An enhanced understanding of forest structure and ecology using airborne LiDAR (Light Detection and Ranging) can be gained through improved data analysis tools and optimized data processing frame-works that simplify working with LiDAR data. The aim of this paper is to present treetop, a freely available, open access web- based LiDAR analysis tool, and a standalone R package (treetop). treetop is capa-ble of fast and effective individual tree detection (ITD) and crown delineation from LiDAR- derived canopy height models (CHMs), to support and enhance LiDAR- based forest monitoring, conservation initiatives and forest ecology research as well industrial uses. For demonstrative purposes, we present three case studies: (a) post- hurricane disturbance assessment of longleaf pine (Pinus palustris Mill.) forests in the Florida Panhandle (Section 2.1); (b) analysis of competitive dominance conditions through structural heterogeneity in eucalyptus (Eucalyptus grandis) and loblolly pine (Pinus taeda L.) forest plantations in South Brazil (Section 2.2); and (c) assessment of changes in spatial patterns of individual tree distributions in tropical forest in the Western Brazilian Amazon (Section 2.3).
1.1 | Background and model foundation
The use of LiDAR for ITD and crown delineation is promising; how-ever, it requires specific training in computational methods for prac-titioners to derive reliable forest information from LiDAR datasets (Valbuena et al., 2014). A LiDAR- derived CHM can be used to detect individual trees, delineate their crowns and subsequently estimate biophysical attributes such as biomass, stem volume and gap frac-tion (Silva et al., 2016; Stark et al., 2012). The CHM is defined as the spatially explicit height of the tallest vegetation and is essentially computed by subtracting the digital terrain model (DTM) from the digital surface model (DSM) representing the scanned vegetation (Figure 1). The simplest method to detect individual trees on the
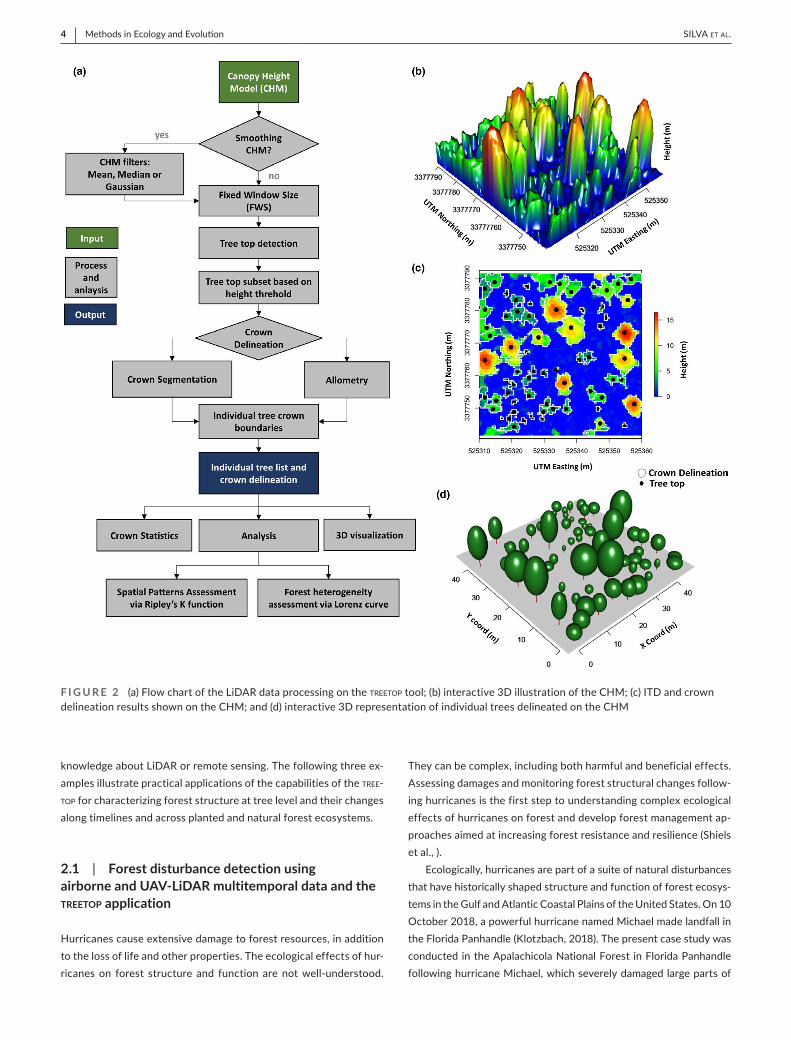
LiDAR- derived CHM is by using the local maximum (LM) algorithm. LM methods assume that local height maxima in the CHM repre-sent tree tops (Korpela et al., 2006), and the method is a relatively straightforward technique that utilizes two major parameters: a smoothing parameter, which is also often mentioned as smoothing window size (SWS), and a fixed window size (FWS) for tree detection (Silva et al., 2016). As FWS increases, the number of trees detected decreases (Mohan et al., 2017). Application of smoothing filters helps eliminate spurious local maxima caused by, say, large spreading tree branches, and thereby limits the number of local maxima detected, increasing the accuracy of the algorithm (Lindberg & Hollaus, 2012). Once, individual trees are detected, their crown boundaries can be delimited using the Voronoi tessellation- based algorithm developed by Silva et al. (2016) (Figure 2). The algorithm uses maximum crown factor and exclusion parameters, both ranging from 0 to 1, to define the crown boundaries on the LiDAR- CHM (Silva et al., 2016).
treetop is both an interactive online tool as well as a standalone R package (Silva et al., 2021) that puts complex ITD and crown de-lineation procedures easily within reach of any non- specialized user, allowing the visualization of forest information promptly and the ability to download generated results in a variety of file formats. The tool was developed using RStudio, a free and open- source in-tegrated development environment for R (R Core Team, 2018), and the Shiny package in R (Chang et al., 2019). The online version of
homogeneity in industrial forest plantations and the spatial distribution of indi-vidual trees in a tropical forest.
4. treetop simplifies the extraction of relevant forest information for forest ecolo-gists and conservationists who may use the tool to easily visualize tree positions and sizes, conduct complex analyses and download results including indi-vidual tree lists and figures summarizing forest structural properties. Through this open- source approach, treetop can foster the practical use of LiDAR data among forest conservation and management stakeholders and help ecological researchers to further understand the relationships between forest structure and function.
K E Y W O R D Sairborne LiDAR, change detection, ecology, individual trees, spatial distribution
Highlights
(i) A Shiny- based application and R package for forest structure assessment from LiDAR data
(ii) Individual tree assessments of forest disturbance after Hurricane Michael
(iii) Tree competitive dominance analysed by Lorenz curves and spatial distribution of individual trees

| 3Methods in Ecology and Evolu onSILVA et AL.
treetop is publicly available on the shinyapps.io, a service platform for hosting Shiny web apps, at https://carlo sasil va.shiny apps.io/webli dar- treet op/ and has limited size for input (30 Megabytes). The R package version of treetop can run natively on a user's computer and can be downloaded via the Comprehensive R Archive Network (CRAN) (https://cran.r- proje ct.org/web/packa ges/treet op/index.html). In addition, it can be installed directly in R install.packages (treetop) and launched by the single command line launchApp(). The R package launches a native Shiny- based app identical to the treetop web- based tool.
We used the LM, SWS and FWS algorithms for ITD (Figure 2) along with three CHM filter options and a Voronoi tessellation- based algorithm for crown delineation. This algorithm and ITD ac-curacy have been already validated in Silva et al. (2016) and Leite et al. (2020). Optionally, the user can estimate tree crown width using a list of equations available in the application (Popescu et al., 2014) or even by a user- defined custom equation.
1.2 | System design and features
The requested data input for ITD through the treetop application is a LiDAR- derived CHM in raster format, and thus CHM- derived from other remote sensing sources can also be used. The R package ver-sion of treetop does not have any data size limitations, thus allow-ing users to process larger CHM rasters. The treetop tool is capable of providing crown change estimates from multitemporal data as
highlighted in our first case study. The treetop application graphical user interface (GUI) has five major panels: (a) the settings menu; (b) the summary of the LiDAR metrics; (c) the CHM profile (frequency distribution and box and whiskers plots) or spatial pattern analysis; (d) the individually detected trees represented over the CHM or Lorenz curve analysis of tree size heterogeneity; and (e) an interac-tive 3D viewer of the CHM or a reconstruction of individually de-tected trees (Table 1; Figure 3). Furthermore, there are eight buttons to download the generated results, depending on the users' choices, which include: (a) metrics summarizing the distribution of LiDAR heights in the CHM; (b) a figure of the CHM profile, which includes the frequency distribution and box plots; (c) a figure showing the de-tected trees and crowns over the CHM; (d) the LiDAR- derived trees with the tree location and crown width estimates; (e) two buttons for downloading the resulting tree positions and delineated crowns in shapefile format; (f) spatial pattern analysis of detected trees; and (g) Lorenz curve analysis of differences in height among the detected trees.
2 | t r e e to p APPLIC ATIONS AND C A SE STUDIES
treetop's main functionality is to detect and delineate individual tree crowns using CHMs derived from LiDAR or other remote sensing sources, and to generate forest structure information relevant to forest ecologists and conservationists, not requiring any specialized
F I G U R E 1 LiDAR- derived products and illustration of tree top detection. (a) Digital terrain model (DTM; red colour line) and digital surface model (DSM; grey colour line); (b) canopy height model (CHM; orange colour line); and (c) tree top detection using local maximum (LM) algorithm (yellow dots)
4 | Methods in Ecology and Evolu on SILVA et AL.
knowledge about LiDAR or remote sensing. The following three ex-amples illustrate practical applications of the capabilities of the tree-top for characterizing forest structure at tree level and their changes along timelines and across planted and natural forest ecosystems.
2.1 | Forest disturbance detection using airborne and UAV- LiDAR multitemporal data and the treetop application
Hurricanes cause extensive damage to forest resources, in addition to the loss of life and other properties. The ecological effects of hur-ricanes on forest structure and function are not well- understood.
They can be complex, including both harmful and beneficial effects. Assessing damages and monitoring forest structural changes follow-ing hurricanes is the first step to understanding complex ecological effects of hurricanes on forest and develop forest management ap-proaches aimed at increasing forest resistance and resilience (Shiels et al., ).
Ecologically, hurricanes are part of a suite of natural disturbances that have historically shaped structure and function of forest ecosys-tems in the Gulf and Atlantic Coastal Plains of the United States. On 10 October 2018, a powerful hurricane named Michael made landfall in the Florida Panhandle (Klotzbach, 2018). The present case study was conducted in the Apalachicola National Forest in Florida Panhandle following hurricane Michael, which severely damaged large parts of
F I G U R E 2 (a) Flow chart of the LiDAR data processing on the treetop tool; (b) interactive 3D illustration of the CHM; (c) ITD and crown delineation results shown on the CHM; and (d) interactive 3D representation of individual trees delineated on the CHM

| 5Methods in Ecology and Evolu onSILVA et AL.
TA B L E 1 Features of the web- LiDAR tree top application
Panel Features/options Description
Page 1: Application The interactive tool for LiDAR processing
Panel a) Input CHM file Allows the user to import their own CHM (as raster file in.tif, .asc or .img format) with grid cell size higher than 0.5 m. An example CHM is also provided. When uploaded CHM with grid cell <0.5 m, the tool resamples the CHM from its original spatial resolution to 0.5 m using the nearest neighbour approach
Tree Height Threshold The user can set the tree height threshold for ITD. The default is breast height, or 1.37 m
FWS Fixed window size (FWS) used in LM algorithm for ITD. The user can customize the FWS ranging from 3 × 3 to 17 × 17
CHM colour CHM colour options
Select tiles Tile selection for processing
Crown colour Individual tree crown boundary colour options
Tree top colour Detected tree top colour options
CHM profile colour CHM profile colour options: Frequency distribution and box plots
Tree Crown delineation/• CrownSeg•
CrownAllometry
Allows the user to set parameters for delineating individual tree crowns.• Allows the users to delineate automatically individual tree crowns using the Voronoi
tessellation- based algorithm (Silva et al., 2016). The user can set the parameters:Maxcrown defines the maximum crown diameter of a tree as a proportion of its height;
Exclusion is the proportion of tree height under which pixels are excluded from the crown.• Allows the users to select the allometry to estimate crown width based on tree height.
Users can either specify their custom allometric equation, or select one of three allometric equations provided, respectively calibrated for deciduous, pine and mixed forests (combined)
Smoothing CHM/• Smoothing filter• Filter Window Size
Option for smoothing the CHM prior to running the LM algorithm for ITD.• A mean, median or Gaussian smoothing filter can be chosen• Sets the smoothing window size (SWS) for LM, ranging from 3 × 3 to 17 × 17 pixels
CHM 2d/Lorenz curve Option to switch information displayed in panel (d) between: (1) individual trees and crown detected over the CHM, or (2) Lorenz curve showing detected tree height heterogeneity
CHM profile/Ripley's K and L Option to switch information displayed in panel (c) between: (1) frequency distribution and box plots of canopy, or (2) Lorenz curve for analysing heterogeneity in detected tree heights
CHM 3d/Trees 3d Option to switch interactive 3D information displayed in panel (e) between: (1) CHM; or (2) detected trees. Selecting Trees 3d creates a visual reconstruction of trees using a solid, mesh or line surfaces and with their crowns being optional Cones (e.g. conifer), Ellipsoids (e.g. broadleaved), halfellipsoid, paraboloid or cylinder 3D shapes (see Table S1)
Run Start the data processing
Refresh app Refresh the web- tool
Panel b) Summary of LiDAR height metrics
Summary of LiDAR- derived crown height statistics of the individual tree detection results
Panel c) Canopy height model profile CHM profile as a frequency distribution, and box plot figures showing the distribution of detected tree heights and crown areas. Requires that CHM profile is selected in panel (a)
Download LiDAR metrics Button for downloading LiDAR metrics displayed in panel (b). Requires that CHM profile is selected in panel (a)
Download CHM profile Button for downloading CHM profile displayed in panel (c) figure as .tif file. Requires that CHM profile is selected in panel (a)
Spatial pattern analysis Ripley’s K and L functions from detected tree positions, including Clark- Evans index. Requires that Ripley’s K and L are selected in panel (a)
Download Ripley's K and L Button for downloading results of spatial pattern analysis as .tif file. Requires that Ripley's K and L are selected in panel (a)
(Continues)

6 | Methods in Ecology and Evolu on SILVA et AL.
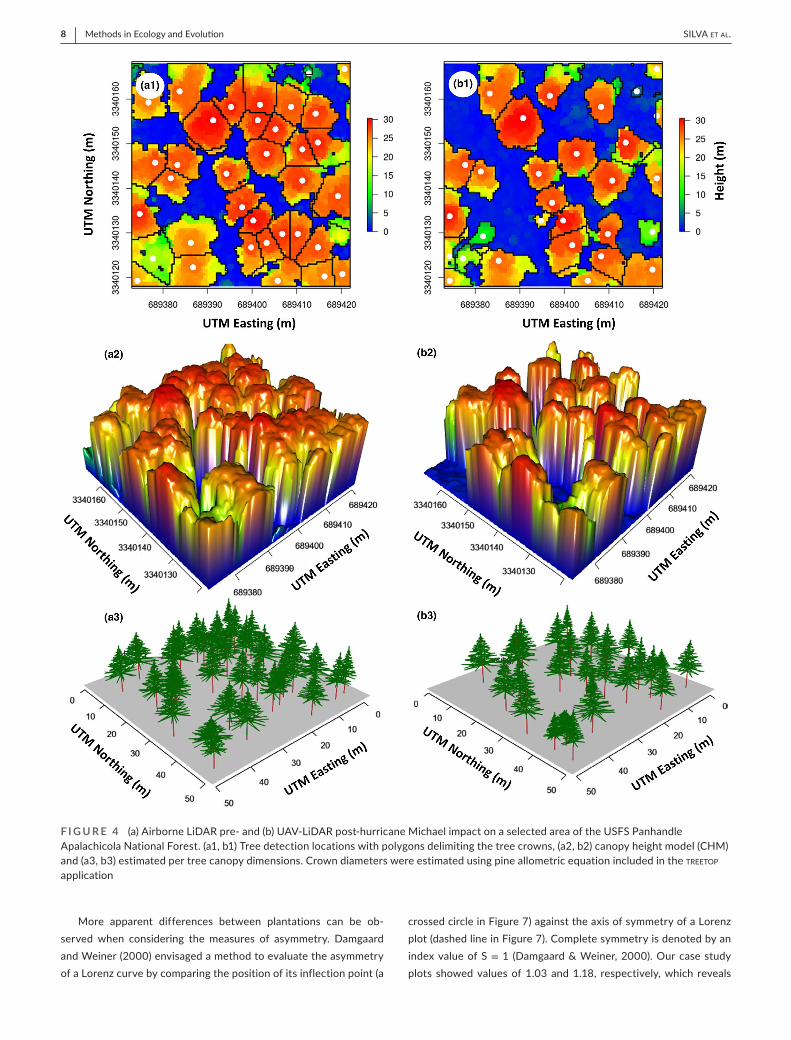
this forest. We made a quick assessment of damage and disturbance on sites impacted by Hurricane Michael using LiDAR data and the treetop tool. Specifically, we used LiDAR data that were collected im-mediately prior to Hurricane Michael from an aircraft- borne LiDAR system. A UAV- LiDAR system (GatorEye system, see Supporting Information) collected data at the same site 2 months after the hurri-cane which was 6 months after the initial airborne flight. CHMs (0.5 m resolution) were computed using LAStools (Isenburg, 2018) and, for the purposes of this case study, we selected a 50 × 50 m sample plot in which individual trees were detected and delineated on the CHMs using FWS = 3 × 3 and SWS = 3 × 3, and MaxCrown and Exclusion parameters were set to 0.6 and 0.3 respectively (Figures S1 and S2).
Hurricane impacts were visually apparent between the collection dates in our sample site. The 32 trees initially detected were reduced to 24 trees following the hurricane. We found 38.5% reduction in canopy coverage with large increases in gaps and crown reductions in some re-maining standing trees (Figure 4). No decrease in maximum tree height was detected within the plot; however, mean tree height decreased from 26.8 to 23 m, indicating that mortality of the canopy trees pos-sibly occurred. Height distributions (Figure 5) can be used to calculate vertical leaf area density provided sufficient calibration data (Stark et al., 2012). Even without calibration, the assessment of these vertical profiles reveals a large increase in LiDAR echoes below 8 ms above the ground which is consistent with an increase in downed woody debris following the hurricane. However, for this small sample plot, a two- sample Kolmogorov– Smirnov (KS) test (Wayne, 1990) showed that the tree height distribution pre- and post- hurricane disturbance (Figure 5) did not significantly differ (KS = 0.23, p- value = 0.47 and α = 0.05).
2.2 | Assessment of structural heterogeneity in forest plantations
The treetop tool was used to access forest structural heterogene-ity in a 3- year- old fast- growing Eucalyptus grandis forest plantation
(e.g. Silva et al., 2014) and in an 8- year- old seminal (seed) planta-tion of Pinus taeda (Figure 6) in southern Brazil (Klabin SA com-pany, Paraná State, Brazil; Silva et al., 2017). LiDAR data were collected with pulse density of 4 pulses/m2 and CHM (0.5 m of resolution) was created using LAStools (Isenburg, 2018). Individual trees were detected and delineated in both plantation sites using treetop tool in a plot area of 0.25 ha (50 × 50 m2). ITD and crown delineation were performed using FWS = 3 × 3 and SWS = 3 × 3, and MaxCrown and Exclusion parameters were set to 0.6 and 0.3 respectively (Figures S3 and S4).
The structural heterogeneity of forests is typically assessed by a measurement of variability and a measurement of asymme-try (Knox et al., 1989; Valbuena et al., 2017). In our treetop tool, we chose to evaluate variability and asymmetry in the height of detected trees, because height above the ground is the vari-able directly measured by the LiDAR. Except for MacArthur and MacArthur's (1961) foliage height diversity (FHD), structural in-dices are more typically based on tree bole diameters because in the field they are more directly measurable than heights. One such measure of heterogeneity based on tree heights is the PH350 index (Hentz et al., 2018). To clarify the role of PH350 in eval-uating forest heterogeneity, we computed Lorenz curves from the cubic power of tree heights, which has been observed to re-late to Lorenz curves obtained from tree diameters (Hakamada et al., 2015). Lorenz plots for the two forest areas— (a) the E. gran-dis and (b) P. taeda plantations (Figure 7)— both showed a high degree of homogeneity in their structure, which can be observed by the low amplitude of their Lorenz curves, close to the diago-nal (absolute equality). The Gini coefficient obtained from both of stands, GC = 0.17 and 0.11, respectively, are reflective of the Lorenz curve results (Weiner & Thomas, 1986). The upper part of the shaded area in Figure 7 shows the position of a Lorenz curve with a maximum value for MacArthur and MacArthur's (1961) FHD, as demonstrated by Valbuena et al. (2012) depiction of max-imum entropy over the Lorenz plot.
Panel Features/options Description
Panel d) Individual tree detected Display the individual trees and crowns detected on the CHM
Download CHM Button for downloading CHM figure as .tif image. Requires CHM 2d to be selected in panel (a)
Lorenz curve Tree size heterogeneity analysis including the Lorenz curve (cumulative proportions) of detected tree heights, their Gini coefficient and the proportion taller than their mean
Download Lorenz Curve Button for downloading Lorenz Curve results as .tif file. Requires that Lorenz Curve be selected in panel (a)
Panel e) Canopy height model and 3D trees detected
Displays a 3D scene showing either the CHM or a reconstruction of individual trees detected. The used can interact with this 3D plot changing the zoom and perspective. For visualization purpose, crown- based height is estimated as 40% of the tree height
Tree location (.csv) Export the tree list containing their locations, heights, crown widths and crown areas
Tree Crown (.shp) Option for downloading the detected tree crowns as shapefile
Tree Location (.shp) Option for downloading the detected tree locations as shapefile
Page 2: About Description of the treetop tool and authors
TA B L E 1 (Continued)

| 7Methods in Ecology and Evolu onSILVA et AL.
F I G U R E 3 Web- LiDAR tree top application workflow of analyses. (a) Setting menu; (b) summary of LiDAR metrics; (c) canopy height model (CHM) profile (above) and spatial pattern analysis (below); (d) individual tree detected on the CHM (above) and Lorenz curve (below); and (e) 3D interactive plot with CHM (below) or reconstructed trees (above)
8 | Methods in Ecology and Evolu on SILVA et AL.
More apparent differences between plantations can be ob-served when considering the measures of asymmetry. Damgaard and Weiner (2000) envisaged a method to evaluate the asymmetry of a Lorenz curve by comparing the position of its inflection point (a
crossed circle in Figure 7) against the axis of symmetry of a Lorenz plot (dashed line in Figure 7). Complete symmetry is denoted by an index value of S = 1 (Damgaard & Weiner, 2000). Our case study plots showed values of 1.03 and 1.18, respectively, which reveals
F I G U R E 4 (a) Airborne LiDAR pre- and (b) UAV- LiDAR post- hurricane Michael impact on a selected area of the USFS Panhandle Apalachicola National Forest. (a1, b1) Tree detection locations with polygons delimiting the tree crowns, (a2, b2) canopy height model (CHM) and (a3, b3) estimated per tree canopy dimensions. Crown diameters were estimated using pine allometric equation included in the treetop application

| 9Methods in Ecology and Evolu onSILVA et AL.
the P. taeda forests to have a more heterogeneous structure. In these two case studies, we observed values of PH3 = 0.55 and 0.64, and PH350 = 0.58 and 0.61 respectively (in Figure 7, PH3 is denoted by a crossed circle and PH350 by a red arrow). These are just a few exam-ples of how ecologists, forest science experts, foresters and other practitioners can benefit from the outputs automatically yielded by the Web- LiDAR treetop application and the R treetop package.
2.3 | Spatial patterns of individual trees in tropical forest
In our third case study, the treetop tool was used for ITD and crown delineation within a plot of 2.25 ha in a tropical forest site in the Western Brazilian Amazon to analyse the spatial distribution of trees by using Ripley's K functions (Ripley, 1976). The LiDAR data were collected at the Adolfo Ducke Forest Reserve in Manaus, state of Amazonas, Brazil (dos- Santos & Keller, 2015) with a pulse density of 22.7 points/m2 in 2012. CHMs (0.5 × 0.5 m) were created using LAStools (Isenburg, 2018) for ITD and crown boundary delinea-tions (Silva et al., 2016). ITD was performed using FWS = 7 × 7 and SWS = 7 × 7, and MaxCrown and Exclusion parameters were set to 0.4 and 0.7 respectively (Figures S5). The treetop detected 75 trees with mean (± SD) height of 33.47 m (± 4.93) and a mean crown area of 213.79 m2 (± 86.96) (Figure 8).
Ripley's K and L functions (Besag, 1977; Ripley, 1976) and the Clark– Evans index (Clark & Evans, 1954) were used to examine spa-tial patterns followed by the detected trees in the 2.25- ha plot in the Adolfo Ducke Forest Reserve. Ripley's function calculates distances (r) between individual pairs of trees and compares them to what
would be expected from a purely random (Poisson) point process. The empirical K function observed from spatial distribution of trees (Kobs (r); black solid lines in Figure 9) is compared against the theo-retical K function (Ktheo (r) = πr2; red dashed line in Figure 9). The grey- shaded areas in Figure 9 are confidence intervals for the ran-dom process developed by Monte Carlo simulations (Baddeley et al., ). Random variability and large ranges of values in the point intensity (y- axis) makes it difficult to analyse the differences between both curves (Figure 9a). For this reason, Besag (1977) proposed the L func-tion, as a transformation of the K function, Lobs (r) =
√
L (r) ∕� , where the theoretical L function becomes Ltheo (r) = r (Figure 9b). Finally, a further transformation into the L̂ function, obtained after subtracting the distance r from the L values, which makes Ripley's function and the confidence intervals for a random process easiest to visualize and analyse (Baddeley et al., ). Clark and Evans (1954) index (R) summarizes the information of Ripley's function into a single indicator with values R = 1 representing a random process, R < 1 a mechanism of attraction resulting in aggregated spatial patterns and R > 1 a mechanism of in-hibition which results in spatial regularity (Figure 9c).
The results obtained in the Adolfo Ducke Forest Reserve plot with the treetop application showed signs of mechanisms inhib-iting the growth of large trees close to one another (Figure 9). This is revealed by the empirically observed Ripley's K function laying below the confidence intervals for random process for dis-tances around r = 4– 15 m. The overall value of Clark- Evans index R = 1.48; from an ecological viewpoint, this indicates the mecha-nism of size- asymmetric competition between these trees which inhibit the growth of a tree in proximity of another (Weiner, 1990), which is in agreement with the natural growth conditions of this forest (DeMalach et al., 2016; Freckleton & Watkinson, 2001).
F I G U R E 5 Pre- and post- hurricane canopy metrics from LiDAR on a selected area of the USFS Panhandle Apalachicola National Forest. (a1, a2) Canopy height density profile, (b1, b2) tree height density distribution and (c1, c2) crown area density distribution

10 | Methods in Ecology and Evolu on SILVA et AL.
3 | FINAL CONSIDER ATIONS
We have provided an overview of the design and usage of treetop, the first web- based application and R package for ecologists and conservationist to automatically extract and analyse forest infor-mation from LiDAR- CHM data. The tool provides five panels which
were described in detail, and functionality exemplified with three case studies using LiDAR datasets collected from disparate for-est ecosystems, illustrating the ecological meaning of the analyses included in the application. The paper presents case studies fo-cused on mostly forested areas; however, the tool can be applied in non- forested (e.g. urban) areas as well. We hope this web- based
F I G U R E 6 (a1) Plot (50 × 50 m2) of forest clone plantation of Eucalyptus grandis (3 years old); and (a2) plot (50 × 50 m2) of seminal plantation of Pinus taeda (8 years old). The CHM is 0.5 m spatial resolution; (b1) and (b2) represent the 3D trees while (c1) and (c2) show the distribution of tree height within the Eucalyptus grandis and Pinus taeda sample plot

| 11Methods in Ecology and Evolu onSILVA et AL.
application will assist non- specialized practitioners of ecology and conservation world- wide towards better understanding the relation-ships between forest structure and function in different ecosystems.
treetop is open- source software and the source code as well as the datasets used in this study are available on the treetop GitHub reposi-tory (https://github.com/carlo s- alber to- silva/ webli dar- treetop).
F I G U R E 7 Lorenz curve plots of cubic powers of detected tree heights for (a) the forest clone plantation of Eucalyptus grandis; and (b) the seminal plantation of Pinus taeda. Lorenz curves are plotted according to Valbuena et al. (2012, 2013), and the red arrow shows how the value of the inverse of PH350 can be read from them
FI G U R E 8 Illustration of individual tree detection and crown delineation in the 2.25- ha plot located at the Adolfo Ducke Forest Reserve: (a) 2D visualization of the calculated tree location and crown delineation over the CHM (0.5 × 0.5 m); (b) CHM and tree height profile distribution; (c) 3D visualization of the CHM. (d) Virtual forest in 3D considering tree height and crown diameter derived from the treetop web- based app results

12 | Methods in Ecology and Evolu on SILVA et AL.
ACKNOWLEDG EMENTSThe authors thank Nicholas L. Crookston for co- developing the web- LiDAR treetop tool, and the two anonymous reviewers for their helpful suggestions on the first version of the manuscript. This study is based on the work supported by the Department of Defence Strategic Environmental Research and Development Program (SERDP) under grants No. RC- 2243, RC19- 1064 and RC20- 1346 and USDA Forest Service (grand No. PRO00031122).
CONFLIC T OF INTERE S TSThe authors have no conflict of interest.
AUTHORS' CONTRIBUTIONSAll the authors have made a substantial contribution towards the successful completion of this manuscript. They all have been in-volved in designing the study, drafting the manuscript and engaging in critical discussion. C.A.S., A.T.H., L.A.V., R.V. and C.K. contributed to the development of the web- LiDAR tool; A.C., M.M., D.R.A.d.A., E.N.B., A.M.A.Z., B.W., A.S., J.B.D., P.B.M., J.G.V. and G.A.P. con-tribute with the data processing, data analysis and write- up; A.T.H., L.A.V., E.N.B., D.J.J., J.W.A. and R.V. contributed to the interpreta-tion, quality control and revisions of the manuscript. All authors read and approved the final manuscript.
PEER RE VIE WThe peer review history for this article is available at https://publo ns.com/publo n/10.1111/2041- 210X.13830.
DATA AVAIL ABILIT Y S TATEMENTThe source code of the treetop package and datasets for the case studies are accessible via GitHub (https://github.com/carlo s- alber
to- silva/ webli dar- treetop). In addition, the R package can be down-loaded from the Comprehensive R Archive Network at https://cran.r- proje ct.org/web/packa ges/treet op/index.html and Zenodo at https://doi.org/10.5281/zenodo.6040071
ORCIDCarlos Alberto Silva https://orcid.org/0000-0002-7844-3560 Ruben Valbuena https://orcid.org/0000-0003-0493-7581 Danilo Roberti Alves de Almeida https://orcid.org/0000-0002-8747-0085 Jeff W. Atkins https://orcid.org/0000-0002-2295-3131 Carine Klauberg https://orcid.org/0000-0002-6898-5593
R E FE R E N C E SBesag, J. (1977). Contribution to the discussion on Dr. Ripley's paper.
Journals of the Royal Statistical Society, B39, 193– 195.Chang W., Cheng, J., Allaire, J. J., Sievert, C., Schloerke, B., Xie, Y., Allen,
J., McPherson, J., Dipert, A., & Borges, B. (2019). https://cran.r- proje ct.org/web/packa ges/shiny/ shiny.pdf
Clark, P. J., & Evans, F. C. (1954). Distance to nearest neighbour as a mea-sure of spatial relationships in populations. Ecology, 35, 445– 453.
Damgaard, C., & Weiner, J. (2000). Describing inequality in plant size or fe-cundity. Ecology, 81(4), 1139– 1142. https://doi.org/10.1890/0012- 9658(2000)081[1139:DIIPS O]2.0.CO;2
DeMalach, N., Zaady, E., Weiner, J., & Kadmon, R. (2016). Size asym-metry of resource competition and the structure of plant com-munities. Journal of Ecology, 104(4), 899– 910. https://doi.org/10.1111/1365- 2745.12557
dos- Santos, M. N., & Keller, M. M. (2015). CMS: Forest inventory and biophysical measurements, Para, Brazil, 2012– 2014. ORNL DAAC. https://doi.org/10.3334/ornld aac/1301
Freckleton, R. P., & Watkinson, A. R. (2001). Asymmetric competition between plant species. Functional Ecology, 15(5), 615– 623. https://doi.org/10.1046/j.0269- 8463.2001.00558.x
F I G U R E 9 (a) Ripley's K functions; (b) L function and (c) L̂function after extracting the distance band r from L based on the individual trees detected in 2012 within a 2.25- ha plot at the Adolfo Ducke Forest Reserve in the Western Brazilian Amazon

| 13Methods in Ecology and Evolu onSILVA et AL.
Hakamada, R. E., Stape, J. L., de Lemos, C. C. Z., Almeida, A. E. A., & Silva, L. F. (2015). Uniformidade Entre Árvores Durante Uma Rotação E Sua Relação Com A Produtividade Em Eucalyptus Clonais. Cerne, 21(3), 465– 472. https://doi.org/10.1590/01047 76020 15210 31716
Hentz, Â. M. K., Silva, C. A., Dalla Corte, A. P., Netto, S. P., Strager, M. P., & Klauberg, C. (2018). Estimating forest uniformity in Eucalyptus spp. and Pinus taeda L. stands using field measurements and struc-ture from motion point clouds generated from unmanned aerial ve-hicle (UAV) data collection. Forest Systems, 27(2), e005. https://doi.org/10.5424/fs/20182 72- 11713
Isenburg, M. (2018). LAStools— Efficient tools for lidar processing. 2018. Retrieved from http://www.cs.unc.Edu/~isenb urg/lasto ols/
Klotzbach, P. (2018). Michael made history as one of the top four stron-gest hurricanes to strike the United States. The Washington Post, October 11. Retrieved from https://www.washi ngton post.com/weath er/2018/10/11/micha el- made- histo ry- one- top- four- stron gest- hurri canes - strik e- unite d- state s/?utm_term=.0f01a 0f9d303
Knox, R. G., Peet, R. K., & Christensen, N. L. (1989). Population dynam-ics in loblolly pine stands: Changes in skewness and size inequality. Ecology, 70(4), 1153– 1167. https://doi.org/10.2307/1941383
Korpela, I., Anttila, P., & Pitkänen, J. (2006). The performance of a local maxima method for detecting individual tree tops in aerial photo-graphs. International Journal of Remote Sensing, 27(6), 1159– 1175. https://doi.org/10.1080/01431 16050 0354070
Leite, R. V., Silva, C. A., Mohan, M., Cardil, A., Almeida, D. R. A.d., Carvalho, S.d. P. C.e., Jaafar, W. S. W. M., Guerra- Hernández, J., Weiskittel, A., Hudak, A. T., Broadbent, E. N., Prata, G., Valbuena, R., Leite, H. G., Taquetti, M. F., Soares, A. A. V., Scolforo, H. F., Amaral, C. H.d., Dalla Corte, A. P., & Klauberg, C. (2020). Individual tree attribute estimation and uniformity assessment in fast- growing Eucalyptus spp. Forest plantations using lidar and linear mixed- effects models. Remote Sensing, 12, 3599. https://doi.org/10.3390/rs122 13599
Lindberg, E., & Hollaus, M. (2012). Comparison of methods for estima-tion of stem volume, stem number and basal area from airborne laser scanning data in a hemi- boreal Forest. Remote Sensing, 4(4), 1004– 1023. https://doi.org/10.3390/rs404 1004
MacArthur, R. H., & MacArthur, J. W. (1961). On bird species diversity. Ecology, 42(3), 594– 598. https://doi.org/10.2307/1932254
Mohan, M., Silva, C., Klauberg, C., Jat, P., Catts, G., Cardil, A., & Dia, M. (2017). Individual tree detection from unmanned aerial vehi-cle (UAV) derived canopy height model in an open canopy mixed conifer Forest. Forests, 8(9), 340. https://doi.org/10.3390/f8090340
Popescu, S. C., Wynne, R. H., & Nelson, R. F. (2014). Measuring individ-ual tree crown diameter with lidar and assessing its influence on estimating forest volume and biomass. Canadian Journal of Remote Sensing, 29(5), 564– 577. https://doi.org/10.5589/m03- 027
R Core Team. (2018). R: A language and environment for statistical computing. R Foundation for Statistical Computing. http://www.R- proje ct.org/
Ripley, B. D. (1976). The second- order analysis of stationary point pro-cesses. Journal of Applied Probability, 13(2), 255– 266. https://doi.org/10.2307/3212829
Sanz, B., Malinen, J., Leppänen, V., Valbuena, R., Kauranne, T., & Tokola, T. (2018). Valuation of growing stock using multisource GIS data, a stem quality database, and bucking simulation. Canadian Journal of Forest Research, 48(8), 888– 897. https://doi.org/10.1139/cjfr- 2017- 0172
Silva, C., Klauberg, C., Hudak, A., Vierling, L., Jaafar, W., Mohan, M., & Saatchi, S. (2017). Predicting stem Total and assortment volumes in an industrial Pinus taeda L. Forest plantation using airborne laser scanning data and random Forest. Forests, 8(7), 254. https://doi.org/10.3390/f8070254
Silva, C. A., Hudak, A. T., Vierling, L. A., Loudermilk, E. L., O'Brien, J. J., Hiers, J. K., & Khosravipour, A. (2016). Imputation of individual longleaf pine (Pinus palustris Mill.) tree attributes from Field and LiDAR data. Canadian Journal of Remote Sensing, 42(5), 554– 573. https://doi.org/10.1080/07038 992.2016.1196582
Silva, C. A., Hudak, A. T., Vierling, L. A., Valbuena, R., Cardil, A., Mohan, M., Almeida, D. A., Broadbent, E. N., Zambrano, A. M. A., Wilkinson, B., Sharma, A., Drake, J. B., Medley, P. B., Vogel, J. G., Prata, G. A., Atkins, J., Hamamura, C. & Klauberg, C. (2021). Treetop: A Shiny- based Application for Extracting Forest Information from LiDAR data. Version 0.0.3. Retrieved from https://CRAN.R- proje ct.org/packa ge=treetop
Silva, C. A., Klauberg, C., de Carvalho, S. P. C. E., Hudak, A. T., & Rodriguez, L. C. E. (2014). Mapping aboveground carbon stocks using LiDAR data in Eucalyptus spp. plantations in the state of Sao Paulo, Brazil. Scientia Forestalis, 42(104), 591– 604. https://www.fs.usda.gov/trees earch/ pubs/48607
Stark, S. C., Leitold, V., Wu, J. L., Hunter, M. O., de Castilho, C. V., Costa, F. R. C., McMahon, S. M., Parker, G. G., Shimabukuro, M. T., Lefsky, M. A., Keller, M., Alves, L. F., Schietti, J., Shimabukuro, Y. E., Brandão, D. O., Woodcock, T. K., Higuchi, N., de Camargo, P. B., de Oliveira, R. C., … Saleska, S. R. (2012). Amazon forest car-bon dynamics predicted by profiles of canopy leaf area and light environment. Ecology Letters, 15(12), 1406– 1414. https://doi.org/10.1111/j.1461- 0248.2012.01864.x
Valbuena, R., Maltamo, M., Mehtätalo, L., & Packalen, P. (2017). Key structural features of boreal forests may be detected directly using L- moments from airborne lidar data. Remote Sensing of Environment, 194, 437– 446. https://doi.org/10.1016/J.RSE.2016.10.024
Valbuena, R., Packalén, P., Martín- Fernández, S., & Maltamo, M. (2012). Diversity and equitability ordering profiles applied to study forest structure. Forest Ecology and Management, 276, 185– 195. https://doi.org/10.1016/J.FORECO.2012.03.036
Valbuena, R., Packalen, P., Mehtätalo, L., García- Abril, A., & Maltamo, M. (2013). Characterizing forest structural types and shelterwood dy-namics from Lorenz- based indicators predicted by airborne laser scanning. Canadian Journal of Forest Research, 43(11), 1063– 1074. https://doi.org/10.1139/cjfr- 2013- 0147
Valbuena, R., Vauhkonen, J., Packalen, P., Pitkänen, J., & Maltamo, M. (2014). Comparison of airborne laser scanning methods for esti-mating forest structure indicators based on Lorenz curves. ISPRS Journal of Photogrammetry and Remote Sensing, 95, 23– 33. https://doi.org/10.1016/J.ISPRS JPRS.2014.06.002
Wayne, D. W. (1990). Kolmogorov– Smirnov one- sample test. In Applied nonparametric statistics (2nd ed., pp. 319– 330). PWS- Kent. ISBN 978– 0– 534- 91976- 4.
Weiner, J. (1990). Asymmetric competition in plant populations. Trends in Ecology & Evolution, 5(11), 360– 364. https://doi.org/10.1016/0169- 5347(90)90095 - U
Weiner, J., & Thomas, S. C. (1986). Size variability and compe-tition in plant monocultures. Oikos, 47(2), 211. https://doi.org/10.2307/3566048
SUPPORTING INFORMATIONAdditional supporting information may be found in the online version of the article at the publisher’s website.
How to cite this article: Silva, C. A., Hudak, A. T., Vierling, L. A., Valbuena, R., Cardil, A., Mohan, M., de Almeida, D. R., Broadbent, E. N., Almeyda Zambrano, A. M., Wilkinson, B., Sharma, A., Drake, J. B., Medley, P. B., Vogel, J. G., Prata, G. A., Atkins, J. W., Hamamura, C., Johnson, D. J. & Klauberg, C. (2022). treetop: A Shiny- based application and R package for extracting forest information from LiDAR data for ecologists and conservationists. Methods in Ecology and Evolution, 00, 1–13. https://doi.org/10.1111/2041-210X.13830
Copyright © 2022 FDOKUMEN