
Forest Engineering and Technologies FETEC 2019
193
2 nd International Symposium of Forest Engineering and Technologies FETEC 2019 “Human and Nature Oriented Forest Engineering” SYMPOSIUM PROCEEDINGS 04-06 September 2019 Tirana-Albania Agricultural University of Tirana Faculty of Forestry Science [email protected] http://ubt.edu.al/sq/fetec-2019-albania Symposium Proceedings of FETEC 2019
-
Upload
khangminh22 -
Category
Documents
-
view
0 -
download
0
Transcript of Forest Engineering and Technologies FETEC 2019
2nd International Symposium of
Forest Engineering and Technologies
FETEC 2019
“Human and Nature Oriented Forest Engineering”
SYMPOSIUM PROCEEDINGS
04-06 September 2019
Tirana-Albania
Agricultural University of Tirana
Faculty of Forestry Science
http://ubt.edu.al/sq/fetec-2019-albania
Symposium Proceedings of FETEC 2019

FETEC’19 2nd International Symposium of Forest Engineering and Technologies
04-06 September 2019, Tirana
i
SYMPOSIUM COMMITTEES
Honorary Committee
Prof.Dr. Bahri Musabelliu, AUT, Rector
Prof.Dr. Leonidha Peri, AUT, FFS, Dean
Prof.Dr. Woodam Chung, IUFRO Division 3.0, OSU, USA
Prof.Dr. Hüseyin E. Çelik, FETEC, İU-C, Istanbul
Organizational Committee
Assoc.Prof.Leonidha Peri,AUT, FFS, Dean, Albania
Prof.Dr. Hajri Haska, AUT, FFS, (Chairman) Albania
Prof.Dr. Abdullah E. Akay, IUFRO Division 3.01, BTU, Turkey
Prof.Dr. Murat Demir, IU-C, Istanbul, Turkey
Prof.Dr. Mehmet Eker, IUAS, Isparta, Turkey
Prof.Dr. Selçuk Gümüş, KTU, Trabzon, Turkey
Secretarial
Assist.Prof.Dr. Ina Vejsiu, AUT, FFS, Albania
Assist.Prof.Dr. Ebru Bilici, GU, Giresun, Turkey
Facilitator
Msc. Eneida Haska, Albania
FETEC’19 2nd International Symposium of Forest Engineering and Technologies
04-06 September 2019, Tirana
ii
Scientific Committee
Prof.Dr. H.Hulusi Acar, IYYU, Istanbul, Turkey
Prof.Dr. Abdullah E. Akay, BTU, Bursa, Turkey
Prof.Dr. Kazuhiro Aruga, UDAI, Japan
Prof.Dr. Abdurrahim Aydın, DU, Düzce, Turkey
Prof.Dr. Alexandru Borz, UTB, Brasov, Romania
Prof.Dr. Murat Demir, IU-C, Istanbul, Turkey
Prof.Dr. Mehmet Eker, IUAS, Isparta, Turkey
Prof.Dr. M. Reza Ghaffariyan, USC, Australia
Prof.Dr. Selçuk Gümüş, KTU, Trabzon, Turkey
Prof.Dr. Mesut Hasdemir, IU-C, Istanbul, Turkey
Prof.Dr. Bahri Musabelliu, AUT, Albania
Prof.Dr. Hajri Haska, AUT, FFS, Albania
Prof.Dr. Vasillaq Mine, AUT, FFS, Albania
Prof.Dr. Tadeusz Moskalik, WU, Poland
Prof.Dr. Tolga Öztürk, IU-C, Istanbul, Turkey
Assoc.Prof.Leonidha Peri AUT, FFS, Albania
Prof.Dr. Tibor Pentek, UZ, Croatia
Prof.Dr. Hideo Sakai, UT, Tokyo, Japan
Prof.Dr. Juan C. Santamarta, UL, Spain
Prof.Dr. Vath Tabaku, AUT, FFS, Albania
Prof.Dr. Hektor Thoma, AUT, FFS, Albania
Prof.Dr. Andrea Maliqari, AUT, Albania
Prof.Dr. Metin Tunay, BU, Bartın, Turkey
Prof.Dr.Peter Zhelev, UF-FF, Bulgaria
Prof.Dr. Makedonka Stojanovsk, FF, N. Macedonia
Assoc.Prof.Dr. Stefano Grigolato, UNIPD, Italy
Assoc.Prof.Dr. Dzevada Sokolovic, US, Bosnia and Herzegovina
Assoc.Prof.Dr. Michael Wing, OSU, Oregon, USA
Dr. Dijana Vuletic FRIC, Croatia
Dr. Ljubinko Rakonjac, SI, Belgrade, Serbia
Dr. Radovan Nevenic, SI, Belgrade, Serbia
Dr. Misho Andelic, MARD, Montenegro.
Dr. Kole Vasilievski,FF, North Macedonia
Dr. Faruk Bojaxhi , UUH, Kosovo
Dr. Thomas Papachristou, FRI, Thessaloniki, Greece
Dr. Raffaele Spinelli, IBE, Italy
Dr. Natascia Magagnotti, IBE, Italy
FETEC’19 2nd International Symposium of Forest Engineering and Technologies
04-06 September 2019, Tirana
iii
INTRODUCTION
Traditional ecological knowledge emphasizes the importance of the relationship between
human beings and nature. The eco standards of 21th century make it necessary to develop and
implement human and nature-oriented activities for sustainable management of forest
resources. Technically designated forestry activities should contribute to the protection of
biodiversity, ecosystems, and habitats through environmentally friendly operations, while
meeting the public demands for wide range of forest products and services within sustainable
limits of the forest ecosystems.
There is no doubt that environmentally friendly approaches are necessary for implementing
reduced impact forest operations in the field of forest engineering. Besides, forest operation
activities provide important sources of income and job opportunities and help enhancing life
of rural populations in many countries. Although these activities provide many economic
benefits, a wide variety of workplace hazards present risks to the health and safety of people
at workplace. Therefore, not only technically appropriate and economically profitable but also
environmentally sound and socially acceptable forest operation practices should be promoted
to ensure the continued satisfaction of human needs for present and future generations.
2nd International Symposium of Forest Engineering and Technologies (FETEC
2019): “Human and Nature Oriented Forest Engineering” was held on 4-6 September
2019 at “Agricultural University of Tirana (AUT)” in the city of Tirana, Albania. The
symposium co-organizers included IUFRO Division 3.01.00 and FETEC Platform.
The aim of the symposium was to discuss the most recent scientific researches and
professional works related to human and nature oriented perspective of forest engineering
with attendance of international researchers, practitioners, and relevant shareholders.
Participants of the event included the representatives of the Agricultural University of Tirana,
Prof. Dr. Bahri Musabelliu, Rector of AUT, Dr. Ornela Çuçi, Deputy Minister in Ministry of
Tourism and Environment, Administrator of AUT, Deputy Rectors of AUT, Prof.Dr Sulejman
Sulce and Prof. Dr Remzi Keca, Assoc. Prof. Dr. Leonidha Peri, Dean, FFS, Ramadan
Mujollari, Administrator of FFS, Prof. Dr. Abdullah E. Akay, Deputy Coordinator in UIFRO
FETEC’19 2nd International Symposium of Forest Engineering and Technologies
04-06 September 2019, Tirana
iv
Division 3.01, Prof. Dr. H. Hulusi Acar as representative of FETEC, as well as researchers
from Albania and various countries such as: Turkey, Germany, Japan, Montenegro, and
Kosovo.
On behalf of the organizing committee, Prof. Dr.H. Haska welcomed the participants and
emphasized the importance of this activity to bring together researchers in the field and
opportunities for exchange of relevant knowledge and experience.
After welcoming speech from the rectorate of AUT, faculty and ministry, the symposium
continued with plenary, technical sessions, where 39 oral papers and 5 poster were presented.
The second and third day of the symposium has continued with a field trip in Belsh region
forests, as well as and after a Cultural Tour in Durres and next day at Tirana.
On behalf of the entire organizing committee we would like to sincerely thank all the
participants of the symposium and express our best wishes to those who contributed during
the preparation and organization stages of the symposium.
Assoc.Prof. Leonidha Peri Prof. Dr. Hajri Haska
Dean, FFS, Albania Symposium Chairman
Prof.Dr. Bahri Musabelliu
Rector, AUT, Albania
AGRICULTURAL UNIVERSITY OF TIRANA
Faculty of Forestry Science
Koder Kamez, SH1, Tirana 1000, Albania
Tel: +355 47200874
E-mail: [email protected]
http://ubt.edu.al/sq/fetec-2019-albania
FETEC’19 2nd International Symposium of Forest Engineering and Technologies
04-06 September 2019, Tirana
v
SYMPOSIUM PARTICIPANTS
Dritan AJDINA, Albania
Erzen BULICA, Albania
Nehat ÇOLLAKU, Albania
Abdulla DIKU, Albania
Eva GASHI, Albania
Dorian GJINI, Albania
Ardita GUSHO, Albania
Selçuk GÜMÜŞ, Albania
Eneida HASKA, Albania
Hajri HASKA, Albania
Elmaz ISLAMI, Albania
Albora KACANI, Albania
Ledis KOLA, Albania
Qazim KUKALAJ, Albania
Barjam KULLOLLI, Albania
Kostandina KUMI, Albania
Enea MALAJ, Albania
Janaq MALE, Albania
Vasillaq MINE, Albania
Gerd MUSTAFARAJ, Albania
Isuf OMURI, Albania
Leonidha PERI, Albania
Arben PETTO, Albania
Arsen PROKO, Albania
Kliti STARJA, Albania
Elvin TOROMANI, Albania
Ina VEJSIU, Albania
Stephan HOFFMANN, Germany
Kazuhiro ARUGA, Japan
Faruk BOJAXHI, Kosovo
Ergin HAJREDINI, Kosovo
Milosav ANĐELIĆ, Montenegro
H. Hulusi ACAR, Turkey
Abdullah E. AKAY, Turkey
Burak ARICAK, Turkey
Abdurrahim AYDIN, Turkey
Ebru BİLİCİ, Turkey
Sadık ÇAĞLAR, Turkey
Korhan ENEZ, Turkey
Selçuk GÜMÜŞ, Turkey
Taha Yasin HATAY, Turkey
Salih PARLAK, Turkey
Temel SARIYILDIZ, Turkey
İnanç TAŞ, Turkey
Yilmaz TURK, Turkey
Zennure UÇAR, Turkey
Abdullah YILDIZ, Turkey
Kıvanç YÜKSEL, Turkey
FETEC’19 2nd International Symposium of Forest Engineering and Technologies
04-06 September 2019, Tirana
vi
TABLE OF CONTENTS
Pages
Oral Presentations
Examination of Some Properties of Bursa Resort Areas with Open Source Web Mapping
(OpenLayers), Selçuk GÜMÜŞ, Taha Yasin HATAY
1
Profitability of clear cutting and regeneration operations in the Utsunomiya city, Tochigi prefecture, Japan, Chikara NAKAHATA, Kazuhiro ARUGA, Shun GUNJI, Takahisa
YAMAMOTO, Yoshikazu OGAWA, Shuntaro MIYASHITA, Takumi ADACHI
7
Insights of motor-manual tree felling in Germany, recent developments to ensure efficient operations in single tree selection harvest, Stephan HOFFMANN, Dirk JAEGER
12
Comparison of Workshop and Forest Field Application Results by Using Pheromone Baited
Trap with Electronic Control Unit, Osman ÇİÇEK, Gonca Ece ÖZCAN, Korhan ENEZ
18
Urban Green areas Design, using contemporary Architecture Software – a case study from Mangalem 21 project, Tirana Albania, Eneida HASKA, Ardita GUSHO, Kostandina KUMI,
Eva GASHI, Gerd MUSTAFARAJ, Hajri HASKA
23
Productivity Analysis of Front-end Loader in Timber Harvesting, Abdullah E. AKAY, Ebru BİLİCİ, İnanç TAŞ, H.Eren FINDIK
30
Rural people, governance, and forests in Kosovo, Qazim KUKALAJ 36
How much do forest products contribute to rural household income? Empirical evidence from three administrative units in Albania, Albora KACANI, Leonidha PERI
41
Pros and Cons of the Manual and Autonomous UAV Flights in Mapping of the Forest Road
Surface Deformations: Preliminary Results, Abdurrahim AYDIN, Yilmaz TURK, Remzi EKER
47
The Development of Protected Areas. Dajti National Park. The Impact In Tourism. Ina VEJSIU 53
Analysing of Forest Transport Techniques in Terms of Environmental Effect (A Case Study of
Bigadic Forest Enterprise), Tolga ÖZTÜRK, Merve Gökçe VARSAK, Ebru BİLİCİ
57
Determination of the Efficiency Status of Access to Chestnut Forests (Bozkurt Forest Management Directorate Example), Burak ARICAK, Hakan ÖREN, Çiğdem ÖZER GENÇ
63
Comparison of Turkey's wetland management approaches to International Wetland Policies in
terms of the role of wetlands in carbon cycling: An example from Bursa Karacabey Floodplain Forests, Temel SARIYILDIZ, Salih PARLAK, Mert TANI, Derya AYGÜN
69
National Forest Inventory estimation and timber harvesting planning in Albania, Kliti STARJA,
Arsen PROKO, Elmaz ISLAMI
75
Impact of Forest Management Practices on Climate Change, Nuray MISIR, Mehmet MISIR, Abdullah YILDIZ
82
An Evaluation of General Situation and Importance of Forest Roads: Turkish Forestry, Selçuk
GÜMÜŞ, Taha Yasin HATAY, Saliha ÜNVER OKAN
86
Actual Wood Flow Analysis for State-Forestry in Turkey, Mehmet EKER, H. Hulusi ACAR 92
Roles and Responsibilities of Municipalities in Albania Related to Forest Harvesting Based on 97
FETEC’19 2nd International Symposium of Forest Engineering and Technologies
04-06 September 2019, Tirana
vii
Regulatory Instruments and their Challenges, Nehat ÇOLLAKU, Elvin TOROMANI, Dritan
AJDINA, Abdulla DIKU
Determining Carbon Sequestration Using Remote Sensing, Mehmet MISIR, Nuray MISIR,
Abdullah YILDIZ
102
Accessibility of forest Protected Area by cable way/cable car - a contemporary and
environmental manner: a case study of Dajti National Park, Albania, Arben PETTO, Dorian
GJINI, Hajri HASKA
106
Effects of Timber Harvesting Activities on Needle Litter Decomposition Rates and Nutrient
Concentrations of Black Pine, Korhan ENEZ, Temel SARIYILDIZ, Gamze SAVACI
111
Some aspects of the assessment of the erosion rate in the Ulza basin as a function of land use in forest areas in this region, Enea MALAJ, Ledis KOLA
117
Post harvesting evaluation - an ecological-environmental assessment of forest harvested areas,
a case study of forest ecosystems in the Gramshi region, Albania, Hajri HASKA
123
Modeling of Noise Propagation from Mechanized Harvesting Equipment Using GIS Techniques, Abdullah E. AKAY, H. Hulusi ACAR
129
A Study on Winching Operations of the Farm Tractor at Kastamonu Forest in Turkey, Sadık
ÇAĞLAR
135
The Use of Unmanned Aerial Vehicle (UAV) for Tracking Stock Movements in Forest
Enterprise Depots, Remzi EKER, Abdurrahim AYDIN
141
Effectiveness of Open-Top Culverts in Forest Road Deformations: Preliminary Results from a
Forest Road Section, Düzce-Turkey, Yilmaz TURK, Abdurrahim AYDIN, Remzi EKER
147
Using of 3D Model in Documentation and Planning of Natural and Cultural Tourism, Ebru
BİLİCİ, Zennure UÇAR, Musa GENÇ
153
Determinations of vegetation cover change based on NVDI for Samur Yalama National Park in Azerbaijan, Yusif ABIYEV, Fevzi KARSLI, Selcuk GUMUS
158
An Assessment on Health and Safety Conditions at Forestry Works with Risk Analysis
Method, H. Hulusi ACAR, Mehmet EKER
162
Biodiversity of Eastern Black Sea Mixed Forests, Nuray MISIR, Mehmet MISIR, Abdullah
YILDIZ
168
Poster Presentations
Forest contribution to rural household economy and income equality: Calculation of Lorenz
curves for three administrative units of north-east Albania, Leonidha PERI, Albora KACANI
173
The study about the ksilofag insect Stromatium unicolor (Olivier), or Stromatium fulvum (Villers) and timber/wood protected, Fatmir LAÇEJ
178
Awareness of communities and tourism in natural forest parks, Ina VEJSIU 182
FETEC’19 2nd International Symposium of Forest Engineering and Technologies
04-06 September 2019, Tirana
1
Examination of Some Properties of Bursa Resort Areas with Open Source
Web Mapping (OpenLayers)
Selçuk GÜMÜŞ1, Taha Yasin HATAY1*
1Karadeniz Technical University, Forestry Faculty, Forest Engineering Department, 61080, Trabzon, Turkey
Abstract
Information Technologies are used in many different sectors. This has a positive impact on the
dissemination and use of information. Online mapping systems allow to use of forestry
databases created by relevant stakeholders. Open-source databases of recreational activities
(recreation area, national park, nature park, etc.) should be established. These databases can be
integrated with online mapping systems, enabling stakeholders to access forestry data more
easily. In this study; 70 recreation areas were determined within the borders of Bursa Regional
Directorate of Forestry. In addition to classification of recreation areas, a database was created
by taking into consideration the physical and administrative structures, usage status, purpose of
use and the forest structure (stand types, crown closures, development stages, tree species).
Recreation areas are 856.37 ha. Recreation areas 56.85 percent of the C-type recreation area.
24.29% of recreation area not used actively. 48% of the recreation area are intended for natural
beauty. As a result, for more efficient use of recreational areas in Turkish Forestry, open source
online databases and applications are important. However the applications, such as website,
online map system and online application, for the recreation areas in Turkey are available in
sufficient quantities.
Keywords: Resort area of Bursa, Open source web map, OpenLayers, Geographic
Information Systems, Online map
1. INTRODUCTION
Nowadays, information technologies are being used more and more in the management of green
spaces. Depending on these developments, spatial decision-making processes arise in field
management. With some studies as Open source software, web mapping applications, databases
and editing of geographic data, spatial decision making processes become more usable (Wold,
2017). The positive impact of technological developments is also seen in the forestry sector and
the use of online maps in spatial analysis is becoming widespread.
In recent years, GIS has been used on the web in many studies as watershed management, pest
management and ecosystem services. (Zhang et al., 2015; Damos, 2015; Lajis et al., 2016;
Tayyebi et al., 2016). These studies were generally performed with GIS based software and data
storage. The relationship between forest stand characteristics and landslide characteristics can
be given as an example of these connections (Gümüş et al., 2019). Spatial decision-making
processes should be carried out economically, socio-culturally and ecologically in accordance
with the basic characteristics of the ecosystem. Open-source mapping systems can be used to
share these analyses with more stakeholders. Open source mapping systems are those that do
not depend on any copyright, patent or control mechanism and are available to everyone free of
charge. This system, which is easy to use and accessible, has encouraged people to gather
around a common denominator.
Open source web maps emerge with the common use of GIS and internet technologies. It
facilitates access and control of data by end users with the use of file transfer protocol and world
FETEC’19 2nd International Symposium of Forest Engineering and Technologies
04-06 September 2019, Tirana
2
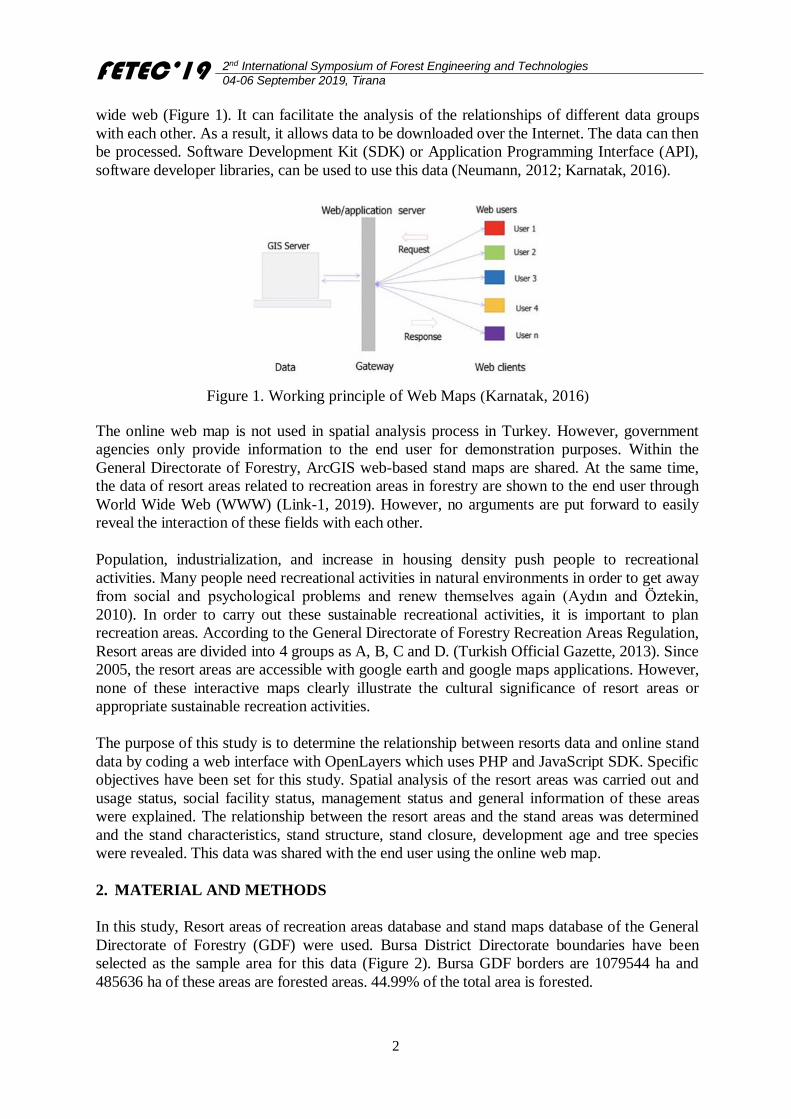
wide web (Figure 1). It can facilitate the analysis of the relationships of different data groups
with each other. As a result, it allows data to be downloaded over the Internet. The data can then
be processed. Software Development Kit (SDK) or Application Programming Interface (API),
software developer libraries, can be used to use this data (Neumann, 2012; Karnatak, 2016).
Figure 1. Working principle of Web Maps (Karnatak, 2016)
The online web map is not used in spatial analysis process in Turkey. However, government
agencies only provide information to the end user for demonstration purposes. Within the
General Directorate of Forestry, ArcGIS web-based stand maps are shared. At the same time,
the data of resort areas related to recreation areas in forestry are shown to the end user through
World Wide Web (WWW) (Link-1, 2019). However, no arguments are put forward to easily
reveal the interaction of these fields with each other.
Population, industrialization, and increase in housing density push people to recreational
activities. Many people need recreational activities in natural environments in order to get away
from social and psychological problems and renew themselves again (Aydın and Öztekin,
2010). In order to carry out these sustainable recreational activities, it is important to plan
recreation areas. According to the General Directorate of Forestry Recreation Areas Regulation,
Resort areas are divided into 4 groups as A, B, C and D. (Turkish Official Gazette, 2013). Since
2005, the resort areas are accessible with google earth and google maps applications. However,
none of these interactive maps clearly illustrate the cultural significance of resort areas or
appropriate sustainable recreation activities.
The purpose of this study is to determine the relationship between resorts data and online stand
data by coding a web interface with OpenLayers which uses PHP and JavaScript SDK. Specific
objectives have been set for this study. Spatial analysis of the resort areas was carried out and
usage status, social facility status, management status and general information of these areas
were explained. The relationship between the resort areas and the stand areas was determined
and the stand characteristics, stand structure, stand closure, development age and tree species
were revealed. This data was shared with the end user using the online web map.
2. MATERIAL AND METHODS
In this study, Resort areas of recreation areas database and stand maps database of the General
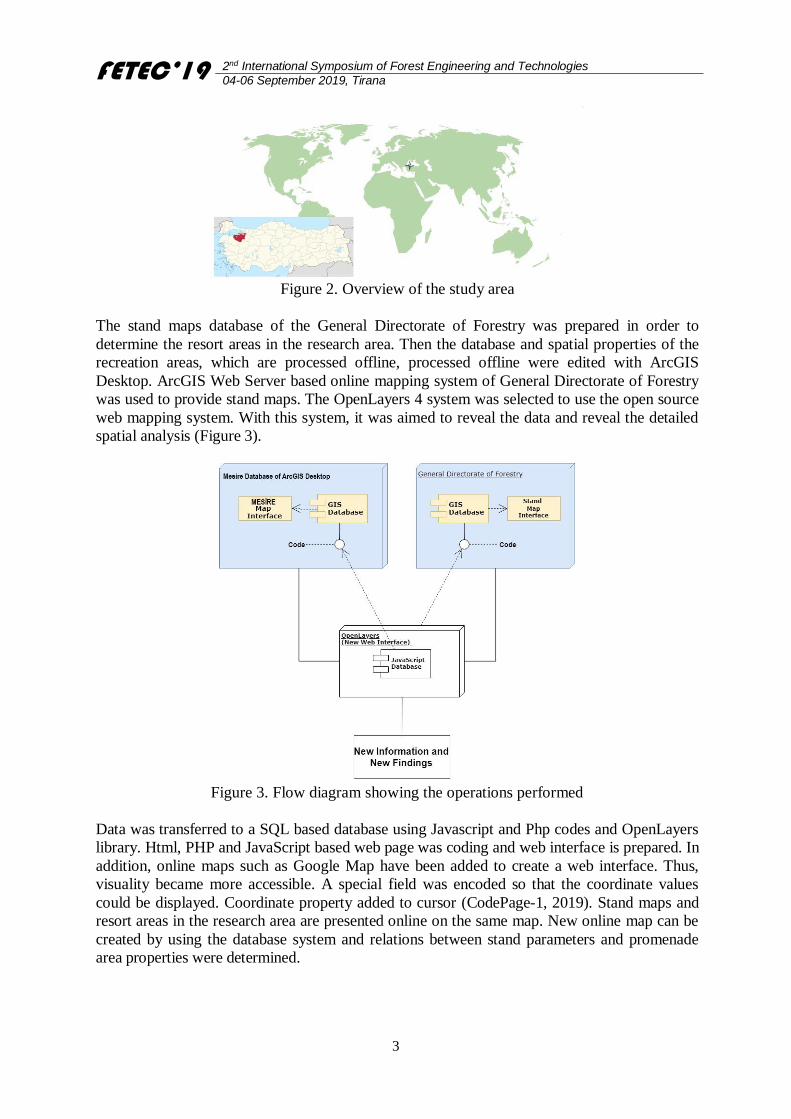
Directorate of Forestry (GDF) were used. Bursa District Directorate boundaries have been
selected as the sample area for this data (Figure 2). Bursa GDF borders are 1079544 ha and
485636 ha of these areas are forested areas. 44.99% of the total area is forested.
FETEC’19 2nd International Symposium of Forest Engineering and Technologies
04-06 September 2019, Tirana
3
Figure 2. Overview of the study area
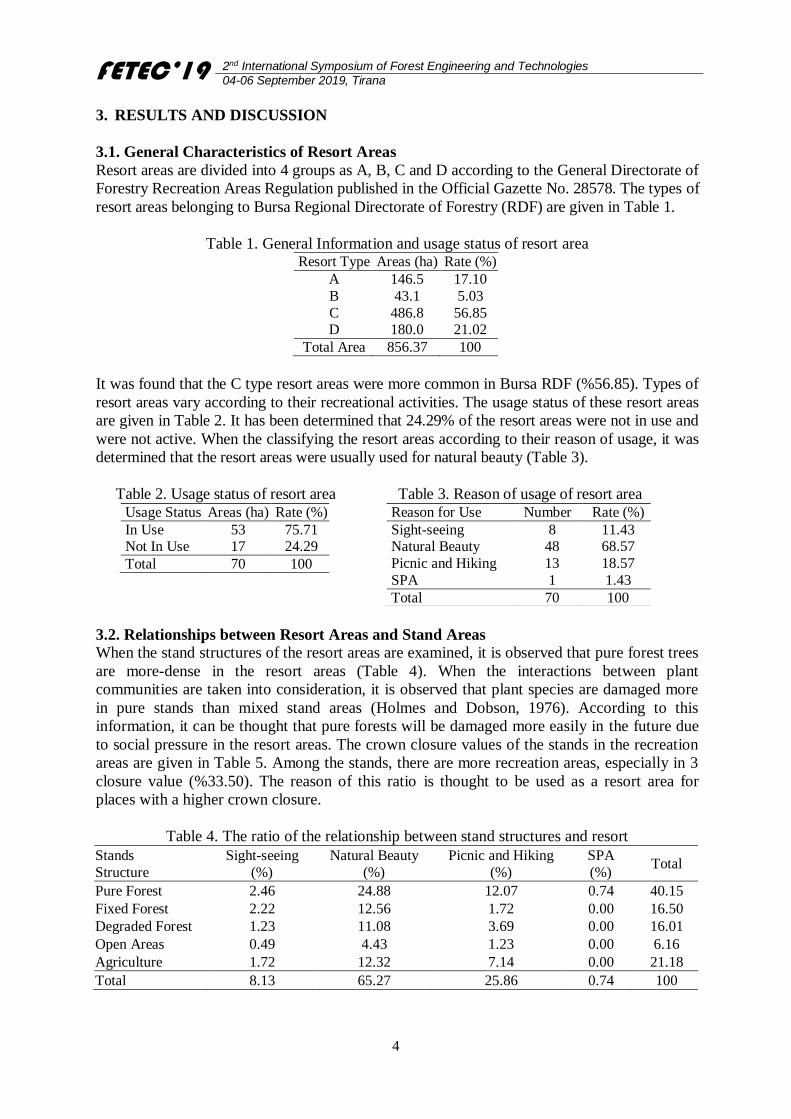
The stand maps database of the General Directorate of Forestry was prepared in order to
determine the resort areas in the research area. Then the database and spatial properties of the
recreation areas, which are processed offline, processed offline were edited with ArcGIS
Desktop. ArcGIS Web Server based online mapping system of General Directorate of Forestry
was used to provide stand maps. The OpenLayers 4 system was selected to use the open source
web mapping system. With this system, it was aimed to reveal the data and reveal the detailed
spatial analysis (Figure 3).
Figure 3. Flow diagram showing the operations performed
Data was transferred to a SQL based database using Javascript and Php codes and OpenLayers
library. Html, PHP and JavaScript based web page was coding and web interface is prepared. In
addition, online maps such as Google Map have been added to create a web interface. Thus,
visuality became more accessible. A special field was encoded so that the coordinate values
could be displayed. Coordinate property added to cursor (CodePage-1, 2019). Stand maps and
resort areas in the research area are presented online on the same map. New online map can be
created by using the database system and relations between stand parameters and promenade
area properties were determined.
FETEC’19 2nd International Symposium of Forest Engineering and Technologies
04-06 September 2019, Tirana
4
3. RESULTS AND DISCUSSION
3.1. General Characteristics of Resort Areas
Resort areas are divided into 4 groups as A, B, C and D according to the General Directorate of
Forestry Recreation Areas Regulation published in the Official Gazette No. 28578. The types of
resort areas belonging to Bursa Regional Directorate of Forestry (RDF) are given in Table 1.
Table 1. General Information and usage status of resort area Resort Type Areas (ha) Rate (%)
A 146.5 17.10
B 43.1 5.03
C 486.8 56.85 D 180.0 21.02
Total Area 856.37 100
It was found that the C type resort areas were more common in Bursa RDF (%56.85). Types of
resort areas vary according to their recreational activities. The usage status of these resort areas
are given in Table 2. It has been determined that 24.29% of the resort areas were not in use and
were not active. When the classifying the resort areas according to their reason of usage, it was
determined that the resort areas were usually used for natural beauty (Table 3).
Table 2. Usage status of resort area Usage Status Areas (ha) Rate (%)
In Use 53 75.71 Not In Use 17 24.29
Total 70 100
Table 3. Reason of usage of resort area Reason for Use Number Rate (%)
Sight-seeing 8 11.43 Natural Beauty 48 68.57
Picnic and Hiking 13 18.57
SPA 1 1.43
Total 70 100
3.2. Relationships between Resort Areas and Stand Areas
When the stand structures of the resort areas are examined, it is observed that pure forest trees
are more-dense in the resort areas (Table 4). When the interactions between plant
communities are taken into consideration, it is observed that plant species are damaged more
in pure stands than mixed stand areas (Holmes and Dobson, 1976). According to this
information, it can be thought that pure forests will be damaged more easily in the future due
to social pressure in the resort areas. The crown closure values of the stands in the recreation
areas are given in Table 5. Among the stands, there are more recreation areas, especially in 3
closure value (%33.50). The reason of this ratio is thought to be used as a resort area for
places with a higher crown closure.
Table 4. The ratio of the relationship between stand structures and resort
Stands
Structure
Sight-seeing
(%)
Natural Beauty
(%)
Picnic and Hiking
(%)
SPA
(%) Total
Pure Forest 2.46 24.88 12.07 0.74 40.15
Fixed Forest 2.22 12.56 1.72 0.00 16.50
Degraded Forest 1.23 11.08 3.69 0.00 16.01
Open Areas 0.49 4.43 1.23 0.00 6.16
Agriculture 1.72 12.32 7.14 0.00 21.18
Total 8.13 65.27 25.86 0.74 100
FETEC’19 2nd International Symposium of Forest Engineering and Technologies
04-06 September 2019, Tirana
5
Table 5. The ratio of the relationship between crown closures and resort
Crown
Closures
Sight-seeing
(%)
Natural Beauty
(%)
Picnic and Hiking
(%)
SPA
(%) Total
1 - (0.10-0.40) 0.49 4.43 2.71 0.00 7.64
2 - (0.41-0.70) 0.25 10.59 4.68 0.00 15.52
3 - (0.71-1.0) 3.94 22.41 6.40 0.74 33.50
Total (*) 8.13 65.27 25.86 0.74 100.00 (*) including Degraded Forest, Open Areas, Agriculture
The relationship between the resort areas and stand areas according to the development stages
is given in Table 6. It is observed that the resort areas are especially in stands of c stage
(%16.50). It is normal to use stands as a resort area for a certain developmental age. However,
it is noteworthy that there are resort areas in the early stages such as a, ab, b, bc. The resort
areas in these stages correspond to 16.5% of the total resort area.
When the relationship between the resort areas and stands according to tree species is
examined (Table-7), it is seen that the most common tree species is Turkish pine (%12.81). In
a study on forest trees in areas used for recreational activity across Europe (Edwards et al.,
2012), broad-leaved trees were found to be more preferred than coniferous trees. Compared
with this study, it is seen that tree preferences are not very important in resort areas.
Table 6. The ratio of the relationship between development stages and resort
Development Stages Sight-seeing (%) Natural Beauty
(%) Picnic and Hiking (%)
SPA
(%) Total
a (..<7.9 cm) 0.00 3.20 0.00 0.00 3.20
ab (1.30-7.9 cm) 0.00 2.46 0.00 0.00 2.46
b (20.0-35.9 cm) 0.25 1.97 1.23 0.00 3.45
bc (20.0-35.9 cm) 0.25 6.40 0.74 0.00 7.39
c (36.0-51.9 cm) 2.22 9.85 4.19 0.25 16.50
cd (36.0-51.9 cm) 1.23 7.14 3.69 0.25 12.32
d (52<.. cm) 0.74 6.40 3.94 0.25 11.33
Total (*) 8.13 65.27 25.86 0.74 100.00 (*) including Degraded Forest, Open Areas, Agriculture
Table-7. The ratio of the relationship between tree species and resort
Tree Specie Sight-seeing (%) Natural Beauty
(%) Picnic and Hiking
(%) SPA (%)
Total
Stone pine 0.00 1.48 0.25 0.00 1.72
Black Pine 1.97 9.61 3.69 0.00 15.27
Radiata Pine 0.00 0.74 0.49 0.00 1.23
Carpinus 0.00 0.49 0.00 0.00 0.49
Turkish Pine 0.49 5.17 7.14 0.00 12.81
Abies 0.00 0.00 0.74 0.00 0.74
Tilia 0.99 0.99 0.00 0.00 1.97
Beech 0.00 12.81 0.74 0.74 14.29
Oak 1.23 6.16 0.74 0.00 8.13
Total (*) 8.13 65.27 25.86 0.74 100.00 (*) including Degraded Forest, Open Areas, Agriculture
FETEC’19 2nd International Symposium of Forest Engineering and Technologies
04-06 September 2019, Tirana
6
4. CONCLUSION
In this study, an open source online databases and applications are used for more efficient usage
of recreational areas in Turkey. Resort areas of Bursa RDF are 856.37 ha. 75.71% of these areas
are actively used. Recreation areas are mostly used for natural beauty purposes. 58.6% of these
areas are managed by municipalities. 24.88% of these areas are pure forest stands and are used
for natural beauty. There are degraded forest areas, open areas and agricultural areas in resort
areas (43.35%).
Open source mapping activities should be used in the service of all stakeholders involved in
forestry activities. Thus, more open improvements can be made to the contribution based on
spatial analysis for forestry. And, as the databases can be used more efficiently, the relationship
between the information network and the forestry activities as a whole can be examined and
recorded. The findings in this study provide managers and policy makers with long-term
development of forest stands. It also shows the low silvicultural effects of forests in accordance
with sustainable recreation forestry.
References
Aydın, İ., Öztekin, Y. 2010. An example of promenades, breathing gardens of urban
population: Değirmen Boğazı (Balıkesir), The Journal of International Social Research,
3(14):88-98.
CodePage-1. 2019. (view-source:http://www.tahayasin.com/kml/proje2/) Access: 03.08.2019
Damos, P. 2015. Modular structure of web-based decision support systems for integrated pest
management. A review. Agron Sustain Dev, 35(4):1347-1372.
Edwards, D.M., Jay, M., Jensen, F.S., Lucas B., Marzano M., Montagné C., Peace, A., Weiss,
G. 2012. Public preferences across Europe for different forest stand types as sites for
recreation. Ecology and Society, 17(1): 27.
Holmes, D.O., Dobson, H.E. 1976. Ecological carrying capacity research: Yosemite National
Park. Part I. The Effect of human and trampling and urine on subalpine vegetation-A
survey of past and present backcountry use and the ecological carrying capacity of
wilderness. US Department of Commerce NTIS, Springfield, Virginia.
Gümüş, S., Hatay, T.Y., Ünver Okan, S. 2019. Investigation of Relevance Between Landslide
and Stand Areas on Open Source Web Map (Openlayers): Case Study in Trabzon Region.
European Journal of Forest Engineering, 5(1):11-17.
Karnatak, H.C. 2016. Geo Web Services Technology and Applications, SPIE APRS
Symposium 2016, Apr, New Delhi.
Lajis, A., Nasir, H.M., Ismail, N. 2016. Web GIS based information visualization for pest
infection: a case study of rice plantation. Asian J Plant Sci 15(3-4):109-114.
Link-1, 2019. (https://cbsuygulama.ogm.gov.tr/Vatandas/) Access: 07.08.2019
Neumann, A. 2012. Web Mapping and Web Cartography, Springer Handbook of Geographic
Information, 273-287.
Tayyebi, A., Meehan, T.D., Dischler J., Radloff G., Ferris M. Gratton, C. 2016. SmartScape: a
webbased decision support system for assessing the tradeoffs among multiple ecosystem
services under crop-change scenarios. Comput Electron Agric, 121:108-121.
Turkish Official Gazette, 2013. Recreation Area Regulation, Official Gazette Date:
05.03.2013, Official Gazette Number: 28578
Zhang, D., Chen, X.,Yao, H. 2015. Development of a prototype web-based decision support
system for watershed management. Water, 7(2):780-792
FETEC’19 2nd International Symposium of Forest Engineering and Technologies
04-06 September 2019, Tirana
7
Profitability of clear cutting and regeneration operations in the
Utsunomiya city, Tochigi prefecture, Japan
Chikara Nakahata1, Kazuhiro Aruga2*, Shun Gunji2, Takahisa Yamamoto2, Yoshikazu
Ogawa2, Shuntaro Miyashita2, Takumi Adachi2
1Utsunomiya City Forest Owners’ Co-operative, Utsunomiya, Japan 2Utsunomiya University (Department of Forest Science, Utsunomiya, Japan
Abstract
This study analyzed profitability of clear cutting and regeneration operations with operators’
daily reports and product sales reports of the Utsunomiya city Forest Owners’ Cooperative
(FOC) in the central area of Tochigi prefecture, Japan. Small-sized machines (6-8 tons weight)
were used in bunching and processing operations in 2015 and 2016 with small areas, about 1
ha, whereas medium-sized machines (9-13 tons weight) were used in 2017 and 2018 with
larger areas more than 5 ha. The productivities of clear cutting operations in 2015 and 2016
were 7.9 and 4.5 m3/man-day whereas those in 2017 and 2018 were 15.0 and 9.0 m3/man-day.
Thus, medium-sized machines with larger areas efficiently conducted clear cutting operations.
Furthermore, the productivity in 2016 was the lowest because manual processing was
performed in 2016 due to pine trees with crooked stems, whereas that in 2017 was the highest
because of gentle slope. Sufficient profits were only obtained in 2017 because the labour
productivity in 2017 was only beyond the target of the Government Of Japan (GOJ), 11-13
m3/man-day. Therefore, it is implied that the labour productivity should be increased by the
target of GOJ to obtain profits of clear cutting and regeneration operations.
Keywords: Revenue, Labor input, Productivity, Cost, Profit
1. INTRODUCTION
Extraordinary efforts were made to recover forests devastated during World War II and
subsequent restoration age in Japan (Forestry Agency 2018). Those planted forest resources
are getting mature and now ready for harvest. Government of Japan (GOJ) and Tochigi
prefecture have promoted the harvesting of matured planted forests in a sustainable manner
and then re-plant where appropriate. Therefore, many studies have been examining these final
felling and regeneration operations. Akaguma et al. (2017) compared productivities and costs
of clear cutting and regeneration operations with thinning operations of Nasu town FOC
(Aruga et al. 2013) using labour inputs from operators’ daily reports and production volumes
from product sales reports. Nasu town FOC was the top runner of mechanized thinning and
clear cutting operations in Tochigi prefecture, Japan. Nasu town was located in rural area
with relatively moderate slopes.
Utsunomiya city has also promoted clear cutting and regeneration operations since 2015
although it was a capital of Tochigi prefecture and a relatively populated area. Time and
motion studies between 2015 and 2016 as well as analyses on production between 2015 and
2017 have been reported (Gunji et al., 2017; Nakahata et al., 2018).
GOJ subsidized regeneration operations with 93.5% of site preparation and planting and 85%
of weeding standard costs (Nakahata et al., 2018). Tochigi prefecture made additional
subsidy to secure regeneration operations including 5 years weeding with JPY 320,000/ha
FETEC’19 2nd International Symposium of Forest Engineering and Technologies
04-06 September 2019, Tirana
8
(The exchange rate was USD 1 = JPY 109 on October 26, 2019) in 2015 and 2016, which
was shortage of subsidy from GOJ, with using completely felled trees as not only saw logs
but also energy woods. In 2017 and 2018, Tochigi prefecture reduced additional subsidy to
JPY 300,000/ha with extending clear cutting areas more than 5 ha for a logging contractor to
work efficiently and to reduce costs. Therefore, the logging contractor of Utsunomiya city
using the small-scale ground based system rented medium sized forestry machines on larger
clear-cutting areas in 2017 and 2018. In this study, productivities and costs as well as
profitability of clear cutting and regeneration operations with medium sized machines were
analyzed and compared with small sized machines using operators’ daily reports and
production volumes from product sales reports.
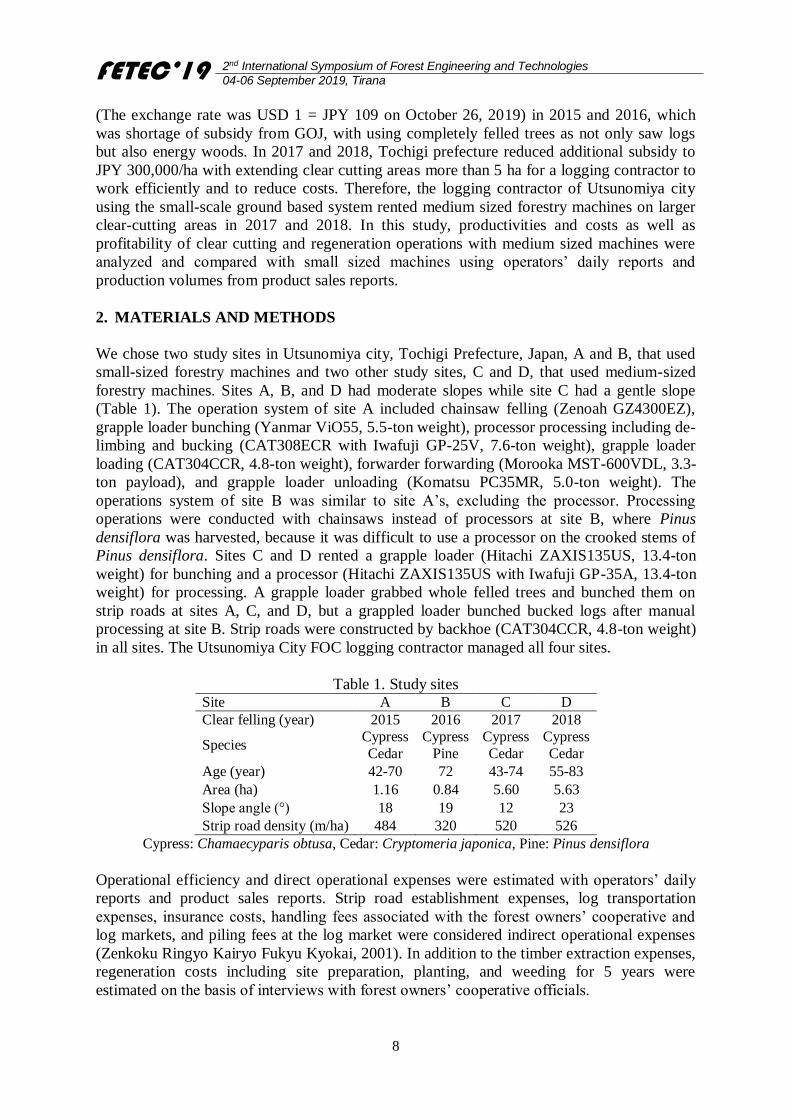
2. MATERIALS AND METHODS
We chose two study sites in Utsunomiya city, Tochigi Prefecture, Japan, A and B, that used
small-sized forestry machines and two other study sites, C and D, that used medium-sized
forestry machines. Sites A, B, and D had moderate slopes while site C had a gentle slope
(Table 1). The operation system of site A included chainsaw felling (Zenoah GZ4300EZ),
grapple loader bunching (Yanmar ViO55, 5.5-ton weight), processor processing including de-
limbing and bucking (CAT308ECR with Iwafuji GP-25V, 7.6-ton weight), grapple loader
loading (CAT304CCR, 4.8-ton weight), forwarder forwarding (Morooka MST-600VDL, 3.3-
ton payload), and grapple loader unloading (Komatsu PC35MR, 5.0-ton weight). The
operations system of site B was similar to site A’s, excluding the processor. Processing
operations were conducted with chainsaws instead of processors at site B, where Pinus
densiflora was harvested, because it was difficult to use a processor on the crooked stems of
Pinus densiflora. Sites C and D rented a grapple loader (Hitachi ZAXIS135US, 13.4-ton
weight) for bunching and a processor (Hitachi ZAXIS135US with Iwafuji GP-35A, 13.4-ton
weight) for processing. A grapple loader grabbed whole felled trees and bunched them on
strip roads at sites A, C, and D, but a grappled loader bunched bucked logs after manual
processing at site B. Strip roads were constructed by backhoe (CAT304CCR, 4.8-ton weight)
in all sites. The Utsunomiya City FOC logging contractor managed all four sites.
Table 1. Study sites Site A B C D
Clear felling (year) 2015 2016 2017 2018
Species Cypress
Cedar
Cypress
Pine
Cypress
Cedar
Cypress
Cedar
Age (year) 42-70 72 43-74 55-83
Area (ha) 1.16 0.84 5.60 5.63
Slope angle (°) 18 19 12 23
Strip road density (m/ha) 484 320 520 526
Cypress: Chamaecyparis obtusa, Cedar: Cryptomeria japonica, Pine: Pinus densiflora
Operational efficiency and direct operational expenses were estimated with operators’ daily
reports and product sales reports. Strip road establishment expenses, log transportation
expenses, insurance costs, handling fees associated with the forest owners’ cooperative and
log markets, and piling fees at the log market were considered indirect operational expenses
(Zenkoku Ringyo Kairyo Fukyu Kyokai, 2001). In addition to the timber extraction expenses,
regeneration costs including site preparation, planting, and weeding for 5 years were
estimated on the basis of interviews with forest owners’ cooperative officials.

FETEC’19 2nd International Symposium of Forest Engineering and Technologies
04-06 September 2019, Tirana
9
Table 2. Machine fixed and variable daily costs (JPY/day)
Machine Chain saw Grapple loader
Backhoe Processor Forwarder
Size Small Medium Small Medium
Fixed 656 12,600 24,256 21,776 27,584 18,096
Variable 2,624 6,280 10,784 10,648 14,176 10,128
Site preparations piling residues were conducted with small-sized grapple-loader at sites A
and B whereas that was conducted with medium-sized grapple-loader and backhoe at site D.
At site C, both small and medium-sized grapple loaders were used for site preparations. The
Utsunomiya City FOC logging contractor conducted site preparations just after clear cutting
operations. However, site A was a snow damaged forest and site preparations piling residues
as well as snow damaged trees were conducted with forwarding operations. Therefore, labor
inputs of site preparations at site A were not obtained.
At site A, a specialized silvicultural contractor completed the planting of 3,000 container
seedlings/ha of Cryptomeria japonica using hoes and dibbles. Planting container seedlings
with dibbles was a relatively new method in Japan. The logging contractor conducted
planting operations at sites B, C, and D, because regeneration operations were projected to
increase, and new workers had to be trained. At site B, 3,000 normal seedlings/ha of
Chamaecyparis obtuse were planted with hoes, and 2,500 container seedlings/ha of
Cryptomeria japonica were planted with dibbles at site C. At site D, 1.47 ha of 2,500 normal
seedlings/ha of Chamaecyparis obtuse were planted with hoes, and 4.16 ha of 2,500 container
seedlings/ha of Cryptomeria japonica were planted with dibbles. The prices of normal and
container seedlings were JPY133 and JPY199, respectively.
3. RESULTS
3.1. Clear cutting
The productivities of clear cutting operations in sites A and B were 7.9 and 4.5 m3/man-day
whereas those in sites C and D were 15.0 and 9.0 m3/man-day (Table 3). Thus, medium-sized
machines with larger areas efficiently conducted clear cutting operations. Furthermore, the
productivity in site B was the lowest because manual processing was performed in site B due
to pine trees with crooked stems, whereas that in site C was the highest because of less
steepness. The total cost in site B was also the highest whereas that in site C was the lowest
(Table 4). However, total costs in sites A and D were almost same because of lower
machinery costs with small-sized machines in site A although the productivity in site D was
higher.
Table 3. Labour productivity (m3/man-day)
Site A B C D
Felling 29.0 *10.5 45.3 30.0
Bunching 63.5 29.9 79.3 50.6
Processing 54.4 - 107.5 68.0
Forwarding 17.5 11.5 49.2 28.6
Strip road 761.9 147.7 392.8 127.4
Total 7.9 4.5 15.0 9.0
*Processing with manual chainsaw was included
FETEC’19 2nd International Symposium of Forest Engineering and Technologies
04-06 September 2019, Tirana
10
Table 4. Cost (JPY/m3)
Site A B C D
Felling 835 *2,135 500 758
Bunching 817 1,689 647 1,054
Processing 971 - 583 883
Forwarding 2,827 4,979 1,560 2,560
Strip road 68 255 96 297
Total 5,518 9,058 3,384 5,552
*Processing with manual chainsaw was included
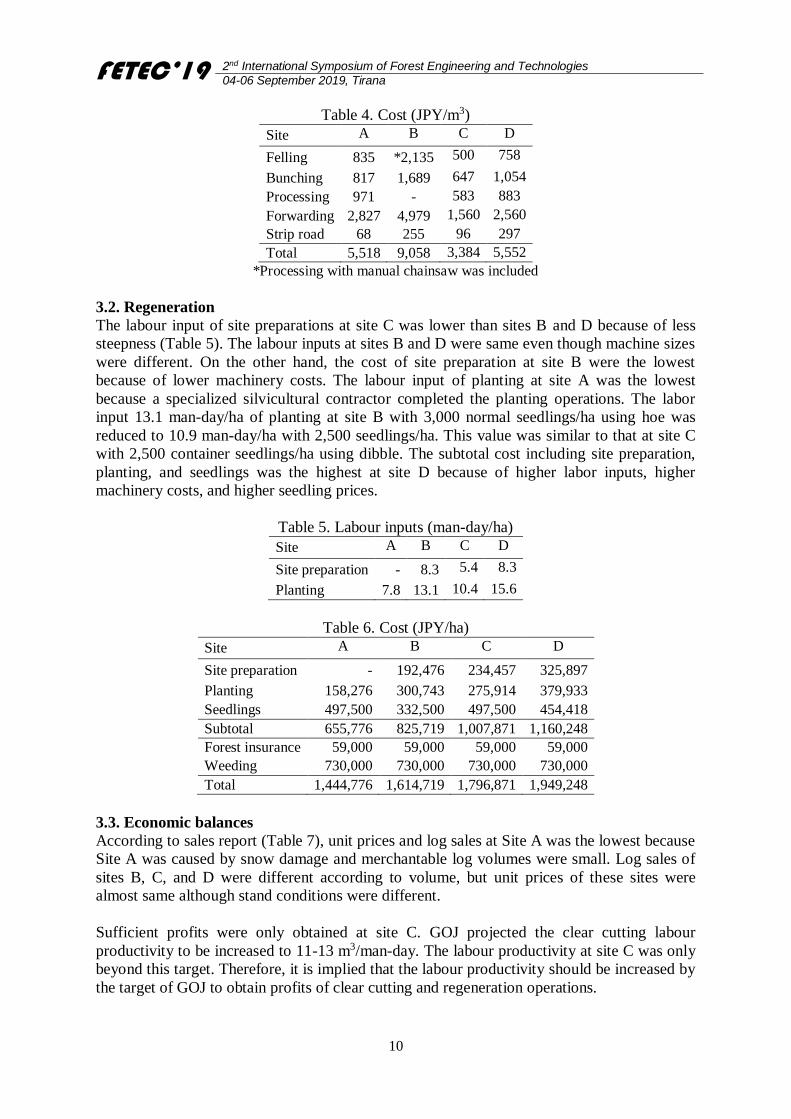
3.2. Regeneration
The labour input of site preparations at site C was lower than sites B and D because of less
steepness (Table 5). The labour inputs at sites B and D were same even though machine sizes
were different. On the other hand, the cost of site preparation at site B were the lowest
because of lower machinery costs. The labour input of planting at site A was the lowest
because a specialized silvicultural contractor completed the planting operations. The labor
input 13.1 man-day/ha of planting at site B with 3,000 normal seedlings/ha using hoe was
reduced to 10.9 man-day/ha with 2,500 seedlings/ha. This value was similar to that at site C
with 2,500 container seedlings/ha using dibble. The subtotal cost including site preparation,
planting, and seedlings was the highest at site D because of higher labor inputs, higher
machinery costs, and higher seedling prices.
Table 5. Labour inputs (man-day/ha)
Site A B C D
Site preparation - 8.3 5.4 8.3
Planting 7.8 13.1 10.4 15.6
Table 6. Cost (JPY/ha)
Site A B C D
Site preparation - 192,476 234,457 325,897
Planting 158,276 300,743 275,914 379,933
Seedlings 497,500 332,500 497,500 454,418
Subtotal 655,776 825,719 1,007,871 1,160,248
Forest insurance 59,000 59,000 59,000 59,000
Weeding 730,000 730,000 730,000 730,000
Total 1,444,776 1,614,719 1,796,871 1,949,248
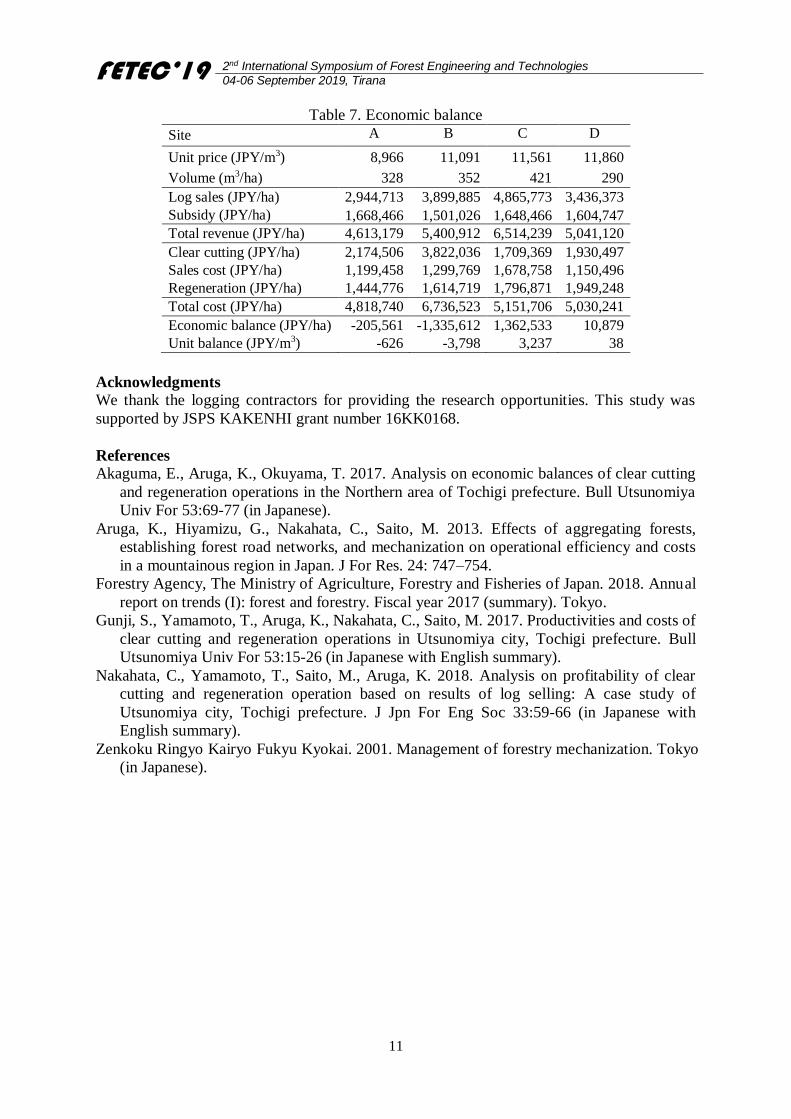
3.3. Economic balances
According to sales report (Table 7), unit prices and log sales at Site A was the lowest because
Site A was caused by snow damage and merchantable log volumes were small. Log sales of
sites B, C, and D were different according to volume, but unit prices of these sites were
almost same although stand conditions were different.
Sufficient profits were only obtained at site C. GOJ projected the clear cutting labour
productivity to be increased to 11-13 m3/man-day. The labour productivity at site C was only
beyond this target. Therefore, it is implied that the labour productivity should be increased by
the target of GOJ to obtain profits of clear cutting and regeneration operations.
FETEC’19 2nd International Symposium of Forest Engineering and Technologies
04-06 September 2019, Tirana
11
Table 7. Economic balance
Site A B C D
Unit price (JPY/m3) 8,966 11,091 11,561 11,860
Volume (m3/ha) 328 352 421 290
Log sales (JPY/ha) 2,944,713 3,899,885 4,865,773 3,436,373
Subsidy (JPY/ha) 1,668,466 1,501,026 1,648,466 1,604,747
Total revenue (JPY/ha) 4,613,179 5,400,912 6,514,239 5,041,120
Clear cutting (JPY/ha) 2,174,506 3,822,036 1,709,369 1,930,497
Sales cost (JPY/ha) 1,199,458 1,299,769 1,678,758 1,150,496
Regeneration (JPY/ha) 1,444,776 1,614,719 1,796,871 1,949,248
Total cost (JPY/ha) 4,818,740 6,736,523 5,151,706 5,030,241
Economic balance (JPY/ha) -205,561 -1,335,612 1,362,533 10,879
Unit balance (JPY/m3) -626 -3,798 3,237 38
Acknowledgments We thank the logging contractors for providing the research opportunities. This study was
supported by JSPS KAKENHI grant number 16KK0168.
References
Akaguma, E., Aruga, K., Okuyama, T. 2017. Analysis on economic balances of clear cutting
and regeneration operations in the Northern area of Tochigi prefecture. Bull Utsunomiya
Univ For 53:69-77 (in Japanese).
Aruga, K., Hiyamizu, G., Nakahata, C., Saito, M. 2013. Effects of aggregating forests,
establishing forest road networks, and mechanization on operational efficiency and costs
in a mountainous region in Japan. J For Res. 24: 747–754.
Forestry Agency, The Ministry of Agriculture, Forestry and Fisheries of Japan. 2018. Annual
report on trends (I): forest and forestry. Fiscal year 2017 (summary). Tokyo.
Gunji, S., Yamamoto, T., Aruga, K., Nakahata, C., Saito, M. 2017. Productivities and costs of
clear cutting and regeneration operations in Utsunomiya city, Tochigi prefecture. Bull
Utsunomiya Univ For 53:15-26 (in Japanese with English summary).
Nakahata, C., Yamamoto, T., Saito, M., Aruga, K. 2018. Analysis on profitability of clear
cutting and regeneration operation based on results of log selling: A case study of
Utsunomiya city, Tochigi prefecture. J Jpn For Eng Soc 33:59-66 (in Japanese with
English summary).
Zenkoku Ringyo Kairyo Fukyu Kyokai. 2001. Management of forestry mechanization. Tokyo
(in Japanese).
FETEC’19 2nd International Symposium of Forest Engineering and Technologies
04-06 September 2019, Tirana
12
Insights of motor-manual tree felling in Germany, recent developments to
ensure efficient operations in singletree selection harvest
Stephan Hoffmann1*, Dirk Jaeger2
1Chair of Forest Operations, University of Freiburg, 79085 Freiburg, Germany 2Department of Forest Work Science and Engineering, University of Goettingen, 37077 Goettingen, Germany
Abstract
Despite of an intensive mechanization trend in German forest operations, fully-mechanized
harvesting systems reach on many sites restrictions due to trafficability and singletree
selection harvest based silviculture. Consequently, motor-manual operations are still relevant,
but need to be adapted to stay efficient and improve safety in a changing work environment.
Recent developments of new felling techniques and aiding tools, but also advances in training
and work organization, improved occupational health and safety, and avoid log devaluation
by felling damages, too. The general digitalization trend did not ignore motor-manual
operations either. Smartphone applications can already contribute to more efficient bucking,
operation planning and fleet management. Yet, motor-manual operations will remain cost-
intensive, and expose worker directly to occupational hazards. Therefore, generally,
operations should take as much advantage of mechanized systems as possible.
Keywords: Occupational health and safety, Forest worker, Felling equipment, Digitalization
1. INTRODUCTION
Fully-mechanized harvesting systems are the synonym for state of the art logging operations
in the Western World, and have replaced motor-manual work due to higher productivity, cost
competitiveness and also increased occupational health and safety (Axelsson, 1998; Labelle
et al., 2017). However, in Germany, a key industrialized country with high labor costs, about
40% of timber production is still realized by motor-manual and semi-mechanized operations
(KWF, 2011).
Silvicultural systems of structured broadleaf forests, with large target diameters and a
selective utilization, but also trafficability restrictions due to terrain conditions, limit
extensive mechanization (BMEL 2017). In consequence, that means that motor-manual
works will remain relevant within the German forest operation sector. Therefore, recent
technical, but also organizational advancements took place in order to increase the efficiency
of such operations.
The objective of the authors is to share some insights of these developments to a wider
audience through this subject review. It is the aim to support silviculturists with the
implementation of close-to-nature forest management systems, by promotion of operational
tools for efficient facilitation of singletree selection harvest.
2. FELLING EQUIPMENT
Chainsaws were already marked as an outdated technology for professional use with the
upcoming dominance of harvesters in the Nordic countries at the end of the 1980s (Axelsson,
1998). Yet, all major chainsaw manufacturers continued technical developments. Improved
FETEC’19 2nd International Symposium of Forest Engineering and Technologies
04-06 September 2019, Tirana
13
ergonomics by weight optimization and vibration dampers, but also safety features such as
quick stop chain brake and emission improvements through catalytic converter and alkylate
fuels; created hand power tools of high sophistication, such as the just recently released
STIHL MS 500i with electronic fuel injection (Thöny, 2007; Haim, 2009; Höllerl, 2017a,
STIHL, 2018). Also the continues further development of battery powered chainsaws, with
higher power ratings and longer work cycles, qualifying them for professional use (Wiese,
2019), pin point that there is a flourishing market for chainsaws in modern forestry.
Besides the technical performance of chainsaws, also the PPE (personal protective
equipment) has gone through very evolutionary stages in the recent decades. Until the 1950s,
ordinary farm gear was worn during forest work, and not even the use of a simple helmet was
standard. However, with upcoming safety awareness and regulations top-down from EU level
since 1989, with last revision through the Regulation EU/2016/425 (European Parliament and
Council, 9th of March 2016), high tech forestry PPE was developed from boot to helmet,
adapted to the needs of forestry professionals. With a previous focus on cut protection only,
the technical garments of forestry workers further improved in wear comfort. Light stretch
materials, wear resistance and high visibility colors for safety improvements, and well
adapted to work in difficult terrain at all weather conditions, create healthier working
conditions and a higher level of job satisfaction and performance (Hartmann, 2007).
Clear communication among forestry workers is a fundamental requirement for accident
prevention, but also log devaluation due to felling damages caused by miscommunication
within a felling team. Two-way radio headsets, integrated in the earmuffs of professional
forestry helmets, and combined with automatic emergency call systems, have overcome this
shortfall (Schmidt-Baum 2008). The latest generation make now use of Bluetooth
connections, and, as such, avoid wiring beneath the work gear and further increases work
comfort, and thus performance efficiency (Höllerl, 2017b).
Various felling aids in form of levers and wedges became essential equipment for motor-
manual operations, too, further increasing performance and safety. Light weighted PVC
wedges are carried nowadays by every professional forest worker at his belt, supporting
directional felling, but also securing the guide bar of the saw during felling cuts, avoiding
chain stucks in the wood (SVLFG 2017). More recently developed technical felling aids,
such as hydraulic wedges and levers, increase these supports for high dimensional trees
leaning in opposite felling directions. These technical felling aids, although heavy to carry,
have the additional advantage that work becomes more ergonomic, at lowered accident risk
by falling objects, such as dead branches, during conventional hammering (Ruppert, 2000).
Much lighter, but at least in the normal range with up to 20 t hoist power, almost equally
powerful mechanical wedges, have overtaken the application area of the hydraulic ones
(Höllerl, 2014). Although increasing the weight again, mechanical wedges are available with
refitted power tools, too, decreasing the manual force requirement for efficient application.
3. FELLING TECHNIQUES
Next to advances in equipment and gear, also felling techniques have further developed to
guaranty the highest degree of safety and least devaluation of logs and residual stand due to
felling damages. The international recognized standard felling technique (e.g. FAO, 1980),
was adapted in Germany in various ways to suit tree dimensions and felling situation. Most
notably is the so-called safety technique (SVLFG, 2017). There, instead of an ordinary back
FETEC’19 2nd International Symposium of Forest Engineering and Technologies
04-06 September 2019, Tirana
14
cut, a bore cut is applied, leaving a holding strap at the backside, which is quickly cut
afterwards when the worker is standing sideways already in a safe retreating position. Since
the weight of the log and crown creates tension, the tree can rupture without warning when
applying the conventional standard felling technique, causing felling damages and in the
worst-case fatal accidents. The holding strap takes up the tension of the entire log and secures
the tree until the end of the felling process, not putting the worker under any time pressure
(DGUV, 2014; SVLFG, 2017).
The adaptation of felling techniques focused also on the usage of felling levers, wedges, and
winch supported felling. The latter are special techniques combining chainsaw works with
cable winches, further securing and guiding the falling direction of trees, selected and applied
after an individual tree evaluation (Kieser, 2009). Winch supported tree-felling increase the
efficiency of thinning operations, which commonly creates hangers during felling. Also
within special tree felling in old growth stands, where trees are difficult to direct due to their
wide crowns or other restrictions such as terrain, dead wood in crowns, harvesting in
vegetation period or simply when structures deny the natural falling direction, winches are
valuable supports (DGUV, 2014; SVLFG, 2017).
4. EDUCATION AND VOCATIONAL TRAINING
A professional and well trained workforce is a key element for sustainable forest operations
(Marchi et al. 2018). According to the German Vocational Training Act of 2005, with its last
revision in 2017 (BMBF, 2005), forest worker (German “Forstwirt”) is a recognized job
qualification, requiring formal 3-years education and approved examination. This covers a
wide range of subjects beyond pure chainsaw handling, such as; forest management, timber
harvesting, nature protection and landscape management, forestry equipment, enterprise
organization and management, guarantying a high standard during professional forest
operations (Forstwirtschaft in Deutschland, 2019).
However, due to Germany’s location within the mobile job market of the EU, with
international sub-contracting or just generally international staff among the enterprises, many
forest workers active in German operations did not undergo these vocational qualifications.
In order to still ensure a high quality standard of operations and also to fulfill certification
requirements of employing only qualified staff (e.g. FSC, 2018), the European Chainsaw
Certificate (ECC), initialized by the European Forestry and Environmental Skills Council
(EFESC), is a European standard to assure a qualification for forest workers across Europe
(EFESC, 2017). This basic qualification for public and certified enterprise staff ensures a
decent standard for sustainable operations.
5. DIGITALIZATION
The ongoing digitalization of our modern world, brought up applications under the umbrella
of industry 4.0, aiming to improve flexibility, productivity and customer orientation of
production, and bears high potential to increase the efficiency of wood supply chains (Müller
et al., 2019). Owing the fact that chainsaws lack the connection to high capacity on-board
computers as present with fully-mechanized systems, motor-manual operations are far more
limited to benefit from the industry 4.0 applications. However, the prevalence of
smartphones, allows other ways to digitalize daily routines of forest operations. Already well
established are i.e. smartphone apps for photo-optical timber scaling such as the iFOVEA™
FETEC’19 2nd International Symposium of Forest Engineering and Technologies
04-06 September 2019, Tirana
15
system, simplifying volume measurements and being the interface to the log buyer for billing
and routing (FOVEA, 2019).
More dedicated apps with a focus on increasing the efficiency of chainsaw operators, are for
example the recently released Tech4Effect Bucking App, increasing the value recovery of a
log by optimized bucking (Erber, 2019), or the more sophisticated LogBuch™ App. The
latter, covers already the entire felling process from tree selection by the forester, where he
can set a geo-reference for the tree location and add relevant information regarding safety
hazards, optimal felling and extraction direction or other relevant information through a
headset voice recording and GPS magnifier (Eber, 2019). This information can be provided
to the chainsaw operator on his smartphone in form of a logging map for enhanced in-stand
navigation. The next development stage of the app intends to incorporate the process of
assortment conversion on log lists, with geo-reference, too. Thereby, not only all relevant
information for the skidder operator are provided, but further this process accelerates the
billing and marketing of the logs due to fast information forwarding, and therefore, increases
the efficiency of the entire operation.
LogBuch™ enables the incorporation of operation related information flow, already provided
for some time by software solutions of the leading machine manufacturers, allowing
communication within harvester-forwarder supply chains and the contractor’s office for
efficient production, as for example John Deere’s combination of TimberMatic™ and
TimberManager™ (John Deere, 2019). Yet, the component of fleet management is lacking
with LogBuch™, which however is available through the machine manufacturers themselves.
Both, STIHL and Husqvarna, the globally leading chainsaw manufacturers are providing fleet
management applications as a combination of machine mounted sensors and smartphone
applications, monitoring essential data such as operating hours, fuel consumption and
maintenance intervals, but also ergonomic factors such as exposure to vibration (Husqvarna,
2019; STIHL, 2019). This offers not only additional potential to reduce downtimes, but also
to coordinate a fleet of motorized hand tools among working teams.
6. CONCLUSIONS
Motor-manual operations are currently, and will remain relevant in Germany as an important
tool within singletree focused silviculture management. Predominantly in terrain with low
trafficability, high dimensional timber and for low and scattered cut volumes, as prevalent in
private woodlots of small size. Yet, it requires highly qualified workers, to implement such
silvicultural systems, and to perform efficient operations. Suitable work equipment,
techniques and organization, following the latest findings in ergonomics, occupational health
and safety, as well as environmental compatibility to do so, are available, but will also need
frequent revisions if no alternative mechanized method suits the same requirements.
However, where possible, the hazardous work of tree felling should be replaced by
mechanized systems for further reducing workplace accidents.
References
Axelsson, S.-å. 1998. The Mechanization of Logging Operations in Sweden and its Effect on
Occupational Safety and Health. International Journal of Forest Engineering. 9(2): 25–31.
BMBF 2005. Berufsbildungsgesetz. BBiG, revised 7/17/2017. Available online at
http://www.gesetze-im-internet.de/bbig_2005/BBiG.pdf.
BMEL 2017. Waldbericht der Bundesregierung 2017. Edited by Bundesministerium für
Ernährung und Landwirtschaft. Bonn.
FETEC’19 2nd International Symposium of Forest Engineering and Technologies
04-06 September 2019, Tirana
16
DGUV 2014. Sichere Waldarbeiten. Edited by DGUV (DGUV Informationen, 214-046).
Eber, J. 2019. Motorsäge und App. Forst und Technik (7):20–23.
EFESC 2017. EFESC Handbook. Groß-Umstadt/Germany. Available online at
https://efesc.org/wp-content/uploads/12_EFESC_Handbook_Nov_2017-1.pdf.
Erber, G. 2019. T4E Bucking App - A mobile device based application for value-optimized
motor-manual bucking. With assistance of Michael Viertbauer, Viktor Schildberger.
Edited by BoKu. Available online at http://www.tech4effect.eu/wp-
content/uploads/2019/09/t4e-bucking-app-manual-english-v13-201909.pdf.
European Parliament and Council 9th of March 2016. Regulation (EU) 2016/425 of the
European Parliament and of the Council on personal protective equipment. EU/2016/425.
Official Journal of the European Union (L81/51). Available online at https://eur-
lex.europa.eu/legal-content/EN/TXT/HTML/?uri=CELEX:32016R0425&from=EN.
FAO 1980. Chainsaws in Tropical Forests. Food and Agriculture Organization of the United
Nations, Rome. 96 p.
Forstwirtschaft in Deutschland 2019. Der Forstwirt: Ausbildung und Arbeit. Available online
at https://www.forstwirtschaft-in-deutschland.de/forstwirtschaft/arbeitgeber-
forstwirtschaft/forstwirt-in/.
FOVEA 2019. Digitale Holzvermessung. Available online at https://www.fovea.eu/.
FSC 2018. Deutscher FSC-Standard 3-0. 2nd ed. Edited by FSC Deutschland. Freiburg.
Available online at https://www.fsc-deutschland.de/preview.fsc-waldstandard-3-0.a-
1207.pdf.
Haim, G. 2009 Von der Fällmaschine zur modernen Motorsäge.Wald und Holz 83(9): 51–54.
Hartmann, H. 2007. Funktionelle Bekleidung hält Einzug in den Forstbetrieben. Bündnerwald
60(2): 16–19.
Höllerl, H. 2014. Kurbeln statt klopfen. Forst und Technik (12): 14–18.
Höllerl, H. 2017a. Einspritzsäge. Forst und Technik (11): 70.
Höllerl, H. 2017b. KuNo kabellos. Forst und Technik (11): 69.
Husqvarna 2019. Husqvarna Fleet Services. Available online at
https://www.husqvarna.com/de/rasen-garten/profi/fleetservices/.
John Deere 2019. TimberMatic™ Maps TimberManager™. Edited by Deere & Company.
Available online at
https://www.deere.co.uk/assets/publications/index.html?id=bd2a8bf9#1.
Kieser, W. 2009. Fällen mit Seilwinde leicht gemacht! Forst und Technik (5): 2–5.
KWF 2011. Vollmechanisierte Holzernte. Entwicklung der vollmechanisierten Holzernte in
Deutschland. Personal communication, Forbrig, Andreas. Forstliche Arbeitsverfahren,
Technikfolgenabschätzung – KWF. 20.02.2018, Groß-Umstadt/Germany
Labelle, E.R., Bergen, M., Windisch, J. 2017. The effect of quality bucking and automatic
bucking on harvesting productivity and product recovery in a pine-dominated stand.
European Journal of Forest Research. 136(4): 639–652.
Marchi, E., Chung, W., Visser, R., Abbas, D., Nordfjell, T., Mederski, P.S., McEwan, A.,
Brink, M., Laschi, A. 2018. Sustainable Forest Operations (SFO): A new paradigm in a
changing world and climate. The Science of the total Environment. 634: 1385–1397.
Müller, F., Jaeger, D., Hanewinkel, M. 2019. Digitization in wood supply – A review on how
Industry 4.0 will change the forest value chain. Computers and Electronics in Agriculture.
162:206–218.
Ruppert, D. 2000. Einsatz von hydraulischen Fällhilfen. Forsttechnische Informationen
(5+7): 49–50.
Schmidt-Baum, T. 2008. Konzepte für Rettungsketten in Waldarbeitssystemen. 1st Edition,
Cuvillier, Göttingen. 282 p.

FETEC’19 2nd International Symposium of Forest Engineering and Technologies
04-06 September 2019, Tirana
17
STIHL 2018. Annual Report 2018. Tradition and Transformation. Edited by STIHL Holding
AG & Co. KG. Waiblingen. Available online at
https://ar2018.stihl.com/downloads/STIHL_AnnualReport2018_EN_Web.pdf.
STIHL 2019. STIHL Smart Connector. Produkte intelligent vernetzen. Edited by STIHL
Holding AG & Co. KG. Available online at https://www.stihl.de/STIHL-Produkte/Smarte-
L%C3%B6sungen/287476-93994/Produkte-intelligent-vernetzen.aspx.
SVLFG 2017.Waldarbeit.Aktuelles zu Sicherheit undGesundheitsschutz. Edited SVLFG,
Kassel.87 p.
Thöny, P. 2007. The History of the Chainsaw. Edited by WSL. Available online at
https://www.waldwissen.net/lernen/forstgeschichte/wsl_geschichte_motorsaege/index_EN
Wiese, P. 2019. Akkugeräte im Forst. Forst und Technik (9): 20–25.
FETEC’19 2nd International Symposium of Forest Engineering and Technologies
04-06 September 2019, Tirana
18
Comparison of Workshop and Forest Field Application Results by Using
Pheromone Baited Trap with Electronic Control Unit
Osman ÇİÇEK1, Gonca Ece ÖZCAN2, Korhan ENEZ2*
1Kastamonu University, Faculty of Engineering and Architecture, Electrical and Electronics Engineering, 37100 Kastamonu, Turkey
2Kastamonu University, Faculty of Forestry, Department of Forestry Engineering, 37100 Kastamonu, Turkey
Abstract
Mass pheromone trapping applications are one of the most common strategies for controlling
target species. The results obtained from the Pheromone Baited Trap with Electronic Control
Unit (ECU), which is developed by adapting to today’s technology, will provide detailed
temporal and climatic data about the behavior of target species. The usage in the field of this
ECU, which is designed and gave successfull workshop results will provide the results of
real-time natural capture of lps sexdentatus which is the target species. ECU, designed in
2014 and patented in 2016 was placed in a forest area where the target species made damage
at the end of May in 2019 and the results were evaluated. Beetles trapped at approximately
the same hours every day were counted and controlled manually. The data recorded by the
electronic unit on the MicroSD card and the manual counting results were compared and
observed to be in agreement. According to the 24-day evaluations, as ECU's total counting
success was 94.6% during these periods the lowest and highest counting success rates were
85% -100%, respectively. As a result, the success rate obtained from previous experimental
studies was 97.5%, whereas this rate was 3.2% lower in real-time counts.
Key words: Electronic Control Unit, Phoremone- baited trap, Counting success
1. INTRODUCTION
The use of modern technology in order to provide as much real information as possible in
order to achieve the objectives set for forestry management (Kovácsová and Antalová, 2010)
is the basic principle of precision forestry, which is a current issue in today's forestry. In this
context, new technological developments offer the opportunity to obtain more objective
information on forestry applications (Holopainen et al., 2014). It is recognized that for
sustainable forestry, adapting technical advances to forestry in a suitable scheme will help
address current issues (Sayer et al., 1997). While the significance of technological
innovations in the forestry sector is mentioned, there is limited research on this subject
(Hetemäki, 2010).
Within the sustainable forestry approach, new creative initiatives to reduce losses and thus
financial losses in forests are crucial in terms of forest conservation as in all fields (Özcan et
al., 2016). Explaining, in particular, the behavior of bark beetles, which from time to time
threaten the world's forests and Turkey with their different species, and efforts to control this
species of beetle are issues that continue to be relevant. Bark beetles may cause irreversible
changes in forest areas as a result of their damage (Näsi et al., 2018). Although there is
limited information on the unproven approaches of pest and host plant populations (Coulson
et al., 1985), interdisciplinary studies that provide quantitative data on the population
dynamics of beetles and their host interactions are important in explaining beetle ecology and
behavior. Pheromone baited traps are very powerful tools for the capture of target species
FETEC’19 2nd International Symposium of Forest Engineering and Technologies
04-06 September 2019, Tirana
19
(Sciarretta and Calabrese, 2019). Mass pheromone trap practices in the control against
harmful target species and population monitoring are now one of the most common strategies
(Lindgren and Border, 1983; Yonker, 1990; Bakke 1991; Knodel and Petzoldt 1995,
Safranyik et al., 2004; Byers, 2006; Hyes et al., 2008; Özcan et al. 2011; Galko et al., 2016;
Sagitov et. al. 2016).
The currently used pheromone traps help target species to be captured on a limited basis and
to partially monitor their populations. However, these traps do not provide data on the
temporal and climatic variables at the time the target species is captured. At the same time,
these traps are very costly both in terms of time and labor and therefore remain weak in terms
of reliability (Özcan et al., 2014). Due to their reliability, ease of use and low costs (Sciarretta
and Calabrese, 2019) compared to traditional monitoring methods, technically equipped
devices will become more viable over time in practice. The use of new technological
applications for forest sustainability could be made by making more accurate measurements
and thus by acquiring more accurate information. In this study, the success of the pheromone-
Baited Trap with the Electronic Control Unit (ECU), designed in 2014, patented in 2016 and
capable of obtaining detailed time and climate data on the behavior of target species, was
tested using today's technology and the results were compared with the results of the previous
experimental evaluation.
2. MATERIAL AND METHODS
The prototype Pheromone-Baited Trap with ECU, designed in 2014 and patented in 2016,
was used for this research (Patent No. TR 2014 / 03278B) (Özcan et al., 2014; 2016; Özcan et
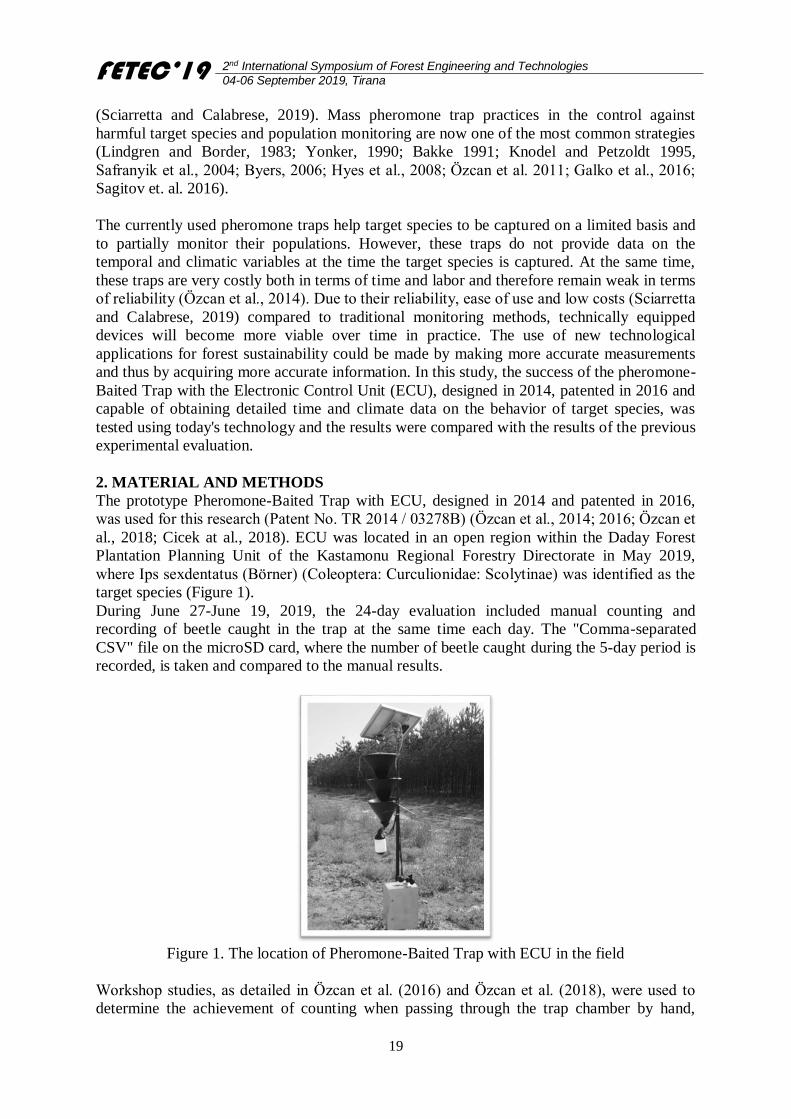
al., 2018; Cicek at al., 2018). ECU was located in an open region within the Daday Forest
Plantation Planning Unit of the Kastamonu Regional Forestry Directorate in May 2019,
where Ips sexdentatus (Börner) (Coleoptera: Curculionidae: Scolytinae) was identified as the
target species (Figure 1).
During June 27-June 19, 2019, the 24-day evaluation included manual counting and
recording of beetle caught in the trap at the same time each day. The "Comma-separated
CSV" file on the microSD card, where the number of beetle caught during the 5-day period is
recorded, is taken and compared to the manual results.
Figure 1. The location of Pheromone-Baited Trap with ECU in the field
Workshop studies, as detailed in Özcan et al. (2016) and Özcan et al. (2018), were used to
determine the achievement of counting when passing through the trap chamber by hand,
FETEC’19 2nd International Symposium of Forest Engineering and Technologies
04-06 September 2019, Tirana
20
regardless of the natural trapping of the target species. All statistical analyses were performed
using IBM SPSS® 20.0 for Windows® software. Descriptive statistics have been used to
define variables in the database, including range of modifications, standard deviation,
standard error, minimum value, maximum value, and percentages. The compatibility of the
data with the normal distribution was controlled by Kolmogorov-Smirnov (K-S) (Table 1).
During the 24-day period, it was determined that the amount of beetles manually counted and
reported by the ECU distributed normally (p>0.05) and than, the average amount of beetle
counted and captured was determined by the Independent T-test samples (Table 1).
Table 1. Group statistics of beetles numbers that are manually counted and ECU recorded and
normality control according to Kolmogorov – Smirnov K-S test
N
Mean±Std. Deviation
Min
Max
P*
Manuel counted 24 31.70±19,92 9 86 0.728
ECU recorded 24 30.00±20,41 9 86 0.555
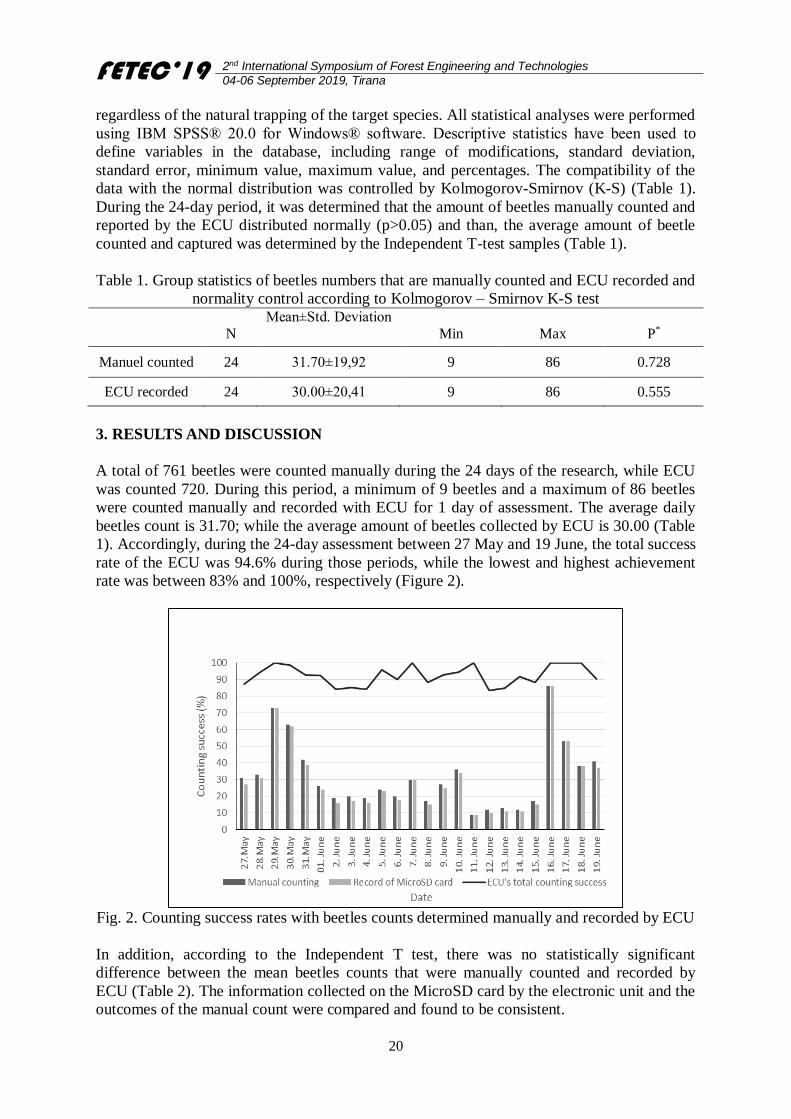
3. RESULTS AND DISCUSSION
A total of 761 beetles were counted manually during the 24 days of the research, while ECU
was counted 720. During this period, a minimum of 9 beetles and a maximum of 86 beetles
were counted manually and recorded with ECU for 1 day of assessment. The average daily
beetles count is 31.70; while the average amount of beetles collected by ECU is 30.00 (Table
1). Accordingly, during the 24-day assessment between 27 May and 19 June, the total success
rate of the ECU was 94.6% during those periods, while the lowest and highest achievement
rate was between 83% and 100%, respectively (Figure 2).
Fig. 2. Counting success rates with beetles counts determined manually and recorded by ECU
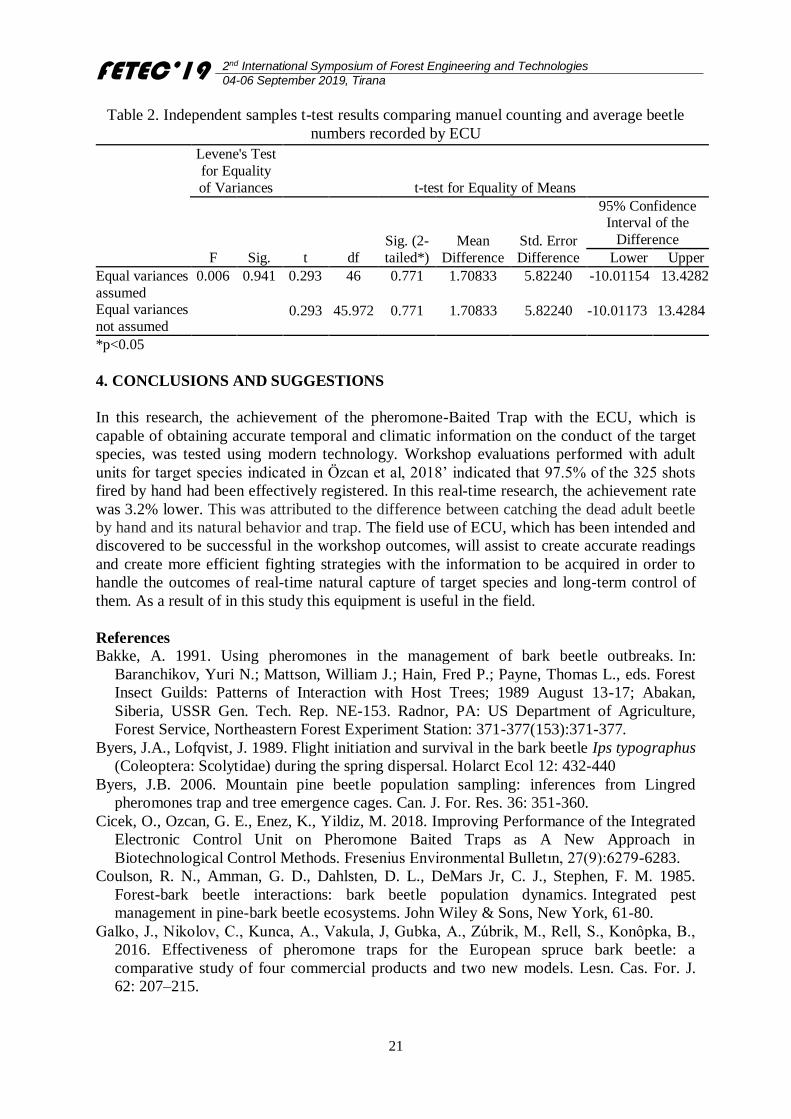
In addition, according to the Independent T test, there was no statistically significant
difference between the mean beetles counts that were manually counted and recorded by
ECU (Table 2). The information collected on the MicroSD card by the electronic unit and the
outcomes of the manual count were compared and found to be consistent.
FETEC’19 2nd International Symposium of Forest Engineering and Technologies
04-06 September 2019, Tirana
21
Table 2. Independent samples t-test results comparing manuel counting and average beetle
numbers recorded by ECU
*p<0.05
4. CONCLUSIONS AND SUGGESTIONS
In this research, the achievement of the pheromone-Baited Trap with the ECU, which is
capable of obtaining accurate temporal and climatic information on the conduct of the target
species, was tested using modern technology. Workshop evaluations performed with adult
units for target species indicated in Özcan et al, 2018’ indicated that 97.5% of the 325 shots
fired by hand had been effectively registered. In this real-time research, the achievement rate
was 3.2% lower. This was attributed to the difference between catching the dead adult beetle
by hand and its natural behavior and trap. The field use of ECU, which has been intended and
discovered to be successful in the workshop outcomes, will assist to create accurate readings
and create more efficient fighting strategies with the information to be acquired in order to
handle the outcomes of real-time natural capture of target species and long-term control of
them. As a result of in this study this equipment is useful in the field.
References
Bakke, A. 1991. Using pheromones in the management of bark beetle outbreaks. In:
Baranchikov, Yuri N.; Mattson, William J.; Hain, Fred P.; Payne, Thomas L., eds. Forest
Insect Guilds: Patterns of Interaction with Host Trees; 1989 August 13-17; Abakan,
Siberia, USSR Gen. Tech. Rep. NE-153. Radnor, PA: US Department of Agriculture,
Forest Service, Northeastern Forest Experiment Station: 371-377(153):371-377.
Byers, J.A., Lofqvist, J. 1989. Flight initiation and survival in the bark beetle Ips typographus
(Coleoptera: Scolytidae) during the spring dispersal. Holarct Ecol 12: 432-440
Byers, J.B. 2006. Mountain pine beetle population sampling: inferences from Lingred
pheromones trap and tree emergence cages. Can. J. For. Res. 36: 351-360.
Cicek, O., Ozcan, G. E., Enez, K., Yildiz, M. 2018. Improving Performance of the Integrated
Electronic Control Unit on Pheromone Baited Traps as A New Approach in
Biotechnological Control Methods. Fresenius Environmental Bulletın, 27(9):6279-6283.
Coulson, R. N., Amman, G. D., Dahlsten, D. L., DeMars Jr, C. J., Stephen, F. M. 1985.
Forest-bark beetle interactions: bark beetle population dynamics. Integrated pest
management in pine-bark beetle ecosystems. John Wiley & Sons, New York, 61-80.
Galko, J., Nikolov, C., Kunca, A., Vakula, J, Gubka, A., Zúbrik, M., Rell, S., Konôpka, B.,
2016. Effectiveness of pheromone traps for the European spruce bark beetle: a
comparative study of four commercial products and two new models. Lesn. Cas. For. J.
62: 207–215.
Levene's Test
for Equality
of Variances t-test for Equality of Means
F Sig. t df
Sig. (2-
tailed*)
Mean
Difference
Std. Error
Difference
95% Confidence Interval of the
Difference
Lower Upper
Equal variances
assumed Equal variances
not assumed
0.006 0.941 0.293 46 0.771 1.70833 5.82240 -10.01154 13.4282
0.293
45.972
0.771
1.70833
5.82240
-10.01173
13.4284
FETEC’19 2nd International Symposium of Forest Engineering and Technologies
04-06 September 2019, Tirana
22
Hayes C.J, DeGomez T.E, Clancy K.M, Williams K.K, McMillin J.D, Anhold J.A. 2008.
Evaluation of funnel traps for characterizing the bark beetle (Coleoptera: Scolytidae)
communities in ponderosa pine forests of north-central Arizona. J Econ Entomol.
101(4):1253-65.
Holopainen, M., Vastaranta, M., Hyyppä, J. 2014. Outlook for the next generation’s
precision forestry in Finland. Forests, 5(7):1682-1694.
Hetemäki, L., Mery, G., Holopainen, M., Hyyppä, J., Vaario, L. M., Yrjälä, K. 2010.
Implications of technological development to forestry (Vol. 25, pp. 157-181). IUFRO
(International Union of Forestry Research Organizations) Secretariat.
Knodel, J., Petzoldt, C. H. 1995. Pheromone traps–effective tools for monitoring
Lepidopterous insect pests of sweet Corn. Janet IPM Support Group, NYS Agricultural
Experiment Station at Geneva, and Michael P. Hoffmann, Department of Entomolgy,
Cornell University. www.nysipm.cornell.edu/factsheets/vegetables/swcorn/
pheromone_tra
ps.pdf. 4pp.
Kovácsová, P., Antalová, M. 2010. Precision forestry–definition and technologies. Šumarski
list, 134 (11-12): 603-610.
Lindgren. B.S., Borden. J.H. 1983. Survey and mass trapping of ambrosia beetl es (Cokoptera
: Scolytidae) in timber processing areas on Vancouver Island . Canadian Journal of Forest
Research 13: 81-93.
Näsi, R., Honkavaara, E., Blomqvist, M., Lyytikäinen-Saarenmaa, P., Hakala, T., Viljanen,
N., Holopainen, M. 2018. Remote sensing of bark beetle damage in urban forests at
individual tree level using a novel hyperspectral camera from UAV and aircraft. Urban
Forestry & Urban Greening, 30:72-83.
Ozcan, G. E., Cicek, O., Enez, K., Yildiz, M. 2014. A new approach to determine the capture
conditions of bark beetles in pheromone-baited traps. Biotechnology & Biotechnological
Equipment, 28(6): 1057-1064.
Özcan GE, Eroğlu M, Alkan-Akıncı H (2011) Use of pheromone-baited traps for monitoring
Ips sexdentatus (Boerner) (Coleoptera: Curculionidae) in oriental spruce stands. Afr J
Biotechnol 10(72): 16351-16360
Özcan, G. E., Çiçek, O., Enez, K., Yildiz, M. 2016. Evaluation of the counting success of
pheromone-baited trap with electronic control unit. Current Science, 111(1): 192-197.
Özcan, G. E., Çіçek, O., Enez, K., Yildiz, M. 2018. A new design of electronic control unit
involving microcontroller to determine important parameters for target species in forest.
Environmental monitoring and assessment, 190(10): 600.
Sayer, J. A., Vanclay, J. K., Byron, N. 1997. Technologies for sustainable forest
management: challenges for the 21st century. The Commonwealth Forestry Review, 162-
170.
Sciarretta, A., Calabrese, P. 2019. Development of automated devices for the monitoring of
insect pests. Current Agriculture Research Journal, 7(1) : 19-25
Safranyik L, Shore T.L, Linton D.A 2004. Measuring trap efficiency for bark beetles (Col.,
Scolytidae). Blacwell Verlag, JEN 128(5) :337–341.
Sagitov, A., Mukhamadiev, N., Ashikbaev, N., Mazarzhanova, K., Bolat, Z., Mendibaeva,
G.,. Abzhanbayev, D., 2016. Pheromone traps application against bark beetles
(Coleoptera: Scolytidae) In Ili-Alatau Mountains. Kastamonu University Journal of
Engineering and Sciences 2(1) :14-20.
Yonker, C.R., 1990. Pheromone trapping applications for monitoring European Elm Bark
beetle populations. Journal of Arboriculture 16(6): 148-152.
FETEC’19 2nd International Symposium of Forest Engineering and Technologies
04-06 September 2019, Tirana
23
Urban Green areas Design, using contemporary Architecture Software–a
case study from Mangalem21 project, Tirana Albania Eneida HASKA1*, Ardita GUSHO2, Kostandina KUMI2, Eva GASHI2, Gerd
MUSTAFARAJ2, Hajri HASKA3
1*Okan University, Architecture and Design Department, Istanbul, Turkey 2Kontakt. Al, Tirana, Albania
3Agriculture University of Tirana, Faculty of Forestry Sciences, 1029 Tirana, Albania
Abstract
The world is getting more and more urbanized. The last decades have been characterized by
increased migration from rural to urban areas, since 2008 and for the first time in history,
more than half of the world’s population lives in towns and cities, and this percentage is
expected to increase up to 70% by 2050. Although cities occupy only 2 percent of the
planet’s surface, their inhabitants use 70% of its natural resources. The same thing is
happening in Albania, where rural population is migrating more and more in towns and cities.
In the early stages of architecture, special attention was given to the structural and panoramic
side of buildings, buildings, roads, squares and other infrastructures, and much less to the
recreation areas such as the green surfaces of the site. Recently due to the large negative
impacts on the environment by the over population of cities, architects and urbanists more
and more are focusing on the aspects of how to incorporate more environmental factors
during the design of new cities or neighbourhoods. Thus, it is intended that during urban
development projects equity proportions be maintained between buildings, roads, sidewalks
and green areas, shrubs, trees or urban forests. And using this theory, during urban project
development, it is given great importance to the relationship between building design and
technology and to what is called Green Infrastructure-GI, (GI is a concept originating in the
US in the mid-1990s that highlights the importance of the natural environment in decisions
about land use planning, or GI can be broadly defined as a strategically planned network of
high quality natural and semi-natural areas with other environmental features, which is
designed and managed to deliver a wide range of ecosystem services and protect biodiversity
in both rural and urban settings. More specifically GI, being a spatial structure providing
benefits from nature to people, aims to enhance nature’s ability to deliver multiple valuable
ecosystem goods and services, such as clean air or water.), using contemporary architectural
engineering programs such as REVIT during their design. More specifically in this paper we
will consider a Case Study realized during the design Project realized by OMA architecture
studio based in Rotterdam, Netherlands, created in 1975 by Rem Koolhaas in collaboration
with Kontak based in Tirana, Albania. The project covers a plot of land in the middle of the
city, bordered by mountains and former communist quarters to the north, and informal
settlements from the 1990s to the south.
Inspired by the charm of the informal settlements, the architecture studio OMA proposed a
chequerboard-like pattern of blocks and courtyards. The sloped terrain allows for every
building to look over the other, creating various views over the surroundings. The
configuration reaches a high density while leaving 70% of the site open for public plazas and
green spaces. The development is car-free and all parking is underground. The main street
running through the development brings together commercial activities and at the same t ime
connects the future Metrobosco green belt and the new ring road planned by the municipality.
The abstract chequerboard pattern turns into a continuous array of habitable spaces by
elaborating the tangent corners into architectural entities. The façades reinterpret Tirana’s use

FETEC’19 2nd International Symposium of Forest Engineering and Technologies
04-06 September 2019, Tirana
24
of colures reinforcing the identity of the blocks. The openings are organized in a system that
uses standardization to create diversity by shifting their position and subdivisions. The roofs
are treated as a fifth facade since the stepping configuration of the development makes them
visible from the upper buildings. The project will be a jewel in the city of Tirana, which will
create a new community with the existing part of the city., where we have a valuable
contribution to the creation of urban environments with features as close as possible to
natural areas by implementing green areas, tree species and forest shrubs, where ecological,
socio-economic and aesthetic criteria, such as species, have been taken into account in their
selection which have aesthetic and biological characteristics as a function of improving urban
environments. The use of contemporary architectural engineering software’s (BIM, REVIT,
Lumion) in the design of green surfaces, trees and urban forests is a very valuable innovation
that we will present and demonstrate during our presentation.
Keywords: Urban area, Architecture, Urban trees, Design, Mangalem 21
1. INTRODUCTION
The world is getting more and more urbanized. The last decades have been characterized by
increased migration from rural to urban areas, since 2008 and for the first time in history,
more than half of the world’s population lives in towns and cities, and this percentage is
expected to increase up to 70% by 2050. Although cities occupy only 2 percent of the
planet’s surface, their inhabitants use 70% of its natural resources.
The study of urban life
The study of urban life and its tendencies
The study of urban life is of particular importance not only because it analyses the
composition of urban society in large cities, but also predicts how these cities will develop.
There have never been so many people living in cities. Never before have cities been as big
as they are today, and never before has there been such a strong movement that it is now
towards urbanization not only in the Americas and Europe, but also in Asia, Latin America,
Africa and the Middle East.
The urban age is now vital throughout the world and can be said to imply the breakdown of
one type of society, unlike what it used to be. Urban society differs from rural society.
2. MATERIAL AND METHODS
2.1. Urban method concept
The part of the inhabitants of a concentrated community and the presence of very large
population centres within a country give the basic meaning of an urban concept. Referring to
Cousins and Nagpaul (A.Causin, H.Nagpaul, and Urban Life) in the US census, four main
categories for the classification of urban populations were identified. These are:
Urban Place
Urbanized Regions
Standard Metropolitan Statistical Regions
Standard Consolidated Regions
The Urban Concept mainly indicates the size and density of a population. Hope Tisdale
(A.Causin, H. Nagpaul, and Urban Life) has defined it simply as the concentration of the
population and as the multiplicity of points of concentration and growth in the number of
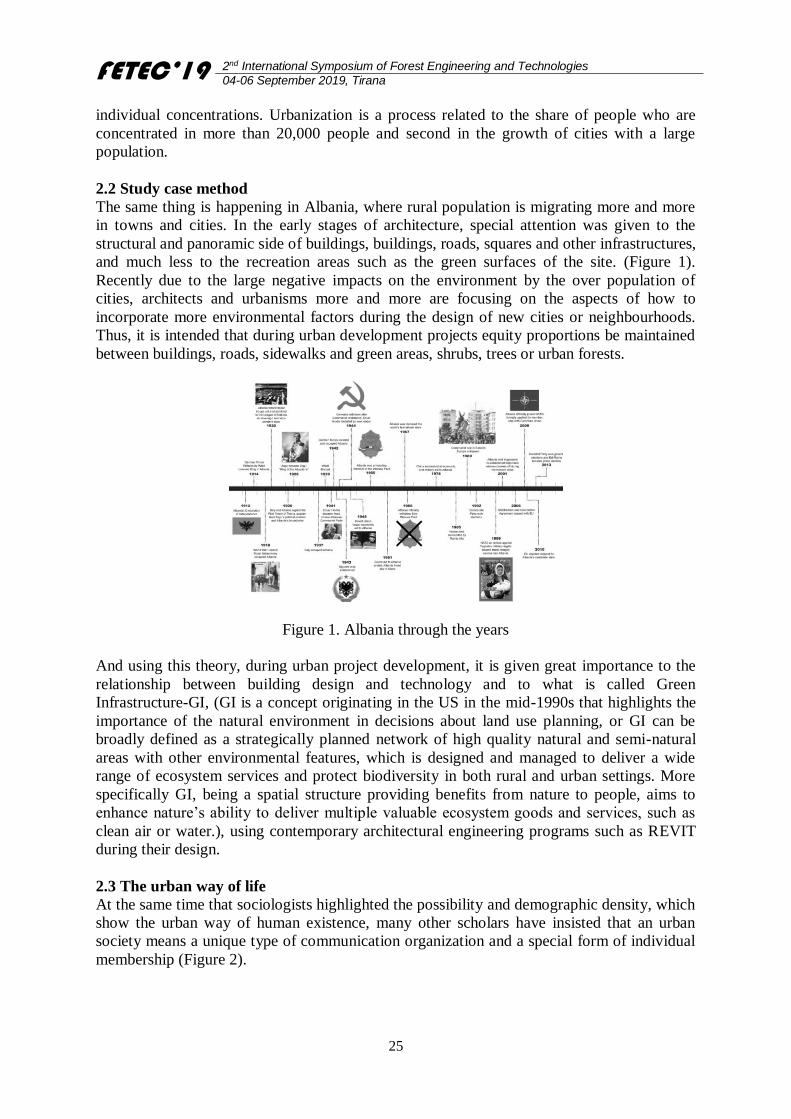
FETEC’19 2nd International Symposium of Forest Engineering and Technologies
04-06 September 2019, Tirana
25
individual concentrations. Urbanization is a process related to the share of people who are
concentrated in more than 20,000 people and second in the growth of cities with a large
population.
2.2 Study case method
The same thing is happening in Albania, where rural population is migrating more and more
in towns and cities. In the early stages of architecture, special attention was given to the
structural and panoramic side of buildings, buildings, roads, squares and other infrastructures,
and much less to the recreation areas such as the green surfaces of the site. (Figure 1).
Recently due to the large negative impacts on the environment by the over population of
cities, architects and urbanisms more and more are focusing on the aspects of how to
incorporate more environmental factors during the design of new cities or neighbourhoods.
Thus, it is intended that during urban development projects equity proportions be maintained
between buildings, roads, sidewalks and green areas, shrubs, trees or urban forests.
Figure 1. Albania through the years
And using this theory, during urban project development, it is given great importance to the
relationship between building design and technology and to what is called Green
Infrastructure-GI, (GI is a concept originating in the US in the mid-1990s that highlights the
importance of the natural environment in decisions about land use planning, or GI can be
broadly defined as a strategically planned network of high quality natural and semi-natural
areas with other environmental features, which is designed and managed to deliver a wide
range of ecosystem services and protect biodiversity in both rural and urban settings. More
specifically GI, being a spatial structure providing benefits from nature to people, aims to
enhance nature’s ability to deliver multiple valuable ecosystem goods and services, such as
clean air or water.), using contemporary architectural engineering programs such as REVIT
during their design.
2.3 The urban way of life
At the same time that sociologists highlighted the possibility and demographic density, which
show the urban way of human existence, many other scholars have insisted that an urban
society means a unique type of communication organization and a special form of individual
membership (Figure 2).
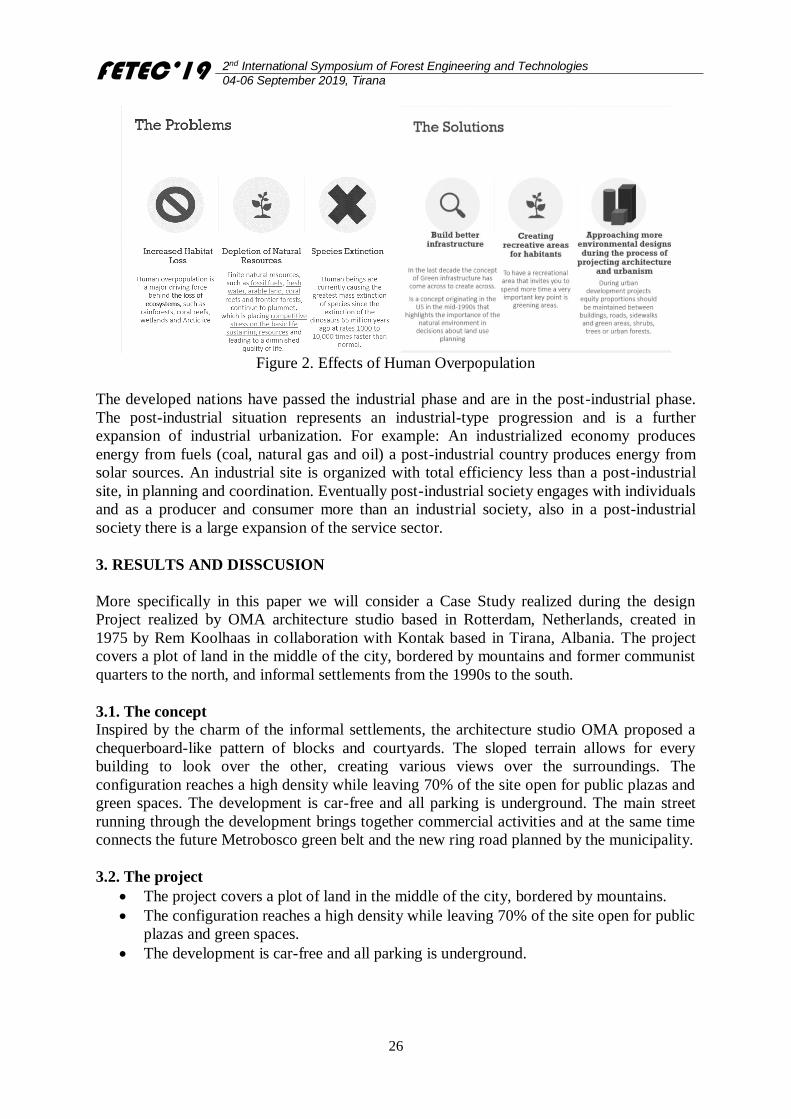
FETEC’19 2nd International Symposium of Forest Engineering and Technologies
04-06 September 2019, Tirana
26
Figure 2. Effects of Human Overpopulation
The developed nations have passed the industrial phase and are in the post-industrial phase.
The post-industrial situation represents an industrial-type progression and is a further
expansion of industrial urbanization. For example: An industrialized economy produces
energy from fuels (coal, natural gas and oil) a post-industrial country produces energy from
solar sources. An industrial site is organized with total efficiency less than a post-industrial
site, in planning and coordination. Eventually post-industrial society engages with individuals
and as a producer and consumer more than an industrial society, also in a post-industrial
society there is a large expansion of the service sector.
3. RESULTS AND DISSCUSION
More specifically in this paper we will consider a Case Study realized during the design
Project realized by OMA architecture studio based in Rotterdam, Netherlands, created in
1975 by Rem Koolhaas in collaboration with Kontak based in Tirana, Albania. The project
covers a plot of land in the middle of the city, bordered by mountains and former communist
quarters to the north, and informal settlements from the 1990s to the south.
3.1. The concept Inspired by the charm of the informal settlements, the architecture studio OMA proposed a
chequerboard-like pattern of blocks and courtyards. The sloped terrain allows for every
building to look over the other, creating various views over the surroundings. The
configuration reaches a high density while leaving 70% of the site open for public plazas and
green spaces. The development is car-free and all parking is underground. The main street
running through the development brings together commercial activities and at the same time
connects the future Metrobosco green belt and the new ring road planned by the municipality.
3.2. The project
The project covers a plot of land in the middle of the city, bordered by mountains.
The configuration reaches a high density while leaving 70% of the site open for public
plazas and green spaces.
The development is car-free and all parking is underground.

FETEC’19 2nd International Symposium of Forest Engineering and Technologies
04-06 September 2019, Tirana
27
Terrain Manipulation Strategies (Figure 3).
Strategy 1: The green spaces as communal gardens
Strategy 2: The spine as a commercial boulevard creating recreation spaces like plazas.
Strategy 3: The parking roof as a flat surface, this system eliminates the dark spaces implied
in a sloped terrain
Figure 3. Terrain Manipulation Strategies
3.3. Strategies
We need to keep in mind some rules on how urban green projecting works to make the design
as convenient as possible:
What should be kept in mind is that all leafy plants should be combined with
coniferous plants and deciduous plants should be combined with leafy plants.
Selection Intensity: They should have little family affinity, in order to exclude
similarity problems and obtain a minimum of individuals adapted to the purpose of
selection. In relation to the former the distance of natural clusters is a reliable
indicator. The closer the trees are, the greater the probability of resemblance between
them due to pollen movement. Trees of large distances on different surfaces exhibit
less family affinity.
Planting distances: 5-6m distance is generally used for the creation of gardens. This
planting distance is called the norm and fits in well with previous practices for
planting land surfaces and is often associated with the evaluation of inter-row soil
care equipment rather than species growth. The final distance between the fruit trees
and the seedlings should be 6-9m
Considering these points several plants were proposed and selected by studying: (Figure 4).
If they were suitable for a steep terrain
Fuit trees type
Slothe types
The age of planting
The periode of planting
If we can build fences with them
For Tirana climate
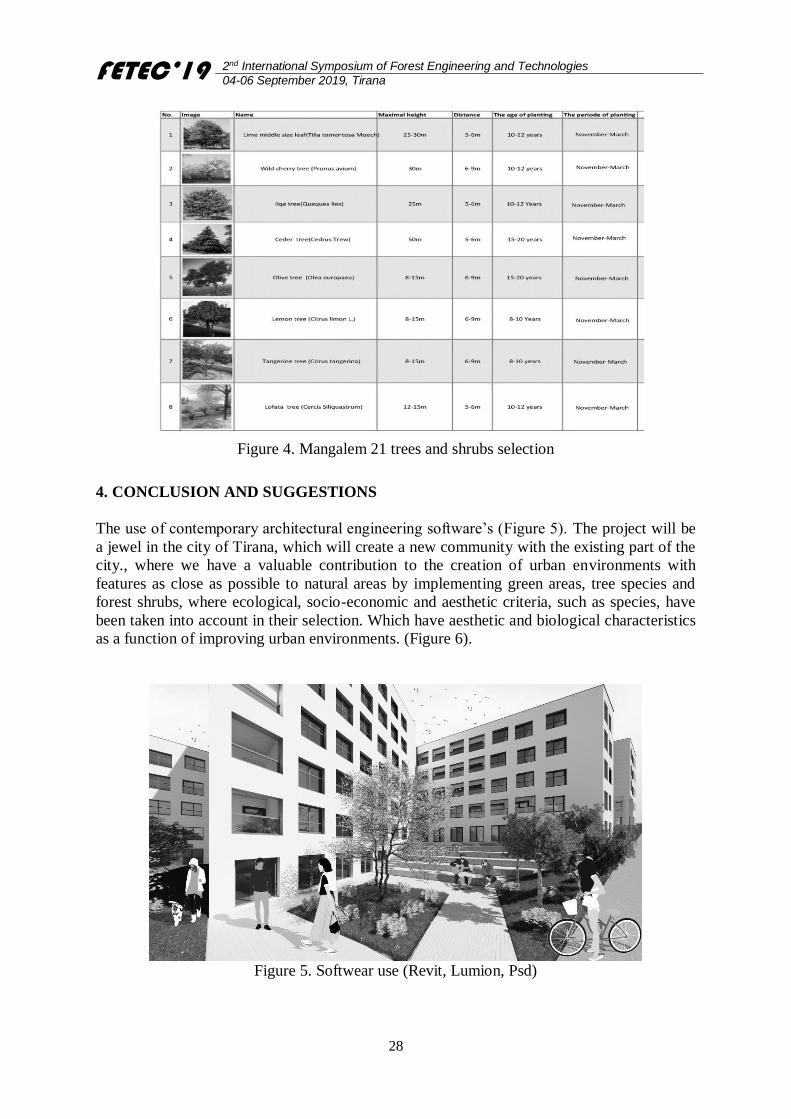
FETEC’19 2nd International Symposium of Forest Engineering and Technologies
04-06 September 2019, Tirana
28
Figure 4. Mangalem 21 trees and shrubs selection
4. CONCLUSION AND SUGGESTIONS
The use of contemporary architectural engineering software’s (Figure 5). The project will be
a jewel in the city of Tirana, which will create a new community with the existing part of the
city., where we have a valuable contribution to the creation of urban environments with
features as close as possible to natural areas by implementing green areas, tree species and
forest shrubs, where ecological, socio-economic and aesthetic criteria, such as species, have
been taken into account in their selection. Which have aesthetic and biological characteristics
as a function of improving urban environments. (Figure 6).
Figure 5. Softwear use (Revit, Lumion, Psd)
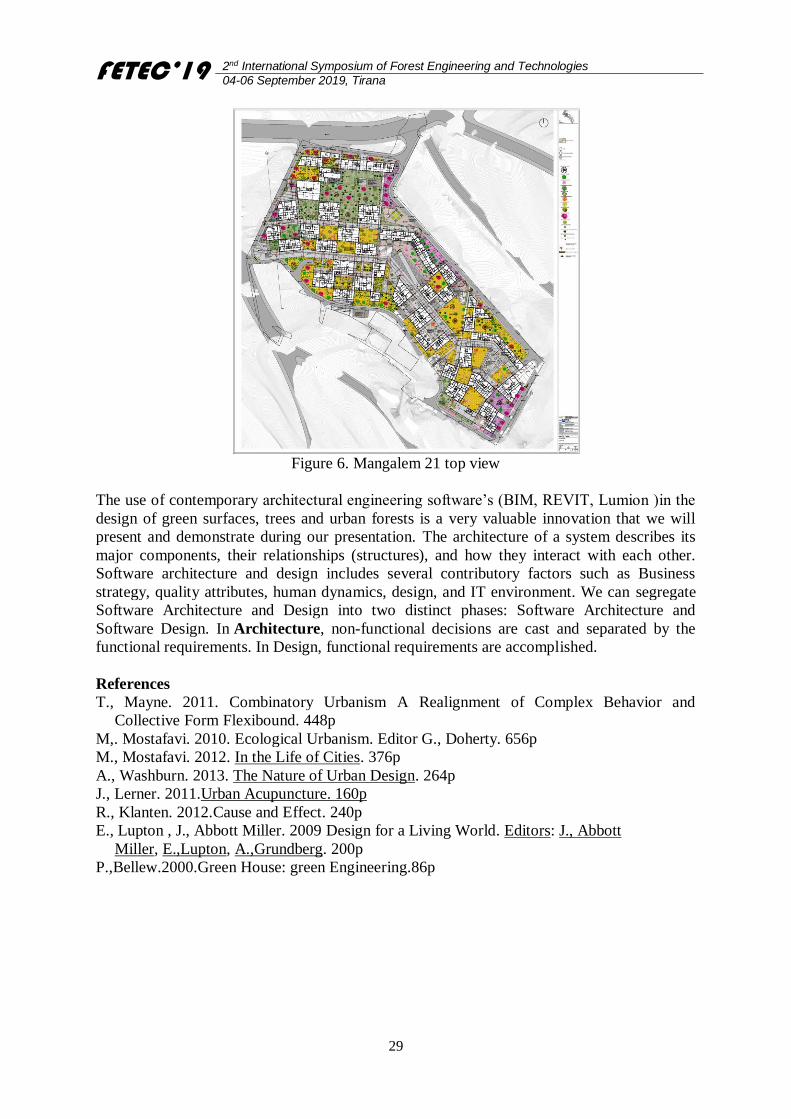
FETEC’19 2nd International Symposium of Forest Engineering and Technologies
04-06 September 2019, Tirana
29
Figure 6. Mangalem 21 top view
The use of contemporary architectural engineering software’s (BIM, REVIT, Lumion )in the
design of green surfaces, trees and urban forests is a very valuable innovation that we will
present and demonstrate during our presentation. The architecture of a system describes its
major components, their relationships (structures), and how they interact with each other.
Software architecture and design includes several contributory factors such as Business
strategy, quality attributes, human dynamics, design, and IT environment. We can segregate
Software Architecture and Design into two distinct phases: Software Architecture and
Software Design. In Architecture, non-functional decisions are cast and separated by the
functional requirements. In Design, functional requirements are accomplished.
References
T., Mayne. 2011. Combinatory Urbanism A Realignment of Complex Behavior and
Collective Form Flexibound. 448p
M,. Mostafavi. 2010. Ecological Urbanism. Editor G., Doherty. 656p
M., Mostafavi. 2012. In the Life of Cities. 376p
A., Washburn. 2013. The Nature of Urban Design. 264p
J., Lerner. 2011.Urban Acupuncture. 160p
R., Klanten. 2012.Cause and Effect. 240p
E., Lupton , J., Abbott Miller. 2009 Design for a Living World. Editors: J., Abbott
Miller, E.,Lupton, A.,Grundberg. 200p
P.,Bellew.2000.Green House: green Engineering.86p
FETEC’19 2nd International Symposium of Forest Engineering and Technologies
04-06 September 2019, Tirana
30
Productivity Analysis of Front-end Loader in Timber Harvesting
Abdullah E. AKAY1*, Ebru BILICI2, İnanç TAŞ1, H. Eren FINDIK1
1Bursa Technical University, Faculty of Forestry, 16310 Bursa, Turkey 2Giresun University, Dereli Vocational School, Giresun, Turkey
Abstract
In this study, the productivity of front-end loader (Liebherr L 514 Stereo), which is one of the
most used mechanized harvesting equipment in the production of forest products, was
analyzed using time-study method. Factors influencing loader productivity were also
evaluated by statistical analysis. Time measurements were carried out during forest
harvesting operations in Topçam Forest Enterprise Chief in the city of Giresun. The results
indicated that the most time-consuming stage of the loading operation was moving loaded to
the logging truck, followed by moving unloaded to the side of the logs. According to the
results, the average productivity of the loader was 34.27 m3/hr. Correlation test results
showed that there was a positive correlation between productivity and log diameter and log
volume, while there was no significant relationship between productivity and log length. The
regression model developed with respect to the loader's productivity and specified log
parameters (i.e. log diameter and log volume) was found to be significant and adequately
explained the productivity of the loader. It was found that there was a significant relation
between loader productivity and diameter classes and volume classes. It was also found that
loader productivity increased as log diameter and log volume increases.
Keywords: Forest harvesting, Mechanized loading, Front-end loader, Productivity
5. INTRODUCTION
The increasing demand of the population and society has increased the pressure on natural
resources, thus the products and services provided from the forests should be planned
effectively and continuously. For this reason, the forests which are among the top natural
resources should be planned considering the optimum efficiency, minimum environmental
impact, and economic factors (Kovácsová and Antalová, 2010). Considering that the need of
the society, especially for wood-based forest products, will increase gradually, it is foreseen
that the inclusion of modern techniques and technological tools and equipment in the work of
forest harvesting will be of increasing importance. Production stages of wood-based forest
products include felling, delimbing, debarking, bucking, timber extracting, loading, hauling,
unloading and stacking (Eker and Acar, 2006). These stages are implemented with different
applications which are developed to reduce costs, simplify the work and ensure the time
efficiently (Coşkun et al., 2010). When modern techniques and technological tools are not put
into practice, they are improperly planned or applied, production stages can be not economic,
take much longer than usual, damage the residual stand and forest soil, and reduce quality of
the product (Akay et al., 2007; Eroğlu, 2012). Loading, which is one of the production stages,
is of great importance in transporting the products reaching from the forests to the landing
without losing time. The efficiency of this stage depends on the harmony of planning of its sub-
phases.
In this study, it was aimed to investigate the performance of mechanical loading operation in
mountainous terrain based on hourly productivity. In this context, precision forestry tools
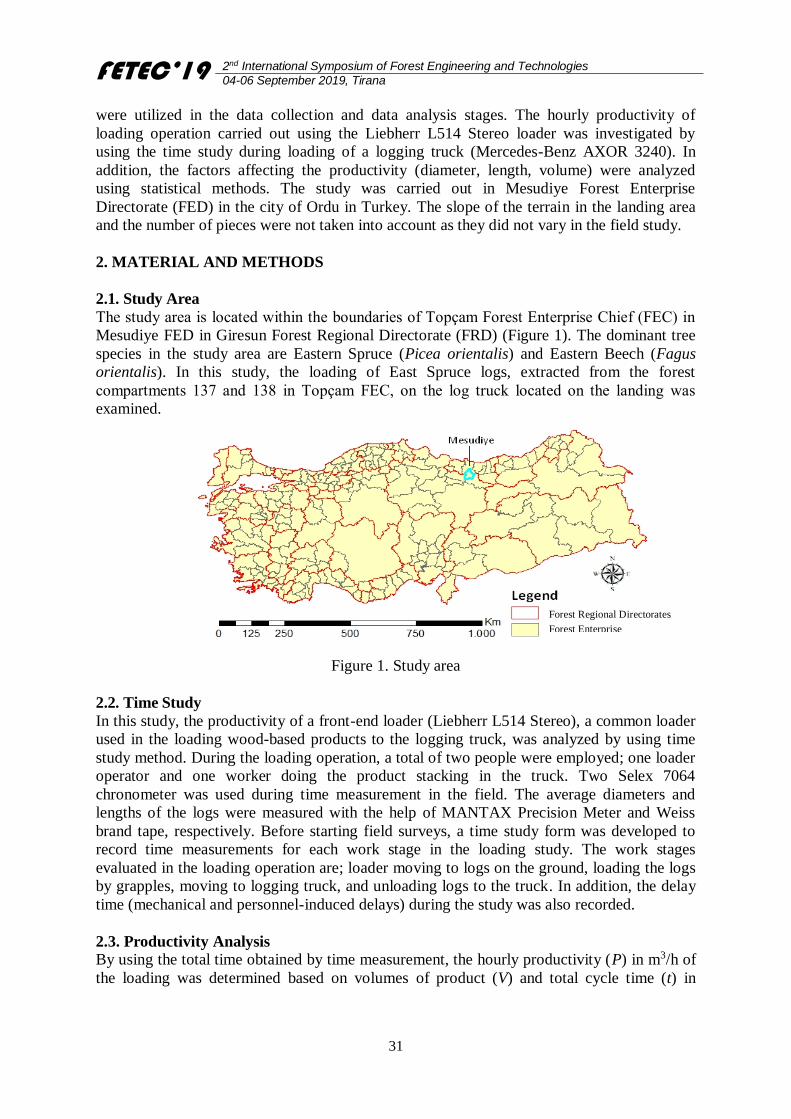
FETEC’19 2nd International Symposium of Forest Engineering and Technologies
04-06 September 2019, Tirana
31
were utilized in the data collection and data analysis stages. The hourly productivity of
loading operation carried out using the Liebherr L514 Stereo loader was investigated by
using the time study during loading of a logging truck (Mercedes-Benz AXOR 3240). In
addition, the factors affecting the productivity (diameter, length, volume) were analyzed
using statistical methods. The study was carried out in Mesudiye Forest Enterprise
Directorate (FED) in the city of Ordu in Turkey. The slope of the terrain in the landing area
and the number of pieces were not taken into account as they did not vary in the field study.
2. MATERIAL AND METHODS
2.1. Study Area
The study area is located within the boundaries of Topçam Forest Enterprise Chief (FEC) in
Mesudiye FED in Giresun Forest Regional Directorate (FRD) (Figure 1). The dominant tree
species in the study area are Eastern Spruce (Picea orientalis) and Eastern Beech (Fagus
orientalis). In this study, the loading of East Spruce logs, extracted from the forest
compartments 137 and 138 in Topçam FEC, on the log truck located on the landing was
examined.
Figure 1. Study area
2.2. Time Study
In this study, the productivity of a front-end loader (Liebherr L514 Stereo), a common loader
used in the loading wood-based products to the logging truck, was analyzed by using time
study method. During the loading operation, a total of two people were employed; one loader
operator and one worker doing the product stacking in the truck. Two Selex 7064
chronometer was used during time measurement in the field. The average diameters and
lengths of the logs were measured with the help of MANTAX Precision Meter and Weiss
brand tape, respectively. Before starting field surveys, a time study form was developed to
record time measurements for each work stage in the loading study. The work stages
evaluated in the loading operation are; loader moving to logs on the ground, loading the logs
by grapples, moving to logging truck, and unloading logs to the truck. In addition, the delay
time (mechanical and personnel-induced delays) during the study was also recorded.
2.3. Productivity Analysis
By using the total time obtained by time measurement, the hourly productivity (P) in m3/h of
the loading was determined based on volumes of product (V) and total cycle time (t) in
Forest Regional Directorates
Forest Enterprise Directorates
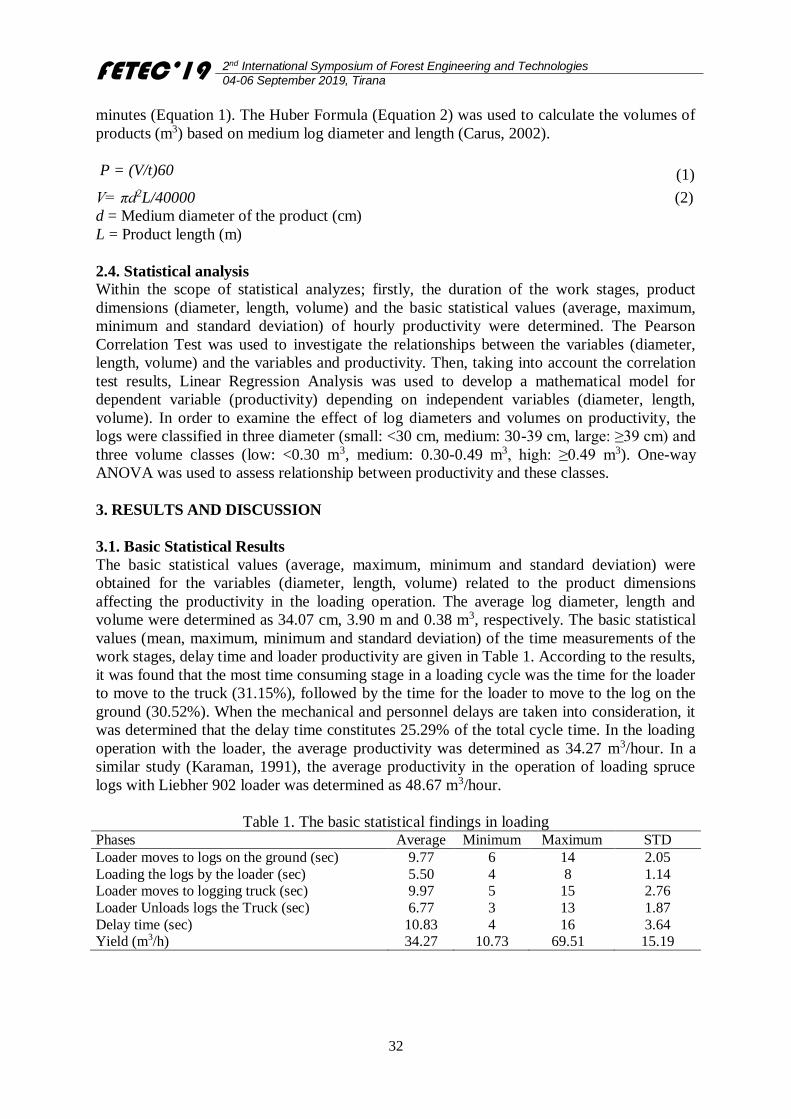
FETEC’19 2nd International Symposium of Forest Engineering and Technologies
04-06 September 2019, Tirana
32
minutes (Equation 1). The Huber Formula (Equation 2) was used to calculate the volumes of
products (m3) based on medium log diameter and length (Carus, 2002).
P = (V/t)60 (1)
V= πd2L/40000 (2)
d = Medium diameter of the product (cm)
L = Product length (m)
2.4. Statistical analysis
Within the scope of statistical analyzes; firstly, the duration of the work stages, product
dimensions (diameter, length, volume) and the basic statistical values (average, maximum,
minimum and standard deviation) of hourly productivity were determined. The Pearson
Correlation Test was used to investigate the relationships between the variables (diameter,
length, volume) and the variables and productivity. Then, taking into account the correlation
test results, Linear Regression Analysis was used to develop a mathematical model for
dependent variable (productivity) depending on independent variables (diameter, length,
volume). In order to examine the effect of log diameters and volumes on productivity, the
logs were classified in three diameter (small: <30 cm, medium: 30-39 cm, large: ≥39 cm) and
three volume classes (low: <0.30 m3, medium: 0.30-0.49 m3, high: ≥0.49 m3). One-way
ANOVA was used to assess relationship between productivity and these classes.
3. RESULTS AND DISCUSSION
3.1. Basic Statistical Results
The basic statistical values (average, maximum, minimum and standard deviation) were
obtained for the variables (diameter, length, volume) related to the product dimensions
affecting the productivity in the loading operation. The average log diameter, length and
volume were determined as 34.07 cm, 3.90 m and 0.38 m3, respectively. The basic statistical
values (mean, maximum, minimum and standard deviation) of the time measurements of the
work stages, delay time and loader productivity are given in Table 1. According to the results,
it was found that the most time consuming stage in a loading cycle was the time for the loader
to move to the truck (31.15%), followed by the time for the loader to move to the log on the
ground (30.52%). When the mechanical and personnel delays are taken into consideration, it
was determined that the delay time constitutes 25.29% of the total cycle time. In the loading
operation with the loader, the average productivity was determined as 34.27 m3/hour. In a
similar study (Karaman, 1991), the average productivity in the operation of loading spruce
logs with Liebher 902 loader was determined as 48.67 m3/hour.
Table 1. The basic statistical findings in loading Phases Average Minimum Maximum STD
Loader moves to logs on the ground (sec) 9.77 6 14 2.05
Loading the logs by the loader (sec) 5.50 4 8 1.14 Loader moves to logging truck (sec) 9.97 5 15 2.76
Loader Unloads logs the Truck (sec) 6.77 3 13 1.87
Delay time (sec) 10.83 4 16 3.64 Yield (m3/h) 34.27 10.73 69.51 15.19
FETEC’19 2nd International Symposium of Forest Engineering and Technologies
04-06 September 2019, Tirana
33
3.2. Correlation between Variables Affecting Productivity
The Pearson Correlation Test was applied to determine the relationships between hourly
productivity and variables (diameter, length, volume) (Table 2). Correlation test results
showed that there was a positive (p<0.001) relationship between log diameter and log volume
and productivity at 99% confidence level.
Table 2. Findings of correlation analysis
Diameter Height Volume Productivity
Pearson correlation
constant
Diameter 1 -0.083 .919** 0.823** Height -0.083 1 0.134 0.141
Volume 0.919** 0.134 1 0.851**
Productivity 0.823** 0.141 0.851** 1
Sig. (2-tailed)
Diameter 0.662 0.000 0.000 Height 0.662 0.479 0.457
Volume 0.000 0.479 0.000
Productivity 0.000 0.457 0.000
There was no significant relationship between log dimensions and productivity at 99%
confidence level (p> 0.5). This is due to the fact that the lengths of the log evaluated in the
study are very close to each other. In similar studies in which the loader's productivity
analysis was carried out, it was stated that log volume and log dimensions were effective
factors on productivity (Kewilaa and Tehupeiory, 2015).
3.3. Regression Analysis Results
Taking into account the correlation test results, Linear Regression Analysis was used to
reveal the relationship between independent variables (diameter and volume) and dependent
variable (productivity). The regression model was found to be significant at 99% confidence
level (p<0.001). The obtained R2 value (0.74) showed that the regression model explained the
loader efficiency sufficiently.
The regression model which includes the dependent variable (y = productivity) and the
independent variables (x1 = diameter; x2 = volume) representing the productivity is shown in
the Equation 3. The developed mathematical model showed that the most influential factor on
productivity was the volume value. The graphs obtained as a result of regression analysis
showed normal distribution.
y = -1.379 + (0.509)x1 +(47.731)x2 (3)
3.4. Diameter Classes Results
In order to examine the effect of measured product diameters on productivity, logs were
divided into three diameter classes (small, medium, and large) according to the standard
diameter classes of General Directorate of Forestry. Then, 0.05 significance level One-Way
Analysis of Variance, using the relationship between the productivity of the diameter classes
were evaluated (Table 3). According to the results obtained yield values increased from small
diameter class, medium and large diameter class increased (Table 4). In a similar study,
Naghdi (2005) stated that the increase in log dimensions increases the productivity in loading
studies. By using Tukey multiple comparison test, yield values of diameter classes were
compared among themselves. According to the results, it was determined that yield values
belonging to diameter classes showed significant differences at 95% confidence level.
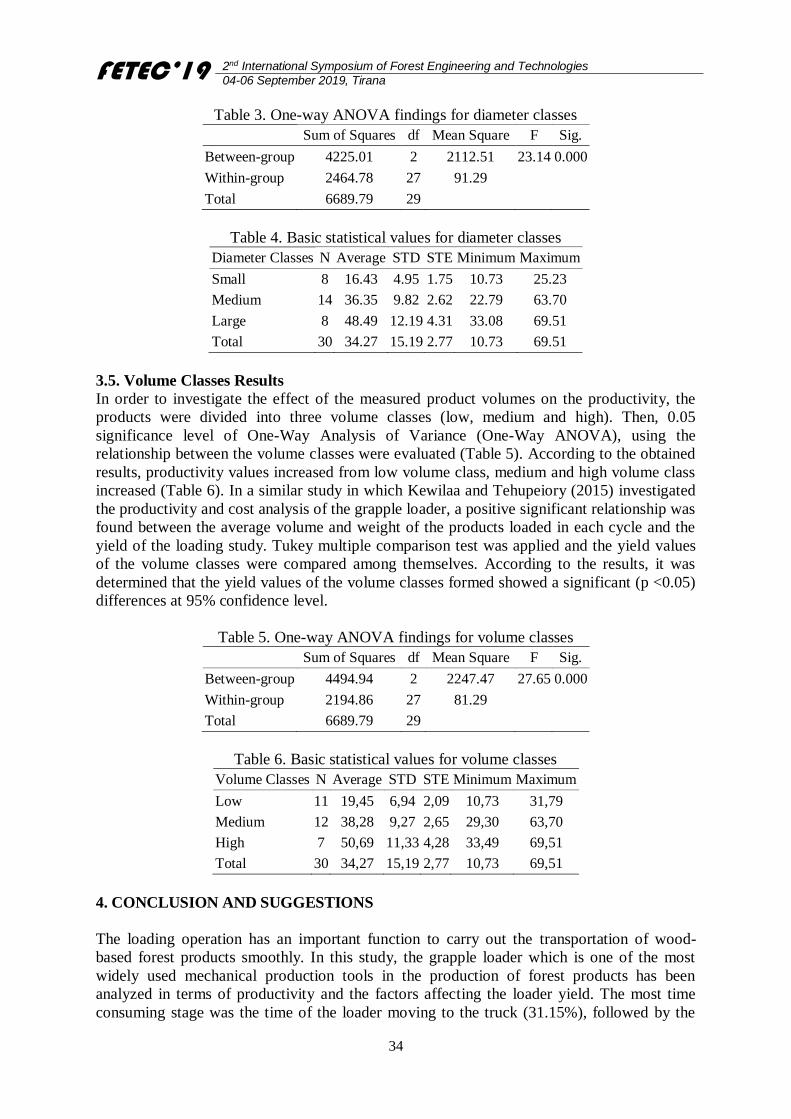
FETEC’19 2nd International Symposium of Forest Engineering and Technologies
04-06 September 2019, Tirana
34
Table 3. One-way ANOVA findings for diameter classes
Sum of Squares df Mean Square F Sig.
Between-group 4225.01 2 2112.51 23.14 0.000
Within-group 2464.78 27 91.29
Total 6689.79 29
Table 4. Basic statistical values for diameter classes
Diameter Classes N Average STD STE Minimum Maximum
Small 8 16.43 4.95 1.75 10.73 25.23
Medium 14 36.35 9.82 2.62 22.79 63.70
Large 8 48.49 12.19 4.31 33.08 69.51
Total 30 34.27 15.19 2.77 10.73 69.51
3.5. Volume Classes Results
In order to investigate the effect of the measured product volumes on the productivity, the
products were divided into three volume classes (low, medium and high). Then, 0.05
significance level of One-Way Analysis of Variance (One-Way ANOVA), using the
relationship between the volume classes were evaluated (Table 5). According to the obtained
results, productivity values increased from low volume class, medium and high volume class
increased (Table 6). In a similar study in which Kewilaa and Tehupeiory (2015) investigated
the productivity and cost analysis of the grapple loader, a positive significant relationship was
found between the average volume and weight of the products loaded in each cycle and the
yield of the loading study. Tukey multiple comparison test was applied and the yield values
of the volume classes were compared among themselves. According to the results, it was
determined that the yield values of the volume classes formed showed a significant (p <0.05)
differences at 95% confidence level.
Table 5. One-way ANOVA findings for volume classes
Sum of Squares df Mean Square F Sig.
Between-group 4494.94 2 2247.47 27.65 0.000
Within-group 2194.86 27 81.29
Total 6689.79 29
Table 6. Basic statistical values for volume classes
Volume Classes N Average STD STE Minimum Maximum
Low 11 19,45 6,94 2,09 10,73 31,79
Medium 12 38,28 9,27 2,65 29,30 63,70
High 7 50,69 11,33 4,28 33,49 69,51
Total 30 34,27 15,19 2,77 10,73 69,51
4. CONCLUSION AND SUGGESTIONS
The loading operation has an important function to carry out the transportation of wood-
based forest products smoothly. In this study, the grapple loader which is one of the most
widely used mechanical production tools in the production of forest products has been
analyzed in terms of productivity and the factors affecting the loader yield. The most time
consuming stage was the time of the loader moving to the truck (31.15%), followed by the
FETEC’19 2nd International Symposium of Forest Engineering and Technologies
04-06 September 2019, Tirana
35
time of the loader moving back to the logs on the ground (30.52%). According to the results,
the average productivity was 34.27 m3/hour. Correlation test results showed that there was a
positive correlation (p <0.001) between log diameter and volume and productivity at 99%
confidence level, whereas there was no significant relationship between log length and
productivity. It was determined that the regression model developed for loader productivity
and log diameter and volume was significant at 99% confidence level (p <0.001) and
explained loader productivity in sufficient level (R2 = 0.74).
In order to carry out the production of forest products effectively, a good harmony between
loading activity and felling, unloading, stacking and hauling is required. Therefore, the use of
high-performance mechanical loaders in the loading will contribute to the success of the
production of forest products. Operator performance is also of key importance for using
loaders with optimum efficiency. Therefore, the necessary theoretical and practical training
should be given to loader operators. The results obtained from this study indicated that it will
be appropriate to investigate the productivity of loaders in different sizes and capacities in
loading various forest products (i.e. industry wood, mining pole, paper wood, etc.).
References
Akay, A.E., Erdaş, O. 2007. Estimating rut depth during skidding with a rubbertired skidder,
SDU Faculty of Forestry Journal, A(1):49-57.
Akay, A.E., Yuksel, A., Reis, M., Tutus, A. 2007. The Impacts of Ground-based Logging
Equipment on Forest Soil, Polish Journal of Environmental Studies, 16(3):371-376.
Aykut T., Öztürk T. 1998. Time investigations an cable yarding and the results obtained, İ.Ü.
Faculty of Forestry Journal, 48:61-73.
Coşkun, K., Eroğlu, H., Özkaya, M.S., Çetiner K., Bilgin F. 2010. An assessment in terms of
mechanization of timber harvesting operations in Artvin Forest Regional Directorate, III
National Blacksea Forestry Congress, 20-22 May, Vol. II, 587-597.
Eker, M., Acar, H.H. 2006. Development of annual operational planning model for timber
harvesting, SDU Journal of Applied Sciences Institute. 10-2:235-248.
Eroğlu, H. 2012. Effects of Different Logging Techniques on Forest Soil Compaction
at Mountainous Terrain, Artvin Çoruh University Faculty of Forestry Journal, 13(2):213-
225.
Karaman, A. 1991. Orman Depolarında Liebher 902 ile Tomruk Yükleme ve İstiflemenin
Zaman, Verim ve Masraf Yönünden Araştırılması, Master Thesis, Trabzon. 103 p. (In
Turkish)
Kewilaa, B., Tehupeiory, A. 2015. Effects of Working Time and the Volume and Weight of
Timber on Productivity of Log Loader Caterpillar Type 966F and WL 980C. Wood
Research Journal. 6(1):8-13.
Kovácsová P., Antalová M. 2010. Precision Forestry - Definition and Technologies. Journal
of ForestrySociety of Croatia, 134(11-12):603-611.
FETEC’19 2nd International Symposium of Forest Engineering and Technologies
04-06 September 2019, Tirana
36
Rural people, governance and forests in Kosovo
Qazim KUKALAJ*
Forestry Independent Expert, Kosova
Abstract
The capacity of Kosovo government institutions to govern the forest sector, including its
ability to monitor developments, and the effectiveness of the action in relation to national
strategies, policies, law enforcement and programs and their translation into real action by
different government institutions and agencies, is inadequate, including insufficient staff
competency and experience. Complicated administrative and management procedures, lack
of compensation of restriction use of private forests, and insufficient capacities to provide
training and services to private forest owners and other interested parties, remains a
significant problem. Overlapping, unclear and contradictory among policies, strategies and
regulations continue to have a negative impact on the right of private forestry owners and
people to use their private property and benefits from natural resources, especially to people
living inside and around naturally protected zones. Inadequate fiscal policies have enhanced
the price of wood material, increased illegal logging, and other forest land damages. The
main purpose of this study is the review and analyses some of the most important barriers in
achieving adequate forest governance on enhancing the rural people employment especially
young people.
Keywords: Restricted land use, land rights recognition, land restitutions
1. INTRODUCTION
Kosovo has a central geographical position in the Balkan Peninsula. It lies between 41°50’58
“and 43°51’42”, north geographical latitude and, 20°01’30” and 21°48’02” east geographical
longitude. Kosovo has total area of 10,908 km², with 1,739,825 inhabitants (residents), but is
one of the most densely populated countries, with an average density of 192 inhabitants
per/km1.It is bordered with Albania (southwest), Macedonia (southeast), Serbia (east, north
and northeast) and Montenegro (west).Based on the aggregate of four quarters, real GDP
growth reached 3.9%. At the same time, Kosovo’s per capita it is the lowest in the region.
Unemployment has fallen slightly from 30.5%to 29.6%, with the high youth unemployment
of 55.4%.2 On the other hand, despite efforts to achieve progress in rural development,
namely implementation of IPARD programs and Kosovo Agriculture Rural Development
Program, no efficient progress has been made with the exception of grants scheme
implementation in some sectors and sub-sectors of agriculture, excluding the forestry sector
and, the assistance of private forest owners. Damages and degradation of natural resources
(forests, agriculture and forest land, water resources, flora and fauna) continues. Private forest
1Source: Agency for Statistics of Kosovo (ASK).
2Source: COMMISSION STAFF WORKING DOCUMENT Kosovo* 2019 Report: Brussels, 29.5.2019
SWD(2019) 216 final
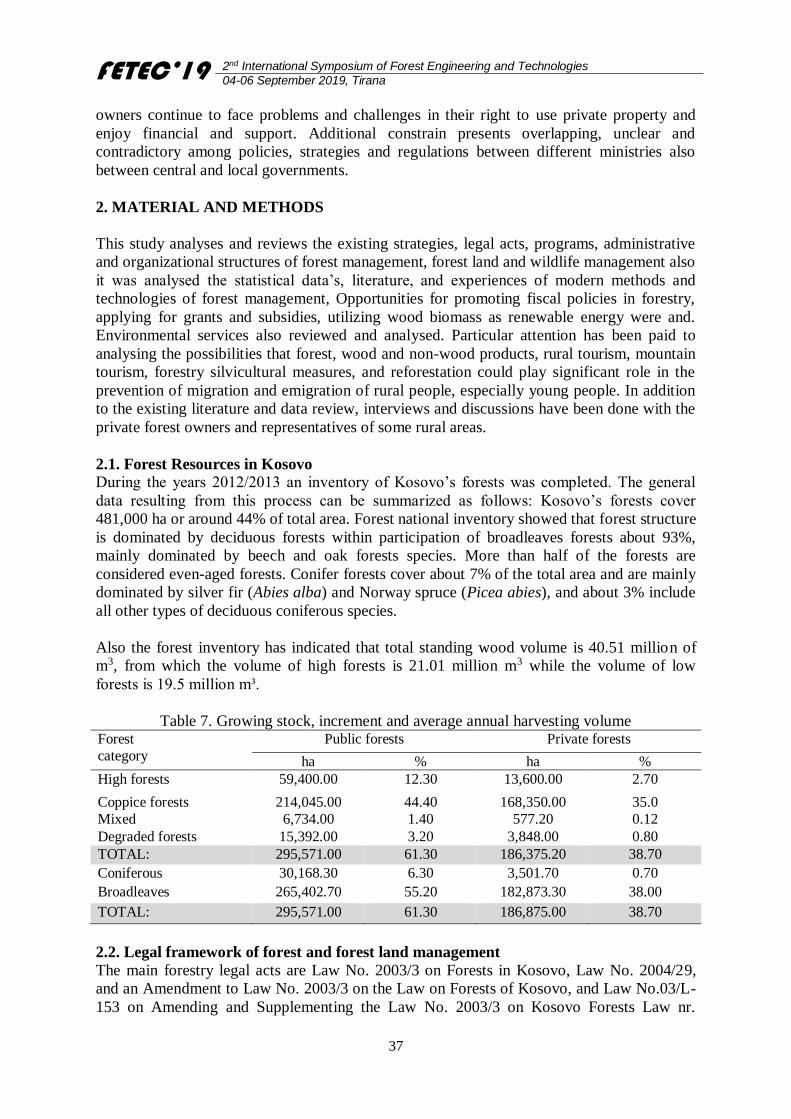
FETEC’19 2nd International Symposium of Forest Engineering and Technologies
04-06 September 2019, Tirana
37
owners continue to face problems and challenges in their right to use private property and
enjoy financial and support. Additional constrain presents overlapping, unclear and
contradictory among policies, strategies and regulations between different ministries also
between central and local governments.
2. MATERIAL AND METHODS
This study analyses and reviews the existing strategies, legal acts, programs, administrative
and organizational structures of forest management, forest land and wildlife management also
it was analysed the statistical data’s, literature, and experiences of modern methods and
technologies of forest management, Opportunities for promoting fiscal policies in forestry,
applying for grants and subsidies, utilizing wood biomass as renewable energy were and.
Environmental services also reviewed and analysed. Particular attention has been paid to
analysing the possibilities that forest, wood and non-wood products, rural tourism, mountain
tourism, forestry silvicultural measures, and reforestation could play significant role in the
prevention of migration and emigration of rural people, especially young people. In addition
to the existing literature and data review, interviews and discussions have been done with the
private forest owners and representatives of some rural areas.
2.1. Forest Resources in Kosovo
During the years 2012/2013 an inventory of Kosovo’s forests was completed. The general
data resulting from this process can be summarized as follows: Kosovo’s forests cover
481,000 ha or around 44% of total area. Forest national inventory showed that forest structure
is dominated by deciduous forests within participation of broadleaves forests about 93%,
mainly dominated by beech and oak forests species. More than half of the forests are
considered even-aged forests. Conifer forests cover about 7% of the total area and are mainly
dominated by silver fir (Abies alba) and Norway spruce (Picea abies), and about 3% include
all other types of deciduous coniferous species.
Also the forest inventory has indicated that total standing wood volume is 40.51 million of
m3, from which the volume of high forests is 21.01 million m3 while the volume of low
forests is 19.5 million m³.
Table 7. Growing stock, increment and average annual harvesting volume Forest
category
Public forests Private forests
ha % ha %
High forests 59,400.00 12.30 13,600.00 2.70
Coppice forests 214,045.00 44.40 168,350.00 35.0
Mixed 6,734.00 1.40 577.20 0.12
Degraded forests 15,392.00 3.20 3,848.00 0.80
TOTAL: 295,571.00 61.30 186,375.20 38.70
Coniferous 30,168.30 6.30 3,501.70 0.70
Broadleaves 265,402.70 55.20 182,873.30 38.00
TOTAL: 295,571.00 61.30 186,875.00 38.70
2.2. Legal framework of forest and forest land management
The main forestry legal acts are Law No. 2003/3 on Forests in Kosovo, Law No. 2004/29,
and an Amendment to Law No. 2003/3 on the Law on Forests of Kosovo, and Law No.03/L-
153 on Amending and Supplementing the Law No. 2003/3 on Kosovo Forests Law nr.
FETEC’19 2nd International Symposium of Forest Engineering and Technologies
04-06 September 2019, Tirana
38
2010/03/-l-233, Nature Protection Law`, National parks laws, Law no. 10/ 03/-L- 163 on
Mines and Minerals, Law no. 2005/02- L – 53 on Hunting, Law no. 2004/13, on Seedling
Material 2004/13, Law no. 2008/03/2004 on Local Self-Governance and other related laws
and numerous administrative instructions.
2.3. Regulatory Overburden
Existing administrative and management structures regulated by legal laws and by laws are
characterized by contradictions and overlapping among different ministries and agencies as
well among central and local governments (municipalities). It is highlighted that the main
problem of responsibilities and mandates has been identified to be between MAFRD, MESP
in administration and management of commercial forest at the two existing national parks
“Bjeshket e Nemuna and" Sharri” which covers an area of 115,957 hectares or 10.60% of the
total area of Kosovo, 90% of the high participation in the country level and around
participation of 40% the total standing tree volume in the Country level and Ministry of
Economic Development (MED) in the administration of mines and minerals.
2.4. Private forest management, tree harvesting and ownership rights
By analysing the legal acts and sub-legal acts it has been found that the right to use private
property is subject to bureaucratic and complicated administrative and technical procedures.
In general the main problems facing private forest owners can be summarized in the
following issues: Complicated procedures of forest harvesting and wood transport, setting
the amount of wood volume that can be harvest, by the KFA, obligation that all trees before
harvesting must be marked and have transport permit issuing by municipal forestry sectors
and other administrative and technical complicated procedures.
An additional problem is the administrative procedures for obtaining a private forest
exploitation permit, which lasts up to 60 days, with a particular emphasis on securing the
property ( ownership) due to the fact that in the most cases the registration of the owner and
heirs of the property / heirs is missing ( has not been done in the cadastral register). Also the
right of hunting and gathering of non-wood forest products on private property is not
completely clarified by legal acts in force. Even more drastic is the use of private property
that lies within national parks, due to the lack of compensation for the restrictions on the use
of private property.
2.5. Weak Social and Environmental Safeguards Related to Developments in Other
Sectors The annual cutting of public forests with only about 50,000 cubic meters, the granting of
annual cutting permits in annual base and for very small areas (1-2 forest compartments) has
resulted in the fact that logging is not financially feasible and there are no interested logger
companies, in profiling and seeing their long-term interest in dealing with the forest
operation. Annual wood volume harvesting in both properties meets the population demand
for fuel wood at only around 14% and even less so, at about 12%, with construction wood.
These facts occurred that existing logging companies have lack of mechanism, professional
staff and experienced skill workers. Situation is similar with the private forest owners, who
use their forests in an unprofessional way, damaging the value of timber assortment and lack
of financial analysis (income and profit). As a result of these impacts, managers of
responsible agencies and of forestry sectors have been hired by political parties and
influenced by politicians without possessing proper education and working experience.
FETEC’19 2nd International Symposium of Forest Engineering and Technologies
04-06 September 2019, Tirana
39
3. RESULTS AND DISCUSSIONS
Based for the above mentioned dates there is an urgent need to isolate the sector from
political interferences, nepotism and regional influences. Also baseline analysis has shown
that responsible government institutions have ignored the complexities of current situations
and their main focus continues to be concentrated at formal issues. The failure to integrate
social, economic and environmental considerations, in some cases has been partially handled
by securing international assistance expertise that has been influenced by the managers of the
Government institutions and certain interest groups closely related to the government
decision makers. Engagement of the local communities has to support integration approach
for managing, protecting, and enhancing forests, forest land, wildlife populations and
habitats. The application of reforestation, collection and processing of aromatic, medicinal
and forest fruits would enable the job opportunities for female living in rural areas in the
same time will ensure the provision of raw material for the production, use and sale of wood
biomass products (wood chips, briquettes and pellets). The promotion of cultural heritage,
traditions, languages and traditional brands, would ensure tourism development and increase
the number of visitors, which would in turn increase income and improve the standard of
living of rural people.
4. CONCLUSIONS AND SUGESSTIONS
As a result of analysis of the situation of forestry sector and based on the data that have been
presented above, the following conclusions can be reached:
Licenses of forest harvesting are based on very small forest areas (some forest
compartments) on an annual basis.
Forest, forest land, wildlife and other natural resources continue to be damaged
despite the prevalence of very strict legal provisions for the punishment of illegal
actions
The Kosovo Forest Agency main incomes generation are concentrated in the leasing
of forest land, and tax collection from quarries, which has caused damage and has
been reflected in the changing of forest land use and also, leaving aside activities of
applying modern technologies and methods of sustainable forest management and
supporting the forestry private owners.
Private forest owners have not been supported by subsidies and grants at the same rate
as the agricultural farmers.
Financial and technical support from international donors has been concentrated
mainly on human capacity building instead of supporting the application of
sustainable forestry management.
The European directives, as well as the regional and world conventions have been well-
defined by legal acts, but in practice still remain unenforceable.
References
Appleton M and Kukalaj Q. 2014, Sharri National Park Management Plan, Project:
Sustainable Land Use Management&Conservation of Biodiversity in Dragash/Dragaš
Municipality, Kosovo, (96), p 66.
Contreras A. People, Forests 2011, Stumbling Blocks in Forest Governance Reform in Latin
America, (199), pages: 169.170.177, 189.
European Commission, 2019. Staff working document Kosovo* Report. (92), page 46.

FETEC’19 2nd International Symposium of Forest Engineering and Technologies
04-06 September 2019, Tirana
40
ENVSEC, Federal Government of Belgium 2009, Illegal Logging in SEE and EE
Governance, (Implementation and Enforcement), Illegal logging activities in Kosovo
(under UNSCR 1244/1999). A FACT FINDING STUDY (28), pages 8, 13, 18, 20.
Kukalaj Q. and Nishori A. Project 2016/2017, Natural Resource Management in Southeast
Europe. (143) page 133:133-143.
Kukalaj Q. 2014. National Forest Program Design in Kosovoa. 15-th IUFRO International
Symposium on Legal Aspects of European Forest Sustainable Development, Symposium
in Tirana, Albania. Page 12, page 5, 6.
Ministry of Agriculture, Forestry and Rural Development 2012. Kosovo National Forest
Inventory. (58), page 25 (table modified).
Ministry of Agriculture, Forestry and Rural Development 2009.Policy and Strategy Paper on
Forestry Sector Development in Kosovo 2010 – 2020. (34) page 17.
FETEC’19 2nd International Symposium of Forest Engineering and Technologies
04-06 September 2019, Tirana
41
How much do forest products contribute to rural household income?
Empirical evidence from three administrative units in Albania
Albora KACANI*, Leonidha PERI
Agriculture University of Tirana, Faculty of Forestry Sciences, 1029 Tirana, Albania
Abstract
Significant data gaps exist in estimating the monetary contributions of forest products in rural
household economy. Therefore, this study attempts to examine the direct economic
contributions of forests in the livelihoods of rural households in three Local Government
Units of Albania. 197 households were randomly selected from Ulëz, Melan and Zerqan
Administrative Units. Using a semi-structured questionnaire data, we estimated the share of
forest income to total household income with the aim to quantify the distribution of other
household activities related to forest. Our results show that the major sources of household
income are off-farm activities, agriculture, livestock and forest products. Income from off-
farm activities is the most important income among sampled households with a share of about
56.6% coming mainly from employment, pensions, family business, remittances and aid, etc.
Livestock income represents the second highest contribution to total household income by
about 17.6% followed by agriculture with 17%. While forest income, accounts for 8.8% of
annual household income. Firewood and nuts represent the majority of family income coming
from the main sources of forest income. Although not high, the contribution of forest may be
substantial for the poorest households, representing up to 16% of their income.
Keywords: monetary contributions, Forest products, Household economy, Semi-structured
questionnaire, Forest income.
1. INTRODUCTION
The importance of forests in improving people's livelihood was stated in the 14th World
Forestry Congress Declaration held in Durban in September 2015. The Congress outlined a
vision for the contribution of forests to achieving the 2030 Agenda for Sustainable
Development by emphasizing among other things that: Forests are more than trees and are
fundamental to food security and improved livelihoods.
About 36% of Albanian’s land area is currently under forest coverage, and the forest is
potentially an important resource for promoting rural livelihood of people living near forest
areas. Rural households in Albania use fuelwood, timber, fodder and other forest products to
meet their family needs contributing therefore directly and indirectly in the family income.
Therefore, there is an interest to examine the contribution that forest and its products make to
rural income. Currently, in Albania there is a knowledge gaps in quantifying the direct
economic contributions of forest in the livelihoods of rural households.
Many studies at global level, which have a focus on forest, found that forest income makes
significant contributions to rural livelihoods (Baral 2008; Agrawal et. al, 2013; Kollert et. al,
2017). According to Wollenberg et al. 1998, estimating the incomes of people whose
livelihoods depend on forests, is key to understanding their wellbeing and use of the forest.
Further, according to Angelsen et al, 2014, the quantification of the relative and absolute
contribution of environmental income to total income portfolios, is the key for understanding
the livelihoods of rural people. Yet the real economic benefits that rural communities derive
FETEC’19 2nd International Symposium of Forest Engineering and Technologies
04-06 September 2019, Tirana
42
from forest extraction are difficult to assess and the estimation methods are not easily applied
(Wollenberg et. al 1998).
2. MATERIAL AND METHODS
2.1. Selection of the study area
The administrative units of Zerqan, Ulëz and Melan of Dibër district were selected for this
study. The following criteria were considered during the selection process: (i) communities
actively engaged in forest governance; (ii) significant forest area transferred to Local
Government Units; (iii) good state of the forests resources; and (iv) existence and
functionality of Forest and Pasture Users Associations (FPUAs).
2.2. Data collection
Primary and secondary data sources were collected for the purpose of this study. Primary data
were collected through household interviews. The household interviews were conducted
using a semi-structured questionnaire. Our sample included a total of 197 households from 31
villages in 3 Administrative Units (37 from Ulëz, 67 from Melan and 93 from Zerqan).
The questionnaire aimed at obtaining comprehensive data on the total household income, on
forest income as well as data on participation in forestry activities. The questionnaire was
used to capture both qualitative and quantitative data and it included four groups of questions:
(i) general information on respondents; (ii) income-generating activities; (iii) forest product
inputs on family income; (iv) participation and decision-making process in the activities of
the FPUA.
Secondary data were collected by reviewing relevant literature, documents and various
national and international reports about the subject of the study. The data collected during the
survey were organized and analyzed using quantitative and qualitative approaches.
2.3. Calculation of annual income
The main objective of the household questionnaire was to collect detailed data on all income
sources, including from agriculture, livestock, off-farm activities, forests and non-timber
forest products. For this study, we have used the gross income during the calculations of the
household annual income. Agriculture income included the value of yield from various crops
grown by the household (without including the production cost).
Livestock income consisted as a summation of cattle sale income, milk income and chicken
income). Income from off-farm activities was calculated as the total value of earnings
through employment, pensions, family business, remittances, state financial assistance. Forest
income, which is the primary focus of this study, includes the income coming from the use
and the sale of forest products (timber and firewood income, fodder and humus income, nuts
income, medicinal and NTFP income). Forest income includes also the cash income coming
from per diems received because of participation in various capacity building activities and
payments from implementation of forest operations through the Forest and Pasture Users
Associations.
3. RESULTS AND DISSCUSION
Income from off-farm activities is the most important income among sampled households
with a share of about 56.6% coming mainly from employment, pensions, family business,
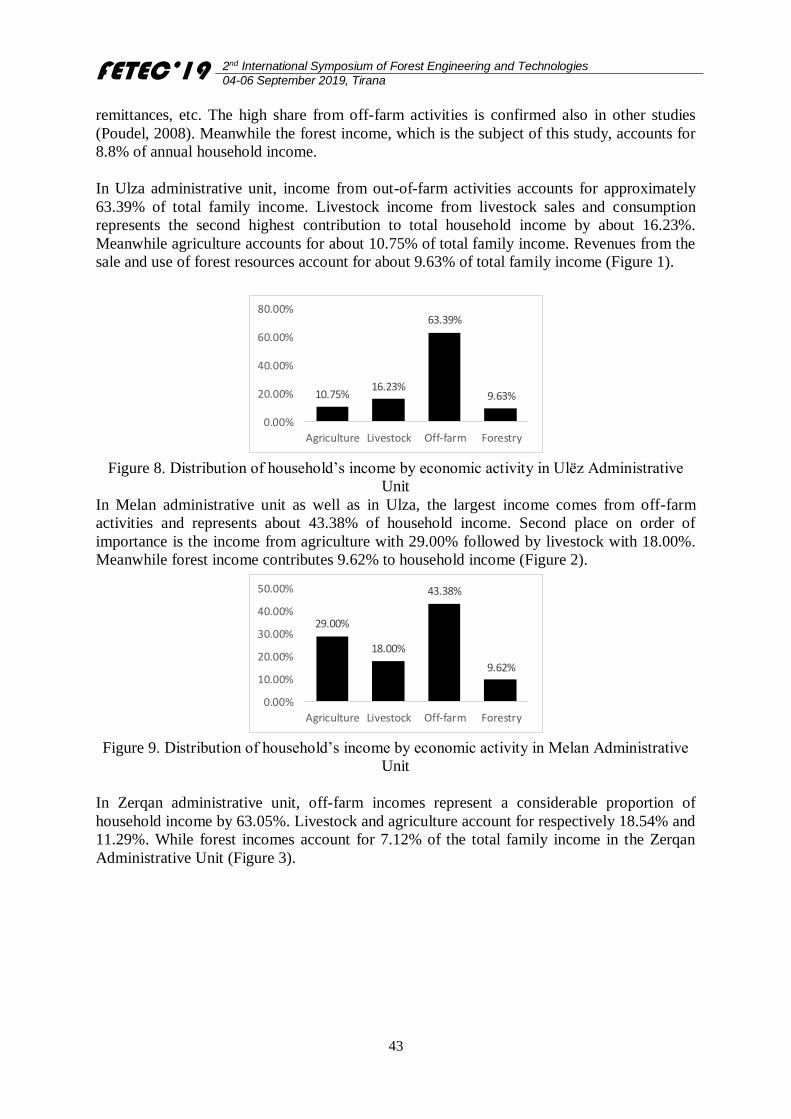
FETEC’19 2nd International Symposium of Forest Engineering and Technologies
04-06 September 2019, Tirana
43
remittances, etc. The high share from off-farm activities is confirmed also in other studies
(Poudel, 2008). Meanwhile the forest income, which is the subject of this study, accounts for
8.8% of annual household income.
In Ulza administrative unit, income from out-of-farm activities accounts for approximately
63.39% of total family income. Livestock income from livestock sales and consumption
represents the second highest contribution to total household income by about 16.23%.
Meanwhile agriculture accounts for about 10.75% of total family income. Revenues from the
sale and use of forest resources account for about 9.63% of total family income (Figure 1).
10.75%16.23%
63.39%
9.63%
0.00%
20.00%
40.00%
60.00%
80.00%
Agriculture Livestock Off-farm Forestry
Figure 8. Distribution of household’s income by economic activity in Ulëz Administrative
Unit
In Melan administrative unit as well as in Ulza, the largest income comes from off-farm
activities and represents about 43.38% of household income. Second place on order of
importance is the income from agriculture with 29.00% followed by livestock with 18.00%.
Meanwhile forest income contributes 9.62% to household income (Figure 2).
29.00%
18.00%
43.38%
9.62%
0.00%
10.00%
20.00%
30.00%
40.00%
50.00%
Agriculture Livestock Off-farm Forestry
Figure 9. Distribution of household’s income by economic activity in Melan Administrative
Unit
In Zerqan administrative unit, off-farm incomes represent a considerable proportion of
household income by 63.05%. Livestock and agriculture account for respectively 18.54% and
11.29%. While forest incomes account for 7.12% of the total family income in the Zerqan
Administrative Unit (Figure 3).
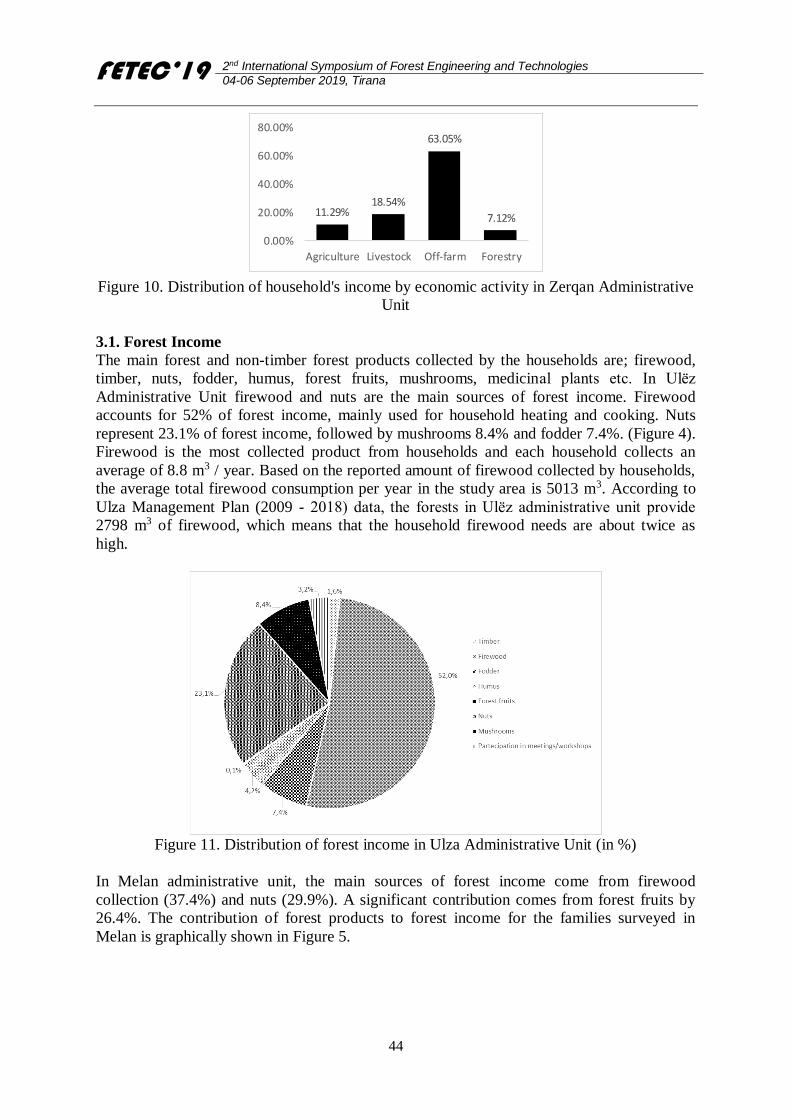
FETEC’19 2nd International Symposium of Forest Engineering and Technologies
04-06 September 2019, Tirana
44
11.29%18.54%
63.05%
7.12%
0.00%
20.00%
40.00%
60.00%
80.00%
Agriculture Livestock Off-farm Forestry
Figure 10. Distribution of household's income by economic activity in Zerqan Administrative
Unit
3.1. Forest Income
The main forest and non-timber forest products collected by the households are; firewood,
timber, nuts, fodder, humus, forest fruits, mushrooms, medicinal plants etc. In Ulëz
Administrative Unit firewood and nuts are the main sources of forest income. Firewood
accounts for 52% of forest income, mainly used for household heating and cooking. Nuts
represent 23.1% of forest income, followed by mushrooms 8.4% and fodder 7.4%. (Figure 4).
Firewood is the most collected product from households and each household collects an
average of 8.8 m3 / year. Based on the reported amount of firewood collected by households,
the average total firewood consumption per year in the study area is 5013 m3. According to
Ulza Management Plan (2009 - 2018) data, the forests in Ulëz administrative unit provide
2798 m3 of firewood, which means that the household firewood needs are about twice as
high.
Figure 11. Distribution of forest income in Ulza Administrative Unit (in %)
In Melan administrative unit, the main sources of forest income come from firewood
collection (37.4%) and nuts (29.9%). A significant contribution comes from forest fruits by
26.4%. The contribution of forest products to forest income for the families surveyed in
Melan is graphically shown in Figure 5.
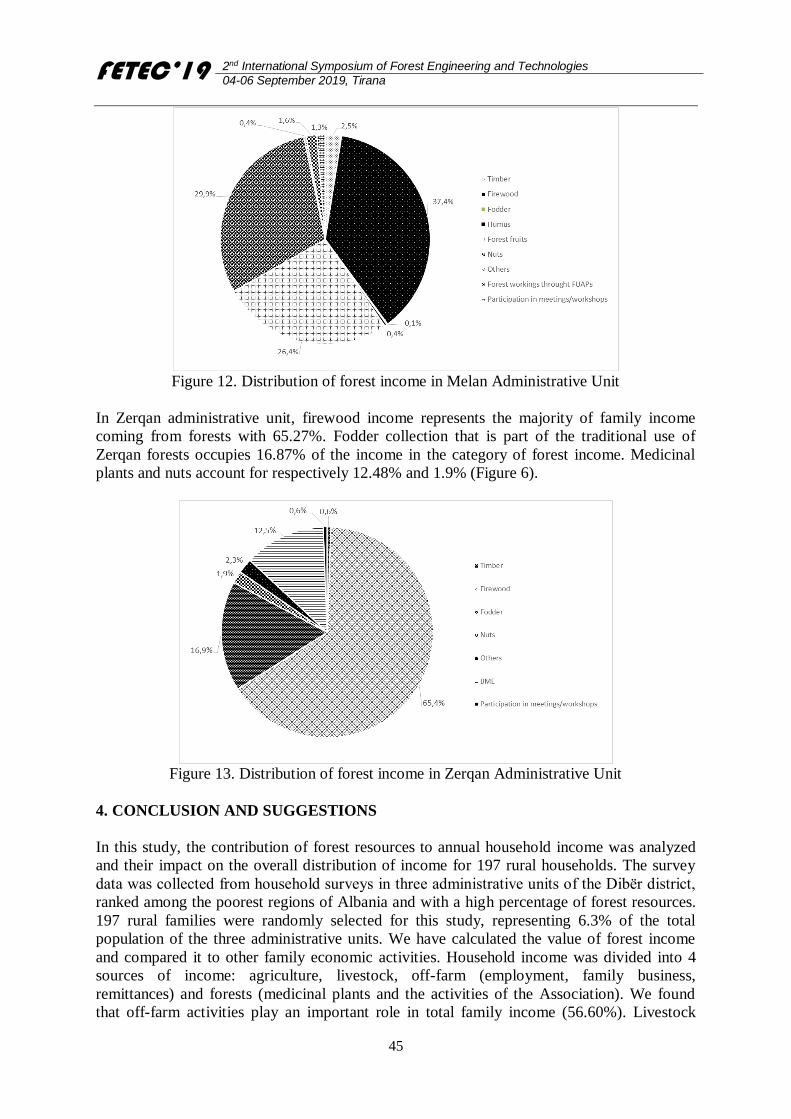
FETEC’19 2nd International Symposium of Forest Engineering and Technologies
04-06 September 2019, Tirana
45
Figure 12. Distribution of forest income in Melan Administrative Unit
In Zerqan administrative unit, firewood income represents the majority of family income
coming from forests with 65.27%. Fodder collection that is part of the traditional use of
Zerqan forests occupies 16.87% of the income in the category of forest income. Medicinal
plants and nuts account for respectively 12.48% and 1.9% (Figure 6).
Figure 13. Distribution of forest income in Zerqan Administrative Unit
4. CONCLUSION AND SUGGESTIONS
In this study, the contribution of forest resources to annual household income was analyzed
and their impact on the overall distribution of income for 197 rural households. The survey
data was collected from household surveys in three administrative units of the Dibër district,
ranked among the poorest regions of Albania and with a high percentage of forest resources.
197 rural families were randomly selected for this study, representing 6.3% of the total
population of the three administrative units. We have calculated the value of forest income
and compared it to other family economic activities. Household income was divided into 4
sources of income: agriculture, livestock, off-farm (employment, family business,
remittances) and forests (medicinal plants and the activities of the Association). We found
that off-farm activities play an important role in total family income (56.60%). Livestock
FETEC’19 2nd International Symposium of Forest Engineering and Technologies
04-06 September 2019, Tirana
46
(17.59%) occupies the second share in total family income, followed by agriculture (17.01%).
However, being a rural area rich in forest resources, the forest contribution to the three
administrative units is important for total rural household income (about 8.8%) and plays a
role in reducing inequality. So, on average, surveyed households receive about 8.8% of their
income from forests. Firewood and nuts represent the majority of family income coming from
the main sources of forest income. Although not high, the contribution of forest may be
substantial for the poorest households, representing up to 16% of their income.
References
Angelsen A, Jagger P, Babigumira R, Belcher B, Hogarth N, Bauch S, Borner J, Smith-Hall
C, Wunder ,. 2014. Environmental Income and Rural Livelihoods: A Global-Comparative
Analysis. World Development, 64:12–28.
Poudel B. 2008. Income Generating activities of community forest User Group in Nepal.
Agrawal A, Cashore B, Hardin R, Shepherd G, Benson C, Miller D. 2013. Economic
contributions of forests. Background Paper 1, United Nations Forum for Tenth Session 8–
19 April 2013. p. 1–127.
Wollenberg E, Nawir AS.1998. Estimating the Incomes of People Who Depend on Forests.
Chapter 8. In: Incomes from the Forest, Methods for the development and conservationof
forest products for local communities. Edited by Eva Wollenberg and Andrew Ingles.
Center for International Forestry Research.
Baral S. 2008. Contribution of Community Forestry to Rural Households: An Economic
Analysis. M.Sc. Thesis. Universitaet fuer Bodenkultur, Wien, Austria.
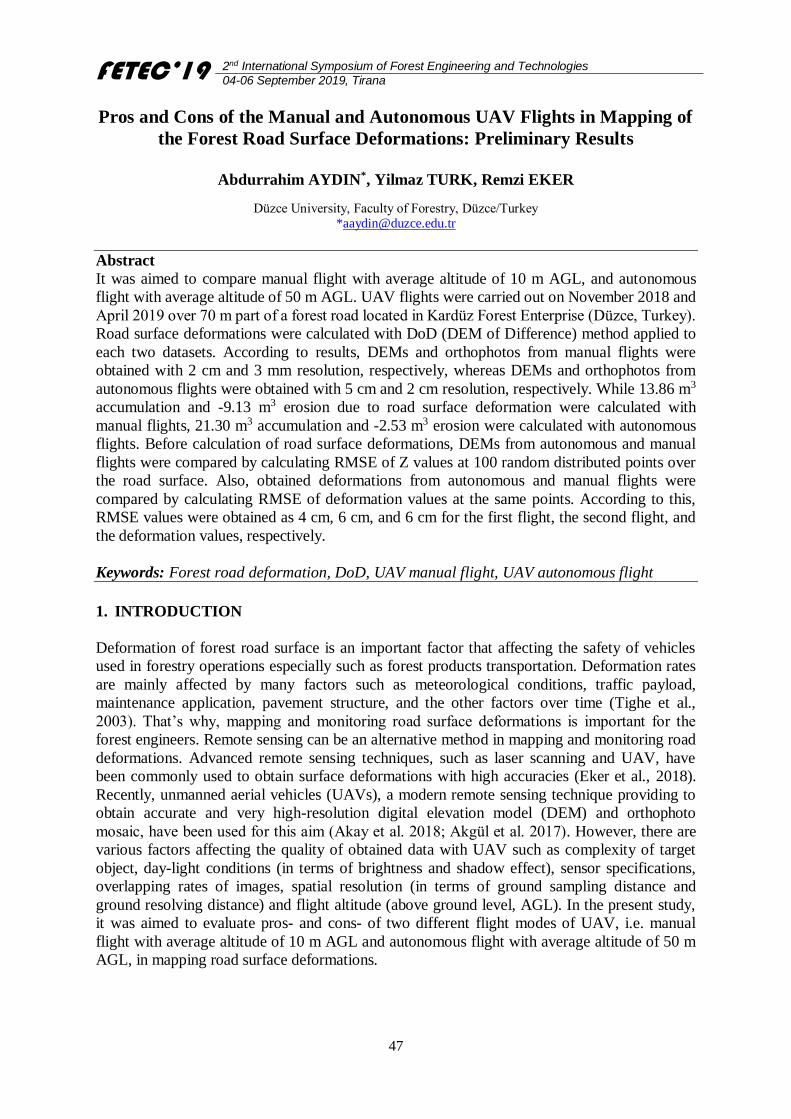
FETEC’19 2nd International Symposium of Forest Engineering and Technologies
04-06 September 2019, Tirana
47
Pros and Cons of the Manual and Autonomous UAV Flights in Mapping of
the Forest Road Surface Deformations: Preliminary Results
Abdurrahim AYDIN*, Yilmaz TURK, Remzi EKER
Düzce University, Faculty of Forestry, Düzce/Turkey *[email protected]
Abstract
It was aimed to compare manual flight with average altitude of 10 m AGL, and autonomous
flight with average altitude of 50 m AGL. UAV flights were carried out on November 2018 and
April 2019 over 70 m part of a forest road located in Kardüz Forest Enterprise (Düzce, Turkey).
Road surface deformations were calculated with DoD (DEM of Difference) method applied to
each two datasets. According to results, DEMs and orthophotos from manual flights were
obtained with 2 cm and 3 mm resolution, respectively, whereas DEMs and orthophotos from
autonomous flights were obtained with 5 cm and 2 cm resolution, respectively. While 13.86 m3
accumulation and -9.13 m3 erosion due to road surface deformation were calculated with
manual flights, 21.30 m3 accumulation and -2.53 m3 erosion were calculated with autonomous
flights. Before calculation of road surface deformations, DEMs from autonomous and manual
flights were compared by calculating RMSE of Z values at 100 random distributed points over
the road surface. Also, obtained deformations from autonomous and manual flights were
compared by calculating RMSE of deformation values at the same points. According to this,
RMSE values were obtained as 4 cm, 6 cm, and 6 cm for the first flight, the second flight, and
the deformation values, respectively.
Keywords: Forest road deformation, DoD, UAV manual flight, UAV autonomous flight
1. INTRODUCTION
Deformation of forest road surface is an important factor that affecting the safety of vehicles
used in forestry operations especially such as forest products transportation. Deformation rates
are mainly affected by many factors such as meteorological conditions, traffic payload,
maintenance application, pavement structure, and the other factors over time (Tighe et al.,
2003). That’s why, mapping and monitoring road surface deformations is important for the
forest engineers. Remote sensing can be an alternative method in mapping and monitoring road
deformations. Advanced remote sensing techniques, such as laser scanning and UAV, have
been commonly used to obtain surface deformations with high accuracies (Eker et al., 2018).
Recently, unmanned aerial vehicles (UAVs), a modern remote sensing technique providing to
obtain accurate and very high-resolution digital elevation model (DEM) and orthophoto
mosaic, have been used for this aim (Akay et al. 2018; Akgül et al. 2017). However, there are
various factors affecting the quality of obtained data with UAV such as complexity of target
object, day-light conditions (in terms of brightness and shadow effect), sensor specifications,
overlapping rates of images, spatial resolution (in terms of ground sampling distance and
ground resolving distance) and flight altitude (above ground level, AGL). In the present study,
it was aimed to evaluate pros- and cons- of two different flight modes of UAV, i.e. manual
flight with average altitude of 10 m AGL and autonomous flight with average altitude of 50 m
AGL, in mapping road surface deformations.
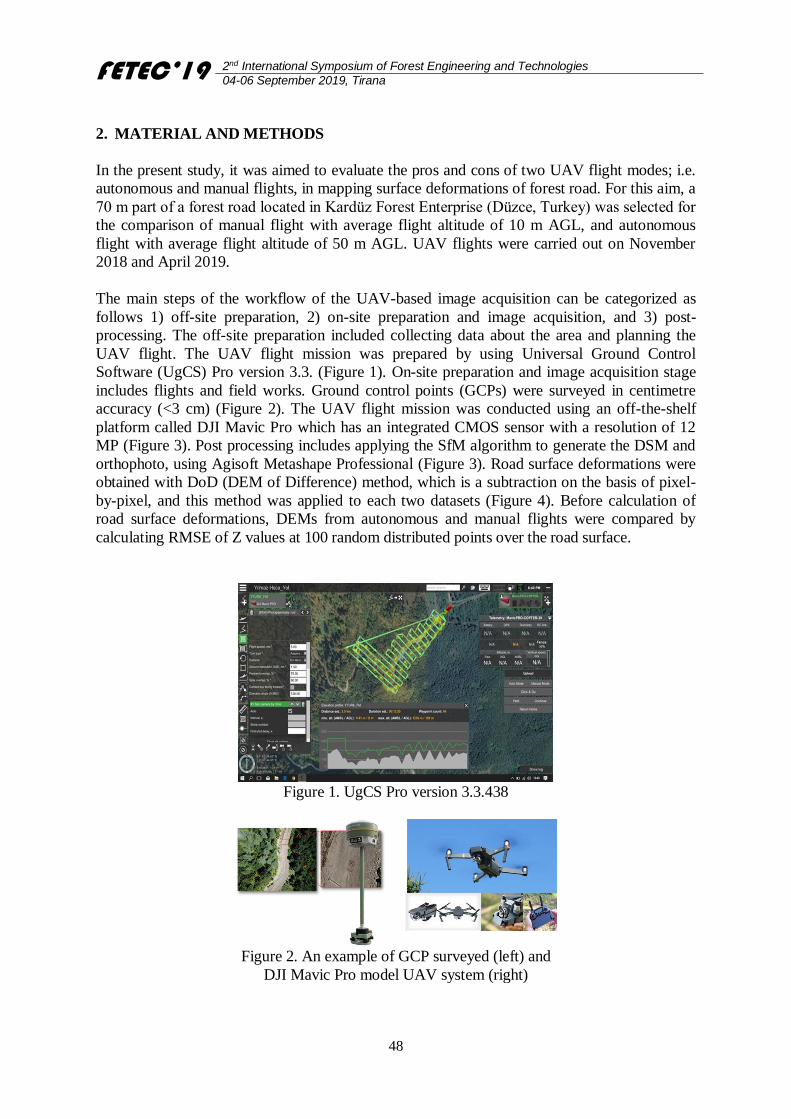
FETEC’19 2nd International Symposium of Forest Engineering and Technologies
04-06 September 2019, Tirana
48
2. MATERIAL AND METHODS
In the present study, it was aimed to evaluate the pros and cons of two UAV flight modes; i.e.
autonomous and manual flights, in mapping surface deformations of forest road. For this aim, a
70 m part of a forest road located in Kardüz Forest Enterprise (Düzce, Turkey) was selected for
the comparison of manual flight with average flight altitude of 10 m AGL, and autonomous
flight with average flight altitude of 50 m AGL. UAV flights were carried out on November
2018 and April 2019.
The main steps of the workflow of the UAV-based image acquisition can be categorized as
follows 1) off-site preparation, 2) on-site preparation and image acquisition, and 3) post-
processing. The off-site preparation included collecting data about the area and planning the
UAV flight. The UAV flight mission was prepared by using Universal Ground Control
Software (UgCS) Pro version 3.3. (Figure 1). On-site preparation and image acquisition stage
includes flights and field works. Ground control points (GCPs) were surveyed in centimetre
accuracy (<3 cm) (Figure 2). The UAV flight mission was conducted using an off-the-shelf
platform called DJI Mavic Pro which has an integrated CMOS sensor with a resolution of 12
MP (Figure 3). Post processing includes applying the SfM algorithm to generate the DSM and
orthophoto, using Agisoft Metashape Professional (Figure 3). Road surface deformations were
obtained with DoD (DEM of Difference) method, which is a subtraction on the basis of pixel-
by-pixel, and this method was applied to each two datasets (Figure 4). Before calculation of
road surface deformations, DEMs from autonomous and manual flights were compared by
calculating RMSE of Z values at 100 random distributed points over the road surface.
Figure 1. UgCS Pro version 3.3.438
Figure 2. An example of GCP surveyed (left) and
DJI Mavic Pro model UAV system (right)
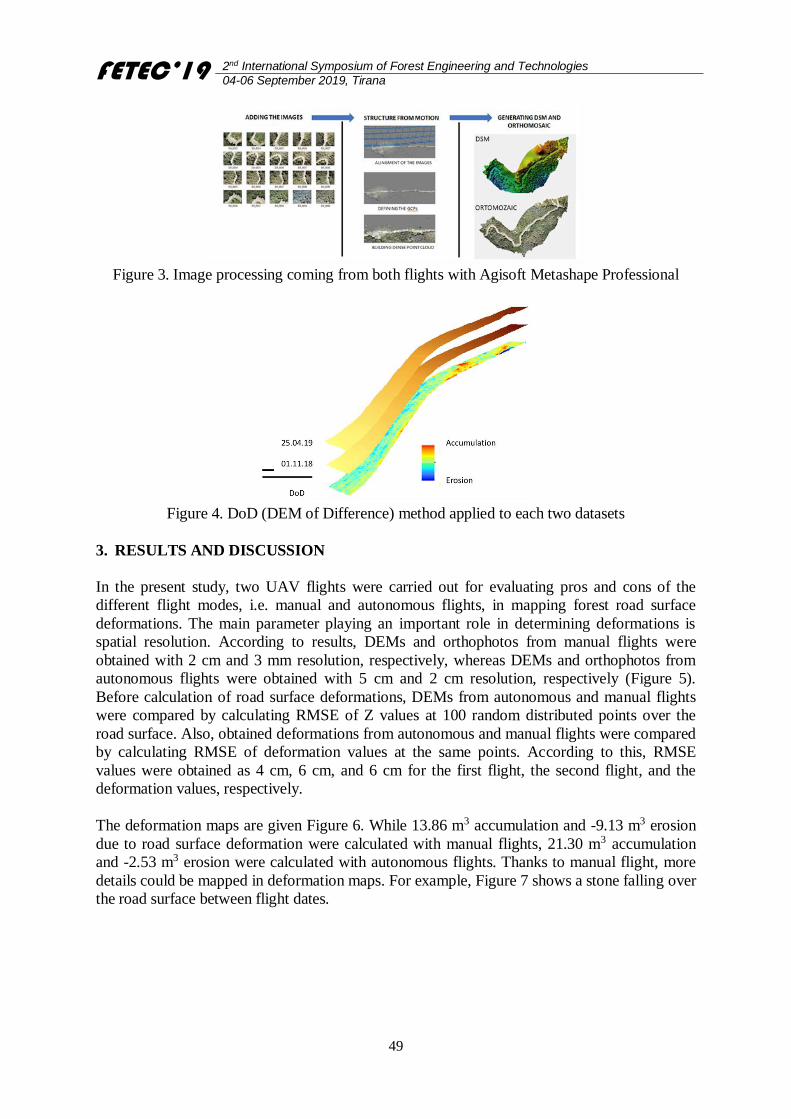
FETEC’19 2nd International Symposium of Forest Engineering and Technologies
04-06 September 2019, Tirana
49
Figure 3. Image processing coming from both flights with Agisoft Metashape Professional
Figure 4. DoD (DEM of Difference) method applied to each two datasets
3. RESULTS AND DISCUSSION
In the present study, two UAV flights were carried out for evaluating pros and cons of the
different flight modes, i.e. manual and autonomous flights, in mapping forest road surface
deformations. The main parameter playing an important role in determining deformations is
spatial resolution. According to results, DEMs and orthophotos from manual flights were
obtained with 2 cm and 3 mm resolution, respectively, whereas DEMs and orthophotos from
autonomous flights were obtained with 5 cm and 2 cm resolution, respectively (Figure 5).
Before calculation of road surface deformations, DEMs from autonomous and manual flights
were compared by calculating RMSE of Z values at 100 random distributed points over the
road surface. Also, obtained deformations from autonomous and manual flights were compared
by calculating RMSE of deformation values at the same points. According to this, RMSE
values were obtained as 4 cm, 6 cm, and 6 cm for the first flight, the second flight, and the
deformation values, respectively.
The deformation maps are given Figure 6. While 13.86 m3 accumulation and -9.13 m3 erosion
due to road surface deformation were calculated with manual flights, 21.30 m3 accumulation
and -2.53 m3 erosion were calculated with autonomous flights. Thanks to manual flight, more
details could be mapped in deformation maps. For example, Figure 7 shows a stone falling over
the road surface between flight dates.
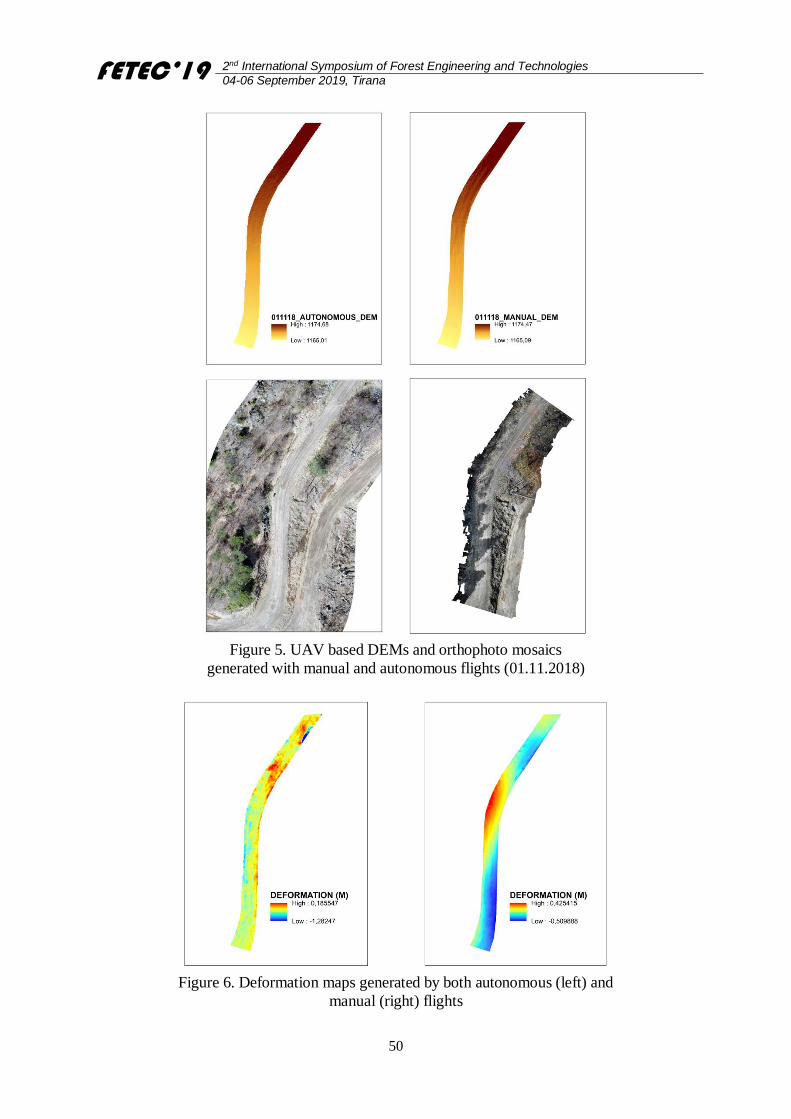
FETEC’19 2nd International Symposium of Forest Engineering and Technologies
04-06 September 2019, Tirana
50
Figure 5. UAV based DEMs and orthophoto mosaics
generated with manual and autonomous flights (01.11.2018)
Figure 6. Deformation maps generated by both autonomous (left) and
manual (right) flights
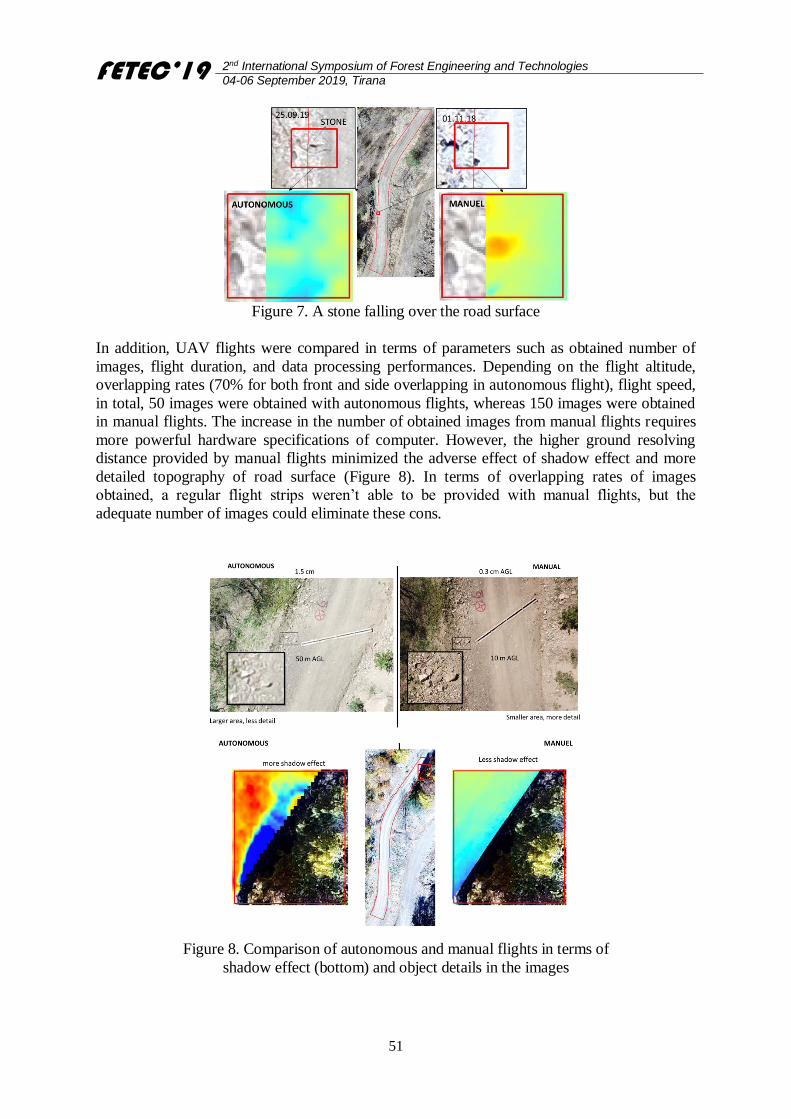
FETEC’19 2nd International Symposium of Forest Engineering and Technologies
04-06 September 2019, Tirana
51
Figure 7. A stone falling over the road surface
In addition, UAV flights were compared in terms of parameters such as obtained number of
images, flight duration, and data processing performances. Depending on the flight altitude,
overlapping rates (70% for both front and side overlapping in autonomous flight), flight speed,
in total, 50 images were obtained with autonomous flights, whereas 150 images were obtained
in manual flights. The increase in the number of obtained images from manual flights requires
more powerful hardware specifications of computer. However, the higher ground resolving
distance provided by manual flights minimized the adverse effect of shadow effect and more
detailed topography of road surface (Figure 8). In terms of overlapping rates of images
obtained, a regular flight strips weren’t able to be provided with manual flights, but the
adequate number of images could eliminate these cons.
Figure 8. Comparison of autonomous and manual flights in terms of
shadow effect (bottom) and object details in the images
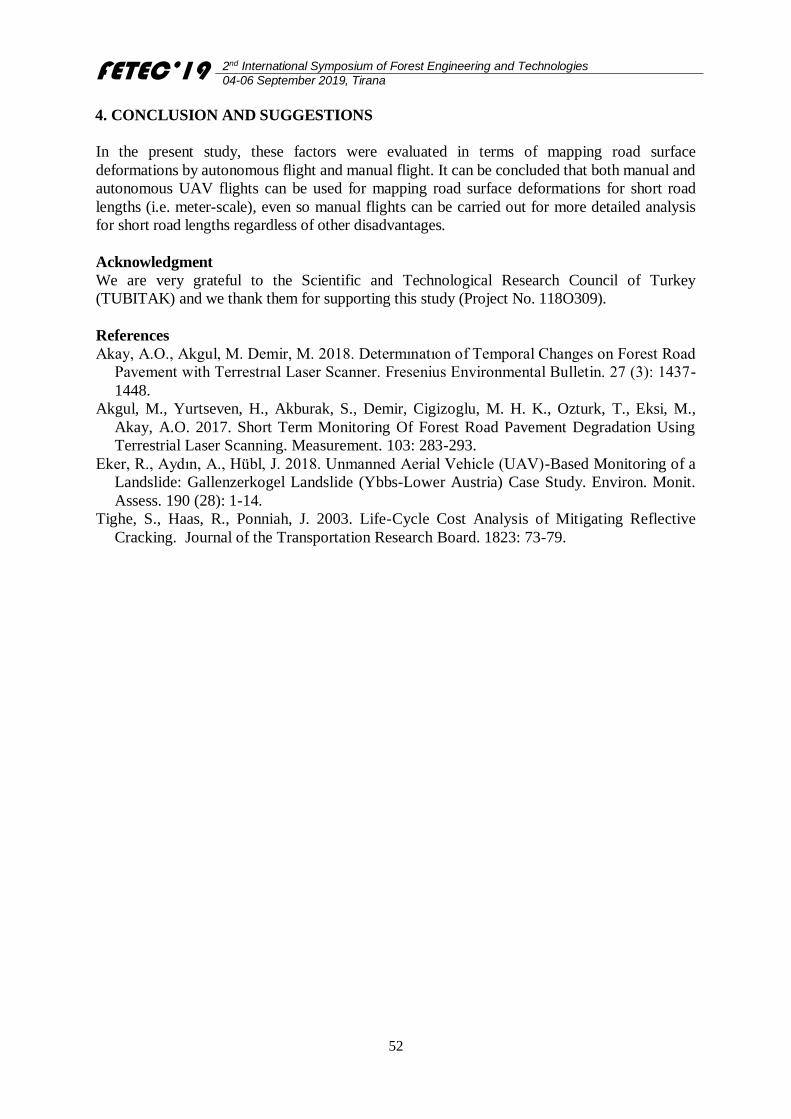
FETEC’19 2nd International Symposium of Forest Engineering and Technologies
04-06 September 2019, Tirana
52
4. CONCLUSION AND SUGGESTIONS
In the present study, these factors were evaluated in terms of mapping road surface
deformations by autonomous flight and manual flight. It can be concluded that both manual and
autonomous UAV flights can be used for mapping road surface deformations for short road
lengths (i.e. meter-scale), even so manual flights can be carried out for more detailed analysis
for short road lengths regardless of other disadvantages.
Acknowledgment
We are very grateful to the Scientific and Technological Research Council of Turkey
(TUBITAK) and we thank them for supporting this study (Project No. 118O309).
References
Akay, A.O., Akgul, M. Demir, M. 2018. Determınatıon of Temporal Changes on Forest Road
Pavement with Terrestrıal Laser Scanner. Fresenius Environmental Bulletin. 27 (3): 1437-
1448.
Akgul, M., Yurtseven, H., Akburak, S., Demir, Cigizoglu, M. H. K., Ozturk, T., Eksi, M.,
Akay, A.O. 2017. Short Term Monitoring Of Forest Road Pavement Degradation Using
Terrestrial Laser Scanning. Measurement. 103: 283-293.
Eker, R., Aydın, A., Hübl, J. 2018. Unmanned Aerial Vehicle (UAV)-Based Monitoring of a
Landslide: Gallenzerkogel Landslide (Ybbs-Lower Austria) Case Study. Environ. Monit.
Assess. 190 (28): 1-14.
Tighe, S., Haas, R., Ponniah, J. 2003. Life-Cycle Cost Analysis of Mitigating Reflective
Cracking. Journal of the Transportation Research Board. 1823: 73-79.
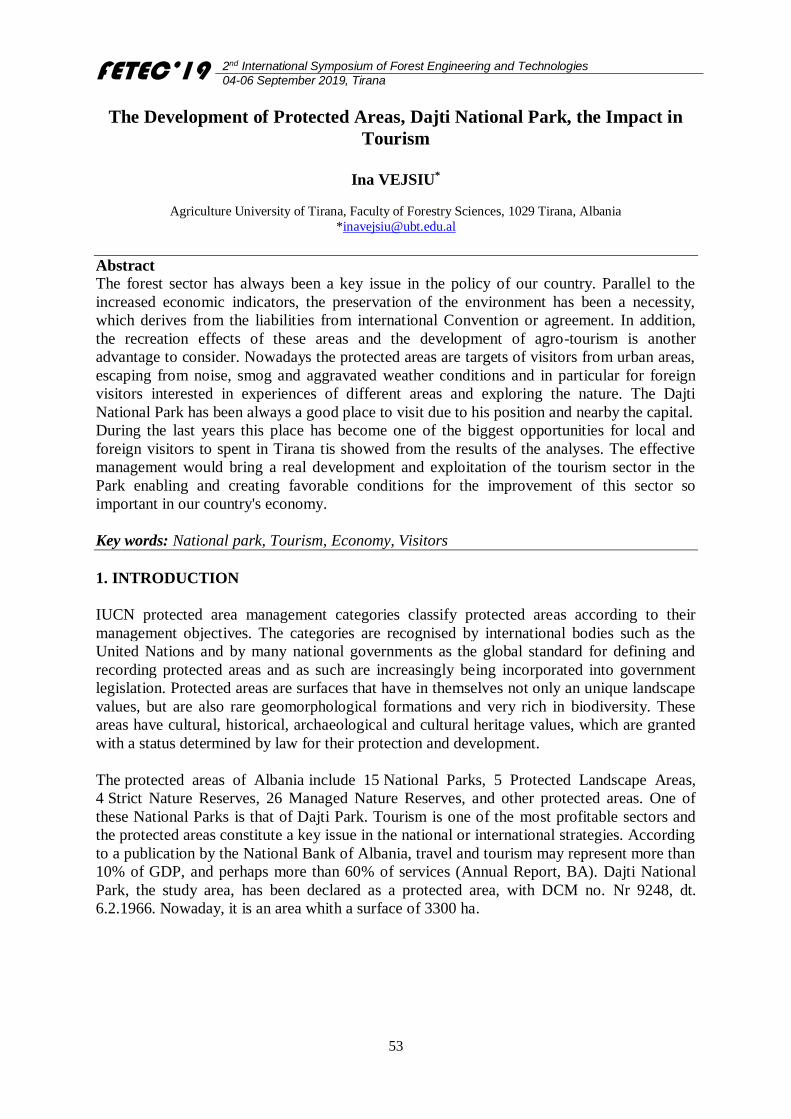
FETEC’19 2nd International Symposium of Forest Engineering and Technologies
04-06 September 2019, Tirana
53
The Development of Protected Areas, Dajti National Park, the Impact in
Tourism
Ina VEJSIU*
Agriculture University of Tirana, Faculty of Forestry Sciences, 1029 Tirana, Albania
Abstract
The forest sector has always been a key issue in the policy of our country. Parallel to the
increased economic indicators, the preservation of the environment has been a necessity,
which derives from the liabilities from international Convention or agreement. In addition,
the recreation effects of these areas and the development of agro-tourism is another
advantage to consider. Nowadays the protected areas are targets of visitors from urban areas,
escaping from noise, smog and aggravated weather conditions and in particular for foreign
visitors interested in experiences of different areas and exploring the nature. The Dajti
National Park has been always a good place to visit due to his position and nearby the capital.
During the last years this place has become one of the biggest opportunities for local and
foreign visitors to spent in Tirana tis showed from the results of the analyses. The effective
management would bring a real development and exploitation of the tourism sector in the
Park enabling and creating favorable conditions for the improvement of this sector so
important in our country's economy.
Key words: National park, Tourism, Economy, Visitors
1. INTRODUCTION
IUCN protected area management categories classify protected areas according to their
management objectives. The categories are recognised by international bodies such as the
United Nations and by many national governments as the global standard for defining and
recording protected areas and as such are increasingly being incorporated into government
legislation. Protected areas are surfaces that have in themselves not only an unique landscape
values, but are also rare geomorphological formations and very rich in biodiversity. These
areas have cultural, historical, archaeological and cultural heritage values, which are granted
with a status determined by law for their protection and development.
The protected areas of Albania include 15 National Parks, 5 Protected Landscape Areas,
4 Strict Nature Reserves, 26 Managed Nature Reserves, and other protected areas. One of
these National Parks is that of Dajti Park. Tourism is one of the most profitable sectors and
the protected areas constitute a key issue in the national or international strategies. According
to a publication by the National Bank of Albania, travel and tourism may represent more than
10% of GDP, and perhaps more than 60% of services (Annual Report, BA). Dajti National
Park, the study area, has been declared as a protected area, with DCM no. Nr 9248, dt.
6.2.1966. Nowaday, it is an area whith a surface of 3300 ha.
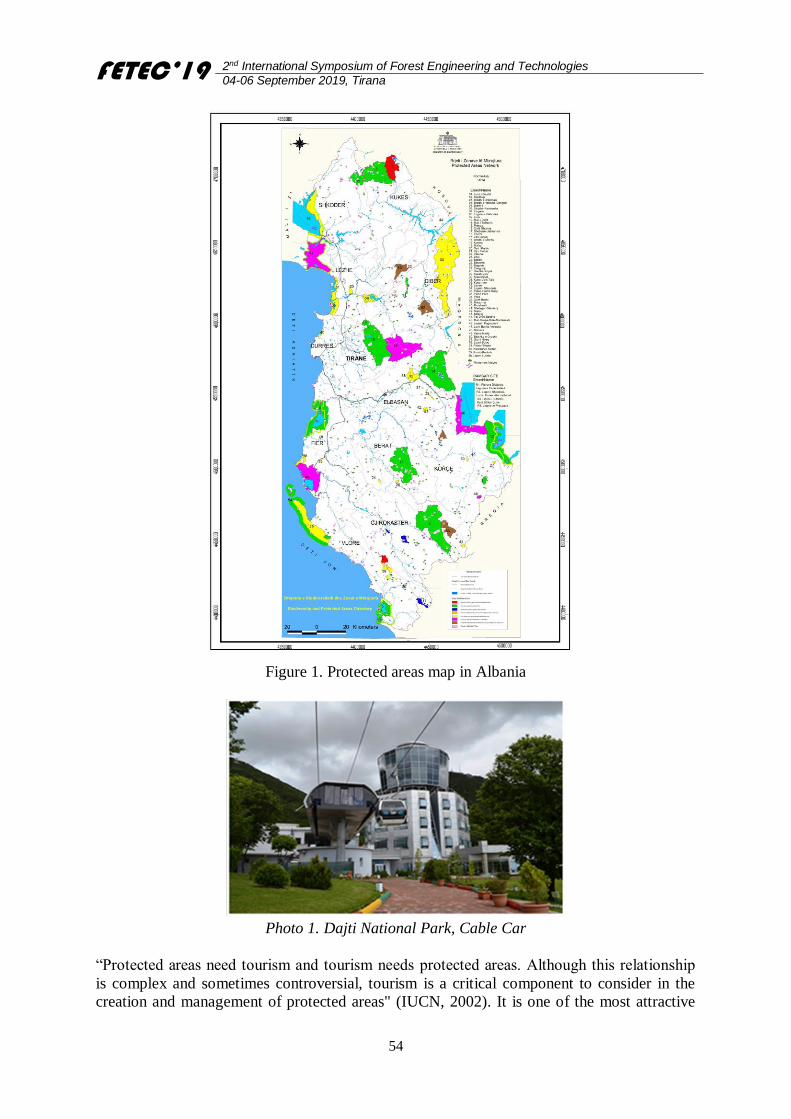
FETEC’19 2nd International Symposium of Forest Engineering and Technologies
04-06 September 2019, Tirana
54
Figure 1. Protected areas map in Albania
Photo 1. Dajti National Park, Cable Car
“Protected areas need tourism and tourism needs protected areas. Although this relationship
is complex and sometimes controversial, tourism is a critical component to consider in the
creation and management of protected areas" (IUCN, 2002). It is one of the most attractive
FETEC’19 2nd International Symposium of Forest Engineering and Technologies
04-06 September 2019, Tirana
55
industries for operating boats, due to the large number of employees and low participation
costs. This sector has a steady increase in the number of companies operating within it.
2. MATERIAL AND METHODS
This study was focused on one of the protected areas of the Republic of Albania, Dajti
National Park. Also we focused on the development of this area and the opportunities it gave
to the local economy growth. During the research we prepared an interview with different
stockholders operating in the area, visitors and representative of local government.
3. RESULTS AND DISCUSSION
Protected areas provide important national ecosystem services and have great potential to
maximize this contribution. They are a reliable source of employment for the local
community. They provide important national ecosystem services and have great potential to
maximize this contribution. These protected areas provides community development
opportunities through the sustainable use of resources. Contains plant species of great social,
cultural or economic importance which contributes to ecosystem services and benefits to the
community. Some other values of the protected areas is the high recreational value and it has
educational and / or scientific value.
3.1. Potential sources of income for e protected area
There is a list of sources that can make possible the increscent of the protected areas income
- Special government programme (free or taxation)
- Entrance fee to the Park
- Fee for special events, services and recreational services
- Accommodation
- selling operators (restaurant, shops, etc)
- Donations
- parking
- Marketing
- Public investments
- Private sector incentives
- Etc.
4. CONCLUSION AND SUGGESTIONS
As a result of this study we get into a conclusion that the concrete area is lack of concrete
development projects to increase the investments and incomes on this specific Park without
destroying it. There is no coordination between stakeholders interested in the development of
protected areas and nature conservation. During this study we get into a conclusion that there
is lack of legal and economic incentive mechanisms for the development of private
entrepreneurship in the field of forest tourism and protected areas.
References
Protected areas in Europe- an overview. 2012. EEA Report
M.Dida, N.Dragoti, G.Kromidha, Gj. Fierza, Tiranë (2004) Zonat e Mbrojtura dhe Parqet
Kombëtare
Nigel Dudle- Guidelines for Applying Protected Area Management Categories, IUCN

FETEC’19 2nd International Symposium of Forest Engineering and Technologies
04-06 September 2019, Tirana
56
International Development Association (IDA) DHV Agriculture and Natural Resources BV,
in collaboration with Halcrow Rural Management, UK dhe DIAVA, Albania (2004) Dajti
National Park Administration Plan
DCM nr 88, 1993 “For the aceptance of Touristic Priority Zones”
WTTC Travel & Tourism Economic Impact 2012
Annual Report, Bank of Albania
INSTAT, Albania.
FETEC’19 2nd International Symposium of Forest Engineering and Technologies
04-06 September 2019, Tirana
57
Analysing of Forest Transport Techniques in terms of
Environmental Effect (A case study of Bigadic Forest Enterprise)
Tolga ÖZTÜRK1*, Merve GÖKÇE VARSAK2, Ebru BILICI3
1IUC Faculty of Forestry, Department of Forest Engineering, Istanbul / Turkey
2IUC Faculty of Forestry, Department of Forest Engineering, Master Student, Istanbul / Turkey. 3 University of Giresun, Dereli Vocational School, Dereli / Turkey
Abstract
In this study, wood production in the areas of Beydağ Forest Management Directorate was
examined. First of all, time studies were conducted to find the efficiency of tractors used in
wood production studies. The result of the study showed that skidding distance is an average
of 385 m. Hourly productivity is 4.50 m³/hour for a skidding distance of 385 m. The time
consumption for a time cycle is found 30.47 min, and the average volume of skidding
products is calculated by 2.223 m3. At the same time, the environmental impact of the
product carried during the production works, the trees remaining in the stand, and the forest
soil were examined.
Keywords: Hauling, Skid road, Environmental Damages, Time measurement
1. INTRODUCTION
Parallel to the increase in the population in our country, the consumption of wood is
increasing. Based on that, wood raw materials demand increases that requires better technical
characteristics of forest roads and mechanization. Thus, many studies have been recently
conducted to evaluate the technical features of forest roads and giving priority to
mechanization for increased wood raw material demands. Environmental factors, time,
occupational safety, quality loss of wood raw material, and economics are taken into
consideration in the production of wood raw material. Logging is perceived to be one of the
major causes of damage to forest vegetation (Alexander, 2012). Also, forest machinery is
becoming more massive and more powerful (Horn et al., 2004).
In many regions of the world, farm tractors have been used in forestry, where the terrain
conditions and the size of the forest operation are not limited (Akay, 2005). Harvest systems,
consisting of farm tractors and skidders, are the most popular systems for timber harvesting
in Turkish forestry. In particular, the modified farm tractors are used in many regions in
Turkey (Öztürk, 2014).
In this study, wood production in the areas of Beydağ Forest Management Directorate was
examined. First, we conducted time studies to find the productivity of tractors used in wood
production studies. At the same time the environmental impact of the product carried during
the production works, the trees remaining in the stand and the forest soil were examined.
2. MATERIAL AND METHODS
Study area is managed by Bigadiç Forest Enterprise, and this area was located in northwest
Turkey (Figure 1). The research was carried out in compartments numbers 135-136 of
Beydağ Forest Management, with an altitude ranging between 750 and 900 meters above the
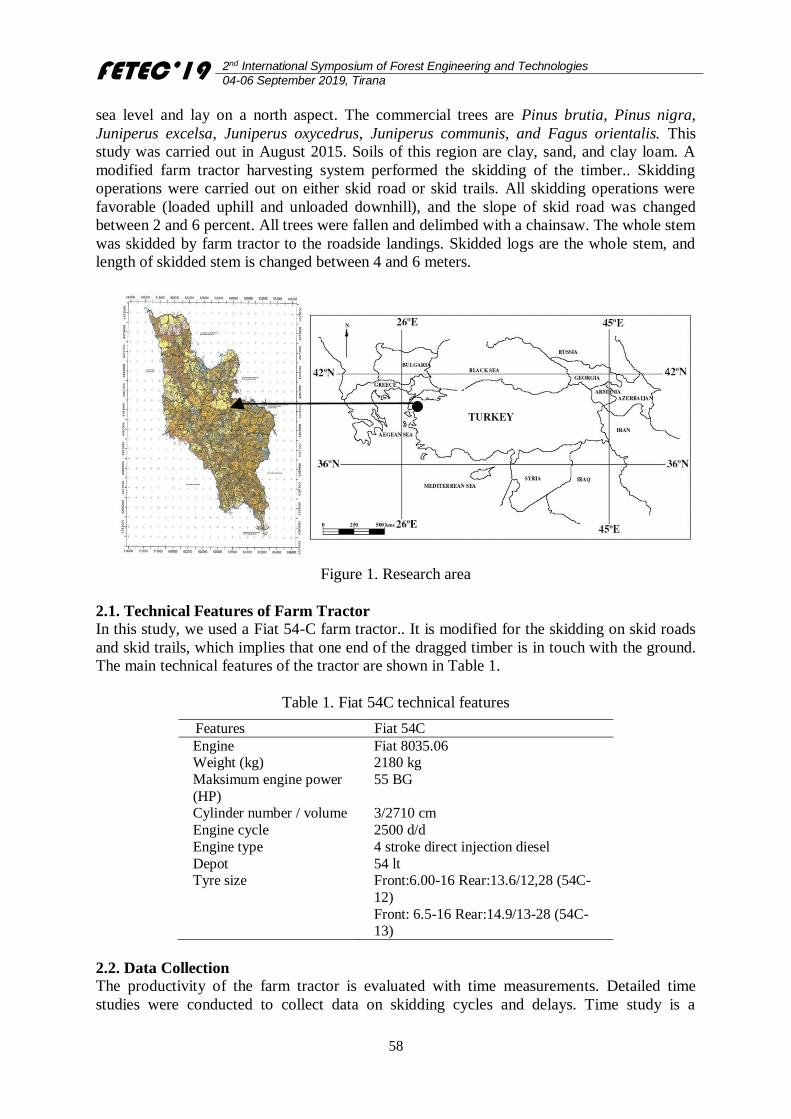
FETEC’19 2nd International Symposium of Forest Engineering and Technologies
04-06 September 2019, Tirana
58
sea level and lay on a north aspect. The commercial trees are Pinus brutia, Pinus nigra,
Juniperus excelsa, Juniperus oxycedrus, Juniperus communis, and Fagus orientalis. This
study was carried out in August 2015. Soils of this region are clay, sand, and clay loam. A
modified farm tractor harvesting system performed the skidding of the timber.. Skidding
operations were carried out on either skid road or skid trails. All skidding operations were
favorable (loaded uphill and unloaded downhill), and the slope of skid road was changed
between 2 and 6 percent. All trees were fallen and delimbed with a chainsaw. The whole stem
was skidded by farm tractor to the roadside landings. Skidded logs are the whole stem, and
length of skidded stem is changed between 4 and 6 meters.
Figure 1. Research area
2.1. Technical Features of Farm Tractor
In this study, we used a Fiat 54-C farm tractor.. It is modified for the skidding on skid roads
and skid trails, which implies that one end of the dragged timber is in touch with the ground.
The main technical features of the tractor are shown in Table 1.
Table 1. Fiat 54C technical features
Features Fiat 54C
Engine Fiat 8035.06 Weight (kg) 2180 kg
Maksimum engine power
(HP)
55 BG
Cylinder number / volume 3/2710 cm
Engine cycle 2500 d/d
Engine type 4 stroke direct injection diesel
Depot 54 lt Tyre size Front:6.00-16 Rear:13.6/12,28 (54C-
12)
Front: 6.5-16 Rear:14.9/13-28 (54C-13)
2.2. Data Collection
The productivity of the farm tractor is evaluated with time measurements. Detailed time
studies were conducted to collect data on skidding cycles and delays. Time study is a
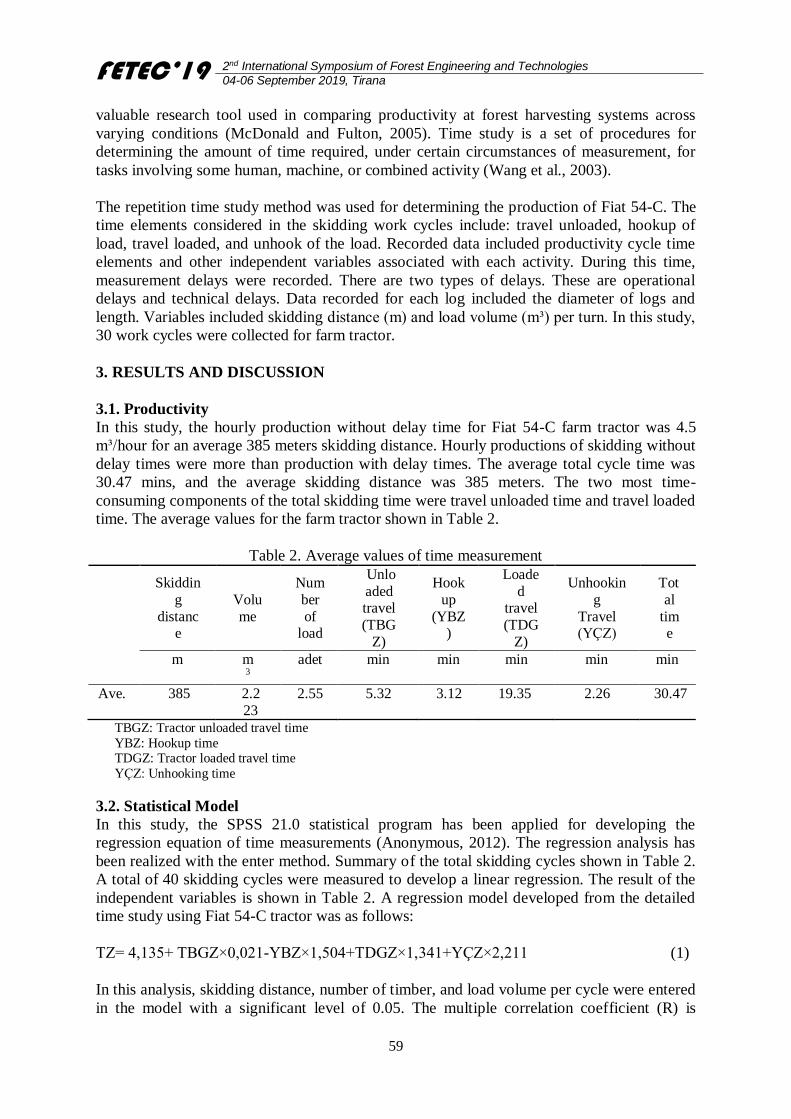
FETEC’19 2nd International Symposium of Forest Engineering and Technologies
04-06 September 2019, Tirana
59
valuable research tool used in comparing productivity at forest harvesting systems across
varying conditions (McDonald and Fulton, 2005). Time study is a set of procedures for
determining the amount of time required, under certain circumstances of measurement, for
tasks involving some human, machine, or combined activity (Wang et al., 2003).
The repetition time study method was used for determining the production of Fiat 54-C. The
time elements considered in the skidding work cycles include: travel unloaded, hookup of
load, travel loaded, and unhook of the load. Recorded data included productivity cycle time
elements and other independent variables associated with each activity. During this time,
measurement delays were recorded. There are two types of delays. These are operational
delays and technical delays. Data recorded for each log included the diameter of logs and
length. Variables included skidding distance (m) and load volume (m³) per turn. In this study,
30 work cycles were collected for farm tractor.
3. RESULTS AND DISCUSSION
3.1. Productivity
In this study, the hourly production without delay time for Fiat 54-C farm tractor was 4.5
m³/hour for an average 385 meters skidding distance. Hourly productions of skidding without
delay times were more than production with delay times. The average total cycle time was
30.47 mins, and the average skidding distance was 385 meters. The two most time-
consuming components of the total skidding time were travel unloaded time and travel loaded
time. The average values for the farm tractor shown in Table 2.
Table 2. Average values of time measurement
Skiddin
g
distance
Volu
me
Num
ber
of load
Unlo
aded travel
(TBG
Z)
Hook
up
(YBZ)
Loade
d travel
(TDG
Z)
Unhookin
g
Travel (YÇZ)
Tot
al
time
m m3
adet min min min min min
Ave. 385 2.2
23
2.55 5.32 3.12 19.35 2.26 30.47
TBGZ: Tractor unloaded travel time
YBZ: Hookup time TDGZ: Tractor loaded travel time
YÇZ: Unhooking time
3.2. Statistical Model
In this study, the SPSS 21.0 statistical program has been applied for developing the
regression equation of time measurements (Anonymous, 2012). The regression analysis has
been realized with the enter method. Summary of the total skidding cycles shown in Table 2.
A total of 40 skidding cycles were measured to develop a linear regression. The result of the
independent variables is shown in Table 2. A regression model developed from the detailed
time study using Fiat 54-C tractor was as follows:
TZ= 4,135+ TBGZ×0,021-YBZ×1,504+TDGZ×1,341+YÇZ×2,211 (1)
In this analysis, skidding distance, number of timber, and load volume per cycle were entered
in the model with a significant level of 0.05. The multiple correlation coefficient (R) is
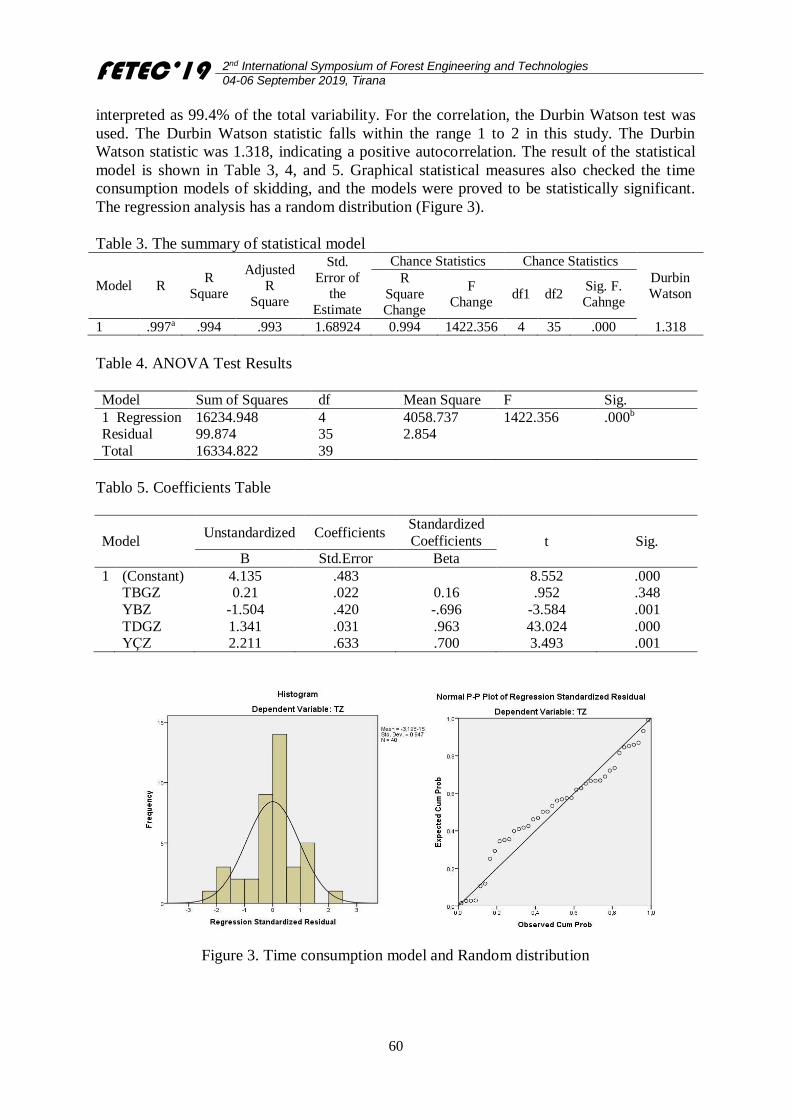
FETEC’19 2nd International Symposium of Forest Engineering and Technologies
04-06 September 2019, Tirana
60
interpreted as 99.4% of the total variability. For the correlation, the Durbin Watson test was
used. The Durbin Watson statistic falls within the range 1 to 2 in this study. The Durbin
Watson statistic was 1.318, indicating a positive autocorrelation. The result of the statistical
model is shown in Table 3, 4, and 5. Graphical statistical measures also checked the time
consumption models of skidding, and the models were proved to be statistically significant.
The regression analysis has a random distribution (Figure 3).
Table 3. The summary of statistical model
Model R R
Square
Adjusted
R
Square
Std.
Error of
the
Estimate
Chance Statistics Chance Statistics
Durbin
Watson R
Square
Change
F
Change df1 df2
Sig. F.
Cahnge
1 .997a .994 .993 1.68924 0.994 1422.356 4 35 .000 1.318
Table 4. ANOVA Test Results
Model Sum of Squares df Mean Square F Sig.
1 Regression Residual
Total
16234.948 99.874
16334.822
4 35
39
4058.737 2.854
1422.356 .000b
Tablo 5. Coefficients Table
Model Unstandardized Coefficients
Standardized
Coefficients t Sig.
B Std.Error Beta
1 (Constant) 4.135 .483 8.552 .000 TBGZ 0.21 .022 0.16 .952 .348
YBZ -1.504 .420 -.696 -3.584 .001
TDGZ 1.341 .031 .963 43.024 .000 YÇZ 2.211 .633 .700 3.493 .001
Figure 3. Time consumption model and Random distribution
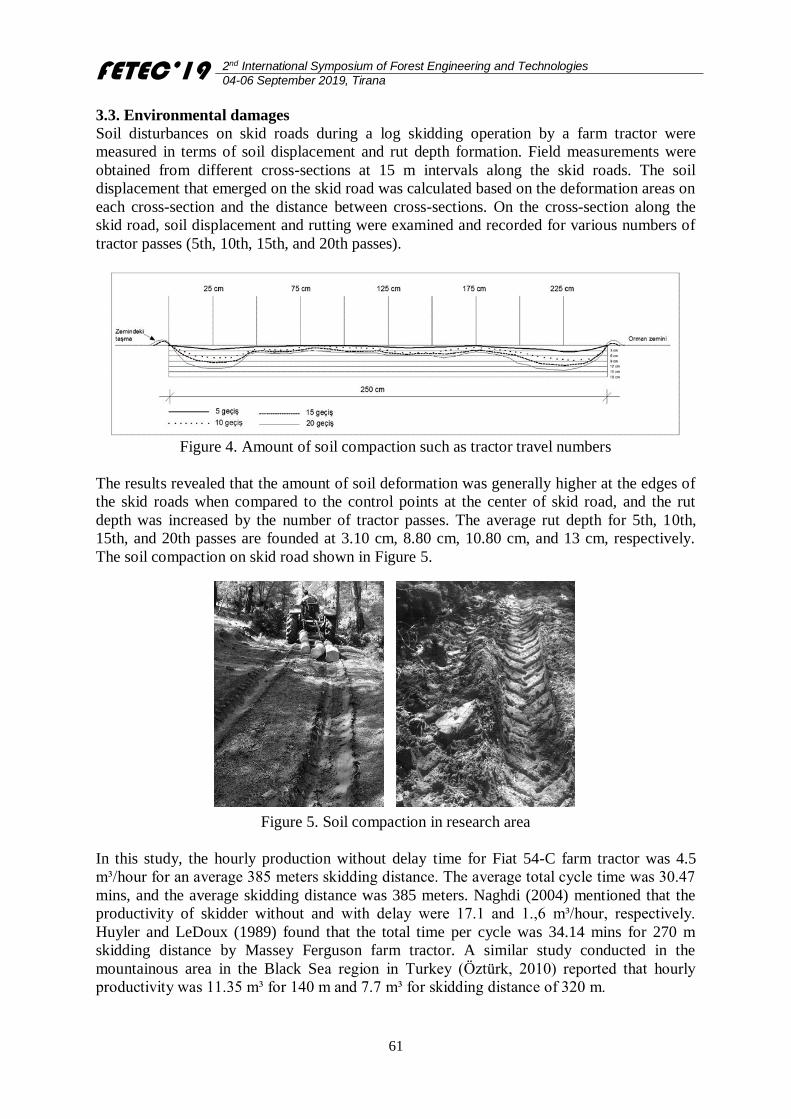
FETEC’19 2nd International Symposium of Forest Engineering and Technologies
04-06 September 2019, Tirana
61
3.3. Environmental damages
Soil disturbances on skid roads during a log skidding operation by a farm tractor were
measured in terms of soil displacement and rut depth formation. Field measurements were
obtained from different cross-sections at 15 m intervals along the skid roads. The soil
displacement that emerged on the skid road was calculated based on the deformation areas on
each cross-section and the distance between cross-sections. On the cross-section along the
skid road, soil displacement and rutting were examined and recorded for various numbers of
tractor passes (5th, 10th, 15th, and 20th passes).
Figure 4. Amount of soil compaction such as tractor travel numbers
The results revealed that the amount of soil deformation was generally higher at the edges of
the skid roads when compared to the control points at the center of skid road, and the rut
depth was increased by the number of tractor passes. The average rut depth for 5th, 10th,
15th, and 20th passes are founded at 3.10 cm, 8.80 cm, 10.80 cm, and 13 cm, respectively.
The soil compaction on skid road shown in Figure 5.
Figure 5. Soil compaction in research area
In this study, the hourly production without delay time for Fiat 54-C farm tractor was 4.5
m³/hour for an average 385 meters skidding distance. The average total cycle time was 30.47
mins, and the average skidding distance was 385 meters. Naghdi (2004) mentioned that the
productivity of skidder without and with delay were 17.1 and 1.,6 m³/hour, respectively.
Huyler and LeDoux (1989) found that the total time per cycle was 34.14 mins for 270 m
skidding distance by Massey Ferguson farm tractor. A similar study conducted in the
mountainous area in the Black Sea region in Turkey (Öztürk, 2010) reported that hourly
productivity was 11.35 m³ for 140 m and 7.7 m³ for skidding distance of 320 m.
FETEC’19 2nd International Symposium of Forest Engineering and Technologies
04-06 September 2019, Tirana
62
4. CONCLUSION AND SUGGESTION
Increasing the average skidding distance during forest operations decreases the efficiency of
machines. At the same time, the cost of skidding increases in the falling area. Therefore, in
the falling areas, forest engineers should use shorter skidding distances. The planning of skid
roads and trails should be done carefully. Besides, the skid roads should be coated in the form
of a network in production areas. The environmental damages during harvesting operations
should be considered, and these effects should be minimal.
References
Akay, A.E. 2005. Using Farm Tractors in Small-Scale Forest Harvesting Operations. Journal
of Applied Sciences Research, 1(2): 196-199.
Alexander, A.B. 2012. Soil Compaction on Skid Trails after Selective Logging in Moist
Evergreen Forest of Ghana. Agriculture and Biology Journal of North America. 3(6):262-
264.
Anonymous, 2012. IBM SPSS Advanced Statistics 21.
Horn, R., Vossbrink, J., Becker, S. 2004. Modern Forestry Vehicles and Their Impacts on
Soil Physical Properties. Soil & Tillage Research, 79: 207-219.
Huyler, N.K., Ledoux, C.B. 1989. Small Tractors for Harvesting Fuelwood in Low-Volume
Small Diameter Hardwood Stands. COFE, Implementing Techniques for Successful Forest
Operations, August 27 to 30, Idoha, 1989: 61-67.
McDonald, T.P., Fulton, J.P. 2005. Automated Time Study of Skidders Using Global
Positioning System Data. Computers and Electronics in Agriculture, 48: 19-37.
Naghdi, R. 2004. Study of Optimum Road Density in Tree Length and Cut to Length
Systems. PhD. Thesis, University of Tarbiat Modarres, Faculty of Natural Resources.
Öztürk, T. 2010. Productivity of New Holland Farm Tractor at Beech Stands on Mountainous
Areas in Black Sea Region. Forestry Ideas, 16(1): 52-57.
Öztürk, T. 2014. Productivity and Cost of Rubber - Tired Tractor in Northern Pine Plantation
Forest of Turkey. Baltıc Forestry, 20 (2): 272-276.
Wang, J., McNeel, J., Baumgras, J. 2003. A Computer-Based Time Study System for Timber
Harvesting Operations. Forest Products Journal, 53(3): 47-53.
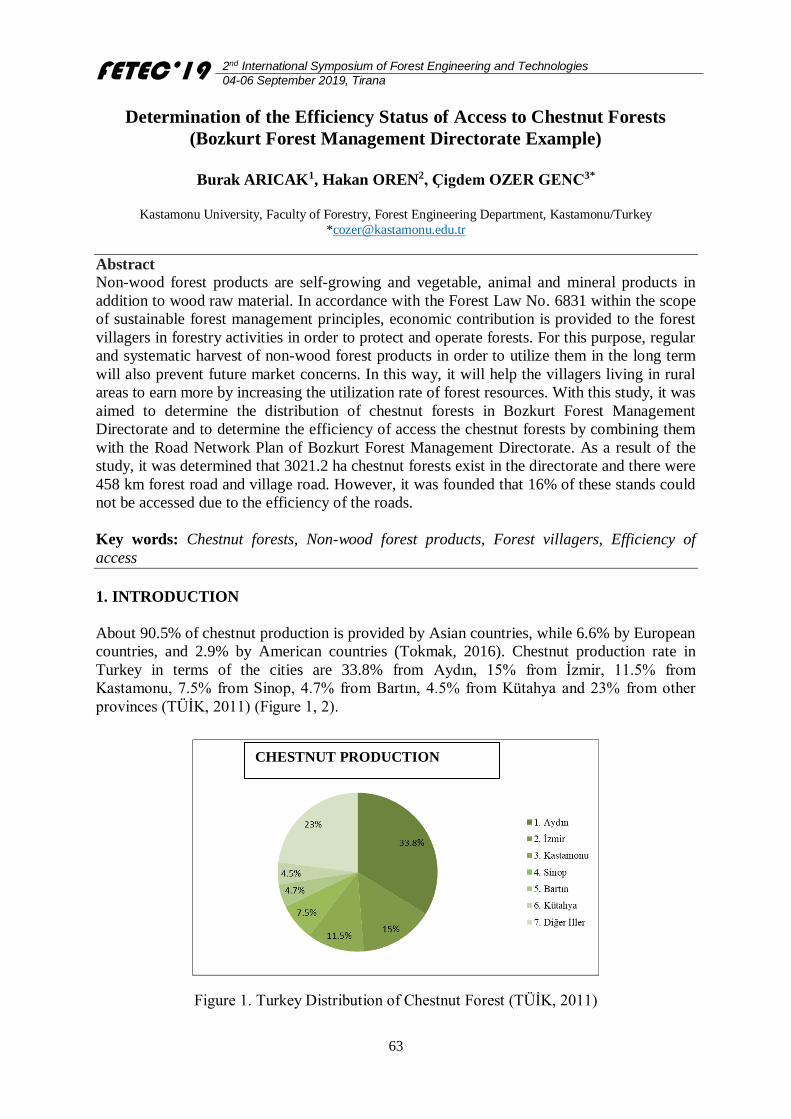
FETEC’19 2nd International Symposium of Forest Engineering and Technologies
04-06 September 2019, Tirana
63
Determination of the Efficiency Status of Access to Chestnut Forests
(Bozkurt Forest Management Directorate Example)
Burak ARICAK1, Hakan OREN2, Çigdem OZER GENC3*
Kastamonu University, Faculty of Forestry, Forest Engineering Department, Kastamonu/Turkey
Abstract
Non-wood forest products are self-growing and vegetable, animal and mineral products in
addition to wood raw material. In accordance with the Forest Law No. 6831 within the scope
of sustainable forest management principles, economic contribution is provided to the forest
villagers in forestry activities in order to protect and operate forests. For this purpose, regular
and systematic harvest of non-wood forest products in order to utilize them in the long term
will also prevent future market concerns. In this way, it will help the villagers living in rural
areas to earn more by increasing the utilization rate of forest resources. With this study, it was
aimed to determine the distribution of chestnut forests in Bozkurt Forest Management
Directorate and to determine the efficiency of access the chestnut forests by combining them
with the Road Network Plan of Bozkurt Forest Management Directorate. As a result of the
study, it was determined that 3021.2 ha chestnut forests exist in the directorate and there were
458 km forest road and village road. However, it was founded that 16% of these stands could
not be accessed due to the efficiency of the roads.
Key words: Chestnut forests, Non-wood forest products, Forest villagers, Efficiency of
access
1. INTRODUCTION
About 90.5% of chestnut production is provided by Asian countries, while 6.6% by European
countries, and 2.9% by American countries (Tokmak, 2016). Chestnut production rate in
Turkey in terms of the cities are 33.8% from Aydın, 15% from İzmir, 11.5% from
Kastamonu, 7.5% from Sinop, 4.7% from Bartın, 4.5% from Kütahya and 23% from other
provinces (TÜİK, 2011) (Figure 1, 2).
Figure 1. Turkey Distribution of Chestnut Forest (TÜİK, 2011)
CHESTNUT PRODUCTION
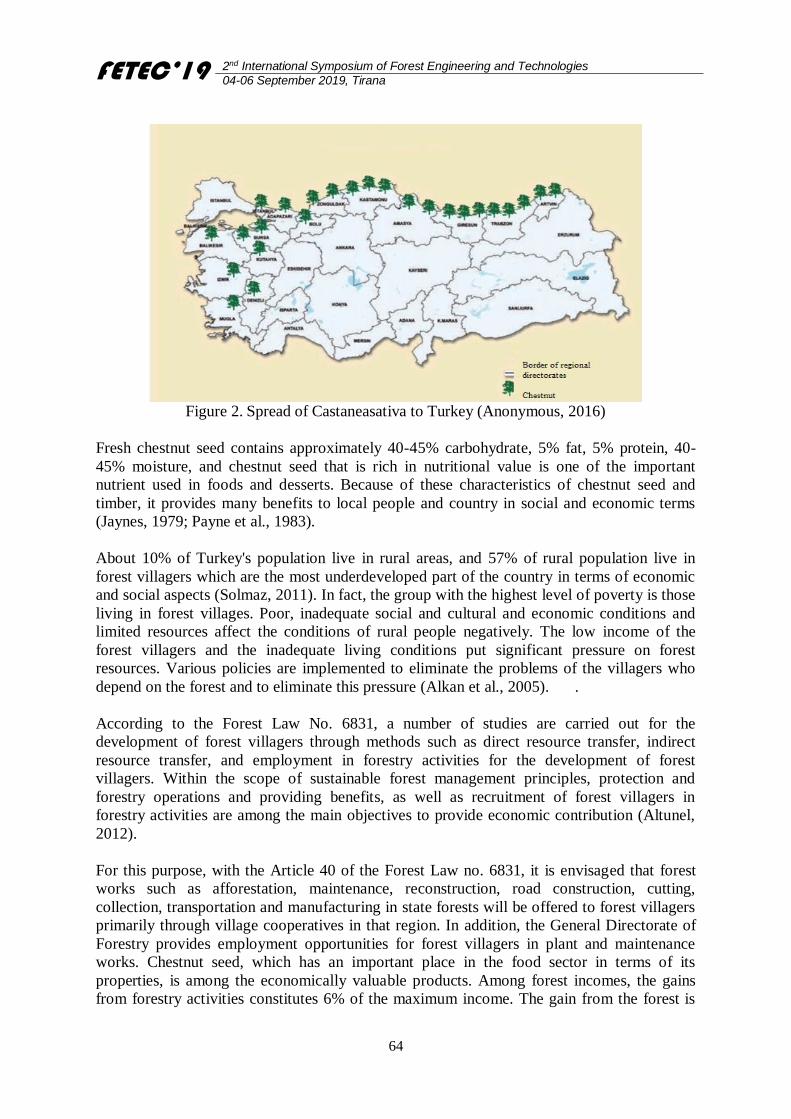
FETEC’19 2nd International Symposium of Forest Engineering and Technologies
04-06 September 2019, Tirana
64
Figure 2. Spread of Castaneasativa to Turkey (Anonymous, 2016)
Fresh chestnut seed contains approximately 40-45% carbohydrate, 5% fat, 5% protein, 40-
45% moisture, and chestnut seed that is rich in nutritional value is one of the important
nutrient used in foods and desserts. Because of these characteristics of chestnut seed and
timber, it provides many benefits to local people and country in social and economic terms
(Jaynes, 1979; Payne et al., 1983).
About 10% of Turkey's population live in rural areas, and 57% of rural population live in
forest villagers which are the most underdeveloped part of the country in terms of economic
and social aspects (Solmaz, 2011). In fact, the group with the highest level of poverty is those
living in forest villages. Poor, inadequate social and cultural and economic conditions and
limited resources affect the conditions of rural people negatively. The low income of the
forest villagers and the inadequate living conditions put significant pressure on forest
resources. Various policies are implemented to eliminate the problems of the villagers who
depend on the forest and to eliminate this pressure (Alkan et al., 2005). .
According to the Forest Law No. 6831, a number of studies are carried out for the
development of forest villagers through methods such as direct resource transfer, indirect
resource transfer, and employment in forestry activities for the development of forest
villagers. Within the scope of sustainable forest management principles, protection and
forestry operations and providing benefits, as well as recruitment of forest villagers in
forestry activities are among the main objectives to provide economic contribution (Altunel,
2012).
For this purpose, with the Article 40 of the Forest Law no. 6831, it is envisaged that forest
works such as afforestation, maintenance, reconstruction, road construction, cutting,
collection, transportation and manufacturing in state forests will be offered to forest villagers
primarily through village cooperatives in that region. In addition, the General Directorate of
Forestry provides employment opportunities for forest villagers in plant and maintenance
works. Chestnut seed, which has an important place in the food sector in terms of its
properties, is among the economically valuable products. Among forest incomes, the gains
from forestry activities constitutes 6% of the maximum income. The gain from the forest is
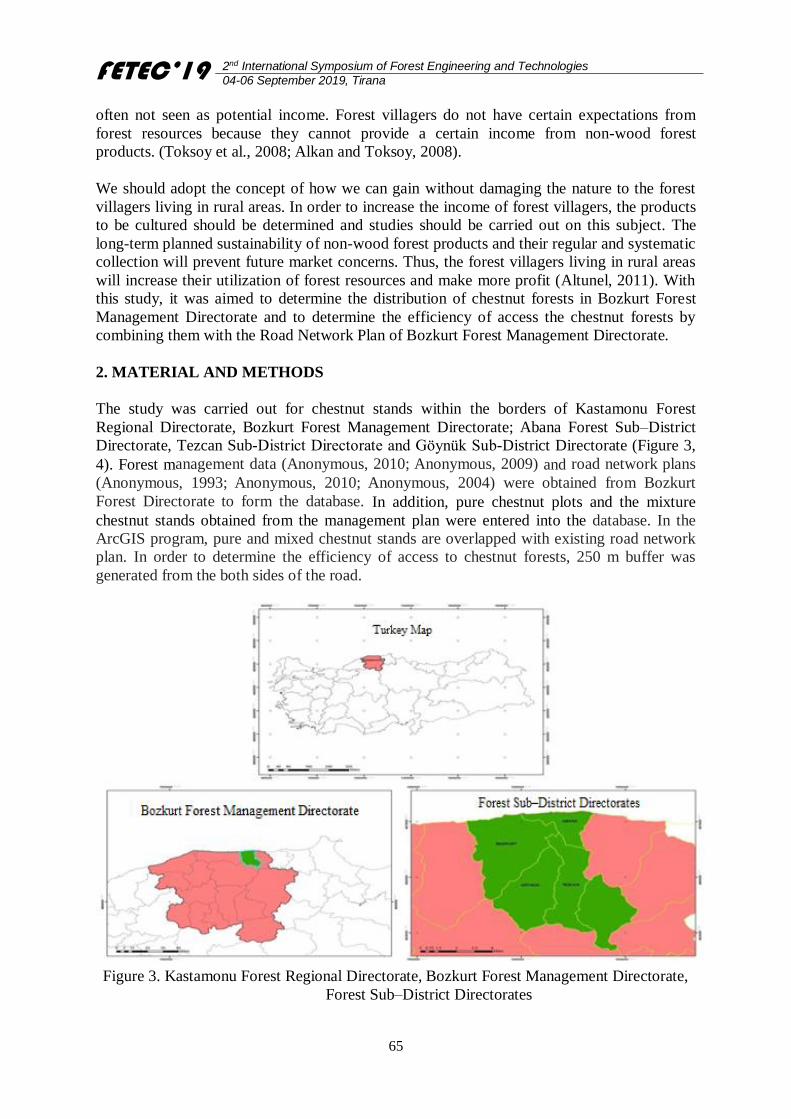
FETEC’19 2nd International Symposium of Forest Engineering and Technologies
04-06 September 2019, Tirana
65
often not seen as potential income. Forest villagers do not have certain expectations from
forest resources because they cannot provide a certain income from non-wood forest
products. (Toksoy et al., 2008; Alkan and Toksoy, 2008).
We should adopt the concept of how we can gain without damaging the nature to the forest
villagers living in rural areas. In order to increase the income of forest villagers, the products
to be cultured should be determined and studies should be carried out on this subject. The
long-term planned sustainability of non-wood forest products and their regular and systematic
collection will prevent future market concerns. Thus, the forest villagers living in rural areas
will increase their utilization of forest resources and make more profit (Altunel, 2011). With
this study, it was aimed to determine the distribution of chestnut forests in Bozkurt Forest
Management Directorate and to determine the efficiency of access the chestnut forests by
combining them with the Road Network Plan of Bozkurt Forest Management Directorate.
2. MATERIAL AND METHODS
The study was carried out for chestnut stands within the borders of Kastamonu Forest
Regional Directorate, Bozkurt Forest Management Directorate; Abana Forest Sub–District
Directorate, Tezcan Sub-District Directorate and Göynük Sub-District Directorate (Figure 3,
4). Forest management data (Anonymous, 2010; Anonymous, 2009) and road network plans
(Anonymous, 1993; Anonymous, 2010; Anonymous, 2004) were obtained from Bozkurt
Forest Directorate to form the database. In addition, pure chestnut plots and the mixture
chestnut stands obtained from the management plan were entered into the database. In the
ArcGIS program, pure and mixed chestnut stands are overlapped with existing road network
plan. In order to determine the efficiency of access to chestnut forests, 250 m buffer was
generated from the both sides of the road.
Figure 3. Kastamonu Forest Regional Directorate, Bozkurt Forest Management Directorate,
Forest Sub–District Directorates
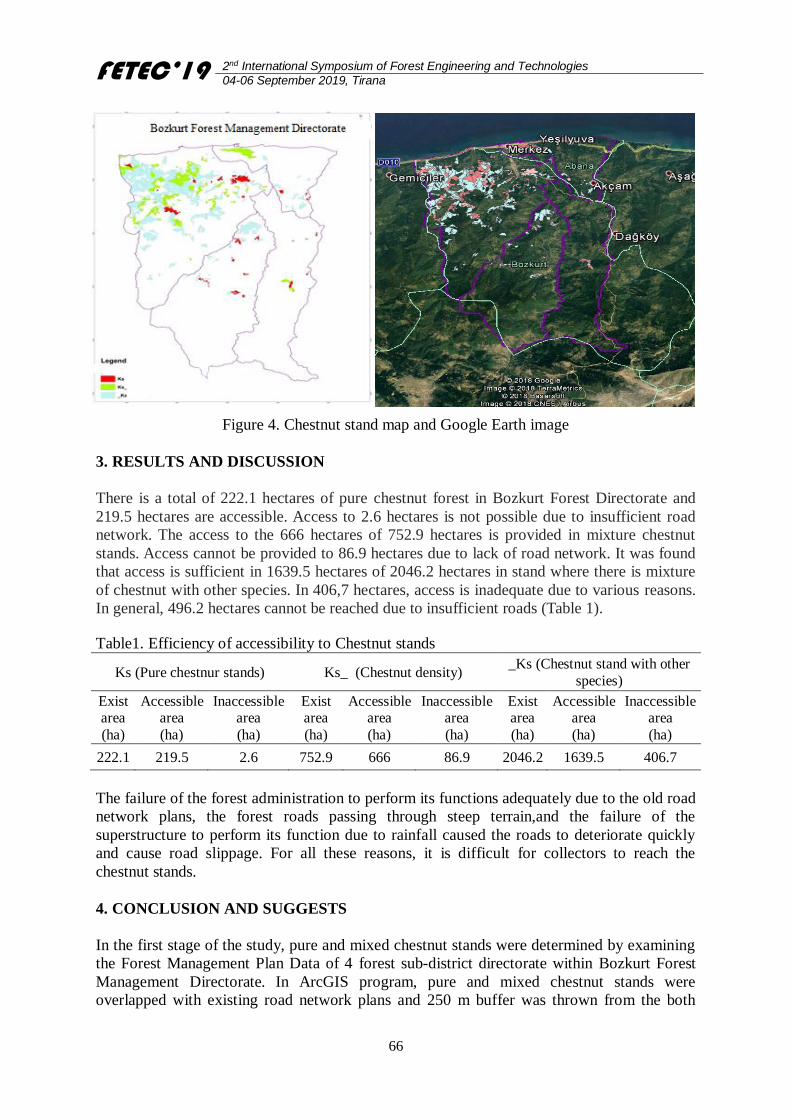
FETEC’19 2nd International Symposium of Forest Engineering and Technologies
04-06 September 2019, Tirana
66
Figure 4. Chestnut stand map and Google Earth image
3. RESULTS AND DISCUSSION
There is a total of 222.1 hectares of pure chestnut forest in Bozkurt Forest Directorate and
219.5 hectares are accessible. Access to 2.6 hectares is not possible due to insufficient road
network. The access to the 666 hectares of 752.9 hectares is provided in mixture chestnut
stands. Access cannot be provided to 86.9 hectares due to lack of road network. It was found
that access is sufficient in 1639.5 hectares of 2046.2 hectares in stand where there is mixture
of chestnut with other species. In 406,7 hectares, access is inadequate due to various reasons.
In general, 496.2 hectares cannot be reached due to insufficient roads (Table 1).
Table1. Efficiency of accessibility to Chestnut stands
Ks (Pure chestnur stands) Ks_ (Chestnut density) _Ks (Chestnut stand with other
species)
Exist area
(ha)
Accessible area
(ha)
Inaccessible area
(ha)
Exist area
(ha)
Accessible area
(ha)
Inaccessible area
(ha)
Exist area
(ha)
Accessible area
(ha)
Inaccessible area
(ha)
222.1 219.5 2.6 752.9 666 86.9 2046.2 1639.5 406.7
The failure of the forest administration to perform its functions adequately due to the old road
network plans, the forest roads passing through steep terrain,and the failure of the
superstructure to perform its function due to rainfall caused the roads to deteriorate quickly
and cause road slippage. For all these reasons, it is difficult for collectors to reach the
chestnut stands.
4. CONCLUSION AND SUGGESTS
In the first stage of the study, pure and mixed chestnut stands were determined by examining
the Forest Management Plan Data of 4 forest sub-district directorate within Bozkurt Forest
Management Directorate. In ArcGIS program, pure and mixed chestnut stands were
overlapped with existing road network plans and 250 m buffer was thrown from the both
FETEC’19 2nd International Symposium of Forest Engineering and Technologies
04-06 September 2019, Tirana
67
sides of the road in order to determine the efficiency level of access to chestnut forests. It was
found that 219.5 ha of pure chestnut stands and 2305.5 ha of mixture chestnut stands were
accessible. It was determined that there was no access to 2.6 ha in pure chestnut stands and
493.6 ha in mixture chestnut stands. Several measures should be taken in order to solve
accessibility problems:
Many factors should be considered when planning roads, not just the purpose of
production.
In the new network plans, the planning should prevent unnecessary planned routes to
be included in the enterprise
Renewal of forest road network plans, acceleration of maintenance works, and
attention to the superstructure will assist the chestnut collectors. Thus, more chestnut
stands can be reached, without unnecessary expenses.
References
Alkan, S., Toksoy, D. 2008. Orman köylerinde sosyo-ekonomik yapı: Trabzon ili örneği.
Kastamonu Üniversitesi Orman Fakültesi Dergisi, 8(1): 37-46. (In Turkish)
Alkan, H., Korkmaz, M., Tolunay, A. 2005. Burdur İli’nde Ormancılık Etkinliklerinin
Orman-Halk İlişkileri Kapsamında Değerlendirilmesi. I. Burdur Sempozyumu, Sayfa:
1115-1126, Burdur
Altunel, T.A. 2011. Odun Dışı Orman Ürünlerinin Değerlendirilmesinde Dünya’dan
Örnekler. II. In International NonWood Forest Products Symposium (pp. 8-10).
Altunel, T. 2012. Odun Dışı Orman Ürünlerinin Toplayıcı/Üretici Açısından Sosyoekonomik
Önemi. Journal of the Faculty of Forestry Istanbul University, 62 (1). 85-99.
Anonymou, 1993. Bozkurt Orman İşletme Şefliği Yol Ağı Planı, Çevre ve Orman Bakanlığı
OGM, Ankara. (In Turkish)
Anonymous, 2010. Bozkurt Orman İşletme Şefliği Fonksiyonel Orman Amenajman Planı
(2010-2029). Çevre ve Orman Bakanlığı OGM, Ankara. (In Turkish)
Anonymous, 2010. Abana Orman İşletme Şefliği Yol Ağı Planı, Çevre ve Orman Bakanlığı
OGM, Ankara. (In Turkish)
Anonymous, 2009. AbanaOrman İşletme Şefliği Fonksiyonel Orman Amenajman Planı
(2009-2028). Çevre ve Orman Bakanlığı OGM, Ankara. (In Turkish)
Anonymous, 2004.Tezcan Orman İşletme Şefliği Yol Ağı Planı, Çevre ve Orman Bakanlığı
OGM, Ankara. (In Turkish)
Anonymous, 2009. TezcanOrman İşletme Şefliği Fonksiyonel Orman Amenajman Planı
(2009-2028). Çevre ve Orman Bakanlığı OGM, Ankara. (In Turkish)
Anonymous, 2004.Göynük Orman İşletme Şefliği Yol Ağı Planı, Çevre ve Orman Bakanlığı
OGM, Ankara. (In Turkish)
Anonymous, 2009. Göynük Orman İşletme Şefliği Fonksiyonel Orman Amenajman Planı
(2009-2028). Çevre ve Orman Bakanlığı OGM, Ankara. (In Turkish)
Anonymous, 2016. Kastamonu Orman Bölge Müdürlüğü’nde Anadolu Kestanesinin
(Castanea Sativa Mill) Yayilişi İle Ekolojik, Biyolojik Ve Ekonomik Özelliklerinin
Araştirilmasi Projesi Kesin Raporu. (In Turkish)
Jaynes, R.A. 1979. Chestnuts, nut tree culture in North America. Northern Nut Grw. Assoc.
Inc. Hamdem, Connecticut 06518. 111-127 pp.
Payne, J. A., Jaynes, R. A., Kays, S. J. 1983. Chinese chestnut production in the United
States: practice, problems and possible solutions. Economic Bot., 37(2): 187-200.
Solmaz, E. 2011. Muğla Orman Köylerinin Kalkinmasina Yönelik Uygulanan Politikalarin
Yoksulluk Düzeyi Ve Orman Kaynaklarinin Kullanimina Etkisi. Muğla Üniversitesi
Sosyal Bilimler Enstitüsü Dergisi, (19). (In Turkish)

FETEC’19 2nd International Symposium of Forest Engineering and Technologies
04-06 September 2019, Tirana
68
Toksoy, D., Ayaz, H., Şen, G., Özden, S. 2005. Doğu Karadeniz Bölgesinde Orman Köylü
İlişkileri, Kafkas Üniversitesi Artvin Orman Fakültesi Dergisi, 6 (1-2):79-85. (In Turkish)
Tokmak, S. 2016. Chesnut flour; White gold. International Forestry Symposium, Proceeding,
07-10 December, Kastamonu, Turkey, 959-963.
Toksoy, D., Ayaz, H., Şen, G. 2008. Artvin ili orman köylerinin sosyo-ekonomik özellikleri.
(In Turkish)
TÜİK (2011). Haber Bülteni “İş Gücü İstatistikleri” (In Turkish)
FETEC’19 2nd International Symposium of Forest Engineering and Technologies
04-06 September 2019, Tirana
69
Comparison of Turkey's Wetland Management Approaches to
International Wetland Policies in terms of the role of Wetlands in Carbon
Cycling: An example from Bursa Karacabey Floodplain Forests
Temel SARIYILDIZ*, Salih PARLAK, Mert TANI, Derya AYGÜN
Bursa Technical University, Faculty of Forestry, Department of Forest Engineering, Bursa, TURKEY *[email protected]
Abstract
Wetlands cover approximately six to nine per cent of the Earth’s surface, and some 60% of
these areas are estimated to be floodplain forests. In recent years, wetlands have begun to
shrink due to mostly anthropogenic pressures and also due to global climate changes.
Unfortunately, very few floodplain forests remain in Europe. 90% of their original area has
disappeared and the remaining fragments are often in critical condition. Similarly, from over
22.6-million-hectare terrestrial forest lands, only 11.400-hectare floodplain forests remain in
Turkey. With 3800 ha areas, Bursa Karacabey floodplain forests are one of the largest
floodplain forests in Turkey. These forest ecosystems are only known and managed by
governmental and local authorities with their potential for tourism and rich biological diversity.
However, these forest ecosystems play an important role in landscape function, including
cycling of carbon sequestration and storage, water and nutrients, food and fibre production,
water purification, regulation of flows, provision of habitats, and recreation services. This paper
considers the role of floodplain forests in carbon cycling, the implications of climate change for
floodplain forest functions and services, and mechanisms to promote protection and restoration
of floodplain forest for multiple benefits including carbon sequestration.
Keywords: Flood plain forests, Climate change, Carbon storage, Management policies
1. INTRODUCTION
Wetlands are complex ecosystems and occupy the zone between permanently wet aquatic
ecosystems and dry terrestrial ecosystems. Since the water occupies a wetland is not
permanent, this zone varies considerably in the associated climate and weather conditions,
vegetation and soil characteristics, there is not a single scientific and legal definition of the
wetland that everyone agreed on (Güneş and Elvan, 2003). Hence, a definition that satisfies
both scientists and politicians and absolutely reflects the portray of wetlands is not
straightforward (Cubbage et al., 1993). On the other hand, there exists some legal and
scientific definitions, provided by some prominent entities that are widely used for different
purposes (Heimlich et al., 1998).
Wetlands can be scientifically defined as Areas that are inundated or saturated by surface or
groundwater frequently or for a duration sufficient to support, a prevalence of vegetation
typically adapted for life in saturated soil conditions and generally wetlands include swamp,
marshes and similar areas (Lyon, 1993). According to the Ramsar International Convention,
article 1, wetlands are areas of marsh, fen, peatland or water, whether natural or artificial,
permanent or temporary, with water that is static or flowing, fresh, brackish or salt, including
areas of marine water the depth of which at low tide does not exceed six meters. The
Convention on Wetlands (Ramsar, Iran, 1971)-called the ‘Ramsar Convention’- is an
intergovernmental treaty that embodies the commitments of its member countries to maintain
FETEC’19 2nd International Symposium of Forest Engineering and Technologies
04-06 September 2019, Tirana
70
the ecological character of their wetlands of International Importance and to plan for the
‘wise use’, or sustainable use, of all of the wetlands in their territories (Ramsar Convention
Secretariat, 2007). Since Turkey has signed Ramsar Convention in 1994, the same definition
has been accepted and been used delineating wetlands (Güneş and Elvan, 2003).
In the light of the above definitions of wetlands, three main features are considered to be
essential for an area to be classified as a wetland (Foster et al., 2012). These are wetland
hydrology (the existence of water), hydric soils (wet or saturated soil permanently or
seasonally), and vegetation adapted to wet or saturated soils. Wetlands are essential parts of
ecosystems and biodiversity. Their importance for biodiversity and ecosystem are critical.
The plants and animal species mostly depends solely on wetlands in terms of habitat
necessity. In recent years, however, wetlands have begun to shrink due to mostly
anthropogenic pressures and also due to global climate changes. An example can be given for
the floodplain forests in Europe. Unfortunately, very few floodplain forests remain in Europe.
90% of their original area has disappeared and the remaining fragments are often in critical
condition.
The main objective of this paper is to raise an awareness about the role of wetlands in carbon
cycling, the implications of climate change for wetland functions and services, and mechanisms
to promote protection and restoration of wetlands for multiple benefits including carbon
sequestration. We have chosen this topic since we believe that most people are not well aware
of how important wetlands are. In this paper, firstly, scientific and legal definition of the
wetlands will be given. Secondly, the importance of wetlands will be explained under two
subtitles as “Ecosystem Goods and Services Provided by Wetland Ecosystems” and “The role
of wetlands in carbon cycling”. Thirdly, some information about “Wetlands in Turkey” will be
given and “Turkey's past, present and future wetland management approaches” will be briefly
explained. And finally, some solutions what to do and how to protect wetlands in Turkey will
be discussed.
2. ECOSYSTEM GOODS AND SERVICES PROVIDED BY WETLAND
ECOSYSTEMS
In comparison to other ecosystems, limited information exists on the goods and services
provided by wetlands. In summary, wetlands play an important role in landscape function,
including cycling of water and nutrients, food and fibre production, water purification,
regulation of flows, provision of habitats, and tourism and recreation services (Table 1).
There is also increasing evidence that wetlands have an important and under-estimated role in
both carbon storage and the regulation of greenhouse gas emissions (Zhang, 2019). Wetlands
tend to be sinks for carbon and nitrogen and sources for methane and sulfur compounds, but
situations vary from place to place, time to time and between wetland types (Foster et al.,
2012). The role of wetlands in carbon sequestration and storage has generally been under-
estimated. As wetlands are centers of high productivity in the landscape, they have a high
capacity to sequester and store carbon. As depositional areas, wetlands can also store carbon-
rich organic sediments. However, under anaerobic conditions, wetlands can also produce
greenhouse gases such as methane and nitrous oxide, though this is limited in saline
conditions. Clearing or drainage of wetlands can lead to large losses of stored organic carbon
to atmospheric carbon dioxide.
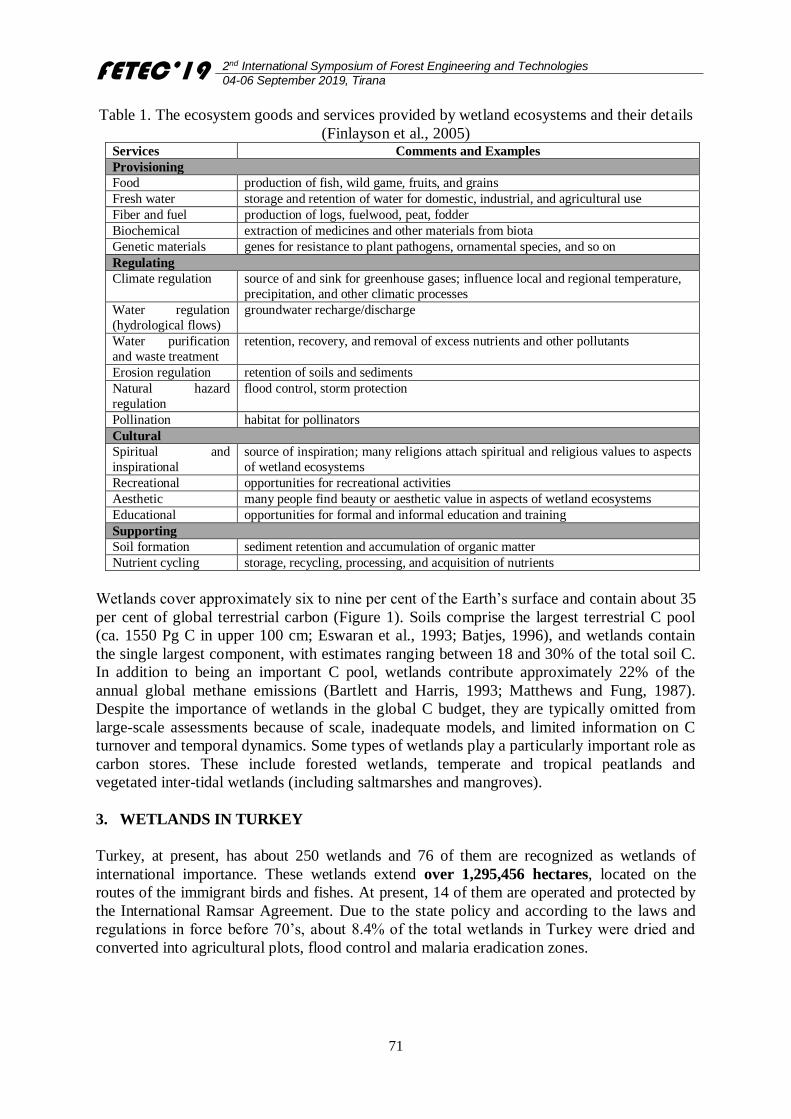
FETEC’19 2nd International Symposium of Forest Engineering and Technologies
04-06 September 2019, Tirana
71
Table 1. The ecosystem goods and services provided by wetland ecosystems and their details
(Finlayson et al., 2005) Services Comments and Examples
Provisioning
Food production of fish, wild game, fruits, and grains
Fresh water storage and retention of water for domestic, industrial, and agricultural use
Fiber and fuel production of logs, fuelwood, peat, fodder
Biochemical extraction of medicines and other materials from biota
Genetic materials genes for resistance to plant pathogens, ornamental species, and so on
Regulating
Climate regulation source of and sink for greenhouse gases; influence local and regional temperature,
precipitation, and other climatic processes
Water regulation
(hydrological flows)
groundwater recharge/discharge
Water purification
and waste treatment
retention, recovery, and removal of excess nutrients and other pollutants
Erosion regulation retention of soils and sediments
Natural hazard
regulation
flood control, storm protection
Pollination habitat for pollinators
Cultural
Spiritual and
inspirational
source of inspiration; many religions attach spiritual and religious values to aspects
of wetland ecosystems
Recreational opportunities for recreational activities
Aesthetic many people find beauty or aesthetic value in aspects of wetland ecosystems
Educational opportunities for formal and informal education and training
Supporting
Soil formation sediment retention and accumulation of organic matter
Nutrient cycling storage, recycling, processing, and acquisition of nutrients
Wetlands cover approximately six to nine per cent of the Earth’s surface and contain about 35
per cent of global terrestrial carbon (Figure 1). Soils comprise the largest terrestrial C pool
(ca. 1550 Pg C in upper 100 cm; Eswaran et al., 1993; Batjes, 1996), and wetlands contain
the single largest component, with estimates ranging between 18 and 30% of the total soil C.
In addition to being an important C pool, wetlands contribute approximately 22% of the
annual global methane emissions (Bartlett and Harris, 1993; Matthews and Fung, 1987).
Despite the importance of wetlands in the global C budget, they are typically omitted from
large-scale assessments because of scale, inadequate models, and limited information on C
turnover and temporal dynamics. Some types of wetlands play a particularly important role as
carbon stores. These include forested wetlands, temperate and tropical peatlands and
vegetated inter-tidal wetlands (including saltmarshes and mangroves).
3. WETLANDS IN TURKEY
Turkey, at present, has about 250 wetlands and 76 of them are recognized as wetlands of
international importance. These wetlands extend over 1,295,456 hectares, located on the
routes of the immigrant birds and fishes. At present, 14 of them are operated and protected by
the International Ramsar Agreement. Due to the state policy and according to the laws and
regulations in force before 70’s, about 8.4% of the total wetlands in Turkey were dried and
converted into agricultural plots, flood control and malaria eradication zones.
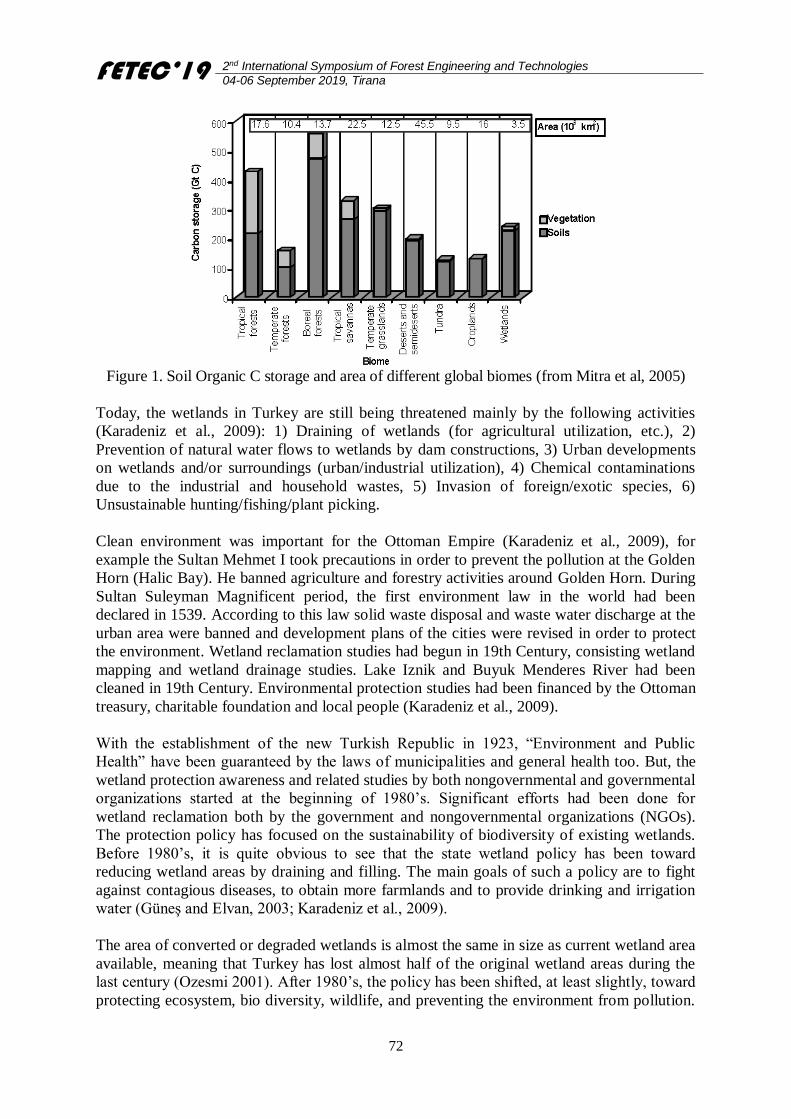
FETEC’19 2nd International Symposium of Forest Engineering and Technologies
04-06 September 2019, Tirana
72
Figure 1. Soil Organic C storage and area of different global biomes (from Mitra et al, 2005)
Today, the wetlands in Turkey are still being threatened mainly by the following activities
(Karadeniz et al., 2009): 1) Draining of wetlands (for agricultural utilization, etc.), 2)
Prevention of natural water flows to wetlands by dam constructions, 3) Urban developments
on wetlands and/or surroundings (urban/industrial utilization), 4) Chemical contaminations
due to the industrial and household wastes, 5) Invasion of foreign/exotic species, 6)
Unsustainable hunting/fishing/plant picking.
Clean environment was important for the Ottoman Empire (Karadeniz et al., 2009), for
example the Sultan Mehmet I took precautions in order to prevent the pollution at the Golden
Horn (Halic Bay). He banned agriculture and forestry activities around Golden Horn. During
Sultan Suleyman Magnificent period, the first environment law in the world had been
declared in 1539. According to this law solid waste disposal and waste water discharge at the
urban area were banned and development plans of the cities were revised in order to protect
the environment. Wetland reclamation studies had begun in 19th Century, consisting wetland
mapping and wetland drainage studies. Lake Iznik and Buyuk Menderes River had been
cleaned in 19th Century. Environmental protection studies had been financed by the Ottoman
treasury, charitable foundation and local people (Karadeniz et al., 2009).
With the establishment of the new Turkish Republic in 1923, “Environment and Public
Health” have been guaranteed by the laws of municipalities and general health too. But, the
wetland protection awareness and related studies by both nongovernmental and governmental
organizations started at the beginning of 1980’s. Significant efforts had been done for
wetland reclamation both by the government and nongovernmental organizations (NGOs).
The protection policy has focused on the sustainability of biodiversity of existing wetlands.
Before 1980’s, it is quite obvious to see that the state wetland policy has been toward
reducing wetland areas by draining and filling. The main goals of such a policy are to fight
against contagious diseases, to obtain more farmlands and to provide drinking and irrigation
water (Güneş and Elvan, 2003; Karadeniz et al., 2009).
The area of converted or degraded wetlands is almost the same in size as current wetland area
available, meaning that Turkey has lost almost half of the original wetland areas during the
last century (Ozesmi 2001). After 1980’s, the policy has been shifted, at least slightly, toward
protecting ecosystem, bio diversity, wildlife, and preventing the environment from pollution.
FETEC’19 2nd International Symposium of Forest Engineering and Technologies
04-06 September 2019, Tirana
73
For example, article 1 of the Environmental Statute of 2872 dated August 11, 1983 it is
essential to preserve the natural areas in which several plant and animal species have been
living and such areas as having scenic and natural beauties.
Ministry of Environment has been established in 1991 and this ministry declared the first
“Wetland Protection Circular” in 1993, then “Wetland Protection Regulation” had been
published in 2005. “National Wetland Commission” was established on 2000 and National
Wetland Strategy Plan for 2003-2008 was prepared. This commission prepared wetland
management plans for Goksu Lagoon, Manyas Lake, Uluabat Lake, and Gediz Delta before
the end of 2006. Wetland management plans of Sultansazligi, Kizilirmak Delta, Burdur Lake,
Eber and Aksehir Lake, Erzincan Wetlands, Adiyaman Lake and Yumurtalik Lagoon are
under preparation by the same commission.
On the other hand, it can be said that Turkish Republic does not have a strict and a well-
defined wetland policy. Even after having been a contracting parties of International Ramsar
Convention in 1993, Turkey have not provided enough protection and have not reached a
satisfactory protection level. As it is mentioned earlier, the surface wetlands constitute 6 to
9% of the terrestrial ecosystems, and some 60% of these areas are estimated to be floodplain
forests. International studies conducted in recent years have revealed that as well as the
ecological and biological richness of floodplain forests, these forests have an important place
in the areas where global organic carbon is stored (Sutfin et al., 2016). It has been reported
that floodplain forests are responsible for 0.5% to 8% of global organic carbon stocks.
Turkey has flooded forest areas in several regions, especially in the Marmara and Black Sea
Regions, but unfortunately only 11.400-hectare floodplain forests remain. There are studies
available on the general conditions, the flora and fauna of the floodplain forests, but in our
knowledge, there has been no study available in Turkey related to the role of floodplain
forests as carbon stocks. With 3800 ha areas, Bursa Karacabey floodplain forest is one of the
largest floodplain forests in Turkey. Consequently, it is worthwhile to consider the role of
wetlands in carbon sequestration and storage in Turkey and in the World, and the case for
investment in protection and restoration of wetlands for both carbon storage and other
benefits. Degradation of wetlands is a significant source of emissions of carbon dioxide to the
atmosphere.
4. CONCLUSION AND SUGGESTION
Wetlands show rich biological and ecological diversity, and if they are protected, they build an
important part of biological richness. Greater consideration needs to be given to the roles of
wetlands as carbon sources, sinks and storages, when designing climate protection and natural
resource programs. Information on the functions of specific types of Turkish wetlands is
required, to enable better evaluation of their contribution to climate change mitigation and
adaptation and to assist in design of programs for their protection, enhancement and restoration
for multiple benefits. The controversies of the wetland statutes have several consequences that
work against wetlands and have kept reducing their quality and quantities. The other important
controversy is that more than one agencies have authorized on the same wetland area.
Therefore, an administrative overlap comes out. Depending upon the lacking of collaboration
among those agencies it is quite obvious to watch that every conservation project will fail. As a
solution, a broad legislative revision is required to get rid such statutes as work against wetland
protection off.
FETEC’19 2nd International Symposium of Forest Engineering and Technologies
04-06 September 2019, Tirana
74
References
Bartlett, K.B., Harris, R.C. 1993. Review and assessment of methane emissions from
wetlands, Chemosphere, 26: 261-320.
Batjes, N.H. 1996. Total carbon and nitrogen in the soils of the world. European Journal of
Soil Science. 47: 151-163.
Cubbage, F.W., Jay, O., Charles, S.B. 1993. Forest Resources Policy, John Wiley & Sons,
Inc. New York, 615 p.
Eswaran, H., van der Berg, E., Reich, P. 1993. Organic carbon in soils of the world, Soil
Science Society of America Journal. 57: 192-194.
Finlayson, C.M., Bellio, M.G., Lowry, J.B. 2005. A conceptual basis for the wise use of
wetlands in northern Australia – linking information needs, integrated analyses, drivers of
change and human well-being. Marine & Freshwater Research. 56: 269-277
Foster, J., Evans, L., Curtin, A., Hill, B., et al. 2012. The Role of Wetlands in the Carbon
Cycle. the Department of Sustainability, Environment, Water, Population and
Communities in consultation with the Wetlands and Waterbirds Taskforce, Australian
Government.
Güneş, Y., Elvan, D. 2003. The impact of statutory controversies on wetland degradation in
Turkey. The XII World Forestry Congress, Quebec City, Canada.
Heimlich, R.E., Wiebe., K.D., Claassen., R., Gadsby, D., House, R.M. 1998. Wetlands and
Agriculture: Private Interests and Public Benefits, USDA, Agricultural Economic Report
Number 765, Washington, D.C., 94 p.
Karadeniz, N., Tırıl, A., Baylan, E. 2009. Wetland management in Turkey: Problems,
achievements and perspectives. African Journal of Agricultural Research. 4 (11): 1106-
1119
Lyon J.G. 1993. Wetland Identification and Delineation, Lewis Publishers, USA.
Matthews, E., Fung, I. 1987. Methane emissions from natural wetlands: global distribution,
area, and environmental characteristics of sources, Global Biogeochemical Cycles. 1: 61-
86.
Mitra, S., Wassmann, R., Vlek, P. 2005. An Appraisal of global wetland area and its organic
carbon stock. Current Science Vol 88, No 1, p.30.
Ozesmi, U., Stacy, O. 2001. Sulak Alanlar: Icimizdeki Deniz, Yesil Atlas, Sayi : 4, Kasim,
Istanbul, 30 p.
Ramsar Convention Secretariat, 2007. Managing wetlands: Frameworks for managing
Wetlands of International Importance and other wetland sites. Ramsar handbooks for the
wise use of wetlands, 3rd edition, vol. 16. Ramsar Convention Secretariat, Gland,
Switzerland.
Sutfin, N.A., Wohl, E.E., Dwire, K.A. 2016. Banking carbon: a review of organic carbon
storage and physical factors influencing retention in floodplains and riparian ecosystems.
Earth Surf. Proc. Land. 41:38–60.
Zhang, S., Lu, X., Zhang, Y., Nie, G., Li, Y. 2019. Estimation of Soil Organic Matter, Total
Nitrogen and Total Carbon in Sustainable Coastal Wetlands. Sustainability 11: 667;
doi:10.3390/su11030667.
FETEC’19 2nd International Symposium of Forest Engineering and Technologies
04-06 September 2019, Tirana
75
National Forest Inventory estimation and timber harvesting planning in
Albania
Kliti STARJA1, Arsen PROKO2, Elmaz ISLAMI2
1 Faculty of Forestry Sciences, AUT, Tirana, Albania 2 National Environment Agency, Tirana, Albania
Abstract
The National Forest Inventory is being conducted in Albania since 2017, using innovative
methodologies and state-of-the-art technologies. Through the analyses of some variables
estimated by the Albanian National Forest Inventory 2018 (ANFI 2018) in this paper we aim
demonstrating the contribution of ANFI 2018 to policy making and development of forest
economy in terms of Sustainable Forest Management (SFM). Forests represent an important
economic resource especially for mountainous areas in Albania, being for mountain
communities the main form of income. After the communist system collapse, the Albanian
forestry sector has been characterized by confused policy and reforms, intensive cutting, high
wild fires prevalence, which are far from the SFM. In 2017, a moratorium law was approved
by the Albanian government but not satisfactory results have been achieved because the fire
wood is the most traditional fuel material used by the rural population. Illegal cutting is a
major cause of forest damaging, both for the operation planning aspects and the hardware
requirements. Recently through the Strategic Declaration, the Albanian Government is
focusing more on the forest economy. In fact, forest organizational and technical problems
require a wider strategic and detailed planning level to reach the forest productivity level, by
applying good operational techniques. In particular, excellent knowledge of forest inventories
improves long-term management sustainability and efficiency allowing for a better
understanding of forest ecosystems. The work presented in this paper investigates the
capability to generate, manage and visualize detailed forest models using geospatial
information and combining ANFI2018 preliminary data. From the preliminary results we
suggest to the decision makers the best managerial options for SFM. The figures demonstrate
that Albania is rich in the forest area, but not so much in volumes, is characterized by an
uneven structure per age classes, dominated by young age forests and that in this stage the
silvicultural measures (secondary thinning) must dominate over the harvesting processes.
Key words: ANFI, remote sensing, SFM, Accessibility, forest production, secondary thinning
1. INTRODUCTION
Forests in the Mediterranean region represent an important economic resource for the
mountainous areas, being for a few regions and mountain communities the main source of
income. Forest organizational and technical issues require a wider strategic and detailed level
of planning to reach the level of productivity of forest by applying good operational
techniques. Excellent knowledge of forest inventories improves long-term management
sustainability and efficiency allowing for a better understanding of forest ecosystems. ANFI
system provides up-to-date information on the status of forest and pastures resources and
generates information on how these resources are changing over time, as a result of policies
and external developments. It serves as the basis for decisions in forestry, forest economy and
forest ecology related aspects. Currently the potential of forests producing fuel wood is of
particular interest.
FETEC’19 2nd International Symposium of Forest Engineering and Technologies
04-06 September 2019, Tirana
76
National Forest Inventories (NFIs) are becoming increasingly important worldwide in order
to provide information about the multiple functions of forests, e.g. their provision of raw
materials to the industry, biodiversity and their capacity to store carbon for mitigating climate
change. NFIs supply invaluable long term time series of forest states. Their typical purpose is
to provide information for the strategic level of forest and environmental decisions, not only
at national and sub-national level, but also at larger geographical scales, since data are
regularly reported to international organizations (FAO, 2010);(Europe, 2011). Nowadays
forests are managed to provide multiple ecosystem goods and services.
The history of NFI in Albania is not so long. The first ANFI was conducted in 1953, the
second one in 1968, and third one in 1985. With the increased needs for new and more
comprehensive information on forestry and forest-related issues, the first sample-based
national forest inventory in Albania (ANFI) was launched in 2004. The last ANFI is being
conducted during 2018-2019. The European National Forest Inventory Network (ENFIN)
was established in 2003 and has been successful in pan-European NFI harmonization. The
task of revising the NFIs is not trivial. In order to maintain time series that allow meaningful
comparisons across different time periods there is a need to maintain definitions and
assessment techniques, as well as a certain level of skills among the surveyors. Changes in
any of these factors may lead to data inconsistencies between different time periods.
However, it is imperative for NFIs to adapt to new information requirements and to adopt
new methods in order to be cost-efficient. Thus, changes must be made continuously or
otherwise the NFIs would become outdated (Wulff, 2004).
The forestry sector in Albania has changed drastically in the time in many aspects
(ownership, organization, administration). From the state own forest (100%) to municipality
forests (82), State forests (mainly protected areas 18%) and from Forest Enterprises (1990) –
to District Forestry Service (2015) – to municipality forest service (nowadays); from state
enterprise of wood harvesting and processing (1990) to private companies of harvesting
and/or wood processing.
2. METHODOLOGY
The aim of ANFI, based at the NEA, is to establish a sustainable forest and environmental
monitoring system, including technical resources, adequate methodologies and human
capacities, which can serve to provide the government, other stakeholders and international
organizations with national level data for policy, management strategies and international
reporting. Forest inventories are under the responsibility of the state. From the first to the last
ANFI the methodology has changed drastically. As a consequence of new methodological
approaches the data differ in structure, spectrum of forest indicators and in some cases also in
estimates. ANFI started in 1957 and has evolved from an inventory with a narrow focus on
wood resources to a current inventory which aims to provide information about all major
forest ecosystem services. It can be concluded that the traditional approaches of most ANFIs,
e.g. to collect data through sample plot field inventories, have proved applicable even for a
wide range of new information requirements. Specifically, detailed data about land use, trees,
vegetation, and soils have found new important uses in connection with biodiversity
assessments and the estimation of greenhouse gas emissions (Fridman J, Holm, Nilsson,
Hendstronm, & Stahl, 2014). The combination of NFI field data with remote sensing
techniques can offer good estimates for forest areas at national and regional levels (Fridman
J, Holm, Nilsson, Hendstronm, & Stahl, 2014).
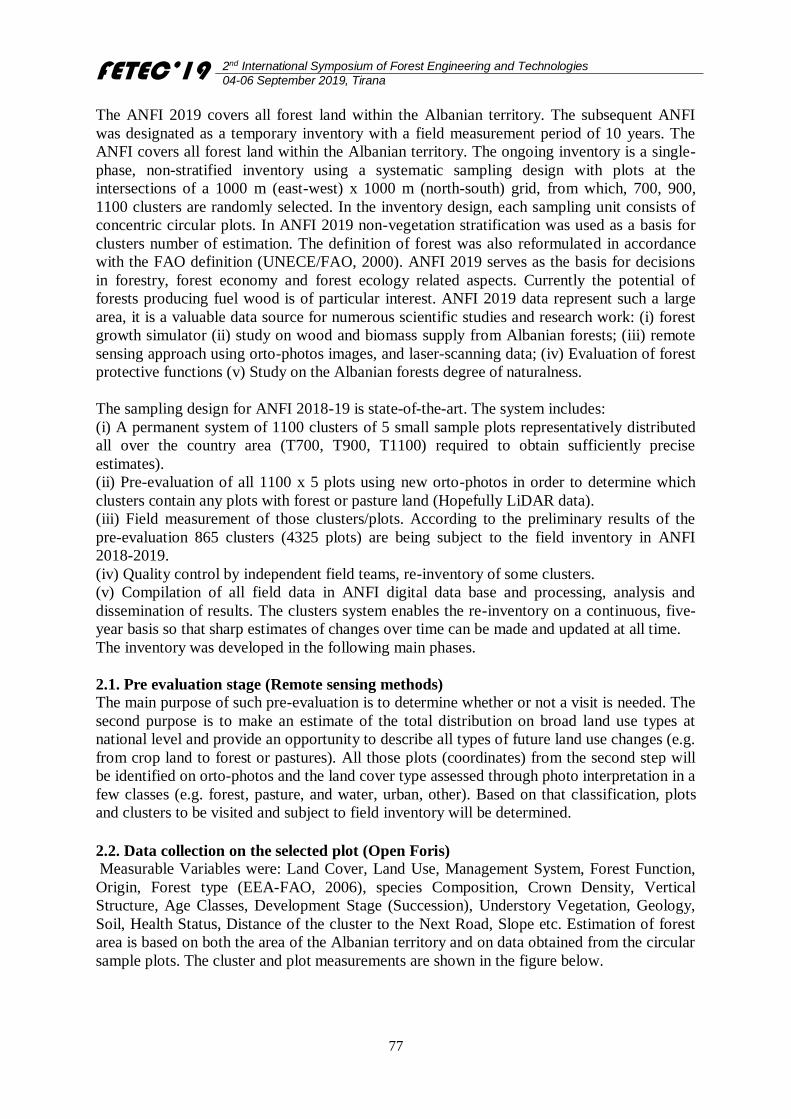
FETEC’19 2nd International Symposium of Forest Engineering and Technologies
04-06 September 2019, Tirana
77
The ANFI 2019 covers all forest land within the Albanian territory. The subsequent ANFI
was designated as a temporary inventory with a field measurement period of 10 years. The
ANFI covers all forest land within the Albanian territory. The ongoing inventory is a single-
phase, non-stratified inventory using a systematic sampling design with plots at the
intersections of a 1000 m (east-west) x 1000 m (north-south) grid, from which, 700, 900,
1100 clusters are randomly selected. In the inventory design, each sampling unit consists of
concentric circular plots. In ANFI 2019 non-vegetation stratification was used as a basis for
clusters number of estimation. The definition of forest was also reformulated in accordance
with the FAO definition (UNECE/FAO, 2000). ANFI 2019 serves as the basis for decisions
in forestry, forest economy and forest ecology related aspects. Currently the potential of
forests producing fuel wood is of particular interest. ANFI 2019 data represent such a large
area, it is a valuable data source for numerous scientific studies and research work: (i) forest
growth simulator (ii) study on wood and biomass supply from Albanian forests; (iii) remote
sensing approach using orto-photos images, and laser-scanning data; (iv) Evaluation of forest
protective functions (v) Study on the Albanian forests degree of naturalness.
The sampling design for ANFI 2018-19 is state-of-the-art. The system includes:
(i) A permanent system of 1100 clusters of 5 small sample plots representatively distributed
all over the country area (T700, T900, T1100) required to obtain sufficiently precise
estimates).
(ii) Pre-evaluation of all 1100 x 5 plots using new orto-photos in order to determine which
clusters contain any plots with forest or pasture land (Hopefully LiDAR data).
(iii) Field measurement of those clusters/plots. According to the preliminary results of the
pre-evaluation 865 clusters (4325 plots) are being subject to the field inventory in ANFI
2018-2019.
(iv) Quality control by independent field teams, re-inventory of some clusters.
(v) Compilation of all field data in ANFI digital data base and processing, analysis and
dissemination of results. The clusters system enables the re-inventory on a continuous, five-
year basis so that sharp estimates of changes over time can be made and updated at all time.
The inventory was developed in the following main phases.
2.1. Pre evaluation stage (Remote sensing methods)
The main purpose of such pre-evaluation is to determine whether or not a visit is needed. The
second purpose is to make an estimate of the total distribution on broad land use types at
national level and provide an opportunity to describe all types of future land use changes (e.g.
from crop land to forest or pastures). All those plots (coordinates) from the second step will
be identified on orto-photos and the land cover type assessed through photo interpretation in a
few classes (e.g. forest, pasture, and water, urban, other). Based on that classification, plots
and clusters to be visited and subject to field inventory will be determined. 2.2. Data collection on the selected plot (Open Foris)
Measurable Variables were: Land Cover, Land Use, Management System, Forest Function,
Origin, Forest type (EEA-FAO, 2006), species Composition, Crown Density, Vertical
Structure, Age Classes, Development Stage (Succession), Understory Vegetation, Geology,
Soil, Health Status, Distance of the cluster to the Next Road, Slope etc. Estimation of forest
area is based on both the area of the Albanian territory and on data obtained from the circular
sample plots. The cluster and plot measurements are shown in the figure below.
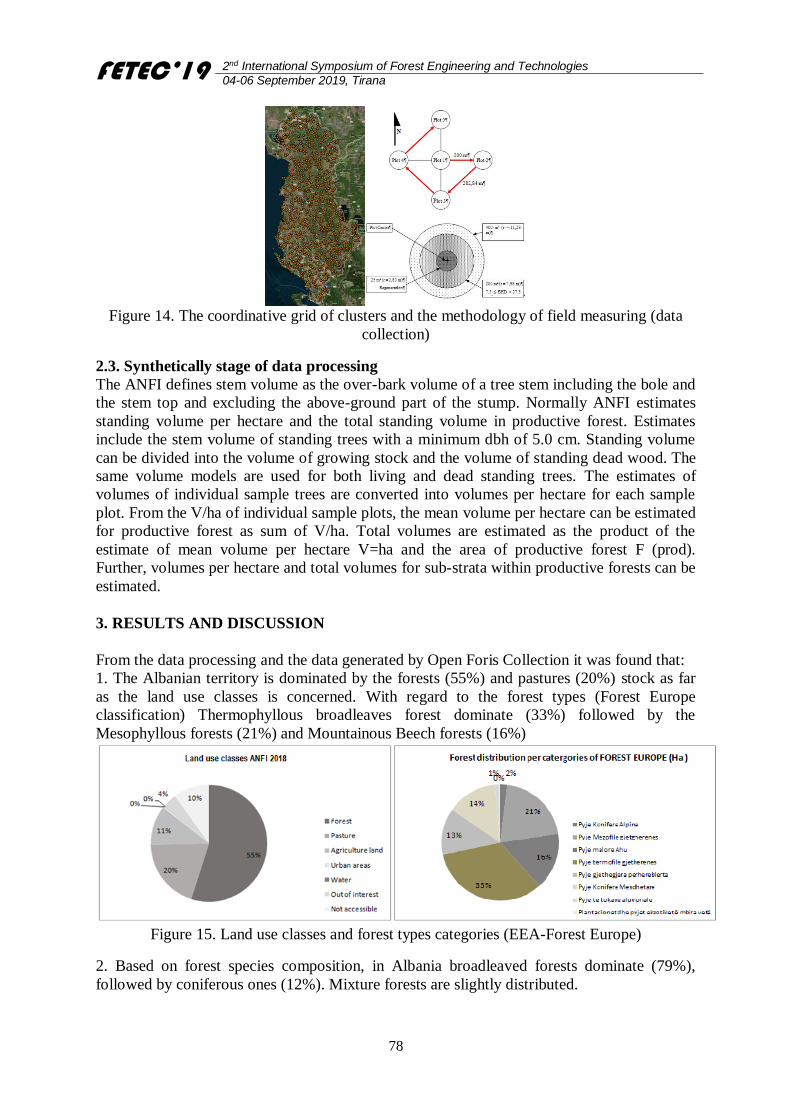
FETEC’19 2nd International Symposium of Forest Engineering and Technologies
04-06 September 2019, Tirana
78
Figure 14. The coordinative grid of clusters and the methodology of field measuring (data
collection)
2.3. Synthetically stage of data processing
The ANFI defines stem volume as the over-bark volume of a tree stem including the bole and
the stem top and excluding the above-ground part of the stump. Normally ANFI estimates
standing volume per hectare and the total standing volume in productive forest. Estimates
include the stem volume of standing trees with a minimum dbh of 5.0 cm. Standing volume
can be divided into the volume of growing stock and the volume of standing dead wood. The
same volume models are used for both living and dead standing trees. The estimates of
volumes of individual sample trees are converted into volumes per hectare for each sample
plot. From the V/ha of individual sample plots, the mean volume per hectare can be estimated
for productive forest as sum of V/ha. Total volumes are estimated as the product of the
estimate of mean volume per hectare V=ha and the area of productive forest F (prod).
Further, volumes per hectare and total volumes for sub-strata within productive forests can be
estimated.
3. RESULTS AND DISCUSSION
From the data processing and the data generated by Open Foris Collection it was found that:
1. The Albanian territory is dominated by the forests (55%) and pastures (20%) stock as far
as the land use classes is concerned. With regard to the forest types (Forest Europe
classification) Thermophyllous broadleaves forest dominate (33%) followed by the
Mesophyllous forests (21%) and Mountainous Beech forests (16%)
Figure 15. Land use classes and forest types categories (EEA-Forest Europe)
2. Based on forest species composition, in Albania broadleaved forests dominate (79%),
followed by coniferous ones (12%). Mixture forests are slightly distributed.
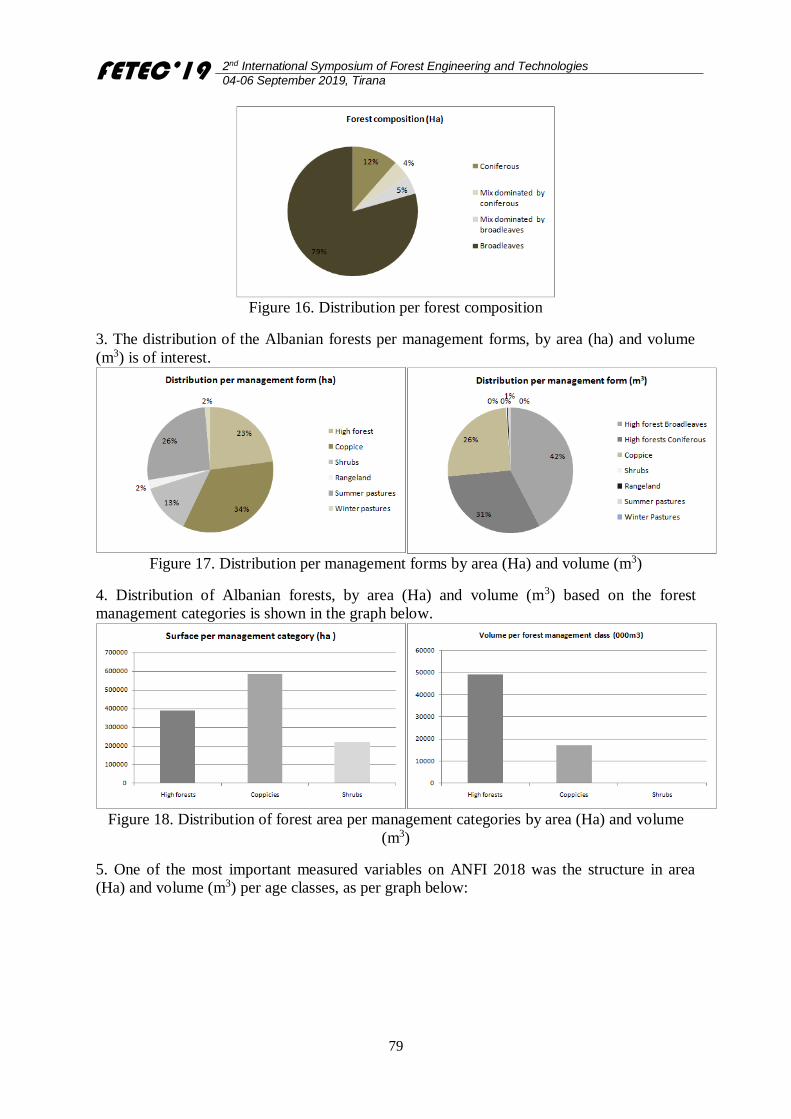
FETEC’19 2nd International Symposium of Forest Engineering and Technologies
04-06 September 2019, Tirana
79
Figure 16. Distribution per forest composition
3. The distribution of the Albanian forests per management forms, by area (ha) and volume
(m3) is of interest.
Figure 17. Distribution per management forms by area (Ha) and volume (m3)
4. Distribution of Albanian forests, by area (Ha) and volume (m3) based on the forest
management categories is shown in the graph below.
Figure 18. Distribution of forest area per management categories by area (Ha) and volume
(m3)
5. One of the most important measured variables on ANFI 2018 was the structure in area
(Ha) and volume (m3) per age classes, as per graph below:
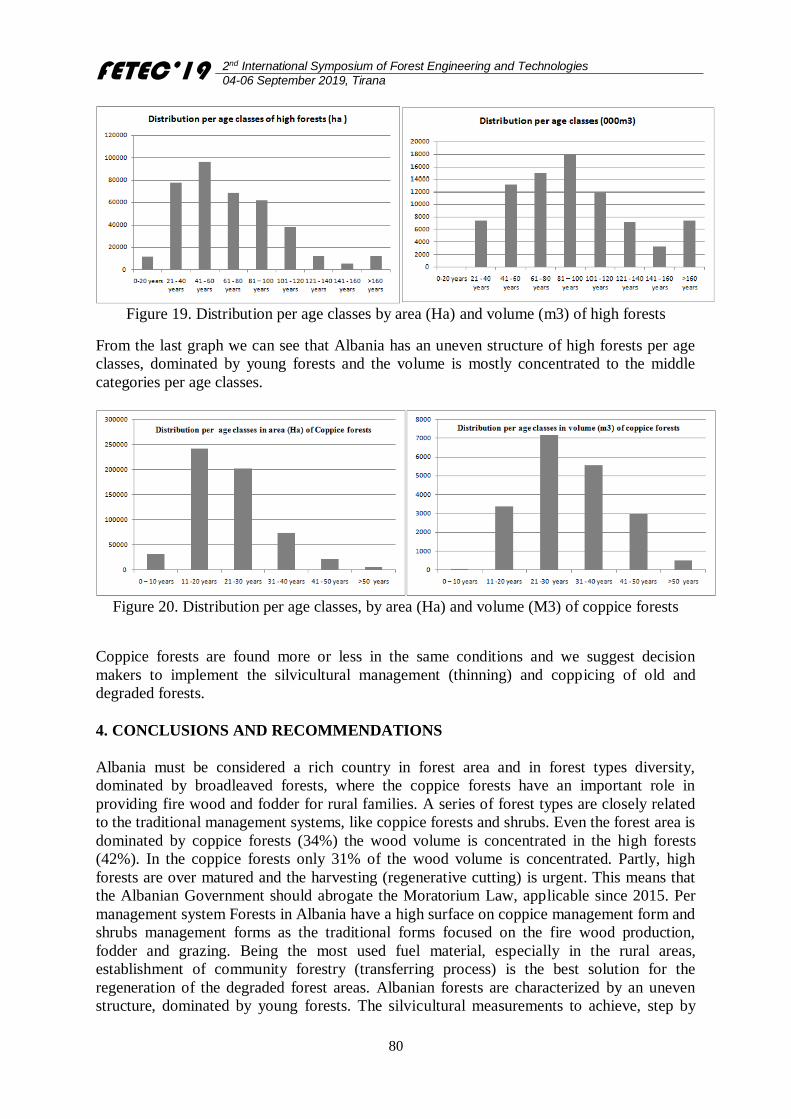
FETEC’19 2nd International Symposium of Forest Engineering and Technologies
04-06 September 2019, Tirana
80
Figure 19. Distribution per age classes by area (Ha) and volume (m3) of high forests
From the last graph we can see that Albania has an uneven structure of high forests per age
classes, dominated by young forests and the volume is mostly concentrated to the middle
categories per age classes.
Figure 20. Distribution per age classes, by area (Ha) and volume (M3) of coppice forests
Coppice forests are found more or less in the same conditions and we suggest decision
makers to implement the silvicultural management (thinning) and coppicing of old and
degraded forests.
4. CONCLUSIONS AND RECOMMENDATIONS
Albania must be considered a rich country in forest area and in forest types diversity,
dominated by broadleaved forests, where the coppice forests have an important role in
providing fire wood and fodder for rural families. A series of forest types are closely related
to the traditional management systems, like coppice forests and shrubs. Even the forest area is
dominated by coppice forests (34%) the wood volume is concentrated in the high forests
(42%). In the coppice forests only 31% of the wood volume is concentrated. Partly, high
forests are over matured and the harvesting (regenerative cutting) is urgent. This means that
the Albanian Government should abrogate the Moratorium Law, applicable since 2015. Per
management system Forests in Albania have a high surface on coppice management form and
shrubs management forms as the traditional forms focused on the fire wood production,
fodder and grazing. Being the most used fuel material, especially in the rural areas,
establishment of community forestry (transferring process) is the best solution for the
regeneration of the degraded forest areas. Albanian forests are characterized by an uneven
structure, dominated by young forests. The silvicultural measurements to achieve, step by
FETEC’19 2nd International Symposium of Forest Engineering and Technologies
04-06 September 2019, Tirana
81
step, a normal structure per age classes must be a strategic policy, toward an effective forest
economy. Taking into consideration the Albanian forest state, the forest policy should focus
on the silvicultural measurements (secondary thinning), which can provide fire wood and
employment opportunities to the people living in remote areas.
References
EEA-FAO. (2006). European forest types Categories and types for sustainable forest
management reporting and policy. Copenhagen: Office for Official Publications of the
European Communities.
Europe, F. (2011). State of Europe's forests 2011. Status and trends in sustainable forest
management in Europe. Rom: UNECE, FAO, ISBN: 978-82-92980-05-7.
FAO. (2010). Global forest resources assessment. Rom: FAO Forestry report 163, ISSN:
0258-6150.
Fridman J, e. a., Holm, S., Nilsson, P., Hendstronm, A. R., & Stahl, G. (2014). Adapting
National Forest Inventories to changing requirements – the case of the Swedish National
Forest Inventory at the turn of the 20th century. . Silva Fennica, vol. 48 .
UNECE/FAO. (2000). Forest Resources of Europe, CIS, North America, Australia, Japan and
New Zealand (industrialized temperate/boreal countries. UN-ECE/FAO contribution to the
Global Forest Resources Assessment 2000. Main report. UN: Geneva Timber and Forest
Study Papers.
Wulff, S. (2004). Nonsampling errorsin ocular assessments – Swedish experiences of
observer influences on forest damage assessments. In: Environmental monitoring. CRC
Press. http://dx.doi.org/10.1201/9780203495476.ch13. , 337–346.
FETEC’19 2nd International Symposium of Forest Engineering and Technologies
04-06 September 2019, Tirana
82
Impact of Forest Management Practices on Climate Change
Nuray MISIR*, Mehmet MISIR, Abdullah YILDIZ
Department of Forest Engineering, Faculty of Forestry, Karadeniz Technical University, Turkey
Abstract
The forests are a net primary source of Renewable Energy Sources and also the greater
carbon pool after the oceans. Therefore, increasing forest cover through afforestation and
reforestation is expected to play a strategic and twofold role in the new low carbon economy
by contributing to the targets of 2050 as a Renewable Energy Sources provider on one hand
and as a major carbon pool on the other. Moreover, decision 529/2013/EU, on accounting
rules regarding Greenhouse Gas emissions and removals stipulates that all land use should be
considered in a holistic manner and Land Use, Land Use Change and Forestry (LULUCF)
should be addressed within the Union’s climate policy. EU Regulation 2018/841 amended
EU Regulation No 525/2013 and decision No 592/2013/EU, on the inclusion of greenhouse
gas emissions and removals from Land Use, Land Use Change and Forestry in the EU 2030
climate and energy framework. According to this regulation Member States should submit
national forestry accounting plans to the Commission, including forest reference levels. The
present work sets the grounds for incorporating carbon balance into forest management
practices in line with the reporting rules of the EU.
Keywords: Climate change, Forest management, Carbon sequestration
1. INTRODUCTION
The development of forest management strategies for addressing climate change has become
an increasingly important issue around the globe. Currently, management approaches are
being proposed that intend to mitigate climate change by enhancing forest carbon stores
(D’Amato et al., 2011).
Incorporating carbon sequestration and storage in forest management raises a lot of questions
regarding age, rotation period, stand structure and mixture, as well as management practices.
Different analyses of national or local forest systems reveal that cessation of forest
management in productive forests would yield much lower mitigation effects than those
provided by the substitution effect of the currently harvested wood (SFC, 2010). Carbon
sequestration should only be one of the goals that drive forest management decisions in
relation to climate change. Optimal achievement of multiple benefits across the landscape
may require maintaining an assortment of management strategies to enhance ecosystem
resilience while improving production and carbon storage (Lindner et al., 2014; Sharma et al.,
2016).
The rationale behind the present work is firstly to obtain knowledge about carbon stocks in
Anatolian black pine forests in order to set a baseline and be able to monitor their changes
and secondly to provide insight into the impact of different management practices on the
carbon stock of Anatolian black pine forests.
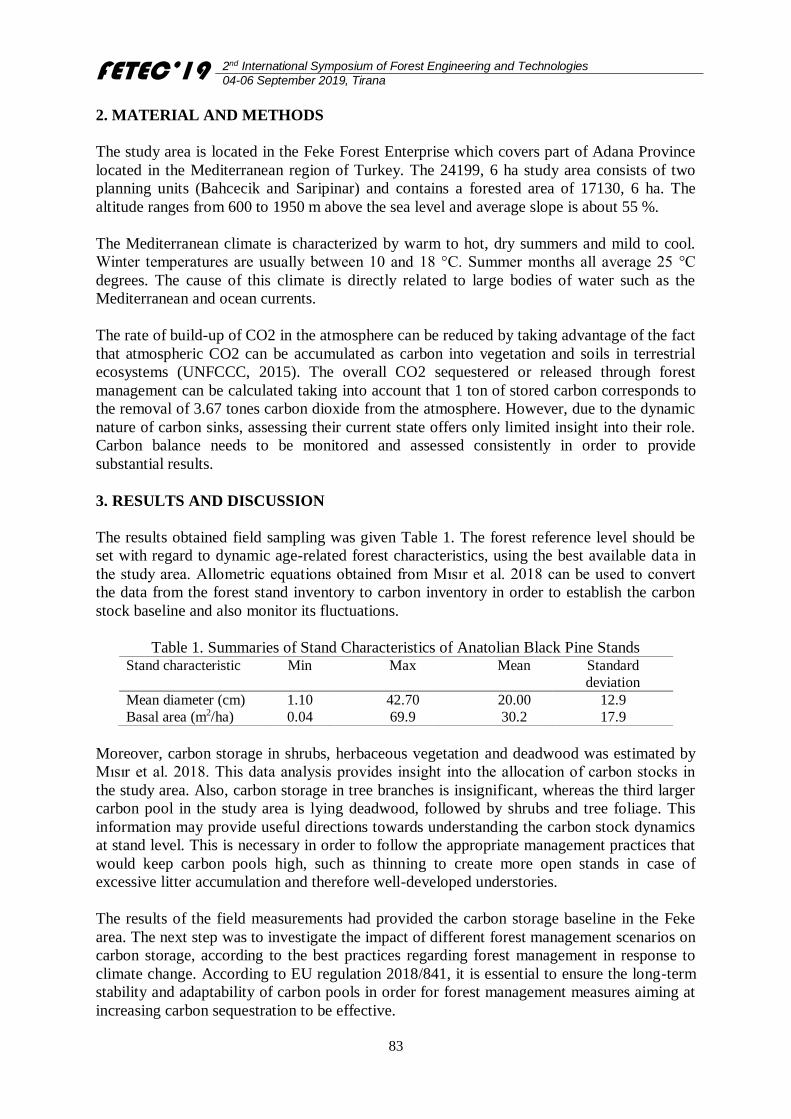
FETEC’19 2nd International Symposium of Forest Engineering and Technologies
04-06 September 2019, Tirana
83
2. MATERIAL AND METHODS
The study area is located in the Feke Forest Enterprise which covers part of Adana Province
located in the Mediterranean region of Turkey. The 24199, 6 ha study area consists of two
planning units (Bahcecik and Saripinar) and contains a forested area of 17130, 6 ha. The
altitude ranges from 600 to 1950 m above the sea level and average slope is about 55 %.
The Mediterranean climate is characterized by warm to hot, dry summers and mild to cool.
Winter temperatures are usually between 10 and 18 °C. Summer months all average 25 °C
degrees. The cause of this climate is directly related to large bodies of water such as the
Mediterranean and ocean currents.
The rate of build-up of CO2 in the atmosphere can be reduced by taking advantage of the fact
that atmospheric CO2 can be accumulated as carbon into vegetation and soils in terrestrial
ecosystems (UNFCCC, 2015). The overall CO2 sequestered or released through forest
management can be calculated taking into account that 1 ton of stored carbon corresponds to
the removal of 3.67 tones carbon dioxide from the atmosphere. However, due to the dynamic
nature of carbon sinks, assessing their current state offers only limited insight into their role.
Carbon balance needs to be monitored and assessed consistently in order to provide
substantial results.
3. RESULTS AND DISCUSSION
The results obtained field sampling was given Table 1. The forest reference level should be
set with regard to dynamic age-related forest characteristics, using the best available data in
the study area. Allometric equations obtained from Mısır et al. 2018 can be used to convert
the data from the forest stand inventory to carbon inventory in order to establish the carbon
stock baseline and also monitor its fluctuations.
Table 1. Summaries of Stand Characteristics of Anatolian Black Pine Stands Stand characteristic Min Max Mean Standard
deviation
Mean diameter (cm) 1.10 42.70 20.00 12.9
Basal area (m2/ha) 0.04 69.9 30.2 17.9
Moreover, carbon storage in shrubs, herbaceous vegetation and deadwood was estimated by
Mısır et al. 2018. This data analysis provides insight into the allocation of carbon stocks in
the study area. Also, carbon storage in tree branches is insignificant, whereas the third larger
carbon pool in the study area is lying deadwood, followed by shrubs and tree foliage. This
information may provide useful directions towards understanding the carbon stock dynamics
at stand level. This is necessary in order to follow the appropriate management practices that
would keep carbon pools high, such as thinning to create more open stands in case of
excessive litter accumulation and therefore well-developed understories.
The results of the field measurements had provided the carbon storage baseline in the Feke
area. The next step was to investigate the impact of different forest management scenarios on
carbon storage, according to the best practices regarding forest management in response to
climate change. According to EU regulation 2018/841, it is essential to ensure the long-term
stability and adaptability of carbon pools in order for forest management measures aiming at
increasing carbon sequestration to be effective.
FETEC’19 2nd International Symposium of Forest Engineering and Technologies
04-06 September 2019, Tirana
84
Forest management and natural disturbances, such as forest fires and severe insect outbreaks
influence the carbon stocks in forest ecosystems. Forests sequester carbon by capturing
carbon dioxide from the atmosphere and transforming it into biomass through photosynthesis.
Sequestered carbon is then accumulated in the form of biomass, deadwood, litter and in forest
soil.
Forest ecosystems release carbon through natural processes as well as a deliberate or
unintended result of human activities. A decrease in a pool relative to the reference level
should be accounted for as emissions. Specific national circumstances and practices, such as
lower harvest intensity than usual or ageing forests during the reference period, should also
be taken into account (European Commission, 2018).
To facilitate data collection and methodology improvement, land use should be inventoried
and reported using geographical tracking of each land area. The best use should be made of
existing land use change tracking programs and surveys. Data management, including sharing
of data for reporting, reuse and dissemination, should conform to the requirements provided
for in Directive 2007/2/EC (European Commission, 2018).
In cases where the net balance of carbon emissions by forests is negative, i.e. carbon
sequestration prevails; forests contribute to mitigating carbon emissions by acting as both a
carbon reservoir and a tool to sequester additional carbon. In cases when the net balance of
carbon emissions is positive, forests contribute to enhancing greenhouse effect and climate
change.
4. CONCLUSION AND SUGGESTIONS
The density of forest stands during their life cycle needs to be actively modified by forest
managers in order to improve stand conditions, reduce competition-induced tree mortality
and to avoid natural disturbances such as storm damage and insects’ infestation. Stand
thinning has a long history in practical forest management. However, in the context of carbon
sequestration, thinning removes amounts of carbon sequestered in biomass and dead organic
matter for the sake of sustainability, improved stand stability and longevity.
Tree species composition, which can be altered by silvicultural methods, affects soil carbon
storage by direct and indirect effects on the quality and quantity of litter fall, through fall and
stem flow, soil properties, rooting patterns, soil respiration and consequently the nutrient
availability in forest stands (Berger et al. 2002; Bayramzadeh, 2014).
According to the rules of the Kyoto Protocol and of the UN Framework Convention on
Climate Change, forestry can generate a sink for GHG that can contribute to meeting the
commitments to emissions reductions (Jandl et al., 2007). Managing mountain forests is also
very important for society generally and especially for communities in densely populated
mountain regions (Frehner et al., 2007).
Different analyses of national or local forest systems reveal that cessation of forest
management in productive forests would yield much lower mitigation effects than those
provided by the substitution effect of the currently harvested wood (SFC, 2010).
FETEC’19 2nd International Symposium of Forest Engineering and Technologies
04-06 September 2019, Tirana
85
References
Bayramzadeh, V. 2014. Does tree species composition control the soil carbon stocks of the
Hyrcanian forest in the Northern Iran? (A case study in Guilan province, Iran). Journal of
Forestry Research, 25(1): 143-146.
Berger, T., Neubauer, Ch, Glatzel, G. 2002. Factors controlling soil carbon and nitrogen
stores
in pure stands of Norway spruce (Picea abies) and mixed species stands in Austria. Forest
Ecol Manage, 159(1-2): 3-14.
D’Amato, A.W., Bradford, J. B., Fraver, S., Palik, B. J. 2011. Forest management for
mitigation and adaptation to climate change: Insights from long-term silviculture
experiments. Forest Ecology and Management. 262: 803–816. EU Commission, 2018. Regulation 2018/841 of the European Parliament and of the Council
of 30 May 2018 on the inclusion of greenhouse gas emissions and removals from land use,
land use change and forestry in the 2030 climate and energy framework, and amending
Regulation (EU) No 525/2013 and Decision No 529/2013/EU.
Frehner, M., Wasser, B., Schwitter, R. 2007. Sustainability and Success Monitoring in
Protection Forests. Guidelines for Managing Forests with Protective Functions. Federal
Office for the Environment FOEN, Bern.
Jandl, R., Vesterdal, L., Olsson, M., Bens, O., Badeck, F., Rock, J. 2007. Carbon
sequestration and forest management. CAB Reviews: Perspectives in Agriculture,
Veterinary Science, Nutrition and Natural Resources. 2: No. 017.
Lindner, M., Fitzgerald, J.B., Zimmermann, N.E., Reyer, C., Delzon, S., van der Maaten, E.,
Hanewinkel, M. 2014. Climate change and European forests: What do we know, what are
the uncertainties, and what are the implications for forest management? Journal of
Environmental Management, 146:69-83.
Mısır, N., Vlachaki, D.M., Mısır, M., Galatsidas, S., Karanikola, P. 2018. Ormanlarda
Karbon Birikimini Arttırmaya Yönelik Ortak Amenajman Rehberi, Development of a
Common Protocol to Assess the Impact of Forest Management Practices on Climate
Change (D4.5), In EuropeAid Project Reference No: TR2013/0327.05.01-02/124,
Karadeniz Technical University, Trabzon, Turkey.
Sharma, A., Bohn, K., Jose, S., Dwivedi, P. 2016. Even-Aged vs. Uneven-Aged Silviculture:
Implications for Multifunctional Management of Southern Pine Ecosystems. Forests. 7(4):
86. Standing Forestry Committee (SFC). 2010. Climate Change and Forestry. Retrieved from
https://ec.europa.eu/agriculture/sites/agriculture/files/fore/publi/wg3-112010_en.pdf.
FETEC’19 2nd International Symposium of Forest Engineering and Technologies
04-06 September 2019, Tirana
86
An Evaluation of General Situation and Importance of Forest Roads:
Turkish Forestry
Selçuk GÜMÜŞ1, Taha Yasin HATAY1*, Saliha ÜNVER OKAN1
1Karadeniz Technical University, Forest Engineering Department, 61080, Trabzon, Turkey *[email protected]
Abstract
This study is a cross-sectional and finding comparison study. The relationship between forest
roads and forest wealth in Turkey were investigated. Systematic road networks in Turkey, the
amount and density of forest road were determined. The length of the roads that can be used in
forestry activities is 260 589 km (including village roads). The length of the roads planned to be
used in forestry is 307 000 km. Turkey's total forest area and the actual road density are 22 621
935 ha and 11.52 m/ha, respectively in 2018. As a result, the planning stage of forest roads,
which are indispensable elements of sustainable forestry activities, should be based on
optimum utilization. By optimizing forest road networks, social and ecological benefits other
than the production function should be taken into consideration. Planning criteria should be
determined according to functional purpose.
Keywords: Forest roads, Forest road density, Forest road network, Turkey
1. INTRODUCTION
Rapid and uncontrolled irregular urbanization began in the 1950s in Turkey. Meanwhile,
people have started building more roads. As the importance of the positive and negative
consequences of these phenomena gradually increased, the transportation sector was included
in the planning. Roads are classified in four groups in Turkey as: state roads, provincial roads,
village roads, forest roads. State roads are the major primary roads connecting the important
regional and provincial centres with the railway station, airport zones, seaport for seaway.
High-traffic roads such as motorways or Express roads fall into this category. They are built to
provide high speed and safe transportation. They are closed to non-motor vehicles and slow-
moving motor vehicles. They are composed of four lanes in the form of at least two runs and
two arrivals. Provincial roads are of second degree importance within the provincial border
which does not belong to the state roads class. These roads connect big cities and district cities
to each other and connect to neighbouring city from province. They are also connected to major
tourist and industrial centres, ports and stations. Village roads are defined as all roads other
than forest roads that are not in the State road and Provincial road network. General Directorate
of Highways conducts studies related to all village roads in Turkey. These roads generally have
the purpose of providing people with access to goods and services and providing access to rural
areas. Roads are the structures which are open to public benefit for vehicles and pedestrians
(Umar and Yayla, 2004), providing the basic infrastructure of the transport network and the
connections of topographical different areas and objects (Dube et al., 2004), transferring all
kinds of weight to the ground (Aykut and Demir, 2004), having infrastructure, superstructure
and positive effect on the purchase of goods and services. These structures can have various
ecological, economic and social impacts on geographical terrain and humanity (Akay and
Session, 2005; Bjorklund, 2006; Cofin 2007; Caliskan and Caglar, 2010).
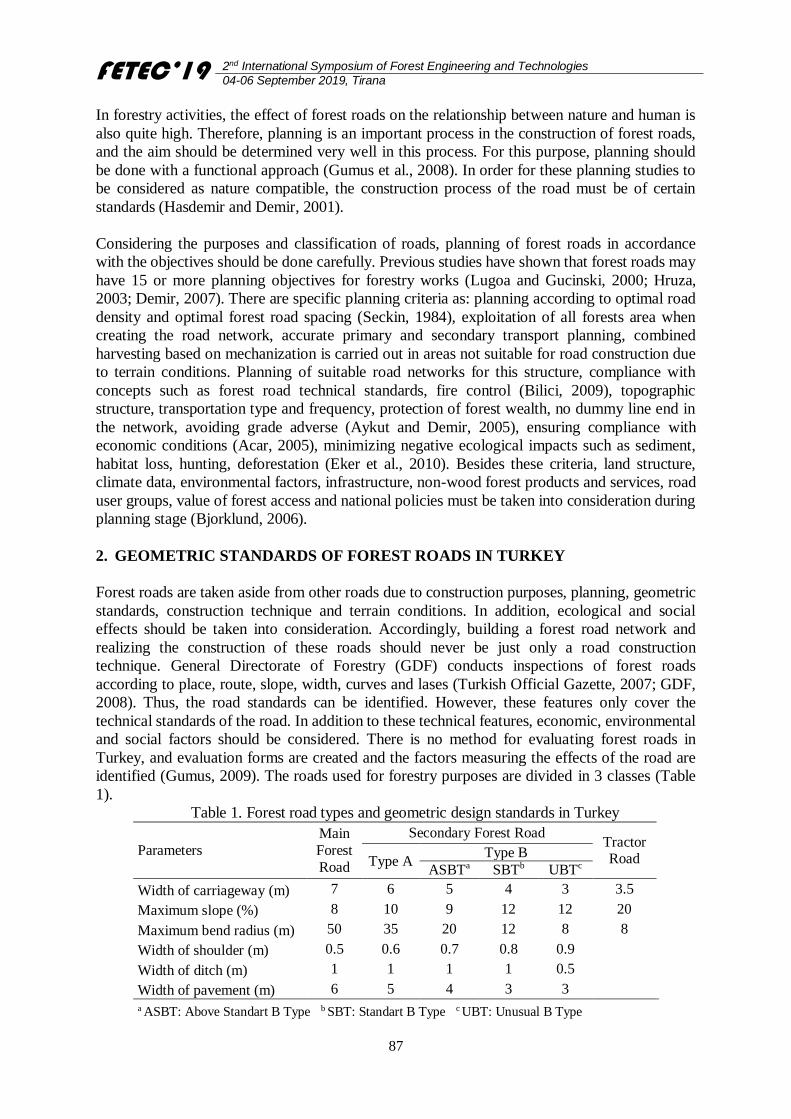
FETEC’19 2nd International Symposium of Forest Engineering and Technologies
04-06 September 2019, Tirana
87
In forestry activities, the effect of forest roads on the relationship between nature and human is
also quite high. Therefore, planning is an important process in the construction of forest roads,
and the aim should be determined very well in this process. For this purpose, planning should
be done with a functional approach (Gumus et al., 2008). In order for these planning studies to
be considered as nature compatible, the construction process of the road must be of certain
standards (Hasdemir and Demir, 2001).
Considering the purposes and classification of roads, planning of forest roads in accordance
with the objectives should be done carefully. Previous studies have shown that forest roads may
have 15 or more planning objectives for forestry works (Lugoa and Gucinski, 2000; Hruza,
2003; Demir, 2007). There are specific planning criteria as: planning according to optimal road
density and optimal forest road spacing (Seckin, 1984), exploitation of all forests area when
creating the road network, accurate primary and secondary transport planning, combined
harvesting based on mechanization is carried out in areas not suitable for road construction due
to terrain conditions. Planning of suitable road networks for this structure, compliance with
concepts such as forest road technical standards, fire control (Bilici, 2009), topographic
structure, transportation type and frequency, protection of forest wealth, no dummy line end in
the network, avoiding grade adverse (Aykut and Demir, 2005), ensuring compliance with
economic conditions (Acar, 2005), minimizing negative ecological impacts such as sediment,
habitat loss, hunting, deforestation (Eker et al., 2010). Besides these criteria, land structure,
climate data, environmental factors, infrastructure, non-wood forest products and services, road
user groups, value of forest access and national policies must be taken into consideration during
planning stage (Bjorklund, 2006).
2. GEOMETRIC STANDARDS OF FOREST ROADS IN TURKEY
Forest roads are taken aside from other roads due to construction purposes, planning, geometric
standards, construction technique and terrain conditions. In addition, ecological and social
effects should be taken into consideration. Accordingly, building a forest road network and
realizing the construction of these roads should never be just only a road construction
technique. General Directorate of Forestry (GDF) conducts inspections of forest roads
according to place, route, slope, width, curves and lases (Turkish Official Gazette, 2007; GDF,
2008). Thus, the road standards can be identified. However, these features only cover the
technical standards of the road. In addition to these technical features, economic, environmental
and social factors should be considered. There is no method for evaluating forest roads in
Turkey, and evaluation forms are created and the factors measuring the effects of the road are
identified (Gumus, 2009). The roads used for forestry purposes are divided in 3 classes (Table
1).
Table 1. Forest road types and geometric design standards in Turkey
Parameters
Main
Forest
Road
Secondary Forest Road Tractor Road Type A
Type B
ASBTa SBTb UBTc
Width of carriageway (m) 7 6 5 4 3 3.5
Maximum slope (%) 8 10 9 12 12 20
Maximum bend radius (m) 50 35 20 12 8 8
Width of shoulder (m) 0.5 0.6 0.7 0.8 0.9
Width of ditch (m) 1 1 1 1 0.5
Width of pavement (m) 6 5 4 3 3
a ASBT: Above Standart B Type b SBT: Standart B Type c UBT: Unusual B Type
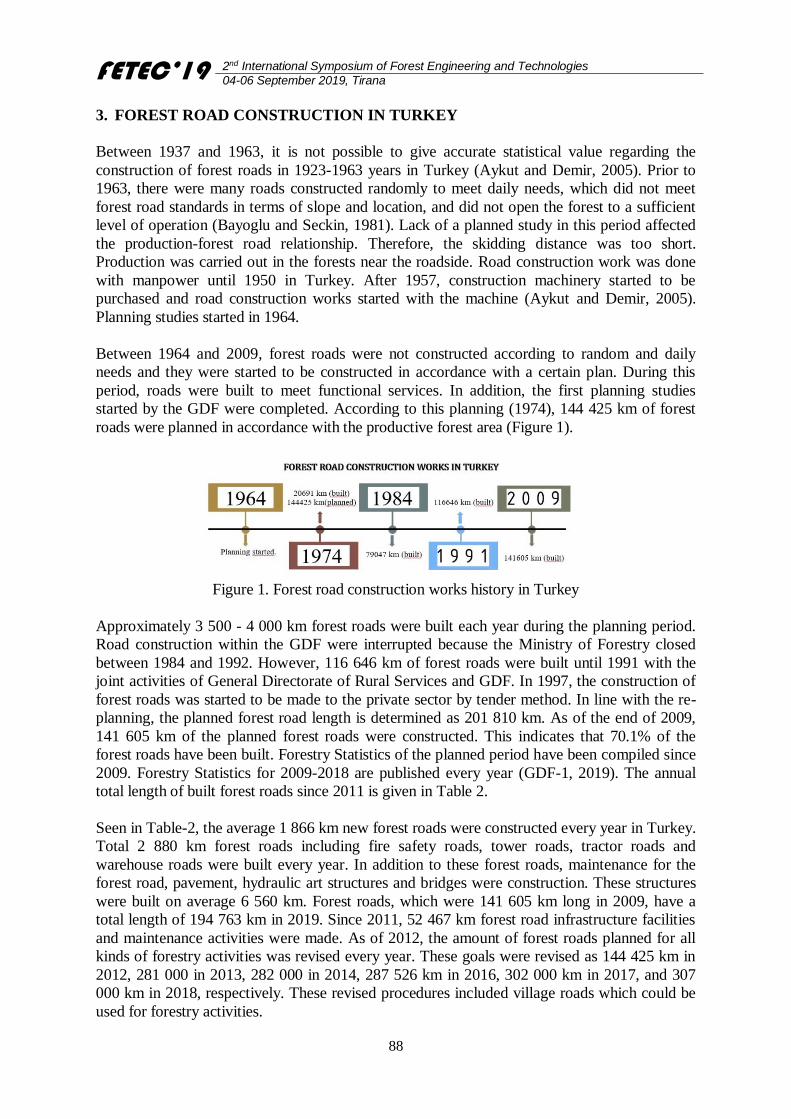
FETEC’19 2nd International Symposium of Forest Engineering and Technologies
04-06 September 2019, Tirana
88
3. FOREST ROAD CONSTRUCTION IN TURKEY
Between 1937 and 1963, it is not possible to give accurate statistical value regarding the
construction of forest roads in 1923-1963 years in Turkey (Aykut and Demir, 2005). Prior to
1963, there were many roads constructed randomly to meet daily needs, which did not meet
forest road standards in terms of slope and location, and did not open the forest to a sufficient
level of operation (Bayoglu and Seckin, 1981). Lack of a planned study in this period affected
the production-forest road relationship. Therefore, the skidding distance was too short.
Production was carried out in the forests near the roadside. Road construction work was done
with manpower until 1950 in Turkey. After 1957, construction machinery started to be
purchased and road construction works started with the machine (Aykut and Demir, 2005).
Planning studies started in 1964.
Between 1964 and 2009, forest roads were not constructed according to random and daily
needs and they were started to be constructed in accordance with a certain plan. During this
period, roads were built to meet functional services. In addition, the first planning studies
started by the GDF were completed. According to this planning (1974), 144 425 km of forest
roads were planned in accordance with the productive forest area (Figure 1).
Figure 1. Forest road construction works history in Turkey
Approximately 3 500 - 4 000 km forest roads were built each year during the planning period.
Road construction within the GDF were interrupted because the Ministry of Forestry closed
between 1984 and 1992. However, 116 646 km of forest roads were built until 1991 with the
joint activities of General Directorate of Rural Services and GDF. In 1997, the construction of
forest roads was started to be made to the private sector by tender method. In line with the re-
planning, the planned forest road length is determined as 201 810 km. As of the end of 2009,
141 605 km of the planned forest roads were constructed. This indicates that 70.1% of the
forest roads have been built. Forestry Statistics of the planned period have been compiled since
2009. Forestry Statistics for 2009-2018 are published every year (GDF-1, 2019). The annual
total length of built forest roads since 2011 is given in Table 2.
Seen in Table-2, the average 1 866 km new forest roads were constructed every year in Turkey.
Total 2 880 km forest roads including fire safety roads, tower roads, tractor roads and
warehouse roads were built every year. In addition to these forest roads, maintenance for the
forest road, pavement, hydraulic art structures and bridges were construction. These structures
were built on average 6 560 km. Forest roads, which were 141 605 km long in 2009, have a
total length of 194 763 km in 2019. Since 2011, 52 467 km forest road infrastructure facilities
and maintenance activities were made. As of 2012, the amount of forest roads planned for all
kinds of forestry activities was revised every year. These goals were revised as 144 425 km in
2012, 281 000 in 2013, 282 000 in 2014, 287 526 km in 2016, 302 000 km in 2017, and 307
000 km in 2018, respectively. These revised procedures included village roads which could be
used for forestry activities.
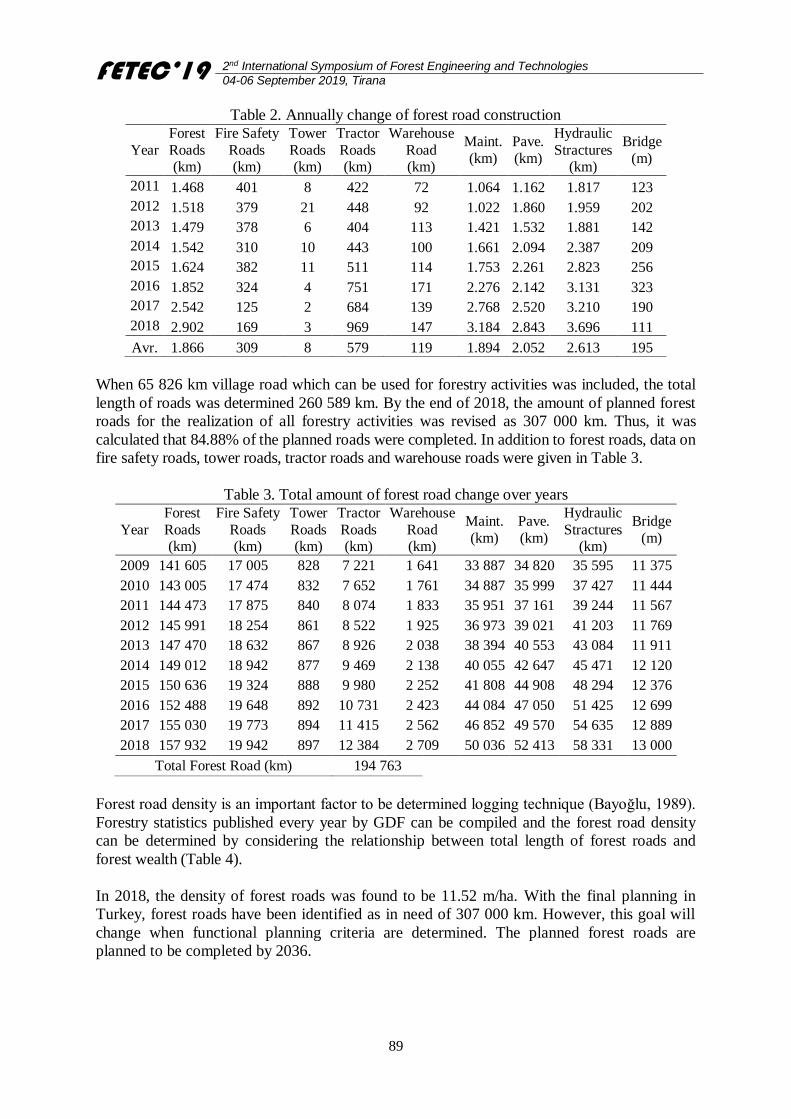
FETEC’19 2nd International Symposium of Forest Engineering and Technologies
04-06 September 2019, Tirana
89
Table 2. Annually change of forest road construction
Year
Forest
Roads (km)
Fire Safety
Roads (km)
Tower
Roads (km)
Tractor
Roads (km)
Warehouse
Road (km)
Maint.
(km)
Pave.
(km)
Hydraulic
Stractures (km)
Bridge
(m)
2011 1.468 401 8 422 72 1.064 1.162 1.817 123
2012 1.518 379 21 448 92 1.022 1.860 1.959 202
2013 1.479 378 6 404 113 1.421 1.532 1.881 142
2014 1.542 310 10 443 100 1.661 2.094 2.387 209
2015 1.624 382 11 511 114 1.753 2.261 2.823 256
2016 1.852 324 4 751 171 2.276 2.142 3.131 323
2017 2.542 125 2 684 139 2.768 2.520 3.210 190
2018 2.902 169 3 969 147 3.184 2.843 3.696 111
Avr. 1.866 309 8 579 119 1.894 2.052 2.613 195
When 65 826 km village road which can be used for forestry activities was included, the total
length of roads was determined 260 589 km. By the end of 2018, the amount of planned forest
roads for the realization of all forestry activities was revised as 307 000 km. Thus, it was
calculated that 84.88% of the planned roads were completed. In addition to forest roads, data on
fire safety roads, tower roads, tractor roads and warehouse roads were given in Table 3.
Table 3. Total amount of forest road change over years
Year
Forest
Roads (km)
Fire Safety
Roads (km)
Tower
Roads (km)
Tractor
Roads (km)
Warehouse
Road (km)
Maint.
(km)
Pave.
(km)
Hydraulic
Stractures (km)
Bridge
(m)
2009 141 605 17 005 828 7 221 1 641 33 887 34 820 35 595 11 375
2010 143 005 17 474 832 7 652 1 761 34 887 35 999 37 427 11 444
2011 144 473 17 875 840 8 074 1 833 35 951 37 161 39 244 11 567
2012 145 991 18 254 861 8 522 1 925 36 973 39 021 41 203 11 769
2013 147 470 18 632 867 8 926 2 038 38 394 40 553 43 084 11 911
2014 149 012 18 942 877 9 469 2 138 40 055 42 647 45 471 12 120
2015 150 636 19 324 888 9 980 2 252 41 808 44 908 48 294 12 376
2016 152 488 19 648 892 10 731 2 423 44 084 47 050 51 425 12 699
2017 155 030 19 773 894 11 415 2 562 46 852 49 570 54 635 12 889
2018 157 932 19 942 897 12 384 2 709 50 036 52 413 58 331 13 000
Total Forest Road (km) 194 763
Forest road density is an important factor to be determined logging technique (Bayoğlu, 1989).
Forestry statistics published every year by GDF can be compiled and the forest road density
can be determined by considering the relationship between total length of forest roads and
forest wealth (Table 4).
In 2018, the density of forest roads was found to be 11.52 m/ha. With the final planning in
Turkey, forest roads have been identified as in need of 307 000 km. However, this goal will
change when functional planning criteria are determined. The planned forest roads are
planned to be completed by 2036.
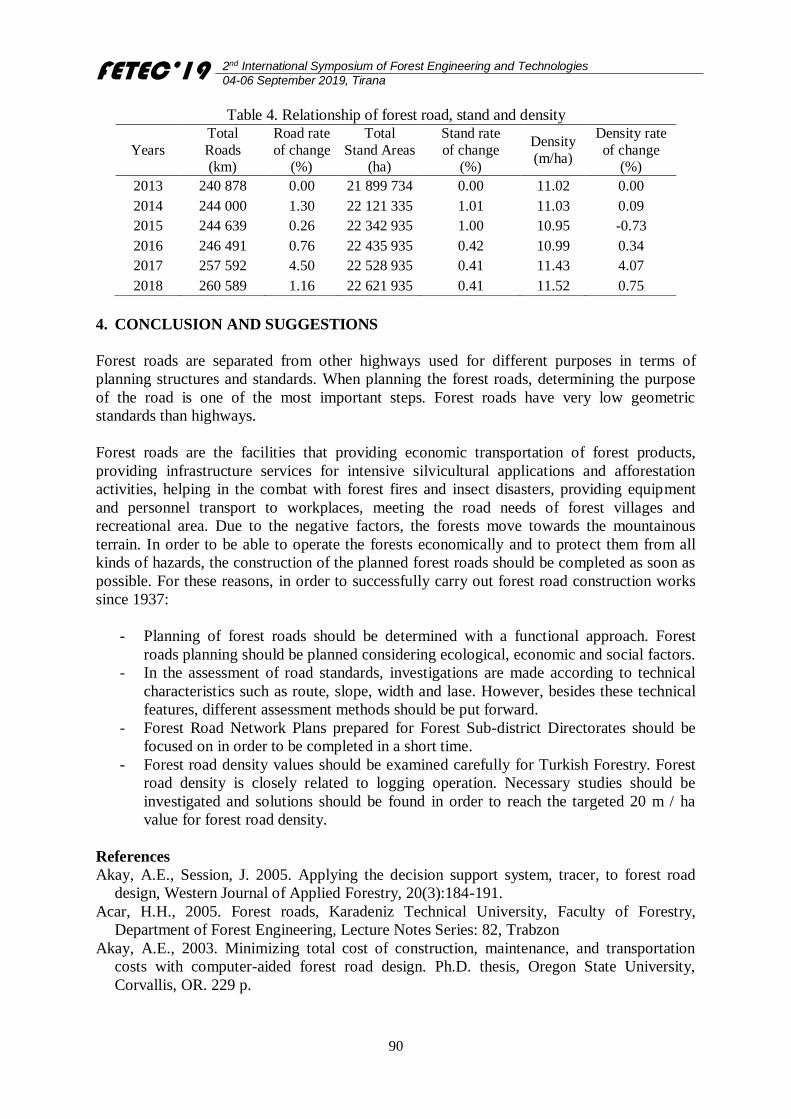
FETEC’19 2nd International Symposium of Forest Engineering and Technologies
04-06 September 2019, Tirana
90
Table 4. Relationship of forest road, stand and density
Years
Total
Roads (km)
Road rate
of change (%)
Total
Stand Areas (ha)
Stand rate
of change (%)
Density
(m/ha)
Density rate
of change (%)
2013 240 878 0.00 21 899 734 0.00 11.02 0.00
2014 244 000 1.30 22 121 335 1.01 11.03 0.09
2015 244 639 0.26 22 342 935 1.00 10.95 -0.73
2016 246 491 0.76 22 435 935 0.42 10.99 0.34
2017 257 592 4.50 22 528 935 0.41 11.43 4.07
2018 260 589 1.16 22 621 935 0.41 11.52 0.75
4. CONCLUSION AND SUGGESTIONS
Forest roads are separated from other highways used for different purposes in terms of
planning structures and standards. When planning the forest roads, determining the purpose
of the road is one of the most important steps. Forest roads have very low geometric
standards than highways.
Forest roads are the facilities that providing economic transportation of forest products,
providing infrastructure services for intensive silvicultural applications and afforestation
activities, helping in the combat with forest fires and insect disasters, providing equipment
and personnel transport to workplaces, meeting the road needs of forest villages and
recreational area. Due to the negative factors, the forests move towards the mountainous
terrain. In order to be able to operate the forests economically and to protect them from all
kinds of hazards, the construction of the planned forest roads should be completed as soon as
possible. For these reasons, in order to successfully carry out forest road construction works
since 1937:
- Planning of forest roads should be determined with a functional approach. Forest
roads planning should be planned considering ecological, economic and social factors.
- In the assessment of road standards, investigations are made according to technical
characteristics such as route, slope, width and lase. However, besides these technical
features, different assessment methods should be put forward.
- Forest Road Network Plans prepared for Forest Sub-district Directorates should be
focused on in order to be completed in a short time.
- Forest road density values should be examined carefully for Turkish Forestry. Forest
road density is closely related to logging operation. Necessary studies should be
investigated and solutions should be found in order to reach the targeted 20 m / ha
value for forest road density.
References
Akay, A.E., Session, J. 2005. Applying the decision support system, tracer, to forest road
design, Western Journal of Applied Forestry, 20(3):184-191.
Acar, H.H., 2005. Forest roads, Karadeniz Technical University, Faculty of Forestry,
Department of Forest Engineering, Lecture Notes Series: 82, Trabzon
Akay, A.E., 2003. Minimizing total cost of construction, maintenance, and transportation
costs with computer-aided forest road design. Ph.D. thesis, Oregon State University,
Corvallis, OR. 229 p.
FETEC’19 2nd International Symposium of Forest Engineering and Technologies
04-06 September 2019, Tirana
91
Aykut, T., Demir, M. 2005. The importance, evaluation and situation of forest roads in
Turkey, Forestist, 55(1):37-51.
Bayoğlu, S., Seçkin, Ö.B. 1982. Forest Road Construction Work and Benefits in Turkey,
İstanbul University Faculty of Forestry Publication ID:2883/307, İstanbul.
Bilici, E. 2009. A Study on the integration of Firebreaks and fireline with Forest Roads
Networks and It’s Planning and Construction (A Case Study of Gallipoly National Park),
Forestist, 59(2):85-101.
Bjorklund, E.S. 2006. Environmental Statement 2005, Wood Supply Europe Report, Stora
Enso Forest Product, Sweden.
Çalışkan, E., Çağlar, S. 2010. Evaluation of the damages caused by forest road construction
works to the environment, III. National Black Sea Forestry Congress, 2:564-570.
Cofin, A. 2007. From roadkill to road ecology: A review of the ecological effects of roads,
Journal of Transport Geography, 15 (5):396-406.
Demir, M. 2007. Impacts, management and functional planning criterion of forest road
network system in Turkey, Transportation Research Part A, 41:56–68.
Dube, K., Megahan, W. and Mc Calmon, M. 2004. Washington road surface erosion model,
Prepared for: State of Washington, Department of Natural Resources, February 20, 2004,
Washington, USA, 189 p.
Eker, M., Acar, H.H., Coban H.O. 2010. The potential ecological impacts of forest roads,
Turkish Journal of Forestry, 11(1):109-125.
Erdas, O. 1997. Forest Roads, Karadeniz Technical University, Faculty of Forestry,
Department of Forest Engineering, Lecture Notes Series:187/25-188/26. 1-2, Trabzon.
GDF, 2008. Republic of Turkey, General Directorate of Forestry, Department of Construction
and Procurement, Communiqué numbered 292.
GDF-1, 2019. Republic of Turkey, Ministry of Forestry and Water Affairs, General
Directorate of Forestry, Department of Strategy Development, Forestry Statistics,
Gumus, S., Acar, H.H., Toksoy, D. 2008. Functional forest road network planning by
consideration of environmental impact assessment for wood harvesting. Environ. Monit.
Assess. 142:109-119.
Gumus S. 2009. Constitution of the forest road evaluation form for Turkish forestry, African
Journal of Biotechnology, 8:5389-5394.
Hasdemir, M., Demir M. 2001. The features that distinguish forest roads from other roads
and their classification in Turkey, Forestist, 50(2):85-96.
Hruza, P. 2003. Optimization of forest road network under principles of functionally
integrated forest management, Journal of Forest Science, 49(9):439-443.
Lugoa, A., Gucinski, E. 2000. H. Function, effects, and management of forest roads, Forest
Ecology and Management, 133:249-262.
Seckin, 1984. Forest road network and road spacing distance, Forestist, 34(2):59-68.
Turkish Official Gazette, 2007. Communiqué on the preparation of Forest Road Network
Plans, Official Gazette Date:01.07.2007, Official Gazette Number: 26569.
Umar, F., Yayla, N. 1994. Road construction, Publication of ITU Vol: 1541, Istanbul.
FETEC’19 2nd International Symposium of Forest Engineering and Technologies
04-06 September 2019, Tirana
92
Actual Wood Flow Analysis for State-Forestry in Turkey
Mehmet EKER1*, H. Hulusi ACAR2
1Isparta University of Applied Science, Faculty of Forestry, Forest Engineering Dept., 32260 Isparta, Turkey 2İstanbul Yeni Yüzyıl University, Health Science Faculty, Occupational Health and Safety Department, İstanbul
Abstract
Wood raw material supply chains have a long processing time in terms of generating a high
amount of consequent products. Depending on structural mapping method, wood supply chain
focuses on material flow from standing tree to wood products. Wood product range from a tree
has been varied by forest policy and management, market demands, and selling types. This
situation triggers the spatial, temporal, and functional variation on wood flow. The paper aims
at objectifying this situation by undertaking the material flow analysis of the forest wood
supply chain. In this study, it was firstly revealed the current and futuristic wood flow models
and then the flow models were discussed to technical considerations. As general results, the
annual wood supply activities are scattered to very wide area with small harvesting units (20
Million m3/22.3 Million ha), which illustrates that wood flow has a spatial dispersion. A
various wood product (log, veneer, pulp, pole, leaf and chip board, fire wood, fuel wood, stick,
etc.) is produced from a coniferous and broadleaved tree, which indicates material flow
complexity because of a wide range of product from each source. Harvesting and transportation
is operated by nearly over 150.000 workers, which point out the difficulties to provide
organizational standard for wood flow.
Keywords: Wood supply chain, Wood flow, Material flow analysis, Wood procurement
1. INTRODUCTION
Wood as raw material provides for a broad variety of human needs (construction materials,
textiles and fibres, paper, chemicals, and energy (heat, electricity and fuel). The technological
possibilities to utilize wood in new and traditional applications are increasing significantly.
Wood can be a sustainable resource and it is already playing a key role for the development of
economy. Wood resources, is a finite but functionally renewable resource. The demands for
wood and wood-based products as well as other services provided by forests are increasing,
partly with a growing global population. To meet these demands sustainably requires action to
the more resource efficient use of wood in society. The wood raw material, from stand to a final
product, passes several stages of production and different types of markets. These stages
include; harvest and transportation, primary wood processing, secondary wood processing, and
subsequent wood-using industries. Within these stages, wood raw material is transformed into
that; primary processed intermediate products (sawn wood, pulp), secondary processed
products (furniture, construction, and joinery), and then final production of different industries
related to the use of wood (e.g., construction).
A covalent links exist between the forestry, forest industry and other sectors that are dependent
on wood raw material and wood products. To use existing resources optimally, it is therefore
necessary to explain and quantify the relationships through material flow (Piskur and Krajnc,
2007; Parobek et al., 2014). The paper aims at objectifying the wood procurement by
undertaking the material flow analysis of the forest wood supply chain. In this study, it was

FETEC’19 2nd International Symposium of Forest Engineering and Technologies
04-06 September 2019, Tirana
93
firstly revealed the current and futuristic wood flow models for different industrial sectors in
Turkish state-forestry, and then the flow models were discussed to technical considerations.
2. METHODLOGY
The material flow covered only the raw wood but no non-wood components. Material flow
analysis (MFA) (Fisher-Kowalski, 1998) was used for the quantification and modelling of
wood flows. The analysis process includes the gathering of information and requires market
experience and recognition of mutual relations in the “wood – consumption” chain. Official
statistics (General Directorate of Forestry; GDF, 2019a), statistics of industry associations,
empirical studies, and estimations were used a data sources for the MFA. Related to wood raw
material; sources, wood supply, processing of wood, product range, and wood consumption
amount were analyzed. Wood flow within supply chain from stand to storage was modelled.
Actual and futuristic flow models were estimated and discussed.
3. RESULT AND DISCUSSION
The annual wood supply activities are scattered to very wide area with small harvesting units
(23.4 Mm3/22.3 Mha), which illustrates that wood flow has been provided from spatially
dispersed locations (long transportation distance). Wood product range from a tree has been
varied by forest policy and management, market demands, and selling types. This situation
triggers the spatial, temporal, and functional variation on wood flow. (Table 1 and 2)
Table 1.Wood resources and use
Resources
Uses Sources Primary Products
Woody biomass
from state forests
Roundwood from
- Coniferous
- Nonconiferous
• Logs
• Telephone poles
• Mining poles
• Other industrial wood
• Pulp&paper wood
• Fibre-chip wood
• Thin pole
• Fuel wood
– Sawmill industry
– Veneer industry
– Plywood industry
– Particleboard industry
– Fibreboard industry
– Pallet industry
– Package industry
– Pulp&paper industry
Wood processing
industry
– Wood fuel industry
– Households
– Power and heat plant
Energy users and
suppliers
Private forests
and plantations - Roundwood – Sawmill industry
– Plywood industry
– Particleboard industry
– Fibreboard industry
– Package industry
– Pulp&paper industry
Wood processing
industry
Imported - Roundwood
- Wood Chips
– Plywood industry
– Particleboard industry
– Fibreboard industry
– Pulp&paper industry
Wood processing
industry
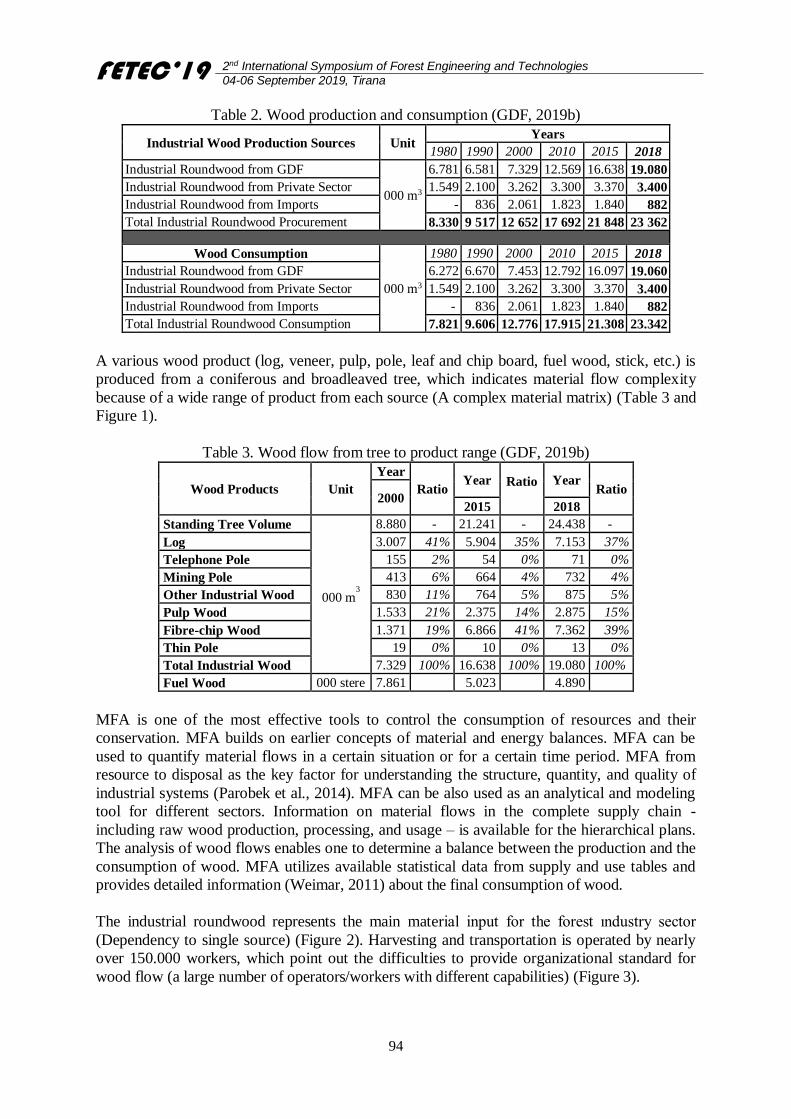
FETEC’19 2nd International Symposium of Forest Engineering and Technologies
04-06 September 2019, Tirana
94
Table 2. Wood production and consumption (GDF, 2019b)
Industrial Wood Production Sources Unit Years
1980 1990 2000 2010 2015 2018
Industrial Roundwood from GDF
000 m3
6.781 6.581 7.329 12.569 16.638 19.080
Industrial Roundwood from Private Sector 1.549 2.100 3.262 3.300 3.370 3.400
Industrial Roundwood from Imports - 836 2.061 1.823 1.840 882
Total Industrial Roundwood Procurement 8.330 9 517 12 652 17 692 21 848 23 362
Wood Consumption
000 m3
1980 1990 2000 2010 2015 2018
Industrial Roundwood from GDF 6.272 6.670 7.453 12.792 16.097 19.060
Industrial Roundwood from Private Sector 1.549 2.100 3.262 3.300 3.370 3.400
Industrial Roundwood from Imports - 836 2.061 1.823 1.840 882
Total Industrial Roundwood Consumption 7.821 9.606 12.776 17.915 21.308 23.342
A various wood product (log, veneer, pulp, pole, leaf and chip board, fuel wood, stick, etc.) is
produced from a coniferous and broadleaved tree, which indicates material flow complexity
because of a wide range of product from each source (A complex material matrix) (Table 3 and
Figure 1).
Table 3. Wood flow from tree to product range (GDF, 2019b)
Wood Products Unit
Year
Ratio Year Ratio
Year Ratio
2000 2015 2018
Standing Tree Volume
000 m3
8.880 - 21.241 - 24.438 -
Log 3.007 41% 5.904 35% 7.153 37%
Telephone Pole 155 2% 54 0% 71 0%
Mining Pole 413 6% 664 4% 732 4%
Other Industrial Wood 830 11% 764 5% 875 5%
Pulp Wood 1.533 21% 2.375 14% 2.875 15%
Fibre-chip Wood 1.371 19% 6.866 41% 7.362 39%
Thin Pole 19 0% 10 0% 13 0%
Total Industrial Wood 7.329 100% 16.638 100% 19.080 100%
Fuel Wood 000 stere 7.861 5.023 4.890
MFA is one of the most effective tools to control the consumption of resources and their
conservation. MFA builds on earlier concepts of material and energy balances. MFA can be
used to quantify material flows in a certain situation or for a certain time period. MFA from
resource to disposal as the key factor for understanding the structure, quantity, and quality of
industrial systems (Parobek et al., 2014). MFA can be also used as an analytical and modeling
tool for different sectors. Information on material flows in the complete supply chain -
including raw wood production, processing, and usage – is available for the hierarchical plans.
The analysis of wood flows enables one to determine a balance between the production and the
consumption of wood. MFA utilizes available statistical data from supply and use tables and
provides detailed information (Weimar, 2011) about the final consumption of wood.
The industrial roundwood represents the main material input for the forest ındustry sector
(Dependency to single source) (Figure 2). Harvesting and transportation is operated by nearly
over 150.000 workers, which point out the difficulties to provide organizational standard for
wood flow (a large number of operators/workers with different capabilities) (Figure 3).
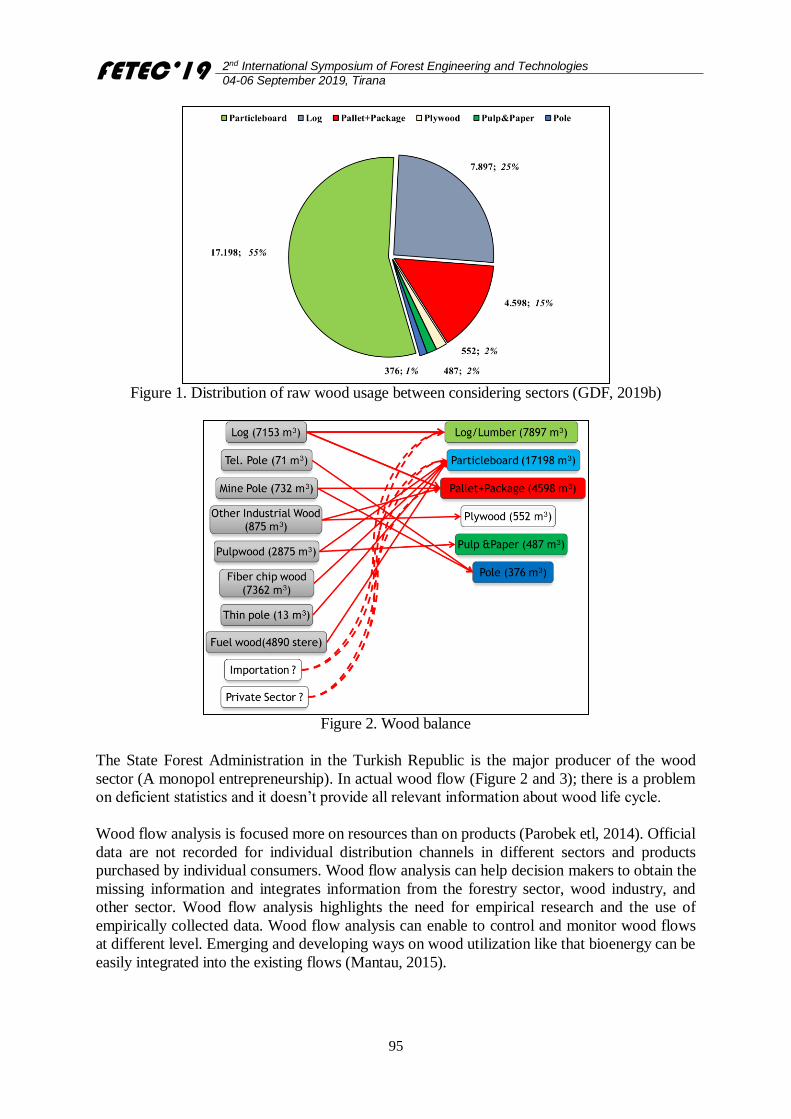
FETEC’19 2nd International Symposium of Forest Engineering and Technologies
04-06 September 2019, Tirana
95
Figure 1. Distribution of raw wood usage between considering sectors (GDF, 2019b)
Figure 2. Wood balance
The State Forest Administration in the Turkish Republic is the major producer of the wood
sector (A monopol entrepreneurship). In actual wood flow (Figure 2 and 3); there is a problem
on deficient statistics and it doesn’t provide all relevant information about wood life cycle.
Wood flow analysis is focused more on resources than on products (Parobek etl, 2014). Official
data are not recorded for individual distribution channels in different sectors and products
purchased by individual consumers. Wood flow analysis can help decision makers to obtain the
missing information and integrates information from the forestry sector, wood industry, and
other sector. Wood flow analysis highlights the need for empirical research and the use of
empirically collected data. Wood flow analysis can enable to control and monitor wood flows
at different level. Emerging and developing ways on wood utilization like that bioenergy can be
easily integrated into the existing flows (Mantau, 2015).
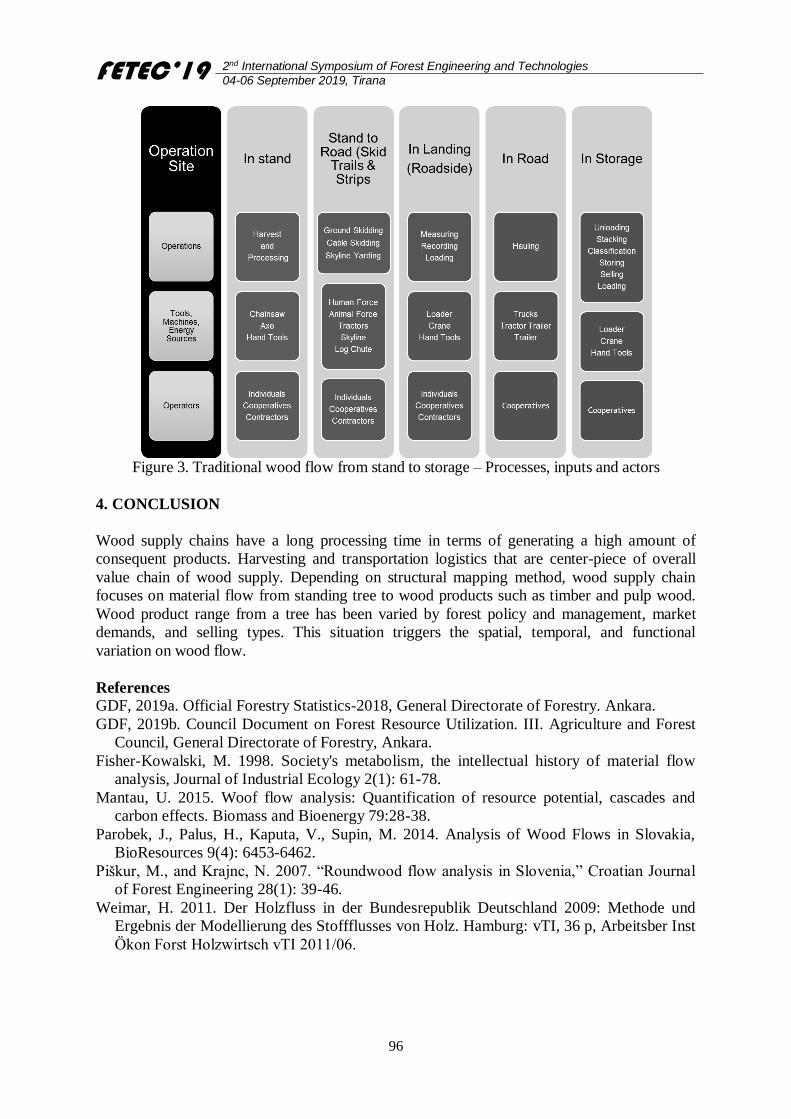
FETEC’19 2nd International Symposium of Forest Engineering and Technologies
04-06 September 2019, Tirana
96
Figure 3. Traditional wood flow from stand to storage – Processes, inputs and actors
4. CONCLUSION
Wood supply chains have a long processing time in terms of generating a high amount of
consequent products. Harvesting and transportation logistics that are center-piece of overall
value chain of wood supply. Depending on structural mapping method, wood supply chain
focuses on material flow from standing tree to wood products such as timber and pulp wood.
Wood product range from a tree has been varied by forest policy and management, market
demands, and selling types. This situation triggers the spatial, temporal, and functional
variation on wood flow.
References
GDF, 2019a. Official Forestry Statistics-2018, General Directorate of Forestry. Ankara.
GDF, 2019b. Council Document on Forest Resource Utilization. III. Agriculture and Forest
Council, General Directorate of Forestry, Ankara.
Fisher-Kowalski, M. 1998. Society's metabolism, the intellectual history of material flow
analysis, Journal of Industrial Ecology 2(1): 61-78.
Mantau, U. 2015. Woof flow analysis: Quantification of resource potential, cascades and
carbon effects. Biomass and Bioenergy 79:28-38.
Parobek, J., Palus, H., Kaputa, V., Supin, M. 2014. Analysis of Wood Flows in Slovakia,
BioResources 9(4): 6453-6462.
Piškur, M., and Krajnc, N. 2007. “Roundwood flow analysis in Slovenia,” Croatian Journal
of Forest Engineering 28(1): 39-46.
Weimar, H. 2011. Der Holzfluss in der Bundesrepublik Deutschland 2009: Methode und
Ergebnis der Modellierung des Stoffflusses von Holz. Hamburg: vTI, 36 p, Arbeitsber Inst
Ökon Forst Holzwirtsch vTI 2011/06.
FETEC’19 2nd International Symposium of Forest Engineering and Technologies
04-06 September 2019, Tirana
97
Roles and responsibilities of municipalities in Albania related to forest
harvesting based on regulatory instruments and their challenges
Nehat ÇOLLLAKU 1*, Elvin TOROMANI1, Dritan AJDINAJ2, Abdulla DIKU3,
1 Faculty of Forestry Sciences, Department of Forestry, Tirana, Albania 2 Faculty of Forestry Sciences, Department of Wood Industry, Tirana, Albania
3 Diava Consulting, Director, Tirana, Albania
Abstract
Regulatory instruments were considered one of the most important of forest policy
instruments within the process of forest policy formulation in our country. Forest resource
policies in Albania have changed significantly in recent years. In 2016, the Government of
Albania transferred forest management (with the exception of protected areas) to 61 LGUs,
and implemented a moratorium on harvesting with the goal of reducing the unsustainable
harvesting of wood in the country. Exceptions to the 2016 moratorium permit LGUs to
harvest fuelwood to meet local needs of households and public institutions. The main purpose
of this paper, it was intended to analyze the roles and responsibilities of the municipalities
related to forest harvesting based on the regulation instruments and policies approved by the
Albanian institutions. The methodology used was consisting firstly on the identification of
the legal acts and policies approved and a deeper analysis of them, in order to find out the
roles and responsibilities of municipalities toward forest harvesting, and their challenges The
results show that new forest policies and the installed Moratorium have a strong impact on
the availability of fuelwood and wood biomass. These recent policy changes have led to a
number of challenges. Many LGUs lack the capacity and resources needed to adequately
manage forest resources.
Keywords: municipalities, roles and responsibilities, regulation instruments, policies, forest
harvesting, challenges
1. INTRODUCTION
The forest policies undertaken by Albanian Government for decentralization of natural
resources consisted in the transferring of forests and pastures to communes and
municipalities. The results were very promising regarding the change of users’attitude and
awareness in putting under stronger protection the forests and pastures under their possession
(Muharremaj. V, et al 2009). In the period of 2007-2008, was carried out the main process of
transferring of forests and pastures from state to the Local Government Units (LGU).
During this time, the responsible ministry for pasture and forests through the support of
foreign donors like World Bank and SIDA, in framework of Natural Resources Development
Project (NRDP) had supported the communes to prepare the management plans for the
forests and pastures transferred to the communes and in the same time had offered some
small financial packages to implement the main activities foreseen in the forests and pasture
management plans (Collaku and Shehu, 2013). Last decade has shown an increasing
significance related to community based forest management, by transferring of forest
management responsibilities to local communities (Adhikari B et al., 2004).
FETEC’19 2nd International Symposium of Forest Engineering and Technologies
04-06 September 2019, Tirana
98
In the year 2015, the Albanian Government approved the new territorial administrative
reform, which entails the consolidation of local government units to only 61 municipalities
with the aim of increasing their capacity to offer better quality services and the efficiency of
resource and asset management. As result of this reform, the government has delegated the
forest management to 61 municipalities for about 80 % of forests and pastures in Albania,
except protected areas which remain under the administration of state administration.
In February 2016, a ten-year moratorium on the commercial harvesting of timber and export
of wood products was passed by Parliament. Those changes in the management of forests and
pastures transferred to the municipalities require a fully legal framework, in order to make
clear the competences and responsibilities for different actors and especially for the
municipalities as the biggest owner of forests and pasture resources. Laws generally attempt
to create, maintain, or restore order, stability and justice (Anderson and Kumpf, 1972). On
the other side, Cubbage et al. (1980) underlines that “modern forest practice laws usually
include a purpose or policy statement decreed by the state legislature.
In fact, up to now related to regulatory framework, there was no a new Law on Forest in
place, but there were approved only few amendments in the main Law on Forests and certain
Decisions of Councils of Ministers (DCMs). Taking into consideration that in term of forest
policy, the legal framework is called as regulatory instruments, means that under this paper
the used term of regulatory instruments means the same thing like legal framework. Through
this paper we would like to identify and analyse the current regulatory instruments approved
in Albania on forest harvesting by municipalities.
2. MATERIAL AND METHODS
The material s used for the analysis of this paper is the current legal framework and strategic
documents from the forestry sector in Albania. The most important document is the National
Strategy of the Forestry Sector itself, supplemented by other documents like:
Declaration of Forestry Sector;
The Forest Law No. 9385 “For Forests and Forestry Sector”;
The Law. No. 48/2016 “Some changes and additions on Law no.9385, dated on
4.5.2005. “For Forests and Forest Service”, changed,
Law. No. 5/2016 “For declaration of Forests Moratorium in the Republic of
Albania”.
DoCM. No. 438, dated on 8.6.2016 “For criteria and rules of forests harvesting
and selling of wood material and other forestry and non-forestry products”.
DoCM. No.433 dated on 8.6.2016 “For transferring of public forests and pasture
in ownership of municipalities, according to the inventory lists, administrated
actually by the Environment Ministry and ex-communes/municipalities.
Order No. 2, dated on 3.03.2017 “ For technical criteria and determination of
forest parcels, group parcels and forest economy for treatment through
silvicultural thinning and rules for the wood harvesting with goal of securing the
fuelwood for heating
The method used consists on identification and analysis of rules and responsibilities of
municipalities according to regulatory instruments. The important issues related to this paper
were to see:
What are the municipality roles and responsibilities on forests harvesting?
How do the municipalities carry out their roles and responsibilities?
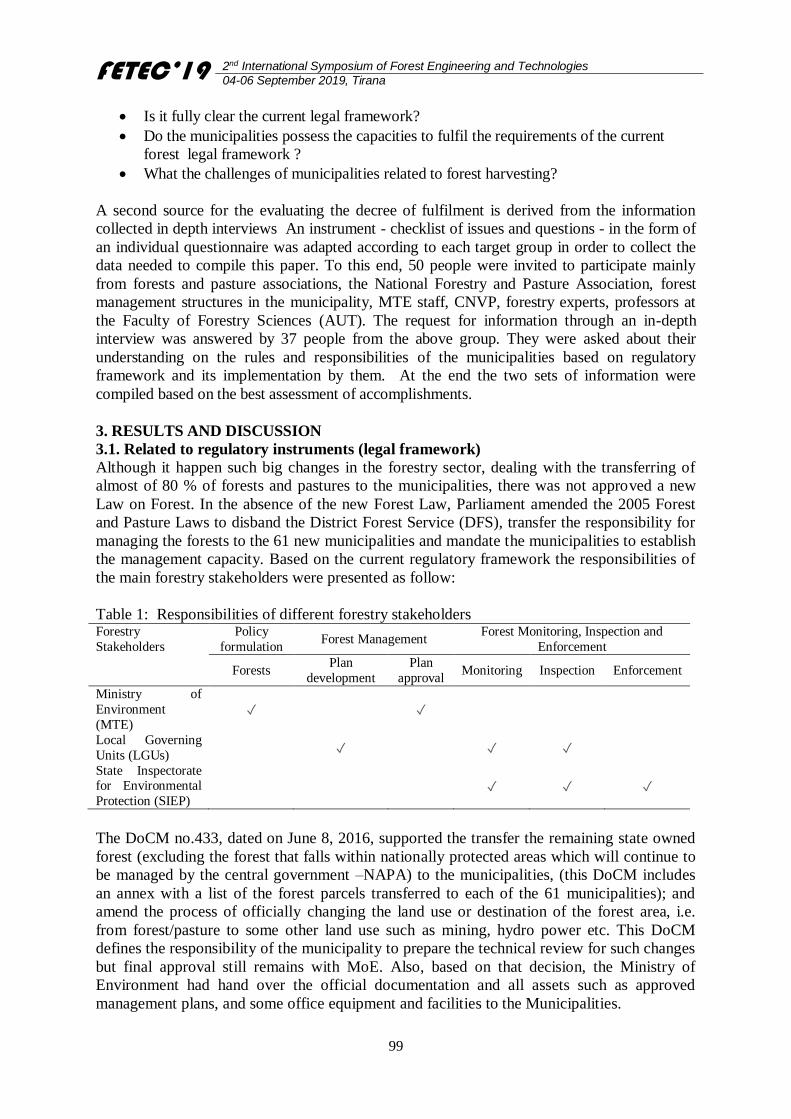
FETEC’19 2nd International Symposium of Forest Engineering and Technologies
04-06 September 2019, Tirana
99
Is it fully clear the current legal framework?
Do the municipalities possess the capacities to fulfil the requirements of the current
forest legal framework ?
What the challenges of municipalities related to forest harvesting?
A second source for the evaluating the decree of fulfilment is derived from the information
collected in depth interviews An instrument - checklist of issues and questions - in the form of
an individual questionnaire was adapted according to each target group in order to collect the
data needed to compile this paper. To this end, 50 people were invited to participate mainly
from forests and pasture associations, the National Forestry and Pasture Association, forest
management structures in the municipality, MTE staff, CNVP, forestry experts, professors at
the Faculty of Forestry Sciences (AUT). The request for information through an in-depth
interview was answered by 37 people from the above group. They were asked about their
understanding on the rules and responsibilities of the municipalities based on regulatory
framework and its implementation by them. At the end the two sets of information were
compiled based on the best assessment of accomplishments.
3. RESULTS AND DISCUSSION
3.1. Related to regulatory instruments (legal framework)
Although it happen such big changes in the forestry sector, dealing with the transferring of
almost of 80 % of forests and pastures to the municipalities, there was not approved a new
Law on Forest. In the absence of the new Forest Law, Parliament amended the 2005 Forest
and Pasture Laws to disband the District Forest Service (DFS), transfer the responsibility for
managing the forests to the 61 new municipalities and mandate the municipalities to establish
the management capacity. Based on the current regulatory framework the responsibilities of
the main forestry stakeholders were presented as follow:
Table 1: Responsibilities of different forestry stakeholders Forestry
Stakeholders
Policy
formulation Forest Management
Forest Monitoring, Inspection and
Enforcement
Forests Plan
development
Plan
approval Monitoring Inspection Enforcement
Ministry of
Environment
(MTE) ✓ ✓
Local Governing
Units (LGUs) ✓ ✓ ✓
State Inspectorate for Environmental
Protection (SIEP) ✓ ✓ ✓
The DoCM no.433, dated on June 8, 2016, supported the transfer the remaining state owned
forest (excluding the forest that falls within nationally protected areas which will continue to
be managed by the central government –NAPA) to the municipalities, (this DoCM includes
an annex with a list of the forest parcels transferred to each of the 61 municipalities); and
amend the process of officially changing the land use or destination of the forest area, i.e.
from forest/pasture to some other land use such as mining, hydro power etc. This DoCM
defines the responsibility of the municipality to prepare the technical review for such changes
but final approval still remains with MoE. Also, based on that decision, the Ministry of
Environment had hand over the official documentation and all assets such as approved
management plans, and some office equipment and facilities to the Municipalities.
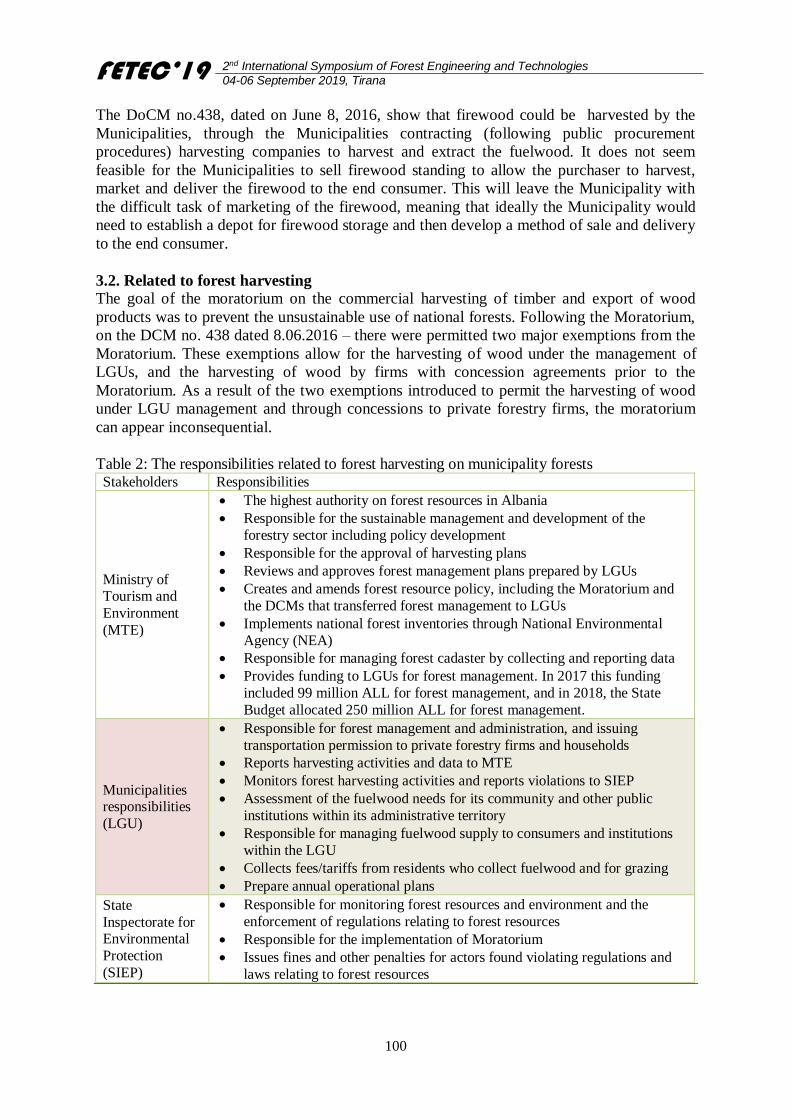
FETEC’19 2nd International Symposium of Forest Engineering and Technologies
04-06 September 2019, Tirana
100
The DoCM no.438, dated on June 8, 2016, show that firewood could be harvested by the
Municipalities, through the Municipalities contracting (following public procurement
procedures) harvesting companies to harvest and extract the fuelwood. It does not seem
feasible for the Municipalities to sell firewood standing to allow the purchaser to harvest,
market and deliver the firewood to the end consumer. This will leave the Municipality with
the difficult task of marketing of the firewood, meaning that ideally the Municipality would
need to establish a depot for firewood storage and then develop a method of sale and delivery
to the end consumer.
3.2. Related to forest harvesting
The goal of the moratorium on the commercial harvesting of timber and export of wood
products was to prevent the unsustainable use of national forests. Following the Moratorium,
on the DCM no. 438 dated 8.06.2016 – there were permitted two major exemptions from the
Moratorium. These exemptions allow for the harvesting of wood under the management of
LGUs, and the harvesting of wood by firms with concession agreements prior to the
Moratorium. As a result of the two exemptions introduced to permit the harvesting of wood
under LGU management and through concessions to private forestry firms, the moratorium
can appear inconsequential.
Table 2: The responsibilities related to forest harvesting on municipality forests Stakeholders Responsibilities
Ministry of Tourism and
Environment
(MTE)
The highest authority on forest resources in Albania
Responsible for the sustainable management and development of the
forestry sector including policy development
Responsible for the approval of harvesting plans
Reviews and approves forest management plans prepared by LGUs
Creates and amends forest resource policy, including the Moratorium and
the DCMs that transferred forest management to LGUs
Implements national forest inventories through National Environmental
Agency (NEA)
Responsible for managing forest cadaster by collecting and reporting data
Provides funding to LGUs for forest management. In 2017 this funding
included 99 million ALL for forest management, and in 2018, the State
Budget allocated 250 million ALL for forest management.
Municipalities responsibilities
(LGU)
Responsible for forest management and administration, and issuing
transportation permission to private forestry firms and households
Reports harvesting activities and data to MTE
Monitors forest harvesting activities and reports violations to SIEP
Assessment of the fuelwood needs for its community and other public
institutions within its administrative territory
Responsible for managing fuelwood supply to consumers and institutions
within the LGU
Collects fees/tariffs from residents who collect fuelwood and for grazing
Prepare annual operational plans
State
Inspectorate for Environmental
Protection
(SIEP)
Responsible for monitoring forest resources and environment and the
enforcement of regulations relating to forest resources
Responsible for the implementation of Moratorium
Issues fines and other penalties for actors found violating regulations and
laws relating to forest resources
FETEC’19 2nd International Symposium of Forest Engineering and Technologies
04-06 September 2019, Tirana
101
4. CONCLUSION AND SUGGESTIONS
The Albanian forestry sector has gone through notable changes in the past few years. In
January 2016, the Government decided to transfer all State-owned productive forests (except
the designated protected areas) to municipalities. From the analysis of the current regulatory
framework, it is concluded that there is a gap with the absence of a new Law on Forests. This
means there are no clear roles, responsibilities and competences of the different actors related
to municipality forests. For this reason, it is suggested that a new Law on Forest should be
drafted and approved as soon as be possible. Although, there was approved a DoCMs related
to forest harvesting, we see that there some overlapping competences among forestry actors.
Based on that, it is important that after the new Law on Forest will be in place, the sub-legal
acts like DoCMs should be revised in order to avoid such overlapping competences on
current legal framework. Exceptions to the 2016 moratorium permit LGUs to harvest
fuelwood to meet local needs of households. To date, three models have been employed by
LGUs to meet this need. In one model, the LGUs have taken responsibility for the
production, transport and delivery of fuelwood. In the other two models, LGUs have
contracted private forestry firms to manage some or all of the activities needed to meet local
fuelwood needs. In all three models, households are permitted to collect fuelwood from
forests under a fee system.
For a longer term solution related to forest harvesting, the municipalities should consider the
establishment of Municipally Owned Enterprises for the supply of fuelwood. It should be
stressed that simply because a system has not been implemented correctly or has been abused
in the past (essentially due to weak supervision), this system is not the most efficient method
for this particular set of circumstances. It is clear that for the villages located close to the
forest, the inhabitants will continue to cut and use firewood from their own forests as
permitted by both the legislation and moratorium.
References
Adhikari. B. 2003. Property rights and natural resources and natural resources: Socio-
economic heterogeneity and distributional implications of common property resource
management. Working paper no. 1-03.
Cubbage, Frederick W., Paul V. E. 1980. State forests practice laws: A major policy force
unique to the natural resources community. Natural Resources Lawyer 13(2):421-468.
Çollaku. N., Shehu. D. 201. Forests in Albania, problems and challenges for the future.
International Journal of Ecosystems and Ecology Science (IJEES). 3(4): 801-806. ISSN
2224-4980
Hickman, C.A., William C.S., Christopher E.M. 1991. Forests Practice regulatory
developments in the East. Pp327-332 in Proceedings, 1991, Convention, Society of
American Foresters, Bethesda, MD.
Muharremaj. V., Male. J., Kola. H., Çollaku. N. 2009. ”Legal provisions regulating
communal forests and pastures in Albania” Presented on “Legal Aspects of European
Forest Sustainable Development”, May 2008. Proceedings of 10th International
Symposium Sarajevo, Bosnia -Herzegovina. p. 5 – 16.
The DoCM. No. 438, dated on 8.6.2016 “For criteria and rules of forests harvesting and selling
of wood material and other forestry and non-forestry products”.
The Law. No. 48/2016 “Some changes and additions on Law no.9385, dated on
4.5.2005.“For Forests and Forest Service”, changed.
The Law. No. 5/2016 “For declaration of Forests Moratorium in the Republic of Albania”.
FETEC’19 2nd International Symposium of Forest Engineering and Technologies
04-06 September 2019, Tirana
102
Determining Carbon Sequestration Using Remote Sensing
Mehmet MISIR, Nuray MISIR, Abdullah YILDIZ
Department of Forest Engineering, Faculty of Forestry, Karadeniz Technical University, Turkey
Abstract
Forested ecosystems make up 30 % of terrestrial ecosystems and play a very important role in
the global C cycle because they store large amounts of C in vegetative biomass and soil.
Forests store 86 % of the planet's terrestrial above-ground C and 73% of the planet's soil C.
Two different methods are used for determining the amount of carbon stored in forests. In
both cases, control points necessary to determine the parameters of the different stand.
However, these studies are time consuming and costly. Thus, this study aims of use remote
sensing data to determine the amount of carbon storage. Selected as the study area for this
purpose, natural Anatolian black pine stands in Feke Forest Enterprise of Adana Regional
Directorate of Forestry in Mediterranean region, terrestrial carbon storage levels are
determined with the help of the measurement data. Relationship between obtained from the
brightness values of the various bands in Landsat 8 ETM+ satellite image and various
vegetation indices and amount of carbon storages to determine was established conceptual
framework.
Keywords: Carbon storage, Remote sensing, LANDSAT 8 ETM+, Regression analysis
2. INTRODUCTION
Although forested ecosystems make up 30 % of terrestrial ecosystems, play a very important
role in the global C cycle because they store large amounts of C in vegetative biomass and
soil. Forest is one of nature’s mechanisms that sequester the carbon from the atmosphere and
store it in its reservoirs. Carbon sequestration is a process of capturing carbon dioxide (CO2)
from the atmosphere and storage by forestland to reduce the accumulation of it in the
atmosphere. This important role in regulating carbon cycle is of major concern in relation to
the continuous increase of CO2 in the atmosphere which contributes to global warming
(Malhi et al., 2002). Forests store 86 % of the planet's terrestrial above-ground C, 40% of the
entire below-ground terrestrial C and 73 % of the planet's soil C. Forest contain about
approximately 80 % of the carbon stored in above- ground vegetation and about 40 % of the
carbon stored in soil and below-ground vegetation (Çakır et al., 2017).
Estimation of the stock and accumulation of C in the forests is essential for assessing the role
of forest ecosystems in global C budgets. This process is essential to reduce the overheated of
the earth that caused the climate change effects (Adnan et al., 2017).
Traditional methods of estimating forest biomass and carbon storage capacity at the tree level
use allometric equations, developed as a function of the species and such characteristics as
tree height and diameter at breast height (Mısır et al., 2017). These methods are time
consuming and expensive and the equations are specific to the location of the sample plots
used for their development, and may not necessarily be applicable to other regions but using
remote sensing imaginary is a practical product for developing biomass and carbon storage
mapping methods (Mısır et al., 2018). The objective of this study was aimed to determine
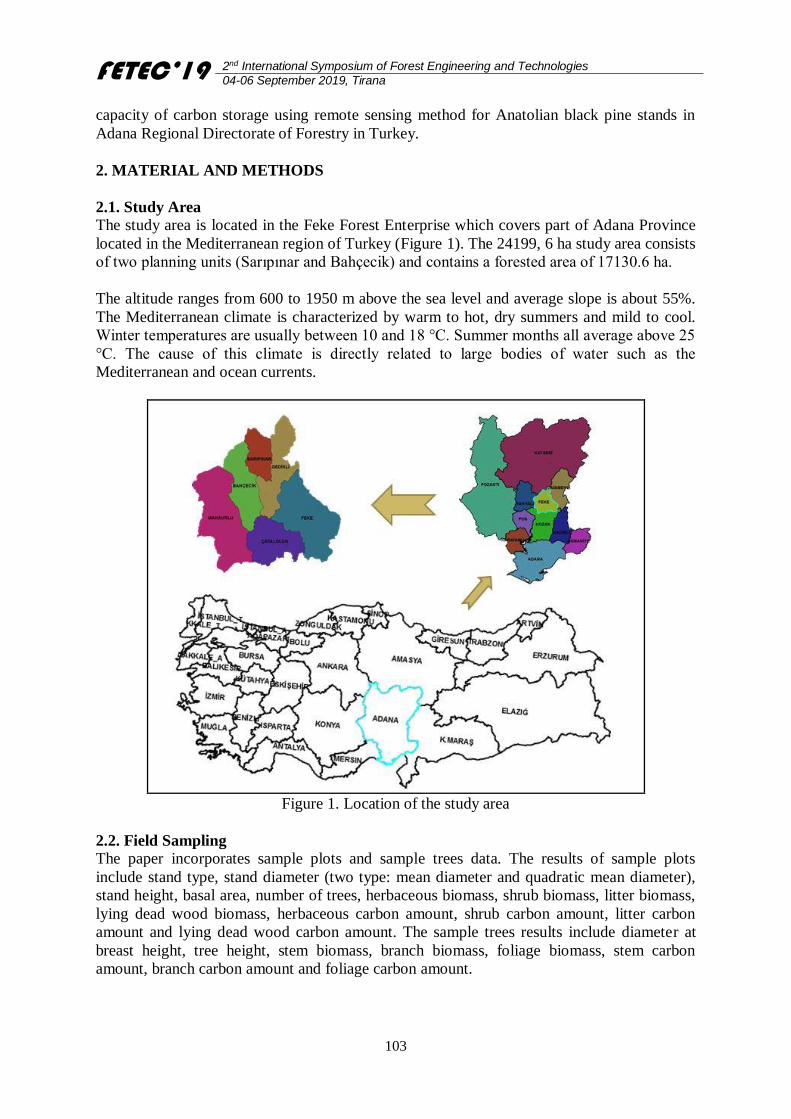
FETEC’19 2nd International Symposium of Forest Engineering and Technologies
04-06 September 2019, Tirana
103
capacity of carbon storage using remote sensing method for Anatolian black pine stands in
Adana Regional Directorate of Forestry in Turkey.
2. MATERIAL AND METHODS
2.1. Study Area
The study area is located in the Feke Forest Enterprise which covers part of Adana Province
located in the Mediterranean region of Turkey (Figure 1). The 24199, 6 ha study area consists
of two planning units (Sarıpınar and Bahçecik) and contains a forested area of 17130.6 ha.
The altitude ranges from 600 to 1950 m above the sea level and average slope is about 55%.
The Mediterranean climate is characterized by warm to hot, dry summers and mild to cool.
Winter temperatures are usually between 10 and 18 °C. Summer months all average above 25
°C. The cause of this climate is directly related to large bodies of water such as the
Mediterranean and ocean currents.
Figure 1. Location of the study area
2.2. Field Sampling
The paper incorporates sample plots and sample trees data. The results of sample plots
include stand type, stand diameter (two type: mean diameter and quadratic mean diameter),
stand height, basal area, number of trees, herbaceous biomass, shrub biomass, litter biomass,
lying dead wood biomass, herbaceous carbon amount, shrub carbon amount, litter carbon
amount and lying dead wood carbon amount. The sample trees results include diameter at
breast height, tree height, stem biomass, branch biomass, foliage biomass, stem carbon
amount, branch carbon amount and foliage carbon amount.
FETEC’19 2nd International Symposium of Forest Engineering and Technologies
04-06 September 2019, Tirana
104
2.3. Obtaining of Reflection Values
Landsat 8 ETM + satellite image of the study area was obtained in order to develop Carbon
Stock models of Feke forests of Eastern Mediterranean region. Band values and 20 different
vegetation indexes were calculated by making necessary operations on satellite image. Since
the reflectance values of Landsat 8 ETM+ satellite images used in the study may vary
according to the slope and the aspect, slope and aspect values of the sample plots were
calculated.
Necessary measurements were taken in 30 sample areas determined in Feke planning unit and
samples were taken. These samples were brought to the laboratory and prepared for carbon
analysis. The carbon values obtained from the carbon analyses using elemental analyze
machine will be correlated with satellite image band values and vegetation indices. The most
suitable equation will be developed to be used in the determination of carbon storage amount
of Feke forests by remote sensing method. Researchers will be able to use this equation
which be developed.
2.4. Determining Amount of Carbon Storage with Remote Sensing Data
Remote sensing data can provide detailed information about the composition of the stand
structures and the species forming the stand. Different stand structures have different spectral
reflectance values in different wave lengths. In addition, the topographic structure on the
stands affects their reflection values. Therefore, the relationship between stand parameters
and remote sensing data also varies.
3. RESULTS AND DISCUSSION
The results obtained field sampling was given Table 1. The amounts of carbon storage stands,
the relationship between the values of the reflection band satellite images and vegetation
index values are tried to be obtained. As explained above, the reflection values of the bands,
the vegetation index values and the sample plot average slope and aspect values are used as
independent variables in the models in which the amount of carbon storage is a dependent
variable.
Table 1. Summaries of stand characteristics of Anatolian Black Pine stands
Stand characteristic Min Max Mean Standard
deviation
Mean diameter (cm) 1.10 42.70 20.00 12.9
Basal area (m2/ha) 0.04 69.9 30.2 17.9
4. CONCLUSION AND SUGGESTIONS
In order to develop carbon stock models by remote sensing of Anatolian black pine stands of
Adana region; correlations between carbon storage values obtained from the sampling area,
reflectance values of slopes, slope and aspect values and 20 different vegetation index values
were determined. As a result of the evaluations, a model will be developed for the
determination of carbon storage capacity of Anatolian black pine in Mediterranean region by
remote sensing method.
This study is the original study on carbon storage capacity of Anatolian black pine forests. An
important issue that stands as well as natural stands in Turkey also having on global climate
FETEC’19 2nd International Symposium of Forest Engineering and Technologies
04-06 September 2019, Tirana
105
change reveals numerically the positive contribution both in terms of contracts that the
international side in Turkey should not be ignored in terms of scientific requirements.
Turkey has complex climate structure, particularly due to global warming, is one of the
countries most affected by climate change will be seen. Because of it is naturally surrounded
three sides by sea, it has a defective structure and orographic characteristics, different regions
of Turkey will be affected by climate change in different formats and in different sizes.
Determining the carbon storage capacity of forests in Turkey is of considerable importance
because of this reason. In addition to the determination of carbon storage capacity only, it is
important for our country to update these data periodically. (Mısır et al., 2013).
One of the remote sensing methods, satellite images can determine the carbon storage
capacity of forested areas quickly, easily and with minimum cost. In such a study, the
difference between the year in which the satellite images were taken and the year in which
the data to be taken as control points was obtained is important. In order to see how the year
difference affects performance, more accurate information will be obtained by performing
similar studies with recent and long-term data.
The results from such studies can be transferred to other fields of study with similar
conditions and can be used as a guide for the selection of the best spectral band combinations
in studies related to stand parameters. In addition, these results are important for the selection
of possible bands in the classification of forest cover. It is estimated that these new
relationships can be applied to studies using LANDSAT, ASTER, SPOT, MODIS or
AVHRR data at regional or global scale.
Determining the carbon storage capacity of forests is becoming more and more important as
the forests are one of the most important factors affecting global climate change. It is of great
importance that this and similar studies be carried out using different satellite images so that
we do not have more information about the carbon storage capacity of our forests quickly.
References
Adnan, N.A., Razı, N.M., Yusoff, Z.M., Latıf, Z.A. 2017. Geospatial Temporal Estimation
and Analysis of Carbon Sequestration in the Taman Botani Negara Shah Alam, Centre of
Geospatial Technology, Centre of Studies Surveying Science & Geomatics, Faculty of
Architecture, Planning and Surveying, UTM, Shah Alam, Malaysia.
Çakır, C., Mısır, M., Mısır, N. 2017. Determination of Carbon Sequestration Using Remote
Sensing, International Confrerence on Agriculture, Forest, Food Sciences and Technologies,
15-17 Mayıs, Kapadokya, Turkey.
Malhi, Y., Phillips, O.L., Lloyd ,J. et al. 2002. An international network to monitor the
structure, composition and dynamics of Amazonian forests (RAINFOR). Journal of
Vegetation Science, 13, 439–450.
Mısır, N., Mısır, M. 2018. Development of a Common Protocol to Assess the Impact of
Forest Management Practices on Climate Change, TR2013/0327.05.01-02/124 NOLU ab
Projesi, D2.1 nolu iş paketi, Karadeniz Teknical University, Trabzon.
Mısır, M., Mısır, N, Ülker, C., Erkut, S. 2013. Saf Kayın Meşcerelerinin Karbon Depolama
Miktarının Belirlenmesi (Trabzon Orman Bölge Müdürlüğü Örneği), Bilimsel Araştırma
Projeleri, Trabzon. (In Turkish)
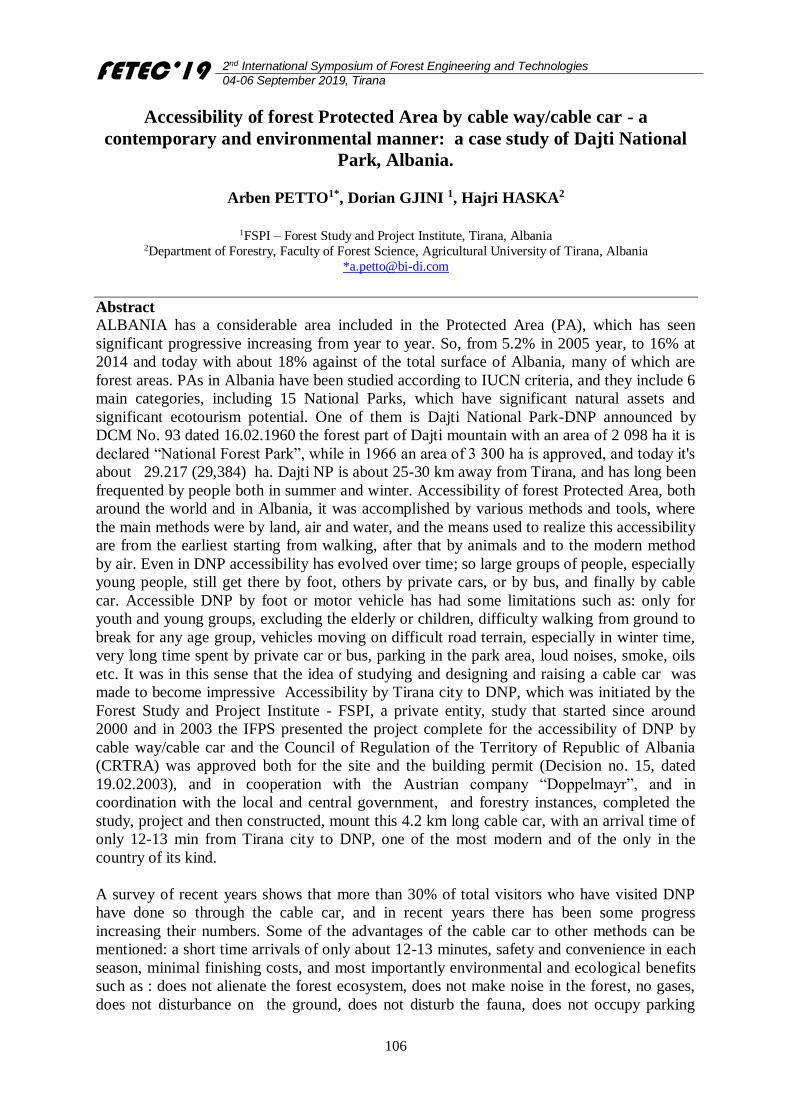
FETEC’19 2nd International Symposium of Forest Engineering and Technologies
04-06 September 2019, Tirana
106
Accessibility of forest Protected Area by cable way/cable car - a
contemporary and environmental manner: a case study of Dajti National
Park, Albania.
Arben PETTO1*, Dorian GJINI 1, Hajri HASKA2
1FSPI – Forest Study and Project Institute, Tirana, Albania 2Department of Forestry, Faculty of Forest Science, Agricultural University of Tirana, Albania
Abstract
ALBANIA has a considerable area included in the Protected Area (PA), which has seen
significant progressive increasing from year to year. So, from 5.2% in 2005 year, to 16% at
2014 and today with about 18% against of the total surface of Albania, many of which are
forest areas. PAs in Albania have been studied according to IUCN criteria, and they include 6
main categories, including 15 National Parks, which have significant natural assets and
significant ecotourism potential. One of them is Dajti National Park-DNP announced by
DCM No. 93 dated 16.02.1960 the forest part of Dajti mountain with an area of 2 098 ha it is
declared “National Forest Park”, while in 1966 an area of 3 300 ha is approved, and today it's
about 29.217 (29,384) ha. Dajti NP is about 25-30 km away from Tirana, and has long been
frequented by people both in summer and winter. Accessibility of forest Protected Area, both
around the world and in Albania, it was accomplished by various methods and tools, where
the main methods were by land, air and water, and the means used to realize this accessibility
are from the earliest starting from walking, after that by animals and to the modern method
by air. Even in DNP accessibility has evolved over time; so large groups of people, especially
young people, still get there by foot, others by private cars, or by bus, and finally by cable
car. Accessible DNP by foot or motor vehicle has had some limitations such as: only for
youth and young groups, excluding the elderly or children, difficulty walking from ground to
break for any age group, vehicles moving on difficult road terrain, especially in winter time,
very long time spent by private car or bus, parking in the park area, loud noises, smoke, oils
etc. It was in this sense that the idea of studying and designing and raising a cable car was
made to become impressive Accessibility by Tirana city to DNP, which was initiated by the
Forest Study and Project Institute - FSPI, a private entity, study that started since around
2000 and in 2003 the IFPS presented the project complete for the accessibility of DNP by
cable way/cable car and the Council of Regulation of the Territory of Republic of Albania
(CRTRA) was approved both for the site and the building permit (Decision no. 15, dated
19.02.2003), and in cooperation with the Austrian company “Doppelmayr”, and in
coordination with the local and central government, and forestry instances, completed the
study, project and then constructed, mount this 4.2 km long cable car, with an arrival time of
only 12-13 min from Tirana city to DNP, one of the most modern and of the only in the
country of its kind.
A survey of recent years shows that more than 30% of total visitors who have visited DNP
have done so through the cable car, and in recent years there has been some progress
increasing their numbers. Some of the advantages of the cable car to other methods can be
mentioned: a short time arrivals of only about 12-13 minutes, safety and convenience in each
season, minimal finishing costs, and most importantly environmental and ecological benefits
such as : does not alienate the forest ecosystem, does not make noise in the forest, no gases,
does not disturbance on the ground, does not disturb the fauna, does not occupy parking
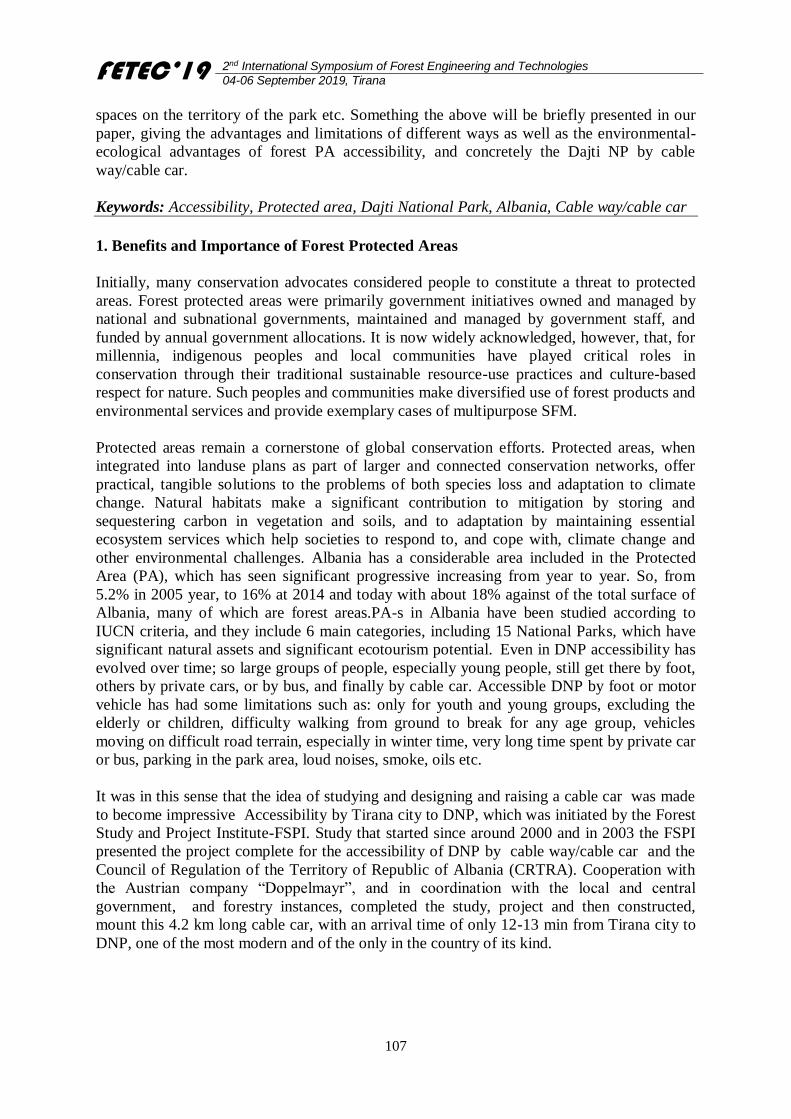
FETEC’19 2nd International Symposium of Forest Engineering and Technologies
04-06 September 2019, Tirana
107
spaces on the territory of the park etc. Something the above will be briefly presented in our
paper, giving the advantages and limitations of different ways as well as the environmental-
ecological advantages of forest PA accessibility, and concretely the Dajti NP by cable
way/cable car.
Keywords: Accessibility, Protected area, Dajti National Park, Albania, Cable way/cable car
1. Benefits and Importance of Forest Protected Areas
Initially, many conservation advocates considered people to constitute a threat to protected
areas. Forest protected areas were primarily government initiatives owned and managed by
national and subnational governments, maintained and managed by government staff, and
funded by annual government allocations. It is now widely acknowledged, however, that, for
millennia, indigenous peoples and local communities have played critical roles in
conservation through their traditional sustainable resource-use practices and culture-based
respect for nature. Such peoples and communities make diversified use of forest products and
environmental services and provide exemplary cases of multipurpose SFM.
Protected areas remain a cornerstone of global conservation efforts. Protected areas, when
integrated into landuse plans as part of larger and connected conservation networks, offer
practical, tangible solutions to the problems of both species loss and adaptation to climate
change. Natural habitats make a significant contribution to mitigation by storing and
sequestering carbon in vegetation and soils, and to adaptation by maintaining essential
ecosystem services which help societies to respond to, and cope with, climate change and
other environmental challenges. Albania has a considerable area included in the Protected
Area (PA), which has seen significant progressive increasing from year to year. So, from
5.2% in 2005 year, to 16% at 2014 and today with about 18% against of the total surface of
Albania, many of which are forest areas.PA-s in Albania have been studied according to
IUCN criteria, and they include 6 main categories, including 15 National Parks, which have
significant natural assets and significant ecotourism potential. Even in DNP accessibility has
evolved over time; so large groups of people, especially young people, still get there by foot,
others by private cars, or by bus, and finally by cable car. Accessible DNP by foot or motor
vehicle has had some limitations such as: only for youth and young groups, excluding the
elderly or children, difficulty walking from ground to break for any age group, vehicles
moving on difficult road terrain, especially in winter time, very long time spent by private car
or bus, parking in the park area, loud noises, smoke, oils etc.
It was in this sense that the idea of studying and designing and raising a cable car was made
to become impressive Accessibility by Tirana city to DNP, which was initiated by the Forest
Study and Project Institute-FSPI. Study that started since around 2000 and in 2003 the FSPI
presented the project complete for the accessibility of DNP by cable way/cable car and the
Council of Regulation of the Territory of Republic of Albania (CRTRA). Cooperation with
the Austrian company “Doppelmayr”, and in coordination with the local and central
government, and forestry instances, completed the study, project and then constructed,
mount this 4.2 km long cable car, with an arrival time of only 12-13 min from Tirana city to
DNP, one of the most modern and of the only in the country of its kind.
FETEC’19 2nd International Symposium of Forest Engineering and Technologies
04-06 September 2019, Tirana
108
Figure 1. Bottom station of ropeway of Dajti
A survey of recent years shows that more than 30% of total visitors who have visited DNP
have done so through the cable car, and in recent years there has been some progress
increasing their numbers. Some of the advantages of the cable car to other methods can be
mentioned: a short time arrivals of only about 12-13 minutes, safety and convenience in each
season, minimal finishing costs.
The ecological benefits such as:
does not alienate the forest ecosystem
does not make noise in the forest
no gases, does not disturbance on the ground
does not disturb the fauna
does not occupy parking spaces on the territory of the park
2. Governance of Forest Protected Areas for Multiple Objectives and Diverse
Management Arrangements
Good governance of protected areas is essential if management is to be effective and
objectives achieved; it is often the key to preventing or managing social conflicts and
generating and maintaining public support. In recent years, most protected-area and forest
management institutions have acknowledged the importance of recognizing the rights of
indigenous peoples and local communities and of sharing the relevant costs and benefits of
protected areas.This acknowledgement has led to the development of various governance
models for the management of forest protected areas. Such models take into account the need
to integrate protected areas in a larger conservation framework, the potential to increase
management capacity through partnerships, and the designation, within landscapes, of a
network of protected areas with differing management regimes and objectives. The
Convention on Biological Diversity’s Programme of Work on Protected Areas emphasizes
that protected areas should be an essential component of conservation strategies and that they
must be integrated into the wider landscape and into the concerns of society if they are to be
successful in the long term.
A wide variety of rightsholders and stakeholders are involved in the management of protected
areas, including forests, such as government agencies and ministries at various levels, elected
and traditional authorities, indigenous peoples and local communities, businesses and
corporations, private individuals and non-profit trusts, international bodies, professional
organizations, religious and educational organizations, military authorities, and political
FETEC’19 2nd International Symposium of Forest Engineering and Technologies
04-06 September 2019, Tirana
109
officials and parties. The 2003 World Parks Congress identified four main protected-area
governance types: governmental managed protected areas (state governance); co-managed
protected areas (shared governance); private protected areas (private governance); and
community conserved areas (community governance).
Experience has shown that the key factors in achieving well-managed protected areas are:
trained staff; strong institutions; secure political support; a good legal framework and
enforcement; the involvement of local communities in management planning and execution;
coordination among managing organizations; comprehensive land-use plans; well-marked
boundaries; and adequate funds.
3. The Environmental Code of conduct for Administrative body
An efficient Code of Conduct for Ecotourism development for the administrative
body of Dajti National Park should include a list of procedures expected to be
followed by organizers and tour operators before, during and after their trip to the site.
The Park Administration Code of Conduct includes elements such as:
Comply with all requirements of the Albanian Protected Area legal framework
and ensure that visitors are aware of requirements that are relevant to them;
Monitor environmental impacts of their activities, if appropriate, and advise
the Regional Environmental Agency or National environmental Agency of
any adverse or cumulative impacts resulting from an activity, which were not
foreseen by their environmental impact assessment;
Operate cars, motorcars, bicycles etc safely and according to appropriate
procedures;
Provide the Park with visitor information tables, signs and maps in Albanian
and English language and ensure that such information tables and signals are
easy watched and clearly indicate sites and related permitted activities, strict
protected sites, waste disposal sites, etc;
Provide Environmental Code of Conduct and Tourism Guides to visitors;
deliver to the tourism developers the Dajti National Park regulation and
summary of management plan.
Train appropriate local community members, give to them “Guidance license”
and offer them to visitors or tourism developers as licensed guides. Train the
tourism developers and host community on Dajti National Park features and
specifications, conservation objectives etc.
Apply fines to the tourism developers, visitors and host community in case of
not respecting Park restrictions and regulations
Intermediate in case of confrontations between tourism developers, host
community and visitors, avoiding conflicts
Maintain a careful and complete record of the activities conducted.
The code of Conduct is most useful when made available on site. It can be printed on
brochures, exhibited on signs where they are easily seen or proclaimed verbally to
visitors by administrative staff of the Park or local guides. The commitment of Park
administration on the Code of Conduct development and implementation is necessary.
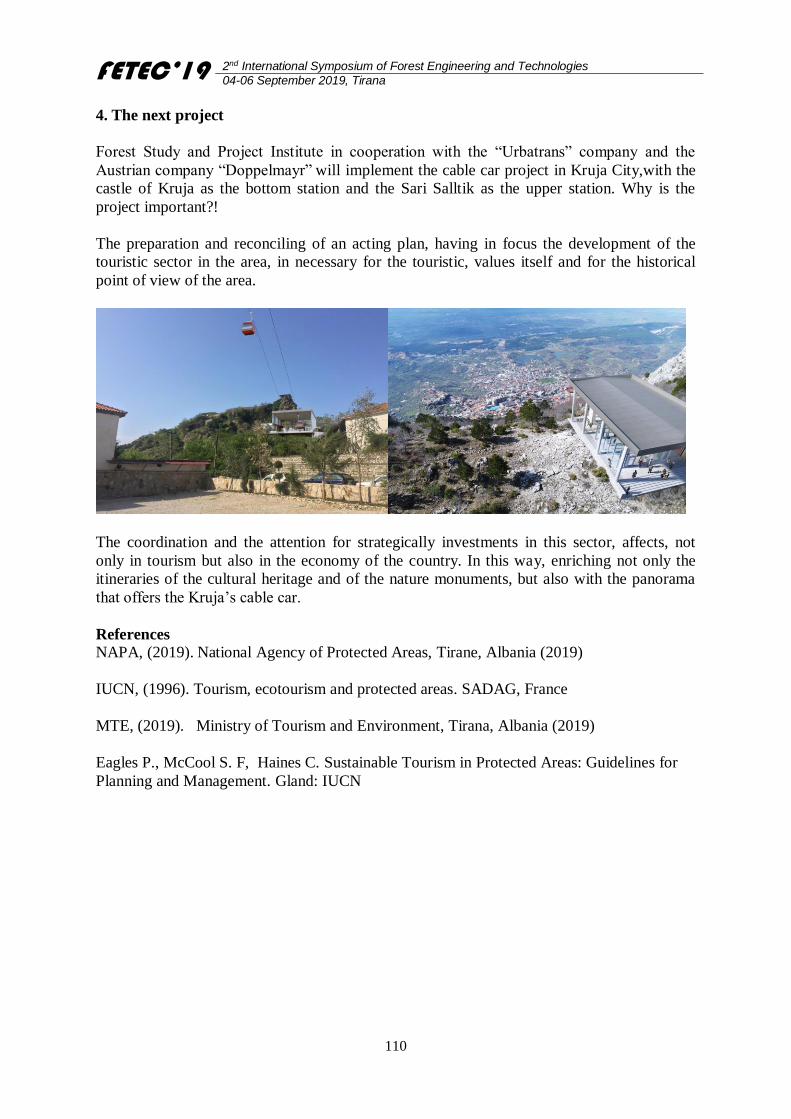
FETEC’19 2nd International Symposium of Forest Engineering and Technologies
04-06 September 2019, Tirana
110
4. The next project
Forest Study and Project Institute in cooperation with the “Urbatrans” company and the
Austrian company “Doppelmayr” will implement the cable car project in Kruja City,with the
castle of Kruja as the bottom station and the Sari Salltik as the upper station. Why is the
project important?!
The preparation and reconciling of an acting plan, having in focus the development of the
touristic sector in the area, in necessary for the touristic, values itself and for the historical
point of view of the area.
The coordination and the attention for strategically investments in this sector, affects, not
only in tourism but also in the economy of the country. In this way, enriching not only the
itineraries of the cultural heritage and of the nature monuments, but also with the panorama
that offers the Kruja’s cable car.
References
NAPA, (2019). National Agency of Protected Areas, Tirane, Albania (2019)
IUCN, (1996). Tourism, ecotourism and protected areas. SADAG, France
MTE, (2019). Ministry of Tourism and Environment, Tirana, Albania (2019)
Eagles P., McCool S. F, Haines C. Sustainable Tourism in Protected Areas: Guidelines for
Planning and Management. Gland: IUCN
FETEC’19 2nd International Symposium of Forest Engineering and Technologies
04-06 September 2019, Tirana
111
Effects of Timber Harvesting Activities on Needle Litter Decomposition
Rates and Nutrient Concentrations of Black Pine
Korhan ENEZ*1, Temel SARIYILDIZ2, Gamze SAVACI1
1 Kastamonu University, Faculty of Forestry, Department of Forest Engineering, Kastamonu, TURKEY 2 Bursa Technical University, Faculty of Forestry, Department of Forest Engineering, Bursa, TURKEY
Abstract
This study aims at investigating the possible effects of harvesting activities on needle litter
decomposition rates and nutrient concentrations of black pine (Pinus nigra Arnold.) needles
under the different micro-ecologic areas. Those micro-ecologic areas were named as (1) non-
harvesting activity areas (control) (C), (2) intra-forest skidding roads (Skidding road) (SR), (3)
under logging residues (Logging residue) (LR) and areas with a 20% slope and top-soil
damaged during harvesting activities and (4) scalped mineral soil (SMS). The litter
decomposition bags were placed at their own stands where the harvesting activities were
previously carried out and also at the adjacent stands as control where there were no harvesting
activities. The litter decomposition experiment was followed for 18 months, and every 6
months, a number of litter bags were collected from the field, and litter mass loss rates were
calculated. In addition, variation in macro (Mg, P, S, K, Ca) and micro (Na, Cl, Mn, Fe, Cu,
Zn) nutrient concentrations in the needle litter of black pine during the decomposition processes
were determined. The results showed that there were significant variations in the litter mass
loses and the nutrient concentrations among the different micro-ecologic areas.
Keywords: Harvesting activities, Black pine, Needle litter decomposition, Nutrients, Micro-
ecologic areas
1. INTRODUCTION
The dynamics of litter on the forest floor constitute an important part of the energy transfer and
nutrition cycle in forest ecosystems. Besides, litter decomposition which is shown to play an
important role in globally scaled carbon studies carried out recent years, has also crucial effects
both in global and regional climate changes. Among the soil biological processes, forest litter
decomposition is known to be fundamental biological soil process, and it is also important to
many ecosystem functions such as the formation of soil organic matter, the mineralization of
organic nutrients, and the carbon balance.
Decomposition is affected by a sequential order of relationships of physical, chemical and
biological factors. Climate puts physiological pressure on the activity of the microorganisms
and limits the general decomposition events, whereas biochemical quality of the decomposed
material determines the decomposition rate with the organisms. The studies carried out in
macro scale areas have emphasized the importance of the climate factor, whereas the other
studies have shown that biochemical structure of the decomposed material is the most
significant factor upon the decomposition under the small scale areas (Sarıyıldız, 2002).
Many studies have stated three fundamental factors influencing the litter decomposition and
release of nutrients. These are 1) climate characteristics of the atmosphere (especially heat
and rain) where the decomposition of the litter occurs, 2) number, variety, activity of the
microorganisms and soil organisms and 3) chemical components of the decomposed litter.
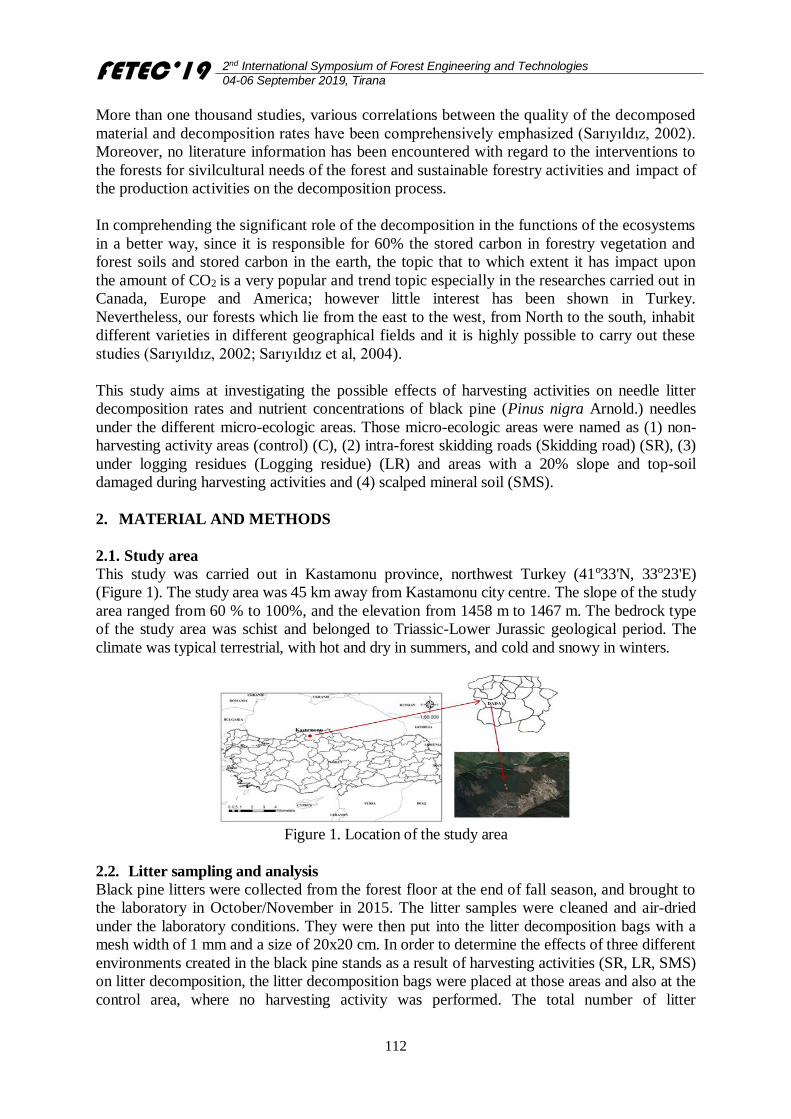
FETEC’19 2nd International Symposium of Forest Engineering and Technologies
04-06 September 2019, Tirana
112
More than one thousand studies, various correlations between the quality of the decomposed
material and decomposition rates have been comprehensively emphasized (Sarıyıldız, 2002).
Moreover, no literature information has been encountered with regard to the interventions to
the forests for sivilcultural needs of the forest and sustainable forestry activities and impact of
the production activities on the decomposition process.
In comprehending the significant role of the decomposition in the functions of the ecosystems
in a better way, since it is responsible for 60% the stored carbon in forestry vegetation and
forest soils and stored carbon in the earth, the topic that to which extent it has impact upon
the amount of CO2 is a very popular and trend topic especially in the researches carried out in
Canada, Europe and America; however little interest has been shown in Turkey.
Nevertheless, our forests which lie from the east to the west, from North to the south, inhabit
different varieties in different geographical fields and it is highly possible to carry out these
studies (Sarıyıldız, 2002; Sarıyıldız et al, 2004).
This study aims at investigating the possible effects of harvesting activities on needle litter
decomposition rates and nutrient concentrations of black pine (Pinus nigra Arnold.) needles
under the different micro-ecologic areas. Those micro-ecologic areas were named as (1) non-
harvesting activity areas (control) (C), (2) intra-forest skidding roads (Skidding road) (SR), (3)
under logging residues (Logging residue) (LR) and areas with a 20% slope and top-soil
damaged during harvesting activities and (4) scalped mineral soil (SMS).
2. MATERIAL AND METHODS
2.1. Study area
This study was carried out in Kastamonu province, northwest Turkey (41o33'N, 33o23'E)
(Figure 1). The study area was 45 km away from Kastamonu city centre. The slope of the study
area ranged from 60 % to 100%, and the elevation from 1458 m to 1467 m. The bedrock type
of the study area was schist and belonged to Triassic-Lower Jurassic geological period. The
climate was typical terrestrial, with hot and dry in summers, and cold and snowy in winters.
Figure 1. Location of the study area
2.2. Litter sampling and analysis
Black pine litters were collected from the forest floor at the end of fall season, and brought to
the laboratory in October/November in 2015. The litter samples were cleaned and air-dried
under the laboratory conditions. They were then put into the litter decomposition bags with a
mesh width of 1 mm and a size of 20x20 cm. In order to determine the effects of three different
environments created in the black pine stands as a result of harvesting activities (SR, LR, SMS)
on litter decomposition, the litter decomposition bags were placed at those areas and also at the
control area, where no harvesting activity was performed. The total number of litter
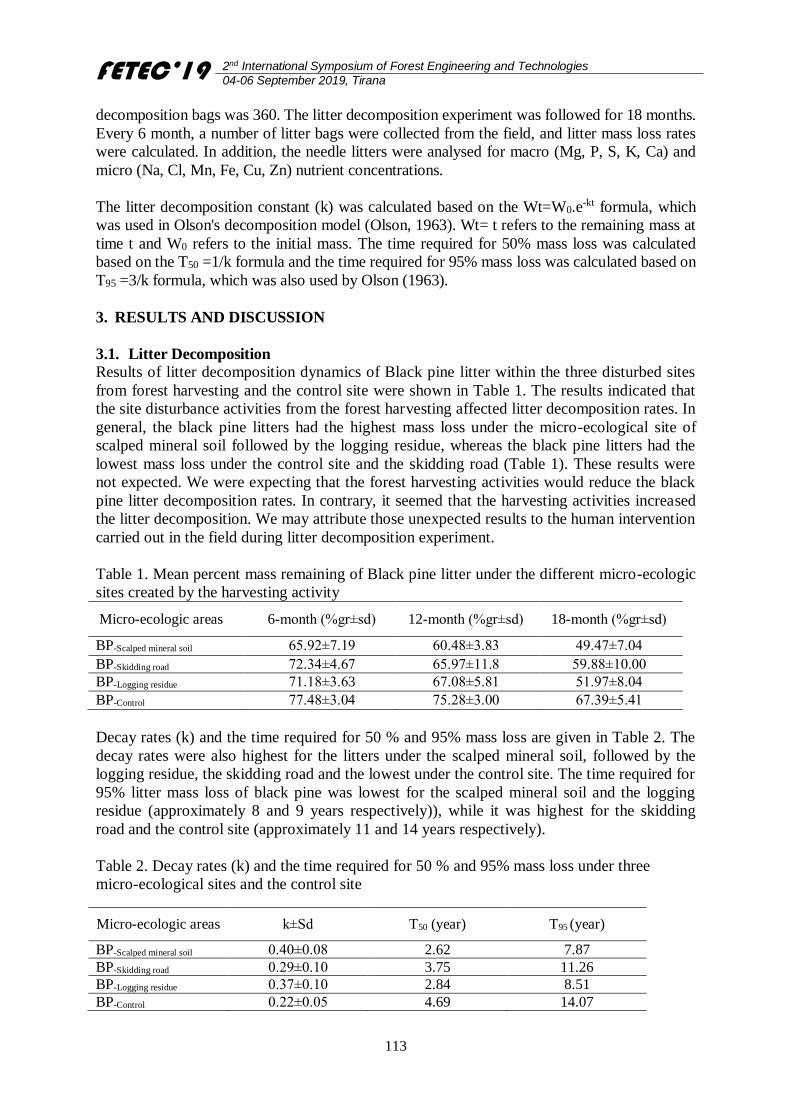
FETEC’19 2nd International Symposium of Forest Engineering and Technologies
04-06 September 2019, Tirana
113
decomposition bags was 360. The litter decomposition experiment was followed for 18 months.
Every 6 month, a number of litter bags were collected from the field, and litter mass loss rates
were calculated. In addition, the needle litters were analysed for macro (Mg, P, S, K, Ca) and
micro (Na, Cl, Mn, Fe, Cu, Zn) nutrient concentrations.
The litter decomposition constant (k) was calculated based on the Wt=W0.e-kt formula, which
was used in Olson's decomposition model (Olson, 1963). Wt= t refers to the remaining mass at
time t and W0 refers to the initial mass. The time required for 50% mass loss was calculated
based on the T50 =1/k formula and the time required for 95% mass loss was calculated based on
T95 =3/k formula, which was also used by Olson (1963).
3. RESULTS AND DISCUSSION
3.1. Litter Decomposition
Results of litter decomposition dynamics of Black pine litter within the three disturbed sites
from forest harvesting and the control site were shown in Table 1. The results indicated that
the site disturbance activities from the forest harvesting affected litter decomposition rates. In
general, the black pine litters had the highest mass loss under the micro-ecological site of
scalped mineral soil followed by the logging residue, whereas the black pine litters had the
lowest mass loss under the control site and the skidding road (Table 1). These results were
not expected. We were expecting that the forest harvesting activities would reduce the black
pine litter decomposition rates. In contrary, it seemed that the harvesting activities increased
the litter decomposition. We may attribute those unexpected results to the human intervention
carried out in the field during litter decomposition experiment.
Table 1. Mean percent mass remaining of Black pine litter under the different micro-ecologic
sites created by the harvesting activity
Micro-ecologic areas 6-month (%gr±sd) 12-month (%gr±sd) 18-month (%gr±sd)
BP-Scalped mineral soil 65.92±7.19 60.48±3.83 49.47±7.04
BP-Skidding road 72.34±4.67 65.97±11.8 59.88±10.00
BP-Logging residue 71.18±3.63 67.08±5.81 51.97±8.04
BP-Control 77.48±3.04 75.28±3.00 67.39±5.41
Decay rates (k) and the time required for 50 % and 95% mass loss are given in Table 2. The
decay rates were also highest for the litters under the scalped mineral soil, followed by the
logging residue, the skidding road and the lowest under the control site. The time required for
95% litter mass loss of black pine was lowest for the scalped mineral soil and the logging
residue (approximately 8 and 9 years respectively)), while it was highest for the skidding
road and the control site (approximately 11 and 14 years respectively).
Table 2. Decay rates (k) and the time required for 50 % and 95% mass loss under three
micro-ecological sites and the control site
Micro-ecologic areas k±Sd T50 (year) T95 (year)
BP-Scalped mineral soil 0.40±0.08 2.62 7.87
BP-Skidding road 0.29±0.10 3.75 11.26
BP-Logging residue 0.37±0.10 2.84 8.51
BP-Control 0.22±0.05 4.69 14.07
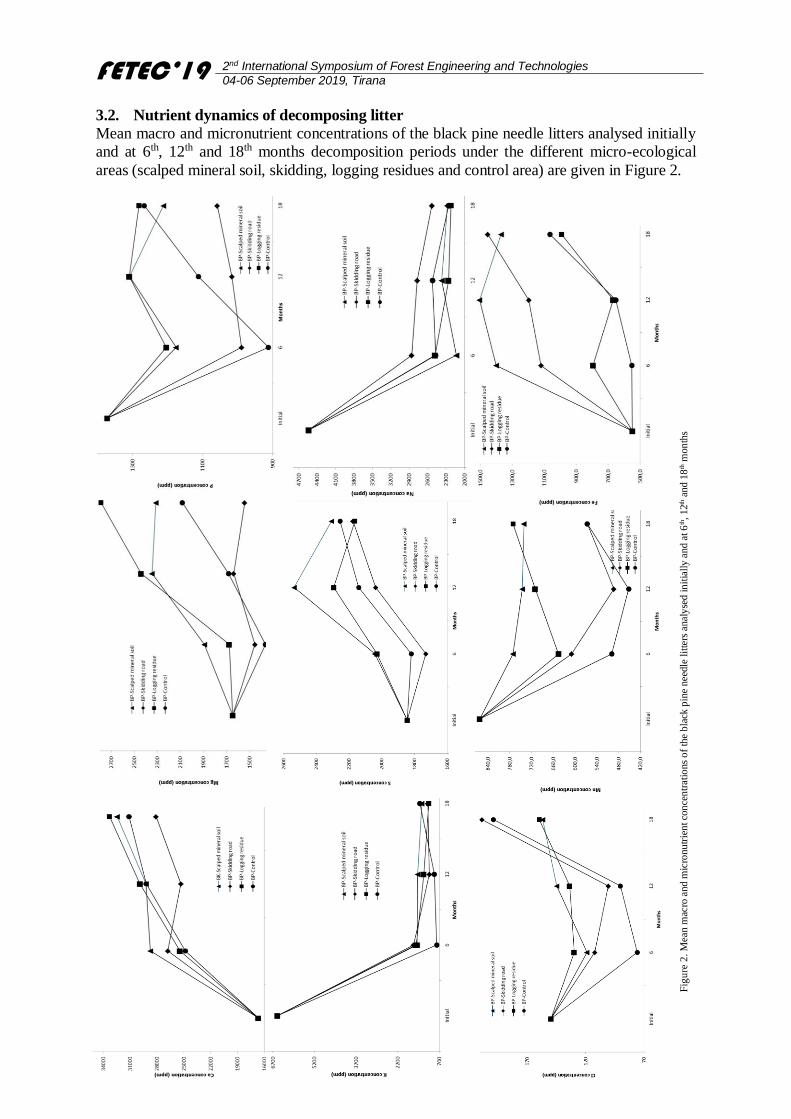
FETEC’19 2nd International Symposium of Forest Engineering and Technologies
04-06 September 2019, Tirana
114
3.2. Nutrient dynamics of decomposing litter
Mean macro and micronutrient concentrations of the black pine needle litters analysed initially
and at 6th, 12th and 18th months decomposition periods under the different micro-ecological
areas (scalped mineral soil, skidding, logging residues and control area) are given in Figure 2.
Fig
ure
2. M
ean
mac
ro a
nd
mic
ronu
trie
nt co
nce
ntr
atio
ns
of
the
bla
ck p
ine
nee
dle
lit
ters
anal
yse
d in
itia
lly
and
at 6
th, 12
th a
nd
18
th m
on
ths
dec
om
po
siti
on
per
iod
s un
der
the
dif
fere
nt m
icro
-eco
log
ical
are
as

FETEC’19 2nd International Symposium of Forest Engineering and Technologies
04-06 September 2019, Tirana
115
Figure 2 continued
Litter Ca concentration from the logging residues and the control area was linear from the
beginning to the end of the 18th month, while Ca concentration from the other micro-ecological
areas was initially low and then showed an increase and later a decrease. K concentration was
initially highest and then lowest values were observed in the other months. Mg concentration in
the black pine litters was highest at 18th month under control area and logging residues. P
concentrations were initially highest, after that a fluctuation in the form of decrease-increase
was observed in the other months (Figure 2). Na concentration was initially highest and then
decrease in the other months. The highest Cl concentration was observed at 18th months in
black pine needles under the different micro-ecological areas. Fe concentration was highest
under the scalped mineral soils. The Cu concentration had the highest value under the control
area, followed by the logging residues and skidding roads at the 18th month. A linear increase
in the Zn concentration under the control area was observed, whereas there was a fluctuation in
the form of an increase and decrease for the other sites (Figure 2).
Plant nutrients are released from plant litter either by mechanical leaching or breakdown of
structural organic components by soil organisms. Leaching, a process highly dependent on the
litter type (Nykvist, 1963), is partly responsible for the initial release of magnesium and
potassium from Scots pine needle litter (Staaf and Berg, 1977). Climatic conditions such as
freeze-thaw cycles and rainfall could thus be expected to be important for the release of these
elements. The release of nitrogen, phosphorus and calcium, on the other hand, which, at least in
later stages of decay, are lost about proportionally to organic matter (Staaf and Berg, 1977), and
they should be regulated by factors similar to those regulating total decomposition rate.
Nutrient release through litter decomposition may cause improvements in soil fertility.
4. CONCLUSION AND SUGGESTION
The results show that there are significant variations in the litter mass loses and the nutrient
concentrations among the different micro-ecologic areas due to the site disturbance activities
from the forest harvesting. This results makes it mandatory to specify the operation plans and
especially the skidding routes with its inspection for the production activities. It is seen that the
time required for 50 % and 95% mass loss under three micro-ecological sites and the control
site show significant variations. This situation needs to be strengthened with the statistical
analysis and it is seen that the required attention should be paid in the interventions with the
nature.
FETEC’19 2nd International Symposium of Forest Engineering and Technologies
04-06 September 2019, Tirana
116
Acknowledgements
This study was supported by a research grant from the Kastamonu University (Project No. KÜ-
BAP01/2015-19).
References Johansson, M.B. 1994. Decomposition Rates of Scots Pine Needle Litter related to Site Properties,
Litter Quality and Climate. Can. J. For. Res. 24(9):1771-1781. Kumar, B.M., George, S.J., Jamaludheen, V., Suresh, T.K. 1998. Comparison of Biomass Production,
Tree Allometry and Nutrient Use Efficiency of Multipurpose Trees Grown under Three Age-series
in Kerala, India. For. Ecol. Manage., 112/1-2, 147-165. Nykvist, N. 1963. Leaching and Decomposition of Water-soluble Organic Substances from Different
Types of Leaf and Needle Litter. Stud. for. suec. 3, 31 pp.
Olson, J.S. 1963. Energy Storage and the Balance of Producers and Decomposers in Ecological
Systems. Ecology, 44(2):322-331. Sarıyıldız, T. 2002. Ölü Örtünün Ayrışmasının Önemi ve Ölü Örtü Ayrışmasında Ölü Örtü
Bileşenlerinin Etkisi Konusunda Yapılan Çalışmalara Genel Bir Bakış. II. Ulusal Karadeniz
Ormancılık Kongresi Cilt 2: 807-819. Sariyildiz, T., Acar, M., Küçük, M. 2010. Kök Ayrışma Seyri Üzerinde Ağaç Türünün ve
Topografyanın Etkisi, III. Ulusal, Karadeniz Ormancılık Kongresi, 20-22.
Sarıyıldız, T., Tüfekçioğlu, A., Küçük, M. 2004. Comparison of Decomposition rates of Beech (Fagus orientalis Lipsky) and Spruce (Picea orientalis (L.) Link) Litter in pure and mixed stands
of both species in Artvin, Turkey.
Staaf, H., Berg, B. 1977. Mobilization of Plant Nutrients in a Scots pine forest mor in Central
Sweden. Silva fenn. 11:210-217.
FETEC’19 2nd International Symposium of Forest Engineering and Technologies
04-06 September 2019, Tirana
117
Some Aspects of the Assessment of the Erosion Rate in the Ulza Basin as a
Function of Land use In Forest Areas in this Region
Enea MALAJ*, Ledis KOLA
Indipendent expert, Msc in Forestry field, Tirana, Albania
Abstract
The overall objective of the study was to evaluate the extent of soil erosion in relation to
topography and vegetation in the Ulza basin to provide quantitative data on actual land loss
and its trend, which can be used in land use planning and land conservation in this area.
Specific objectives were to determine the amount of land currently lost by water erosion and
estimate the trend of loss in the study area. Determine the cost instead of soil erosion in the
Ulza basin. To analyze the relationship between land erosion and land use in the project area.
Raise awareness among farmers, water users, national and local authorities of the importance
of applying best management practices and payment for environmental services for the
economy and ecology of the area. The field work has focused on performing soil layer
deposition measurements at erosion monitoring stations, in order to evaluate the degree of
erosion by land use categories by man. Based on the results of the measurements, we aim to
draw conclusions on effective measures to prevent this phenomenon.
Keywords: Forest lands, soil erosion, man and erosion, economic losses, sustainable
management of forest ecosystems
1. INTRODUCTION
Erosion is a major threat to soil resources in Albania, and may impair their ability to deliver a
range of ecosystem goods and services. Therefore, accurate data on soil loss are required,
especially in the light of predicted changes in climate patterns, notably frequency, seasonal
distribution and intensity of precipitation. Rates of soil loss differ between soil types and a
variety of landscapes and must be compared with natural rates of soil formation which can be
used as a basis for setting tolerable soil erosion levels. A modified definition of tolerable soil
erosion is proposed as ‘any actual soil erosion rate at which a deterioration or loss of one or
more soil functions does not occur’, actual soil erosion being ‘the total amount of soil lost by
all recognised erosion types’. The causes of accelerated soil erosion are influenced by a
number of factors (Morgan, 2005) and the most significant are: soil erodibility or
susceptibility to erosive forces, as determined by soil physical, chemical and biological
properties (Czarnes et al., 2000; Doerr et al., 2000, Allton, 2006; Shakesby and Doerr, 2006),
erosivity or energy of the eroding agent, e.g. rainfall, overland flow or wind (Morgan et al.,
1986; Knighton, 1998); slope characteristics (Meyer et al., 1975; D’Souza and Morgan, 1976;
Wischmeier and Smith, 1978), land cover use and management (Gyssels et al., 2005; Zhang
et.al., 2007).
Soil erosion is a natural process, occurring over geological time, and most concerns about
erosion are related to accelerated erosion, where the natural rate has been significantly
increased by human action. Soil erosion is considered as one of the major threats to
European soils, particularly in the Mediterranean areas (Communication on Soil Protection –
“Towards a Thematic Strategy for Soil Protection”, CEC, 2002). In order to effectively
FETEC’19 2nd International Symposium of Forest Engineering and Technologies
04-06 September 2019, Tirana
118
formulate mitigation strategies and implement conservation measurements to counteract soil
erosion, it is essential to identify the hotspots and rating them based on the risk level. There
are numerous studies identifying various factors contributing to erosion where land cover
change and land use are factors which strongly are affected by the mankind determining the
susceptibility to erosion. Moreover the conventional cultivation practices especially in the
agriculture lands which have a direct impact in the soil erosion may be modified and
mitigating their effect in a short period due to the application of the best cultivation practices
and crops planting. Thus soil erosion is considered as the major form of soil degradation in
Albania inducing severe limitations to sustainable agriculture land use, pasture and forest
management. The average rate of soil formation in Europe is estimated at about 1.4
t/ha/year (Verheijen et al., 2009, quoted by Panagos et al. 2010). Therefore, any soil loss
more than 1.4 t/ha/year can be considered irreversible. In Albania soil loss ranged from 20 to
70 t/ha (WB, 2007) and these data may happen in individual storms in extreme events
(Morgan,1992). The Ulza watershed is prone to soil erosion and this phenomenon has caused
irreversible consequences in the landscape. Erosion phenomenon is induced by the
combination of various factors. These factors are grouped together in several groups: climate
factors (precipitation, rainfall intensity, rainfall duration and distribution, wind); soil factors
(soil type, soil moisture, humus, litter layer, soil chemical compounds, bedrock); topographic
factors; watershed slope, watershed area, aspect, elevation, vegetation cover; hydrographical
factors; creeks density, water flow length; human factors; land use factors. Ulza watershed
provides a wide combination of these factors because of the specific characteristics of this
entity. Our aim is the analysis of such factor’s combination on soil loss and sediment and the
estimation of the erosion quantity depending on the land use in the Ulza watershed. In order
to have a clear evidence about the erosion and soil loss in the Ulza watershed the
experimental sample plots are located in various types of land cover and usage. By raising the
number of experimental sample plots and making a distribution in all types of land use and
possible combinations of such factors we aim to increase the accuracy of data about soil loss.
Monitoring of soil loss using runoff plots is considered cost-effective allowing direct linkages
between land use, current management practices and their impacts on runoff and soil erosion.
Identification of the problems on land management practices especially on agriculture and
pasture will serve to take appropriate preventive measures to reduce soil loss by improving
management practices.
2. PURPOSE OF THE STUDY
2.1 General purpose
The overall purpose of the study was to evaluate the degree of soil erosion in relation to
topography and vegetation in the Ulza basin to provide quantitative data on actual land loss
and its trend, which can be used in land use planning and land conservation in this area.
2.2 Specific Objectives
Determine the amount of land currently lost by aquatic erosion and estimate the trend of
loss in the study area.
Determine the cost instead of soil erosion in the Ulza basin.
To analyze the relationship between land erosion and land use in the project area.
Raise awareness among farmers, water users, national and local authorities of the
importance of applying best management practices and payment for environmental
services for the economy and ecology of the area.
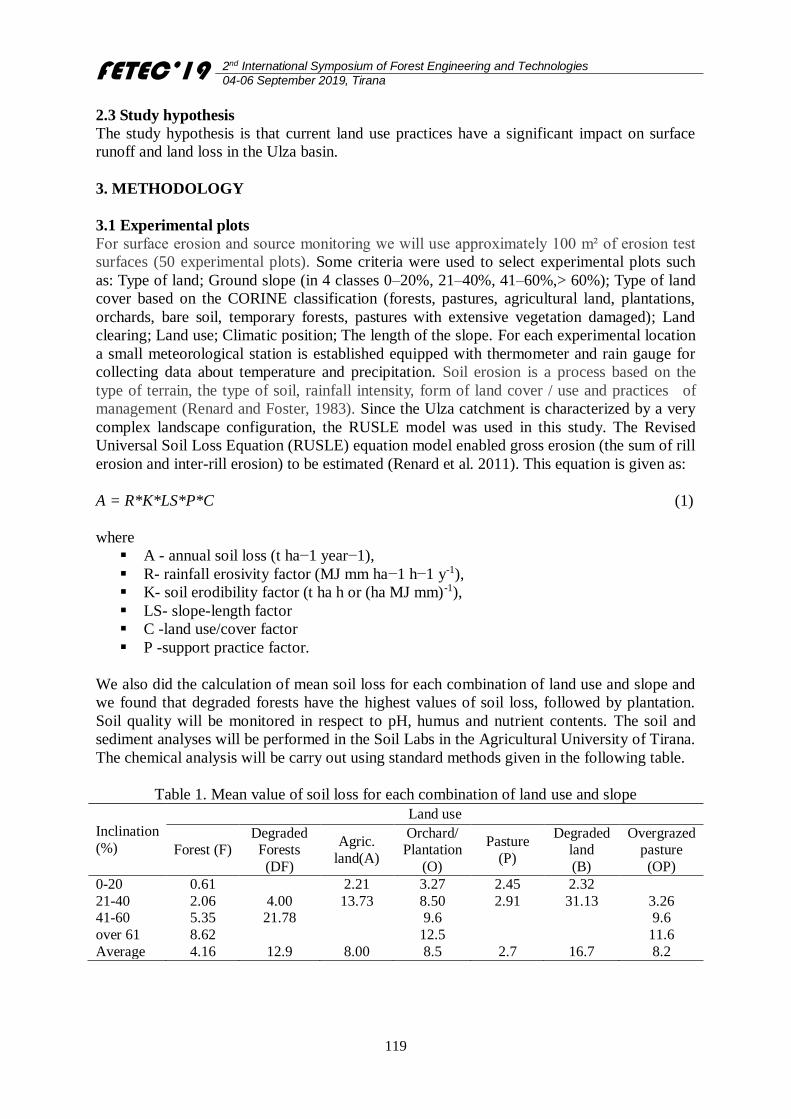
FETEC’19 2nd International Symposium of Forest Engineering and Technologies
04-06 September 2019, Tirana
119
2.3 Study hypothesis
The study hypothesis is that current land use practices have a significant impact on surface
runoff and land loss in the Ulza basin.
3. METHODOLOGY
3.1 Experimental plots
For surface erosion and source monitoring we will use approximately 100 m² of erosion test
surfaces (50 experimental plots). Some criteria were used to select experimental plots such
as: Type of land; Ground slope (in 4 classes 0–20%, 21–40%, 41–60%,> 60%); Type of land
cover based on the CORINE classification (forests, pastures, agricultural land, plantations,
orchards, bare soil, temporary forests, pastures with extensive vegetation damaged); Land
clearing; Land use; Climatic position; The length of the slope. For each experimental location
a small meteorological station is established equipped with thermometer and rain gauge for
collecting data about temperature and precipitation. Soil erosion is a process based on the
type of terrain, the type of soil, rainfall intensity, form of land cover / use and practices of
management (Renard and Foster, 1983). Since the Ulza catchment is characterized by a very
complex landscape configuration, the RUSLE model was used in this study. The Revised
Universal Soil Loss Equation (RUSLE) equation model enabled gross erosion (the sum of rill
erosion and inter-rill erosion) to be estimated (Renard et al. 2011). This equation is given as:
A = R*K*LS*P*C (1)
where
A - annual soil loss (t ha−1 year−1),
R- rainfall erosivity factor (MJ mm ha−1 h−1 y-1),
K- soil erodibility factor (t ha h or (ha MJ mm)-1),
LS- slope-length factor
C -land use/cover factor
P -support practice factor.
We also did the calculation of mean soil loss for each combination of land use and slope and
we found that degraded forests have the highest values of soil loss, followed by plantation.
Soil quality will be monitored in respect to pH, humus and nutrient contents. The soil and
sediment analyses will be performed in the Soil Labs in the Agricultural University of Tirana.
The chemical analysis will be carry out using standard methods given in the following table.
Table 1. Mean value of soil loss for each combination of land use and slope
Inclination
(%)
Land use
Forest (F) Degraded Forests
(DF)
Agric.
land(A)
Orchard/ Plantation
(O)
Pasture
(P)
Degraded land
(B)
Overgrazed pasture
(OP)
0-20 0.61 2.21 3.27 2.45 2.32
21-40 2.06 4.00 13.73 8.50 2.91 31.13 3.26 41-60 5.35 21.78 9.6 9.6
over 61 8.62 12.5 11.6
Average 4.16 12.9 8.00 8.5 2.7 16.7 8.2
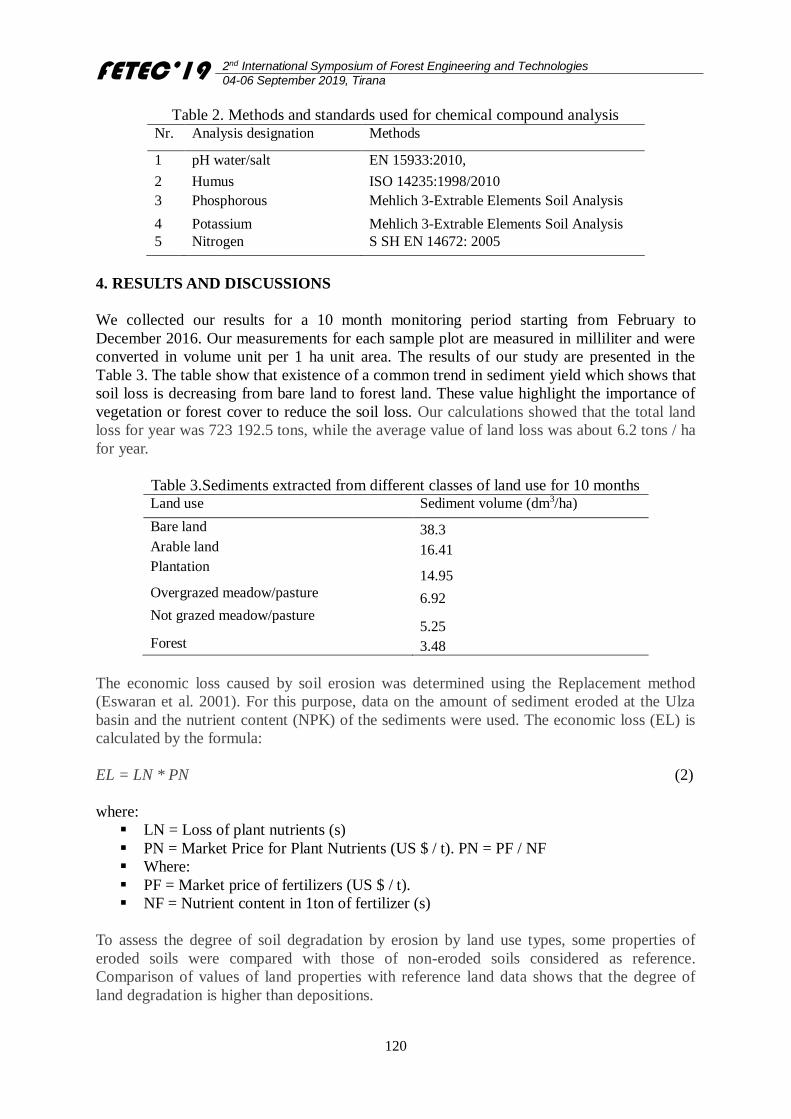
FETEC’19 2nd International Symposium of Forest Engineering and Technologies
04-06 September 2019, Tirana
120
Table 2. Methods and standards used for chemical compound analysis Nr. Analysis designation Methods
1 pH water/salt EN 15933:2010,
2 Humus ISO 14235:1998/2010
3 Phosphorous Mehlich 3-Extrable Elements Soil Analysis
4 Potassium Mehlich 3-Extrable Elements Soil Analysis
5 Nitrogen S SH EN 14672: 2005
4. RESULTS AND DISCUSSIONS
We collected our results for a 10 month monitoring period starting from February to
December 2016. Our measurements for each sample plot are measured in milliliter and were
converted in volume unit per 1 ha unit area. The results of our study are presented in the
Table 3. The table show that existence of a common trend in sediment yield which shows that
soil loss is decreasing from bare land to forest land. These value highlight the importance of
vegetation or forest cover to reduce the soil loss. Our calculations showed that the total land
loss for year was 723 192.5 tons, while the average value of land loss was about 6.2 tons / ha
for year.
Table 3.Sediments extracted from different classes of land use for 10 months Land use Sediment volume (dm3/ha)
Bare land 38.3
Arable land 16.41 Plantation
14.95
Overgrazed meadow/pasture 6.92
Not grazed meadow/pasture 5.25
Forest 3.48
The economic loss caused by soil erosion was determined using the Replacement method
(Eswaran et al. 2001). For this purpose, data on the amount of sediment eroded at the Ulza
basin and the nutrient content (NPK) of the sediments were used. The economic loss (EL) is
calculated by the formula:
EL = LN * PN (2)
where:
LN = Loss of plant nutrients (s)
PN = Market Price for Plant Nutrients (US $ / t). PN = PF / NF
Where:
PF = Market price of fertilizers (US $ / t).
NF = Nutrient content in 1ton of fertilizer (s)
To assess the degree of soil degradation by erosion by land use types, some properties of
eroded soils were compared with those of non-eroded soils considered as reference.
Comparison of values of land properties with reference land data shows that the degree of
land degradation is higher than depositions.
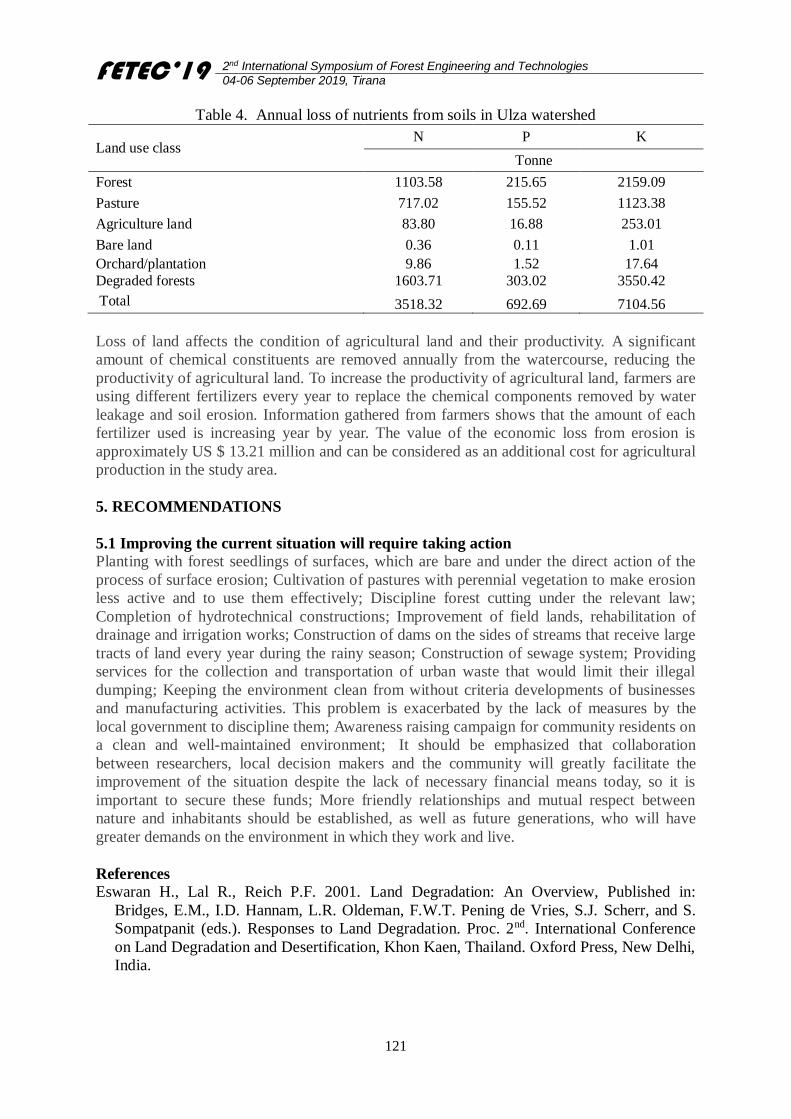
FETEC’19 2nd International Symposium of Forest Engineering and Technologies
04-06 September 2019, Tirana
121
Table 4. Annual loss of nutrients from soils in Ulza watershed
Land use class N P K
Tonne
Forest 1103.58 215.65 2159.09
Pasture 717.02 155.52 1123.38
Agriculture land 83.80 16.88 253.01
Bare land 0.36 0.11 1.01
Orchard/plantation 9.86 1.52 17.64
Degraded forests 1603.71 303.02 3550.42
Total 3518.32 692.69 7104.56
Loss of land affects the condition of agricultural land and their productivity. A significant
amount of chemical constituents are removed annually from the watercourse, reducing the
productivity of agricultural land. To increase the productivity of agricultural land, farmers are
using different fertilizers every year to replace the chemical components removed by water
leakage and soil erosion. Information gathered from farmers shows that the amount of each
fertilizer used is increasing year by year. The value of the economic loss from erosion is
approximately US $ 13.21 million and can be considered as an additional cost for agricultural
production in the study area.
5. RECOMMENDATIONS
5.1 Improving the current situation will require taking action
Planting with forest seedlings of surfaces, which are bare and under the direct action of the
process of surface erosion; Cultivation of pastures with perennial vegetation to make erosion
less active and to use them effectively; Discipline forest cutting under the relevant law;
Completion of hydrotechnical constructions; Improvement of field lands, rehabilitation of
drainage and irrigation works; Construction of dams on the sides of streams that receive large
tracts of land every year during the rainy season; Construction of sewage system; Providing
services for the collection and transportation of urban waste that would limit their illegal
dumping; Keeping the environment clean from without criteria developments of businesses
and manufacturing activities. This problem is exacerbated by the lack of measures by the
local government to discipline them; Awareness raising campaign for community residents on
a clean and well-maintained environment; It should be emphasized that collaboration
between researchers, local decision makers and the community will greatly facilitate the
improvement of the situation despite the lack of necessary financial means today, so it is
important to secure these funds; More friendly relationships and mutual respect between
nature and inhabitants should be established, as well as future generations, who will have
greater demands on the environment in which they work and live.
References
Eswaran H., Lal R., Reich P.F. 2001. Land Degradation: An Overview, Published in:
Bridges, E.M., I.D. Hannam, L.R. Oldeman, F.W.T. Pening de Vries, S.J. Scherr, and S.
Sompatpanit (eds.). Responses to Land Degradation. Proc. 2nd. International Conference
on Land Degradation and Desertification, Khon Kaen, Thailand. Oxford Press, New Delhi,
India.

FETEC’19 2nd International Symposium of Forest Engineering and Technologies
04-06 September 2019, Tirana
122
Oliveira, V. A. de., Mello, C.R. de., Durães, M.F.,da Silva, A.M. 2014. Soil Erosion
Vulnerability In The Verde River Basin, Southern Minas Gerais. Ciênc. Agrotec., Lavras,
v.38, n. 3, p.262-269, maio./jun.
Tesfahunegn, G. B. and Vlek, P. L. G. 2013. Assessing Sediment-Nutrient Export Rate and
Soil Degradation in Mai-Negus Catchment, Northern Ethiopia. ISRN Soil Science,
Volume 2013, Article ID 748561, 10 pages, http://dx.doi.org/10.1155/2013/748561
The Academy of Sciences of the Republic of Albania, 1991. The Physical Geography of
Albania. Vol. II. pp. 490.
Academy of Sciences of the Republic of Albania. 1991. Climate of Albania.
Allton, K.E. 2006. Interactions between soil microbial communities, erodibility and tillage
practices, PhD thesis, Cranfield University, Cranfield, 224 pp.
Beskow S., Mello CR., Norton LD. 2009. Soil erosion prediction in the Grande River Basin,
Brazil using distributed modeling. Catena 79(1):49-59.
FETEC’19 2nd International Symposium of Forest Engineering and Technologies
04-06 September 2019, Tirana
123
Post harvesting evaluation - an ecological-environmental assessment of
forest harvested areas, a case study of forest ecosystems in the Gramshi
region, Albania
Hajri HASKA1*
1Department of Forestry, Faculty of Forest Sciences, Agricultural University of Tirana, Albania
Abstract
Forests have a multifunctional role, which is reflected in some direction as: biological:
timber, green bio-mass, fruit; ecological:-take part in driving cycles of carbon, water,
nitrogen, influence on climate, soil, air, water with its protective functions; social: a source
of income and services useful to man, the community living in its vicinity; aesthetic: an
integral part of the landscape, its corrective; recreation: tourist-sport more suitable for human
recreation; cultural: with the forest in many cases related historical, cultural, religious,
archaeological affections; other functions: creates microclimates, reduces the speed of
rainfall, creates the conditions for the fauna living animals etc. but undoubtedly timber
production remains one of its primary functions and in the present decades.The study
undertaken by us has as its object an ecological-environmental assessment of the forest area
harvested decades ago. More specifically, this study was carried out at FUE Rove-Gribe, part
of Roves, with a total area of about 2 343 ha, of which 1 413 ha are forest area, of which
1374 high forests and 39 ha coppice forest. Years ago, in this FUE of Rove, one of the richest
forests in our country, exploitation works were initially applied by the Forest Harvesting
Enterprise-FHE Pogradec and then by FHE Gramsh.
Keywords: Forest harvesting, Evaluation, Forest ecosystems, Regeneration, Rove
6. INTRODUCTION
The importance of forests for biological diversity, non-timber products, cultural values and
environmental services is now recognized worldwide, and as a result forestry has become a
more complex, more demanding discipline.(Dycastra and Heinrich, 1996). In order to
increase more and more eficasity of the different ways used in forest ecosystem management,
in the last decades harvesting process and operations has evolved in the directions for to
optimize an economic harvesting, sustainability of the forest management as well as with a
lower cost for intervenes and services application on forests management, with main aim of
finding most appropriate ways which gives maximum benefits to both: - for nature and
community/society. The aggregation of all operations, including pre-harvest planning and
postharvest assessment, related to the felling of trees and the extraction of their stems or other
usable parts from the forest for subsequent processing into industrial products. Also called
timber harvesting. . (Dycastra and Heinrich, 1996).
Forestry harvesting activities are categorized grouped in three phases: Pre-harvesting,
harvesting and post–harvesting. The first phase: Pre-harvestng is very important, and
generally started from harvesting planning. Years of planning go into deciding when and
which parts of the forest will be harvested and how this will occur, all to ensure that these
activities are carried out in a manner consistent with protecting social and environmental
values.(Wellburn and Kuhlberg, 2010) Undoubtedly, in the pre-harvesting phase, the
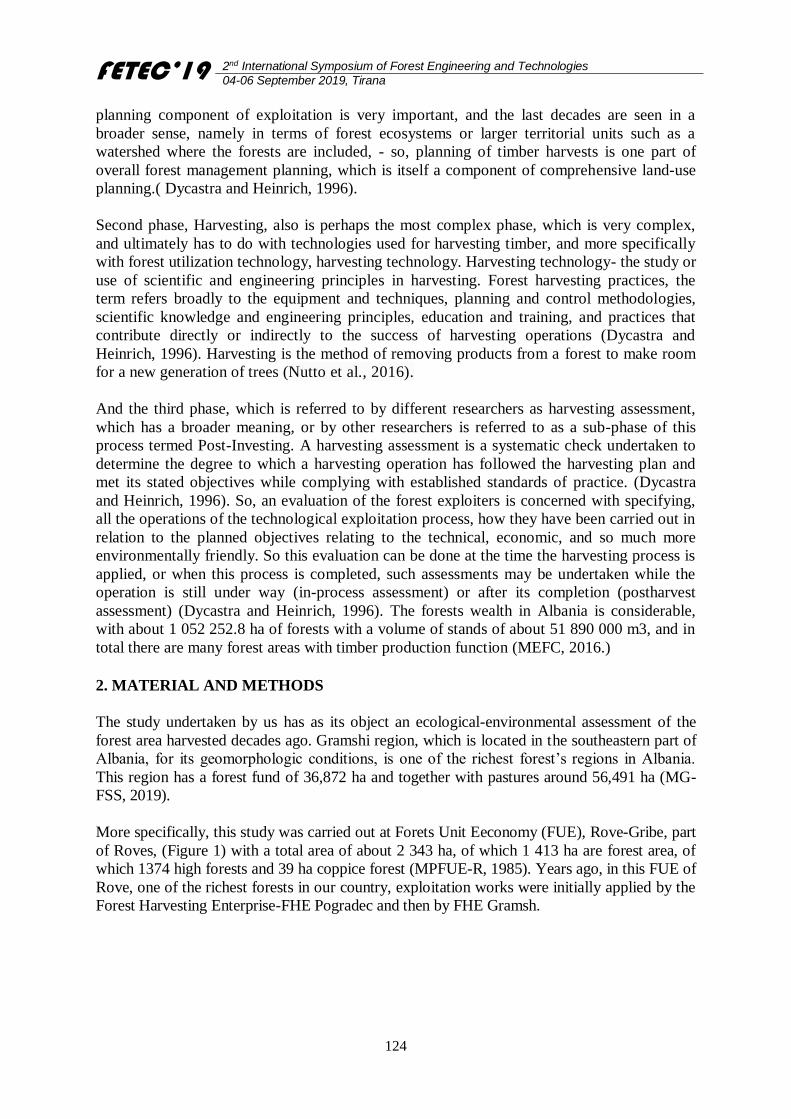
FETEC’19 2nd International Symposium of Forest Engineering and Technologies
04-06 September 2019, Tirana
124
planning component of exploitation is very important, and the last decades are seen in a
broader sense, namely in terms of forest ecosystems or larger territorial units such as a
watershed where the forests are included, - so, planning of timber harvests is one part of
overall forest management planning, which is itself a component of comprehensive land-use
planning.( Dycastra and Heinrich, 1996).
Second phase, Harvesting, also is perhaps the most complex phase, which is very complex,
and ultimately has to do with technologies used for harvesting timber, and more specifically
with forest utilization technology, harvesting technology. Harvesting technology- the study or
use of scientific and engineering principles in harvesting. Forest harvesting practices, the
term refers broadly to the equipment and techniques, planning and control methodologies,
scientific knowledge and engineering principles, education and training, and practices that
contribute directly or indirectly to the success of harvesting operations (Dycastra and
Heinrich, 1996). Harvesting is the method of removing products from a forest to make room
for a new generation of trees (Nutto et al., 2016).
And the third phase, which is referred to by different researchers as harvesting assessment,
which has a broader meaning, or by other researchers is referred to as a sub-phase of this
process termed Post-Investing. A harvesting assessment is a systematic check undertaken to
determine the degree to which a harvesting operation has followed the harvesting plan and
met its stated objectives while complying with established standards of practice. (Dycastra
and Heinrich, 1996). So, an evaluation of the forest exploiters is concerned with specifying,
all the operations of the technological exploitation process, how they have been carried out in
relation to the planned objectives relating to the technical, economic, and so much more
environmentally friendly. So this evaluation can be done at the time the harvesting process is
applied, or when this process is completed, such assessments may be undertaken while the
operation is still under way (in-process assessment) or after its completion (postharvest
assessment) (Dycastra and Heinrich, 1996). The forests wealth in Albania is considerable,
with about 1 052 252.8 ha of forests with a volume of stands of about 51 890 000 m3, and in
total there are many forest areas with timber production function (MEFC, 2016.)
2. MATERIAL AND METHODS
The study undertaken by us has as its object an ecological-environmental assessment of the
forest area harvested decades ago. Gramshi region, which is located in the southeastern part of
Albania, for its geomorphologic conditions, is one of the richest forest’s regions in Albania.
This region has a forest fund of 36,872 ha and together with pastures around 56,491 ha (MG-
FSS, 2019).
More specifically, this study was carried out at Forets Unit Eeconomy (FUE), Rove-Gribe, part
of Roves, (Figure 1) with a total area of about 2 343 ha, of which 1 413 ha are forest area, of
which 1374 high forests and 39 ha coppice forest (MPFUE-R, 1985). Years ago, in this FUE of
Rove, one of the richest forests in our country, exploitation works were initially applied by the
Forest Harvesting Enterprise-FHE Pogradec and then by FHE Gramsh.
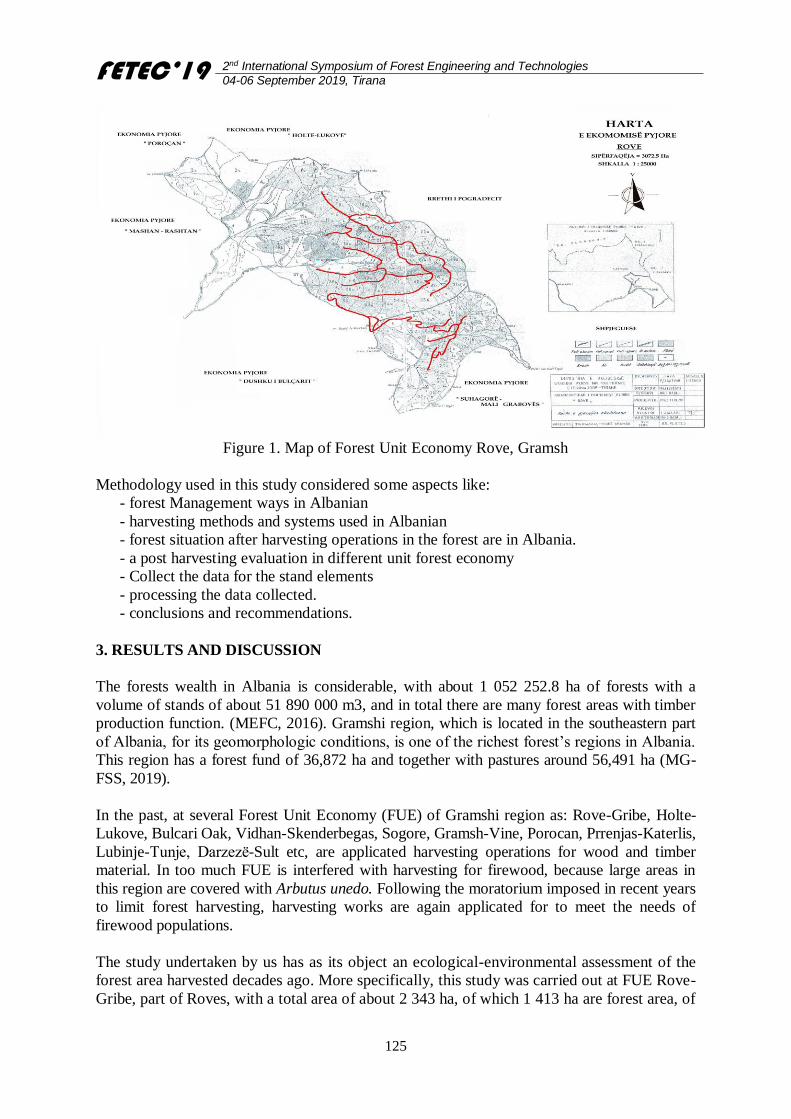
FETEC’19 2nd International Symposium of Forest Engineering and Technologies
04-06 September 2019, Tirana
125
Figure 1. Map of Forest Unit Economy Rove, Gramsh
Methodology used in this study considered some aspects like:
- forest Management ways in Albanian
- harvesting methods and systems used in Albanian
- forest situation after harvesting operations in the forest are in Albania.
- a post harvesting evaluation in different unit forest economy
- Collect the data for the stand elements
- processing the data collected.
- conclusions and recommendations.
3. RESULTS AND DISCUSSION
The forests wealth in Albania is considerable, with about 1 052 252.8 ha of forests with a
volume of stands of about 51 890 000 m3, and in total there are many forest areas with timber
production function. (MEFC, 2016). Gramshi region, which is located in the southeastern part
of Albania, for its geomorphologic conditions, is one of the richest forest’s regions in Albania.
This region has a forest fund of 36,872 ha and together with pastures around 56,491 ha (MG-
FSS, 2019).
In the past, at several Forest Unit Economy (FUE) of Gramshi region as: Rove-Gribe, Holte-
Lukove, Bulcari Oak, Vidhan-Skenderbegas, Sogore, Gramsh-Vine, Porocan, Prrenjas-Katerlis,
Lubinje-Tunje, Darzezë-Sult etc, are applicated harvesting operations for wood and timber
material. In too much FUE is interfered with harvesting for firewood, because large areas in
this region are covered with Arbutus unedo. Following the moratorium imposed in recent years
to limit forest harvesting, harvesting works are again applicated for to meet the needs of
firewood populations.
The study undertaken by us has as its object an ecological-environmental assessment of the
forest area harvested decades ago. More specifically, this study was carried out at FUE Rove-
Gribe, part of Roves, with a total area of about 2 343 ha, of which 1 413 ha are forest area, of
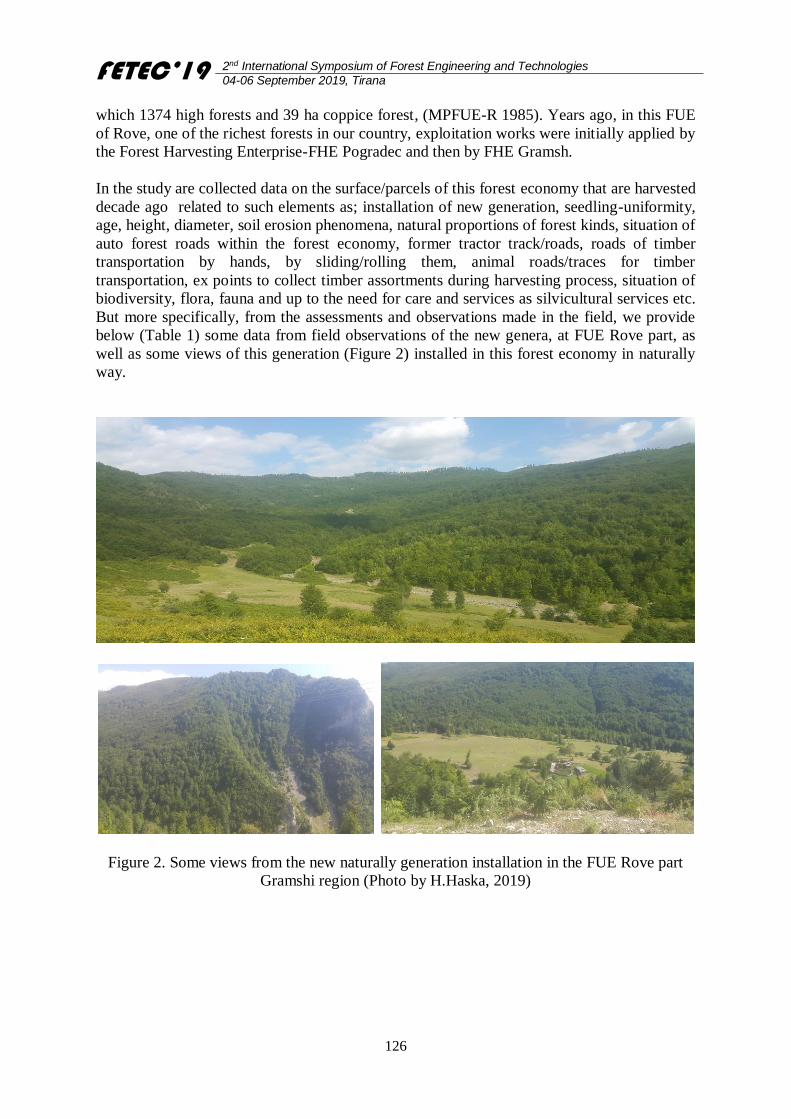
FETEC’19 2nd International Symposium of Forest Engineering and Technologies
04-06 September 2019, Tirana
126
which 1374 high forests and 39 ha coppice forest, (MPFUE-R 1985). Years ago, in this FUE
of Rove, one of the richest forests in our country, exploitation works were initially applied by
the Forest Harvesting Enterprise-FHE Pogradec and then by FHE Gramsh.
In the study are collected data on the surface/parcels of this forest economy that are harvested
decade ago related to such elements as; installation of new generation, seedling-uniformity,
age, height, diameter, soil erosion phenomena, natural proportions of forest kinds, situation of
auto forest roads within the forest economy, former tractor track/roads, roads of timber
transportation by hands, by sliding/rolling them, animal roads/traces for timber
transportation, ex points to collect timber assortments during harvesting process, situation of
biodiversity, flora, fauna and up to the need for care and services as silvicultural services etc.
But more specifically, from the assessments and observations made in the field, we provide
below (Table 1) some data from field observations of the new genera, at FUE Rove part, as
well as some views of this generation (Figure 2) installed in this forest economy in naturally
way.
Figure 2. Some views from the new naturally generation installation in the FUE Rove part
Gramshi region (Photo by H.Haska, 2019)

FETEC’19 2nd International Symposium of Forest Engineering and Technologies
04-06 September 2019, Tirana
127
Table 1. Data in relation of new regeneration situation in FUE Rove part
4. CONCLUSION AND SUGGESTIONS
- In the forest ecosystems of Gramshi Region that are harvested decades ago, from the field
observations a favorable situation is observed post-harvesting related to such elements as;
installation of new generation, seedling-uniformity, soil erosion phenomena, natural
proportions of forest kinds, situation of auto forest roads within the forest economy,
former tractor track/roads, situation of biodiversity, flora, fauna and up to the need for care
and services as silvicultural services etc.
- Protect forest regeneration them from overgrazing
- Forest infrastructure – should be maintenance and disponible all year season
- In the Rove forest economy, can and must plan and realized different cultural and services
in specific clusters.
- Important–to application silvicultural works as thinning in different forest area etc.
- In any areas where seedling has not yet been installed, seed spread can be applied in
winter or planted with squares or gradients
- Especially during the summer period it should be kept under constant surveillance by
sensitizing the inhabitants of the region about the risk of falling fires.
- In places where there is accumulated and decomposed waste, we would recommend
opening ditches around them in the summer
- To favor and preserve specific or industrial species such as for example, maples, fraxinus
etc.
- So, have high BD, wild habitats, good conditions for conservation and addition, as
vegetation and flora and wild animals and poultry, birds.
FETEC’19 2nd International Symposium of Forest Engineering and Technologies
04-06 September 2019, Tirana
128
References
Dycastra,P.D., Heinrich R., FAO Model Code of Forest Harvesting Practice, (FAO-MCFHP)
1996 Rome 1996, Reprinted 1997.
Manxhement Plan of Forets Unit Economy, Rove, (MPFUE-R) 1985.
Municipality of Gramshi, Forest service Sector (MG-FSS) 2019, given data by e-mail, Xhelil
Muca, [email protected], 15 August 2019.
Ministry of Environment, Forest Cadastre, (MEFC) 2016, Drejtoria e mbrojtjes e trajt te
pyjeve, Tirana, Albania, given data by e-mail, Ylli Hoxha, [email protected] 2
november 2017.
Wellburn .v. G., Kuhlberg M., - The Canadian Encyclopedia, Foresst Harvesting, (CE-FH)
2010, published online 25 October 2010, last edited 25 May, 2015.
Nutto L., Malinovski J.R., Castro G.P., Malinovski R.A. (2016) Harvesting Process. In:
Pancel L., Köhl M. (eds) Tropical Forestry Handbook. Springer, Berlin, Heidelberg.
FETEC’19 2nd International Symposium of Forest Engineering and Technologies
04-06 September 2019, Tirana
129
Modeling of Noise Propagation from Mechanized Harvesting Equipment
Using GIS Techniques
Abdullah E. AKAY1*, H. Hulusi ACAR2
1Bursa Technical University, Faculty of Forestry, 16310 Bursa, Turkey
2İstanbul Yeni Yüzyıl University, Zeytinburnu, İstanbul, Turkey
Abstract
The noise is a kind of environmental pollutions that affects human health and decreases
performance of people, education, and home life. Harvesting activities in forestry are one of
working environments where noise effect is very intense. Noise is an element of
environmental pollution that is effective on human health and needs to be controlled. To
evaluate the noise effect, maps of noise propagation are used. The noise map is defined as
numerical model of noise sources. The changes in sound level determined by measurements
in certain points are shown in noise map. Noise maps are used in calculation of average
sound level if it is within acceptable limits and in determination of risky areas where
employees are adversely effected. Computer-aided systems have been used in modeling noise
propagation in recent years. SPreAD-GIS is free program developed to estimate acoustic
effects of anthropogenic noise propagation and adapted to ArcGIS software. In this study, it
was aimed to introduce SPreAD-GIS program that can be used to model noise propagation
caused by mechanized harvesting equipment. In addition, main factors affecting noise
propagation in forest (elevation, land use type, temperature, humidity, wind direction and
intensity, climate and weather conditions) were evaluated.
Keywords: Forest harvesting, Noise propagation, Noise map, GIS
1. INTRODUCTION
Technological innovations, industrial developments and urbanization have made numerous
important contributions and conveniences to human life, but also brought some negative effects
on natural resources and ecosystems. Environmental pollution such as air pollution, water
pollution, soil pollution and noise pollution are the most important problems. Anthropogenic
noise pollution, which is an important element of environmental pollution and an increasing
problem in our lives day by day, consists of vehicles used in land, sea and air traffic,
construction equipment, electrical machinery. The number of vibrations of sound per unit time
is the frequency of the sound and its unit is hertz (Hz). The hearing range of the human ear is
between 20 and 20000 Hz, and the most comfortable sound frequencies are between 200 and
4000 Hz (Yılmaz, 2007). The factors affecting the propagation of sound are distance to the
sound source, the absorbance of the sound environment, meteorological parameters
(temperature, wind, air movements), the absorption of the ground, the presence of forest and
woodland areas and natural and/or artificial obstacles (Aydın, 2015). The A-weighted sound
pressure level (dB or dBA) is the sound pressure unit in which the medium and high
frequencies to which the human ear is sensitive are particularly emphasized. A-weighted sound
levels are the most commonly used in noise control studies. Unwanted and disturbing sounds
are called noise. Noise affecting human health physiologically, physically and psychologically
is an environmental pollution that reduces the performance of people in work environment,
education and home life. Scientific studies conducted in this area show that more than 20% of
FETEC’19 2nd International Symposium of Forest Engineering and Technologies
04-06 September 2019, Tirana
130
the world's population is exposed to above-normal noise levels and approximately 60% of the
European population is exposed to high noise levels throughout the day (Rivas et al., 2003).
Table 1 shows the negative effects of noise levels on people.
Table 1. The negative effects of noise levels on people (Kurra, 1991)
2. NOISE EFFECT IN FOREST OPERATIONS
Production in forestry is one of the working environments where the noise effect can be very
intense. Depending on the difficulty of the work and the type of equipment used, the effects of
noise to forest workers and operators vary (Serin and Akay, 2010). The most commonly used
equipment in forestry studies in Turkey is the chainsaw used in the cutting of trees, delimbing
and bucking in the production of forest products. Previous studies have shown that the
chainsaw is one of the most critical equipment in terms of noise level. In a study conducted by
Serin and Akay (2008), the noise level caused by the chainsaw was analyzed by making close
and distant measurements (15-20 m). According to the results, the average noise level was
measured as 83.19 dBA in close measurements and 73.91 dBA in remote measurements. The
maximum noise level (93.60 dBA) was obtained at close measurements.
Studies on the effects of noise level have shown that noise level of 80 dBA and lower may not
cause significant problems on worker health and the effect of noise can be prevented by using
personal protective equipment (Güvercin and Aybek, 2003). On the other hand, 85 dBA noise
level is defined as the warning limit, while 90 dBA and above is defined as the hazard limit
containing risk. 85-115 dBA noise level leads to physiological and psychological health
problems, while 115 dBA or higher noise level cause permanent hearing loss (Polat and
Kırıkkaya, 2004). The noise generated during the use of chainsaws affects wildlife in large
areas as well as the operator. High noise levels cause cycle change and deterioration of animal
life (Shannon et al., 2016). The increase in noise level causes significant problems especially on
bird species and negatively affects the hatching success during the reproduction period (Kleist
et al., 2018). In studies examining the effects of noise on birds, noise levels above 45 dBA have
been reported to affect reproduction, stress hormone levels and species richness in birds
(Shannon et al., 2016). In addition, the noise originating from the noise source and the regions
where the natural noise difference in the environment increases to 20 dBA and above are
defined as critical areas for bird species (Proto et al., 2016).
3. MODELING OF NOISE PROPAGATION
Noise, like all other environmental pollution elements, is an environmental pollution element
that has an impact on human health and needs to be controlled. Noise maps showing noise
propagation are used to evaluate and control the noise effect. Noise map is defined as a
numerical model of noise sources (Probst and Huber, 2003). Noise maps are used to calculate
average sound levels, determine whether sound levels are within acceptable limits and identify
risky areas where employees are adversely affected (Aydın, 2015). Besides, knowledge of
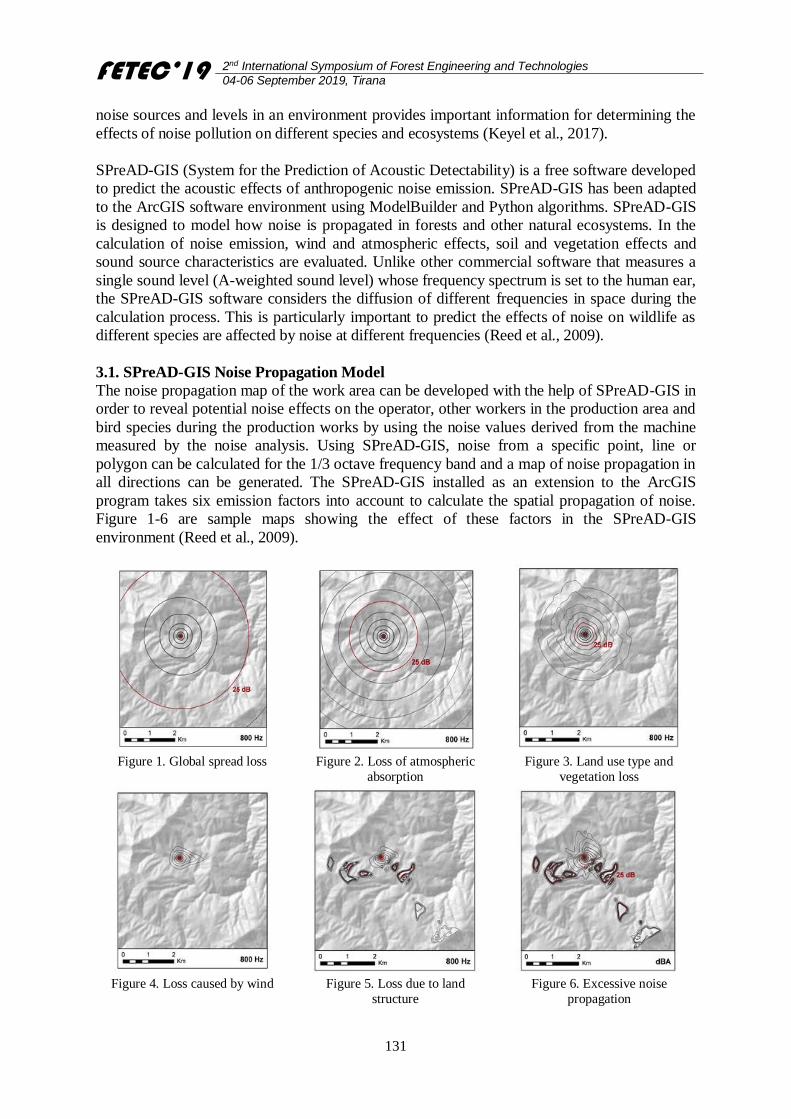
FETEC’19 2nd International Symposium of Forest Engineering and Technologies
04-06 September 2019, Tirana
131
noise sources and levels in an environment provides important information for determining the
effects of noise pollution on different species and ecosystems (Keyel et al., 2017).
SPreAD-GIS (System for the Prediction of Acoustic Detectability) is a free software developed
to predict the acoustic effects of anthropogenic noise emission. SPreAD-GIS has been adapted
to the ArcGIS software environment using ModelBuilder and Python algorithms. SPreAD-GIS
is designed to model how noise is propagated in forests and other natural ecosystems. In the
calculation of noise emission, wind and atmospheric effects, soil and vegetation effects and
sound source characteristics are evaluated. Unlike other commercial software that measures a
single sound level (A-weighted sound level) whose frequency spectrum is set to the human ear,
the SPreAD-GIS software considers the diffusion of different frequencies in space during the
calculation process. This is particularly important to predict the effects of noise on wildlife as
different species are affected by noise at different frequencies (Reed et al., 2009).
3.1. SPreAD-GIS Noise Propagation Model
The noise propagation map of the work area can be developed with the help of SPreAD-GIS in
order to reveal potential noise effects on the operator, other workers in the production area and
bird species during the production works by using the noise values derived from the machine
measured by the noise analysis. Using SPreAD-GIS, noise from a specific point, line or
polygon can be calculated for the 1/3 octave frequency band and a map of noise propagation in
all directions can be generated. The SPreAD-GIS installed as an extension to the ArcGIS
program takes six emission factors into account to calculate the spatial propagation of noise.
Figure 1-6 are sample maps showing the effect of these factors in the SPreAD-GIS
environment (Reed et al., 2009).
Figure 1. Global spread loss Figure 2. Loss of atmospheric
absorption
Figure 3. Land use type and
vegetation loss
Figure 4. Loss caused by wind Figure 5. Loss due to land
structure
Figure 6. Excessive noise
propagation
FETEC’19 2nd International Symposium of Forest Engineering and Technologies
04-06 September 2019, Tirana
132
3.2. Database Development
Before running SPreAD-GIS, the data sets required for the model should be provided and some
parameters must be determined by field measurements. The data in the database include the
location of noise sources, characteristics of noise sources, coverage of the model, Digital
Terrain Model (DTM), land use type map, climate parameters and natural noise level in the
environment. The noise source file can be developed to represent the locations in the SPreAD-
GIS database where noise is propagated within the workspace. The working area can be
divided into grids. The center point of the grid are recorded in the noise source file in the
SPreAD-GIS database as the noise source location. Considering that several operators work
simultaneously, noise propagation calculations should be made by taking adjacent grids into
account at a time. SPreAD-GIS produces the noise emission map in raster data format with a
resolution of 30 m, and the final noise emission map considers the value of the combination.
Various characteristics of the noise source should be defined. SPreAD-GIS allows the user to
select from the noise level data of the engines of different machines installed in the database
(Martin et al., 2005). On the other hand, when users want to use their own data or want to
develop a noise propagation model for machines that are not in the database, the data of some
characteristics of the noise source (1/3 octave frequency band, noise level, distance between
noise meter and noise source) must be defined in the system. The noise level values arising
from the machine for 500, 1000 and 2000 Hz of 1/3 octave frequency bands should be
considered. The reason why these three bands are selected is that many bird species along with
humans are sensitive to noise in the 500, 1000 and 2000 Hz frequency range (Delaney et al.,
1999). Another characteristic of the noise source is the distance to the noise source during
measurements. In SPreAD-GIS environment, the noise source distance can be defined by the
user to the system. In this study, since the noise meter is planned to be placed as close to the
operator's ears as possible, the distance from the noise source will be 0.30 m.
In SPreAD-GIS, the coverage area of the model represents the spatial coverage determined for
noise propagation analysis. The pattern coverage area is generally in the form of a polygonal
polygon, but can be of any size or shape. As the coverage area increases, processing time
increases in SPreAD-GIS (Reed et al., 2009). In order to evaluate the effect of land structure on
noise propagation during the process of the model, the Digital Terrain Model (DTM) of the
study area should be prepared. The DTM should cover the coverage area expressed in the
above section and the cell size should have a resolution of 30 m. Within the scope of this study,
DTM of the study area can be developed by using contour map. In order to evaluate the impact
of the existing land use type on noise propagation in SPreAD-GIS model, land use type data
layer (30 m) should be prepared. In Turkey, stand type map can be obtained from Forest
Enterprise Directorate to produce land use type data layer. Each land use type can be converted
to the land use types defined in SPreAD-GIS environment (Table 2).
Tablo 2. Land use types defined in SPreAD-GIS tipi
Land Use Types Symbol
Coniferous CON
Broadleaves HWD
Range HEB
Shrubs SHB
Bareland BAR
Water WAT
Settlements URB
FETEC’19 2nd International Symposium of Forest Engineering and Technologies
04-06 September 2019, Tirana
133
In the modelling of noise propagation using SPreAD-GIS, it is necessary to provide data for
some climatic parameters for the day and season when land measurements are made. These
climate parameters; temperature (°C), relative humidity (%), dominant wind direction (°), wind
speed (km/h) and seasonal conditions. The model also has a list to define the seasonal
conditions, from which the user can select the seasonal condition that best represents the status
of the measured time. Some of the seasonal conditions listed are: “clear, calm summer day”,
“clear, calm winter day”, “clear, windy summer day ”, “clear, windy winter day”, “ cloudy and
calm”, “cloudy and windy”. In the field, ambient temperature, relative humidity, wind speed
and direction can be measured using a portable weather station. Seasonal conditions should be
determined and recorded at the time of measurement in the field.
In the final stage, the noise conditions in the working area are to be defined and thus the areas
in the model where the noise from the machine can be heard at different frequencies can be
determined. In this context, ambient noise level values suggested by the system can be entered
or used in special values measured by the user. If user-specific ambient noise measurements are
preferred, it is necessary to measure the ambient noise level for all of the different 1/3 octave
frequency bands evaluated under SPreAD-GIS or for target frequency bands. To determine the
natural noise level in the environment, three repetitive noise measurements can be performed
for each land use type for a period of five minutes during which the machine is not operated
and no noise source is active in the environment.
3.3. Generation of noise propagation maps
In SPreAD-GIS environment, a spatial propagation model of anthropogenic noise can be
developed by considering six noise emission factors and three frequency bands (500, 1000,
2000 Hz). As model outputs, maps showing noise propagation in raster data format should be
produced. Noise emission maps can be developed at 5dBA intervals. In the final noise emission
maps, the combination giving the highest pixel value among combinations for each pixel
should be considered. By calculating the projected noise emission around the noise source, the
noise exposure of the personnel working around the noise source can be determined. By
calculating the difference between the noise from the noise source and the natural noise levels
in the environment, the areas where the noise emitted from the source is likely to be heard and
the areas where the bird species in the area can be affected can be determined. The noise
propagation map to be developed and the map of the bird breeding area of the site should be
overlapped and the effects of the noise generated by the machine on the bird species can be
evaluated. Areas where noise levels above 45 dBA and above determined to affect
reproduction, stress hormone level and species richness in bird species will be determined. In
addition, the noise originating from the noise source and the regions where the natural noise
difference in the environment exceeds 20 dBA and critical for bird species should be
determined.
4. CONCLUSION AND SUGGESTIONS
In this study, the map of the noise caused by the forestry machine on the operators and other
forest workers was evaluated. The generation of noise propagation map by using SPreAD-GIS
software was introduced based on the noise effect on the forest workers and birds species.
Using the noise emission map, the effects of topographic, ecological and climatic factors on the
noise emission from the machine can be evaluated and ergonomic methods and technical
solutions can be proposed to minimize the effects of noise on the operator and other employees.
In addition, the possible effects of anthropogenic noise propagation on wildlife species (birds)
can be investigated using the noise propagation map. If the noise level caused by the machine
FETEC’19 2nd International Symposium of Forest Engineering and Technologies
04-06 September 2019, Tirana
134
exceeds the critical values of the bird species living and breeding areas in the field, operational
measures to be taken to minimize noise damage (production schedule planning, appropriate
machine selection, appropriate working hours, working methods, etc.) should be implemented.
Acknowledgements
This study is funded by The Scientific and Technological Research Council of Turkey
(TUBITAK) with the project number 119O736.
References
Aydın, B. 2015. Noise mapping on an university campus area: case study for Istanbul
Technical University Ayazaga Campus. Master Thesis, İTÜ FBE, İstanbul. 98 p.
Delaney, D.K., Grubb, T.G., Beier, P., Pater, L.L., Hildegard Reiser, M. 1999. Effects of
helicopter noise on Mexican spotted owls. Journal of Wildlife Management, 63(1):60-76.
Güvercin, Ö., Aybek, A. 2003. Noise Problem In Stone Pulverizing and Sieving Plants. KSU
Journal of Science and Engineering. 6(2):101-107.
Keyel, A.C., Reed, S.E., McKenna, M.F., Wittemyer, G. 2017. Modeling anthropogenic noise
propagation using the Sound Mapping Tools ArcGIS toolbox. Environmental Modelling &
Software, 97:56-60.
Kleist, N.J., Guralnick, R.P., Cruz, A., Lowry, C.A., Francis, C.D. 2018. Chronic
anthropogenic noise disrupts glucocorticoid signaling and has multiple effects on fitness in
an avian community. PNAS 115(4):648-657.
Kurra, S. 1991. Noise, Turkey's Environmental Problems, Turkey Environment Foundation
Publications, pp. 447-484. Ankara.
Martin, S.A., Leung, A., Pallini, P. 2005. California off-highway vehicle noise study. Wyle
Laboratories, Inc., El Segundo, CA.
Polat, S., Kırıkkaya, E.B. 2004. Effects of Noise on Education and Teaching. XIII. National
Educational Sciences Congress, 6-9 July, İnönü University, Faculty of Education,
Malatya.
Probst, W., Huber, B. 2003. The Sound Power Level of Cities, Sound and Vibration, May.
Proto, A.R., Grigolato, S., Mologni, O., Macrì, G., Zimbalatti, G., Cavalli, R. 2016.
Modelling noise propagation generated by forest operations: a case study in Southern
Italy. Procedia -Social and Behavioral Sciences. 223: 841– 848.
Reed, S.E., Mann, J.P., Boggs, J.L. 2009. SPreAD-GIS: an ArcGIS toolbox for modeling the
propagation of engine noise in a wildland setting. Version 1.2. The Wilderness Society,
San Francisco, CA. 32 p.
Rivas, S., Hernandz, R., Cueto, J.L. 2003. Evaluation and Prediction of Noise Pollution
Levels in Urban Areas of Cdiz (Spain). The Journal of the Acoustical Society of America
114:2439-2439.
Serin, H., Akay, A.E. 2008. Analysis of Noise Level During Logging. XIV. National
Ergonomics Congress 30 October-1 November, Trabzon. pp. 412-416.
Serin, H., Akay, A. E. 2010. Noise Level Analysis of a Bulldozer Used in Constructing a
Forest Road in Mediterranean Region of Turkey, African Journal of Agricultural
Research. 5(19):2624-2628.
Shannon, G., McKenna, M.F., Angeloni, L.M., Crooks, K.R., Fristrup, K.M., Brown, E.,
Warner, K.A., Nelson, M.D., White, C., Briggs, J., McFarland, S., Wittemyer, G. 2016. A
synthesis of two decades of research documenting the effects of noise on wildlife. Biol.
Rev. 91:982–1005.
Yılmaz, S. 2007. Environmental and Building Acoustics Handbook for Architects and
Engineers, Birsen Publications. 511 p.
FETEC’19 2nd International Symposium of Forest Engineering and Technologies
04-06 September 2019, Tirana
135
A study on winching operations of the farm tractor at Kastamonu Forest in
Turkey
Sadık ÇAĞLAR*
Kastamonu University, Faculty of Forestry, Forest Engineering Department, Kuzeykent, Kastamonu, Turkey *[email protected]
Abstract
Farm tractors working in forest works have been used in forestry works by modifying them in
some industrial establishments in Turkey. During the winching operations, farm tractors have
been used for cable haulage and skidding of the harvested materials on relatively flat forest
areas while forest tractors (such as MB Trac 800) have been used for heavy and bulky logs,
stems and whole trees cut from mountainous and steep sloped terrain conditions in Turkey. The
aim of this research is to determine the working conditions and to calculate the productivity of
Branson 6530 farm tractors in pure Fir (Abies nordmanniana) forests in Daday in Kastamonu,
Turkey. During the research, the tree length harvesting method (trees are felled, delimbed and
topped and logs) was used. All the tree length harvested materials with an average diameter of
17 cm and an average length of 28 m were hauled from their respective stumps to the uphill
landing areas. The hauling distance was ranged from 10 m to 70 m from felling area to the
forest road side landing place. Time analysis and other measurements was realized while the
farm tractor was hauling the harvested materials in pure Fir Stands. As a result, the productivity
and the cycle time prediction model were offered by using measured depended and independent
variables for the Branson 6530 farm tractor.
Keywords: Farm tractor, Cable haulage, Time study, Productivity
1. INTRODUCTION
After the motor-manual tree felling operations in practice in Turkey, there are two stages for
the transportation of the harvested wood materials from forest. The first one is the primer
transport which is to transport tree from the place where it was originally cut down to main
storage area. And the second one is named as seconder transport that is to transport the
harvested products from the stacked or main storage areas to trading storage and factories
(Karaman, 1997; Çağlar, 2016). The primer transportation of raw wood material is expensive,
time consuming and dangerous in the steep terra terrain conditions.
Several classes of primer transportation systems are commonly recognized as: ground
skidding systems, forwarders, cable systems, aerial systems, draught animals and the other
extraction systems such as manual, pitsawing, chute, winch truck, water (Heinrich, 1995). A
harvesting system refers to the tools, equipment and machines used to harvest an area. The
individual components of the system can be changed without changing the harvesting
method. A typical cut-to-length logging system could employ a one-grip harvester which
fells, delimbs and bucks the trees right in the stump area, and a forwarder to carry the
pulpwood and logs to roadside. With the tree-length method a common system would include
motor-manual (chain saw) felling, delimbing and topping, tree-length skidding to roadside,
and roadside slashing. A typical harvesting system used in full tree harvesting would include
a feller buncher, grapple skidder, stroke delimber and slasher (URL-1).
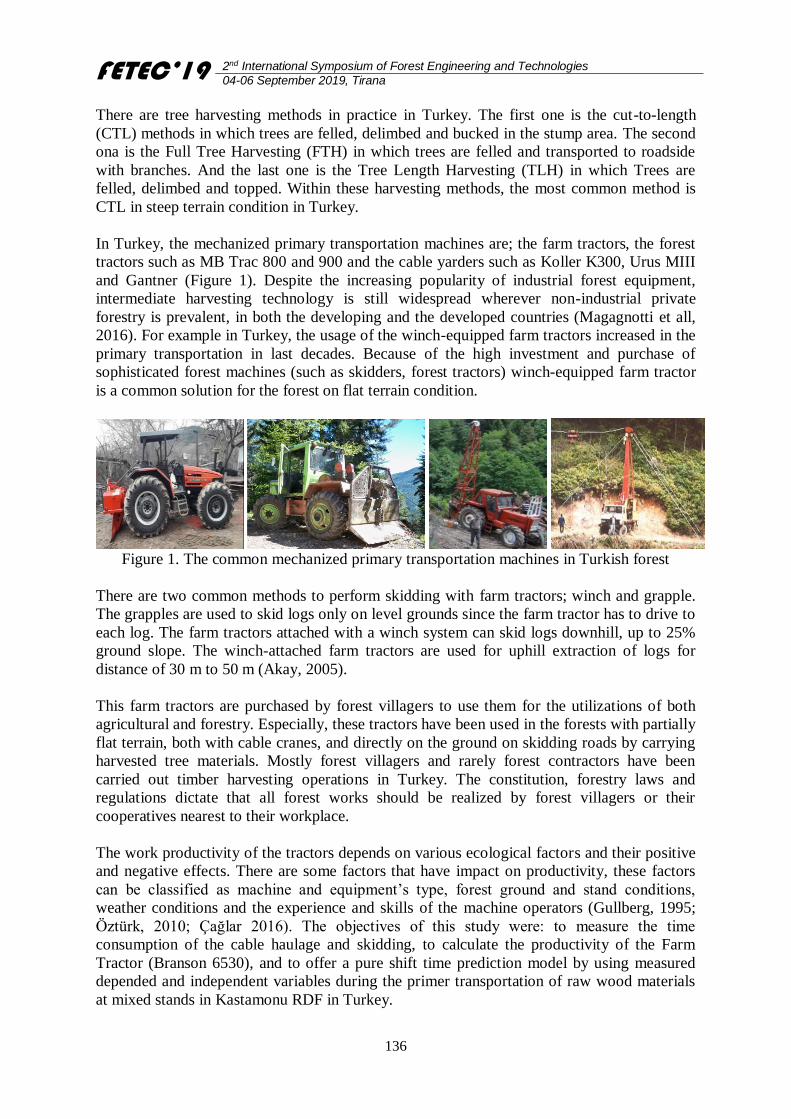
FETEC’19 2nd International Symposium of Forest Engineering and Technologies
04-06 September 2019, Tirana
136
There are tree harvesting methods in practice in Turkey. The first one is the cut-to-length
(CTL) methods in which trees are felled, delimbed and bucked in the stump area. The second
ona is the Full Tree Harvesting (FTH) in which trees are felled and transported to roadside
with branches. And the last one is the Tree Length Harvesting (TLH) in which Trees are
felled, delimbed and topped. Within these harvesting methods, the most common method is
CTL in steep terrain condition in Turkey.
In Turkey, the mechanized primary transportation machines are; the farm tractors, the forest
tractors such as MB Trac 800 and 900 and the cable yarders such as Koller K300, Urus MIII
and Gantner (Figure 1). Despite the increasing popularity of industrial forest equipment,
intermediate harvesting technology is still widespread wherever non-industrial private
forestry is prevalent, in both the developing and the developed countries (Magagnotti et all,
2016). For example in Turkey, the usage of the winch-equipped farm tractors increased in the
primary transportation in last decades. Because of the high investment and purchase of
sophisticated forest machines (such as skidders, forest tractors) winch-equipped farm tractor
is a common solution for the forest on flat terrain condition.
Figure 1. The common mechanized primary transportation machines in Turkish forest
There are two common methods to perform skidding with farm tractors; winch and grapple.
The grapples are used to skid logs only on level grounds since the farm tractor has to drive to
each log. The farm tractors attached with a winch system can skid logs downhill, up to 25%
ground slope. The winch-attached farm tractors are used for uphill extraction of logs for
distance of 30 m to 50 m (Akay, 2005).
This farm tractors are purchased by forest villagers to use them for the utilizations of both
agricultural and forestry. Especially, these tractors have been used in the forests with partially
flat terrain, both with cable cranes, and directly on the ground on skidding roads by carrying
harvested tree materials. Mostly forest villagers and rarely forest contractors have been
carried out timber harvesting operations in Turkey. The constitution, forestry laws and
regulations dictate that all forest works should be realized by forest villagers or their
cooperatives nearest to their workplace.
The work productivity of the tractors depends on various ecological factors and their positive
and negative effects. There are some factors that have impact on productivity, these factors
can be classified as machine and equipment’s type, forest ground and stand conditions,
weather conditions and the experience and skills of the machine operators (Gullberg, 1995;
Öztürk, 2010; Çağlar 2016). The objectives of this study were: to measure the time
consumption of the cable haulage and skidding, to calculate the productivity of the Farm
Tractor (Branson 6530), and to offer a pure shift time prediction model by using measured
depended and independent variables during the primer transportation of raw wood materials
at mixed stands in Kastamonu RDF in Turkey.
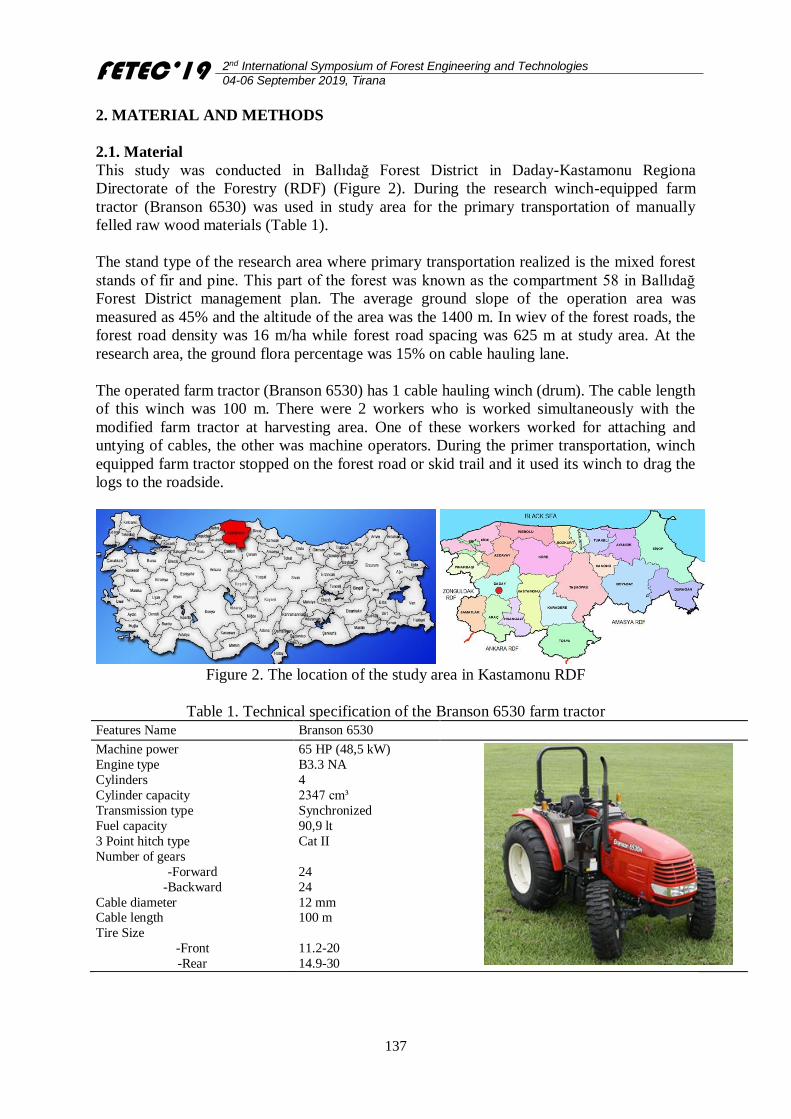
FETEC’19 2nd International Symposium of Forest Engineering and Technologies
04-06 September 2019, Tirana
137
2. MATERIAL AND METHODS
2.1. Material
This study was conducted in Ballıdağ Forest District in Daday-Kastamonu Regiona
Directorate of the Forestry (RDF) (Figure 2). During the research winch-equipped farm
tractor (Branson 6530) was used in study area for the primary transportation of manually
felled raw wood materials (Table 1).
The stand type of the research area where primary transportation realized is the mixed forest
stands of fir and pine. This part of the forest was known as the compartment 58 in Ballıdağ
Forest District management plan. The average ground slope of the operation area was
measured as 45% and the altitude of the area was the 1400 m. In wiev of the forest roads, the
forest road density was 16 m/ha while forest road spacing was 625 m at study area. At the
research area, the ground flora percentage was 15% on cable hauling lane.
The operated farm tractor (Branson 6530) has 1 cable hauling winch (drum). The cable length
of this winch was 100 m. There were 2 workers who is worked simultaneously with the
modified farm tractor at harvesting area. One of these workers worked for attaching and
untying of cables, the other was machine operators. During the primer transportation, winch
equipped farm tractor stopped on the forest road or skid trail and it used its winch to drag the
logs to the roadside.
Figure 2. The location of the study area in Kastamonu RDF
Table 1. Technical specification of the Branson 6530 farm tractor Features Name Branson 6530
Machine power
Engine type
Cylinders
Cylinder capacity
Transmission type
Fuel capacity
3 Point hitch type
Number of gears
-Forward
-Backward
Cable diameter Cable length
Tire Size
-Front
-Rear
65 HP (48,5 kW)
B3.3 NA
4
2347 cm³
Synchronized
90,9 lt
Cat II
24
24
12 mm 100 m
11.2-20
14.9-30
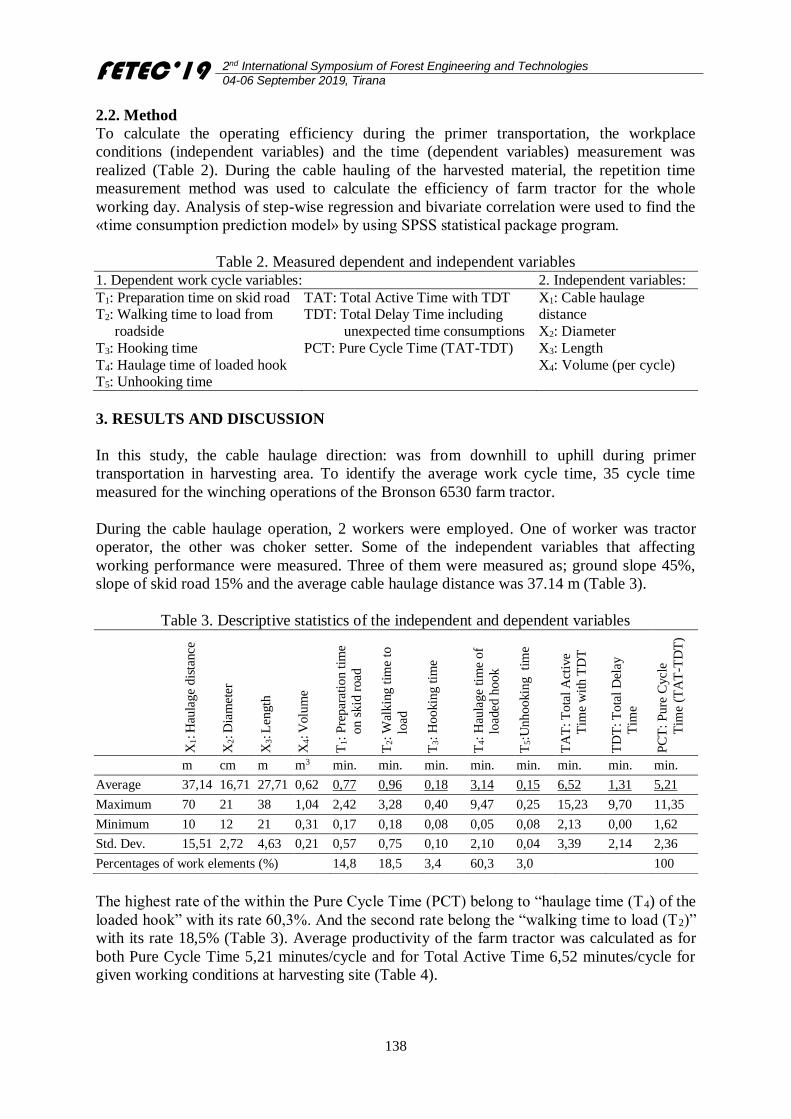
FETEC’19 2nd International Symposium of Forest Engineering and Technologies
04-06 September 2019, Tirana
138
2.2. Method
To calculate the operating efficiency during the primer transportation, the workplace
conditions (independent variables) and the time (dependent variables) measurement was
realized (Table 2). During the cable hauling of the harvested material, the repetition time
measurement method was used to calculate the efficiency of farm tractor for the whole
working day. Analysis of step-wise regression and bivariate correlation were used to find the
«time consumption prediction model» by using SPSS statistical package program.
Table 2. Measured dependent and independent variables 1. Dependent work cycle variables: 2. Independent variables:
T1: Preparation time on skid road T2: Walking time to load from
roadside
T3: Hooking time
T4: Haulage time of loaded hook T5: Unhooking time
TAT: Total Active Time with TDT TDT: Total Delay Time including
unexpected time consumptions
PCT: Pure Cycle Time (TAT-TDT)
X1: Cable haulage distance
X2: Diameter
X3: Length
X4: Volume (per cycle)
3. RESULTS AND DISCUSSION
In this study, the cable haulage direction: was from downhill to uphill during primer
transportation in harvesting area. To identify the average work cycle time, 35 cycle time
measured for the winching operations of the Bronson 6530 farm tractor.
During the cable haulage operation, 2 workers were employed. One of worker was tractor
operator, the other was choker setter. Some of the independent variables that affecting
working performance were measured. Three of them were measured as; ground slope 45%,
slope of skid road 15% and the average cable haulage distance was 37.14 m (Table 3).
Table 3. Descriptive statistics of the independent and dependent variables
X1: H
aula
ge
dis
tance
X2: D
iam
eter
X3: L
ength
X4: V
olu
me
T1:
Pre
par
atio
n t
ime
on
sk
id r
oad
T2: W
alk
ing
tim
e to
load
T3:
Ho
okin
g t
ime
T4:
Hau
lag
e ti
me
of
load
ed h
oo
k
T5:U
nh
oo
kin
g ti
me
TA
T: T
ota
l A
ctiv
e
Tim
e w
ith
TD
T
TD
T: T
ota
l D
elay
Tim
e
PC
T:
Pu
re C
ycl
e
Tim
e (T
AT
-TD
T)
m cm m m3 min. min. min. min. min. min. min. min.
Average 37,14 16,71 27,71 0,62 0,77 0,96 0,18 3,14 0,15 6,52 1,31 5,21
Maximum 70 21 38 1,04 2,42 3,28 0,40 9,47 0,25 15,23 9,70 11,35
Minimum 10 12 21 0,31 0,17 0,18 0,08 0,05 0,08 2,13 0,00 1,62
Std. Dev. 15,51 2,72 4,63 0,21 0,57 0,75 0,10 2,10 0,04 3,39 2,14 2,36
Percentages of work elements (%) 14,8 18,5 3,4 60,3 3,0 100
The highest rate of the within the Pure Cycle Time (PCT) belong to “haulage time (T4) of the
loaded hook” with its rate 60,3%. And the second rate belong the “walking time to load (T2)”
with its rate 18,5% (Table 3). Average productivity of the farm tractor was calculated as for
both Pure Cycle Time 5,21 minutes/cycle and for Total Active Time 6,52 minutes/cycle for
given working conditions at harvesting site (Table 4).
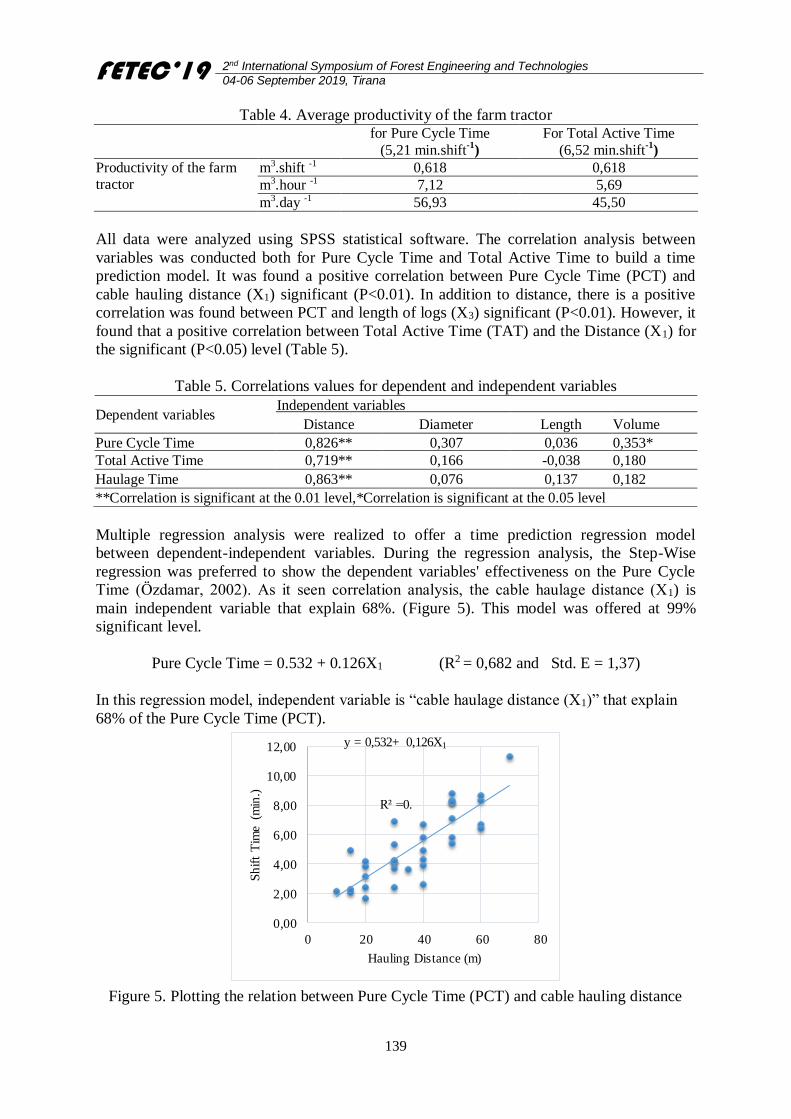
FETEC’19 2nd International Symposium of Forest Engineering and Technologies
04-06 September 2019, Tirana
139
Table 4. Average productivity of the farm tractor
for Pure Cycle Time
(5,21 min.shift-1
)
For Total Active Time
(6,52 min.shift-1
)
Productivity of the farm tractor
m3.shift -1 0,618 0,618
m3.hour -1 7,12 5,69
m3.day -1 56,93 45,50
All data were analyzed using SPSS statistical software. The correlation analysis between
variables was conducted both for Pure Cycle Time and Total Active Time to build a time
prediction model. It was found a positive correlation between Pure Cycle Time (PCT) and
cable hauling distance (X1) significant (P<0.01). In addition to distance, there is a positive
correlation was found between PCT and length of logs (X3) significant (P<0.01). However, it
found that a positive correlation between Total Active Time (TAT) and the Distance (X1) for
the significant (P<0.05) level (Table 5).
Table 5. Correlations values for dependent and independent variables
Dependent variables Independent variables
Distance Diameter Length Volume
Pure Cycle Time 0,826** 0,307 0,036 0,353*
Total Active Time 0,719** 0,166 -0,038 0,180
Haulage Time 0,863** 0,076 0,137 0,182
**Correlation is significant at the 0.01 level,*Correlation is significant at the 0.05 level
Multiple regression analysis were realized to offer a time prediction regression model
between dependent-independent variables. During the regression analysis, the Step-Wise
regression was preferred to show the dependent variables' effectiveness on the Pure Cycle
Time (Özdamar, 2002). As it seen correlation analysis, the cable haulage distance (X1) is
main independent variable that explain 68%. (Figure 5). This model was offered at 99%
significant level.
Pure Cycle Time = 0.532 + 0.126X1 (R2 = 0,682 and Std. E = 1,37)
In this regression model, independent variable is “cable haulage distance (X1)” that explain
68% of the Pure Cycle Time (PCT).
y = 0,532+ 0,126X1
R² =0.
0,00
2,00
4,00
6,00
8,00
10,00
12,00
0 20 40 60 80
Sh
ift
Tim
e (m
in.)
Hauling Distance (m)
Figure 5. Plotting the relation between Pure Cycle Time (PCT) and cable hauling distance
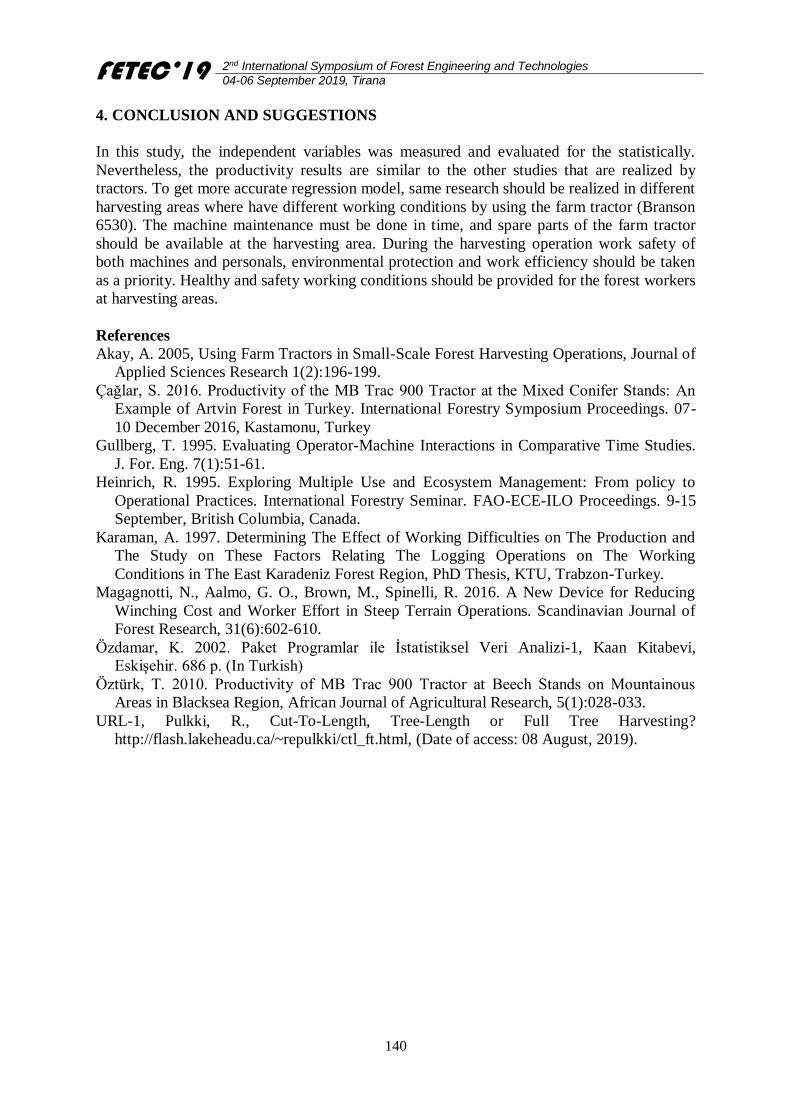
FETEC’19 2nd International Symposium of Forest Engineering and Technologies
04-06 September 2019, Tirana
140
4. CONCLUSION AND SUGGESTIONS
In this study, the independent variables was measured and evaluated for the statistically.
Nevertheless, the productivity results are similar to the other studies that are realized by
tractors. To get more accurate regression model, same research should be realized in different
harvesting areas where have different working conditions by using the farm tractor (Branson
6530). The machine maintenance must be done in time, and spare parts of the farm tractor
should be available at the harvesting area. During the harvesting operation work safety of
both machines and personals, environmental protection and work efficiency should be taken
as a priority. Healthy and safety working conditions should be provided for the forest workers
at harvesting areas.
References
Akay, A. 2005, Using Farm Tractors in Small-Scale Forest Harvesting Operations, Journal of
Applied Sciences Research 1(2):196-199.
Çağlar, S. 2016. Productivity of the MB Trac 900 Tractor at the Mixed Conifer Stands: An
Example of Artvin Forest in Turkey. International Forestry Symposium Proceedings. 07-
10 December 2016, Kastamonu, Turkey
Gullberg, T. 1995. Evaluating Operator-Machine Interactions in Comparative Time Studies.
J. For. Eng. 7(1):51-61.
Heinrich, R. 1995. Exploring Multiple Use and Ecosystem Management: From policy to
Operational Practices. International Forestry Seminar. FAO-ECE-ILO Proceedings. 9-15
September, British Columbia, Canada.
Karaman, A. 1997. Determining The Effect of Working Difficulties on The Production and
The Study on These Factors Relating The Logging Operations on The Working
Conditions in The East Karadeniz Forest Region, PhD Thesis, KTU, Trabzon-Turkey.
Magagnotti, N., Aalmo, G. O., Brown, M., Spinelli, R. 2016. A New Device for Reducing
Winching Cost and Worker Effort in Steep Terrain Operations. Scandinavian Journal of
Forest Research, 31(6):602-610.
Özdamar, K. 2002. Paket Programlar ile İstatistiksel Veri Analizi-1, Kaan Kitabevi,
Eskişehir. 686 p. (In Turkish)
Öztürk, T. 2010. Productivity of MB Trac 900 Tractor at Beech Stands on Mountainous
Areas in Blacksea Region, African Journal of Agricultural Research, 5(1):028-033.
URL-1, Pulkki, R., Cut-To-Length, Tree-Length or Full Tree Harvesting?
http://flash.lakeheadu.ca/~repulkki/ctl_ft.html, (Date of access: 08 August, 2019).
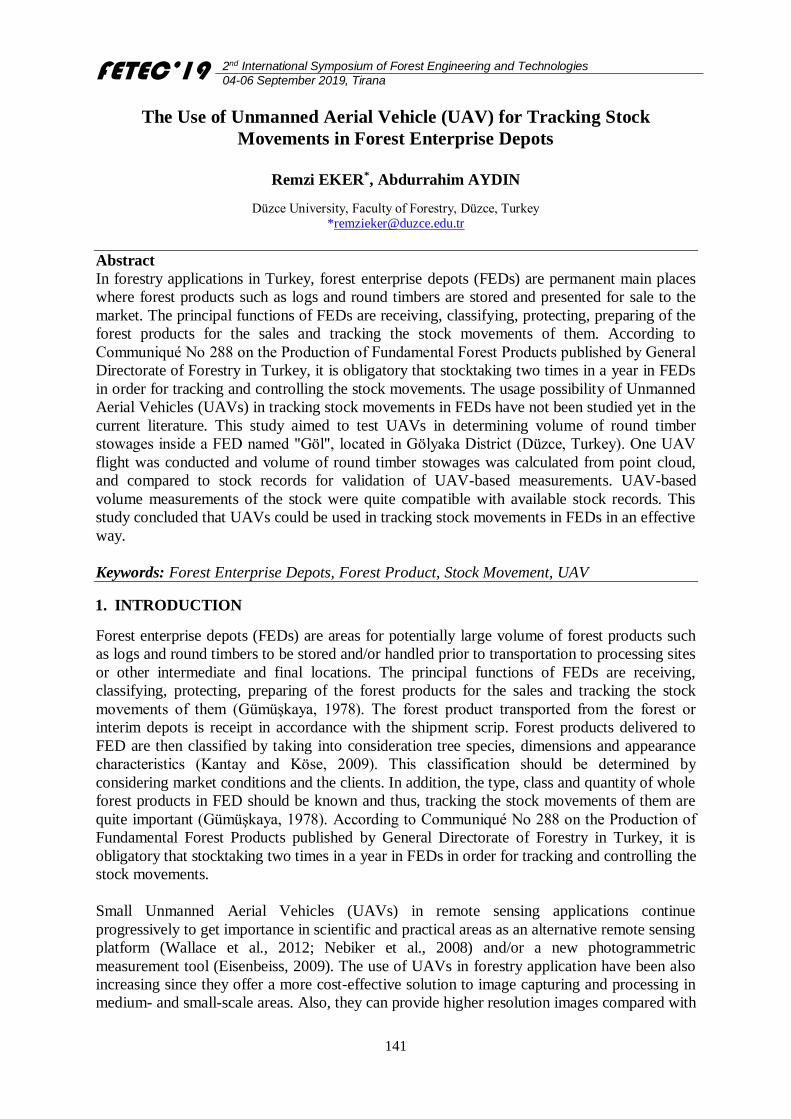
FETEC’19 2nd International Symposium of Forest Engineering and Technologies
04-06 September 2019, Tirana
141
The Use of Unmanned Aerial Vehicle (UAV) for Tracking Stock
Movements in Forest Enterprise Depots
Remzi EKER*, Abdurrahim AYDIN
Düzce University, Faculty of Forestry, Düzce, Turkey *[email protected]
Abstract
In forestry applications in Turkey, forest enterprise depots (FEDs) are permanent main places
where forest products such as logs and round timbers are stored and presented for sale to the
market. The principal functions of FEDs are receiving, classifying, protecting, preparing of the
forest products for the sales and tracking the stock movements of them. According to
Communiqué No 288 on the Production of Fundamental Forest Products published by General
Directorate of Forestry in Turkey, it is obligatory that stocktaking two times in a year in FEDs
in order for tracking and controlling the stock movements. The usage possibility of Unmanned
Aerial Vehicles (UAVs) in tracking stock movements in FEDs have not been studied yet in the
current literature. This study aimed to test UAVs in determining volume of round timber
stowages inside a FED named "Göl", located in Gölyaka District (Düzce, Turkey). One UAV
flight was conducted and volume of round timber stowages was calculated from point cloud,
and compared to stock records for validation of UAV-based measurements. UAV-based
volume measurements of the stock were quite compatible with available stock records. This
study concluded that UAVs could be used in tracking stock movements in FEDs in an effective
way.
Keywords: Forest Enterprise Depots, Forest Product, Stock Movement, UAV
1. INTRODUCTION
Forest enterprise depots (FEDs) are areas for potentially large volume of forest products such
as logs and round timbers to be stored and/or handled prior to transportation to processing sites
or other intermediate and final locations. The principal functions of FEDs are receiving,
classifying, protecting, preparing of the forest products for the sales and tracking the stock
movements of them (Gümüşkaya, 1978). The forest product transported from the forest or
interim depots is receipt in accordance with the shipment scrip. Forest products delivered to
FED are then classified by taking into consideration tree species, dimensions and appearance
characteristics (Kantay and Köse, 2009). This classification should be determined by
considering market conditions and the clients. In addition, the type, class and quantity of whole
forest products in FED should be known and thus, tracking the stock movements of them are
quite important (Gümüşkaya, 1978). According to Communiqué No 288 on the Production of
Fundamental Forest Products published by General Directorate of Forestry in Turkey, it is
obligatory that stocktaking two times in a year in FEDs in order for tracking and controlling the
stock movements.
Small Unmanned Aerial Vehicles (UAVs) in remote sensing applications continue
progressively to get importance in scientific and practical areas as an alternative remote sensing
platform (Wallace et al., 2012; Nebiker et al., 2008) and/or a new photogrammetric
measurement tool (Eisenbeiss, 2009). The use of UAVs in forestry application have been also
increasing since they offer a more cost-effective solution to image capturing and processing in
medium- and small-scale areas. Also, they can provide higher resolution images compared with
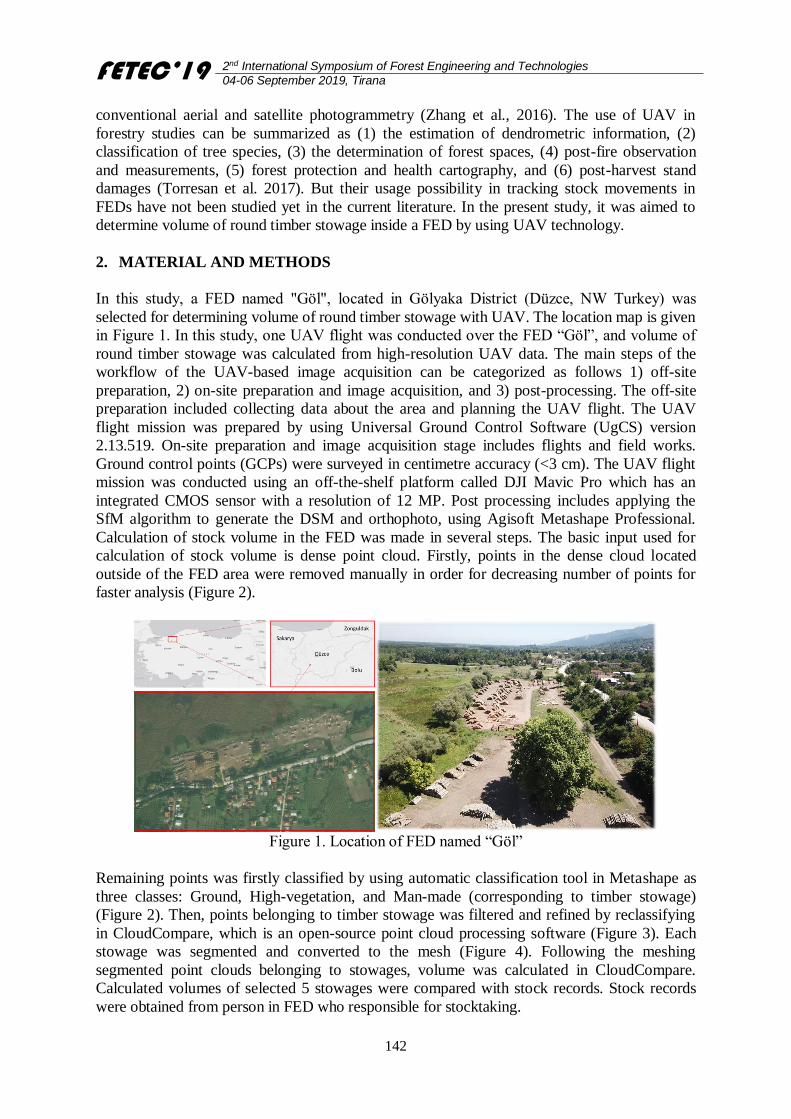
FETEC’19 2nd International Symposium of Forest Engineering and Technologies
04-06 September 2019, Tirana
142
conventional aerial and satellite photogrammetry (Zhang et al., 2016). The use of UAV in
forestry studies can be summarized as (1) the estimation of dendrometric information, (2)
classification of tree species, (3) the determination of forest spaces, (4) post-fire observation
and measurements, (5) forest protection and health cartography, and (6) post-harvest stand
damages (Torresan et al. 2017). But their usage possibility in tracking stock movements in
FEDs have not been studied yet in the current literature. In the present study, it was aimed to
determine volume of round timber stowage inside a FED by using UAV technology.
2. MATERIAL AND METHODS
In this study, a FED named "Göl", located in Gölyaka District (Düzce, NW Turkey) was
selected for determining volume of round timber stowage with UAV. The location map is given
in Figure 1. In this study, one UAV flight was conducted over the FED “Göl”, and volume of
round timber stowage was calculated from high-resolution UAV data. The main steps of the
workflow of the UAV-based image acquisition can be categorized as follows 1) off-site
preparation, 2) on-site preparation and image acquisition, and 3) post-processing. The off-site
preparation included collecting data about the area and planning the UAV flight. The UAV
flight mission was prepared by using Universal Ground Control Software (UgCS) version
2.13.519. On-site preparation and image acquisition stage includes flights and field works.
Ground control points (GCPs) were surveyed in centimetre accuracy (<3 cm). The UAV flight
mission was conducted using an off-the-shelf platform called DJI Mavic Pro which has an
integrated CMOS sensor with a resolution of 12 MP. Post processing includes applying the
SfM algorithm to generate the DSM and orthophoto, using Agisoft Metashape Professional.
Calculation of stock volume in the FED was made in several steps. The basic input used for
calculation of stock volume is dense point cloud. Firstly, points in the dense cloud located
outside of the FED area were removed manually in order for decreasing number of points for
faster analysis (Figure 2).
Figure 1. Location of FED named “Göl”
Remaining points was firstly classified by using automatic classification tool in Metashape as
three classes: Ground, High-vegetation, and Man-made (corresponding to timber stowage)
(Figure 2). Then, points belonging to timber stowage was filtered and refined by reclassifying
in CloudCompare, which is an open-source point cloud processing software (Figure 3). Each
stowage was segmented and converted to the mesh (Figure 4). Following the meshing
segmented point clouds belonging to stowages, volume was calculated in CloudCompare.
Calculated volumes of selected 5 stowages were compared with stock records. Stock records
were obtained from person in FED who responsible for stocktaking.
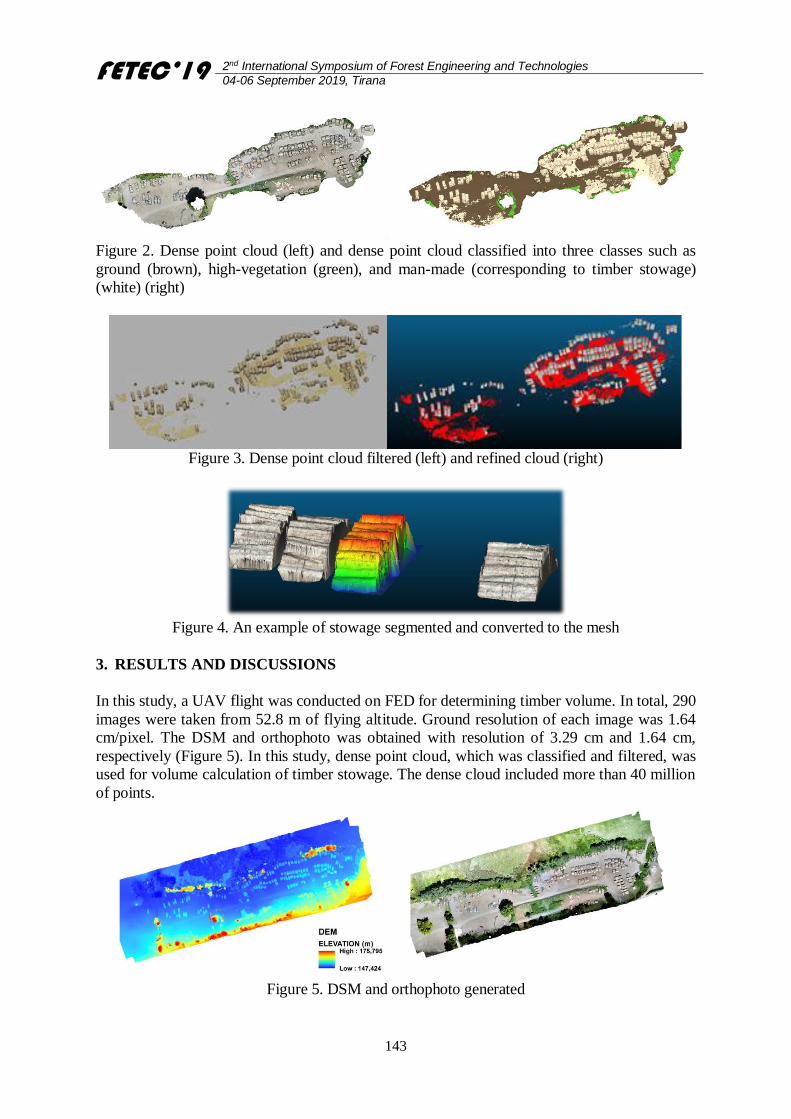
FETEC’19 2nd International Symposium of Forest Engineering and Technologies
04-06 September 2019, Tirana
143
Figure 2. Dense point cloud (left) and dense point cloud classified into three classes such as
ground (brown), high-vegetation (green), and man-made (corresponding to timber stowage)
(white) (right)
Figure 3. Dense point cloud filtered (left) and refined cloud (right)
Figure 4. An example of stowage segmented and converted to the mesh
3. RESULTS AND DISCUSSIONS
In this study, a UAV flight was conducted on FED for determining timber volume. In total, 290
images were taken from 52.8 m of flying altitude. Ground resolution of each image was 1.64
cm/pixel. The DSM and orthophoto was obtained with resolution of 3.29 cm and 1.64 cm,
respectively (Figure 5). In this study, dense point cloud, which was classified and filtered, was
used for volume calculation of timber stowage. The dense cloud included more than 40 million
of points.
Figure 5. DSM and orthophoto generated
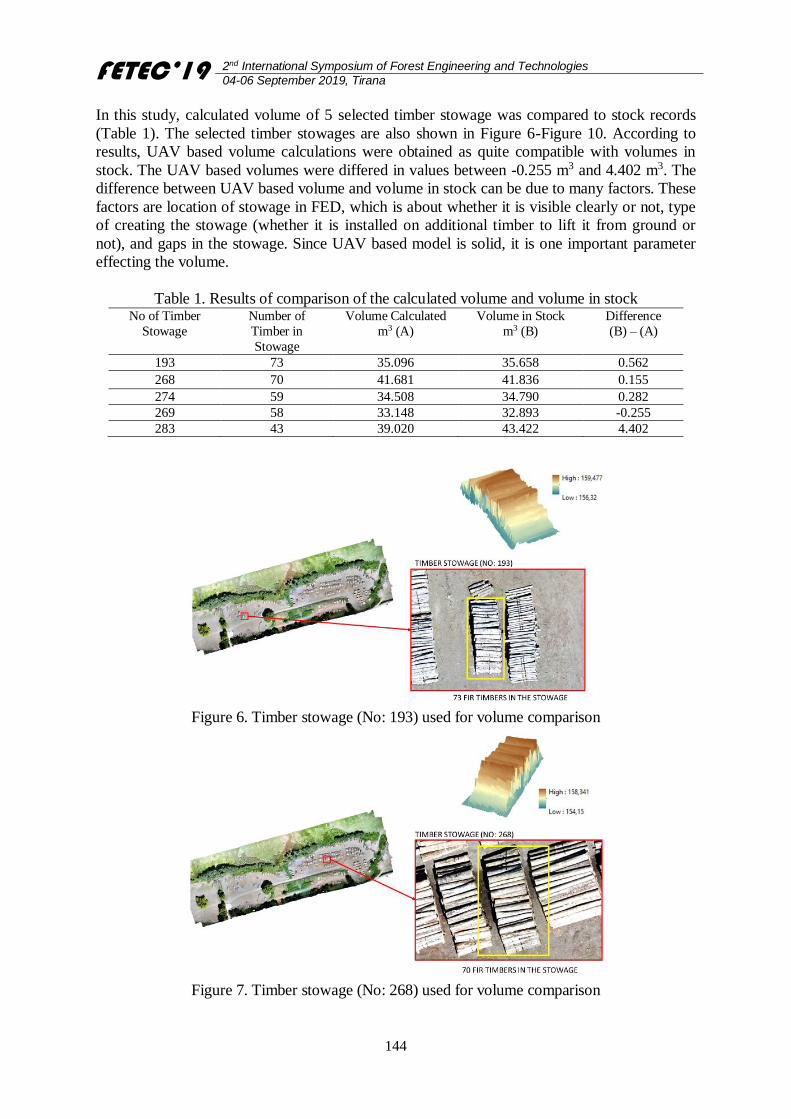
FETEC’19 2nd International Symposium of Forest Engineering and Technologies
04-06 September 2019, Tirana
144
In this study, calculated volume of 5 selected timber stowage was compared to stock records
(Table 1). The selected timber stowages are also shown in Figure 6-Figure 10. According to
results, UAV based volume calculations were obtained as quite compatible with volumes in
stock. The UAV based volumes were differed in values between -0.255 m3 and 4.402 m3. The
difference between UAV based volume and volume in stock can be due to many factors. These
factors are location of stowage in FED, which is about whether it is visible clearly or not, type
of creating the stowage (whether it is installed on additional timber to lift it from ground or
not), and gaps in the stowage. Since UAV based model is solid, it is one important parameter
effecting the volume.
Table 1. Results of comparison of the calculated volume and volume in stock No of Timber
Stowage
Number of
Timber in
Stowage
Volume Calculated
m3 (A)
Volume in Stock
m3 (B)
Difference
(B) – (A)
193 73 35.096 35.658 0.562
268 70 41.681 41.836 0.155
274 59 34.508 34.790 0.282
269 58 33.148 32.893 -0.255
283 43 39.020 43.422 4.402
Figure 6. Timber stowage (No: 193) used for volume comparison
Figure 7. Timber stowage (No: 268) used for volume comparison
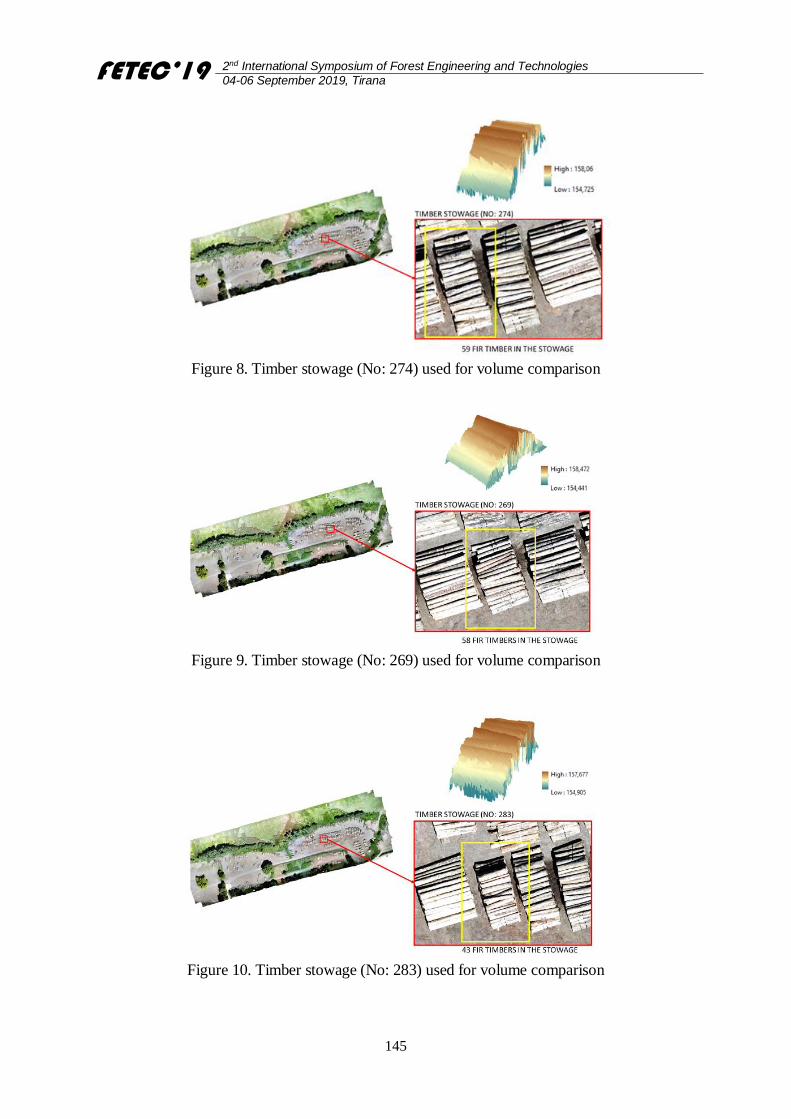
FETEC’19 2nd International Symposium of Forest Engineering and Technologies
04-06 September 2019, Tirana
145
Figure 8. Timber stowage (No: 274) used for volume comparison
Figure 9. Timber stowage (No: 269) used for volume comparison
Figure 10. Timber stowage (No: 283) used for volume comparison
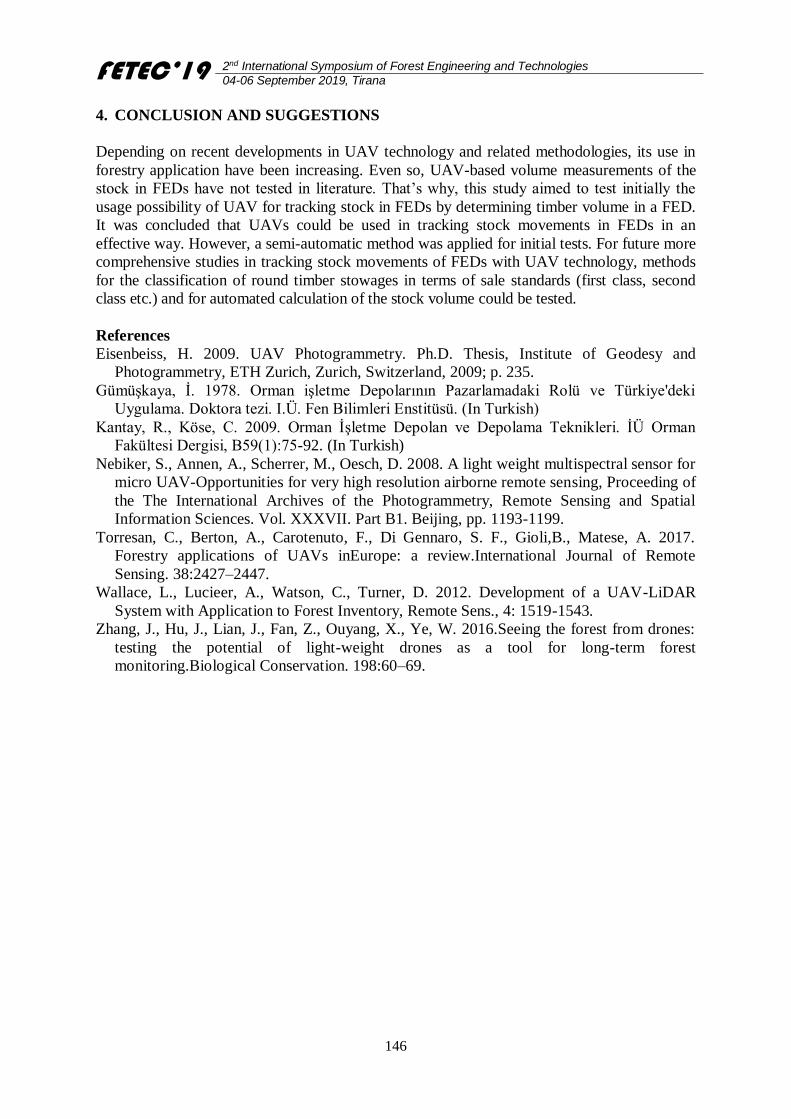
FETEC’19 2nd International Symposium of Forest Engineering and Technologies
04-06 September 2019, Tirana
146
4. CONCLUSION AND SUGGESTIONS
Depending on recent developments in UAV technology and related methodologies, its use in
forestry application have been increasing. Even so, UAV-based volume measurements of the
stock in FEDs have not tested in literature. That’s why, this study aimed to test initially the
usage possibility of UAV for tracking stock in FEDs by determining timber volume in a FED.
It was concluded that UAVs could be used in tracking stock movements in FEDs in an
effective way. However, a semi-automatic method was applied for initial tests. For future more
comprehensive studies in tracking stock movements of FEDs with UAV technology, methods
for the classification of round timber stowages in terms of sale standards (first class, second
class etc.) and for automated calculation of the stock volume could be tested.
References
Eisenbeiss, H. 2009. UAV Photogrammetry. Ph.D. Thesis, Institute of Geodesy and
Photogrammetry, ETH Zurich, Zurich, Switzerland, 2009; p. 235.
Gümüşkaya, İ. 1978. Orman işletme Depolarının Pazarlamadaki Rolü ve Türkiye'deki
Uygulama. Doktora tezi. I.Ü. Fen Bilimleri Enstitüsü. (In Turkish)
Kantay, R., Köse, C. 2009. Orman İşletme Depolan ve Depolama Teknikleri. İÜ Orman
Fakültesi Dergisi, B59(1):75-92. (In Turkish)
Nebiker, S., Annen, A., Scherrer, M., Oesch, D. 2008. A light weight multispectral sensor for
micro UAV-Opportunities for very high resolution airborne remote sensing, Proceeding of
the The International Archives of the Photogrammetry, Remote Sensing and Spatial
Information Sciences. Vol. XXXVII. Part B1. Beijing, pp. 1193-1199.
Torresan, C., Berton, A., Carotenuto, F., Di Gennaro, S. F., Gioli,B., Matese, A. 2017.
Forestry applications of UAVs inEurope: a review.International Journal of Remote
Sensing. 38:2427–2447.
Wallace, L., Lucieer, A., Watson, C., Turner, D. 2012. Development of a UAV-LiDAR
System with Application to Forest Inventory, Remote Sens., 4: 1519-1543.
Zhang, J., Hu, J., Lian, J., Fan, Z., Ouyang, X., Ye, W. 2016.Seeing the forest from drones:
testing the potential of light-weight drones as a tool for long-term forest
monitoring.Biological Conservation. 198:60–69.
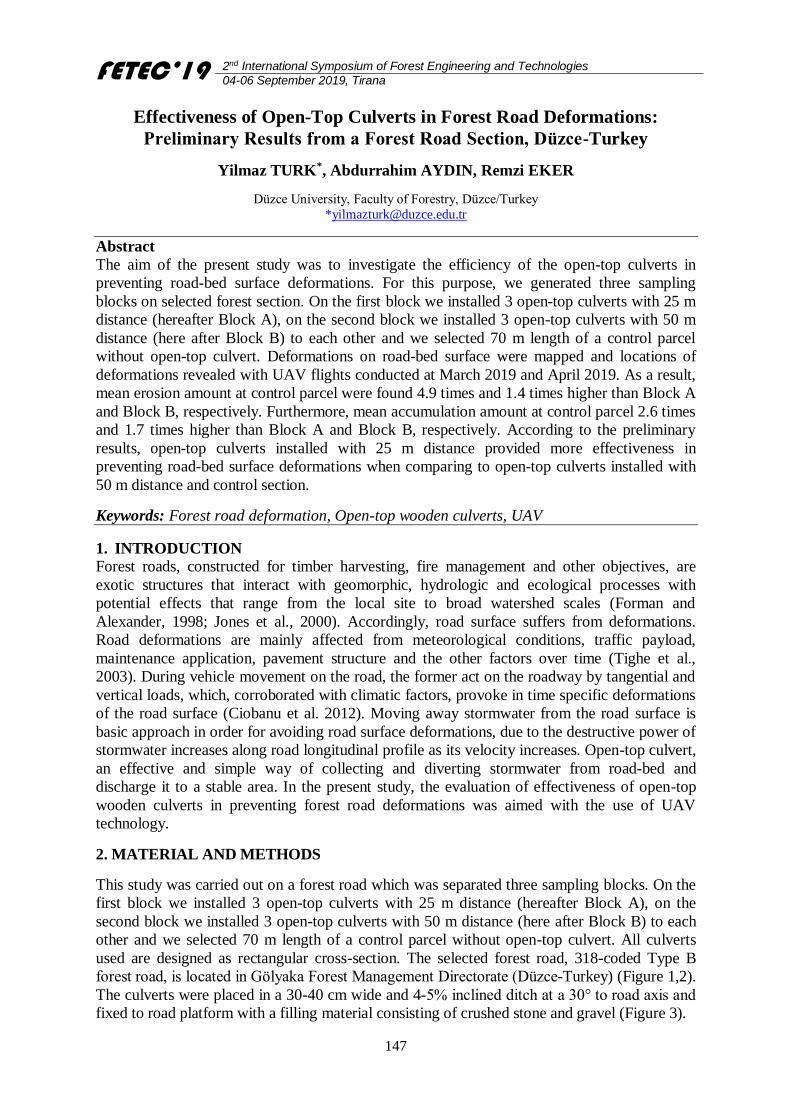
FETEC’19 2nd International Symposium of Forest Engineering and Technologies
04-06 September 2019, Tirana
147
Effectiveness of Open-Top Culverts in Forest Road Deformations:
Preliminary Results from a Forest Road Section, Düzce-Turkey
Yilmaz TURK*, Abdurrahim AYDIN, Remzi EKER
Düzce University, Faculty of Forestry, Düzce/Turkey
Abstract
The aim of the present study was to investigate the efficiency of the open-top culverts in
preventing road-bed surface deformations. For this purpose, we generated three sampling
blocks on selected forest section. On the first block we installed 3 open-top culverts with 25 m
distance (hereafter Block A), on the second block we installed 3 open-top culverts with 50 m
distance (here after Block B) to each other and we selected 70 m length of a control parcel
without open-top culvert. Deformations on road-bed surface were mapped and locations of
deformations revealed with UAV flights conducted at March 2019 and April 2019. As a result,
mean erosion amount at control parcel were found 4.9 times and 1.4 times higher than Block A
and Block B, respectively. Furthermore, mean accumulation amount at control parcel 2.6 times
and 1.7 times higher than Block A and Block B, respectively. According to the preliminary
results, open-top culverts installed with 25 m distance provided more effectiveness in
preventing road-bed surface deformations when comparing to open-top culverts installed with
50 m distance and control section.
Keywords: Forest road deformation, Open-top wooden culverts, UAV
1. INTRODUCTION
Forest roads, constructed for timber harvesting, fire management and other objectives, are
exotic structures that interact with geomorphic, hydrologic and ecological processes with
potential effects that range from the local site to broad watershed scales (Forman and
Alexander, 1998; Jones et al., 2000). Accordingly, road surface suffers from deformations.
Road deformations are mainly affected from meteorological conditions, traffic payload,
maintenance application, pavement structure and the other factors over time (Tighe et al.,
2003). During vehicle movement on the road, the former act on the roadway by tangential and
vertical loads, which, corroborated with climatic factors, provoke in time specific deformations
of the road surface (Ciobanu et al. 2012). Moving away stormwater from the road surface is
basic approach in order for avoiding road surface deformations, due to the destructive power of
stormwater increases along road longitudinal profile as its velocity increases. Open-top culvert,
an effective and simple way of collecting and diverting stormwater from road-bed and
discharge it to a stable area. In the present study, the evaluation of effectiveness of open-top
wooden culverts in preventing forest road deformations was aimed with the use of UAV
technology.
2. MATERIAL AND METHODS
This study was carried out on a forest road which was separated three sampling blocks. On the
first block we installed 3 open-top culverts with 25 m distance (hereafter Block A), on the
second block we installed 3 open-top culverts with 50 m distance (here after Block B) to each
other and we selected 70 m length of a control parcel without open-top culvert. All culverts
used are designed as rectangular cross-section. The selected forest road, 318-coded Type B
forest road, is located in Gölyaka Forest Management Directorate (Düzce-Turkey) (Figure 1,2).
The culverts were placed in a 30-40 cm wide and 4-5% inclined ditch at a 30° to road axis and
fixed to road platform with a filling material consisting of crushed stone and gravel (Figure 3).
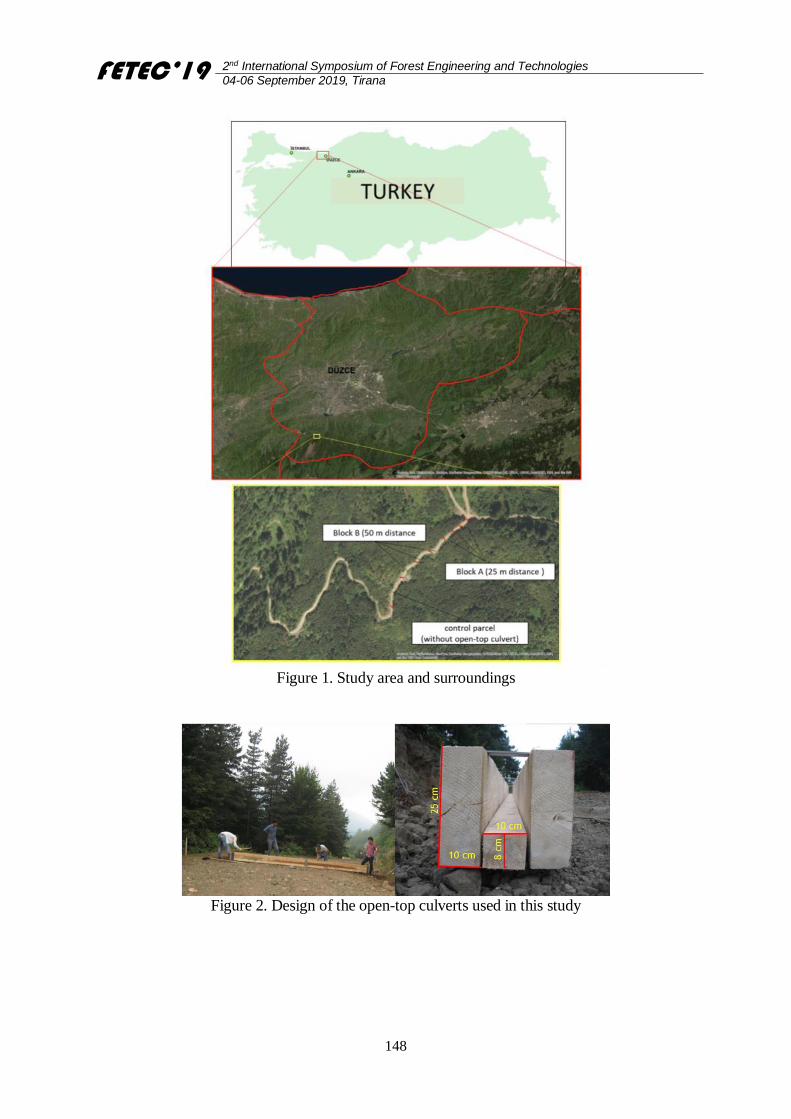
FETEC’19 2nd International Symposium of Forest Engineering and Technologies
04-06 September 2019, Tirana
148
Figure 1. Study area and surroundings
Figure 2. Design of the open-top culverts used in this study
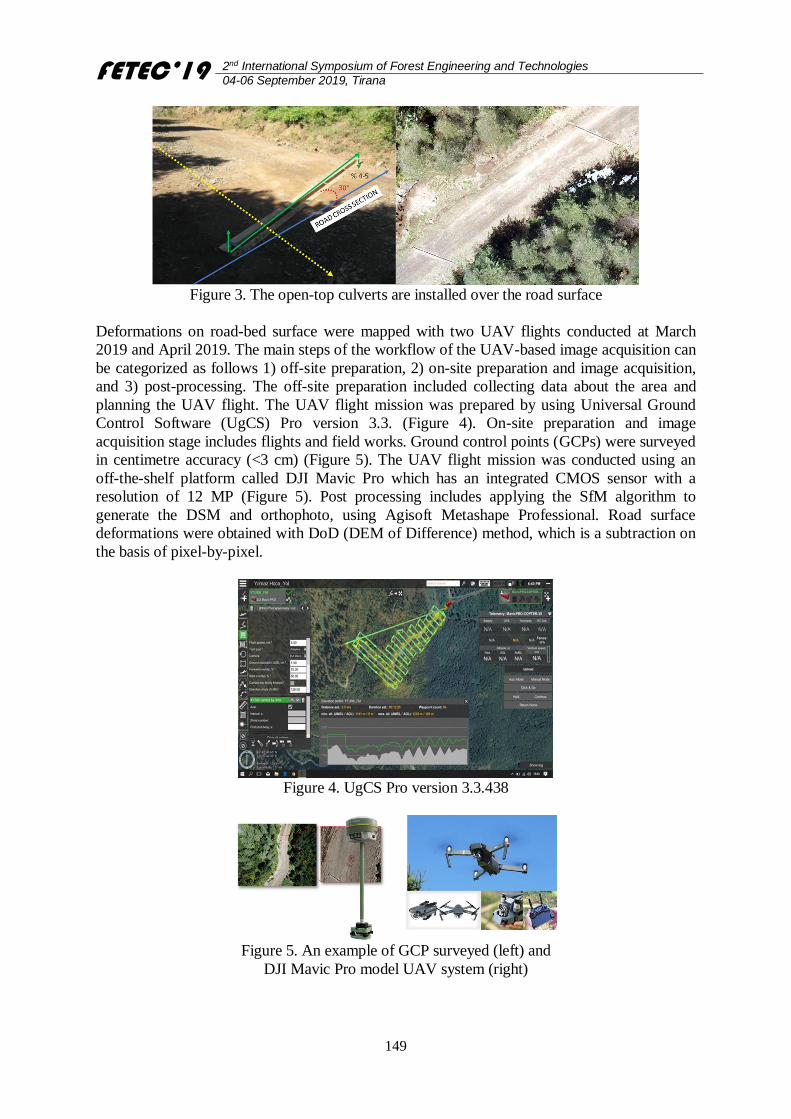
FETEC’19 2nd International Symposium of Forest Engineering and Technologies
04-06 September 2019, Tirana
149
Figure 3. The open-top culverts are installed over the road surface
Deformations on road-bed surface were mapped with two UAV flights conducted at March
2019 and April 2019. The main steps of the workflow of the UAV-based image acquisition can
be categorized as follows 1) off-site preparation, 2) on-site preparation and image acquisition,
and 3) post-processing. The off-site preparation included collecting data about the area and
planning the UAV flight. The UAV flight mission was prepared by using Universal Ground
Control Software (UgCS) Pro version 3.3. (Figure 4). On-site preparation and image
acquisition stage includes flights and field works. Ground control points (GCPs) were surveyed
in centimetre accuracy (<3 cm) (Figure 5). The UAV flight mission was conducted using an
off-the-shelf platform called DJI Mavic Pro which has an integrated CMOS sensor with a
resolution of 12 MP (Figure 5). Post processing includes applying the SfM algorithm to
generate the DSM and orthophoto, using Agisoft Metashape Professional. Road surface
deformations were obtained with DoD (DEM of Difference) method, which is a subtraction on
the basis of pixel-by-pixel.
Figure 4. UgCS Pro version 3.3.438
Figure 5. An example of GCP surveyed (left) and
DJI Mavic Pro model UAV system (right)
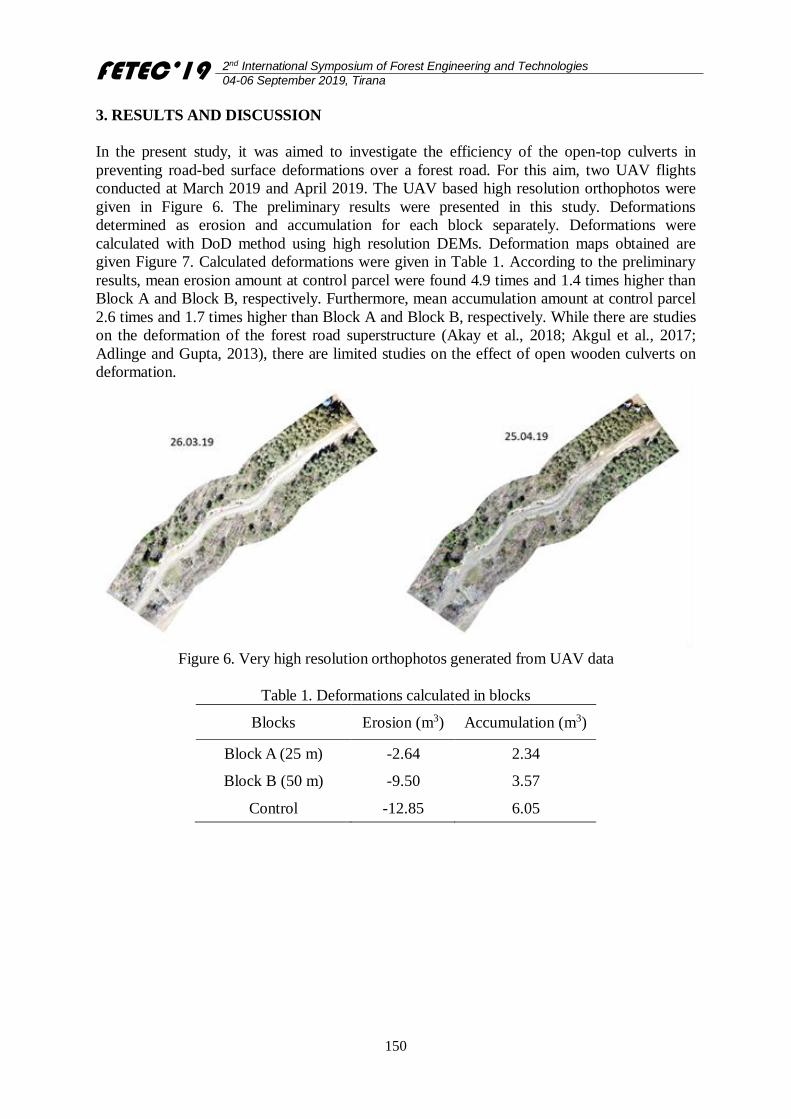
FETEC’19 2nd International Symposium of Forest Engineering and Technologies
04-06 September 2019, Tirana
150
3. RESULTS AND DISCUSSION
In the present study, it was aimed to investigate the efficiency of the open-top culverts in
preventing road-bed surface deformations over a forest road. For this aim, two UAV flights
conducted at March 2019 and April 2019. The UAV based high resolution orthophotos were
given in Figure 6. The preliminary results were presented in this study. Deformations
determined as erosion and accumulation for each block separately. Deformations were
calculated with DoD method using high resolution DEMs. Deformation maps obtained are
given Figure 7. Calculated deformations were given in Table 1. According to the preliminary
results, mean erosion amount at control parcel were found 4.9 times and 1.4 times higher than
Block A and Block B, respectively. Furthermore, mean accumulation amount at control parcel
2.6 times and 1.7 times higher than Block A and Block B, respectively. While there are studies
on the deformation of the forest road superstructure (Akay et al., 2018; Akgul et al., 2017;
Adlinge and Gupta, 2013), there are limited studies on the effect of open wooden culverts on
deformation.
Figure 6. Very high resolution orthophotos generated from UAV data
Table 1. Deformations calculated in blocks
Blocks Erosion (m3) Accumulation (m3)
Block A (25 m) -2.64 2.34
Block B (50 m) -9.50 3.57
Control -12.85 6.05
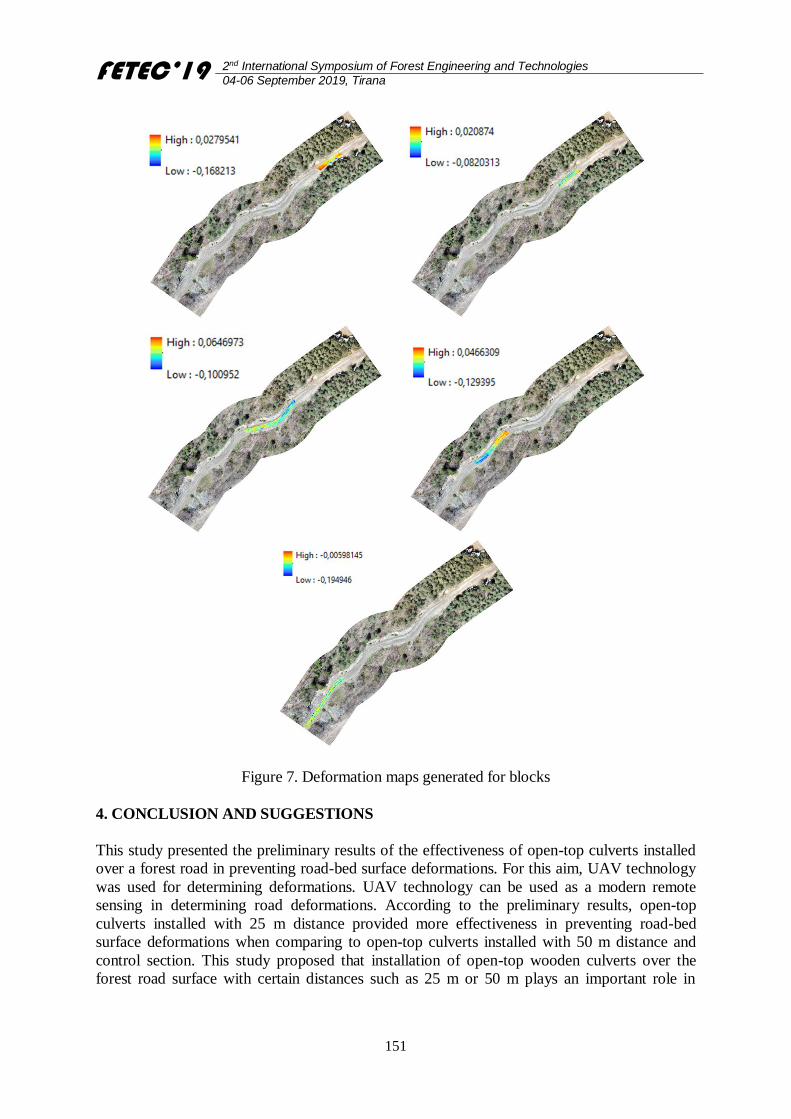
FETEC’19 2nd International Symposium of Forest Engineering and Technologies
04-06 September 2019, Tirana
151
Figure 7. Deformation maps generated for blocks
4. CONCLUSION AND SUGGESTIONS
This study presented the preliminary results of the effectiveness of open-top culverts installed
over a forest road in preventing road-bed surface deformations. For this aim, UAV technology
was used for determining deformations. UAV technology can be used as a modern remote
sensing in determining road deformations. According to the preliminary results, open-top
culverts installed with 25 m distance provided more effectiveness in preventing road-bed
surface deformations when comparing to open-top culverts installed with 50 m distance and
control section. This study proposed that installation of open-top wooden culverts over the
forest road surface with certain distances such as 25 m or 50 m plays an important role in
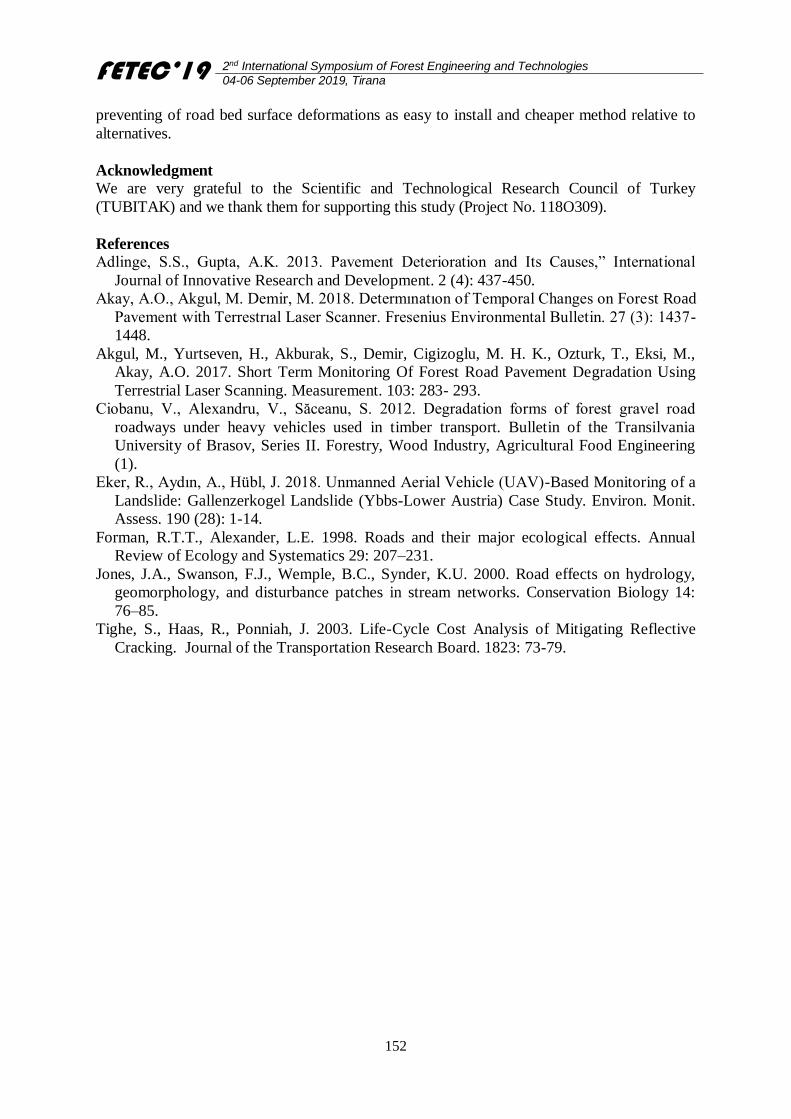
FETEC’19 2nd International Symposium of Forest Engineering and Technologies
04-06 September 2019, Tirana
152
preventing of road bed surface deformations as easy to install and cheaper method relative to
alternatives.
Acknowledgment
We are very grateful to the Scientific and Technological Research Council of Turkey
(TUBITAK) and we thank them for supporting this study (Project No. 118O309).
References
Adlinge, S.S., Gupta, A.K. 2013. Pavement Deterioration and Its Causes,” International
Journal of Innovative Research and Development. 2 (4): 437-450.
Akay, A.O., Akgul, M. Demir, M. 2018. Determınatıon of Temporal Changes on Forest Road
Pavement with Terrestrıal Laser Scanner. Fresenius Environmental Bulletin. 27 (3): 1437-
1448.
Akgul, M., Yurtseven, H., Akburak, S., Demir, Cigizoglu, M. H. K., Ozturk, T., Eksi, M.,
Akay, A.O. 2017. Short Term Monitoring Of Forest Road Pavement Degradation Using
Terrestrial Laser Scanning. Measurement. 103: 283- 293.
Ciobanu, V., Alexandru, V., Săceanu, S. 2012. Degradation forms of forest gravel road
roadways under heavy vehicles used in timber transport. Bulletin of the Transilvania
University of Brasov, Series II. Forestry, Wood Industry, Agricultural Food Engineering
(1).
Eker, R., Aydın, A., Hübl, J. 2018. Unmanned Aerial Vehicle (UAV)-Based Monitoring of a
Landslide: Gallenzerkogel Landslide (Ybbs-Lower Austria) Case Study. Environ. Monit.
Assess. 190 (28): 1-14.
Forman, R.T.T., Alexander, L.E. 1998. Roads and their major ecological effects. Annual
Review of Ecology and Systematics 29: 207–231.
Jones, J.A., Swanson, F.J., Wemple, B.C., Synder, K.U. 2000. Road effects on hydrology,
geomorphology, and disturbance patches in stream networks. Conservation Biology 14:
76–85.
Tighe, S., Haas, R., Ponniah, J. 2003. Life-Cycle Cost Analysis of Mitigating Reflective
Cracking. Journal of the Transportation Research Board. 1823: 73-79.
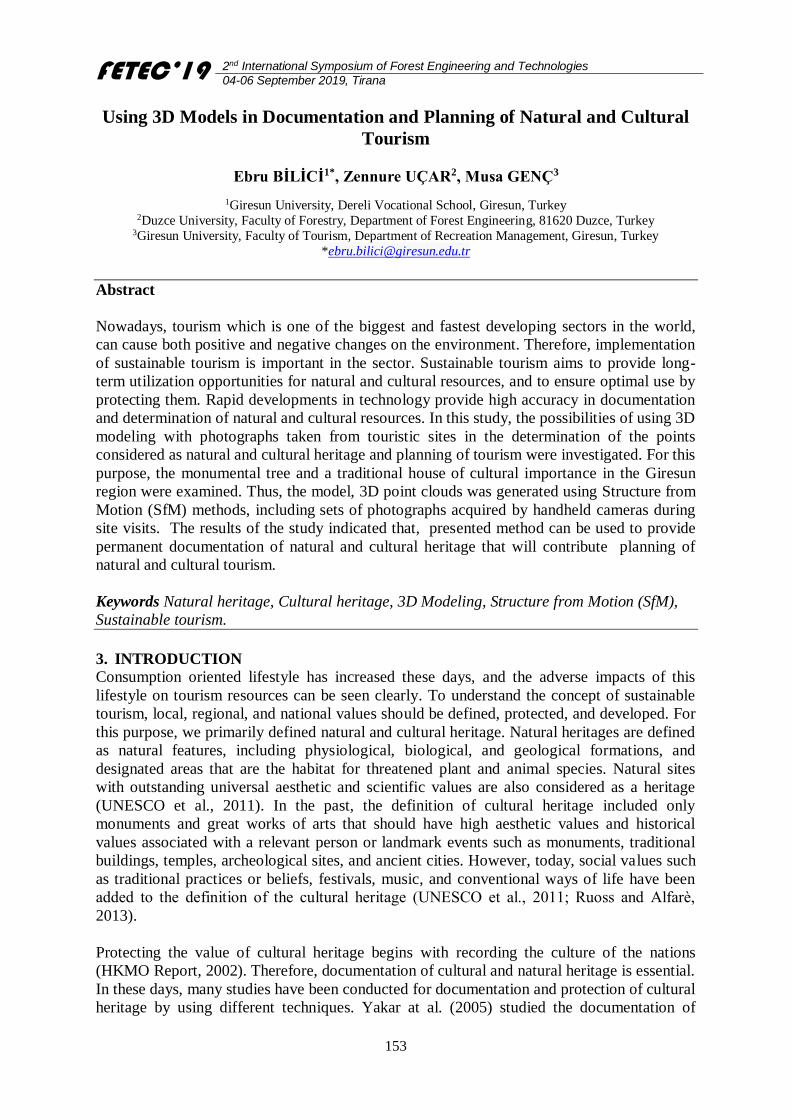
FETEC’19 2nd International Symposium of Forest Engineering and Technologies
04-06 September 2019, Tirana
153
Using 3D Models in Documentation and Planning of Natural and Cultural
Tourism
Ebru BİLİCİ1*, Zennure UÇAR2, Musa GENÇ3
1Giresun University, Dereli Vocational School, Giresun, Turkey 2Duzce University, Faculty of Forestry, Department of Forest Engineering, 81620 Duzce, Turkey
3Giresun University, Faculty of Tourism, Department of Recreation Management, Giresun, Turkey
Abstract
Nowadays, tourism which is one of the biggest and fastest developing sectors in the world,
can cause both positive and negative changes on the environment. Therefore, implementation
of sustainable tourism is important in the sector. Sustainable tourism aims to provide long-
term utilization opportunities for natural and cultural resources, and to ensure optimal use by
protecting them. Rapid developments in technology provide high accuracy in documentation
and determination of natural and cultural resources. In this study, the possibilities of using 3D
modeling with photographs taken from touristic sites in the determination of the points
considered as natural and cultural heritage and planning of tourism were investigated. For this
purpose, the monumental tree and a traditional house of cultural importance in the Giresun
region were examined. Thus, the model, 3D point clouds was generated using Structure from
Motion (SfM) methods, including sets of photographs acquired by handheld cameras during
site visits. The results of the study indicated that, presented method can be used to provide
permanent documentation of natural and cultural heritage that will contribute planning of
natural and cultural tourism.
Keywords Natural heritage, Cultural heritage, 3D Modeling, Structure from Motion (SfM),
Sustainable tourism.
3. INTRODUCTION
Consumption oriented lifestyle has increased these days, and the adverse impacts of this
lifestyle on tourism resources can be seen clearly. To understand the concept of sustainable
tourism, local, regional, and national values should be defined, protected, and developed. For
this purpose, we primarily defined natural and cultural heritage. Natural heritages are defined
as natural features, including physiological, biological, and geological formations, and
designated areas that are the habitat for threatened plant and animal species. Natural sites
with outstanding universal aesthetic and scientific values are also considered as a heritage
(UNESCO et al., 2011). In the past, the definition of cultural heritage included only
monuments and great works of arts that should have high aesthetic values and historical
values associated with a relevant person or landmark events such as monuments, traditional
buildings, temples, archeological sites, and ancient cities. However, today, social values such
as traditional practices or beliefs, festivals, music, and conventional ways of life have been
added to the definition of the cultural heritage (UNESCO et al., 2011; Ruoss and Alfarè,
2013).
Protecting the value of cultural heritage begins with recording the culture of the nations
(HKMO Report, 2002). Therefore, documentation of cultural and natural heritage is essential.
In these days, many studies have been conducted for documentation and protection of cultural
heritage by using different techniques. Yakar at al. (2005) studied the documentation of
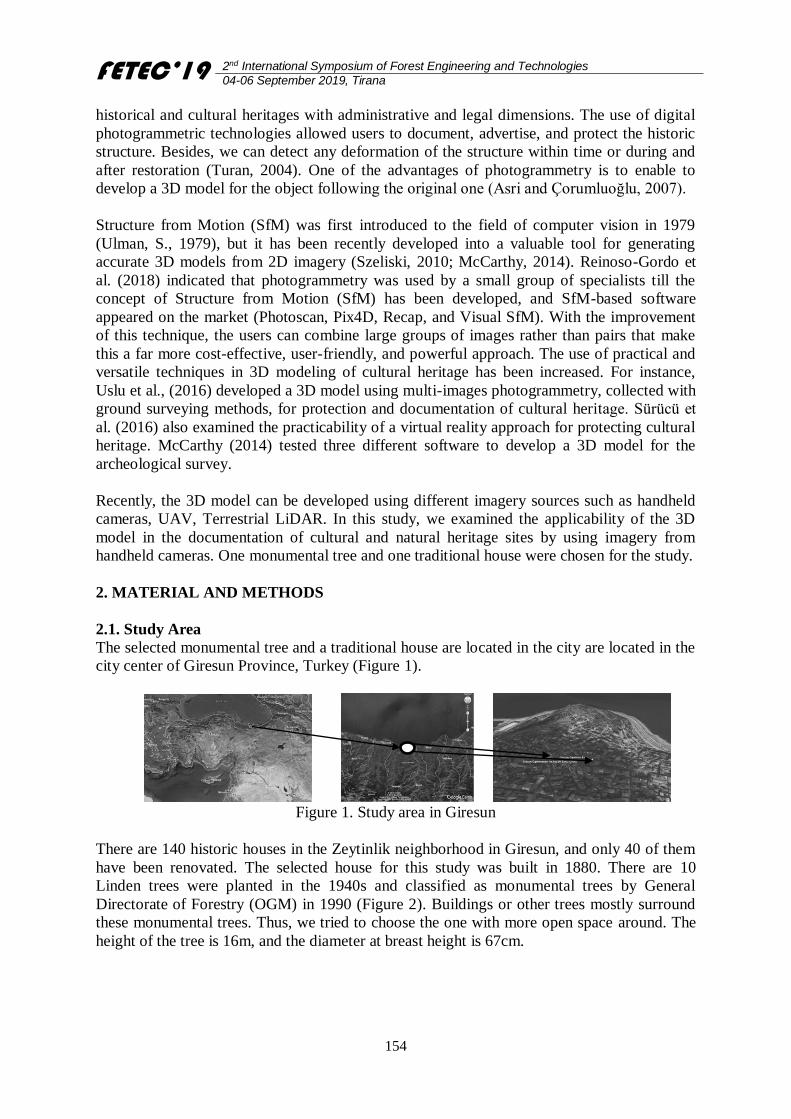
FETEC’19 2nd International Symposium of Forest Engineering and Technologies
04-06 September 2019, Tirana
154
historical and cultural heritages with administrative and legal dimensions. The use of digital
photogrammetric technologies allowed users to document, advertise, and protect the historic
structure. Besides, we can detect any deformation of the structure within time or during and
after restoration (Turan, 2004). One of the advantages of photogrammetry is to enable to
develop a 3D model for the object following the original one (Asri and Çorumluoğlu, 2007).
Structure from Motion (SfM) was first introduced to the field of computer vision in 1979
(Ulman, S., 1979), but it has been recently developed into a valuable tool for generating
accurate 3D models from 2D imagery (Szeliski, 2010; McCarthy, 2014). Reinoso-Gordo et
al. (2018) indicated that photogrammetry was used by a small group of specialists till the
concept of Structure from Motion (SfM) has been developed, and SfM-based software
appeared on the market (Photoscan, Pix4D, Recap, and Visual SfM). With the improvement
of this technique, the users can combine large groups of images rather than pairs that make
this a far more cost-effective, user-friendly, and powerful approach. The use of practical and
versatile techniques in 3D modeling of cultural heritage has been increased. For instance,
Uslu et al., (2016) developed a 3D model using multi-images photogrammetry, collected with
ground surveying methods, for protection and documentation of cultural heritage. Sürücü et
al. (2016) also examined the practicability of a virtual reality approach for protecting cultural
heritage. McCarthy (2014) tested three different software to develop a 3D model for the
archeological survey.
Recently, the 3D model can be developed using different imagery sources such as handheld
cameras, UAV, Terrestrial LiDAR. In this study, we examined the applicability of the 3D
model in the documentation of cultural and natural heritage sites by using imagery from
handheld cameras. One monumental tree and one traditional house were chosen for the study.
2. MATERIAL AND METHODS
2.1. Study Area
The selected monumental tree and a traditional house are located in the city are located in the
city center of Giresun Province, Turkey (Figure 1).
Figure 1. Study area in Giresun
There are 140 historic houses in the Zeytinlik neighborhood in Giresun, and only 40 of them
have been renovated. The selected house for this study was built in 1880. There are 10
Linden trees were planted in the 1940s and classified as monumental trees by General
Directorate of Forestry (OGM) in 1990 (Figure 2). Buildings or other trees mostly surround
these monumental trees. Thus, we tried to choose the one with more open space around. The
height of the tree is 16m, and the diameter at breast height is 67cm.
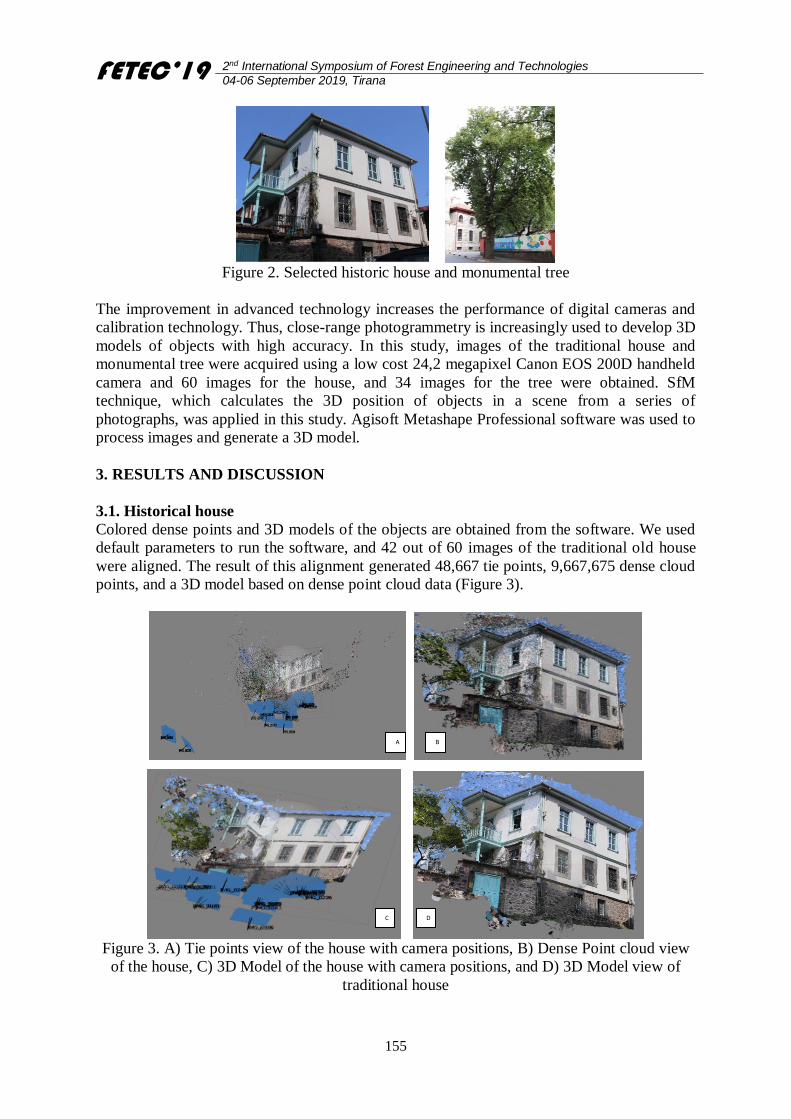
FETEC’19 2nd International Symposium of Forest Engineering and Technologies
04-06 September 2019, Tirana
155
Figure 2. Selected historic house and monumental tree
The improvement in advanced technology increases the performance of digital cameras and
calibration technology. Thus, close-range photogrammetry is increasingly used to develop 3D
models of objects with high accuracy. In this study, images of the traditional house and
monumental tree were acquired using a low cost 24,2 megapixel Canon EOS 200D handheld
camera and 60 images for the house, and 34 images for the tree were obtained. SfM
technique, which calculates the 3D position of objects in a scene from a series of
photographs, was applied in this study. Agisoft Metashape Professional software was used to
process images and generate a 3D model.
3. RESULTS AND DISCUSSION
3.1. Historical house
Colored dense points and 3D models of the objects are obtained from the software. We used
default parameters to run the software, and 42 out of 60 images of the traditional old house
were aligned. The result of this alignment generated 48,667 tie points, 9,667,675 dense cloud
points, and a 3D model based on dense point cloud data (Figure 3).
Figure 3. A) Tie points view of the house with camera positions, B) Dense Point cloud view
of the house, C) 3D Model of the house with camera positions, and D) 3D Model view of
traditional house
A B
C D
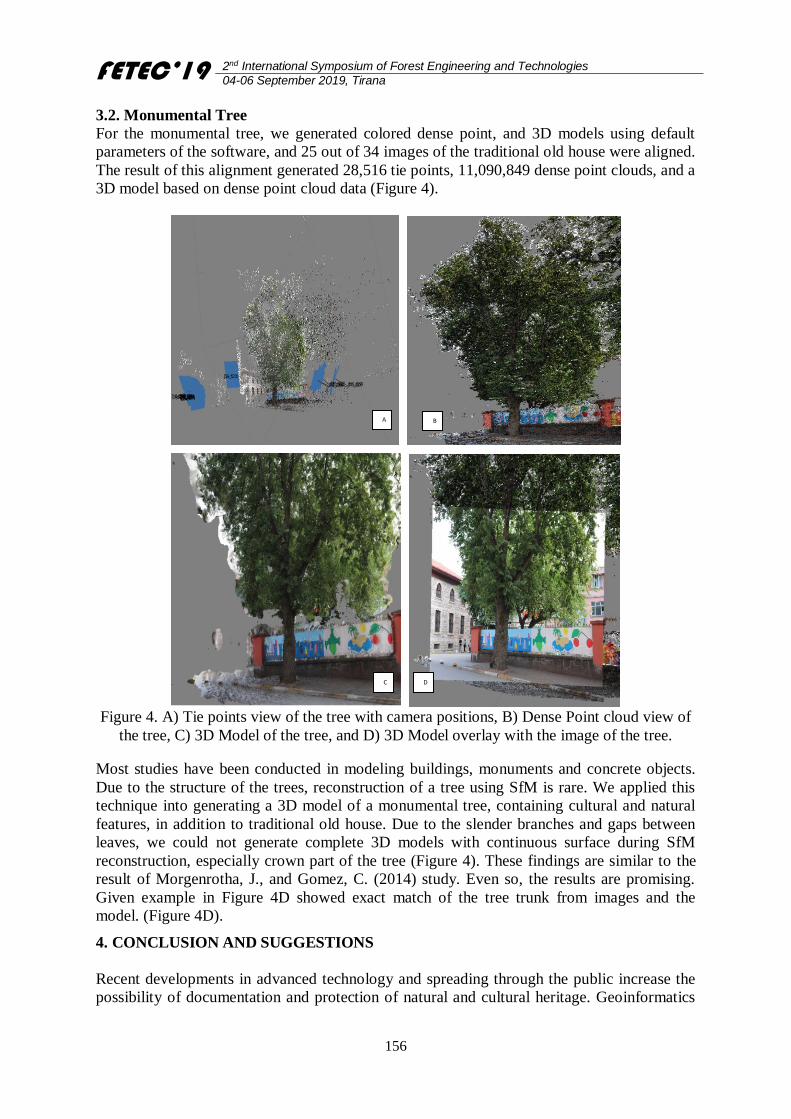
FETEC’19 2nd International Symposium of Forest Engineering and Technologies
04-06 September 2019, Tirana
156
3.2. Monumental Tree
For the monumental tree, we generated colored dense point, and 3D models using default
parameters of the software, and 25 out of 34 images of the traditional old house were aligned.
The result of this alignment generated 28,516 tie points, 11,090,849 dense point clouds, and a
3D model based on dense point cloud data (Figure 4).
Figure 4. A) Tie points view of the tree with camera positions, B) Dense Point cloud view of
the tree, C) 3D Model of the tree, and D) 3D Model overlay with the image of the tree.
Most studies have been conducted in modeling buildings, monuments and concrete objects.
Due to the structure of the trees, reconstruction of a tree using SfM is rare. We applied this
technique into generating a 3D model of a monumental tree, containing cultural and natural
features, in addition to traditional old house. Due to the slender branches and gaps between
leaves, we could not generate complete 3D models with continuous surface during SfM
reconstruction, especially crown part of the tree (Figure 4). These findings are similar to the
result of Morgenrotha, J., and Gomez, C. (2014) study. Even so, the results are promising.
Given example in Figure 4D showed exact match of the tree trunk from images and the
model. (Figure 4D).
4. CONCLUSION AND SUGGESTIONS
Recent developments in advanced technology and spreading through the public increase the
possibility of documentation and protection of natural and cultural heritage. Geoinformatics
A B
C D
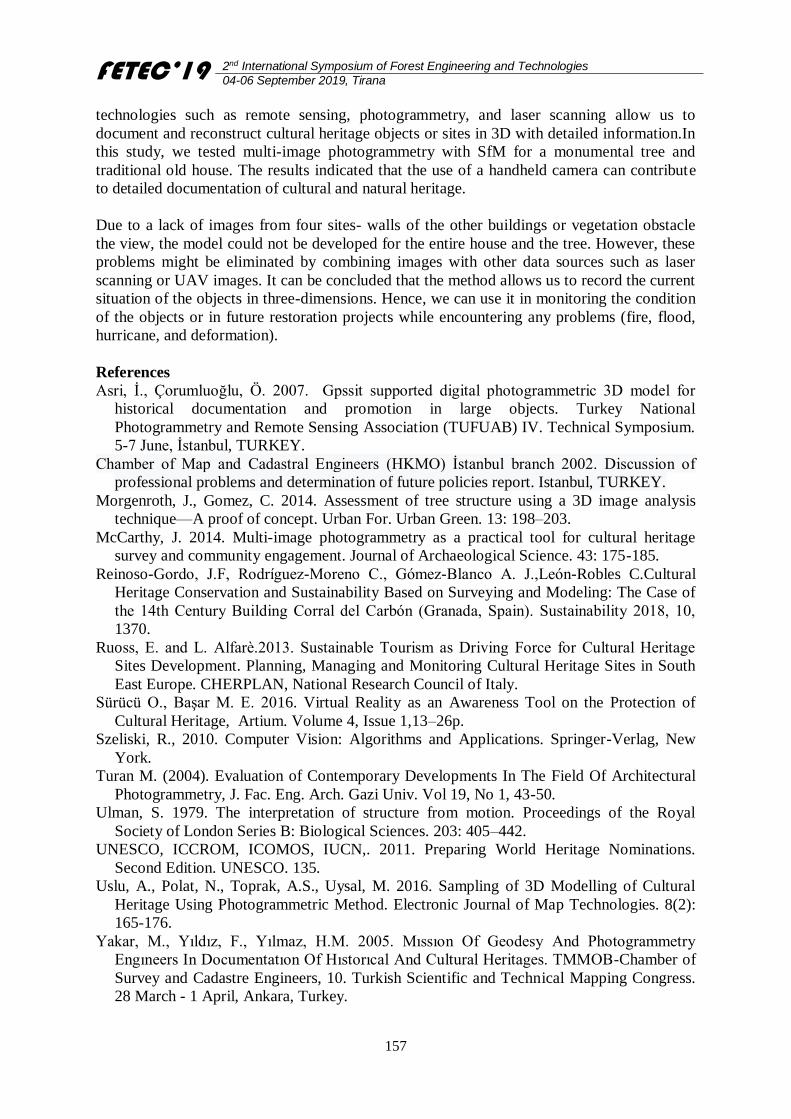
FETEC’19 2nd International Symposium of Forest Engineering and Technologies
04-06 September 2019, Tirana
157
technologies such as remote sensing, photogrammetry, and laser scanning allow us to
document and reconstruct cultural heritage objects or sites in 3D with detailed information.In
this study, we tested multi-image photogrammetry with SfM for a monumental tree and
traditional old house. The results indicated that the use of a handheld camera can contribute
to detailed documentation of cultural and natural heritage.
Due to a lack of images from four sites- walls of the other buildings or vegetation obstacle
the view, the model could not be developed for the entire house and the tree. However, these
problems might be eliminated by combining images with other data sources such as laser
scanning or UAV images. It can be concluded that the method allows us to record the current
situation of the objects in three-dimensions. Hence, we can use it in monitoring the condition
of the objects or in future restoration projects while encountering any problems (fire, flood,
hurricane, and deformation).
References
Asri, İ., Çorumluoğlu, Ö. 2007. Gpssit supported digital photogrammetric 3D model for
historical documentation and promotion in large objects. Turkey National
Photogrammetry and Remote Sensing Association (TUFUAB) IV. Technical Symposium.
5-7 June, İstanbul, TURKEY.
Chamber of Map and Cadastral Engineers (HKMO) İstanbul branch 2002. Discussion of
professional problems and determination of future policies report. Istanbul, TURKEY.
Morgenroth, J., Gomez, C. 2014. Assessment of tree structure using a 3D image analysis
technique—A proof of concept. Urban For. Urban Green. 13: 198–203.
McCarthy, J. 2014. Multi-image photogrammetry as a practical tool for cultural heritage
survey and community engagement. Journal of Archaeological Science. 43: 175-185.
Reinoso-Gordo, J.F, Rodríguez-Moreno C., Gómez-Blanco A. J.,León-Robles C.Cultural
Heritage Conservation and Sustainability Based on Surveying and Modeling: The Case of
the 14th Century Building Corral del Carbón (Granada, Spain). Sustainability 2018, 10,
1370.
Ruoss, E. and L. Alfarè.2013. Sustainable Tourism as Driving Force for Cultural Heritage
Sites Development. Planning, Managing and Monitoring Cultural Heritage Sites in South
East Europe. CHERPLAN, National Research Council of Italy.
Sürücü O., Başar M. E. 2016. Virtual Reality as an Awareness Tool on the Protection of
Cultural Heritage, Artium. Volume 4, Issue 1,13–26p.
Szeliski, R., 2010. Computer Vision: Algorithms and Applications. Springer-Verlag, New
York.
Turan M. (2004). Evaluation of Contemporary Developments In The Field Of Architectural
Photogrammetry, J. Fac. Eng. Arch. Gazi Univ. Vol 19, No 1, 43-50.
Ulman, S. 1979. The interpretation of structure from motion. Proceedings of the Royal
Society of London Series B: Biological Sciences. 203: 405–442.
UNESCO, ICCROM, ICOMOS, IUCN,. 2011. Preparing World Heritage Nominations.
Second Edition. UNESCO. 135.
Uslu, A., Polat, N., Toprak, A.S., Uysal, M. 2016. Sampling of 3D Modelling of Cultural
Heritage Using Photogrammetric Method. Electronic Journal of Map Technologies. 8(2):
165-176.
Yakar, M., Yıldız, F., Yılmaz, H.M. 2005. Mıssıon Of Geodesy And Photogrammetry
Engıneers In Documentatıon Of Hıstorıcal And Cultural Heritages. TMMOB-Chamber of
Survey and Cadastre Engineers, 10. Turkish Scientific and Technical Mapping Congress.
28 March - 1 April, Ankara, Turkey.
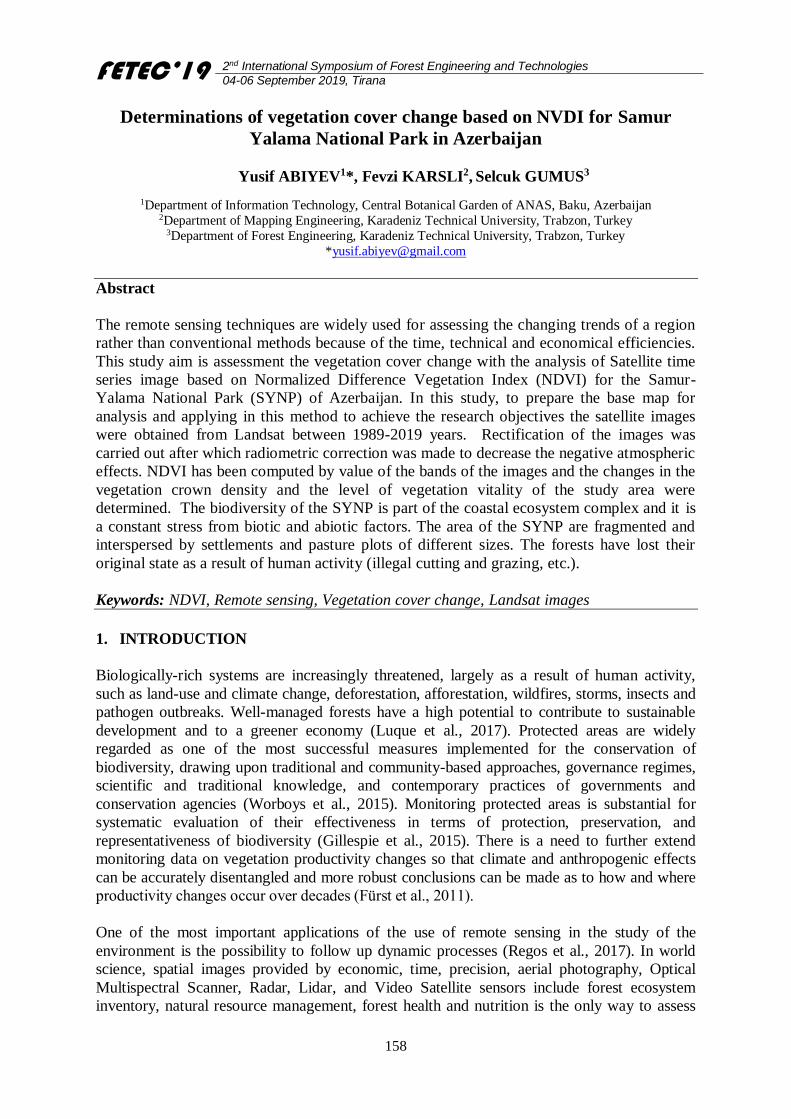
FETEC’19 2nd International Symposium of Forest Engineering and Technologies
04-06 September 2019, Tirana
158
Determinations of vegetation cover change based on NVDI for Samur
Yalama National Park in Azerbaijan
Yusif ABIYEV1*, Fevzi KARSLI2, Selcuk GUMUS3
1Department of Information Technology, Central Botanical Garden of ANAS, Baku, Azerbaijan 2Department of Mapping Engineering, Karadeniz Technical University, Trabzon, Turkey
3Department of Forest Engineering, Karadeniz Technical University, Trabzon, Turkey
Abstract
The remote sensing techniques are widely used for assessing the changing trends of a region
rather than conventional methods because of the time, technical and economical efficiencies.
This study aim is assessment the vegetation cover change with the analysis of Satellite time
series image based on Normalized Difference Vegetation Index (NDVI) for the Samur-
Yalama National Park (SYNP) of Azerbaijan. In this study, to prepare the base map for
analysis and applying in this method to achieve the research objectives the satellite images
were obtained from Landsat between 1989-2019 years. Rectification of the images was
carried out after which radiometric correction was made to decrease the negative atmospheric
effects. NDVI has been computed by value of the bands of the images and the changes in the
vegetation crown density and the level of vegetation vitality of the study area were
determined. The biodiversity of the SYNP is part of the coastal ecosystem complex and it is
a constant stress from biotic and abiotic factors. The area of the SYNP are fragmented and
interspersed by settlements and pasture plots of different sizes. The forests have lost their
original state as a result of human activity (illegal cutting and grazing, etc.).
Keywords: NDVI, Remote sensing, Vegetation cover change, Landsat images
1. INTRODUCTION
Biologically-rich systems are increasingly threatened, largely as a result of human activity,
such as land-use and climate change, deforestation, afforestation, wildfires, storms, insects and
pathogen outbreaks. Well-managed forests have a high potential to contribute to sustainable
development and to a greener economy (Luque et al., 2017). Protected areas are widely
regarded as one of the most successful measures implemented for the conservation of
biodiversity, drawing upon traditional and community-based approaches, governance regimes,
scientific and traditional knowledge, and contemporary practices of governments and
conservation agencies (Worboys et al., 2015). Monitoring protected areas is substantial for
systematic evaluation of their effectiveness in terms of protection, preservation, and
representativeness of biodiversity (Gillespie et al., 2015). There is a need to further extend
monitoring data on vegetation productivity changes so that climate and anthropogenic effects
can be accurately disentangled and more robust conclusions can be made as to how and where
productivity changes occur over decades (Fürst et al., 2011).
One of the most important applications of the use of remote sensing in the study of the
environment is the possibility to follow up dynamic processes (Regos et al., 2017). In world
science, spatial images provided by economic, time, precision, aerial photography, Optical
Multispectral Scanner, Radar, Lidar, and Video Satellite sensors include forest ecosystem
inventory, natural resource management, forest health and nutrition is the only way to assess
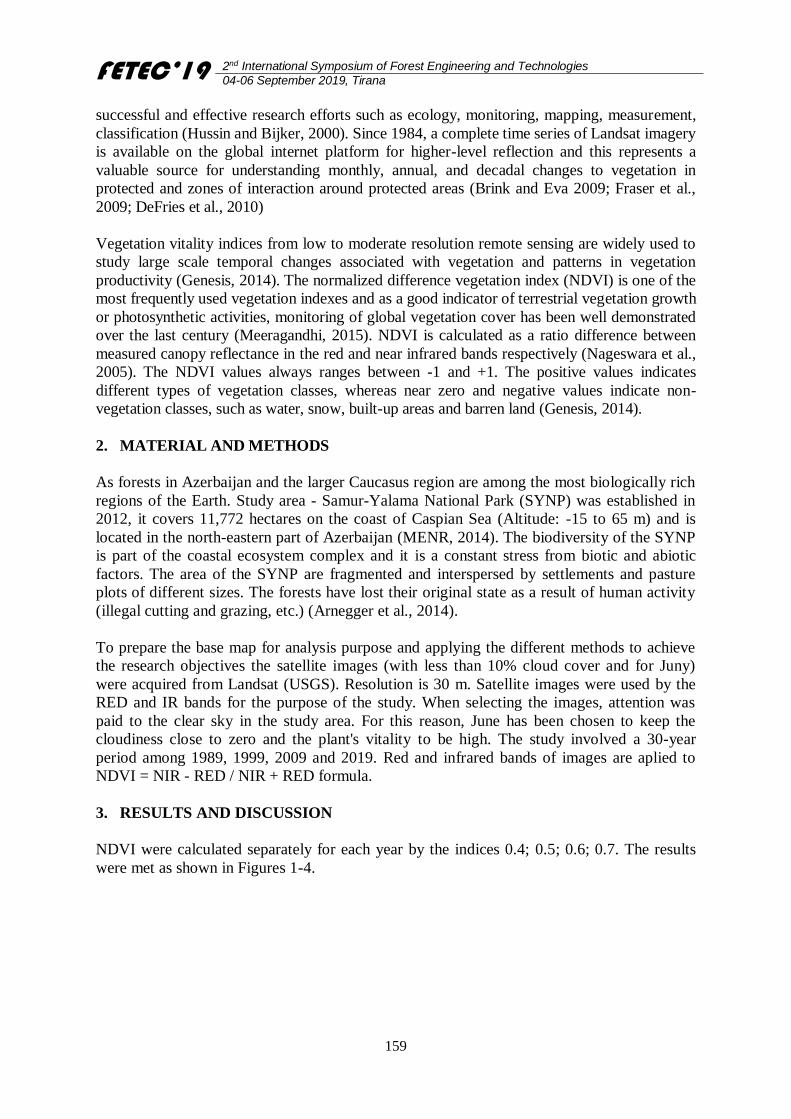
FETEC’19 2nd International Symposium of Forest Engineering and Technologies
04-06 September 2019, Tirana
159
successful and effective research efforts such as ecology, monitoring, mapping, measurement,
classification (Hussin and Bijker, 2000). Since 1984, a complete time series of Landsat imagery
is available on the global internet platform for higher-level reflection and this represents a
valuable source for understanding monthly, annual, and decadal changes to vegetation in
protected and zones of interaction around protected areas (Brink and Eva 2009; Fraser et al.,
2009; DeFries et al., 2010)
Vegetation vitality indices from low to moderate resolution remote sensing are widely used to
study large scale temporal changes associated with vegetation and patterns in vegetation
productivity (Genesis, 2014). The normalized difference vegetation index (NDVI) is one of the
most frequently used vegetation indexes and as a good indicator of terrestrial vegetation growth
or photosynthetic activities, monitoring of global vegetation cover has been well demonstrated
over the last century (Meeragandhi, 2015). NDVI is calculated as a ratio difference between
measured canopy reflectance in the red and near infrared bands respectively (Nageswara et al.,
2005). The NDVI values always ranges between -1 and +1. The positive values indicates
different types of vegetation classes, whereas near zero and negative values indicate non-
vegetation classes, such as water, snow, built-up areas and barren land (Genesis, 2014).
2. MATERIAL AND METHODS
As forests in Azerbaijan and the larger Caucasus region are among the most biologically rich
regions of the Earth. Study area - Samur-Yalama National Park (SYNP) was established in
2012, it covers 11,772 hectares on the coast of Caspian Sea (Altitude: -15 to 65 m) and is
located in the north-eastern part of Azerbaijan (MENR, 2014). The biodiversity of the SYNP
is part of the coastal ecosystem complex and it is a constant stress from biotic and abiotic
factors. The area of the SYNP are fragmented and interspersed by settlements and pasture
plots of different sizes. The forests have lost their original state as a result of human activity
(illegal cutting and grazing, etc.) (Arnegger et al., 2014).
To prepare the base map for analysis purpose and applying the different methods to achieve
the research objectives the satellite images (with less than 10% cloud cover and for Juny)
were acquired from Landsat (USGS). Resolution is 30 m. Satellite images were used by the
RED and IR bands for the purpose of the study. When selecting the images, attention was
paid to the clear sky in the study area. For this reason, June has been chosen to keep the
cloudiness close to zero and the plant's vitality to be high. The study involved a 30-year
period among 1989, 1999, 2009 and 2019. Red and infrared bands of images are aplied to
NDVI = NIR - RED / NIR + RED formula.
3. RESULTS AND DISCUSSION
NDVI were calculated separately for each year by the indices 0.4; 0.5; 0.6; 0.7. The results
were met as shown in Figures 1-4.
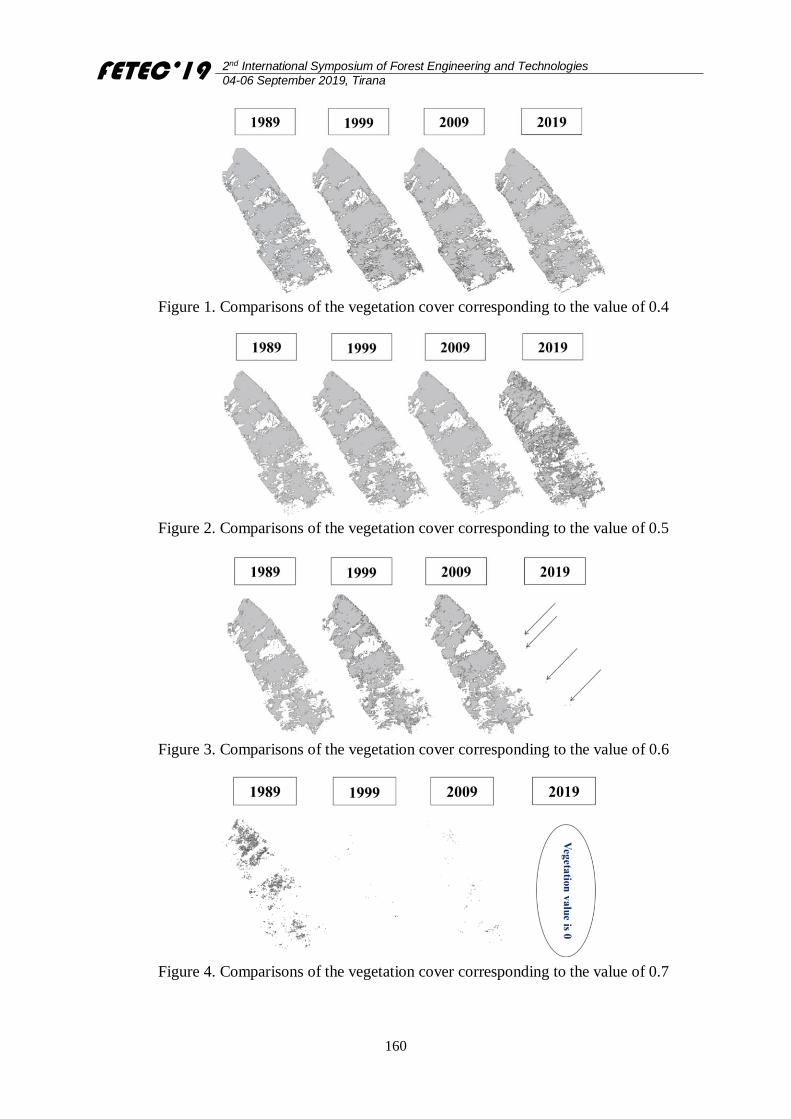
FETEC’19 2nd International Symposium of Forest Engineering and Technologies
04-06 September 2019, Tirana
160
Figure 1. Comparisons of the vegetation cover corresponding to the value of 0.4
Figure 2. Comparisons of the vegetation cover corresponding to the value of 0.5
Figure 3. Comparisons of the vegetation cover corresponding to the value of 0.6
Figure 4. Comparisons of the vegetation cover corresponding to the value of 0.7
FETEC’19 2nd International Symposium of Forest Engineering and Technologies
04-06 September 2019, Tirana
161
4. CONCLUSION AND SUGGESTIONS
Calculated NDVI indexes were significantly changed period by period. However, while 0.4
index was less changed, there is a significant decrease in other indices, especially in the last
period. In 2019, the value of the vegetation cover, which corresponds to the 0.6 and 0.7
indices, is almost zero. These changes could be resulted from social and ecological pressures
such as illegal cutting, land use changing and increasing population and living area.
References
Arnegger, J., Dieterich, T., Rodina, V. 2014. Local awareness, acceptance and tourism
development: challenges and opportunities for protected area management in post-Soviet
countries – the Samur-Yalama National Park, Azerbaijan. Proc. of the 7th International
Conference on Monitoring and Management of Visitors in Recreational and Protected Areas
(148-150).
Brink, A.B., Eva, H.D. 2009. Monitoring 25 years of land cover change dynamics in Africa: A
sample based remote sensing approach. Applied Geography 29: 501–512.
DeFries, R., Karanth, K.K., Pareeth, S. 2010. Interactions between protected areas and their
surroundings in human-dominated tropical landscapes. Bio. Conservation 143: 2870–2880
Fürst C., Lorz, C., Makeschin, F. 2011. Integrating land management and land-cover classes to
assess impacts of land use change on ecosystem services, International Journal of
Biodiversity Science, Ecosystem Services & Management, 7:3, 168-181.
Fraser, R.H., Olthof, I., Pouliot, D. 2009. Monitoring land cover change and ecological
integrity in Canada’s national parks. Remote Sensing of Environment 113: 1397–1409.
Yengoh, G.T., Dent, G.T., Olsson, L., Tengberg, A.E., Tucker III, C.J. 2014. Use of the
Normalized Difference Vegetation Index (NDVI) to assess land degradation at multiple
scales: a review of the current status, future trends, and practical considerations, STAP/GEF,
report.
Gillespie T.W., Willis, K.S., Ostermann-Kelm, S. 2015. Spaceborne remote sensing of the
world’s protected areas. Progress in Physical Geography: Earth and Environment,
39(3):388-404.
Hussin, Y.A., Bijker W. 2000. Inventory of remote sensing applications in forestry for
sustainable management. The International Institute for Aerospace Survey and Earth
Science (ITC) 7500 AA, Enschede
Luque, S., Gonzalez-Redin, J., Fürst, C. 2017. In book: Ecosystem Services Mapping, Chapter:
7(3):324-328
Meera Gandhi, G., Parthiban, S., Thummala, N., Christy, A. 2015. NDVI: Vegetation Change
Detection Using Remote Sensing and GIS – A Case Study of Vellore District. Procedia
Computer Science. 57:1199-1210.
Ministry of Ecology and Natural Resources of Azerbaijan (MENR), KFW - Kreditanstalt für
Wiederaufbau and GFA Consulting Group. 2014. Samur-Yalama National Park.
Nageswara, P.P.R., Shobha, S.V., Ramesh, K.S., Somashekhar, R.K. 2005. Satellite -based
assessment of Agricultural drought in Karnataka State, Journal of the Indian society of
remote sensing, 33(3):429-434.
Regos, A., Tapia, L., Gil-Carrera, A., Domínguez, J., 2017. Monitoring protected areas from
space: A multi-temporal assessment using raptors as biodiversity surrogates. PLOS ONE,
vol. 12, issue 7, p. e0181769.
Worboys, G.L., Lockwood, M., Kothari, A., Feary, S., Pulsford, I. 2015. Protected Area
Governance and Management, ANU Press, The Australian National University, Canberra,
Australia. XXI–XXVI.
FETEC’19 2nd International Symposium of Forest Engineering and Technologies
04-06 September 2019, Tirana
162
An Assessment on Health and Safety Conditions for Forestry Works with
Risk Analysis Method
H. Hulusi ACAR1, Mehmet EKER2*
1İstanbul Yeni Yüzyıl Univ., Faculty of Health Science, Occupational Health and Safety Dept., İstanbul, Turkey 2Isparta University of Applied Science, Faculty of Forestry, Forest Engineering Dept., Isparta, Turkey
Abstract
Concerning with forest harvesting works, all shareholders are willing to do something to
eliminate and minimize the risks and hazards. Health and Safety at Work Acts recognize the
ethical imperative prerequisites. Therefore, it is needed to identify risks, hazards and preventing
measures in forest harvesting works to achieve a culture of health and safety. This study aimed
to characterize the current situations of workers’ health and safety, to show the hazards and
risks, to reveal the risk factors, and to perform a risk analysis and evaluation throughout the
wood supply chain. Within this scope, risk analysis tables have been prepared according to “L-
Type Matrix”. The acts and rules, legislation and regulations, official statistics, documents
related to state-forestry, and observational data revealing the current situation were used as
research material. As a result, the forest harvesting and transportation works had the higher risk
level and one of the most hazardous sectors. L-Type matrix was an available assessment
procedure for the forestry works. The application of other risk analysis method such as
frequency-valued risk assessment methods cannot be rational because of the risks and hazards
involved in harvesting, the incidence of unrecorded injured occupational accidents, and
insufficient detection of risks and lack of data on previous occupational accidents.
Keywords: Health and safety, Wood harvesting, Risk assessment, Forestry works
1. INTRODUCTION
Forestry works are generally specified as; cultivation and breeding, afforestation works, Works
at the forest nurseries, silvicultural operations, harvesting and transportation of forest products,
road construction works, stand preparation, firefighting works, conservation works, etc. In the
forestry works, the most repeated, having the highest employment capacity and the most
important forestry work is harvesting and transportation (Acar and Eker, 2002). The
characteristics of the works are realized in different operating site with various technology
levels. The forestry work environment is a source of hazardous situations since the works are
performed in a wide area with heavy load. Forestry occupation is carried on 22.62 million ha
forestland (28.88% of country) in Turkey. Total wood harvesting rate is over 20 million m3
(GDF, 2019a). The average yield-productivity is under 150 m3 per ha. Cut-to-length harvesting
is applied (nearly 50 million piece of logs) in each season. Furthermore, forests are generally
located on steep, rocky, and mountainous areas. Topography has sloping, curved and rugged
land structure. Stand floor is covered with litter and brush. 99.9 % of forests areas are
belonging to the government Forestry operations are conducted by General Directorate of
Forestry.
When we look at the Turkish forestry workmanship and working conditions we may come
across the situation that are: forest harvest decisions and operations is planned, organized, and
controlled through General Directorate of Forestry. The constitution, forestry laws, and
FETEC’19 2nd International Symposium of Forest Engineering and Technologies
04-06 September 2019, Tirana
163
regulations dictate that «all forestry works are operated by forest villagers or their
cooperatives». Forestry employment provides vital economic contributions for forest villagers.
Approx. 7 million people, 10 % of national population living over 20.000 forest district. Forest
villager’s cooperatives have over 250.000 members. Employment is provided to whom from
120.000 to 250.000 person per annual (GDF, 2019b). The villagers have the least gross national
income around the nation. Their education level is very low. The technology level for forestry
operations is also low. Mainly manuel and rarely motor-manual harvesting techniques are used
in forestry. The forestry works spread over a wide area. The works are realized in local
environment, where is isolated from community.
On the other hand, forestry is one of the most hazardous sectors in the worldwide. Occupational
accidents have been a significant problem. Manually operated works cause a trend of rising
accident rates and a high incidence of occupational diseases among forestry workers. The
governments, enterprises, employers, and workers are willing to eliminate and minimize the
risks and hazards. In order to reduce the accidents, it is obligatory to perceive the present risks
and to analyse them correctly. Health and Safety at Work Acts recognize the ethical imperative
prerequisites. According to the Labor Act it is compulsory to make a risk assessment at all the
working places. Therefore, it is needed to identify risks, hazards and preventing measures in
forest harvesting works to achieve a culture of health and safety. In well-known literature, the
risk analysis methods can be listed as follow; Risk Mapping, Preliminary Hazard Analysis
(PHA), Job Safety Analysis (JSA), What if..?, Preliminary Risk Analysis (PRA), Preliminary
Risk Analysis Using Checklists, Risk Assessment Decision Matrix, L - Type Matrix, Multi-
Variable X - Type Matrix Diagram, Hazard and Operability Studies (HAZOP), Hazard
Ranking Index (DOW index, MOND index, NFPA index), Rapid Ranking (Material Factor),
Fault Tree Analysis (FTA), Failure Mode and Effects Analysis- Failure Mode and Critically
Effects Analysis (FMEA/FMECA), Safety Audit, Event Tree Analysis (ETA), Cause-
Consequence Analysis (Rausand, 2011). The aim of study is to characterize the current
situations of workmanship, to show the hazards and risks, to reveal the risk factors, and to
perform a risk analysis and assessment throughout the wood supply chain in forestry.
2. MATERIAL AND METHOD
In this study, the acts and rules, legislation and regulations, official statistics and documents
related to state-forestry, and observational data from wood harvest operations and also previous
studies were used as research material.
As research methodology, first of all, the sources of hazard in harvesting were determined and
also classified in Table 1. The hazards were described, based on hazardous situation of
workplace and works, and behaviour of workers. Risks were defined to observation and
literature based case studies. An available risk analysis method, mentioned above, was selected.
Then, risk analysis tables were prepared according to risk assessment methods.
The source of hazardous situation was classified as follow:
Work environment (climate, topography, forest cover, isolation, plants and animal, etc.)
Work objects (trees, logs, other products, etc.)
Machines, tools and equipment (tractor, chainsaw, axe, rope, etc. )
Worker characteristics (Health, education, skill, training, etc.)

FETEC’19 2nd International Symposium of Forest Engineering and Technologies
04-06 September 2019, Tirana
164
Table 1. The characteristic of the wood harvesting and transportation works
Furthermore, risk factors related to forestry workmanship were itemized as is;
Physical (Noise, vibration, dust, heavy load, air pressure, temperature, etc.)
Chemical (Fuel, oil, solvent, gas, pesticide, insecticide, etc.)
Biologic (Plant or animal or insect infections, fungi, bacteria, etc.)
Psychosocial (Employment security, monotonous, stress, etc.)
Ergonomic (Working time, fatigue, posture, etc.)
Personal (Behavioral, physiological, demographic, and genetic)
In this study, “L-Type (5x5) Matrix” method was selected for risk analysis in forest
harvesting works due to its easily and understantable apllication procedure (Figure 1).
Typically, in the implementation of the method as in Figure 1, the enumeration of likelihood
and impact were realized to the scale as follows (Anonymous, 2019);
Likelihood (L);
5 : Almost certain – It is or has already happened (Everyday)
4 : Likely – It will probably happen (Once a week)
3 : Possible – It could possibly happen(Once a month)
2 : Low likely – It is to happen (Quarterly)
1 : Rare – It is unlikely to happen(Once a year)
Impact (I);
5: Severe – Catastropic (Fatality, continuous incapacity)
4 : Significant – Major inquiry (Permanent impairment, disease, death)
3 : Moderate – Lost time accident (Requiring hospital admission)
2 : Minor – Minor inquiry (Requiring medical treatment, no loss of working day)
1 : Minimal – Near miss (No medical treatment and no loss of work hour)
Depending on the process, L and I values were multiplied to calculate risk reporting matrix
(Table 2). Thus, risk scores (Table 3) were obtained to evaluate for each work phases in all
work cycle.
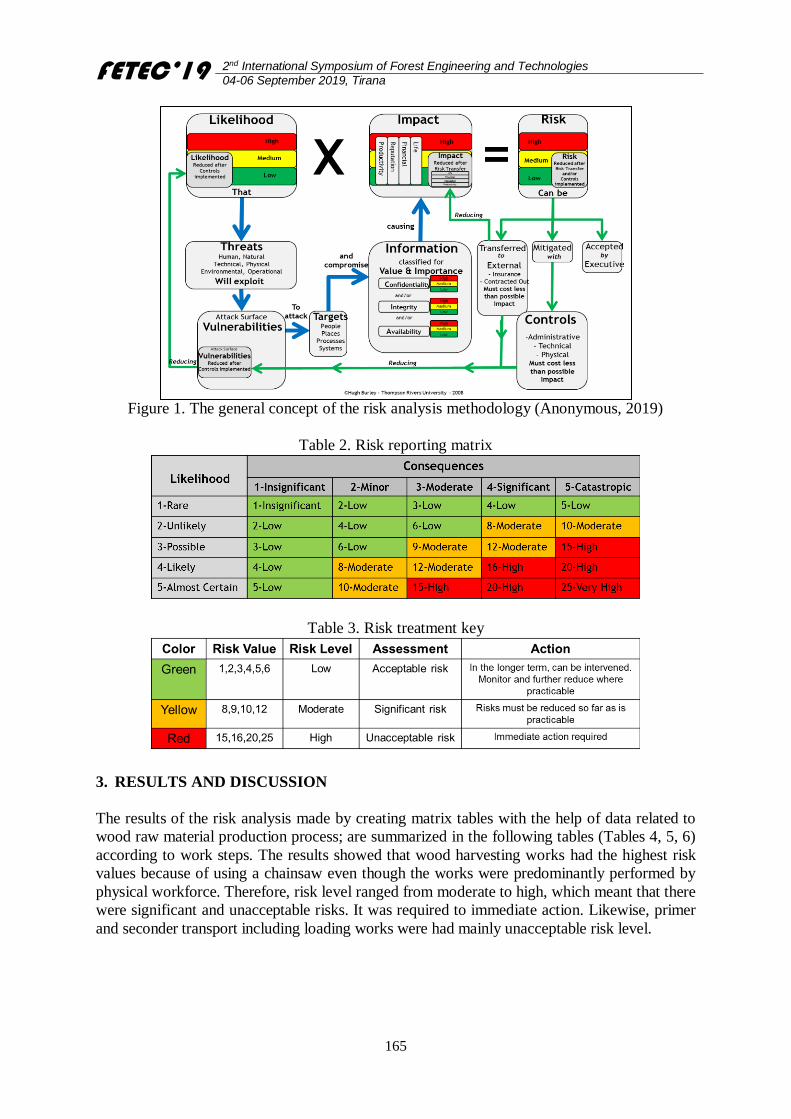
FETEC’19 2nd International Symposium of Forest Engineering and Technologies
04-06 September 2019, Tirana
165
Figure 1. The general concept of the risk analysis methodology (Anonymous, 2019)
Table 2. Risk reporting matrix
Table 3. Risk treatment key
3. RESULTS AND DISCUSSION
The results of the risk analysis made by creating matrix tables with the help of data related to
wood raw material production process; are summarized in the following tables (Tables 4, 5, 6)
according to work steps. The results showed that wood harvesting works had the highest risk
values because of using a chainsaw even though the works were predominantly performed by
physical workforce. Therefore, risk level ranged from moderate to high, which meant that there
were significant and unacceptable risks. It was required to immediate action. Likewise, primer
and seconder transport including loading works were had mainly unacceptable risk level.
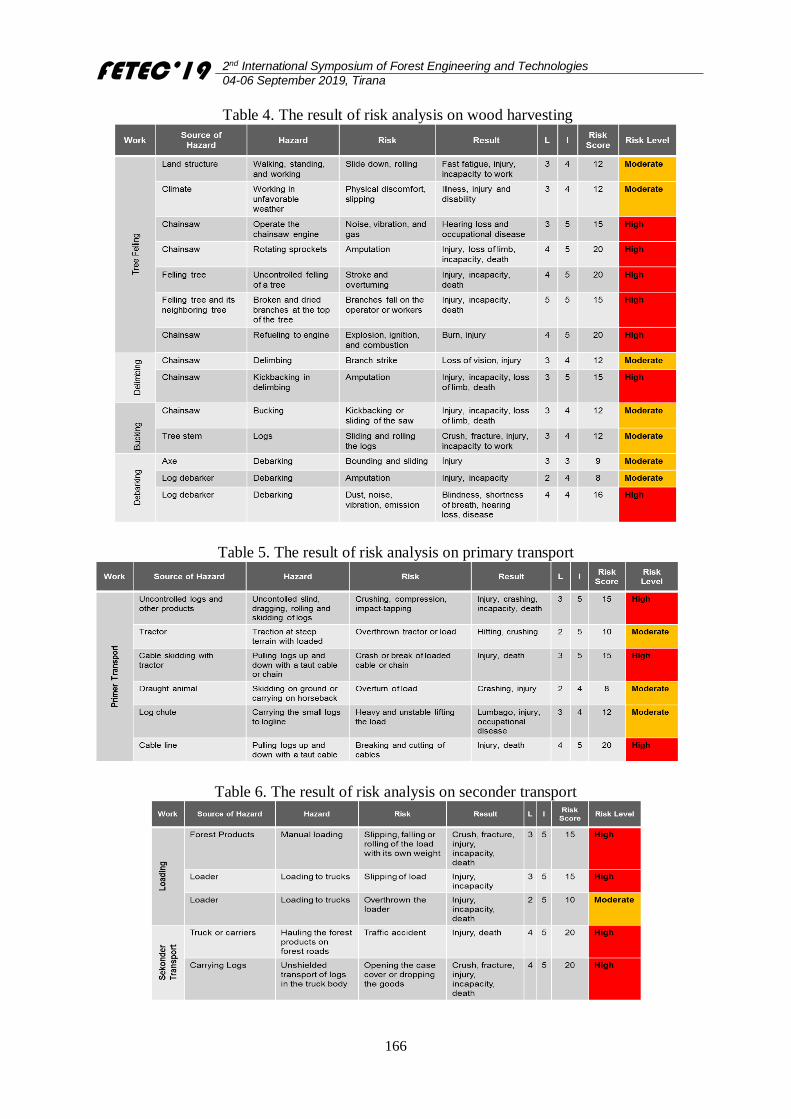
FETEC’19 2nd International Symposium of Forest Engineering and Technologies
04-06 September 2019, Tirana
166
Table 4. The result of risk analysis on wood harvesting
Table 5. The result of risk analysis on primary transport
Table 6. The result of risk analysis on seconder transport
FETEC’19 2nd International Symposium of Forest Engineering and Technologies
04-06 September 2019, Tirana
167
5 x 5 Matrix diagram (L Type Matrix) is used especially for the evaluation of cause-effect
relationships like that in the study. This method is simple and ideal for analysts who have to
perform risk analysis alone, but is not sufficient alone for all jobs involving different processes
or with very different flow diagrams, and the success rate of the method varies according to the
analyst's accumulation. It should be used in order to detect the dangers that require urgency in
such establishments and which require immediate action. With this method, if an event occurs
with the probability of occurrence, the result is graded and measured (Özkılıç, 2005).
4. CONCLUSION
The sources of hazard in forestry are many and varied. Forestry work is dangerous, difficult and
dirty. The risk level in forestry works is high. Hazard and risks are very difficult and costly to
replace by substitution. Although it seems to be contrary to hierarchical measures, the use of
Personal Protective Equipment as a first measure may be a reliable solution. Since risks may
vary according to the workplace, employee and job, risk assessment should be performed on an
operational scale and in site specific level. There is no consensus in the world about the ideal
method of risk assessment and a standard has not been developed. Although risk assessment is
required by law, it is not clear how to do it. In order to make a fair and healthy assessment, it is
necessary to choose the appropriate methods within the framework of legislation in forestry
works. However, it may not be a scientific approach to try to apply the same method to every
job or business of all sizes. For example, in a risk analysis using the L-Type Matrix Table as in
this study, the risk score for the same type of hazard may be different in different work phases
and in different workplaces. Risk determinants in such methods; they are purely subjective
criteria such as observation, experience, and predictive ability of the analyst. It is impossible to
set a single risk assessment standard that is suitable for each workplace in forestry works. For
example, the application of frequency-valued risk assessment methods cannot be rational
because of the risks and hazards involved in harvesting, the incidence of unrecorded injured
occupational accidents, and insufficient detection of risks and lack of data on previous
occupational accidents. Because the hazards of accidents and diseases occur in different types
and sizes in every business and every workplace. Therefore, the appropriate method for risk
analysis should be determined by the occupational safety specialist according to the workplace
conditions and employees. Once the risk assessment is made mandatory by law, the
implementation model should be left to workplaces and safety experts. In this context, the risk
assessment method should be sought for plausibility, clarity and suitability for the purpose.
References
Acar, H.H.; Eker, M. 2002. Ergonomics in Forestry - A Challenge for Turkey and a Call for
Partners, Forworknet Update, December 2002, p.12, ILO, Geneva, Switzerland.
Anonymous, 2019. Risk Analysis.
https://www.tru.ca/its/infosecurity/about/Risk_Analysis.html
GDF, 2019a. Forestry Statistics 2018, Official Statistics, General Directorate of Forestry.
https://www.ogm.gov.tr/ekutuphane/Sayfalar/Istatistikler.aspx
GDF, 2019b. 2018 Yılı İdare Faaliyet Raporu. Orman Genel Müdürlüğü. Ankara, 98 s. (In
Turkish)
Özkılıç, Ö. 2005. İş Sağlığı ve Güvenliği Yönetim Sistemleri ve Risk Değerlendirme
Metodolojileri. Türkiye İşveren Sendikaları Yayını, Ankara, 219 p. (In Turkish)
Rausand, M. 2011. Risk Assessment: Theory, Methods, and Applications. John Wiley &
Sons, Inc., Nwe Jersey, USA.
FETEC’19 2nd International Symposium of Forest Engineering and Technologies
04-06 September 2019, Tirana
168
Biodiversity of Eastern Black Sea Mixed Forest
Nuray MISIR*, Mehmet MISIR, Abdullah YILDIZ
Department of Forest Engineering, Faculty of Forestry, Karadeniz Technical University, Turkey
Abstract
Biodiversity refers to combination of all living things on earth and is recognized as one of the
key components of environmental sustainability. Human actions lead to irreversible losses in
terms of diversity of life on earth. These losses affect the functioning of the whole
ecosystems and make difficult to realize of the natural cycle. It is important to establish and
protect life as an indicator of biodiversity for the continuation of natural balance. Forest areas
are ecosystems that contain a significant portion of biological diversity. So, biodiversity in
forest areas needs to be demonstrated. Importance of measurement of biological diversity is
increasing and need for biodiversity assessment methods to enable biodiversity to be
measured is outlined. Various methods were used to determine biological diversity. The
biodiversity indices are statistical method which is planned to evaluate the variety of a data
group consisting of different types of components. In this study, aim to compare biodiversity
using biodiversity indices such as Shannon-Weaner Index, Simpson Index, MacArthur Index,
Pielou Regularity Index. The calculations are based on species composition as well as basal
area distribution
Keywords: Biodiversity, Forest, Index, Species composition
4. INTRODUCTION
The earth is made up of ecosystems and ecological features which are supported by
biodiversity; yet many people do not understand the meaning of biodiversity or what the
impact of its loss would mean. To discern the influence of forest management intervention on
forest biodiversity conservation among management regimes, we need to explore the effects
of environmental and human forest use variables on species richness, diversity and density
(Hooper et al., 2005, Kalonga et al., 2016). Generally, easily accessible forests are more
affected by human activities (Sassen and Sheil, 2013) depending on tree species (Ndangalasi
et al., 2007); although effective forest management planning could reverse the situation (Ball,
2011; Kalonga et al., 2016).
Various diversity indices are used to determine the biodiversity. Diversity index is a
statistical method which is planned to evaluate the variety of a data group consisting of
different types of components. Features of a population such as number of existing species
(Richness), distribution of individuals equally (Evenness) and total number of existing
individuals underlie the basis of diversity indices (Wilhm and Dorris, 1968; Allan, 1975).
Thus, any changes in any of these three features will affect the whole population, so that the
diversity indices depending upon these features are used effectively to determine the changes
in a population (Mandaville, 2002; Dügel, 1995; Türkmen and Kazancı, 2010). In this study,
aim to compare biodiversity using biodiversity indices such as Shannon-Weaner Index,
Simpson Index, MacArthur Index, Pielou Regularity Index. The calculations are based on
species composition and species distribution as well as basal area and number of tree.
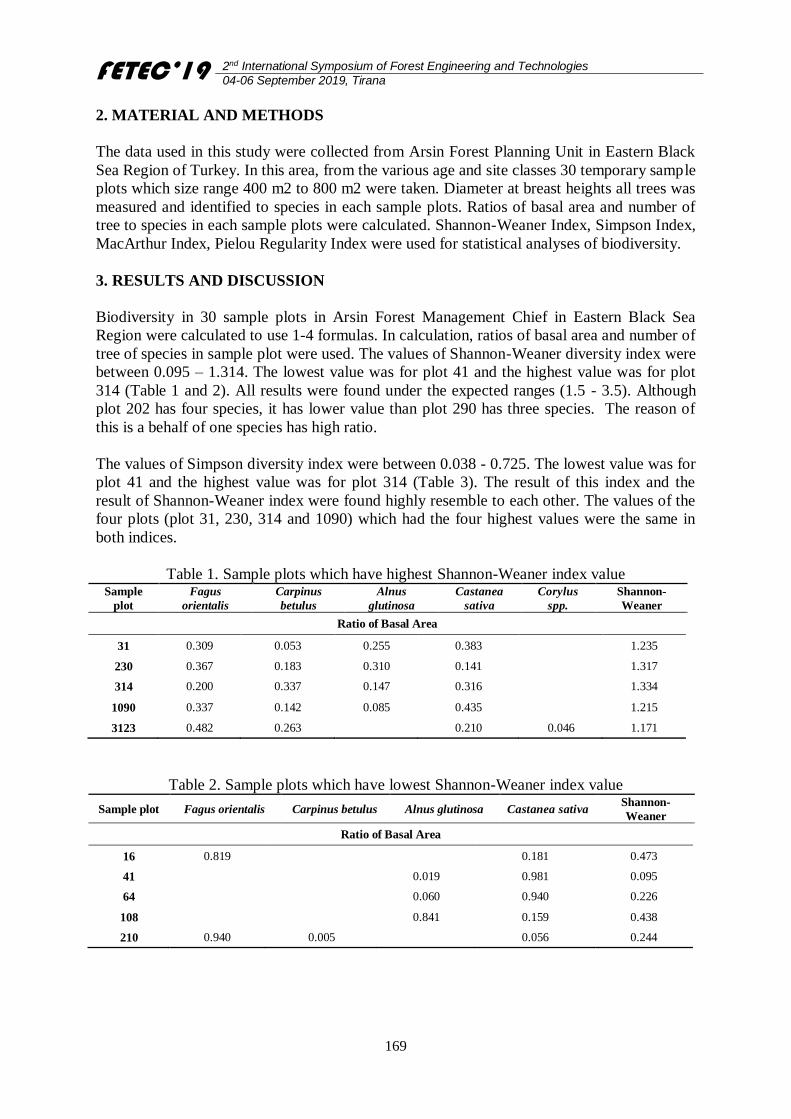
FETEC’19 2nd International Symposium of Forest Engineering and Technologies
04-06 September 2019, Tirana
169
2. MATERIAL AND METHODS
The data used in this study were collected from Arsin Forest Planning Unit in Eastern Black
Sea Region of Turkey. In this area, from the various age and site classes 30 temporary sample
plots which size range 400 m2 to 800 m2 were taken. Diameter at breast heights all trees was
measured and identified to species in each sample plots. Ratios of basal area and number of
tree to species in each sample plots were calculated. Shannon-Weaner Index, Simpson Index,
MacArthur Index, Pielou Regularity Index were used for statistical analyses of biodiversity.
3. RESULTS AND DISCUSSION
Biodiversity in 30 sample plots in Arsin Forest Management Chief in Eastern Black Sea
Region were calculated to use 1-4 formulas. In calculation, ratios of basal area and number of
tree of species in sample plot were used. The values of Shannon-Weaner diversity index were
between 0.095 – 1.314. The lowest value was for plot 41 and the highest value was for plot
314 (Table 1 and 2). All results were found under the expected ranges (1.5 - 3.5). Although
plot 202 has four species, it has lower value than plot 290 has three species. The reason of
this is a behalf of one species has high ratio.
The values of Simpson diversity index were between 0.038 - 0.725. The lowest value was for
plot 41 and the highest value was for plot 314 (Table 3). The result of this index and the
result of Shannon-Weaner index were found highly resemble to each other. The values of the
four plots (plot 31, 230, 314 and 1090) which had the four highest values were the same in
both indices.
Table 1. Sample plots which have highest Shannon-Weaner index value Sample
plot
Fagus
orientalis
Carpinus
betulus
Alnus
glutinosa
Castanea
sativa
Corylus
spp.
Shannon-
Weaner
Ratio of Basal Area
31 0.309 0.053 0.255 0.383 1.235
230 0.367 0.183 0.310 0.141 1.317
314 0.200 0.337 0.147 0.316 1.334
1090 0.337 0.142 0.085 0.435 1.215
3123 0.482 0.263 0.210 0.046 1.171
Table 2. Sample plots which have lowest Shannon-Weaner index value
Sample plot Fagus orientalis Carpinus betulus Alnus glutinosa Castanea sativa Shannon-
Weaner
Ratio of Basal Area
16 0.819 0.181 0.473
41 0.019 0.981 0.095
64 0.060 0.940 0.226
108 0.841 0.159 0.438
210 0.940 0.005 0.056 0.244
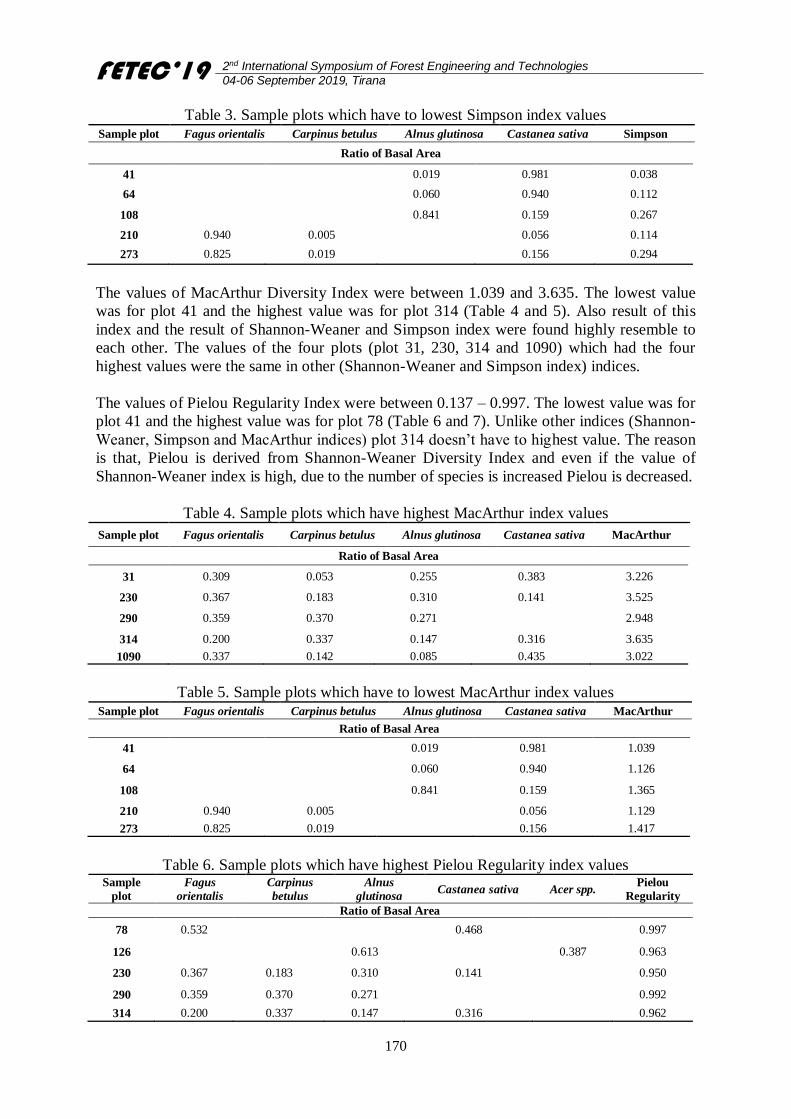
FETEC’19 2nd International Symposium of Forest Engineering and Technologies
04-06 September 2019, Tirana
170
Table 3. Sample plots which have to lowest Simpson index values Sample plot Fagus orientalis Carpinus betulus Alnus glutinosa Castanea sativa Simpson
Ratio of Basal Area
41 0.019 0.981 0.038
64 0.060 0.940 0.112
108 0.841 0.159 0.267
210 0.940 0.005 0.056 0.114
273 0.825 0.019 0.156 0.294
The values of MacArthur Diversity Index were between 1.039 and 3.635. The lowest value
was for plot 41 and the highest value was for plot 314 (Table 4 and 5). Also result of this
index and the result of Shannon-Weaner and Simpson index were found highly resemble to
each other. The values of the four plots (plot 31, 230, 314 and 1090) which had the four
highest values were the same in other (Shannon-Weaner and Simpson index) indices.
The values of Pielou Regularity Index were between 0.137 – 0.997. The lowest value was for
plot 41 and the highest value was for plot 78 (Table 6 and 7). Unlike other indices (Shannon-
Weaner, Simpson and MacArthur indices) plot 314 doesn’t have to highest value. The reason
is that, Pielou is derived from Shannon-Weaner Diversity Index and even if the value of
Shannon-Weaner index is high, due to the number of species is increased Pielou is decreased.
Table 4. Sample plots which have highest MacArthur index values
Sample plot Fagus orientalis Carpinus betulus Alnus glutinosa Castanea sativa MacArthur
Ratio of Basal Area
31 0.309 0.053 0.255 0.383 3.226
230 0.367 0.183 0.310 0.141 3.525
290 0.359 0.370 0.271 2.948
314 0.200 0.337 0.147 0.316 3.635
1090 0.337 0.142 0.085 0.435 3.022
Table 5. Sample plots which have to lowest MacArthur index values Sample plot Fagus orientalis Carpinus betulus Alnus glutinosa Castanea sativa MacArthur
Ratio of Basal Area
41 0.019 0.981 1.039
64 0.060 0.940 1.126
108 0.841 0.159 1.365
210 0.940 0.005 0.056 1.129
273 0.825 0.019 0.156 1.417
Table 6. Sample plots which have highest Pielou Regularity index values Sample
plot
Fagus
orientalis
Carpinus
betulus
Alnus
glutinosa Castanea sativa Acer spp.
Pielou
Regularity
Ratio of Basal Area
78 0.532 0.468 0.997
126 0.613 0.387 0.963
230 0.367 0.183 0.310 0.141 0.950
290 0.359 0.370 0.271 0.992
314 0.200 0.337 0.147 0.316 0.962
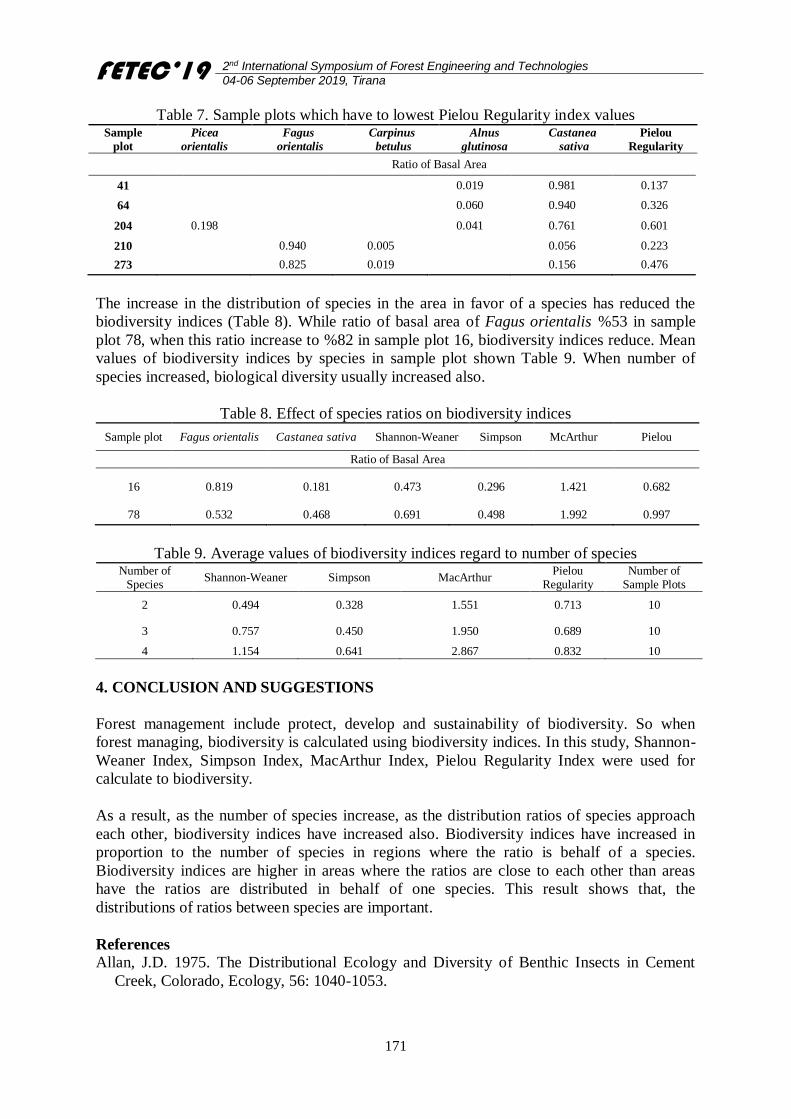
FETEC’19 2nd International Symposium of Forest Engineering and Technologies
04-06 September 2019, Tirana
171
Table 7. Sample plots which have to lowest Pielou Regularity index values Sample
plot
Picea
orientalis
Fagus
orientalis
Carpinus
betulus
Alnus
glutinosa
Castanea
sativa
Pielou
Regularity
Ratio of Basal Area
41 0.019 0.981 0.137
64 0.060 0.940 0.326
204 0.198 0.041 0.761 0.601
210 0.940 0.005 0.056 0.223
273 0.825 0.019 0.156 0.476
The increase in the distribution of species in the area in favor of a species has reduced the
biodiversity indices (Table 8). While ratio of basal area of Fagus orientalis %53 in sample
plot 78, when this ratio increase to %82 in sample plot 16, biodiversity indices reduce. Mean
values of biodiversity indices by species in sample plot shown Table 9. When number of
species increased, biological diversity usually increased also.
Table 8. Effect of species ratios on biodiversity indices
Sample plot Fagus orientalis Castanea sativa Shannon-Weaner Simpson McArthur Pielou
Ratio of Basal Area
16 0.819 0.181 0.473 0.296 1.421 0.682
78 0.532 0.468 0.691 0.498 1.992 0.997
Table 9. Average values of biodiversity indices regard to number of species Number of
Species Shannon-Weaner Simpson MacArthur
Pielou Regularity
Number of Sample Plots
2 0.494 0.328 1.551 0.713 10
3 0.757 0.450 1.950 0.689 10
4 1.154 0.641 2.867 0.832 10
4. CONCLUSION AND SUGGESTIONS
Forest management include protect, develop and sustainability of biodiversity. So when
forest managing, biodiversity is calculated using biodiversity indices. In this study, Shannon-
Weaner Index, Simpson Index, MacArthur Index, Pielou Regularity Index were used for
calculate to biodiversity.
As a result, as the number of species increase, as the distribution ratios of species approach
each other, biodiversity indices have increased also. Biodiversity indices have increased in
proportion to the number of species in regions where the ratio is behalf of a species.
Biodiversity indices are higher in areas where the ratios are close to each other than areas
have the ratios are distributed in behalf of one species. This result shows that, the
distributions of ratios between species are important.
References
Allan, J.D. 1975. The Distributional Ecology and Diversity of Benthic Insects in Cement
Creek, Colorado, Ecology, 56: 1040-1053.
FETEC’19 2nd International Symposium of Forest Engineering and Technologies
04-06 September 2019, Tirana
172
Ball, S. 2011. Putting the Forestry into Participatory Forest Managmenet – Simple Inventory
Protocols for Sustainable Logging. In: Geldenhuys, C., Ham, C., Ham, H. (Eds.),
Sustainable Forest Management in Africa. Stellenbosch.
Dügel, M. 1995. Köyceğiz Gölü’ne dökülen akarsuların su kalitelerinin fiziko-kimyasal ve
biyolojik parametrelerle belirlenmesi, Bilim Uzmanlığı Tezi, Hacettepe Üniversitesi, Fen
Bilimleri Enstitüsü, Ankara, 88 s. (In Turkish)
D., Loreau, M., Naeem, S. 2005. Effects of biodiversity on ecosystem functioning: a
consensus of current knowledge. Ecol. Monogr. 75, 3–35.
Kalonga, S. K., Midtgaard, F., Klanderud, K. 2016. Forest certification as a policy option in
conserving biodiversity: An empirical study of forest management in Tanzania, Forest
Ecology and Management, 361, 1-12.
Kocataş, A. 1992. Ekoloji ve Çevre Biyolojisi, Ege Üniv. Matbaası, İzmir, 564s. MacArthur,
R. H., 1965. Patterns of Species Diversity, Biological Reviews, Volume 40, Issue 4, 510-
533.
Mandaville, S.M. 2002. Benthic Macroinvertebrates in Freshwater – Taxa Tolerance Values,
Metrics, and Protocols, Project H - 1. (Nova Scotia: Soil & Water Conservation Society of
Metro Halifax).
Ndangalasi, H.J., Bitariho, R., Dovie, D.B. 2007. Harvesting of non-timber forest products
and implications for conservation in two montane forests of East Africa. Biol. Conserv.
134, 242–250.
Pielou, E.C. 1966. The Measurement of Diversity in Different Types of Biological
Collections, J. Theoret. Biol., 13: 131-144.
Sassen, M., Sheil, D. 2013. Human impacts on forest structure and species richness on the
edges of a protected mountain forest in Uganda. For. Ecol. Manage. 307, 206–218.
Türkmen, G., Kazancı, N. 2010. Applications of Various Diversity Indices to Benthic
Macroinvertebrate Assemblages In Streams In A National Park In Turkey, Review of
Hydrobiology, 3(2): 111-125.
Wilhm, J.L., Dorris, T.C. 1968. Biological Parameters for Water Quality Criteria, Bioscience
18(6): 477-481.
FETEC’19 2nd International Symposium of Forest Engineering and Technologies
04-06 September 2019, Tirana
173
Forest contribution to rural household economy and income equality: A
case study in three administrative units of north-east Albania
Leonidha PERI*, Albora KACANI
Agriculture University of Tirana, Faculty of Forestry Sciences, 1029 Tirana, Albania
Abstract
The study aims to describe and examine the effects of forests income in the distribution of
household income and equality. Data were obtained by interviewing a total of 197 rural
households, randomly selected from three administrative units in north-east Albania. Forest
income contributes around 9% of total household income calculated as a sum of collected
timber, firewood, fodder, forest fruits, mushrooms, and nuts. Firewood represents the largest
proportion of forest income (57.4%), utilized mainly for family needs related to heating and
cooking. Nuts contribute 19.4%, fodder 9.4% and forest fruits 9.2%, to household forest
income. While mushrooms and timber respectively contribute 3% and 1.6%. To describe the
effects of forests income in the distribution of incomes and inequality for the interviewed
households, Gini coefficient, and Lorenz curve are used. The result shows that forest products
can potentially play an important role in reducing inequality in income distribution among
sampled households.
Keywords: forest income, household income, equality, north-east Albania, Gini coefficient,
Lorenz curve.
1. INTRODUCTION
Recently there is a growing awareness of the importance and value of the use of natural
resources in the lives of rural communities (Babulo et al., 2009). The importance of products
coming from community forests has been highlighted in several studies (Varughese and
Ostrom, 2001; Baral, 2008). Furthermore, forest products play a crucial role in reducing
inequality in income distribution among rural communities (Gatiso and Wossen, 2014). The
past decade has witnessed an increasing emphasis on community-based forest management,
with the transference of forest management responsibility into the hands of local communities
(Adhikari, 2004). A similar approach has been implemented in Albania during the last two
decades where 80% of forest and pastures area is transferred from central to local government
(municipalities) until 2014.
The study aims to describe and examine the effects of forests income in the distribution of
household income and equality. Data were obtained by interviewing a total of 197 rural
households, randomly selected from three administrative units in north-east Albania (Ulëz,
Melan and Zerqan).
2. MATERIAL AND METHODS
2.1. Selection of the study area
The administrative units of Zerqan, Ulëz and Melan of Dibër district were selected for this
study. The following criteria were considered during the selection process: (i) communities
actively engaged in forest governance, (ii) significant forest area transferred to Local
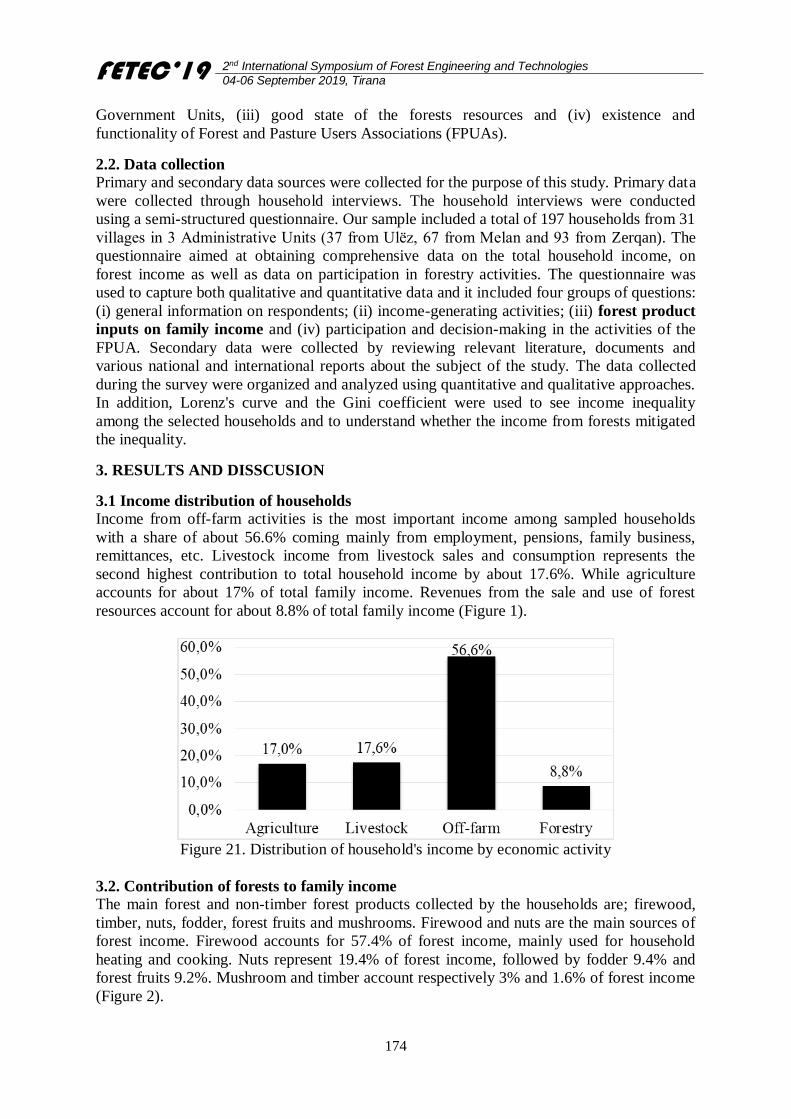
FETEC’19 2nd International Symposium of Forest Engineering and Technologies
04-06 September 2019, Tirana
174
Government Units, (iii) good state of the forests resources and (iv) existence and
functionality of Forest and Pasture Users Associations (FPUAs).
2.2. Data collection
Primary and secondary data sources were collected for the purpose of this study. Primary data
were collected through household interviews. The household interviews were conducted
using a semi-structured questionnaire. Our sample included a total of 197 households from 31
villages in 3 Administrative Units (37 from Ulëz, 67 from Melan and 93 from Zerqan). The
questionnaire aimed at obtaining comprehensive data on the total household income, on
forest income as well as data on participation in forestry activities. The questionnaire was
used to capture both qualitative and quantitative data and it included four groups of questions:
(i) general information on respondents; (ii) income-generating activities; (iii) forest product
inputs on family income and (iv) participation and decision-making in the activities of the
FPUA. Secondary data were collected by reviewing relevant literature, documents and
various national and international reports about the subject of the study. The data collected
during the survey were organized and analyzed using quantitative and qualitative approaches.
In addition, Lorenz's curve and the Gini coefficient were used to see income inequality
among the selected households and to understand whether the income from forests mitigated
the inequality.
3. RESULTS AND DISSCUSION
3.1 Income distribution of households
Income from off-farm activities is the most important income among sampled households
with a share of about 56.6% coming mainly from employment, pensions, family business,
remittances, etc. Livestock income from livestock sales and consumption represents the
second highest contribution to total household income by about 17.6%. While agriculture
accounts for about 17% of total family income. Revenues from the sale and use of forest
resources account for about 8.8% of total family income (Figure 1).
Figure 21. Distribution of household's income by economic activity
3.2. Contribution of forests to family income
The main forest and non-timber forest products collected by the households are; firewood,
timber, nuts, fodder, forest fruits and mushrooms. Firewood and nuts are the main sources of
forest income. Firewood accounts for 57.4% of forest income, mainly used for household
heating and cooking. Nuts represent 19.4% of forest income, followed by fodder 9.4% and
forest fruits 9.2%. Mushroom and timber account respectively 3% and 1.6% of forest income
(Figure 2).
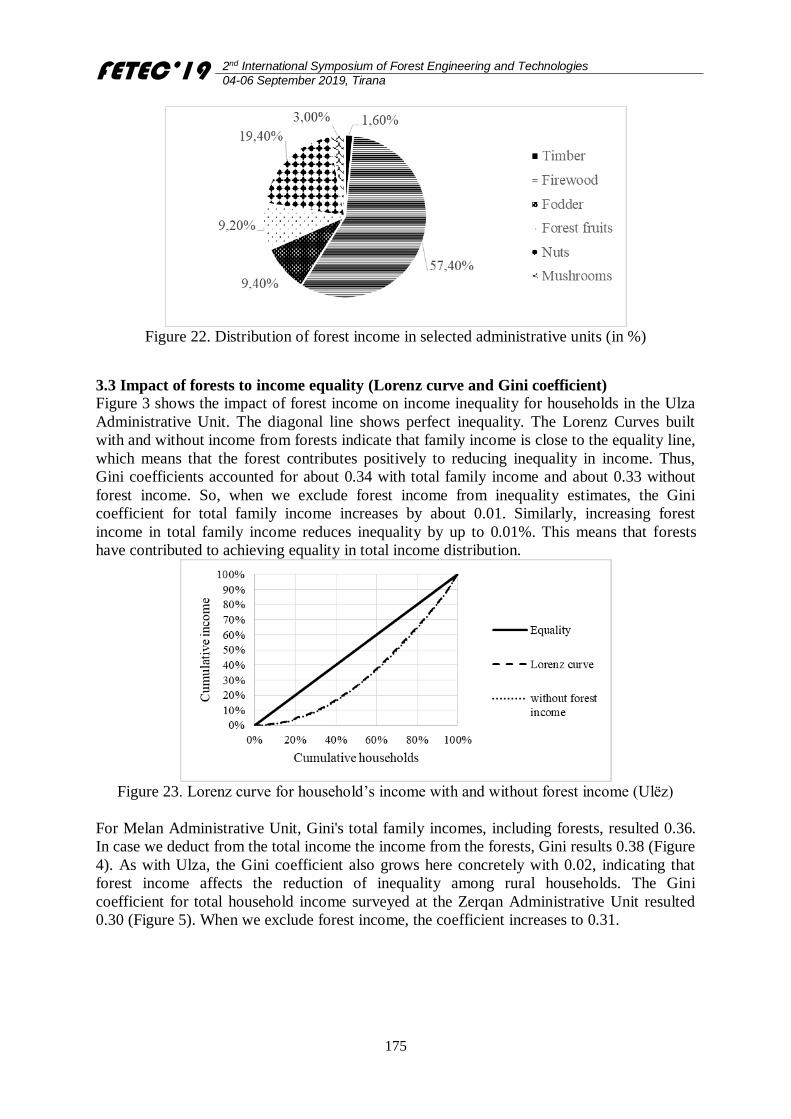
FETEC’19 2nd International Symposium of Forest Engineering and Technologies
04-06 September 2019, Tirana
175
Figure 22. Distribution of forest income in selected administrative units (in %)
3.3 Impact of forests to income equality (Lorenz curve and Gini coefficient)
Figure 3 shows the impact of forest income on income inequality for households in the Ulza
Administrative Unit. The diagonal line shows perfect inequality. The Lorenz Curves built
with and without income from forests indicate that family income is close to the equality line,
which means that the forest contributes positively to reducing inequality in income. Thus,
Gini coefficients accounted for about 0.34 with total family income and about 0.33 without
forest income. So, when we exclude forest income from inequality estimates, the Gini
coefficient for total family income increases by about 0.01. Similarly, increasing forest
income in total family income reduces inequality by up to 0.01%. This means that forests
have contributed to achieving equality in total income distribution.
Figure 23. Lorenz curve for household’s income with and without forest income (Ulëz)
For Melan Administrative Unit, Gini's total family incomes, including forests, resulted 0.36.
In case we deduct from the total income the income from the forests, Gini results 0.38 (Figure
4). As with Ulza, the Gini coefficient also grows here concretely with 0.02, indicating that
forest income affects the reduction of inequality among rural households. The Gini
coefficient for total household income surveyed at the Zerqan Administrative Unit resulted
0.30 (Figure 5). When we exclude forest income, the coefficient increases to 0.31.
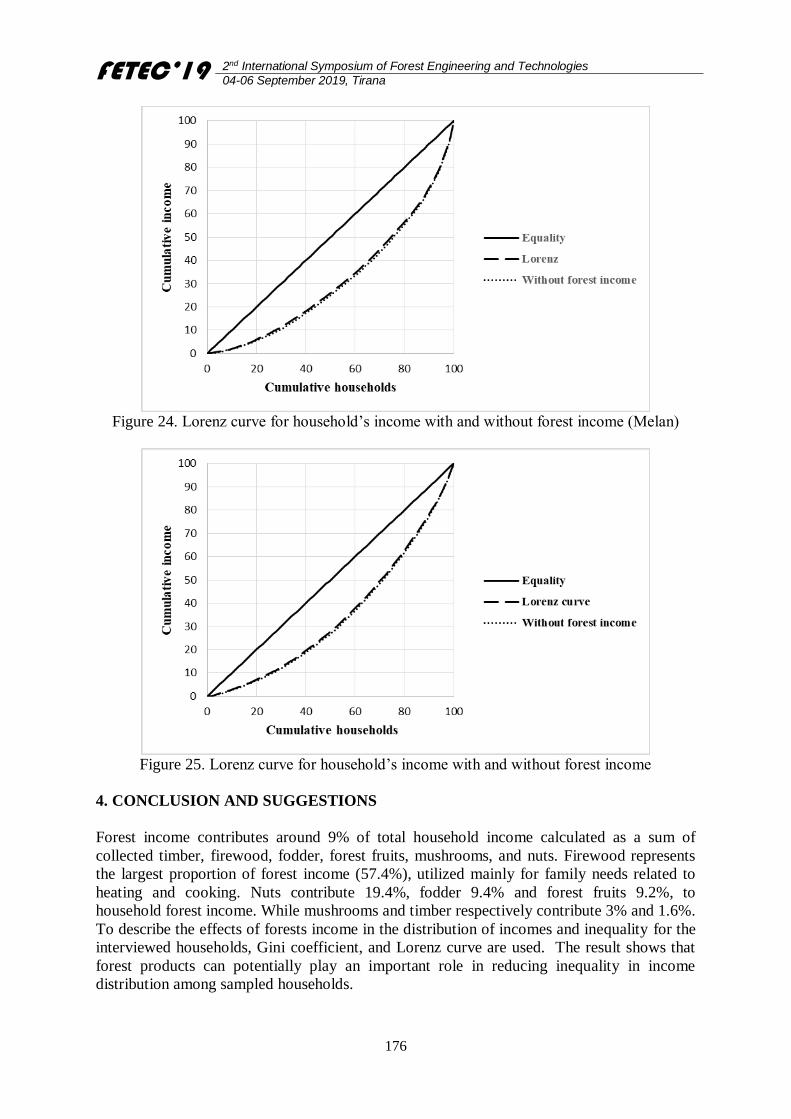
FETEC’19 2nd International Symposium of Forest Engineering and Technologies
04-06 September 2019, Tirana
176
Figure 24. Lorenz curve for household’s income with and without forest income (Melan)
Figure 25. Lorenz curve for household’s income with and without forest income
4. CONCLUSION AND SUGGESTIONS
Forest income contributes around 9% of total household income calculated as a sum of
collected timber, firewood, fodder, forest fruits, mushrooms, and nuts. Firewood represents
the largest proportion of forest income (57.4%), utilized mainly for family needs related to
heating and cooking. Nuts contribute 19.4%, fodder 9.4% and forest fruits 9.2%, to
household forest income. While mushrooms and timber respectively contribute 3% and 1.6%.
To describe the effects of forests income in the distribution of incomes and inequality for the
interviewed households, Gini coefficient, and Lorenz curve are used. The result shows that
forest products can potentially play an important role in reducing inequality in income
distribution among sampled households.
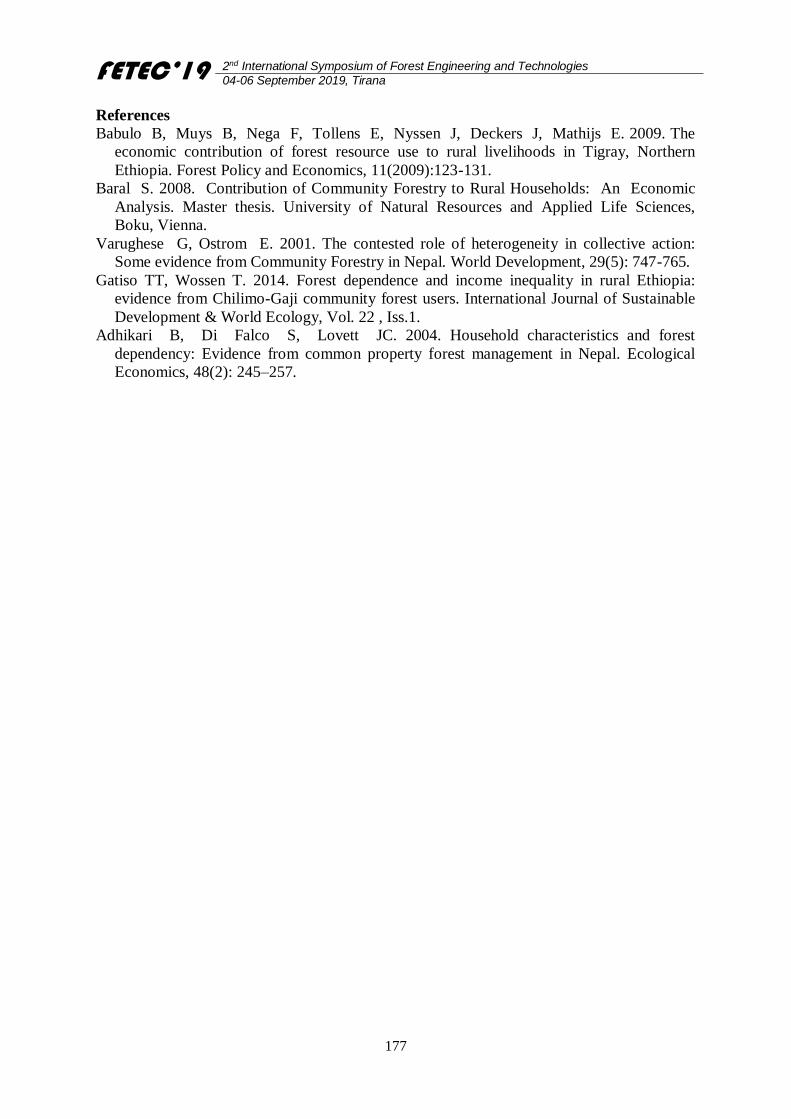
FETEC’19 2nd International Symposium of Forest Engineering and Technologies
04-06 September 2019, Tirana
177
References
Babulo B, Muys B, Nega F, Tollens E, Nyssen J, Deckers J, Mathijs E. 2009. The
economic contribution of forest resource use to rural livelihoods in Tigray, Northern
Ethiopia. Forest Policy and Economics, 11(2009):123-131.
Baral S. 2008. Contribution of Community Forestry to Rural Households: An Economic
Analysis. Master thesis. University of Natural Resources and Applied Life Sciences,
Boku, Vienna.
Varughese G, Ostrom E. 2001. The contested role of heterogeneity in collective action:
Some evidence from Community Forestry in Nepal. World Development, 29(5): 747-765.
Gatiso TT, Wossen T. 2014. Forest dependence and income inequality in rural Ethiopia:
evidence from Chilimo-Gaji community forest users. International Journal of Sustainable
Development & World Ecology, Vol. 22 , Iss.1.
Adhikari B, Di Falco S, Lovett JC. 2004. Household characteristics and forest
dependency: Evidence from common property forest management in Nepal. Ecological
Economics, 48(2): 245–257.
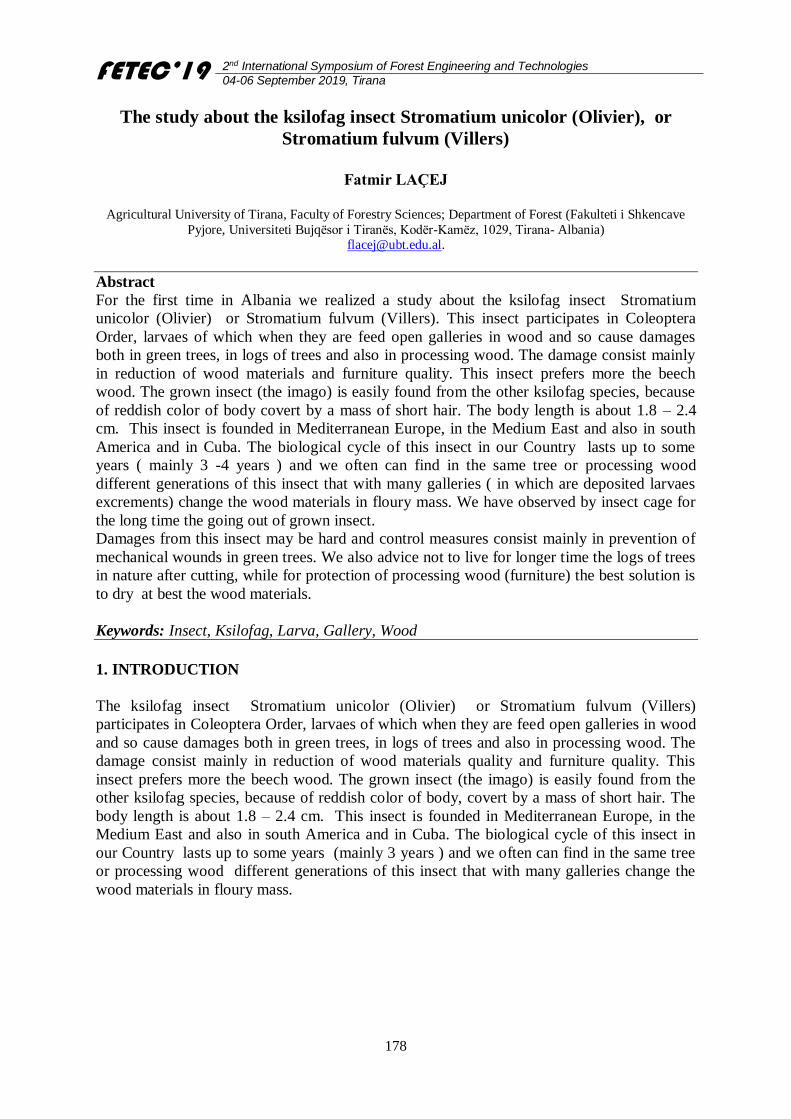
FETEC’19 2nd International Symposium of Forest Engineering and Technologies
04-06 September 2019, Tirana
178
The study about the ksilofag insect Stromatium unicolor (Olivier), or
Stromatium fulvum (Villers)
Fatmir LAÇEJ
Agricultural University of Tirana, Faculty of Forestry Sciences; Department of Forest (Fakulteti i Shkencave
Pyjore, Universiteti Bujqësor i Tiranës, Kodër-Kamëz, 1029, Tirana- Albania) [email protected].
Abstract
For the first time in Albania we realized a study about the ksilofag insect Stromatium
unicolor (Olivier) or Stromatium fulvum (Villers). This insect participates in Coleoptera
Order, larvaes of which when they are feed open galleries in wood and so cause damages
both in green trees, in logs of trees and also in processing wood. The damage consist mainly
in reduction of wood materials and furniture quality. This insect prefers more the beech
wood. The grown insect (the imago) is easily found from the other ksilofag species, because
of reddish color of body covert by a mass of short hair. The body length is about 1.8 – 2.4
cm. This insect is founded in Mediterranean Europe, in the Medium East and also in south
America and in Cuba. The biological cycle of this insect in our Country lasts up to some
years ( mainly 3 -4 years ) and we often can find in the same tree or processing wood
different generations of this insect that with many galleries ( in which are deposited larvaes
excrements) change the wood materials in floury mass. We have observed by insect cage for
the long time the going out of grown insect.
Damages from this insect may be hard and control measures consist mainly in prevention of
mechanical wounds in green trees. We also advice not to live for longer time the logs of trees
in nature after cutting, while for protection of processing wood (furniture) the best solution is
to dry at best the wood materials.
Keywords: Insect, Ksilofag, Larva, Gallery, Wood
1. INTRODUCTION
The ksilofag insect Stromatium unicolor (Olivier) or Stromatium fulvum (Villers)
participates in Coleoptera Order, larvaes of which when they are feed open galleries in wood
and so cause damages both in green trees, in logs of trees and also in processing wood. The
damage consist mainly in reduction of wood materials quality and furniture quality. This
insect prefers more the beech wood. The grown insect (the imago) is easily found from the
other ksilofag species, because of reddish color of body, covert by a mass of short hair. The
body length is about 1.8 – 2.4 cm. This insect is founded in Mediterranean Europe, in the
Medium East and also in south America and in Cuba. The biological cycle of this insect in
our Country lasts up to some years (mainly 3 years ) and we often can find in the same tree
or processing wood different generations of this insect that with many galleries change the
wood materials in floury mass.
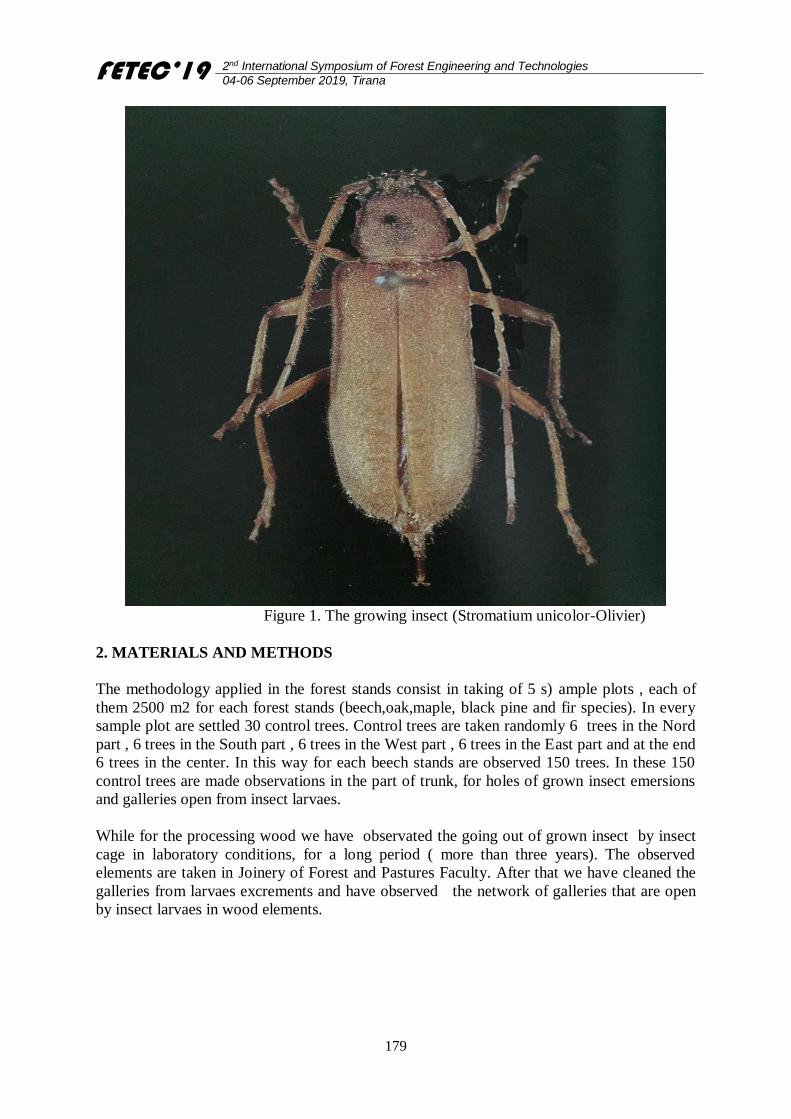
FETEC’19 2nd International Symposium of Forest Engineering and Technologies
04-06 September 2019, Tirana
179
Figure 1. The growing insect (Stromatium unicolor-Olivier)
2. MATERIALS AND METHODS
The methodology applied in the forest stands consist in taking of 5 s) ample plots , each of
them 2500 m2 for each forest stands (beech,oak,maple, black pine and fir species). In every
sample plot are settled 30 control trees. Control trees are taken randomly 6 trees in the Nord
part , 6 trees in the South part , 6 trees in the West part , 6 trees in the East part and at the end
6 trees in the center. In this way for each beech stands are observed 150 trees. In these 150
control trees are made observations in the part of trunk, for holes of grown insect emersions
and galleries open from insect larvaes.
While for the processing wood we have observated the going out of grown insect by insect
cage in laboratory conditions, for a long period ( more than three years). The observed
elements are taken in Joinery of Forest and Pastures Faculty. After that we have cleaned the
galleries from larvaes excrements and have observed the network of galleries that are open
by insect larvaes in wood elements.
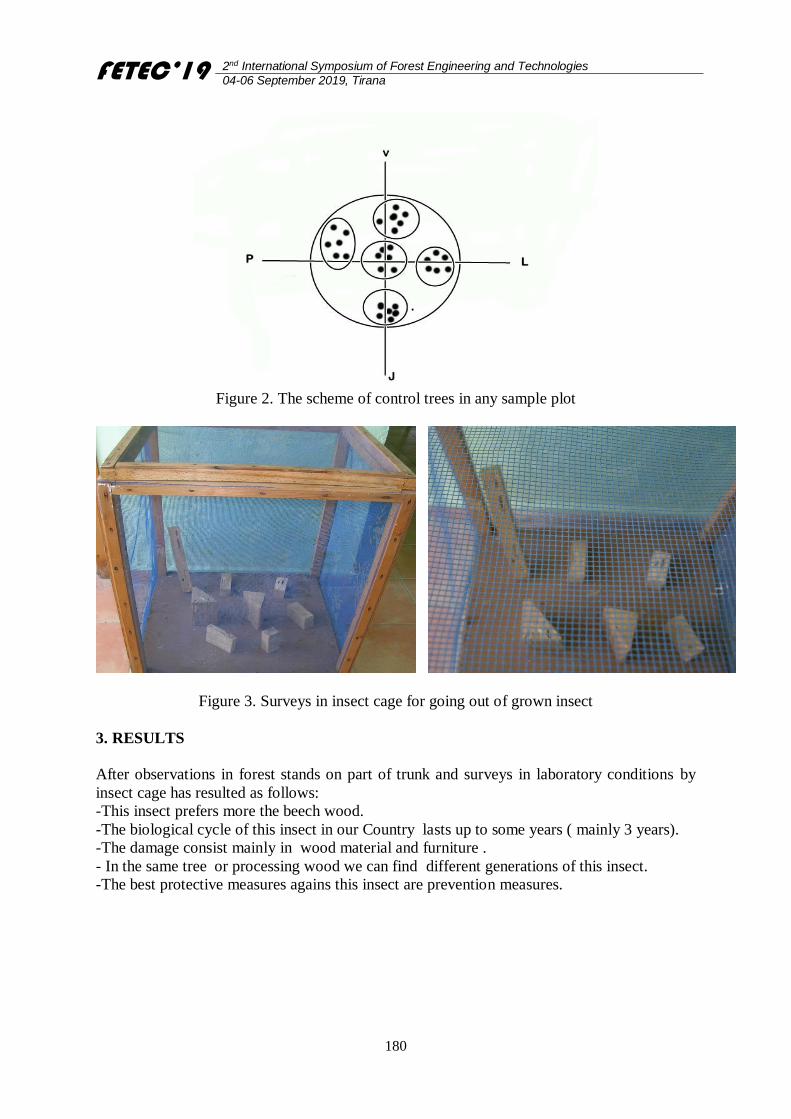
FETEC’19 2nd International Symposium of Forest Engineering and Technologies
04-06 September 2019, Tirana
180
Figure 2. The scheme of control trees in any sample plot
Figure 3. Surveys in insect cage for going out of grown insect
3. RESULTS
After observations in forest stands on part of trunk and surveys in laboratory conditions by
insect cage has resulted as follows:
-This insect prefers more the beech wood.
-The biological cycle of this insect in our Country lasts up to some years ( mainly 3 years).
-The damage consist mainly in wood material and furniture .
- In the same tree or processing wood we can find different generations of this insect.
-The best protective measures agains this insect are prevention measures.
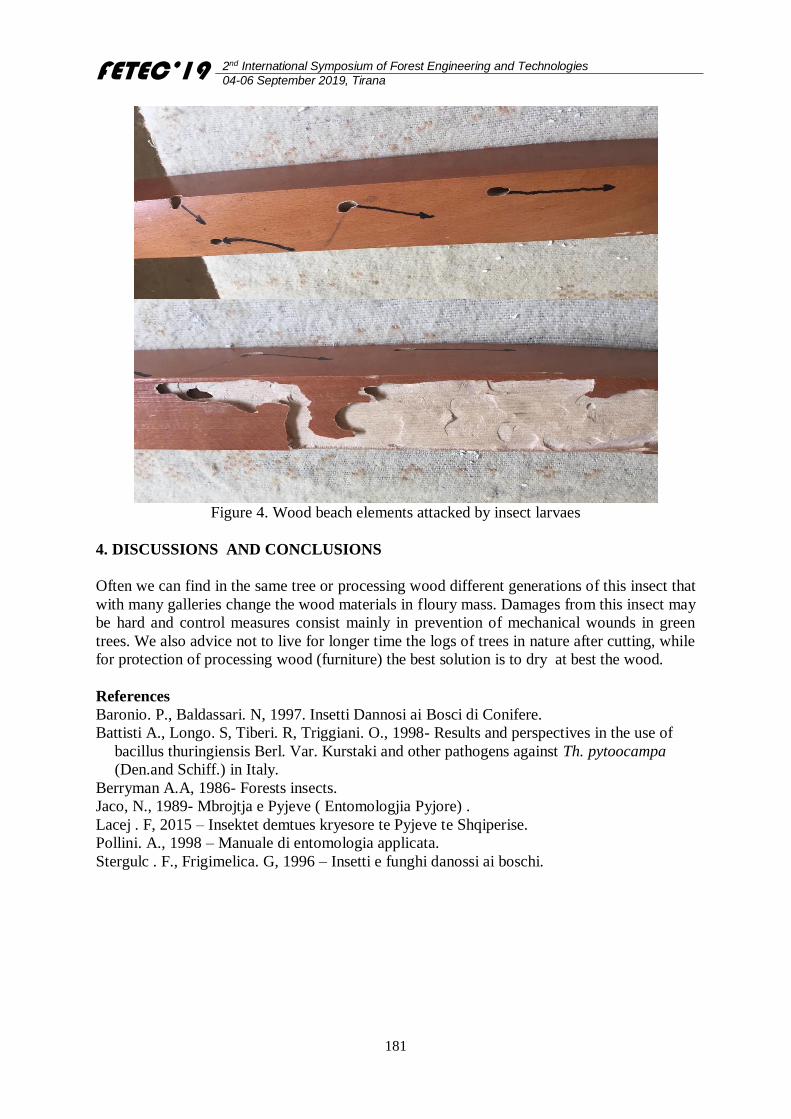
FETEC’19 2nd International Symposium of Forest Engineering and Technologies
04-06 September 2019, Tirana
181
Figure 4. Wood beach elements attacked by insect larvaes
4. DISCUSSIONS AND CONCLUSIONS
Often we can find in the same tree or processing wood different generations of this insect that
with many galleries change the wood materials in floury mass. Damages from this insect may
be hard and control measures consist mainly in prevention of mechanical wounds in green
trees. We also advice not to live for longer time the logs of trees in nature after cutting, while
for protection of processing wood (furniture) the best solution is to dry at best the wood.
References
Baronio. P., Baldassari. N, 1997. Insetti Dannosi ai Bosci di Conifere.
Battisti A., Longo. S, Tiberi. R, Triggiani. O., 1998- Results and perspectives in the use of
bacillus thuringiensis Berl. Var. Kurstaki and other pathogens against Th. pytoocampa
(Den.and Schiff.) in Italy.
Berryman A.A, 1986- Forests insects.
Jaco, N., 1989- Mbrojtja e Pyjeve ( Entomologjia Pyjore) .
Lacej . F, 2015 – Insektet demtues kryesore te Pyjeve te Shqiperise.
Pollini. A., 1998 – Manuale di entomologia applicata.
Stergulc . F., Frigimelica. G, 1996 – Insetti e funghi danossi ai boschi.
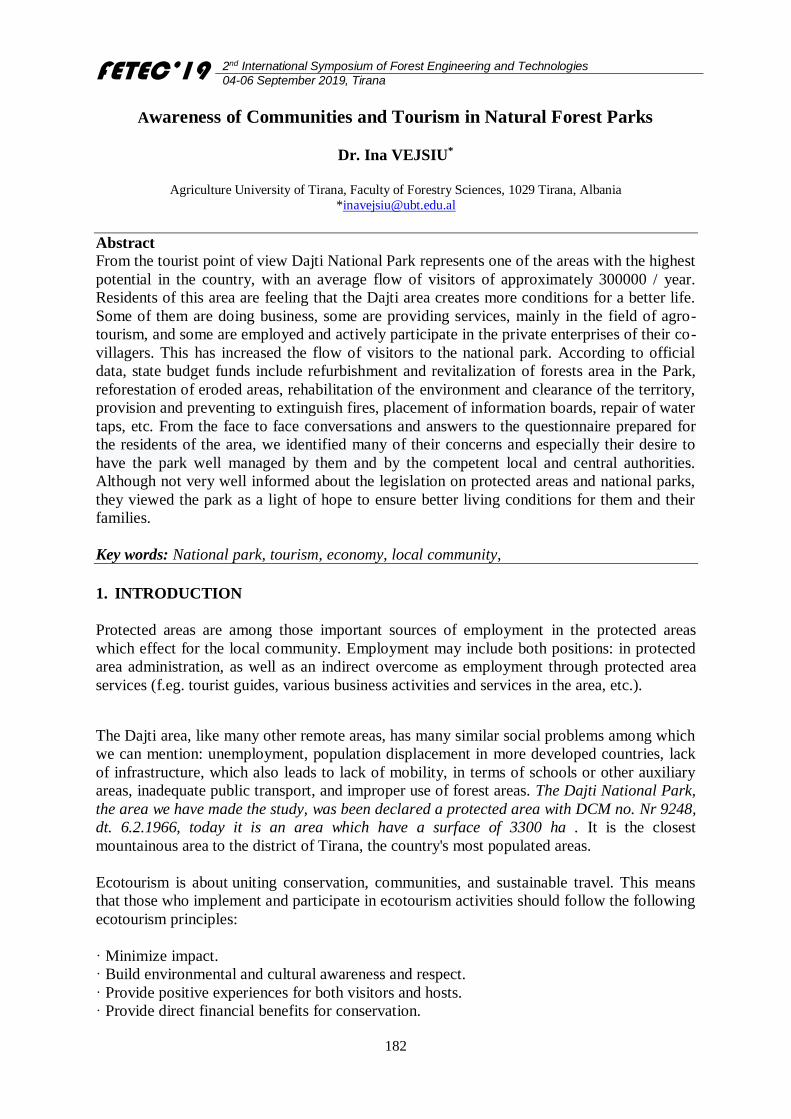
FETEC’19 2nd International Symposium of Forest Engineering and Technologies
04-06 September 2019, Tirana
182
Awareness of Communities and Tourism in Natural Forest Parks
Dr. Ina VEJSIU*
Agriculture University of Tirana, Faculty of Forestry Sciences, 1029 Tirana, Albania
Abstract
From the tourist point of view Dajti National Park represents one of the areas with the highest
potential in the country, with an average flow of visitors of approximately 300000 / year.
Residents of this area are feeling that the Dajti area creates more conditions for a better life.
Some of them are doing business, some are providing services, mainly in the field of agro-
tourism, and some are employed and actively participate in the private enterprises of their co-
villagers. This has increased the flow of visitors to the national park. According to official
data, state budget funds include refurbishment and revitalization of forests area in the Park,
reforestation of eroded areas, rehabilitation of the environment and clearance of the territory,
provision and preventing to extinguish fires, placement of information boards, repair of water
taps, etc. From the face to face conversations and answers to the questionnaire prepared for
the residents of the area, we identified many of their concerns and especially their desire to
have the park well managed by them and by the competent local and central authorities.
Although not very well informed about the legislation on protected areas and national parks,
they viewed the park as a light of hope to ensure better living conditions for them and their
families.
Key words: National park, tourism, economy, local community,
1. INTRODUCTION
Protected areas are among those important sources of employment in the protected areas
which effect for the local community. Employment may include both positions: in protected
area administration, as well as an indirect overcome as employment through protected area
services (f.eg. tourist guides, various business activities and services in the area, etc.).
The Dajti area, like many other remote areas, has many similar social problems among which
we can mention: unemployment, population displacement in more developed countries, lack
of infrastructure, which also leads to lack of mobility, in terms of schools or other auxiliary
areas, inadequate public transport, and improper use of forest areas. The Dajti National Park,
the area we have made the study, was been declared a protected area with DCM no. Nr 9248,
dt. 6.2.1966, today it is an area which have a surface of 3300 ha . It is the closest
mountainous area to the district of Tirana, the country's most populated areas.
Ecotourism is about uniting conservation, communities, and sustainable travel. This means
that those who implement and participate in ecotourism activities should follow the following
ecotourism principles:
· Minimize impact.
· Build environmental and cultural awareness and respect.
· Provide positive experiences for both visitors and hosts.
· Provide direct financial benefits for conservation.
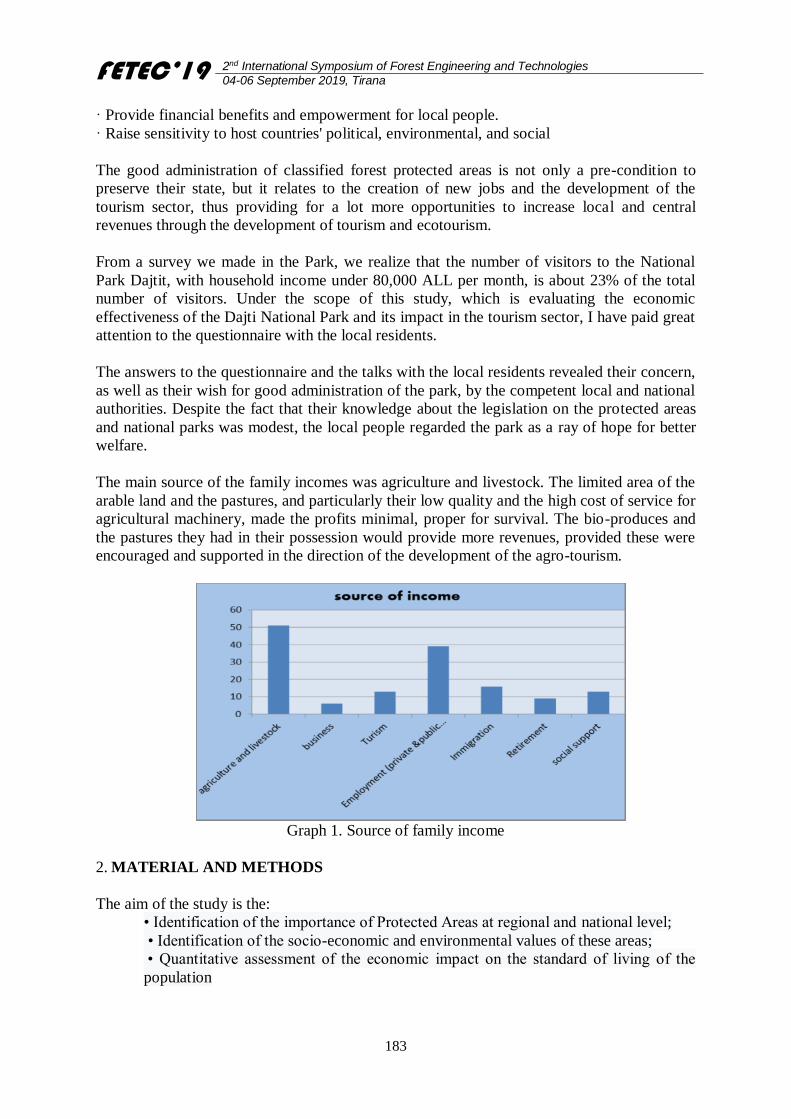
FETEC’19 2nd International Symposium of Forest Engineering and Technologies
04-06 September 2019, Tirana
183
· Provide financial benefits and empowerment for local people.
· Raise sensitivity to host countries' political, environmental, and social
The good administration of classified forest protected areas is not only a pre-condition to
preserve their state, but it relates to the creation of new jobs and the development of the
tourism sector, thus providing for a lot more opportunities to increase local and central
revenues through the development of tourism and ecotourism.
From a survey we made in the Park, we realize that the number of visitors to the National
Park Dajtit, with household income under 80,000 ALL per month, is about 23% of the total
number of visitors. Under the scope of this study, which is evaluating the economic
effectiveness of the Dajti National Park and its impact in the tourism sector, I have paid great
attention to the questionnaire with the local residents.
The answers to the questionnaire and the talks with the local residents revealed their concern,
as well as their wish for good administration of the park, by the competent local and national
authorities. Despite the fact that their knowledge about the legislation on the protected areas
and national parks was modest, the local people regarded the park as a ray of hope for better
welfare.
The main source of the family incomes was agriculture and livestock. The limited area of the
arable land and the pastures, and particularly their low quality and the high cost of service for
agricultural machinery, made the profits minimal, proper for survival. The bio-produces and
the pastures they had in their possession would provide more revenues, provided these were
encouraged and supported in the direction of the development of the agro-tourism.
Graph 1. Source of family income
2. MATERIAL AND METHODS
The aim of the study is the:
• Identification of the importance of Protected Areas at regional and national level;
• Identification of the socio-economic and environmental values of these areas;
• Quantitative assessment of the economic impact on the standard of living of the
population
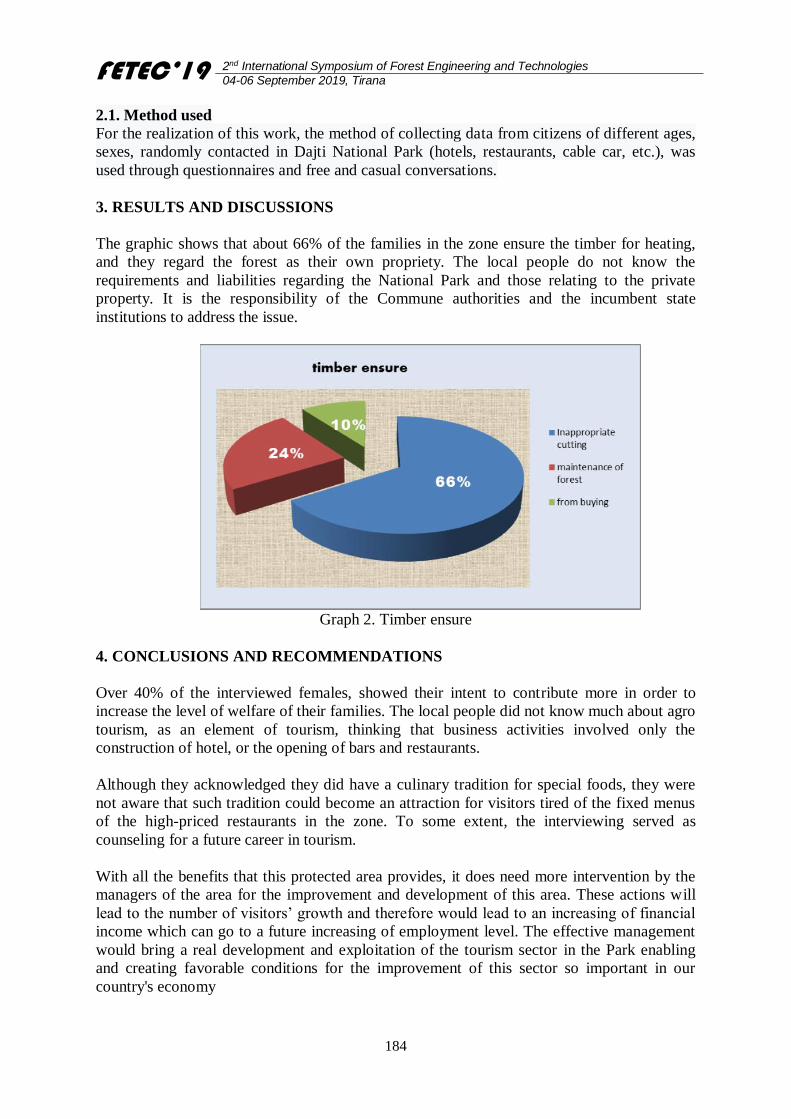
FETEC’19 2nd International Symposium of Forest Engineering and Technologies
04-06 September 2019, Tirana
184
2.1. Method used
For the realization of this work, the method of collecting data from citizens of different ages,
sexes, randomly contacted in Dajti National Park (hotels, restaurants, cable car, etc.), was
used through questionnaires and free and casual conversations.
3. RESULTS AND DISCUSSIONS
The graphic shows that about 66% of the families in the zone ensure the timber for heating,
and they regard the forest as their own propriety. The local people do not know the
requirements and liabilities regarding the National Park and those relating to the private
property. It is the responsibility of the Commune authorities and the incumbent state
institutions to address the issue.
Graph 2. Timber ensure
4. CONCLUSIONS AND RECOMMENDATIONS
Over 40% of the interviewed females, showed their intent to contribute more in order to
increase the level of welfare of their families. The local people did not know much about agro
tourism, as an element of tourism, thinking that business activities involved only the
construction of hotel, or the opening of bars and restaurants.
Although they acknowledged they did have a culinary tradition for special foods, they were
not aware that such tradition could become an attraction for visitors tired of the fixed menus
of the high-priced restaurants in the zone. To some extent, the interviewing served as
counseling for a future career in tourism.
With all the benefits that this protected area provides, it does need more intervention by the
managers of the area for the improvement and development of this area. These actions will
lead to the number of visitors’ growth and therefore would lead to an increasing of financial
income which can go to a future increasing of employment level. The effective management
would bring a real development and exploitation of the tourism sector in the Park enabling
and creating favorable conditions for the improvement of this sector so important in our
country's economy

FETEC’19 2nd International Symposium of Forest Engineering and Technologies
04-06 September 2019, Tirana
185
References
M.Dida, N.Dragoti, G.Kromidha, Gj. Fierza, Tiranë. 2004. Protected Areas and National
Parks
Nigel Dudle- Guidelines for Applying Protected Area Management Categories, IUCN.
International Development Association (IDA) DHV Agriculture and Natural Resources BV,
në bashkëpunim me Halcrow Rural Management, UK dhe DIAVA, Shqipëri. 2004. Dajti
National Park Administration Plan Tirana Prefecture
Deborah Rezzoagli. 2005. Community Based Tourism development and environmental
protection in Albania. The CISP experience in the Butrint National Park, Greater Area,
CISP European Programmes\Dajti Express. Rome.