Forests and Drugs: Coca-Driven Deforestation in Tropical Biodiversity Hotspots

(This is a sample cover image for this issue. The actual cover is not yet available at this time.)
This article appeared in a journal published by Elsevier. The attachedcopy is furnished to the author for internal non-commercial researchand education use, including for instruction at the authors institution
and sharing with colleagues.
Other uses, including reproduction and distribution, or selling orlicensing copies, or posting to personal, institutional or third party
websites are prohibited.
In most cases authors are permitted to post their version of thearticle (e.g. in Word or Tex form) to their personal website orinstitutional repository. Authors requiring further information
regarding Elsevier’s archiving and manuscript policies areencouraged to visit:
http://www.elsevier.com/copyright

Author's personal copy
Forest cover and deforestation patterns in the Northern Andes (Lake MaracaiboBasin): A synoptic assessment using MODIS and Landsat imagery
C.A. Portillo-Quintero a,*, A.M. Sanchez b, C.A. Valbuena b, Y.Y. Gonzalez b, J.T. Larreal a
aCentro de Estudios Botánicos y Agroforestales, Instituto Venezolano de Investigaciones Científicas, Apdo. 21827, Maracaibo, VenezuelabDepartamento de Biología, Facultad Experimental de Ciencias, La Universidad del Zulia, Maracaibo, Venezuela
Keywords:Tropical forestsLake Maracaibo BasinMODISDeforestation ratesNested samplingLandsat
a b s t r a c t
This work synthesizes results from the application of land cover classification techniques and probabilitysampling of satellite imagery for estimating forest extent and deforestation in Lake Maracaibo Basin(Venezuela and Colombia). A forest map was produced using a semi-automated supervised classificationroutine on MODIS 8-day 500-m imagery acquired in January 2010. Results show that forests occupy29,710 km2 which represents 38% of the basin’s total terrestrial landmass. From this extent, 61% belongsto Venezuela and 39% falls within the Colombian region. Findings indicate a drastic decrease in forestcover as a result of anthropogenic agricultural and urban expansion, especially when compared to itspotential extent within the ‘Maracaibo dry forests’ and the ‘Venezuelan Andean montane forests’ ecor-egions. Using time series of Landsat imagery, deforestation rates for the 1985e2010 time period werecalculated. The analysis was performed on 24 samples blocks of 10 � 10 km2 randomly allocated withinpreviously defined change probability strata. The general spatial distribution of deforestation rates waspredicted by a simple regression model between sample blocks and prior change probabilities at thebasin scale. Our results indicate that deforestation was low (<0.5%/y) in 85% of the basin, with highlyfocalized deforestation fronts (intermediate-to-high rates, <2.5%/y) in three regions: a) the Motatán riversub-basin in the Eastern Cordillera, b) the lower slopes of the Catatumbo river sub-basin and c) thesubmontane regions of the Apón and Santa Ana river sub-basins. The results of this paper lead the wayfor understanding current patterns in socioeconomic drivers of forest clearing in Lake Maracaibo Basin.The study also demonstrates the feasibility of using alternatives methods to the time-consuming andfinancially unsustainable methods traditionally used at national and sub-national scale in Venezuela andother Latin American countries.
� 2012 Elsevier Ltd. All rights reserved.
Introduction
Tropical deforestation has several deleterious effects includingspecies loss, soil erosion, siltation of streams and desestabilizationof watersheds as well as socioeconomic and cultural consequences(Laurance & Bierregaard, 1997; Peres, 2011). It also leads to higheremissions of CO2 and higher loss of carbon stock and is thought tobe a major contributor of greenhouse gas emissions in the world(Achard et al., 2010). Its rapid pace is a major concern for humansocieties around the world.
Data from the Forest and Agricultural Organization (FAO)reports an approximate global annual change in forest areaof �52,110 km2/y for the period 2000e2010, ranging from �4100to �39,970 km2/yr across regions of the world (FAO, 2011). This
information comes from per country annual deforestation ratesprovided by national environmental agencies. These deforestationrates have been tremendously valuable in providing information onglobal, regional and intraregional trends in forest loss.
Comparatively to other parts of world, Latin American countrieshave experienced the highest tropical deforestation rates duringthe last decade. According to FAO (2011), forest cover change during2000e2010 in Central America and South American (SA) countrieswas estimated at �1.2% and �0.5% annual rates respectively,compared to �0.49% annual rate in Africa, þ0.19% in Asia and thePacific region, þ0.03% in North America, and þ0.09% in Europe.Tropical countries (Colombia, Venezuela, Ecuador, Brazil, Boliviaand Peru) account for 90% of total deforestation in SA. The highestdeforestation rates are found in Ecuador and Venezuela (�1.8 and0.6% annual rates, respectively), followed by Bolivia (�0.5%), Brazil(�0.5%), Colombia (�0.2%) and Peru (�0.2%). In Central America,the highest deforestation rates are found in Honduras (�2.1%),Nicaragua (�2.0%), Guatemala (�1.4%) and El Salvador (�1.4%).
* Corresponding author.E-mail address: [email protected] (C.A. Portillo-Quintero).
Contents lists available at SciVerse ScienceDirect
Applied Geography
journal homepage: www.elsevier .com/locate/apgeog
0143-6228/$ e see front matter � 2012 Elsevier Ltd. All rights reserved.http://dx.doi.org/10.1016/j.apgeog.2012.06.015
Applied Geography 35 (2012) 152e163

Author's personal copy
These estimates are often used to evaluate differences and simi-larities among socioeconomic drivers of forest cover change(Forner, Blaser, Jotzo, & Robledo, 2006; Laurance, 1999). For inter-national agencies and NGOs, this information is used to encouragespecific national environmental agencies to reinforce operationalstrategies dedicated to stabilize or reduce elevated deforestationrates in their countries.
However, in the case of Venezuela e the country with secondhighest deforestation rate in South America according to FAO(2011) e national deforestation estimates rely on reports thathave been questioned by independent research teams. GlobalForest Watch (2002, p. 134), Pacheco-Angulo, Aguado Suarez, andMollicone (2011) and FAO/JRC (2011) explain that these estimatesare derived from forecasts based on outdated forest cover data fromthe 70s and early 80s. The Global ForestWatch (2002, p. 134) reporton the state of Venezuela’s forests emphasizes the lack of clarityand transparency regarding methodologies and source data used.National and sub-national estimates from Venezuelan nationaldatabases (at the province or ecoregional level) have the sameinconsistencies. Consequently, using this data for understandingtrends in deforestation rates within Venezuela might lead decisionmakers to inaccurate conclusions on the future of its forests andtherefore, should be interpreted with caution.
Accurate and consistent forest cover data and estimates of GHGemissions from tropical deforestation have been urged by theUnited Nations Framework Convention on Climate Change(UNFCCC) and the UNCBD Strategic Plan for Biodiversity2011e2020. One of the technical issues emphasized at UNFCC onthe issue of reducing emissions from deforestation and degradation(REDD), is that all estimates should be transparent, consistent andas accurate as possible, as well as open to independent review(Achard et al., 2010; Eckert, Ratsimba, Rakotondrasoa, Rajoelison, &Ehrensperger, 2011).
Satellite remote sensing has played an important role ingenerating more accurate and reliable information about forestcover, vegetation type and land use changes. Tucker andTownshend (2000) state that remote sensing procedures adoptedby scientific teams across the globe, have achieved high accuraciesthrough a combination of the use of high-resolution satellite data,integration of automated methods and human interpreters. Suchprocedures and technical capabilities have advanced since the early1990s and standardized operational forest monitoring systems atthe national and sub-national level are now a feasible goal for mostdeveloping countries (DeFries et al., 2007).
The application of automated land cover classification tech-niques using high resolution andmoderate resolution imagery havegreatly improved our knowledge of forest extent at global, regionaland local scales since the 1970’s (Eva et al., 2004; Fuller, 2006;Portillo-Quintero & Sánchez-Azofeifa, 2010). Techniques includeunsupervised and supervised classification using clustering algo-rithms (e.g. isodata, maximum likelihood classifier) and non-parametrical methods such as machine learning, supported byground-truth information from high-resolution imagery, aerialphotography or field data collection (Jensen, 2007).
Regarding deforestation mapping, one of the most practical androbust methodologies applied today is the probability sampling ofsatellite imagery (Achard et al., 2010; DeFries et al., 2007; Stehman,Sohl, & Loveland, 2003). Probability sampling relies on theassumption that deforestation events are not randomly distributedin space, and therefore, particular attention is needed to ensure thatthe statistical design is adequately sampled within areas ofpotential deforestation (Achard et al., 2007). Comparatively towall-to-wall or complete coverage approaches, probability sampling ofsatellite imagery is preferred because is less expensive, it hasa smaller classification error bias and allows for timelier reporting
of results (Stehman et al., 2003). Achard et al. (2002) developeda statistical sampling strategy using satellite imagery to providea reliable measurement of change in tropical forests in a uniform,independent and repeatable manner. In this approach, also knownas a ‘nested sampling approach’, wall-to-wall coarse resolution datais used to produce a deforestation risk map (indicating spatialtrends in forest loss probabilities), which is later categorized in riskstrata. Sample sites among strata are then randomly selected usinga stratified sampling method. Finally, deforestation is calculated foreach sample site using time-series of high resolution data(20e30 m spatial resolution). This approach has been applied inseveral studies at the global (Hansen, Stehman et al., 2008),regional (Broich, Stehman, Hansen, Potapov, & Shimabukuro, 2009;Hansen, Shimabukuro, Potapov, & Pittman, 2008; Potapov, Hansen,Stehman, Loveland, & Pittman, 2008; Stehman, Hansen, Broich, &Potapov, 2011), national (Hansen, Shimabukuro et al., 2008;Hansen et al., 2009) and sub-national level (Broich et al., 2011). Forits global assessments, the Global Forest Resource Assessment ledby FAO, has begun to estimate forest change for the periods1990e2000e2005 based on samples of high-resolution satelliteimagery (e.g. Landsat TM, ETMþ, ASTER) in order to complementnational reports (FAO/JRC, 2011).
In South America, systematic monitoring systems based ona similar nested sampling approach have only been developed bythe Brazilian National Space Agency (INPE) for the Legal Amazonthrough a comprehensive annual national monitoring programcalled PRODES. The Brazilian PRODES monitoring system for theBrazilian Amazon uses a hot-spot approach to identify ‘criticalareas’ based on the previous year’s monitoring (INPE, 2006). These‘critical areas’ are priorities for analysis in the following year to beused as samples for high resolution deforestation mapping usingLandsat imagery.
For Venezuela and other developing countries in South America,the implementation of a standardized national deforestationmonitoring system in a cost-effective and efficient manner is athand, but the feasibility of a nested sampling design has only beenaddressed within the Brazilian Legal Amazon (BLA) area. Opera-tional strategies and technical issues outside the BLA might have totake into account differences in the availability of ancillary infor-mation and the uniqueness of local geomorphological andbiophysical characteristics of the Andean and Llanos bioregions.
The purpose of this study was to quantify forest extent anddeforestation rates using a combination of remote sensing and GIStechniques applied at the sub-national level in Venezuela and toidentify challenges and needs in the process of designing andimplementing a forest monitoring system in Venezuela. The studyfocuses within the limits of the Lake Maracaibo Basin (LMB), one ofthe country’s most degraded regions in terms of the historicalanthropogenic pressure posed on local dry and humid forests(Bisbal, 1988; Llamozas et al., 2003, p. 555; Olson & Dinerstein,2002; Rodríguez, Rojas-Suárez, & Hernández, 2010, p. 324).
Methods
Study area
Lake Maracaibo Basin, VenezuelaThe Lake Maracaibo Basin (LMB) is a large coastal depression
located between the 9� and 12� N and the 70� and 72� W in north-western Venezuela and north-eastern Colombia (Fig. 1). The regionis flanked by the bifurcation of the Andean Cordillera in northernSouth America and extends for approximately 121.823 km2
(Medina & Barboza, 2006; Rivas et al., 2005). Topographic relief isvariable across the basin, and it reaches altitudes of 3000 to 5000min the western and eastern flanks of the Andean cordilleras. Fig. 1
C.A. Portillo-Quintero et al. / Applied Geography 35 (2012) 152e163 153

Author's personal copy
shows the relative location of the study area and the geographicaldistribution of its topographical relief. The cordilleras act as naturalbarrier to winds coming from the northeeast, creating differentprecipitation and evapotranspiration conditions that range from
arid, to semiarid, to humid environments in a north-south direction(Medina & Barboza, 2006). The region is known for being one of thelargest crude oil reservoirs in Venezuela, which has been inten-sively exploited since the beginning of the twentieth century. The
Fig. 1. Study area in western Venezuela: Lake Maracaibo Basin (LMB). The LMB is formed by fifteen river sub-basins which drain into the lake. Each sub-basin is labeled with itsname. The dotted line indicates international boundaries between Colombia and Venezuela within the LMB. Shades of grey show altitude ranges within the LMB (0 m above sealevel ¼ black; >5000 m above sea level ¼ white).
C.A. Portillo-Quintero et al. / Applied Geography 35 (2012) 152e163154

Author's personal copy
lake itself and the lowland plains contain more than 5000 oil wellsand 20,000 km of oil pipes (Gardner, Cavaletto, Bootsma,Lavrentyev, & Troncone, 1998).
Deciduous forest formations in the LMB, also known as the‘Maracaibo Dry forests’ ecoregion, once dominated the colluvio-alluvial lowlands surrounding the lake, but little is left after 60years of human intervention. The area is now mostly dominated bycattle ranching, agricultural activities, infrastructure for the oilindustry, residential areas andurbanisms (WWF, 2002). Several smallto large remnantsof submontaneandmontane forests aredistributedalong the western (Perijá mountains) and south-eastern cordilleras(Mérida cordillera) surroundedby populations of small andmedium-size-farm landholders that produce a diversity of crops (from vege-tables to plantain and coffee plantations). Moist forests can be foundin the south-western region of the basin, along the Colombian-Venezuelan international border, in the valley of the Catatumboriver. Also knownas the ‘Catatumbomoist forests’ ecoregion, the corearea of these forests surround the lower slopes and lowlands of thePerijá andMérida cordilleras. These are considered among the richestinfloral diversity inhumid tropical forests ofVenezuela andColombia(Viloria, 2002, p. 220; WWF, 2002).
Historical forest cover data for the LMB dates back to the 1920’swhen the first vegetationmap of Venezuelawas published byHenriPittier (Pacheco-Angulo et al., 2011; Rodríguez et al., 2010, p. 324).The phytogeographical maps of Venezuela, as well as the HoldridgeLife zone maps contributed to have a better knowledge of the forestdistribution in the basin, but it was not until the early 80s thatforest cover was mapped by visual interpretation of satelliteimagery and aerial photography at 1:250,000 scale or less. Recently,Rodríguez et al. (2010, p. 324) published an updated map of vege-tation of Venezuela using the same techniques, and added infor-mation on the national and local trends of forest loss through thecomparison of historical maps using coarse resolution datasets.Prior to the work presented in this paper, there are no studies onforest cover and deforestation at the scale of the LMB. Its forestcover has only been assessed as part of national inventories and fewindependent studies at the landscape level.
Forest cover mapping
Satellite imageryIn 1998, NASA launched the first Moderate Resolution Imaging
Spectroradiometer (MODIS) providing improved capabilities forterrestrial satellite remote sensing aimed at meeting the needs ofglobal change research (Justice et al., 1998). The design of the landimaging component combines characteristics of the AVHRR and theLandsat Thematic Mapper sensors, adding spectral bands in themiddle and long-wave infrared (IR) and providing a spatial reso-lution of 250 m, 500 m and 1-km global coverage on a near dailyimaging capability. The MODIS sensor is a key instrument aboardthe Terra (EOS AM) and Aqua (EOS PM) satellites providing globalsurface reflectance data on a near-daily basis through the LandProcesses Distributed Active Archive Centere LPDAACwebsite (Giri& Jenkins, 2005).
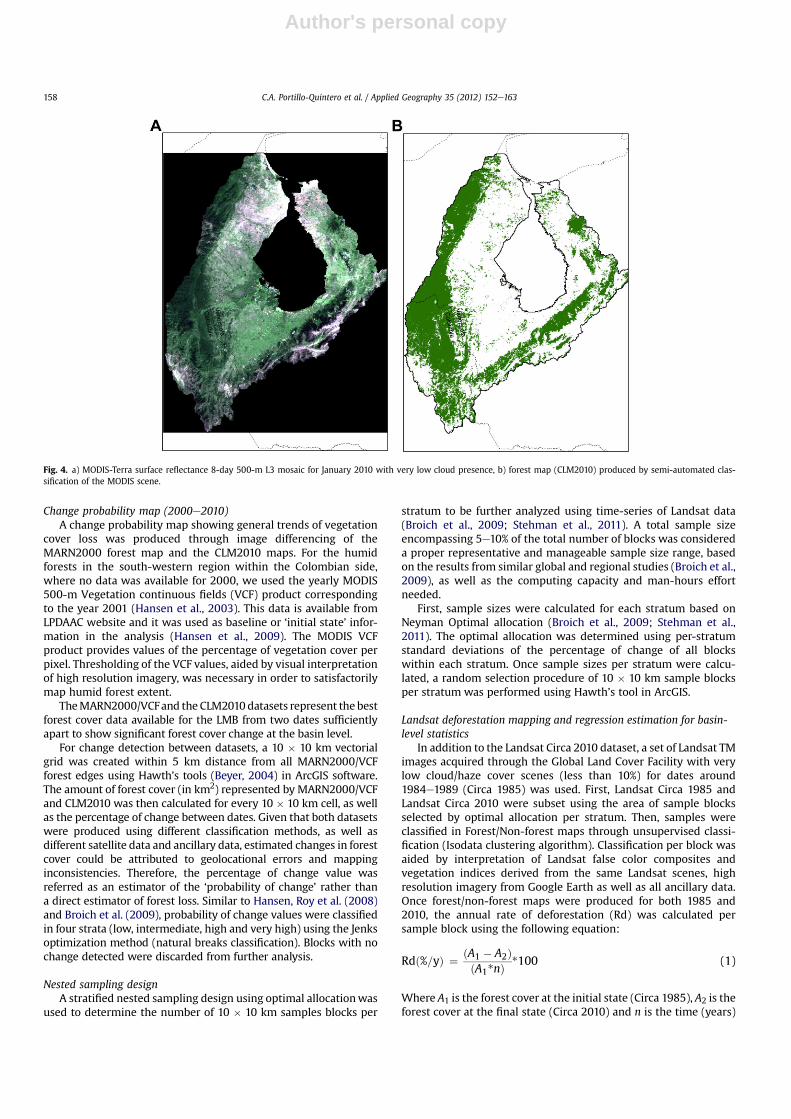
The imagery used for this analysis included the first seven bandsfrom MODIS-Terra surface reflectance 8-day 500-m L3 Globalcomposites data. This MODIS 8-day product provides Bands 1e7 at500-m resolution in an 8-day gridded level-3 product in theSinusoidal projection. Each pixel contains the best possible obser-vation during an 8-day period as selected on the basis of highobservation coverage, low view angle, the absence of clouds orcloud shadow, and aerosol loading. We selected tiles h10/v07, h10/v08, h11/v07 and h11/v08 from the first week of January 2010, atthe beginning of the dry season, due to very low cloud presence(Fig. 4a). An additional MODIS dataset was needed in order to
successfully identify seasonally dry forests. The dataset consistedon a time-series of 240mosaics of MODIS Vegetation Indices 16-dayL3 Global 250 m product (tiles h10/v07, h10/v08, h11/v07 and h11/v08) from January 2001 to January 2010. Mosaicking and repro-jection to UTM19/Datum WGS84 was performed using the MODISReprojection Tool (available from http://lpdaac.usgs.gov/).
Landsat TM and ETM þ imagery (Level 1T e terrain corrected)was acquired through the Global Land Cover Facility (http://www.landcover.org) with very low cloud/haze cover (less than 10%) foracquisition dates ranging from 2008 to 2011 (Circa 2010). A total ofnine Landsat satellite scenes (p006/r052; p006/r053; p006/r054;p007/r052; p007/r053; p007/r054; p008/r052; p008/r053; p008/r054) were necessary in order to cover the study area. This datawasused as supporting land cover information at higher resolution forthe automated classification of MODIS imagery and also, forcalculating deforestation rates in Section 2.3.
Ancillary dataDigital hydrographic information for geographic information
systems (GIS) was obtained from the USGS’s HydroSHEDS database(http://hydrosheds.cr.usgs.gov) in order to define the geographicallimits of the LMB. Geographical information on the ecoregionallimits within the basin between tropical humid and dry forests wasobtained from the WWF terrestrial ecoregions GIS database(available at www.worldwildlife.org). The WWF ecoregions data-base is a result of the exploration of existing global maps of floristic,zoogeographic provinces and broad vegetation types, and theconsultation of regional experts (Olson et al., 2001). Additionalsupporting information on forest extent at 1:250,000 was availablefrom a National GIS database of land use and land cover completedin 2007 (known as the MARNOT project) and distributed by theVenezuelan Ministry of Environment and Natural Resources(MARN) (Rodríguez et al., 2010, p. 324). Although there is noinformation available on the acquisition dates of the imagery usedin this project, different sources indicate that most of the nationaldatabase was produced by visual interpretation of SPOT, LandsatTM and MSS imagery of 1988 and 1995 with updated informationusing imagery from 2000 to 2001 (FRA, 1999; Olea, 2008; Pacheco-Angulo et al., 2011; Rodríguez et al., 2010, p. 324). This dataset willbe referred as the MARN2000 forest map.
Semi-automated classification methodsA supervised imagery classification methodology was imple-
mented in order to map forests, agriculture (pastures and crops),and urban land cover types for the entire study area. Locationsrepresenting land cover types were identified by interpretation ofLandsat RGB 453 false color composites (Circa 2010) and vegetationindices derived from the same Landsat scenes. Criteria used for theinterpretation of Landsat false-color composites is based onknowledge gained from several field visits to humid and dry forestslandscapes of the south-western, north-eastern and Andeanregions of Lake Maracaibo Basin. These were carried out during the2009e2011 time period. Field observations of xeric scrub and dryforest were achieved by traveling in paved and unpaved roadswithin the Machango-Pueblo Viejo sub-basins and the Falcón-Zuliahighway in the eastern coast of Lake Maracaibo. Field observationsof humid forest landscapes were made across the panamericanhighway in the Trujillo, Merida, Táchira State and Zulia State(Colón-La Fría). For each type of landscape, shades of color repre-senting the spectral response of forest, pasture, urban and agri-cultural land cover in RGB 453 false color composites, wereidentified. Training sites for every land cover type were then digi-talized over a mosaic of RGB 453 Landsat composites. A total of3983 geographical locations of different land cover types over thestudy area were collected.
C.A. Portillo-Quintero et al. / Applied Geography 35 (2012) 152e163 155

Author's personal copy
A 500 � 500 m vectorial grid was used in order to choose loca-tions representing forests at the minimummapping unit of MODIS.The high-resolution imagery available for visualization on GoogleEarth (http://earth.google.com) was helpful for the collection oftraining sites.
In Venezuela, tropical forests are officially defined as ‘nativeforests’, represented by forest vegetation established by means ofnatural ecological succession, with at least 10% occupied bya canopy of trees, and a minimum area of 0.1 ha (National ForestManagement Law, 2008). The ‘Forest estate’ definition in thissame law, however, includes not only native forests but alsoforest plantations, trees outside forests and vegetation associatedto natural forests (e.g. secondary growth). In order to meet thesecriteria, the identification of training sites involved the repre-sentation of forest dominated landscapes in LMB with theexception of forest plantations for commercial use. The ‘forest’concept used in this study includes native forests, secondarygrowth and closed canopy layers formed by standing trees withno understory as a result of human intervention. The types offorested landscapes represented by training sites are exemplifiedin Fig. 2.
A maximum likelihood algorithm was used to classify the2010 MODIS scene mosaic (Fig. 4a), based on the spectralsignatures derived from training sites. Once general land covertypes were satisfactorily classified, further separation of spectralmixture for identifying riparian forests in urban and agriculturallandscapes was achieved through unsupervised classification(Isodata) of the MODIS scene within the agricultural and urbanmasks.
For successfully identifying medium-size and small-sizeseasonally dry forests fragments within the matrix of agricul-tural, riparian and xeric scrub vegetation in the lowland plains;a preliminary vegetation map was produced using unsupervisedclassification of a cloud-free Landsat ETM þ p007/r053 scene fromMarch 2003 within the ‘Maracaibo dry forest’ ecoregion. This mapwas used as a potential vegetation map within the dry forestecoregion. Based on the definition from Sanchez-Azofeifa et al.,(2005) of dry forest e tropical forest where at least 50% of treespresent are drought deciduous e a method for identifyingphenological patterns within the potential vegetation map wasapplied. The method consisted in calculating the standard devia-tion of Enhanced Vegetation Index (EVI) values from the2001e2010 time-series of MODIS Vegetation Indices within thepotential vegetation mask. The method allowed discriminatinghighly seasonal ecosystems from evergreen riparian and xericscrub vegetation by thresholding standard deviation values.Thresholding was assisted by the use of higher resolution imageryfrom Google Earth and interpretation of Landsat Circa 2010 false-color composites. The resultant dry forest layer was added to thefinal forest map.
A final step of exhaustive cross-checking of the produced mapfor inconsistencies (areas of obvious misclassification) using theMODIS imagery and all the ancillary data and high resolutionimagery available, was necessary. Where needed, we performedmanual recoding and vectorial digitalization of misclassified pixels.Additionally, for the final map, we considered a minimummappingunit of 100-ha (1-km2) as a conservative threshold in order to avoidincluding small isolated pixels arisen due to artifacts of the
Fig. 2. Types of forested landscapes considered ‘forest estate’ by the National Forest Management Law in Venezuela as seen from high resolution imagery: a) continuous nativeforests, b) mosaic of native and secondary growth forest, c) secondary growth and native forests in agricultural matrices. Images represent 500 � 500 m forested landscapes whichcorresponds to the spatial resolution of MODIS imagery used in this study.
C.A. Portillo-Quintero et al. / Applied Geography 35 (2012) 152e163156

Author's personal copy
classification method and the quality of the imagery and ancillarydata. For practical purposes, the forest map produced using thismethodology will be referred as the CLM2010 forest map.
ValidationWe collected an independent sample of 221 points representing
forests and non-forest sites from the Landsat Circa 2010 dataset andGoogle Earth high-resolution imagery. The areas selected for thevalidation included forested landscapes with combinations of largecontinuous and highly fragmented tracts of forests. The selectionwas carried out by overlaying a 1 km� 1 km grid over each Landsatscene and generating points randomly within cells that repre-sented 100% forest and 100% non-forest coverage. This approachwas applied in order to reduce the probability of errors typicallyderived from comparing coarse-scale resolution data to higher-resolution data (Foody, 2002). Finally, we constructed an error orconfusion matrix by comparing the tropical dry forest final map to
the validation points (Congalton, 1991; Foody, 2002; Stehman &Czaplewski, 1998). The result allowed us to estimate of overallaccuracy of the map.
Sampling design to quantify deforestation rates
The methodology applied for quantifying deforestation rates isadapted from the work published by Achard et al. (2002), Hansen,Roy et al. (2008), Hansen, Shimabukuro et al. (2008), Hansen,Stehman et al. (2008), Hansen et al. (2009), Broich et al. (2009)and Stehman et al. (2011). The method consists of three steps: i)derivation of a change probability map showing general trends offorest loss, ii) statistical design for selecting 10 � 10 km sampleblocks, iii) deforestation mapping in 10 � 10 km sample blocksusing Landsat time series, and iv) derivation of a deforestationmodel based on a regression analysis.
MODIS-Terra surface reflectance 8-Day 500 m
(January 2010)
Supervised classification
Forests Agriculture Pastures/Urban
Separation of spectral mixture
(Unsupervised classification)
Separation of spectral mixture
(Unsupervised classification)
Forest/Non-Forest
Forest/Non-Forest
MODIS EVI 16-Day 250m time series
2001-2010
Application of a Landsat-derived vegetation mask
(Xeric scrub/Riparian and dry forests)
EVI standard deviation x pixel
Thresholding to map dry forests from other
vegetation
CLM2010Forest/Non-Forest map
MARN2000/VCFForest map
Image differencing:Change probabilities 0- 100%
classified in four strata
Optimal allocation per stratum and random selection:24 samples analyzed for deforestation rates from Landsat
TM and ETM+ (circa 1985 – circa 2010)
Simple linear regression model using 2000-2010
change probabilities
Estimates of deforestation rates at the basin scale
1985-2010
Fig. 3. Schematic of methods used in this study.
C.A. Portillo-Quintero et al. / Applied Geography 35 (2012) 152e163 157
Author's personal copy
Change probability map (2000e2010)A change probability map showing general trends of vegetation
cover loss was produced through image differencing of theMARN2000 forest map and the CLM2010 maps. For the humidforests in the south-western region within the Colombian side,where no data was available for 2000, we used the yearly MODIS500-m Vegetation continuous fields (VCF) product correspondingto the year 2001 (Hansen et al., 2003). This data is available fromLPDAAC website and it was used as baseline or ‘initial state’ infor-mation in the analysis (Hansen et al., 2009). The MODIS VCFproduct provides values of the percentage of vegetation cover perpixel. Thresholding of the VCF values, aided by visual interpretationof high resolution imagery, was necessary in order to satisfactorilymap humid forest extent.
TheMARN2000/VCFand the CLM2010datasets represent the bestforest cover data available for the LMB from two dates sufficientlyapart to show significant forest cover change at the basin level.
For change detection between datasets, a 10 � 10 km vectorialgrid was created within 5 km distance from all MARN2000/VCFforest edges using Hawth’s tools (Beyer, 2004) in ArcGIS software.The amount of forest cover (in km2) represented by MARN2000/VCFand CLM2010 was then calculated for every 10 � 10 km cell, as wellas the percentage of change between dates. Given that both datasetswere produced using different classification methods, as well asdifferent satellite data and ancillary data, estimated changes in forestcover could be attributed to geolocational errors and mappinginconsistencies. Therefore, the percentage of change value wasreferred as an estimator of the ‘probability of change’ rather thana direct estimator of forest loss. Similar to Hansen, Roy et al. (2008)and Broich et al. (2009), probability of change values were classifiedin four strata (low, intermediate, high and very high) using the Jenksoptimization method (natural breaks classification). Blocks with nochange detected were discarded from further analysis.
Nested sampling designA stratified nested sampling design using optimal allocationwas
used to determine the number of 10 � 10 km samples blocks per
stratum to be further analyzed using time-series of Landsat data(Broich et al., 2009; Stehman et al., 2011). A total sample sizeencompassing 5e10% of the total number of blocks was considereda proper representative and manageable sample size range, basedon the results from similar global and regional studies (Broich et al.,2009), as well as the computing capacity and man-hours effortneeded.
First, sample sizes were calculated for each stratum based onNeyman Optimal allocation (Broich et al., 2009; Stehman et al.,2011). The optimal allocation was determined using per-stratumstandard deviations of the percentage of change of all blockswithin each stratum. Once sample sizes per stratum were calcu-lated, a random selection procedure of 10 � 10 km sample blocksper stratum was performed using Hawth’s tool in ArcGIS.
Landsat deforestation mapping and regression estimation for basin-level statistics
In addition to the Landsat Circa 2010 dataset, a set of Landsat TMimages acquired through the Global Land Cover Facility with verylow cloud/haze cover scenes (less than 10%) for dates around1984e1989 (Circa 1985) was used. First, Landsat Circa 1985 andLandsat Circa 2010 were subset using the area of sample blocksselected by optimal allocation per stratum. Then, samples wereclassified in Forest/Non-forest maps through unsupervised classi-fication (Isodata clustering algorithm). Classification per block wasaided by interpretation of Landsat false color composites andvegetation indices derived from the same Landsat scenes, highresolution imagery from Google Earth as well as all ancillary data.Once forest/non-forest maps were produced for both 1985 and2010, the annual rate of deforestation (Rd) was calculated persample block using the following equation:
Rdð%=yÞ ¼ ðA1 � A2ÞðA1*nÞ
*100 (1)
Where A1 is the forest cover at the initial state (Circa 1985), A2 is theforest cover at the final state (Circa 2010) and n is the time (years)
Fig. 4. a) MODIS-Terra surface reflectance 8-day 500-m L3 mosaic for January 2010 with very low cloud presence, b) forest map (CLM2010) produced by semi-automated clas-sification of the MODIS scene.
C.A. Portillo-Quintero et al. / Applied Geography 35 (2012) 152e163158

Author's personal copy
between A1 and A2 (Hernández & Pozzobon, 2004). Four categorieswere assigned to deforestation rates: Low (<0.5%/y), Intermediate(0.5e2%/y), High (2e3.0%/y), Very high (>3%/y). This equation andcategories were used to allow comparability with previous nationaldeforestation statistics and studies at the landscape-level inVenezuela (Catalán, 1991, p. 11; Hernández & Pozzobon, 2004).
Finally, a regression estimator was employed to derive defor-estation estimates at the basin level (Hansen et al., 2009). A simplelinear regression model was applied between calculated defores-tation rates and correspondent MARN2003eCLM2010 changeprobability values. The model was applied to all 377 blocks in orderto derive deforestation rates for the entire study area.
Fig. 3 shows a schematic of the main steps of the methodologyapplied formapping forest cover and estimating deforestation rates.
Results
Forest cover and geographical distribution
The semi-automated classification of MODIS 500-m imageryallowed us to produce a forest cover map for Lake Maracaibo Basinusing scenes of January 2010 (Fig. 4b). Because the land covermatrix is very diverse, especially in the lowland plains and sub-montane areas, pixels with early stages of forests had a higherprobability of being included in the non-forest class (Castro,Sánchez-Azofeifa, & Rivard, 2003; Portillo-Quintero & Sánchez-Azofeifa, 2010). The map produced is then, mostly representingold growth, intermediate successional stages, and homogeneouscanopy layers formed by standing trees outside forests.
The forest map was evaluated using a confusion matrix whichshowed a high overall accuracy of 90% (Producer’s accuracy: Forest82%, Non-Forest 98%; User’s accuracy: Forest 97%, Non-Forest 83%).This product represents the first forest cover map produced at thebasin level using automated classification methods of satelliteimagery. The map shows that the total extent of forest in LakeMaracaibo Basin for 2010 is 29,710 km2 representing 38% of thetotal terrestrial landmass of the basin. From this extent, 18,343 km2
(61.74%) belongs to Venezuela and 11,367 km2 (38.26%) falls withinthe Colombian region.
Table 1 shows the forest extent for the 15 sub-basins formingthe Lake Maracaibo Basin. The Catatumbo river basin, in the south-western region, contains the largest core area of forest (14,736 km2)around the lower slopes and lowlands of the Perijá and Méridacordilleras. Almost 78% of the forests of the Catatumbo river sub-basin are located in the Colombian part of the sub-basin. The restis scattered along the Venezuela-Colombia border.
At the basin level, most forests are distributed along thewesternand southern regions of the basin in the submontane and montanealtitudinal belts of the upper sub-basins. In fact 5069 km2 of forestsare located in the lowland plains of the basin or premontane belt(<100 masl), 3861 km2 are located in the basimontain belt (>100and <300 masl), 8166 km2 in the submontane belt (>300 and<800 masl), and 12,611 km2 in the montane belt (>800 and2800 masl). Furthermore, a comparison between the Olson andDinerstein (2002) delineation of terrestrial ecoregions and theCLM2010 forest extent shows that 88% of the ‘Maracaibo dry forest’ecoregion, 66% of the Venezuelan Andean montane forests, 58% ofthe Catatumbo moist forests and only 6% of the Cordillera Orientalmontane forests have been already converted to anthropogenicland use (Table 1).
Sampling of deforestation rates
The four strata derived from the comparison between theMARN2000/VCF and CLM2010 maps were 0e5% (Stratum 1),
>5e17% (Stratum 2), >17e38% (Stratum 3), and >38% (Stratum 4)change probabilities (Fig. 5a and b). A total of 33 sample blocksaccounting for 8.75% of the total number of blocks (n ¼ 377) wereinitially analyzedwith the allocation to the strata being 10,13, 9 and2 sample blocks respectively. During the processing of Landsatimagery, samples with more than 50% of missing data caused bycloud and shadow cover and data gaps from the Landsat 7 scan-linecorrector-off (SLC-off) malfunction were discarded. Finally, thenumber of samples analyzed for stratum 1e4 was 7, 9, 7 and 1,respectively. These 24 samples accounted for 6.36% of the totalnumber of sample blocks. Fig. 5c shows the location of the 24sample blocks analyzed. Table 2a summarizes the results fromcalculating deforestation rates per stratum.
Results for sample blocks analyzed within the low changeprobability stratum (Stratum 1) showed a rate of 0.24 � 0.04%/y,which indeed falls into the low deforestation rate categoryaccording to Catalán (1991, p. 11). Values within strata 2 and 3(intermediate and high change probability) were 0.83 � 0.61%/yand 0.58 � 0.57%/y respectively, which in fact, falls into the inter-mediate deforestation rate category. Only one sample with anannual deforestation rate of 0.42%/y was registered in the Very-High change probability stratum, also in the intermediate defor-estation rate category. At the basin level, a mean annual defores-tation rate of 0.56 � 0.24%/y was estimated.
Although mean values differed between strata, reflecting onlytwo levels of deforestation (Table 2b), data obtained within theintermediate level was highly variable and showed no significantstatistical difference compared to the low level (ManneWhitneyU ¼ 34, p > 0.05). This is due to the fact that a large proportion ofsample blocks showed low deforestation values, even in the areaswere intermediate and high values were predicted (85% in stratum1; 37% in stratum 2; 71% in stratum 3). Stratification did success-fully allocate the areas were intermediate and high deforestationrates are occurring in the Lake Maracaibo Basin. These were locatedin the sub-montane and premontane zones of the CordilleraOriental montane forests, Catatumbo moist lowland forests andEastern cordillera.
A general spatial distribution of deforestation rates predicted bythe regressionestimationmodel applied to the377blocks is shown inFig. 5d. The best-fitted regression model for the 1985e2010 time
Table 1Forest extent in the fifteen river sub-basins and four ecoregions of the LakeMaracaibo Basin.
Sub-basin Sub-basinarea (km2)
Forestcover (km2)
% Forested
Catatumbo 27,548 14,736 53Guasare 5630 2636 47Santa Ana 6714 2231 33Chama 5633 1616 29Motatán 5139 1595 31El Palmar 4594 1306 28Tucaní 2175 1111 51Escalante 4703 966 21Apón 3593 894 25Capaz 1950 789 40Pueblo Viejo 3109 722 23Machango 1306 388 30Motatán de los negros 1641 388 24Cocuiza 2072 320 15Caño Carrillo 365 12 3
Ecoregion(from Olson & Dinerstein, 2002)
Ecoregionarea (km2)
Forestcover (km2)
% Forested
Cordillera oriental montane forests 12,509 11,793 94Catatumbo moist forests 20,945 8697 42Venezuelan Andes montane forests 16,517 5698 34Maracaibo dry forests 29,787 3522 12
C.A. Portillo-Quintero et al. / Applied Geography 35 (2012) 152e163 159

Author's personal copy
period captured 29% of the variation in Landsat-derived forest coverchange (R2 ¼ 0.29, p < 0.05, n ¼ 20; Rd ¼ 0.0263[Changeprob] þ 0.1482). Modeled deforestation rates range from 0.15%/y to1.86%/y. The regression model shows a relative accurate distributionof deforestation pressure across the basin, illustrating higher defor-estation rates along Eastern Cordillera (Motatán river sub-basin), theCentral western cordillera (Perijá submontane forests) and the lowerslopes of the western cordillera in the Catataumbo river sub-basin.The model provides a coarse approximation to rates of forest coverloss in Lake Maracaibo Basin during 1985e2010, but absolute defor-estation rates calculated per block might not be necessarily capturedin the spatial model. For example, the model predicts higher defor-estation values in the eastern cordillera (Motatán sub-river basin)when, in fact, Landsat-derived deforestation rates were slightly
higher in the Catatumbo sub-basin lowlands (Mean AnnualRd¼ 0.89%/y,n¼ 4) than sampleblocks analyzed in theMotatán riversub-basin (Mean Annual Rd ¼ 0.52%/y, n ¼ 5). Such bias toward theMotatan river sub-basin was likely produced by higher prior changeprobabilities predicted for the sub-basin comparatively to other sub-basins. As a complement for the comprehension of deforestationdynamics in Lake Maracaibo Basin, the two sample blocks thatshowed high deforestation rates (>2%/y) with higher-resolutionmapping are marked in Fig. 5d.
Discussion
This work represents the first synoptic approach to map forestcover and deforestation in Lake Maracaibo Basin using automated
Fig. 5. a) Map indicating areas of forest change after comparing the MARN2000/VCF and the CLM2010 dataset; b) predicted change probabilities calculated for 10 � 10 km2 blockswithin 5 km of all mapped forests (n ¼ 377). Values were classified in four strata using the Jenks optimization method. c) Sample blocks selected per stratum using Neyman optimalallocation. Deforestation rates were calculated per sample block using Landsat scenes from 1985 to 2010, d) deforestation rates estimated for 377 blocks based on a simple linearregression model using calculated deforestation rates and MARN2000eCLM2010 change probability values (R2 ¼ 0.29, p < 0.05; Rd ¼ 0.0263[change prob] þ 0.1482). The twosample blocks showing the highest deforestation rates (>2%/y) are highlighted with black line boundaries.
C.A. Portillo-Quintero et al. / Applied Geography 35 (2012) 152e163160

Author's personal copy
classification methods and nested sampling of high resolutionimagery. The selection of MODIS 8-day scenes from January 2010(beginning of the dry season) with very low cloud presence (SeeFig. 4a) allowed to accurately map the distribution of forest cover atthe basin scale. To achieve satisfactory results from supervisedclassification, an exhaustive collection of training sites was needed.The presence of various types of forest vegetation as a result ofa north-south gradient in climatic conditions required a semi-automated classification that included validation, cross-checkingand manual digitalization of forest cover when needed. In thelowland plains of the basin, the use of an EVI time series wasnecessary in order to separate pixels representing dry forests fromriparian vegetation, crops and evergreen xeric scrub. The optimalaccuracy achieved in this map is also a contribution of the use of thenational concept of ‘forest estate’ as a criterion for selecting trainingsites and imagery classification. This concept includes the repre-sentation of fragmented forest landscapes, which are inherentlymapped with MODIS at a minimum mapping unit of 0.25 ha (500-m pixel). Based on this concept, periodic monitoring forests withinthe LMB is methodologically feasible using MODIS 500-m imagery.Monitoring forests at the scale of the ‘native forests’ concept withinLMBmight require the use of MODIS imagery at a spatial resolutionof 250 m and/or sub-pixel classification methods in order to ach-ieve satisfactory levels of accuracy.
The application of a nested sampling design to estimate defores-tation rates generated information on the local patterns of forestcover change in a statistically-sound and cost-effective way. Resultsdid not only allowed to distinguish two levels of deforestation rates(lowand intermediate) in the study area and an overall annual rate ofdeforestation of 0.56%/y, but it also generated comprehensivespatially-explicit information on the localization of deforestationfronts within the basin. Periodic quantification of annual deforesta-tion rates can be highly improved by calculating change probabilitiesusing the CLM2010 as the initial baseline map and future updatedversions of the CLM2010 map elaborated using similar automatedclassificationmethods. Standard errors of deforestationvalueswithinand among strata can be reduced by increasing the sample size perstratum. An improvement on the estimation of change probabilitiesand an increase in samples blocks per stratum can improve thecoefficient of determination (R2) of the simple linear regressionmodel estimator, thus providing higher confidence estimates forpredicted deforestation rates. Furthermore, the selection ofa minimum proper sample size also needs to be based on affordableand sustainable costs of man-hour effort and maintenance ofcomputing capacity in order to ensure its long-term application.
Regarding forest cover and deforestation patterns in Lake Mar-acaibo Basin, results indicate that forest cover has been reduceddrastically as a result of anthropogenic agricultural and urban
expansion, especially for the ‘Maracaibo dry forests’ and the ‘Ven-ezuelan Andeanmontane forests’ ecoregions. However, most of thisforest cover change occurred during the 50’s and 60’s during theconstruction of the Pan-American highway that borders all pre-montane areas of the basin. The only published official rates for theregion are derived from visual interpretation of satellite imageryand report an annual rate of deforestation of 4.4%/y for the1977e1982 time period for Zulia state e which represents >50% ofthe basin territory (GFW, 2002). For the last 25 years (1985e2010),our results indicate that deforestation was low (<0.5%/y) in 85% ofthe basin, with highly focalized deforestation fronts (intermediate-to-high rates, <2.5%/y) in three regions: a) the Motatán river sub-basin in the Eastern Cordillera, b) the lower slopes of the Cata-tumbo river sub-basin and c) the submontane regions of the Apónand Santa Ana river sub-basins.
In general, deforestation drivers in these regions can be attrib-uted to agricultural, cattle ranching and urban expansion (Strauss,Fuenmayor, & Romero, 1992, pp. 93e141, www.gobiernoenlinea.gob.ve). Activities within the Motatán river sub-basin in Trujillostate are mainly agricultural (vegetables and flower crops) withareas affected by the construction of roads and infrastructure fortourism expansion. The submontane regions of the Apón and SantaAna river are mostly affected by cattle ranching in the lower slopesand agricultural activities concentrated toward the Perijá cordillera.Cattle ranching and agriculture also dominate the Catatumbo riversub-basin. In this area, the reported expansion of illegal crops in thefrontier between the Tibu department (Colombia) and the J.M.Semprún municipality (Venezuela) might play an important role asa deforestation driver in the region (Report from the ColombianNational Agency of Narcotics, available at http://www.dne.gov.co/?idcategoria¼794).
Future research on the direct causes of deforestation at thelandscape scale (using high-resolution imagery) could help policy-makers and local conservation practitioners to understand thesocioeconomic activities specifically related to forest loss.
In addition, the results of this study suggest a revision of forestconservation priorities within the LMB. For example, Llamozas et al.(2003, p. 555) and Rodríguez et al. (2010, p. 324) report that theCatatumbomoist forests are critically endangered.While thismightbe true for the Venezuelan share of the Catatumbo sub-basin, it isnot an accurate condition for the forests of the whole sub-basin. Infact, our results indicate that the Catatumbo river sub-basincontains the largest core area of forest in the basin (14,736 km2)but 78% of these are located in the Colombian share of the sub-basin. This fact is especially important because it underpins theimportance of bi-national management of the Catatumbo river sub-basin and the integral study of the Lake Maracaibo Basin beyondnational frontiers.
Table 2LMB mean annual deforestation rates calculated using high resolution imagery: a) per change probabilities strata; b) per level of deforestation according to Catalán (1991).
Strata Number of blocks Number of samples Landsat-derived mean annual deforestation rate (%/y) Estimated range of valuesa
a)1 189 7 0.24 0.20e0.282 125 9 0.83 0.22e1.443 56 7 0.58 0.01e1.154 7 1 0.42 e
Strata Numberof blocks
Number ofsamples
Landsat-derivedmean annualdeforestation rate (%/y)a
Deforestation rate categoryaccording to Catalán (1991)
b)Low change probability (stratum 1) 189 7 0.24 � 0.04 LowMid-to-high change probability (stratum 2,3,4) 188 17 0.70 � 0.32 IntermediateTotal 377 24 0.56 � 0.24 Intermediate
a Estimated ranges are at the 95% confidence level.
C.A. Portillo-Quintero et al. / Applied Geography 35 (2012) 152e163 161

Author's personal copy
Conclusions
The results of this paper lead the way for understanding currentpatterns in socioeconomic drivers of forest clearing in Lake Mar-acaibo Basin. The study also demonstrated the feasibility of usingalternatives methods to those traditionally used at the local andnational scale in Venezuela. For Lake Maracaibo Basin andVenezuela in general, the elaboration of forest maps based on thevisual interpretation of satellite imagery as well as the determi-nation of deforestation rates using wall-to-wall approaches of highresolution imagery, has proved to be time-consuming and finan-cially unsustainable. For local and national environmental institu-tions, the application of time and cost-efficientmethods guaranteesthe long-term generation of information for forest conservationand management. The methodology here applied can be imple-mented by small teams of geographers specialized in GIS andremote sensing using low cost and/or free available satellite data.An ongoing national project led by the Venezuelan Space Agency(ABAE) for launching the first Venezuelan remote sensing satellite(VRSS-1) in 2012e2013, promises to benefit initiatives on forestcover and deforestation monitoring even more. The VRSS-1 isdesigned to provide high resolution optical imagery (VIS-NIR) ata pixel size of 10-mwhich would improve the collection of trainingand validation sites, and the calculation of deforestation rates fromsample blocks. In the meantime, further research needs to addressthe methodological challenges for: a) deriving more accurate forestcover maps at coarse and high spatial resolutions, b) defining theminimum proper sample size per stratum and c) setting statisticalmethods and quality standards for reporting estimates of annualdeforestation rates. Addressing these questions will help estab-lishing a more accurate and transparent forest cover monitoringsystem at sub-national and national scales.
Acknowledgments
This work was carried out as part of the Project Nbr. 1046 of theCenter for Botanical and Agroforestry Studies of the VenezuelanInstitute of Scientific Research (IVIC). We would like to acknowl-edge the aid from the NGO ‘Fundación Amigos del Lago’ (BancoOccidental de Descuento) in early stages of this work. We thankEdgar Oléa and Miguel Pietrangeli for their comments on themethods and the analysis of results.
References
Achard, F., DeFries, R., Eva, H., Hansen, M., Mayaux, P., & Stibig, H.-J. (2007).Pantropical monitoring of deforestation. Environmental Research Letters, 2, 11.http://dx.doi.org/10.1088/1748-9326/2/4/045022.
Achard, F., Eva, H. D., Stibig, H. J., Mayaux, P., Gallego, J., Richards, T., et al. (2002).Determination of deforestation rates of the world’s humid tropical forests.Science, 297, 999e1002.
Achard, F., Stibig, H.-J., Eva, H. D., Lindquist, E., Bouvet, A., Arino, O., et al. (2010).Estimating tropical deforestation from Earth observation data. CarbonManagement, 1(2), 271e287.
Beyer, H. L. (2004). Hawth’s analysis tools for ArcGIS. Available at http://www.spatialecology.com/htools.
Bisbal, F. J. (1988). Impacto humano sobre los hábitats de Venezuela. Interciencia,13(5), 226e232.
Broich, M., Hansen, M. C., Potapov, P. V., Adusei, B., Lindquist, E. J., & Stehman, S. V.(2011). Time-series analysis of multi-resolution optical remote sensing imageryfor quantifying forest cover loss in Sumatra and Kalimantan, Indonesia. Inter-national Journal of Applied Earth Observation and Geoinformation, 13, 277e291.
Broich, M., Stehman, S. V., Hansen, M. C., Potapov, P. V., & Shimabukuro, Y. E. (2009).A comparison of sampling designs for estimating deforestation from Landsatimagery: a case study of the Brazilian Legal Amazon. Remote Sensing of Envi-ronment, 113, 2448e2454.
Castro, K., Sánchez-Azofeifa, G. A., & Rivard, B. (2003). Monitoring secondarytropical forest using space-borne data: implications for Central America.International Journal of Remote Sensing, 24(9), 1853e1894.
Catalán, A. (1991). El Proceso de Deforestación en Venezuela entre 1975e1988.Venezuela: Ministerio del Ambiente y de los Recursos NaturalesRenovablesCaracas.
Congalton, R. (1991). A review of assessing the accuracy of classification of remotelysensed data. Remote Sensing of Environment, 37, 35e46.
DeFries, R., Achard, F., Brown, S., Herold, M., Murdiyarso, D., Schlamadinger, B., et al.(2007). Earth observations for estimating greenhouse gas emissions fromdeforestation in developing countries. Environmental Science & Policy, 10(4),385e394.
Eckert, S., Ratsimba, H., Rakotondrasoa, L., Rajoelison, L., & Ehrensperger, A. (2011).Deforestation and forest degradation monitoring and assessment of biomassand carbon stock of lowland rainforest in the Analanjirofo region, Madagascar.Forest Ecology and Management, 262, 1996e2007.
Eva, H. D., Belward, A. S., De Miranda, E. E., Di Bella, C. M., Gond, V., Huber, O., et al.(2004). A land covermap of South America. Global Change Biology, 10(5), 731e744.
FAO. (2011). State of the World’s forests 2011. Rome: Food and Agriculture Organi-zation of the United Nations.
FAO/JRC. (2011). Global forest land use change from 1990 to 2005: Initial results froma global remote sensing survey. Rome: Food and Agriculture Organization of theUnited Nations/Joint Research Center. Available online at http://www.fao.org/forestry/fra/remotesensingsurvey/en/.
Foody, G. (2002). Status of land cover classification accuracy assessment. RemoteSensing of Environment, 80, 185e201.
Forner, C., Blaser, J., Jotzo, F., & Robledo, C. (2006). Keeping the forest for theclimate’s sake: avoiding deforestation in developing countries under theUNFCCC. Climate Policy, 6(3), 275e294.
FRA. (1999). Memorias del Taller sobre el programa de evaluación de los recursosforestales en once países latinoamericanos e FRA Working paper 10. Food andAgriculture Organization of the United Nations. Available online at http://www.fao.org/docrep/007/ad102s/AD102S00.htm#TopOfPage.
Fuller, D. O. (2006). Tropical forest monitoring and remote sensing: a new era of trans-parency in forest governance? Singapore Journal of Tropical Geography, 27, 15e29.
Gardner, W. S., Cavaletto, J. F., Bootsma, H. A., Lavrentyev, P. J., & Troncone, F. (1998).Nitrogen cycling rates and light effects in tropical Lake Maracaibo, Venezuela.Limnology and Oceanography, 43(8), 1814e1825.
Giri, C., & Jenkins, C. (2005). Land cover mapping of Greater Mesoamerica usingMODIS data. Canadian Journal of Remote Sensing, 31(4), 274e282.
Global Forest Watch. (2002). The state of Venezuela’s forests: A case study of theGuayana region. Fundación Polar.
Hansen, M. C., DeFries, R., Townshend, J., Carroll, M., Dimiceli, C., & Sohlberg, R.(2003). Global percent tree cover at a spatial resolution of 500 meters: First resultsof the MODIS vegetation continuous fields algorithmIn Earth Interactions, Vol. 7,Paper No. 10.
Hansen, M., Roy, D., Lindquist, E., Adusei, B., Justice, C., & Altstatt, A. (2008).A method for integrating MODIS and Landsat data for systematic monitoring offorest cover and change in the Congo Basin. Remote Sensing of Environment, 112,2495e2513.
Hansen, M. C., Shimabukuro, Y., Potapov, P., & Pittman, K. (2008). Comparing annualMODIS and PRODES forest cover change data for advancing monitoring ofBrazilian forest cover. Remote Sensing of Environment, 112, 3784e3793.
Hansen, M., Stehman, S., Potapov, P., Arunarwati, B., Stolle, F., & Pittman, K. (2009).Quantifying changes in the rates of forest clearing in Indonesia from 1990 to2005 using remotely sensed data sets. Environmental Research Letters, 4.
Hansen, M., Stehman, S., Potapov, P., Loveland, T., Townshend, J., DeFries, R., et al.(2008). Humid tropical forest clearing from 2000 to 2005 quantified by usingmultitemporal and multiresolution remotely sensed data. Proceedings of theNational Academy of Sciences, 105, 9439e9444.
Hernández, E., & Pozzobon, E. (2004). Tasas de deforestación en cuatro cuencasmontañosas del occidente de Venezuela. Revista Forestal Venezolana, 46, 35e42.
INPE. (2006). Monitoramento da Floresta Amazonica Brasileira por Satelite, ProjetoPRODES. Available online at http://www.obt.inpe.br/prodes/index.html.
Jensen, J. (2007). Remote sensing of environment: An earth resource perspective (2nded.).In Prentice hall series in geographic information science, USA: PearsonPrentice Hall.
Justice, C. O., Vermote, E., Townshend, J. R. G., Defries, R., Roy, D. P., Hall, D. K., et al.(1998). The moderate resolution imaging spectroradiometer (MODIS): landremote sensing for global change research. IEEE Transactions on Geosciences andRemote Sensing, 36(4).
Laurance, W. (1999). Reflections on the tropical deforestation crisis. BiologicalConservation, 91, 109e117.
Laurance, W., & Bierregaard, R. (1997). A crisis in the making. In W. Laurance, &R. Bierregaard (Eds.), Tropical forest remnants: Ecology, management andconservation of fragmented communities (pp. 612). USA: The University of Chi-cago Press.
Llamozas, S., Duno de Stefano, R., Meier, W., Riina, R., Stauffer, F., Aymard, G., et al.(2003). Libro Rojo de la Flora Venezolana. Caracas: Provita, Fundación Polar,Fundación Instituto Botánico de Venezuela Dr. Tobías Lasser.
Medina, E., & Barboza, F. (2006). Lagunas costeras del lago de Maracaibo: Distrib-ución, estatus y perspectivas de conservación. Ecotropicos, 19(2), 128e139.
National Forest Management Law. (2008). Ley de bosques y gestión forestal. GacetaOficial N� 38.946 del 5 de junio de 2008. Available online at http://www.minamb.gob.ve.
Olea, E. (2008). Diseño de una metodología de análisis SIG para evaluación ambientalde gasoductos en áreas terrestres. MSc thesis in Geomatics. Universidad CentralDe Venezuela.
C.A. Portillo-Quintero et al. / Applied Geography 35 (2012) 152e163162

Author's personal copy
Olson, D. M., & Dinerstein, E. (2002). The global 200: priority ecoregions for globalconservation. Annals of the Missouri Botanical Garden, 89(2), 199e224.
Olson, D. M., Dinerstein, E., Wikramanayake, E. D., Burgess, N. D., Powell, G. V. N.,Underwood, E. C., et al. (2001). Terrestrial ecoregions of the world: a new mapof life on earth. BioScience, 51, 933e938.
Pacheco-Angulo, C., Aguado Suarez, I., & Mollicone, D. (2011). Dinámica de ladeforestación en Venezuela: análisis de los cambios a partir de mapas histór-icos. Interciencia, 36(8), 578e586.
Peres, C. A. (2011). Conservation in sustainable-use tropical forest reserves.Conservation Biology, 25(6), 1124e1129.
Portillo-Quintero, C., & Sánchez-Azofeifa, G. A. (2010). Extent and conservationof tropical dry forests in the Americas. Biological Conservation, 143(1),144e155.
Potapov, P., Hansen, M. C., Stehman, S. V., Loveland, T. R., & Pittman, K. (2008).Combining MODIS and Landsat imagery to estimate and map boreal forestcover loss. Remote Sensing of Environment, 112, 3708e3719.
Rivas, Z., Sanchez, J., Troncone, F., Marquez, R., Ledo De Medina, H., Colina, M., et al.(2005). Nitrógeno y fósforo totales de los ríos tributarios al sistema lago deMaracaibo, Venezuela. Interciencia, 34(5), 308e314.
Rodríguez, J. P., Rojas-Suárez, F., & Hernández, D. G. (2010). Libro Rojo de los EcosistemasTerrestres de Venezuela. Caracas, Venezuela: Provita, Shell Venezuela, Lenovo.
Sánchez-Azofeifa, G. A., Quesada, M., Rodríguez, J. P., Nassar, J. M., Stoner, K. E.,Castillo, A., et al. (2005). Research priorities for neotropical dry forests. Bio-tropica, 37(4), 477e485.
Stehman, R., & Czaplewski, R. (1998). Design and analysis for thematic map accu-racy assessment: fundamental principles. Remote Sensing of Environment, 64,331e344.
Stehman, S. V., Hansen, M. C., Broich, M., & Potapov, P. V. (2011). Adapting a globalstratified random sample for regional estimation of forest cover change derivedfrom satellite imagery. Remote Sensing of Environment, 115(2), 650e658.
Stehman, S. V., Sohl, T. L., & Loveland, T. R. (2003). Statistical sampling to charac-terize land-cover change in the U. S. Geological Survey land-cover trendsproject. Remote Sensing of Environment, 86, 517e529.
Strauss, E., Fuenmayor, W., & Romero, J. (1992). Síntesis municipal (2nd ed.).In Atlasdel Estado Zulia.
Tucker, C. J., & Townshend, J. R. G. (2000). Strategies for monitoring tropicaldeforestation using satellite data. International Journal of Remote Sensing,21(6e7), 1461e1471.
Viloria, A. (2002). Episodios en la naturaleza limítrofe. Maracaibo, Cali: UniversidadCatólica Cecilio Acosta/Imágenes de la Naturaleza.
WWF. (2002). Terrestrial ecoregions reports. World Wildlife Fund. Available at http://www.worldwildlife.org/wildworld/profiles/terrestrial_nt.html.
C.A. Portillo-Quintero et al. / Applied Geography 35 (2012) 152e163 163
Copyright © 2022 FDOKUMEN