New perspectives on the synoptic and mesoscale structure of Hurricane Catarina
15
New perspectives on the synoptic and mesoscale structure of Hurricane Catarina Augusto José Pereira Filho a, ⁎, Alexandre Bernardes Pezza b , Ian Simmonds b , Raquel Silva Lima c , Marcio Vianna d a University of São Paulo, Institute of Astronomy, Geophysics and Atmospheric Sciences, Department of Atmospheric Sciences, São Paulo, Brazil b School of Earth Sciences, The University of Melbourne, Victoria 3010, Australia c Brazilian Enterprise of Airport Infra-Structure—INFRAERO, Guarulhos, São Paulo, Brazil d VM Oceanica LTDA, S. J. Dos Campos, SP, Brazil article info abstract Article history: Received 19 November 2008 Received in revised form 16 September 2009 Accepted 18 September 2009 This work explores in detail synoptic and mesoscale features of Hurricane Catarina during its life cycle from a decaying baroclinic wave to a tropical depression that underwent tropical transition (TT) and finally to a Category 2 hurricane at landfall over Santa Catarina State coast, southern Brazil. This unique system caused 11 deaths mostly off the Brazilian coast and an estimated half billion dollars in damage in a matter of a few hours on 28 March 2004. Although the closest meteorological station available was tens of kilometres away from the eye, in situ meteorological measurements provided by a work-team sent to the area where the eye made landfall unequivocally reproduces the tropical signature with category 2 strength, adding to previous analysis where this data was not available. Further analyses are based mostly on remote sensing data available at the time of the event. A classic dipole blocking set synoptic conditions for Hurricane Catarina to develop, dynamically contributing to the low wind shear observed. On the other hand, on its westward transit, large scale subsidence limited its strength and vertical development. Catarina had relatively cool SST conditions, but this was mitigated by favourable air–sea fluxes leading to latent heat release-driven processes during the mature phase. The ocean's dynamic topography also suggested the presence of nearby warm core rings which may have facilitated the transition and post-transition intensification. Since there were no records of such a system at least in the past 30 years and given that SSTs were generally below 26 °C and vertical shear was usually strong, despite all satellite data available, the system was initially classified as an extratropical cyclone. Here we hypothesise that this categorization was based on inadequate regional scale model outputs which did not account for the importance of the latent heat fluxes over the ocean. Hurricane Catarina represents a dramatic event on weather systems in South America. It has attracted attention worldwide and poses questions as whether or not it is a symptom of global warming. © 2009 Elsevier B.V. All rights reserved. Keywords: Hurricane Catarina South America GFDL Remote sensing 1. Introduction Hurricane Catarina depicted in Fig. 1A was a very rare weather event in South America which started as an extra- tropical cyclone, but later acquired tropical cyclone character- istics achieving category 2 strength in the Saffir-Simpson scale (Simpson, 1974) just before landfall on the southern Brazilian coast. It formed at approximately 27°S, 49°W over warm waters of the South Atlantic Ocean as a comma cloud in the wake of a decaying baroclinic wave on 19 March 2004; a dipole blocking structure created a favourable environment for this hybrid cyclone to form and develop into a hurricane. Reports from the Santa Catarina Civil Defence indicate that near half a million people in two dozen cities were affected by Hurricane Catarina, Atmospheric Research 95 (2010) 157–171 ⁎ Corresponding author. Rua do Matão, 1226 São Paulo, 05508-090, SP, Brazil. Tel.: +55 11 3091 4735; fax: +55 11 3091 4714. E-mail address: [email protected] (A.J. Pereira Filho). 0169-8095/$ – see front matter © 2009 Elsevier B.V. All rights reserved. doi:10.1016/j.atmosres.2009.09.009 Contents lists available at ScienceDirect Atmospheric Research journal homepage: www.elsevier.com/locate/atmos
Transcript of New perspectives on the synoptic and mesoscale structure of Hurricane Catarina
Atmospheric Research 95 (2010) 157–171
Contents lists available at ScienceDirect
Atmospheric Research
j ourna l homepage: www.e lsev ie r.com/ locate /atmos
New perspectives on the synoptic and mesoscale structure ofHurricane Catarina
Augusto José Pereira Filho a,⁎, Alexandre Bernardes Pezza b, Ian Simmonds b,Raquel Silva Lima c, Marcio Vianna d
a University of São Paulo, Institute of Astronomy, Geophysics and Atmospheric Sciences, Department of Atmospheric Sciences, São Paulo, Brazilb School of Earth Sciences, The University of Melbourne, Victoria 3010, Australiac Brazilian Enterprise of Airport Infra-Structure—INFRAERO, Guarulhos, São Paulo, Brazild VM Oceanica LTDA, S. J. Dos Campos, SP, Brazil
a r t i c l e i n f o
⁎ Corresponding author. Rua do Matão, 1226 SãoBrazil. Tel.: +55 11 3091 4735; fax: +55 11 3091 471
E-mail address: [email protected] (A.J. Pe
0169-8095/$ – see front matter © 2009 Elsevier B.V.doi:10.1016/j.atmosres.2009.09.009
a b s t r a c t
Article history:Received 19 November 2008Received in revised form 16 September 2009Accepted 18 September 2009
Thisworkexplores indetail synoptic andmesoscale features ofHurricaneCatarinaduring its life cyclefrom a decaying baroclinic wave to a tropical depression that underwent tropical transition (TT) andfinally to a Category 2 hurricane at landfall over Santa Catarina State coast, southern Brazil. Thisunique system caused 11 deathsmostly off the Brazilian coast and an estimated half billion dollars indamage in a matter of a few hours on 28 March 2004. Although the closest meteorological stationavailable was tens of kilometres away from the eye, in situ meteorological measurements providedby a work-team sent to the area where the eye made landfall unequivocally reproduces the tropicalsignature with category 2 strength, adding to previous analysis where this data was not available.Further analyses are basedmostly on remote sensing data available at the time of the event. A classicdipoleblockingset synoptic conditions forHurricaneCatarina todevelop,dynamically contributing tothe low wind shear observed. On the other hand, on its westward transit, large scale subsidencelimited its strength and vertical development.Catarina had relatively cool SST conditions, but this was mitigated by favourable air–sea fluxesleading to latent heat release-driven processes during the mature phase. The ocean's dynamictopography also suggested the presence of nearby warm core rings which may have facilitatedthe transition and post-transition intensification. Since there were no records of such a systemat least in the past 30 years and given that SSTs were generally below 26 °C and vertical shearwas usually strong, despite all satellite data available, the system was initially classified as anextratropical cyclone. Here we hypothesise that this categorization was based on inadequateregional scale model outputs which did not account for the importance of the latent heat fluxesover the ocean. Hurricane Catarina represents a dramatic event on weather systems in SouthAmerica. It has attracted attention worldwide and poses questions as whether or not it is asymptom of global warming.
© 2009 Elsevier B.V. All rights reserved.
Keywords:Hurricane CatarinaSouth AmericaGFDLRemote sensing
1. Introduction
Hurricane Catarina depicted in Fig. 1A was a very rareweather event in South America which started as an extra-tropical cyclone, but later acquired tropical cyclone character-
Paulo, 05508-090, SP,4.reira Filho).
All rights reserved.
istics achieving category 2 strength in the Saffir-Simpson scale(Simpson, 1974) just before landfall on the southern Braziliancoast. It formed at approximately 27°S, 49°Woverwarmwatersof the South Atlantic Ocean as a comma cloud in the wake of adecaying baroclinic wave on 19 March 2004; a dipole blockingstructure created a favourable environment for this hybridcyclone to form and develop into a hurricane. Reports from theSanta Catarina Civil Defence indicate that near half a millionpeople in two dozen citieswere affected byHurricane Catarina,
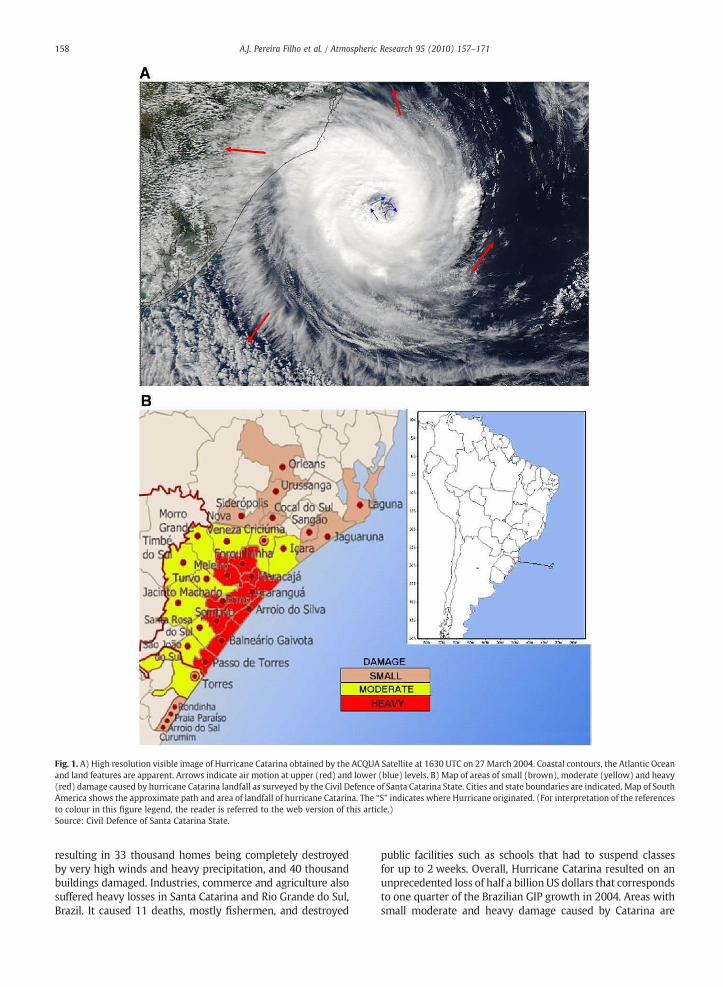
Fig. 1. A) High resolution visible image of Hurricane Catarina obtained by the ACQUA Satellite at 1630 UTC on 27 March 2004. Coastal contours, the Atlantic Oceanand land features are apparent. Arrows indicate air motion at upper (red) and lower (blue) levels. B) Map of areas of small (brown), moderate (yellow) and heavy(red) damage caused by hurricane Catarina landfall as surveyed by the Civil Defence of Santa Catarina State. Cities and state boundaries are indicated. Map of SouthAmerica shows the approximate path and area of landfall of hurricane Catarina. The “S” indicates where Hurricane originated. (For interpretation of the referencesto colour in this figure legend, the reader is referred to the web version of this article.)Source: Civil Defence of Santa Catarina State.
158 A.J. Pereira Filho et al. / Atmospheric Research 95 (2010) 157–171
resulting in 33 thousand homes being completely destroyedby very high winds and heavy precipitation, and 40 thousandbuildings damaged. Industries, commerce and agriculture alsosuffered heavy losses in Santa Catarina and Rio Grande do Sul,Brazil. It caused 11 deaths, mostly fishermen, and destroyed
public facilities such as schools that had to suspend classesfor up to 2 weeks. Overall, Hurricane Catarina resulted on anunprecedented loss of half a billion US dollars that correspondsto one quarter of the Brazilian GIP growth in 2004. Areas withsmall moderate and heavy damage caused by Catarina are
159A.J. Pereira Filho et al. / Atmospheric Research 95 (2010) 157–171
shown in Fig. 1B. The most affected areas coincide with thelandfall location where sustained winds near the wall cloudwere above 150 km h−1.
This study presents further findings and new perspectiveson synoptic and mesoscale aspects of Hurricane Catarina. Ini-tially, Catarina was classified as an extratropical cyclone basedon synoptic scale numerical models. Since this type of weathersystem usually moves eastward, had Catarina behaved as anExtratropical Cyclone (EC) it should not have posed any threatsover land. Later attempts to classify this weather systemalso included a polar low event because in the early stagesof development it produced a typical comma cloud pattern,sometimes observed, for instance, over the Mediterranean Sea(Reale and Atlas, 2001). The evolution of Catarina also resem-bled that of subtropical cyclones (Hebert, 1973).
The initial forecasts were based on model outputs andclimatology with less emphasis on the signals revealed in thesatellite data and the insights fromconceptualmodels. HurricaneCatarina has indicated an urgent need for more specific trainingprograms, observing platforms and procedures to analyze and toforecast unusual and highly destructive weather systems. Onesuch initiativewhosepartial focus ison theSouthernHemisphere(SH) is the THORPEX project (http://www.bom.gov.au/bmrc/projects/THORPEX/TC/index.html). THORPEX (The ObservingSystem Research and Predictability Experiment) is an interna-tional researchprogrammedesigned toaccelerate improvementsin the accuracy of 1-day to 2-week high-impact weather fore-casts. It was established in May 2003 by the Fourteenth WorldMeteorological Congress as a ten-year international global at-mospheric research and development programme under theauspices of the World Meteorological Organization (WMO)Commission for Atmospheric Sciences. The primary scientificaims are to extend the skill that has been achieved in recentdecades by global operational Numerical Weather Predictionmodelling out to the two-week time frame, and to shift the focusof weather forecasting and verification procedures towardshigh-impact forecasts such that the benefit to society is optimised.
Hurricane Catarina is reported in the THORPEX projectas an example of the need for implementing a better severeweather monitoring and forecasting system in the SH. Thisrare cyclone has also been discussed and in special sessionsheld at international scientific meetings (e.g. Silva Dias et al,2004). Several local and international studies have been pre-sented on Catarina such as modelling sensitivity analysis(Menezes and Silva Dias, 2004), propagation aspects (Bonattiet al., 2006), precipitation analysis (Gevaerd et al., 2004),synoptic and dynamic analysis based on model outputs (SilvaDias et al., 2004), dynamic diagnoses of dipole-blockingsbased on conceptual models (McTaggart-Cowan et al., 2006),and wind shear and blocking analysis (Pezza and Simmonds,2005, 2006, 2008). Catarina has also raised conjectures as tothe influence of large scale climate change in the South At-lantic (Pezza et al., 2009).
A common form of severe weather over the South AtlanticOcean is extratropical cyclones (Gan and Rao, 1991). Catarinawas a hybrid cyclone that started as extratropical and underwenttropical transition (TT). There are many documented cases ofextratropical cyclones that undergo dynamic and thermody-namic changes to become tropical cyclones particularly in theNorth Atlantic Ocean. A TT implies a change of a cold core dis-turbance toawarmcoredone (Davis andBosart, 2003;Evans and
Guishard, 2004). These types of weather systems are generallyformed in higher latitudes and initially baroclinic environments,and are not as well understood as classical hurricanes. HurricaneDiana is an example of a TT (Bosart and Bartlo, 1991). A morerecent North Atlantic system that was somewhat of an analog toCatarina was hurricane Epsilon in December 2005 (Beven et al.,2008).
A strong extratropical disturbance can undergo a TT when alow latitude cyclone associated with a cold front develops itselfenough to exchange heat induced by the surfacewind (Emanuel,1989; Davis and Bosart, 2004). On the other hand, a weak extra-tropical disturbancemight be a shallowbaroclinicwaveor amid-troposphere vortex. Convection and latent heat release mightproduce a mechanism to transport heat from the surface to thecyclonealoft and turn it intoaTT (EvansandGuishard, 2004). Theopposite process, where a tropical cyclone becomes an extra-tropical cyclone, is called extratropical transition or ET. It usuallyoccurswhenahurricane is caught inanupper level troughduringthe late stages of development. There are polar lows during thewinter with features of a hurricane called Arctic ‘hurricanes’.Hurricane Catarina is a rare event given its complex lifecycle.
The present study documents and analyses in great detailHurricane Catarina's synoptic and mesoscale structures in thelight of new in situ data, remote sensing and high resolutionmodels. We bring new aspects that add to what is alreadyknown about this rare system and reinforce the importance ofthe interplay between air–sea interaction, large scale blockingdynamics and wind induced surface heat exchange (WISHE)-driven thermodynamic processes (Emanuel, 1989, 1993). It isalso suggested that Hurricane Catarina could have been cor-rectly forecast if moreweight was given to remote sensing datasets and conceptual models and less weight to inadequatesynoptic scalemodel outputs at the time. TheGeophysical FluidDynamics Laboratory (GFDL) model (Bender and Marchok,2004) was able to forecast all major characteristics of thesystem such as its path and time of landfall once the systemintensified. Data sets, numerical model analysis and forecastsare described in Section 2, results and discussion in Section 3followed by conclusions and recommendations in Section 4.
2. Methodology
Most data sets used in this study are from satellite sensorsonboard AQUA, GOES-12, TRMM, NOAA-16 and METEOSAT-8.Rainfall accumulation estimateswere obtained from theNationalOceanic and Atmospheric Administration Morphing (CMORPH)technique (Joyce et al., 2004). Upper level fields are from theNational Centers for Environment Prediction (NCEP) operationalanalysis and surface and lightning data from various sources inBrazil. The dynamic and thermodynamic analyses are based onthe satellite data sets taking into account their strengths andlimitations. Each variable is analyzed individually and later com-pared to verify other variables to identify consistencies and ordiscrepancies among them.
Five basic conditions to form and to maintain a tropicalcyclone (Vasquez, 2002) were considered in the presentstudy. These are understood to be: 1—Sea surface temperatureabove 26 °C; 2—sufficient convective instability; 3—Sufficientlarge scale relative vorticity; 4—Low vertical wind shear(<10 ms−1); 5—pre-existing low pressure disturbances(Gray, 1968). A conceptual model of a Southern Hemisphere
160 A.J. Pereira Filho et al. / Atmospheric Research 95 (2010) 157–171
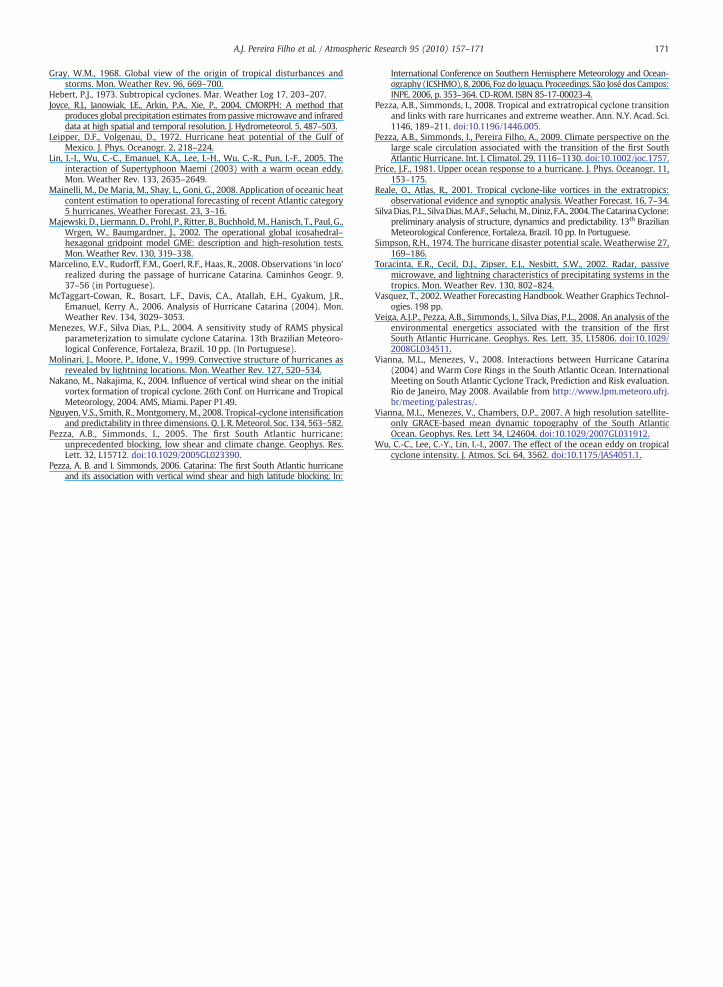
hurricanewas adapted fromConway (1997) andHebert (1973)to summarize the three stages Catarina underwent. Note thattropical cyclone formation in the North Atlantic can occur withsea surface temperatures colder than 26 °C, particularly in thecase of TT cyclones similar to Catarina (see for instance Bevenet al., 2008).
GFDL model analysis and forecasts provided by Penn StateUniversity (PSU) for guidance at the time of the event arepresented in this manuscript to show its value in predictingthe trajectory and intensity of Hurricane Catarina after the tran-sition fromabaroclinicwave toan intensebarotropic system. Themodel was initialized with a temperature perturbation at theobserved location of the eye, a simple and effective approach fora location where no observations were available. The GFDLinitialization generates a warm vortex anomaly where the eye isobserved. This procedure could be applied to future events aswell as in other models to start the vortex.
3. Results
3.1. SST and ocean heat content analysis
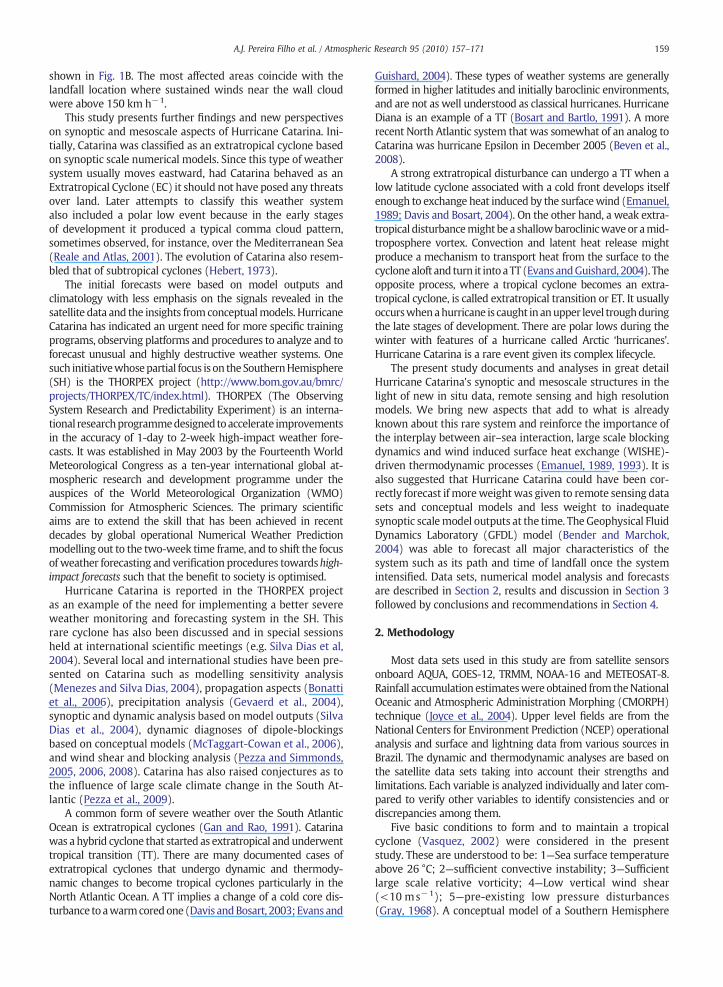
Fig. 2 shows (A) the mean surface temperature fieldestimated from microwave measurements during the devel-opment stage of Catarina and (b) the depth of the 17 °Cisotherm (D17) on a 1/8×1/8° grid on 19th of March (theday Catarina formed). The trajectory of the low pressurecentre appears close to the 24 °C isotherm in Fig. 2A. Panel 2Ashows the track during and after TT only, and panel 2B showsthe whole trajectory during Catarina's lifecycle from the gen-esis point. Panel B was estimated from a regression betweenARGO float profile data and contemporaneous daily oceandynamic topography data of the same resolution, based on 3-satellite altimetry objective space-time mapping (Vianna andMenezes, 2008).
The innovative insights presented in Fig. 2 fit well with theconcept of air sea interaction mechanisms participating in themature phase of Catarina's transition, and add towhat has beenpublished before in the literature. The satellite-derived esti-matemapping of the depth of the 17 °C isothermdepicts a veryinteresting structure which is not apparent in the SST analysis(compare Fig. 2A and B), giving additional information aboutthe heat storagewithin the ocean's thermocline. The depth of agiven subsurface isotherm estimated by satellite altimetry isregarded as a more reliable proxy for upper ocean heat contentthan the SST (Cabanes et al., 2001 and references therein), asclearly seen by the fine structure in Fig. 2B.
From Fig. 2A a tongue of warmer waters is apparent nearthe coast, where the Brazil Current normally brings warmerwaters from lower latitudes. Although the time scale involvedfor Catarina to cross the shallow SST tongue with slightlypositive anomaly was less than one day, its presence suggeststhat as the low pressure centre moved towards the continentthe fluxes of sensible and latent heat increased their contribu-tion towards the cyclone intensification. The weekly averagecan be used as a low pass filter and yields a much smoothertemperature field. Positive and negative small scale anomalieswere observed in the sea surface temperature as one instan-taneousfield (not shown) seems to indicate a region ofwarmertemperatures near theareawhere the lowpressure disturbanceoccurred on 22 March.
Hurricanes are believed to be more likely to form wherethe SST is above 26 °C, but this was not the case with Catarina(McTaggart-Cowan et al., 2006). Although the initial north-ward displacement of Catarina shifted southward at 43° W inassociation with fundamental changes in the large scale cir-culation (Pezza and Simmonds, 2005) and in the environ-mental energetics (Veiga et al., 2008), asymmetric vorticesare also driven by synoptic steering flows and Beta effects.Had Catarina continued its initial movement (Fig. 2B) itwould lower the relative vorticity and increase the environ-ment wind shear (discussed later in Fig. 3) both detrimentalto hurricane development.
We can deduce from Fig. 2B that the ocean's dynamictopography analysis indicated the presence ofWarm Core Ring(WCR) structures during Catarina's lifecycle. The WCR arecharacterized by closed deep subsurface depressions in the17 °C isotherm surface. It can be seen that Catarina crossedthree different WCRs during its entire path, the first oneoccurring during the extratropical phase while the trajectorywas still towards the southeast. The second WCR crossingoccurred just after the trajectory presented a reversal anticy-clonic loop, and the third one is seen during the hurricaneintensification aroundMarch 26th in Fig. 2B. TheWCR channelaround the29–31° latitude belt seem to be a permanent featurein the South Atlantic (Vianna et al., 2007), and had beenobserved during most of March 2004 (not shown). The WCRD17 depths were observed to decrease by more than 40 m inone day by the sudden interaction with the intense wind ringoff the eye of Catarina, and the overall D17 decreased due to thepassage of Catarina over the WCRs. These WCRs lost heat asthey were crossed by the strong winds and slightly deintensi-fied, while the shallow Cyclonic Rings (Cold Core Rings) ab-sorbed heat, damping the wind intensity.
Daily SST (not shown) suggests positive anomalies on theleading edge of Catarina, with negative anomalies on thetrailing edge. This is consistent with the negative SST wakeanomalies normally caused by the inertial oscillations (Price,1981; Wu et al., 2007). Recent research has shown that theincorporation of air–sea interaction processes explicitly in-cluding the effects of WCRs into numerical weather pre-diction models has substantially improved the prediction ofhurricane intensity (Lin et al., 2005; Mainelli et al., 2008 andreferences therein). Satellite imagery of Catarina suggested itwas strengthening in the last few hours before landfall, whichmay have been due to a patch of high Ekman pumpingintensity observed along the coast due to increased wind curl.Note that a warm SST tongue (about 27 °C) was observednear the coast only further north and may have interactedwith Catarina during the early extratropical phase near thecoast of Rio (see Fig. 2 of Pezza and Simmonds 2005).
In the case of Catarina, the overall intensification is believedto be primarily a result of the dynamic set up given by thecombination of blocking and reduced shear (Pezza andSimmonds, 2005). However, we here advance further on thisnotion showing that the boundary layer air–sea fluxes alsoplayed a role (secondary). The lack of data in the area makes itvery difficult to estimate the fluxes. In the Northern Hemi-sphere, the Tropical Cyclone Heat Potential (TCHP) is a mea-surement of the heat content (a relative quantity) between theD26 (depth of the 26 °C isotherm) and the surface: the depthintegration of the subsurface temperature from D26 to zero
Fig. 2. (A) Weekly mean surface temperature between 22 and 28 March 2004 on the South American coast. Colours and isotherms indicate surface temperatures(°C). Small dots indicate the position of the eastward movement of the eye of Hurricane Catarina from 0815 UTC 23 to 0245 28 March 2004. The dot over thecontinent indicates the location of a surface weather station in Siderópolis, Santa Catarina, Brazil; (B) Satellite altimetry-derived ocean dynamic topographyshowing the D17 level (17 °C depth, in m) on 19 March 2004 and the full trajectory described by the entire Catarina's lifecycle.Source: (A) CDC/NOAA and (B) VM Oceanica, www.vmoceanica.com.br).
161A.J. Pereira Filho et al. / Atmospheric Research 95 (2010) 157–171
depth (Leipper andVolgenau, 1972).DeeperD26 areas give lessSST negative feedback, or loss of hurricane strength. TheMixedLayer Depth (MLD) evolution is controlled by the balance ofthermocline water entrainment into it by Ekman Pumping andthe wind-forced lowering of the SST, the “warm” upwelledwater being horizontally (almost radially) advected away fromthe eye, while the lower temperature water from SST coolingsinks.
Without high resolution air–sea flux data it is unclear towhat extent WISHE participated during Catarina's develop-ment. This is alignedwith the sensitivity experiment S4 posedby Nguyen et al. (2008), where the wind-speed dependenceof the surface fluxes were capped at 10 m/s. The fact that thehurricane continued to intensify, despite the absence of apositive feedback of the fluxes with increasing wind speed,
suggests that an alternate mechanism may be at work. Theresults fromNguyen et al. (2008) suggest that the air–sea fluxacts to replenish boundary layer theta-e, which continues tofuel the deep-convective activity that provides the low-levelconvergence and spin-up for the storm. One of the mostinteresting features of Catarina is that it was able to spin-updespite SSTs being cooler than 26 °C.
Although it cannot be said that the WCR initiated thetransition, or that it was responsible for the anticyclonic loopreversal on its track, the crossing of the largest WCR appearsto have fed the cyclone with enough energy to facilitate it inattaining hurricane strength when the tropical transition hadalready been initiated by large scale energetics (Veiga et al.,2008). While clearly more research is needed for the SouthAtlantic, this analysis adds to what was previously known
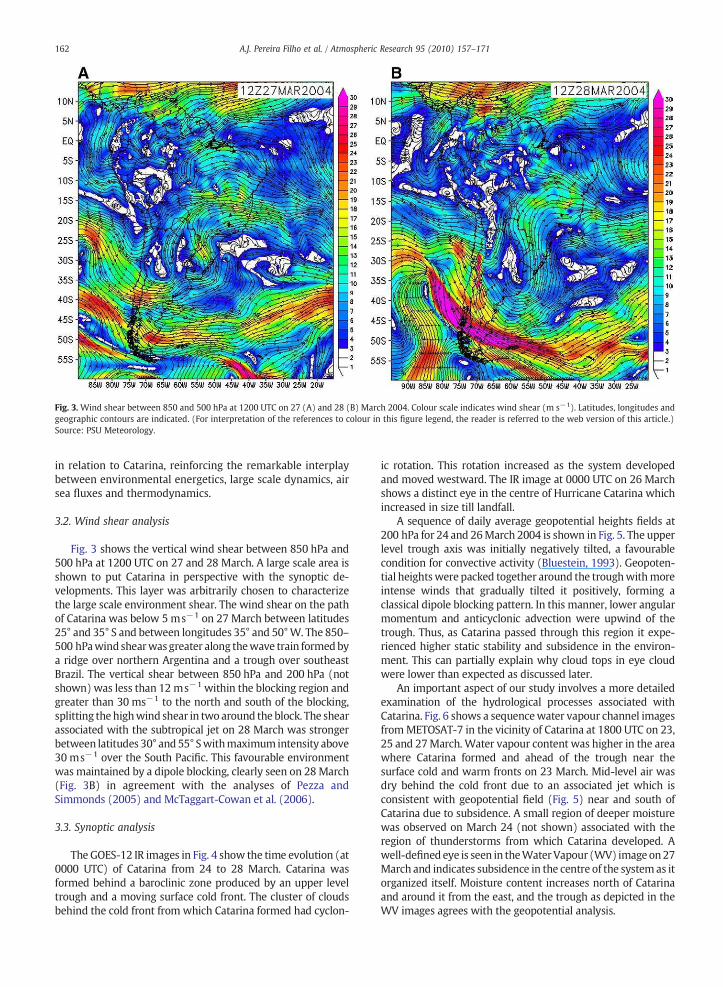
Fig. 3. Wind shear between 850 and 500 hPa at 1200 UTC on 27 (A) and 28 (B) March 2004. Colour scale indicates wind shear (m s−1). Latitudes, longitudes andgeographic contours are indicated. (For interpretation of the references to colour in this figure legend, the reader is referred to the web version of this article.)Source: PSU Meteorology.
162 A.J. Pereira Filho et al. / Atmospheric Research 95 (2010) 157–171
in relation to Catarina, reinforcing the remarkable interplaybetween environmental energetics, large scale dynamics, airsea fluxes and thermodynamics.
3.2. Wind shear analysis
Fig. 3 shows the vertical wind shear between 850 hPa and500 hPa at 1200 UTC on 27 and 28 March. A large scale area isshown to put Catarina in perspective with the synoptic de-velopments. This layer was arbitrarily chosen to characterizethe large scale environment shear. The wind shear on the pathof Catarina was below 5 ms−1 on 27 March between latitudes25° and 35° S and between longitudes 35° and 50°W. The 850–500 hPawind shearwasgreater along thewave train formedbya ridge over northern Argentina and a trough over southeastBrazil. The vertical shear between 850 hPa and 200 hPa (notshown) was less than 12 ms−1 within the blocking region andgreater than 30 ms−1 to the north and south of the blocking,splitting the highwind shear in two around the block. The shearassociated with the subtropical jet on 28 March was strongerbetween latitudes 30° and55° Swithmaximum intensity above30 ms−1 over the South Pacific. This favourable environmentwas maintained by a dipole blocking, clearly seen on 28March(Fig. 3B) in agreement with the analyses of Pezza andSimmonds (2005) and McTaggart-Cowan et al. (2006).
3.3. Synoptic analysis
The GOES-12 IR images in Fig. 4 show the time evolution (at0000 UTC) of Catarina from 24 to 28 March. Catarina wasformed behind a baroclinic zone produced by an upper leveltrough and a moving surface cold front. The cluster of cloudsbehind the cold front from which Catarina formed had cyclon-
ic rotation. This rotation increased as the system developedand moved westward. The IR image at 0000 UTC on 26 Marchshows a distinct eye in the centre of Hurricane Catarina whichincreased in size till landfall.
A sequence of daily average geopotential heights fields at200 hPa for 24 and 26March 2004 is shown in Fig. 5. The upperlevel trough axis was initially negatively tilted, a favourablecondition for convective activity (Bluestein, 1993). Geopoten-tial heightswere packed together around the troughwithmoreintense winds that gradually tilted it positively, forming aclassical dipole blocking pattern. In this manner, lower angularmomentum and anticyclonic advection were upwind of thetrough. Thus, as Catarina passed through this region it expe-rienced higher static stability and subsidence in the environ-ment. This can partially explain why cloud tops in eye cloudwere lower than expected as discussed later.
An important aspect of our study involves a more detailedexamination of the hydrological processes associated withCatarina. Fig. 6 shows a sequencewater vapour channel imagesfromMETOSAT-7 in the vicinity of Catarina at 1800 UTC on 23,25 and 27March. Water vapour content was higher in the areawhere Catarina formed and ahead of the trough near thesurface cold and warm fronts on 23 March. Mid-level air wasdry behind the cold front due to an associated jet which isconsistent with geopotential field (Fig. 5) near and south ofCatarina due to subsidence. A small region of deeper moisturewas observed on March 24 (not shown) associated with theregion of thunderstorms from which Catarina developed. Awell-definedeye is seen in theWaterVapour (WV) imageon27March and indicates subsidence in the centre of the system as itorganized itself. Moisture content increases north of Catarinaand around it from the east, and the trough as depicted in theWV images agrees with the geopotential analysis.

Fig. 4. GOES-12 IR images at 0000 UTC for 24, 26 and 28 March 2004. Gray scale indicates brightness temperatures from lowest (white) to highest (black).
Fig. 5. Daily geopotential mean at 200 hPa for 24 and 26 March 2004. Latitudes, longitudes and geographic contours are indicated as well as colour scale (m). (Forinterpretation of the references to colour in this figure legend, the reader is referred to the web version of this article.)Source: NCEP.
Fig. 6. METEOSAT-7 water vapour channel at 1800 UTC for 23, 25 and 27 March 2004. Gray scale indicates water vapour content from lowest (black) to highest(white).Source: Dundee University.
163A.J. Pereira Filho et al. / Atmospheric Research 95 (2010) 157–171
164 A.J. Pereira Filho et al. / Atmospheric Research 95 (2010) 157–171
Catarina was initially classified as an extratropical circu-lation with non-organized convection near its centre on 23March. Catarina evolved to a hybrid system with cyclonicrotation and deeper convection near its centre on 24 March(not shown). On the next day, the system further evolved to adeeper tropical storm with clouds organized in bands andestimated winds above 25 ms−1. The spiralling of the systemand a drier core are clearly seen in this stage. The diameterof the eye on 26 March was 20–25 km (not shown) withwestward movement of about 20 km h−1. The cloud bandsaround it were deeper and more organized. Catarina wasclassified as a Category 1 hurricane in this stage. The outer-most cloud bands reached the continent on March 27 withstrong winds and heavy rainfall. The vortex was moresymmetric around the well-defined cloudless and dry eye.Catarina reached its mature phase completely changed fromits earlier stages.
The axisymmetric vortex core reached the coast of Brazilat 0515 UTC on 28 March as a Category 2 hurricane. Afterlandfall, friction and shear as well as the system being cut-offfrom its oceanic energy source caused the occlusion of the eyeandmixing that reducedmoisture in its vicinity. TheWV fieldon 29 March (not shown) is consistent with the wind shearfield (Fig. 3).
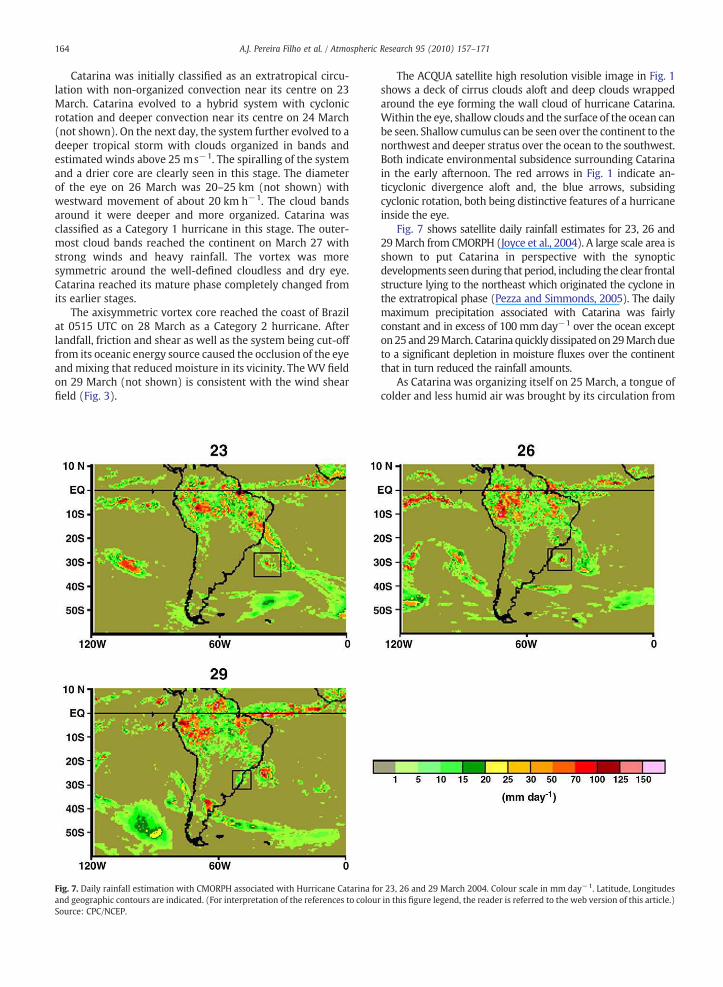
Fig. 7. Daily rainfall estimation with CMORPH associated with Hurricane Catarina foand geographic contours are indicated. (For interpretation of the references to colouSource: CPC/NCEP.
The ACQUA satellite high resolution visible image in Fig. 1shows a deck of cirrus clouds aloft and deep clouds wrappedaround the eye forming the wall cloud of hurricane Catarina.Within the eye, shallow clouds and the surface of the ocean canbe seen. Shallow cumulus can be seen over the continent to thenorthwest and deeper stratus over the ocean to the southwest.Both indicate environmental subsidence surrounding Catarinain the early afternoon. The red arrows in Fig. 1 indicate an-ticyclonic divergence aloft and, the blue arrows, subsidingcyclonic rotation, both being distinctive features of a hurricaneinside the eye.
Fig. 7 shows satellite daily rainfall estimates for 23, 26 and29March from CMORPH (Joyce et al., 2004). A large scale area isshown to put Catarina in perspective with the synopticdevelopments seenduring that period, including the clear frontalstructure lying to the northeast which originated the cyclone inthe extratropical phase (Pezza and Simmonds, 2005). The dailymaximum precipitation associated with Catarina was fairlyconstant and in excess of 100 mm day−1 over the ocean excepton25 and29March. Catarina quickly dissipated on29Marchdueto a significant depletion in moisture fluxes over the continentthat in turn reduced the rainfall amounts.
As Catarina was organizing itself on 25 March, a tongue ofcolder and less humid air was brought by its circulation from
r 23, 26 and 29 March 2004. Colour scale in mm day−1. Latitude, Longitudesr in this figure legend, the reader is referred to the web version of this article.)

165A.J. Pereira Filho et al. / Atmospheric Research 95 (2010) 157–171
higher latitudes (Fig. 6). Thus, it reduced the water content byadvection of colder and drier air. As Catarina became moresymmetric, this advection from the surroundings wasreduced and so the cyclonic convergence at lower levelsover warm ocean waters increased the moisture contents.
Hurricane Catarina produced more than 600 mm of precip-itation during its life cycle (mostly over the ocean) in spite ofits relative shallowness and lower than average sea surfacetemperature. Vertical profiles of heating rate by latent heatrelease (Barbio and Pereira Filho, 2004) indicate warming atmid and upper levels of the order of 1.0 to 2.0 Kday−1. Fig. 7also shows no significant precipitation surrounding Catarina,especially towards thewestwhere subsidence andhigher staticstability inhibited deep convection.
3.4. Mesoscale structure
Fig. 8 shows estimated brightness temperatures near theground and at 200 hPa at 0343UTC onMarch 27when Catarinawas classified a category 1-hurricane. Although clouds tend toaffect the temperature estimates, relatively warm air is clearlyfound in the eye area, especially close to the ground. Thevertical structure of positive temperature anomalies is persis-tent and indicates a distinct warm core at all five microwavechannels of the AMSU-A and AMSU-B sensors onboard satelliteNOAA-16.
Fig. 9 shows 3D views and vertical cross-sections of rainfallrates of HurricaneCatarina onMarch27obtained byNASAwiththe Precipitation Radar (PR) onboard the TRMM satellite. Thethree vertical cross-sections clearly showabright bandwhich isclose to the0 ° C isothermwhere iceparticles and snowmelts asit falls through that level. It is at about 4 km altitude and can beused as height reference.
Fig. 8. Brightness temperatures (°C) measured with the Advanced Microwave Soundfor channels 16 (surface) and 7 (200 hPa). Latitudes, longitudes, geographic contourin this figure legend, the reader is referred to the web version of this article.)Source: UW/CIMMS.
The top cross-section in Fig. 9 was taken near the eye andshows a cumulonimbus feature about 8 km deep to the rightand a deck of stratus to the left nomore than about 5 km deep.This indicates the presence of cold microphysics processeswithin Catarina. The horizontal cross-section shows three cir-cular sectors of precipitation bands near the surface. They aremore clearly seen in themiddle cross-section in Fig. 9 aswell ascumulonimbus structureswith rainfall rates ranging from 30 tomore than 50 mm h−1. A very well-defined bright band isapparent as well as a vigorous rainfall shaft close to themiddlepart of the cross-section.
The bottom cross-section in Fig. 9 shows several precipitat-ing cells with alternating upward and downward movements(deduced directly from the cross-section) that are associatedwith updrafts and compensating downdrafts as normally seenin hurricanes (Anthes, 1982). The highest cumulonimbus topsare associatedwith thewall cloudclose to theeye. Thesedeeperclouds have stronger updrafts and stronger compensatingdowndrafts. Given the asymmetry around the wall cloud, theeffect of each downdraft increases the subsidence and hy-drostatic warming in the eye. This is consistent with the mi-crowave temperature estimates shown in Fig. 8.
The map of lighting strikes shown in Fig. 10 indicates theabsence of electrical activity associatedwith Catarina particularlyin the eye wall, though convective cells had a vertical structurethat indicated the presence of ice crystals (Fig. 9). It might berelated to the kind of cloud condensation nuclei available overthe ocean (predominantly NaCl). Some electrical activity wasobserved over the continent in association to a convective bandto the northwest of Catarina. Nevertheless, lightning is muchmore likely in tropical continental features than tropical oceanicfeatures with similar reflectivity heights (Toracinta et al., 2002;Cecil and Zipser, 2002; Cecil et al. 2002), and is a distinctivefeature of tropical cyclones (Molinari et al. 1999).
ing Unit (AMSU) onboard NOAA-16 satellite at 0343 UTC on 27 March 2004s and colour scale are indicated. (For interpretation of the references to colour
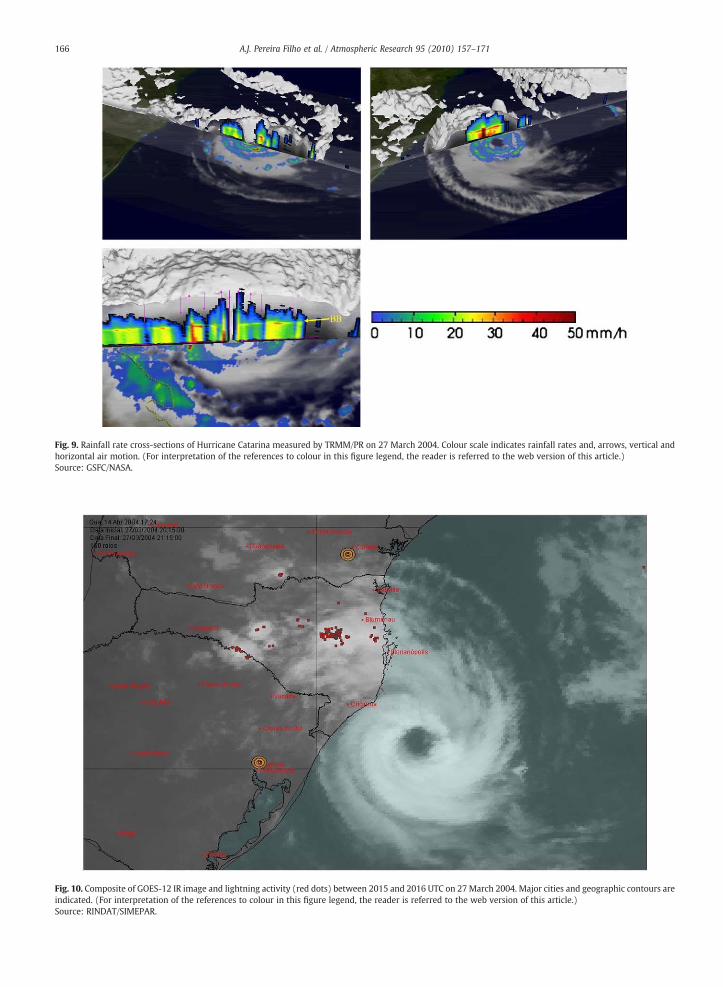
Fig. 9. Rainfall rate cross-sections of Hurricane Catarina measured by TRMM/PR on 27 March 2004. Colour scale indicates rainfall rates and, arrows, vertical andhorizontal air motion. (For interpretation of the references to colour in this figure legend, the reader is referred to the web version of this article.)Source: GSFC/NASA.
Fig. 10. Composite of GOES-12 IR image and lightning activity (red dots) between 2015 and 2016 UTC on 27March 2004. Major cities and geographic contours areindicated. (For interpretation of the references to colour in this figure legend, the reader is referred to the web version of this article.)Source: RINDAT/SIMEPAR.
166 A.J. Pereira Filho et al. / Atmospheric Research 95 (2010) 157–171
167A.J. Pereira Filho et al. / Atmospheric Research 95 (2010) 157–171
3.5. Surface analysis
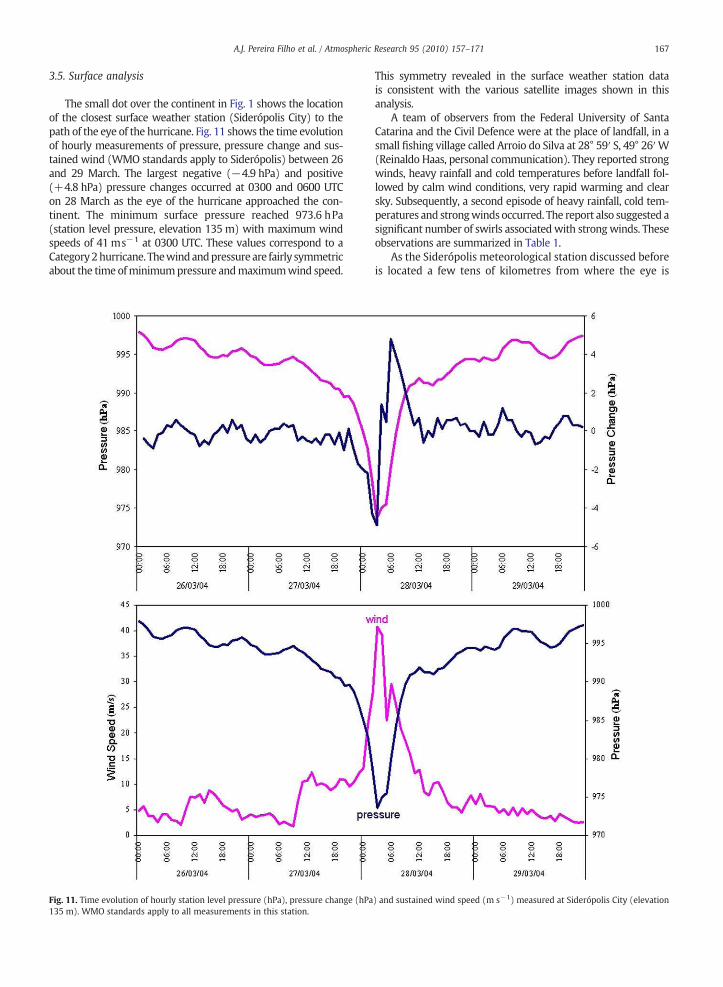
The small dot over the continent in Fig. 1 shows the locationof the closest surface weather station (Siderópolis City) to thepath of the eye of the hurricane. Fig. 11 shows the time evolutionof hourly measurements of pressure, pressure change and sus-tained wind (WMO standards apply to Siderópolis) between 26and 29 March. The largest negative (−4.9 hPa) and positive(+4.8 hPa) pressure changes occurred at 0300 and 0600 UTCon 28 March as the eye of the hurricane approached the con-tinent. The minimum surface pressure reached 973.6 hPa(station level pressure, elevation 135 m) with maximum windspeeds of 41 ms−1 at 0300 UTC. These values correspond to aCategory2hurricane. Thewindandpressure are fairly symmetricabout the time ofminimumpressure andmaximumwind speed.
Fig. 11. Time evolution of hourly station level pressure (hPa), pressure change (hPa135 m). WMO standards apply to all measurements in this station.
This symmetry revealed in the surface weather station datais consistent with the various satellite images shown in thisanalysis.
A team of observers from the Federal University of SantaCatarina and the Civil Defence were at the place of landfall, in asmall fishing village called Arroio do Silva at 28° 59′ S, 49° 26′W(Reinaldo Haas, personal communication). They reported strongwinds, heavy rainfall and cold temperatures before landfall fol-lowed by calm wind conditions, very rapid warming and clearsky. Subsequently, a second episode of heavy rainfall, cold tem-peratures and strongwinds occurred. The report also suggested asignificant number of swirls associatedwith strongwinds. Theseobservations are summarized in Table 1.
As the Siderópolis meteorological station discussed beforeis located a few tens of kilometres from where the eye is
) and sustained wind speed (m s−1) measured at Siderópolis City (elevation
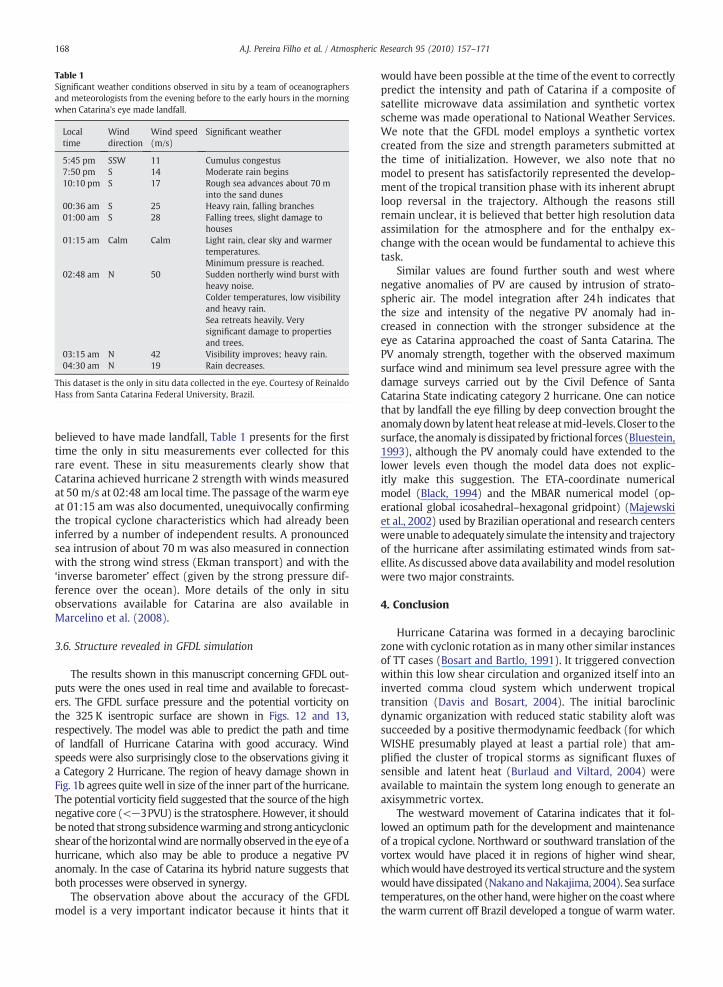
Table 1Significant weather conditions observed in situ by a team of oceanographersand meteorologists from the evening before to the early hours in the morningwhen Catarina's eye made landfall.
Localtime
Winddirection
Wind speed(m/s)
Significant weather
5:45 pm SSW 11 Cumulus congestus7:50 pm S 14 Moderate rain begins10:10 pm S 17 Rough sea advances about 70 m
into the sand dunes00:36 am S 25 Heavy rain, falling branches01:00 am S 28 Falling trees, slight damage to
houses01:15 am Calm Calm Light rain, clear sky and warmer
temperatures.Minimum pressure is reached.
02:48 am N 50 Sudden northerly wind burst withheavy noise.Colder temperatures, low visibilityand heavy rain.Sea retreats heavily. Verysignificant damage to propertiesand trees.
03:15 am N 42 Visibility improves; heavy rain.04:30 am N 19 Rain decreases.
This dataset is the only in situ data collected in the eye. Courtesy of ReinaldoHass from Santa Catarina Federal University, Brazil.
168 A.J. Pereira Filho et al. / Atmospheric Research 95 (2010) 157–171
believed to have made landfall, Table 1 presents for the firsttime the only in situ measurements ever collected for thisrare event. These in situ measurements clearly show thatCatarina achieved hurricane 2 strength with winds measuredat 50 m/s at 02:48 am local time. The passage of the warm eyeat 01:15 am was also documented, unequivocally confirmingthe tropical cyclone characteristics which had already beeninferred by a number of independent results. A pronouncedsea intrusion of about 70 m was also measured in connectionwith the strong wind stress (Ekman transport) and with the‘inverse barometer’ effect (given by the strong pressure dif-ference over the ocean). More details of the only in situobservations available for Catarina are also available inMarcelino et al. (2008).
3.6. Structure revealed in GFDL simulation
The results shown in this manuscript concerning GFDL out-puts were the ones used in real time and available to forecast-ers. The GFDL surface pressure and the potential vorticity onthe 325 K isentropic surface are shown in Figs. 12 and 13,respectively. The model was able to predict the path and timeof landfall of Hurricane Catarina with good accuracy. Windspeeds were also surprisingly close to the observations giving ita Category 2 Hurricane. The region of heavy damage shown inFig. 1b agrees quite well in size of the inner part of the hurricane.The potential vorticity field suggested that the source of the highnegative core (<−3PVU) is the stratosphere. However, it shouldbenoted that strong subsidencewarmingand stronganticyclonicshear of thehorizontalwindarenormally observed in theeyeof ahurricane, which also may be able to produce a negative PVanomaly. In the case of Catarina its hybrid nature suggests thatboth processes were observed in synergy.
The observation above about the accuracy of the GFDLmodel is a very important indicator because it hints that it
would have been possible at the time of the event to correctlypredict the intensity and path of Catarina if a composite ofsatellite microwave data assimilation and synthetic vortexscheme was made operational to National Weather Services.We note that the GFDL model employs a synthetic vortexcreated from the size and strength parameters submitted atthe time of initialization. However, we also note that nomodel to present has satisfactorily represented the develop-ment of the tropical transition phase with its inherent abruptloop reversal in the trajectory. Although the reasons stillremain unclear, it is believed that better high resolution dataassimilation for the atmosphere and for the enthalpy ex-change with the ocean would be fundamental to achieve thistask.
Similar values are found further south and west wherenegative anomalies of PV are caused by intrusion of strato-spheric air. The model integration after 24h indicates thatthe size and intensity of the negative PV anomaly had in-creased in connection with the stronger subsidence at theeye as Catarina approached the coast of Santa Catarina. ThePV anomaly strength, together with the observed maximumsurface wind and minimum sea level pressure agree with thedamage surveys carried out by the Civil Defence of SantaCatarina State indicating category 2 hurricane. One can noticethat by landfall the eye filling by deep convection brought theanomalydownby latentheat release atmid-levels. Closer to thesurface, the anomaly is dissipatedby frictional forces (Bluestein,1993), although the PV anomaly could have extended to thelower levels even though the model data does not explic-itly make this suggestion. The ETA-coordinate numericalmodel (Black, 1994) and the MBAR numerical model (op-erational global icosahedral–hexagonal gridpoint) (Majewskiet al., 2002) used by Brazilian operational and research centerswere unable to adequately simulate the intensity and trajectoryof the hurricane after assimilating estimated winds from sat-ellite. As discussed above data availability andmodel resolutionwere two major constraints.
4. Conclusion
Hurricane Catarina was formed in a decaying barocliniczonewith cyclonic rotation as inmany other similar instancesof TT cases (Bosart and Bartlo, 1991). It triggered convectionwithin this low shear circulation and organized itself into aninverted comma cloud system which underwent tropicaltransition (Davis and Bosart, 2004). The initial baroclinicdynamic organization with reduced static stability aloft wassucceeded by a positive thermodynamic feedback (for whichWISHE presumably played at least a partial role) that am-plified the cluster of tropical storms as significant fluxes ofsensible and latent heat (Burlaud and Viltard, 2004) wereavailable to maintain the system long enough to generate anaxisymmetric vortex.
The westward movement of Catarina indicates that it fol-lowed an optimum path for the development and maintenanceof a tropical cyclone. Northward or southward translation of thevortex would have placed it in regions of higher wind shear,whichwouldhavedestroyed its vertical structure and the systemwouldhavedissipated (Nakano andNakajima, 2004). Sea surfacetemperatures, on the other hand,were higher on the coastwherethe warm current off Brazil developed a tongue of warm water.
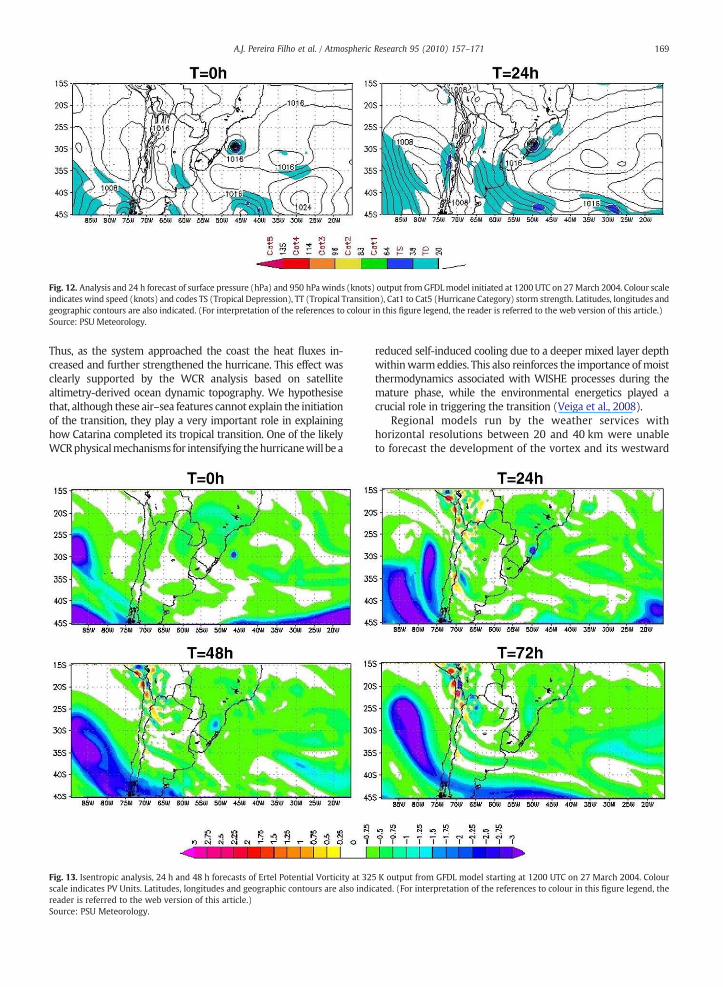
Fig. 12. Analysis and 24 h forecast of surface pressure (hPa) and 950 hPa winds (knots) output fromGFDLmodel initiated at 1200 UTC on 27March 2004. Colour scaleindicates wind speed (knots) and codes TS (Tropical Depression), TT (Tropical Transition), Cat1 to Cat5 (Hurricane Category) storm strength. Latitudes, longitudes andgeographic contours are also indicated. (For interpretation of the references to colour in this figure legend, the reader is referred to the web version of this article.)Source: PSU Meteorology.
169A.J. Pereira Filho et al. / Atmospheric Research 95 (2010) 157–171
Thus, as the system approached the coast the heat fluxes in-creased and further strengthened the hurricane. This effect wasclearly supported by the WCR analysis based on satellitealtimetry-derived ocean dynamic topography. We hypothesisethat, although these air–sea features cannot explain the initiationof the transition, they play a very important role in explaininghow Catarina completed its tropical transition. One of the likelyWCRphysicalmechanisms for intensifying thehurricanewill bea
Fig. 13. Isentropic analysis, 24 h and 48 h forecasts of Ertel Potential Vorticity at 32scale indicates PV Units. Latitudes, longitudes and geographic contours are also indireader is referred to the web version of this article.)Source: PSU Meteorology.
reduced self-induced cooling due to a deeper mixed layer depthwithinwarmeddies. This also reinforces the importance ofmoistthermodynamics associated with WISHE processes during themature phase, while the environmental energetics played acrucial role in triggering the transition (Veiga et al., 2008).
Regional models run by the weather services withhorizontal resolutions between 20 and 40 km were unableto forecast the development of the vortex and its westward
5 K output from GFDL model starting at 1200 UTC on 27 March 2004. Colourcated. (For interpretation of the references to colour in this figure legend, the
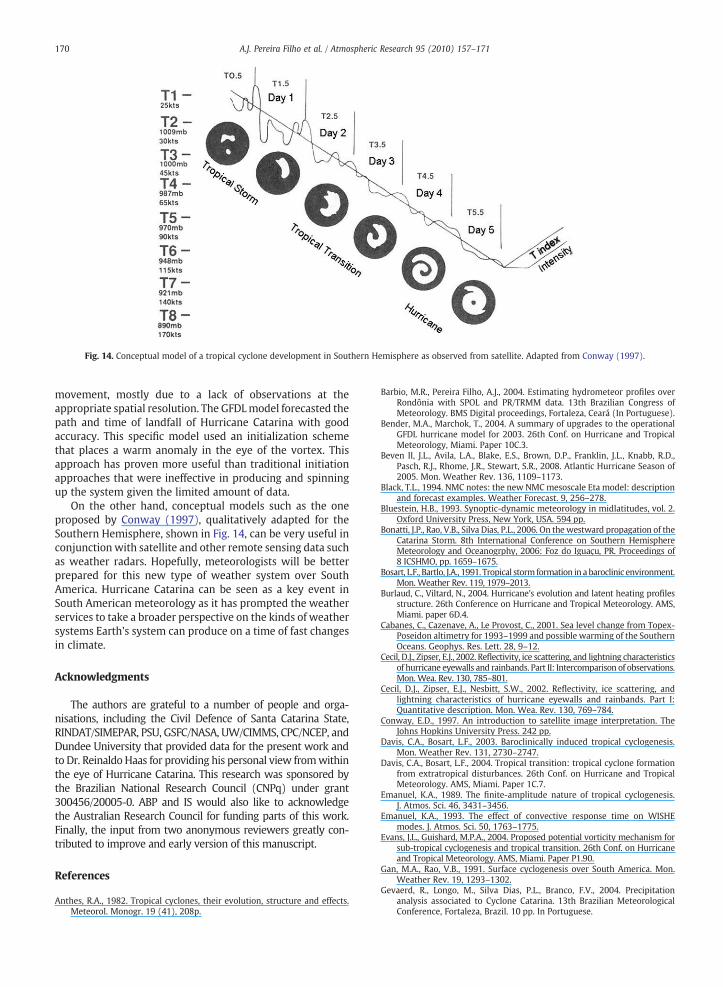
Fig. 14. Conceptual model of a tropical cyclone development in Southern Hemisphere as observed from satellite. Adapted from Conway (1997).
170 A.J. Pereira Filho et al. / Atmospheric Research 95 (2010) 157–171
movement, mostly due to a lack of observations at theappropriate spatial resolution. The GFDLmodel forecasted thepath and time of landfall of Hurricane Catarina with goodaccuracy. This specific model used an initialization schemethat places a warm anomaly in the eye of the vortex. Thisapproach has proven more useful than traditional initiationapproaches that were ineffective in producing and spinningup the system given the limited amount of data.
On the other hand, conceptual models such as the oneproposed by Conway (1997), qualitatively adapted for theSouthern Hemisphere, shown in Fig. 14, can be very useful inconjunction with satellite and other remote sensing data suchas weather radars. Hopefully, meteorologists will be betterprepared for this new type of weather system over SouthAmerica. Hurricane Catarina can be seen as a key event inSouth American meteorology as it has prompted the weatherservices to take a broader perspective on the kinds of weathersystems Earth's system can produce on a time of fast changesin climate.
Acknowledgments
The authors are grateful to a number of people and orga-nisations, including the Civil Defence of Santa Catarina State,RINDAT/SIMEPAR, PSU, GSFC/NASA, UW/CIMMS, CPC/NCEP, andDundee University that provided data for the present work andto Dr. Reinaldo Haas for providing his personal view fromwithinthe eye of Hurricane Catarina. This research was sponsored bythe Brazilian National Research Council (CNPq) under grant300456/20005-0. ABP and IS would also like to acknowledgethe Australian Research Council for funding parts of this work.Finally, the input from two anonymous reviewers greatly con-tributed to improve and early version of this manuscript.
References
Anthes, R.A., 1982. Tropical cyclones, their evolution, structure and effects.Meteorol. Monogr. 19 (41), 208p.
Barbio, M.R., Pereira Filho, A.J., 2004. Estimating hydrometeor profiles overRondônia with SPOL and PR/TRMM data. 13th Brazilian Congress ofMeteorology. BMS Digital proceedings, Fortaleza, Ceará (In Portuguese).
Bender, M.A., Marchok, T., 2004. A summary of upgrades to the operationalGFDL hurricane model for 2003. 26th Conf. on Hurricane and TropicalMeteorology, Miami. Paper 10C.3.
Beven II, J.L., Avila, L.A., Blake, E.S., Brown, D.P., Franklin, J.L., Knabb, R.D.,Pasch, R.J., Rhome, J.R., Stewart, S.R., 2008. Atlantic Hurricane Season of2005. Mon. Weather Rev. 136, 1109–1173.
Black, T.L., 1994. NMC notes: the new NMCmesoscale Eta model: descriptionand forecast examples. Weather Forecast. 9, 256–278.
Bluestein, H.B., 1993. Synoptic-dynamic meteorology in midlatitudes, vol. 2.Oxford University Press, New York, USA. 594 pp.
Bonatti, J.P., Rao, V.B., Silva Dias, P.L., 2006. On the westward propagation of theCatarina Storm. 8th International Conference on Southern HemisphereMeteorology and Oceanogrphy, 2006: Foz do Iguaçu, PR. Proceedings of8 ICSHMO, pp. 1659–1675.
Bosart, L.F., Bartlo, J.A., 1991. Tropical storm formation in a baroclinic environment.Mon. Weather Rev. 119, 1979–2013.
Burlaud, C., Viltard, N., 2004. Hurricane's evolution and latent heating profilesstructure. 26th Conference on Hurricane and Tropical Meteorology. AMS,Miami. paper 6D.4.
Cabanes, C., Cazenave, A., Le Provost, C., 2001. Sea level change from Topex-Poseidon altimetry for 1993–1999 and possible warming of the SouthernOceans. Geophys. Res. Lett. 28, 9–12.
Cecil, D.J., Zipser, E.J., 2002. Reflectivity, ice scattering, and lightning characteristicsof hurricane eyewalls and rainbands. Part II: Intercomparison of observations.Mon. Wea. Rev. 130, 785–801.
Cecil, D.J., Zipser, E.J., Nesbitt, S.W., 2002. Reflectivity, ice scattering, andlightning characteristics of hurricane eyewalls and rainbands. Part I:Quantitative description. Mon. Wea. Rev. 130, 769–784.
Conway, E.D., 1997. An introduction to satellite image interpretation. TheJohns Hopkins University Press. 242 pp.
Davis, C.A., Bosart, L.F., 2003. Baroclinically induced tropical cyclogenesis.Mon. Weather Rev. 131, 2730–2747.
Davis, C.A., Bosart, L.F., 2004. Tropical transition: tropical cyclone formationfrom extratropical disturbances. 26th Conf. on Hurricane and TropicalMeteorology. AMS, Miami. Paper 1C.7.
Emanuel, K.A., 1989. The finite-amplitude nature of tropical cyclogenesis.J. Atmos. Sci. 46, 3431–3456.
Emanuel, K.A., 1993. The effect of convective response time on WISHEmodes. J. Atmos. Sci. 50, 1763–1775.
Evans, J.L., Guishard, M.P.A., 2004. Proposed potential vorticity mechanism forsub-tropical cyclogenesis and tropical transition. 26th Conf. on Hurricaneand Tropical Meteorology. AMS, Miami. Paper P1.90.
Gan, M.A., Rao, V.B., 1991. Surface cyclogenesis over South America. Mon.Weather Rev. 19, 1293–1302.
Gevaerd, R., Longo, M., Silva Dias, P.L., Branco, F.V., 2004. Precipitationanalysis associated to Cyclone Catarina. 13th Brazilian MeteorologicalConference, Fortaleza, Brazil. 10 pp. In Portuguese.
171A.J. Pereira Filho et al. / Atmospheric Research 95 (2010) 157–171
Gray, W.M., 1968. Global view of the origin of tropical disturbances andstorms. Mon. Weather Rev. 96, 669–700.
Hebert, P.J., 1973. Subtropical cyclones. Mar. Weather Log 17, 203–207.Joyce, R.J., Janowiak, J.E., Arkin, P.A., Xie, P., 2004. CMORPH: A method that
produces global precipitation estimates frompassivemicrowave and infrareddata at high spatial and temporal resolution. J. Hydrometeorol. 5, 487–503.
Leipper, D.F., Volgenau, D., 1972. Hurricane heat potential of the Gulf ofMexico. J. Phys. Oceanogr. 2, 218–224.
Lin, I.-I., Wu, C.-C., Emanuel, K.A., Lee, I.-H., Wu, C.-R., Pun, I.-F., 2005. Theinteraction of Supertyphoon Maemi (2003) with a warm ocean eddy.Mon. Weather Rev. 133, 2635–2649.
Mainelli, M., De Maria, M., Shay, L., Goni, G., 2008. Application of oceanic heatcontent estimation to operational forecasting of recent Atlantic category5 hurricanes. Weather Forecast. 23, 3–16.
Majewski, D., Liermann,D., Prohl, P., Ritter, B., Buchhold,M., Hanisch, T., Paul, G.,Wrgen, W., Baumgardner, J., 2002. The operational global icosahedral–hexagonal gridpoint model GME: description and high-resolution tests.Mon. Weather Rev. 130, 319–338.
Marcelino, E.V., Rudorff, F.M., Goerl, R.F., Haas, R., 2008. Observations ‘in loco’realized during the passage of hurricane Catarina. Caminhos Geogr. 9,37–56 (in Portuguese).
McTaggart-Cowan, R., Bosart, L.F., Davis, C.A., Atallah, E.H., Gyakum, J.R.,Emanuel, Kerry A., 2006. Analysis of Hurricane Catarina (2004). Mon.Weather Rev. 134, 3029–3053.
Menezes, W.F., Silva Dias, P.L., 2004. A sensitivity study of RAMS physicalparameterization to simulate cyclone Catarina. 13th Brazilian Meteoro-logical Conference, Fortaleza, Brazil. 10 pp. (In Portuguese).
Molinari, J., Moore, P., Idone, V., 1999. Convective structure of hurricanes asrevealed by lightning locations. Mon. Weather Rev. 127, 520–534.
Nakano, M., Nakajima, K., 2004. Influence of vertical wind shear on the initialvortex formation of tropical cyclone. 26th Conf. on Hurricane and TropicalMeteorology, 2004. AMS, Miami. Paper P1.49.
Nguyen, V.S., Smith, R., Montgomery, M., 2008. Tropical-cyclone intensificationand predictability in three dimensions. Q. J. R. Meteorol. Soc. 134, 563–582.
Pezza, A.B., Simmonds, I., 2005. The first South Atlantic hurricane:unprecedented blocking, low shear and climate change. Geophys. Res.Lett. 32, L15712. doi:10.1029/2005GL023390.
Pezza, A. B. and I. Simmonds, 2006. Catarina: The first South Atlantic hurricaneand its association with vertical wind shear and high latitude blocking. In:
International Conference on Southern Hemisphere Meteorology and Ocean-ography (ICSHMO), 8, 2006, Fozdo Iguaçu. Proceedings. São JosédosCampos:INPE, 2006, p. 353–364. CD-ROM. ISBN 85-17-00023-4.
Pezza, A.B., Simmonds, I., 2008. Tropical and extratropical cyclone transitionand links with rare hurricanes and extreme weather. Ann. N.Y. Acad. Sci.1146, 189–211. doi:10.1196/1446.005.
Pezza, A.B., Simmonds, I., Pereira Filho, A., 2009. Climate perspective on thelarge scale circulation associated with the transition of the first SouthAtlantic Hurricane. Int. J. Climatol. 29, 1116–1130. doi:10.1002/joc.1757.
Price, J.F., 1981. Upper ocean response to a hurricane. J. Phys. Oceanogr. 11,153–175.
Reale, O., Atlas, R., 2001. Tropical cyclone-like vortices in the extratropics:observational evidence and synoptic analysis. Weather Forecast. 16, 7–34.
SilvaDias, P.L., SilvaDias,M.A.F., Seluchi,M.,Diniz, F.A., 2004. TheCatarinaCyclone:preliminary analysis of structure, dynamics and predictability. 13th BrazilianMeteorological Conference, Fortaleza, Brazil. 10 pp. In Portuguese.
Simpson, R.H., 1974. The hurricane disaster potential scale. Weatherwise 27,169–186.
Toracinta, E.R., Cecil, D.J., Zipser, E.J., Nesbitt, S.W., 2002. Radar, passivemicrowave, and lightning characteristics of precipitating systems in thetropics. Mon. Weather Rev. 130, 802–824.
Vasquez, T., 2002. Weather Forecasting Handbook.Weather Graphics Technol-ogies. 198 pp.
Veiga, A.J.P., Pezza, A.B., Simmonds, I., Silva Dias, P.L., 2008. An analysis of theenvironmental energetics associated with the transition of the firstSouth Atlantic Hurricane. Geophys. Res. Lett. 35, L15806. doi:10.1029/2008GL034511.
Vianna, M.L., Menezes, V., 2008. Interactions between Hurricane Catarina(2004) and Warm Core Rings in the South Atlantic Ocean. InternationalMeeting on South Atlantic Cyclone Track, Prediction and Risk evaluation.Rio de Janeiro, May 2008. Available from http://www.lpm.meteoro.ufrj.br/meeting/palestras/.
Vianna, M.L., Menezes, V., Chambers, D.P., 2007. A high resolution satellite-only GRACE-based mean dynamic topography of the South AtlanticOcean. Geophys. Res. Lett 34, L24604. doi:10.1029/2007GL031912.
Wu, C.-C., Lee, C.-Y., Lin, I.-I., 2007. The effect of the ocean eddy on tropicalcyclone intensity. J. Atmos. Sci. 64, 3562. doi:10.1175/JAS4051.1.