FOREIGN EXCHANGE RATE EXPOSURE AND STOCK PRICE: EVIDENCE FROM INDIA
37
FOREIGN EXCHANGE RATE EXPOSURE AND STOCK PRICE: EVIDENCE FROM INDIA Dr. Anindita Chakraborty, Asst. Professor, Faculty of Management Studies, Banaras Hindu University, Varanasi, Ph: 096215-22587/094253-40768. E-mail id: [email protected].
Transcript of FOREIGN EXCHANGE RATE EXPOSURE AND STOCK PRICE: EVIDENCE FROM INDIA
FOREIGN EXCHANGE RATE EXPOSURE AND STOCK PRICE:
EVIDENCE FROM INDIA
Dr. Anindita Chakraborty, Asst. Professor, Faculty
of Management Studies, Banaras Hindu University,
Varanasi, Ph: 096215-22587/094253-40768. E-mail
id: [email protected].
DECLARATION
I, Dr. Anindita Chakraborty, being the first author of the paper
hereby declare that the paper entitled “Foreign Exchange Rate
Exposure and Stock Price: Evidence from India” is unpublished
original paper & it is not sent anywhere for publication in any
journal /newspaper. This paper is prepared by me exclusively for
your Journal. The secondary data collected and used absolutely
for this research paper and it is not used and analyzed anywhere
else. I also like to state that I had followed the guidelines for
the author of this journal.
Signature
Name: Dr. Anindita
Chakraborty
Designation: Asst. Professor
Official address: Faculty of Management Studies,
Banaras Hindu University
Phone No: 096215-22587,
094253-40768
E-Mail Address:

FOREIGN EXCHANGE RATE EXPOSURE AND STOCK PRICE:
EVIDENCE FROM INDIA
ABSTRACT
This paper examines the foreign exchange exposure of a sample of
Indian importing and exporting firms. Using daily data, the study
construct estimates of the exchange rate sensitivity of the firms
with the help of Adler & Simon model (1986) and Jorion’s approach
(1990). The findings of the study revealed that 15 % of sample
firms had a positive and significant economic exposure for the
examined period in case of NSE listed companies whereas 7% for
BSE listed companies when exposure was calculated through Adler &
Simon model (1986). Further the application of Jorion’s approach
(1990) revealed that 46 % of sample firms have a positive and
significant economic exposure for the examined period in case of
NSE listed companies whereas 11% for BSE listed companies where
level of significance is 10%. The proportion and mean exposure

coefficient were high for exporter companies compare to non-
exporter.
Key words: Foreign exchange exposure, Transaction exposure,
Economic exposure, Translation exposure
INTRODUCTION
Ever since the collapse of the Bretton Woods fixed-parity system
in the early 1970s, the volatility of exchange rates and its
associated risks have become an increasingly important
constituent of multinational financial management. As the nature
of business becomes international, many firms are exposed to risk
of fluctuating exchange rates. Foreign exchange risk refers to
the adverse effects of changes in foreign exchange rates on
firm's income and equity. Changes in exchange rates may affect
the settlement of contracts, cash flows and the valuation of the
firms. Therefore, it becomes necessary for the managers to know
the firm’s foreign currency exposure and thus manage the
exposure. The wide currency fluctuations experienced during the
last few decades results in the ever more keen interest in the
potential exposure of multinational firms to foreign exchange
rate risk, and this issue has initiate a considerable amount of
research.
Numerous research papers analytically focus on the exchange rates
and examined that it is a major source of uncertainty for
multinational firms (Jorion, 1990) and therefore exchange rate
risk is of great concern to both market participants and
managers. The investors are concerned with the impact of
unexpected changes in the exchange rate as it relates to
portfolio values, whereas the managers are concerned with the
exposure of the firm as it relates to profitability (Pantzalis et
al, 2001). Exchange rate fluctuations affect operating cash
flows and firm value through translation, transaction, and
economic effects of exchange rate risk exposure (Choi and Prasad,
1995).

The estimation of exchange rate exposure is a relatively new area
in multinational finance (Bodnar and Wong, 2000). From
theoretical perspective there are three types of exposures:
transaction, economic and translation exposure. Transaction
exposure can be defined as the sensitivity of the realized
domestic currency values of the firm’s contractual cash flows
denominated in foreign currencies to unexpected exchange rate
changes. Economic exposure can be defined as the extent to which
the values of the firm would be affected by the unanticipated
changes in the exchange rate. The changes in the exchange rates
can have a profound effect on the firm’s competitive position in
the world market and the thus on its cash flows and market value.
While translation exposure refers to the potential that the
firm’s consolidated financial statements can be affected by
changes in exchange rates. Thus, exchange rate changes have
important implications for financial decision-making and for firm
profitability.
This paper studies the exchange rate exposure of firms involved
in international trading. Like many firms, companies involved in
international trading are highly affected by exchange rate
fluctuations; it affects most directly those firms which are
involved in foreign currency transactions and foreign operations.
Even without such activities, exchange rates also affect all
industries indirectly. Adler and Dumas (1984) showed that even
firms whose entire operations were domestic then also they may be
affected by exchange rates, if their input and output prices were
influenced by currency movements. The purpose of this paper is to
examine the size and significance of the exchange rate exposure
of the Indian listed companies. To that end, the paper first
estimate the exchange rate sensitivity of the equity returns of a
sample of NSE and BSE listed import and export companies and then
estimate the overall impact. Two models were used to estimate the
foreign exchange rate sensitivity such as Adler & Simon model
(1986) and Jorion’s approach (1990).
Model for Economic Exposure Measurement
To measure the Indian firms’ economic exposure Adler & Simon (1986)
model was used. The paper measure economic exposure as the slope
coefficient from a regression of stock returns on exchange rates.
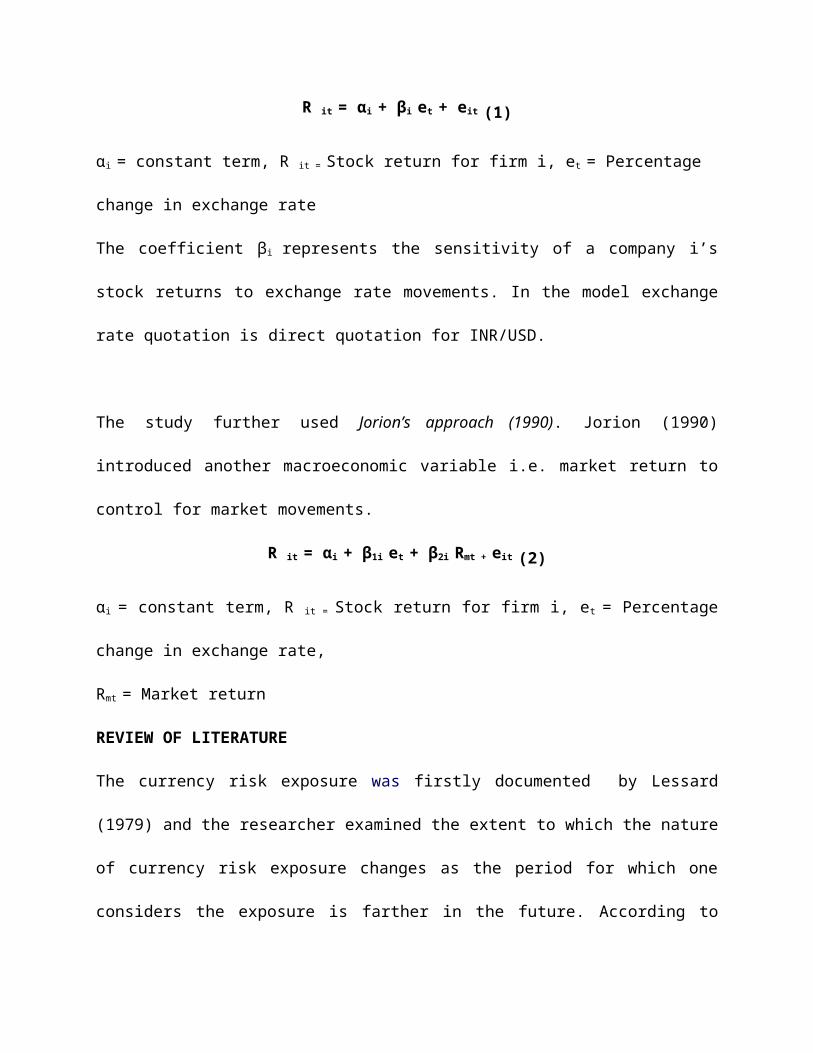
R it = αi + βi et + eit (1)
αi = constant term, R it = Stock return for firm i, et = Percentage
change in exchange rate
The coefficient βi represents the sensitivity of a company i’s
stock returns to exchange rate movements. In the model exchange
rate quotation is direct quotation for INR/USD.
The study further used Jorion’s approach (1990). Jorion (1990)
introduced another macroeconomic variable i.e. market return to
control for market movements.
R it = αi + β1i et + β2i Rmt + eit (2)
αi = constant term, R it = Stock return for firm i, et = Percentage
change in exchange rate,
Rmt = Market return
REVIEW OF LITERATURE
The currency risk exposure was firstly documented by Lessard
(1979) and the researcher examined the extent to which the nature
of currency risk exposure changes as the period for which one
considers the exposure is farther in the future. According to

Jorion (1990) exchange-rate exposure was related to the portion
of total sales made in a foreign country by US multinationals.
He thus admits that exchange rate risk appears to be
diversifiable. If exposure could be priced in an arbitrage
pricing framework, then the firms could hedge the exposure.
Bartov et al (1996) examined that the volatility of both current
and future cash flows of internationally active as well as
domestic firms has been rising since the collapse of fixed parity
regime and results in the currency risk exposure.
Shapiro (1975) concluded that the main determinants of exchange
rate risk are the proportion of foreign sales, the
substitutability of production factors, and the level of
intensity of competition. Corporations with a high proportion of
foreign sales, or with direct foreign investment, will experience
significant exposure to exchange rate fluctuations. While Choi
and Prasad (1995) depicted that the exchange risk sensitivity of
firms depends on their operating profiles, financial strategies,
and other firm-specific variables. It is discerning that the
cash flow sensitivity of a firm to exchange rates should depend

on the nature of a firm’s activities, such as the extent to
which it imports/exports, its involvement in foreign operations,
the currency denomination of its competition, and the
competitiveness of its input and output markets. Adler and Dumas
(1984) showed that exposure to exchange rate risk is similar to
that of market risk measured in the traditional sense. Therefore,
the average exposure to exchange risk can be obtained by
regressing the stock returns on the changes of exchange rates.
Bodnar and Wong (2000) revealed that the theoretical examination
of exposure coincides with the interest of a firm’s managers in
understanding how their firm’s cash flows will be affected by
exchange rate change in order to make value-maximizing risk
management decisions.
Bodner and Gentry (1993) examined industry level exposures for
three countries, Canada, Japan and USA. They revealed that some
industries in all three countries had significant exposure.
Several studies focused on the some companies and they
demonstrated that exporter firms’ stock values are more sensitive
to change in foreign exchange rates (Mao and Kao, 1990; Bortov

and Bodnar, 1992). Bartram and Karolyi (2006) found that the
foreign exchange rate exposure of nonfinancial firms is
systematically related to firm characteristics, regional factors
and industry characteristics. Adjas et al (2008) looked at the
relationship between stock markets and foreign exchange market,
and examined whether movements in exchange rates have an effect
on stock market in Ghana. They found that there was negative
relationship between exchange rate volatility and stock market
returns – a depreciation in the local currency leads to an
increase in stock market returns in the long run. Where as in the
short run it reduces stock market returns.
The studies on emerging markets include Mishra (2004), Adjas et
al (2008); and Koutmos et al (1993). In the studies of Smith
(1992) and Apte (2001) they have found a significant positive
relationship between stock prices and exchange rates while
others, like Ajayi and Mougoue (1996), Mao and Kao (1990) have
reported a significant negative relationship between the two
variables. Whereas in some studies of Bartov and Bodnar (1994),
Frank and Young (1972), they have reported very weak or no

relationship between stock prices and exchange rates. While
studies have so far documented weak relationships between
exchange rates and stock returns, international evidence focusing
on more open economies yield more significant currency risk
exposure. Thus there is always a question of debate which needs
to be answered. Therefore this study will be helpful and add new
dimension to the existing theory and research.
OBJECTIVES OF THE STUDY
1. To evaluate the exchange rate sensitivity INR/USD with the
help of Adler & Simon model (1986).
2. To evaluate the exchange rate sensitivity INR/USD with the
help of Jorion’s approach (1990).
3. To open new vistas for further research.
RESEARCH METHODOLOGY
The study was empirical in nature and the total population of the
study consisted of all the listed companies of India those who
are involved in international trade i.e. importing and exporting.
The time frame of the study was from the year 2000-2010 and the

sample size was 30 listed companies from BSE and NSE which are
involved in international trade. The sampling element of the
study was stock prices, exchange rate and market prices of the
listed companies. Purposive sampling technique was used to
complete the study and the data was collected from secondary
sources through official website of NSE, BSE and yahoo finance.
Tools for Data Analysis
1. Adler & Simon model (1986)
R it = αi + βi et + eit
αi = constant term
R it = Stock return for firm i.
et = Percentage change in exchange rate
2. Jorian’s Approach (1990)
R it = αi + β1i et + β2i Rmt + eit
αi = constant term
R it = Stock return for firm i.
et = Percentage change in exchange rate
Rmt = Market return
RESULT AND DISCUSSION
In this study two models were applied and ordinary least square
regression was used to estimate both the models. Exchange rate
sensitivity of firm value was measured by using stock return,
firstly, regressed real effective exchange rate on all sample
value. Then sample was divided into two groups Exporter and
Importer companies and exchange rate sensitivity of each group
was examined.
1. Adler and Simons Model
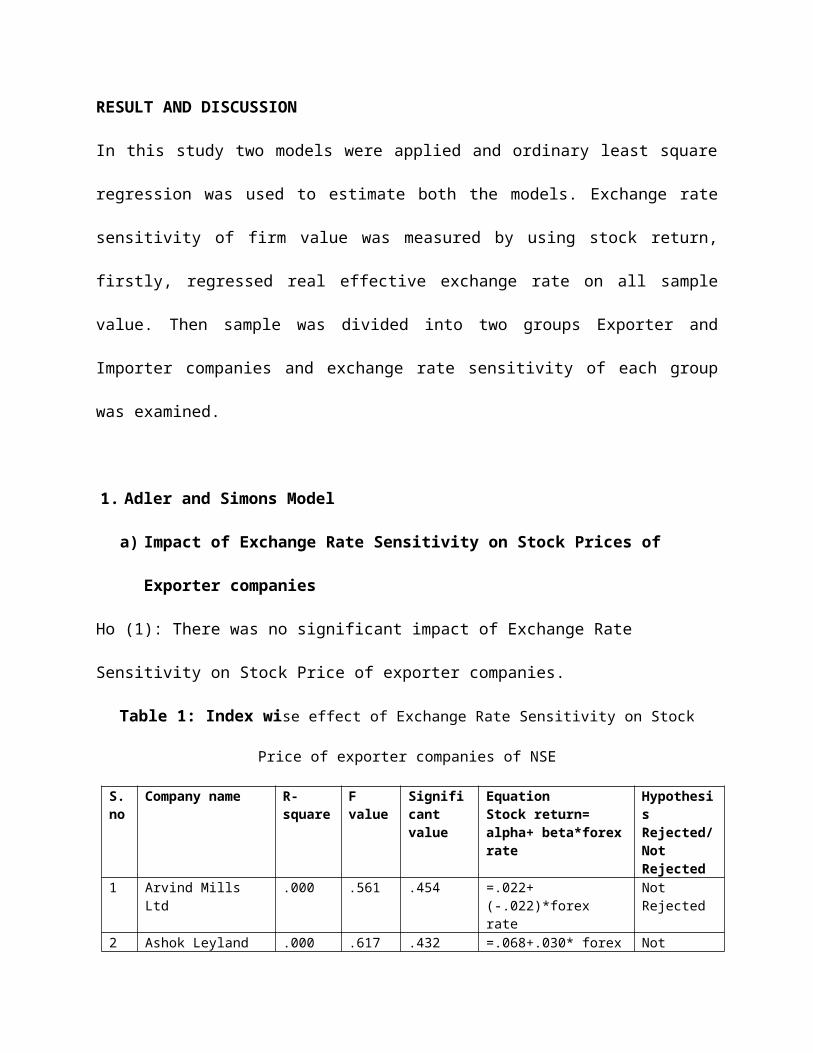
a) Impact of Exchange Rate Sensitivity on Stock Prices of
Exporter companies
Ho (1): There was no significant impact of Exchange Rate
Sensitivity on Stock Price of exporter companies.
Table 1: Index wise effect of Exchange Rate Sensitivity on Stock
Price of exporter companies of NSE
S.no
Company name R- square
F value
Significant value
EquationStock return= alpha+ beta*forexrate
Hypothesis Rejected/Not Rejected
1 Arvind Mills Ltd
.000 .561 .454 =.022+(-.022)*forex rate
Not Rejected
2 Ashok Leyland .000 .617 .432 =.068+.030* forex Not

rate Rejected3 Asian Paints .000 .002 .546 =.070+(-.018)*
forex rateNot Rejected
4 ASIL .006 4.209 .041 =-.127+.040* forex rate
Rejected
5 Birla Power .005 4.733 .030 =.382+(-.010)* forex rate
Rejected
6 Cipla .003 5.420 .020 =-.079+.001* forex rate
Rejected
7 Escorts .000 .647 .421 =-.051+(-.033)* forex rate
Not Rejected
8 Hexaware .000 1.052 .305 =.006+.009* forexrate
Not Rejected
9 Infosys .000 .003 .959 =.000+(-.067)* forex rate
Not Rejected
10 Liberty Shoe .001 1.979 .160 =-.033+.004* forex rate
Not Rejected
11 Maruti .001 1.512 .219 =.115+.017* forexrate
Not Rejected
12 Mastek .000 .042 .837 =.034+.022* forexrate
Not Rejected
13 Mphasis .000 .000 .989 =-.030+.022* forex rate
Not Rejected
14 P & G Hygine .000 .378 .539 =-.071+010* forexrate
Not Rejected
15 Patni .000 .222 .638 =-.038+.016* forex rate
Not Rejected
16 Philips Carbon .008 16.605
.000 =-.117+.002* forex rate
Rejected
17 Polaris .001 1.270 .260 =-.092+(-.001)* forex rate
Not Rejected
18 TCS .000 .136 .713 =-.093+.049* forex rate
Not Rejected
19 Tech Mahindra .001 .745 .388 =.028+(-.036)* forex rate
Not Rejected
20 Wipro .000 .235 .628 =.048+(-.002)* forex rate
Not Rejected
The impact of exchange rate volatility on stock price of NSE
export companies was insignificant at 5% level of significance,
except ASIL, Birla Power, Cipla & Polaris. The value of Beta was
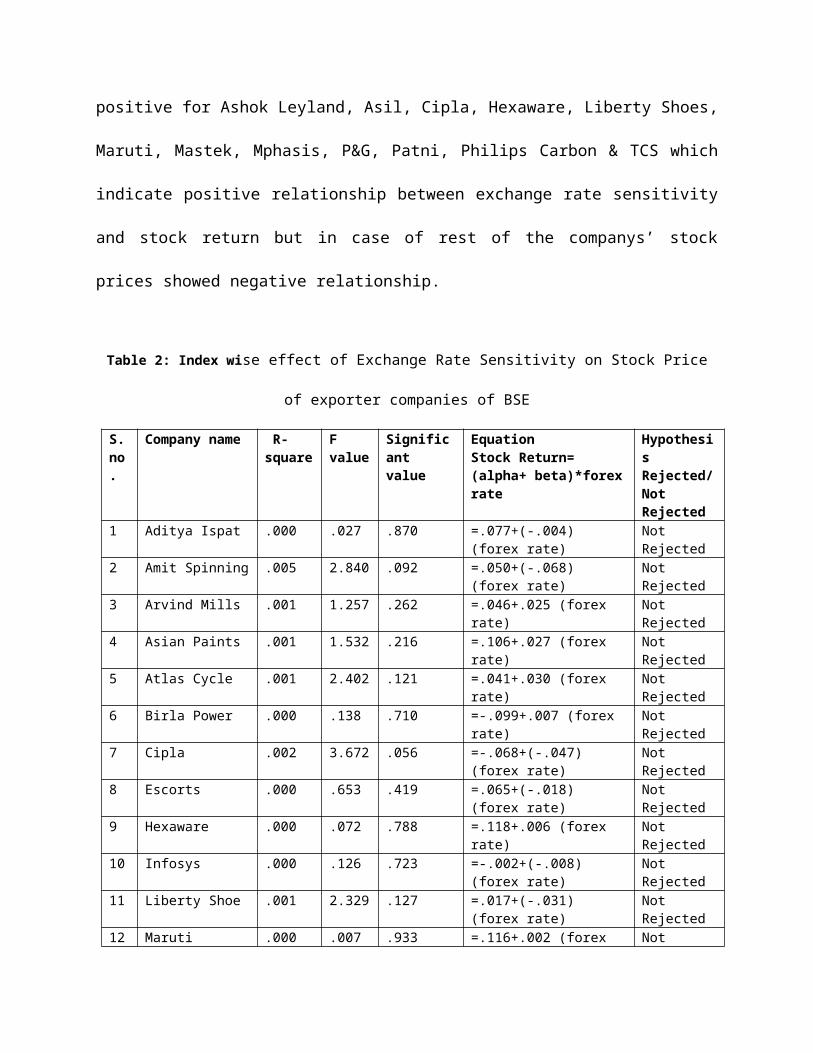
positive for Ashok Leyland, Asil, Cipla, Hexaware, Liberty Shoes,
Maruti, Mastek, Mphasis, P&G, Patni, Philips Carbon & TCS which
indicate positive relationship between exchange rate sensitivity
and stock return but in case of rest of the companys’ stock
prices showed negative relationship.
Table 2: Index wise effect of Exchange Rate Sensitivity on Stock Price
of exporter companies of BSE
S.no.
Company name R- square
F value
Significant value
EquationStock Return= (alpha+ beta)*forexrate
HypothesisRejected/Not Rejected
1 Aditya Ispat .000 .027 .870 =.077+(-.004) (forex rate)
Not Rejected
2 Amit Spinning .005 2.840 .092 =.050+(-.068) (forex rate)
Not Rejected
3 Arvind Mills .001 1.257 .262 =.046+.025 (forex rate)
Not Rejected
4 Asian Paints .001 1.532 .216 =.106+.027 (forex rate)
Not Rejected
5 Atlas Cycle .001 2.402 .121 =.041+.030 (forex rate)
Not Rejected
6 Birla Power .000 .138 .710 =-.099+.007 (forex rate)
Not Rejected
7 Cipla .002 3.672 .056 =-.068+(-.047) (forex rate)
Not Rejected
8 Escorts .000 .653 .419 =.065+(-.018) (forex rate)
Not Rejected
9 Hexaware .000 .072 .788 =.118+.006 (forex rate)
Not Rejected
10 Infosys .000 .126 .723 =-.002+(-.008) (forex rate)
Not Rejected
11 Liberty Shoe .001 2.329 .127 =.017+(-.031) (forex rate)
Not Rejected
12 Maruti .000 .007 .933 =.116+.002 (forex Not
rate) Rejected13 Mastek .000 .010 .919 =-.050+.002 (forex
rate)Not Rejected
14 Mphasis .001 1.678 .195 =.026+(-.027) (forex rate)
Not Rejected
15 Philips Carbon
.000 .880 .348 =.108+.021 (forex rate)
Not Rejected
16 Polaris .000 .271 .603 =-.065+(-.010) (forex rate)
Not Rejected
17 TCS .000 .432 .511 =.085+(-.014) (forex rate)
Not Rejected
18 Tech Mahindra .000 .475 .491 =.021+.022 (forex rate)
Not Rejected
19 Wipro .000 .088 .767 =-.067+(-.007) (forex rate)
Not Rejected
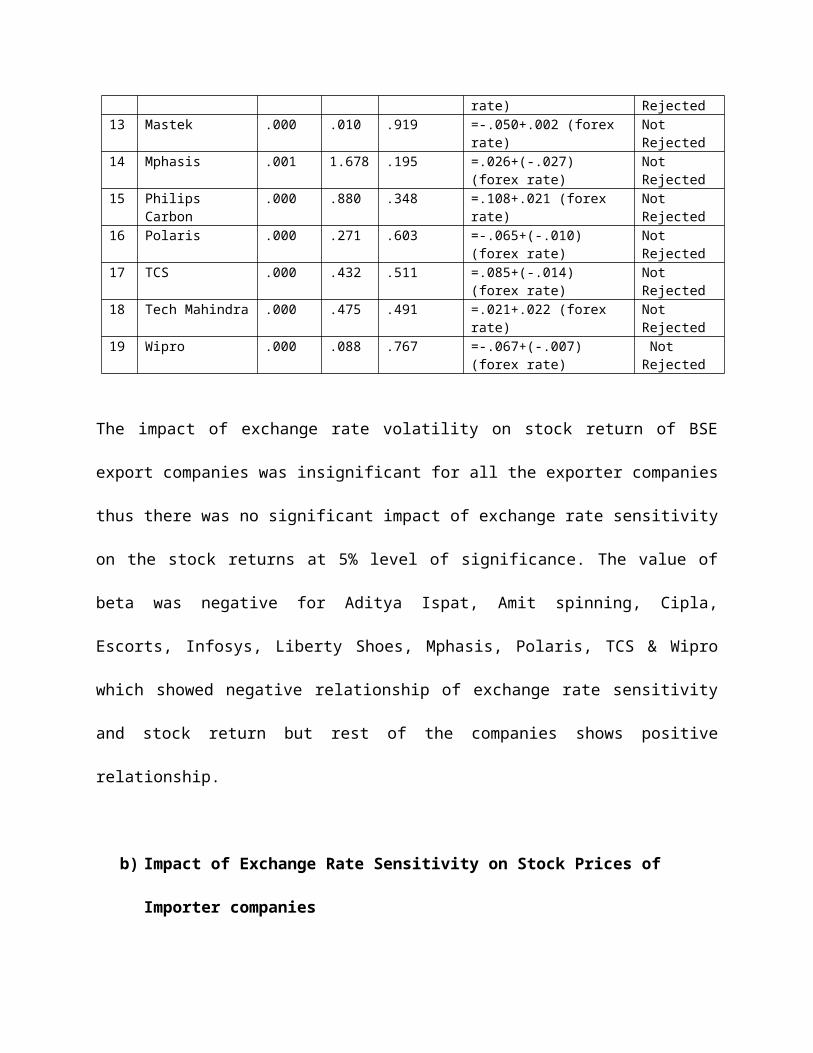
The impact of exchange rate volatility on stock return of BSE
export companies was insignificant for all the exporter companies
thus there was no significant impact of exchange rate sensitivity
on the stock returns at 5% level of significance. The value of
beta was negative for Aditya Ispat, Amit spinning, Cipla,
Escorts, Infosys, Liberty Shoes, Mphasis, Polaris, TCS & Wipro
which showed negative relationship of exchange rate sensitivity
and stock return but rest of the companies shows positive
relationship.
b) Impact of Exchange Rate Sensitivity on Stock Prices of
Importer companies
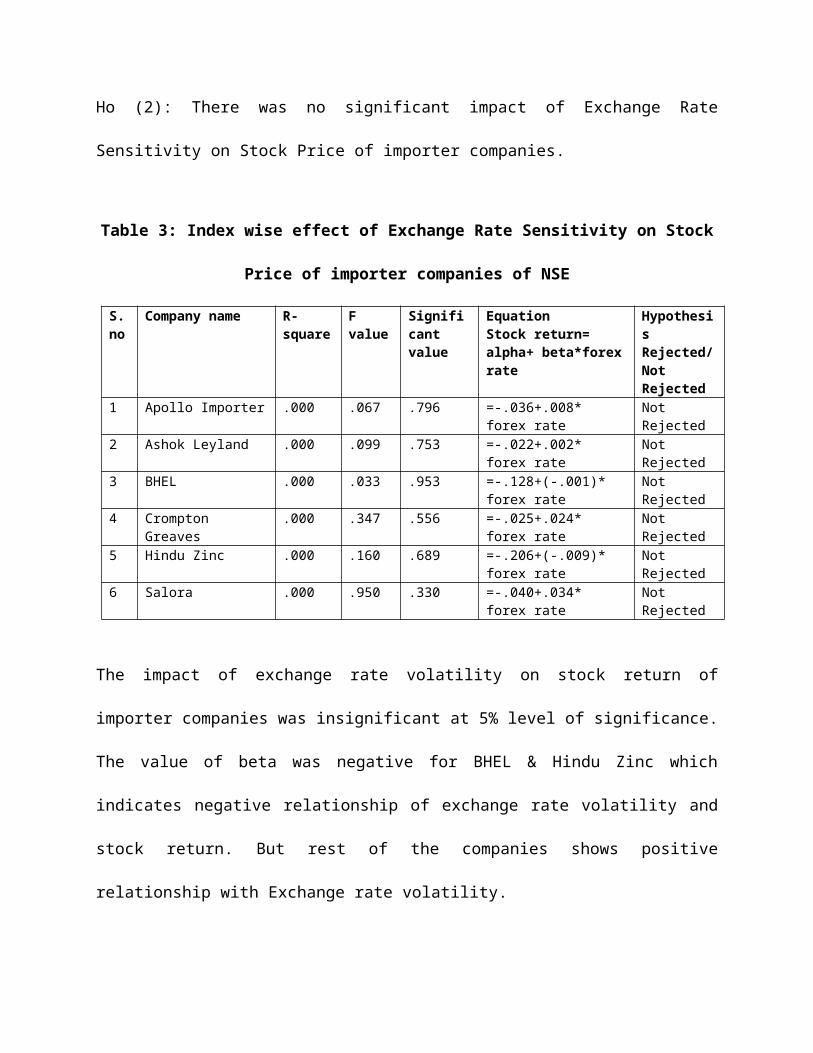
Ho (2): There was no significant impact of Exchange Rate
Sensitivity on Stock Price of importer companies.
Table 3: Index wise effect of Exchange Rate Sensitivity on Stock
Price of importer companies of NSE
S.no
Company name R- square
F value
Significant value
EquationStock return= alpha+ beta*forexrate
Hypothesis Rejected/Not Rejected
1 Apollo Importer .000 .067 .796 =-.036+.008* forex rate
Not Rejected
2 Ashok Leyland .000 .099 .753 =-.022+.002* forex rate
Not Rejected
3 BHEL .000 .033 .953 =-.128+(-.001)* forex rate
Not Rejected
4 Crompton Greaves
.000 .347 .556 =-.025+.024* forex rate
Not Rejected
5 Hindu Zinc .000 .160 .689 =-.206+(-.009)* forex rate
Not Rejected
6 Salora .000 .950 .330 =-.040+.034* forex rate
Not Rejected
The impact of exchange rate volatility on stock return of
importer companies was insignificant at 5% level of significance.
The value of beta was negative for BHEL & Hindu Zinc which
indicates negative relationship of exchange rate volatility and
stock return. But rest of the companies shows positive
relationship with Exchange rate volatility.

Table 4: Index wise effect of Exchange Rate Sensitivity on Stock Price
of importer companies of BSE
S.no
Company name R- square
F value
Significant value
EquationStock return= alpha+ beta*forexrate
Hypothesis Rejected/Not Rejected
1 Apollo Tyres .000 .339 .561 =.067+(-.020) (forex rate)
Not Rejected
2 Ashok Leyland .000 .027 .870 =.074+.004 (forexrate)
Not Rejected
3 BEL .001 1.127 .289 = .099+(-.023) (forexrate)
Not Rejected
4 BHEL .000 .400 .527 =.125+(-.014) (forex rate)
Not Rejected
5 Crompton Greaves
.000 .037 .847 =.040+(-.006) (forex rate)
Not Rejected
6 Hindu Zinc .000 .357 .550 =.207+.013 (forexrate
Not Rejected
7 Jamna Auto .000 .264 .607 =.073+.013 (forexrate)
Not Rejected
8 Salora .000 .468 .494 =(-.103+.014) (forex rate)
Not Rejected
The impact of exchange rate volatility on stock return of
importer companies which were listed in BSE was insignificant.
The stock return of Apollo Tyres, Bharat Electrics Limited,
Bharat Heavy Electricals Limited and Crompton Greaves showed
negative relationship with exchange rate volatility and rest of
the companies’ stock return shows positive relationship.
c) Foreign Exchange Exposure of Indian Companies listed in NSE.
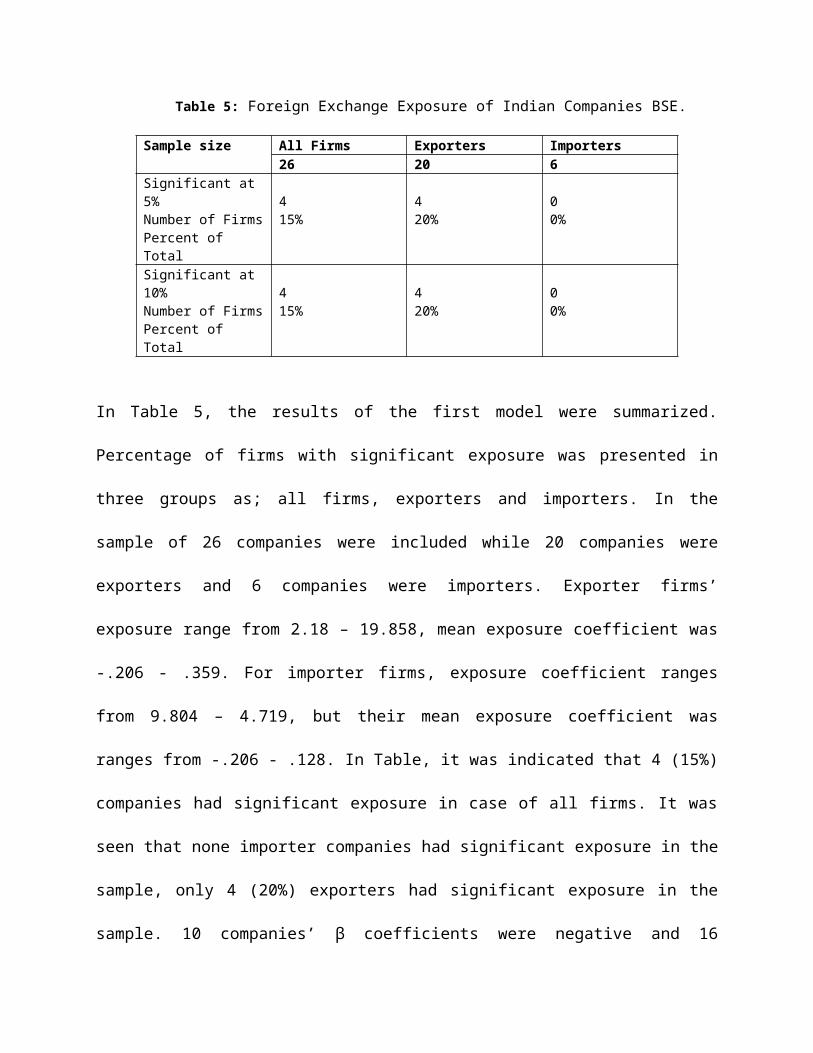
Table 5: Foreign Exchange Exposure of Indian Companies BSE.
Sample size All Firms Exporters Importers26 20 6
Significant at 5%Number of FirmsPercent of Total
415%
420%
00%
Significant at 10%Number of FirmsPercent of Total
415%
420%
00%
In Table 5, the results of the first model were summarized.
Percentage of firms with significant exposure was presented in
three groups as; all firms, exporters and importers. In the
sample of 26 companies were included while 20 companies were
exporters and 6 companies were importers. Exporter firms’
exposure range from 2.18 – 19.858, mean exposure coefficient was
-.206 - .359. For importer firms, exposure coefficient ranges
from 9.804 – 4.719, but their mean exposure coefficient was
ranges from -.206 - .128. In Table, it was indicated that 4 (15%)
companies had significant exposure in case of all firms. It was
seen that none importer companies had significant exposure in the
sample, only 4 (20%) exporters had significant exposure in the
sample. 10 companies’ β coefficients were negative and 16

companies’ were positive which reveals that most of the
companies’ stock returns appreciate with a increase in Exchange
Rate .
d) Foreign Exchange Exposure of Indian Companies listed in BSE.
Table 6: Foreign Exchange Exposure of Indian Companies BSE.
Sample size All Firms Exporters Importers27 19 8
Significant at 5%Number of FirmsPercent of Total
00%
00%
00%
Significant at 10%Number of FirmsPercent of Total
27%
210%
00%
In Table 6, the results of the first model were summarized.
Percentage of firms with significant exposure was presented in
three groups as; all firms, exporters and importers. In the
sample of 27 companies were included while 19 companies were
exporters and 8 companies were importers. Exporter firms’
exposure range from 1.683 - 6.056, mean exposure coefficient was
-.102- .116. For importer firms, exposure range from 5.535 –
1.81, mean coefficient ranges from -.103 - .126. In Table, it was
indicated that none companies had significant exposure. 14
companies’ β coefficients were negative and 9 companies’ were
positive which reveals that most of the companies’ stock returns
appreciate from Exchange Rate volatility.
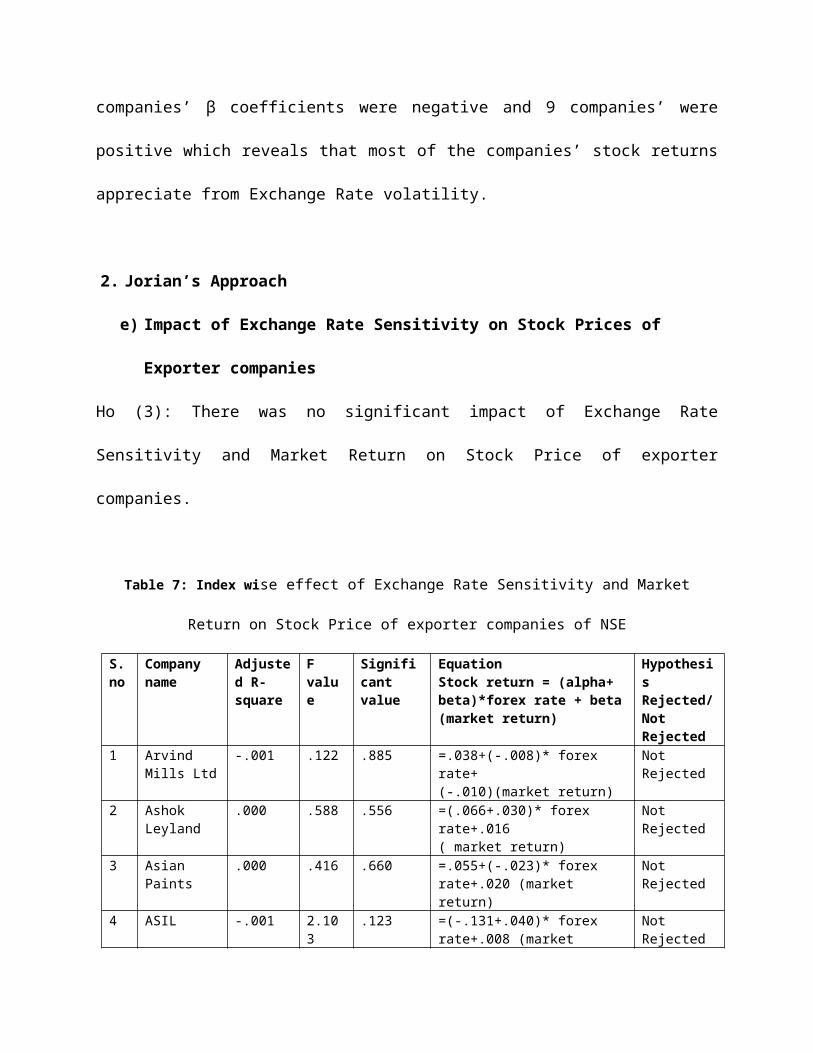
2. Jorian’s Approach
e) Impact of Exchange Rate Sensitivity on Stock Prices of
Exporter companies
Ho (3): There was no significant impact of Exchange Rate
Sensitivity and Market Return on Stock Price of exporter
companies.
Table 7: Index wise effect of Exchange Rate Sensitivity and Market
Return on Stock Price of exporter companies of NSE
S.no
Company name
Adjusted R- square
F value
Significant value
EquationStock return = (alpha+ beta)*forex rate + beta(market return)
HypothesisRejected/Not Rejected
1 Arvind Mills Ltd
-.001 .122 .885 =.038+(-.008)* forex rate+(-.010)(market return)
Not Rejected
2 Ashok Leyland
.000 .588 .556 =(.066+.030)* forex rate+.016( market return)
Not Rejected
3 Asian Paints
.000 .416 .660 =.055+(-.023)* forex rate+.020 (market return)
Not Rejected
4 ASIL -.001 2.103
.123 =(-.131+.040)* forex rate+.008 (market
Not Rejected

return)5 Birla
Power -.002 2.37
4.760 =.336+(-.010)* forex
rate+.023 (market return)
Not Rejected
6 Cipla .001 3.165
.042 =-.069+(-.001)* forex rate+(-.042) (market return)
Rejected
7 Escorts .001 99.290
.000 =-.056+(-.032)* forex rate+.021 (market return)
Rejected
8 Hexaware -.001 4.214
.015 =-.001+.007* forex rate+.011 (market return)
Rejected
9 Infosys .005 1.520
.219 =.009+(-.068)* forex rate+(-.041) (market return)
Not Rejected
10 Liberty Shoe
.000 27.404
.000 =(-.026+.003)* forex rate+(-.032) (market return)
Rejected
11 Maruti -.001 .821 .440 =.115+.017* forex rate+(-.001) (market return)
Not Rejected
12 Mastek .002 5.081
.006 =.067+.020* forex rate+(-.052) (market return)
Rejected
13 Mphasis .000 .278 .758 =(-.025+.020)* forex rate(-.009) (market return)
Not Rejected
14 P & G Hygine
.000 8.578
.000 =(-.073+.011)* forex rate+.021 (market return)
Rejected
15 Patni .003 10.265
.000 =(-.047+.018)* forex rate+.061 (market return)
Rejected
16 Philips Carbon
-.001 12.122
.000 =(-.118+.002)* forex rate+.002 (market return)
Rejected
17 Polaris .000 .902 .406 =(-.135+.019)* forex rate+(-.014) (market return)
Not Rejected
18 TCS .001 16.154
.000 =(-.092+.049)* forex rate+(-.001) (market return)
Rejected
19 Tech Mahindra
.000 .802 .449 =.033+(-.036)* forex rate+(-.018) (market return)
Not Rejected
20 Wipro .001 37.198
.000 =.031+(-.001)* forex rate+.048 (market
Rejected

return)
The impact of exchange rate volatility and market return on stock
price of NSE export companies was insignificant, except Cipla,
Escorts, Hexaware, Liberty Shoes, Mastek, P&G, Patni, Philips
carbon, TCS & Wipro. The value of Beta was negative for Arvind
Mills, Asian Paints, Birla power, Cipla, Escorts, Infosys, Tech
Mahindra & Wipro which indicate negative relationship of exchange
rate volatility and market return with stock return but rest of
the companies’ stock return shows positive relationship with
Exchange rate volatility and market return.
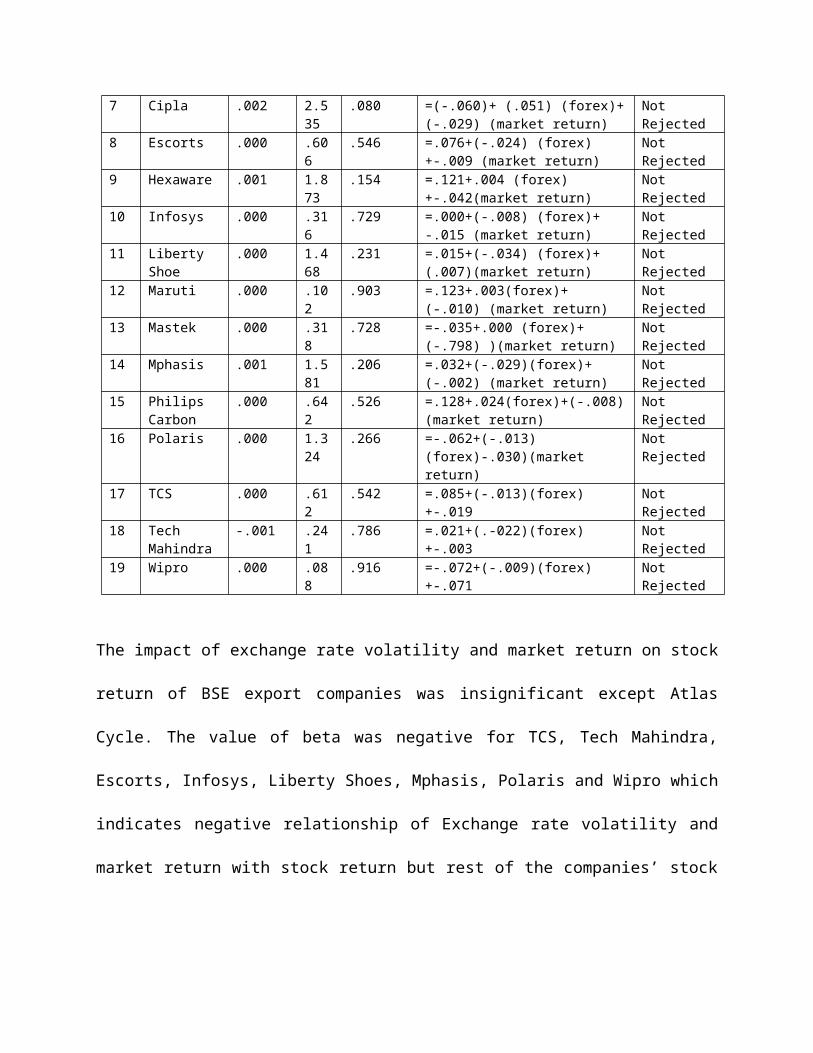
Table 8: Index wise effect of Exchange Rate Sensitivity and Market Return on
Stock Price of exporter companies of BSE
S. no
Company name
Adjusted R- square
F value
Significant value
EquationStock return = (alpha+ beta)*forex rate + beta (market return)
Hypothesis Rejected/Not Rejected
1 Aditya Ispat
.000 .146
.864 =.073+.012 (forex)+.000 (market return)
Not Rejected
2 Amit Spinning
.000 .699
.497 =.052+.042 (forex) +(-.021) (market return)
Not Rejected
3 Arvind Mills
.000 .699
.497 =.052+.042 (forex)+(-.021) (market return)
Not Rejected
4 Asian Paints
.000 .723
.486 =.108+.026 (forex)+-.003(market return)
Not Rejected
5 Atlas Cycle
.002 3.285
.038 =.049+.034 (forex)+.037 (market return)
Rejected
6 Birla Power
.000 .383
.682 =-.076+.005 (forex)+-.017(market return)
Not Rejected
7 Cipla .002 2.535
.080 =(-.060)+ (.051) (forex)+(-.029) (market return)
Not Rejected
8 Escorts .000 .606
.546 =.076+(-.024) (forex)+-.009 (market return)
Not Rejected
9 Hexaware .001 1.873
.154 =.121+.004 (forex)+-.042(market return)
Not Rejected
10 Infosys .000 .316
.729 =.000+(-.008) (forex)+ -.015 (market return)
Not Rejected
11 Liberty Shoe
.000 1.468
.231 =.015+(-.034) (forex)+ (.007)(market return)
Not Rejected
12 Maruti .000 .102
.903 =.123+.003(forex)+ (-.010) (market return)
Not Rejected
13 Mastek .000 .318
.728 =-.035+.000 (forex)+(-.798) )(market return)
Not Rejected
14 Mphasis .001 1.581
.206 =.032+(-.029)(forex)+ (-.002) (market return)
Not Rejected
15 Philips Carbon
.000 .642
.526 =.128+.024(forex)+(-.008)(market return)
Not Rejected
16 Polaris .000 1.324
.266 =-.062+(-.013)(forex)-.030)(market return)
Not Rejected
17 TCS .000 .612
.542 =.085+(-.013)(forex)+-.019
Not Rejected
18 Tech Mahindra
-.001 .241
.786 =.021+(.-022)(forex)+-.003
Not Rejected
19 Wipro .000 .088
.916 =-.072+(-.009)(forex)+-.071
Not Rejected
The impact of exchange rate volatility and market return on stock
return of BSE export companies was insignificant except Atlas
Cycle. The value of beta was negative for TCS, Tech Mahindra,
Escorts, Infosys, Liberty Shoes, Mphasis, Polaris and Wipro which
indicates negative relationship of Exchange rate volatility and
market return with stock return but rest of the companies’ stock

return showed positive relationship with Exchange rate volatility
and market return.
f) Impact of Exchange Rate Sensitivity on Stock Prices of
Importer companies
Ho (4): There was no significant impact of Exchange Rate
Sensitivity and Market Return on Stock Price of importer
companies.
Table 9: Index wise effect of Exchange Rate Sensitivity and Market
Return on Stock Price of importer companies of NSE
S. no
Company name
Adjusted R- square
F value
Significant value
EquationStock return = (alpha+beta)*forex rate + beta (market return)
HypothesisRejected/Not Rejected
1 Apollo .000 .034 .976 =-.061+(-.012)* forex rate+(-.007) (market return)
Not Rejected
2 Ashok Leyland
-.001 .499 .607 =-.050+(-.009)* forex rate+(-.009) (market return)
Not Rejected
3 BHEL -.001 7.196
.001 =-.124+(-.001)* forex rate+(-.010) (market return)
Rejected
4 CromptonGreaves
-.001 . .000 =(-.040+.024)* forex rate+.017 (market return)
Rejected
5 Hindu -.001 2.20 .111 =-.206(-.009)* forex Not

Zinc 5 rate+.001 (market return)
Rejected
6 Salora .001 1.372
.254 =(.024+.040)* forex rate+(-.004) (market return)
Not Rejected
The impact of Exchange rate volatility and market return on stock
return of importer companies which were listed in NSE was
insignificant except BHEL & Crompton greaves. The value of Beta
was positive for Crompton greaves and Salora which indicate
positive relationship of Exchange rate volatility and market
return with stock return. But rest of the companies’ stock return
showed negative relationship with Exchange rate volatility and
market return.
Table 10: Index wise effect of Exchange Rate Sensitivity and Market Return
on Stock Price of importer companies of BSE
S.no
Companyname
Adjusted R- square
F value
Significant value
EquationStock return = (alpha+ beta)*forex rate + beta(market return)
HypothesisRejected/Not Rejected
1 Apollo Tyres
.036 16.174
.000 =.053+(-.021) (forex) +.195( market return)
Rejected
2 Ashok Leyland
-.001 .062 .940 =-.072+.005 (forex)+.008( market return)
Not Rejected
3 BEL .000 .007 .493 =.101+(-.024) (forex)+ (-.011) ( market return)
Not Rejected

4 BHEL .000 .981 .375 =.129+(-.012) (forex)+ .028 ( market return)
Not Rejected
5 Crompton Greaves
.000 .879 .415 =.044+(-.004) (forex) +(-.040) ( market return)
Not Rejected
6 Hindu Zinc
.000 .298 .743 =.208+.013(forex)+ .012( market return)
Not Rejected
7 Jamna Auto
.000 .163 .850 =.074+.012(forex)+(-.006) ( market return)
Not Rejected
8 Salora .000 .791 .454 =(.124)+.012(forex)+.028(market return)
Not Rejected
The impact of exchange rate volatility and market return on stock
return of importer companies which were listed in BSE was
insignificant except Apollo Tyres. The stock return of Apollo
Tyres, BEL, BHEL, Crompton Greaves shows negative relationship
with exchange rate volatility and market return with stock return
and rest of the companies’ stock return showed positive
relationship.
g) Foreign Exchange Exposure of Indian Companies listed in NSE.
Table 11: Foreign Exchange Exposure of Indian Companies listed in NSE
Sample size All Firms Exporters Importers26 20 6
Significant at5%Number of Firms
1246%
1050%
233%

Percent of TotalSignificant at10%Number of FirmsPercent of Total
1246%
1050%
233%
In Table 11, the results of the first model were summarized.
Percentage of firms with significant exposure was presented in
three groups as; all firms, exporters and importers. In the
sample of 26 companies were included while 20 companies were
exporters and 6 companies were importers. Exporter firms’
exposure range from 9.804 – 1.685 mean exposure coefficient was
-.206 - .358. For importer firms, exposure ranges from 9.80 -
44.72, mean exposure coefficient was -.128 - .0633. In Table, it
was indicated that 12 (46%) companies had significant exposure.
It was seen that more companies had significant exposure than
importers in the sample, only 2 (33%) importers had significant
exposure and 10 (50%) companies had significant exposure in the
sample. 12 companies’ β coefficients were negative and 14
companies’ were positive which reveals that most of the

companies’ stock returns appreciate with a increase in Exchange
Rate .
h) Foreign Exchange Exposure of Indian Companies listed in BSE
Table 12: Foreign Exchange Exposure of Indian Companies listed in NSE
Sample size All Firms Exporters Importers27 19 8
Significant at 5%Number of FirmsPercent of Total
27%
15%
112.5%
Significant at 10%Number of FirmsPercent of Total
311%
210%
112.5%
In Table 12, the results of the first model were summarized.
Percentage of firms with significant exposure was presented in
three groups as; all firms, exporters and importers. In the
sample of 27 companies were included while 19 companies were
exporters and 8 companies were importers. Exporter firms’
exposure range from 6.056 to 1.683, mean exposure coefficient was
-.0788 to 0.122. For importer firms, exposure ranges from 5.53 to
1.81, mean exposure coefficient was ranges from -.116 to 0.206.
In Table, it was indicated that 1 exporter and 1 importer had

significant exposure in the sample. 12 companies’ β coefficients
were negative and 15 companies’ were positive which reveals that
most of the companies’ stock returns appreciate from an increase
in Exchange Rate.
CONCLUSION AND SUGGESTIONS
Exchange rate volatility has attracted much attention in
financial economics in developed and developing countries due to
its implications in the financial markets, especially the stock
market. Different implications were observed among exchange rate
volatility and stock market returns – depreciation in the local
currency leads to increases in stock market prices in the long
run. Where as in the short run it reduces stock market returns.
This study was undertaken to determine the effect of exchange
rate exposure on stock returns of exporter and importer companies
in India. The results showed that there was an inverse
relationship between exchange rate exposure and stock market
returns like the studies of Bartov and Bodnar (1994) and Frank
and Young (1972). The study also indicated that there was the
presence of foreign exchange exposure for some of the listed

exporter and importer companies. Thus the study provides mixed
results. This gives an indication that changes in the trade-off
between risk and return is predictable thus serving as a useful
guide for risk management and the investors can hedge this risk
with better risk management tools. This also implies that
investors may use macroeconomic variables to forecast stock
market volatility.
Further this also gives an indication to the sample companies
that they should also hedge their risk. The volatile nature of
the foreign exchange rate market results in the increased use of
forward contracts as the firms that import raw materials or
market their product internationally need to make use of these
instruments to hedge their payables and receipts. This will
enable them to lock in so as to go round the problem of exchange
rate volatility. It is also recommended that investors could
take into consideration the nature of volatility in the exchange
and other macroeconomic variables in the economy to make an
informed decision as to where to direct their investments. So
that whenever the local currency depreciates, it is a signal that
the stock market returns is likely to appreciate; especially for
an import dominated economy. But this argument is based on an
improvement in the international competitiveness of the local
firms. Finally, it is suggested that based on this study other
researchers can use data for other countries and periods of time
to study further the macroeconomic determinants of stock market
and foreign exchange market volatility.
REFERENCES
Adjasi, Charles, Harvey, Simon K. and Agyapong, Daniel
(2008), Effect of Exchange Rate Volatility on the Ghana
Stock Exchange, African Journal of Accounting, Economics, Finance and
Banking Research, Vol. 3, Issue 3, pp. 28-47.
Ajayi, R.A., and Mougoue, M. (1996), On the Dynamic
Relationship between Stock Prices and Exchange Rate, Journal
of Financial Research, Vol. 19, Issue 2, pp.193-207.
Apte, P.G. (1997), Currency Exposure and Stock Prices,
Journal of Foreign Exchange and International Finance, Vol. XII, , Issue
2, pp. 135-143.

Bartov, E., and Bodnar, G. M. (1994), Firm valuation,
earning expectations and the Exchange rate exposure effect,
Journal of Finance, December, pp. 1755-1786.
Bartov, E., Bodnar, G.M., and Kaul, A. (1996), Exchange rate
variability and the riskiness of US multinational firms:
evidence from the breakdown of the Bretton Woods system,
Journal of Financial Economics, Vol. 42, pp.105–132.
Bartram, S. M. and Karolyi, G. A. (2006), The impact of the
introduction of the Euro on foreign exchange rate risk
exposures, Journal of Empirical Finance, Vol.13, pp.519–549.
Bodnar, G. M. and Wong, M.H. Franco (2000), Estimating rate
exposures: some ‘weighty’ issues, Working Paper 7497, National
Bureau of Economic Research.
Bodnar, G. M., and Gentry, W. M. (1993), Exchange rate
exposure and industry characteristics: Evidence from Canade,
Japan and the USA, Journal of International Money and Finance, Vol.
12, pp. 29-45.
Choi, Jongmoo Jay, and Prasad, Anita Mehra, (1995), Exchange
risk sensitivity and its determinants: A firm and industry

analysis of U.S. Multinationals, Financial Management, Vol. 24,
No. 3, pp. 77-88.
Frank, P., and Young, A. (1972), Stock Price Reaction of
Multinational Firms to Exchange Realignments, Financial
Management, winter, pp.66–73, Principles of Economics, New
York, McGraw Hill/Irwin.
Jorion, Philippe. (1990), The exchange-rate exposure of U.S.
multinationals, Journal of Business, Vol. 63, Issue 3, pp.331
Koutmos, N.G. and Theodossiou, P. (1993), Stochastic
Behaviour of the Athens Stock Exchange, Applied Financial
Economics, Vol.3, No.2, pp. 119-126.
Lessard, D.R. (1979). International Financial Management:
Theory and Application. Warren Gorham and Lamont, Boston.
Mao, C. K. G., and W. Kao. (1990), On Exchange Rate Changes
and Stock Price Reactions, Journal of Business Finance and
Accounting, Vol. 17, Issue 3, pp. 441-449.
Mishra, K. A. (2004), Stock Market and Foreign Exchange
market in India: Are they related?, South Asia Economic Journal,
Vol. 5(2).

Shapiro, A.C. (1975), Exchange rate changes, inflation and
the value of the multinational corporation, Journal of Finance,
Vol.30, No.2, pp. 485–502.
Smith, C. (1992), Stock Markets and the Exchange Rate: A
Multi-Country Approach, Journal of Macroeconomics, Vol. 14,
Issue 4, pp. 607–29.