
Forecasting international student mobility: A UK perspective
50
00 Forecasting international student mobility a UK perspective Vision 2020 Anthony Böhm Marcelo Follari Andrew Hewett Sarah Jones Neil Kemp Denis Meares David Pearce Kevin Van Cauter
Transcript of Forecasting international student mobility: A UK perspective

00
British Council
10 Spring GardensLondon SW1A 2BN
T +44 (0)20 7930 8466F +44 (0)20 7389 6347
www.britishcouncil.org
Universities UK
Woburn House20 Tavistock SquareLondon WC1H 9HQ
T +44 (0)20 7419 4111F +44 (0)20 7388 8649
www.universitiesuk.org
IDP Education Australia
Level 4210, Clarence StreetSydney, NSW 2000Australia
T +61 2 8251 2700 F +61 2 8251 2728
www.idp.org
© British Council 2004 Design Department/P267/NLP
The United Kingdom’s international organisation for educational opportunities and cultural relations. We are registered in England as a charity.
Forecasting international student mobilitya UK perspective
Vision2020
Anthony BöhmMarcelo FollariAndrew HewettSarah JonesNeil KempDenis MearesDavid PearceKevin Van Cauter
P267 market research cover AW 19/9/05 2:42 pm Page 1
00
Forecasting international student mobilitya UK perspective
Vision2020
Anthony BöhmMarcelo FollariAndrew HewettSarah JonesNeil KempDenis MearesDavid PearceKevin Van Cauter
P267 market research AW 19/9/05 2:45 pm Page I
The British Council
The British Council, which celebrates its 70th anniversary thisyear, connects people worldwide with learning opportunitiesand creative ideas from the UK to build lasting relationshipsbetween the UK and other countries. It is the UK’sinternational organisation for educational opportunities andcultural relations and is represented in 110 countries. TheBritish Council is funded by a mixture of a grant from the UKgovernment and revenue generated through paid services.
The British Council’s strategic objectives focus on thethemes of learning, creativity and society. The aims are:
� to increase international recognition of the range andquality of learning opportunities from the UK
� to promote the learning of English
� to strengthen educational co-operation between the UKand other countries
� to build appreciation of the UK’s creativity and scientificinnovation among people overseas, and strengthen theirengagement with the diversity of UK culture
� to enhance awareness of the UK’s democratic values andprocesses, and to work in partnership with other countriesto strengthen good governance and human rights.
Further information can be found at www.britishcouncil.org
Universities UK
Universities UK is the essential voice of all the UK universities.It promotes and supports their work and provides services toall their members, the executive heads. It works to deliver itsmission by:
� speaking out for a thriving and diverse higher educationsector that creates benefits for all
� providing and disseminating essential information
� bringing people together to share knowledge and good practice.
There are currently 122 members of Universities UKincluding all universities in the UK and some universitycolleges. Further information on Universities UK can befound at www.universitiesuk.ac.uk
Disclaimer:This report is intended as a guide to international student mobility. While all reasonable efforts have been made to ensurethat the information contained herein is accurate, the British Council, IDP Education Australia and Universities UK accept noliability for any views or opinions presented. Anyone intending to rely on the information should seek independent advice.This report does not form part of a legally binding agreement.
IDP Education Australia
For more than 30 years, IDP Education Australia (IDP) has played a major role in international education anddevelopment. IDP operates in an ever-changingenvironment and the organisation's success has been built on its ability to adapt to change.
IDP is a world leader in international education anddevelopment services. It is a global organisation with morethan 90 locations around the world and activities in some50 countries. Owned by 38 of 39 Australia's universitiesand representing all education sectors, IDP is anindependent not-for-profit organisation.
IDP also provides customised consulting services;conducts industry and sector-wide research; analysesmarket developments; contributes to research ininternational education; organises the annual AustralianInternational Education Conference, training programs andother major conferences and events; and plays a keyconsulting role in establishing links between Australianeducation institutions and their overseas counterparts.
Further information can be found at www.idp.com
Anthony BöhmAnthony is head of IDP Education Australia’s Planning andResearch Branch. In this role he is responsible for IDP’scorporate and industry research as well as the company’sportfolio of strategy and marketing consultancy services.He has also been engaged as an analyst and strategist forthe Australian government, education institutions and theprivate sector.
Marcelo FollariMarcelo is Project Manager, Industry and CorporateResearch within the Planning and Research Branch of IDP.Marcelo was the principal researcher of the UK ForecastingProject.
Andrew HewettAndrew formerly worked as a project manager in IDP’sPlanning and Research Branch for several years. He hasextensive experience particularly in researching andanalysing the international student markets globally,international student mobility data, and he was a keymember of the forecasting projects for both Australia and the United Kingdom.
Sarah JonesSarah Jones was responsible within the British Council forstatistical analysis and scenario development in relation tointernational student recruitment, including support to thePrime Minister’s Initiative. Sarah is now employed as aneducation and economics consultant in DTZ Pieda Consulting.
Neil KempAs director of the Education UK Marketing Division, Neilhas responsibility for leading the international effort tomarket UK education and training for the British Council.He is a member of the Education and Training ExportsGroup, a UK government advisory body. Neil has workedextensively overseas on education projects, including forover 20 years in Asia. He led the UK team for the Vision2020 project
Denis MearesAs a senior manager with IDP’s Planning and ResearchBranch, Denis has extensive experience in internationaleducation. He has worked as a key member of researchand consultancy teams for clients across all educationsectors and has taught in the secondary and highereducation sectors in Australia, Africa and the Asian Region.
David PearceDavid is Principal Policy Analyst with the Centre forInternational Economics, based in Canberra. David has vast experience in the construction and use of formalmathematical models, particularly general equilibriummodels, as a tool for effective policy analysis
Kevin Van CauterKevin Van Cauter is a Distance Learning Adviser within theEducation and Training Group at the British Council. Kevinhas extensive experience of international student dataanalysis, specialising in the demand for transnationaleducation (TNE), and has produced the analysis of demandfor UK TNE programmes for this report.
Project team
UK Technical Advisory Group
The project team benefitted from the advice of a Technical Advisory Group at various stages in the project in the UK, themembership of which was as follows:
Tim Westlake Cardiff University
Jean Krasocki Northern UniversitiesInternational
Angela Little Institute of Education, University of London
Bahram Bekhradnia Higher Education PolicyInstitute, Oxford
Norbert Pachler Institute of Education, University of London
Roy Leitch Scottish Interactive University
Geraint Johnes Lancaster University
Christine Humfrey Nottingham University
Colin Gilligan Sheffield Hallam University
Peter Mackenzie-Smith UKTI
Catherine Marston Universities UK
Sharne Procter University of Glasgow
Graham Wood University of Huddersfield
Tony Westaway University of Loughborough
Shawana Williams DfES
Piera Gerrard British Council
Keith Williams British Council
Barrie Morgan British Council
Christine Bateman British Council
Suzanne Alexander British Council
Neil Kemp (Chair) British Council
The project team would like to acknowledge the support in Australia from: Maggie Anderson, Simon Bush and Skye Worthyof IDP’s Planning and Research Branch; and in the UK from Nick Butler, Jane Finnegan and Christine Bruce from the BritishCouncil, and Liz Green, an independent consultant.
P267 market research AW 19/9/05 2:45 pm Page II
1
Contents
Executive summary 2
I Introduction 3II Research design 3III Overall forecasts 4IV UK scenarios and forecasts 4V Summary of main implications 9
1 Project overview and context 10
1.1 Introduction 111.2 International students in the UK 121.3 Current concerns for international education in the UK 131.4 Objectives for the study 131.5 Research into the changing patterns of demand for international student places 141.6 Glossary 151.7 Forecasting in a changing world 16
2 Research design 17
2.1 Global Forecasting Model 182.2 Discrete choice modelling in international education 202.3 Forecast scenarios 232.4 Further analyses of the nature of demand for UK international student places 25
3 Analysis and forecasts 28
3.1 Analysis of the UK’s market share 293.2 Discrete choice modelling and market share 303.3 Forecasts of total global demand for international student places 323.4 Forecasts of total demand for international student places in MESDCs 333.5 Base scenario for the UK 343.6 Optimistic scenario for the UK 373.7 Pessimistic scenario for the UK 403.8 Price escalation scenario for the UK 413.9 European Union impact scenario 423.10 UK transnational education forecasts 463.11 Global forecasts for the UK by level of study 503.12 Global forecasts for the UK by subject area 553.13 Gender-related considerations 593.14 Impact of increased in-country provision in main source countries 613.15 Forecasts of the UK Domestic to international ratio 633.16 Sources of funding for international students 643.17 A two-way flow: UK students’ demand for international education 64
4 Analysis of implications 65
4.1 Introduction 664.2 Summary of forecast market developments 664.3 Strategic issues 674.4 Conclusion: realising opportunity 73
Appendix A: References 75
Appendix B: Regional groupings of countries 79
Appendix C: Top 20 source countries in 2003 for UK, USA and Australia 81
Appendix D: Base data for the global forecasting model 83
Appendix E: Forecast of demand for international students in higher education in the UK – base scenario for 2005–20 88
Foreword
International students are extremely important for UKhigher education. Their presence in UK universities andcolleges has many positive impacts, including:
� to promote the quality and range of programmes available
� to increase the research output
� to enhance revenue generation
� to internationalise the student and staff body
� to improve efficiency and international competitiveness.
The latest data (2002–03) indicates that there are over 270,000 international students (i.e. EU and non-EU) in UK higher education. These generate about £1.5 billionper annum in fee revenue and, together with theirspending while studying in the UK, result in about £3 billiongross addition to the UK economy. There are also nearly200,000 international students following UK highereducation programmes delivered in their own countries.For similar reasons to those outlined above, the UKwelcomes their engagement.
There are significant numbers of international students infurther education colleges, private colleges, schools andEnglish language training institutions (over 500,000 in thelast). Many of these are on pathway courses leading intosome form of higher education. Although this report doesnot cover demand for these sectors explicitly the forecastsdo have direct relevance.
The UK education and training system has therefore cometo depend on and welcome a strong flow of internationalstudents. Given the growth of global competition, it hasbecome essential for policy makers and staff of institutionsto be better informed regarding likely patterns of demand,particularly as this will facilitate the formulation ofinvestment decisions and internationalisation strategies atall levels in the system.
Similarly, central and local governments are to varyingdegrees affected by the presence of international studentsin the UK and within their constituencies, and they will alsoneed to be prepared for increased future demand.
This study is intended to be an essential tool for use by policy makers, professionals and practitioners in allcountries.
P267 market research AW 19/9/05 2:45 pm Page IV

3
Executivesummary
‘Wherever I travel I meetinternational leaderswho have studied in
Britain. Dynamic,intelligent people whochose Britain because
we offer high-qualityeducation and training.
This is good news forthe UK. People who are educated here have a lasting tie to our country. Theypromote Britain in theworld, helping our trade and democracy.’Tony Blair, 1999
I Introduction
II Research design
International education is an economic sector that isextremely attractive to the UK: it is knowledge-intensive,high value-added and offers long-term benefits. This reportdemonstrates that global demand for internationaleducation is set to increase dramatically over the next fewyears. This however needs to be set in the context of asector that is rapidly evolving on a global basis.
Technological innovations are changing the nature oflearning. Today’s international students are moretechnologically literate, have greater expectations and aremore selective than their predecessors.
Not only is international competition increasing rapidly, but its nature is also changing significantly. The globalopportunities available will attract many new players,public and private, international and national, withinnovative and varied alliances and partnerships and new approaches to delivery.
The UK has been a global leader, second only to the USA,in the provision of higher education to citizens of othercountries. In 2002–03, the UK had over 270,000international students enrolled in higher education, whichwas about 25 per cent of the total number studying in themain English-speaking destination countries.
Given this context it is extremely important thatinstitutions, policy planners, strategists and internationalmangers better understand likely future directions. Thisreport assists by:
� forecasting possible future demand for internationalstudent places from 144 countries
� assessing the likely market share of the UK in thesecountries.
Associated with the analysis, the report also considers:
� internationalisation policies and strategies for the UKand institutions to respond to the growth in demand
� how the UK can be positioned to respond to increasingglobal competition and the changing needs andexpectations of students.
The research focuses on the demand for higher educationin the UK, and some additional projections for UK highereducation delivered transnationally are given.
The report does not explicitly cover further education,schools or the demand for English language programmes.However, the findings are very relevant to these sectors asmany students enrol on such programmes as a pathway tohigher education.
A team of British Council and IDP Education Australia staffundertook the project. Additional advice was sought froma Technical Advisory Group (TAG), comprising academicsand practitioners active in the field.
The project employed a model that allowed the forecastingof global demand for international student places from 144countries through considering the following informationover the forecast period 2003–2020:
� income per capita in each country and its projected rateof change
� demographic projections over the forecast period
� participation rates in both higher education andinternational higher education in each country and itsprojected rate of change.
The model provided forecasts of demand for internationalstudent places for individual destination countries. TheUK’s future market share will depend upon the changes inits attractiveness relative to the other Main English-Speaking Destination Countries (MESDCs)1.
Measuring the relative attractiveness of the UK as aninternational education destination using a ‘discrete-choicemodel’ allows its forecast market share to be calculated.
Through market research analysis the following keyattributes (attractiveness factors) affecting student choiceof destination country were identified:
� quality of education� employment prospects� affordability� personal security� lifestyle� education accessibility.
The discrete choice model analysed the historicalperformance of each of the MESDCs with regard to theattractiveness factors as well as historical market shares.This analysis revealed very clearly that two factors are ofover-riding importance for the UK, relative to other MESDCs:
� the quality of education provision
� future employment prospects associated with thequalification obtained.
Through the analysis, the likely changes in market shareassociated with decline or enhancement of anattractiveness factor can be estimated. For example, a 1 per cent improvement in the perceived quality of UKeducation across South East Asia, relative to otherMESDCs, will lead to a 4.3 percent increase in the UK’sshare of demand from South East Asia. This could result ina gain of about 6,000 students from that region for UKhigher education over the period from 2005 to 2010.
1 MESDCs: USA, Australia, Canada, New Zealand, Canada
P267 market research AW 19/9/05 2:45 pm Page 2
5Executive summary
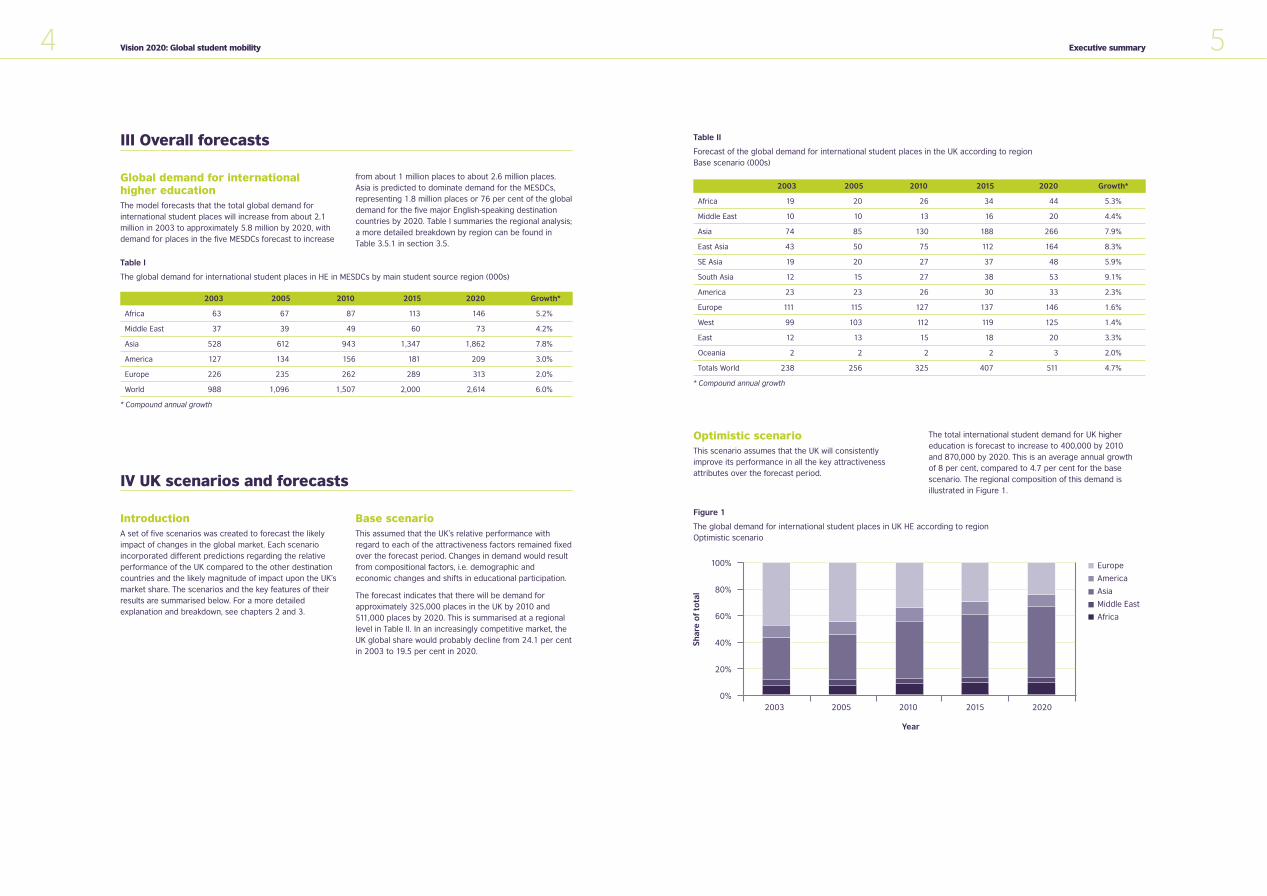
Table II
Forecast of the global demand for international student places in the UK according to regionBase scenario (000s)
Optimistic scenarioThis scenario assumes that the UK will consistentlyimprove its performance in all the key attractivenessattributes over the forecast period.
The total international student demand for UK highereducation is forecast to increase to 400,000 by 2010 and 870,000 by 2020. This is an average annual growth of 8 per cent, compared to 4.7 per cent for the basescenario. The regional composition of this demand isillustrated in Figure 1.
IV UK scenarios and forecasts
IntroductionA set of five scenarios was created to forecast the likelyimpact of changes in the global market. Each scenarioincorporated different predictions regarding the relativeperformance of the UK compared to the other destinationcountries and the likely magnitude of impact upon the UK’smarket share. The scenarios and the key features of theirresults are summarised below. For a more detailedexplanation and breakdown, see chapters 2 and 3.
Base scenarioThis assumed that the UK’s relative performance withregard to each of the attractiveness factors remained fixedover the forecast period. Changes in demand would resultfrom compositional factors, i.e. demographic andeconomic changes and shifts in educational participation.
The forecast indicates that there will be demand forapproximately 325,000 places in the UK by 2010 and511,000 places by 2020. This is summarised at a regionallevel in Table II. In an increasingly competitive market, theUK global share would probably decline from 24.1 per centin 2003 to 19.5 per cent in 2020.
4 Vision 2020: Global student mobility
III Overall forecasts
Global demand for internationalhigher educationThe model forecasts that the total global demand forinternational student places will increase from about 2.1million in 2003 to approximately 5.8 million by 2020, withdemand for places in the five MESDCs forecast to increase
from about 1 million places to about 2.6 million places.Asia is predicted to dominate demand for the MESDCs,representing 1.8 million places or 76 per cent of the globaldemand for the five major English-speaking destinationcountries by 2020. Table I summaries the regional analysis;a more detailed breakdown by region can be found inTable 3.5.1 in section 3.5.
Table I
The global demand for international student places in HE in MESDCs by main student source region (000s)
2003 2005 2010 2015 2020 Growth*
Africa 63 67 87 113 146 5.2%
Middle East 37 39 49 60 73 4.2%
Asia 528 612 943 1,347 1,862 7.8%
America 127 134 156 181 209 3.0%
Europe 226 235 262 289 313 2.0%
World 988 1,096 1,507 2,000 2,614 6.0%
* Compound annual growth
2003 2005 2010 2015 2020 Growth*
Africa 19 20 26 34 44 5.3%
Middle East 10 10 13 16 20 4.4%
Asia 74 85 130 188 266 7.9%
East Asia 43 50 75 112 164 8.3%
SE Asia 19 20 27 37 48 5.9%
South Asia 12 15 27 38 53 9.1%
America 23 23 26 30 33 2.3%
Europe 111 115 127 137 146 1.6%
West 99 103 112 119 125 1.4%
East 12 13 15 18 20 3.3%
Oceania 2 2 2 2 3 2.0%
Totals World 238 256 325 407 511 4.7%
* Compound annual growth
Figure 1
The global demand for international student places in UK HE according to regionOptimistic scenario
100%
80%
60%
40%
20%
0%2003 2005 2010 2015 2020
Europe
America
Asia
Middle East
Africa
Shar
e o
f to
tal
Year
P267 market research AW 19/9/05 2:45 pm Page 4
7Executive summary
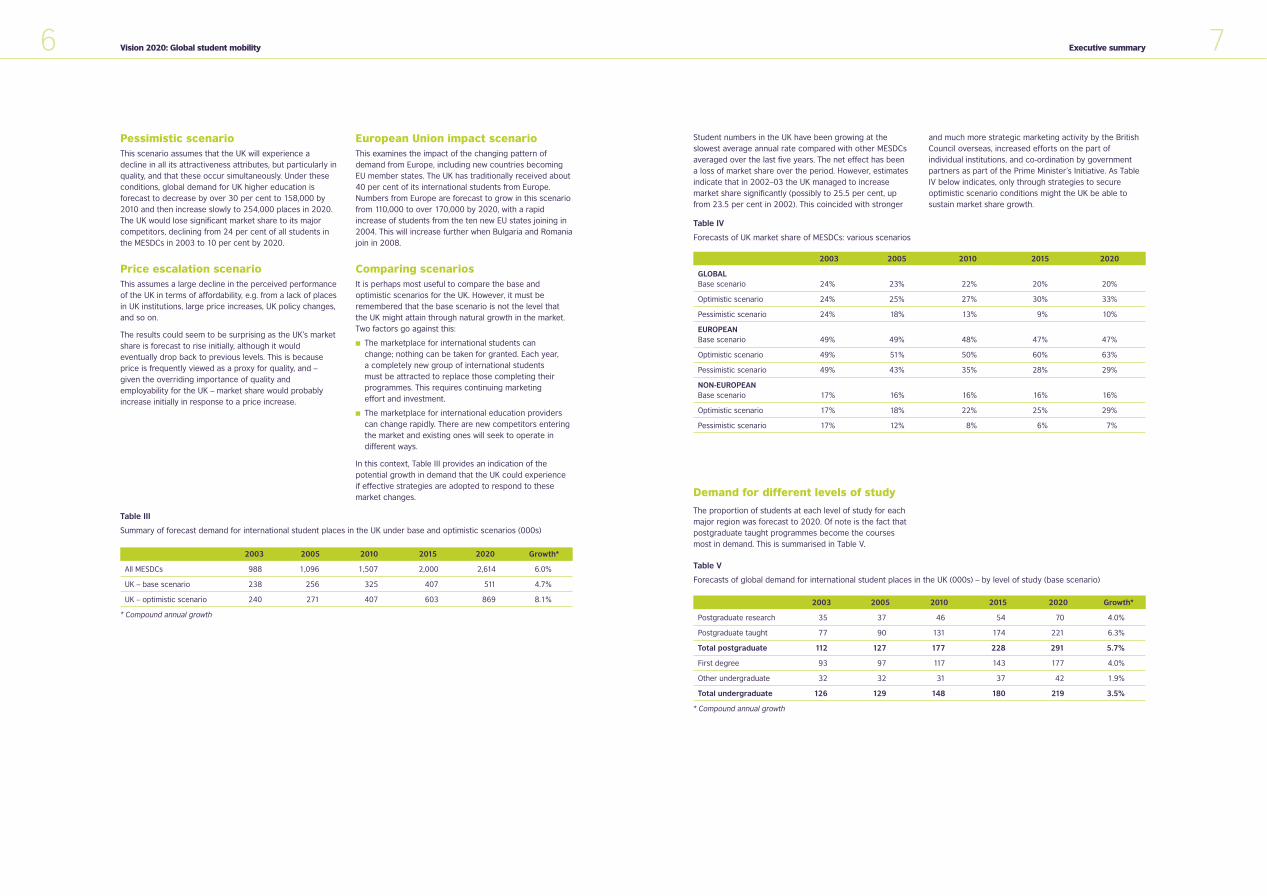
Student numbers in the UK have been growing at theslowest average annual rate compared with other MESDCsaveraged over the last five years. The net effect has beena loss of market share over the period. However, estimatesindicate that in 2002–03 the UK managed to increasemarket share significantly (possibly to 25.5 per cent, upfrom 23.5 per cent in 2002). This coincided with stronger
and much more strategic marketing activity by the BritishCouncil overseas, increased efforts on the part ofindividual institutions, and co-ordination by governmentpartners as part of the Prime Minister’s Initiative. As TableIV below indicates, only through strategies to secureoptimistic scenario conditions might the UK be able tosustain market share growth.
Demand for different levels of study
The proportion of students at each level of study for eachmajor region was forecast to 2020. Of note is the fact thatpostgraduate taught programmes become the coursesmost in demand. This is summarised in Table V.
6 Vision 2020: Global student mobility
Pessimistic scenarioThis scenario assumes that the UK will experience adecline in all its attractiveness attributes, but particularly inquality, and that these occur simultaneously. Under theseconditions, global demand for UK higher education isforecast to decrease by over 30 per cent to 158,000 by2010 and then increase slowly to 254,000 places in 2020.The UK would lose significant market share to its majorcompetitors, declining from 24 per cent of all students inthe MESDCs in 2003 to 10 per cent by 2020.
Price escalation scenarioThis assumes a large decline in the perceived performanceof the UK in terms of affordability, e.g. from a lack of placesin UK institutions, large price increases, UK policy changes,and so on.
The results could seem to be surprising as the UK’s marketshare is forecast to rise initially, although it wouldeventually drop back to previous levels. This is becauseprice is frequently viewed as a proxy for quality, and –given the overriding importance of quality andemployability for the UK – market share would probablyincrease initially in response to a price increase.
European Union impact scenarioThis examines the impact of the changing pattern ofdemand from Europe, including new countries becomingEU member states. The UK has traditionally received about40 per cent of its international students from Europe.Numbers from Europe are forecast to grow in this scenariofrom 110,000 to over 170,000 by 2020, with a rapidincrease of students from the ten new EU states joining in2004. This will increase further when Bulgaria and Romaniajoin in 2008.
Comparing scenariosIt is perhaps most useful to compare the base andoptimistic scenarios for the UK. However, it must beremembered that the base scenario is not the level thatthe UK might attain through natural growth in the market.Two factors go against this:
� The marketplace for international students can change; nothing can be taken for granted. Each year, a completely new group of international students must be attracted to replace those completing theirprogrammes. This requires continuing marketing effort and investment.
� The marketplace for international education providerscan change rapidly. There are new competitors enteringthe market and existing ones will seek to operate indifferent ways.
In this context, Table III provides an indication of thepotential growth in demand that the UK could experience if effective strategies are adopted to respond to thesemarket changes.
Table III
Summary of forecast demand for international student places in the UK under base and optimistic scenarios (000s)
2003 2005 2010 2015 2020 Growth*
All MESDCs 988 1,096 1,507 2,000 2,614 6.0%
UK – base scenario 238 256 325 407 511 4.7%
UK – optimistic scenario 240 271 407 603 869 8.1%
* Compound annual growth
Table IV
Forecasts of UK market share of MESDCs: various scenarios
2003 2005 2010 2015 2020
GLOBALBase scenario 24% 23% 22% 20% 20%
Optimistic scenario 24% 25% 27% 30% 33%
Pessimistic scenario 24% 18% 13% 9% 10%
EUROPEANBase scenario 49% 49% 48% 47% 47%
Optimistic scenario 49% 51% 50% 60% 63%
Pessimistic scenario 49% 43% 35% 28% 29%
NON-EUROPEANBase scenario 17% 16% 16% 16% 16%
Optimistic scenario 17% 18% 22% 25% 29%
Pessimistic scenario 17% 12% 8% 6% 7%
Table V
Forecasts of global demand for international student places in the UK (000s) – by level of study (base scenario)
2003 2005 2010 2015 2020 Growth*
Postgraduate research 35 37 46 54 70 4.0%
Postgraduate taught 77 90 131 174 221 6.3%
Total postgraduate 112 127 177 228 291 5.7%
First degree 93 97 117 143 177 4.0%
Other undergraduate 32 32 31 37 42 1.9%
Total undergraduate 126 129 148 180 219 3.5%
* Compound annual growth
P267 market research AW 19/9/05 2:45 pm Page 6

9Executive summary
V Summary of main implications
Gender-related considerationsApproximately 48 per cent of all international highereducation students in the UK are women. However, thereare considerable variations by source country, level andsubject. The female participation rate in postgraduatetaught programmes for a number of East Asian countries(Taiwan, Thailand, Japan and China) is high. In contrast, 75 per cent of all students from India are men.
The study forecasts that UK higher education mayexperience a tripling of the current level of demand forinternational students to 850,000 by 2020. Similarly, forprogrammes delivered through a variety of arrangementstransnationally, growth is forecast to increase rapidly –from the current figure of approximately 190,000 studentsto over 800,000 by 2020.
However, the sector is evolving rapidly, and the futureoperating environment will be very different from thecurrent one. The global opportunities available will attractmany new players, public and private, international andnational, with innovative and varied alliances andpartnerships and new approaches to delivery employing arange of technological solutions. Student needs andexpectations are becoming increasingly sophisticated anddemanding. The UK has been a global leader, second onlyto the USA, in the provision of higher education to citizensof other countries – what might be necessary to sustain oreven improve this position?
This research defines five fundamental strategic issuesabout the future extent and nature of internationaleducation activities. These can be summarised as:
� Ensuring quality: Can the UK maintain its qualityposition while significantly expanding provision?
� Responding to global competition: How might the UKrespond to the dramatic changes in the global marketthat may come from the new competitive environment?
� Building capacity: Do institutions have sufficientcapacity (human and physical) to respond to the verylarge opportunities presented?
� Presenting diversity: How will the composition ofdemand change? Can the UK meet the challenge ofdiversity and student choice?
� Delivering globally: How might the UK capitalise on itscurrent leading global position for transnational provision?
These issues are discussed in depth in chapter 4 andimplications for future policy raised. These implicationsinclude that:
� the UK international education industry needs acoherent national approach led by a clear strategicvision
� any strategy must engage directly with UK highereducation institutions to reflect their needs andconstraints and facilitate their collaboration
� new investment is essential, to:
– refresh, develop and reposition the ‘Education UK’brand to underpin a marketing strategy and tocombat increasing competition
– develop and grow the UK’s position in transnationaleducation
– develop and build long-term sustainable relationshipswith those who have experienced a UK education
� assuring quality is vital. This needs to encompass alleducation providers (not just the higher educationsector) which are active in delivering in or from the UK.
If the UK is able to respond in the ways indicatedthroughout the report, the ultimate beneficiaries will bestudents – both international and UK, and whetherstudying in the UK or on programmes delivered locally.
8 Vision 2020: Global student mobility
Subject areas in demandAn analysis of the forecast demand by broad subject arearevealed the following:
� Business and related studies continue to be the leadingsubject area in demand. The proportion of allinternational students enrolled in these is projected torise from 21 per cent in 2003 to 26 per cent in 2020.
� Computer science experiences the highest growth rate of any subject area at 8.5 per cent per annum. It becomes the third most popular area.
� The arts and humanities area falls from 18 per cent in2003 to 14 per cent in 2020 as a proportion of allinternational students in the UK. However, even in 2020 it still remains the subject area with the second highestlevel of demand.
Transnational education2
The global demand for UK transnational education (TNE) in 2020 is predicted to outstrip that for UK onshoreinternational education. It is forecast to grow from anestimated 190,000 in 2003 to 350,000 in 2010 and800,000 in 2020, a compound annual growth rate of just
over 9 per cent. A detailed breakdown of this forecastdemand is provided in section 3.10.
In 2003, five Asian countries – China, India, Malaysia, HongKong and Singapore – made up 58 per cent of the globaldemand (110,000 students) for UK programmes. Thesecountries are predicted to represent about 66 per cent ofglobal demand in 2010 (just over 225,000 students).Demand from China and India is forecast to grow by over15 per cent per annum and Russia and other EastEuropean states are also expected to be among theleading countries in 2020.
International students and UK students on campusGiven the forecasted strong growth in demand frominternational students, it is necessary to consider the likelyimpact on total student population in UK higher education.This is described in Table VI.
The implications of these proportions and issuesconcerning the need for greater diversity are discussed in chapter 4.
Impact of increased higher educationprovision in the main source countriesOne factor that will considerably influence demand forinternational study is the availability of university places inthe student’s home country. The model takes this intoaccount. However, if a country is able to accelerate localprovision beyond that predicted normally, then thedemand for international study places from that countrymay fall. The two countries where this would have thelargest impact overall are China and India. Severalscenarios where both these countries were assumed toincrease domestic higher education places were modelled.One of these assumed a 50 per cent reduction in thedemand for international education from these twocountries, due to increased domestic provision. The netimpact implied by this increase in provision in China andIndia would be a total decrease in global demand in 2020across all MESDCs of some 576,000 higher educationplaces (22 per cent reduction). In the UK, a decrease inglobal demand from 511,000 to 445,000 (13 per cent) in2020 might be experienced.
Sources of funds for international studentsMuch of the strong growth in numbers of internationalstudents over the last few years has been due to privatedemand from individuals. An analysis of funding sourcesfor international students in the UK indicates the following:
� Undergraduate and related studies: Nearly two-thirdsof the approximately 143,000 students are privatelyfunded.
� Postgraduate taught courses: Of the approximately88,000 international students on these programmes,some 86 per cent have their fees met from sourcesoutside the UK – the majority appearing to derive fromprivate rather than official funds.
� Postgraduate research: Approximately 40 per cent ofthe 39,000 international students on postgraduateresearch programmes receive some payment of fees fromsources within the UK (scholarships, fee waivers, etc).
Table VI
International students as a percentage of all students in UK HE (current and projected)
2003 2010 2020
All students (undergraduate and postgraduate)* 10.2 10.5 11.6
All full-time students 15.8 17.6 21
All full-time postgraduate students 38 38 37
All full-time undergraduate students 10.5 9 13
* Includes part-time plus full-time
2 TNE comprises all forms of programmes delivered overseas by UK HE institutions.
P267 market research AW 19/9/05 2:45 pm Page 8
11
1.1 Introduction
The UK and international education The UK has always welcomed large numbers ofinternational students. Over recent years, their importancehas been recognised by both institutions and government.Their presence in UK universities has many positiveimpacts, including promoting:
� the quality and range of programmes now available atboth undergraduate and postgraduate levels
� the development of internationally focused programmes,including country and regional specialist studies;languages and literature; international comparativeeducation; comparative studies in law, economics,politics etc.
� the research output: the range and scope of UK’sresearch output has been greatly enhanced throughattracting high-quality international research students
� enhanced international content of courses on offer:courses increasingly offer programmes that areenriched with international content
� internationalisation of the student and staff body
� improved efficiency and international competitiveness:organisations that trade internationally are generallymore effective and innovative than those active onlydomestically
� a very significant source of revenue for HE institutions inthe UK and the wider economy.
In addition, the presence of international students in UKuniversities has ensured that a wider range of programmesis available to UK domestic students in higher educationinstitutions generally.
The latest data from the Higher Education StatisticsAgency (HESA) for 2002–03 indicate that there are over270,000 international students (EU and non-EU) in UKhigher education. These generate over £1.5 billion perannum in fee revenue, and – together with their spendingwhile studying in the UK – result in over £3 billion grossaddition to the UK economy.
In addition, there are an estimated 190,000 internationalstudents following UK higher education programmesdelivered in their own countries. An estimated total ofsome 3 million UK examinations are taken overseas; theseinclude English language, music, professional and technicalstudies.
There are significant numbers of international students in further education colleges (over 60,000 in 2002–03),private colleges, schools and English language traininginstitutions (over 500,000 in the last). Many of these are on pathway courses leading into some form of highereducation.
The UK welcomes international academics on short visitsand research attachments. There is also foreign contractedresearch and development in UK universities. The totalvalue of all these activities in 2001–02 was estimated to beabout £600 million.3
The UK also generates considerable other exports revenuefrom goods and services associated with education andtraining, including:
� education-related publishing (over £900m p.a.)
� education equipment (over £500m p.a.)
� consultancy services (worth some £13 billion p.a. to theUK economy); however, it is impossible to separate theeducation and training shares.
In this context, and given the particular importance ofinternational students to the UK, it is essential for policymakers and staff of institutions to be better informedregarding likely patterns of future demand. This willfacilitate the formulation of investment decisions andinternationalisation strategies at all levels withininstitutions, up to the highest.
Similarly, central and local governments are to varyingdegrees affected by the presence of international studentsin the UK and within their constituencies, and will also needto be prepared for what patterns future demand may bring.
1 Project overview and context
3 ‘Global values of UK Education and Training Exports’: Professor Geraint Jones sponsored by UKTI and the British Council (April 2004).
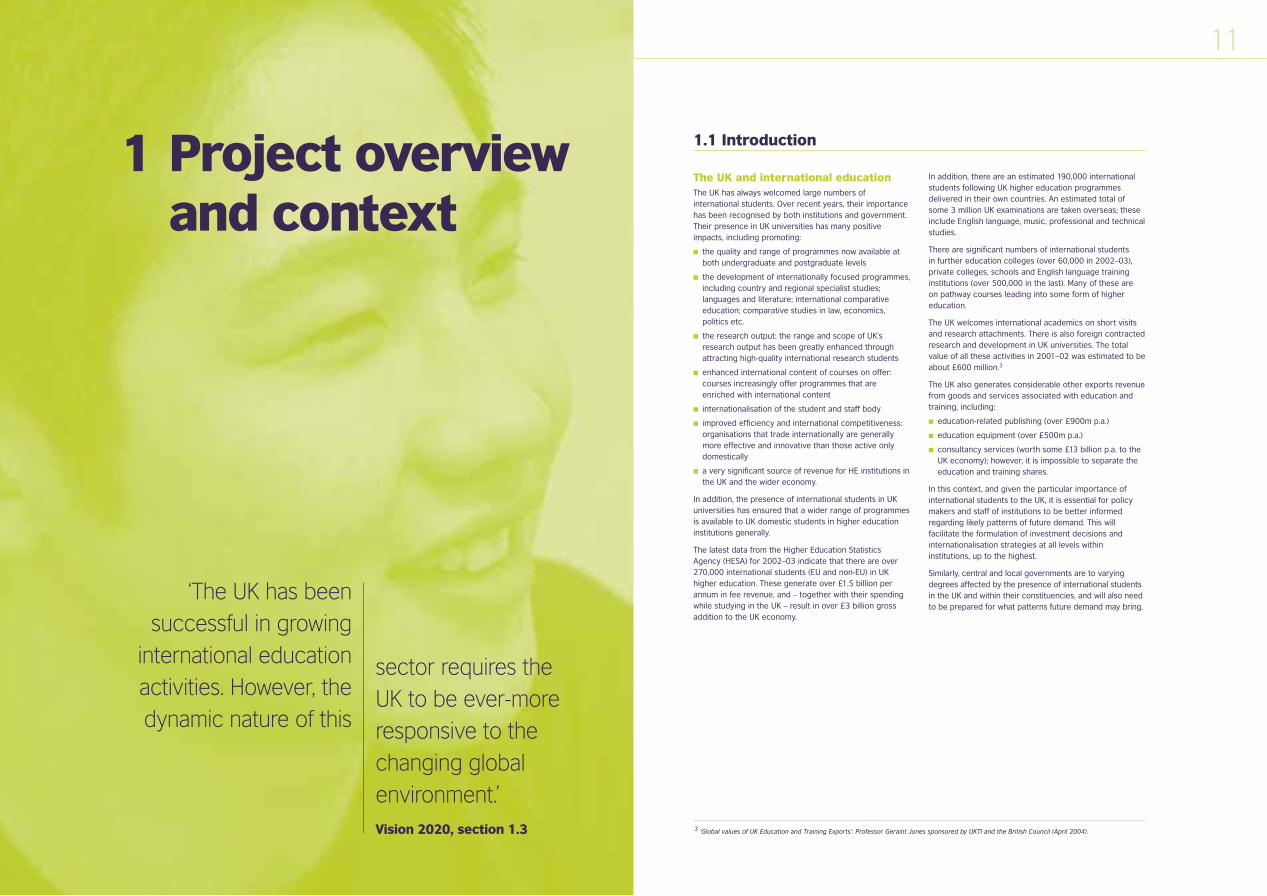
‘The UK has beensuccessful in growing
international educationactivities. However, thedynamic nature of this
sector requires the UK to be ever-moreresponsive to thechanging globalenvironment.’Vision 2020, section 1.3
P267 market research AW 19/9/05 2:45 pm Page 10
13Project overview and context
1.3 Current concerns for international education in the UK
The UK has been successful in growing internationaleducation activities. However, the dynamic nature of thissector requires the UK to be ever-more responsive to thechanging global environment. The areas listed as concernsin this section reflect some of the factors identified to date.There are others and these are addressed in chapter 4.
International students: There is a need to appreciatebetter and respond to the needs and changing aspirationsand expectations of international students. However, totake this forward, it is essential to understand the variablesinvolved which depend on a range of factors includingcountry of origin and level and subject of study.
Internationalisation of UK institutions: What will be theappearance of an ‘international’ higher educationinstitution in 2020? Much emphasis is currently placed oninternational student recruitment by institutions; however,many institutions are engaged in a great diversity ofinternational activities. The question of how these might bedrawn together in a more coherent approach to achievegreater impact towards their strategic mission needs to beaddressed.
Transnational education: There are great opportunitiesfor the UK in the rapidly expanding market for overseas-delivered programmes. However, there are barriers tocapitalising on the current position, including financial,
institutional, strategic and resourcing limitations. A betterunderstanding of the breadth of possibilities will facilitatedecision making.
Impact of new technologies: The evolving newtechnologies will have a growing and direct impact on anumber of areas – in particular, the delivery of educationand the provision of student support systems, both in theUK and when delivered internationally. The need is toexploit the potential of such technologies to the full.Prospective international students regularly turn to theinternet as their primary source of detailed information onglobal education opportunities. The challenge is to keeppace with internet developments and manage marketingand delivery efforts accordingly.
Resource constraints: The last five years have seenstrong growth in demand from both domestic UK andinternational students for places in UK higher educationinstitutions. However, resource constraints – both humanand physical – are becoming more apparent.
New partnerships: UK institutions have been at theforefront of developments to grow new partnerships todeliver programmes internationally in a wide range ofinnovative approaches (both with the public and privatesectors). However, work is needed to disseminate goodpractice more effectively in this area of activity.
1.4 Objectives for the study
Given the increased interest in all aspects of internationaleducation in the UK and driven by strong financial,institutional development and government concerns, theBritish Council and various representatives of the UKhigher education sector agreed that further research intoglobal trends of international student mobility wasnecessary – in particular, to analyse these trends from a UK perspective.
This research was therefore conceived with the followingobjectives:
� To provide a current analysis and projections of thepatterns of global demand for international students –both in terms of their home country and destinationcountries
� To assess the key factors that influence the UK share ofthe global market for international students and toemploy these to forecast likely demand to 2020
� To review any other factors that could influence theabove and assess their impact, particularly those relatedto the wider context of internationalisation
� To forecast the likely demand for transnationaleducation programmes for the period to 2020.
The overall intention was to make available the researchfindings, analysis and forecasts to facilitate decision-making, help formulate strategy and assist in makinginvestment and related decisions. The main user groupsfor the research were identified as:
� strategic decision makers in higher educationinstitutions throughout the world
� strategic decision and policy makers in government,national organisations and representative bodies
� practitioners involved in international studentrecruitment
� professionals and practitioners engaged in the deliveryof programmes transnationally.
12 Vision 2020: Global student mobility
After a period of relative decline in terms of global marketshare for the UK during the 1990s, action was taken. Thisinvolved a more integrated approach by government,education institutions and the British Council (under theaegis of the Prime Minister’s Initiative – PMI), and has led toa significant increase in numbers of international studentsin the UK in 2002–03.
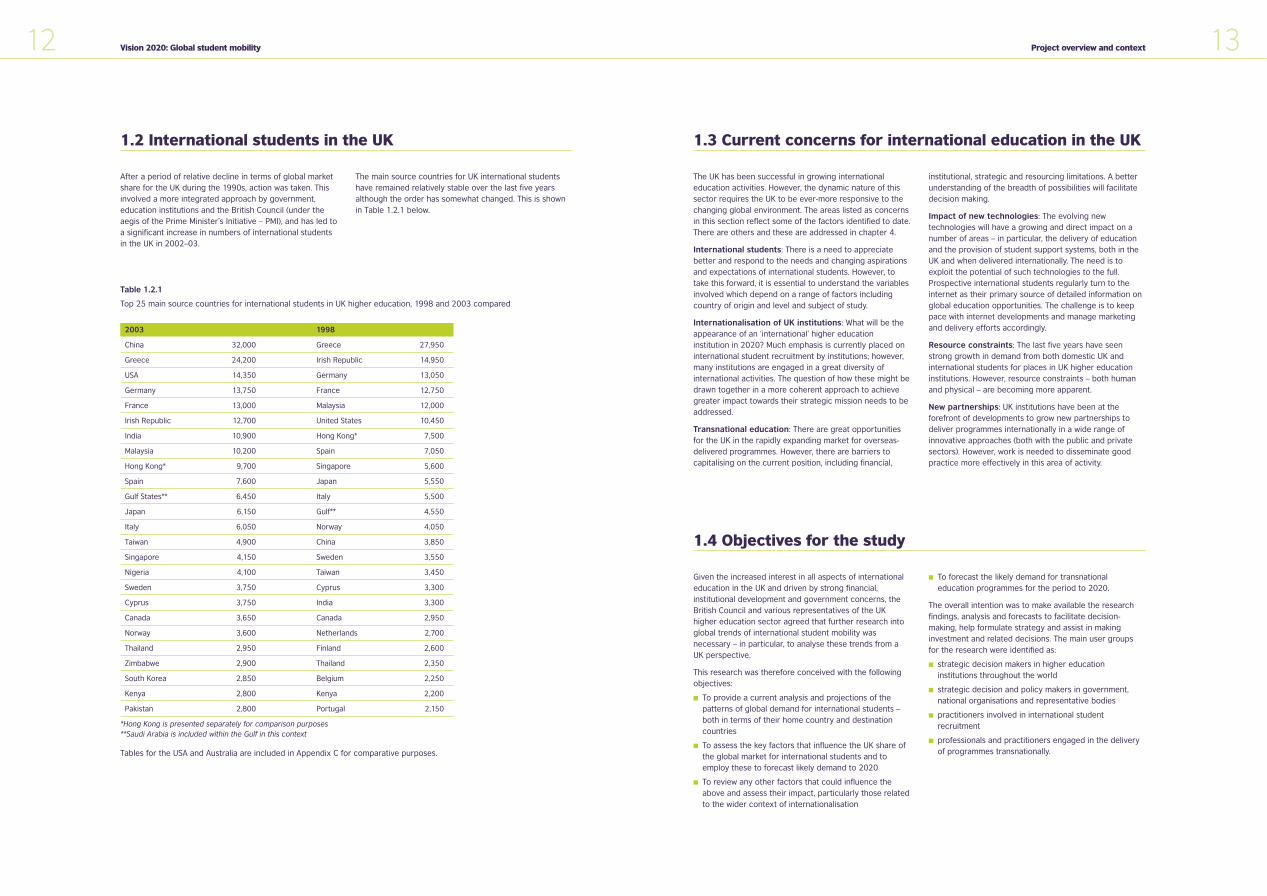
The main source countries for UK international studentshave remained relatively stable over the last five yearsalthough the order has somewhat changed. This is shownin Table 1.2.1 below.
2003 1998
China 32,000 Greece 27,950
Greece 24,200 Irish Republic 14,950
USA 14,350 Germany 13,050
Germany 13,750 France 12,750
France 13,000 Malaysia 12,000
Irish Republic 12,700 United States 10,450
India 10,900 Hong Kong* 7,500
Malaysia 10,200 Spain 7,050
Hong Kong* 9,700 Singapore 5,600
Spain 7,600 Japan 5,550
Gulf States** 6,450 Italy 5,500
Japan 6,150 Gulf** 4,550
Italy 6,050 Norway 4,050
Taiwan 4,900 China 3,850
Singapore 4,150 Sweden 3,550
Nigeria 4,100 Taiwan 3,450
Sweden 3,750 Cyprus 3,300
Cyprus 3,750 India 3,300
Canada 3,650 Canada 2,950
Norway 3,600 Netherlands 2,700
Thailand 2,950 Finland 2,600
Zimbabwe 2,900 Thailand 2,350
South Korea 2,850 Belgium 2,250
Kenya 2,800 Kenya 2,200
Pakistan 2,800 Portugal 2,150
*Hong Kong is presented separately for comparison purposes**Saudi Arabia is included within the Gulf in this context
Tables for the USA and Australia are included in Appendix C for comparative purposes.
Table 1.2.1
Top 25 main source countries for international students in UK higher education, 1998 and 2003 compared
1.2 International students in the UK
P267 market research AW 19/9/05 2:45 pm Page 12
15Project overview and context
1.6 Glossary
The terminology associated with global student mobilityand international student places is complex and oftenconfusing. Some terms that are commonly used in thereport are explained here; others are discussed as theyappear in the report. Importantly, given that the projectionsare restricted to the higher education sector, the term‘student’ in this report refers to a higher education student,unless otherwise stated.
Where possible, the authors of this report have categorisedstudents as being either international or transnational.
Compositional effect: This term is used when describingthe results of the base scenario. It refers to the effect ofchanging demographic, economic and educationalsituations in source countries on the size of the globaldemand for international student places, and in particularthe UK’s market share of MESDCs. Changes in the UKglobal market share are therefore a direct result of thechanges in these variables at the country level. Note that itis assumed that in this situation there is no contribution tochange due to attractiveness factors. For furtherinformation, see section 2.3.
Cross-elasticities of demand: See ‘Elasticities of demand’
Demand: The number of international student placesdemanded by students as forecast in this report ispotentially different from the number of internationalstudents that will actually be enrolled. This is becausesupply factors (i.e. factors related to the provision ofhigher education places) are not explicitly taken intoaccount in the global forecasting model. For furtherinformation, see the paragraph ‘demand versusenrolments’ in section 2.1.3.
Discrete choice model: The model that determines andquantifies the influence of each primary attractivenessfactor upon a destination country’s market share, based onan analysis of the historical relationship between thatcountry’s market share and performance with regards tothese factors.
Elasticities of demand: The outputs of the discretechoice model are elasticities of demand. They predict howchanges in a country’s perceived performance on adiscriminating attribute may affect changes in a country’smarket share, for students from each source region andcountry. ‘Cross-elasticities’ simply refers to the impact ofthe positive or negative performance of destinationcountry with regard to a discriminating attribute, on everyother destination country. For example, a positiveimprovement of 1 per cent in the performance of UK withregard to employment prospects for students from theMiddle East region may lead to a decline of 0.27 per centin the market share of each competitor destinationcountry, for that source region.
Global forecasting model: The model that gives forecastsof international students in an international educationdestination as its output. See section 2.1 for furtherinformation.
Growth rates: The growth rates referred to in this reportare compound annual growth rates. They have beencalculated using the LOGEST formula, which is provided inMicrosoft Excel. The LOGEST approach is commonly usedin forecasting because, unlike a conventional growthformula, which is based on the end-points of the data (thebeginning and the end), LOGEST averages the logarithmsof the year-to-year growth ratios, thus taking into accountall of the data.
Higher education students (also referred to in thisreport simply as ‘students’): The global forecasting modelis based on ‘third level’ UNESCO (1996) data, which includeseducation provided at ‘universities, teachers’ colleges andhigher professional schools’. Thus, the data do not includeenrolments at the vocational and technical level.
Income per capita: In this report, the terms ‘income percapita’, ‘GDP per capita’ and ‘GNP per capita’ are usedinterchangeably, even though they are strictly distinct. Forthe data collection and analysis, GNP was used whereverpossible, but often only GDP was available. Followinggeneral practice, either was used as a proxy for income,depending on which was available.
Income elasticities: This term is used in the report todescribe the extent to which a change in a sourcecountry’s income per capita will lead to a change indomestic and international higher education participationrates in that country.
International access ratio: This refers to the ratio ofinternational higher education students from a sourcecountry to the total number of higher education studentsfrom that country (whether studying domestically orinternationally).
International students: International students are thosestudents who fall into the WTO’s General Agreements onTrade in Services category of consumption abroad – thatis, those students who travel from one country to thecountry of the education provider in order to obtaineducation or training.
Major English Speaking Destination Countries(MESDCs): This group of countries includes the UnitedKingdom, United States, Australia, Canada and NewZealand, in their capacity as destinations for internationalstudents.
14 Vision 2020: Global student mobility
1.5 Research into the changing patterns of demand for international student places
IDP Education Australia: In 2002, IDP Education Australiadeveloped forecasts of the global demand for internationalhigher education student places. This study, entitled GlobalStudent Mobility 2025: Forecasts of Global Demand forHigher Education, projected a four-fold increase in theglobal demand for international higher education studentplaces by 2025. The implications generated extensivedebate globally.
In 2003, the analytical capacity of the global forecastingmodel used in 2002 was extended. The new study soughtto examine empirically the factors influencing the majorEnglish-speaking destination countries’ share of the globaldemand for international higher education student places.
Linking changes in consumer behaviour with macro-forecasting is complex. However, in partnership with theCentre for International Economics, a discrete choicemodel was applied to forecasts of demand for internationalhigher education student places. This helped to develop agreater understanding of likely future trends ininternational student places.
The British Council: Over the last three years, the BritishCouncil has been undertaking research studies with thepolling organisation MORI into the perceptions ofinternational students while they are still in their homecountry, while in the UK and then on return home.
Although the British Council has undertaken a number ofinternal studies to consider changing patterns of globaldemand for international students, it has never previouslyhad the opportunity to undertake a large internationalstudy to review and model the combination ofmacroeconomic and educational factors that may effectstudent mobility.
Co-operation between the UK and AustraliaThe British Council had discussed with its UK partnerinstitutions the possibility of undertaking research topredict future global patterns of international studentmobility. However, the opportunity that arose through co-operation with IDP Education Australia was consideredto be the most effective way forward; the lessons thatcould be learned through building on the initial IDPresearch were seen to be significant.
Discussions between the British Council and sectorrepresentatives in the UK led to an agreement that anappropriately developed version of the IDP research couldbe applicable and useful for the UK. The British Counciland Universities UK agreed to form a Technical AdvisoryGroup, comprising academics and practitioners active inthe field, to ensure that all appropriate considerations wereincluded in the research. Some UK-specific changes wereproposed, and these included:
� refining the attractiveness factors in the light of theBritish Council’s own detailed research on studentperceptions commissioned through MORI
� focusing on a wider range of key countries, as the UKtraditionally has a more diversified base of sourcecountries for students than most others
� considering in more detail activities across Europe –especially in the early stages of the forecast period whenat least ten new states are scheduled to join the EU
� considering the demand for transnational education ascomplementing the study overseas option rather thanas a substitute
� assessing the impact of supply side constraints – both inthe UK and in some of the larger source countries
� considering the differences in demand for postgraduateand undergraduate education
� considering the pattern of demand for subjects.
These changes were included in various ways in a refinedapproach proposed in discussions with IDP. Some of theadditional analysis required had to be undertakenindependently of the model. The methodology is discussedin chapter 2 and in parts of chapter 3.
Much thought was given to the logic behind the UKcollaborating with Australia – a major internationalcompetitor in this activity for the UK. Indeed, Australia hasbeen very successful over the last few years in winningmarket share from the UK, particularly in Asia. However, itwas the view of all concerned that the need to understandbetter the main drivers and trends in the global demandfor international student places overrode such concerns.
P267 market research AW 19/9/05 2:45 pm Page 14
2 Research design
‘Education is the mostpowerful weapon which you can use to change
the world.’Nelson Mandela
16 Vision 2020: Global student mobility
Primary attractiveness factors: Those factors of choicethat the project team has identified as the majorcharacteristics of destinations determineing students’choice of an international education English-speakingdestination. They include quality of education, employmentprospects, affordability, lifestyle, personal security andeducation accessibility.
Regions: The regional classifications used in this project,and the countries in each region, are shown in Appendix B.
Transnational students: Transnational students are thosestudents who fall into the General Agreement on Trade inServices (GATS) categories of commercial presence (theeducation provider establishes a presence in anothercountry), cross-border supply (the education service is
delivered by distance education) or presence of naturalpersons (the educator travels to another country to supplythe education services). Transnational educationprogrammes (TNE) refer to the courses of studyundertaken by transnational students.
The delivery modes associated with transnational studentsare more commonly referred to and encompass: distancelearning (including e-delivery), franchising, validation,licensing, twinning and partnership arrangements, offshoreor overseas campuses, etc.
UK market share: Unless otherwise specified, the UKmarket share in this report refers to the number ofinternational students in the UK relative to the number in all major English speaking destination countries.
Underlying the forecasts presented in this report are keyassumptions regarding world order and stability. Forecastingcontinued growth in the global economy, in part, relies on anassumption that the world will not experience a majorworldwide catastrophe – man-made or natural.
While international education is a resilient industry andhas, for example, continued to experience growth despitethe Asian economic crisis and recent terrorist attacks, thefuture growth of international education relies on a worldorder that allows and encourages the movement of people
and ideas. Just as the terrorist attacks were unexpected,this report cannot predict potential changes in the futureworld order.
Furthermore, this report does not address possible futurechanges in social attitudes within the United Kingdom thatmay either enhance or restrict the United Kingdom’sengagement in international education. These importantissues and their implications for international educationare areas for further research and consideration.
1.7 Forecasting in a changing world
P267 market research AW 19/9/05 2:45 pm Page 16
19Research design
International demand for UK highereducation student placesHaving identified the global demand for international highereducation student places, the UK’s projected market sharewas applied to the model to determine the global demandfor UK higher education. Determining this share involvedthe development of a discrete choice model. This isdiscussed in detail in the next section.
The Global Forecasting Model forecast each of thesedemands for 144 source countries. These demands couldthen be aggregated to give forecasts from each majorworld region, and global forecasts.
This UK report focuses on the demand by internationalstudents for higher education courses delivered onshorein the UK. Some additional projections for UK educationdelivered transnationally, either offshore or by distancelearning, are given and the approach for this is explainedin the appropriate section of the report.
The global projections are for all higher education and donot normally distinguish between undergraduate andpostgraduate demand, or demand for different subjectareas. Separate exercises to model these categories havebeen undertaken and are reported.
The report does not cover further and school-leveleducation or the demand for English languageprogrammes. However, the report will be important tothese sectors given that increasingly many students arechoosing to enrol in such programmes as pathways intohigher education.
Demand versus enrolmentsIt is important to distinguish between demand forenrolments and actual enrolments. The demand forenrolments represents individuals who are willing and ableto undertake a higher education. In contrast, actualenrolments include those who are willing, able and havebeen accepted by a higher education institution. In thiscontext, actual enrolments relate to both demand andsupply factors. Importantly, the Global Forecasting Modelproduces forecasts of the demand for enrolments, themeasure of demand for individual student places.
Period for the studyAt the time that the forecasts were generated, the mostrecent statistics available showing actual internationalstudent numbers in the UK were from the 2001–02academic year. In addition, at the time of generating theforecasts there were no finalised academic yearinternational student numbers from any of the MESDCsbeyond 2002. Therefore, the starting year employed for allthe forecasts is 2003; the results for this year wereobtained by projecting forward all country data from theircommon point in time, which is 2002.
However, since generating the forecasts, 2002–03 datahave been received from the Higher Education StatisticsAgency (HESA). These figures indicate a considerableincrease in numbers of international higher educationstudents in the UK compared with the 2003 projections. It was agreed not to re-run the model with these new data,as the underlying basis of the work – that is, to investigatelong-term trends, is not undermined. There will always beevents that will have a short-term impact but their effectwill normally be dissipated over time.
In the case of forecasting, based on the 2002–03 HESAdata, the question is whether the more than 20 per centincrease in international student numbers in the UK in oneyear will be sustained or whether numbers will drop backover the short term in line with the general projections.This will be monitored over the next two years and theseresults updated accordingly.
Data issuesThe key source of data for higher education used in theGlobal Forecasting Model is UNESCO, in particular the2001 World Education Report and the associated onlinedatabases.5
The base period for most of the UNESCO data is 1996,although data for 1996 are not complete for all regions.Where suitable 1996 data from other sources have beenunavailable, the country has been excluded from theanalysis.
UNESCO also publishes population and gross nationalproduct (GNP) per capita data, and this also forms part ofthe base data. The time series analysis is based on realGNP per capita and population from the World Bank,6 whiledemographic projections are taken from the UnitedNations Population Division’s latest series of projections.7
UNESCO does not currently publish any information forTaiwan. As Taiwan is an important source of internationalstudents for the UK, comparable Taiwanese data havebeen obtained directly from the Taiwan StatisticalYearbook. The latest published UNESCO data oninternational students generally refer to 1995 or 1996 asthe base period. UNESCO data for the UK have thereforebeen updated using more recent official statistics.8
Further, more recent international student data areavailable for Australia, New Zealand, Canada, UK and theUS. The more recent data have been used to check andcalibrate the historical forecasts from 1996 to the present.
Data for Hong Kong have been shown separately. Thisfacilitated trend analysis for comparison with bothhistorical data and other MESDC statistics.
The Global Forecasting Model (GFM) employed a singlemodel to cover as many individual countries as possible.Data for 144 individual source countries were included inthe final model.
18 Vision 2020: Global student mobility
2.1 Global Forecasting Model
The model used in this project is named the GlobalForecasting Model, which is the same model used by IDPfor their Australian research in 2003, and very similar tothe model they used for their original Global StudentMobility 2025 publication in 2002. Although the model was
used on these occasions specifically for the Australiansituation, it is easily transferable for use with otherinternational education destinations.
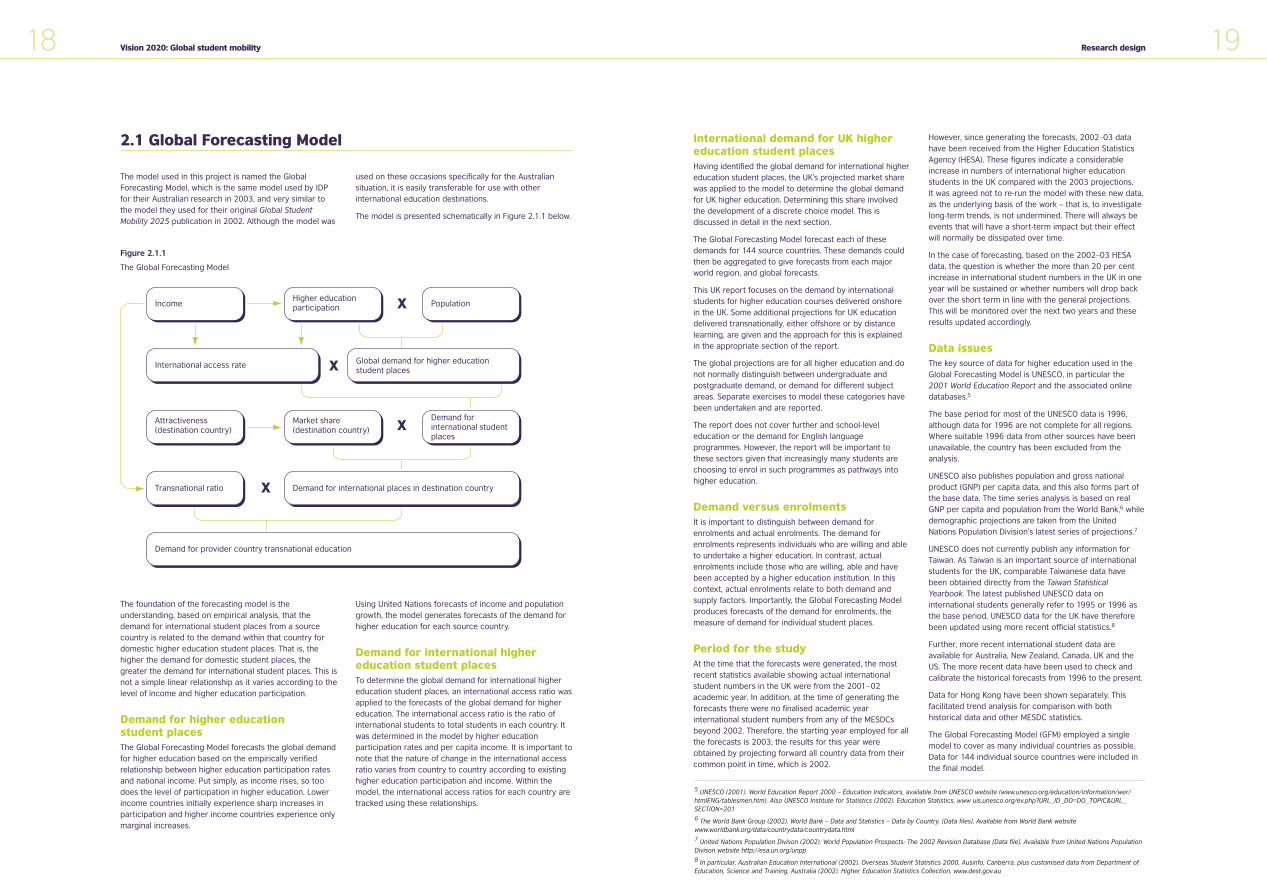
The model is presented schematically in Figure 2.1.1 below.
The foundation of the forecasting model is theunderstanding, based on empirical analysis, that thedemand for international student places from a sourcecountry is related to the demand within that country fordomestic higher education student places. That is, thehigher the demand for domestic student places, thegreater the demand for international student places. This isnot a simple linear relationship as it varies according to thelevel of income and higher education participation.
Demand for higher education student placesThe Global Forecasting Model forecasts the global demandfor higher education based on the empirically verifiedrelationship between higher education participation ratesand national income. Put simply, as income rises, so toodoes the level of participation in higher education. Lowerincome countries initially experience sharp increases inparticipation and higher income countries experience onlymarginal increases.
Using United Nations forecasts of income and populationgrowth, the model generates forecasts of the demand forhigher education for each source country.
Demand for international highereducation student placesTo determine the global demand for international highereducation student places, an international access ratio wasapplied to the forecasts of the global demand for highereducation. The international access ratio is the ratio ofinternational students to total students in each country. Itwas determined in the model by higher educationparticipation rates and per capita income. It is important tonote that the nature of change in the international accessratio varies from country to country according to existinghigher education participation and income. Within themodel, the international access ratios for each country aretracked using these relationships.
Figure 2.1.1
The Global Forecasting Model
IncomeHigher educationparticipation Population
Attractiveness(destination country)
Market share(destination country)
Demand for international studentplaces
International access rate Global demand for higher educationstudent places
Transnational ratio
Demand for provider country transnational education
Demand for international places in destination country
X
X
X
X
5 UNESCO (2001). World Education Report 2000 – Education Indicators, available from UNESCO website (www.unesco.org/education/information/wer/htmlENG/tablesmen.htm). Also UNESCO Institute for Statistics (2002). Education Statistics, www uis.unesco.org/ev.php?URL_ID_DO=DO_TOPIC&URL_SECTION=2016 The World Bank Group (2002). World Bank – Data and Statistics – Data by Country. [Data files]. Available from World Bank websitewww.worldbank.org/data/countrydata/countrydata.html7 United Nations Population Divison (2002). World Population Prospects: The 2002 Revision Database [Data file]. Available from United Nations PopulationDivison website http://esa.un.org/unpp8 In particular, Australian Education International (2002). Overseas Student Statistics 2000, Ausinfo, Canberra, plus customised data from Department ofEducation, Science and Training, Australia (2002). Higher Education Statistics Collection, www.dest.gov.au
P267 market research AW 19/9/05 2:45 pm Page 18
21Research design
students may consider Italy as a study option. However,market research with international students in UK, USA andAustralia generally indicates that the five MESDCs largelydefine the competitor set.10
Step 2: Determine the UK’s share of internationalstudents in five MESDCs
The UK’s current share of international students in the fiveMESDCs provides the basis for the projected market share.The project team collected detailed information on theUK’s historical performance, or international student flows,from each of the source countries included in the GlobalForecasting Model based on UNESCO data updated withthe latest international student statistics.
Step 3: Determine the primary attractiveness factorsfor destination countries
There is a growing body of market research into thefactors influencing international students’ choice ofdestination country.11 This research has identified a widerange of factors influencing choice of destination country– from climate of the destination country to the costs ofobtaining a student visa.
However, research available on factors influencing choiceof destination countries by international students hasfocused on analysing key factors in choosing oneparticular destination country. There is no publiclyavailable research on discrete choice by all majordestination countries.
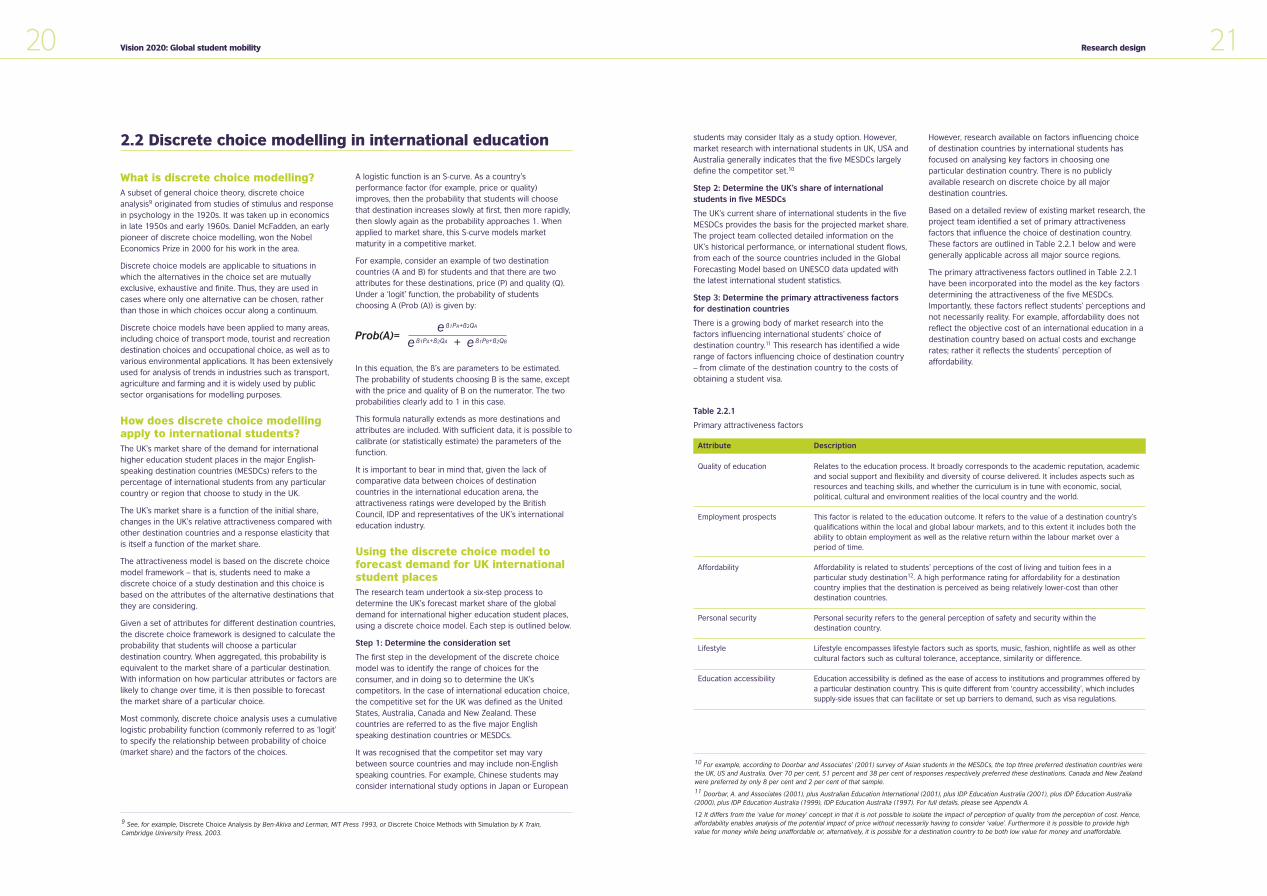
Based on a detailed review of existing market research, theproject team identified a set of primary attractivenessfactors that influence the choice of destination country.These factors are outlined in Table 2.2.1 below and weregenerally applicable across all major source regions.
The primary attractiveness factors outlined in Table 2.2.1have been incorporated into the model as the key factorsdetermining the attractiveness of the five MESDCs.Importantly, these factors reflect students’ perceptions andnot necessarily reality. For example, affordability does notreflect the objective cost of an international education in adestination country based on actual costs and exchangerates; rather it reflects the students’ perception ofaffordability.
20 Vision 2020: Global student mobility
2.2 Discrete choice modelling in international education
What is discrete choice modelling?A subset of general choice theory, discrete choiceanalysis9 originated from studies of stimulus and responsein psychology in the 1920s. It was taken up in economicsin late 1950s and early 1960s. Daniel McFadden, an earlypioneer of discrete choice modelling, won the NobelEconomics Prize in 2000 for his work in the area.
Discrete choice models are applicable to situations inwhich the alternatives in the choice set are mutuallyexclusive, exhaustive and finite. Thus, they are used incases where only one alternative can be chosen, ratherthan those in which choices occur along a continuum.
Discrete choice models have been applied to many areas,including choice of transport mode, tourist and recreationdestination choices and occupational choice, as well as tovarious environmental applications. It has been extensivelyused for analysis of trends in industries such as transport,agriculture and farming and it is widely used by publicsector organisations for modelling purposes.
How does discrete choice modellingapply to international students?The UK’s market share of the demand for internationalhigher education student places in the major English-speaking destination countries (MESDCs) refers to thepercentage of international students from any particularcountry or region that choose to study in the UK.
The UK’s market share is a function of the initial share,changes in the UK’s relative attractiveness compared withother destination countries and a response elasticity thatis itself a function of the market share.
The attractiveness model is based on the discrete choicemodel framework – that is, students need to make adiscrete choice of a study destination and this choice isbased on the attributes of the alternative destinations thatthey are considering.
Given a set of attributes for different destination countries,the discrete choice framework is designed to calculate theprobability that students will choose a particulardestination country. When aggregated, this probability isequivalent to the market share of a particular destination.With information on how particular attributes or factors arelikely to change over time, it is then possible to forecastthe market share of a particular choice.
Most commonly, discrete choice analysis uses a cumulativelogistic probability function (commonly referred to as ‘logit’to specify the relationship between probability of choice(market share) and the factors of the choices.
A logistic function is an S-curve. As a country’sperformance factor (for example, price or quality)improves, then the probability that students will choosethat destination increases slowly at first, then more rapidly,then slowly again as the probability approaches 1. Whenapplied to market share, this S-curve models marketmaturity in a competitive market.
For example, consider an example of two destinationcountries (A and B) for students and that there are twoattributes for these destinations, price (P) and quality (Q).Under a ‘logit’ function, the probability of studentschoosing A (Prob (A)) is given by:
In this equation, the ß’s are parameters to be estimated.The probability of students choosing B is the same, exceptwith the price and quality of B on the numerator. The twoprobabilities clearly add to 1 in this case.
This formula naturally extends as more destinations andattributes are included. With sufficient data, it is possible tocalibrate (or statistically estimate) the parameters of thefunction.
It is important to bear in mind that, given the lack ofcomparative data between choices of destinationcountries in the international education arena, theattractiveness ratings were developed by the BritishCouncil, IDP and representatives of the UK’s internationaleducation industry.
Using the discrete choice model toforecast demand for UK internationalstudent placesThe research team undertook a six-step process todetermine the UK’s forecast market share of the globaldemand for international higher education student places,using a discrete choice model. Each step is outlined below.
Step 1: Determine the consideration set
The first step in the development of the discrete choicemodel was to identify the range of choices for theconsumer, and in doing so to determine the UK’scompetitors. In the case of international education choice,the competitive set for the UK was defined as the UnitedStates, Australia, Canada and New Zealand. Thesecountries are referred to as the five major Englishspeaking destination countries or MESDCs.
It was recognised that the competitor set may varybetween source countries and may include non-Englishspeaking countries. For example, Chinese students mayconsider international study options in Japan or European
Table 2.2.1
Primary attractiveness factors
Attribute
Quality of education
Employment prospects
Affordability
Personal security
Lifestyle
Education accessibility
Description
Relates to the education process. It broadly corresponds to the academic reputation, academicand social support and flexibility and diversity of course delivered. It includes aspects such asresources and teaching skills, and whether the curriculum is in tune with economic, social,political, cultural and environment realities of the local country and the world.
This factor is related to the education outcome. It refers to the value of a destination country’squalifications within the local and global labour markets, and to this extent it includes both theability to obtain employment as well as the relative return within the labour market over aperiod of time.
Affordability is related to students’ perceptions of the cost of living and tuition fees in aparticular study destination12. A high performance rating for affordability for a destinationcountry implies that the destination is perceived as being relatively lower-cost than otherdestination countries.
Personal security refers to the general perception of safety and security within the destination country.
Lifestyle encompasses lifestyle factors such as sports, music, fashion, nightlife as well as othercultural factors such as cultural tolerance, acceptance, similarity or difference.
Education accessibility is defined as the ease of access to institutions and programmes offered bya particular destination country. This is quite different from ‘country accessibility’, which includessupply-side issues that can facilitate or set up barriers to demand, such as visa regulations.
Prob(A)=ß1PA+ß2QAe
ß1PA+ß2QAe ß1PB+ß2QBe+
9 See, for example, Discrete Choice Analysis by Ben-Akiva and Lerman, MIT Press 1993, or Discrete Choice Methods with Simulation by K Train, Cambridge University Press, 2003.
10 For example, according to Doorbar and Associates’ (2001) survey of Asian students in the MESDCs, the top three preferred destination countries werethe UK, US and Australia. Over 70 per cent, 51 percent and 38 per cent of responses respectively preferred these destinations. Canada and New Zealandwere preferred by only 8 per cent and 2 per cent of that sample.11 Doorbar, A. and Associates (2001), plus Australian Education International (2001), plus IDP Education Australia (2001), plus IDP Education Australia(2000), plus IDP Education Australia (1999), IDP Education Australia (1997). For full details, please see Appendix A.
12 It differs from the ‘value for money’ concept in that it is not possible to isolate the impact of perception of quality from the perception of cost. Hence,affordability enables analysis of the potential impact of price without necessarily having to consider ‘value’. Furthermore it is possible to provide highvalue for money while being unaffordable or, alternatively, it is possible for a destination country to be both low value for money and unaffordable.
P267 market research AW 19/9/05 2:45 pm Page 20

23Research design
2.3 Forecast scenarios
In order to forecast the demand of international studentsgoing to the United Kingdom, the following variables wereincluded in the Global Forecasting Model:
� projected income growth
� projected population growth
� projected higher education participation rates
� projected international access rates
� projected share of total international students for thefive MESDCs
� projected UK share of international students in the fiveMESDCs, that are based on projected performanceratings for each of the MESDCs.
The project team developed a number of scenariosaffecting the UK by considering the following globalchange drivers and their potential impact on the globaldemand for higher education in the UK:
� globalisation and mobility trends
� knowledge economies
� global trade in services
� lifelong learning
� increasing competition
� technology and new modes of delivery
� expectations and needs of students.
Through the use of scenarios – that is, differentcombinations of these change drivers – it is possible toform an understanding of fundamental changes in demandfor international student places and their differing impacton the attractiveness, and hence market share, ofdestination countries. Thus, while most of the variablesused in the forecasting model remain the same throughoutall scenarios, the projected UK market share is the onevariable that will differ.
Detailed discussions within the project team identified thescenarios described in sections 2.3.1 to 2.3.5. Thesescenarios are also briefly presented in Table 2.3.1.
Base scenarioThis provides a reference against which the otherscenarios can be benchmarked. It is based on holding theUK’s performance on each of the primary attractivenessfactors constant over the forecast period.
Described another way, it is assumed that the marketshares for the MESDCs within any particular origin country
remain the same throughout the forecast period. That is, ifthe UK has a share of X per cent in country Y, then thisshare is assumed to remain unchanged. Such a constantshare would come about if the attractiveness factorsremained constant for all destination countries.
22 Vision 2020: Global student mobility
Step 4: Determine performance ratings for eachprimary attractiveness factor
In order to complete the parameters of the primaryattractiveness factors, the project team determined therelative performance of each of the five destinationcountries for each of the primary attractiveness factorsover time. This represented the central input into thediscrete choice model.
This analysis was undertaken at the regional level. Thebroad regional groupings included in the GlobalForecasting Model include:
� Sub-Saharan Africa and North Africa
� Middle East
� East Asia (including all East Asian countries north ofVietnam), South East Asia, South Asia (including theIndian sub-continent and Sri Lanka) and Central Asia(including mainly former Soviet republics)
� North America, Central America and South America
� Western Europe and Eastern Europe
� Oceania.
A full list of the countries in each regional grouping can befound in Appendix B.
For the purposes of model calibration, historical data from1998 to 2003 were required. On the basis of these datatemplates were completed by the project team for eachregion, defining each attractiveness factor for each MESDCover the timespan of the projections.
A sample of a section of a template completed by theproject team, which shows how the performance ratingsfor the primary attractiveness factors were recorded, isprovided in Table 2.2.2.
The final attractiveness templates were agreed on by theproject team following an intensive multi-day workshopdrawing upon existing research plus the expert knowledgeof team members.
Step 5: Statistical calibration
At the conclusion of step 4, the research team haddeveloped two large data sets. One data set analysed thehistorical performance of the MESDCs in attractinginternational students from 13 regions between 1997 and2002 inclusive. That is, the actual size of internationalstudent flows. The other data set compared the relativeperformance of the MESDCs based on the primaryattractiveness factors in each of the 13 regions over thesame time period.
Through a statistical calibration exercise, the researchteam assessed the extent to which changes in each of theprimary attractiveness factors influenced changes inmarket share over the period 1997 to 2002 in the MESDCs.In this way, the statistical calibration identified underlyingparameters and elasticities for each of the primaryattractiveness factors in each region. These elasticities
enabled the research team to determine quantitatively howa small change in students’ perceptions of the UK on anyof the primary attractiveness factors in any region wouldimpact on the UK’s share of that market.
The UK’s market shares could then be applied to the forecastdemand for international higher education student places inthe major English-speaking countries, to give the demand forUK international higher education student places.
Step 6: Identify potential supply side factors
Clearly, the number of international students in adestination country may be influenced by a number offactors other than the destination country’s performancein the primary attractiveness factors. For example, a rangeof supply side factors, such as government regulations,may influence the number of international students from aparticular country or region studying in a particulardestination country.
On this basis, the research team analysed the potentialinstitutional and government supply barriers that couldlimit the current or future demand for international studentplaces in UK institutions.
Table 2.2.2
Section of template – North America 1997 for attractiveness factors and MESDCs
North America 1997 1997 1997 1997 1997
US UK AUS CAN NZ
Quality of education 10 9 3 9 3
Employment prospects 10 8 3 9 2
Affordability 2 3 7 4 8
Personal security 3 8 9 9 10
Lifestyle 8 5 9 9 5
Education accessibility 10 7 3 10 1
(1 = low performance, 10 = high performance)
Table 2.3.1
Summary of scenarios for international education in the UK
Scenario name
Base
Optimistic
Pessimistic
Price escalation
EU impact
Scenario description
This scenario is based on holding the UK’s performance on each of the primary attractivenessfactors constant over the forecast period. Changes that occur in the UK’s overall market shareare compositional changes – that is, related to the UK’s current share in growing or decliningmarkets
This represents the best case for the UK. It assumes that the UK will consistently improve itsperformance in all the key attractiveness attributes over the forecast period.
This is the worst-case scenario, which assumes that the UK will experience a decline in all itsattractiveness attributes.
This assumes a large decline in the perceived performance of UK in terms of affordability. Thiscould result from a variety of reasons: lack of places in UK institutions; large price increases, etc.
This scenario looks only at Europe and how the accession of new states to the EU as well asdomestic policy may affect demand.
P267 market research AW 19/9/05 2:45 pm Page 22

25Research design
The accession countries will have a profound impact onthe demand for higher education in the UK for thefollowing reasons:
� There will be a dramatic increase in the perceptions ofthe affordability of UK education for prospectiveinternational students from the accession countries asthey will be required to pay only domestic student fees.However, this will be tempered by the proposed increasein UK domestic student fees (possibly to £3,000 in2006) – although all EU students will be entitled to thesame fee deferment as domestic students. This isessentially a loan to meet the fees that will be repayableonly when the student has achieved a target salary intheir subsequent employment.
� Given the broad range of widely publicised EUprogrammes aimed at promoting intra-European mobilityof students, it is likely that UK education will beperceived as more accessible.
� There will be an increase in the perception ofemployability. A UK higher education qualification willprovide greater access to employment across EU statesover time – and more immediately in the UK.
The UK is proceeding to introduce tuition fees fordomestic students in higher education at a faster rate thanother EU member states. As EU students must also paythese rates, this may have a continuing negative impact.
The impact:
� an increase in most of the UK’s attractiveness factorsfrom the point of view of the accession countries
� an increase in the employment prospects andaccessibility of UK’s education ratings by 20 per cent forall new EU states from 2005 and for Bulgaria, Romaniaand Turkey from 2009
� an increase in the affordability ratings in 2005 for theaccession states, then a slight decrease in the ratings in2006 with a gradual increase again over time
� Turkey and Cyprus international access rates remainconstant over time.
From scenarios to forecasts . . .Each of the scenario assumptions necessitates differingfuture performance ratings for each of the primaryattractiveness factors and for each of the MESDCs. Thesesets of differing ratings were incorporated into thediscrete choice model to generate projected marketshares for the UK in each of the source countries includedin the Global Forecasting Model. Applying these projectedUK market shares to the forecast total demand forinternational higher education student places in MESDCs,forecasts of the global demand for UK higher educationwere developed for each scenario.
While not part of the Global Forecasting Model, a numberof other characteristics of interest to internationaleducation practitioners have been analysed. The resultsfor these analyses are reported with the forecasts inchapter 3. In each case, the forecasts of internationalstudents in the UK, as derived from the global forecastingmodel, provide a basis for these analyses to be overlaid.
These analyses include the following:
� forecasts by level of study
� forecasts by subject area
� gender considerations
� forecasts of demand for transnational higher educationdelivered by UK institutions
� implications for demand in the UK if education provisionincreases in certain key source countries
� funding sources of international students in the UK
� domestic to international student number ratios in UK universities
� how global student mobility from the UK compares tomobility to the UK.
Level of study
Understanding the future split between postgraduate andundergraduate demand is important for a number ofreasons, including decisions regarding allocation ofinternational marketing resources, as well as influencinghow an institution or country perceives or would like toperceive itself internationally, e.g. as a research institution,teaching institution etc.
As part of this project, the proportion of students studyingfrom each major region at the following different levelswas forecast to 2020: postgraduate research,postgraduate taught courses, first degree, and otherundergraduate students (such as study abroad programmestudents).
These proportions were forecast by observing thehistorical patterns with regard to proportions studying ateach level, and then applying this pattern into the future.
In particular, three assumptions have been made:
24 Vision 2020: Global student mobility
Optimistic scenarioIn this scenario, there is an increasing recognition byemployers and prospective students of the benefits ofbroader academic education over a narrow skill-basededucation. In this context, the UK is well positioned givenits strong reputation for academic excellence and itsbreadth of student choice. Furthermore, effective andcohesive marketing of UK education, continuing thedirections established under the Prime Minister’s Initiative,lead to an increase in the perception of UK educationquality relative to other destination countries. This isreinforced by the establishment of effective quality-assurance processes to ensure that any new educationproviders do not detract from the current perception of UKquality within the international markets. New marketentrants ease some of the supply constraints experiencedby the traditional providers, leading to improved access toUK education. Finally, over the forecast period, the UKexperiences a more favourable exchange rate, althoughthis scenario assumes no major changes in the underlyinglevels of tuition fees and living costs.
The impact:
� relative increases for the UK in:
– employment prospects
– quality of education
– affordability
– education accessibility.
� performance ratings for other competitor countriesremain constant over time.
Pessimistic scenarioThis projects a series of simultaneous events that have alarge negative impact on the perception of UK education inthe international education markets related to all the keyattractiveness factors. The model assumes all these impacttogether early in the forecast period (from 2005) as ameans towards assessing the largest possible effect theycould have for the UK over the timescale of the forecasts. A number of factors might contribute to a rapid growth innegative perceptions, including:
� A reduction in the perception of the UK as a qualitydestination. Possible causes might include: the strongcorrelation between leading research and teachingquality being eroded due to a de-coupling of researchand teaching in some institutions; and ‘problems’associated with the quality of some UK higher educationprogrammes delivered transnationally that arehighlighted in the international press.
� Employers increasingly seeking skill-based training, asopposed to more ‘academically orientated’ education. Inthis context, the USA improves its recognition as aleader in industry-driven education at the expense ofthe UK.
� The slower take-up of GATS leads to increased capacityconstraints in the short term, significantly reducing theperception of the accessibility of UK education.
� A significant increase in the total cost of studying in the UK,driven by increases in the cost of living, increasing tuitionfees driven up by supply constraints and an unfavourableexchange rate. At the same time, students become moresensitive to changes in price as market informationimproves with enhanced global communications.
� Fast-increasing numbers of Chinese and South Asianstudents studying on campus in the UK is seen asimpacting negatively on the perceptions of diversity.This will have a direct impact on North American andEuropean students seeking the unique ‘UK experience’.
The impact:
� the affordability of UK education declines, then veryslowly recovers (but not to previous levels)
� a price elasticity of market share increases significantly;
� a strong decline in the perceptions of educationaccessibility, then recovery to 2020, although not toprevious levels
� a strong decline in the perceptions of quality ofeducation and employment prospects, then recoverybut not to historical levels
� a strong decline in the perceptions of lifestyle, thenconstant until 2020
� increased employment prospects for the United States.
Price escalation scenarioUnder this scenario, in response to the increased demandfor UK education and the lack of places available, UKinstitutions seek to ration the supply of places bysignificantly increasing tuition fees.
While the increase in price has a negative impact onaffordability, it does lead to an unexpected increase in theperceptions of quality within the market. However, this islikely to be a short-term effect as the improvement inglobal communications results in more detailedinformation being available. With better marketinformation, prospective students are able to determinethat the increased prices were a result of limited supplyand not an increase in quality. Over time, perceptions ofquality and employment prospects return to former levels.
The impact:
� a strong decline in affordability, then slow recovery
� a strong initial increase in the perceptions of quality ofeducation and employment prospects, then relativedecline.
European Union impact scenarioWithin this scenario, the impact of the accession of tenEastern European countries (Cyprus, Lithuania, CzechRepublic, Estonia, Poland, Hungary, Slovakia, Latvia,Slovenia and Malta) into the European Union in 2004 isconsidered. This will be followed by the accession ofBulgaria and Romania in 2008. Turkey has also beenincluded in the projections, assuming that they will also join the EU in 2008 – although it is recognised that a datehas yet to be set.
2.4 Further analyses of the nature of demand for UK international student places
P267 market research AW 19/9/05 2:45 pm Page 24
27Research design
This approach implicitly assumes that internationaleducation in the UK and transnational education at UKinstitutions are complements, not substitutes, and that it isattractiveness of the UK as an education provider that isthe main determinant for education choice.
Data was sourced from a survey of British Council officesin key markets. They were able to provide information onthe number of programmes offered by UK institutions in
each country. In addition, a 1997 Institute of DevelopmentStudies (University of Sussex) survey was used to checkand confirm estimates.13
Based on these analyses, the number of students on UKtransnational programmes in each market was estimated.Recently released HESA data, although incomplete, broadlyconfirmed these estimates.14
26 Vision 2020: Global student mobility
� First, that the growth or decline in the share of studentsstudying at any particular level follows an ‘s-shaped’curve – for example, the proportion of studentsfollowing postgraduate taught programmes may initiallyincrease rapidly for a variety of reasons, but thisincrease will eventually taper off. In this way, the marketmaturity theory, as described earlier in the discussionconcerning the discrete choice model, is applied. In thiscase, each cohort of students from a particular area at aparticular level of study is treated as a sub-market.
� Second, it has been assumed that there are upper andlower limits to the proportions of students in particularlevels of study. For example, it is highly unlikely that 90 per cent of students from any particular region willbe studying at the postgraduate research level, althoughthere will normally always be some studying at this level. These limits were set using the judgement of theproject team.
� Third, observing markets has shown that, as a regionalor country market grows in maturity, the numbers ofpostgraduate taught students, as well as undergraduatestudents, rise more rapidly than those of postgraduateresearch students.
Finally, the forecast proportions, calculated at a regionallevel, were then applied to the forecast total studentnumbers from the respective regions.
Subject area
The concept was to forecast the proportions ofinternational students by subject area, in the same way asit was done for levels of study – that is, by examining pasttrends with regard to the breakdown share of students ineach subject area from each region and then projectingthese patterns forward.
However, the available historical data did not show manyconsistently upward or downward pattern in the shares ofstudents in each subject area. Therefore, the decision wasmade to take a weighted average of the share of eachsubject area for each source region of students for the lastfour years, and then to apply this average to all yearsbetween 2004 and 2020. The shares in more recent yearswere given heavier weightings than those in earlier years.For example, if the share of students from region A forsubject area B was 20 per cent, 19 per cent, 22 per centand 23 per cent over the last four years, the resultantweighted average is 21.6 per cent, compared to 21 percent if the average was not weighted.
In some cases, where a clear pattern was obvious, aweighted average was not taken and in such cases themarket shares were forecast forward using the samemethod as was outlined in the level of study analysis (see
above). This was the case for computer science for whichthe historical data showed an upward trend in marketshare over time, in a number of different regions. Onceagain, reasonable limits were applied to the magnitude ofsuch growth.
The following cautions need to be understood whenconsidering level of study and subject area forecasts:
� There is a lack of historic data to establish reliabletrends, particularly for the subject area analysis.
� There is likely to be differentiation of each of the subjectareas as a regional market matures and evolves – ascomparison with mature source markets (e.g. Europeand USA) indicates.
� Changing subject patterns can be driven by currentlyunforeseen changes in the demand for employableskills.
Historic data indicates some degree of stability in patterns,so the forecasts by subject area are likely to be morereliable over the period to 2010 but becoming increasinglyless certain beyond then.
Transnational education
Based on the model for demand for international studentplaces in the UK, a separate analysis has been run tomodel demand for UK transnational programmes
Reliable data on the number of students studying ontransnational programmes is limited. Comprehensive datais available for Australian programmes, and this was usedin the original Australian study to model demand forstudents studying Australian transnational programmes. As more data has become available for UK programmes, a similar approach has been used to model demand for UK transnational programmes.
Demand for transnational education provided by UKsuppliers is modelled as a fraction of the demand forinternational student places in the UK. The methodologyassumes that transnational education will lead to an overallgrowth in demand, rather than that some of the studentdemand that is predicted for study in the UK will besatisfied instead by transnational education.
The first step was to define the current transnational ratiofor each source country. It is then assumed that this ratiowill grow over time, according to an income elasticityfactor representing the responsiveness of participationrates to changes in income and the rate of growth in percapita income (the same factors that influence the demandfor in-country provision). The number of students optingfor UK transnational education at any given time in thefuture is then calculated by applying this ratio to demandfor study in the UK.
13 IDS Working Paper 75 ‘The Internationalisation of Higher education’, Paul Benell and Terry Pearce. For this paper, a survey was conducted and datawas collected from 109 out of a total of 124 universities in the UK for 1997. For a total of 31 institutions these figures relate to 1994–95 or 1996 datawhich was gathered from CVU and UKCOSA surveys.14 86 institutions (50 per cent in total) returned data to HESA on students studying for the whole of their course overseas in 2002–03.
P267 market research AW 19/9/05 2:45 pm Page 26

29
3.1 Analysis of the UK’s market share
Understanding the historical changes in the UK’s globalmarket share of international higher education studentsprovides an important foundation for the development ofstrategy, policy and planning within governments,institutions and the private sector.
Among the five MESDCs, the UK has the second largestmarket share after the US. However, until recently, the gapbetween the US and the UK appeared to be increasing.
Considering the period between 1997–98 and 2001–02,the total number of international student numbers in theUK has increased by about 19 per cent. The compoundannual growth rate since 1997, although still positive at 3.5per cent, is the smallest rate of the major competitorcountries. However, if the recently available UK data for2002–03 is included, then a more positive improvement isseen. In this case, the compound rate of growth over thelast three years is 7.7 per cent per annum. Table 3.1.1summarises the growth in student numbers in the MESDCs.
3 Analysis andforecasts
‘The study clearlydemonstrates theimpact of the twofactors that have
emerged to be of overriding
importance . . .
these are the perceivedquality of the provisionin the UK and the futureemployment prospectsassociated with the UKqualification obtained.’Vision 2020, section 3.2
Table 3.1.1
Total student numbers MESDCs* (000s)
MESDCs 1997 1998 1999 2000 2001 2002 2003 CompoundGrowth (97–02)
USA 458 481 491 515 548 583 586 4.9%
UK 198 208 213 219 223 235 273 3.5%
Australia 49 54 59 70 82 97 115 14.5%
Canada 32 33 36 41 59 69 N/A 16.8%
NZ 6 6 6 7 10 15 N/A 21.4%
Total 743 782 804 852 922 999 6.1%
* Data for Canada for 2002 is based on IDP projections
Table 3.1.2 clearly indicates the downward trends in globalmarket shares for both the UK and USA. The UK suffered a3.1 per cent loss in share from 1997 to 2002, even thoughactual numbers increased from 198,000 to 235,000 overthis period. This contrasts with growths in global market
shares of the other three MESDCs, albeit from a small base.The UK is estimated to have reversed this decline in globalmarket share in 2003, but the final figure can only becalculated when confirmed data from all MESDCs becomesavailable
Table 3.1.2
Global market share MESDCs
MESDCs 1997 1998 1999 2000 2001 2002 Change 97–02
USA 61.7% 61.6% 61.1% 60.4% 59.4% 58.4% –3.3%
UK 26.7% 26.6% 26.5% 25.7% 24.2% 23.6% –3.1%
Australia 6.6% 6.9% 7.3% 8.2% 8.9% 9.7% 3.1%
Canada 4.3% 4.2% 4.4% 4.9% 6.4% 6.9% 2.6%
NZ 0.8% 0.7% 0.7% 0.8% 1.1% 1.5% 0.7%
P267 market research AW 19/9/05 2:45 pm Page 28
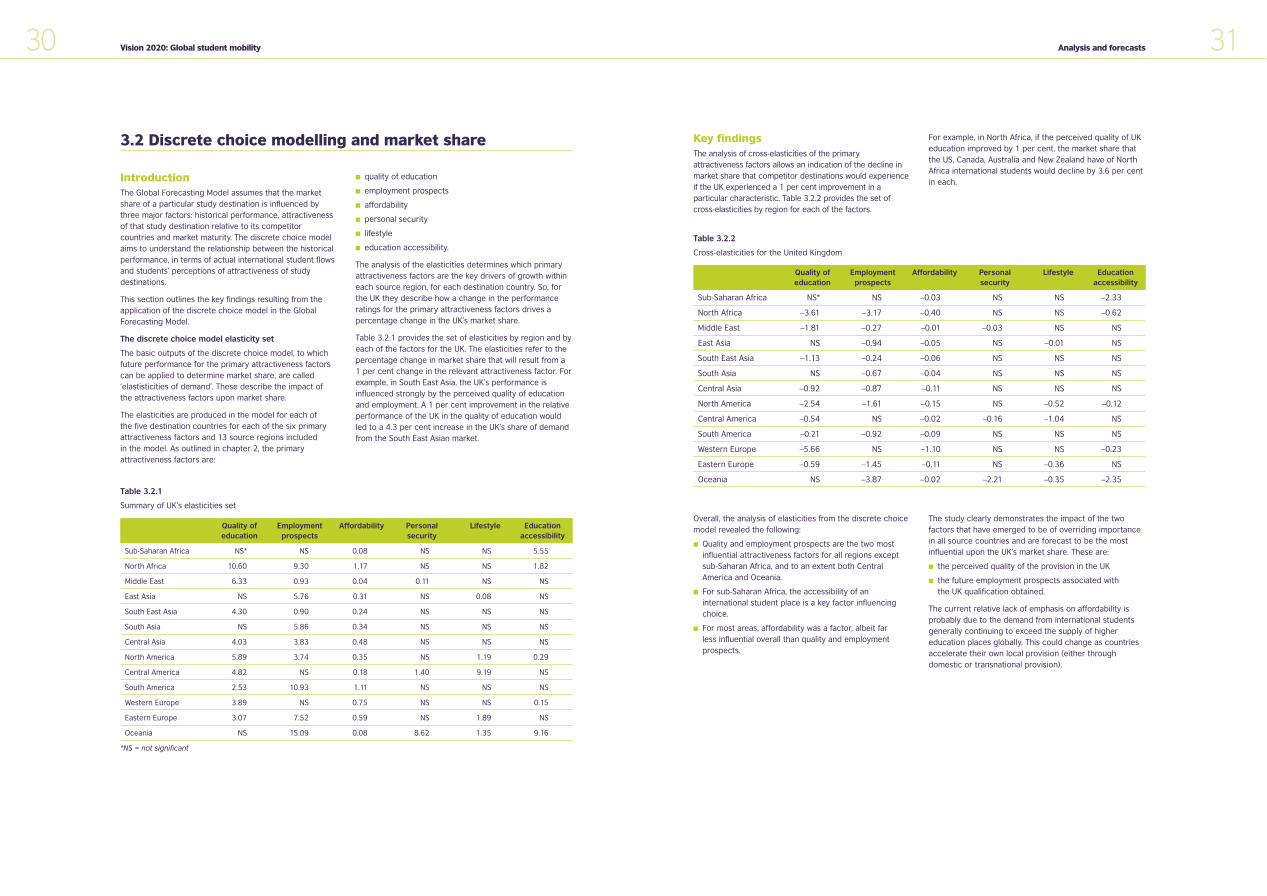
31Analysis and forecasts
Key findingsThe analysis of cross-elasticities of the primaryattractiveness factors allows an indication of the decline inmarket share that competitor destinations would experienceif the UK experienced a 1 per cent improvement in aparticular characteristic. Table 3.2.2 provides the set ofcross-elasticities by region for each of the factors.
For example, in North Africa, if the perceived quality of UKeducation improved by 1 per cent, the market share thatthe US, Canada, Australia and New Zealand have of NorthAfrica international students would decline by 3.6 per centin each.
30 Vision 2020: Global student mobility
3.2 Discrete choice modelling and market share
IntroductionThe Global Forecasting Model assumes that the marketshare of a particular study destination is influenced bythree major factors: historical performance, attractivenessof that study destination relative to its competitorcountries and market maturity. The discrete choice modelaims to understand the relationship between the historicalperformance, in terms of actual international student flowsand students’ perceptions of attractiveness of studydestinations.
This section outlines the key findings resulting from theapplication of the discrete choice model in the GlobalForecasting Model.
The discrete choice model elasticity set
The basic outputs of the discrete choice model, to whichfuture performance for the primary attractiveness factorscan be applied to determine market share, are called‘elastisticities of demand’. These describe the impact of the attractiveness factors upon market share.
The elasticities are produced in the model for each of the five destination countries for each of the six primaryattractiveness factors and 13 source regions included in the model. As outlined in chapter 2, the primaryattractiveness factors are:
� quality of education
� employment prospects
� affordability
� personal security
� lifestyle
� education accessibility.
The analysis of the elasticities determines which primaryattractiveness factors are the key drivers of growth withineach source region, for each destination country. So, forthe UK they describe how a change in the performanceratings for the primary attractiveness factors drives apercentage change in the UK’s market share.
Table 3.2.1 provides the set of elasticities by region and byeach of the factors for the UK. The elasticities refer to thepercentage change in market share that will result from a 1 per cent change in the relevant attractiveness factor. Forexample, in South East Asia, the UK’s performance isinfluenced strongly by the perceived quality of educationand employment. A 1 per cent improvement in the relativeperformance of the UK in the quality of education wouldled to a 4.3 per cent increase in the UK’s share of demandfrom the South East Asian market.
Quality of Employment Affordability Personal Lifestyle Educationeducation prospects security accessibility
Sub-Saharan Africa NS* NS 0.08 NS NS 5.55
North Africa 10.60 9.30 1.17 NS NS 1.82
Middle East 6.33 0.93 0.04 0.11 NS NS
East Asia NS 5.76 0.31 NS 0.08 NS
South East Asia 4.30 0.90 0.24 NS NS NS
South Asia NS 5.86 0.34 NS NS NS
Central Asia 4.03 3.83 0.48 NS NS NS
North America 5.89 3.74 0.35 NS 1.19 0.29
Central America 4.82 NS 0.18 1.40 9.19 NS
South America 2.53 10.93 1.11 NS NS NS
Western Europe 3.89 NS 0.75 NS NS 0.15
Eastern Europe 3.07 7.52 0.59 NS 1.89 NS
Oceania NS 15.09 0.08 8.62 1.35 9.16
*NS = not significant
Table 3.2.1
Summary of UK’s elasticities set
Quality of Employment Affordability Personal Lifestyle Educationeducation prospects security accessibility
Sub-Saharan Africa NS* NS –0.03 NS NS –2.33
North Africa –3.61 –3.17 –0.40 NS NS –0.62
Middle East –1.81 –0.27 –0.01 –0.03 NS NS
East Asia NS –0.94 –0.05 NS –0.01 NS
South East Asia –1.13 –0.24 –0.06 NS NS NS
South Asia NS –0.67 –0.04 NS NS NS
Central Asia –0.92 –0.87 –0.11 NS NS NS
North America –2.54 –1.61 –0.15 NS –0.52 –0.12
Central America –0.54 NS –0.02 –0.16 –1.04 NS
South America –0.21 –0.92 –0.09 NS NS NS
Western Europe –5.66 NS –1.10 NS NS –0.23
Eastern Europe –0.59 –1.45 –0.11 NS –0.36 NS
Oceania NS –3.87 –0.02 –2.21 –0.35 –2.35
Table 3.2.2
Cross-elasticities for the United Kingdom
Overall, the analysis of elasticities from the discrete choicemodel revealed the following:
� Quality and employment prospects are the two mostinfluential attractiveness factors for all regions exceptsub-Saharan Africa, and to an extent both CentralAmerica and Oceania.
� For sub-Saharan Africa, the accessibility of aninternational student place is a key factor influencingchoice.
� For most areas, affordability was a factor, albeit far less influential overall than quality and employmentprospects.
The study clearly demonstrates the impact of the twofactors that have emerged to be of overriding importancein all source countries and are forecast to be the mostinfluential upon the UK’s market share. These are:
� the perceived quality of the provision in the UK
� the future employment prospects associated with the UK qualification obtained.
The current relative lack of emphasis on affordability isprobably due to the demand from international studentsgenerally continuing to exceed the supply of highereducation places globally. This could change as countriesaccelerate their own local provision (either throughdomestic or transnational provision).
P267 market research AW 19/9/05 2:45 pm Page 30
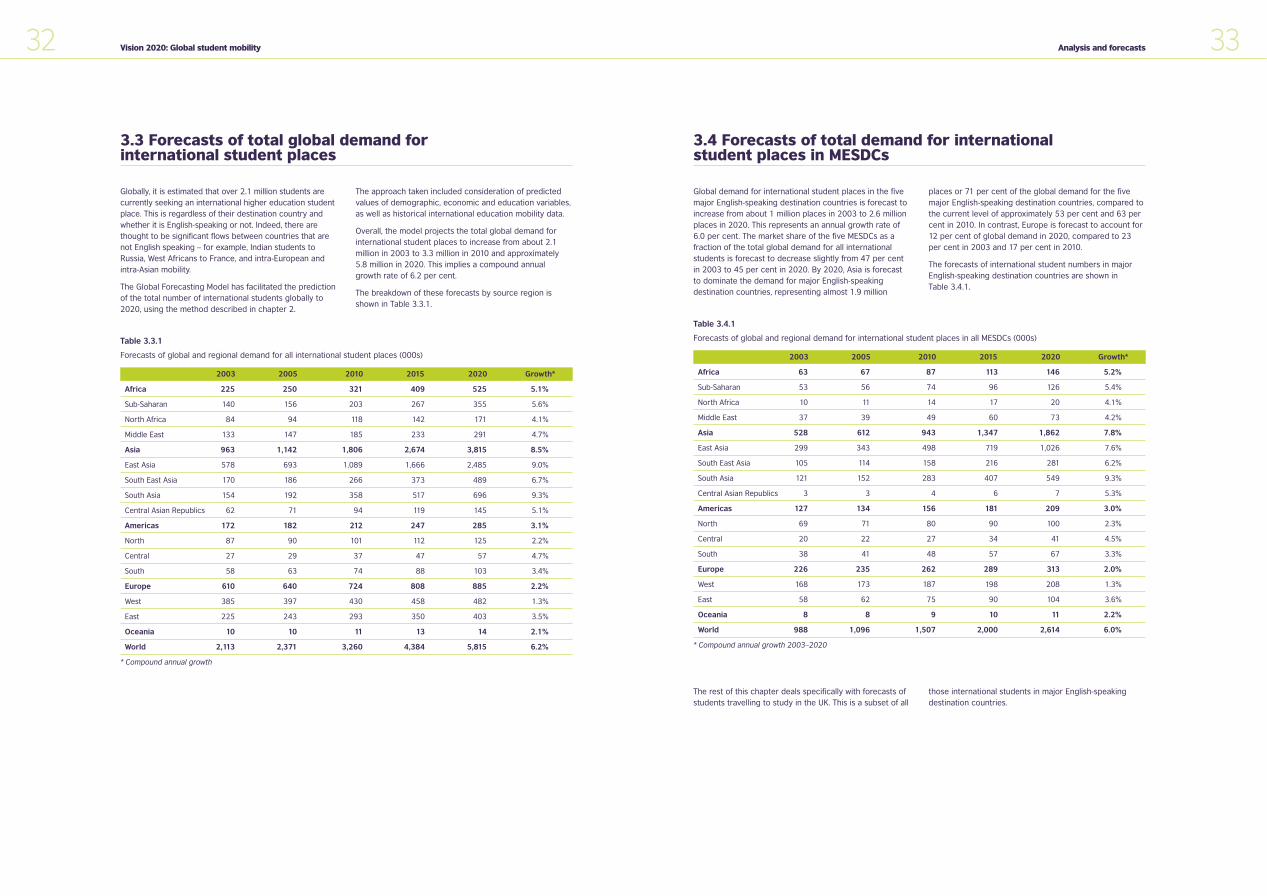
33Analysis and forecasts
3.4 Forecasts of total demand for international student places in MESDCs
Global demand for international student places in the fivemajor English-speaking destination countries is forecast toincrease from about 1 million places in 2003 to 2.6 millionplaces in 2020. This represents an annual growth rate of6.0 per cent. The market share of the five MESDCs as afraction of the total global demand for all internationalstudents is forecast to decrease slightly from 47 per centin 2003 to 45 per cent in 2020. By 2020, Asia is forecastto dominate the demand for major English-speakingdestination countries, representing almost 1.9 million
places or 71 per cent of the global demand for the fivemajor English-speaking destination countries, compared tothe current level of approximately 53 per cent and 63 percent in 2010. In contrast, Europe is forecast to account for12 per cent of global demand in 2020, compared to 23per cent in 2003 and 17 per cent in 2010.
The forecasts of international student numbers in majorEnglish-speaking destination countries are shown in Table 3.4.1.
32 Vision 2020: Global student mobility
3.3 Forecasts of total global demand for international student places
Globally, it is estimated that over 2.1 million students arecurrently seeking an international higher education studentplace. This is regardless of their destination country andwhether it is English-speaking or not. Indeed, there arethought to be significant flows between countries that arenot English speaking – for example, Indian students toRussia, West Africans to France, and intra-European andintra-Asian mobility.
The Global Forecasting Model has facilitated the predictionof the total number of international students globally to2020, using the method described in chapter 2.
The approach taken included consideration of predictedvalues of demographic, economic and education variables,as well as historical international education mobility data.
Overall, the model projects the total global demand forinternational student places to increase from about 2.1million in 2003 to 3.3 million in 2010 and approximately5.8 million in 2020. This implies a compound annualgrowth rate of 6.2 per cent.
The breakdown of these forecasts by source region isshown in Table 3.3.1.
Table 3.3.1
Forecasts of global and regional demand for all international student places (000s)
2003 2005 2010 2015 2020 Growth*
Africa 225 250 321 409 525 5.1%
Sub-Saharan 140 156 203 267 355 5.6%
North Africa 84 94 118 142 171 4.1%
Middle East 133 147 185 233 291 4.7%
Asia 963 1,142 1,806 2,674 3,815 8.5%
East Asia 578 693 1,089 1,666 2,485 9.0%
South East Asia 170 186 266 373 489 6.7%
South Asia 154 192 358 517 696 9.3%
Central Asian Republics 62 71 94 119 145 5.1%
Americas 172 182 212 247 285 3.1%
North 87 90 101 112 125 2.2%
Central 27 29 37 47 57 4.7%
South 58 63 74 88 103 3.4%
Europe 610 640 724 808 885 2.2%
West 385 397 430 458 482 1.3%
East 225 243 293 350 403 3.5%
Oceania 10 10 11 13 14 2.1%
World 2,113 2,371 3,260 4,384 5,815 6.2%
* Compound annual growth
Table 3.4.1
Forecasts of global and regional demand for international student places in all MESDCs (000s)
2003 2005 2010 2015 2020 Growth*
Africa 63 67 87 113 146 5.2%
Sub-Saharan 53 56 74 96 126 5.4%
North Africa 10 11 14 17 20 4.1%
Middle East 37 39 49 60 73 4.2%
Asia 528 612 943 1,347 1,862 7.8%
East Asia 299 343 498 719 1,026 7.6%
South East Asia 105 114 158 216 281 6.2%
South Asia 121 152 283 407 549 9.3%
Central Asian Republics 3 3 4 6 7 5.3%
Americas 127 134 156 181 209 3.0%
North 69 71 80 90 100 2.3%
Central 20 22 27 34 41 4.5%
South 38 41 48 57 67 3.3%
Europe 226 235 262 289 313 2.0%
West 168 173 187 198 208 1.3%
East 58 62 75 90 104 3.6%
Oceania 8 8 9 10 11 2.2%
World 988 1,096 1,507 2,000 2,614 6.0%
* Compound annual growth 2003–2020
The rest of this chapter deals specifically with forecasts ofstudents travelling to study in the UK. This is a subset of all
those international students in major English-speakingdestination countries.
P267 market research AW 19/9/05 2:45 pm Page 32
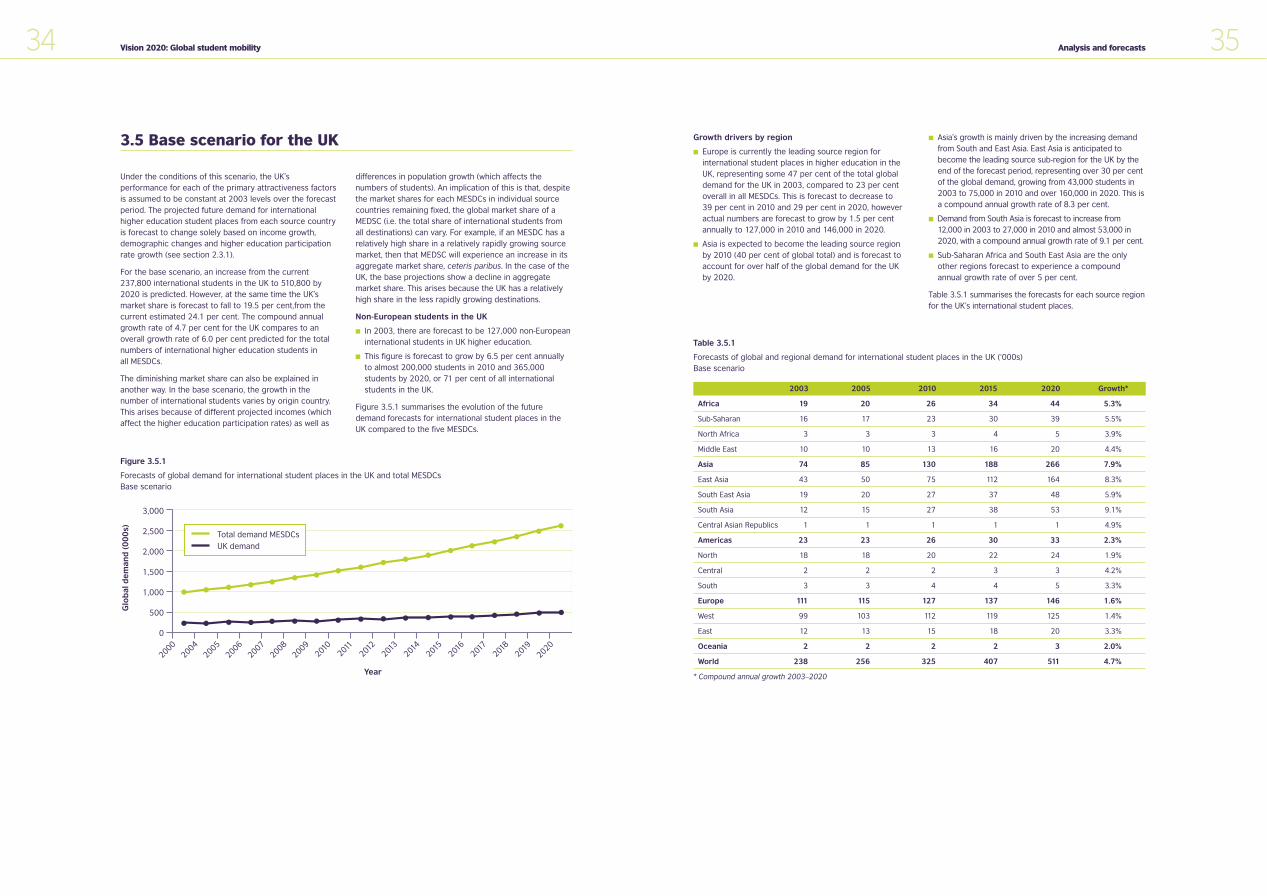
35Analysis and forecasts
Growth drivers by region
� Europe is currently the leading source region forinternational student places in higher education in theUK, representing some 47 per cent of the total globaldemand for the UK in 2003, compared to 23 per centoverall in all MESDCs. This is forecast to decrease to 39 per cent in 2010 and 29 per cent in 2020, howeveractual numbers are forecast to grow by 1.5 per centannually to 127,000 in 2010 and 146,000 in 2020.
� Asia is expected to become the leading source regionby 2010 (40 per cent of global total) and is forecast toaccount for over half of the global demand for the UK by 2020.
� Asia’s growth is mainly driven by the increasing demandfrom South and East Asia. East Asia is anticipated tobecome the leading source sub-region for the UK by theend of the forecast period, representing over 30 per centof the global demand, growing from 43,000 students in2003 to 75,000 in 2010 and over 160,000 in 2020. This isa compound annual growth rate of 8.3 per cent.
� Demand from South Asia is forecast to increase from12,000 in 2003 to 27,000 in 2010 and almost 53,000 in2020, with a compound annual growth rate of 9.1 per cent.
� Sub-Saharan Africa and South East Asia are the onlyother regions forecast to experience a compoundannual growth rate of over 5 per cent.
Table 3.5.1 summarises the forecasts for each source regionfor the UK’s international student places.
34 Vision 2020: Global student mobility
3.5 Base scenario for the UK
Under the conditions of this scenario, the UK’sperformance for each of the primary attractiveness factorsis assumed to be constant at 2003 levels over the forecastperiod. The projected future demand for internationalhigher education student places from each source countryis forecast to change solely based on income growth,demographic changes and higher education participationrate growth (see section 2.3.1).
For the base scenario, an increase from the current237,800 international students in the UK to 510,800 by2020 is predicted. However, at the same time the UK’smarket share is forecast to fall to 19.5 per cent,from thecurrent estimated 24.1 per cent. The compound annualgrowth rate of 4.7 per cent for the UK compares to anoverall growth rate of 6.0 per cent predicted for the totalnumbers of international higher education students in all MESDCs.
The diminishing market share can also be explained inanother way. In the base scenario, the growth in thenumber of international students varies by origin country.This arises because of different projected incomes (whichaffect the higher education participation rates) as well as
differences in population growth (which affects thenumbers of students). An implication of this is that, despitethe market shares for each MESDCs in individual sourcecountries remaining fixed, the global market share of aMEDSC (i.e. the total share of international students fromall destinations) can vary. For example, if an MESDC has arelatively high share in a relatively rapidly growing sourcemarket, then that MEDSC will experience an increase in itsaggregate market share, ceteris paribus. In the case of theUK, the base projections show a decline in aggregatemarket share. This arises because the UK has a relativelyhigh share in the less rapidly growing destinations.
Non-European students in the UK
� In 2003, there are forecast to be 127,000 non-Europeaninternational students in UK higher education.
� This figure is forecast to grow by 6.5 per cent annuallyto almost 200,000 students in 2010 and 365,000students by 2020, or 71 per cent of all internationalstudents in the UK.
Figure 3.5.1 summarises the evolution of the futuredemand forecasts for international student places in theUK compared to the five MESDCs.
Figure 3.5.1
Forecasts of global demand for international student places in the UK and total MESDCsBase scenario
3,000
2,500
2,000
1,500
1,000
500
0
Glo
bal
de
man
d (
00
0s)
2000
2004
2005
2006
2007
2008
2009
2010
2011
2012
2013
2014
2015
2016
2017
2018
2019
2020
Year
Total demand MESDCs
UK demand
Table 3.5.1
Forecasts of global and regional demand for international student places in the UK (‘000s)Base scenario
2003 2005 2010 2015 2020 Growth*
Africa 19 20 26 34 44 5.3%
Sub-Saharan 16 17 23 30 39 5.5%
North Africa 3 3 3 4 5 3.9%
Middle East 10 10 13 16 20 4.4%
Asia 74 85 130 188 266 7.9%
East Asia 43 50 75 112 164 8.3%
South East Asia 19 20 27 37 48 5.9%
South Asia 12 15 27 38 53 9.1%
Central Asian Republics 1 1 1 1 1 4.9%
Americas 23 23 26 30 33 2.3%
North 18 18 20 22 24 1.9%
Central 2 2 2 3 3 4.2%
South 3 3 4 4 5 3.3%
Europe 111 115 127 137 146 1.6%
West 99 103 112 119 125 1.4%
East 12 13 15 18 20 3.3%
Oceania 2 2 2 2 3 2.0%
World 238 256 325 407 511 4.7%
* Compound annual growth 2003–2020
P267 market research AW 19/9/05 2:45 pm Page 34
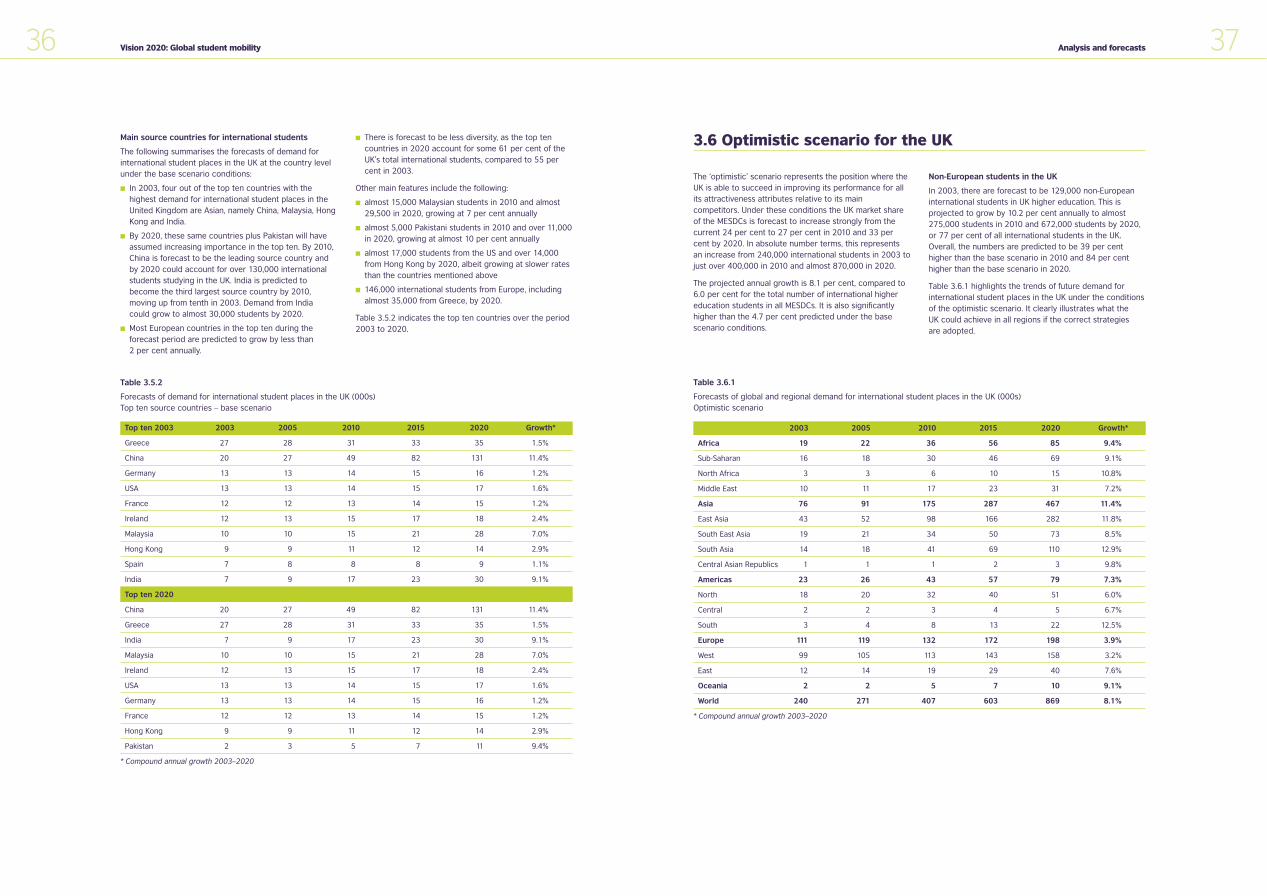
37Analysis and forecasts
3.6 Optimistic scenario for the UK
The ‘optimistic’ scenario represents the position where theUK is able to succeed in improving its performance for allits attractiveness attributes relative to its maincompetitors. Under these conditions the UK market shareof the MESDCs is forecast to increase strongly from thecurrent 24 per cent to 27 per cent in 2010 and 33 percent by 2020. In absolute number terms, this representsan increase from 240,000 international students in 2003 tojust over 400,000 in 2010 and almost 870,000 in 2020.
The projected annual growth is 8.1 per cent, compared to6.0 per cent for the total number of international highereducation students in all MESDCs. It is also significantlyhigher than the 4.7 per cent predicted under the basescenario conditions.
Non-European students in the UK
In 2003, there are forecast to be 129,000 non-Europeaninternational students in UK higher education. This isprojected to grow by 10.2 per cent annually to almost275,000 students in 2010 and 672,000 students by 2020,or 77 per cent of all international students in the UK.Overall, the numbers are predicted to be 39 per centhigher than the base scenario in 2010 and 84 per centhigher than the base scenario in 2020.
Table 3.6.1 highlights the trends of future demand forinternational student places in the UK under the conditionsof the optimistic scenario. It clearly illustrates what the UK could achieve in all regions if the correct strategies are adopted.
36 Vision 2020: Global student mobility
Main source countries for international students
The following summarises the forecasts of demand forinternational student places in the UK at the country levelunder the base scenario conditions:
� In 2003, four out of the top ten countries with thehighest demand for international student places in theUnited Kingdom are Asian, namely China, Malaysia, HongKong and India.
� By 2020, these same countries plus Pakistan will haveassumed increasing importance in the top ten. By 2010,China is forecast to be the leading source country andby 2020 could account for over 130,000 internationalstudents studying in the UK. India is predicted tobecome the third largest source country by 2010,moving up from tenth in 2003. Demand from India could grow to almost 30,000 students by 2020.
� Most European countries in the top ten during theforecast period are predicted to grow by less than 2 per cent annually.
� There is forecast to be less diversity, as the top tencountries in 2020 account for some 61 per cent of theUK’s total international students, compared to 55 percent in 2003.
Other main features include the following:
� almost 15,000 Malaysian students in 2010 and almost29,500 in 2020, growing at 7 per cent annually
� almost 5,000 Pakistani students in 2010 and over 11,000in 2020, growing at almost 10 per cent annually
� almost 17,000 students from the US and over 14,000from Hong Kong by 2020, albeit growing at slower ratesthan the countries mentioned above
� 146,000 international students from Europe, includingalmost 35,000 from Greece, by 2020.
Table 3.5.2 indicates the top ten countries over the period2003 to 2020.
Table 3.5.2
Forecasts of demand for international student places in the UK (000s)Top ten source countries – base scenario
Top ten 2003 2003 2005 2010 2015 2020 Growth*
Greece 27 28 31 33 35 1.5%
China 20 27 49 82 131 11.4%
Germany 13 13 14 15 16 1.2%
USA 13 13 14 15 17 1.6%
France 12 12 13 14 15 1.2%
Ireland 12 13 15 17 18 2.4%
Malaysia 10 10 15 21 28 7.0%
Hong Kong 9 9 11 12 14 2.9%
Spain 7 8 8 8 9 1.1%
India 7 9 17 23 30 9.1%
Top ten 2020
China 20 27 49 82 131 11.4%
Greece 27 28 31 33 35 1.5%
India 7 9 17 23 30 9.1%
Malaysia 10 10 15 21 28 7.0%
Ireland 12 13 15 17 18 2.4%
USA 13 13 14 15 17 1.6%
Germany 13 13 14 15 16 1.2%
France 12 12 13 14 15 1.2%
Hong Kong 9 9 11 12 14 2.9%
Pakistan 2 3 5 7 11 9.4%
* Compound annual growth 2003–2020
Table 3.6.1
Forecasts of global and regional demand for international student places in the UK (000s)Optimistic scenario
2003 2005 2010 2015 2020 Growth*
Africa 19 22 36 56 85 9.4%
Sub-Saharan 16 18 30 46 69 9.1%
North Africa 3 3 6 10 15 10.8%
Middle East 10 11 17 23 31 7.2%
Asia 76 91 175 287 467 11.4%
East Asia 43 52 98 166 282 11.8%
South East Asia 19 21 34 50 73 8.5%
South Asia 14 18 41 69 110 12.9%
Central Asian Republics 1 1 1 2 3 9.8%
Americas 23 26 43 57 79 7.3%
North 18 20 32 40 51 6.0%
Central 2 2 3 4 5 6.7%
South 3 4 8 13 22 12.5%
Europe 111 119 132 172 198 3.9%
West 99 105 113 143 158 3.2%
East 12 14 19 29 40 7.6%
Oceania 2 2 5 7 10 9.1%
World 240 271 407 603 869 8.1%
* Compound annual growth 2003–2020
P267 market research AW 19/9/05 2:45 pm Page 36
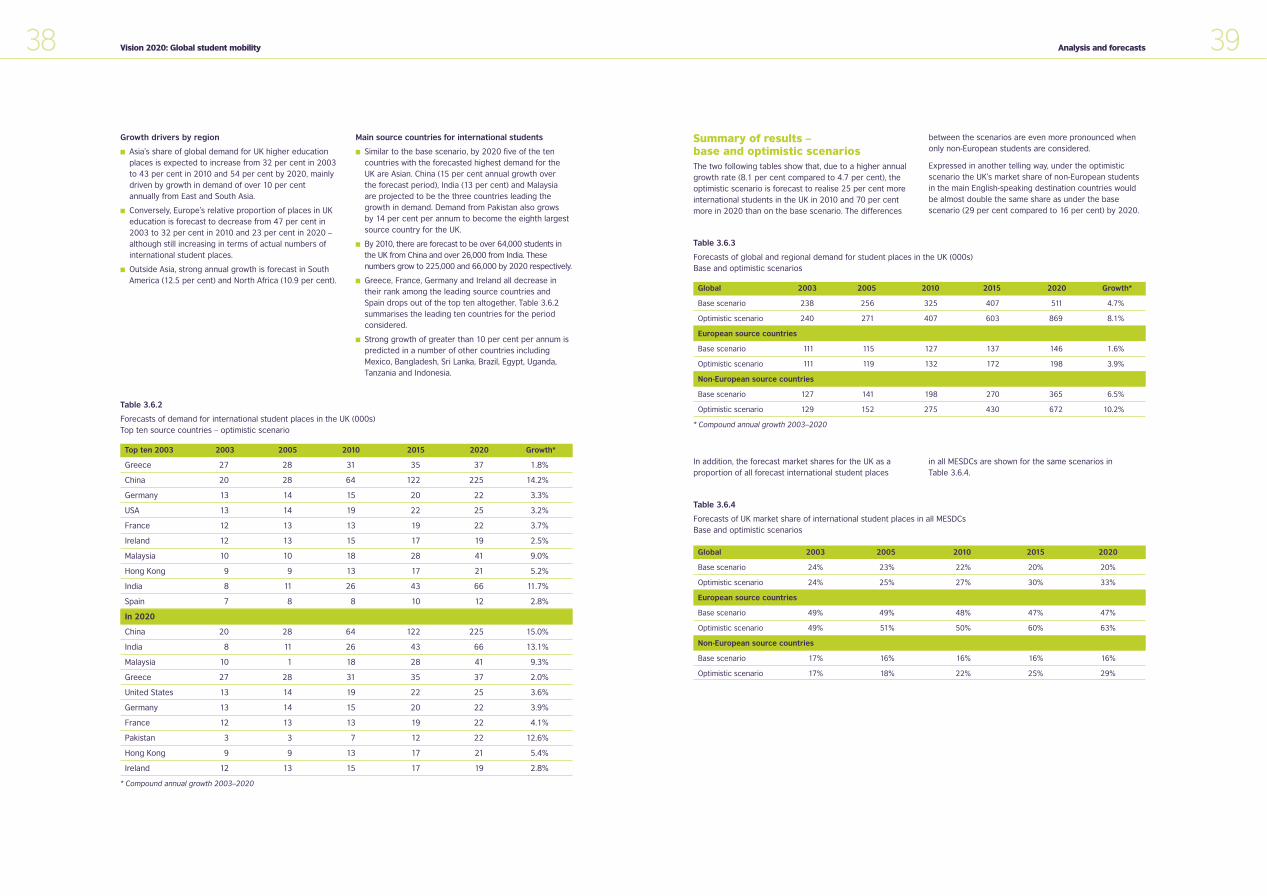
39Analysis and forecasts
Table 3.6.2
Forecasts of demand for international student places in the UK (000s)Top ten source countries – optimistic scenario
Summary of results – base and optimistic scenariosThe two following tables show that, due to a higher annualgrowth rate (8.1 per cent compared to 4.7 per cent), theoptimistic scenario is forecast to realise 25 per cent moreinternational students in the UK in 2010 and 70 per centmore in 2020 than on the base scenario. The differences
between the scenarios are even more pronounced whenonly non-European students are considered.
Expressed in another telling way, under the optimisticscenario the UK’s market share of non-European studentsin the main English-speaking destination countries wouldbe almost double the same share as under the basescenario (29 per cent compared to 16 per cent) by 2020.
38 Vision 2020: Global student mobility
Growth drivers by region
� Asia’s share of global demand for UK higher educationplaces is expected to increase from 32 per cent in 2003to 43 per cent in 2010 and 54 per cent by 2020, mainlydriven by growth in demand of over 10 per centannually from East and South Asia.
� Conversely, Europe’s relative proportion of places in UKeducation is forecast to decrease from 47 per cent in2003 to 32 per cent in 2010 and 23 per cent in 2020 –although still increasing in terms of actual numbers ofinternational student places.
� Outside Asia, strong annual growth is forecast in SouthAmerica (12.5 per cent) and North Africa (10.9 per cent).
Main source countries for international students
� Similar to the base scenario, by 2020 five of the tencountries with the forecasted highest demand for the UK are Asian. China (15 per cent annual growth over the forecast period), India (13 per cent) and Malaysia are projected to be the three countries leading thegrowth in demand. Demand from Pakistan also grows by 14 per cent per annum to become the eighth largestsource country for the UK.
� By 2010, there are forecast to be over 64,000 students inthe UK from China and over 26,000 from India. Thesenumbers grow to 225,000 and 66,000 by 2020 respectively.
� Greece, France, Germany and Ireland all decrease intheir rank among the leading source countries andSpain drops out of the top ten altogether. Table 3.6.2summarises the leading ten countries for the periodconsidered.
� Strong growth of greater than 10 per cent per annum ispredicted in a number of other countries includingMexico, Bangladesh, Sri Lanka, Brazil, Egypt, Uganda,Tanzania and Indonesia.
Top ten 2003 2003 2005 2010 2015 2020 Growth*
Greece 27 28 31 35 37 1.8%
China 20 28 64 122 225 14.2%
Germany 13 14 15 20 22 3.3%
USA 13 14 19 22 25 3.2%
France 12 13 13 19 22 3.7%
Ireland 12 13 15 17 19 2.5%
Malaysia 10 10 18 28 41 9.0%
Hong Kong 9 9 13 17 21 5.2%
India 8 11 26 43 66 11.7%
Spain 7 8 8 10 12 2.8%
In 2020
China 20 28 64 122 225 15.0%
India 8 11 26 43 66 13.1%
Malaysia 10 1 18 28 41 9.3%
Greece 27 28 31 35 37 2.0%
United States 13 14 19 22 25 3.6%
Germany 13 14 15 20 22 3.9%
France 12 13 13 19 22 4.1%
Pakistan 3 3 7 12 22 12.6%
Hong Kong 9 9 13 17 21 5.4%
Ireland 12 13 15 17 19 2.8%
* Compound annual growth 2003–2020
Table 3.6.3
Forecasts of global and regional demand for student places in the UK (000s)Base and optimistic scenarios
Global 2003 2005 2010 2015 2020 Growth*
Base scenario 238 256 325 407 511 4.7%
Optimistic scenario 240 271 407 603 869 8.1%
European source countries
Base scenario 111 115 127 137 146 1.6%
Optimistic scenario 111 119 132 172 198 3.9%
Non-European source countries
Base scenario 127 141 198 270 365 6.5%
Optimistic scenario 129 152 275 430 672 10.2%
* Compound annual growth 2003–2020
In addition, the forecast market shares for the UK as aproportion of all forecast international student places
in all MESDCs are shown for the same scenarios in Table 3.6.4.
Table 3.6.4
Forecasts of UK market share of international student places in all MESDCsBase and optimistic scenarios
Global 2003 2005 2010 2015 2020
Base scenario 24% 23% 22% 20% 20%
Optimistic scenario 24% 25% 27% 30% 33%
European source countries
Base scenario 49% 49% 48% 47% 47%
Optimistic scenario 49% 51% 50% 60% 63%
Non-European source countries
Base scenario 17% 16% 16% 16% 16%
Optimistic scenario 17% 18% 22% 25% 29%
P267 market research AW 19/9/05 2:45 pm Page 38
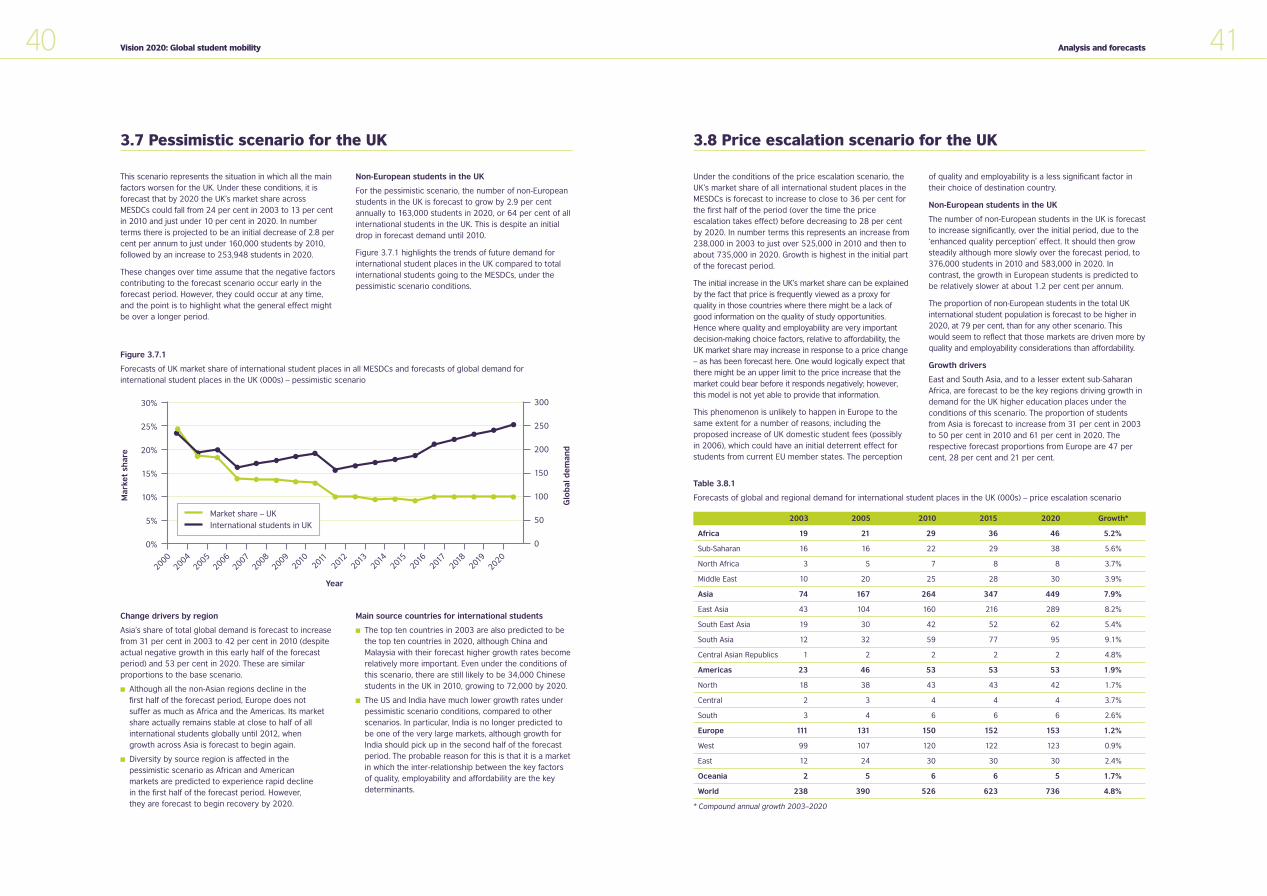
30%
25%
20%
15%
10%
5%
0%
2000
Market share – UK
International students in UK
Mar
ket
shar
e
Glo
bal
de
man
d
Year
200420052006200720082009201
0201
1201
2201
3201
4201
5201
6201
7201
8201
92020
300
250
200
150
100
50
0
41Analysis and forecasts
3.7 Pessimistic scenario for the UK
This scenario represents the situation in which all the mainfactors worsen for the UK. Under these conditions, it isforecast that by 2020 the UK’s market share acrossMESDCs could fall from 24 per cent in 2003 to 13 per centin 2010 and just under 10 per cent in 2020. In numberterms there is projected to be an initial decrease of 2.8 percent per annum to just under 160,000 students by 2010,followed by an increase to 253,948 students in 2020.
These changes over time assume that the negative factorscontributing to the forecast scenario occur early in theforecast period. However, they could occur at any time,and the point is to highlight what the general effect mightbe over a longer period.
Non-European students in the UK
For the pessimistic scenario, the number of non-Europeanstudents in the UK is forecast to grow by 2.9 per centannually to 163,000 students in 2020, or 64 per cent of allinternational students in the UK. This is despite an initialdrop in forecast demand until 2010.
Figure 3.7.1 highlights the trends of future demand forinternational student places in the UK compared to totalinternational students going to the MESDCs, under thepessimistic scenario conditions.
40 Vision 2020: Global student mobility
Figure 3.7.1
Forecasts of UK market share of international student places in all MESDCs and forecasts of global demand for international student places in the UK (000s) – pessimistic scenario
Change drivers by region
Asia’s share of total global demand is forecast to increasefrom 31 per cent in 2003 to 42 per cent in 2010 (despiteactual negative growth in this early half of the forecastperiod) and 53 per cent in 2020. These are similarproportions to the base scenario.
� Although all the non-Asian regions decline in the first half of the forecast period, Europe does not suffer as much as Africa and the Americas. Its marketshare actually remains stable at close to half of allinternational students globally until 2012, when growth across Asia is forecast to begin again.
� Diversity by source region is affected in the pessimistic scenario as African and American markets are predicted to experience rapid decline in the first half of the forecast period. However, they are forecast to begin recovery by 2020.
Main source countries for international students
� The top ten countries in 2003 are also predicted to bethe top ten countries in 2020, although China andMalaysia with their forecast higher growth rates becomerelatively more important. Even under the conditions ofthis scenario, there are still likely to be 34,000 Chinesestudents in the UK in 2010, growing to 72,000 by 2020.
� The US and India have much lower growth rates underpessimistic scenario conditions, compared to otherscenarios. In particular, India is no longer predicted tobe one of the very large markets, although growth forIndia should pick up in the second half of the forecastperiod. The probable reason for this is that it is a marketin which the inter-relationship between the key factorsof quality, employability and affordability are the keydeterminants.
3.8 Price escalation scenario for the UK
Under the conditions of the price escalation scenario, theUK’s market share of all international student places in theMESDCs is forecast to increase to close to 36 per cent forthe first half of the period (over the time the priceescalation takes effect) before decreasing to 28 per centby 2020. In number terms this represents an increase from238,000 in 2003 to just over 525,000 in 2010 and then toabout 735,000 in 2020. Growth is highest in the initial partof the forecast period.
The initial increase in the UK’s market share can be explainedby the fact that price is frequently viewed as a proxy forquality in those countries where there might be a lack ofgood information on the quality of study opportunities.Hence where quality and employability are very importantdecision-making choice factors, relative to affordability, theUK market share may increase in response to a price change– as has been forecast here. One would logically expect thatthere might be an upper limit to the price increase that themarket could bear before it responds negatively; however,this model is not yet able to provide that information.
This phenomenon is unlikely to happen in Europe to thesame extent for a number of reasons, including theproposed increase of UK domestic student fees (possiblyin 2006), which could have an initial deterrent effect forstudents from current EU member states. The perception
of quality and employability is a less significant factor intheir choice of destination country.
Non-European students in the UK
The number of non-European students in the UK is forecastto increase significantly, over the initial period, due to the‘enhanced quality perception’ effect. It should then growsteadily although more slowly over the forecast period, to376,000 students in 2010 and 583,000 in 2020. Incontrast, the growth in European students is predicted tobe relatively slower at about 1.2 per cent per annum.
The proportion of non-European students in the total UKinternational student population is forecast to be higher in2020, at 79 per cent, than for any other scenario. Thiswould seem to reflect that those markets are driven more byquality and employability considerations than affordability.
Growth drivers
East and South Asia, and to a lesser extent sub-SaharanAfrica, are forecast to be the key regions driving growth indemand for the UK higher education places under theconditions of this scenario. The proportion of studentsfrom Asia is forecast to increase from 31 per cent in 2003to 50 per cent in 2010 and 61 per cent in 2020. Therespective forecast proportions from Europe are 47 percent, 28 per cent and 21 per cent.
Table 3.8.1
Forecasts of global and regional demand for international student places in the UK (000s) – price escalation scenario
2003 2005 2010 2015 2020 Growth*
Africa 19 21 29 36 46 5.2%
Sub-Saharan 16 16 22 29 38 5.6%
North Africa 3 5 7 8 8 3.7%
Middle East 10 20 25 28 30 3.9%
Asia 74 167 264 347 449 7.9%
East Asia 43 104 160 216 289 8.2%
South East Asia 19 30 42 52 62 5.4%
South Asia 12 32 59 77 95 9.1%
Central Asian Republics 1 2 2 2 2 4.8%
Americas 23 46 53 53 53 1.9%
North 18 38 43 43 42 1.7%
Central 2 3 4 4 4 3.7%
South 3 4 6 6 6 2.6%
Europe 111 131 150 152 153 1.2%
West 99 107 120 122 123 0.9%
East 12 24 30 30 30 2.4%
Oceania 2 5 6 6 5 1.7%
World 238 390 526 623 736 4.8%
* Compound annual growth 2003–2020
P267 market research AW 19/9/05 2:45 pm Page 40
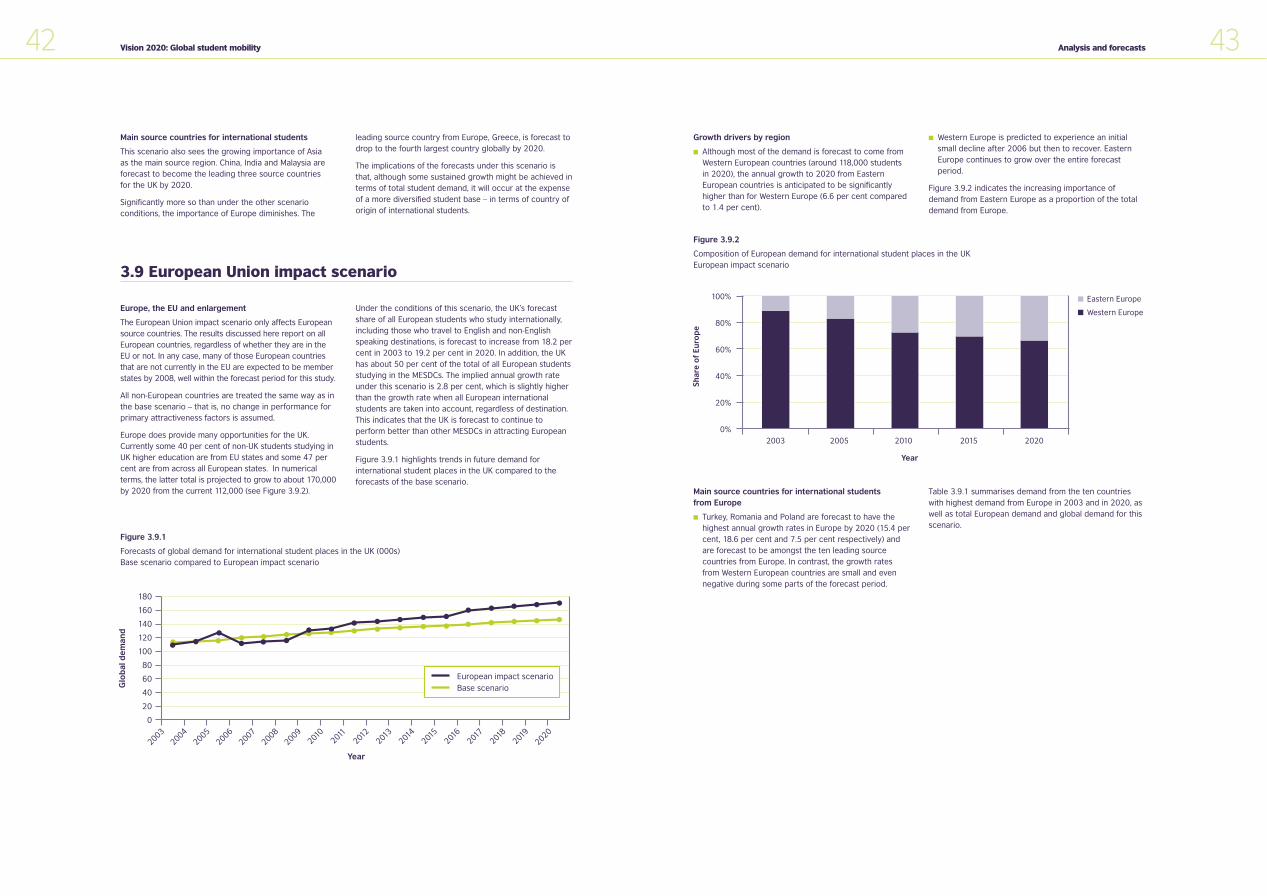
43Analysis and forecasts
3.9 European Union impact scenario
Main source countries for international students
This scenario also sees the growing importance of Asia as the main source region. China, India and Malaysia areforecast to become the leading three source countries for the UK by 2020.
Significantly more so than under the other scenarioconditions, the importance of Europe diminishes. The
leading source country from Europe, Greece, is forecast todrop to the fourth largest country globally by 2020.
The implications of the forecasts under this scenario isthat, although some sustained growth might be achieved interms of total student demand, it will occur at the expenseof a more diversified student base – in terms of country oforigin of international students.
Europe, the EU and enlargement
The European Union impact scenario only affects Europeansource countries. The results discussed here report on allEuropean countries, regardless of whether they are in theEU or not. In any case, many of those European countriesthat are not currently in the EU are expected to be memberstates by 2008, well within the forecast period for this study.
All non-European countries are treated the same way as inthe base scenario – that is, no change in performance forprimary attractiveness factors is assumed.
Europe does provide many opportunities for the UK.Currently some 40 per cent of non-UK students studying inUK higher education are from EU states and some 47 percent are from across all European states. In numericalterms, the latter total is projected to grow to about 170,000by 2020 from the current 112,000 (see Figure 3.9.2).
Under the conditions of this scenario, the UK’s forecastshare of all European students who study internationally,including those who travel to English and non-Englishspeaking destinations, is forecast to increase from 18.2 percent in 2003 to 19.2 per cent in 2020. In addition, the UKhas about 50 per cent of the total of all European studentsstudying in the MESDCs. The implied annual growth rateunder this scenario is 2.8 per cent, which is slightly higherthan the growth rate when all European internationalstudents are taken into account, regardless of destination.This indicates that the UK is forecast to continue toperform better than other MESDCs in attracting Europeanstudents.
Figure 3.9.1 highlights trends in future demand forinternational student places in the UK compared to theforecasts of the base scenario.
42 Vision 2020: Global student mobility
Figure 3.9.1
Forecasts of global demand for international student places in the UK (000s)Base scenario compared to European impact scenario
180
160
140
120
100
80
60
40
20
0
2003
2004
2005
2006
2007
2008
2009
2010
2011
2012
2013
2014
2015
2016
2017
2018
2019
2020
Glo
bal
de
man
d
European impact scenario
Base scenario
Year
Figure 3.9.2
Composition of European demand for international student places in the UKEuropean impact scenario
Growth drivers by region
� Although most of the demand is forecast to come fromWestern European countries (around 118,000 studentsin 2020), the annual growth to 2020 from EasternEuropean countries is anticipated to be significantlyhigher than for Western Europe (6.6 per cent comparedto 1.4 per cent).
� Western Europe is predicted to experience an initialsmall decline after 2006 but then to recover. EasternEurope continues to grow over the entire forecastperiod.
Figure 3.9.2 indicates the increasing importance ofdemand from Eastern Europe as a proportion of the totaldemand from Europe.
100%
80%
60%
40%
20%
0%
2003 2005 2010 2015 2020
Eastern Europe
Western Europe
Shar
e o
f E
uro
pe
Year
Main source countries for international students from Europe
� Turkey, Romania and Poland are forecast to have thehighest annual growth rates in Europe by 2020 (15.4 percent, 18.6 per cent and 7.5 per cent respectively) andare forecast to be amongst the ten leading sourcecountries from Europe. In contrast, the growth ratesfrom Western European countries are small and evennegative during some parts of the forecast period.
Table 3.9.1 summarises demand from the ten countrieswith highest demand from Europe in 2003 and in 2020, aswell as total European demand and global demand for thisscenario.
P267 market research AW 19/9/05 2:45 pm Page 42
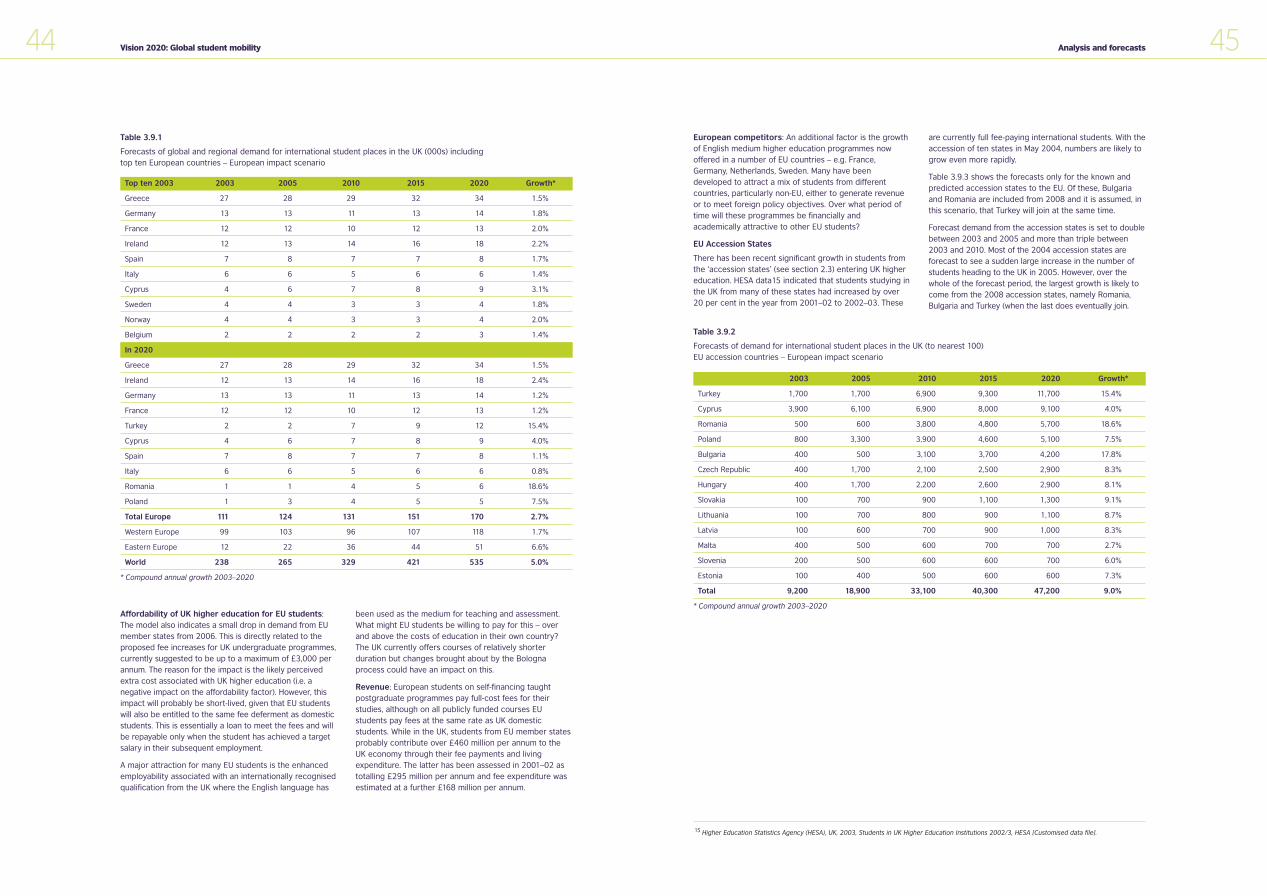
45Analysis and forecasts
Table 3.9.1
Forecasts of global and regional demand for international student places in the UK (000s) including top ten European countries – European impact scenario
44 Vision 2020: Global student mobility
Top ten 2003 2003 2005 2010 2015 2020 Growth*
Greece 27 28 29 32 34 1.5%
Germany 13 13 11 13 14 1.8%
France 12 12 10 12 13 2.0%
Ireland 12 13 14 16 18 2.2%
Spain 7 8 7 7 8 1.7%
Italy 6 6 5 6 6 1.4%
Cyprus 4 6 7 8 9 3.1%
Sweden 4 4 3 3 4 1.8%
Norway 4 4 3 3 4 2.0%
Belgium 2 2 2 2 3 1.4%
In 2020
Greece 27 28 29 32 34 1.5%
Ireland 12 13 14 16 18 2.4%
Germany 13 13 11 13 14 1.2%
France 12 12 10 12 13 1.2%
Turkey 2 2 7 9 12 15.4%
Cyprus 4 6 7 8 9 4.0%
Spain 7 8 7 7 8 1.1%
Italy 6 6 5 6 6 0.8%
Romania 1 1 4 5 6 18.6%
Poland 1 3 4 5 5 7.5%
Total Europe 111 124 131 151 170 2.7%
Western Europe 99 103 96 107 118 1.7%
Eastern Europe 12 22 36 44 51 6.6%
World 238 265 329 421 535 5.0%
* Compound annual growth 2003–2020
Affordability of UK higher education for EU students:The model also indicates a small drop in demand from EUmember states from 2006. This is directly related to theproposed fee increases for UK undergraduate programmes,currently suggested to be up to a maximum of £3,000 perannum. The reason for the impact is the likely perceivedextra cost associated with UK higher education (i.e. anegative impact on the affordability factor). However, thisimpact will probably be short-lived, given that EU studentswill also be entitled to the same fee deferment as domesticstudents. This is essentially a loan to meet the fees and willbe repayable only when the student has achieved a targetsalary in their subsequent employment.
A major attraction for many EU students is the enhancedemployability associated with an internationally recognisedqualification from the UK where the English language has
been used as the medium for teaching and assessment.What might EU students be willing to pay for this – overand above the costs of education in their own country?The UK currently offers courses of relatively shorterduration but changes brought about by the Bolognaprocess could have an impact on this.
Revenue: European students on self-financing taughtpostgraduate programmes pay full-cost fees for theirstudies, although on all publicly funded courses EUstudents pay fees at the same rate as UK domesticstudents. While in the UK, students from EU member statesprobably contribute over £460 million per annum to theUK economy through their fee payments and livingexpenditure. The latter has been assessed in 2001–02 astotalling £295 million per annum and fee expenditure wasestimated at a further £168 million per annum.
European competitors: An additional factor is the growthof English medium higher education programmes nowoffered in a number of EU countries – e.g. France,Germany, Netherlands, Sweden. Many have beendeveloped to attract a mix of students from differentcountries, particularly non-EU, either to generate revenueor to meet foreign policy objectives. Over what period oftime will these programmes be financially andacademically attractive to other EU students?
EU Accession States
There has been recent significant growth in students fromthe ‘accession states’ (see section 2.3) entering UK highereducation. HESA data15 indicated that students studying inthe UK from many of these states had increased by over20 per cent in the year from 2001–02 to 2002–03. These
are currently full fee-paying international students. With theaccession of ten states in May 2004, numbers are likely togrow even more rapidly.
Table 3.9.3 shows the forecasts only for the known andpredicted accession states to the EU. Of these, Bulgariaand Romania are included from 2008 and it is assumed, inthis scenario, that Turkey will join at the same time.
Forecast demand from the accession states is set to doublebetween 2003 and 2005 and more than triple between2003 and 2010. Most of the 2004 accession states areforecast to see a sudden large increase in the number ofstudents heading to the UK in 2005. However, over thewhole of the forecast period, the largest growth is likely tocome from the 2008 accession states, namely Romania,Bulgaria and Turkey (when the last does eventually join.
Table 3.9.2
Forecasts of demand for international student places in the UK (to nearest 100)EU accession countries – European impact scenario
2003 2005 2010 2015 2020 Growth*
Turkey 1,700 1,700 6,900 9,300 11,700 15.4%
Cyprus 3,900 6,100 6,900 8,000 9,100 4.0%
Romania 500 600 3,800 4,800 5,700 18.6%
Poland 800 3,300 3,900 4,600 5,100 7.5%
Bulgaria 400 500 3,100 3,700 4,200 17.8%
Czech Republic 400 1,700 2,100 2,500 2,900 8.3%
Hungary 400 1,700 2,200 2,600 2,900 8.1%
Slovakia 100 700 900 1,100 1,300 9.1%
Lithuania 100 700 800 900 1,100 8.7%
Latvia 100 600 700 900 1,000 8.3%
Malta 400 500 600 700 700 2.7%
Slovenia 200 500 600 600 700 6.0%
Estonia 100 400 500 600 600 7.3%
Total 9,200 18,900 33,100 40,300 47,200 9.0%
* Compound annual growth 2003–2020
15 Higher Education Statistics Agency (HESA), UK, 2003, Students in UK Higher Education Institutions 2002/3, HESA [Customised data file].
P267 market research AW 19/9/05 2:45 pm Page 44
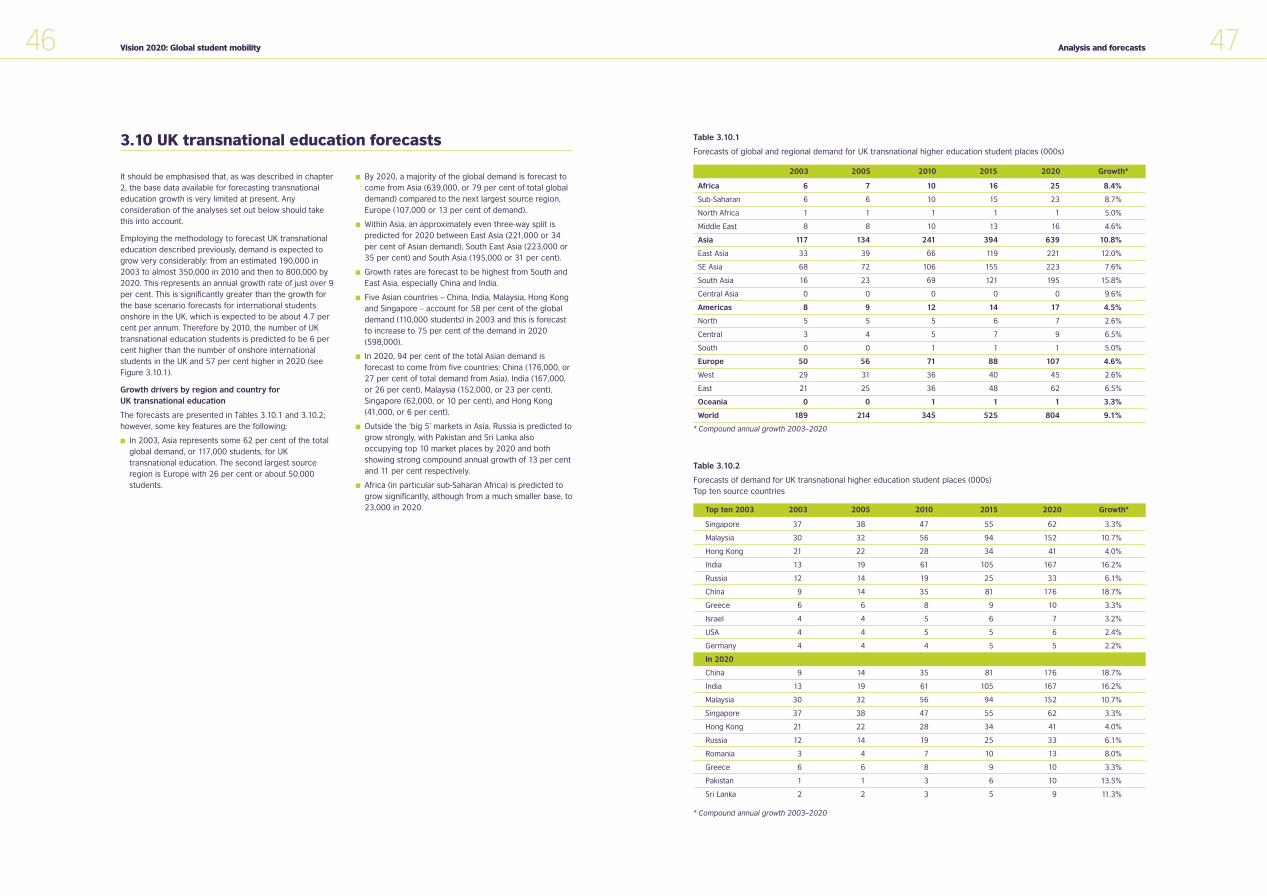
47Analysis and forecasts46 Vision 2020: Global student mobility
3.10 UK transnational education forecasts
It should be emphasised that, as was described in chapter2, the base data available for forecasting transnationaleducation growth is very limited at present. Anyconsideration of the analyses set out below should takethis into account.
Employing the methodology to forecast UK transnationaleducation described previously, demand is expected togrow very considerably: from an estimated 190,000 in2003 to almost 350,000 in 2010 and then to 800,000 by2020. This represents an annual growth rate of just over 9per cent. This is significantly greater than the growth forthe base scenario forecasts for international studentsonshore in the UK, which is expected to be about 4.7 percent per annum. Therefore by 2010, the number of UKtransnational education students is predicted to be 6 percent higher than the number of onshore internationalstudents in the UK and 57 per cent higher in 2020 (seeFigure 3.10.1).
Growth drivers by region and country for UK transnational education
The forecasts are presented in Tables 3.10.1 and 3.10.2;however, some key features are the following:
� In 2003, Asia represents some 62 per cent of the totalglobal demand, or 117,000 students, for UKtransnational education. The second largest sourceregion is Europe with 26 per cent or about 50,000students.
� By 2020, a majority of the global demand is forecast tocome from Asia (639,000, or 79 per cent of total globaldemand) compared to the next largest source region,Europe (107,000 or 13 per cent of demand).
� Within Asia, an approximately even three-way split ispredicted for 2020 between East Asia (221,000 or 34per cent of Asian demand), South East Asia (223,000 or35 per cent) and South Asia (195,000 or 31 per cent).
� Growth rates are forecast to be highest from South andEast Asia, especially China and India.
� Five Asian countries – China, India, Malaysia, Hong Kongand Singapore – account for 58 per cent of the globaldemand (110,000 students) in 2003 and this is forecastto increase to 75 per cent of the demand in 2020(598,000).
� In 2020, 94 per cent of the total Asian demand isforecast to come from five countries: China (176,000, or27 per cent of total demand from Asia), India (167,000,or 26 per cent), Malaysia (152,000, or 23 per cent),Singapore (62,000, or 10 per cent), and Hong Kong(41,000, or 6 per cent).
� Outside the ‘big 5’ markets in Asia, Russia is predicted togrow strongly, with Pakistan and Sri Lanka alsooccupying top 10 market places by 2020 and bothshowing strong compound annual growth of 13 per centand 11 per cent respectively.
� Africa (in particular sub-Saharan Africa) is predicted togrow significantly, although from a much smaller base, to23,000 in 2020.
Table 3.10.1
Forecasts of global and regional demand for UK transnational higher education student places (000s)
2003 2005 2010 2015 2020 Growth*
Africa 6 7 10 16 25 8.4%
Sub-Saharan 6 6 10 15 23 8.7%
North Africa 1 1 1 1 1 5.0%
Middle East 8 8 10 13 16 4.6%
Asia 117 134 241 394 639 10.8%
East Asia 33 39 66 119 221 12.0%
SE Asia 68 72 106 155 223 7.6%
South Asia 16 23 69 121 195 15.8%
Central Asia 0 0 0 0 0 9.6%
Americas 8 9 12 14 17 4.5%
North 5 5 5 6 7 2.6%
Central 3 4 5 7 9 6.5%
South 0 0 1 1 1 5.0%
Europe 50 56 71 88 107 4.6%
West 29 31 36 40 45 2.6%
East 21 25 36 48 62 6.5%
Oceania 0 0 1 1 1 3.3%
World 189 214 345 525 804 9.1%
* Compound annual growth 2003–2020
Table 3.10.2
Forecasts of demand for UK transnational higher education student places (000s)Top ten source countries
Top ten 2003 2003 2005 2010 2015 2020 Growth*
Singapore 37 38 47 55 62 3.3%
Malaysia 30 32 56 94 152 10.7%
Hong Kong 21 22 28 34 41 4.0%
India 13 19 61 105 167 16.2%
Russia 12 14 19 25 33 6.1%
China 9 14 35 81 176 18.7%
Greece 6 6 8 9 10 3.3%
Israel 4 4 5 6 7 3.2%
USA 4 4 5 5 6 2.4%
Germany 4 4 4 5 5 2.2%
In 2020
China 9 14 35 81 176 18.7%
India 13 19 61 105 167 16.2%
Malaysia 30 32 56 94 152 10.7%
Singapore 37 38 47 55 62 3.3%
Hong Kong 21 22 28 34 41 4.0%
Russia 12 14 19 25 33 6.1%
Romania 3 4 7 10 13 8.0%
Greece 6 6 8 9 10 3.3%
Pakistan 1 1 3 6 10 13.5%
Sri Lanka 2 2 3 5 9 11.3%
* Compound annual growth 2003–2020
P267 market research AW 19/9/05 2:45 pm Page 46
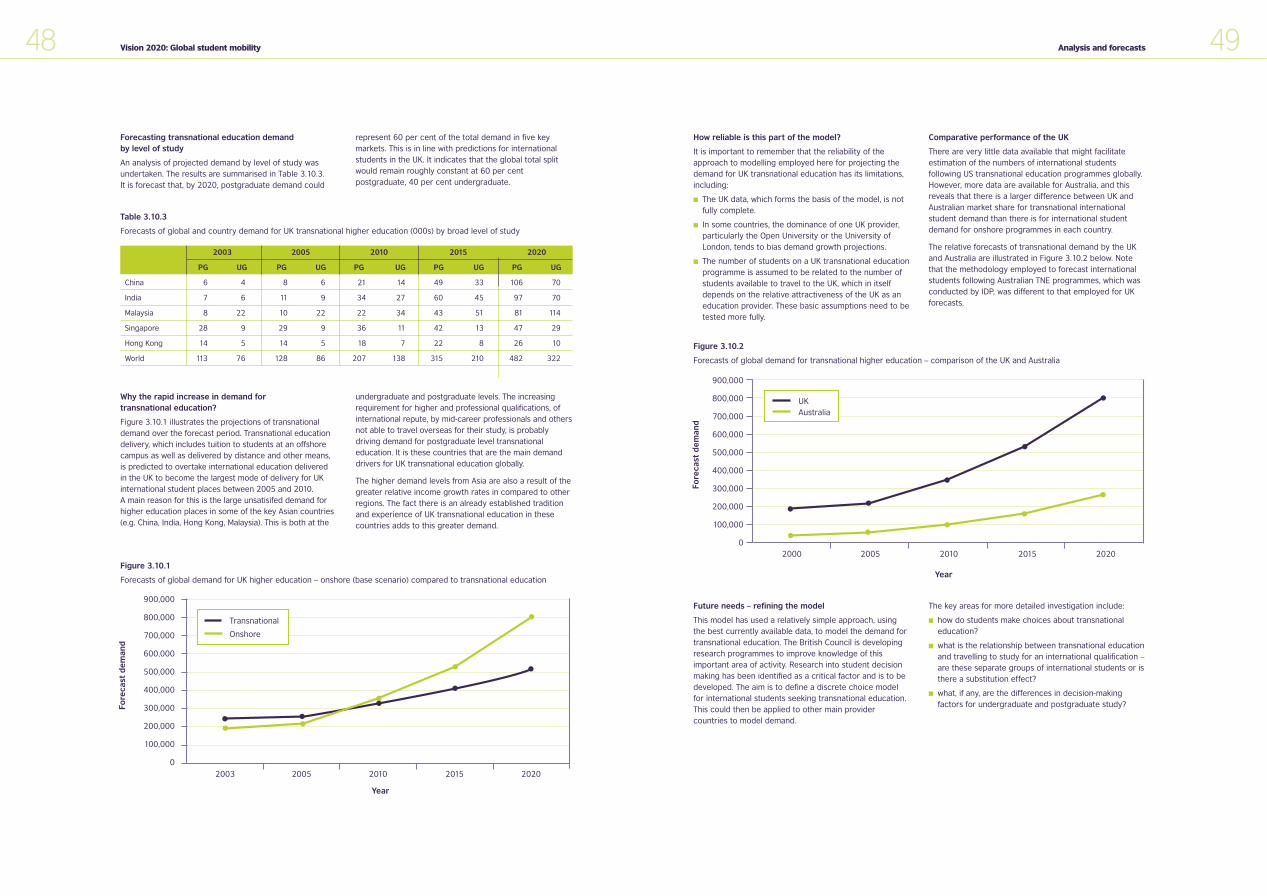
2003
900,000
800,000
700,000
600,000
500,000
400,000
300,000
200,000
100,000
0
2005 2010 2015 2020
Transnational
Onshore
Year
Fore
cast
de
man
d
49Analysis and forecasts
Figure 3.10.1
Forecasts of global demand for UK higher education – onshore (base scenario) compared to transnational education
Why the rapid increase in demand for transnational education?
Figure 3.10.1 illustrates the projections of transnationaldemand over the forecast period. Transnational educationdelivery, which includes tuition to students at an offshorecampus as well as delivered by distance and other means,is predicted to overtake international education delivered in the UK to become the largest mode of delivery for UKinternational student places between 2005 and 2010. A main reason for this is the large unsatisifed demand forhigher education places in some of the key Asian countries(e.g. China, India, Hong Kong, Malaysia). This is both at the
undergraduate and postgraduate levels. The increasingrequirement for higher and professional qualifications, ofinternational repute, by mid-career professionals and othersnot able to travel overseas for their study, is probablydriving demand for postgraduate level transnationaleducation. It is these countries that are the main demanddrivers for UK transnational education globally.
The higher demand levels from Asia are also a result of thegreater relative income growth rates in compared to otherregions. The fact there is an already established traditionand experience of UK transnational education in thesecountries adds to this greater demand.
How reliable is this part of the model?
It is important to remember that the reliability of theapproach to modelling employed here for projecting thedemand for UK transnational education has its limitations,including:
� The UK data, which forms the basis of the model, is notfully complete.
� In some countries, the dominance of one UK provider,particularly the Open University or the University ofLondon, tends to bias demand growth projections.
� The number of students on a UK transnational educationprogramme is assumed to be related to the number ofstudents available to travel to the UK, which in itselfdepends on the relative attractiveness of the UK as aneducation provider. These basic assumptions need to betested more fully.
Comparative performance of the UK
There are very little data available that might facilitateestimation of the numbers of international studentsfollowing US transnational education programmes globally.However, more data are available for Australia, and thisreveals that there is a larger difference between UK andAustralian market share for transnational internationalstudent demand than there is for international studentdemand for onshore programmes in each country.
The relative forecasts of transnational demand by the UKand Australia are illustrated in Figure 3.10.2 below. Notethat the methodology employed to forecast internationalstudents following Australian TNE programmes, which wasconducted by IDP, was different to that employed for UKforecasts.
48 Vision 2020: Global student mobility
Forecasting transnational education demand by level of study
An analysis of projected demand by level of study wasundertaken. The results are summarised in Table 3.10.3. It is forecast that, by 2020, postgraduate demand could
represent 60 per cent of the total demand in five keymarkets. This is in line with predictions for internationalstudents in the UK. It indicates that the global total splitwould remain roughly constant at 60 per centpostgraduate, 40 per cent undergraduate.
Table 3.10.3
Forecasts of global and country demand for UK transnational higher education (000s) by broad level of study
2003 2005 2010 2015 2020
PG UG PG UG PG UG PG UG PG UG
China 6 4 8 6 21 14 49 33 106 70
India 7 6 11 9 34 27 60 45 97 70
Malaysia 8 22 10 22 22 34 43 51 81 114
Singapore 28 9 29 9 36 11 42 13 47 29
Hong Kong 14 5 14 5 18 7 22 8 26 10
World 113 76 128 86 207 138 315 210 482 322
Figure 3.10.2
Forecasts of global demand for transnational higher education – comparison of the UK and Australia
900,000
800,000
700,000
600,000
500,000
400,000
300,000
200,000
100,000
02000 2005 2010 2015 2020
UKAustralia
Year
Fore
cast
de
man
d
Future needs – refining the model
This model has used a relatively simple approach, usingthe best currently available data, to model the demand fortransnational education. The British Council is developingresearch programmes to improve knowledge of thisimportant area of activity. Research into student decisionmaking has been identified as a critical factor and is to bedeveloped. The aim is to define a discrete choice modelfor international students seeking transnational education.This could then be applied to other main providercountries to model demand.
The key areas for more detailed investigation include:
� how do students make choices about transnationaleducation?
� what is the relationship between transnational educationand travelling to study for an international qualification –are these separate groups of international students or isthere a substitution effect?
� what, if any, are the differences in decision-makingfactors for undergraduate and postgraduate study?
P267 market research AW 19/9/05 2:45 pm Page 48
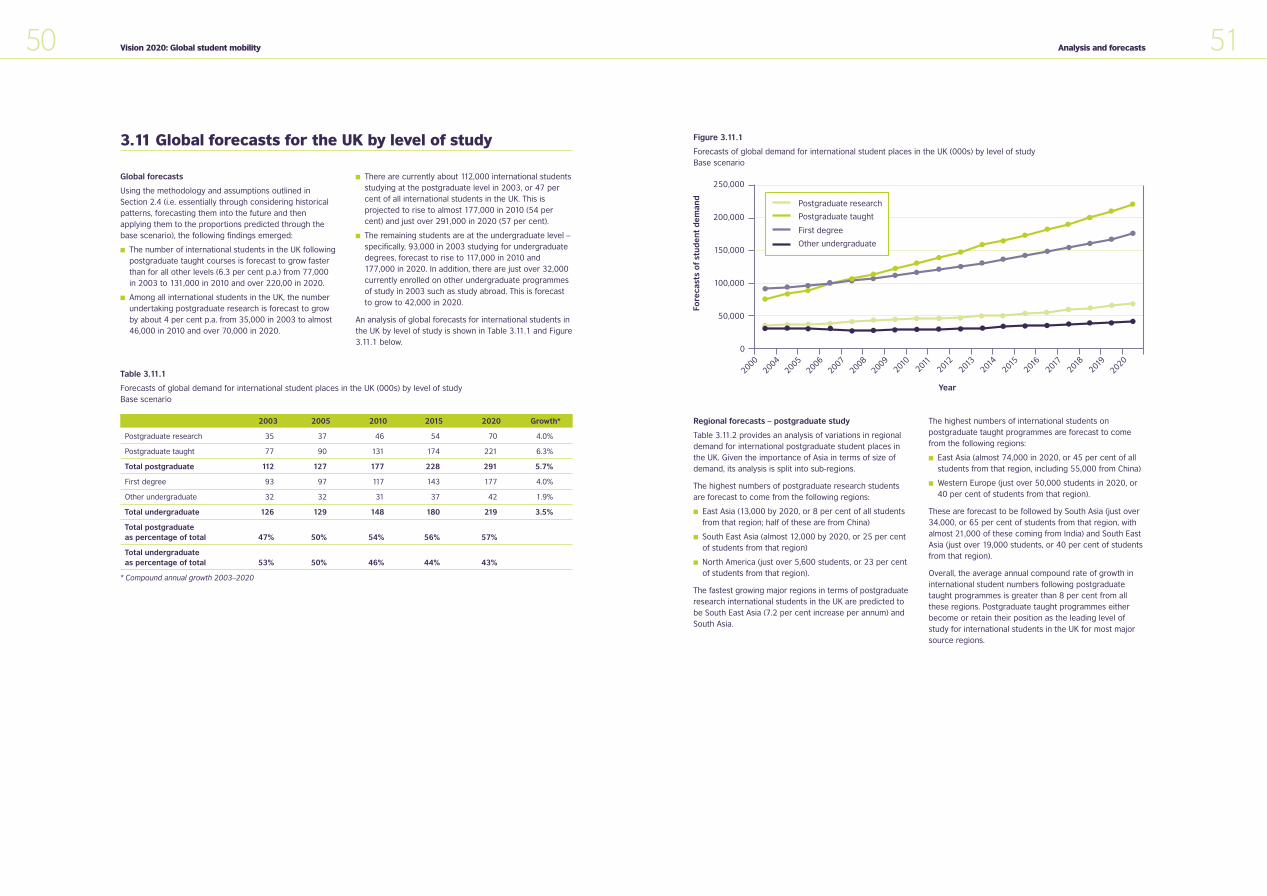
51Analysis and forecasts
3.11 Global forecasts for the UK by level of study
Global forecasts
Using the methodology and assumptions outlined inSection 2.4 (i.e. essentially through considering historicalpatterns, forecasting them into the future and thenapplying them to the proportions predicted through thebase scenario), the following findings emerged:
� The number of international students in the UK followingpostgraduate taught courses is forecast to grow fasterthan for all other levels (6.3 per cent p.a.) from 77,000in 2003 to 131,000 in 2010 and over 220,00 in 2020.
� Among all international students in the UK, the numberundertaking postgraduate research is forecast to growby about 4 per cent p.a. from 35,000 in 2003 to almost46,000 in 2010 and over 70,000 in 2020.
� There are currently about 112,000 international studentsstudying at the postgraduate level in 2003, or 47 percent of all international students in the UK. This isprojected to rise to almost 177,000 in 2010 (54 percent) and just over 291,000 in 2020 (57 per cent).
� The remaining students are at the undergraduate level –specifically, 93,000 in 2003 studying for undergraduatedegrees, forecast to rise to 117,000 in 2010 and177,000 in 2020. In addition, there are just over 32,000currently enrolled on other undergraduate programmesof study in 2003 such as study abroad. This is forecastto grow to 42,000 in 2020.
An analysis of global forecasts for international students inthe UK by level of study is shown in Table 3.11.1 and Figure3.11.1 below.
50 Vision 2020: Global student mobility
Table 3.11.1
Forecasts of global demand for international student places in the UK (000s) by level of studyBase scenario
2003 2005 2010 2015 2020 Growth*
Postgraduate research 35 37 46 54 70 4.0%
Postgraduate taught 77 90 131 174 221 6.3%
Total postgraduate 112 127 177 228 291 5.7%
First degree 93 97 117 143 177 4.0%
Other undergraduate 32 32 31 37 42 1.9%
Total undergraduate 126 129 148 180 219 3.5%
Total postgraduate as percentage of total 47% 50% 54% 56% 57%
Total undergraduate as percentage of total 53% 50% 46% 44% 43%
* Compound annual growth 2003–2020
Figure 3.11.1
Forecasts of global demand for international student places in the UK (000s) by level of studyBase scenario
250,000
200,000
150,000
100,000
50,000
2000200420052006200720082009
2010
2011
2012
2013
2014
2015
2016
2017
2018
2019
2020
0
Fore
cast
s o
f st
ud
en
t d
em
and
Year
Postgraduate research
Postgraduate taught
First degree
Other undergraduate
Regional forecasts – postgraduate study
Table 3.11.2 provides an analysis of variations in regionaldemand for international postgraduate student places inthe UK. Given the importance of Asia in terms of size ofdemand, its analysis is split into sub-regions.
The highest numbers of postgraduate research studentsare forecast to come from the following regions:
� East Asia (13,000 by 2020, or 8 per cent of all studentsfrom that region; half of these are from China)
� South East Asia (almost 12,000 by 2020, or 25 per centof students from that region)
� North America (just over 5,600 students, or 23 per centof students from that region).
The fastest growing major regions in terms of postgraduateresearch international students in the UK are predicted tobe South East Asia (7.2 per cent increase per annum) andSouth Asia.
The highest numbers of international students onpostgraduate taught programmes are forecast to comefrom the following regions:
� East Asia (almost 74,000 in 2020, or 45 per cent of allstudents from that region, including 55,000 from China)
� Western Europe (just over 50,000 students in 2020, or40 per cent of students from that region).
These are forecast to be followed by South Asia (just over34,000, or 65 per cent of students from that region, withalmost 21,000 of these coming from India) and South EastAsia (just over 19,000 students, or 40 per cent of studentsfrom that region).
Overall, the average annual compound rate of growth ininternational student numbers following postgraduatetaught programmes is greater than 8 per cent from allthese regions. Postgraduate taught programmes eitherbecome or retain their position as the leading level ofstudy for international students in the UK for most majorsource regions.
P267 market research AW 19/9/05 2:45 pm Page 50
53Analysis and forecasts
Table 3.11.2
Forecasts of global and regional demand for international student places in the UK (000s)Postgraduate research and postgraduate taught students – base scenario
52 Vision 2020: Global student mobility
2003 2005 2010 2015 2020 Growth*
Total Asia
Postgraduate research 9.8 9.8 12 14.8 19.8 4%
Postgraduate taught 28.8 36 61.4 90.7 127.8 9%
East Asia
Postgraduate research 4.5 4.2 3.6 3.4 4.9 0%
Postgraduate taught 16.6 20.3 33.9 50.4 73.8 9%
South East Asia
Postgraduate research 3.8 4.2 6.9 9.2 12 7%
Postgraduate taught 5.2 6.1 9.9 14.8 19.2 8%
South Asia
Postgraduate research 1.3 1.3 1.3 1.9 2.6 5%
Postgraduate taught 6.7 9.3 17.2 25 34.2 10%
Total Europe
Postgraduate research 14.2 16 19 20.5 28.1 3%
Postgraduate taught 31.1 35.8 46 53 56.3 3%
Total Africa
Postgraduate research 1.6 1.5 1.6 1.7 1.8 1%
Postgraduate taught 4.8 4.6 6.5 9 12.6 6%
Total Americas
Postgraduate research 5.1 5.2 5.6 6.1 6.5 1%
Postgraduate taught 7.4 8 9.7 11.1 12.4 3%
Middle East
Postgraduate research 2.8 2.9 3.2 3.5 3.8 2%
Postgraduate taught 3 3.4 5.1 6.4 7.9 6%
Oceania
Postgraduate research 0.6 0.6 0.5 0.4 0.4 -3%
Postgraduate taught 0.7 0.7 0.8 1 1.1 3%
* Compound annual growth 2003–2020
Regional forecasts – undergraduate study
� South and East Asia are the only regions in which thereis forecast to be significant annual growth in studentsseeking undergraduate studies (over 9 per cent in bothcases).
� Western Europe is predicted to experience an overalldecline in first-degree students during the forecastperiod, in favour of postgraduate students.
� Relatively speaking, the proportion of students followingfirst-degree programmes would not seem to varysignificantly for most major source markets. There ishowever, predicted to be a large increase in theproportion of East Asian (mainly Chinese) students whowish to follow first degree programmes in the UK, and alarge decrease for South East Asia and Western Europe(as a proportion of all students from each of theseregions). This is probably due to the differences inrelative growth rates for the supply of undergraduateopportunities in each of these countries and regions.
The forecasts of undergraduate international studentnumbers in the UK, split into major regions, are shown in Table 3.11.3.
The limitations of this model are that it is not possible topredict accurately the likely changes in demand for levelsof study as markets mature. For example:
� As the US and some Western European markets haveevolved, the demand for study abroad programmes hasincreased more rapidly than for other levels.
� The growth of provision of undergraduate places inmany of the main source countries for MESDCs studentscan result in a much greater rate of growth in demandfor international postgraduate studies – as is currentlythe case in some South East Asian countries.
Table 3.11.3
Forecasts of global demand for international student places in the UK (000s)First degree and other undergraduate students – base scenario
2003 2005 2010 2015 2020 Growth*
Total Asia
First degree 29.6 32.8 49.7 72.5 103.4 8%
Other undergraduate 5.9 6.6 7 10.4 14.6 6%
East Asia
First degree 16.6 19.9 32.3 50.4 73.8 9%
Other undergraduate 4.8 5.3 5.5 7.8 11.5 5%
South East Asia
First degree 9.4 9.1 9.8 11.1 14.4 3%
Other undergraduate 0.6 0.7 0.9 1.8 2.4 10%
South Asia
First degree 3.4 3.6 7.3 10.8 15.1 10%
Other undergraduate 0.5 0.5 0.7 0.7 0.7 3%
Total Europe
First degree 50 49.9 49.8 48.9 47.6 0%
Other undergraduate 15.4 13.5 12 14.4 13.7 0%
Total Africa
First degree 6.2 5.9 7.8 10.2 13.1 5%
Other undergraduate 3.7 5.1 6.8 8.9 11.8 6%
Total Americas
First degree 3.8 4.1 5.1 6 6.8 4%
Other undergraduate 6.1 6 5.9 6.4 7.3 1%
Middle East
First degree 3.2 3.4 4 4.7 5.5 3%
Other undergraduate 0.7 0.7 1 1.4 1.9 7%
Oceania
First degree 0.3 0.3 0.3 0.4 0.4 1%
Other undergraduate 0.3 0.4 0.5 0.7 0.8 5%
* Compound annual growth 2003–2020
P267 market research AW 19/9/05 2:45 pm Page 52
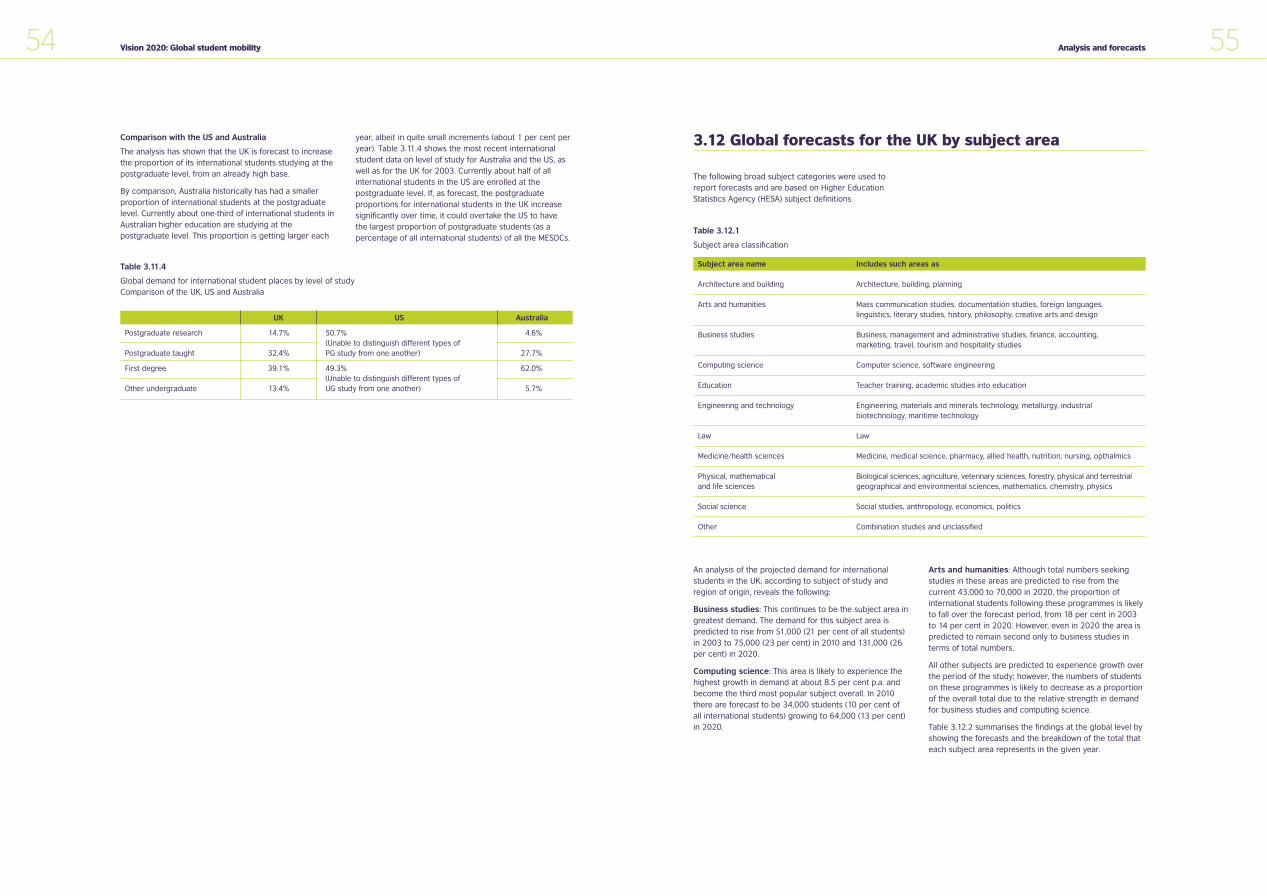
55Analysis and forecasts
3.12 Global forecasts for the UK by subject area
The following broad subject categories were used toreport forecasts and are based on Higher EducationStatistics Agency (HESA) subject definitions.
An analysis of the projected demand for internationalstudents in the UK, according to subject of study andregion of origin, reveals the following:
Business studies: This continues to be the subject area ingreatest demand. The demand for this subject area ispredicted to rise from 51,000 (21 per cent of all students)in 2003 to 75,000 (23 per cent) in 2010 and 131,000 (26per cent) in 2020.
Computing science: This area is likely to experience thehighest growth in demand at about 8.5 per cent p.a. andbecome the third most popular subject overall. In 2010there are forecast to be 34,000 students (10 per cent of all international students) growing to 64,000 (13 per cent)in 2020.
Arts and humanities: Although total numbers seekingstudies in these areas are predicted to rise from thecurrent 43,000 to 70,000 in 2020, the proportion ofinternational students following these programmes is likelyto fall over the forecast period, from 18 per cent in 2003to 14 per cent in 2020. However, even in 2020 the area ispredicted to remain second only to business studies interms of total numbers.
All other subjects are predicted to experience growth overthe period of the study; however, the numbers of studentson these programmes is likely to decrease as a proportionof the overall total due to the relative strength in demandfor business studies and computing science.
Table 3.12.2 summarises the findings at the global level byshowing the forecasts and the breakdown of the total thateach subject area represents in the given year.
54 Vision 2020: Global student mobility
Table 3.12.1
Subject area classification
Subject area name
Architecture and building
Arts and humanities
Business studies
Computing science
Education
Engineering and technology
Law
Medicine/health sciences
Physical, mathematical and life sciences
Social science
Other
Includes such areas as
Architecture, building, planning
Mass communication studies, documentation studies, foreign languages,linguistics, literary studies, history, philosophy, creative arts and design
Business, management and administrative studies, finance, accounting,marketing, travel, tourism and hospitality studies
Computer science, software engineering
Teacher training, academic studies into education
Engineering, materials and minerals technology, metallurgy, industrialbiotechnology, maritime technology
Law
Medicine, medical science, pharmacy, allied health, nutrition, nursing, opthalmics
Biological sciences, agriculture, veterinary sciences, forestry, physical and terrestrialgeographical and environmental sciences, mathematics, chemistry, physics
Social studies, anthropology, economics, politics
Combination studies and unclassified
Table 3.11.4
Global demand for international student places by level of studyComparison of the UK, US and Australia
UK US Australia
Postgraduate research 14.7% 50.7% 4.6%(Unable to distinguish different types of
Postgraduate taught 32.4% PG study from one another) 27.7%
First degree 39.1% 49.3% 62.0%(Unable to distinguish different types of
Other undergraduate 13.4% UG study from one another) 5.7%
Comparison with the US and Australia
The analysis has shown that the UK is forecast to increasethe proportion of its international students studying at thepostgraduate level, from an already high base.
By comparison, Australia historically has had a smallerproportion of international students at the postgraduatelevel. Currently about one-third of international students inAustralian higher education are studying at thepostgraduate level. This proportion is getting larger each
year, albeit in quite small increments (about 1 per cent peryear). Table 3.11.4 shows the most recent internationalstudent data on level of study for Australia and the US, aswell as for the UK for 2003. Currently about half of allinternational students in the US are enrolled at thepostgraduate level. If, as forecast, the postgraduateproportions for international students in the UK increasesignificantly over time, it could overtake the US to have the largest proportion of postgraduate students (as apercentage of all international students) of all the MESDCs.
P267 market research AW 19/9/05 2:45 pm Page 54
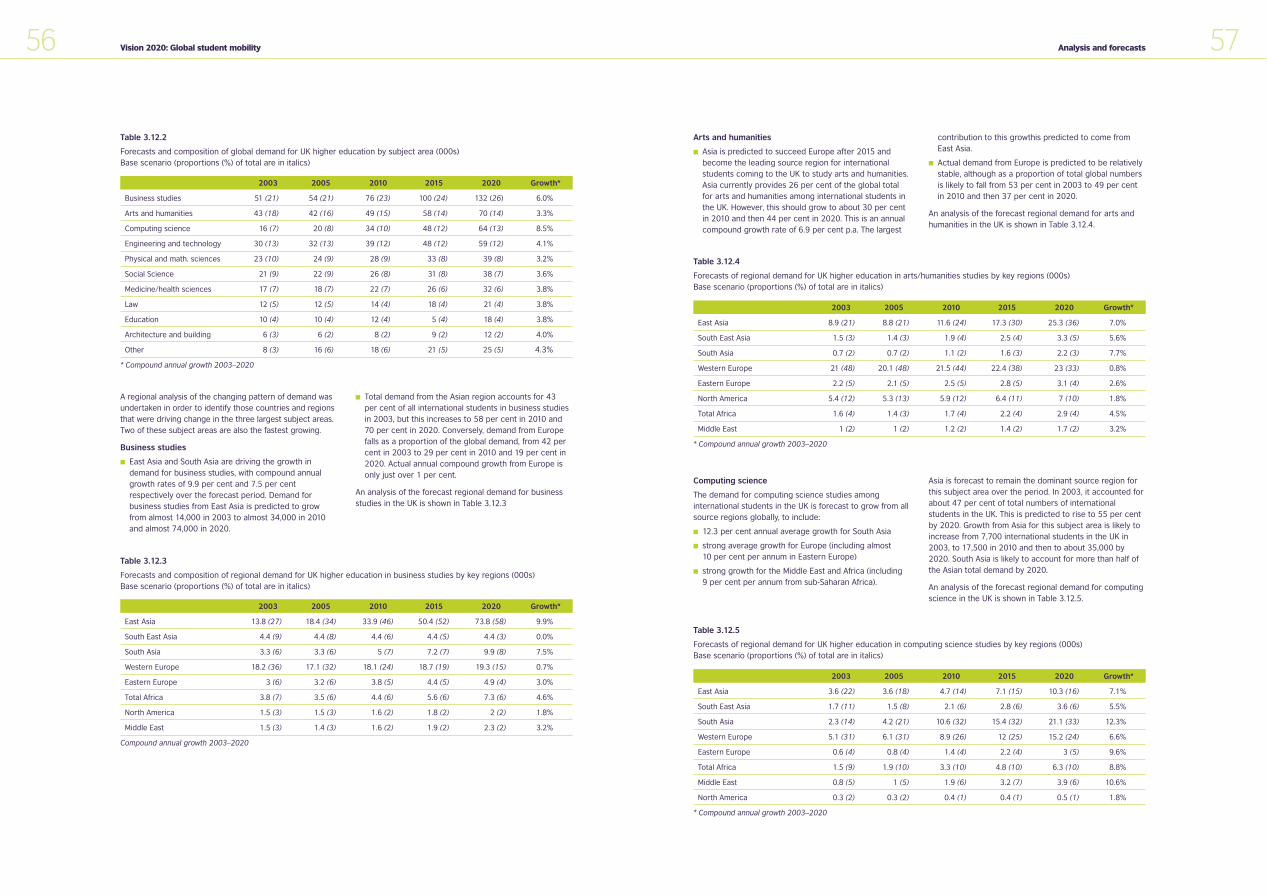
57Analysis and forecasts
Table 3.12.4
Forecasts of regional demand for UK higher education in arts/humanities studies by key regions (000s)Base scenario (proportions (%) of total are in italics)
Arts and humanities
� Asia is predicted to succeed Europe after 2015 andbecome the leading source region for internationalstudents coming to the UK to study arts and humanities.Asia currently provides 26 per cent of the global totalfor arts and humanities among international students inthe UK. However, this should grow to about 30 per centin 2010 and then 44 per cent in 2020. This is an annualcompound growth rate of 6.9 per cent p.a. The largest
contribution to this growthis predicted to come fromEast Asia.
� Actual demand from Europe is predicted to be relativelystable, although as a proportion of total global numbersis likely to fall from 53 per cent in 2003 to 49 per centin 2010 and then 37 per cent in 2020.
An analysis of the forecast regional demand for arts andhumanities in the UK is shown in Table 3.12.4.
Computing science
The demand for computing science studies amonginternational students in the UK is forecast to grow from allsource regions globally, to include:
� 12.3 per cent annual average growth for South Asia
� strong average growth for Europe (including almost 10 per cent per annum in Eastern Europe)
� strong growth for the Middle East and Africa (including 9 per cent per annum from sub-Saharan Africa).
Asia is forecast to remain the dominant source region forthis subject area over the period. In 2003, it accounted forabout 47 per cent of total numbers of internationalstudents in the UK. This is predicted to rise to 55 per centby 2020. Growth from Asia for this subject area is likely toincrease from 7,700 international students in the UK in2003, to 17,500 in 2010 and then to about 35,000 by2020. South Asia is likely to account for more than half ofthe Asian total demand by 2020.
An analysis of the forecast regional demand for computingscience in the UK is shown in Table 3.12.5.
56 Vision 2020: Global student mobility
Table 3.12.2
Forecasts and composition of global demand for UK higher education by subject area (000s)Base scenario (proportions (%) of total are in italics)
A regional analysis of the changing pattern of demand wasundertaken in order to identify those countries and regionsthat were driving change in the three largest subject areas.Two of these subject areas are also the fastest growing.
Business studies
� East Asia and South Asia are driving the growth indemand for business studies, with compound annualgrowth rates of 9.9 per cent and 7.5 per centrespectively over the forecast period. Demand forbusiness studies from East Asia is predicted to growfrom almost 14,000 in 2003 to almost 34,000 in 2010and almost 74,000 in 2020.
� Total demand from the Asian region accounts for 43 per cent of all international students in business studiesin 2003, but this increases to 58 per cent in 2010 and70 per cent in 2020. Conversely, demand from Europefalls as a proportion of the global demand, from 42 percent in 2003 to 29 per cent in 2010 and 19 per cent in2020. Actual annual compound growth from Europe isonly just over 1 per cent.
An analysis of the forecast regional demand for businessstudies in the UK is shown in Table 3.12.3
2003 2005 2010 2015 2020 Growth*
Business studies 51 (21) 54 (21) 76 (23) 100 (24) 132 (26) 6.0%
Arts and humanities 43 (18) 42 (16) 49 (15) 58 (14) 70 (14) 3.3%
Computing science 16 (7) 20 (8) 34 (10) 48 (12) 64 (13) 8.5%
Engineering and technology 30 (13) 32 (13) 39 (12) 48 (12) 59 (12) 4.1%
Physical and math. sciences 23 (10) 24 (9) 28 (9) 33 (8) 39 (8) 3.2%
Social Science 21 (9) 22 (9) 26 (8) 31 (8) 38 (7) 3.6%
Medicine/health sciences 17 (7) 18 (7) 22 (7) 26 (6) 32 (6) 3.8%
Law 12 (5) 12 (5) 14 (4) 18 (4) 21 (4) 3.8%
Education 10 (4) 10 (4) 12 (4) 5 (4) 18 (4) 3.8%
Architecture and building 6 (3) 6 (2) 8 (2) 9 (2) 12 (2) 4.0%
Other 8 (3) 16 (6) 18 (6) 21 (5) 25 (5) 4.3%
* Compound annual growth 2003–2020
2003 2005 2010 2015 2020 Growth*
East Asia 13.8 (27) 18.4 (34) 33.9 (46) 50.4 (52) 73.8 (58) 9.9%
South East Asia 4.4 (9) 4.4 (8) 4.4 (6) 4.4 (5) 4.4 (3) 0.0%
South Asia 3.3 (6) 3.3 (6) 5 (7) 7.2 (7) 9.9 (8) 7.5%
Western Europe 18.2 (36) 17.1 (32) 18.1 (24) 18.7 (19) 19.3 (15) 0.7%
Eastern Europe 3 (6) 3.2 (6) 3.8 (5) 4.4 (5) 4.9 (4) 3.0%
Total Africa 3.8 (7) 3.5 (6) 4.4 (6) 5.6 (6) 7.3 (6) 4.6%
North America 1.5 (3) 1.5 (3) 1.6 (2) 1.8 (2) 2 (2) 1.8%
Middle East 1.5 (3) 1.4 (3) 1.6 (2) 1.9 (2) 2.3 (2) 3.2%
Compound annual growth 2003–2020
2003 2005 2010 2015 2020 Growth*
East Asia 8.9 (21) 8.8 (21) 11.6 (24) 17.3 (30) 25.3 (36) 7.0%
South East Asia 1.5 (3) 1.4 (3) 1.9 (4) 2.5 (4) 3.3 (5) 5.6%
South Asia 0.7 (2) 0.7 (2) 1.1 (2) 1.6 (3) 2.2 (3) 7.7%
Western Europe 21 (48) 20.1 (48) 21.5 (44) 22.4 (38) 23 (33) 0.8%
Eastern Europe 2.2 (5) 2.1 (5) 2.5 (5) 2.8 (5) 3.1 (4) 2.6%
North America 5.4 (12) 5.3 (13) 5.9 (12) 6.4 (11) 7 (10) 1.8%
Total Africa 1.6 (4) 1.4 (3) 1.7 (4) 2.2 (4) 2.9 (4) 4.5%
Middle East 1 (2) 1 (2) 1.2 (2) 1.4 (2) 1.7 (2) 3.2%
* Compound annual growth 2003–2020
Table 3.12.5
Forecasts of regional demand for UK higher education in computing science studies by key regions (000s)Base scenario (proportions (%) of total are in italics)
2003 2005 2010 2015 2020 Growth*
East Asia 3.6 (22) 3.6 (18) 4.7 (14) 7.1 (15) 10.3 (16) 7.1%
South East Asia 1.7 (11) 1.5 (8) 2.1 (6) 2.8 (6) 3.6 (6) 5.5%
South Asia 2.3 (14) 4.2 (21) 10.6 (32) 15.4 (32) 21.1 (33) 12.3%
Western Europe 5.1 (31) 6.1 (31) 8.9 (26) 12 (25) 15.2 (24) 6.6%
Eastern Europe 0.6 (4) 0.8 (4) 1.4 (4) 2.2 (4) 3 (5) 9.6%
Total Africa 1.5 (9) 1.9 (10) 3.3 (10) 4.8 (10) 6.3 (10) 8.8%
Middle East 0.8 (5) 1 (5) 1.9 (6) 3.2 (7) 3.9 (6) 10.6%
North America 0.3 (2) 0.3 (2) 0.4 (1) 0.4 (1) 0.5 (1) 1.8%
* Compound annual growth 2003–2020
Table 3.12.3
Forecasts and composition of regional demand for UK higher education in business studies by key regions (000s)Base scenario (proportions (%) of total are in italics)
P267 market research AW 19/9/05 2:45 pm Page 56
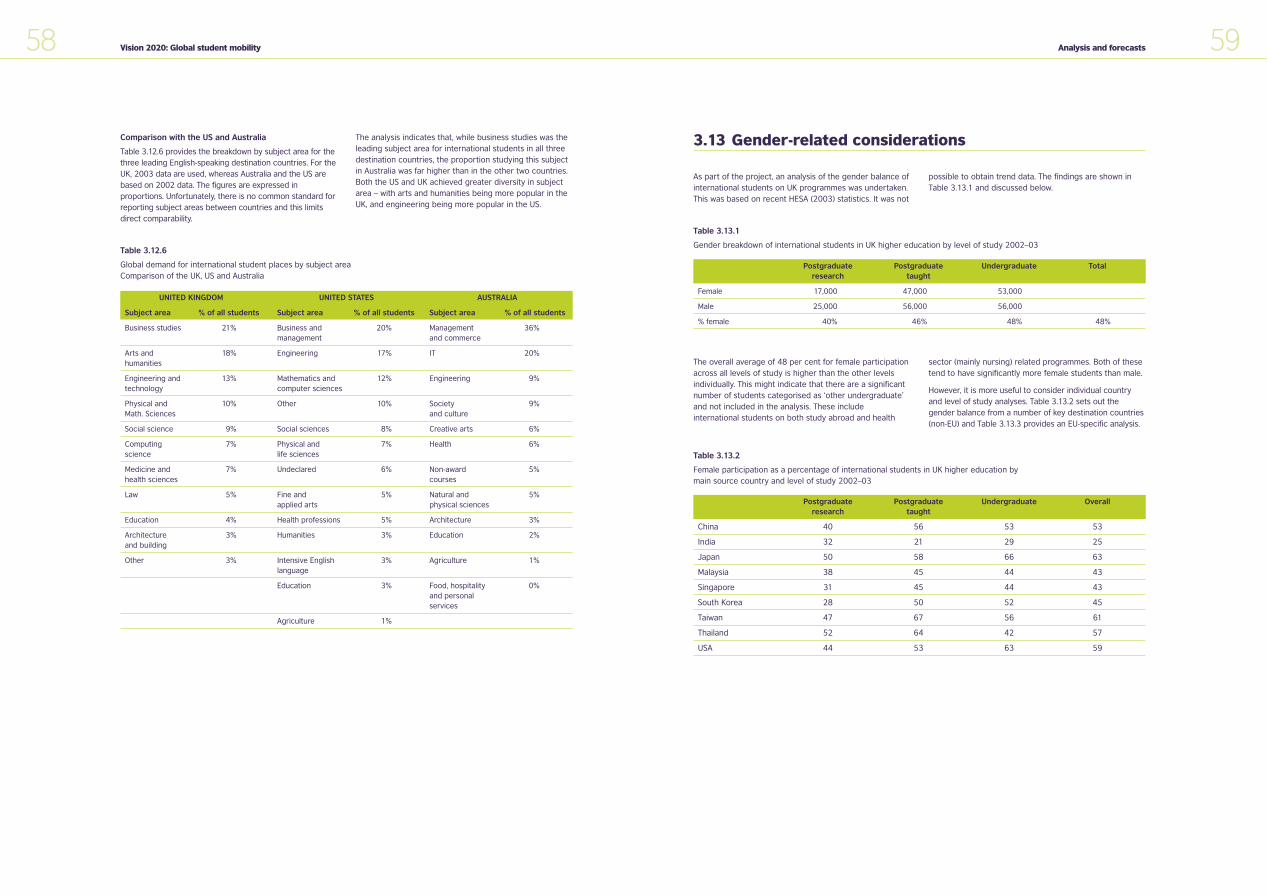
59Analysis and forecasts58 Vision 2020: Global student mobility
Comparison with the US and Australia
Table 3.12.6 provides the breakdown by subject area for thethree leading English-speaking destination countries. For theUK, 2003 data are used, whereas Australia and the US arebased on 2002 data. The figures are expressed inproportions. Unfortunately, there is no common standard forreporting subject areas between countries and this limitsdirect comparability.
The analysis indicates that, while business studies was theleading subject area for international students in all threedestination countries, the proportion studying this subjectin Australia was far higher than in the other two countries.Both the US and UK achieved greater diversity in subjectarea – with arts and humanities being more popular in theUK, and engineering being more popular in the US.
Table 3.12.6
Global demand for international student places by subject areaComparison of the UK, US and Australia
UNITED KINGDOM UNITED STATES AUSTRALIA
Subject area % of all students Subject area % of all students Subject area % of all students
Business studies 21% Business and 20% Management 36%management and commerce
Arts and 18% Engineering 17% IT 20%humanities
Engineering and 13% Mathematics and 12% Engineering 9%technology computer sciences
Physical and 10% Other 10% Society 9%Math. Sciences and culture
Social science 9% Social sciences 8% Creative arts 6%
Computing 7% Physical and 7% Health 6%science life sciences
Medicine and 7% Undeclared 6% Non-award 5%health sciences courses
Law 5% Fine and 5% Natural and 5%applied arts physical sciences
Education 4% Health professions 5% Architecture 3%
Architecture 3% Humanities 3% Education 2%and building
Other 3% Intensive English 3% Agriculture 1%language
Education 3% Food, hospitality 0%and personalservices
Agriculture 1%
3.13 Gender-related considerations
As part of the project, an analysis of the gender balance ofinternational students on UK programmes was undertaken.This was based on recent HESA (2003) statistics. It was not
possible to obtain trend data. The findings are shown inTable 3.13.1 and discussed below.
The overall average of 48 per cent for female participationacross all levels of study is higher than the other levelsindividually. This might indicate that there are a significantnumber of students categorised as ‘other undergraduate’and not included in the analysis. These includeinternational students on both study abroad and health
sector (mainly nursing) related programmes. Both of thesetend to have significantly more female students than male.
However, it is more useful to consider individual countryand level of study analyses. Table 3.13.2 sets out thegender balance from a number of key destination countries(non-EU) and Table 3.13.3 provides an EU-specific analysis.
Table 3.13.1
Gender breakdown of international students in UK higher education by level of study 2002–03
Postgraduate Postgraduate Undergraduate Totalresearch taught
Female 17,000 47,000 53,000
Male 25,000 56,000 56,000
% female 40% 46% 48% 48%
Table 3.13.2
Female participation as a percentage of international students in UK higher education by main source country and level of study 2002–03
Postgraduate Postgraduate Undergraduate Overallresearch taught
China 40 56 53 53
India 32 21 29 25
Japan 50 58 66 63
Malaysia 38 45 44 43
Singapore 31 45 44 43
South Korea 28 50 52 45
Taiwan 47 67 56 61
Thailand 52 64 42 57
USA 44 53 63 59
P267 market research AW 19/9/05 2:45 pm Page 58
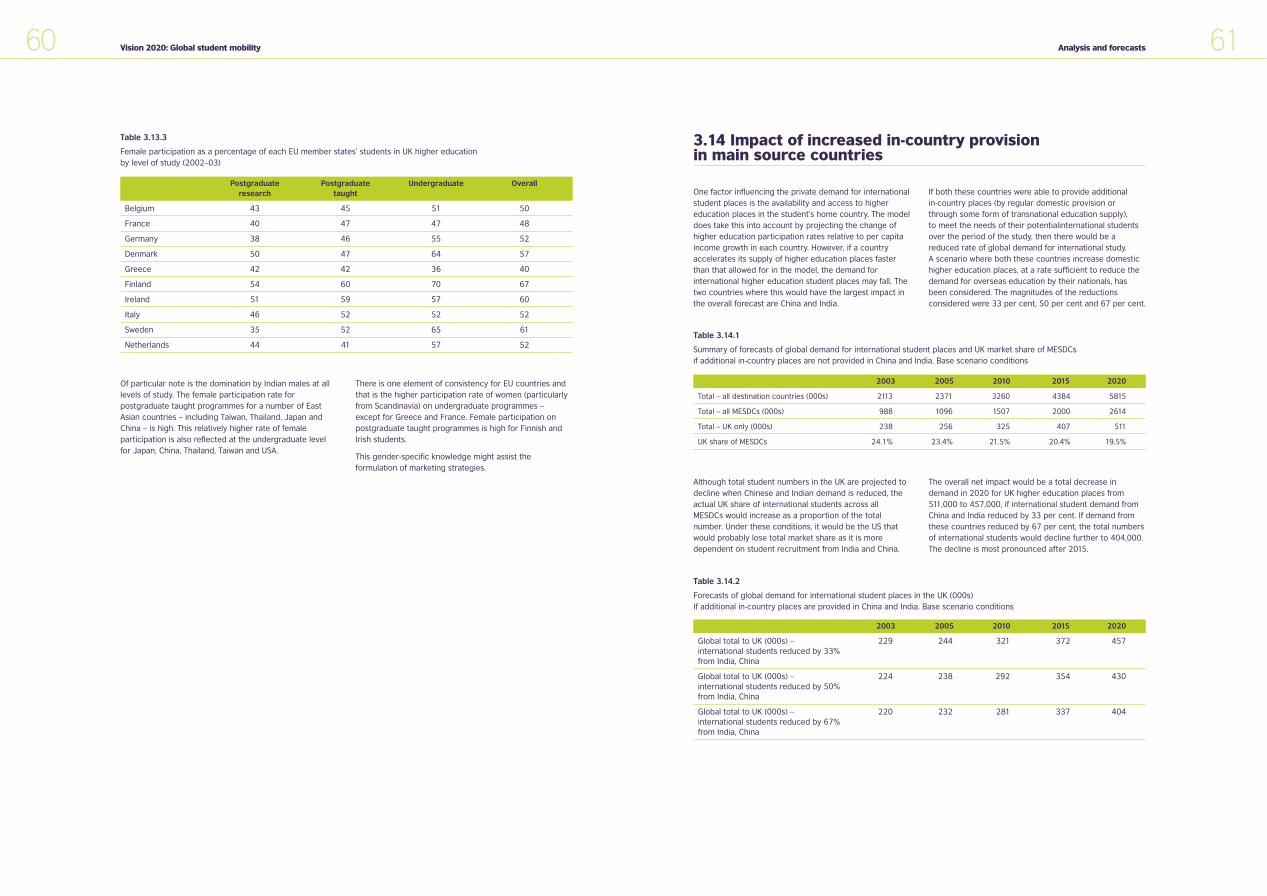
61Analysis and forecasts60 Vision 2020: Global student mobility
Table 3.13.3
Female participation as a percentage of each EU member states’ students in UK higher education by level of study (2002–03)
Postgraduate Postgraduate Undergraduate Overallresearch taught
Belgium 43 45 51 50
France 40 47 47 48
Germany 38 46 55 52
Denmark 50 47 64 57
Greece 42 42 36 40
Finland 54 60 70 67
Ireland 51 59 57 60
Italy 46 52 52 52
Sweden 35 52 65 61
Netherlands 44 41 57 52
Of particular note is the domination by Indian males at alllevels of study. The female participation rate forpostgraduate taught programmes for a number of EastAsian countries – including Taiwan, Thailand, Japan andChina – is high. This relatively higher rate of femaleparticipation is also reflected at the undergraduate levelfor Japan, China, Thailand, Taiwan and USA.
There is one element of consistency for EU countries andthat is the higher participation rate of women (particularlyfrom Scandinavia) on undergraduate programmes – except for Greece and France. Female participation onpostgraduate taught programmes is high for Finnish andIrish students.
This gender-specific knowledge might assist theformulation of marketing strategies.
Although total student numbers in the UK are projected todecline when Chinese and Indian demand is reduced, theactual UK share of international students across allMESDCs would increase as a proportion of the totalnumber. Under these conditions, it would be the US thatwould probably lose total market share as it is moredependent on student recruitment from India and China.
The overall net impact would be a total decrease indemand in 2020 for UK higher education places from511,000 to 457,000, if international student demand fromChina and India reduced by 33 per cent. If demand fromthese countries reduced by 67 per cent, the total numbersof international students would decline further to 404,000.The decline is most pronounced after 2015.
Table 3.14.2
Forecasts of global demand for international student places in the UK (000s)If additional in-country places are provided in China and India. Base scenario conditions
2003 2005 2010 2015 2020
Global total to UK (000s) – 229 244 321 372 457international students reduced by 33% from India, China
Global total to UK (000s) – 224 238 292 354 430international students reduced by 50% from India, China
Global total to UK (000s) – 220 232 281 337 404international students reduced by 67%from India, China
One factor influencing the private demand for internationalstudent places is the availability and access to highereducation places in the student’s home country. The modeldoes take this into account by projecting the change ofhigher education participation rates relative to per capitaincome growth in each country. However, if a countryaccelerates its supply of higher education places fasterthan that allowed for in the model, the demand forinternational higher education student places may fall. Thetwo countries where this would have the largest impact inthe overall forecast are China and India.
If both these countries were able to provide additional in-country places (by regular domestic provision orthrough some form of transnational education supply), to meet the needs of their potentialinternational studentsover the period of the study, then there would be areduced rate of global demand for international study. A scenario where both these countries increase domestichigher education places, at a rate sufficient to reduce thedemand for overseas education by their nationals, hasbeen considered. The magnitudes of the reductionsconsidered were 33 per cent, 50 per cent and 67 per cent.
3.14 Impact of increased in-country provision in main source countries
Table 3.14.1
Summary of forecasts of global demand for international student places and UK market share of MESDCsif additional in-country places are not provided in China and India. Base scenario conditions
2003 2005 2010 2015 2020
Total – all destination countries (000s) 2113 2371 3260 4384 5815
Total – all MESDCs (000s) 988 1096 1507 2000 2614
Total – UK only (000s) 238 256 325 407 511
UK share of MESDCs 24.1% 23.4% 21.5% 20.4% 19.5%
P267 market research AW 19/9/05 2:45 pm Page 60
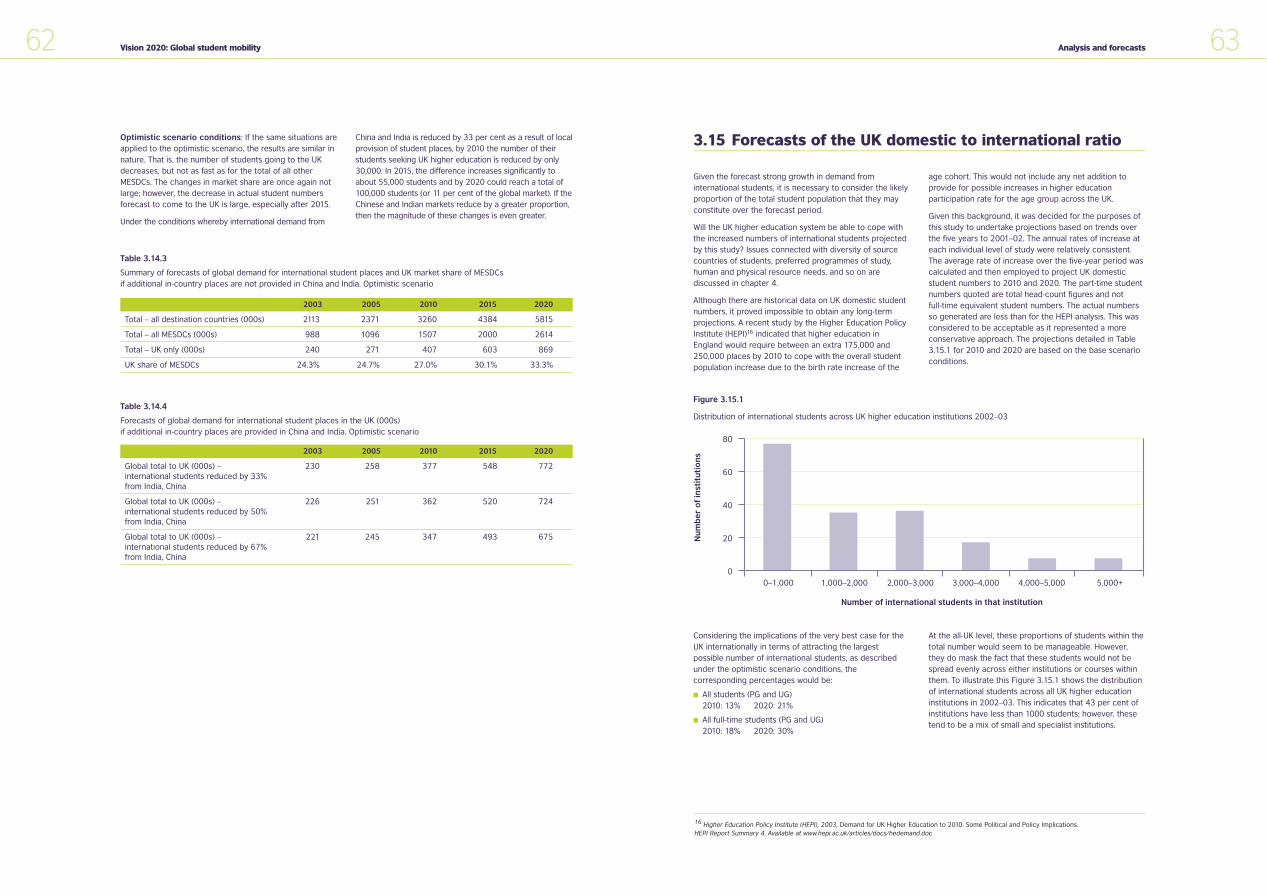
63Analysis and forecasts62 Vision 2020: Global student mobility
Optimistic scenario conditions: If the same situations areapplied to the optimistic scenario, the results are similar innature. That is, the number of students going to the UKdecreases, but not as fast as for the total of all otherMESDCs. The changes in market share are once again notlarge; however, the decrease in actual student numbersforecast to come to the UK is large, especially after 2015.
Under the conditions whereby international demand from
China and India is reduced by 33 per cent as a result of localprovision of student places, by 2010 the number of theirstudents seeking UK higher education is reduced by only30,000. In 2015, the difference increases significantly toabout 55,000 students and by 2020 could reach a total of100,000 students (or 11 per cent of the global market). If theChinese and Indian markets reduce by a greater proportion,then the magnitude of these changes is even greater.
Table 3.14.4
Forecasts of global demand for international student places in the UK (000s)if additional in-country places are provided in China and India. Optimistic scenario
2003 2005 2010 2015 2020
Global total to UK (000s) – 230 258 377 548 772international students reduced by 33% from India, China
Global total to UK (000s) – 226 251 362 520 724international students reduced by 50% from India, China
Global total to UK (000s) – 221 245 347 493 675international students reduced by 67% from India, China
Table 3.14.3
Summary of forecasts of global demand for international student places and UK market share of MESDCsif additional in-country places are not provided in China and India. Optimistic scenario
2003 2005 2010 2015 2020
Total – all destination countries (000s) 2113 2371 3260 4384 5815
Total – all MESDCs (000s) 988 1096 1507 2000 2614
Total – UK only (000s) 240 271 407 603 869
UK share of MESDCs 24.3% 24.7% 27.0% 30.1% 33.3%
3.15 Forecasts of the UK domestic to international ratio
Given the forecast strong growth in demand frominternational students, it is necessary to consider the likelyproportion of the total student population that they mayconstitute over the forecast period.
Will the UK higher education system be able to cope withthe increased numbers of international students projectedby this study? Issues connected with diversity of sourcecountries of students, preferred programmes of study,human and physical resource needs, and so on arediscussed in chapter 4.
Although there are historical data on UK domestic studentnumbers, it proved impossible to obtain any long-termprojections. A recent study by the Higher Education PolicyInstitute (HEPI)16 indicated that higher education inEngland would require between an extra 175,000 and250,000 places by 2010 to cope with the overall studentpopulation increase due to the birth rate increase of the
age cohort. This would not include any net addition toprovide for possible increases in higher educationparticipation rate for the age group across the UK.
Given this background, it was decided for the purposes ofthis study to undertake projections based on trends overthe five years to 2001–02. The annual rates of increase ateach individual level of study were relatively consistent.The average rate of increase over the five-year period wascalculated and then employed to project UK domesticstudent numbers to 2010 and 2020. The part-time studentnumbers quoted are total head-count figures and not full-time equivalent student numbers. The actual numbersso generated are less than for the HEPI analysis. This wasconsidered to be acceptable as it represented a moreconservative approach. The projections detailed in Table3.15.1 for 2010 and 2020 are based on the base scenarioconditions.
Figure 3.15.1
Distribution of international students across UK higher education institutions 2002–03
80
60
40
20
00–1,000 1,000–2,000 2,000–3,000 3,000–4,000 4,000–5,000 5,000+
Nu
mb
er
of
inst
itu
tio
ns
Number of international students in that institution
Considering the implications of the very best case for theUK internationally in terms of attracting the largestpossible number of international students, as describedunder the optimistic scenario conditions, thecorresponding percentages would be:
� All students (PG and UG)2010: 13% 2020: 21%
� All full-time students (PG and UG)2010: 18% 2020: 30%
At the all-UK level, these proportions of students within thetotal number would seem to be manageable. However,they do mask the fact that these students would not bespread evenly across either institutions or courses withinthem. To illustrate this Figure 3.15.1 shows the distributionof international students across all UK higher educationinstitutions in 2002–03. This indicates that 43 per cent ofinstitutions have less than 1000 students; however, thesetend to be a mix of small and specialist institutions.
16 Higher Education Policy Institute (HEPI), 2003, Demand for UK Higher Education to 2010: Some Political and Policy Implications. HEPI Report Summary 4. Available at www.hepi.ac.uk/articles/docs/hedemand.doc
P267 market research AW 19/9/05 2:45 pm Page 62
4 Analysis ofimplications
If the UK is able torespond successfully
. . . all students(international and
domestic) will benefitsignificantly. They will
have access to agreater range of
programmes that arebetter resourced,offered through a widerand more flexible mix ofdelivery modes and atthe world’s leading levelof quality.Vision 2020, section 4.4
3.16 Sources of funding for international students
3.17 A two-way flow: UK students’ demand for international education
Much of the strong growth in numbers of internationalstudents over the last few years has been due to theprivate demand from individuals. An analysis of fundingsources for international students17 in the UK indicates the following:
� Undergraduate and related: Nearly two-thirds of theapproximately 143,000 students are privately funded.The remaining one-third has their fees met from avariety of UK sources including fee waivers orscholarships. The largest single UK government sourceof public funds at this level is the Department of Health– mainly for nurse-related training.
� Postgraduate taught courses: Of the approximately88,000 international students on these programmes,approximately 86 per cent have their fees met fromsources outside the UK.
� Postgraduate research: Approximately 40 per cent ofthe 39,000 international students on postgraduateresearch programmes receive some payment of fees fromUK. This comes in the form of fee waivers, UK governmentscholarship or related support. Approximately 15 per cent(6,000) receive scholarships from their own governmentor employing institutions. Most of the remaining 60 percent are privately supported.
� Transnational education: The main growth intransnational education has been due to privatelyfunded students; these include both those who are mid-career professionals and whose lifestyle and personalcircumstances precludes study abroad, and thoseseeking to access quality international education atlower cost in their own country. There is every indicationthat private funding will continue to be the main driverof demand in this sector over the period of this study.
In general, there is very little data available from othercountries regarding the funding support available for
international students. The US does have some informationthat is published through Open Doors. This indicates that, in2002–03, some 78 per cent of international undergraduatestudents were privately funded. For international postgraduatesthe privately funded proportion fell to 51 per cent. Some 38 per cent of postgraduate students reported that the USuniversity at which they were studying was their primarysource of funds, and it is believed that, for postgraduateresearch students in particular, this fraction is significantlyhigher, possibly over 50 per cent.
Of particular interest is the relatively large number ofprivately funded international students on UK postgraduatetaught courses. The possible reason for this is that asparticipation rate in a country at the undergraduate levelincreases, then it is more likely that a postgraduatequalification will become a key discriminator in the labourmarket.
The above patterns of funding are likely to be reinforcedover the next few years for a number of reasons. The trendtowards individual private funding of higher educationacross the world will grow as more and more countriesseek to increase the prices charged for their highereducation programmes to meet the full costs of delivery.This applies to both domestic and international students.The net results of this trend will probably be that anincreasing number of students will be internationally mobile;they will seek to access the most cost-effective educationfor their requirements, wherever it might be delivered.
Postgraduate research students represent a special case.They are essential for the UK and its universities; the needis to maintain and grow innovative research. It is likely thatthere will be a need to increase direct financial supportfrom both government and individual universities to attractthe best researchers internationally available, due to themore competitive international environment.
64 Vision 2020: Global student mobility
As part of the study, it was possible to assess theparticipation rate of UK students in international highereducation. Indications are that the annual growth rate forUK students (1.3 per cent) is the smallest for any of themajor English-speaking nations, and among the smallest
growth worldwide, along with several other Europeancountries and Japan. The total number of UK studentsstudying outside the UK in all countries is forecast to growfrom the current figure of 28,000 to 35,000 in 2020.
17 HESA Data 2002–03
P267 market research AW 19/9/05 2:45 pm Page 64

66 Vision 2020: Global student mobility 67Analysis of implications
4.1 Introduction
International education is an economic sector that isextremely attractive to a country: it is knowledge-intensive,high value-added and offers long-term benefits. Whencompared with other activities in the services sector of theeconomy, growth (both achieved and projected) isextremely impressive. Few sectors of the world economycould match such predictions for sustained growth. Forexample, the total value of education exports to the UK isestimated at over £10 billion p.a. and has been growingsignificantly and consistently.
International education is at the centre of the UK’sknowledge economy and the nation’s long-term wealth andprosperity. It provides the UK with a dynamic, high-skill andsustainable export industry that has far-reaching nationalimplications.
The UK has been a global leader, second only to the US, in the provision of higher education to citizens of othercountries; but this research raises some fundamentalquestions for the future. This chapter provides an analysisof the research, summarising the market developmentsexpected under the different scenarios presented in thisreport and setting out five key strategic issues for the UKand its higher education institutions. Although for ease ofpresentation these issues are dealt with individually, itshould be noted that they are inextricably linked. They can be summarised as follows:
� Strategic issue 1: ensuring quality Can the UK maintain its quality position whilstsignificantly expanding provision?
� Strategic issue 2: responding to global competitionHow might the UK respond to the dramatic changes inthe global market that may come from the newcompetitive environment?
� Strategic issue 3: building capacityDo institutions have sufficient physical and humancapacity to respond to the potential huge opportunitiespresented?
� Strategic issue 4: presenting diversityHow will the composition of demand change? Can theUK meet the challenge of diversity and student choice?
� Strategic issue 5: delivering globallyHow might the UK capitalise on its current global leadposition for transnational provision?
In analysing these issues, this chapter seeks to answer thefollowing questions:
� How might the UK capitalise more effectively on itscurrent market position?
� How might UK providers ensure that they are meetingthe needs of their students?
� How might UK institutions be more aware of andresponsive to potential problems?
Finally, a conclusion discussing how the UK internationaleducation industry as a whole might capitalise on thepotential opportunities of the changing global market isprovided.
4.2 Summary of forecast market developments
Market growthAs the study demonstrates, the global demand forinternational student places is likely to increase from thecurrent 2.1 million to about 5.8 million by 2020. Within themain MESDCs the equivalent demand growth could befrom the current less than 1 million places to about 2.6
million places. As part of this, UK higher education mayexperience a tripling of the current level of demand toover 850,000 places by 2020.
Table 4.1 compares projected growth predicted for the UK under base and optimistic scenario conditions asdescribed in detail in chapter 3. There are historical
Table 4.1
Projected growth of international students in UK HE under differing scenarios (000s)
Scenario 2005 2010 2015 2020 Growth*
Base 256 325 407 511 4.7%
Optimistic 271 407 603 869 8.1%
* Compound annual growth 2003–2020
4.3 Strategic issues
reasons for being optimistic. Globally, international studentnumbers have grown strongly and consistently. Thenumber of international students in the US over the lastten years has averaged 3.1 per cent p.a. growth and forthe MESDCs the overall average has been 6.1 per cent p.a.since 1997. Few areas of global economic activity haveachieved such high levels of growth.
Similarly for UK HE programmes, delivered through avariety of arrangements transnationally, growth is forecastto increase very fast – from the current approximate figureof 190,000 students to over 800,000 by 2020. The UK isprobably the current world leader in TNE with some 43 percent of all international students on UK HE programmesfollowing their study programmes through a full variety ofTNE delivery modes – distance learning, validation andfranchising arrangements, partnerships, overseascampuses and so on. In addition, many UK professionaltraining programmes (e.g. marketing, accountancy,computing) are available globally through TNE (althoughthese fall outside the scope of this study). Growth rates areforecast to be highest from South and East Asia. Five Asiancountries – China, India, Malaysia, Hong Kong andSingapore – are projected to make up 75 per cent(598,000) of the global demand in 2020. Outside the mainfive Asian countries, demand from Sri Lanka and Pakistan ispredicted to grow strongly, as it is from Russia and otherEastern European countries. Demand from Africa (inparticular sub-Saharan Africa) is also forecast to expand,although from a much smaller base.
Increasing competition, changing customerexpectations and new technology
The returns (academic, political, social and financial)available through engagement in international educationcan be high; consequently, the global market place isbecoming increasingly competitive. New destinationcountries for students are emerging as governmentsincreasingly realise the strong relationship betweeninternational education, prosperity and economic andpolitical advantage. The sustained growth of the sectorand the associated profitability is attracting new marketentrants, both from traditional providers as well as fromprivate and corporate interests.
In addition,students are becoming increasingly demandingand discriminating. This will significantly affect both studentservices and the nature of programmes on offer. Newtechnology is also likely to have a fundamental impact, by:
� reducing barriers to entry through new types of delivery
� enabling the development of scalable models and thepotential reduction of the cost base
� facilitating delivery in price-sensitive markets wherepreviously this was not possible
� facilitating demand for increasingly more flexible andcustomised programmes and delivery mechanisms,including growth in demand for lifelong learning andtransnational programmes
� making information on the range of opportunities moreeasily accessible.
Section 4.3 discusses these nature of the changes in moredepth and a number of implications for future policy areprovided.
Ensuring quality The conclusions in this research from the application ofdiscrete choice modelling to the position of the UK arevery clear: delivering on quality is of overriding importanceto the UK. Recent evidence shows that a small shift in theperception of quality and associated value leads tosignificant rises in market share.
The role of the Quality Assurance Agency for HigherEducation (QAA) is well recognised internationally, and theUK currently has wide global recognition for its quality ofprovision18. Many countries are now seeking to emulate thisapproach. International students are also becoming betterinformed; they frequently check institutional records on bothteaching and research assessments. The fact that the QAAalso makes its reviews publicly available sends a powerfulglobal signal about the UK’s commitment to quality.
International students perceive that the quality associatedwith acquiring a UK HE qualification will provide them withadded advantage in the labour market. As competition foremployment increases, an international study experiencewill be a vital discriminator for employers19. Howeverrecent research20 has indicated that many internationalstudents experience a sharp drop in their perception ofthe UK as a quality education destination about three to sixmonths into their programme. The reasons for this are notfully understood. Although there is an improvement inperception over the latter period of their stay andfollowing return home, it is a cause for concern. This is tobe explored in more detail as part of a proposedUKCOSA/British Council/Universities UK research study.
There are two areas in particular where the UK has beenvulnerable over recent years. These are:
18 Education UK and PMI – four years on, research conducted by MORI for the British Council, 2003.19 Böhm and Lenssen, 2001.20 Education UK and PMI – four years on, research conducted by MORI for the British Council, 2003.
P267 market research AW 19/9/05 2:45 pm Page 66
69Analysis of implications
� International communications and media: Aseducation has come to the forefront of internationalbusiness, so it has attracted increasing press coverage.Any problems associated with delivery of UK HE,whether in the UK or internationally, are immediatelypublished in the international media. This will onlyincrease as global communications and informationimproves.
� Quality in TNE delivery: There have already been anumber of high profile-cases in which a few UKinstitutions have been criticised for quality assurancerelated to some programmes delivered outside the UK.These have had very damaging effects on the UK’sreputation as a whole – particularly as they arepublished throughout the world’s press. Other countrieshave suffered similarly: the criticism of some Australianprogrammes delivered in Malaysia resulted in asignificant lowering of the quality perceptions ofAustralian education provision generally in Singaporeand Malaysia21.
Ensuring quality: implications for future policy and essential research
1 Any drop in the quality of provision, real orperceived, by UK HE providers will have strongnegative consequences. But enhancing qualitydoes have considerable associated costs. In theface of declining government funding and othercosts’ escalation what is the most cost-effectiveapproach to quality assurance?
2 The most effective way of promoting more widelythe added employment opportunities associatedwith a UK qualification needs to be identified.
3 Effective ways of dealing with bad news stories in the global press need to be found andimplemented. Does the UK need an industry-widePR and communications strategy?
4 The UK needs to ensure that it has in place anappropriate quality-assurance regime sufficient tomeet the needs of the growing diversity of TNEprogrammes.
5 Further research is necessary to establish whythere is a drop in perception of quality once astudent undertakes a UK course of study.
Meeting the needs of international students: The quality imperative
Students will benefit significantly from accessing high-quality education in the UK. These qualificationswill directly support their career aspirations and berecognised by employers and government in thestudent’s home country.
Responding to growing global competitionThe global education market is fundamentally changing,and dramatically increasing levels of competition can beseen to be coming from a variety sources. These aredescribed below:
� English medium competition The existing MESDCs, ledby the US and Australia, are likely to continue to presentthe main competition to the UK over the period of thisstudy. However all, except the US, have significantlysmaller national capacity for HE provision than the UK,and this may limit their ability to expand.
An attraction that New Zealand, Canada and Australiaoffer, relative to the UK, is the enhanced opportunity tomigrate to those countries for international studentsqualifying in their universities. This would ultimatelyimpact on the perception of enhanced employabilityassociated with those destinations.
� New English medium providers : These are bestdescribed in two separate groups. First, there are thosecountries whose national HE systems are predominantlydelivered through the medium of English. Second, thereare those with other primary languages of delivery(most notably the new European providers).
Included in the first category are Singapore and Malaysia.Both countries have made it very clear that they wish toattract foreign universities with an international reputationto establish activities and attract international students.The University of Nottingham campus in Malaysia (andrecent expansion into China) is a good example of anapproach that has the potential to be beneficial to bothMalaysia and the UK. However, there are other institutionsfrom outside the UK developing and such initiatives willpresent an additional layer of competition.
Similarly, India is growing capacity to attract internationalstudents both in India and globally, including in Malaysia.For example, the National Institute of InformationTechnology offers programmes22 across Asia and Africawith links to America and Europe as well as on-lineprogrammes. Additionally, a private sector medicalschool associated with established Indian universitieshas been established in Malaysia.
Singapore is growing its capacity to attract internationalstudents with a target of up to 150,000 being suggested.A number of concessions are being offered toprestigious foreign institutions to establish operations to deliver in Singapore.
A prime example of the second category is theestablishment of EduFrance, which currently advertisessome 150 programmes in French HE institutions deliveredthrough the English language. NUFFIC23 details on itswebsite over 850 international courses delivered throughEnglish in HE institutions in the Netherlands. Similardevelopments are occurring in Sweden and Germany.New providers in English will also be available in EasternEurope and the Baltic States.
68 Vision 2020: Global student mobility
� The private sector and corporate universities: About 25 per cent of US higher education students areenrolled in private sector institutions. However, inresponse to changing patterns of demand, increasingnumbers are entering the new private sector institutionsthat offer more flexible approaches to delivery. Includedin this new category is the University of Phoenix, whichhas over 100 centres across the US and operates centresin Puerto Rico and Canada and has links with India.There are also plans to expand into Europe. Similarly, the US education company Sylvan Learning Systems isgrowing rapidly with operations in Mexico, France,Guam, Hong Kong and Canada as well as in the US.
Responding to global competition: implications for future policy
The UK will face extremely strong, well-organised andpotentially better resourced competition from itstraditional competitors in the coming years. Theemergence of the new competitors from Asia andEurope must be taken seriously. In many cases theirgovernments have chosen to invest significantly aspart of a broader foreign diplomacy agenda.Collectively, they could have a large impact. Also theyhave the potential to compete very effectively in nicheareas (e.g. Netherlands and Germany in technology)and in specific source countries that they might target.What sector-wide strategy does the UK need tocombat these new threats?
Meeting the needs of international students: impact of global competition
All students should benefit from greater competitionwhich could lead to greater choice of programmesdelivered more effectively and at a lower cost.
Building capacityPerhaps one of the most significant problems for the UK willbe to supply sufficient places to meet the projected demand.The implications in terms of building needs (for teaching andstudent accommodation), other physical resources and staff(both academic and support) are immense. The current totalnumbers of international students as a percentage of thetotal UK HE student population is about 10 per cent. A smallnumber of institutions report up to 20 per cent internationalstudents on their campuses. Given the growth ofparticipation rate for UK domestic students, the relativenumbers of international students overall in the UK could bebetween 11.6 per cent (base scenario) and 21 per cent(optimistic scenario) of all HE students by 2020. There areseveral factors involved in providing a balanced response tothe question of where flexibility might exist. These include:
� Does capacity actually exist? A recent survey of UKinstitutions24 indicated that the majority considered theyhad sufficient capacity to meet the current rate ofgrowth in international student demand over the short tomid-term. However, this research was limited in coverageand does need to be augmented by more structuredresearch to establish more rigorously the size and scale.Additionally, from discussions with UK institutions, there isan indication that potential capacity is not evenly spreadacross subject areas, levels of study and institutions.
� Domestic provision UK higher education institutionswill need to expand provision to meet projectedadditional demand from UK domestic students, providingthis is in line with government targets. This is due to a‘bulge’ in the age group to 2010 due to increased birth-rate. There is also pressure to increase participation inhigher education towards 50 per cent of people aged18–30 by 2010. UK student demand may change, for avariety of reasons and developments in student supportarrangements within the UK may also influence demand.
� Private sector provision: A rapid growth in privatesector provision in the UK could occur as the potentialfor revenue generation from international activities isvery significant and would be attractive to manybusiness operations. This might derive from foreignproviders, independent UK operators or throughfranchised or validation arrangements.
There has been rapid private sector growth elsewhere(e.g. US, Eastern Europe and South East Asia) and theincreasing liberlisation of trade in educational servicesthrough GATS and other routes might well facilitate asimilar pattern in the UK. There are already someindications that this is indeed happening in the UK asprivate providers are very active in ELT delivery andmany also offer foundation courses for accessing highereducation. Possible changes in higher education in theUK around the use of ‘university’ title may encouragemore private sector engagement in UK highereducation. A more direct approach towards growingquality provision and capacity more rapidly within theprivate sector might be through a greater variety ofpublic–private partnerships coupled with validation orother similar arrangements.
� Public–public and public–private partnerships: UKpublic sector HE institutions have already demonstrateda high level of entrepreneurial flair in the developmentof programmes delivered in countries where there aresupply constraints through a wide range of TNEarrangements. This approach could easily be extendedto growing provision in the UK. The approach couldinvolve UK universities, established in the internationalmarket already, agreeing franchises or validationarrangements in partnership with other UK higher andfurther education institutions in both public and privatesectors, in which there might already be existing capacity.
21 Report at AEI/IDP International Education Conference. 200222 See www.niit.com23 See www.nuffic.org 24 Education UK and PMI – four years on, research conducted by MORI for the British Council, 2003.
P267 market research AW 19/9/05 2:45 pm Page 68
71Analysis of implications
Building capacity: implications for future policy
1 Demand, even under the baseline scenario, isforecast to grow significantly up to 2020. Howeverthere appear to be bottlenecks and potentialcapacity issues in the UK system. What is the bestway of addressing these?
2 Better market intelligence is needed to enableinstitutions to spread risk, widen their internationalproduct portfolio and address capacity issues. Howmight this be best captured and disseminated?
3 To maximise the benefits institutions will need tointegrate their international strategy with objectivesfor the home market. What central support wouldbe useful to facilitate this?
Meeting the needs of international students: greater capacity – better resources
Students will benefit through investment in domesticprovision: additional capacity will be created; accessto a wider range of programmes will be available; andchoice of institution and delivery will be enhancedthrough a variety of public, private and public-privatearrangements.
Presenting diversity The concept of diversity has many dimensions, and thiswas well analysed in the IDP GSM 2025 report. Essentiallydiversity, in the context of international students in UK HEinstitutions, tends to relate to source regions andcountries, study disciplines and levels of study.
Diversity is important for the UK and UK higher educationfor a number of reasons:
� economic: diversification of source countries forstudents helps institutions to reduce risk
� academic: diversity within the teaching environmentprovides benefits associated with the internationalisationof the learning processes and research. These includecountry and regional specific projects and programmes;language and culture; international comparativeeducation; economic, social and political systems, etc.
� political: enhanced diversity will help extend the UK’sinternational political, economic and social networks andthe associated influence of these
� socio-cultural: these are potential internationalisationbenefits for UK communities through encouraging closerengagement with international student populations.
From a student’s perspective, how important is theconcept of diversity? And does this vary with country andregion? International student networks in UK institutions
tend to contain mainly other international students – notnecessarily from the same country. Indeed these havebeen reported to be very rewarding as Simon Bere, aZimbabwean postgraduate student at Lancaster University(and a silver award winner at the 2003 UK IYSA25) soeloquently described:
I have tested that it is possible for races to co-exist inharmony. I share a flat with eight other students, fivefrom China, one each from Greece, Denmark and Spain.We share the kitchen, use the same toilets andbathrooms and we have never had any problems. If anything we live as a family. If people from differentraces and cultures can live under the same roof, it ispossible for them to live in harmony in the same country.
But anecdotally, international students are reported to begenerally surprised at their relatively low level ofinteraction with UK students.
The main challenge suggested by this analysis relates toensuring a more even spread of international studentsfrom a diverse range of countries, subject areas, levels ofstudy and institutions as well as promoting integration ofinternational students.
� Country and regional diversification: This study clearlyindicates the importance of Asia as the main source forstudents. Just over 50 per cent of the UK’s demand islikely to come from Asia in 2020, and more if theoptimistic scenario is realised. Within Asia, China and Indiaare dominant. Encouragingly however, relative to theother MESDCs (other than the US), the UK has a morediverse range of countries from which it attracts students.There are currently some 32 countries that provide over1,000 students each for UK HE institutions. A further tencountries are in the 500 to 1,000 student range.
The UK needs to ensure wide diversification in its entirestudent population: UK, EU and non-EU international.This issue was discussed at a joint seminar sponsoredby Universities UK and the British Council 26 where it wasagreed that it was not appropriate, ethical, or acceptable(and probably not legal) to ‘ration’ places. Quality mustbe the paramount criterion for admission to a UK HEprogramme.
While this might provide a stronger base for diversifiedgrowth for the UK, relative to the other MESDCs, thereare additional costs associated with a drive for greaterdiversity of source country. More funds will need to be spent on marketing; for example, the costs ofattracting an additional Brazilian or South African studentare higher than for an Indian or Chinese student undercurrent market conditions. Additionally, any reduction ineffort in some of the current main markets will provideopportunities for competitors to exploit.
70 Vision 2020: Global student mobility
� Diversity of subject: The analysis of subject of studyindicates the likely concentration of internationalstudents in a limited range of study areas by 2020. Thetop four areas27 account for 65 per cent of all students.The comparable figure for the same four areas in 2003(where they were also the lead topics) was 59 per cent.
These figures represent the best analysis possibleemploying currently available data. However, what isimpossible to predict, given data limitations and theabsence of studies on international comparisons, is howthe nature of increasing market maturity and changes inemployment prospects associated with a particularqualification might impact on these proportions over theperiod of the projection.
From historical evidence, change does seem to occurslowly in the global education market. By comparisonwith more mature domestic markets it might beconcluded that:
– increasing competition for employment will result insignificant differentiation within each of the studyareas, e.g. ‘general’ business studies will evolve to avariety of more specialist topics.
– there will be an evolution to consumption-orientatedchoice (i.e. seeking ‘psychic returns’ to the educationexperience) rather than the more ‘vocational’ topics.This is a trend already noticeable in North Americaand Western Europe. Such moves might be reinforcedby the shift to other patterns of study, e.g. study abroad.
� Levels of study: Forecasts are for a move away fromundergraduate towards postgraduate study, particularlyfor postgraduate taught programmes. The currentproportion of all international postgraduate students inUK institutions is about 47 per cent and this is projectedto rise to 57 per cent by 2020. In terms of diversity,relative to the other MESDCs, this represents probablythe greatest range of programmes.
A major challenge for the UK is to attract morepostgraduate research students. Numbers are projectedto grow over the period but at a relatively more modestrate of about 4 per cent p.a. These students areessential for the UK’s research and innovation.
Presenting diversity: implications for future policyand essential research
1 Meeting the imperatives of diversity, both countryand regional, will provide difficult challenges for UKhigher education. There are strong reasons forgrowing such diversity from a sector, institutionaland student viewpoint and the choice of approachwill require a delicate balance.
2 In terms of spread by subjects and levels, there ispotential to diversify further and this could be tothe benefit of both UK institutions and the students.
3 There is a major gap in our understanding ofperceptions and needs from a student perspective.Additional research on this is essential and a jointproject is planned28.
4 The approach to international student recruitmentfor postgraduate students is in need of a more farreaching review. A joint Universities UK–BritishCouncil working group is being established to takethis forward.
5 The proportion of international students todomestic students, and the proportion of studentsfrom a particular country as a fraction of totalstudents, are frequently quoted as measures ofdiversity. Whether this is appropriate for UKuniversities to have programmes with onlyinternational students or even with students fromjust one or two countries need to be considered.
Meeting the needs of international students: diversity of choice
Students will benefit from having access to a broadrange of options, enabling them to fulfil both careerand personal aspirations through their study. Theirstudy experience will be greatly enriched through theopportunities presented to meet and mix withstudents from a wider range of countries.
Delivering globallyDemand for transnational education is forecast to groweven faster than that programmes within the UK, but thereare considerable associated risks.
It is inevitable that competition in this area will grow fast.The opportunities presented by new technologies andeconomies of scale are many. In particular, a number ofcountries (notably the US) are developing moresophisticated approaches for the provision of coursemodules through distance learning, including for theirhome campus students. They will be in a position toexpand this activity internationally. The UK must positionitself similarly if it wants to stay ahead. Currentunderstanding of this sector is based on very limitedstatistics so further research will be essential.
Maintaining strict quality assurance is essential for allprogrammes (see ‘Ensuring quality’, page 67). Any failureto meet quality requirements is likely to have disastrousrepercussions across the whole of the UK HE sector. Theneed for the UK is to review regularly and critically the fullvariety of TNE provision from the UK in each country.
Little is currently known about the decision-makingapproach of students seeking to pursue internationalhigher education programmes in their home country. Thiswas discussed in chapter 3 and research was proposed ina number of countries to improve understanding.
25 UK international Student of the Year Awards.26 Chinese Students in the UK: Universities UK and British Council joint seminar, July 2002.
27 Business studies and related (24%), arts and humanities (16%), computing related (13%), and engineering and technology (12%).28 Proposed study on international student experiences: UKCOSA with the British Council and Universities UK.
P267 market research AW 19/9/05 2:45 pm Page 70

73Analysis of implications
4.4 Conclusion: realising opportunityThere are also a number of UK institutional issues. These include:
� How does the delivery of TNE fit within the overallmission of the UK institution?
� How can an institution ensure that the internationalstudent enrolled on a TNE programme receives acomparable experience to one following a programmeon the UK campus?
� How might the appropriate staff and other resourceneeds be best met to ensure the delivery of theprogramme?
� Can adequate quality assurance measures be put intoplace to meet QAA guidelines in a globally competitivemarket?
� What sanctions might be available locally if partners failto meet the standards required?
� UK institutions are not normally encouraged to take risksdue to the regulatory and accountability requirements –how might they be supported to pursue potentialopportunities?
� Can scaleable models be developed to meet the risingdemand?
� Can programmes be delivered at a cost that allows for alevel of pricing appropriate for the local market?
Delivering globally: implications for future policy and essential research
1 Many of these these activities are left to theentrepreneurial flair of individual institutions anddepartments. Can the UK industry as a wholeadopt a more strategic approach (e.g. reviewingmarkets systematically and providing access to thenecessary investment)?
2 Institutions need to invest significantly if they are toincrease their TNE acivities globally. A number ofUK institutions have been very entrepreneurial todate. How might other UK institutions learn fromthese?
3 There is a need for better market intelligence to begathered, business opportunities to be developedand information disseminated to assist institutionsin their strategic decision making.
4 Adequate provision needs to be made by UKinstitutions within their pricing policies forprogrammes to fully meet the quality assuranceneeds of the programme. Is an expanded role forthe QAA necessary?
5 It is noticeable that only a few UK public–privatepartnerships have been developed in order toexpand UK TNE delivery globally. What have beenthe barriers?
6 A more thorough analysis of global markets isessential if UK institutions are to be better advisedon investment strategy.
7 Research is necessary to establish a clearer pictureof students who seek to follow TNE programmes –both in terms of how they make their initial choicesand their learning and support requirements.
Meeting the needs of international students: the TNE option
Students, who are unable to undertake a course ofstudy overseas for whatever reason (financial, family,professional etc.) will benefit through being able toundertake a quality-assured UK programme in theirhome country, the final qualification being recognisedby both government and employers. They will alsobenefit from the flexibility of delivery mechanisms andlearning options designed to meet their personalcircumstances.
72 Vision 2020: Global student mobility
Economic value of international educationAs was mentioned at the start of this chapter, internationaleducation is becoming an increasingly significanteconomic sector for many countries. Countries perceivethat, by internationalising their education, they will be ableto reap substantial benefits and improve their globalcompetitiveness. This fact was acknowledged at the mostsenior level in the UK government in 1999, when Tony Blairlaunched the Prime Minister’s Initiative. This specificallyfocuses on long-term relationship-building throughinternational students to advance UK political andeconomic interests.
The forecast growth in global demand for internationaleducation described in this report presents very significantopportunities for the UK. In addition to the direct benefitsto the UK economy, increased numbers of internationalstudents undertaking a UK education will also make a vitalcontribution to the UK’s capacity for research,technological growth and innovation.
And this study shows tremendous opportunity for the UKacross the EU, particularly in the area of postgraduaterecruitment. While in the UK, students from the EUcontribute over £460 million p.a. to the UK economythrough their fee payments and living expenditure.
On the same terms, the total value to the UK economy ofall international HE students by 2020 forecast under theoptimistic scenario could be over £12 billion p.a. (atcurrent prices), compared with nearly £8 billion p.a. in thebase scenario. The 2003 value for this is estimated at £3 billion. If the UK is able to respond successfully to thestrategic implications described in this section, all students(international and domestic) will benefit significantly. Theywill have access to a greater range of programmes thatare better resourced, offered through a wider mix ofdelivery modes and at the world’s leading level of quality.
The Prime Ministers’ Initiative:towards a new strategyThe Prime Minister’s Initiative (PMI) has been successful ingrowing the UK’s ability to deliver internationally. It hasprovided an excellent example of how a strategic and co-ordinated approach to delivering a total programme atthe national level can succeed.
It was launched against a backdrop of the UK losing marketshare to the other MESDCs. Much of this erosion in theUK’s position had been due to rapid Australian growthacross Asia, plus the entrance of Canada and New Zealandtargeting similar markets. However, with efforts associatedwith the PMI since 1999, reinforced by a strong marketingdrive from UK institutions, change has occurred. The UKwould seem to have increased market share significantly in2003 – although figures for all countries for 2003 have yetto be made public.
The key activities that have most contributed to success todate included:
� The Education UK brand underpinning a worldwidemarketing campaign: This has successfully contributedto global awareness of the quality and accessibility ofUK education.
� Increasing the UK’s marketing, counselling andinformation capacity through initiatives such as thedevelopment of the Education UK website: There arenow over 4 million visitors each year to the central sitethat hosts a database of some 500,000 courses.
� The creation of strategic initiatives overseas insupport of the campaign: Most notably, these includedthe Real UK campaign, the International Student Awardsand the Independent School’s Council awards.
� Changes in visa and right to work policies: Morestudent-friendly visa and right to work policies havebeen established. However, the impact of the former hasbeen somewhat eroded recently by the introduction ofnew charges and EU residency permits.
� Central co-ordination: The Department for Educationand Skills in London successfully coordinated and drewtogether a variety of government departments,devolved administrations and other interested bodies.
� UK institutions were able to take advantage of the newoperating environment provided in the UK and investstrategically in marketing and related activities.
� The British Council was able to adopt a more cohesiveand proactive approach to marketing globally withstrategic education-marketing activity becoming apriority in all key markets.
P267 market research AW 19/9/05 2:45 pm Page 72

Appendix A:References
74 Vision 2020: Global student mobility
Capitalising on the benefitsIn considering future policy to capitalise on the benefits ofthe forecast market developments and to combatincreasing competition, the following factors need to beconsidered:
� The risk of not responding The pessimistic scenarioanalysis demonstrates clearly how UK market sharemight collapse. The key implications of the results arethat the UK must:
– ensure the quality image of UK education ismaintained above all
– promote the enhanced employability of UK alumni in the global labour market
– invest strategically to capitalise on the successesachieved recently.
� Pricing UK education internationally The analysis ofthe price escalation scenario indicates that the impactof a sudden price rise for UK education and training maynot prove as serious as previously considered. This isbecause UK education is recognised internationally forits quality and the enhanced employment prospectsassociated with its qualifications. In a global marketwhere demand currently appears to be running ahead ofthe supply of study places, affordability becomesrelatively less important for many intending students, i.e.there is still sufficient demand to fill the places availableat the higher prices.
The net impact of this is likely to be an increasedperception of the quality of UK provision. However, thisinfluence is likely to be only short lived, given the rapidgrowth in information available through the web and thehigh rate of usage of this by students.
As a consequence of the above analysis, should UKinstitutions increase their prices? The answer is notstraightforward given the dynamism of the market, therapid growth in competition (including new entrants witha strong reputation for quality) and the increasing driveof many countries to improve their own quality position.There might be short-term gains for some providers butthe overall consequences for the UK in the mid- to long-term are likely to be negative.
Realising opportunity: implications for future policy
1 The UK international education industry needs aconcerted national approach led by a clearstrategic vision that directly engages with UK HEinstitutions to reflect their needs and constraintsand facilitates their collaboration.
2 Investment is essential, to:
– refresh, develop and reposition the EducationUK brand to underpin a marketing strategywith the following aims: combatting increasing competition; conclusively demonstrating that a UK qualification is a better investment than that provided by competitor countries; and ensuring key messages of quality, value and relevance reach a wider audience
– develop and grow the UK’s position in TNE
– develop and build long-term sustainablerelationships with those who have experienced aUK education
– form new alliances and partnerships
– establish strategies to provide the physical andhuman resources necessary to deliver.
3 Assuring quality is vital, and this needs to encompassall education providers active in delivering in or fromthe UK.
4 Institution-wide strategies should be put in place toembed internationalism and its benefits across allparts of the organisation.
Meeting the needs of international students:
If the UK is able to respond successfully to all theabove implications, all students (international anddomestic) will benefit significantly. They will haveaccess to a greater range of programmes that arebetter resourced, offered through a wider and moreflexible mix of delivery modes and at the world’sleading level of quality.
P267 market research AW 19/9/05 2:45 pm Page 74
76 Vision 2020: Global student mobility 77Appendix A: references
StatisticsAustralian Education International, 2002, Overseas StudentStatistics 2000, Ausinfo, Canberra
Australian Education International, 2004, Final InternationalStudent Numbers 2003. Available athttp://aei.dest.gov.au/general/stats/StudentVisaData/RecentAnnualData/RecentData.htm
Canadian Bureau for International Education (CBIE), 2002,The National Report on International Students in Canada,2000/01, CBIE
Canadian Bureau for International Education (CBIE), 2000,The National Report on International Students in Canada,1998/99, CBIE
Davis, T.M., 2003, Atlas of Student Mobility, Institute ofInternational Education
Department of Education, Science and Training, Australia,2002, Higher Education Statistics Collection 2001 and2002, www.dest.gov.au [Customised data file]
Higher Education Statistics Agency (HESA), UK, 2002,Students in UK Higher Education Institutions 2001/2, HESA[Customised data file]
Higher Education Statistics Agency (HESA), UK, 2003,Students in UK Higher Education Institutions 2002/3, HESA[Customised data file]
IDP Education Australia, 2002a and 2002b, InternationalStudents in Australian Universities, Semester 1 and 2, 2002,www.idp.com (unpublished)
IDP Education Australia, 2003a and 2003b, InternationalStudents in Australian Universities, Semester 1 and 2, 2003,www.idp.com (unpublished)
Institute of International Education (IIE), 2002, Open Doors2002, Report on International Educational Exchange, IIE
Institute of International Education (IIE), 2003, Open Doors2003, Report on International Educational Exchange, IIE
Ministry of Education (MOE), New Zealand, 2001, ForeignFee-Paying Students in New Zealand: Trends. Available onMinistry of Education website at www.minedu.govt.nz/index.cfm?layout=document&documentid=7641&indexid=6671&indexparentid=6663
Ministry of Education (MOE), New Zealand, 2003, TertiaryStatistics, Available on Ministry of Education website atwww.minedu.govt.nz/index.cfm?layout=index&indexid=1051&indexparentid=1028
UNESCO, 1998, UNESCO Statistical Yearbook 1998, UNESCOPublishing/Bernan Press
UNESCO, 2001, World Education Report 2000 – EducationIndicators, Available from the UNESCO website,www.unesco.org/education/information/wer/htmlENG/tablesmenu.htm
UNESCO Institute for Statistics, 2002, Education Statistics,www.uis.unesco.org/ev.php?URL_ID=5187&URL_DO=DO_TOPIC&URL_SECTION=201
UKCOSA: Council for International Education, 2003, HigherEducation Statistics, Available on UKCOSA website atwww.ukcosa.org.uk/pages/hestats.htm
International education researchAustralian Education International (AEI), 2001, PositioningAustralian Education and Training into the Future: A reporton the Findings of Australian Education and TrainingOffshore, Department of Education, Science and Training,Canberra, Australia
Bohm, A., and King, R., 1999, Positioning AustralianInstitutions for the Future: An analysis of the internationaleducation markets in the People’s Republic of China, IDPEducation Australia
Bohm, A., and Chaudhri, D., 2000, Securing Australia’s Future:An Analysis of the International Education Markets in India
British Council, 1999, The Brand Report, available atwww.britishcouncil.org/ecs/report199909/summary.htm
Doorbar, A. and Associates, 2001, The Asian Student of2000, EduWorld
IDP Education Australia, 2001, Transnational Education:Australia Online: Critical Factors for Success
IDP Education Australia (IDP) and Australian EducationInternational (AEI), 2001, Comparative Costs of HigherEducation Courses for International Students in Australia,New Zealand, the United Kingdom, Canada and the UnitedStates.
IDP Education Australia, 2002, Global Student Mobility2025: Forecasts of the Global Demand for InternationalHigher Education
King, R., 2003, ‘The Rise and Regulation of For-ProfitHigher Education’, Observatory on Borderless HigherEducation, December 2003
Lawley, M. and Blight, D., 1998, Reasons for Choice of anOverseas Study Destination, IDP Education Australia
Planning and Research Branch, 2003, Factors InfluencingStudent Choice of Australia as a Study Destination, IDPEducation Australia.
Reports used for the development of global scenarios:Auer, P. and Fortuny, M., 2000, Employment Paper 2000/02:Ageing of the Labour Force in OECD Countries: Economicand Social Consequences, Employment Sector,International Labour Office, Geneva.
Barland, J., Dawkins, P., Johnson, D. and Williams, R., 2000,Returns on Investment in Higher Education, University ofMelbourne, Melbourne.
Citizenship and Immigration Canada, available atwww.cic.gc.ca/english/index.html
Cobb-Clark, D. and Chapman, B.J., 1999, The ChangingPatterns of Immigrants Labour Market Experiences,Department of Immigration Multicultural and IndigenousAffairs, Canberra.
Commonwealth of Australia’s Department of Employmentand Workplace Relations, 2003, National and State SkillShortages Lists, Australia, 2003.
Department of Labour of New Zealand, 2001, OccupationalTrends in New Zealand 1991–2001.
European Commision, Eurostat, 2001, Long-term MigrationScenarios for the European Economic Area, Office forOfficial Publications of the European Communities,Luxembourg.
European Commision, Eurostat, 2003, National andRegional Trends in the Labour Force in the European Union1985–2050, Office for Official Publications of the EuropeanCommunities, Luxembourg.
Feridhanusetyawan, T. and Stahl, C., 1999, The Impact ofTrade Liberalisation on Labour Markets in the Asia PacificRegion, Centre for International Studies, Jakarta andCentre for Asia Pacific Social Transformation Studies,University of Newcastle, Australia.
Findlay, A., 2001, ‘From Brain Gain to Brain Gain: PolicyImplications for the UK of Recent Trends in SkilledMigration from Developing Countries’, InternationalMigration Papers, International Migration Branch,International Labour Office, Geneva.
Guest, R. and McDonald, I., 2002, Prospective DemographicChange and Australia’s Policy Agenda for the 21st Century,School of Accounting and Finance, Griffith University,Australia and National Australian Bank Professor ofEconomics, University of Melbourne.
International Labour Organization, January 2003, GlobalEmployment Trends, International Labour Office, Geneva.
Kent, M. and Mather, M., December 2002, What Drives U.S.Population Growth?, US Population Reference Bureau.
Lewis, P.E.T., 2002, ‘The New Economy and the Demand forSkills’, Discussion Paper Series 01/2, The Centre for LabourMarket Research, Murdoch University.
Lowel, B.L. and Findlay, A.M., October 2001, Migration ofHighly Skilled Persons from Developing Countries: Impactsand Policy Responses, Synthesis Report, Report preparedfor International Labour Office, Geneva, Department forInternational Development, United Kingdom.
Lowell, B.L., 2002, Skilled Temporary and PermanentImmigrants into the United States, Metropolis Project,Vancouver Centre of Excellence, Vancouver.
Lowell, B.L., 2001, Some Developmental Effects on theInternational Migration of High Skilled Persons, InternationalMigration Branch, International Labour Office, Geneva.
Martin, P. and Midgley, E., June 2003, Immigration: Shapingand reshaping America, US’ Population Reference Bureau,Washington.
McDonald, P., 2002, The Ageing Population in Australia:Demographic Projections and the Case for a PopulationPolicy, Demography and Sociology Program, ResearchSchool of Social Sciences, Australian National University.
Martin, P., 2003, Sustainable Migration Policies in aGlobalising World, International Institute for Labour Studies,Geneva.
New Zealand Immigration Service, available atwww.immigration.govt.nz/
OECD, 2003, Migration and the Labour Market in Asia-Recent Trends and Policies, Japan institute of Labour,Japan.
OECD, 2002, Measuring the Information Economy.
Scetagne, S., 1971, Building Bridges Across Generations inthe Workplace – A response to the Ageing of the Workforce,Canadian Council on Social Development, Vancouver.
UK’s National Statistics, 2003, Labour Market Trends,Report Volume 111, Number 8, August 2003.
UK’s Immigration and Nationality Directorate, available atwww.ind.homeoffice.gov.uk
US’ Bureau of Citizenship and Immigration Services,available at www.immigration.gov
United Nations, 2002, International Migration 2002,Department of Economic and Social Affairs, New York.
United Nations, 2000, World Population Prospects: The2000 Review, Population Division of the Department ofEconomic and Social Affairs, United Nations, New York.
Wickramasekera, P., 2000, ‘Asian Labour Migration: Issuesand Challenges in the Era of Globalization’, InternationalMigration Papers, International Migration Programme,International Labour Office, Geneva.
P267 market research AW 19/9/05 2:45 pm Page 76

Appendix B:Regional groupings of countries
78 Vision 2020: Global student mobility
Other documents and articlesUK’s Prime Minister Initiative, available atwww.britishcouncil.org/promotion/pmi.htm
The Higher Education Supplement, 2003, “Coalition Ralliesfor Fight”, 5/9/2003, available atwww.thes.co.uk/current_edition/story.asp?fksp=1&id=48131
European Union Web site, available at www.europa.eu.intand EU at a Glance, available atwww.europa.eu.int/abc/index_en.htm#
The Observatory on Borderless Higher Education, 2002,Survey of 2002 Breaking News, available atwww.obhe.ac.uk/products/reports/pdf/April2003.pdf
The Observatory on Borderless Higher Education, 2003,“China announces signing of new regulations on foreignproviders and Nottingham University opens firstinternational branch campus in China”, Breaking NewsArticle, 11th April 2003.
Skilled migration into the UK, available atwww.ind.homeoffice.gov.uk/default.asp?pageid=2769 andwww.ind.homeoffice.gov.uk/default.asp?pageID=2757
Student visas programme into the UK, available atwww.ind.homeoffice.gov.uk/default.asp?pageid=737
Visa programmes into the UK, available atwww.ukvisas.gov.uk
Quality assurance arrangements including in transnationaleducation, available at www.qaa.ac.uk
Higher Education Policy Institute (HEPI), 2003, Demand forUK Higher Education to 2010: Some Political and PolicyImplications. HEPI Report Summary 4. Available atwww.hepi.ac.uk/articles/docs/hedemand.doc
P267 market research AW 19/9/05 2:45 pm Page 78
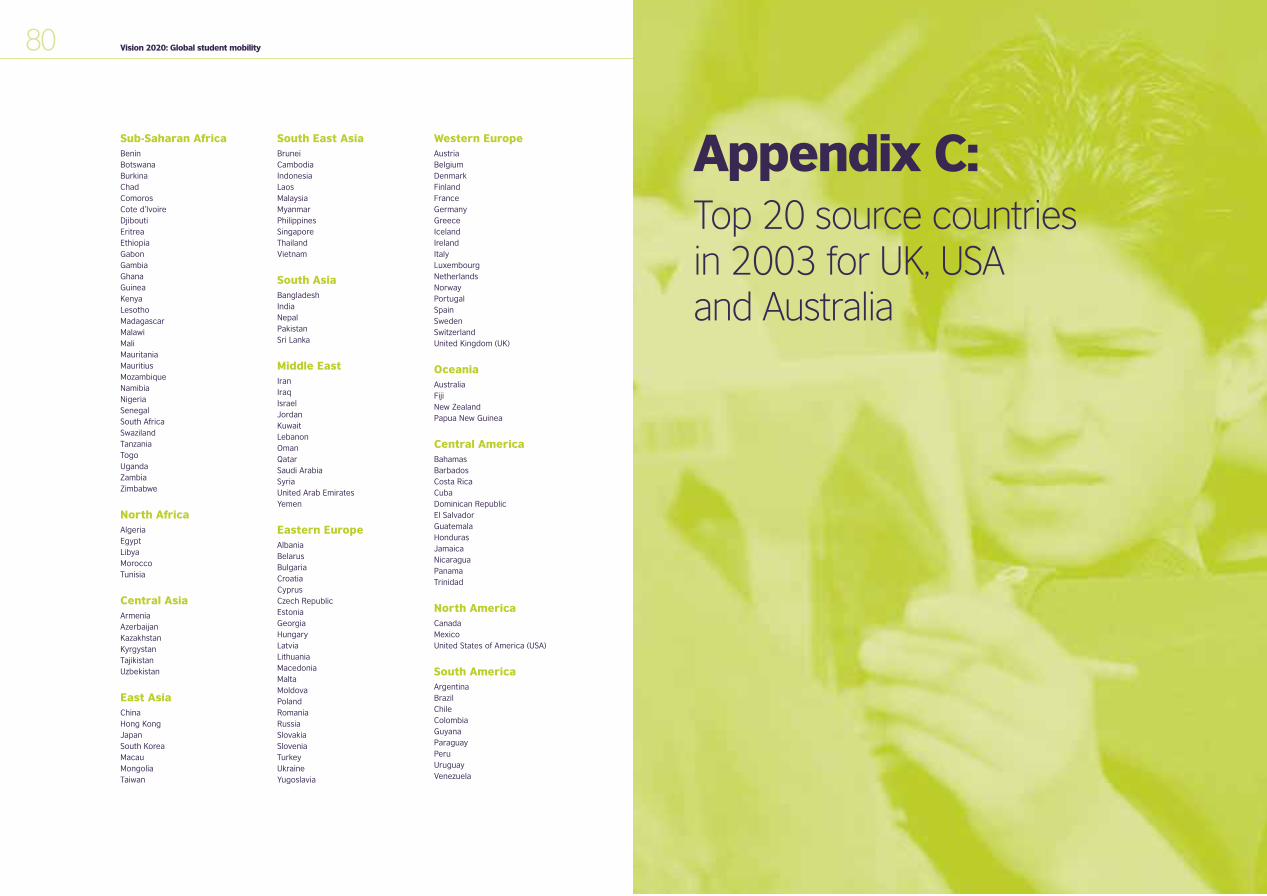
Appendix C:Top 20 source countriesin 2003 for UK, USA and Australia
80 Vision 2020: Global student mobility
Sub-Saharan AfricaBeninBotswanaBurkinaChadComorosCote d’IvoireDjiboutiEritreaEthiopiaGabonGambiaGhanaGuineaKenyaLesothoMadagascarMalawiMaliMauritaniaMauritiusMozambiqueNamibiaNigeriaSenegalSouth AfricaSwazilandTanzaniaTogoUgandaZambiaZimbabwe
North AfricaAlgeriaEgyptLibyaMoroccoTunisia
Central AsiaArmeniaAzerbaijanKazakhstanKyrgystanTajikistanUzbekistan
East AsiaChinaHong KongJapanSouth KoreaMacauMongoliaTaiwan
South East AsiaBruneiCambodiaIndonesiaLaosMalaysiaMyanmarPhilippinesSingaporeThailandVietnam
South AsiaBangladeshIndiaNepalPakistanSri Lanka
Middle EastIranIraqIsraelJordanKuwaitLebanonOmanQatarSaudi ArabiaSyriaUnited Arab EmiratesYemen
Eastern EuropeAlbaniaBelarusBulgariaCroatiaCyprusCzech RepublicEstoniaGeorgiaHungaryLatviaLithuaniaMacedoniaMaltaMoldovaPolandRomaniaRussiaSlovakiaSloveniaTurkeyUkraineYugoslavia
Western EuropeAustriaBelgiumDenmarkFinlandFranceGermanyGreeceIcelandIrelandItalyLuxembourgNetherlandsNorwayPortugalSpainSwedenSwitzerlandUnited Kingdom (UK)
OceaniaAustraliaFijiNew ZealandPapua New Guinea
Central AmericaBahamasBarbadosCosta RicaCubaDominican RepublicEl SalvadorGuatemalaHondurasJamaicaNicaraguaPanamaTrinidad
North AmericaCanadaMexicoUnited States of America (USA)
South AmericaArgentinaBrazilChileColombiaGuyanaParaguayPeruUruguayVenezuela
P267 market research AW 19/9/05 2:45 pm Page 80

Appendix D: Base data for the globalforecasting model
82 Vision 2020: Global student mobility
UNITED KINGDOM UNITED STATES AUSTRALIARank Country No. of students Rank Country No. of students Rank Country No. of students
1 China 32,000 1 India 74,603 1 China 16,780
2 Greece 24,200 2 China 64,757 2 Malaysia 12,200
3 USA 14,350 3 South Korea 51,519 3 Hong Kong 9,480
4 Germany 13,750 4 Japan 45,960 4 Indonesia 8,890
5 France 13,000 5 Taiwan 28,017 5 Singapore 8,690
6 Irish Republic 12,700 6 Canada 26,513 6 India 8,380
7 India 10,900 7 Mexico 12,801 7 USA 5,530
8 Malaysia 10,200 8 Turkey 11,601 8 Thailand 4,170
9 Hong Kong* 9,700 9 Indonesia 10,432 9 Norway 3,260
10 Spain 7,600 10 Thailand 9,982 10 South Korea 3,130
11 Gulf States** 6,450 11 Germany 9,302 11 Taiwan 2,860
12 Japan 6,150 12 Brazil 8,388 12 Japan 2,644
13 Italy 6,050 13 UK 8,326 13 Vietnam 1,930
14 Taiwan 4,900 14 Pakistan 8,123 14 Bangladesh 1,920
15 Singapore 4,150 15 Hong Kong 8,076 15 Sri Lanka 1,720
16 Nigeria 4,100 16 Kenya 7,862 16 Canada 1,695
17 Sweden 3,750 17 Colombia 7,771 17 Germany 1,625
18 Cyprus 3,750 18 France 7,223 18 UK 1,540
19 Canada 3,650 19 Malaysia 6,595 19 Sweden 1,405
20 Norway 3,600 20 Russia 6,238 20 Kenya 895
Actual numbers from HESA data, not global forecasting model projections* Hong Kong data presented separately for historical comparison purposes** Includes Saudi Arabia
P267 market research AW 19/9/05 2:45 pm Page 82
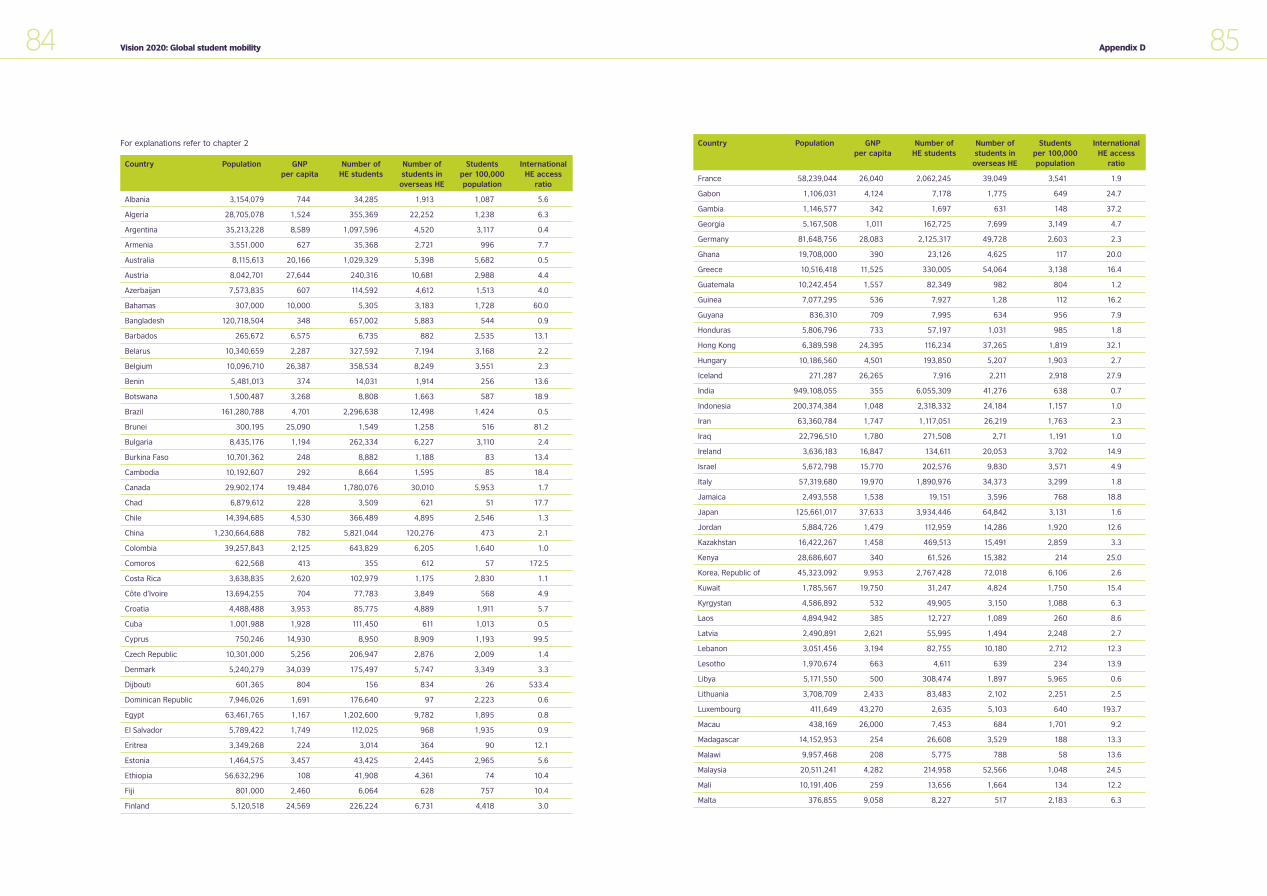
84 Vision 2020: Global student mobility 85Appendix D
Country Population GNP Number of Number of Students Internationalper capita HE students students in per 100,000 HE access
overseas HE population ratio
Albania 3,154,079 744 34,285 1,913 1,087 5.6
Algeria 28,705,078 1,524 355,369 22,252 1,238 6.3
Argentina 35,213,228 8,589 1,097,596 4,520 3,117 0.4
Armenia 3,551,000 627 35,368 2,721 996 7.7
Australia 8,115,613 20,166 1,029,329 5,398 5,682 0.5
Austria 8,042,701 27,644 240,316 10,681 2,988 4.4
Azerbaijan 7,573,835 607 114,592 4,612 1,513 4.0
Bahamas 307,000 10,000 5,305 3,183 1,728 60.0
Bangladesh 120,718,504 348 657,002 5,883 544 0.9
Barbados 265,672 6,575 6,735 882 2,535 13.1
Belarus 10,340,659 2,287 327,592 7,194 3,168 2.2
Belgium 10,096,710 26,387 358,534 8,249 3,551 2.3
Benin 5,481,013 374 14,031 1,914 256 13.6
Botswana 1,500,487 3,268 8,808 1,663 587 18.9
Brazil 161,280,788 4,701 2,296,638 12,498 1,424 0.5
Brunei 300,195 25,090 1,549 1,258 516 81.2
Bulgaria 8,435,176 1,194 262,334 6,227 3,110 2.4
Burkina Faso 10,701,362 248 8,882 1,188 83 13.4
Cambodia 10,192,607 292 8,664 1,595 85 18.4
Canada 29,902,174 19,484 1,780,076 30,010 5,953 1.7
Chad 6,879,612 228 3,509 621 51 17.7
Chile 14,394,685 4,530 366,489 4,895 2,546 1.3
China 1,230,664,688 782 5,821,044 120,276 473 2.1
Colombia 39,257,843 2,125 643,829 6,205 1,640 1.0
Comoros 622,568 413 355 612 57 172.5
Costa Rica 3,638,835 2,620 102,979 1,175 2,830 1.1
Côte d’Ivoire 13,694,255 704 77,783 3,849 568 4.9
Croatia 4,488,488 3,953 85,775 4,889 1,911 5.7
Cuba 1,001,988 1,928 111,450 611 1,013 0.5
Cyprus 750,246 14,930 8,950 8,909 1,193 99.5
Czech Republic 10,301,000 5,256 206,947 2,876 2,009 1.4
Denmark 5,240,279 34,039 175,497 5,747 3,349 3.3
Dijbouti 601,365 804 156 834 26 533.4
Dominican Republic 7,946,026 1,691 176,640 97 2,223 0.6
Egypt 63,461,765 1,167 1,202,600 9,782 1,895 0.8
El Salvador 5,789,422 1,749 112,025 968 1,935 0.9
Eritrea 3,349,268 224 3,014 364 90 12.1
Estonia 1,464,575 3,457 43,425 2,445 2,965 5.6
Ethiopia 56,632,296 108 41,908 4,361 74 10.4
Fiji 801,000 2,460 6,064 628 757 10.4
Finland 5,120,518 24,569 226,224 6,731 4,418 3.0
For explanations refer to chapter 2 Country Population GNP Number of Number of Students Internationalper capita HE students students in per 100,000 HE access
overseas HE population ratio
France 58,239,044 26,040 2,062,245 39,049 3,541 1.9
Gabon 1,106,031 4,124 7,178 1,775 649 24.7
Gambia 1,146,577 342 1,697 631 148 37.2
Georgia 5,167,508 1,011 162,725 7,699 3,149 4.7
Germany 81,648,756 28,083 2,125,317 49,728 2,603 2.3
Ghana 19,708,000 390 23,126 4,625 117 20.0
Greece 10,516,418 11,525 330,005 54,064 3,138 16.4
Guatemala 10,242,454 1,557 82,349 982 804 1.2
Guinea 7,077,295 536 7,927 1,28 112 16.2
Guyana 836,310 709 7,995 634 956 7.9
Honduras 5,806,796 733 57,197 1,031 985 1.8
Hong Kong 6,389,598 24,395 116,234 37,265 1,819 32.1
Hungary 10,186,560 4,501 193,850 5,207 1,903 2.7
Iceland 271,287 26,265 7,916 2,211 2,918 27.9
India 949,108,055 355 6,055,309 41,276 638 0.7
Indonesia 200,374,384 1,048 2,318,332 24,184 1,157 1.0
Iran 63,360,784 1,747 1,117,051 26,219 1,763 2.3
Iraq 22,796,510 1,780 271,508 2,71 1,191 1.0
Ireland 3,636,183 16,847 134,611 20,053 3,702 14.9
Israel 5,672,798 15,770 202,576 9,830 3,571 4.9
Italy 57,319,680 19,970 1,890,976 34,373 3,299 1.8
Jamaica 2,493,558 1,538 19,151 3,596 768 18.8
Japan 125,661,017 37,633 3,934,446 64,842 3,131 1.6
Jordan 5,884,726 1,479 112,959 14,286 1,920 12.6
Kazakhstan 16,422,267 1,458 469,513 15,491 2,859 3.3
Kenya 28,686,607 340 61,526 15,382 214 25.0
Korea, Republic of 45,323,092 9,953 2,767,428 72,018 6,106 2.6
Kuwait 1,785,567 19,750 31,247 4,824 1,750 15.4
Kyrgystan 4,586,892 532 49,905 3,150 1,088 6.3
Laos 4,894,942 385 12,727 1,089 260 8.6
Latvia 2,490,891 2,621 55,995 1,494 2,248 2.7
Lebanon 3,051,456 3,194 82,755 10,180 2,712 12.3
Lesotho 1,970,674 663 4,611 639 234 13.9
Libya 5,171,550 500 308,474 1,897 5,965 0.6
Lithuania 3,708,709 2,433 83,483 2,102 2,251 2.5
Luxembourg 411,649 43,270 2,635 5,103 640 193.7
Macau 438,169 26,000 7,453 684 1,701 9.2
Madagascar 14,152,953 254 26,608 3,529 188 13.3
Malawi 9,957,468 208 5,775 788 58 13.6
Malaysia 20,511,241 4,282 214,958 52,566 1,048 24.5
Mali 10,191,406 259 13,656 1,664 134 12.2
Malta 376,855 9,058 8,227 517 2,183 6.3
P267 market research AW 19/9/05 2:45 pm Page 84
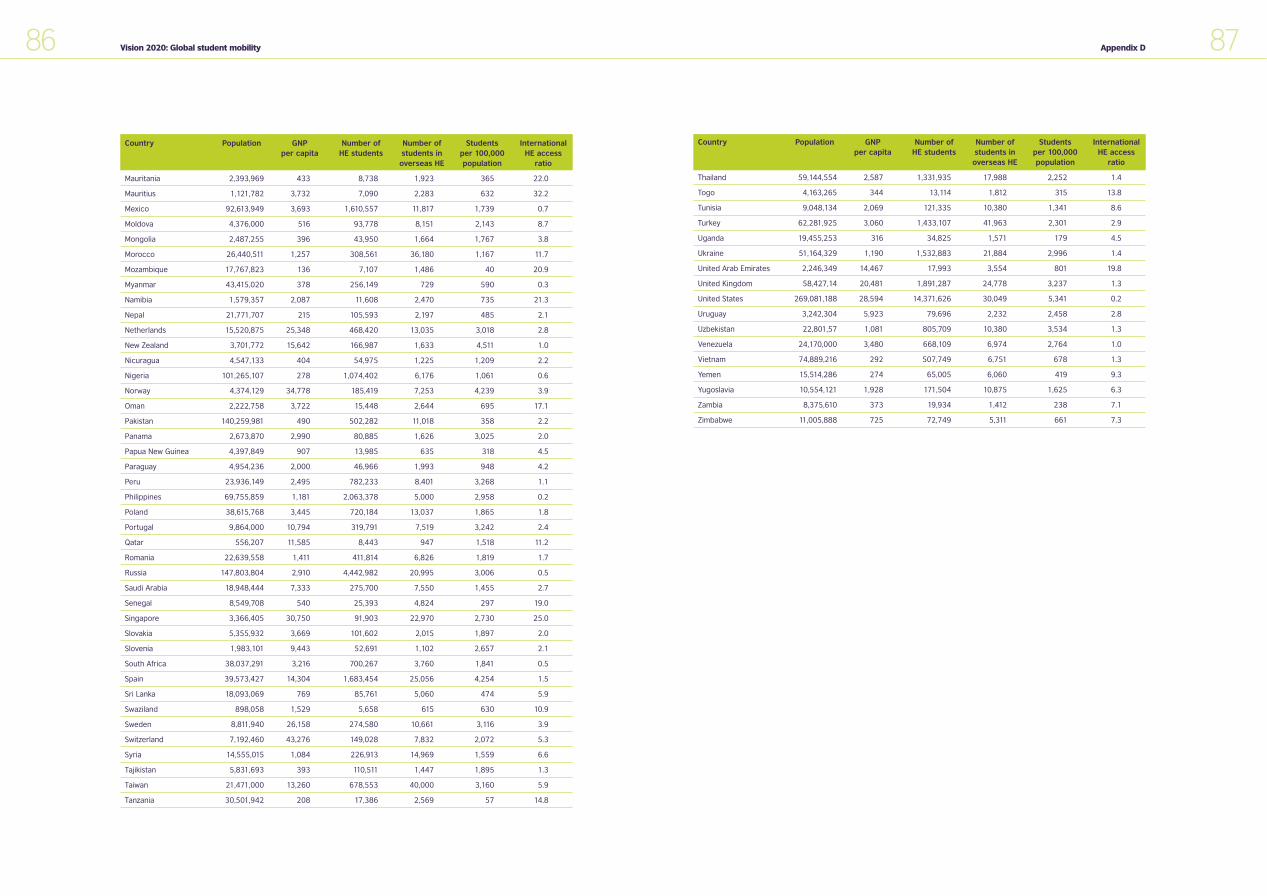
87Appendix D86 Vision 2020: Global student mobility
Country Population GNP Number of Number of Students Internationalper capita HE students students in per 100,000 HE access
overseas HE population ratio
Mauritania 2,393,969 433 8,738 1,923 365 22.0
Mauritius 1,121,782 3,732 7,090 2,283 632 32.2
Mexico 92,613,949 3,693 1,610,557 11,817 1,739 0.7
Moldova 4,376,000 516 93,778 8,151 2,143 8.7
Mongolia 2,487,255 396 43,950 1,664 1,767 3.8
Morocco 26,440,511 1,257 308,561 36,180 1,167 11.7
Mozambique 17,767,823 136 7,107 1,486 40 20.9
Myanmar 43,415,020 378 256,149 729 590 0.3
Namibia 1,579,357 2,087 11,608 2,470 735 21.3
Nepal 21,771,707 215 105,593 2,197 485 2.1
Netherlands 15,520,875 25,348 468,420 13,035 3,018 2.8
New Zealand 3,701,772 15,642 166,987 1,633 4,511 1.0
Nicuragua 4,547,133 404 54,975 1,225 1,209 2.2
Nigeria 101,265,107 278 1,074,402 6,176 1,061 0.6
Norway 4,374,129 34,778 185,419 7,253 4,239 3.9
Oman 2,222,758 3,722 15,448 2,644 695 17.1
Pakistan 140,259,981 490 502,282 11,018 358 2.2
Panama 2,673,870 2,990 80,885 1,626 3,025 2.0
Papua New Guinea 4,397,849 907 13,985 635 318 4.5
Paraguay 4,954,236 2,000 46,966 1,993 948 4.2
Peru 23,936,149 2,495 782,233 8,401 3,268 1.1
Philippines 69,755,859 1,181 2,063,378 5,000 2,958 0.2
Poland 38,615,768 3,445 720,184 13,037 1,865 1.8
Portugal 9,864,000 10,794 319,791 7,519 3,242 2.4
Qatar 556,207 11,585 8,443 947 1,518 11.2
Romania 22,639,558 1,411 411,814 6,826 1,819 1.7
Russia 147,803,804 2,910 4,442,982 20,995 3,006 0.5
Saudi Arabia 18,948,444 7,333 275,700 7,550 1,455 2.7
Senegal 8,549,708 540 25,393 4,824 297 19.0
Singapore 3,366,405 30,750 91,903 22,970 2,730 25.0
Slovakia 5,355,932 3,669 101,602 2,015 1,897 2.0
Slovenia 1,983,101 9,443 52,691 1,102 2,657 2.1
South Africa 38,037,291 3,216 700,267 3,760 1,841 0.5
Spain 39,573,427 14,304 1,683,454 25,056 4,254 1.5
Sri Lanka 18,093,069 769 85,761 5,060 474 5.9
Swaziland 898,058 1,529 5,658 615 630 10.9
Sweden 8,811,940 26,158 274,580 10,661 3,116 3.9
Switzerland 7,192,460 43,276 149,028 7,832 2,072 5.3
Syria 14,555,015 1,084 226,913 14,969 1,559 6.6
Tajikistan 5,831,693 393 110,511 1,447 1,895 1.3
Taiwan 21,471,000 13,260 678,553 40,000 3,160 5.9
Tanzania 30,501,942 208 17,386 2,569 57 14.8
Country Population GNP Number of Number of Students Internationalper capita HE students students in per 100,000 HE access
overseas HE population ratio
Thailand 59,144,554 2,587 1,331,935 17,988 2,252 1.4
Togo 4,163,265 344 13,114 1,812 315 13.8
Tunisia 9,048,134 2,069 121,335 10,380 1,341 8.6
Turkey 62,281,925 3,060 1,433,107 41,963 2,301 2.9
Uganda 19,455,253 316 34,825 1,571 179 4.5
Ukraine 51,164,329 1,190 1,532,883 21,884 2,996 1.4
United Arab Emirates 2,246,349 14,467 17,993 3,554 801 19.8
United Kingdom 58,427,14 20,481 1,891,287 24,778 3,237 1.3
United States 269,081,188 28,594 14,371,626 30,049 5,341 0.2
Uruguay 3,242,304 5,923 79,696 2,232 2,458 2.8
Uzbekistan 22,801,57 1,081 805,709 10,380 3,534 1.3
Venezuela 24,170,000 3,480 668,109 6,974 2,764 1.0
Vietnam 74,889,216 292 507,749 6,751 678 1.3
Yemen 15,514,286 274 65,005 6,060 419 9.3
Yugoslavia 10,554,121 1,928 171,504 10,875 1,625 6.3
Zambia 8,375,610 373 19,934 1,412 238 7.1
Zimbabwe 11,005,888 725 72,749 5,311 661 7.3
P267 market research AW 19/9/05 2:45 pm Page 86
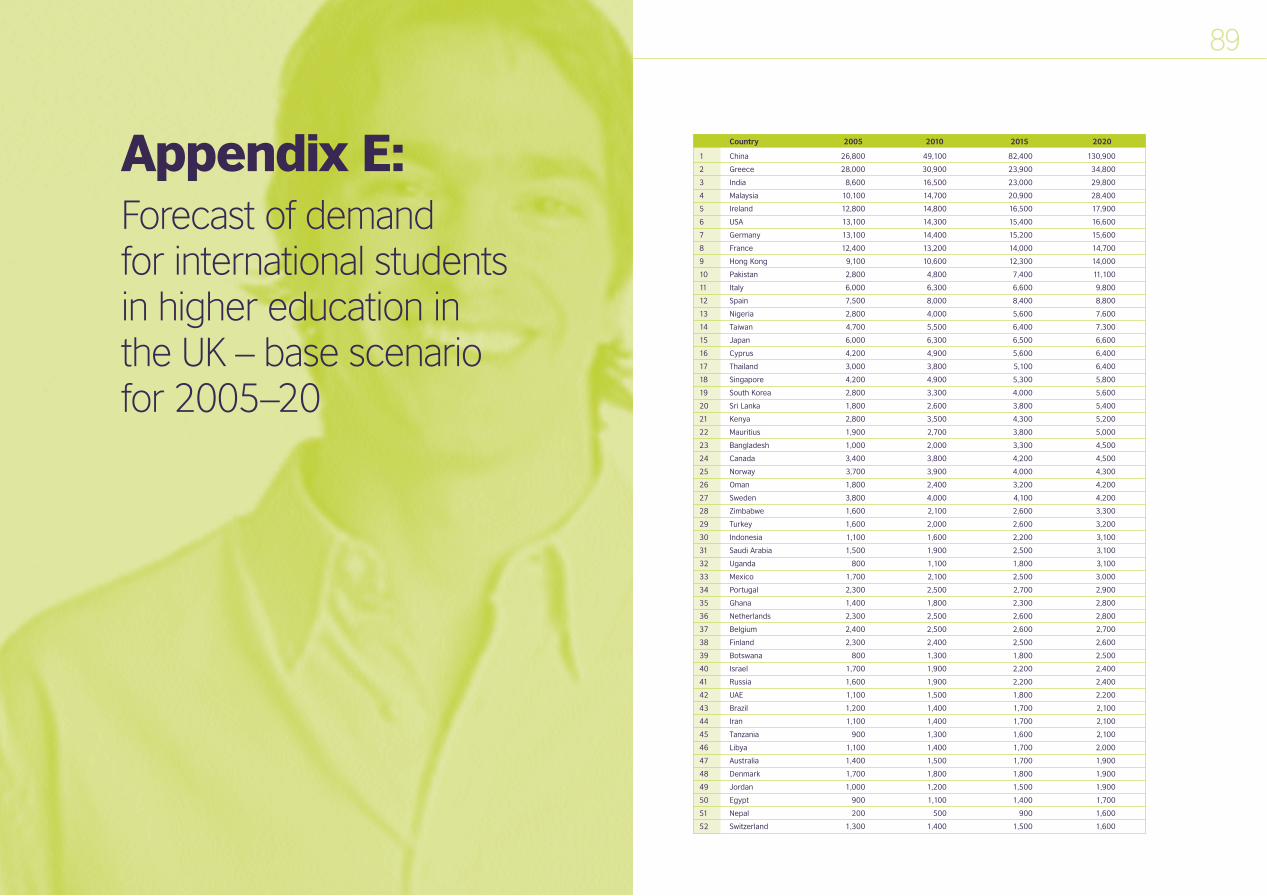
89
Appendix E:Forecast of demand for international studentsin higher education in the UK – base scenario for 2005–20
Country 2005 2010 2015 2020
1 China 26,800 49,100 82,400 130,900
2 Greece 28,000 30,900 23,900 34,800
3 India 8,600 16,500 23,000 29,800
4 Malaysia 10,100 14,700 20,900 28,400
5 Ireland 12,800 14,800 16,500 17,900
6 USA 13,100 14,300 15,400 16,600
7 Germany 13,100 14,400 15,200 15,600
8 France 12,400 13,200 14,000 14,700
9 Hong Kong 9,100 10,600 12,300 14,000
10 Pakistan 2,800 4,800 7,400 11,100
11 Italy 6,000 6,300 6,600 9,800
12 Spain 7,500 8,000 8,400 8,800
13 Nigeria 2,800 4,000 5,600 7,600
14 Taiwan 4,700 5,500 6,400 7,300
15 Japan 6,000 6,300 6,500 6,600
16 Cyprus 4,200 4,900 5,600 6,400
17 Thailand 3,000 3,800 5,100 6,400
18 Singapore 4,200 4,900 5,300 5,800
19 South Korea 2,800 3,300 4,000 5,600
20 Sri Lanka 1,800 2,600 3,800 5,400
21 Kenya 2,800 3,500 4,300 5,200
22 Mauritius 1,900 2,700 3,800 5,000
23 Bangladesh 1,000 2,000 3,300 4,500
24 Canada 3,400 3,800 4,200 4,500
25 Norway 3,700 3,900 4,000 4,300
26 Oman 1,800 2,400 3,200 4,200
27 Sweden 3,800 4,000 4,100 4,200
28 Zimbabwe 1,600 2,100 2,600 3,300
29 Turkey 1,600 2,000 2,600 3,200
30 Indonesia 1,100 1,600 2,200 3,100
31 Saudi Arabia 1,500 1,900 2,500 3,100
32 Uganda 800 1,100 1,800 3,100
33 Mexico 1,700 2,100 2,500 3,000
34 Portugal 2,300 2,500 2,700 2,900
35 Ghana 1,400 1,800 2,300 2,800
36 Netherlands 2,300 2,500 2,600 2,800
37 Belgium 2,400 2,500 2,600 2,700
38 Finland 2,300 2,400 2,500 2,600
39 Botswana 800 1,300 1,800 2,500
40 Israel 1,700 1,900 2,200 2,400
41 Russia 1,600 1,900 2,200 2,400
42 UAE 1,100 1,500 1,800 2,200
43 Brazil 1,200 1,400 1,700 2,100
44 Iran 1,100 1,400 1,700 2,100
45 Tanzania 900 1,300 1,600 2,100
46 Libya 1,100 1,400 1,700 2,000
47 Australia 1,400 1,500 1,700 1,900
48 Denmark 1,700 1,800 1,800 1,900
49 Jordan 1,000 1,200 1,500 1,900
50 Egypt 900 1,100 1,400 1,700
51 Nepal 200 500 900 1,600
52 Switzerland 1,300 1,400 1,500 1,600
P267 market research AW 19/9/05 2:45 pm Page 88
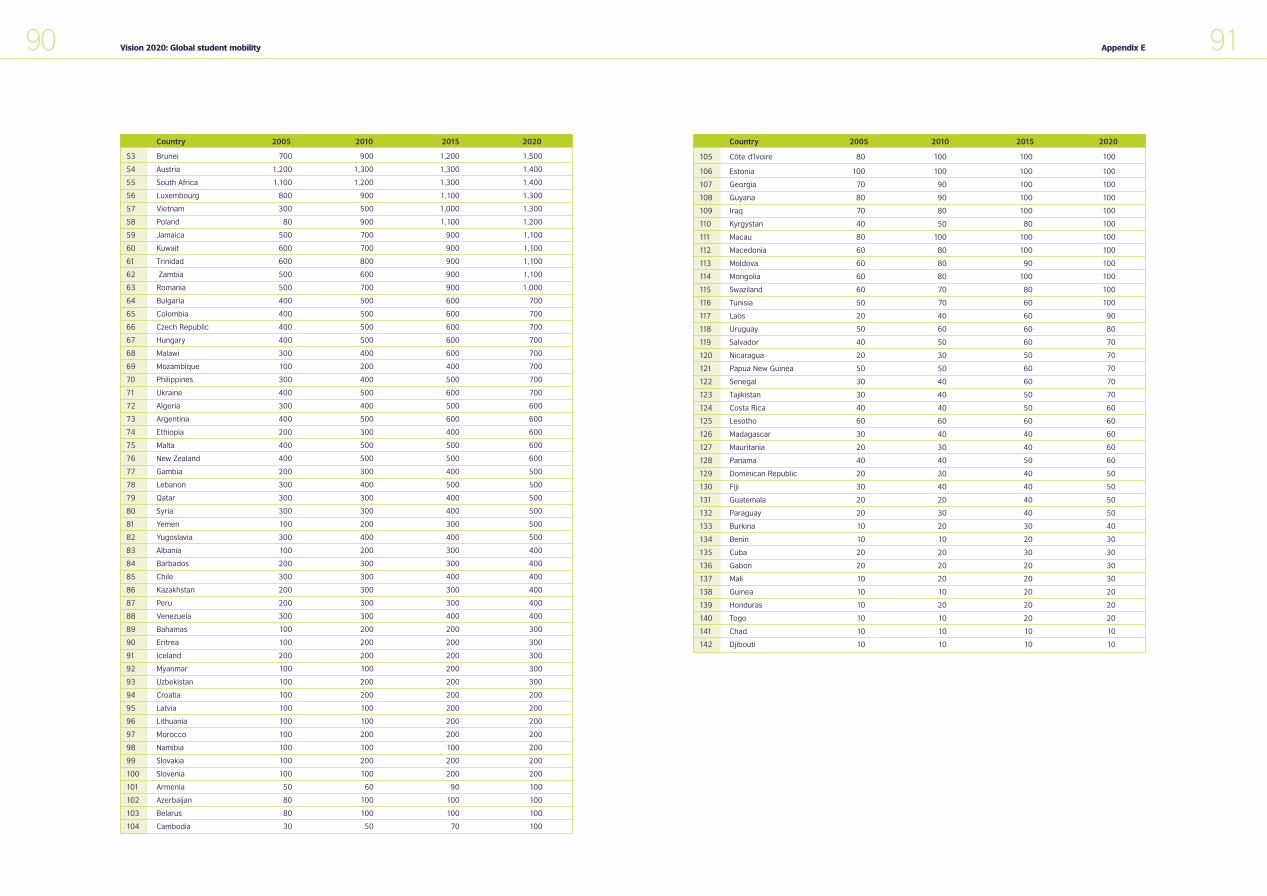
91Appendix E90 Vision 2020: Global student mobility
Country 2005 2010 2015 2020
53 Brunei 700 900 1,200 1,500
54 Austria 1,200 1,300 1,300 1,400
55 South Africa 1,100 1,200 1,300 1,400
56 Luxembourg 800 900 1,100 1,300
57 Vietnam 300 500 1,000 1,300
58 Poland 80 900 1,100 1,200
59 Jamaica 500 700 900 1,100
60 Kuwait 600 700 900 1,100
61 Trinidad 600 800 900 1,100
62 Zambia 500 600 900 1,100
63 Romania 500 700 900 1,000
64 Bulgaria 400 500 600 700
65 Colombia 400 500 600 700
66 Czech Republic 400 500 600 700
67 Hungary 400 500 600 700
68 Malawi 300 400 600 700
69 Mozambique 100 200 400 700
70 Philippines 300 400 500 700
71 Ukraine 400 500 600 700
72 Algeria 300 400 500 600
73 Argentina 400 500 600 600
74 Ethiopia 200 300 400 600
75 Malta 400 500 500 600
76 New Zealand 400 500 500 600
77 Gambia 200 300 400 500
78 Lebanon 300 400 500 500
79 Qatar 300 300 400 500
80 Syria 300 300 400 500
81 Yemen 100 200 300 500
82 Yugoslavia 300 400 400 500
83 Albania 100 200 300 400
84 Barbados 200 300 300 400
85 Chile 300 300 400 400
86 Kazakhstan 200 300 300 400
87 Peru 200 300 300 400
88 Venezuela 300 300 400 400
89 Bahamas 100 200 200 300
90 Eritrea 100 200 200 300
91 Iceland 200 200 200 300
92 Myanmar 100 100 200 300
93 Uzbekistan 100 200 200 300
94 Croatia 100 200 200 200
95 Latvia 100 100 200 200
96 Lithuania 100 100 200 200
97 Morocco 100 200 200 200
98 Namibia 100 100 100 200
99 Slovakia 100 200 200 200
100 Slovenia 100 100 200 200
101 Armenia 50 60 90 100
102 Azerbaijan 80 100 100 100
103 Belarus 80 100 100 100
104 Cambodia 30 50 70 100
Country 2005 2010 2015 2020
105 Côte d’Ivoire 80 100 100 100
106 Estonia 100 100 100 100
107 Georgia 70 90 100 100
108 Guyana 80 90 100 100
109 Iraq 70 80 100 100
110 Kyrgystan 40 50 80 100
111 Macau 80 100 100 100
112 Macedonia 60 80 100 100
113 Moldova 60 80 90 100
114 Mongolia 60 80 100 100
115 Swaziland 60 70 80 100
116 Tunisia 50 70 60 100
117 Laos 20 40 60 90
118 Uruguay 50 60 60 80
119 Salvador 40 50 60 70
120 Nicaragua 20 30 50 70
121 Papua New Guinea 50 50 60 70
122 Senegal 30 40 60 70
123 Tajikistan 30 40 50 70
124 Costa Rica 40 40 50 60
125 Lesotho 60 60 60 60
126 Madagascar 30 40 40 60
127 Mauritania 20 30 40 60
128 Panama 40 40 50 60
129 Dominican Republic 20 30 40 50
130 Fiji 30 40 40 50
131 Guatemala 20 20 40 50
132 Paraguay 20 30 40 50
133 Burkina 10 20 30 40
134 Benin 10 10 20 30
135 Cuba 20 20 30 30
136 Gabon 20 20 20 30
137 Mali 10 20 20 30
138 Guinea 10 10 20 20
139 Honduras 10 20 20 20
140 Togo 10 10 20 20
141 Chad 10 10 10 10
142 Djibouti 10 10 10 10
P267 market research AW 19/9/05 2:45 pm Page 90

00
British Council
10 Spring GardensLondon SW1A 2BN
T +44 (0)20 7930 8466F +44 (0)20 7389 6347
www.britishcouncil.org
Universities UK
Woburn House20 Tavistock SquareLondon WC1H 9HQ
T +44 (0)20 7419 4111F +44 (0)20 7388 8649
www.universitiesuk.org
IDP Education Australia
Level 4210, Clarence StreetSydney, NSW 2000Australia
T +61 2 8251 2700 F +61 2 8251 2728
www.idp.org
© British Council 2004 Design Department/P267/NLP
The United Kingdom’s international organisation for educational opportunities and cultural relations. We are registered in England as a charity.
Forecasting international student mobilitya UK perspective
Vision2020
Anthony BöhmMarcelo FollariAndrew HewettSarah JonesNeil KempDenis MearesDavid PearceKevin Van Cauter
P267 market research cover AW 19/9/05 2:42 pm Page 1