Forced thermal cycling of catalytic reactions: Experiments and modelling
6
Forced thermal cycling of catalytic reactions: Experiments and modelling Søren Jensen a , Jakob L. Olsen b , Sune Thorsteinsson a , Ole Hansen a , Ulrich J. Quaade b, * a MIC – Department of Micro and Nanotechnology, Technical University of Denmark, 2800 Kgs. Lyngby, Denmark b Department of Physics, NanoDTU, Center for Individual Nanoparticle Functionality (CINF), Technical University of Denmark, 2800 Kgs. Lyngby, Denmark Received 25 January 2007; received in revised form 15 March 2007; accepted 20 March 2007 Available online 30 March 2007 Abstract Recent studies of catalytic reactions subjected to fast forced temperature oscillations have revealed a rate enhancement increasing with temperature oscillation frequency. We present detailed studies of the rate enhancement up to frequencies of 2.5 Hz. A maximum in the rate enhancement is observed at about 1 Hz. A model for the rate enhancement that includes the surface kinetics and the dynamic partial pressure variations in the reactor is introduced. The model predicts a levelling off of the rate enhancement with frequency at about 1 Hz. The experimentally observed decrease above 1 Hz is explained by dynamic thermal limitations of the reactor. Ó 2007 Elsevier B.V. All rights reserved. PACS: 82.65.+r; 82.65.s; 82.40.Bj Keywords: Microreactor; Catalysis; Temperature cycling 1. Introduction Unsteady-state processing has long been recognized as an important way to improve the performance of physical and chemical processes [1], organic [2] as well as inorganic, catalytic as well as non-catalytic [3]. The improved performance can be in the form of stabilization of sponta- neously oscillatory systems [4], increase of reaction rates, and improvement of selectivities. The improvements are obtained by periodically varying the reactant concentra- tions/flow rates [5], pressure [6], or the reaction tempera- ture [7]. For catalytic reactions, the improvements in many cases stem from a periodic removal of inhibiting spe- cies that build up on the catalyst surface over time. As an example, periodic variation of the feed composition during ammonia synthesis has resulted in a 5–50 fold production rate increase [8]. Temperature oscillations affect the time-averaged reac- tion rate. At low frequencies, the reaction rates during oscillation are equal to the ones found during steady state operation at the same temperatures, and the time-averaged rate is the so-called quasi steady-state rate, r QSS . At very high (MHz) frequencies, where the characteristic time con- stants for the surface processes are larger than the oscilla- tion period, the adsorbed species on the surface will only experience the average temperature of the oscillation, and the time-averaged rate is the so-called relaxed steady-state rate, r RSS . Depending on the exact nature of the reaction, there are possibilities for rate enhancement at intermediate frequencies. By numerical solution of a Langmuir–Hin- schelwood reaction scheme for a catalytic system subjected to forced temperature oscillations, rate enhancement ascribed to dissimilar adsorption/desorption dynamics of the species involved has been observed for a certain range of kinetic parameters [9]. The effects of temperature oscillations on oxidation of CO over platinum have been studied experimentally in 1566-7367/$ - see front matter Ó 2007 Elsevier B.V. All rights reserved. doi:10.1016/j.catcom.2007.03.026 * Corresponding author. E-mail address: [email protected] (U.J. Quaade). www.elsevier.com/locate/catcom Available online at www.sciencedirect.com Catalysis Communications 8 (2007) 1985–1990
Transcript of Forced thermal cycling of catalytic reactions: Experiments and modelling
Available online at www.sciencedirect.com
www.elsevier.com/locate/catcom
Catalysis Communications 8 (2007) 1985–1990
Forced thermal cycling of catalytic reactions:Experiments and modelling
Søren Jensen a, Jakob L. Olsen b, Sune Thorsteinsson a, Ole Hansen a, Ulrich J. Quaade b,*
a MIC – Department of Micro and Nanotechnology, Technical University of Denmark, 2800 Kgs. Lyngby, Denmarkb Department of Physics, NanoDTU, Center for Individual Nanoparticle Functionality (CINF),
Technical University of Denmark, 2800 Kgs. Lyngby, Denmark
Received 25 January 2007; received in revised form 15 March 2007; accepted 20 March 2007Available online 30 March 2007
Abstract
Recent studies of catalytic reactions subjected to fast forced temperature oscillations have revealed a rate enhancement increasing withtemperature oscillation frequency. We present detailed studies of the rate enhancement up to frequencies of 2.5 Hz. A maximum in therate enhancement is observed at about 1 Hz. A model for the rate enhancement that includes the surface kinetics and the dynamic partialpressure variations in the reactor is introduced. The model predicts a levelling off of the rate enhancement with frequency at about 1 Hz.The experimentally observed decrease above 1 Hz is explained by dynamic thermal limitations of the reactor.� 2007 Elsevier B.V. All rights reserved.
PACS: 82.65.+r; 82.65.s; 82.40.Bj
Keywords: Microreactor; Catalysis; Temperature cycling
1. Introduction
Unsteady-state processing has long been recognized asan important way to improve the performance of physicaland chemical processes [1], organic [2] as well as inorganic,catalytic as well as non-catalytic [3]. The improvedperformance can be in the form of stabilization of sponta-neously oscillatory systems [4], increase of reaction rates,and improvement of selectivities. The improvements areobtained by periodically varying the reactant concentra-tions/flow rates [5], pressure [6], or the reaction tempera-ture [7]. For catalytic reactions, the improvements inmany cases stem from a periodic removal of inhibiting spe-cies that build up on the catalyst surface over time. As anexample, periodic variation of the feed composition duringammonia synthesis has resulted in a 5–50 fold productionrate increase [8].
1566-7367/$ - see front matter � 2007 Elsevier B.V. All rights reserved.
doi:10.1016/j.catcom.2007.03.026
* Corresponding author.E-mail address: [email protected] (U.J. Quaade).
Temperature oscillations affect the time-averaged reac-tion rate. At low frequencies, the reaction rates duringoscillation are equal to the ones found during steady stateoperation at the same temperatures, and the time-averagedrate is the so-called quasi steady-state rate, rQSS. At veryhigh (MHz) frequencies, where the characteristic time con-stants for the surface processes are larger than the oscilla-tion period, the adsorbed species on the surface will onlyexperience the average temperature of the oscillation, andthe time-averaged rate is the so-called relaxed steady-staterate, rRSS. Depending on the exact nature of the reaction,there are possibilities for rate enhancement at intermediatefrequencies. By numerical solution of a Langmuir–Hin-schelwood reaction scheme for a catalytic system subjectedto forced temperature oscillations, rate enhancementascribed to dissimilar adsorption/desorption dynamics ofthe species involved has been observed for a certain rangeof kinetic parameters [9].
The effects of temperature oscillations on oxidation ofCO over platinum have been studied experimentally in
200 nm SiO2
200 nm NiSi30 μm Si 100 μm
Pyrex
10 mm
Inlets OutletMS Interface
Heater
Reaction chamber
Thermometercontacts
Front Rear
320 μm
1.5 mm
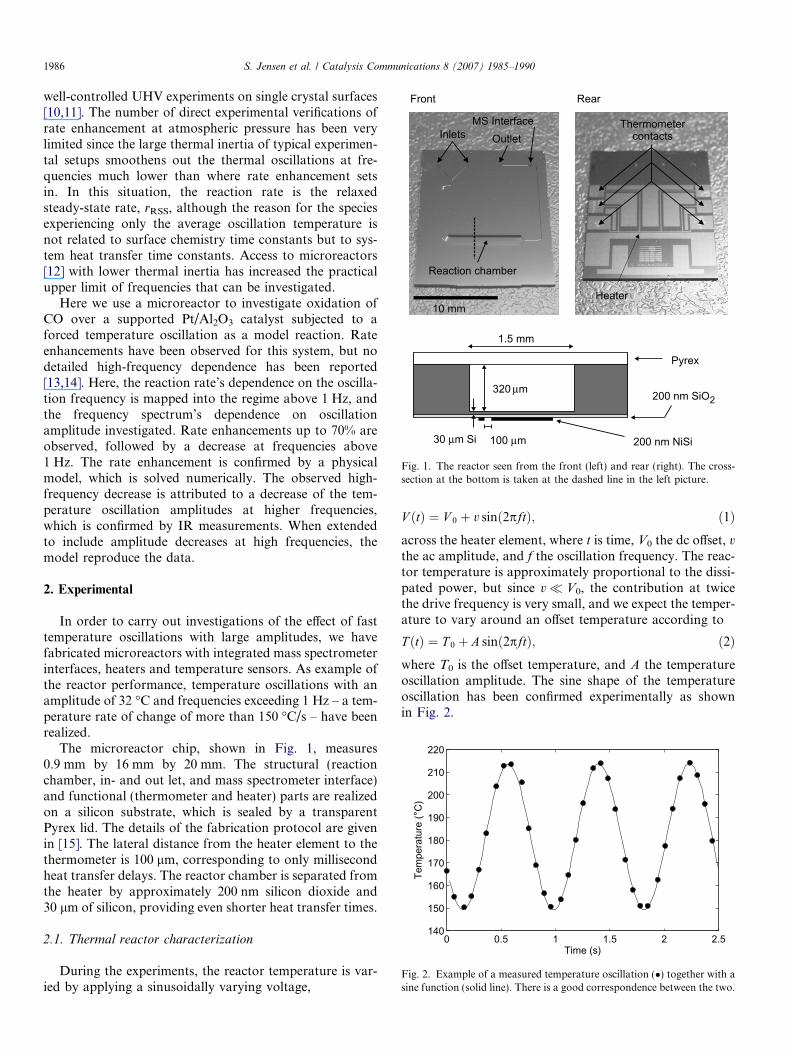
Fig. 1. The reactor seen from the front (left) and rear (right). The cross-section at the bottom is taken at the dashed line in the left picture.
0 0.5 1 1.5 2 2.5140
150
160
170
180
190
200
210
220
Time (s)
Tem
pera
ture
(°C
)
Fig. 2. Example of a measured temperature oscillation (�) together with asine function (solid line). There is a good correspondence between the two.
1986 S. Jensen et al. / Catalysis Communications 8 (2007) 1985–1990
well-controlled UHV experiments on single crystal surfaces[10,11]. The number of direct experimental verifications ofrate enhancement at atmospheric pressure has been verylimited since the large thermal inertia of typical experimen-tal setups smoothens out the thermal oscillations at fre-quencies much lower than where rate enhancement setsin. In this situation, the reaction rate is the relaxedsteady-state rate, rRSS, although the reason for the speciesexperiencing only the average oscillation temperature isnot related to surface chemistry time constants but to sys-tem heat transfer time constants. Access to microreactors[12] with lower thermal inertia has increased the practicalupper limit of frequencies that can be investigated.
Here we use a microreactor to investigate oxidation ofCO over a supported Pt/Al2O3 catalyst subjected to aforced temperature oscillation as a model reaction. Rateenhancements have been observed for this system, but nodetailed high-frequency dependence has been reported[13,14]. Here, the reaction rate’s dependence on the oscilla-tion frequency is mapped into the regime above 1 Hz, andthe frequency spectrum’s dependence on oscillationamplitude investigated. Rate enhancements up to 70% areobserved, followed by a decrease at frequencies above1 Hz. The rate enhancement is confirmed by a physicalmodel, which is solved numerically. The observed high-frequency decrease is attributed to a decrease of the tem-perature oscillation amplitudes at higher frequencies,which is confirmed by IR measurements. When extendedto include amplitude decreases at high frequencies, themodel reproduce the data.
2. Experimental
In order to carry out investigations of the effect of fasttemperature oscillations with large amplitudes, we havefabricated microreactors with integrated mass spectrometerinterfaces, heaters and temperature sensors. As example ofthe reactor performance, temperature oscillations with anamplitude of 32 �C and frequencies exceeding 1 Hz – a tem-perature rate of change of more than 150 �C/s – have beenrealized.
The microreactor chip, shown in Fig. 1, measures0.9 mm by 16 mm by 20 mm. The structural (reactionchamber, in- and out let, and mass spectrometer interface)and functional (thermometer and heater) parts are realizedon a silicon substrate, which is sealed by a transparentPyrex lid. The details of the fabrication protocol are givenin [15]. The lateral distance from the heater element to thethermometer is 100 lm, corresponding to only millisecondheat transfer delays. The reactor chamber is separated fromthe heater by approximately 200 nm silicon dioxide and30 lm of silicon, providing even shorter heat transfer times.
2.1. Thermal reactor characterization
During the experiments, the reactor temperature is var-ied by applying a sinusoidally varying voltage,
V ðtÞ ¼ V 0 þ v sinð2pftÞ; ð1Þacross the heater element, where t is time, V0 the dc offset, v
the ac amplitude, and f the oscillation frequency. The reac-tor temperature is approximately proportional to the dissi-pated power, but since v� V0, the contribution at twicethe drive frequency is very small, and we expect the temper-ature to vary around an offset temperature according to
T ðtÞ ¼ T 0 þ A sinð2pftÞ; ð2Þwhere T0 is the offset temperature, and A the temperatureoscillation amplitude. The sine shape of the temperatureoscillation has been confirmed experimentally as shownin Fig. 2.
S. Jensen et al. / Catalysis Communications 8 (2007) 1985–1990 1987
The temperature in the reactor is measured by measur-ing the four-point resistance of the NiSi thermometer.The resistance of NiSi varies linearly with temperature,and the relation has been calibrated by furnace experi-ments [15]. The temperature is recorded using LabViewsoftware capable of sampling up to 14 times/s. Theapplied voltages are adjusted manually, and it is possibleto realize temperature oscillations within a precision of0.5 �C.
2.2. IR investigations
Prior to the chemical experiment, the reactor’s responseto applied temperature oscillations is investigated using aninfrared camera. The camera measures thermal radiation inthe wavelength interval 7.5 lm < k < 13 lm at a frame rateof 50 s�1. Since the spectral transmissivity of the Pyrex lidis zero for k > 5 lm it is not possible to image the reactorfrom the top, and measurements are therefore performedon the rear of the reactor. A temperature oscillation withan amplitude of 10 �C and an offset of 180 �C, as measuredusing the middle third of the thermometer, is applied, andIR image sequences are recorded at frequencies of 0.01 Hz,0.1 Hz and 1 Hz. The thermometer measurement is moni-tored at all frequencies.
The recorded images show that the average temperatureover the middle third of the thermometer oscillates asexpected. At measurement points 1 mm away from the hea-ter, we note up to 50% amplitude loss and phase lags on theorder of 0.1 s at 1 Hz. The reactor bottom is much closer tothe heater than 1 mm, and the effects inside the reactor areexpected to be less severe. However, since the thermal con-tact from the reactor bottom to the catalyst support is lessthan perfect, we still expect to see some reduction of theoscillation amplitude.
2.3. Catalytic reaction
For investigation of the effects of fast temperaturecycling of catalytic reactions, we study oxidation of COover a supported Pt/Al2O3 catalyst [14],
COþ 1
2O2 ! CO2; ð3Þ
as a model reaction. The feed gas used is a stoichiometricmix of 5% CO and 2.5% O2. In addition, the gas contains2.5% Ar for calibration, since the flow rate through themass spectrometer interface is temperature dependent[16], and the carrier gas is He. With flow rates around1 mL/min, a diffusion coefficient of 6 · 10�5 m2/s, andreactor dimensions given in Fig. 1, the reactor approachesplug flow behaviour with a Bodenstein number between 5and 15, depending on the amount of catalyst occupyingthe reactor volume. The output gas is analyzed using amass spectrometer. Blind-activity measurements in anempty reactor and in one with the support matrix withoutcatalyst show no conversion.
Since the reaction rate depends exponentially on temper-ature, the mean reaction rate during an oscillation periodwill always be larger than the reaction rate at the meantemperature of the period. To measure reaction rateincreases beyond this trivial increase, we calculate a reac-tion rate enhancement,
U ¼ hrðT 0;A; f Þi � rQSSðT 0;AÞrQSSðT 0;AÞ
; ð4Þ
between the measured, time-averaged reaction rate at thefrequency in question, f, and the quasi steady-state rate,rQSS(T0,A). In practice, rQSS(T0,A) is obtained as thetime-averaged rate measured at frequencies where the reac-tor follows steady-state behaviour, typically 10–20 mHz,and with the same amplitude and offset as the fastoscillation.
The measured data is subject to uncertainty due to driftin the system and random fluctuations of e.g. flow control-lers. These effects are minimized by letting the system warmup and by averaging the measured concentrations overtime. By repeated measurements at different constantparameter settings, the uncertainty is estimated to be lessthan 5% in total.
3. Results
The frequency dependence of the reaction rate enhance-ment has been investigated for a number of differentparameter settings [15]. Variations of gas flow rate andtemperature oscillation offset do not change the shape ofthe frequency spectrum curve unless they are accompaniedby substantial changes in the CO conversion. Variations ofthe oscillation amplitude have a large effect at low conver-sion, but only a limited effect at high conversions (>30%).The current investigations are therefore limited to studiesof the frequency spectrum as a function of oscillationamplitude at low conversions (<12%). The experimentsare carried out using a setup similar to the one describedin [15].
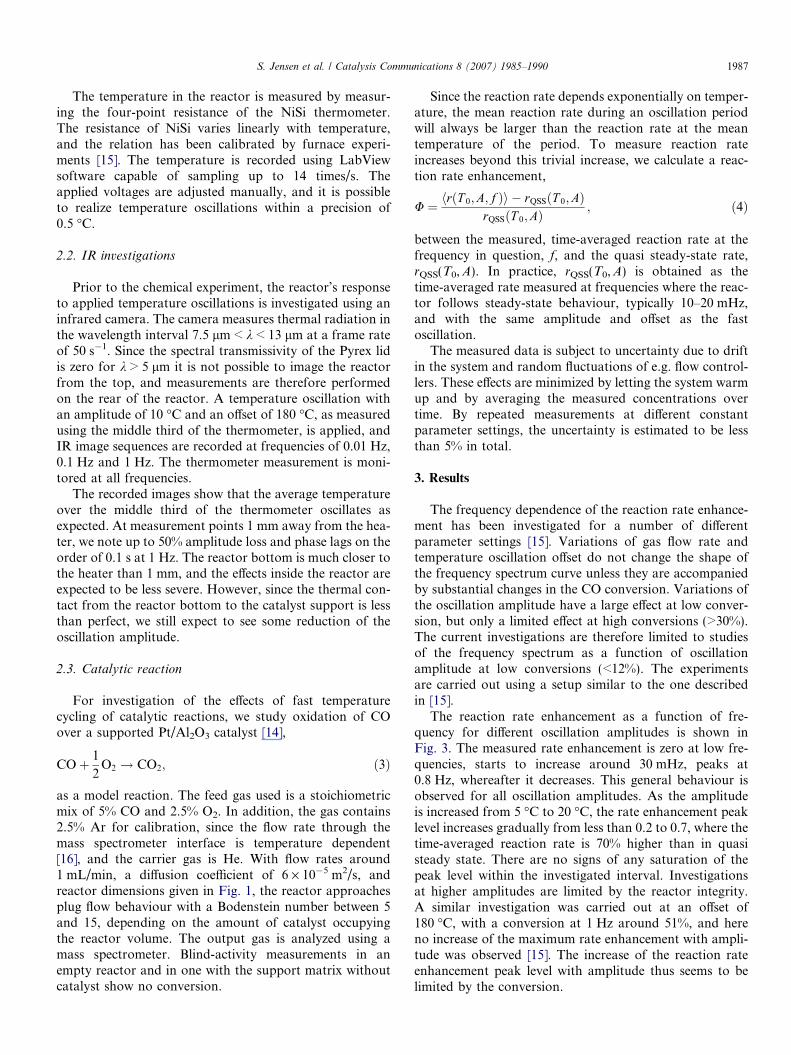
The reaction rate enhancement as a function of fre-quency for different oscillation amplitudes is shown inFig. 3. The measured rate enhancement is zero at low fre-quencies, starts to increase around 30 mHz, peaks at0.8 Hz, whereafter it decreases. This general behaviour isobserved for all oscillation amplitudes. As the amplitudeis increased from 5 �C to 20 �C, the rate enhancement peaklevel increases gradually from less than 0.2 to 0.7, where thetime-averaged reaction rate is 70% higher than in quasisteady state. There are no signs of any saturation of thepeak level within the investigated interval. Investigationsat higher amplitudes are limited by the reactor integrity.A similar investigation was carried out at an offset of180 �C, with a conversion at 1 Hz around 51%, and hereno increase of the maximum rate enhancement with ampli-tude was observed [15]. The increase of the reaction rateenhancement peak level with amplitude thus seems to belimited by the conversion.
10—2 10—1 100 1010
0.2
0.4
0.6
0.8
1
Rat
e En
hanc
emen
t
Frequency (Hz)
Offset: 160°CFlow: 0.975 mL/min
5°C10°C15°C20°C
Fig. 3. Reaction rate enhancement as a function of frequency for differentamplitudes. The solid lines represent data obtained from numericalsolution of a model.
1988 S. Jensen et al. / Catalysis Communications 8 (2007) 1985–1990
The observed rate enhancement decrease at higher fre-quencies could easily be due to earlier mentioned difficul-ties in maintaining the temperature oscillation amplitudeinside the reactor as the frequency is increased. Furtherinvestigation of the rate enhancement behaviour at higherfrequencies is therefore performed using numerical solutionof a physical model.
4. Modelling
Supplementary to the measurements of rate enhance-ment, a simple model is developed. Only little theoreticalwork on forced temperature oscillations is reported in theliterature. In [9] a general Langmuir–Hinschelwood reac-tion mechanism is simulated with periodic oscillation ofthe temperature. In some ranges of the kinetic parametersand frequencies, deviation from steady state behaviour,including rate enhancement, is found.
For CO oxidation the Langmuir–Hinschelwood reac-tion mechanism is [17]:
COþ � $ CO�
O2 þ 2� $ 2O�
CO� þO� ! CO2;
ð5Þ
with corresponding equations for the coverages, hCO andhO:
dhCO
dt¼ kþ1 pCOh� � k�1 hCO � kþ3 hCOhO
dhO
dt¼ kþ2 pO2
h2� � k�2 h2
O � kþ3 hCOhO:
ð6Þ
Here kþ=�1 are the forward/backward rate constants forCO-adsorption and kþ=�2 the rate constants for O2 adsorp-tion. The reaction rate is given by r ¼ kþ3 hCOhO. All the rateconstants are temperature dependent, and the temperatureis given by T(t) = T0 + A sin (2pft), where T0 is the offsettemperature, A the amplitude, and f the frequency. By solv-ing the kinetic equations numerically along the lines of [9],
deviation from steady-state behaviour is found only for fre-quencies in the kHz range and above, even for the largevariation of kinetic parameters found in the literature.Since rate enhancement is experimentally found at frequen-cies below 1 Hz, another mechanism must be sought.
The partial pressures in the reactor vary with the reac-tion rate and adsorption/desorbtion rates of CO and oxy-gen. In the following we propose a model that, inaddition to the surface kinetics, include these partial pres-sure variations. The change in the number of CO molecules
in the reactor dNCO ;gasdt depends on the flux into the reactor
minus the flux out of the reactor: JkBT ðpCO;0 � pCOÞ, where
pCO is now the time dependent partial pressure in the reac-tor, pCO,0 the constant inlet partial pressure, J the volumet-ric flow rate, and kB the Boltzmann constant. The partialpressures are assumed uniform throughout the reactor as
in a continuously stirred tank reactor. Further, dN CO;gasdt
changes with the reaction rate as �Nkþ3 hCOhO and with
changes in the coverage as �N dhCO
dt , where N denotes the
number of sites in the reactor. Similar arguments holdfor oxygen, and the following two equations for determin-ing the partial pressures in the reactor as functions of timeare obtained:
VkBT
dpCO
dt¼ J
kBTðpCO;0 � pCOÞ � N
dhCO
dtþ kþ3 hCOhO
� �
VkBT
dpO2
dt¼ J
kBTðpO2;0
� pO2Þ � N
1
2
dhO
dtþ kþ3 hCOhO
� �:
ð7Þ
To obtain results from the model, kinetic parameters aretaken from [17] and reactor parameters from [14]. Atfrequencies below 10 mHz no deviation from steady statebehaviour is observed, and the rate enhancement at aspecific temperature oscillation, T(T0,A, f) is calculated as
U ¼ raveðT 0;A; f Þ � raveðT 0;A; f0ÞraveðT 0;A; f0Þ
; ð8Þ
where f0 is some frequency below 10 mHz. Details aboutthe model and the analysis will be given elsewhere [18].The model can not be expected to reproduce the measuredrate enhancements exactly since the reactor model is basedon a continuously stirred tank reactor and the measure-ments are performed under conditions that approach plugflow. However, looking at Fig. 3, where model predictionsfor the rate enhancement at four different amplitudes (5 �C,10 �C, 15 �C, 20 �C) are shown, the general trend ofincreasing rate enhancement in the frequency range 0.01–1 Hz and the levelling off at about 1 Hz is reproduced.
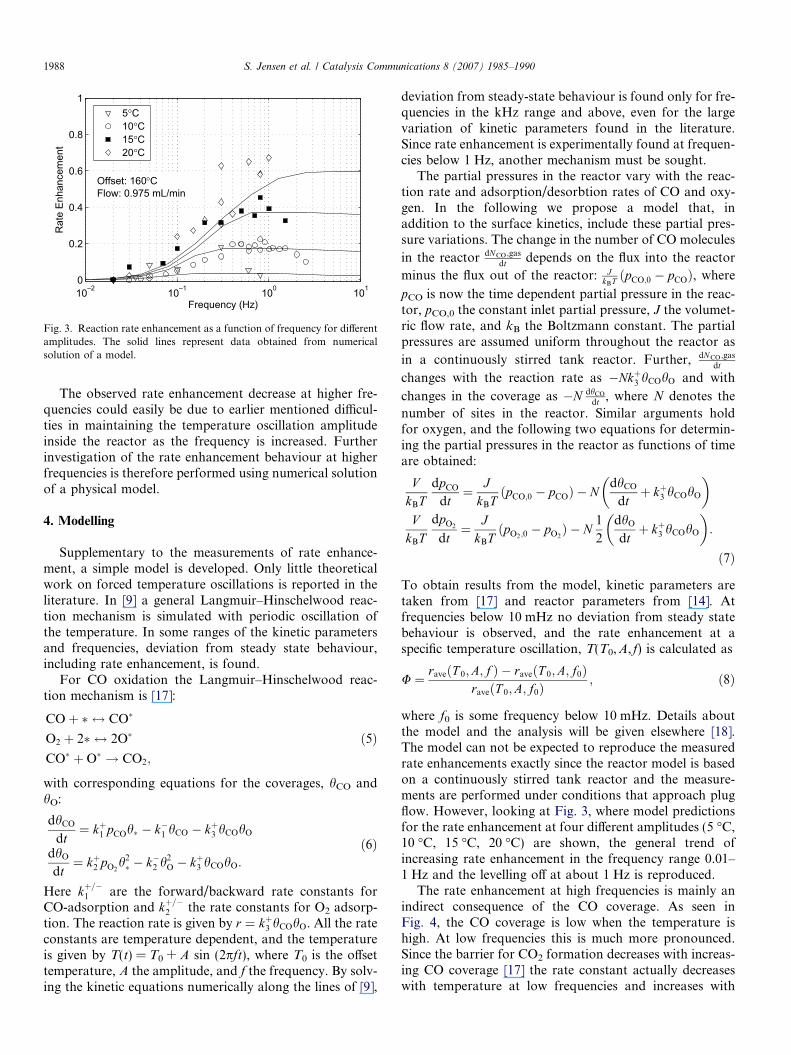
The rate enhancement at high frequencies is mainly anindirect consequence of the CO coverage. As seen inFig. 4, the CO coverage is low when the temperature ishigh. At low frequencies this is much more pronounced.Since the barrier for CO2 formation decreases with increas-ing CO coverage [17] the rate constant actually decreaseswith temperature at low frequencies and increases with
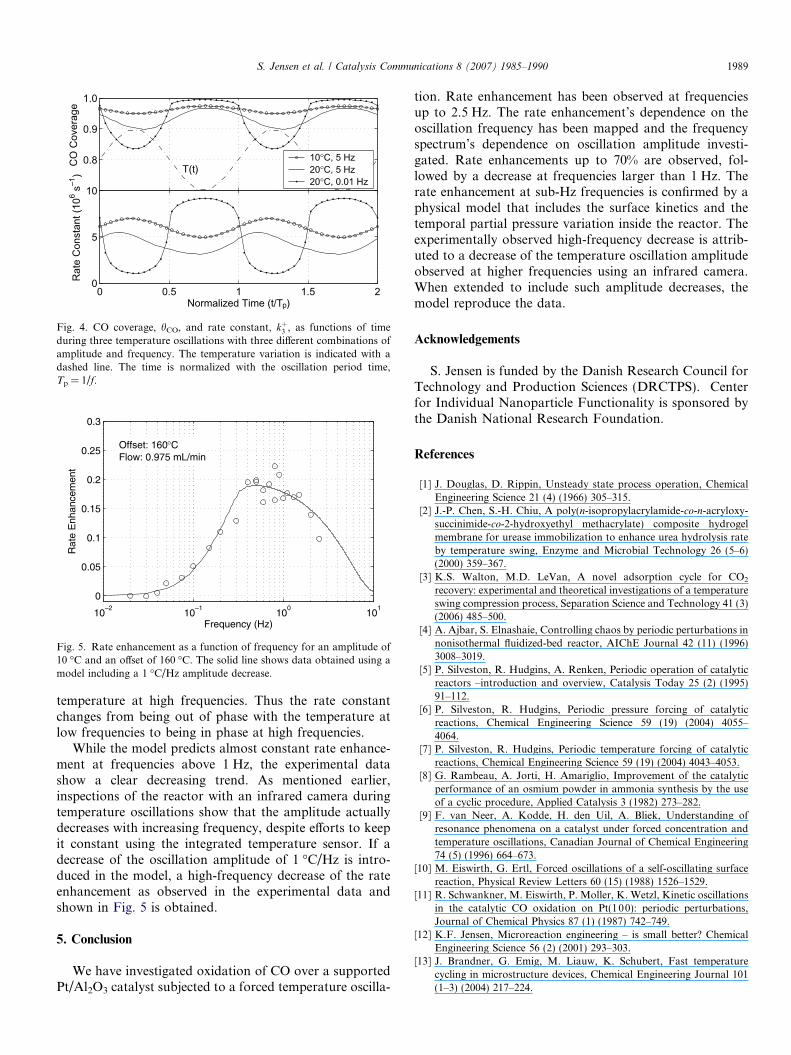
0.8
0.9
1.0
CO
Cov
erag
e
0 0.5 1 1.5 20
5
10
Normalized Time (t/Tp)
Rat
e C
onst
ant (
106 s
—1)
10°C, 5 Hz20°C, 5 Hz20°C, 0.01 Hz
T(t)
Fig. 4. CO coverage, hCO, and rate constant, kþ3 , as functions of timeduring three temperature oscillations with three different combinations ofamplitude and frequency. The temperature variation is indicated with adashed line. The time is normalized with the oscillation period time,Tp = 1/f.
10–2
10—1
100
101
0
0.05
0.1
0.15
0.2
0.25
0.3
Rat
e E
nhan
cem
ent
Frequency (Hz)
Offset: 160°CFlow: 0.975 mL/min
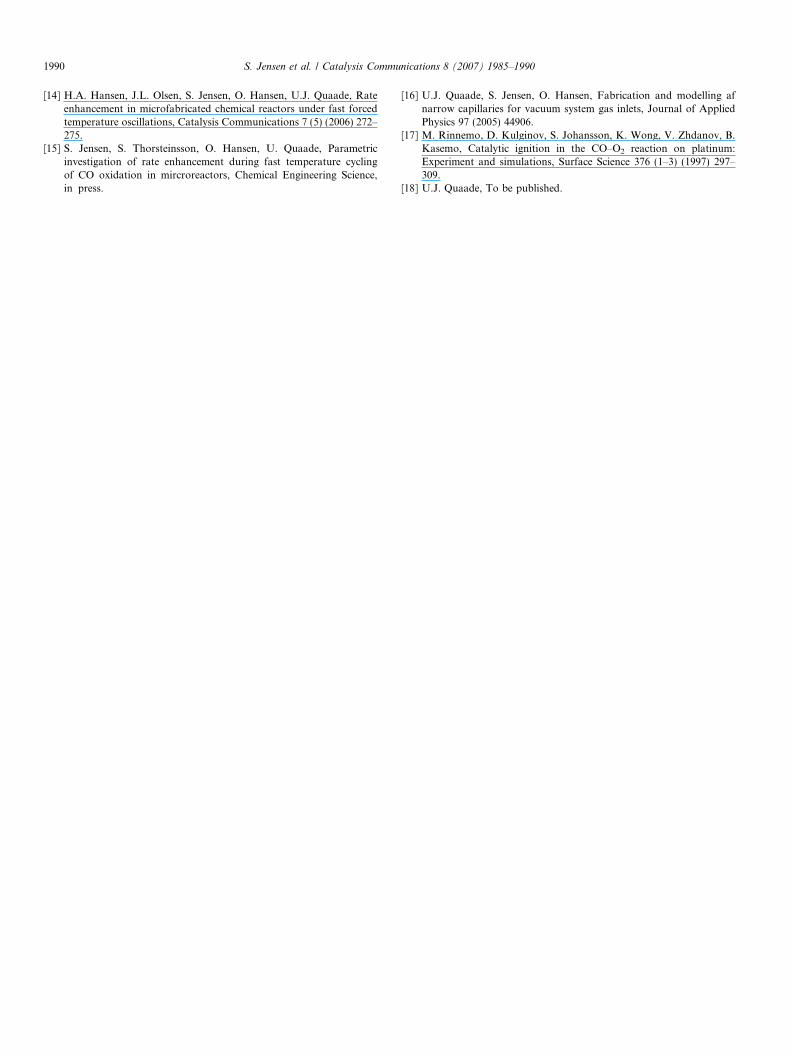
Fig. 5. Rate enhancement as a function of frequency for an amplitude of10 �C and an offset of 160 �C. The solid line shows data obtained using amodel including a 1 �C/Hz amplitude decrease.
S. Jensen et al. / Catalysis Communications 8 (2007) 1985–1990 1989
temperature at high frequencies. Thus the rate constantchanges from being out of phase with the temperature atlow frequencies to being in phase at high frequencies.
While the model predicts almost constant rate enhance-ment at frequencies above 1 Hz, the experimental datashow a clear decreasing trend. As mentioned earlier,inspections of the reactor with an infrared camera duringtemperature oscillations show that the amplitude actuallydecreases with increasing frequency, despite efforts to keepit constant using the integrated temperature sensor. If adecrease of the oscillation amplitude of 1 �C/Hz is intro-duced in the model, a high-frequency decrease of the rateenhancement as observed in the experimental data andshown in Fig. 5 is obtained.
5. Conclusion
We have investigated oxidation of CO over a supportedPt/Al2O3 catalyst subjected to a forced temperature oscilla-
tion. Rate enhancement has been observed at frequenciesup to 2.5 Hz. The rate enhancement’s dependence on theoscillation frequency has been mapped and the frequencyspectrum’s dependence on oscillation amplitude investi-gated. Rate enhancements up to 70% are observed, fol-lowed by a decrease at frequencies larger than 1 Hz. Therate enhancement at sub-Hz frequencies is confirmed by aphysical model that includes the surface kinetics and thetemporal partial pressure variation inside the reactor. Theexperimentally observed high-frequency decrease is attrib-uted to a decrease of the temperature oscillation amplitudeobserved at higher frequencies using an infrared camera.When extended to include such amplitude decreases, themodel reproduce the data.
Acknowledgements
S. Jensen is funded by the Danish Research Council forTechnology and Production Sciences (DRCTPS). Centerfor Individual Nanoparticle Functionality is sponsored bythe Danish National Research Foundation.
References
[1] J. Douglas, D. Rippin, Unsteady state process operation, ChemicalEngineering Science 21 (4) (1966) 305–315.
[2] J.-P. Chen, S.-H. Chiu, A poly(n-isopropylacrylamide-co-n-acryloxy-succinimide-co-2-hydroxyethyl methacrylate) composite hydrogelmembrane for urease immobilization to enhance urea hydrolysis rateby temperature swing, Enzyme and Microbial Technology 26 (5–6)(2000) 359–367.
[3] K.S. Walton, M.D. LeVan, A novel adsorption cycle for CO2
recovery: experimental and theoretical investigations of a temperatureswing compression process, Separation Science and Technology 41 (3)(2006) 485–500.
[4] A. Ajbar, S. Elnashaie, Controlling chaos by periodic perturbations innonisothermal fluidized-bed reactor, AIChE Journal 42 (11) (1996)3008–3019.
[5] P. Silveston, R. Hudgins, A. Renken, Periodic operation of catalyticreactors –introduction and overview, Catalysis Today 25 (2) (1995)91–112.
[6] P. Silveston, R. Hudgins, Periodic pressure forcing of catalyticreactions, Chemical Engineering Science 59 (19) (2004) 4055–4064.
[7] P. Silveston, R. Hudgins, Periodic temperature forcing of catalyticreactions, Chemical Engineering Science 59 (19) (2004) 4043–4053.
[8] G. Rambeau, A. Jorti, H. Amariglio, Improvement of the catalyticperformance of an osmium powder in ammonia synthesis by the useof a cyclic procedure, Applied Catalysis 3 (1982) 273–282.
[9] F. van Neer, A. Kodde, H. den Uil, A. Bliek, Understanding ofresonance phenomena on a catalyst under forced concentration andtemperature oscillations, Canadian Journal of Chemical Engineering74 (5) (1996) 664–673.
[10] M. Eiswirth, G. Ertl, Forced oscillations of a self-oscillating surfacereaction, Physical Review Letters 60 (15) (1988) 1526–1529.
[11] R. Schwankner, M. Eiswirth, P. Moller, K. Wetzl, Kinetic oscillationsin the catalytic CO oxidation on Pt(100): periodic perturbations,Journal of Chemical Physics 87 (1) (1987) 742–749.
[12] K.F. Jensen, Microreaction engineering – is small better? ChemicalEngineering Science 56 (2) (2001) 293–303.
[13] J. Brandner, G. Emig, M. Liauw, K. Schubert, Fast temperaturecycling in microstructure devices, Chemical Engineering Journal 101(1–3) (2004) 217–224.
1990 S. Jensen et al. / Catalysis Communications 8 (2007) 1985–1990
[14] H.A. Hansen, J.L. Olsen, S. Jensen, O. Hansen, U.J. Quaade, Rateenhancement in microfabricated chemical reactors under fast forcedtemperature oscillations, Catalysis Communications 7 (5) (2006) 272–275.
[15] S. Jensen, S. Thorsteinsson, O. Hansen, U. Quaade, Parametricinvestigation of rate enhancement during fast temperature cyclingof CO oxidation in mircroreactors, Chemical Engineering Science,in press.
[16] U.J. Quaade, S. Jensen, O. Hansen, Fabrication and modelling afnarrow capillaries for vacuum system gas inlets, Journal of AppliedPhysics 97 (2005) 44906.
[17] M. Rinnemo, D. Kulginov, S. Johansson, K. Wong, V. Zhdanov, B.Kasemo, Catalytic ignition in the CO–O2 reaction on platinum:Experiment and simulations, Surface Science 376 (1–3) (1997) 297–309.
[18] U.J. Quaade, To be published.