Food Security Status among Muslim Households in West Bengal: An Empirical Study, Ismail M & Alam A...
334
Transcript of Food Security Status among Muslim Households in West Bengal: An Empirical Study, Ismail M & Alam A...


LIFE AND LIVING THROUGHNEWER SPECTRUM OF
GEOGRAPHY

Life and Living ThroughNewer Spectrum of Geography
EDITOR
MD. ISMAILDepartment of Geography
Aliah UniversityWest Bengal
ASSISTANT EDITOR
ASRAFUL ALAMDepartment of Geography
Aliah UniversityWest Bengal
MOHIT PUBLICATIONSNEW DELHI 110 002

First Published 2015© Editors
ISBN 978-81-7445-690-8
All rights reserved. No part of this publication maybe reproduced, stored in a retrieval system or
transmitted in any form or by any means, electronicor mechanical, including photocopying, recording or
otherwise, without written permission from theAuthor.
Published by:
MOHIT PUBLICATIONS4675/21—Ganpati Bhawan, Ansari Road
Darya Ganj, New Delhi-110 002Phone: 011-23255141, Fax: 011-23284136E-mail: [email protected]
PRINTED IN INDIA
Published by Mohit Publications, New Delhi-110 002,Typeset by Gaurav Graphices.Printed at R.K. Digital Print, Delhi.

Dedicated toDr. Md. Mustaquim, Dr. Rukshana,
Dr. Julfikar Ali & Dr. Sk. Mafizul hoque


Preface and Acknowledgements
This edited volume is a collection of papers fromvarious eminent researchers throughout the Country. Thebook entitled “Life and Living through Newer Spectrumof Geography” including 18 papers covering variousdiscipline of Geography “Life and Living through NewerSpectrum of Geography” has been the burning issues ofdiscussion in Geography over the past few decades. Thisbook is the collection of various issues and problemsfrom different parts of India. The edited book has beendivided into three sections. The first section is Ecologyand Environment issues in Geography and has 5(five)research articles covering different ecological andenvironmental issues. The Second Section of this bookdiscuss various economic issues which is the mostimportant and burning problem all over the World andthis section has 7 (seven) articles which are deals variouseconomic related issues. The Last Section in this bookdeals with social problem in Geography and including6 (six) research papers which are mainly discussing thesocial problem an Indian perspective.
We would like to express our deep appreciation tothe Faculty Members of the Department of Geography,Aliah University for their help, suggestion and theiravailability.We also grateful to Dr Balai Chandra DasAssistant Professor, Department of Geography, Krishnagar

Govt. College, Krishnagar, Nadia for his valuablesuggestion. Equally we are also thankful to Mr AznarulIslam, Assistant Professor of Geography, BarasatGovt.College for his inspiration and without his valuablesuggestion; perhaps the book would not have been thelight of the day. Very Special thanks to all our heartiestfriends for their Support and guidance in every step ofour work. Last but not least, We Would likes to thankfulour teacher Dr Shamim Firdous, Assistant Professor inHistory, Aliah University for always supporting us.
Finally, we would like to thank everybody who wasimportant to the successful realization of book as wellas expressing our apology that we could not mentionpersonally one by one.
EDITORS
(viii)

List of Contributors
1. Dr. Balai Chandra Das, Assistant Professor,Department of Geography, Krishnagar Govt.College, Krishnagar, Nadia-741101
2. Anil Kumar, Research Scholar, Jamia Millia Islamia,New Delhi, India
3. Aznarul Islam, Assistant Professor, Departmentof Geography, Barasat Govt. College, West BengalState University
4. Dr. Sanat Kumar Guchhait, Professor, Departmentof Geography, The University of Burdwan, WestBengal.
5. Ranjana Laskar, Research Scholar, Department ofGeography, North-Eastern Hill University, Shillong,Meghalaya, 793022
6. Dr. Rajat Halder, Assistant professor of Geography,Kalinagar Mahavidyalaya, 24 Parganas (North),West Bengal
7. Md. Ismail, Department of Geography, AliahUniversity, Kolkata – 700 091
8. Balendra Pal, Research Scholar, Department ofGeography, Delhi School of Economics, Universityof Delhi, Delhi-110007

9. Dr.Anjan Sen, Assistant Professor, Department ofGeography, Delhi School of Economics, Universityof Delhi, Delhi-110007
10. Mr. Surajit Paul, Research scholar, Departmentof Geography, North Bengal University, WestBengal.
11. Dr. Sushma Rohatgi, Associate Professor,Department of Geography, North BengalUniversity, West Bengal.
12. Jumafuddin Sheikh, Ph. D. Research Scholar,Department of Geography, Aliah University,Kolkata – 700 091
13. Dr. Rukhsana, Assistant Professor, Departmentof Geography, Aliah University, Kolkata, WestBengal
14. Md. Monirul Islam, Ph. D. Research Scholar,Department of Geography, Aliah University,Kolkata – 700 091
15. Dr. Md. Mustaquim, Assistant Professor, Dept.of Geography, Aliah University, Kolkata, WestBengal
16. Jaidul Islam, Ph. D. Research Scholar, Departmentof Geography, Aliah University, Kolkata – 700 091
17. Moududa Khatun, Research Scholar, Departmentof Geography, Visva Bharati, Santiniketan,Birbhum, West Bengal.
18. Nazneen Akhtar, Ph.D. Scholar, Department ofGeography, North-Eastern Hill University, Shillong,Meghalaya.
19. Nida Fatima, Research scholars, Department ofGeography, Aligarh Muslim University, Aligarh.
20. Razia Bano, Research scholars, Department ofGeography, Aligarh Muslim University, Aligarh.
(x)

21. Asraful Alam, Ph. D. Research Scholar, Departmentof Geography, Aliah University, Kolkata – 700 091
22. Dr. Sanjit Kumar Shil Sharma, Assistant Teacher,Shikarpur High School (H.S), Mathabhanga, CoochBehar, West Bengal.
23. Sweety Nandy, Department of Geography,Krishnagar Govt. College, University of Kalyani,West Bengal, India.
24. Subrata Roy, UGC Junior Research Fellow,Department of Geography, Aliah University,Kolkata.
25. Dr. Md. Julfikar Ali, Assistant Professor, Dept.of Geography, Aliah University, Kolkata, WestBengal.
(xi)


Contents
Preface & Acknowledgements v
List of Contributors ix
SECTION-A
ECOLOGY AND ENVIRONMENT1. Crying with the River: A Study on a 3
Dying River and Her Famished FishermenDr. Balai Chandra Das
2. Mapping of Waterlogged Salinity 23Areas in Jhajjar District; HaryanaAnil Kumar
3. Is Severity of River Bank Erosion 35Proportional to Social Vulnerability?A Perspective from West Bengal, IndiaAznarul Islam & Dr. Sanat Kumar Guchhait
4. Preservation of Culture of Lepchas 52Through EcotourismRanjana Laskar
5. Problem and Prospect of Pisciculture 66in North 24 Parganas District, West BengalDr. Rajat Halder

SECTION-BECONOMIC ISSUES IN GEOGRAPHY
6. Food Security Status Among Muslim 83Households in West Bengal: An EmpiricalStudyMd. Ismail
7. Analyzing the Spatial and Temporal 123Pattern of Land Use/Land Cover Changeof Churu City in RajasthanBalendra Pal & Dr. Anjan Sen
8. Analysis of Traffic Flow Pattern and 139its Impact: A Study on GariahatFlyover & its Adjacent AreaMr. Surajit Paul & Dr. Sushma Rohatgi
9. Human Development Index in Rural 154Habitat, Economy and Society: A CaseStudy of Ballabhpur Village, Birbhum,West BengalJumafuddin Sheikh & Dr. Rukhsana
10. Problems of Road Transport System 175in Krishnanagar Municipality, West BengalSweety Nandy
11. Gender Gap in Literacy: A Study 188of Indian Scenario
Md. Monirul Islam & Dr. Md. Mustaquim
12. Spatio-Temporal Analysis of Rice 203Productivity Regions Inkoch BiharDistrict, West BengalAsraful Alam & Dr. Rukhsana
(xiv)

SECTION-CSOCIAL PROBLEMS IN GEOGRAPHY
13. A Geographical View of Demographi 217of Urban Poor: A Comparative HouseholdStudy in KolkataJaidul Islam & Moududa Khatun
14. The Handloom Industry and its 241Gender Dimension: A Study in AssamNazneen Akhtar
15. Health Problems of Lock Industry 254Workers: A Case Study of AligarhCity in Uttar PradeshNida Fatima & Razia Bano
16. Mid Day Meal: A Historic Step for 269Elimentary Education in IndiaDr. Sanjit Kumar Shil Sharma
17. Thriving Art at Cost of Childhood: 280Present Scenario of Child Workersin Indian Carpet IndustryRazia Bano & Nida Fatma
18. Tourism Development and Urbanization 300in Himalayas: A Case Study of Gangtok,SikkimSubrata Roy & Dr. Md. Julfikar Ali
(xv)


1
SECTION-AECOLOGY AND ENVIRONMENT

Life and Living Through Newer Spectrum of Geography2

3
1Crying with the River:A Study on a Dying Riverand Her Famished Fishermen
Dr. Balai Chandra Das
1. ABSTRACT
Human activities on river banks are stronglycontrolled by the river concerned. Fishermen, amongall other inhabitants, are directly and most intenselyinfluenced by the behavior of the river on whichthey live for their livelihood. River Jalangi, one ofthree ‘Nadia Rivers’, was once the life-line of thedistrict of Nadia. Being a river of moribund delta,Jalangi is proceeding to it ultimate fate of death ata faster rate. Unscientific ploughing on banks,encroachment, urbanization, road constructions, etchas fastened the process of deterioration of the river.As a result, catch has gone down very sharply.River can no more feed her fishermen. Power andpolitics has joined together with their hardship todeprive them of their birth right of catching fishfrom river. Fishermen have been forced to cast offtheir ancestral occupation. Present paper will focuson the agony of those fishermen living on riverJalangi.
Crying with the River: A Study on a Dying River . . .

Life and Living Through Newer Spectrum of Geography4
2. Introduction
Deterioration and death of rivers in Bengal delta isa very common phenomenon. Matin (2010) reported aloss of 700 to 800 rivers of Bangladesh during the periodfrom 11th century to present day. Rivers of West Bengalare also passing through such stages of evolution toreach that ultimate fate. Jalangi is one of the three ‘NadiaRivers’ in the district of Nadia of moribund deltaic WestBengal which has been deteriorated badly. Every changesof a part of a system stir another part. River Jalangi andinhabitants on its banks are two parts of a single system.River Jalangi has gone through a long history of changeof its course and passed phases of instigation, vigor andfeeble. This changes and deterioration of the course hasdefinite effects (Biswas, 2001) on the inhabitants on banks.The present paper will focus its point of concentrationon the impact of the spatial and temporal changes anddeterioration of the course of the river Jalangi upon thefishermen on its banks in the district of Nadia, WestBengal, India.
3. Materials and Method
For this study, the author interviewed 250 respondentsof fishermen both from Hindu and Muslim communityof 34 vivillages on banks of Jalangi in 9 C.D. blocks inthe district of Nadia. All the materials for this studywere collected from direct field survey and data are ofpurely primary in nature. Above mentioned targetrespondents were interviewed as per pre-plannedquestionnaire and information was collected during theperiod from 2007 to 2012. Collected data were arranged,tabulated and analyzed by simple statistical tools andrepresented diagrammatically with the help of M.S.Excell2007. Information and numerical record regardingdeterioration of the River Jalangi was collected fromdifferent literatures, government records and maps.

5
River Jalangi
River Bhagirathi
River Jalangi
River Jalangi River Bhairab
4. Findings and Discussion
Main findings of the study are summarized underfollowing heads-
Crying with the River: A Study on a Dying River . . .
Life and Living Through Newer Spectrum of Geography6
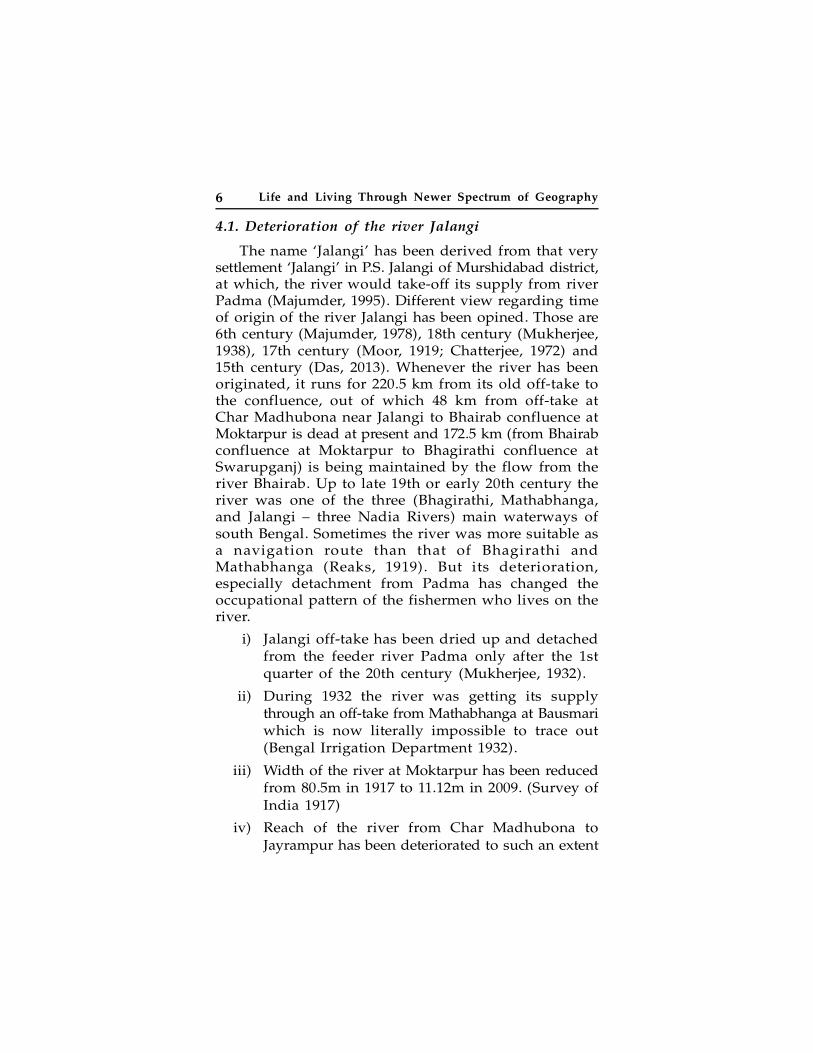
4.1. Deterioration of the river Jalangi
The name ‘Jalangi’ has been derived from that verysettlement ‘Jalangi’ in P.S. Jalangi of Murshidabad district,at which, the river would take-off its supply from riverPadma (Majumder, 1995). Different view regarding timeof origin of the river Jalangi has been opined. Those are6th century (Majumder, 1978), 18th century (Mukherjee,1938), 17th century (Moor, 1919; Chatterjee, 1972) and15th century (Das, 2013). Whenever the river has beenoriginated, it runs for 220.5 km from its old off-take tothe confluence, out of which 48 km from off-take atChar Madhubona near Jalangi to Bhairab confluence atMoktarpur is dead at present and 172.5 km (from Bhairabconfluence at Moktarpur to Bhagirathi confluence atSwarupganj) is being maintained by the flow from theriver Bhairab. Up to late 19th or early 20th century theriver was one of the three (Bhagirathi, Mathabhanga,and Jalangi – three Nadia Rivers) main waterways ofsouth Bengal. Sometimes the river was more suitable asa navigation route than that of Bhagirathi andMathabhanga (Reaks, 1919). But its deterioration,especially detachment from Padma has changed theoccupational pattern of the fishermen who lives on theriver.
i) Jalangi off-take has been dried up and detachedfrom the feeder river Padma only after the 1stquarter of the 20th century (Mukherjee, 1932).
ii) During 1932 the river was getting its supplythrough an off-take from Mathabhanga at Bausmariwhich is now literally impossible to trace out(Bengal Irrigation Department 1932).
iii) Width of the river at Moktarpur has been reducedfrom 80.5m in 1917 to 11.12m in 2009. (Survey ofIndia 1917)
iv) Reach of the river from Char Madhubona toJayrampur has been deteriorated to such an extent

7
that it is literally impossible to trace out. Sometanks (ponds) excavated within the bed are foundas water body, otherwise all the length of thereach is cultivated for paddy and Ravi crops.
v) The reach between Jayghata (approximately 7 kmdownstream to Karimpur) and Moktarpur, widthof the river has been reduced from 225m in1917to only 4m in 2009.
vi) Except rainy season this reach remains absolutelydry. Immediate downstream to Suti confluence,there was no sand bar along right bank during1921. But at present, there is a sand bar of 650mlong and average width 50m.
vii) The Banur bil (swamp/wetland/lake) connectornear Nischintapur in P.S. Tehatta-I has effectivelybeen closed by village road.
viii) Bahadurpur-Panditpur village road effectivelyclosed the Hansadanga bil connector from Jalangiwithin this time span of 1921 to 2012.
It is very interesting point to note that although thepost-Faracca water level of the river at Krishnagar toSwarupganj or in lower reaches up to Kalinagar loophas been risen (Figure 1), but the discharge has beendecreased in comparison to pre-Faracca (Figure 2). Post–Faracca rise in water level in Bhagirathi create backpressure to Jalangi at Swarupganj which forces Jalangiwater to rise up. But as the river Jalangi is beheadedand has no supply from the river Padma (except throughBhairab during monsoon months only), the discharge ofthe river has fallen abruptly during post Faracca period.During a time span of about 100 years the discharge ofthe river has been reduced to half. In 1915 at Panditpur,the average discharge recorded for the rainy season 32787cusecs (Hirst, 1916), whereas it was only 18386.2 cusecs(Directorate of Irrigation and Waterways 2009) in 2009at Krishnagar, few kilometers downstream of Panditpur.
Crying with the River: A Study on a Dying River . . .

Life and Living Through Newer Spectrum of Geography8
Figure 1: Changes in greatest depth of water at Swarupganj,Source: Reaks, 1919 and IWWD, 2010
Figure 2: Temporal variation in discharge of the river Jalangi
i) Deltaic river morphology, bank erosion and shifting:-Changes in the course is the inseparable part ofdelta building mechanism. The rivers are at aloss to find a perceptible slope (Bagchi, 1978) andconsequently they are depositing a lion share oftheir silt load within bed and on bank and alittle portion are being deposited low lying floodplains behind levee. As a result the rivers areflowing on beds of higher levels than surroundinglow-lying areas and during high flood rivers arefinding new course breaching levees through lowerareas (Rudra, 2010). All the bils (ox-bow lakes orswamps) like Karua bil, Tengramari bil (Karimpur-I), Topla bil, Margangnee khal (Karimpur-II),

9
Patpukur bil (Nakashipara), Gokhurapota bil(Chapra), Morakodi bil, Damuk bil, Argarini bil,Banur bil (Tehatta-I), Baragadi bil, Satikhali bil,Margangni bil (Tehatta-II), Chuakhali bil,Hansadanga bil (Krishnagar – II), Shyamnagar bil(Krishnagar – I), Alokananda, Kalatala bil, andBhaluka bil (Nabadwip) along the course of theriver are those old courses of the river whichwere rejected during different time (especiallywithin the period from 1764 to 1854 because during1764 sinuosity of the river was 2.23 which reducedat 1.93 in 1854) to raise lower part of the deltaand to flow through the channel which is nowoccupied. In 2006, the state government sanctionedRs. 70 millions for anti-erosion work in the JalangiRiver (Pramanick, 2005).
ii) South-Eastward shifting of Padma and detachment ofoff-take:- Closing of the off-take is one of theimportant causes of deterioration of the courseof the river Jalangi. River Padma, the feeder ofthe river Jalangi has been shifted towards south-east (Basu, 1972). Due to this shifting, the off-take of the river Jalangi became detached andblocked by silting.
iii) Transformation of Acute Angular Off-Take Of The R.Jalangi Into Obtuse Angular One Accelerated TheProcesses Of Deterioration:- Moreover the acute angleof confluence between Padma and its distributaryJalangi subsequently were changed into obtuseone and the off-take point got closed finally.Hydraulics of the transformation the off-take ofthe river Jalangi at Madhubona into an obtuseangular one can be explained by Law On CollisionOf Bodies In Fluid (Das and Mukherjee, 1966).The mechanism of change of position of the off-
Crying with the River: A Study on a Dying River . . .

Life and Living Through Newer Spectrum of Geography10
Figure 3: South-Eastward shifting of the river Padma anddetachment and deterioration of the river Jalangi
take is illustrated in figure 4. During first half ofthe 18th century, the off-take of the river Jalangiwas at Jalangi bazaar and that is why the rivergot its name Jalangi. The then off-take of the riveris about 5 km upstream of the present day off-take position. This was happened because i) whenthe acute angular off-take transformed into obtuseangular one, the collision point ‘O’ (Fig. 4) movedgradually downward. ii) that obtuse angular off-take whose orientation was from south-east tonorth-west was swallowed by river Padma againto move the Jalangi of-take downward.
iv) Fluctuation of ground water table:- Rivers with steepcohesive banks much failure occurs especiallyduring ground water draw down as flood levelsdrop. Bank more than 10m high above the lowwater level may be potentially unstable (Richards1982). Due to Faracca Water Sharing Treaty- 1996

11
between India and Bangladesh (Rudra, 1998), waterlevel of the river Bhagirathi fluctuates every 10days (10 days for India and next 10 days forBangladesh). Back pressure in the river Bhagirathiraises the water level of the river Jalangi duringIndia’s turn and goes down during Bangladesh’sturn. This fluctuation in water level especiallyduring lean periods causes fluctuation in groundwater pressure of bank materials leading bankerosion and in turn changes in course.
Figure 4: Transformation Of Acute Angular Off-Take Of TheR. Jalangi Into Obtuse Angular One Accelerated The
Processes Of Deterioration
VI.2.2. Anthropogenic causes
v) River training:- River training in Moribund (Bagchi,1978) Deltaic Bengal which causes changes in thecourse of the rivers are -
vi) Embankment:- Flushing of land during floods isnot only necessary to raise and fertilize the landand in the interest of public health, but this veryprocess is essential for the conservancy of theriver itself (Majumdar 1941). Owing to flattergradient and consequently comparatively lessvelocity, the river is normally unable to transportits silt. During floods rivers require certain spillarea where it could relieve itself of a portion of
Crying with the River: A Study on a Dying River . . .

Life and Living Through Newer Spectrum of Geography12
its silt which would otherwise deposit in its bedand would gradually deteriorate it.
Figure 5: Embankment goes against forwhich it was designed
At present there are 10550 km. long embankmentsalong the banks of rivers (Rudra, 2010) of West Bengalout of which more than 60% were inherited from theZamindars or landlords (Basu, 2002). Doors to spill areasfor the river Jalangi are effectively closed from all sidesby numerous embankments. State Highway-11 fromJalangi to Karimpur, Karimpur-Krishnagar road, andKrishnagar – Swarupganj road are second – frontprotection on left bank. Karimpur – Domkal, Palashipara– Domkal, Krishnagar – Nabadwip, Bethudahari - Birpurand Chougacha – Hulorghat state highways, andKrishnagar – Bethuadahari N.H.- 34 are on right bank.There are many first – front embankments like Gopalpurghat to Jayrampur in P.S. Karimpur-I; Moktarpur –Natipota road in P.S. Karimpur-II; Kalabagha – Birpurroad in P.S. Nakashipara; Gate-road in Krishnagar etc.Except NH-34, all the state highways or merely metalledroads mentioned above are built on previously existingembankments built by local Zaminders or land lordsand renovated later on by colonial rulers.

13
vii) Dam across the river: - Earthen dam across theriver, especially for the purpose of reducing thelength of ferry services are very common in theupper reach. From both sides of the river, soilsare put into the river bed leaving a very narrowchannel where boatmen keeps 3 or 4 boats tiedtogether to make the ferry service easier. Evenfour wheeler motor cars also moves across theseearthen dams and boat-made bridges. Theseearthen dams reduce free flow of the riveraccelerating bank erosion.
Figure 6: Schematic diagram showing earthen dam at FerryGhat across the River Jalangi at Moktarpur
There are two earthen dams within the reach fromMoktarpur to Jayrampur viz, at Moktarpur and atKarimpur on the river Jalangi. Every year at each ferryghat boat man introduces a huge quantity of silt to theriver putting approximately 15000 ft.3 of soil during leanseason. During rainy season, the river swept away thishuge quantity of soils and deposits a lion share into itsbed or along banks. Because the river has no sufficientenergy to carry away the whole volume of soil introducedinto it every year. After every rainy season, boatmenput that huge quantity of soil for each concave bank at
Crying with the River: A Study on a Dying River . . .

Life and Living Through Newer Spectrum of Geography14
meander turn and the owners make Khadan ( pond likewater body attached to the river by cutting soil on bank)to trap silt in those Khadan during floods. But theseKhadans becomes further extended by attack of currenton concave bank causing gradual shifting of the river.
Figure 7: Map showing effect of soil cutting on bank
Source: Field Survey (2007-2011) and Cadastral Map, D.L. & L.R.O.,Govt. of W.B.
In bed soil cutting is not so much influential to bankerosion and aerial changes in the course of the riverJalangi. It might be disturbing the hydro dynamic stabilityof the river locally and must have some long term effecton changes in river course, but it has no immediate orshort term impact on bank erosion. Even this practice ofsoil cutting from river bed may be substitute of dredgingfor keeping the river alive. Yet the brick-industry ownershould cut soil from river bed provided it is permittedby government authority and prescribed by river scientistsand engineers.
viii) Blockage of free flow due to different practices byfishermen and farmers:- Making obstacles withinthe river bed to the free flow of the river bydifferent means and ways are very common all

15
along the course of the river. Indigenous andintensive fishing practices are exclusivelyresponsible for this. Fishermen put Kanta (branchesof bushes and trees), Jhamp (wall like made upof bamboo splinter), Bana (bamboo – stick madebarrier to pass water but fish through it) etc. acrossthe river bed which create great obstacle to riverflow. This in turn due to retarded velocity causesin bed siltation and gradual deterioration of theriver.
ix) Post-Faracca lowering of water level of Padma thanJalangi bed: - Faracca Barrage on river Padma wasplanned to feed the river Bhagirathi to save thePort of Calcutta, the economic hearth of the easternand north-eastern India. At Jayrampur the bedlevel of the river Jalangi is 15.66 m and atGopalpur Ghat, the river is almost disappearedwith bed (?) level of 17.76 m. But the average(2007 – 2009) highest water surface level of theriver Padma during monsoon months (July toOctober) is only 16.75m which is 1.01m bellowthe Jalangi bed level to enter into the river. Thatis why the water from Padma cannot feed theriver Jalangi.
x) Construction of SH-11:- During 1950s, state highway– 11 was constructed erasing the last line of theriver Jalangi. State Highway – 11 runs fromKarimpur to Baharampur via Gopalpur Ghat –Jalangi. A ferry ghat was there at Gopalpur Ghateven during last part of 1930s decade and presentday N.H.-11 was a Kachha Rasta (unmetalled road)broken by the river Jalangi at Gopalpur ghat.Therefore it is proved that only after theconstruction of this State Highway, the off-takeof the river was made permanently closed.
Crying with the River: A Study on a Dying River . . .

Life and Living Through Newer Spectrum of Geography16
xi) On bank ploughing, Deforestation and overgrazing: -Deterioration of the river is caused by two ways– 1. Decrease in volume & velocity 2. Increase insilt charge of the river. Excessive silt charge tothe river is mainly caused by addition of soil tothe river water from bank erosion and soil carriedby surface run-off. The later is more powerfulpoison than the first to kill the river. Due to onbank (Moktarpur, Putimari) and in bed (Jayrampur,Saguna, Bakshipur) ploughing, soil becomes themost vulnerable to be washed away by surfacerunoff. Deforestation and over grazing act togetherto join with on bank & in bed ploughing to giveover burden of silt which accelerate the processof decaying of the river.
xii) Too much withdrawal of water:- Along with loweringof Padma level, water from the river Jalangi andits feeder rivers are increasingly being pumpedto irrigate agricultural fields. There are 124 RiverLift Irrigation (RLI) stations on the banks of theriver within the district of Nadia to irrigate morethan 10% of irrigated land. Decrease in volumeleads decrease in velocity which in turn compelsthe river to deposit its silt load within the riverbed causing rapid deterioration.
4.2. Per-capita Decrease in Fish Catch
The cause of decrease in per capita fish catch is nota single one. Causes are many and are identified byfishermen themselves. Detachment of the river from theriver Padma and consequent absence of silt laden currentis the main cause for the decrease in fish catch and thiswas opined by 36.6 % fishermen. Decrease in volume ofthe river was opined by 15.6 % and water pollution wasopined by 15.1 % fishermen as causes of decrease infish catch. Detachment of the river Jalangi from Padma
17
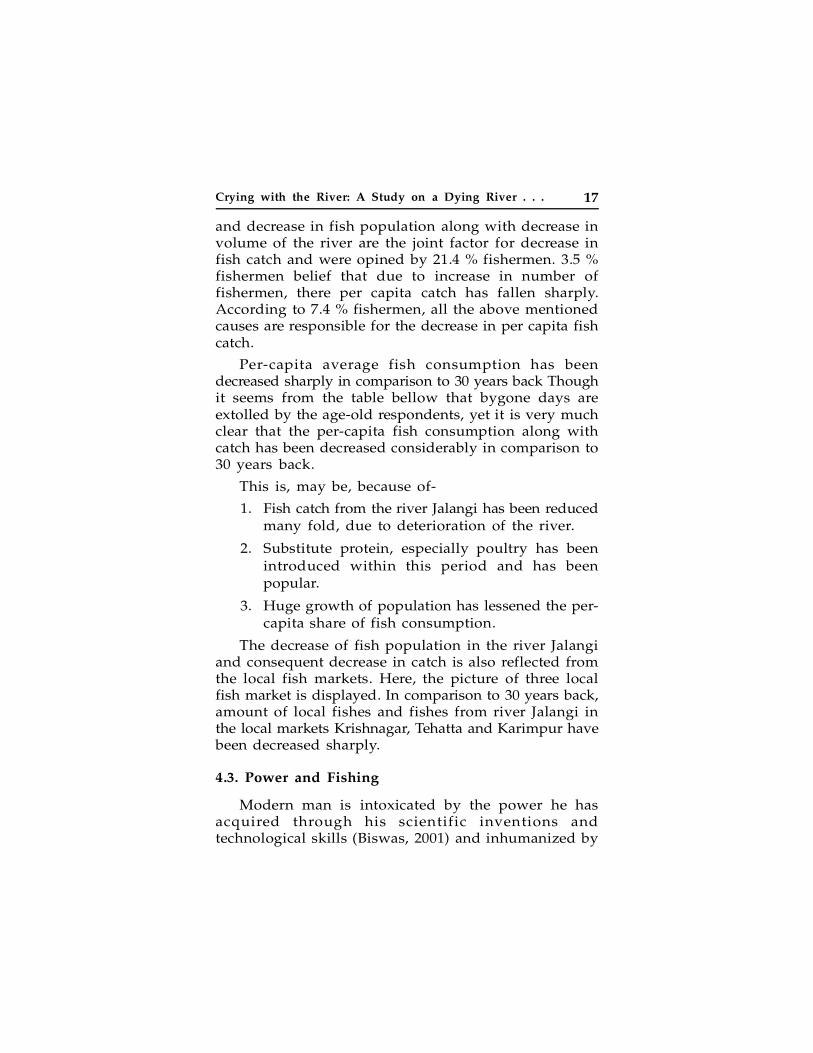
and decrease in fish population along with decrease involume of the river are the joint factor for decrease infish catch and were opined by 21.4 % fishermen. 3.5 %fishermen belief that due to increase in number offishermen, there per capita catch has fallen sharply.According to 7.4 % fishermen, all the above mentionedcauses are responsible for the decrease in per capita fishcatch.
Per-capita average fish consumption has beendecreased sharply in comparison to 30 years back Thoughit seems from the table bellow that bygone days areextolled by the age-old respondents, yet it is very muchclear that the per-capita fish consumption along withcatch has been decreased considerably in comparison to30 years back.
This is, may be, because of-
1. Fish catch from the river Jalangi has been reducedmany fold, due to deterioration of the river.
2. Substitute protein, especially poultry has beenintroduced within this period and has beenpopular.
3. Huge growth of population has lessened the per-capita share of fish consumption.
The decrease of fish population in the river Jalangiand consequent decrease in catch is also reflected fromthe local fish markets. Here, the picture of three localfish market is displayed. In comparison to 30 years back,amount of local fishes and fishes from river Jalangi inthe local markets Krishnagar, Tehatta and Karimpur havebeen decreased sharply.
4.3. Power and Fishing
Modern man is intoxicated by the power he hasacquired through his scientific inventions andtechnological skills (Biswas, 2001) and inhumanized by
Crying with the River: A Study on a Dying River . . .

Life and Living Through Newer Spectrum of Geography18
the power of politics and wealth. The upper part of thesocial pyramid often abuses the base section for theirend with the help of those powers. Government hasundertaken many schemes for the development of poorcitizens. But benefits of those schemes often goes to therich not to the poor. There is a policy of West BengalGovernment, to lease the river to so-called fishermen’sco-operative society (Govt. of West Bengal, District Land& Land Reforms Officer, Nadia District). Virtually it isa noble scheme of the Govt. towards poor fishermen.But very often fruits of this scheme go to the rich. Socalled members of the fisher-men’s co-operatives, whoare very rich and very few in number, but politicallyinfluential, take re-lease a greater length of the riverand use the river recklessly to maximize his profit. Notonly he exploits and destroys the national resources forhis personal interest but also deprives really poorfishermen prohibiting them to catch fish from the river.Poor fishermen catch fish on the basis of no – work - no- pay for so- called rich member of the fishermen’s co-operative, who practically does not catch at all and whohave other main source of income. Stories are sometimesmore pathetic. Even in free river, where the natural andnational water resource is not leased to anybody,fishermen cannot catch their livelihood. The poorfishermen collect branches of shrubs and put it into theriver during late monsoon for the rich fishermen. Duringwinter, when fishes get together into those areas ofdrowned branches of shrubs, poor fishermen catch fishas a day labor for rich fishermen. So for this long periodfishing in Jalangi is prohibited for the poor fishermenbecause rich fishermen (who never catch fish physically)took the illegal occupancy of the river. This way thenatural right of livelihood of poor fishermen was stanchedby rich. They have boats, nets, lines and hooks but nounity and political power. This lacking converted themfrom fishermen into day-labor. This reduction of theirstate reduces their health gradually and malnutrition leads

19
them to the ultimate fate of life. Their co-operative societydoes not look after the matter of poverty alleviation(west bengal wetlands and water bodies conservationpolicy 2012) and life insurance so that the widows offishermen who died as a result of their occupation wouldreceive a death benefit (martin, 1994). Their distressedwidows moves towards town for stomach and get lostinto the dark of the city.
4.4. Fishermen are being Forced to Leave their AncestralOccupation
Table 1: Changes in Occupation Structure
The impact of deterioration rather changes in thecourse of the river Jalangi on occupation is prominenton those people, who are directly related to the riverfor their livelihood. They are fishermen. In most caseswithout any exception, it was found that fishermen haveshifted from their ancestral profession of fishing torickshaw puller or day laborer. Some of them have movedto other states like Kerala and Maharastra to earn theirlivelihood mainly as waiter to hotels or as mansions.Another important occupation where the presentgeneration has shifted from their ancestral one is handloom weaving. Percentage of workers in this occupationhas increased considerably in present generation.
Impact of changes and deterioration of the course of the river Jalangi on occupation
Occupation
No. of workers engaged per generation Present
Generation % Father’s % Grandpa’s % Agriculture 2018 47.11 2514 58.68 2254 52.61 Fishing 231 5.39 623 14.55 896 20.92 Handloom 1015 23.69 701 16.36 432 10.08 Service 168 3.92 81 1.89 113 2.64 Handicraft 78 1.82 64 1.49 108 2.53 Day labor 277 6.47 67 1.56 51 1.19 Rickshaw puller 132 3.08 23 0.54 7 0.16 Others 365 8.52 211 4.93 423 9.87 Total 4284 100 4284 100 4284 100
Source: Field survey.
Crying with the River: A Study on a Dying River . . .

Life and Living Through Newer Spectrum of Geography20
As fish population in the river Jalangi has beendecreased alarmingly, it is not only difficult ratherimpossible to earn livelihood by fishing. As a result mostof the fishermen are either engaged in other occupationalong with fishing or leaving their ancestral occupationchoosing another one that gives them more income.
5. Conclusion and Recommendation
The life line of particular place is the river flowingthrough it. Jalangi is the life line of the district of Nadiaand it controls the socio-economic-cultural or better tosay every sphere of life of the people especially offishermen living on the banks of the river. Decaying ofthe river exerts great influence on fishing which wasthe main source of earning of fishermen. Fishermen’sCo-operative cannot work for its goal of povertyalleviation because of so called rich and politicallyinfluential members of the society. River is now recklesslybeing used by those few rich fishermen depriving thelarge number of poor fishermen.
Fishermen has lost their ancestral occupation andshifted to other occupation like rickshaw puller, day labor,etc. Although, some other pulling factors are there, yetas per their opinion, sharp decrease in catch due todifferent prohibitive factors to catch fish from river haspushed them to choose alternative occupation.
6. References
1. Bagchi, K.(1978), Diagnostic Survey Of Deltaic West Bengal,A Research And Development Project, Department OfGeography, Calcutta University, P- 17
2. Basu S. R. (1972), The significance of the Farakka BarrageScheme, Indian Journal of Regional Science, Cal, Vol.-iv,No.-1, PP-69-75.
3. Biswas, K. R. (2001), Rivers Of Bengal, Vol-II, Govt. OfWest Bengal, P- 87,107

21
4. Das B.C. and Mukherjee B. N. (1966) ‘IntermediateDynamics’ 11th Edition, cited from Basu. S. R. andChakravorty. S.C., (1972) Some Consideration over TheDecay of The Bhagirathi Drainage System, The Bhagirathi-Hooghly Basin, Proceedings of the InterdisciplinarySymposium, ed- Bagchi. K., University of Calcutta, p-59-77
5. Das, B. C. (2013), Changes And Deterioration Of The CourseOf River Jalangi And Its Impact On The People Living OnIts Banks, Nadia, West Bengal, Ph.D. Thesis, University ofCalcutta
6. Hirst, Major F.C. (1916), Report on the Nadia Rivers 1915,in Biswas K.R. (2001), Rivers of Bengal, Vol-III, Govt. ofWest Bengal, p-108-113
7. Majumder S. C, (1941), Rivers of the Bengal Delta, ed-Biswas K.R.2001,Rivers of Bengal, Department of HigherEducation, Govt. of West Bengal, p-17,18,54
8. Majumder, D. (1978), West Bengal District Gazetters Nadia.Govt. of W. B. p-5,7,16
9. Majumder. S. (1995), Sri Chaitanya Janmasthan Bitarka TarTruti O Samadhan; Nabadwip, p-37
10. Martin, I. (1994), Legacy and Testament, the Story ofColumbia River Gillnetters. Pullman: Washington StateUniversity Press, 1994
11. Matin, M. A. (2010), River pollution in Bangladesh: Unabatedatrocity on people's right to safe water, A Report
12. Moor Committee’s Report (1919), Report on the Hooghlyriver and its headwaters, in Biswas K.R. (2001), Rivers ofBengal, Vol-II, Govt. of West Bengal, pp- 1-15
13. Mukherjee R. K. (1938), The Changing Face of Bengal, Astudy in riverine economy, C.U, reprinted in 2009, p-6,116
14. Mukherjee, B.B. (1932), Final Report on Survey andSettlement Operation In the District Of Murshidabad, Govt.of Bengal, p-3-8,74,75,76,96,125-127
15. Mukherjee, B.B. (1932), Final Report on Survey andSettlement Operation In the District Of Murshidabad, Govt.of Bengal, p-3-8,74,75,76,96,125-127
Crying with the River: A Study on a Dying River . . .
Life and Living Through Newer Spectrum of Geography22
16. Pramanick, A. (2005), "Rivers Wreak Havoc". Bengal. TheStatesman, 27 August 2005.
17. Reaks H.G. (1919), ‘Report on the Physical and HydraulicCharacteristics of the Rivers of the Delta’, In Report onthe Hooghly River and Its Head-Waters. Vol-I, The BengalSecretariat Book Depot, Calcutta, 1919, In Rivers Of Bengal,edited Biswas (2001), Vol-II, Govt. Of West Bengal, P- 87,107
18. Reaks H.G. (1919), ‘Report on the Physical and HydraulicCharacteristics of the Rivers of The Delta’, In Report onthe Hooghly River and Its Head-Waters. Vol-I, The BengalSecretariat Book Depot, Calcutta, 1919, In Biswas (2001),Rivers Of Bengal, Vol-II, Govt. Of West Bengal, P- 87,107
19. Richards, K. (1982) Rivers Form and Processes in AlluvialChannels, Methuen and Co. New York, p- 11
20. Rudra, K. (1998), ‘Problems of navigation in Calcutta portand 1996 water treaty’, Environment and development,Shantiniketan, pp-140-148
21. Rudra, K. (2010), Banglar Nadikatha. In Bengali, SishuSahitya Sansad Pvt. Ltd, Kolkata. p-36-40
22. Annual Report, 2012-13, Department Of AnimalHusbandry,Dairying & Fisheries. Annual, New Delhi:Ministry of Agriculture, Government of India, 2013.
23. Department, Bengal Irrigation. (Annual Report on MajorRivers, Nadia River Division. Annual, Govt. of Bengal,1932, 25.
24. Irrigation and Waterways Directorate. Hydrological Recordsof the river Jalangi. daily, Krishnagar: Govt of West Bengal,2009.
25. Survey of India. Topographical Map No. 78D/5 and FieldSurvey 2009. Map, *: Govt. of India, 1917.
26. Martin, I. (1994) Legacy and Testament, the Story ofColumbia River Gillnetters. Washington: Pullman:Washington State University Press
27. West Bengal Wetlands And Water Bodies ConservationPolicy. Special, Kolkata: Department Of Environment,Government Of West Bengal, 2012.

23
2Mapping of Waterlogged SalinityAreas in Jhajjar District: Haryana
Anil Kumar
ABSTRACT
Satellite Remote Sensing integrated with GeographicalInformation Systems (GIS) is an excellent tool ofmapping and monitoring of surface waterlogged areas.In the present study, surface waterlogged areas weredelineated in 5 blocks of the Jhajjar District, Haryanausing Indian Remote Sensing Satellite (IRS-1D) -LISS-III data acquired during the period of pre-monsoon (03 March 2006) and post-monsoon (10Oct.2006). Digital Image interpretation techniquecombined with on screen digitization used to identifythe different waterlogged areas in district on 1:50,000scale. Permanent waterlogged and seasonalwaterlogged areas were identified for the study areaby integrating the waterlogged areas derived forboth the pre- and post-monsoon seasons under GISenvironment. Results show that the total surfacewaterlogged area in Jhajjar district is 162.14 sq.km. Surface waterlogged area covers 8.84% of thetotal geographical area of Jhajjar District. Totalseasonal waterlogged area is 144.60 sq. km. andpermanent waterlogged 17.54 sq. km. Maximum
Mapping of Waterlogged Salinity Areas in Jhajjar District

Life and Living Through Newer Spectrum of Geography24
seasonal waterlogged area is observed in Beri khasBlock and maximum permanent waterlogged observedin Bahaduragh Block. The study demonstrates utilityof integration of remote sensing and GIS techniquesfor Mapping of waterlogged areas particularly inregions where waterlogging conditions occur.
Keywords: Waterlogging, Remote sensing &Geographical Information System (GIS).
Introduction
Water-logging is a dynamic phenomena and it isdifficult to interrelate the causative factors to get thereliable solution. Water logging is major problems affectingthe agricultural productivity and sometime becomes toosevere to take it out from economic crop production. InIndia, it is estimated that about 6.0 m ha land is affectedfrom various nature and order of water logging Waterlogging is when the soil surface area becomes saturated.Soil pores (spaces) are full of water. Excess water cannotdrain. Over watering with irrigation causes water logging.Water logging happens in those low-lying areas that lackthe natural ground water outlet channels such as a nallahor a rivulet. It is a natural phenomenon on the earththat some part of it is elevated and some are low lying.
Remote sensing (RS) and geographical informationsystem (GIS) offers convenient solutions to map the extentand severity of water logging, particularly in large areas.An efficient and proper use of land, water and otherresources requires systematic management of the relevantdata and information, which is spatial in nature. Manualhandling of such voluminous data is time consumingand expensive. Under such situation, a powerful toollike GIS provides enormous potential for efficient storing,handling, manipulating, and visualization, updating andanalyzing multiple spatial data sets in systematic way.The objective of this chapter is to present a review on

25
selected papers on application of RS and GIS for studyingthe waterlogged areas.
Study Area
Jhajjar district of Haryana lies between 28º 22’: 28º49’ north latitudes, and 76º 18’: 76º 59’ east longitudes.Total geographical area of the district is 1834 sq.km.Administratively, the district is controlled by Rohtakdivision. It is divided into 5 development blocks namelyJhajjar, Beri, Bahadurgarh, Matenhail and Salahwas. Thedistrict area falls in Yamuna sub-basin of Ganga basin,and is mainly drained by the artificial drain No. 8 flowsfrom north to south. Jawahar Lal Nehru feeder andBhalaut sub Branch are main canals of the district. Areaunder Canal irrigation is about 690 sq. km. in the district.
Fig. 1: Location of the study area
The climate of the district can be classified as tropicalsteppe, semi-arid and hot which is mainly characterizedby the extreme dryness of the air except during monsoonmonths, intensely hot summers and cold winters. Duringthree months of south west monsoon from last week ofJune to September, the moist air of oceanic origin penetrate
Mapping of Waterlogged Salinity Areas in Jhajjar District

Life and Living Through Newer Spectrum of Geography26
into the district and causes high humidity, cloudinessand monsoon rainfall. The period from October toDecember constitutes post monsoon season. The coldweather season prevails from January to the beginningof March and followed by the hot weather or summerseason which prevails up to the last week of June.
The normal annual rainfall in Jhajjar district is about444 mm spread over 23 days. The south west monsoonsets in the last week of June and withdraws towardsthe end of September and contributes about 85% of theannual rainfall. July and August are the wettest months.15% of the annual rainfall occurs during the non-monsoonmonths in the wake of thunder storms and westerndisturbances.
Fig. 2: Drainage Networks

27
The area forms a part of Indo- Ganga alluvial plain.Physiographically the district area is dotted with sanddunes and very small isolated hill in south western partand rest is alluvial plain. Alluvial plains are by andlarge flat. And elevation in the district ranges from 212to 222m above MSL. The soils of the district are fine tomedium textured. It comprises sand to sandy loam innorth eastern part covering Bahadurgarh, and Jhajjarblocks.
Objective
1. Map the Seasonal and permanent waterloggedareas of Jhajjar District.
2. To study the impact of waterlogged areas onagriculture land.
3. To identify the Salt-Affected Area in Jhajjar District.
Data Used
Satellite data: IRS-ID LISS-III (3 March 2006) and IRS-ID LISS-III (10 Oct.2006)
Fig. 3bFig. 3a
Mapping of Waterlogged Salinity Areas in Jhajjar District

Life and Living Through Newer Spectrum of Geography28
Methodology
Fig. 4: Showing waterlogged during Pre monsoon season(Permanent Waterlogged).
A systematic Digital Image interpretation techniquecombined with on screen digitization of the IRS-ID LISS-III pre-monsoon (3 March 2006) satellite data and post-monsoon IRS-ID LISS-III (10 Oct.2006) satellite data (Fig.3a&b) for the year 2006-07 on 1:50,000 scale, by overlayingthe base map and other ancillary information. Based onthe differential tone, texture, pattern, shape, size andassociation the waterlogged area and salt affected Areawere characterized and classified under differentcategories. The waterlogged area (Fig. 4&5) was classifiedunder two categories, pre monsoon and post monsoon.The waterlogged area was very clear in dark blue tobluish black tone during pre monsoon and in bluishblack to light bluish tone during post monsoon. Thearea under salinity (Fig. 6) was also classified where the

29
salt was clearly visible on the image as “salt affected”area. The salt affected area appeared in white to yellowishwhite tones. The LISS III data used for pre monsoondue to spatial and a better spectral resolution allowedmapping of scattered small patches of waterlogged andsalt affected areas. Block boundary were superimposedover the water logging and salinity maps for the areaestimation block wise in GIS (ArcGIS 9.2) environment.Based on the satellite interpretation and area statisticsto find out the major causes responsible for this problem.
Fig. 5: Showing waterlogged during Post monsoon season (Seasonal)
Fig. 6: Showing salt-affected Area during pre monsoon season
Mapping of Waterlogged Salinity Areas in Jhajjar District

Life and Living Through Newer Spectrum of Geography30
Results and Discussion
The waterlogging was found to be predominant alongthe western side of the canal. (Jhajjar Sub Branch). Thearea statistics generated through spatial database createdin GIS (Geographical Information System) environmentreveals that the district covered 0.96% or 17.54 sq. km.area during pre monsoon (Permanent waterlogged), 7.88%or 144.60 sq. km. area during post monsoon (seasonalwaterlogged) is affected by waterlogging and 0.98% or18.25 sq. km. of land during pre monsoon is affected bysalinity (Table1).
Table 1: Pre monsoon and post monsoonwaterlogged and salt affected area statistics for
Jhajjar district
Table 2: Pre monsoon waterlogged area statisticsBlock wise
Category Pre Monsoon (Sq.k.m.) %
Post Monsoon (Sq.k.m.) %
Total Area(Sq.k.m.) %
Waterlogged Area 17.54 (0.96%) 144.60 (7.88%) 162.14 (8.84%)
Salt Affected Area 18.25 (0.98%) Not Assessed 18.25(0.98%)
Note: Figures in parenthesis are percentage of the total geographical area of the district.
Season Blocks Waterlogged Area in
(Sq.k.m.) % of Waterlogged
Area
Pre Mansoon Bahadurgarh 11.15 0.61%
Beri khas 1.89 0.10%
Jhajjar 0.37 0.02%
Matanhail 3.45 0.19%
Sahlawas 0.68 0.04%
Total 17.54 0.96%
Note: Figures in parenthesis are percentage of the total geographical area of the district.

31
Maximum seasonal waterlogged area has beenobserved in Beri khas Block 3.28% or 60.24 sq. km. andmaximum permanent waterlogged observed inBahaduragh Block 0.61% or 11.15 sq. km. (Table 2&3).During the pre mansoon in beri khas block has observedmaximum area ( 0.38% or 7.01 sq. km.) affected by salinity(Table 4).
Table 3: Post monsoon waterlogged area statisticsBlock wise
Table 4: Pre monsoon Salt Affected Area statisticsBlock wise
Season Blocks Waterlogged Area in
(Sq.k.m.) % of Waterlogged
Area
Post Mansoon Bahadurgarh 31.17 1.70%
Beri khas 60.24 3.28%
Jhajjar 33.94 1.85%
Matanhail 8.96 0.49%
Sahlawas 10.29 0.56%
Total 144.6 7.88%
Note: Figures in parenthesis are percentage of the total geographical area of the district.
Season Blocks Salt-Affected in (Sq.k.m.) % of Salt-Affected
Pre Monsoon Bahadurgarh 3.19 0.17%
Beri khas 7.01 0.38%
Jhajjar 6.09 0.33%
Matanhail 0.59 0.03%
Sahlawas 1.37 0.07%
Total 18.25 0.98%
Note: Figures in parenthesis are percentage of the total geographical area of the district
Mapping of Waterlogged Salinity Areas in Jhajjar District

Life and Living Through Newer Spectrum of Geography32
The relationship between pre and post monsoonwaterlogged area Fig. 7 has shows that maximumSeasional waterlogged area for Jhajjar District is 3.28%of Beri khas block, and Maximum Permanent waterloggedarea is 0.61% of Bhadurgarh block. waterlogging andsalinity for pre monsoon season (Table 4) shows that forall Block area under salinity is more except for Matanhailblock, where area under waterlogging is 3.45 Sq.k.m (19%)of total geographical area of the Jhajjar District.
The satellite data interpretation clearly identies thatwaterlogging and salinity problem in Jhajjr District ismainly due to the Presence of numerous naturaltopographic depressions. Canal seepage is the reasonfor the increase in area under waterlogging in JhajjrDistrict during post monsoon season. Whereas, in BeriKhas the waterlogging problem is mainly the result ofcanal seepage, occurring from the damaged canal liningportions. Therefore, areas near canal banks are found tobe permanently waterlogged in this block.
Fig. 7: Relationship between waterlogged area during preand post monsoon
Conclusion
Multi-temporal satellite data used to continuousmonitoring of the waterlogging dynamics. Integrated
1.70
0.61
3.28
0.10
1.85
0.02
0.49
0.190.56
0.04
0.00
0.50
1.00
1.50
2.00
2.50
3.00
3.50
% A
rea
Bahadurgarh
Beri khas
JhajjarMatanhail
SahlawasBlocks
Waterlogged Area Pre And Post Monsoon Blockwise
Post Monsoon Pre Monsoon

33
analysis of spatial and non spatial data parameters inGeographical Information System (GIS) environment mustbe made use of for any kind of decision making. Theseepage from the unlined and damaged portions of canaland distributaries contribute significantly to thewaterlogging and subsequent salinization problem. Theborrow pits near the canal in filling are continuouslysubmerged by the seeping water from the canals andalso from irrigation and rain water as well. The heavyrain during monsoon season at times is also responsiblefor waterlogging. The area being low lying and devoidof any natural streams soon turns up into a pondedzone. In the years of above normal rainfall, the run offwater accumulates in low lying areas resulting insubsequent water logging. Farmers of the district mostlypractice flood irrigation and still have to be accustomedto scientific practices of irrigation. The water percolatingthrough the soil profile contains majority of the saltsleft behind by evaporation and transpiration phenomenon.As the water moves through the soil profile, it maypick up additional salts by dissolution. In addition, somesalts may be precipitated in the soil; while there will bean exchange between some salt ions in the water appliedto the land. Thus over irrigation also results inWaterlogging in the Jhajjar District.
References
• Bhamrah, P.J.S. (1998) Non-judicious use of water resources,suggestions for sustainable management. CongressInternational DE KASLIK-LIBAN. 18-20 June.
• Chana, K.S. (2003) Condition of Muktsar farmers living inwaterlogged affected areas is pathetic. Ajeet. May 7.
• Chopra, Rajiv., Verma, V.K., Sharma, P.K. and SinghCharanjit.(1998). Surface flooding and waterlogging in southwestern districts of Punjab. Technical report, Punjab RemoteSensing Centre Publication: 1-20.
• Dhillon, G.S. (1997) Waterlogging Menace in Muktsar. TheTribune. October 2.
Mapping of Waterlogged Salinity Areas in Jhajjar District

Life and Living Through Newer Spectrum of Geography34
• Sharma, R. Water table (2007): Going down deep intodepletion. Hindustan Times. June 24, 2003.
• Ground Water Information Booklet, Jhajjar district, Haryana
• Sharma, P.K., Verma, V.K., Litotia, P.K., Sood, Anil., Loshali,D.C., Kumar, Ashok., Singh Charanjit., Bhatt, C.M. andChopra, Rajiv. (2003). Resource Atlas Muktsar District, PunjabRemote Sensing Centre Publication.
• Walia, V. (1997) Cotton crop worth 200 crore damaged,The Tribune. September 4, Vol. 117, No. 235.

35
3Is Severity of River Bank ErosionProportional to Social Vulnerability?A Perspective from West Bengal, India
Aznarul Islam & Dr. Sanat Kumar Guchhait
ABSTRACT
In post-Farakka period, the fluctuating river dischargeby artificial control of river regime has regulatedthe river bank erosion year the round. The tributariesespecially the River Ajay by its huge sediment anddischarge in monsoon period has accelerated thebank instability in the lower reach of River Bhagirathimainly in between the confluence zone of Ajay-Bhagirathi in north and Jalangi-Bhagirathi in thesouth of West Bengal, India. This huge bank erosionhas snatched the land and lives of the thousands ofpeople in this region. Consequently, there has beensubstantial decrease in the agricultural output. Thatis why, their economy is practically paralyzed. Inmost cases, they are caught in debt trap. Thisunstable economic structure has led to socialinstability. Crimes, moral erosion of values, childlabour are increasing day by day. But severity ofbank erosion is not always proportional to the socialvulnerability because social vulnerability isdetermined by the socio-economic factors too.
Is Severity of River Bank Erosion Proportional to . . .

Life and Living Through Newer Spectrum of Geography36
Key-Words: river bank erosion; social vulnerability;West Bengal; River Bhagirathi; Rukunpur andMatiari Mouza
1. Introduction
River bank erosion in socio-economic perspective isone of the most important issues in fluvial geomorphology,hazard management and environmental sociology. Riverbank erosion and channel instability is one of the mostimportant hazardous phenomena over the Gangetic deltaicregion (Bandyopadhyay, 2007). The middle and the lowerreaches of the river Bhagirathi is very erosion proneregion. During 1988 and 1994, the total land eroded is206.60 Sq. Km.; total numbers of families affected are14236; and total population displaced (projected) 79190in Murshidabad District alone ( Rudra, 2011).In the lowerreach of river Bhagirathi 46 mauzas adjacent to riverBhagirathi in Nadia District is badly affected by the bankerosion (Islam and Guchhait, 2012). The erosion in thisreach is very severe. In the lean period erosion is dueto the effect of controlled hydrology after the constructionof Farakka Barrage in 1975 and the erosion in the freshetperiod (monsoon months) is mainly due to thecontribution of Ajay-Mayurakshi system(Islam, 2013). Bankerosion has created enormous loss of lives and propertiesin the mouzas of this belt. The degree of marginalizationof the people of the mouzas not only depends upon theseverity of bank erosion but the social outlook and theeconomic structure of the people also. The present paperseeks to unfold the social vulnerability andmarginalization of the rural people of West Bengal inrespect of bank erosion and other socio-economic factorsby empirical micro level field verification.
2. Study Area
For carrying out the present research work the tworepresentative Mouzas from two C.D Blocks of Nadia

37
District adjacent to the River Bhagirathi (in between theconfluence zone of River Ajay and Jalangi) have beenselected. These two Mouzas are 1) Matiari of C.D. BlockKaliganj, 2) Rukunpur of C.D. Block Krishnagar II (Fig.1). Rukunpur and Matiari are conspicuous by theirseverity or very high nature of erosion. In the very higherosion (severe) belt the two mouzas i.e Rukunpur andMatiari have been taken so as to assess whether severityof erosion is the only cause of degree of victimization.Rukunpur is basically agriculture based area whereasthe Matiari Mouza once having the parallel economy ofagriculture and brass metal industry and now deviatedfrom the land based economy to brass metal industry.
3. Materials and Methods
i) Secondary data
a) District Census Handbook, Nadia from 1961 to2001,
b) ‘Annual Reports on River Bhagirathi, for variousyears from 2003-04 to 2008-09, and Index Plan ofthe Bhagirathi River prepared by Hydraulic StudyDepartment, Kolkata Port Trust.
c) The secondary data mainly Mouza maps fromdistrict land revenue office, Nadia, West Bengal
d) Satellite images of the study area from GoogleEarth, 2012.
ii) Primary Data
The primary data for carrying out the research havebeen collected from field survey taking 20% samplehousehold on a random basis from the two selectedvillages viz. Matiari and Rukunpur. As per 2001 census,out of 2984 households at Matiari, 597 households; outof 914 households at Rukunpur, 183 sample householdshave been taken as the samplesize.
Is Severity of River Bank Erosion Proportional to . . .

Life and Living Through Newer Spectrum of Geography38
Fig. 1: Location of the Study Area
The present work has followed a systematicmethodology to reach the desired goals. The methodologyhas been presented as a flow chart in the followingmanner (Fig. 2).

39
Fig. 2. Methodology of the work
4. Results and Discussion
The whole discussion has been systematically
Is Severity of River Bank Erosion Proportional to . . .

Life and Living Through Newer Spectrum of Geography40
subdivided into three heads viz. Nature of bank erosion,impact of bank erosion on economy and degree ofvictimization discussed in the following sections.
4.1. Nature of bank erosion in the representative mouzas
The course of river Bhagirathi-Hooghly has undergonechanges during last few centuries (Chatterjee, 1989). Thedescriptions by various scholars viz. Rennell (1788),Colebrooke (1801), Sherwill (1858), Hirst (1915), Mukherjee(1938), Bandyopadhyay (1996), Ray (1999), Bhattacharya(2000), and Rudra (2010) have established the frequentshifting nature of Ganga Channel . So the channel shiftingof Ganga or Bhagirathi-Hooghly system has drawnattention from time immemorial. In this section oscillatingnature of Bhagirathi has been traced at very micro level.The extent of river shifting has been shown along theRukunpur and Matiari mouzas of Nadia District, WestBengal during the period 1920s and 2012.
River bank in lower reach of the river Bhagirathi isvery unstable. The investigated mouzas are located withinthis area- the area in between the two confluences ofRiver Ajay with Bhagirathi and River Jalangi withBhagirathi. It is to be noticed that banks of Bhagirathiin this segment is always oscillating within a limit asfar as the past study is concerned. Generally, there isnear about 200-240 years cycle of fluvial swing (Islam,2012). This frequent oscillating nature of the river makesthe mouzas and mouza boundaries unstable. From thecomparative study of the mouza maps of 1920s and therecent maps of 2012 based on field survey and Googleearth images, it is observed that both the mouzas arethreatened by the hazard of river bank oscillation.

41
Fig. 3: River Bhagirathi and Rukunpur Mouza:(a) 1920 (b) 2012
Fig. 4: River Bhagirathi and Matiari Mouza:(a) 1920 (b) 2012
In case of Rukunpur Mouza, the River Bhagirathihas moved from south-western portion from 1920s to anorth-eastern part in 2012 (Fig.3 a & b). During thisperiod of almost 100 years, the single channel Bhagirathiturned into a bifurcated channel and the charland has
Is Severity of River Bank Erosion Proportional to . . .

Life and Living Through Newer Spectrum of Geography42
formed within the channel. For this mouza more than27 % land i.e. 0 .75 Sq. Km out of total area of 2.7357Sq. Km was lost during this time period (Fig. 5).
For Matiari, the river has moved towards north ofthe mouza, more specifically towards the interior portionof the Matiari Mouza. During the period of 1920 to 2012,the mouza has lost more than 14% land i.e. 0.885 Sq.km. out of total area of 6.192 sq. km (Fig.4 a & b ).
Fig 5: Percentage of land loss during 1920-2012
The first and foremost important shock thatimmediately comes through bank erosion is the loss oflanded property. In the surveyed mouzas it is revealedthat more than 60% households have lost their land. Itis to be noted that lion’s share of the households haveexperienced huge loss of agricultural land in both themouzas. Mouza level survey shows that among the lossof landed properties agricultural land loss tops the list.In both the mouzas, loss of agricultural land is morethan 90% (Fig. 6).
Agricultural land loss is a common parlance in thebank erosion prone areas all over the world. In recentdays bank erosion and agricultural land loss has become

43
so much intertwined that numerous scholars are devotedto unfold their inquiry from economic and socialperspectives. This work also did not intend to deviatefrom such past works in this point. Empirical survey inthe selected mouzas indicates that farmers in the Matiariand Rukunpur mouzas are most threatened by agriculturalland loss (Islam, 2013). Here more than 40% farmershave lost 5 bighas or more land in the concerned mouzasor adjacent as well as nearby mouzas ( Fig. 7). InRukunpur more than 13% farmers have lost 16 bighasor more land. It is really a horrible in the scenario fromthe perspective of mouza economy of India.
In respect of proportion of land loss, it is observedthat farmers of Matiari and Rukunpur are most victimized.In Matiari mouza more than 69% farmers have lost 90%or above of their agricultural land. Similarly, in Rukunpurmouza nearly 47% farmers have lost 90% more.
Fig. 6: Types of land lost (Source: Field Survey, 2012)
Is Severity of River Bank Erosion Proportional to . . .

Life and Living Through Newer Spectrum of Geography44
Fig. 7: Magnitude of land loss of the farmers,
(Source: Field Survey, 2012; Total farmers: 152 for Rukunpur and362 for Matiari).
4.2. Impact of Bank Erosion on Economy
Shift in income sources are important to detectdeviation in the economy from farm to non-farm sector.Sample survey in the selected mouzas suggests that from1st generation (Base Year, 1970) to 3rd generation (BaseYear, 2012), there is a gradual increase in the incomelevel in case of Matiari while in case of Rukunpur thereis steady or sharp fall in the average per capita incomelevel during the same period (Islam, 2013). It is to benoted that in case of Rukunpur, there is steep fall in theincome level. Per capita monthly average income hascome down to Rs.614 in 2012 from Rs.1104 in 1970 onthe basis of 2012 price level (Fig.8a).

45
Fig. 8 (a) Temporal variation in income at RukunpurMouza(Source: Field Survey, 2012; Total respondents: 183 in
each generation)
Fig. 8 (b) Temporal variation in income at MatiariMouza(Source: Field Survey, 2012;Total respondents 597 in
each generation)
It is reality that in all the mouzas per capita averageincome from agriculture is falling. The steeper fall hasbeen noted for Matiari (Fig. 8b). Because most of thepeople are involved in non farm activities in Matiari. Incase of non agricultural income both the mouzas haveregistered positive growth but Matiari outcompeted
Is Severity of River Bank Erosion Proportional to . . .

Life and Living Through Newer Spectrum of Geography46
Rukunpur in this respect. This shows that fall inagricultural income level is common but if the non farmincome does not increase, the economy will collaspe.That has really happened in case of Rukunpur.
Concerning occuaptional diversity of individual itbecomes clear that after losing land through bank erosionmany people have been involved in more than oneoccuaptions in a financial year. Individual occupationaldiversity measures how many occupation types aninvidual is involved in within a financial year. Mouzalevel survey indicates that individual occuaption diversityhas decreased in case of Matiari in the third generation(Table 1).
Table 1: Nature of Occupational involvement atindividual level
Note: M =Matirai, R= Rukunpur, and 1 for 1st generation, 2 for2nd generation and 3 for 3rd generation
The higher the occupational diversity at individuallevel, the lesser is the stability in the economy. It hasbeen observed that occupational diversity at individuallevel has increased in the third generation for RukunpurMouza while the reverse picture has been noted forMatiari. It is due to presence of stable brass metaleconomy in MatiariMouza.
Abbreviation
of Mouzas
and generati
on
No. of Occupation(s) an individual involved in an economic year (Absolute Figure of Respondents)
No. of Occupation(s) an individual involved in an economic year (Percentage Figure of Respondents)
One Two More than two
Total One Two More than two
Total
M1 478 119 0 597 80.07 19.93 0.00 100.00 M2 466 131 0 597 78.06 21.94 0.00 100.00 M3 485 112 0 597 81.24 18.76 0.00 100.00 R1 145 38 0 183 79.23 20.77 0.00 100.00 R2 135 48 0 183 73.77 26.23 0.00 100.00 R3 118 61 4 183 64.48 33.33 2.19 100.00

47
Regarding the family budget, it can be mentionedthat family budget (income, expenditure and savings)are diminishing day by day for Rukunpur and in thirdgeneration savings has come to negative while Matiarihas registered a consistent increase in family budget (Fig.9).
Fig. 9: Mouza wise Family Budget
(Source: Field Survey, 2012; Total respondents: 183 for Rukunpur,597 for Matiari in each generation)
Above discussion regarding income, expenditureandsavings reveals that satisfaction of the respondentsregarding occupation is bound to fall for Rukunpur.Torepresent the degree of satisfaction, satisfaction indexafter Hall, Yan and (1975) has been calculated accordingthis formula: (satisfied respondents-dissatisfiedrespondents/total respondents). The index value rangesfrom +1 to -1 denoting 100 % satisfied respondents and100% dissatisfied respondents respectively. Perceptionsurvey shows that across the generations there is a gradualfall in the level of satisfaction and in case of thirdgeneration satisfaction level has come down to negativefor Rukunpur. So, most of the respondents are dissatisfied
Is Severity of River Bank Erosion Proportional to . . .
Life and Living Through Newer Spectrum of Geography48
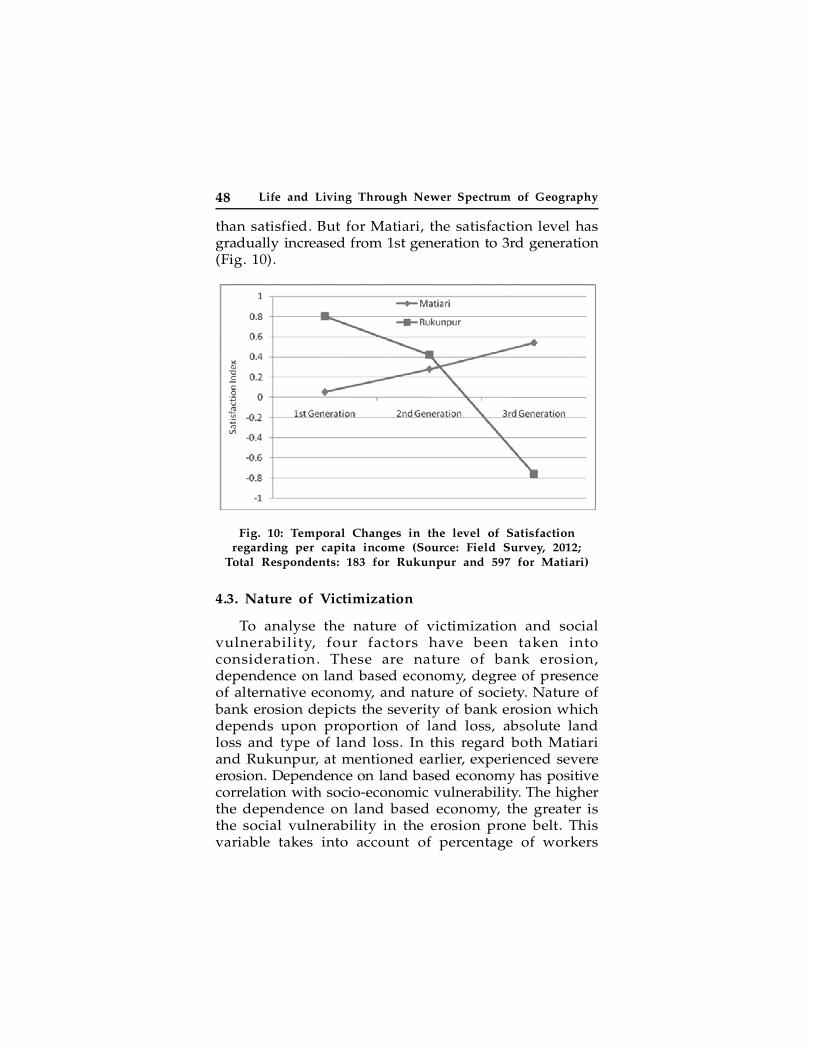
than satisfied. But for Matiari, the satisfaction level hasgradually increased from 1st generation to 3rd generation(Fig. 10).
Fig. 10: Temporal Changes in the level of Satisfactionregarding per capita income (Source: Field Survey, 2012;
Total Respondents: 183 for Rukunpur and 597 for Matiari)
4.3. Nature of Victimization
To analyse the nature of victimization and socialvulnerability, four factors have been taken intoconsideration. These are nature of bank erosion,dependence on land based economy, degree of presenceof alternative economy, and nature of society. Nature ofbank erosion depicts the severity of bank erosion whichdepends upon proportion of land loss, absolute landloss and type of land loss. In this regard both Matiariand Rukunpur, at mentioned earlier, experienced severeerosion. Dependence on land based economy has positivecorrelation with socio-economic vulnerability. The higherthe dependence on land based economy, the greater isthe social vulnerability in the erosion prone belt. Thisvariable takes into account of percentage of workers

49
engaged as farmers. In this variable Rukunpur registershigher dependence on agriculture than Matiari becausein Rukunpur more than 75 % are farmers while for Matiariit is less than 40%. The third variable i.e. degree ofpresence of alternative economy is a positive indicatorof development. This variable takes into account ofpercentage of workers engaged in non land basedeconomy or the economy not directly dependent on thenurturing of land (e.g. secondary or tertiary economicactivities). The higher the percentage of workers engagedin non land based economy, the lesser is the risk frombank erosion. In Rukunpur less than 35% people areengaged in non land based economywhile for Matiari itis more than 60%. Fourth variable i.e. the nature of societyis very significant for determining its vulnerability.Outlook of the member of the society,whether modernor traditional, determines society’s strength or weaknessto combat a hazard. For Rukpunpur the members of thesociety bear traditional outlook and reluctant to acceptnew emerging economy, while Matirians are literate andready to accept the new economic order.
5. Conclusion
From the above discussion, it can be mentioned thatbank erosion definitely controls the socio-economic fabricof a particular society. Bank erosion induces socialvulnerability. But its extent depends upon the other factorsof a society viz. the outlook of the society, dependenceon the land based economy, presence of the alternativeeconomy. Despite the presence of severe bank erosionin Rukunpur and Matiari Mouza, Matiari has experiencedrelatively little socio-economic vulnerability mainly dueto the presence of an alternative brass metal industrythat acted as a shock absorbing economy. Finally it canbe concluded that although bank erosion drags aneconomy and society towards to backward direction,severity of bank erosion is not always proportional tothe social vulnerability.
Is Severity of River Bank Erosion Proportional to . . .

Life and Living Through Newer Spectrum of Geography50
6. Acknowledgements
I express my gratitude to the respondents of theMatiari, and RunkunpurMouzas for giving their valuabletime during survey. I am also grateful to District Landand Land Revenue Officer, Nadia for providing me theMouza Maps of the study area and Census office ofIndia, Kolkata for providing me census data for theselected Mouzas.
7. References
1. Bandyopadhyay, S. (1996). Location of Adi Ganhga PaleoChannel, S. 24 Parganas, West Bengal. Geographical Reviewof India, 58 (2), 93-109.
2. Bandyopadhyay, S. (2007): Riverbank and Coastal ErosionHazards: Mechanisms and Mapping in Basu, R. and Bhaduri,S. (editors): Contemporary Issues and Techniques inGeography, Progressive Publishers, Kolkata 73, pp.36-72.
3. Bhattacharya, K. (2000). Bangladesher Nadnadi o Parikalpana(pp.10-19). Kolkata: Vidyoday Library Private Ltd.
4. Chatterjee, S.N. (1989). River System of West Bengal (pp.9-24). Kolkata: River Research Institute, Govt. of West Bengal.
5. Colebooke, R.H (1801). On the Courses of Ganges throughBengal. Asiatic Researchers, 7, 1-31.
6. Hall et.al (1975) Satisfaction Index in Majumder, K.A.et.al(2007): Urban Environmental Quality Mapping: A PerceptionStudy on Chittagong Metropolitan City, KathmanduUniversity Journal of Science Engineering, and Technology,VOL.I, No.IV,August, 2007.
7. Hirst, F.C. (1915). Reports on Nadia Rivers. Reprinted inRiver of Bengal, Vol. III (2002) (pp. 1-180).Calcutta:Gazetteers Dept.
8. Islam, A. (2012). Unstable River Bank and the Question ofSocial Stability: A Study on Rukunpur Mouza in C.D. BlockKrishnagar II, Nadia. Journal of River Research Institute –River Behaviour and Control, 32, 53-65.
9. Islam, A and Guchhait, S.K (2012): Hydraulic control andBank Erosion of the River Bhagirathi – a search for socialjustice. An unpublished paper.

51
10. Islam, A (2013). Bank erosion of River Bhagirathi and itsimpact on agriculture and economy in the selected areasof Nadia District, West Bengal. An unpublished M.PhilDissertation.
11. Mukherjee, R.K. (1938). The Changing Face of Bengal (pp.161-190). Kolkata: Calcutta University.
12. Ray, A. (1999). Locational Problems of the sixteenth centuryBengal Coast. Pratna samiksha, Journal o the Directorateof Archaeology and Museum, 6 (8), 121-134.
13. Rennell, J. (1788). Memoir of Hindoostan or Mughal Empire(pp.225-284). London.
14. Rudra, K, (2010). Banglar Nadikatha (pp.24-35). Kolkata:Sahitya Samsad.
15. Rudra, K, (2011): The Encroaching Ganga and Social Conflict:the case of West Bengal, India, unpublished paper, pp. 19-32.
16. Sherwill, W.S. (1858). Report on Rivers of Bengal (pp. 1-18). Calcutta: Savielle Printing and Publishing Co Ltd.
Is Severity of River Bank Erosion Proportional to . . .

Life and Living Through Newer Spectrum of Geography52
4Preservation of Culture ofLepchas Through Ecotourism
Ranjana Laskar
ABSTRACT
Dzongu is characterised by picturesque landscaperich in bio-diversity and also known for the uniqueculture of Lepchas which is closely related to thislandscape. The Lepchas constitute a small minoritygroup of only 6.61% of total population (2001 census)and are considered indigenous inhabitants of Sikkim.The merger of the protectorate of Sikkim with theIndian Union in 1975 ushered the need of socio-economic development which threatened Dzongu andits inhabitants in the name of hydro-electric projects.The development of 7 hydro-electric power projects,for harnessing about 2500MW energy, resulted fatalfor Dzongu and had direct and indirect impacts onLepcha culture. The hydro-power development ledto redefining the land-use pattern, demographicchanges and also cultural erosion of the Lepchas,as their religious practises are linked to theirimmediate environment. This small section ofpopulation also needs development, but a sustainableone. In this regard, this paper brings about analternative route of development that may also be
53
helpful in the conservation of the Lepcha culture,which comes in a way of Ecotourism. The regionhas great opportunities for development of sustainabletourism where the communities participate indeveloping the tourism sector. They preserve theirtraditional custom and landscape as this form thebasic resource of tourists’ attraction. This not onlyhelps in conservation measures, but also enhancesthe scope for employment opportunities, incomegeneration, leading to overall socio-economicdevelopment of the local community. In this context,the Lepchas, a small community found in the SikkimHimalayas can be a part of the development activitieswithout harming their environment and culture.
Keywords: Dzongu, Lepcha, HydropowerDevelopment, Ecotourism
Introduction
Dzongu is a restricted territory located in North Sikkimin the North-Eastern part of India. It is lying at closeproximity to Kanchendzonga Biosphere Reserve. It is theholy land of the Lepchas the indigenous population ofthe state of Sikkim (Hooker, 1855) who are at present aminority, comprising of a small section of Sikkim’spopulation which is only 6.61% of the total state’spopulation in 2001.
The erstwhile Chogyal of Sikkim in order to retainthe unique culture and socio-religious practises of theLepchas declared a sizeable area consisting of thirteenrevenue blocks located on the north of Sikkim skirtedby river Teesta in the east and river Rongyang in thewest, roughly triangular in shape bounded on the northwest by the Kanchendzonga bio reserve and coveringabout 78 sq.km of area as the reserve for the Lepchaswhich is called the Dzongu.
The State of Sikkim with its rugged terrain and swift
Preservation of Culture of Lepchas Through Ecotourism

Life and Living Through Newer Spectrum of Geography54
flowing rivers are ideal for harnessing hydro-electricity.However with the merger of the protectorate of Sikkimwith the Indian Union in 1975, and the need for thesocio-economic development, the Dzongu and itsinhabitants have been threatened in the guise of hydro-power development. This is being resented by a sectionof the Lepchas who feel that hydro-power developmentwill not only redefine the land use pattern but also leadto demographic changes and cultural erosion of theLepchas. It is in this context that the present paperaddresses ecotourism as an alternative development modelfor the Dzongu which will help in conserving the uniqueculture of the Lepchas.
Review of Literature
The Lepchas are known for their retention of richcultural heritage (Bhasin, 2011), which are inextricablylinked with nature. They have developed an elaborateunderstanding of the nature and causes of disasters andalso have identified accurate and precise indicators toassist in predicting disasters, as well as ways and meansof mitigating their effects (Jha & Jha, 2011).
But changing times and modern development havestarted disturbing the delicate eco-system with whichthey have lived so closely over centuries. Bhasin (2011)mentions that the Lepchas are in focus because of theon-going cultural and economic changes which is broughtin by the present process of development in the form ofhydro power development.
“Ecotourism is responsible travel to natural areas thatconserve the environment and sustains the well beingof local people” (The International Eco-tourismSociety).According to the Brundtland Report, whensustainability is applied to the tourism, the definition ofsustainable tourism leads to: ‘a form of tourism whichmeets the needs of tourists, the tourism industry, andthe host communities today without compromising the

55
ability of future generations to meet their own needs’(Drexhage & Murphy, 2010).
Tourism can serve as a strategy to address the rampantpoverty situation in the Himalayas. It can also provideneeded resources for the poor to adapt to the changingenvironment of the Himalayas. The creation of profitablelocal livelihood opportunities in the area will reducetheir vulnerability to global challenges such as climatechange and natural hazards (Kruk, 2009).
Objectives
1. To assess the culture of Lepchas;
2. To analyze the impact of present developmentalactivities in Dzongu; and
3. To assess the present nature of tourismdevelopment in the Dzongu.
Database and Methodology
The data source for this paper is based on bothprimary and secondary sources. Primary data has beencollected through field observation, focused groupdiscussion with some of the Lepcha community leadersand informal interview with different officials and otherlocal residents. The secondary data includes the datagathered from various books and articles; census reportsdealing with Lepcha population; reports from TouristDepartment of Sikkim to know about the tourist flowand availability of infrastructure in the region, tourismbrochure of the area etc. and the methodology istheoretical.
Study Area
Dzongu falls in the picturesque landscape of SikkimHimalayas. It lies in the North district of Sikkim. It isa restricted territory reserved exclusively for the Lepcha
Preservation of Culture of Lepchas Through Ecotourism

Life and Living Through Newer Spectrum of Geography56
community and covers an area of 78 sq. Km extendingfrom 27º28' – 27º38' N latitude and 88º23' – 88º38' Elongitude. It is located in close proximity ofKanchendzonga Biosphere reserve at an elevation rangingfrom 3000ft to 20,000ft above sea level. It is roughlytriangular in shape, bounded on the south-east by theriver Teesta, on the north-east by the river Talung andon the third side by the mountains south of Kanchenjunga.The area is characterised by diverse snowy mountainouslandscape with steep and narrow valleys and gorgeswith well drained slopes. As per 2004 official list ofvoters, it has a total adult population of approximately4513 persons spread over 38 villages. The geographicalposition of Dzongu zone shows its isolation from therest of Sikkim.
Figure 1: Location of Dzongu

57
The Culture of the Lepchas
The Lepchas are the original inhabitants of the stateof Sikkim. They are “MutanchiRong”Kun-rum-kup whichmeans beloved sons of Mother of Creation and AlmightyGod. They call themselves “Rong” which means “ravinefolk” or “mutanchi”, but are referred to by others as theLepchas. Lepchas belong to the Mongolian racial stock.However, opinions differ about the original homelandof the Lepchas. They are a timid and peaceful tribe whoconsider aggression unnatural and dangerous and whointerpret envy as an affliction sent by the devil. Theyare happiest when they are in their beloved forests,walking its trails and living close to the abundant natureall around them. Born naturalists, they are able torecognise and use all of the forest’s plentiful resources.They also have a rich cultural heritage of their ownclosely associated with Mother Nature.
1. Religion and Language
The primitive Lepchas followed ‘Bon’ religion.Theywere worshippers of trees and other natural objects andancestral spirits. Later, they came in touch with Buddhism,the religion which was made the state religion by theNamgyals. The religion practised by them now-a-daysis a synthesis of both Buddhism and Bon religion.
The Lepchas refer to their language as ‘Rong-aring’or ‘Rongring’ belonging to TibetoKanauri group includedin Tibeto-Burman group of languages. The Lepchalanguage has its own script supposed to be invented bythe Lepcha scholar Thakung Men Salong during 17thcentury.
2. Family and Marriage
The Lepchas have no joint family system. The womenhave equal rights with men. They practice monogamy,polygyny and polyandry forms of marriage and patrilocalresidence.
Preservation of Culture of Lepchas Through Ecotourism

Life and Living Through Newer Spectrum of Geography58
3. Housing
The Lepchas seem to have gained marvelover thetechnical use of Bamboo. They are expert in making aframe in the majority of constructions, such as housesand bridges. They built their houses scientificallysupported by wooden pillars covered with thatched roofs.Their houses are never built of more than a single storey.
4. Food-habit
The Lepchas drink ‘CHI’ an intoxicant prepared frommillet. They are fond of roots, pork, flesh of monkeys,toads etc.
5. Costume
The traditional cloths of the Lepchas are woveninexquisite colour combinations. They wear long robes,tied with belts and long sleeved blouses inside. Thiscame to be called ‘Gada’ for women and ‘Tharu’ formen.
6. Livelihood
Once the sole inhabitants of Sikkim hills, theymanaged their environment for making a living mainlyby collection of roots, tubers, leaves, fruits, grasses, fishing,hunting and primitive shifting cultivation with simpletechnology. The Lepchas have adapted culturally todiverse natural landscape and designed productionactivities suited to the region. They cultivate all kindsof crops for their livelihood. They produce cardamomas cash crop followed by orange and ginger. Wheat, maize,rice and varieties of dry rice are cultivated for dailyuse.
7. Traditional Knowledge on Disaster Management
In the guise of folklore, theLepchas have developedan elaborate understanding of the causes of disastersand have identified accurate indicators to assist in

59
predicting disasters and mitigating their effects. For e.g.,they possess knowledge of the annual timing when floods,landslides, forest fires etc occur. They also tell stories ofearthquakes that rocked their land and share oral historieson avalanches and hailstorms. The beliefs based on theirfolklores are however based on sound principles thathelp to anticipate and limit the impact of disasters.
Present Developmental Scenario
The indigenous Lepchas of Sikkim are using Gandhianmethods of protest to prevent construction of hydelprojects that will destroy their land and the environment.In their eyes, MayelLyang, their hidden paradise, wasunder attack and in danger of disappearing, so peacefulresistance began. When their protests were ignored, moredrastic means to gain attention were decided upon. In2005, the opposition acquired a popular following innorth Sikkim and took an organisational form with theconstitution of the ACT (Affected Citizens of Teesta).Otherorganisations and non-¬governmental organisations(NGOs) joined hands in 2006 to actively oppose landacquisition and any construction activities in Dzongu.To these struggling Lepcha activists, Dzongu representsthe last mainstay of their cultural heritage and the onlyplace in the region where they uninterruptedly followtheir distinctive cultural and religious traditions. Dzongucontains a number of important sacred sites such as caveswhere Guru Rinpoche meditated, the Keshong Lake, theKongsa hot springs, and the Tholung temple that isconsidered sacred not merely by the Lepchas, but by allthe Buddhists of Sikkim. Its alienation is unacceptableto the indigenous Lepchas.
M K Pandit, the director of the Centre forInterdisciplinary Studies of Mountain and HillEnvironment (CISMHE) under whose supervision acarrying capacity study of the Teesta basin was conductedover nearly six years admitted in December 2007 that
Preservation of Culture of Lepchas Through Ecotourism

Life and Living Through Newer Spectrum of Geography60
project Teesta stages I-III are neither environmentallyadvisable nor feasible. Many of the hydropower projectson river Teesta are located in the high-risk zone IV ofthe seismic zoning map. There is drastic increase in thenumber of landslides in the Teesta basin due to increaseddevelopmental activity, especially after commencementof construction and blasting. The weakness of soil ofthe constructed areas was revealed during the earthquakeof 18 September, 2011 when there were about 42 landslidesoccurred between Mangan and Chungthang on NorthSikkim. Scientists strongly warn against dams above theheight of 80m in north Sikkim (Arora, 2008). The Lepchacommunity of Dzongu are opposed to infrastructuraldevelopment that is achieved at the cost of the loss oftheir culture and identity. The major threat from thesehydro-power projects is the influx of a large number ofmigrants who are responsible for a drastic increase incrime rates and disease in this restricted access area.Thus social scientists recommend a mechanism to checkinflux of migrants and ensure that they do not settlethere and dilute the cultural specificity of the indigenousgroup of Sikkim.
In this regard, Geographer Maitreyee Choudhurydocuments the high level of awareness among the Lepchasabout their rights as an indigenous people includingthe right to self-determination, protection from culturalethnocide and right to control, use, and oppose toalienation of their natural resources. She even recommendsthat Teesta projects should not be implemented byignoring either these local sentiments or the vocalopposition of the indigenous communities affected bythem (Choudhury 2007).
Their non argumentative nature has, however, beenpushed beyond endurance during the past ten years.Their land and their cultural heritage are under threat;their sacred rivers are being dammed; the verdant forestsblasted away and the people displaced. Lamenting theirlost and devastated land, the Lepchas have begun fighting

61
Sl. No.
Project Name Capacity (In Mw)
Developer Probable Date Of Commissioning
Present Status
1. Teesta Stage - III 1200 TeestaUrja Ltd. 2011-12 DPR Ready 2. Teesta Stage - IV 495 NHPC 2011-12 Under
Investigation 3. Teesta Stage - V 510 NHPC 2008-09 Commissioned 4. Panam 280 Himgiri Hydro
Energy (P) Ltd 2011-12 DPR Ready
5. Rangyong Approx.
300
NHPC
2011-12 Stopped 6. Rukel 2005 Stopped 7. Ringpi 2005 Stopped 8. Lingzya 2005 Stopped
Source: Sikkim Power Corporation Ltd.
back. However, Dzongu has not been left to develop inits own way. Without consulting the owners of this untilnow unspoiled environment, India’s federal governmentand Sikkim’s state government went on a dam-buildingspree. Reports show that within Dzongu one dam wasconstructed across the Teesta River and seven more werein the planning or early construction stages.
Table 1: Hydropower Projects in Dzongu(updated 2010)
Of the dams already built or under construction, theeffects on the physical environment have beencatastrophic. One village was swept away in a flash flood,while entire mountainsides and diversion tunnels neardam sites collapsed during the 2011 earthquake. Giventhe geological imperfection of the environment, moredams can only bring more disasters.
Potential for Tourism Development
Tourism in the present time is considered to be oneof the potential growth sectors and vehicle fordevelopment. In the contemporary societies, it isconsidered as a key form of consumption, meaning thatit is bound up in wider debates about the changingnature of consumption. Presence of scenic beauty,congenial climate, varieties of flora and fauna, and a
Preservation of Culture of Lepchas Through Ecotourism

Life and Living Through Newer Spectrum of Geography62
hospitable host population are the basic prerequisitesfor a place to become tourist destination. In this regard,Sikkim is blessed with immense natural beauty, healthyclimate, rich bio-diversity and very friendly hostpopulation. Tourism is one of the fastest growingindustries in the state and is considered by thegovernment as one of the driving force of state’s economy.The flow of tourists in Sikkim has shown significantincrease since 1980 till 2003 (Sarttatat, 2011). However,if the flow of domestic tourists is observed since 2005,it also shows an increasing trend till 2010, while the2011 earthquake lowered the influx of domestic tourists.On the other hand, the flow of foreign tourists grewstagnantly since 2005 since 2012.
Table 2: Pattern of Tourist flow in Sikkim(2005 – 2012)
On the contrary, Dzongu has scanty flow of tourists.In 2012, it was only about 150. The identified touristdestinations in Dzonguare: Passingdang, Hee-gyathang,Tingvong, Namprikdang, Lingthem and 6th mile.
Passingdong: The Tholung monastery is situated at adistance from Passingdong and is an ancient religiousplace of worship. Also present there is a cane bridgewhich also serves as a place of tourist attraction.
Hee-gyathang: It is located in lower Dzongu. Presenthere is a small lake which is considered sacred and isworshipped by the Lepcha people.
Year Domestic Tourist Foreign Tourist Total 2005 347650 16518 364168 2006 421943 18049 439992 2007 465204 17837 483041 2008 512373 19154 531527 2009 615628 17730 633358 2010 700011 20757 720768 2011 552453 23945 576398 2012 558538 26489 585027
Source: Tourism and Aviation Department, Government of Sikkim

63
Tingvong: Tingvong is located on a gentle slopeoverlooking the yawning valleys amidst terracedfarmlands of mustard, millet and vegetables. Sparklingstreams flow through the village.
Namprikdang: A traditional Lepcha museum is locatedhere. It displays the ingenuity of an age old tradition oflaying the superstructure on open surface (over stoneslabs) to counter the effects of powerful earthquakes.Another unique feature in the construction of traditionalLepcha houses is that no nails are used.
Lingthem: Lingthem is famous for its spectacular viewsof the Kanchendzonga Range. The village is a three hoursuphill walk from road head at Passingdong across terracedfields and pine ridges. Though the ascent is strenuous,the effort is richly rewarded with great mountain viewsand the mesmerizing beauty that nature offer. Here, onehas the opportunity for a close look at old traditionalhouses still intact, probably the last relics of Lepchaarchitecture.
6th mile: Present there is a hot spring which is alsoconsidered sacred by the Lepcha people.
Apart from all these, Dzongu is surrounded bycardamom fields and number of waterfalls, which providesa homely environment to the visitors. Dzongu offers aunique home-stay experience. Domestic and Internationaltourists visit this place to experience the Lepcha lifestyleand cultural traditions amidst luxuriant landscape andspectacular mountain scenery. Dzongu offers village hikes,bird watching, experience of rich cardamom fields,experience of the oldest the cane bamboo bridge atPassingdong, angling on the Teesta River and theknowledge of use of medicinal plants as practised bythe Lepchas.
Recommendations
Tourism is one of the fastest growing sectors of theIndian economy, which, apart from providing direct
Preservation of Culture of Lepchas Through Ecotourism

Life and Living Through Newer Spectrum of Geography64
employment, gives multiplier effects for employmentgeneration. It is also a low impact industry. The 10thFive Year Plan of India has identified tourism as one ofthe major sources for generating employment andpromoting sustainable livelihood. When material productstravel, development occurs in the established market sectoronly, but when the consumers travel to the productioncentres, development reaches to the remotest places. Withthis philosophy in mind, the Union Ministry of Tourism(MoT), government of India, adopted the new tourismpolicy, which positions tourism as the engineof economicgrowth.
Global tourism scenario has undergone a majortransformation over the past 30 years. In 1980s the focusshifted from “beach tourism” to “cultural tourism”, whichinvolves visits to historical sites and cultural spots. Thenthe focus shifted to “ecotourism”. Due to consistent effortsof environmentalists coupled with growing concern ofvarious stakeholders in tourism development, includingNGOs, the emphasis is being gradually shifted to eco-tourism particularly because of its relevance andimperative need for protecting fragile character of theenvironment in its specific stations like mountains andhills. This scenario is rightly pronounced in the case ofSikkim, particularly Dzongu, which bears a fragile ecologyin conjunction with its age-old cultural heritage of theLepchas.
Suggestions
1. Promote and strengthen village institutions forvillage level decision making regarding tourismpromotion and overall development of the village;
2. Creation of basic rural infrastructure for promotionof tourism in the village;
3. Identification of tourist sites in Dzongu;4. Identification of the tourists’ requirements in the
area and fine tuning the supply side in the village

65
for satisfying the needs of the tourists withoutcompromising the traditional values;
5. Proper training facilities to the tour operators andselected guides from the villages;
6. Networking and marketing support to villagecommittee for marketing of tourist site and villageproduce; and
7. Easy availability of permits to foreign tourists tostay for a longer period of time.
References
1. Arora, V. (2006). The forests of symbols embodied in theTholung sacred landscape of North Sikkim, India.Conservation and society, 4 (1), 55-83.
2. Bhasin, V. (2011). Settlements and land-use patterns in theLepcha Reserve-Dzongu zone in the Sikkim Himalaya, India.Biodiversity, 2 (1), 41-66.
3. Chowdhury, M. (2007). The rights of Indigeneous Tribesand threat perceptionof Lepchas of Sikkim. In N. Ali (Ed.),Natural Resource Management and Sustainable Developmentin North-east India (pp. 33-44). New Delhi: MittalPublications.
4. Drexhage, J., & Murphy, D. (2010). Sustainable Development:From Bruntland to Rio 2012. New York: United NationsHeadquarters.
5. Hooker, J. C. (1855). Notes of a Naturalist in 2 volumes.Himalayan Journals, 117.
6. Jha, V., & Jha, A. (2011). Traditional knowledge on disastermanagement: A preliminary study of the Lepcha communityof Sikkim, India. Indian Journal of Traditional Knowledge,10 (1), 173-182.
7. Kruk, E. (2009, February 09). Tourism in the Himalayas -Mountains of opportunites in a changing climate. ICIMODposition paper (draft).
8. Sarttatat, I. (2010). Conservation and sustainable tourismmanagement in Sap Cham Pa archaeological site and ChamPi Sirindhorn forest. Ph. D. thesis. Thailand: SilpakornUniversity.
Preservation of Culture of Lepchas Through Ecotourism

Life and Living Through Newer Spectrum of Geography66
5Problem and Prospect ofPisciculture in North 24 ParganasDistrict, West Bengal
Dr. Rajat Halder
ABSTRACT
Pisciculture assumes tremendous importance inrespect of socio-economic status of North 24 Parganasdistrict. It nurtures multiple dimensions ofdevelopmental aspect of the district, viz. Economic,Nutritional, Environmental and Human. In the year2010-11, the district covers an area of 56778.6 hectorsunder effective pisciculture along with annualproduction of 1667420.7 quintals and there are430570 persons who are engaged in this profession.Basirhat Subdivision of this district plays animportant role in pisciculture of the district. Itproduced 70% of the total production of the allsubdivisions in 2010-11 because of its favourablephysical and cultural conditions. There is adequatescope for development in this sector of the districtfor boosting up fisheries and allied activities. Forthis the following steps like survey of water bodies,development of minor irrigation-cum-pisciculture,introduction of paddy cum fishery in Sundarban,
67
utilization and protection of water bodies,development of ecotourism in big water bodies aregoing to be taken; and to continue the developmentdifferent types of schemes, plans and programmeslike production enhancement, post-harvest mechanism,training, awareness programme, infrastructuredevelopment, fishermen welfare scheme, credit linkageto banks will be implemented.
Introduction
In view of the steady increase in population growthand to meet the protein diet of underfed humanpopulation of the country, aquaculture comes out to playa great role in human nutrition and economic upliftmentof the poor rural and urban people. With its immenseproduction possibilities and export prospectiveaquaculture is bound to play a definite role in country’seconomy. It nurtures multiple dimensions ofdevelopmental aspects of the district, viz, Economical,Nutritional, Environmental and human development. Sopisciculture assumes tremendous importance in thedistrict.
Objectives of the Study
The present study seeks to fulfill the flowingobjectives:
• To trace the changes that are taking place inpisciculture and the impact of such changes onthe society and economy.
• To investigate into the problem which have arisenout in the development of pisciculture of the studyarea.
• To find out the different ways of all rounddevelopment of pisciculture.
Problem and Prospect of Pisciculture in North . . .

Life and Living Through Newer Spectrum of Geography68
The Study Area
The study area comprises of 22 CommunityDevelopment (CD) Blocks and 5 Subdivisions.Latitudinally it extends from 22o11'6? North to 23o15'22?North and longitudinally from 88o25' East to 89o5' East(approximately). It covers 4094.0 sq.km and 60 percentof total population i.e. 5214020 of the district, (Censusof India, 2001). There are 1507 inhabited villagesdistributed over 20 development blocks. The study areahas 20 Panchayat Samities and 186 Gram Panchayatswith 2715 Gram Sansads. There are 10 municipalitiesand 10 Census Towns in the study area (Source: DistrictStatistical Handbook, North 24 Parganas, 2008). In thestudy area eight C.D.Blocks share international borderwith Bangladesh and six C.D.Blocks included with inthe Sundarban.
The study area is bounded by the Hooghly-Industrialbelt of Barackpur-Kolkata in the west. In the east, theinternational border is formed by the river Icchamati.To the north, it is bounded by the southern boundary ofNadia district, and to the south it is bounded by thenorthern boundary of South 24 Parganas district. Lyingat the apex of the funnel shaped the Bay of Bengal andserving as the immediate hinterland of Kolkata urban-industrial region, this sensitive border district commandsa vital strategic area not only for West Bengal but alsofor India, in war as well as peace (De, 1994).
Geomorphologically the study area as well as North24 Parganas is a deltaic region of West-Bengal. It embracesthe moribund delta in the north, mature delta in middle,and active delta in the south. The active delta still growingsouthwards is a system of innumerable tidal rivers, canalsand creeks, saline soils, swamps and marshes. A part ofthis active delta contains forest, known as Sundarban.

69
Methodology and Database
The present work has endeavored to analyze thedifferent criteria to demark the problems and prospectof pisciculture of the district. Present work has beencarried out with the review of literature, collection ofsecondary data and information mainly particular offisheries and field survey. Data are collected from differentbooks and reports of conventional institution viz, Bureauof applied economics and statistics, West Bengal, BlockDevelopment Offices of North 24 Parganas district, districtplanning department etc.
Development of Pisciculture in the Study Area
Pisciculture now a day is not considered only aprimary economic activity. Apart from culture and captureof fish or aqua products there are other stakeholdersassociated with aqua-culture of the study area as wellas district. These are fish whole sellers, fish retailers, icefactory and fish processing related workers. Aqua-culturethus provides an important source of livelihood for aconsiderable number of families in the study area. It isnot necessarily a rural means of livelihood. Even in themunicipalities of the study area as well as district, aqua-culture serves as a source of livelihood for a considerablenumber of families. So pisciculture is gradually beingdeveloping in the district. In 1995-96, the net area undereffective pisciculture in the district was 21023 hectareand it is increased in 56778.6 hectare in 2010-11. Thiswill be done by optimum utilization of water bodies.The utilization of Fresh water tanks and beels; canalsand creeks; brackish water bheries, sewage fed waterbodies for aqua-culture has been increased in against ofprevious periods. Survey of water bodies with the helpof panchayats and Municipalities enhance the productionand allied activities. Awareness generation programmeregarding protection and conservation play an importantrole to increase the production of fish. The figure (Fig-
Problem and Prospect of Pisciculture in North . . .

Life and Living Through Newer Spectrum of Geography70
1) shows that the net area under effective pisciculturehas gradually been increased. Though the growth of theaforesaid area has been fluctuated in different years butthe average trend is upward in respect of previous years.As a result the production of fish has also been increasedin the district (Fig-2). The production fish has increasedfrom 298751 quintals in 1995-96 to 1667420.7 quintals in2010-11. The people who engaged in fishing, collectingand allied economic activities increase from 2220874persons in 1995-96 to 430570 persons in 2010-11.
Fig-1 Fig-2
Basirhat Subdivision is the largest producer of fishamong the subdivisions of the district and it holds thatposition from the past. The individual fish productionof this subdivision was 38% in 2002-03, 60% in 2005-06to the total production of all subdivisions and it alreadyhas produced 70.24% in 2010-11.This significant positionin respect of fish production depend on the followingfactors
1. The south and east part of the subdivision, inwhere the delta is less advanced stage of growth,there is a network of tidal creeks winding theirway to the sea through numerous island andmorasses. This south eastern part is partly covered

71
Subdivisions 1995-96* 2001-02* 2005-06 2010-11
Bangaon
1 1816 2018 6616 6706.05
2 33201 489 38320 109088
3 64910 5500 13586 201181.5
Basirhat
1 17474 18652 33059 39039.49
2 125592 643 123672 178870
3 148423 49286 92775 1171184.7
Barasat
1 1272 1179 10730 8932.05
2 59915 90 63198 124273
3 75138 9934 42092 232024.2
Barrackpur
1 461 520 2757 2101.01
2 2166 - 23609 18339
3 10280 14450 6909 63030.3
by Hingalganj, Sandeskhali-I and Sandeskhali-IIwhich are saturated by brackish water and it issuitable for the cultivation of brackish fish andshrimp.
2. The wet land which is available for Piscicultureand the net area under effective pisciculture ishigher than the others.
3. Different type of schemes which is operated bythe state Government is also being implementedin highest number in Basirhat Subdivision.
Table 1: Subdivision wise the general features ofpisciculture in different year
1. Net area under effective Pisciculture (hector)
2. No of person engaged in the profession
3. Approx annual productions (quintal)
*All types of data for each block under different subdivision isnot available.
Source: District Statistical Hand Book (North 24 parganas).
Problem and Prospect of Pisciculture in North . . .

Life and Living Through Newer Spectrum of Geography72
Most of the blocks of the district are brought underactive pisciculture and the prominent among them areHaroa, Minakhan sandeshkhali-I, Baduria and Basirhat-II. Most of them are in Sundarban areas. Paddy-cum-fishery in the Sundarban areas is popularizing formaintaining the eco-balancing factors. Minor irrigation-cum-pisciculture with agro base crop has been startedin the different blocks mainly in Sundarban areas and itis thinking to offer pisciculture rights to Self Help Groupsin unutilized water bodies in rural and urban sectors.This apart, a huge quantity of brackish fish is capturedfrom rivers and rivulets. The conspicuousness of the blocksin respect of effective area under Pisciculture, personsengaged the profession and production of fish are variedfrom year to year. The block wise areas covered underpisciculture along with annual production and numbersof persons engaged in the profession are shown in thefollowing.
Table 2: Block wise area under Pisciculture andannual Production in the District for year 2010-11
Sl no
Name of the Block
Net area under effective
Pisciculture (hect.)
No. of persons engaged in the
profession
Annual Production (Approx) in quintal
1 Bagdah 2319.89 38906 69596.7
2 Bongaon 2212.44 57685 66373.2
3 Gaighata 2173.72 12497 65211.6
4 Habra- I 876.41 20750 26292.3
5 Habra -II 824.84 18675 24745.2
6 Barasat- I 734.16 16808 22024.8
7 Barasat- II 2752.76 15874 82582.8
8 Amdanga 909.79 17430 27293.7
9 Deganga 1636.18 30088 49085.4

73
Source: District Statistical Hand Book (2011)
Fig-3
10 Rajarhat 1197.91 4648 35937.3
11 Barackpur- I 1806.3 12554 54189
12 Barackpur- II 294.71 5785 8841.3
13 Baduria 4279.33 27805 128379.9
14 Haroa 8668.61 18468 260058.3
15 Minakhan 6450.46 17638 193513.8
16 Swarupnagar 2945.24 31955 88357.2
17 Hasnabad 2257 20439 67710
18 Hingalgang 1126.73 12243 33801.9
19 Sandeskhali- I 5730.18 11413 171905.4
20 Sandeskhali- Ii 2725.04 12346 81751.2
21 Basirhat -I 1227.09 11205 36812.7
22 Basirhat- II 3629.81 15358 108894.3
Total District 56778.6 430570 1667420.7
Problem and Prospect of Pisciculture in North . . .

Life and Living Through Newer Spectrum of Geography74
Problem and Prospect of Pisciculture in the District:
There are several problems of the fishermen in thedistrict. The beels and baors mostly located in Bongaon,Bagdah, and Gaighata blocks are very much prone toperiodic floods. Almost every year most of the beelssuffer from loss of fish and other aqua-products due toheavy rain or flood. Even in sewage fed fisheries adjacentto urban areas of the district loss of aqua products dueto heavy rain is a perennial problem. Again, the beelsare infested with aquatic weeds that hamper the culturaloperation. The production gets hampered often due toover-silting of beels, baors and the sewage fed fisheries.A comprehensive plan involving massive investment isnecessary for improving the condition of aqua-culturein the district.
Many of the fishermen suffer from working capitalproblem. The traditional means of meeting this problemis to seek loan from informal credit market. Such loansare usually provided by the aratdars that is the wholesaletraders. It is known as the system of dadan. In thissystem the aratdars provide loan to the fishermen withan informal agreement that the aqua products would beauctioned in his arat. The aratdar get a commission whichis equivalent to the rate of interest on the working capitaladvances. In recent years, the Government has takensome measures for addressing these issues. Some of thefishermen are now receiving subsidized loan from thestate Sponsored financial Agencies such as Fish FarmerDevelopment Agency (FFDA) and Brackish Water FishFarmer Development Agency (BFDA). In the year 2003-04 a new credit programme in the form of Short TermCredit has been launched by the Fisheries Developmentwith the active involvement of NABARD. As regardweights and measures, the fishermen are yet to get anytangible benefits.
The study area as well as north 24 parganas districtis bestowed with all types of fisheries resources of

75
immense potentialities. As such there is adequate scopefor development in this sector through different disciplineand directions for boosting up fisheries and allied activitiesmaintaining ecological balance and attributing dueimportance to save our wet lands. For the developmentsof fisheries as well as development of rural and urbaneconomy and to motivate the fisher floks / fish farmers,bunch of specially designed service and informationoriented programmes are being executed. Apart formthis Fisheries Department is pledged to emphasis inimplementing a number of schemes as welfare measuresfor the development upsurge of better living of poorfishermen community that forms a low tier in the societyboth socially and economically. To continue the steadygrowth of the fisheries sector of this district followingsteps are to be taken-
i) Survey and identification of recorded and non-documented existing water bodies with the helpof panchayets and municipalities.
ii) Minor irrigation cum pisciculture with agro basedcrops.
iii) Popularization of paddy cum fishery in theSundarban areas for maintaining eco-balancingfactors
iv) Utilization of small and big water bodies in therural and urban areas through self help groups.
v) Protection and conservation of recorded and non-recorded water bodies in urban areas.
vi) Development of ecotourism in the big waterbodies.
Future Plans
Following parameters shall be emphasized for allround development of the fisheries sector –
Problem and Prospect of Pisciculture in North . . .

Life and Living Through Newer Spectrum of Geography76
1) Production Enhancement
This will be done by optimum utilization of waterbodies both in horizontal and vertical direction. In thisconnection beel and baors of this district shall have tobe renovated. Excavation of water bodies may also helpin a greater way to reduce the recurrence of flood andflood like situation, in addition to another big openingfor eco-tourism in those areas. To maximize, the surfacewater retention, this will also change the chances forbetter irrigation, water transportation and allied matters.
2) Post Harvest Mechanism
To maintain the quality of fish post- harvestingtechnology shall be adapted. Good marketing facilitiesas well as supply of required quantity of ice by settingup to ice plant especially Sundarban areas shall beexplored.
3) Training
The rural fishermen, unemployed youth and SHG sshall be training in large scale to maximize the production.
4) Implementation of New Schemes
Ornamental fishery and culture of indigenous Magurin small tanks shall be spread among the farmersespecially by Self Help Groups. Integrated fish farmingshall be taken with the help of Animal ResourceDepartment.
5) Awareness Programme
Seminars will be organized in gram panchayet levelsto aware the people about the modern technology offisheries sector, importance of wet land.
6) Conservation of Local Fish
Endangered & indigenous fish species (Rani Machh

77
etc) should have to be conserved by adopting socialfisheries programme and river ranching programme.
7) Infrastructure Development
In the fishing villages the roads shall be developedfor easy transport. Fish landing centers one also requiredfor harvesting and auction of fish at site.
8) Fishermen Welfare Scheme
Development of house for poor fishermen along withdrinking water and sanitation facilities shall have todevelop. Poor fishermen should be brought under ‘OldAge Pension Scheme’.
9) Credit Linkage to Bank
The farmers shall be linked with bank through shortterm credit programme. FFDA and BFDA shall providerequisite support to the farmers in the form of subsidyin fresh water and brackish water culture respectively.
Bottle Necks which are to be removed to Success thePresent Planning
I. Development of more scientific and technicaloriented pisciculture practices is to be requiredto create more employment.
II. Skill Development training programme is to beprovided to the fish farmers in lieu of traditionaltraining.
III. Like Agriculture and Animal HusbandryDepartment the fishery Extension officers at blocklevels are to be given adequate supports for thedevelopment of pisciculture in rural areas.
IV. The fund is not enough in this district to createfishery related assets and infrastructure. So effortsare to be taken for adequate fund from differentsource.
Problem and Prospect of Pisciculture in North . . .

Life and Living Through Newer Spectrum of Geography78
Table 3: Proposed beel and baors for developmentof ecotourism
SL
No
Name of the Society
Name of the Water
body
Water Area
(in ha)
Lease granting
Authority / Department
Scope of Eco-
tourism Remarks
1
Kancharapara
Refugee FCS Ltd.at
Barrackpore
Block I
Mathura
Beel
263.80 ha
Fisheries
Dept
1. All the boars are
partly infested
with aquatic vegetation
2. Sides of embankment
need renovation 3.Needs
good inlet and outlet to control the ingress of
water and to release of
water. 4. Needs
good approach
roads
The water bodies
belongs to different
department s.needs
coordination
Between the
Department s like
Irrigation,
Land
Department RR
Department s, Fisheries
Department
To success
The
programme
2 Panchita FCS Ltd. Bangaon
block
Panchita & na –
Baor
117.64
Fisheries
&
L R. Dept
3
Kundipur FCS Ltd. Bangaon
Block
Kundipur
Baor 121.00 L R. Dept
4 Dooma FCS Ltd. Gaighata
Block
Dooma Baor 293.56
Fisheries
&
L R. Dept
5 Sindrani FCS Ltd. Bagdha
block
Raghavpur
Bagula Baor
57.80 R.R. Dept
6 Padma Beel
FCS Ltd. Bagdha Block
Padma Beel 47.50
Own Property
7
Media FCS Ltd,
Swaroopnagar
Block
Kankana Baor
109.96 R.R. Dept

79
References
1. De, B. (ed-1994) - West Bengal District Gazetteers, 24Paqrganas, Govt. of West-Bengal.
2. District Planning Committee (2006) - District Vision: North24 parganas, District Planning Committee,
3. Bureau of Applied Economics & Statistics (1995-2011) -District Statistical Hand Book, North 24 Parganas District,Government of West Bengal.
4. Report of Annual plan (2008-09) of North 24 ParganasDistrict.
5. HDRCC, (2010) - District Human Development Report,North 24 Parganas, Development and Planning Department,Government of West Bengal.
Problem and Prospect of Pisciculture in North . . .

Life and Living Through Newer Spectrum of Geography80

81
SECTION-BECONOMIC ISSUES IN GEOGRAPHY

Life and Living Through Newer Spectrum of Geography82

83
6Food Security Status AmongMuslim Households in WestBengal: An Empirical Study
Md. Ismail
ABSTRACT
Without food every living being are cannot imagine lifeand every person should be birth right for food. But, food isnot available for all people due to various causes which aredirectly or indirectly create by men and sometimes create bynature. Worldwide situation of food availabilities are showingvery pathetic picture. It is surprising to say that more than925 million (FAO) population in the World do not get twosquare meal every day, most of them, are lived in variouspart of Asia and Africa and very marginal number of foodinsecure population are lived in Latin America, North America,Europe And Australia. While most two vulnerable continentsalso produced surplus varieties of resource and food, in spiteof this, large numbers of population are not getting sufficientamount of food for their active and healthy life due to unequaldistribution of resource as well as food. The variation andproblems of food insecurity are not only found in worldwide,it is also found at national level, regional level, communitylevel, religion wise as well as family level. Food security arerefer to that situation when all people from all communities
Food Security Status Among Muslim Households in . . .

Life and Living Through Newer Spectrum of Geography84
and all levels get sufficient amount of food and get all kindsof living facilities for their active and healthy life. The moststandard definition of food security, as adopted by the FAOin the Rome Declaration on World Food Security in 1996 isthe condition that “exists when all people, at all times, havephysical and economic access to sufficient, safe and nutritiousfoods to meet their dietary needs and food preferences for anactive and healthy life.” Food security is as having numberof dimensions: availability of food, access to food, stability offood, and utilization or consumption of food. In India, foodsecurity situation are very worst due to unequal distributionand corruption of food distribution system. Nearly 37 peopleare lived below poverty line, among them; most of the peopleare belong to Muslim minority, scheduled castes and scheduledtribe’s communities. Muslim is the largest minority communityin India but still far behind the benefits of development. Thisis true that every common citizen of the country is derivedfrom the gains of economic growth but the quotient of thisdeprivation is more amongst the Muslim community. Thisreport came into people when Sachar committee report on thecondition of minority community was placed in the parliament.So, in my paper tries to find out the food security statusamong Muslim households, try to show socio-economic profileof Muslim, try to find out the pattern of food security statusamong Muslim households and women work participation ratioas well as try to find out the sources of income. The studyis based on both primary and secondary sources of data, butmore given attention on primary data which are collected byauthor through personal interview with a questionnaire. Thestudy area Malda District is one of the most socio-economicallybackward among West Bengal districts.
Key words: Muslim, food security, social & economicalstatus, food dimensions, Malda district.
Introduction
India is a mother land of diversity and of differentreligions with Hindus followers is the majority. According

85
to the 2011 census Muslim religious population arecontributed about 14.7 per cent of the total populationin India. India is a secular republic and the constitutionguarantees equal rights to all its citizens without anydiscrimination. The Indian constitution provides manylegal safeguards to the minority community and specialprovisions are made for their social and economic growth.Despite these, minorities in India face all types of inequityin the public sphere. Muslim is the largest communityamongst the minorities in India but still far behind thebenefits of development. This is true that every Commoncitizen of the country is derived from the gains ofeconomic growth but the quotient of this deprivation ismore amongst the Muslim community. This came intolight when Sachar committee report on the condition ofminority community was placed in the parliament. Butthe issues of food security are the concern of all religiousand not only problem face by Muslim community. Foodsecurity has been defined as “when all people, at alltimes, have physical and economic access to sufficient,safe and nutritious food to meet their dietary needs andfood preferences for an active and healthy life”. Householdis used as a social organization in which members liveand sleep in the same place and share meals. The concernfor this study is household food security within theMuslim households in the Malda District.
Concept of Food Security
Food security as a concept originated in the mid-1970s, in the discussions of international food problemsduring the time of global food crisis. The initial focus ofattention was primarily on food supply problems - ofassuring the availability and to some degree the pricestability of basic foodstuffs at the international andnational level. That supply-side, international andinstitutional set of concerns reflected the changingorganization of the global food economy that hadprecipitated the crisis. A process of international
Food Security Status Among Muslim Households in . . .
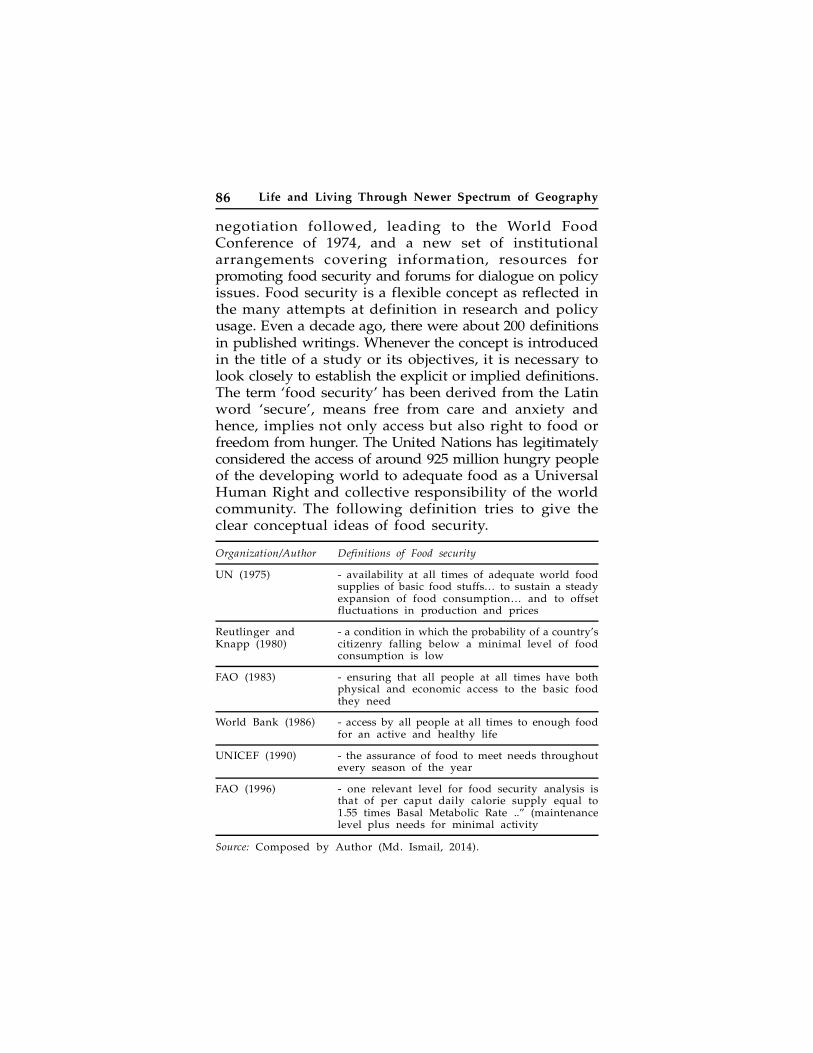
Life and Living Through Newer Spectrum of Geography86
negotiation followed, leading to the World FoodConference of 1974, and a new set of institutionalarrangements covering information, resources forpromoting food security and forums for dialogue on policyissues. Food security is a flexible concept as reflected inthe many attempts at definition in research and policyusage. Even a decade ago, there were about 200 definitionsin published writings. Whenever the concept is introducedin the title of a study or its objectives, it is necessary tolook closely to establish the explicit or implied definitions.The term ‘food security’ has been derived from the Latinword ‘secure’, means free from care and anxiety andhence, implies not only access but also right to food orfreedom from hunger. The United Nations has legitimatelyconsidered the access of around 925 million hungry peopleof the developing world to adequate food as a UniversalHuman Right and collective responsibility of the worldcommunity. The following definition tries to give theclear conceptual ideas of food security.
Organization/Author Definitions of Food security
UN (1975) - availability at all times of adequate world foodsupplies of basic food stuffs… to sustain a steadyexpansion of food consumption… and to offsetfluctuations in production and prices
Reutlinger and - a condition in which the probability of a country’sKnapp (1980) citizenry falling below a minimal level of food
consumption is low
FAO (1983) - ensuring that all people at all times have bothphysical and economic access to the basic foodthey need
World Bank (1986) - access by all people at all times to enough foodfor an active and healthy life
UNICEF (1990) - the assurance of food to meet needs throughoutevery season of the year
FAO (1996) - one relevant level for food security analysis isthat of per caput daily calorie supply equal to1.55 times Basal Metabolic Rate ..” (maintenancelevel plus needs for minimal activity
Source: Composed by Author (Md. Ismail, 2014).

87
Objectives
i. to find out the food security status among Muslimhouseholds in Malda district,
ii. to find out the socio-economic status of Muslimhouseholds,
iii. to find out the pattern of food consumption andfood security status among Muslim households,
iv. to Find out the women work participation ratioand ratio of income, and
v. to find out the various sources of income
Database and Methodology
The study is based on both primary and secondarysources of data, but more attention given on primarydata which are collected by author through personalinterview with. Nine villages have been selected fromnine Muslim concentrated blocks in Malda district and50 samples have been taking from notified area whichis called Chanchal urban. Considering on stratified randomsampling basis a number 500 households wereapproached, 50 households from each village were selectedwith help of a direct questionnaire-respondent method.Household food security status is calculated with thehelp of dimensions of food security and food securityhas four dimensions, namely food availability, foodaccessibility, food stability and food use & utilization.Food availability refers to supply of food that is fulfilledwith production/market/PDS, accessibility is related toincome and purchasing power, and utilization (absorption)requires good health and sanitation facilities. These fourdimensions are affected with PDS, income, size oflandholdings, drinking water, housing and sanitationconditions. Therefore, the samples of households werestratified based on income, size of landholdings, drinkingwater, housing and sanitation conditions. The simple
Food Security Status Among Muslim Households in . . .

Life and Living Through Newer Spectrum of Geography88
statistical methods are used for calculation of variousproblems.
Significance of Study
The study of food security among Muslim householdsin Malda is necessary to fill the gap in current literatureand to provide greater evidence-base for decision-makingand policy-making. The descriptive analysis aims topromote further discussion and analysis of households’experiences of food security and related householdcharacteristics. Additionally, this research can contributeto making evidence-based policy and programmingdecisions and informed targeting of limited resources
Study Areas
Malda is the gate way of North Bengal. It is locatedbetween latitudes 240 40' 20" N to 250 32' 8" N, andlongitudes 870 45' 50" E to 880 28' 10" E, Malda Districtis bounded by Bangladesh and Dakshin Dinajpur districtto its East and North East, by Uttar Dinajpur to thenorth, Bihar to the West, South-west part is bounded toJharkhand and by Murshidabad district across the riverGanga. Malda is spreading over an area of 3733, Sq. Kmand covering 4.2 per cent of the total landmass of theWest Bengal and support with a large number ofpopulations of 3997970, about 4.1 per cent of the totalstates population with the density 1071 persons per. Sq.Km.
Discussion & Result
Demographic structure
Demographic structure of the country or any regionplay key role for sustainable development of country. Itis also important for level of development amongcommunities as well as religion. Sizes of family & age-sex structure are very important determinants of food

89
security especially at household’s level. From table 1,majority (above 60%) of the respondents had more than5 family members with mean size of 5.49 people perhousehold. This could be regarded as large family size.However it is likely that these children will be used assource of manual labour in the household due to variouseconomics causes, also the age at marriage will have animpact on family size. The implication of this finding isthat the quantity of food intake will be affected anddependency ratio will be affected. The larger the familysizes are found the lesser food availability to each peoplewithin the household and also nutritional status is greatlyaffected. According to primary Survey in Malda Districtamong the muslim households in muslim dominated areaare showing block wise average size of family member& Percentage of working population (15-59 Years) aswell as percentage of dependency population. Numberstudies are showing the relation between food securityand family size as well as food security and dependencyratio. Table 1 & Figure 1 are presenting very clear picture,according to my survey, average size of family is 5.49people per family but it have great variation from blockto block. In term of family size, largest average familymember are found at Kaliachak-III, which is 7.40 peopleper family, followed by Ratua –II (6.68 person per family),Harishchandrapur-I (6.26 person per family), Kaliachak-1(5.58 person per family), Manikchak (5.52 person perfamily), Ratua -II (5.08 person per family), Chanchal-I(5.06 person per family),, both Chanchal –II andHarishchandrapur -II (4.94 person per family) and smallestfamily member is found in Chanchal (4.40 person perfamily).Table1 and Figure1 also presenting workingpopulation status and dependency in percentage, workingpopulation mainly considered in between 15-59 yearsage group and dependency are considered in table 1age group, 0-6 years, 6-15 years and 60 & above.According to survey, average working population is 58.44percent and highest percentage of working population
Food Security Status Among Muslim Households in . . .
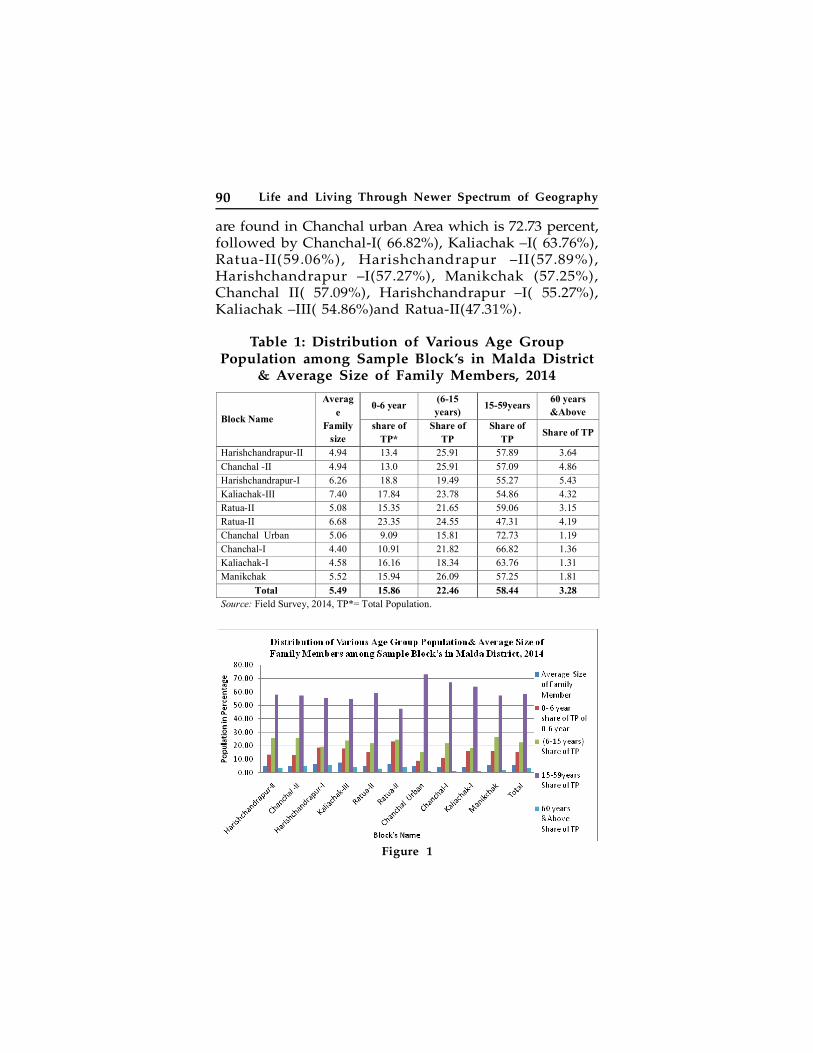
Life and Living Through Newer Spectrum of Geography90
are found in Chanchal urban Area which is 72.73 percent,followed by Chanchal-I( 66.82%), Kaliachak –I( 63.76%),Ratua-II(59.06%), Harishchandrapur –II(57.89%),Harishchandrapur –I(57.27%), Manikchak (57.25%),Chanchal II( 57.09%), Harishchandrapur –I( 55.27%),Kaliachak –III( 54.86%)and Ratua-II(47.31%).
Table 1: Distribution of Various Age GroupPopulation among Sample Block’s in Malda District
& Average Size of Family Members, 2014
Figure 1
Block Name
Average
Family size
0-6 year (6-15 years)
15-59years 60 years &Above
share of TP*
Share of TP
Share of TP
Share of TP
Harishchandrapur-II 4.94 13.4 25.91 57.89 3.64 Chanchal -II 4.94 13.0 25.91 57.09 4.86 Harishchandrapur-I 6.26 18.8 19.49 55.27 5.43 Kaliachak-III 7.40 17.84 23.78 54.86 4.32 Ratua-II 5.08 15.35 21.65 59.06 3.15 Ratua-II 6.68 23.35 24.55 47.31 4.19 Chanchal Urban 5.06 9.09 15.81 72.73 1.19 Chanchal-I 4.40 10.91 21.82 66.82 1.36 Kaliachak-I 4.58 16.16 18.34 63.76 1.31 Manikchak 5.52 15.94 26.09 57.25 1.81
Total 5.49 15.86 22.46 58.44 3.28 Source: Field Survey, 2014, TP*= Total Population.

91
Literacy and Level of Education
Education is the lifeline of modern societies andwithout proper education, man could not survive properly.In the begging of the civilization every men was adaptedmethod of food gather from their ancestor that is alsothe kind education, in spite of this, modern education isessential for their betterment, economic development,cultural development and for transformation activities.Still Large proportion of Indian people are illiterate dueto causes among them Muslim religious follower peopleare contributed high percentage of ill literacy. Accordingto survey, more than 41.07 percent people of therespondents did not have any form of education. Inessence, most of them had one form of education or theother. This shows that more than of respondents wereliterate which might enhance the food security statusliterate while might enhance the food security statusadoption of improved farm practices. This will improvetheir production. According to field survey highest literacy(table2 & figure 2)are found among Kaliachak-Irespondents which is 92.71, followed by Chanchal-I(92.35%), Chanchal urban(85.65%), Harishchandrapur-I(58.27%),Manikchak( 49.57%),Chanchal -II( 55.35%),Harishchandrapur-II( 54.67%),Kaliachak-III(49.34%), Ratua-II( 43.72%) and Ratua-I( 23.83%). Female education isanother important determined of socio-economicdevelopment. In the Study area, there are found gendervariation among the households, among block and overall.Field survey presenting only 57.43 percent male and 43.57percent female are literate and highest female literacyare found in Chanchal –I which is 50.28 percent followedby Harishchandrapur-II(49.57%), Chanchal –II(48.74 %),Kaliachak-I(46.07%), Ratua-II(45.74%), Ratua-I( 44.26%),Chanchal Urban (42.13%), Manikchak(34.78%),Harishchandrapur-I(33.78%), and lowest number ofpercentage are found in Kaliachak-III(31.33%). Some blockare showing high female literacy due to socio-economiccauses, because most of the male member try to collect
Food Security Status Among Muslim Households in . . .

Life and Living Through Newer Spectrum of Geography92
Tab
le 2
: B
lock
-Wis
e L
iter
acy
Rat
e &
Lev
el o
f E
du
cati
on
in
Mal
da
Dis
tric
t, 2
014
Blo
ck N
ame
Rat
e of
Lit
erac
yP
rim
ary
Mid
dle
Sec
onda
ryS
enio
rG
radu
ate
PG
Tech
nic
alL
iter
acy
Mal
eF
emal
eP
ass
Pas
sP
ass
Sec
onda
ry&
oth
ers
Pas
sP
ass
Pas
sP
ass
Har
ish
chan
dra
pu
r-II
54.6
750
.43
49.5
721
.37
36.7
528
.21
5.13
5.98
5.13
0.00
Ch
anch
al -
II55
.35
51.2
648
.74
19.3
338
.66
25.6
46.
725.
982.
520.
00
Har
ish
chan
dra
pu
r-I
58.2
766
.22
33.7
835
.81
20.2
715
.38
16.8
916
.24
0.00
0.00
Kal
iach
ak-I
II49
.34
68.6
731
.33
48.0
022
.67
11.9
711
.33
3.42
1.33
0.00
Rat
ua-
II43
.72
54.2
645
.74
50.0
032
.98
5.13
5.32
5.13
0.00
0.00
Rat
ua-
I23
.83
55.7
444
.26
42.6
236
.07
3.42
1.64
5.13
0.00
0.00
Ch
anch
al U
rban
85.6
557
.87
42.1
319
.80
23.8
631
.62
19.2
921
.37
5.58
0.51
Ch
anch
al-I
92.3
549
.72
50.2
811
.60
37.0
226
.50
22.1
016
.24
3.31
0.00
Kal
iach
ak-I
92.7
153
.93
46.0
714
.61
45.5
129
.06
16.2
911
.11
0.56
0.00
Man
ikch
ak49
.57
65.2
234
.78
44.3
523
.48
16.2
49.
575.
133.
480.
00
Tota
l58
.93
57.4
342
.57
28.1
631
.47
16.6
213
.24
8.24
2.43
0.07
Sou
rce:
Fie
ld
Surv
ey,
2014
.

93
their basic needs, so, their parent cannot interested toadmit the male child in school but in case of femalethey not doing field work. Level of education is alsothe important determinate for making her/him decision,and for develop. Most of the literate people are educatedupto Senior Secondary pass and little number of peopleis educated upto Post graduate level and other technical.Among literacy, more than 31.47 percent people are middlepass followed by primary pass(28.16 %), Secondarypass(16.62%), Senior Secondary Pass (13.24%), Graduate& others (8.24%), Post Graduate(PG) pass?(2.43%) andTechnical education attainment is very rare(0.07%).
Figure 2
Work Participation and Occupation Structure
High rate of work participation, high percentage offemale work participation and type of occupation areeffective determinants of food security. Table 3 ispresenting the distribution of worker among Muslimsample household in Malda district. Age of working andnumber of people doing work is different in point ofviews because huge numbers of working age people donot work due to various reasons. Table 3 depictspercentage of people doing work and only 29.27 percentpeople (out of 100 %) are engaged as worker in different
Food Security Status Among Muslim Households in . . .

Life and Living Through Newer Spectrum of Geography94
sectors and remaining 71.73 percent people depend onthem. According to field report, work engagement isvery low and highest percentage of Working people arefound in Kaliachak block-I which is 34.06 percent followedby Chanchal Urban (32.41%), Chanchal-I (30.45%), bothHarishchandrapur-II & Chanchal-II (30.36%),Harishchandrapur-I (29.39%), Ratua-II (29.13%), Kaliachak-III (28.92%), Manikchak (27.54%) and Ratua-I(23.05%).Roleof female to improve the status of household food securityare very important, number of studies were shown femalereduced the level of food insecurity upto 100 percent.But in study sample in Malda district are shown verynegative picture because of very percentage of femalework participation. Average Female Work participationis only 8.72 percent and remaining 91.28 are male workeramong sample Muslim household in Malda District.Highest percentage of female worker are found inChanchal-I area which is nearly 19.40 percent thenKaliachak-I( 19.23%), followed by Chanchal urban(8.52%),Harishchandrapur-I(8.70%), both Harishchandrapur-II &Chanchal(8.0%), Kaliachak-III(6.54%), Manikchak(5.26%),Ratua-II(2.7%) and Ratua-I (2.6%).Most of the femaleWorker among sample household of muslim in MaldaDistrict are engaged as a Bidi worker. About 64.76 percentworkers are non-formal worker and remaining 35.24percent are formal worker. Table no. 3 and Figure 3 alsoare presenting different type of occupation activities.According to Table no. 3 only 10.59per cent peopleengaged as servicemen in both of govt. job and nongovt. jobs and 24.91 percent people engaged as seller,hawker’s, small businessman, shop keeper that isconsidered as self employed. Nearly 26.65 percent peopleare farmer followed by daily labourer (13.52%),agricultural labourer (14.82%) and other worker whichperson have not any particular work (14.45%).

95Food Security Status Among Muslim Households in . . .

Life and Living Through Newer Spectrum of Geography96
Figure 3
Land Ownership among Muslim
The Maximum farmers in the Malda district are underthe small size of farmer and marginal farmers categorywith an average land holding is 0.72 ha. Again marginalfarmers (with land holding below 1 ha.) are Comprisethe largest category amongst farmers, at 81.3 percent ofthe total farmers in the district. According to primarysurvey more than 35.8 percent sample household ofmuslim in Malda district are landless and remaining64.2 percent are having very little amount of land. Thestudy has shown the average size of landholding amongMuslim household are only 0.66biggha per head in MaldaDistrict. According to study(Table 4 & Figure 4, A, B),Ratua-I having highest per capita land which is 0.87bighafollowed by Manikchak (0.80bigha), Ratua-II(0.77bigha),Harishchandrapur-II(0.73bigha), Harishchandrapur(0.71bigha), both Kaliachak-III & Chanchal-II (0.65bigha),Chanchal urban (0.52bigha),Kaliachak (0.39bigha) andChanchal-I is the lowest amount of per capitaland(0.33bigha).

97
Table 4: Land Ownership among Muslim Householdin Malda District, 2014
Figure 4A
Block Name Ownership of Land Per capita land
Yes No Bigha Harishchandrapur-II 94 6.0 0.73 Chanchal -II 94 6 0.65 Harishchandrapur-I 50 50.0 0.71 Kaliachak-III 70 30.0 0.65 Ratua-II 64 36.0 0.77 Ratua-I 76 24.0 0.87 Chanchal Urban 40 60.0 0.52 Chanchal-I 28 72.0 0.33 Kaliachak-I 32 68.0 0.39 Manikchak 94 6.0 0.80 Total 64.2 35.8 0.66
Source: Field Survey, 2014
Food Security Status Among Muslim Households in . . .

Life and Living Through Newer Spectrum of Geography98
Figure 4B
Animal Husbandry
Animaal husbandry is the largest levelihood activitiesin the Malda District and Domestic livestock’s and birdscan be reduced the level of poverty in rural areas aswell as urban areas. About 60 percent muslim householdshave domestic animal and birds. Specially more backwardarea are having more animal and bird such as Kaliachak-III (80%), Ratua-I (84%), and Harishchandrapur-I & II(82& 70%). Table 5 are presenting the per capita livestockavailability in the study area,average 1.2 livestock availableper people among muslim household in Malda District.Highest Per capita livestock are availabein Ratua-I whichis 2.4 livstock per person followed by kaliachak-III (2.2livstock per person), Harishchandrapur-I (1.4 livstock perperson), Both Manikchak & Ratua –II (1.2 livstock perperson), Harishchandrapur-II (1.08 livstock per person)Chanchal-II (1.0 livstock per person), Chanchal urban(0.9 livstock per person), both Chanchal –I & kaliachak-I (0.6 livstock per person). Goat is the another importantdomestic animal among muslim households in Maldadistrict and almost all household desire the same.Theper capita goat availability is also 1.2 goat per peopleand highest per capita goat available in Kaliachak-III

99
which is 2.7 goat per people followed by Manikchak(2.4 goat per people), Harishchandrapur-III (1.4 goat perpeople), Chanchal–II (1.3 goat per people), bothHarishchandrapur-I & Ratua-I (1.1 goat per people),Chanchal urban (0.4 goat per people), Chanchal-I (0.3goat per people) and Kaliachak-I (0.2 goat per people).Other Domestic Birds also play important role forincreased of additional income of households. AverageDomestic bird availability is 3.9 per people and highestnumber of bird are available in Harishchandrapur-II (10.0per people) and lowest is Kaliachak-1 (004 per people).
Table 5: Showing Various Type of Domestic Animals& Birds in Malda District, 2014
Figure 5
Block Name Ownership of
Live stock Household in %
Livestock per head
Goat per head
Other domestic bird
per head Harishchandrapur-II 70 1.08 1.4 10.0 Chanchal -II 66 1.0 1.3 9.1 Harishchandrapur-I 82 1.4 1.1 1.8 Kaliachak-III 88 2.2 2.7 1.0 Ratua-II 60 1.2 1.0 6.0 Ratua-I 84 2.4 1.1 1.6 Chanchal Urban 30 0.9 0.4 1.9 Chanchal-I 18 0.6 0.3 0.4 Kaliachak-I 20 0.6 0.2 0.4 Manikchak 78 1.2 2.4 7.1 Total 60 1.2 1.2 3.9
Source: Field Survey, 2014.
Food Security Status Among Muslim Households in . . .

Life and Living Through Newer Spectrum of Geography100
Income
FAO (2001) report said that household must havesufficient income to purchase the food. Food securitiesrefer when people get adequate amount of food for healthyand active life. When people have sufficient income peoplepurchase all kinds of essential material from market.Per capita income in Malda is shown relatively high ascompared to other north Bengal Districts. But the averageper capita income are not indicates uniform householdincome. The study try to find out households level income.Average monthly income of the Muslim household isRs.1497 and vary from block to block. According to tableno. 6 & figure no.6, more than 24 percent householdhave income less then Rs. 5000 per month which amountis not sufficient for maintained their households status.The largest income group household having income inbetween Rs 5001 -1000 which is contributed more than30.6 per cent of the total households and about 20.4percent household having income in between Rs.10000-15000 followed by Rs. 15001-20000(8.6 percent) and aboveRs 20000(15.6 percent).The share of female income arealso shown in table 6 and figure 6 which having importantrole for reduction of household poverty. According tofield report, only 6.07 percent (out of 100%) incomes arecontributed by female member. The study finds theimportant relationship between per capita income andshare of female income. The highest percentage of femaleincome is found in Chanchal-I ( 9.72%) followed byKaliachak-I(9.49%), Chanchal urban(9.09%), and verymarginal amount of income came from in those block ofMalda district likely Ratua-I (1.21%), Ratua-II(1.22%) andHarishchandrapur-I(1.34%). he study also depicted greatvariation of per capita income from block to block; highestper capita income block is Kaliachak-I which is Rs. 2332monthly followed by Chanchal-I (Rs. 2320), Chanchalurban(Rs.1943), Ratua-II(Rs.1355), Harishchandrapur-I(Rs1323), Kaliachak-III (Rs.1312), Manikchak (Rs.1146),Chanchal –II (Rs. 902), Harishchandrapur-II(Rs.869) andRatua-I(Rs.859).

101
Tab
le 6
: S
ho
win
g t
he
var
iou
s in
com
e G
rou
p H
ou
seh
old
am
on
g M
usl
im P
op
ula
tio
n i
nM
ald
a D
istr
ict,
201
4
Blo
ck N
ame
Inco
me
Rs
Fem
ale
Per
C
apit
aIn
com
eIn
com
e
<50
0050
01-
10,0
00-
1500
0-A
bove
20
000
Per
cen
tage
Mon
thly
1000
015
000
2000
020
000
In R
s.
Har
ish
chan
dra
pu
r-II
42.0
24.0
10.0
1014
6.83
869
Ch
anch
al -
II34
.028
.014
.08
166.
3490
2
Har
ish
chan
dra
pu
r-I
16.0
42.0
28.0
68
1.34
1323
Kal
iach
ak-I
II26
.040
.020
.06
82.
5313
12
Rat
ua-
II34
.038
.018
.06
41.
2213
55
Rat
ua-
I20
.042
.022
.02
61.
2185
9
Ch
anch
al U
rban
12.0
14.0
28.0
1234
9.09
1943
Ch
anch
al-I
6.0
20.0
18.0
1442
9.72
2320
Kal
iach
ak-I
10.0
26.0
30.0
1618
9.49
2232
Man
ikch
ak40
3216
66
5.12
1146
Tota
l24
30.6
20.4
8.6
15.6
6.07
1497
Sou
rce:
Fie
ld
Surv
ey,
2014
.
Food Security Status Among Muslim Households in . . .

Life and Living Through Newer Spectrum of Geography102
Figure 6
Basic Households Facilities
Households’ conditions are the important instrumentto measure the status of food security. Table no. 7 isshown the housing condition and inters facilities withinhouseholds. According primary survey most of thehousehold are Kutcha which is about 55.2 percent ofthe total household among the sample. Only 31.6 percenthouseholds are pucca followed both type (7.6%) andmixed (5.6%). Report said that only 44.4 household havingtoilet facilities within house and remaining 55.6 percenthousehold used vacant land or brush or nearby hiddenplaces. Out of toilet facilities households, more than 10.8percent household toilets are katcha and 33.6 percenthousehold having pucca toilet facility. Bathroom facilitywithin house premises are presents very low percentage,only 36.2 per cent house having bathroom facility and28.2 percent house having pucca bathroom,4 percenthaving Kutcha and 3.8 percent house use open space.More than 64 percent houses have no idea aboutbathroom.
Drinking Water Facilities
Without food man could be survived few a days butwithout water cannot imagine life in a single day. Drinking

103
Tab
le 7
: S
ho
win
g T
yp
e o
f H
ou
seh
old
& B
asic
Ho
use
ho
lds
Fac
ilit
ies
amo
ng
Mu
slim
Hou
seh
old
in
Mal
da
Dis
tric
t, 2
014
Blo
ck N
ame
Hou
sin
g Ty
peTo
ilet
Fac
ilit
ies
Bat
h R
oom
Fac
ilit
ies
Ku
tcha
Pu
cca
Bot
hM
ixed
Yes
Kat
cha
Pu
cca
Yes
Kat
cha
Pu
cca
Ope
nS
pace
Har
ish
chan
dra
pu
r-II
808
102
3210
1614
48
2
Ch
anch
al -
II76
.08.
010
.06
1810
88
08
0
Har
ish
chan
dra
pu
r-I
68.0
12.0
10.0
1020
128
104
42
Kal
iach
ak-I
II70
.014
.04.
012
188
164
22
0
Rat
ua-
II82
.014
.02.
02
188
1010
010
0
Rat
ua-
I70
.014
.06.
010
142
128
44
0
Ch
anch
al U
rban
8.0
78.0
8.0
610
08
9210
04
6828
Ch
anch
al-I
12.0
76.0
10.0
210
020
8098
2080
0
Kal
iach
ak-I
8.0
72.0
16.0
410
016
8498
290
6
Man
ikch
ak78
.020
.00.
02
2414
1012
08
0
Tota
l55
.231
.67.
65.
644
.410
.833
.636
.24
28.2
3.8
Sou
rce:
Fie
ld
Surv
ey,
2014
Food Security Status Among Muslim Households in . . .

Life and Living Through Newer Spectrum of Geography104
Water facility among the sample household are very badbecause maximum number of households have no ideaabout water quality. According to field report(table no.8& Figure 7), more 60.8 percent sampling household arecollecting the drinking water from hand pump which isranges from 40-100 metres deep and only 13.4 percentsampling household are taken water from the Governmenttube well which water quality is better as compare tohand pump. About 23.8 percent Muslim households areenjoying government supply water and remaining 1.2percent households are having not any particular sourcesof drinking water. The hand pumps are mainly popularin backward area of sampling household in Malda districtlikely, Manikchak (96%), Harishchandrapur-I& II (94&100%), Chanchal-II (94%), Ratua-II(88%) and 32 percentin Kaliachak. In other hand, government water supplyconcentrated area are Chanchal-I(98%), ChanchalUrban(78%)and Kaliachak-I (62%).
Table 8: Showing the Existing Sources of DrinkingWater Facilities in Malda District, 2014
Block Name Source Of Drinking Water
Tube Well Govt. Supply Hand Pump Other
Harishchandrapur-II 6.0 0.0 94.0 0 Chanchal -II 6.0 0.0 94.0 0 Harishchandrapur-I 0.0 0.0 100.0 0 Kaliachak-III 34.0 0.0 64.0 2 Ratua-II 12.0 0.0 88.0 0 Ratua-I 56.0 0.0 26.0 10 Chanchal Urban 8.0 78.0 14.0 0 Chanchal-I 2.0 98.0 0.0 0 Kaliachak-I 6.0 62.0 32.0 0 Manikchak 4.0 0.0 96.0 0 Total 13.4 23.8 60.8 1.2
Source- Field Survey, 2014

105
Figure 7
Status of Mortality
The health of the people is a matter of serious nationalissues. It is highly related with the overall socio-economicdevelopment of the country. A healthy and curepopulation is a developmental goal by itself though itis also a necessary ingredient for the other wider goalsof social and economic development. India’s health systemseems to be currently at cross roads with major changesoccurring in the morbidity and mortality patterns. Alarge proportion of Muslim population in Malda districtare remains poor and vulnerable. Lack of essential healthservices, miserable transport and communication systemand support structures increase the malnutrition risk tothe population, in particular pregnant, nursing womenand children. According primary survey, more than 43.24percent (table no.9) people have been suffering by variousdiseases in the study area and mortality rate amongdifferent age group population are very high as compareto district total. Total mortality refers to include all agegroup people which is 26 per thousand populationfollowed by adult mortality rate(12/1000),Male childmortality upto 6 years age(105/100), Female child
Food Security Status Among Muslim Households in . . .

Life and Living Through Newer Spectrum of Geography106
mortality rate(91/1000 and child mortality rate which isrefer up to 14 year (148/1000).
Table 9: Showing the Block Wise Mortality amongthe Muslim Household in Malda District, 2014
Public Distribution System
The public distribution system is very popular inIndia and the Public Distribution System (PDS) evolvedas a system of management of scarcity and for distributionof food grains at affordable prices. Over the years, PDShas become an important part of Government’s policyfor management of food security in the country. PDS issupplemental in nature and is not intended to makeavailable the entire requirement of any of the commoditiesdistributed under it to a household or a section of thesociety. Under PDS system total household have beendivided into four types on the basic of economic statusof household, namely APL (Above Poverty Line), BPL(Below Poverty Line), AAY (Antyodaya Anna Yojana)and Annapurna Anna Yojana. Table no. 10 is presentingthe scale of public distribution system, amount of fooditem per head and price person. Under the PDS, only
Mortality Rate Per 1000
Block Name Total Adult Male Child
Female Child
Child Mortality
Harishchandrapur-II 20 9 83 111 86 Chanchal -II 12 5 83 0 85 Harishchandrapur-I 32 12 65 107 70 Kaliachak-III 40 16 88 63 93 Ratua-II 16 5 77 77 80 Ratua-I 45 20 49 81 54 Chanchal Urban 16 4 200 77 203 Chanchal-I 28 5 286 200 292 Kaliachak-I 57 36 250 143 257 Manikchak 20 4 107 63 111 Total 26 12 105 91 148 Source: Field Survey, 2014

107
Annapurna category are get food grain 10 Kg/Head/month free of cost. According to primary survey, more46.8 percent sampling households among muslim areBPL card Holder and almost equal (46%)number ofhouseholds belong to APL category followed byAntyodaya Anna Yojana (AAY- 4.6 %) and Annapurnaare only 2.6 percent (table no. 11).
Table 10: Scale of Distribution & Price
Table 11: Distribution of Type of Ration Cardamong Muslim Household in Malda District
Category Rice Wheat Sugar
Annapurna 10 Kg/Head/ month
free of cost XXX XXX
AAY 1Kg/Head /week @
Rs 2.00/Kg 750 gm/H/W @
Rs 2.00/Kg 500gm/H/ week @
Rs 13.50/Kg
BPL 1 Kg/Head/ week @
Rs 2.00/Kg 750 gm/Head/Wk
@Rs 4.65/Kg 500 gm/H/ month @
Rs 13.50/kg
APL 1.5 Kg/Head/ Week
@Rs 9.00/Kg 750 gm/ Head/week
@ Rs 6.75/Kg XXX
Sources: Food Inspector and design by author
Block Name Type Ration Card
APL BPL Antyodaya Anna Yojana (AAY) Annapurna
Harishchandrapur-II 42 52 2 4 Chanchal -II 50 44 4 2 Harishchandrapur-I 24 70 2 4 Kaliachak-III 28 62 6 4 Ratua-II 38 54 4 4 Ratua-I 34 54 8 4 Chanchal Urban 72 24 4 0 Chanchal-I 80 18 2 0 Kaliachak-I 68 26 6 0 Manikchak 24 64 8 4 Total 46 46.8 4.6 2.6
Source: Field Survey, 2014
Food Security Status Among Muslim Households in . . .

Life and Living Through Newer Spectrum of Geography108
Bank Account
According Sachar Committee report, the Muslim isthe most backward community in India. User bank amongMuslim population is very low. Only 28.33 percent peoplehaving bank account and remaining large number ofpopulation never use the banking system. Out of 28.33percent, 17.68 percent (table 12) populations are malepeople and 10.75 percent populations are female member.
Table 12: Showing Number of Population HavingBank Account among Household of Muslim in
Malda District
Food Security Status
Food security at household level is not directlymeasurable, it was necessary to use a proxy indicator,one that indirectly measured the phenomenon of ahousehold’s access to food. During the time of primarysurvey, some important question asked to head of thefamily which essential for measures the status of Scio-economic status as well as food security status. Accordingrespondent’s response among Muslim household in theMalda district are 33.6 percent household feel that thereis no surety of cooking food in the kitchen in the home
Block Name No of family member having Bank account
Total Male Female Harishchandrapur-II 37.65 61.29 38.71 Chanchal -II 37.65 63.44 36.56 Harishchandrapur-I 11.50 52.78 47.22 Kaliachak-III 29.73 53.64 46.36 Ratua-II 29.92 67.11 34.21 Ratua-I 13.17 81.82 18.18 Chanchal Urban 30.04 67.11 35.53 Chanchal-I 35.00 66.23 33.77 Kaliachak-I 39.30 58.89 41.11 Manikchak 29.71 59.76 40.24 Total 28.33 17.68 10.75
Source: Field Survey, 2014.

109
and 66.4 percent households are having food store forfew days. In other hand 32.6per cent households aredaily gather food item by doing work. Most of the remotesampling areas are showing highest number of dailyfood scarcity household. Maximum insecure are foundin Ratua-II which is 48 percent household shown in thetable number 13 followed by Harishchandrapur-II(42 %household), Manikchak(40% household),Harishchandrapur-I (38 % household), Chanchal-II (36% household), Kaliachak-III (32% household), Kaliachak-I(24% household), Chanchal urban (18% household) andChanchal-I (16% household)
Table 13: Showing the Everyday Household Foodsecurity status among Muslim in Malda District,
2014
Basic Food Availability among Muslim Household
Next similar question again asked by household wisein Malda district to identified the actual food securitystatus among Muslim household. Table no. 14 is vividlyshowing the particular question which have been askedby household wise and also are showing very clear result.
Block Name You ever feel that there is no surety of cooking food in the kitchen in the home?
Yes No Harishchandrapur-II 42 58
Chanchal -II 36 64 Harishchandrapur-I 38 62 Kaliachak-III 32 68 Ratua-II 42 58 Ratua-I 48 52 Chanchal Urban 18 82 Chanchal-I 16 84 Kaliachak-I 24 76 Manikchak 40 60 Total 33.6 66.4 Source: Field Survey, 2014
Food Security Status Among Muslim Households in . . .

Life and Living Through Newer Spectrum of Geography110
About 8 percent Muslim households respondents arealways feel that even basic food which is essential forsurvival is not available for their family members. Morethan 80.4 percent household head are sometimes feltthat even basic food which is essential for survival isnot available and only 10 percent muslim householdhead are never feel that even basic food which is essentialfor survival is not available.
Table 14: Showing the Status of Basic FoodAvailability among Muslim Household in Malda
District, 2014
During the time of Shortage Food
India is the store house of poor people as well asmalnourished population. About 26 percent of the countrypopulations are living under below poverty line (BPL)and more than 40 percent household are still food insecurein term of caloric intake. The study are try to find outreal situation of Muslim households food security statusand asked various type of question related to food securitywhich are mainly called the proxy indicator of foodsecurity. Nearly 20.2 percent household among samplingMuslim respondent head are said that they borrow money
Did you ever feel that even basic food which is essential for survival is not available?
Block Name Always Sometimes Never Harishchandrapur-II 2 90 8 Chanchal -II 2 90 8 Harishchandrapur-I 24 72 4 Kaliachak-III 12 80 8 Ratua-II 4 84 8 Ratua-I 8 54 30 Chanchal Urban 4 88 8 Chanchal-I 4 84 8 Kaliachak-I 12 78 10 Manikchak 8 84 8 Total 8 80.4 10 Source: Field Survey, 2014
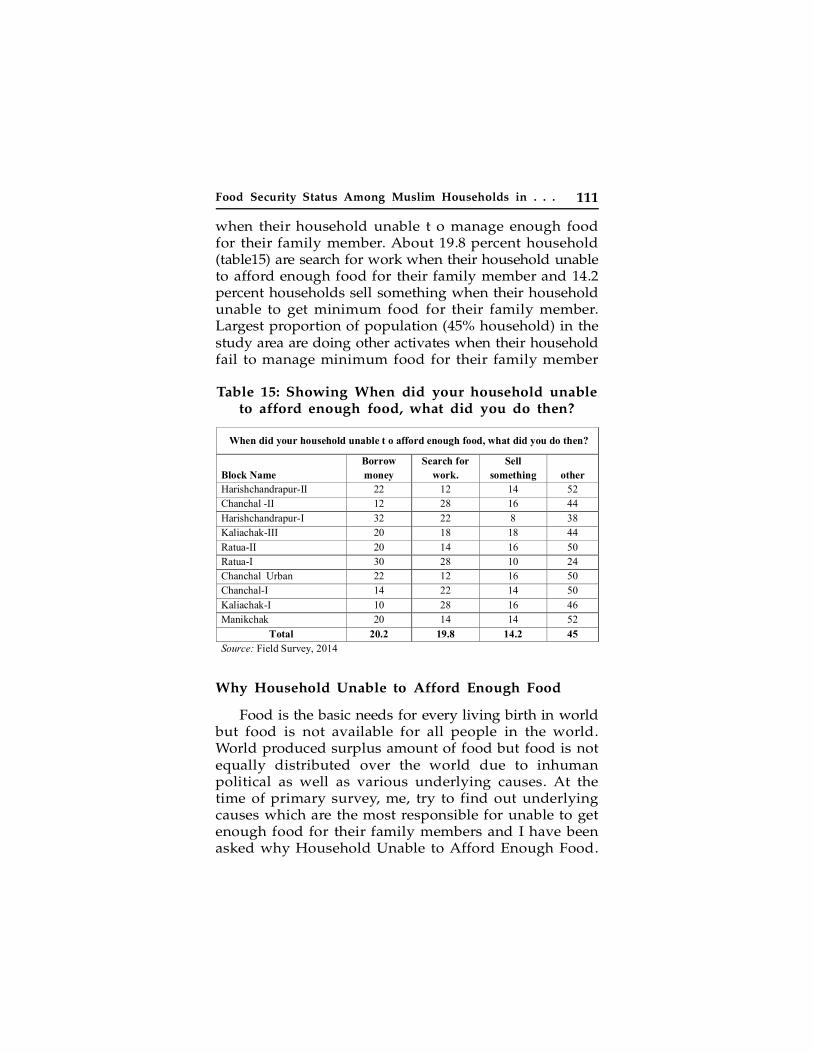
111
when their household unable t o manage enough foodfor their family member. About 19.8 percent household(table15) are search for work when their household unableto afford enough food for their family member and 14.2percent households sell something when their householdunable to get minimum food for their family member.Largest proportion of population (45% household) in thestudy area are doing other activates when their householdfail to manage minimum food for their family member
Table 15: Showing When did your household unableto afford enough food, what did you do then?
Why Household Unable to Afford Enough Food
Food is the basic needs for every living birth in worldbut food is not available for all people in the world.World produced surplus amount of food but food is notequally distributed over the world due to inhumanpolitical as well as various underlying causes. At thetime of primary survey, me, try to find out underlyingcauses which are the most responsible for unable to getenough food for their family members and I have beenasked why Household Unable to Afford Enough Food.
When did your household unable t o afford enough food, what did you do then?
Block Name Borrow money
Search for work.
Sell something other
Harishchandrapur-II 22 12 14 52 Chanchal -II 12 28 16 44 Harishchandrapur-I 32 22 8 38 Kaliachak-III 20 18 18 44 Ratua-II 20 14 16 50 Ratua-I 30 28 10 24 Chanchal Urban 22 12 16 50 Chanchal-I 14 22 14 50 Kaliachak-I 10 28 16 46 Manikchak 20 14 14 52
Total 20.2 19.8 14.2 45 Source: Field Survey, 2014
Food Security Status Among Muslim Households in . . .

Life and Living Through Newer Spectrum of Geography112
According to their response, more than 44.8 percenthousehold head reportedly said that they have not enoughincome to maintain their household requirement and mostof them are engaged as low paid activates. About 22.2percent household head said that they are failing tomanage food due to high casts of essential food itemsand 21.8 per cent household are not enjoy available fooddue to large amount of medical expenditure. Table no.16 is showing, nearly 11.6 percent households are unableto afford enough food due to various reasons and only0.6 percent households are unable to get sufficient amountof food because they have not doing regular work.
Table 16: Showing the Reason, Why HouseholdUnable to Afford Enough Food
Caloric Availability and pattern of food consumption
The per capita caloric availability and pattern of foodconsumption are calculated on basis of the dailyhousehold consumption of all food. All the Food items
Why did your household unable to afford enough food can you tell me the main reason?
Block Name Not
working Not Enough
income Food casts too much
Medical expenditure Other.
Harishchandrapur-II 0 46 30 2 22
Chanchal -II 0 40 14 34 12 Harishchandrapur-I 2 50 18 12 18
Kaliachak-III 4 66 14 4 10 Ratua-II 0 42 26 38 14 Ratua-I 0 34 38 18 2 Chanchal Urban 0 32 30 30 8
Chanchal-I 0 34 26 32 8 Kaliachak-I 0 46 18 24 12 Manikchak 0 58 8 24 10 Total 0.6 44.8 22.2 21.8 11.6 Source: Field Survey, 2014

113
including cereals (Wheat and rice), pulses (Black graindhal, green gram, lentil, Red gram, Bengal Grain dhaletc), vegetables, Fish, milk and milk products, eggs, meat,fruits and other food has been taken into considerationto works out the food availability. According to theirstandard food values, all the foods have been convertedinto caloric value and added all the together. The totalcalories intakes are divided by total family members ofeach household, to get per head per day caloricconsumption. The standard requirement of caloric intakeper head per day is considered 2400 for active and healthylife on the basis of standard requirement. The simplestatistical method applied for the calculation of foodvalues (Ismail, 2013).According to report, the averageper capita caloric availability is 2260 kcal/ per head(table 17) when standard requirement is 2400 kcal/ perhead and some sampling areas are depicted very nicescenario in term of caloric consumption likely Chanchalurban average caloric intake is 2572 kcal/per head andKaliachak –I is 2536 kcal per head followed by Chanchal-I (2650kcal/head). Except these three areas, all the areasare food insecure in term of caloric intake, namely Ratua-II(2393kcal/head), Harishchandrapur-II (2236 kcal/ head),Chanchal –II(2197 kcal/ head), Harishchandrapur- I, 2286kcal/ head), Manikchak(2166 kcal/ head), Kaliachak-III(1809 kcal/ head), It is low to recommended levels,around 75.36 percent(table 17 & figure8) of the energycomes from the cereals alone and better-off householdsconsume less cereals as their income rise, with theirconsumption of other food items like fish, milk and milkproducts, Meat, Egg, fruits, vegetables etc increasing.About 4.65 per cent of the total kcal comes from thevegetables among the sampling household of Muslim inMalda district. Pulses are the most important sources ofdietary protein for the people. But the consumption ofpulse is very low among the Muslim households. Theaverage recommended dietary intake (RDI) for pulses is40 gms/cu/per day. Analysis of consumption of pulses
Food Security Status Among Muslim Households in . . .

Life and Living Through Newer Spectrum of Geography114
Tab
le 1
7: S
how
ing
per
cap
ita
Cal
ori
c &
Pat
tern
of
Fo
od C
on
sum
pti
on
in M
ald
a D
istr
ict,
201
4
Blo
ck N
ame
Foo
d C
onsu
mpt
ion
& S
hare
of
Var
ious
Foo
d It
ems
Per
Cer
eal
Pu
lses
Veg
etab
leF
ish
Mil
kM
eat
Egg
Fru
its
Oth
erC
apit
aC
onsu
m-
Foo
dK
cal
ptio
n
Har
ish
chan
dra
pu
r-II
2236
81.6
91.
835.
081.
221.
141.
432.
000.
684.
93
Ch
anch
al -
II21
9782
.03
1.77
5.15
1.09
0.99
1.32
2.06
0.70
4.88
Har
ish
chan
dra
pu
r-I
2286
57.5
618
.45
2.97
2.32
1.84
0.33
12.3
0.30
4.00
Kal
iach
ak-I
II18
0972
.69
5.51
1.70
1.22
2.05
3.13
3.90
0.73
9.08
Rat
ua-
II23
9382
.58
1.89
5.00
0.97
0.95
1.15
1.95
0.64
4.87
Rat
ua-
I20
9882
.21
2.26
4.68
0.65
1.72
0.70
3.01
0.43
4.34
Ch
anch
al U
rban
2572
74.4
94.
115.
482.
012.
071.
273.
871.
035.
66
Ch
anch
al-I
2650
68.8
95.
765.
803.
083.
391.
354.
741.
225.
76
Kal
iach
ak-I
2536
70.6
85.
205.
592.
452.
881.
284.
971.
045.
91
Man
ikch
ak21
6680
.24
2.41
4.50
0.98
0.95
1.86
2.27
0.63
6.16
Tota
l22
6075
.36
5.02
4.65
1.59
1.76
1.31
4.18
0.73
5.41
Sou
rce:
Fie
ld
Surv
ey,
2014
.

115
at households’ level reveals that households are in villagesconsuming more than 5.02 per cent pulses of the totalfood values. Nearly 1.59 per cent calorie comes fromthe consumption of fish. The fish consumption isdepending upon the income, employment structure andsocio-economic Conditions of the household. Theavailability of meat has been a steadily decreasing dayby day. This decreased availability is due to increasingprices and decline in per capita availability of meat.According to my primary survey, Malda District is thevery low meat consuming district. Only 1.31 per cent ofthe kcal comes from meat. The Indian council of Medicalresearch (ICMR) expert Groups Recommended DietaryIntake (RDI) for milk is 150gm /cu/day. In rural areas,only the highest per capita income groups has averageconsumption of milk higher than RDI (230gms/cu/day)Consumption of milk of medium income group is 121gms/cu/day, whereas the lower groups have intakesbetween 42.86 gms/cu/day. Milk consumption in thestudy area is very low. According to survey, only 1.76per cent energy comes from milk and milk products.
Figure 8
Food Security Status Among Muslim Households in . . .

Life and Living Through Newer Spectrum of Geography116
Egg is an important source of balanced diet. It providesonly 4.18 per cent of the total energy among samplinghouseholds of Malda District. Only 0.73 per cent dailyper capita net availability of energy comes (Kcal) fromdifferent fruits. About 5.41 per cent calories comes fromother food.
Major Findings
I. Average family size among sampling Muslimhousehold in Malda District is 5.49 people and58.44 percent are working age group population.Nearly 41.56 percent population are the age group0-15 years & 60 & above years.
II. Literacy rate among sampling household is 58.93percent, out of them 57.43 percent are male and42.57 percent are female which one is very low.Maximum number of population are seniorsecondary pass which is 31.47 percent among thetotal followed by primary pass(28.16 %), Secondarypass(16.62%), Senior Secondary Pass (13.24%),Graduate & others (8.24%), Post Graduate(PG)pass?(2.43%) and Technical educational attainmentis very rare(0.07%).
III. Only 29.27 percent people (out of 100 %) areengaged as worker in different sectors andremaining 71.73 percent people depend on them.According to study 3 only 10.59per cent peopleengaged as servicemen in both of govt. job andnon govt. jobs and 24.91 percent people engagedas seller, hawker’s, small businessman, shop keeperthat is considered as self employed. Nearly 26.65percent people are farmer followed by dailylabourer (13.52%), agricultural labourer (14.82%)and other worker which person have not anyparticular work (14.45%).

117
IV. According to primary survey more than 35.8percent sample household of Muslim in Maldadistrict are landless and per capita land availabilityis 0.66 bigha.
V. About 60 percent household having livestock, goatand domestic birds.
VI. Per Capita income in the Malda district amongMuslim household is Rs 1497. The study alsodepicted great variation of per capita income fromblock to block; highest per capita income blockis Kaliachak-I which is Rs. 2332 monthly followedby Chanchal-I (Rs. 2320), Chanchal urban (Rs.1943),Ratua-II (Rs.1355), Harishchandrapur-I (Rs 1323),Kaliachak-III (Rs.1312), Manikchak (Rs.1146),Chanchal –II (Rs. 902), Harishchandrapur-II(Rs.869)and Ratua-I (Rs.859), and more than 54 percenthouseholds having less than Rs 10,000 incomeper month. Out of 100 percent, only 6.07 percentare female income.
VII. About 28.33 percent people having bank accountand out of 28.33 percent, 17.68 percent populationsare male people and 10.75 percent populationsare female member.
VIII. About 33.6 percent households are feeling thatthere is no surety of cooking food in the kitchenin the home all over the year.
IX. Nearly 8 percent Muslim households respondentsare always feel that even basic food which isessential for survival is not available for theirfamily members and more than 80.4 percenthousehold head are sometimes felt that even basicfood which is essential for survival is not available.
X. Nearly 20.2 percent household among samplingMuslim respondent head are said that they borrowmoney when their household unable t o manage
Food Security Status Among Muslim Households in . . .

Life and Living Through Newer Spectrum of Geography118
enough food for their family member and 14.2percent households sell something when theirhousehold unable t o get minimum food for theirfamily member.
XI. More than 44.8 percent household head arereportedly said that they have not enough incometo maintain their household requirement and mostof them are engaged as low paid activates. About22.2 percent household head said that they arefailing to manage food due to high casts ofessential food items and 21.8 per cent householdare not enjoy available food due to large amountof medical expenditure.
XII. Mortality rate is 26 per thousand populationfollowed by adult mortality rate (12/1000), Malechild mortality upto 6 years age (105/100), Femalechild mortality rate (91/1000 and child mortalityrate which is refer up to 14 year (148/1000).
XIII. More than 46.8 percent sampling householdsamong muslim are BPL card Holder and almostequal ( 46 %)number of households belong toAPL category followed by Antyodaya Anna Yojana(AAY- 4.6 % ) and Annapurna are 2.6 percent.
XIV. The average per capita caloric availability is 2260kcal/ per head and more than 75 percent caloricenergy comes from cereals food items and 4.65percent come from vegetables.
Conclusion
The household level investigation of food securityamong Muslim reveals that on the whole, the developareas can be said to be more food secure than thebackward area’s household. Farming base householdslocated in the region have higher incomes (both fromagriculture and non-farm employment), higher yields and

119
total production,, have more diversified cropping patternsand are able to spend more on food. Still, the volume offood available to households is approximately the sameamong the each income group of Muslim household andthe average caloric intake is heavily dependent on percapita income. Size of landholding and ownership ofland are found to be the very important determinant ofhousehold level food security. Households with a largerplot of land at their food production are able to providefor their own household needs as well as diversify intogrowing other crops, including the ability to allocate alarger portion of land to cash crop production. Thesehouseholds are able to purchase more food from themarket, consume more food overall, and spend a smallerpercentage of their income on food. Women amongMuslim population in the Malda are found to have muchlower literacy rates than men. Women are generallyresponsible for livestock rearing and food preparationwithin house. A major implication should be of thisresearch is that households need access to moreemployment opportunities to increase their householdfood security. Finally Muslim household are in need ofnutrition education and various schemes to increasedietary diversity through access to cereals, fruits,vegetables and other food.
Suggestion
Based on the outcomes of this study, the followingsuggestions can be formulated for Program interventionsand policy measures:
1. Considering the results of this study that Muslimin Malda are backward in term of per capitaincome, Food security as well as their livingstandard. So Every, government officials,development planners, and communitydevelopment workers alike should made redirectdevelopment efforts towards these areas. Priority
Food Security Status Among Muslim Households in . . .

Life and Living Through Newer Spectrum of Geography120
in terms of programs and projects should be givenfor Malda Muslim population. These programmeand project may lead to increased of income andfood production, and for vocational training anddemanding health and nutrition campaigns to pickup knowledge on nutrition and health of illiteratemothers as well as low level of educated parents.
2. The study among Muslim household in Maldadistrict are confirmed that the smaller thehousehold size, the greater the chance to be foodand nutrition secure. A very strong and immediatefamily planning program, including bothtraditional or “natural” and modern or “artificial”methods of contraception, should be promotedfor their welfare. According to Herrin and Pernia(2003), an effective population program shouldbe directed at: 1) reducing unwanted pregnancies,2) enhancing the preference for small family sizethrough an incentive structure that raises theinvestment per child and lowers the demand forchildren, and 3) reducing population momentumthrough promotion of later age at marriage, laterchild bearing, and birth spacing. Besides these,to increase the effectiveness of the family planningprogram and effective involvement of fathersshould be encouraged.
3. Policy and program emphasis should be on thecreation of high wage-earning non agriculturalemployment. The success of promoting income-generating activities could be to ensure householdfood security and reduced the level of poverty.
4. A number of recommendations were formulatedfor cost effective action in terms of direct foodand nutrition interventions and indirect supportactions to achieve household food and nutritionsecurity. Increased investments and political

121
support for implementation of food and nutritioninterventions and support programs, operationsresearch, Vocational training for manpower, amongothers, are some vital inputs to the effectivedelivery of food production programs.
5. Following Activities should be improve their socio-economic status, likely: handicraft manufacturing,running of various type of household industries,and food vending businesses, developing homegardens, and rearing of animals &bird, poultryfarming etc..
6. Government should remove the discriminationpolicy for development and provide similarinfrastructures like education facilities, transportnetwork and communication, and improvedstorage facilities, in other to produce the constraintsfaced by respondents.
7. There should be easy access to credit facilitiesand government should subsidized cost of input
8. Government should be given special care on SarvaShiksha Abhiyan (SSA), Established more numberof Kasturba Gandhi Balika Vidyalaya, NationalProgramme for Education of Girls at ElementaryLevel (NPEGEL), Mid Day Meal Scheme (MDMS),Mahila Samakhya, setting up of Model Schoolsat Panchayat level, construction of separate boysand girls hostel at school and college level.
9. Some of the major Programmes being popularlyimplemented in the Muslim concentrated pocketin Malda as well as country. The programmesare Swarnajayanti Gram Swarozgar Yojana (SGSY),Prime Minister ’s Rozgar Yojana (PMRY),Swarnajayanti Shahari Rozgar Yojana (SJSRY),Programme for Backward Class People andMinorities, Programmes for Women and Physically
Food Security Status Among Muslim Households in . . .

Life and Living Through Newer Spectrum of Geography122
Handicapped, Margin Money Scheme by KVIC& PKVIB( REGP : KVIC) and Motivation ofUnemployed Persons to start self employedEnterprises Scheme 2006 (MUPSES).
References
1. Census of India, 2011
2. FAO (1983), World Food Security: A Reappraisal Of TheConcepts And Approaches. Director- General’s Report. FAO,Rome.
3. FAO. (1996). Rome Declaration on World Food Security.World Food Summit. Rome: FAO
4. Ismail, M and Mustaquim M (2012), Pattern of FoodConsumption and Food Availability in Malda District (WestBengal), International Journal of Food, Agriculture andVeterinary Sciences, ISSN: 2277-209X, Vol. 2 (3), pp. 108-115
5. Reutlingen S. and Knapp K (1980), “Food Security In FoodDeficit Countries “World Bank Staff Working Paper no 393,World Bank, Washington, DC.
6. UNICEF (1990), Strategy For Improved Nutrition OfChildren And Women In Developing Countries. PolicyReview Paper, UNICEF, New York.
7. United Nations. (1975). Report of the World FoodConference, Rome 5-16 November 1974. New York.
8. World Bank (1986), Poverty and hunger: Issues and options.World Bank, Washington, D.C.
9. www.google.com
10. http://dfpd.nic.in/?q=node/103
11. http://dfpd.nic.in/?q=node/1

123
7Analyzing the Spatial andTemporal Pattern of Land Use/Land Cover Change ofChuru City in Rajasthan
Balendra Pal & Dr. Anjan Sen
ABSTRACT
Urban Land Use refers to the model of land utilisation incities and towns. Urban land use comprises two elements;the nature of land use which relates to which activities aretaking place where, and the level of spatial accumulation,which indicates their intensity and concentration. This studyanalyses the spatial and temporal changes in land use ofChuru city in 1991, 2001, 2011. The intensity of interactionbetween man and spaces in urban areas dynamically changeswith the time leading modification in land use as certainfactors also got dynamically changes such as population,infrastructure, transport, technology and other socio-economicfactors as well. This reflects over space in terms of availabilityof open spaces, green area cover, water bodies and built-uparea of the city. The images of Churu city for this study hasbeen obtained by the land sat ETM+ and TM data fromBhuvan and USGS Global Visualization sites. And, thesecondary data has been obtained through calculating the pixel
Analyzing the Spatial and Temporal Pattern of . . .

Life and Living Through Newer Spectrum of Geography124
value of classified categories of Churu city. The supervisedclassification of 1991, 2001 and 2011 images of the city hasbeen done through ArcGIS and Erdas Imagine 9.2 softwareapplication. The study reveals that the Built-up Area of thecity has reached up to 70.81 per cent in 2011; whereas thegreen area cover, open spaces and the availability of waterbodies has shrunk in 2011 from 1991.
Keywords: Land use, Supervised Classification, GIS,Remote Sensing.
Introduction
Land use and land cover is an important componentto understand global land status; it shows present aswell as past status of the earth surface. Land use andland cover are two separate terminologies which are oftenused interchangeably (Dimyati et al 1994). The Land coverreflects the biophysical of state of the earth’s surfaceand immediate surface, including the soil material,vegetation and water. Land use refers to utilization ofland resources by human beings and land cover changesoften reflects the most significant impact on environmentdue to excessive human activities. Land use and landcover is dynamic in nature and provides a comprehensiveunderstanding of the interaction and relationship ofanthropogenic activities with the environment (Prakasam,2010). Change detection is the process of identifyingdifference in the state of an object or phenomenon byobserving it at different time (Anderson, 1977).Changedetection in Land use/cover can be performed ontemporal scale such as decades to assess landscapechanges caused due to anthropogenic activities on theland (Gibson and Power, 2000). These anthropogenicactivities are due to rapid growth of human populationand demands of food resources. Land use land coverchanges have been recognized as important drivers ofglobal environment change (Turner et al 1996). Hightemporal resolution, precise spectral bandwidths, and

125
accurate geo-referencing procedure are factors thatcontribute to increase use of satellite data for changedetection analysis (Jensen, 1996). Now, advancedgeospatial technologies have further improved theefficiency of mapping of land use land cover type atlandscape level. Thus, integration of these techniquesforms a potential tool for land use land cover and changedetection. In the present study, land use land covermapping and change detection has been done for ChuruCity located in North- West part of Rajasthan as well asof India.
The land use of the city has been classified as GreenArea Cover, Open Space Availability, Water body andBuilt-up Area. The spatial and temporal study deals withthe growth and shrinkage of classified spaces of the cityin the period of 1991, 2001 and in 2011. The map of thecity and the data has been prepared with the help ofRemote Sensing and GIS software if ArcGIS 10 and ErdasImagine 9.2.
Study Area
Churu is a city in the desert region of Rajasthanstate of India. It is known as gateway to the Thar Desertof Rajasthan. It is the administrative headquarters ofChuru District. It lies in the Thar Desert on the NationalHighway-65 connecting Pali to Ambala and is a junctionstation on the railway line to Bikaner. The city is knownfor the grand havelis with marvelous fresco paintings,namely Kanhaiya lal Bagla ki Haweli and Surana Haweli,with hundreds of small windows. It also has some fineChhatris.
The city was founded in A.D. 1620 by Churru, achieftain of the Jats (an agricultural people of northernIndia). Before India’s independence in 1947, it was apart of Bikaner State. The district came into existence in1948 comprising three tehsils Churu, Rajgarh and
Analyzing the Spatial and Temporal Pattern of . . .

Life and Living Through Newer Spectrum of Geography126
Taranagar, when the administration of Bikaner State wasreorganized.
The economy of the town and surrounding area ismainly based on agriculture and animal husbandry. Churuis the main mandi(market) for agricultural produce ofthe area. There is no large or medium size industry inthe industrial area. The main small-scale industries aregranite slabs and tiles, cutting and polishing, and mustardseed crushing.
Geographically, it is located at 28.01N and 73.18E inthe North-West part of the Country (India) and as wellas in the State (Rajasthan). The city is in the midst ofthe Thar Desert and has a hot desert climate (Köppenclimate classification BWh) with very little rainfall andextreme temperatures. The Churu City is encircled bylarge shifting sand dunes. The area is scanty in vegetation.In summer temperatures can exceed 45 °C, and duringthe winter they may dip below freezing. The climate inChuru is characterised by significant variations intemperature. In the summer season it is very hot whenthe temperatures lie in the range of 28–48.5 °C. In thewinter, it is fairly cold with temperatures lying in therange of 5–23.2 °C. Annual rainfall is in the range of260–440 millimetres (10–17 in).
However, Churu is one of the prominent cities ofRajasthan. The population of the city has growntremendously. As it can be assessed from the period of1991, 2001 and 2011; the population was 416289, 529690and 644406 respectively. The city has well developed asCommercial, Financial, Educational, Industrial and TouristCenter in the State and at national level. Along withthis it is well connected by Rail, Road and Air link torest part of the State and Country.

127
Map 1.1: Study Area: Churu City
Methodology and Database
To analyse the spatial -temporal aspect of land usescenario of Churu City the GIS technique with the helpof satellite imagery and different software has been used.
Data Month of Observation Spatial Resolution/Scale
Land Sat-5 (TM) and
Land Sat-7 (ETM+ )
2011- March, May, October 28.50m
Land Sat-5 (TM ) 2001-December 28.50m
Land Sat-4 (TM ) 1989-March,1991-May, September, November
28.50m
SOI Map 1967, 1969 1:63360
Analyzing the Spatial and Temporal Pattern of . . .

Life and Living Through Newer Spectrum of Geography128
Methodology for Preparing Land use maps
Preparation of base map, land use maps of 1991,2001 and 2011 years based on visual/ digitalinterpretation of satellite data.
Limited field visit to update and collect theadditional information and to check the accuracyof interpretation.
Incorporation of field observation in base mapsand in land use maps.
Preparation of Base Maps
The base map of Churu city has been prepared bySOI Topo sheets and updated by the base map preparedby Town Planning Department, Rajasthan. The map ofthe city has been obtained and updated by the LandsatETM+ and TM data. The features of the regions havebeen classified into Built-up area, Open Spaces, GreenArea Cover and Water bodies.
Built-up area shown in Pink colour includes theresidential, commercial, Industrial Transportation,Communications, and Utilities Industrial and CommercialComplexes Mixed Urban or Built-up Land Other Urbanor Built-up Land and transport structure of the city.
Open spaces shown in Light Yellow includeTransitional Areas, Mixed Barren Land, Waste-land, play-ground and Recreational spaces.
Green Area Cover shown in Green colour includesgardens, parks, nurseries and orchards.
Water bodies shown in Sky blue colour includebawaris (ponds), water course and canal.
Preparation of Land use Maps
Land use maps are mainly based on the visualinterpretation of Satellite imagery adopting deductive

129
approach by studying image characteristics and terraininformation in conjunction with a prior knowledge ofgeneral land use structure of concerned area. The shape,size, colour, location, tone, texture, pattern and associationwith other features observable on the satellite image havebeen used for differentiating various land use categories.The satellite image of year 1989, 1991, 1999, 2001 and2011 of the city has obtained by the land sat ETM+ andTM data from Bhuvan and USGS Global Visualizationsites.
Integration of thematic Layers and field Data
Scanning of maps.
Digitization of base maps in Arc view.
Transformation of images and geo coding.
Transformation of all digitized land use maps onbase map characteristics.
Editing of coverage to remove errors, such asdangles, nodes, overshoots and undershoots.
Building the topology after removing error andbrought within the tolerance limit.
Labeling the features as per the standard codes/symbols for representing land use map units.
Digital supervised classification to categorize theclasses.
On screen visual interpretation for correction inrectified data.
Creation of the vector coverage into bitmap classesthrough rasterization process.
Creation of land use classified image of differentyears using Erdas Imagine 9.2 operations.
Analyzing the Spatial and Temporal Pattern of . . .

Life and Living Through Newer Spectrum of Geography130
Land Use Classification (in per cent)
Year
1991 2001 2011
Water bodies 0.00 0.37 0.28 Open Spaces 39.06 24.88 24.92
Green Area Cover 2.80 11.78 3.99 Built-up Area 58.14 62.97 70.81
Source: Calculated pixel value of Satellite Imagery 1991, 2001 and 2011 by Researcher.
Data Input
Data for different land use category has been takenby computing the pixel value of the concernedclassification that is of Built up area, Water bodies, GreenArea Cover and Open Spaces.
Table 1.1: Land use in Churu City in 1991,2001 and 2011.
Software Used
In creation of land use map by classifying the differentaspect Arc GIS 10.2, Erdas Imagine 9.2 and Arc Viewsoftware has been used.
Result and Discussion
The city of Churu is classified into class I Town,having population size of 119856 as per census of India,2011. The city is a well-developed Industrial, Educational,Commercial and Tourist centre not only on State levelbut also on National level. The city is also endowedwith Transport connectivity in terms of Rail, Road andAir Links. People throng in the city from various partsof the state and of the country to sustain their aspirations.Therefore, the available space of the city has been putto different uses over a period of time to cater the needof People of the city. So forth, the land use has beenclassified into four categories viz. Water-body availability,Built-up Area, Green Area Cover and the Open Space in1991, 2001 and 2011 has been taken as period of study.

131
Land use in Churu City
In 1991, the percentage of land use in terms of Waterbody availability, Open Space, Green Area Cover andBuilt-up Area was 0.00 per cent, 39.06 per cent, 2.80 percent and 58.14 per cent respectively in the City. This isalso visible in the Map 1.2 showing Land use in ChuruCity. And in 2001, the percentage of land use viz. Waterbody availability, Open Space, Green Area Cover andBuilt-up Area was 0.37 per cent, 24.88 per cent, 11.78per cent and 62.92 per cent respectively in the City. Thisis also visible in the Map1.3 showing Land use in ChuruCity.
Map 1.2: Land use of Churu City in 1991.
Source: Satellite imagery 1991, acquired from USGS GlovisVisualization.
Analyzing the Spatial and Temporal Pattern of . . .

Life and Living Through Newer Spectrum of Geography132
Map 1.3: Land use of Churu City in 2001.
Source: Satellite imagery 2001, acquired from USGS GlovisVisualization.
Whereas in 2011, the availability of Water body, OpenSpace, Green Area Cover and Built-up Area in the citywas 0.28 per cent, 24.92 per cent, 3.99 per cent and 70.81per cent respectively. This is also visible in the Map 1.4showing Land use in the City.
From the above Maps of Land Use in the city, it isclearly evident that over a period of time the city hasseen significant change in its pattern of Land use.
Land use Change in the City
Over a period of time the pattern of land use in thecity has dynamically changed. It has been seen that Built-up Area of the city has increased to almost two fold onthe cost of other classified categories viz. Open Spaceand Green Area Cover of the city. However, the availbilityof Water body in the city has remained almost negligibleand Constant. This change in the uses of Land has been

133
studied in two phases; First beginning from 1991 to 2001and Second one beginning from 2001 to 2011.
Map 1.4: Land use of Churu City in 2011.
Source: Satellite imagery 2011, acquired from USGS GlovisVisualization.
In the period of 1991-2001, the city has seen significantpositive change in Built-up Area from 58.14 per cent to62.92 per cent. On the contrary Open Space area of thecity has decreased from 39.06 per cent to 24.88 per cent,however in the mean time the Green Cover area of thecity has seen increase from 2.80 per cent to 11.78 percent.
This is clearly shown in the Land use Change Map1.5of the city and evidences can also be discerns from Table1.3.
Analyzing the Spatial and Temporal Pattern of . . .

Life and Living Through Newer Spectrum of Geography134
Map 1.5: Change in Land use of Churu City in 1991-2001.
Source: Satellite imagery 1991-2001, acquired from USGS GlovisVisualization.
Table 1.3: Matrix Analysis of Land use Change inChuru city within year 1991-2001.
Source: Calculated pixel value of Satellite Imagery 1991-2001byResearcher.
In the period of 2001-2011, Built-up Area has increasedfrom 62.92 per cent to 70.81 per cent. There was a minimalpositive change in the area of Open Space from 24.88per cent to 24.92 per cent, but the Green Area Cover of
Year
Year 2001 Land Use
Classification Water bodies
Built up Open Space
Green Area Total
1991
Water bodies 0.00 0.00 0.00 0.00 0.00 Built up 0.20 47.34 3.11 7.49 58.14
Open Space 0.09 14.28 21.71 2.98 39.06
Green Area 0.09 1.35 0.05 1.31 2.80 Total 0.37 62.97 24.88 11.78 100.00

135
the city has shrunk from 11.78 per cent to 3.99 per cent.However, the area of Water body has minimally decreasedfrom 0.37 per cent to 0.28 per cent. The pattern of changehas been shown through the map 1.6 and also in theTable 1.4.
Map 1.6: Change in Land use of Churu City in 2001-2011.
Source: Satellite imagery 2001-2011, acquired from USGS GlovisVisualization.
Table 1.4: Matrix Analysis of Land use Change inChuru city within year 2001-2011.
Year
Year 2011 Land Use
Classification Water bodies
Built up
Open Space
Green Area Total
2001
Water bodies 0.10 0.20 0.09 0.00 0.38 Built up 0.14 53.35 8.11 1.45 63.05
Open Space 0.00 9.97 13.61 1.00 24.58
Green Area 0.05 7.52 2.87 1.56 11.99 Total 0.29 71.03 24.68 3.99 100.00
Source: Calculated pixel value of Satellite Imagery 1991-2001by Researcher.
Analyzing the Spatial and Temporal Pattern of . . .
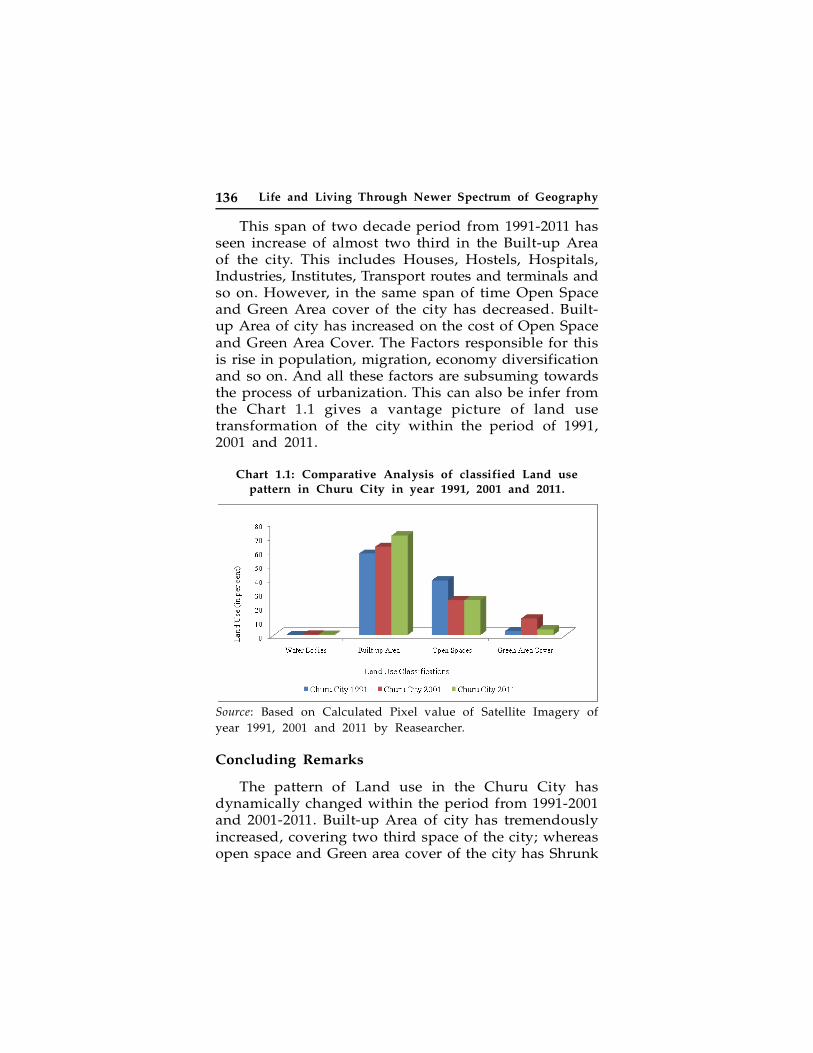
Life and Living Through Newer Spectrum of Geography136
This span of two decade period from 1991-2011 hasseen increase of almost two third in the Built-up Areaof the city. This includes Houses, Hostels, Hospitals,Industries, Institutes, Transport routes and terminals andso on. However, in the same span of time Open Spaceand Green Area cover of the city has decreased. Built-up Area of city has increased on the cost of Open Spaceand Green Area Cover. The Factors responsible for thisis rise in population, migration, economy diversificationand so on. And all these factors are subsuming towardsthe process of urbanization. This can also be infer fromthe Chart 1.1 gives a vantage picture of land usetransformation of the city within the period of 1991,2001 and 2011.
Chart 1.1: Comparative Analysis of classified Land usepattern in Churu City in year 1991, 2001 and 2011.
Source: Based on Calculated Pixel value of Satellite Imagery ofyear 1991, 2001 and 2011 by Reasearcher.
Concluding Remarks
The pattern of Land use in the Churu City hasdynamically changed within the period from 1991-2001and 2001-2011. Built-up Area of city has tremendouslyincreased, covering two third space of the city; whereasopen space and Green area cover of the city has Shrunk

137
to barely 24.92 per cent and 3.99 per cent respectively.However, it seems that within two decades ofliberalization of Indian economy the pace of urbanizationhas been faster than earlier. To say it in other words,the process of urbanization has begun at tremendouspace in the cities of Developing world contributed bythe factors of Population growth, migration, transportation,need of settlement and so on. And this pace and processcan be visible in the dynamic shift of land use patternof the Churu city within the period of two decades viz.1991-2001 and 2001-2011. However, the accurate policyand plans are needed to shape cities of developing world.
Acknowledgements
We want to thank Department of Geography(University of Delhi), Staff of Ratan Tata Library (DelhiSchool of Economics) and U.G.C. for technical and researchsupport. We would also like to thank the Staff at TownPlanning Department, Bikaner City for extending theirinvaluable support and guidance in Study Area.
References
Anderson, J. R. (1977). Land use and land cover changes. Aframework for monitoring. Journal of Research by theGeological Survey, 5, 143-153.
Dimyati, M., Mizuno, K., Kitamura, T (1994). An Analysis ofLand Use/Cover Change using the combination of MSSLandsat and Land Use Map: A Case Study in Yogyakarta,Indonesia: International Journal of Remote Sensing, 17(5),931 – 944.
Gibson, P. and Power, C. (2000). Introductory Remote Sensing:Digital Image Processing and Applications.
Jensen, J. R. (1996). Introductory Digital Image Processing (3rded.). Upper Saddle River, NJ: Prentice Hall.Routledge, 92– 112.
Prakasam, C. (2010). Land use and land cover change detectionthrough remote sensing approach: A case study of
Analyzing the Spatial and Temporal Pattern of . . .

Life and Living Through Newer Spectrum of Geography138
Kodaikanal taluk, Tamil nadu, International journal ofgeomatics and geosciences, 1(2).
Town Planning Department. (2011). Master Plan Churu (2010-2013).Bikaner: Urban Development and Housing Department,Govt. of Rajasthan.
Turner, B. Skole, D. Sanderson, S. Fisher, G. Fresco, L. and Leemans,R. (1996). Land Use and Land Cover change Science/Research Plan, International. Human Dimensions of GlobalEnvironmental Change
Yadav, P. K. and et al. (2012). Land Use Land Cover Mapping,Change Detection and Conflict Analysis of Nagzira-Navegaon Corridor, Central India UsingGeospatialTechnology. International Journal of Remote Sensingand GIS, Volume 1, Issue 2, pp. 90-98.
E-References
• http://bhuvan.nrsc.gov.in/
• http://censusofindia.org/
• http://glovis.usgs.gov/

139
8Analysis of Traffic Flow Patternand its Impact: A Study onGariahat Flyover & itsAdjacent Area
Mr. Surajit Paul & Dr. Sushma Rohatgi
.
Introduction
Kolkata is one of the busiest metropolis in India andthe most important commercial, educational and businesscentre of Eastern India with population growth and alongwith it increase in the demand and use to travel, therehas been a truly quantum leap of vehicular traffic,especially over the last few decades. But fact remains,that the city has inadequate road space to support suchenormous vehicular traffic. Thus the city planners havebrought forth the concept of construction ‘Road overRoads’, i.e., ‘Flyovers’ as its solution. But, accident andtraffic congestion are the main problems of Kolkata tilltoday because of that the city has inadequate road spaceto support such enormous vehicular traffic.
Introducing Study Area
The study area thus forms the entire Kolkata Municipal
Analysis of Traffic Flow Pattern and its Impact

Life and Living Through Newer Spectrum of Geography140
Corporation covering an area of 187.33 square km (asgiven by KMDA) where in the Gariahat and adjacentareas have been selected as the case studies. The studyarea that is KMC is located at 88o23’34’’east, 22o23’47’’north. It stretches along the eastern side of the riverHooghly in an angular direction of 22o and has a totalexpansion up to 20 km from north to south along theriver. The total road space of KMC comprises only abouta measure 6% of the total area and vehicular traffic totalat about 10211881 in 2012 as per public vehicledevelopment.
Objectives
An attempt has been made in this dissertation andtopic to discuss and analyze –
To evaluate the main problems of transportparticularly with reference to accident congestion.
Role of flyovers (Gariahat flyover) in thetransportation development in Kolkata, more overits significance in terms of city’s development andplanning.

141
Lastly suggest some possible remedial measuresof this problem to see whether truly Kolkataaspiring towards attaining a global city ranking.
Methodology
This dissertation has been completed in three distinctphases, where in work has been accomplished by differentmethods. They are –
i) Pre field work: Comprising mainly collection ofsecondary information from home collection.
ii) Field work: Comprising mainly of visiting variousoffices and departments and for collecting data.Also included the questionnaire (sample) surveywhich forms the main source of primary datacollection.
iii) Post field work: Comprising mainly of assemblingof all data and transforming them to differentpictorial/diagrammatic representation by usingseveral cartographic techniques like MapInfoProfessional 10.5, Arc GIS 10.2 etc.
Limitations
There has been some difficulty in obtaining some ofthe information regarding post efficiency of the Gariahatflyover. Another limitation of this work was theunavailability of some relevant information regardingthe transport data and information.
Road Transport in Kolkata
Background
The first comprehensive traffic and transportation lineof Kolkata was under taken in the early sixties by theCalcutta metropolitan planning organisation (CMPO) withthe assistance of foreign consulting farm, which supportedthe metropolitan structure and development proposals
Analysis of Traffic Flow Pattern and its Impact

Life and Living Through Newer Spectrum of Geography142
as envisaged in the basic development plan (BDP)published by CMPO in 1966.
More than37 years have passed, since then and therehas been considerable increase in both area and populationin Kolkata along with other changes associated with it.Thus with increase in both area and population in Kolkata,there has been enormous change in the social economicand physical life of the metropolis.
Transportation Network and Kolkata
Inspite of problems of resources crunch, constraintsof land acquisition, operation and maintains, priceescalation and difficulties of co-ordination, maintainingand management desire to travel have increased anddespite of the soil scarcity, personalised transport likecars and two wheelers have grown at a alarming rate.Owing to this growing demand in vehicular transportdue to economic growth of the state, Kolkata has alsobeen able to develop its own transport infrastructure.
The road/surface transport infrastructure of Kolkataprimarily comprise of major arterial roads along withother roads, lanes and by lanes. It may be pointed outfrom the existing map that from A.J.C BOSE road in thesouth to Bow Bazar (Sealdah) in the north. SOURCE:-PUBLIC VEHICLESDEPARTMENT (PVD),KOLKATA. The roadsare so mach intricatelyand densely build forsupporting maximumroad of vehiculartraffic, that regionposse’s highest densityof roads of above 6.5km/sq. km. Theimmediate areassurrounding the

143
highest density core extends in all three directions (north,east, south). These remaining regions may be ranked asnext higher order regions having high road density (from4.5 – 6.5 km/sq. km). Low road density is observable inthe far north, far south and western areas of Kolkatahaving less than 2.5 km/sq. km road density.
Growth of Vehicular Traffic
With the passage of time, population has its manifoldincrease in Kolkata. As a result of it, demand to travelha also proportionately increased. Illustrate such a similarphenomenon where in it is seen with in a gap of fiveyears the numbers of fast moving vehicles as increasedto a great extent.
Source: Master plan: 2010, CMDA.
Travel Speed on Major Arterial Roads
The travel speed of vehicular traffic is an indicatorof the quality of flow and traffic load on a particularroad. The high speed of flow is mainly noticeable overthe major arterial and over the flyovers of Kolkata asthey provide a certain relief from heavy decongestionon the mouth of such road to flyover intersection, thusbuilding up cost efficiency from the point of view ofvehicular traffic.
Analysis of Traffic Flow Pattern and its Impact

Life and Living Through Newer Spectrum of Geography144
Source: Kolkata Police (Lalbazar Traffic Control).
Accident Prone Zones
It is observable that north south and central Kolkatais heavily gripped with high incidence of road accidents.According to Kolkata Police (Lal Bazar - Fatal department),some roads like Bidhan Sarani, B.T. road, Beleghata mainroad, M.G. road, A.P.C Roy road, C.I.T road are veryhigh accident prone zones of Kolkata. Medium toaccidental zones are mainly central and west Kolkata,where the main flyovers and traffic crossing areobservable, while south and east Kolkata represent lowto very low accident prone zones.
A further consequence of such accidental zones indeath rate shows the comparative death figures duringlast Three years in Kolkata. The comparison coincidemaximum numbers of death in last three years. In thehighest accident prone zone of Kolkata which intern atseveral places in inversely related to road density?However places like AJC Bose road, J. L. Neheru roadthough fall in the category of medium to low accidentprone zones have recorded comparatively high proportionof deaths in last three years. This may be due to the

145
fact that these places have very high road density wherea huge volume of vehicular traffic flows- thus resultingto large death rate. Other roads like Rashbihari Avenuehave lesser death as they are directly proportional toboth accidental and road density zones. The comparativedeath figure of accident prone roads of Kolkata duringlast three tears are provided in table.
Solution to Transportation Problem of Kolkata
Looking forward to the several problem oftransportation of Kolkata, the Govt. of West Bengal hastaken special efforts in improving the transport situationKolkata in recent years. The solutions are describedthoroughly –
Widening and Strengthening Existing Arterial Roads
It has been observed from existing traffic volumeson major arterial roads in Kolkata that a number of roadsto be widen to cater for the future increased trafficvolumes. Based on the future traffic estimates and theexisting capacities, a number of roads are recommendedfor widening and strengthening work on some of whichhave already been completed and on some other workis undergoing. In case where it would not be possibleto widen the roads to the desired extent due to therestricted right of way, widening to the extent possibleshould be done.
Construction of Fly Over
The transport constraints of Kolkata led the Govt. ofWest Bengal to take step to increase the traffic carryingcapacity by constructing few flyovers under the CalcuttaTransport Infrastructure Development Project (CTIDP) withloan assistance of the Overseas Economic Co-OperationFund (OECF), Japan.
Analysis of Traffic Flow Pattern and its Impact

Life and Living Through Newer Spectrum of Geography146
Gariahat Flyover
Location
Gariahat flyover is a standard 4- lane divided flyover,571 meter long, lying almost between Golpark andBallygunge Shikshasadan on Gariahat road, having 2-lane surface road on the either side of flyover. At theintersection, all approaches and exists of Gariahat roadand Rashbihari avenue will have 3 lanes apart fromfootpath 3 m. or more in width. Gariahat flyover wasopen to traffic on 14 th april, 2002.
Basic parameters of flyover
Total flyover length – 571.06 meter.
• Viaduct length – 395.05 meter.
• Approach length – 176.01 meter.
Carriage way – 7.00 meter wide 2 lanes for each.
Traffic load
Prior to the construction of Gariahat flyover, Gariahatintersections experienced explosion of vehicular trafficfrom all directions that is from Golpark in south, Gariahatroad in the north, Rashbihari Avenue in the west andKasba in the east.
Prior to the construction of flyover in Gariahat,Gariahat road and Golpark intersection faced onapproximate number of 28870 vehicles in a day (11-03-2012). This enormous volume used to cause heavycongestion in this intersection which was very inconvenient for general public. But after the constructionof Gariahat flyover, the north south corridor has muchbeen relieved of such heavy traffic and decongestioncreated from it. Gariahat flyover carries large amount oftraffic load which has given free flow of vehicular trafficin Gariahat intersection with lesser congestion.

147
From the analysis of comparative hourly variationin traffic flows at Gariahat intersection during pre andpost flyover period on average week days. It is provedthat construction of Gariahat fly over has considerablydecreased the traffic volume on peak hours of the morningand evening at Gariahat intersection, thereby assuringboth to traffic and pedestrian.
Movement of bus and minibus initially restricted overGariahat flyover but present day scenario is somewhatdifferent. Cars dominate over the flyover both north andsouth appropriate while proportion of bus and minibusis comparatively less. Hooghly River Bridge Commission(HRBC), implementing agency has estimated the trafficcomposition of Gariahat flyover for 2012.
Projected traffic composition on Gariahat flyover (2012)
Source: HRBC.
Traffic Category % of Category % of Category
Bus 9 9Mini Bus 8 8Two- Wheelers 19 17Taxi 36 37Car/Jeep 28 29
Analysis of Traffic Flow Pattern and its Impact

Life and Living Through Newer Spectrum of Geography148
Source: Sample survey, 2012
Cost Benefit Analysis
Gariahat flyover has no doubt made travelling throughthe following road faster and easier. In the processconsumption of petrol/diesel has slightly decreased tosome extent, thus proving to be cost efficient. But inevents when there appears a traffic congestion at thenorthern end of flyover due to widening and levellingof the term track (consider to be the part of the sameproject), cost efficiency of the same declines to someextent. Thus the conclusion cannot yet be rightly drawnas to how far Gariahat flyover has proven to be costefficient for public.
An Eco Friendly Project
Flyover is placed in Gariahat in a most environmentfriendly manner. The alignment of the flyover has beendesigned with an aim to disturb the maximum no. oftrees within the project site. The environmental impactstudy concluded that auto emission and noise pollutionwill be reduced after the completion of the fly over project.

149
Disadvantage
In the present scenario, the role of Gariahat flyoverwould be enormous but to some extent it can be samethat the flyover has decreased the accessibility of Gariahatintersection. This is due to fact that the starting andending point of north south corridor has been pantaloonsand Golpark respectively thus giving much trouble topassengers whose destination is in the between. Besidethe process of road widening and levelling of tram trackadjacent roads have, given rise to excessive dust pollutionand traffic congestion at the northern approach of theflyover respectively. In addition to this it can be saidthat Gariahat fly over has severely hampered the businessclass (shop keepers and hawkers) of the area as theyfacing crisis of customers.
Socio Economic Effects of Flyover on Gariahat and itsAdjacent Areas
A sample survey was conducted on 20th April 2012,which highlighted the influence of Gariahat flyover, trafficrelated problems on the social and economic structureof the adjoining areas of Gariahat. The survey wasconducted on people of various age groups belongingto driver, business class, general public (pedestrians andstudents), some house holder and none other than thepavement dwellers who have now taken shelter in carparking spaces beneath the flyover. The time period ofassociation of this people with Gariahat area were alsoassessed.
The occupational structure of the surveyed populationmainly reflects the dominancy of the business class foraccurate explanation on the effect of the flyover overtheir business and commuters get effected by the trafficcongestion has negative impact. The effect of flyoverseems to be totally negative upon the business class(which includes big shop keepers and road side hawkers).A more grave consequence await the road side hawkers
Analysis of Traffic Flow Pattern and its Impact

Life and Living Through Newer Spectrum of Geography150
of Gariahat whose business suffers from total loss asno. patrolling customers on the streets have declined.
Public opinion: Is gariahat flyover advantageous ordisadvantageous and is Gariahat junction is suitablefor travelling?
Source: Sample survey, 2012.
According to public opinion (which includedpeople of different social and economicbackground), Gariahat flyover is advantageousfrom the point of view of easy and faster traveland for shifting and for shifting the locus ofcongestion from Gariahat intersection to otherplaces. The car parking system has been welcomeby car owners. For the construction of Gariahatflyover, Gariahat junctions facing less of congestionwhich make it easy and faster travel.
But another section of public assessed Gariahatflyover to be an entirely less instrument build byGovt. as it has brought forth with it great loss inbusiness of the entire business community ofGariahat. Some argued about the fact that thecongestion has developed at flyover end nearpantaloons while others complained that for somepeople great time is lost for availing bus, for whichthey have to travel great distance.

151
Most of the footpath occupied by road hawkersfor business activities due to which commutersare using main road for walking which causesslow movement of traffic and accident whichcauses traffic congestion according to commuters.
Fate of Pavement Dwellers
The pavement dwellers who now have taken shelterin the space allotted for car parking beneath the flyover have worsened their own fate. After being affectedfrom the footpaths they had no other choice but to regainshelter under the complete flyover structure. But life forthem has become a hell. The illiterate ignorant massesearn their lively hood as rag pickers and some works asmaid servant but due to city laws they are often affectedout of this place as it is quite unlawful setting there.
The children of this people are the worst hit victimshas their subjected to tremendous pollution and attackof mosquitoes due to which diseases like malaria, coughand cold have become their childhood friend.
A single positive impact of this fly over according tothem is forms like shelter factor. They get shelter fromscorching sun and relief from rain and have welcomedthe flyover for the same but this forms only a provisionalarrangement as they would be eventually evicted out ofthis place shortly.
Main Findings and Suggestions
The flyovers build in Kolkata have brought abouteffective movement in transportation system by reducingtravel time, congestion at critical road intersection andby decreasing excessive traffic load on inadequate andnarrow road system having linear orientation – thusincreasing road space virtually as there is death of spacein Kolkata for any future construction such as Gariahatflyover but the fact remains that pollution has
Analysis of Traffic Flow Pattern and its Impact

Life and Living Through Newer Spectrum of Geography152
simultaneously increased over the years specially by thepoorly maintained vehicles using leaded fuel for whichthis flyover has given an added impetus. Vehicularpollution contributed to about 30% of total pollution inKolkata. The main vehicular sources of noxious gas arediesel truck and buses although they account for only10% of Kolkata’s motor vehicle but they are responsiblefor approximately 90% of the noxious gas emission. Theno. vehicles have risen to above corers (as on 31stDecember, 2011). Thus the proportional increases inpoisonous gases and RSPM (respirable suspendedparticulate matter) can be well assessed. Therefore focusshould be given to the pollution abatement programmesthrough regular checking of auto emission of vehicles.Further it can be added that proper cleansing of theroads and flyovers must be done to reduce dust pollution.Also a standard should be maintained for reducing noisepollution over the junction – as the general public andthe local resident are the most affected victims of thedevelopmental steps towards transportation improvementsof Kolkata. Finally it can be suggested that if Kolkatawant to get the benefits of transportation from the lastsaviour i.e., “flyover and well served traffic”, theircarrying capacity must be kept in mind to avoid anyform of massive accidents in near future – as Kolkata’svehicular traffic is increasing in leaps and bounds throughtime.
Abbreviations
HRBC – Hooghly River Bridge Commissioners
CMDA – Calcutta Metropolitan DevelopmentAuthority
KMDA – Kolkata Metropolitan DevelopmentAuthority
CPCD – Central Pollution Control Board
PVD – Public Vehicles Department

153
KMC – Kolkata Municipal Corporation
PWD – Public Works Development
CTIDP – Calcutta Transport InfrastructureDevelopment Project
OECF – Overseas Economic Corporation Fund
JBIC – Japan Bank For International Corporation
PCU – Passenger Car Unit
References
1. Census Handbook 1961, 1971, 1981, 1991, 2001.
2. Calcutta Transport Infrastructure Development ProjectReports: 2011, HRBC (For Maps).
3. Annual Report (2010), Kolkata Traffic Police.
4. Report On Pollution 2011 By Central Pollution ControlBoard.
5. Report 2011: Public Vehicles Development (PVD), Kolkata.
6. Transportation Circle - Project Plan – 2010, CMDA (ForMaps).
7. Www. Wikipedia. Com, Www. Google Earth. Com
8. Www. Google.Com
Analysis of Traffic Flow Pattern and its Impact
Life and Living Through Newer Spectrum of Geography154
9Human Development Index inRural Habitat, Economy andSociety: A Case Study ofBallabhpur Village, Birbhum,West Bengal
Jumafuddin Sheikh & Dr. Rukhsana
ABSTRACT
This paper is an attempt to examine the response of theHuman Development Index (HDI) of Ballabhpur village atBirbhum district in West Bengal. Ballabhpur village of BirbhumDistrict has been selected because it is a rural place and thetopic human development index have been selected for theresearch and study purpose because of some basic terms andconditions. Human development index has been used forknowing the population density of the Ballabhpur village,whether it is densely or sparsely populated in order to awarethe government about the population of the Ballabhpur village.To take some serious measures regarding any problem this ispresent or may arise there in future. The other main criteriafor the selection of the topic is that the UNDP has beenproviding HDI on the basis of state level only, but here theblock wise survey or study has been done. The important

155
objectives of the present work are to study the socio-economiclife of the inhabitants of the village, to determine the causativefactors responsible for the human disparity in socio-economiclife in the study area, and to calculate and analyse the householdwise Human Development Index. Hypothesis has been furnishedto infer the facts underlying in the study area: per capitaincome is the function of the index of human development.The present study is based on the primary data collectedthrough direct field investigation. The field investigation hasbeen conducted with a well-designed questionnaire. The presentwork has been accomplished with both quantitative as well asqualitative technique.
Introduction
Human Development Index (HDI) is about creatingan environment in which people can develop their foodpotential and live and productive with their leads andinterest. The United Nations Development programmed(UNDP) has defined Human Development as a processof enlarging people’s choices. This depends not only onincome but also on other social indicators like lifeexpectancy, education, literacy and other provisions. Themost critical of these wide ranging choices are to live along and healthy life, to be educated and to have accessto resource needed for a decent standard of living.Additional choices include political freedom, grantedhuman rights and personal self-respect. The well beingof the people are reflected in a rage of social outcomesfrom among which the Human Development Reportfocuses on indicators of longevity, literacy and per-capitaincome.
The Human Development Index measurement wasformed by Pakistani economist Mehababul Haque inpartnership with the Indian economist Nobel LaureateProfessor Amartya Sen. Since 1990, the UNDP has beenpresenting the measurement of Human DevelopmentIndex in terms of HDI annually. The UNDP’s Human
Human Development Index in Rural Habitat, Economy . . .

Life and Living Through Newer Spectrum of Geography156
Development Framework, Human Development Reportsare being prepared at the national and state level. AmartyaSen’s ideas constitute the core principles of a developmentapproach that has evolved in the Human DevelopmentReports. This approach is a ‘‘paradigm’’ based on theconcept of well-being that can help define public policy,but does not embody a set of prescriptions. The currentmovement from an age of development planning to anage of globalization has meant an increasing attentionto agency aspects of development (Fukuda Parr S., 2003).The Human Development index (HDI) is overall wellaccepted as a summary measure of human development(HD) achievements: It is transparent, simple to calculateand interpret, and it serves the purpose to summarizethe performance of the countries on the three dimensionsof HD: standard of living, health, and education(Kovacevic M., 2009). Human development plays afundamental role and remains the most important factorin economic growth and development in countries ofthe world. The Human Development Index (HDI) is acomposite statistic used to rank countries by level of“human development” and to separate countries intodeveloped (high development), developing (middledevelopment), and underdevelopment (low development)categories (Adediran, 2011). Human development isconsidered as one of the core areas of interest indevelopment economics. It says that human developmentcan be regarded as expansion in people real freedomsthat they enjoy. However, one of the most importantindices among them is Human development index orHDI (Al-Hilani H., 2012). The Human Development Index(HDI) is a composite index published annually by theUN Human Development Report Office, since 1990, whichis designed to measure “human well being” in differentcountries. The index combines measures of life expectancy,school enrolment, literacy, and income to provide abroader-based measure of well-being and developmentthan income alone (Engineer M., 2008).

157
Objectives
Following objectives have been selected for thesampled household, this are- to find out the socio-economic condition of the despondence in the selectedstudy area, to analysis the disparities of the HumanDevelopment Index at household area and to examinethe causative factors responsible for the human disparitiesin the selected study area.
Database and Methodology
The data have been collected based on both secondaryand primary for the study area. Secondary data havebeen collected from published and other publishedorganization. The collected primary data have beenanalyzed into simple percentage, firstly which iscategorized into family member based on size of household. The primary data collected through the direct fieldinvestigation. The field investigation has been conductedwith a well designed questioner. A direct interview hasbeen conducted with a person from each sampledhousehold of the Village. Sampled households wereselected on the basis of random sampling technique. Atotal of 50 households have been selected from 129households on the basis of sampling techniques.
The present work has been accomplished with bothquantitative as well as qualitative technique. Among thequantitative techniques, both simple and standardstatistical techniques have been applied to gather thefacts. Simple percentage technique has been used toanalyse the socio-cultural and economic status of thehouseholds of the study area. Karl Paerson’s techniqueof coefficient of concentration and linear regressiontechnique have been used to examine the dimension andextent of causal relationship between the dependent andindependent variables to determine the underlying factors.Student’s‘t’ test technique has been adopted to test thehypothesis and finally to infer the conclusion. Different
Human Development Index in Rural Habitat, Economy . . .

Life and Living Through Newer Spectrum of Geography158
diagram have used for the pictorial presentation thecollected information.
Table 1: Demographic profile of the study area
Name of the Total Total Total Total Sample SampleVillage Population Male Female Household Household Population
Ballabhpur 607 309 298 129 50 186Village
Source: Census of India 2011, Ballabhpur Gram Panchayat, West Bengal.
Study Area
The village Ballabhpur village is located to the Northand North West of Santiniketan about 3.5 km. away fromVishwa Bharati. The geographical location of this villageis confined within the latitudes of 230 41’ 54" N and 260
42’ 26" N and longitudes of 870 40’ 07" E and 870 40’ 37"
E in the police-station and subdivision of Bolpur, Dist-Birbhum, W.B. This included in the topographical mapof survey of India No. 73M/10 and J. L. No. of thismouza is 64.

159
Tab
le 2
: D
istr
ibu
tion
of
pop
ula
tion
am
on
g th
e sa
mp
led
hou
seh
old
s,B
alla
bh
pu
r V
illa
ge,
201
2
Siz
e of
ho
use
hold
Pop
ula
tion
D
istr
ibu
tion
Gen
eral
% o
f S
C%
of
ST
(No.
of
fam
ily
Pop
ula
tion
Pop
ula
tion
Pop
ula
tion
mem
ber)
Per
son
s%
of
mal
e%
of
% o
f%
of
% o
f%
of
% o
f%
of
mal
efe
mal
em
ale
fem
ale
mal
efe
mal
em
ale
fem
ale
< 3
850
.00
50.0
000
0050
.00
50.0
000
00
3 -
448
66.6
633
.33
26.0
839
.13
20.0
914
.70
0000
4 -
580
70.0
030
.00
13.0
416
.73
20.5
016
.07
13.0
410
.62
> 5
5064
.00
36.0
000
0052
.00
48.0
000
00
Sou
rce:
Fie
ld
surv
ey,
Oct
ob
er,
2013
.
Human Development Index in Rural Habitat, Economy . . .

Life and Living Through Newer Spectrum of Geography160
Socio-Economic Profile of the Sample Households
The primary data have been tabulated into fourcategories of families (less than 3, 3-4, 4-5, and morethan 5) based on size of household into simple percentage.The study of the socio-economic aspects of the selectedstudy area is based on primary survey, the informationcollected about the population structure, economiccondition, employment structure, education structure,housing condition, and sanitation condition.
Population Structure
The table 2 reveals that the distribution of populationof Ballabhpur Village. It has been counted that 50 percentmale and 50 percent female population which belongsto Scheduled Caste category come under the group ofless than 3 household sizes. Lowest percentage ofScheduled Tribe population comes under the categoryof less than 3 and 3-4 family size. On the other handhighest percentage Scheduled Tribe population (13.04percent male and 10.62 percent female) belong to 4-5category of families. Highest percentage of Generalpopulation (26.08 percent male and 39.13 percent female)comes under the group of 3-4 family size.
By the close observation of this table 2, it have beenconclude that most of the families belongs to thescheduled caste and scheduled tribe category in thatarea.
Table 3 focused on the age-group wise distributionof population of sampled household. The highestpercentage of population (50 percent male and 50 percentfemale) belong to 18-40 and 40-60 age group which comeunder the category of less than 3 household size andlowest percentage of population which belongs to lessthan 6, 16-18 and more than 60 age group. On the otherhand highest percentage of population (33.33 percent)belongs to 6-18 age groups and comes under the 3-4

161
Tab
le 3
: A
ge-
gro
up
wis
e d
istr
ibu
tion
of
pop
ula
tion
am
on
g th
e sa
mp
led
hou
seh
old
s,B
alla
bh
pu
r V
illa
ge,
201
2
Siz
e of
Hou
seho
lds
Pop
. W
ith
Pop
. W
ith
Pop
. W
ith
Pop
. W
ith
Pop
. W
ith
(No.
of
fam
ily
<6
Yea
rs6-
18
Yea
rs18
-40
Yea
rs40
-60
Yea
rs>
60 Y
ears
mem
bers
)%
of
% o
f%
of
% o
f%
of
% o
f%
of
% o
f%
of
% o
fM
ale
Fem
ale
Mal
eF
emal
eM
ale
Fem
ale
Mal
eF
emal
eM
ale
Fem
ale
< 3
0000
0000
50.0
050
.00
50.0
050
.00
0000
3 -
40
0000
33.3
341
.66
33.3
341
.66
33.3
38.
3300
4 -
59.
525.
2623
.80
21.0
538
.09
36.8
428
.57
36.8
400
5.26
> 5
23.0
100
15.3
825
.00
38.4
641
.66
7.69
25.0
015
.38
00
Sou
rce:
Fie
ld
surv
ey,
Oct
ob
er,
2013
Human Development Index in Rural Habitat, Economy . . .

Life and Living Through Newer Spectrum of Geography162
Tab
le 4
: In
com
e d
istr
ibu
tio
ns
amon
g t
he
sam
ple
d h
ou
seh
old
s, B
alla
bh
pu
r V
illa
ge,
201
2
Siz
e of
Hou
seho
ldA
vera
ge
per-
Per
cen
tage
of
Hou
seho
lds
wit
h pe
r ca
pita
mon
thly
in
com
e (R
s.)
(No.
of
fam
ily
mem
ber)
capi
ta
inco
me
< 2
5025
0-50
050
0-90
090
0-15
0015
00-2
500
2500
-500
0>
5000
(Rs.
)
< 3
1050
0000
100
0000
0000
3 -
415
0400
0000
5025
2500
4 -
584
2.50
2030
5000
0000
00
> 5
860
0020
2040
2000
00
Sou
rce:
Fie
ld
surv
ey,
Oct
ob
er,
2013

163
household size. Another 23.01 percentage of populationwhich has been belongs to less than 6 age groups comeunder the categories of more than 5 size of household.Highest percentage of population (15.38 percent) whichhas been belongs to more than 60 age groups and comesunder the category of more than 5 size of household.By the close observation of this table 3 it have beenconclude that the area is having major percentage ofmale and female populations belongs to 18-40 and 40-60years of age group.
Economic Condition
The income level is depicted by the table 4 whichshows that highest per capita income has Rs. 1504 andlowest per capita income is Rs. 842.50 which comes underthe category of 3-4 and 4-5 size of household. Morethan 50 percent of households as their per capita incomehave Rs 900-1500 under the category of 3-4 and theiraverage per capita income is Rs. 1504. Another 50 percenthousehold belongs to under the category of 4-5 and theiraverage per capita income is Rs. 842.50. Average percapita income Rs. 1050, which have comes under thegroup of less than 3 family members of household. Incategory which comes under group of more than 5members in a family have average per capita income isRs. 860. Apart from the analysis it has been identifiedthat economic condition of Ballabhpur Village is verypoor due to lack of source and employment facilities.
Education Condition
The table 5 reveals that the education status ofBallabhpur Village. Average literacy rate of this villageis less than 55 percent; male percentage is 54.02 andfemale 45.92 percent. The family has 3-4 persons theyhave higher educated and they carry their qualificationup to graduation level. The family having four to fiveof they have high percentage in primary stage but in
Human Development Index in Rural Habitat, Economy . . .

Life and Living Through Newer Spectrum of Geography164
Tab
le 5
: E
du
cati
onal
sta
tus
amon
g t
he
sam
ple
d h
ou
seh
old
, B
alla
bh
pu
r V
illa
ge,
201
2
Siz
e of
ho
use
hold
Lit
erac
y%
of
pop.
up
to%
of
pop.
% o
f po
p.%
of
pop.
% o
f po
p.(N
o. o
f fa
mil
yra
tepr
imar
y le
vel
up
to c
lass
up
to c
lass
up
to c
lass
up
to c
lass
mem
ber)
8th10
th12
thgr
adu
atio
n
MF
MF
MF
MF
MF
MF
< 3
5050
0010
066
.66
33.3
300
0000
0000
00
3 -
452
.94
47.0
510
010
057
.14
42.8
525
.00
75.0
066
.66
33.3
310
000
4 -
560
.72
39.2
860
4060
.00
40.0
045
.14
42.8
533
.33
66.6
600
00
> 5
52.6
347
.36
28.5
771
.42
57.1
442
.85
100
0010
010
000
00
Sou
rce:
Fie
ld s
urv
ey,
Oct
ob
er,
2013
N
ote
:
M –
Mal
e,
F
- F
emal
e

165
Tab
le 6
: D
istr
ibu
tio
n o
f sa
mp
led
hou
seh
old
s o
f B
alla
bh
pu
r V
illa
ge,
201
2
Siz
e of
Hou
seho
ldN
o. o
fN
o. o
f G
ener
alN
o. o
f S
CN
o. o
f S
TP
erce
nta
ge(N
o. o
f F
amil
yH
ouse
hold
sH
ouse
hold
sH
ouse
hold
sH
ouse
hold
sof
hou
seho
ld
mem
ber)
Tota
lP
erce
nt
(%)
Tota
lP
erce
nt
(%)
Tota
lP
erce
nt
(%)
Tota
lP
erce
nt
wit
h pu
cca
(%
)ho
use
< 3
48
00
213
00
00
3 -
416
325
712
130
062
.50
4 -
520
402
296
402
100
20.0
0
> 5
1020
00
534
00
25.0
0
Sou
rce:
Fie
ld
surv
ey,
Oct
ob
er,
2013
.
Human Development Index in Rural Habitat, Economy . . .

Life and Living Through Newer Spectrum of Geography166
higher level educated percentage is very low. In thiscategory 60.72 percent male and 39.28 percent femaleare literate. Another 52.63 percent male and 46.36 percentfemale literate people come under the category of morethan five family members. By the close observation ithas been identified that most of the male persons arepreferred to give education by their parents than thefemale. The population has rarely got the opportunityto go the school or college. After the analysis it canevaluate that the education condition of Ballabhpur Villageis very poor. Peoples are unable to bear as their educationpurpose due to poor economic condition.
Housing Condition
The housing condition of Ballabhpur village is poorcondition understood after the evaluation of the datawhich have collected after visiting door to door. Thetable 6 reveals that there were 71 percent of people whobelongs to general caste and has 3-4 members in theirfamily. It have also came to (now that respectively) therewere 13 percent people who belong scheduled caste andhave 3-4 members in their families. There is 40 percentscheduled tribe population who belongs to four membersin their families. There were 62.50 percent of peoplewho have pucca houses, 32 percent of households have3-4 members in their families. Among these 40 percenthouseholds, 20 percent of households have pucca housesand have 4-5 members in their families, among which40 percent people scheduled caste and 100 percent peoplebelongs to scheduled tribe. There were 20 percenthouseholds who have more than 5 family members amongwhich 34 percent people scheduled tribe and they areoccupied 25 percent pucca houses.
Measurement of Human Development Index (Techniquesas used by UNDP)
The United Nations Development programmed

167
(UNDP) has defined Human Development as a processof enlarging people’s choices. This depends not only onincome but also on other social indicators like lifeexpectancy, education, literacy and other provisions. Themost critical of these wide ranging choices are to live along and healthy life, to be educated and to have accessto resource needed for a decent standard of living.Additional choices include political freedom, grantedhuman rights and personal self-respect. The well beingof the people are reflected in a rage of social outcomesfrom among which the Human Development Reportfocuses on indicators of longevity, literacy and per-capitaincome.
The Human Development Index measurement wasformed by Pakistani economist Mehababul Haque inpartnership with the Indian economist Nobel LaureateProfessor Amartya Sen. Since 1990, the UNDP has beenpresenting the measurement of Human DevelopmentIndex in terms of HDI annually.
The UNDP’s Human Development Framework,Human Development Reports are being prepared at thenational and state level. These reports prepared withthe help of sectoral indicators and composite indicesfrom the evaluated development process in terms of expertoutcome. The national human development report adoptedthree critical dimensions of well being, viz.
a. Longevity – The ability to lead a long and healthylife,
b. Education – The ability to read, write and acquireknowledge,
c. Command over Resources – The ability to enjoya decent standard of living and have a sociallymeaningful life.
The selection of these indicators has been done witha view to reflect attainments on the three criticaldimensions of well being and at the sometime enable to
Human Development Index in Rural Habitat, Economy . . .

Life and Living Through Newer Spectrum of Geography168
ensure the progress in meeting the basic human needsof accessibility to safe drinking water and shelter.
Basic indicators of Human Development are as follows
Published on 4 November 2010 (and updated on 10June 2011), starting with the 2010 Human DevelopmentReport the HDI combines three dimensions:
A long and healthy life: Life expectancy at birth
Education index: Mean years of schooling andExpected years of schooling
A decent standard of living: GNI per capita (PPPUS$)
In its 2010 Human Development Report, the UNDPbegan using a new method of calculating the HDI. Thefollowing three indices are used:
1. Life Expectancy Index (LEI)
2. Education Index (EI)
2.1 Mean Years of Schooling Index (MYSI)
2.2 Expected Years of Schooling Index (EYSI)
3. Income Index (II)
Finally, the HDI is the geometric mean of the previousthree normalized indices:

169
Table 9: Human Development Index of someselected household of Ballabhpur Village, 2012
Human Development Index
Household Code Life Education Income CompositeExpectancy Index Index Mean (HDI
Index Value)
01 0.125 0.125 0.180 0.14302 0.500 0.308 0.161 0.32303 0.500 0.130 0.452 0.36004 0.500 0.236 0.254 0.33005 0.500 0.173 0.480 0.38406 0.175 0.013 0.340 0.17607 0.375 0.135 0.335 0.28108 0.500 0.150 0.340 0.33009 0.500 0.166 0.461 0.37510 0.500 0.341 0.280 0.37411 0.375 0.285 0.062 0.24012 0.500 0.283 0.363 0.38213 0.500 0.166 0.280 0.31514 0.500 0.263 0.573 0.44515 0.500 0.172 0.257 0.30916 0.500 0.250 0.118 0.28917 0.500 0.254 0.303 0.35318 0.000 0.175 0.111 0.09519 0.000 0.166 0.103 0.08920 0.500 0.172 0.111 0.26121 0.500 0.250 0.345 0.36522 0.500 0.182 0.142 0.27423 0.500 0.208 0.280 0.32924 0.500 0.270 0.122 0.29725 0.500 0.125 0.260 0.29526 0.500 0.173 0.480 0.38427 0.175 0.013 0.340 0.17628 0.375 0.135 0.335 0.28129 0.500 0.250 0.345 0.36530 0.500 0.182 0.142 0.27431 0.500 0.208 0.280 0.32932 0.500 0.166 0.280 0.31533 0.500 0.172 0.111 0.26134 0.500 0.308 0.161 0.32335 0.500 0.125 0.260 0.29536 0.500 0.236 0.254 0.330
Human Development Index in Rural Habitat, Economy . . .

Life and Living Through Newer Spectrum of Geography170
37 0.375 0.135 0.335 0.28138 0.175 0.013 0.340 0.17639 0.500 0.208 0.280 0.32940 0.500 0.173 0.480 0.38441 0.500 0.130 0.452 0.36042 0.500 0.250 0.345 0.36543 0.500 0.173 0.480 0.38444 0.500 0.182 0.142 0.27445 0.375 0.135 0.335 0.28146 0.500 0.150 0.340 0.33047 0.500 0.182 0.142 0.27448 0.500 0.208 0.280 0.32949 0.500 0.263 0.573 0.44550 0.500 0.125 0.260 0.295
Source: calculation by author, October, 2012
Each of these indicators defined as a dimension withvalue between 0 and 1 with reference to maximum andminimum values. The general formula for calculatingeach dimension index is Index = (Actual Value – MinimumValue)/(Maximum Value – Minimum Value).
The calculations of the human development index aresimilar to those followed by the UNDP, with some variationswith respect to the estimation of the income index. TheHDI attempts to capture in summary from, the three basicdimensions – that is Health (life expectancy at birth),knowledge (expressed as a combination of the literacy rateand the school enrolment ratio) and the Standard of Living(expressed as a combination of the per-capita income, per-capita consumption and expenditure and population livingabove the poverty line).
The HDI is then calculated as a simple average ofthe three different dimension values. The Health Indexhas been worked out by simply using the village levellife expectancy ratio calculated for 2010, using the aboveformula. The Education Index consists of a weightedaverage of the census literacy rate (two thirds weight)and the school enrolment rate provided by the respondentsfor age group 6-14 years. The maximum and minimumvalues of both of these are taken as 1 and 0. For

171
illustration, consider again the case of Ballabhpur, wherethe literacy rate was 54.07.
The Income Index differs from that typically usedby other Human Development reports because it containswithin it six different variables, in order to capture asfar as possible, the actual income of people. It is a simpleunweighted average of the dimension of per-capitahousehold of the block in Ballabhpur Village. The per-capita monthly consumptions expenditure and maximumpercentage of the population observed below the povertyline in that block of Ballabhpur Village.
Testing of Hypothesis
Here an attempt has been made to examine the casualassociation between per capita incomes as independentvariable (x) and mean composite Human DevelopmentIndex as dependent variable (y). Karl Pearson’s techniqueof Coefficient of correlation and linear regression techniquehave adopted for this purpose. The analysis has beendone taking 50 households as the unit of study. Fromthe analysis it is observed that both the variables arepositively correlated with ‘r’ value 0.51. Their positiverelation relationship may best be represented with fitregression equation of y= 6E - 05x + 0.222 and value ofcoefficient of determination (R2) 0.257.
Human Development Index in Rural Habitat, Economy . . .

Life and Living Through Newer Spectrum of Geography172
With t-test analysis at 23 degree of freedom, itobserved that the calculated’ value 2.84 is more thantabulated t value of 2.50 that reveals that relationship issignificant at 2 percent level. It may be inferred fromthe analysis that the hypothesis per capita income is thefunction of the index of human development is quantitativelyproved.
Conclusion
Apart from the analysis it has been concluded thatthe Human Development Index of Ballabhpur village isnot very good, as far as the Human Development Indexindicators i.e., Health, Education and Income. Economiccondition is very bad because most of the people areunemployed or working as agricultural labourers. Averageper capita income is very low, only 30% household aremaintained the poverty line but 70% people are belowpoverty level. Major occupation of this village isagricultural and industrial labour. Health condition ofBallabhpur Village is very poor. Only one medical storeobserved there but no private and sub-health are foundand hospital is located is very far away from the village.Communication facilities are very poor condition in thevillage and Literacy rate is also very low. Governmentemployment facilities are very poor in condition. Landsare not suitable for agricultural purpose due to infertilesoils.
So Govt. should take proper steps for the developmentof the Ballabhpur Village. To be establish Govt. Hospitaland Medical Store in the Village. Implementation willbe must for rational management of natural resources(Water, land, energy etc.). To be development of transportsystems this is environmental and accessible to all andadvancement of environmental/social education andeducation for the health. Provide more educationalopportunities, technical and vocational training for thepeople of Ballabhpur Village. Road condition is very

173
bad, so communication should be maintain by theGovernment. Overall infrastructure should be developedfor the Ballabhpur Village.
References
1. Broach, V.K. and Sriya Iyar (2005): The Influence of Religionand Caste on Education in Rural India, Journal of DevelopmentStudies, Vol.41, No. 8.
2. Census of India (2011): Final Population Totals, West Bengal.
3. Devi, R. (1985): Prevalence of Child Labour in India: Asecondary data analysis. Tata Institution of Social Science,Mumbai.
4. Dreze, J. and G.G. Kingdon (2001): School Participation inRural India, Review of Development Economics, 5, 1, pp.1-24.
5. Embassy of India, Poilcy Statement: Child Labour in India,Protective policy.
6. Human Rights Watch (1996): The small hands of slavery –Bounded child labour in India. New York: Human RightsWatch.
7. Jayachandran, U. (June, 2002): Socio-Economic Determinantsof School Attendance in India, Delhi School of Economics,Centre of Development Economics, Working Paper No. 103.
8. Mitesh, V. and Bandiwala, M. D.: Child labour in India:Causes, Governmental Policies and the role of education.
9. Office of the director of Census Operation, West Bengal(2003): District and SRS Block WISE Infant Mortality Rate(1994-2000) for West Bengal; Kolkata.
10. Pratichi trust (2002): The Pratichi Education Report, Kolkata.
11. Ramachandran, V.K., and et al (2003): Barriers to Expansionof Mass Literacy and Primary Schooling in West Bengal: A Study based on Primary data from Selected Villages, Centre forDevelopment Studies, Jawaharlal Nehru University, WorkingPaper 345.
12. Raychaudhuri, Ajitava (2002): Role of infrastructure ineconomic development of West Bengal in the last decade,Background Paper submitted for West Bengal StateDevelopment Report and Perspective 2007-08, Kolkata: May.
Human Development Index in Rural Habitat, Economy . . .

Life and Living Through Newer Spectrum of Geography174
13. Rawal, Vikas, Madhura Swaminathan and V.K.Ramachandran (2002): Agriculture in West Bengal: Currenttrends and directions for future growth, Background Papersubmitted for West Bengal State Development Report andperspective 2007-08, Kolkata.
14. Report of Sacher Committee (Nov. 2006): Social, Economicand Educational Status of the Muslim Community of India,Govt. of India, p. 15.
15. Siddiqui, F.A. and Yasmeen Nasser (2004): EducationalDevelopment and Structure of Employment in Western UttarPradesh, Population Geography, Vol. 26, No. 1&2, p. 25.
16. Singh, J. and P.B. Singh (1981): Dimension and Implicationsof Urbanization in the Least Developed Counteies, paperpresented in the International Conference on Urban andRegional Change in Developing Countries, Dec. 11-15,Kharagpur.
17. Srinivasan, K. and Sanjay Kumer (1999): Economic and CasteCriteria in definition of Backwardness, Economic and PoliticalWeekly, 10, pp. 16-23.
18. United Nations Centre for Human Settlements (2001): Citiesin a Globalizing World: Global Report on Human Settlements,London.
19. www.wbplan.gov.in, West Bengal Human DevelopmentReport 2004, p. 03.
175
10Problems of Road TransportSystem in KrishnanagarMunicipality, West Bengal
Sweety Nandy
ABSTRACT
The road transportation system in an unplanned citygenerally displays numerous structural and non structuralproblems. Krishnanagar Municipality is an unplanned citydisplaying numerous problems. In the first part of the presentpaper it has been intended to show the basic problems of theroad transport. In the second part, induced problem havebeen shown and in the third part of the analysis, the perceptionof the passengers and local inhabitants about the differentissues of road transport system have been depicted. The firstand second part is mainly based on secondary data and thethird part is based on exclusively on perception survey in thefield.
Keywords: basic problems, induced problems, roadtransportation system, Krishnanagar Municipality
1. Introduction
Road transport system is a broader term includingthe physical condition of the road, vehicles plying over
Problems of Road Transport System in Krishnanagar . . .
Life and Living Through Newer Spectrum of Geography176
it, the people directly or indirectly involved in this system.Transport lines are often called as life lines as thedevelopment of a society depends on transportation toa greater extent. In other words, transportation givesthe mobility and mobility confers the arena fordevelopment (Saxena, 2005; Rodrigue et. al, 2006).Generally transportation is regarded as the index of anarea’s development pattern. In rural areas transportationsystem is less developed and hence the overalldevelopment pattern of the area too. In urban set up itis better developed compared to rural counterpart. Buta balanced transport system depends on supply anddemand system in the transportation network. In thedeveloped nations the problems of transportation systemare few compared to developing nations because of lessdisparity in intra and inter regional developmental pattern.In developing nations, polarized development aroundthe metropolises and district head quarters at regionallevel triggers several problems including the problemof road transport system. Problems of road transportsystem are explored by numerous scholars in and aroundthe world both in developed and developing nations.Pucher et.al. (2005; 2007), Singh (2005), Nimbalkar et. al(2005) have explored various problems of transportationsystem in Indian context. But most of the previous worksare concerned with large and medium cities. Small citiesare less encountered. Very few works on the problemsof road transportation system have been done onKrishnanagar Municipality. Islam (2011) has analyzed roadaccident in Krishnanagar Municipality. The previous workshad little focus on perceptual framework of the passengerand and local people. Hence the objectives of presentpiece of work are not only to find out the major problemof road transport and their underlying causes inKrishnanagar municipality area but also satisfaction levelof passengers and local inhabitants regarding roadtransport system.

177
2. Study Area
Krishnanagar is located in the district of Nadia (23024/n and 88030/e), with an average elevation of 14 mt.Krishnanagar City is spread over an area of 16.0 sq. km.and have 24 wards (Fig. 1). Krishnanagar is the districthead quarter of Nadia which has 139110 inhabitants livingin an area of 15.96 sq. km. i.e. population density is8716 persons per square kilometer. Besides hugepopulation pressure of its own, thousands of people visitthe district quarter for various administrative, social, andeconomic reasons. It is one of the oldest municipalitiesin West Bengal, nay India. This municipality wasestablished in 1864 a.d. over the time it has grown in anunplanned manner. This unplanned nature of the citymakes the transportation system also haphazard.
3. Database and Methodology
4. Data in connection with this study have been collectedfrom two sources.
1) Secondary data: a) data of road accident collectedfrom the office of Superintendent of Police, b)data on numerical growth of Motor vehiclecollected from the office of Road TransportOrganization and c) data on road width andnumber of rickshaw in different rickshaw standfrom Krishnanagar Municipality) bus servicesprovided to different routes from the office ofthe Bus Owners Association.
2) Primary data: Being a resident of this municipalityarea the author’s empirical observation on roadtransport system for a long period, the satisfactionof the passengers and local inhabitants regardingthe road safety have been collected from the field.
Methodologically the work is very simple. This paperhas been prepared with the help of MS Office 2007, Adobe
Problems of Road Transport System in Krishnanagar . . .

Life and Living Through Newer Spectrum of Geography178
Photoshop 7, MapInfo 7. The data collected from theprimary and secondary sources have presented by tabularformat, absolute mapping techniques and simple bar andcircle diagrams.
Fig. 1
4. Results and Discussion
4.1 Basic Problems of road transportation system
The first problem is road encroachment (Fig.2). Inthe city of Krishnanagar, there is very little space forroad. It accounts for only seven percentage of the total

179
land. Besides, the very little road space, 30% of theroad area is encroached by foot path user and permanentand semi-permanent structures including shops (Islam,2011; Islam and Tarafder, 2013). Consequently there isvery little space for the pedestrians. They face accidentwhen they walk on the road used by the motorizedvehicles.
The second is rapid vehicular growth. The numberof registered motor vehicles has grown rapidly (Islam,2011). The total number of registered motor vehicles hasincreased from 24905 to 31149 during the period of 2004-2009 (Table 1).
Table 1: Registered vehicles at Krishnanagar urban area
Year Goods Jeep, Taxi, Auto Bus and Motor Others TotalVehicles Motor Car rickshaw Minibus Cycle and
Scooter
2004 1854 1366 92 375 21016 202 249052005 1941 1476 97 398 23561 251 277242006 1981 1548 102 448 24537 390 290062007 2050 1580 104 451 24835 460 294802008 2141 1624 109 453 25349 512 301882009 2218 1747 117 469 26010 588 31149
Source: Road Transport Organization, 2010.
Fig. 2. Road encroachment onHigh Street
Fig. 3 Common mode ofoperation of vehicles near
Bus Stand
Problems of Road Transport System in Krishnanagar . . .

Life and Living Through Newer Spectrum of Geography180
It is noticeable that motor cycles and Scooters haverecorded maximum growth in number followed by privatecars, goods vehicles, buses, mini buses. This increase ofvehicles exceeded the carrying capacity of the road.
The third is common mode of operation of motorizedand non-motorized traffic on the same road (Pacione,2005). It has been observed that goods vehicle, taxi, privatecars, buses, mini buses, auto rickshaw, motor cycle, bi-cycles, rickshaw, etc. ply on the same road (Fig. 3). Thismulti speed vehicles not only creates traffic congestionbut also triggers road accidents (Islam, 2011).
The fourth is narrowness of road. Most of the roadin the Krishnanagar Municipality is narrow (Islam, 2013).Nearly 50% of the total road is 2-2.9 meter in width(Fig. 4).
Fig. 4
The fifth is inadequacy of traffic control point. InKrishnanagar Urban area there is dearth of traffic controlpoints. There are traffic control points at Collectory More,P.W D More, Sadar more, Post office More, Nediar paraMore and Bus stand More and the remaining crossingsare unmanned (Fig. 5).

181
The sixth is the problem of parking arrangement. Inthe city Krishnanagar there is no provision of car andother vehicles’ parking facility. Hence the vehicles areparked here and there creating road transport problem.
Fig. 5
4.2 Induced problems
Problems which are induced by the basic problemsas discussed above are referred to as induced problems.The major induced problems include traffic congestion,road accident and peak time crowding the buses.
There is peak time traffic congestion especially 9 a.mto 11 a.m and 4 p.m to 6 p.m due inadequate provisionof road and huge traffic. Here maximum number of trafficis bi-cycles and the rickshaw occupies the second largestposition, and the cars occupy the lowest position forthe selected vehicles (Nandy, 2011). This clearly indicatescommon mode of operation of motorized and non
Problems of Road Transport System in Krishnanagar . . .

Life and Living Through Newer Spectrum of Geography182
motorized vehicles slow down pace of vehicles causingtraffic congestion.
The second major induced problem is that of roadaccident. The pattern of road accident has been analyzedfor the parameters of number of cases, persons killedand persons injured during the period 2005-2009 (Table2). Since 2005, the scenario of road accidents is becomingdevastating day by day. The numbers of road accidentcases, fatalities and injuries have been increasingconsistently since 2005 (Table 2).
Table 2: Road accident Scenario in KrishnanagarMunicipality
Year Number of Case persons killed persons injured
2005 162 51 322
2006 179 58 279
2007 192 63 310
2008 225 48 336
2009 262 72 393
Source: Superintendent of Police, 2010.
The last but not the least induced problem is peaktime overcrowding. The huge number of population comesto this district head quarter daily or weekly basis fromoutside. Along with the huge population coming fromoutside, its own population jointly create the problemof peak hour overcrowding in the buses.
4.3. Satisfaction of passengers and local inhabitants
A perception survey was conducted taking 140passengers and local inhabitants. They were askeddifferent issues related to road transportation system viz.satisfaction regarding bus frequency, problem trafficcongestion, overcrowding in the bus, water logging onroad, physical condition of the road, traffic police serviceand parking facility.

183
Regarding bus frequency, the survey indicates thatnearly 49% bus commuters are satisfied with the frequencyof buses and 31% were dissatisfied and the remaining20% could not say. (Fig- 6 a). In other words, maximumpassengers were satisfied about the frequency of buses.Those who are satisfied with this service travel towardsNabadwip, Dhubulia, Mayapur etc. and those who weredissatisfied with this service commute towards Karimpur,Hanskhali, Durgapur and some pocket routes like Bablari,Gede etc.
Fig. 6 (a)
Fig. 6 (b)
Problems of Road Transport System in Krishnanagar . . .
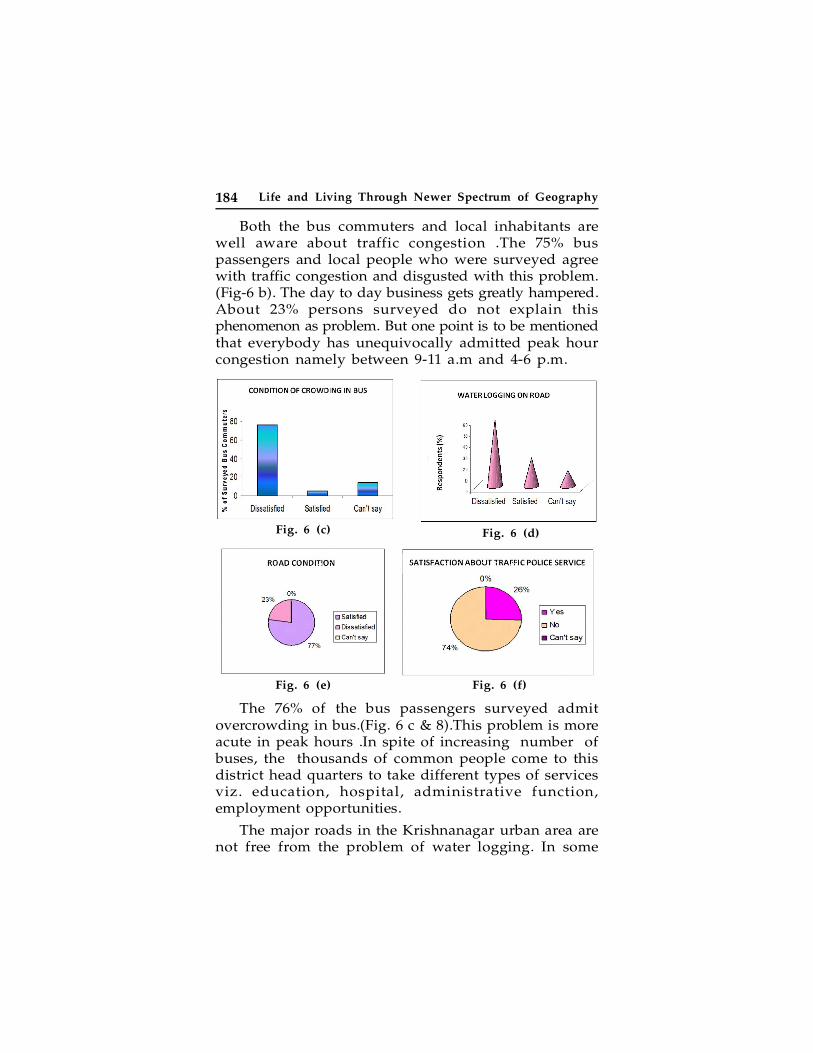
Life and Living Through Newer Spectrum of Geography184
Both the bus commuters and local inhabitants arewell aware about traffic congestion .The 75% buspassengers and local people who were surveyed agreewith traffic congestion and disgusted with this problem.(Fig-6 b). The day to day business gets greatly hampered.About 23% persons surveyed do not explain thisphenomenon as problem. But one point is to be mentionedthat everybody has unequivocally admitted peak hourcongestion namely between 9-11 a.m and 4-6 p.m.
The 76% of the bus passengers surveyed admitovercrowding in bus.(Fig. 6 c & 8).This problem is moreacute in peak hours .In spite of increasing number ofbuses, the thousands of common people come to thisdistrict head quarters to take different types of servicesviz. education, hospital, administrative function,employment opportunities.
The major roads in the Krishnanagar urban area arenot free from the problem of water logging. In some
Fig. 6 (c) Fig. 6 (d)
Fig. 6 (e) Fig. 6 (f)
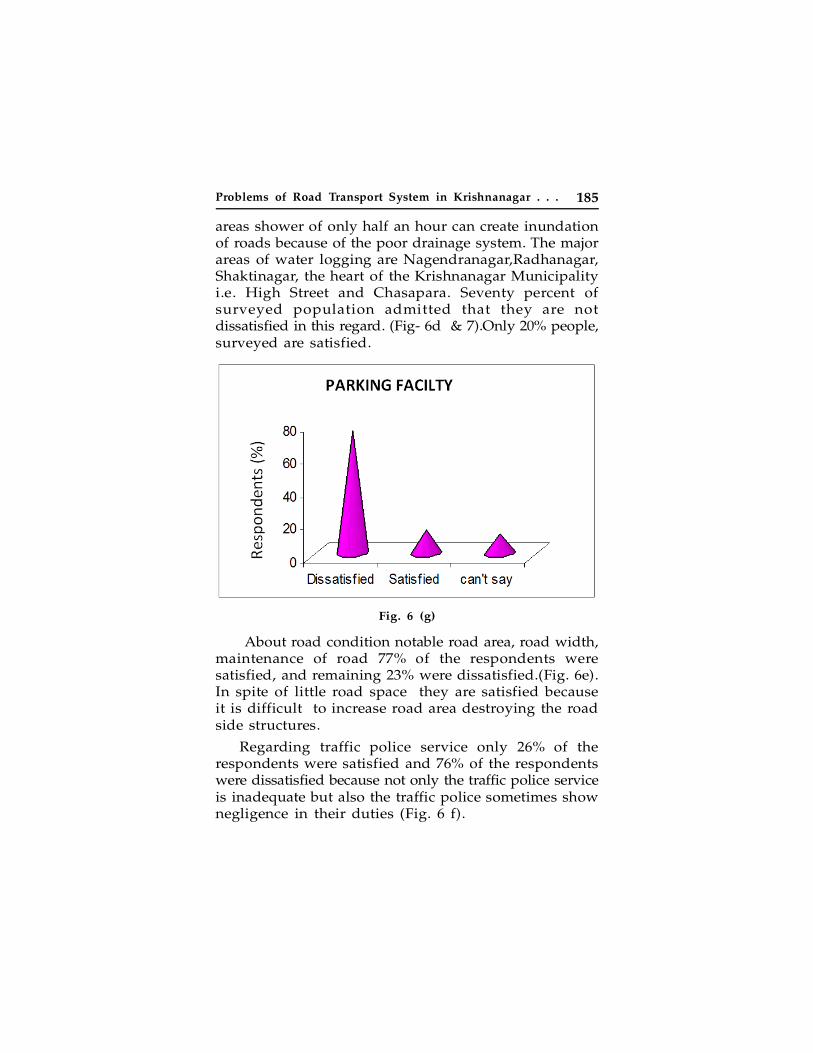
185
areas shower of only half an hour can create inundationof roads because of the poor drainage system. The majorareas of water logging are Nagendranagar,Radhanagar,Shaktinagar, the heart of the Krishnanagar Municipalityi.e. High Street and Chasapara. Seventy percent ofsurveyed population admitted that they are notdissatisfied in this regard. (Fig- 6d & 7).Only 20% people,surveyed are satisfied.
Fig. 6 (g)
About road condition notable road area, road width,maintenance of road 77% of the respondents weresatisfied, and remaining 23% were dissatisfied.(Fig. 6e).In spite of little road space they are satisfied becauseit is difficult to increase road area destroying the roadside structures.
Regarding traffic police service only 26% of therespondents were satisfied and 76% of the respondentswere dissatisfied because not only the traffic police serviceis inadequate but also the traffic police sometimes shownegligence in their duties (Fig. 6 f).
Problems of Road Transport System in Krishnanagar . . .

Life and Living Through Newer Spectrum of Geography186
That parking of vehicles is an acute problem is attestedby answer of overwhelming major of the people surveyed.About 74% of the respondents became dissatisfied aboutparking facility. Only 26% satisfied. This is because ofnear absence of any parking facilities in selected places;vehicles are parked haphazardly on the road or roadside(6 g).
5. Conclusion
The present condition of the road transportationsystem is very poor and the respondents and local peopleare mostly dissatisfied with road transport system. Exceptthe physical condition of the municipal road, in all otherparameters of road transport system they are dissatisfied.The problems of the road transport are not new. Theseare growing in tune with the unplanned growth of thecity itself. Eradication of the problems is not easy at all.What is needed is the in depth analysis of the roadtransport system by the various agencies. This calls forfurther research in this field to make this effort towardsa cherished goal.
6. Acknowledgments
I acknowledge active cooperation of the respondents
Fig. 7 Water logging on road,near Post Office More
Fig. 8 Overcrowded bus infront of Municipality

187
in the field during their perception survey. I am thankfulto Chairman, Krishnanagar Municipality; Superintend ofPolice, Krishnanagar; Road Transport Organization,Krishnanagar for their cooperation during collection ofsecondary data. I acknowledge the guidance of my teacherDr. Balai Chandra Das, Assistant Professor, Dept. ofGeography, Krishnanagar Govt. College, Nadia, WestBengal. Finally I acknowledge the help from AznarulIslam, Assistant Professor, Dept. of Geography, BarasatGovt. College, 24 Parganas (N), West Bengal for hisconstant inspiration and cooperation.
7. References
Islam, A (2011). Road Accident Analysis- A Case Study OnKrishnanagar Urban Area, Journal of Interacademecia, 15(2), 232-239.
Islam, A and Tarafder, S (2013). Urban Morphology of anUnplanned City: A Study on Krishnanagar City, West Bengal,India. Parctising Geographer, 17 (1), 107-120
John Pucher et. al (2005). Urban transport crisis in India, TransportPolicy, Elsevier 12, 185–198
John Pucher et. al (2007). Urban Transport Trends and Policiesin China and India: Impacts of Rapid Economic Growth,Transport Reviews, 27, 1-61
Nandy, S. (2011). Problems of road transport system at KrishnanagarMunicipality, an unpublished dissertation, KalyaniUniversity.
Nimbalkar et.al (2005). Urban transportation problems in amillion city: a case study of a Pune Urban Area, Sodh,Samiksha aur Mulyankan (International Research Journal,352-354
Pacione, M. (2005). Urban Geography- A Global Perspective,London: Routledge Publication.
Rodrigue, J.P et.al (2006). The Geography of Transport System,New York: Routledge Publication.
Saxena, H.M. (2005). Tranport Geogarphy, New Delhi: RawatPublication
Singh, S.K. (2005). Review of Urban Transportation in India, Journalof Public Transportation, 8 (1), 79-97.
Problems of Road Transport System in Krishnanagar . . .

Life and Living Through Newer Spectrum of Geography188
11Gender Gap in Literacy:A Study of Indian Scenario
Md. Monirul Islam & Dr. Md. Mustaquim
ABSTRACT
Gender gap in literacy is a major concern in contemporaryworld especially in India. Gender gap in literacy occurs whenthere are systematic differences in schooling level betweenmen and women. In this paper an attempt has been made toanalyze the spatial pattern of total literacy rates and gendergaps in literacy rates in India. The research work is entirelybased on secondary data which are collected from differentsources. Many statistical techniques have been used for analysisthe data. The finding suggests that there are a certain differencesin male and female literacy rates across the country. India iscontinuously improving in the total literacy rate which reflectsthe reduction of gender gaps in literacy. North Eastern statesare much well condition in terms of male female literacy gapsalong with Southern states of India while Middle Westernparts of India are still facing the curse of gender gaps inliteracy.
Key Word(s): Gender gap, total literacy, female literacy,women, reduce, unequal.

189
Introduction
“Educate one man, you educate one person, buteducate a woman and you educate a whole civilization”.
—Mahatma Gandhi
The 21st century is known for women, as theyestablished their right in every stage of life. But in termsof literacy women are very lag behind as compare tomen in India. Literacy is the basic requirement for everycivilized person. Literacy reflects the socio-economic andcultural set-up of a nation, ethnic group or community.Literacy is essential not only for eradication of poverty,but also for mental isolation for cultivating peaceful andfriendly international relations and for permitting thefree play of demographic processes as well [1]. Low levelof female literacy creates gender gap in literacy whichis a constraint on the improvements of an individual’sas well as nations socio-economic conditions. Genderinequality in literacy is a result of the continualdiscrimination of one group of people based upon gender.The male-female gap in literacy rate is still very high,although female literacy is increased since theindependence but the immense majority of women arestill illiterate.
Gender gaps in literacy reduced the total literacylevel which reflects the negative results on growth ofeconomy of the country, as education is the most activeindicator of economic growth. It is also a responsiblefactor to create different social pollution. Male femaleliteracy gaps are differing from rural to urban oragricultural economy society to industrial societydepending on educational facilities, social custom andparent’s educational level.
Many researchers have worked on the presentproblems of gender literacy; some of the studies arecited here. Kaushik and kaushik (2012) studied the gendergap in literacy in micro level in Mathura district of Uttar
Gender Gap in Literacy: A Study of Indian Scenario

Life and Living Through Newer Spectrum of Geography190
Pradesh [2]. Booth, Johns and Bruce (2009) have studiedthe gender gap appears to be stabilizing after wideningfor a short period, and many boys achieve extremelywell in all areas, while some girls underachieve [3].Firdous & Rahaman (2011) noted that the dropout offemales from the system is a major concern and it createsgender gap in literacy [4]. Pathak & Gupta (2013)explained the significance of women education in socialand economic development of India and also find outthe causes behind low level of education of women [5].Pekkarinen (2012) studied the trends in gender gaps ineducation, their causes and potential policy implications[6]. Rahji (2005) examined the school enrolment andgender gap in rural household children at primary level[7]. Sundaram & Vanneman (2008) find out that girlshave relatively lower literacy compared to boys in areaswhere more women are in the labour force [8]. Menschand Lloyd (1998) explain the Gender differences in theschooling experiences of adolescents in low incomecountries [9]. Impact of the socioeconomic condition ofparents on the gender gap in literacy is analyzed byPeter and David (2000) [10]. In this addition, an attempthas been made to analyze the state wise literacy rateand gender gap in literacy rate in India.
Objectives
The main objectives of the study are as follows:
To analyze the spatial variation in literacy of menand women in India and investigate the growthof gender wise literacy status in India.
To measure the gender gap in literacy and examinethe reducing rates of gaps with making the zonesof gender gap in literacy across India.
To recommend some useful suggestions that canbe helpful for eradication of gender gaps in literacy.

191
Data Base and Methodology
The entire research work is based on the secondarydata. The data have been collected from different sourcesi.e.; census of India, different books and published articles.Different statistical techniques are used to manipulateand analysed the data. To correlate total literacy ratewith gender gaps in literacy Karl Pearson’s correlationtechnique is used. In spite of this, for the analysis ofconcentration of female literacy, location quotienttechnique is used. Gini’s coefficient technique is appliedto measure the degree of inequalities in literacy in termsof gender. Lastly a map is drawn to show the spatialpattern of gender gap in India.
Result and Discussion
Table 1: Literacy rates in India, 1951-2011
Census Year Total Literacy Male Literacy Female Literacy Gender Gapin Literacy
1951 18.33 27.16 8.86 18.3
1961 28.3 40.4 15.35 25.05
1971 34.45 45.96 21.97 23.99
1981 43.57 56.38 29.76 26.62
1991 52.21 64.13 39.29 24.84
2001 64.84 75.26 53.67 21.59
2011 74.04 82.1 65.5 16.6
Source: Census of India, 1951-2011.
In the year 1951 total literacy rate of India was only18.33 percent, in which 27.16 percent was male literacyand only 8.86 percent was female literacy. The gendergap in literacy was about 18.3 percent. After a decadeIndia reached at 28.3 percent of total literacy which wasincrease by nearly 10 percent but the gender gap inliteracy was also increased and reached at 25.05 percentfrom 18.3 percent. But in the year 1971 total literacy
Gender Gap in Literacy: A Study of Indian Scenario

Life and Living Through Newer Spectrum of Geography192
was increased slightly from previous decades and gendergap reached at 23.99 percent by reduced slightly fromprevious census year. In the census of 1981 it was notedthat total literacy rate was 43.57 percent by comprisingof male literacy of 56.38 percent and female literacy of29.76 percent and gender gap reached at the peak levelof 26.62 percent. As the implementation of National Policyon Education (NPE) 1986, from the census 1991 gendergap in literacy is decreasing continuously. In the year2001 the total literacy rate reached at 64.84 percent whilemale literacy rate was more than 75 percent and femaleliteracy has crossed over the 50 percent for the firsttime. Gender gap for the year 2001 was reduced at 21.59percent from the 24.84 percent of previous decades. Inthe latest census of 2011 the total literacy rate is reachedat 74.04 percent while male literacy rate is 82.1 percentand female is 65.5 percent. The gender gap in literacy isbeing reduced by nearly 5 percent and reached at 16.6percent. Figure 1 indicates the declining trends of gendergap in literacy of India. For the implementation of manyact and programmes as well as increasing awarenessamong peoples are the responsible factors for decliningtrends of gender gap in literacy.
Figure 1: literacy rates of India (1951-2011)

193
Table 2 shows the state wise distribution of totalliteracy rate, male literacy rate, female literacy rate andgender gap in literacy rate in the year of 2001 and 2011.In the year of 2001 India has the total literacy rate of64.8 percent whereas male literacy was 75.3 percent andfemale literacy was 53.7 percent with the gap betweentwo genders of 21.6 percent. But in the year of 2011this picture is slightly changed with the increased oftotal literacy rate of 74.04 percent from 64.8 percent ofthe previous census year. The male literacy rate is crossedover 80 percent for the first time and reached at 82.1percent and the female literacy rate is 65.5 percent withgender gap in literacy is 16.7 percent.
There are 10 states namely, Uttaranchal, Orissa,Haryana, Uttar Pradesh, Bihar, Jammu & Kashmir, MadhyaPradesh, Chhattisgarh, Jharkhand and Rajasthan and oneunion territory, Dadra & Nagar Haveli have found whosegender gap in literacy rates are more than Indian nationalaverage i.e.; 16.7 percent. Among them, Rajasthan havingthe highest gender gap with 27.8 percent followed byJharkhand 22.3 percent, Chhattisgarh 20.9 percent, andMadhya Pradesh 20.5 percent and so on. On the otherhand, rest of 24 states and union territories are foundwith the gender gap in literacy below the Indian averagei.e.; 16.7 percent. Among the states, Meghalaya is foundhaving gender gap with only 3.4 percent, followed byKerala 4.0 percent, Mizoram 4.3 percent, Nagaland 6.6percent and so on. And lastly Gujarat is found havingthe gender gap of 16.5 percent nearly the Indian averageof gender gap in literacy. India is experiencing the averageannual gap reducing rate of 0.49 percent where Dadra& Nagar Haveli is over 1 percent. Bihar (0.64%), ArunachalPradesh (0.62%), Manipur (0.65%), Orissa (0.68%), Tripura(0.70) states have come to well situation in terms ofannual reducing rates where Delhi (0.25%), Chandigarh(0.06%), Jammu & Kashmir (0.33%), Goa (0.21%), HimachalPradesh (0.37%), Punjab (0.17%), Rajasthan (0.41%) are
Gender Gap in Literacy: A Study of Indian Scenario

Life and Living Through Newer Spectrum of Geography194
Tab
le 2
: S
tate
-wis
e T
ota
l, M
ale,
Fem
ale
lite
racy
rat
e &
Gen
der
gap
in L
iter
acy
(20
11 &
200
1)
Sta
tes
2011
2001
Red
uci
ng
Lit
erac
yM
ale
Fem
ale
Gap
Lit
erac
yM
ale
Fem
ale
Gap
rate
s of
Rat
eL
iter
acy
Lit
erac
yR
ate
Lit
erac
yli
tera
cyG
ap
Ind
ia74
.082
.165
.516
.764
.875
.353
.721
.60.
49
An
dh
ra P
rad
esh
67.7
75.6
59.7
15.9
60.5
70.3
50.4
19.9
0.40
Aru
nac
hal
Pra
des
h67
.073
.759
.614
.154
.363
.843
.520
.30.
62
Ass
am73
.278
.867
.311
.563
.371
.354
.616
.70.
52
Bih
ar63
.873
.553
.320
.247
.059
.733
.126
.60.
64
Ch
hat
tisg
arh
71.0
81.5
60.6
20.9
64.7
77.4
51.9
25.5
0.46
Go
a87
.492
.881
.811
82.0
88.4
75.4
13.1
0.21
Gu
jara
t79
.387
.270
.716
.569
.179
.757
.821
.90.
54
Har
yan
a76
.685
.466
.818
.667
.978
.555
.722
.80.
42
Him
ach
al P
rad
esh
83.8
90.8
76.6
14.2
76.5
85.4
67.4
17.9
0.37
Jam
mu
&
Kas
hm
ir68
.778
.358
.020
.355
.566
.643
.023
.60.
33
Jhar
kh
and
67.6
78.5
56.2
22.3
53.6
67.3
38.9
28.4
0.61
Kar
nat
aka
75.6
82.8
68.1
14.7
66.6
76.1
56.9
19.2
0.45
Ker
ala
93.9
96.0
92.0
490
.994
.287
.76.
50.
25
Mad
hy
a P
rad
esh
70.6
80.5
60.0
20.5
63.7
76.1
50.3
25.8
0.53
Mah
aras
htr
a82
.989
.875
.514
.376
.986
.067
.018
.90.
46
Man
ipu
r79
.886
.573
.213
.370
.580
.360
.519
.80.
65
Meg
hal
aya
75.5
77.2
73.8
3.4
62.6
65.4
59.6
5.8
0.24

195
Miz
ora
m91
.693
.789
.44.
388
.890
.786
.84.
0-0
.03
Nag
alan
d80
.183
.376
.76.
666
.671
.261
.59.
70.
31
Ori
ssa
73.5
82.4
64.4
1863
.175
.450
.524
.80.
68
Pu
nja
b76
.781
.571
.310
.269
.775
.263
.411
.90.
17
Raj
asth
an67
.180
.552
.727
.860
.475
.743
.931
.90.
41
Sik
kim
82.2
87.3
76.4
10.9
68.8
76.0
60.4
15.6
0.47
Tam
il N
adu
80.3
86.8
73.9
12.9
73.5
82.4
64.4
18.0
0.51
Trip
ura
87.8
92.2
83.1
9.1
73.2
81.0
64.9
16.1
0.70
Utt
aran
chal
79.6
88.3
70.7
17.6
71.6
83.3
59.6
23.7
0.61
Utt
ar P
rad
esh
69.7
79.2
59.3
19.9
56.3
68.8
42.2
26.6
0.67
Wes
t B
eng
al77
.182
.771
.211
.568
.677
.059
.617
.40.
59
An
dam
an &
86.3
90.1
81.8
8.3
81.3
86.3
75.2
11.1
0.28
Nic
ob
ar I
slan
ds
Ch
and
igar
h86
.490
.581
.49.
181
.986
.176
.59.
70.
06
Dad
ra &
N
agar
77.7
86.5
65.9
20.6
57.6
71.2
40.2
31.0
1.04
Hav
eli
Dam
an &
D
iu87
.191
.579
.611
.978
.286
.865
.621
.20.
93
Del
hi
86.3
91.0
80.9
10.1
81.7
87.3
74.7
12.6
0.25
Lak
shad
wee
p92
.396
.188
.27.
986
.792
.580
.512
.10.
42
Po
nd
ich
erry
86.5
92.1
81.2
10.9
81.2
88.6
73.9
14.7
0.38
Sou
rce:
Cen
sus
of
Ind
ia,
2011
&
200
1.
Gender Gap in Literacy: A Study of Indian Scenario

Life and Living Through Newer Spectrum of Geography196
still not able to controlling the annual reducing rates ofgender gaps in literacy.
Table 3: No of States with Gender gaps in literacy, 2011
No. of States Total literacy rates Gender Gap Class Ranges
8 86.7 <10
20 78.6 10 to 20
7 69.5 >20
Source: Calculated by the researcher.
The values of gender gaps in literacy are dividedinto three classes i.e.; class I (gender gap less than 10),class II (gender gap 10–20) and class III (gender gapmore than 20) for the easiness of discussion. Table 3depicted that there are 8 states and union territories liesin the first class category i.e.; Meghalaya (3.4%), Kerala(4.0), Mizoram (4.3%), Nagaland (6.6%), Lakshadweep(7.9%), Andaman & Nicobar Islands (8.3%), Chandigarh(9.1%) and Tripura (9.1%), whose average total literacyrates are 86.7 percent. But most of the states and unionterritories are fall in the class II, as their ranges of gendergaps are 10 percent to 20 percent. There are 20 statesand union territories are in this class whose averagetotal literacy rates are 78.6 percent. Delhi (10.1%), Punjab(10.2%), Sikkim (10.9%), Pondicherry (10.9%), Goa (11.0%),Assam (11.5%), West Bengal (11.5%), Daman & Diu (11.9%),Tamil Nadu (12.9%), Manipur (13.3%), Arunachal Pradesh(14.1%), Himachal Pradesh (14.2%), Maharashtra (14.3%),Karnataka (14.7%), Andhra Pradesh (15.9%), Gujarat(16.5%), Uttaranchal (17.6%), Orissa (18.0%), Haryana(18.6%) and Uttar Pradesh (19.9%) are lies in this class.Remaining 7 states and union territories i.e.; Bihar (20.2%),Jammu & Kashmir (20.3%), Madhya Pradesh (20.5%),Dadra & Nagar Haveli (20.6%), Chhattisgarh (20.9%),Jharkhand (22.3%) and Rajasthan (27.8%) experiencingmore than 20 percent of gender gaps in literacy rates.

197
As these states average total literacy rates are not sowell (60.5%) that they face more differences in male-female literacy level. In these cases females are moredestitute in terms of literacy than the male persons.
Figure 2 shows the spatial pattern of male femaleliteracy gaps in India. There are three states namely;Kerala, Meghalaya and Mizoram have gender gaps inliteracy of below 5 percent where most of the MiddleWestern part is covered by very large proportion of gendergaps in literacy. Southern parts along with North-Easternparts of India are experiencing a well condition in termsof gender gaps in literacy.
Figure 2: Spatial distribution of gender gaps inliteracy in India, 2011
Gender Gap in Literacy: A Study of Indian Scenario

Life and Living Through Newer Spectrum of Geography198
Figure 3 shows the relationship between the totalliteracy rates and gender gaps in literacy rates of India.Figure clearly shows that there are a strong negativerelation between the two variable, total literacy ratesand gender gaps in literacy. With the increasing of totalliteracy rates, male-female gaps in literacy are decreasingcontinuously and vice versa. Rajasthan is the highestliteracy gaps of 27.8 percent whereas their total literacyrate is only 67.1 percent which is very low as compareto Indian national average. On the contrary, Meghalaya,Kerala, Mizoram etc. have the very few male-female gapsin literacy rates, as their total literacy rates are verymuch well as of Indian national average. Kerala stay atthe peak position in terms of total literacy rates (92.9%)and its effects is reflecting in male-female gaps in literacy,only of 4.0 percent. States and union territories, whosetotal literacy rates are low, are resulting increases ofgender gaps in literacy. A strong negative correlation (-0.74) is made between the total literacy rates and gendergaps in literacy rates.
Figure 3: Relationship between Total literacy rates andGender gaps in literacy, 2011

199
Table 4: State-wise total literacy rate and femaleliteracy rate of India, 2011
Total Literacy Female literacy LocationRate Rate Quotient
India 74.0 65.5 -Andhra Pradesh 67.7 59.7 0.78Arunachal Pradesh 67.0 59.6 0.79Assam 73.2 67.3 0.81Bihar 63.8 53.3 0.74Chhattisgarh 71.0 60.6 0.76Goa 87.4 81.8 0.83Gujarat 79.3 70.7 0.79Haryana 76.6 66.8 0.77Himachal Pradesh 83.8 76.6 0.81Jammu & Kashmir 68.7 58.0 0.75Jharkhand 67.6 56.2 0.74Karnataka 75.6 68.1 0.80Kerala 93.9 92.0 0.87Madhya Pradesh 70.6 60.0 0.75Maharashtra 82.9 75.5 0.81Manipur 79.8 73.2 0.81Meghalaya 75.5 73.8 0.86Mizoram 91.6 89.4 0.86Nagaland 80.1 76.7 0.85Orissa 73.5 64.4 0.78Punjab 76.7 71.3 0.82Rajasthan 67.1 52.7 0.69Sikkim 82.2 76.4 0.82Tamil Nadu 80.3 73.9 0.81Tripura 87.8 83.1 0.84Uttaranchal 79.6 70.7 0.79Uttar Pradesh 69.7 59.3 0.75West Bengal 77.1 71.2 0.82Andaman & Nicobar Islands 86.3 81.8 0.84Chandigarh 86.4 81.4 0.83Dadra & Nagar Haveli 77.7 65.9 0.75Daman & Diu 87.1 79.6 0.81Delhi 86.3 80.9 0.83Lakshadweep 92.3 88.2 0.85Pondicherry 86.5 81.2 0.83
Source: Census of India, 2011.
Gender Gap in Literacy: A Study of Indian Scenario

Life and Living Through Newer Spectrum of Geography200
Table 4 shows the concentration of female literacyrates within the total literacy rates in India, 2011. Locationquotient technique is used to analyze this concentration.No Indian states are found where concentration of femaleliteracy is uniform, as all are facing very critical conditionsin terms of female literacy. Among the states, Keralahave the highest concentration (0.87) of female literacyrates, followed by Mizoram (0.86), Meghalaya (0.86),Nagaland (0.85), Lakshadweep (0.85), Andaman & NicobarIslands (0.84), and Tripura (0.84). On the other hand,Rajasthan is found having lowest concentration (0.69) offemale literacy rates. Jharkhand (0.74), Bihar (0.74), andJammu & Kashmir (0.75) etc. states have very lessconcentration of female literacy rates, as these states haveexperiencing very low level of total literacy rates andthe dominance of male literacy over female literacy. WestBengal (0.82), Delhi (0.83), Andhra Pradesh (0.78), Gujarat(0.79), Punjab (0.82), Tamil Nadu (0.81), Maharashtra (0.81)etc states have facing moderate concentration of femaleliteracy. The unequal distribution of male-female literacygap in respect of total literacy rates is calculated tomeasure the inequalities among gaps in literacy wheregini’s co-efficient value is 0.28.
Conclusion
There is a positive significant difference between maleand female literacy rate in India. Gender gap in literacyis 16.7 percent as of 2011 census. Male-female differencesin literacy vary from state to state. A highest male-femalegap in literacy rates is found in Rajasthan, 27.8 percent,which is much more than Indian average gap. On theother hand, Meghalaya found to be the lowest gendergaps, 3.4 percent, whose total literacy rates is more than75 percent. There are 24 states and union territorieswhich have gender gaps of below the national average.On the contrary, remaining states and union territorieshave gender gaps of above the Indian national average.

201
It is noted that more gender gaps are found in thosestates which are lag behind in terms of total literacyrates, which is mainly cover the middle west part of thenation. There are a strong negative correlation is madebetween total literacy rates and gender gaps in literacy.Kerala, Mizoram, Nagaland, Tripura, Lakshadweep etcstates have a little bit gender gaps in literacy as thesestates are experiencing a well total literacy rates.
To remove this gap in gender literacy in India propereducational opportunities should be provide for womenespecially in the rural areas at village level. Employmentopportunities should be generated especially for thewomen. Importance of education should be understoodherself and for their children. Female abuse, eve teasingshould be strictly banned with the due importance ofprotection of women. Though for the Right to educationAct, 2009 gender gaps will be reducing continuously, atarget time will be mark for achieving the zero gendergaps in literacy.
References
1. Hussain, M. (2011), Human Geography, Rawat Publications,Jaipur, p. 96.
2. Kaushik, A. K. and Kaushik, K. (2012), Gender gap inliteracy rate in Mathura district, U.P. A geographical study,European Journal of Business and Social Sciences, Vol. 1, No.9, pp. 95-107.
3. Booth, D., Johns S, E., Bruce, F. (2009), Boys’ LiteracyAttainment: Research and Related Practice, A reportprepared for the Ontario Ministry of Education, Centre forLiteracy, Nipissing University.
4. Jannatul, F. and Rahman, K.M.M. (2011), Gender Inequalityin Bangladesh, Unnayan Onneshan-The Innovators, pp. 1-20.
5. Pathak, S. and Gupta, A. (2013), Status of Women in Indiawith Particular Reference to Gap in Male Female LiteracyRate in India, International Journal of EnvironmentalEngineering and Management, Volume 4, No. 6, pp. 549-552.
Gender Gap in Literacy: A Study of Indian Scenario

Life and Living Through Newer Spectrum of Geography202
6. Pekkarinen, T. (2012), Gender differences in education, NordicEconomic Policy Review, vol. 1.
7. Rahji, M. A. Y. (2005), Primary School Enrollment andGender Gap of Rural Households’ Children in South WesternNigeria, Regional Conference on “Education in West Africa:Constraints and Opportunities, Dakar, Senegal, November1-2, 2005.
8. Sundaram, A. and Vanneman, R. (2008), Gender Differentialsin Literacy in India: The Intriguing Relationship withWomen’s Labor Force Participation, World Development, Vol.36, No. 1, pp. 128–143.
9. Mensch, B. and Lloyd, C. (1998), Gender Differences inthe Schooling Experiences of Adolescents in Low IncomeCountries: The case of Kenya, Studies in Family Planning,Vol. 29, No. 2. pp. 167-184.
10. Glick, P. and David, E. S. (2000), Schooling of Girls andBoys in a West African Country: The Effects of ParentalEducation, Income and Household Structure, Economics ofEducation Review, Vol. 19, pp.63-87.
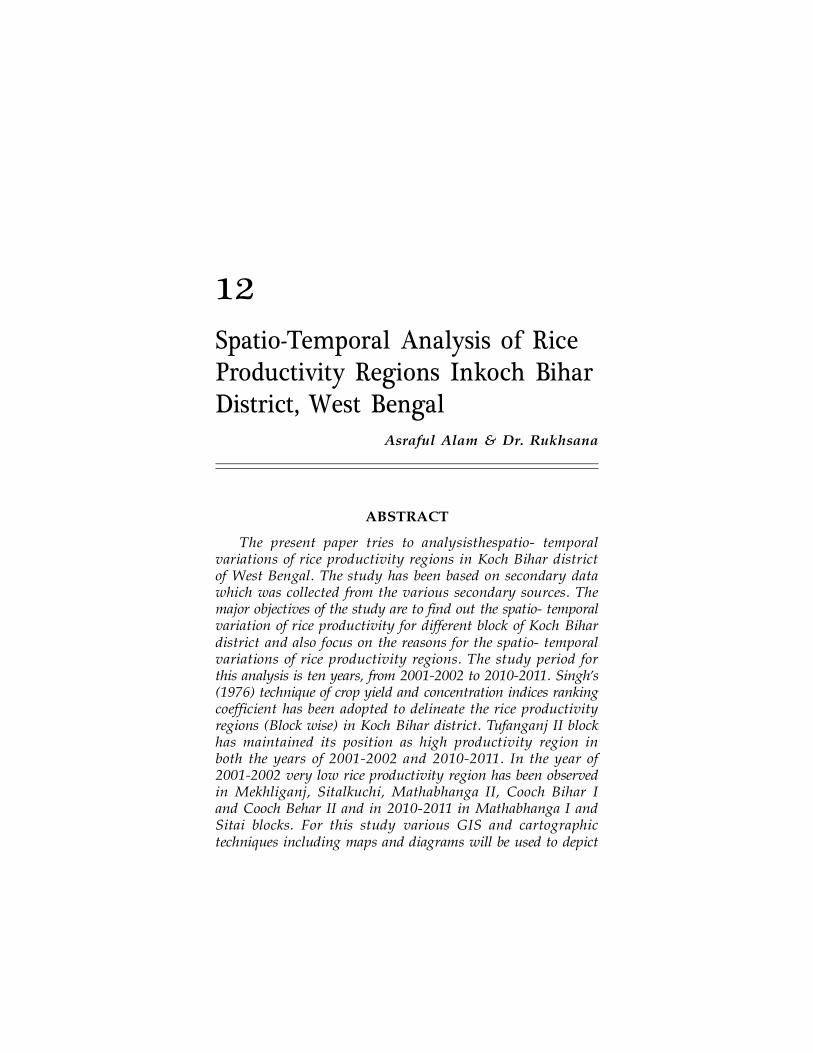
203
12Spatio-Temporal Analysis of RiceProductivity Regions Inkoch BiharDistrict, West Bengal
Asraful Alam & Dr. Rukhsana
ABSTRACT
The present paper tries to analysisthespatio- temporalvariations of rice productivity regions in Koch Bihar districtof West Bengal. The study has been based on secondary datawhich was collected from the various secondary sources. Themajor objectives of the study are to find out the spatio- temporalvariation of rice productivity for different block of Koch Bihardistrict and also focus on the reasons for the spatio- temporalvariations of rice productivity regions. The study period forthis analysis is ten years, from 2001-2002 to 2010-2011. Singh’s(1976) technique of crop yield and concentration indices rankingcoefficient has been adopted to delineate the rice productivityregions (Block wise) in Koch Bihar district. Tufanganj II blockhas maintained its position as high productivity region inboth the years of 2001-2002 and 2010-2011. In the year of2001-2002 very low rice productivity region has been observedin Mekhliganj, Sitalkuchi, Mathabhanga II, Cooch Bihar Iand Cooch Behar II and in 2010-2011 in Mathabhanga I andSitai blocks. For this study various GIS and cartographictechniques including maps and diagrams will be used to depict
Spatio-Temporal Analysis of Rice Productivity . . .

Life and Living Through Newer Spectrum of Geography204
the rice productivity regions in Koch Bihar district of WestBengal.
Key Words: Productivity, Rice, Koch Bihar district, Cropyield index and Crop concentration index.
Introduction
The geographical analysis of agricultural productivityisvery useful for decision makers, administrators andagricultural planner for regional planning. A large numberof factors influence the agricultural productivity of aregion. These factors are Physical factors (Topography,Climate, Soil) Socio- economic (Ownership, Land holdingSize, Market Demand, Cropping Pattern, Crop Rotationetc.). There are some ambiguity among the geographerand economist about the term of agricultural productivityand efficiency. Many of the scholars have used thesetwo terms differently while some scholars have used asa synonymous to each others. Productivity has define ineconomics and agricultural geography means output perunit of input or per unit of area respectively and theimprovement in agricultural productivity is generally theresult of a more efficient use of the factors of productionviz. environment arable land, labour and capital like(Jasbir Sing, 1997). Measurement of riceproductivity isimportant for present day. Aside from providing morefood, increasing productivity effects the regions prospectfor growth and competitive on agricultural market,distribution of income, savings and labour migrationetc.Rice is the most important food crop of Koch Bihar districtcovering two-third of the total cropped area and providingfood to about all of the population in Koch Bihar district.
Rice is a tropical plant and requires high heat andhigh humidity for its successful grown. The temperatureshould be fairly high at mean monthly of 24ºC. It shouldbe 20ºC- 22ºC at the time of sowing, 23ºC- 25ºC duringgrowth and 25ºC – 30ºC at the harvesting time. Theaverage annual rain fall required by rice is 150 cm. Rice

205
is one of the most important food crops in Koch BiharDistrict, not only in Koch Bihar district but whole Asiadepend on mainly this food crop. Rice is life for thousandsof millions people (D. R. Khullar, 2010)
Objectives
The major objectives of the study are to find out thespatio- temporal variation of rice productivity for differentblock of Koch Bihar district from the year of 2001-2002to 2010-2011and this paper also focuses on the reasonsfor the spatio- temporal variations of rice productivityregions.
Methodology
The study has been based on secondary data whichwas collected from the various secondary sources suchas Statistical Abstract, Cooch Behar District StatisticalHand Book 2002 and 2011, Bureau of Applied Economicsand Statistics, Government of West Bengal. Singh’s (1976)technique of crop yield and concentration indices rankingcoefficient has been adopted to delineate the riceproductivity regions (Block wise) in Koch Bihar districtfor the year of 2001-2002 to 2010-2011. The technique ofcrop yield and concentration indices ranking coefficientis given below:
Yi= x100………………I
Where Yi= is the crop yield index
Yae= is the average yield per hectare of crop “a” inthe component enumeration unit.
Yar= is the average yield of the crop “a” in the entireregion.
Ci= x 100 …………………II
Spatio-Temporal Analysis of Rice Productivity . . .

Life and Living Through Newer Spectrum of Geography206
Where Ci= is the crop concentration index.
Pae= is the percentage strongly of crop “a” in thetotal harvested area in the component enumeration unit.
Par= is the percentage share of crop “a” in the totalharvested area in the entire region.
Finally Calculate the Crop yield and ConcentrationindicesRanking Coefficient of Crop “a”
Here, the lower value of the ranking coefficientindicates the higher degree of productivity and the highervalue of the ranking coefficient implies the lower degreeof productivity.
Study Area: The Koch Bihar is covering an area of3387 sq km., with a 2,822,780 population, based on 2011census. It lies in between 25º57’47" and 26º36’20" northlatitude and between 88º47’44" and 89º54’35" eastlongitude. It borders by Assam on the eastern side,Jalpaiguri district of the West Bengal on the northernand western side and the international border in theform of Indo-Bangladesh boundary in the south and south-west. Geographically the Koch Bihar district belongs tothe BarindTract(a tract of old alluvium) of the lowerGanga plain where theTerai (a zone of marshy jungle)kind of vegetation prevails onthe northern side. In thesouth-eastern side it is flat with aslight slope and someareas noticed to be lowand liable toinundation.
Crop Yield Index Ranking of Crop-" "a \""+Crop Concentration Ranking of Crop "a"
2=... III

207
Figure: Administrative map of Koch Bihar district withblocks boundary.
Rice Productivity
In 2001-2002 the highest crop yield index of rice hasbeen observed in Dinhata- II block (121.23) and lowestin the block of Sitai (63.33). In 2010-2011 the highestcrop yield index of rice has been found in MathabhangaII (116.02) and lowest in Cooch Behar II (88.69). In theboth years i.e. 2001-2002 and 2010-2011 the highest crop
Spatio-Temporal Analysis of Rice Productivity . . .

Life and Living Through Newer Spectrum of Geography208
Tab
le 1
: B
lock
Wis
e G
ross
Cro
pp
ed A
rea,
To
tal
Are
a an
d Y
ield
Rat
e o
f R
ice
in C
ooc
hB
ehar
Dis
tric
t, W
est
Ben
gal
2001
-200
220
10-2
011
Gro
ss
Cro
pped
Tota
l A
rea
Yie
ld
Rat
eG
ross
C
ropp
edTo
tal
Are
aY
ield
R
ate
Are
a (H
ecto
rs)
Un
der
Ric
eof
Ric
eA
reas
(H
ecto
rsU
nde
r R
ice
of R
ice
(Hec
tors
)(K
g/H
ecto
rs)
(hec
tors
)
Co
och
Beh
ar-I
4864
029
710
6104
2261
915
205
5177
Co
och
Beh
ar-I
I48
350
3132
054
0315
028
1130
045
56
Din
hat
a-I
4119
027
110
6513
3747
425
140
5516
Din
hat
a-II
4004
023
120
6598
4146
527
266
5041
Seta
i17
990
1426
036
1043
347
2755
849
38
Mat
hab
han
ga-
I39
650
2824
054
9248
895
2873
547
88
Mat
hab
han
ga-
II36
040
2594
049
5239
929
2554
759
60
Sita
lku
chi
3050
021
050
4506
3570
027
235
5247
Tufa
ng
anj-
I40
730
2744
061
4124
852
2075
052
27
Tufa
ng
anj-
II24
350
1682
062
4239
726
2689
555
81
Mek
hli
gan
j34
820
2415
045
6937
124
2603
249
52
Hal
dib
ari
1706
010
090
5178
1501
911
895
4659
Co
och
B
ehar
4193
4027
9250
5442
4019
1127
3558
5137
Sou
rce:
Co
och
Beh
ar D
istr
ict
Stat
isti
cal
Han
d B
oo
k 20
02 a
nd
201
1, B
ure
au o
f A
pp
lied
Eco
no
mic
s an
d S
tati
stic
s, G
ov
ern
men
to
f W
est
Ben
gal
.

209
concentration indices of rice has been observed inHaldibari block and the indices were 2458.03 and 2676.02respectively. In 2001-2002 the lowest crop concentrationindex of Cooch Behar I block (862.13) and in the year of2010-2011 in Mathabhanga I block (821.99).
On the basis of the block wise crop yield and cropconcentration indices ranking correlation coefficient ofthe entire district has beendivided into four riceproductivity regions, these four groups are (Figure No.3):
i) High
ii) Medium
iii) Low and
iv) Very Low
Rice Productivity Regions in Koch Bihar District (2001-2002):
1. Very Low Productivity Regions: Mekhliganj,Sitalkuchi, Mathabhanga II, Cooch Bihar I andCooch Behar II
2. Low Productivity Regions: Sitai, Dinhata I,Tufanganj I and Mathabhanga I
3. Medium Productivity Regions: Haldibari andDinhata II
4. High Productivity Regions: Tufanganj II (Figure:3)
Rice Productivity Regions in Koch Bihar District (2010-2011):
1. Very Low Productivity Regions: Mathabhanga Iand Sitai
2. Low Productivity Regions: Dinhata II
3. Medium Productivity Regions: Mekhliganj andCooch Behar II
Spatio-Temporal Analysis of Rice Productivity . . .

Life and Living Through Newer Spectrum of Geography210
Tab
le 2
: B
lock
Wis
e Y
ield
In
dex
(Y
i),
Co
nce
ntr
atio
n I
nd
ex (
Ci)
, C
rop
Yie
ld a
nd
Con
cen
trat
ion
In
dic
es R
ank
ing
Co
effi
cien
t o
f R
ice
in C
ooch
Beh
ar D
istr
ict
(200
1-20
01an
d 2
010-
2011
)
2001
-200
220
10-2
011
Blo
cks
Nam
eY
ield
Ran
king
Cro
pR
anki
ngC
rop
Yie
ldR
anki
ngC
rop
Ran
king
Cro
pIn
dex
of Y
ield
Con
ce-
of C
rop
Yie
ldIn
dex
of Y
ield
Con
cen-
of C
rop
Yie
ld(Y
i)In
dex
ntra
tion
Con
cen-
and
(Yi)
Inde
xtr
atio
nC
once
nt-
and
Inde
xtr
atio
nC
once
n-In
dex
rati
onC
once
n-(C
i)In
dex
trat
ion
(Ci)
Inde
xtr
atio
nIn
dice
sIn
dice
sR
anki
ngR
anki
ngC
oeffi
cien
tC
oeffi
c-ie
nt
Coo
chbe
har
-I11
2.16
586
2.13
128.
510
0.78
617
76.8
73
4.5
Coo
chbe
har
-II
99.2
87
867.
3011
988
.69
1226
74.4
12
7D
inh
ata-
I11
9.67
210
18.0
610
610
7.38
310
72.5
17
5D
inh
ata-
II12
1.23
110
47.3
08
4.5
98.1
37
969.
2810
8.5
Seta
i66
.33
1223
30.9
62
796
.13
992
7.19
1110
Mat
hab
han
ga-I
100.
916
1057
.60
76.
593
.21
1082
1.99
1211
Mat
hab
han
ga-I
I90
.99
911
63.5
46
7.5
116.
021
1006
.56
95
Sita
lku
chi
82.8
011
1374
.89
47.
510
2.14
411
25.8
05
4.5
Tufa
ngan
j-I
112.
844
1029
.56
96.
510
1.75
516
17.2
24
4.5
Tufa
nga
nj-
II11
4.69
317
22.1
43
310
8.64
210
11.7
18
5M
ekh
liga
nj
83.9
510
1204
.31
57.
596
.40
810
82.6
26
7H
ald
ibar
i95
.14
824
58.0
31
4.5
90.6
911
2676
.02
16
Sou
rce:
Com
pil
ed b
y au
thor
, (F
ollo
wed
Sin
gh’s
Tec
hniq
ue
of c
rop
Yie
ld a
nd C
once
ntr
atio
n In
dic
es R
ank
ing
Coe
ffic
ien
t, 1
976)
211
4. High Productivity Regions: Tufanganj II, TufanganjI, Haldibari, Cooch Bihar I, Mathabhanga II,Sitalkuchi and Dinhata I (Figure: 3).
Figure 3: Block wise productivity of rice in 2001-2002 and2010-2011
The Tufanganj II block has maintained its positionas high productivity region in both the years of 2001-2002 and 2010-2011. The high productivity can beattributed to the favorable agro-ecological conditions aswell as increase in the use of modern technological inputssuch as irrigated water, high yielding varieties of seeds,chemical fertilizers and pesticides. In the year of 2001-2002 very low rice productivity region has been observedin Mekhliganj, Sitalkuchi, Mathabhanga II, Cooch BiharI and Cooch Behar II and in 2010-2011 in MathabhangaI and Sitai blocks. In the year 2010-2011 high riceproductivity regions has been found in the blocks ofTufanganj II, Tufanganj I, Haldibari, Cooch Bihar I,Mathabhanga II, Sitalkuchi and Dinhata I.
In 2001-2002 blocks of Sitalkuchi, Mathabhanga IIand Cooch Bihar I were in low productivity region whilein 2010-2011 these three blocks have been raise to thehigh productivity regions. In these three blocks, overthe ten years of study period use of fertilizers, use oftractors and irrigated area has significantly increased.As a result of that rice productivity has increased. Onthe other hand in 2001-2002 Sitai and Mathabhanga Iblocks were in low productivity region but in 2010-2011
Spatio-Temporal Analysis of Rice Productivity . . .

Life and Living Through Newer Spectrum of Geography212
these two blocks have come down to very low andDinhata II moderate to very low rice productivity regions.In these block farmers were cultivated cash crops(vegetable and Jawar) as an alternative crops of rice. Inearlier time choice of cropping patter was depend onconsumption needs of cultivator’s family but present itis market oriented. This change mainly attributed to theshift in area from season/annual crops to high valueyielding perennial cash crops having a long gestationperiod (Ratheeshmon and Lancelet, 2011).
Conclusions
There are significant spatio- temporal variations inthe rice productivity in Koch Bihar district of West Bengal.These spatio- temporal variations have been controlledby the changing physical factors (topography, climate,rainfall, soil fertility, etc) as well as the utilization patternof modern inputs (HYV seeds, Fertilizers, irrigation, Useof pesticides, modern process of harvesting, Knowledgeabout cultivation, marketing policy etc). Due to lack ofagricultural labour the farmers converts their cultivatedagricultural lands from the high labour intensive foodcrops like rice to commercial or market oriented cropslike tobacco, for which per hectare labour requirementsare relatively lesser.Large scale of rural people migrationto neibouring states also reduces the availability ofagricultural labour in very low rice productivity blocks.In these blocks profitability of the cultivation of foodcrops like rice is relatively lower than profitability ofthe cash crops like potato and tobacco etc. The changingof rice productivity is directly or indirectly related withthe marketing demand, economic policy, trade andcommerce. On the other hand the changing economicsituations are resulted from many processes ofglobalization that amplify the driving force of the changingof rice productivity. It is necessary to increase area underirrigation in Koch Bihar district for increase of level ofrice productivity.

213
References
Buddenhagen, I. W., & Perley, G. J. (1977). Rice in Africa. Proceedingof a Conference held at the International Institute of Agriculture.Ibadan, Nigeria: Academic Press.
Cooch Behar District Stastical Hand Book (2002). Cooch Behar DistrictStastical Hand Book. Kolkata: Bureau of Applied Economicsand Statistics, Government of West Bengal.
Cooch Behar District Stastical Hand Book(2011). Cooch Behar DistrictStatistical Hand Book. Kolkata: Bureau of Applied Economicsand Statistics, Government of West Bengal.
Kendall, M. G. (1939). The Geographical distribution of cropproductivity in Engaland. Journal of Royal Statistical Society,24-28.
Khullar, D. R. (2010). Indian a comprehensive geography. New Delhi:Kalyani Publishers.
Mohapatra, C. A. (2006). Agrarian Developmens and Food Securityin the North- East. In D. Basu, B. F. Kulirani, & B. D. Ray,Agriculture Food Security Nutrition and Health in North EastIndia (pp. 13-20). New Delhi: Mittal Publications.
Ratheeshmon, P., & Lancelet, T. S. (2011). Role of Non- UrbanFactors in Changing Land Use Pattern of Kerala. In D. M.Nandeshwar, V. K. Jayakumar, G. Gopinath, & K. G. Ambili,Sustainable Natural Resources Management under ChengingClimatic Scenarios (pp. 298-302). Kozhikode: Cente for WaterResources Development andManagement.
Singh, G. B. (1979). Transformation of Agriculture. Kurukshetra VishalPublication.
Singh, J., & Dhillon, S. S. (1976). Agricultural Geography. NewDelhi: Tata Mc Graw- Hill pub. Co. Ltd.
Singh, J., & Dhillon, S. S. (1997). Agricultural Geography. NewDelhi: Tata Mc Graw Hill pub Co. Ltd.
Spatio-Temporal Analysis of Rice Productivity . . .

Life and Living Through Newer Spectrum of Geography214

215
SECTION-CSOCIAL PROBLEMS IN GEOGRAPHY

Life and Living Through Newer Spectrum of Geography216

217
13A Geographical View ofDemographi of Urban Poor:A Comparative HouseholdStudy in Kolkata
Jaidul Islam & Moududa Khatun
ABSTRACT
During last five decades or so, rapid urbanization causeda burgeoning of slums, the growth of squatter and informalhousing all around expanding cities of the developing world,rural migration is the main causative factors for the fastergrowth of urban population. Employment generation in urbanformal sector is lower than that is expected to be for that themajority of new comer in cities will take out an informalliving and will live in slums. India’s slum-dwelling populationrose from 27.9 million in 1981 to over 40 million in 2001and 93.06 million in 2011.In spite of number of plan andpolicies implemented for their development what actuallyachieved is the rampant miserable condition of slum life evenin metropolitan cities of developing countries like India. It isobserved that there are certain variation (both physical andsocial) between slum and non-slum area. Population size, itsdistribution and age- sex wise composition are the main aspectof demography. Demographic study refers to the study of
A Geographical View of Demographi of Urban Poor

Life and Living Through Newer Spectrum of Geography218
family size, age-sex structure, literacy rate, occupational pattern,work force etc. Present research paper based on empiricalobservation is an attempt to evaluate the dissimilarity ofdemographic composition in slum and non-slum area overdifferent monthly per capita income group, as it determinethe socio-economic status of people and also to find the answerto the quarries of how this variation can be eliminated throughimplementing policy, programmes and so on. It is observedfrom the study that there is noticeable demographic variationbetween slum and non-slum area, which find out the underlinecauses of deprivation and poor living condition of slum people.The study also revealed that the slum people are not sociallymarginal but under estimated, not economically weaker butcreated.Finally some planning is recommended to overcomethe slum problem.
Introduction
A slum is a settlement that has deteriorated, it is thepart of city which lost its respect that were once desirable,respectable but gradually deteriorated as original dwellersmoved out to newer one (Shelar, 2013).During last fivedecades or so, rapid urbanization caused a burgeoningof slums, the growth of squatter and informal housingall around expanding cities of the developing world,rural migration is the main causes factors for the fastergrowth of urban population. Employment generation inurban formal sector is lower than that is expected to befor that the majority of new comer in cities will takeout an informal living and will live in slums (UNHABITAT REPORT, 2003).The upper class looks slumdwellers as mere marginal, illiterate, unemployed unsocialpeople, they seems slum as the birth place of crime(Desai,1995). What common people understand about theslum is that a dirty, unhygienic cluster of impoverishedshanties with long lines of people crowding around asolitary municipal water tap, bowling babies literallyleft on street corners to fend for themselves and endlesscries and found voices emanating from various corners.

219
Most of them are engaged in taking out their daily lives,always below the poverty line, by working in constructionactivities, domestic helps, rag pickers and chhotus (childservant) in neighbourhood dhabas (small, open and roadside hotel). Though their living conditions are utterlyunhygienic, gloomy, dismal and dehumanized, many ofthem still dream of improving the quality of their lives( Mondal, 2007).
Census of India defined slums as “those residentialareas where dwellings are in any respect unfit for humanhabitation by reasons of dilapidation, overcrowding, faultyarrangements and designs of such buildings, narrownessor faulty arrangement of streets, lack of ventilation, light,sanitation facilities or any combination of these factorswhich are detrimental to safety, health and morals” . Aslum is a compact settlement with a collection of poorlybuilt tenements, mostly of temporary nature, crowdedtogether usually with inadequate sanitary and drinkingwater facilities in unhygienic conditions in that compactarea. Dwellers of slum area defined slum as- It theirplace of residence where they find shelter and share lifewith the people in the same situation (Desai, 1995).
In 1901 India recorded 11.4 percent urban population,which increased to 28.53 percent in 2001 and 30 percentin 2011 but in other hand India’s slum dwelling populationrose from 27.9 million in 1981 to 40 million in 2001(Nair, 2009) Total 2613 towns of India have slumpopulation and in West Bengal out of 129 statutory towns122 towns have slum population (Census of India,2011).One to each six urban Indians do live in slumhousing that is cramped, poorly ventilated, unclean andunfit for human habitation. In other words, nearly 64million Indians live in a degrading urban environmentvery similar to the shantytowns portrayed in the Oscar-winning movie Slumdog Millionaire (Rahman, 2013).Itis almost certain that slum dwellers increased substantiallyduring 1990s. It is further projected that in the next 30years, the global number of slum dwellers will increase
A Geographical View of Demographi of Urban Poor

Life and Living Through Newer Spectrum of Geography220
to about 2 billion, if no firm and concrete action is taken(Un-Habitat, 2003).India’s slum-dwelling population rosefrom 27.9 million in 1981 to over 40 million in 2001 and93.06 million in 2011 (Census of India 2011). Every eighthurban child in India in the age-group of 0-6 years staysin slums. About 7.6 million children are living in slumsin India and they constitute 13.1 per cent to total Indianurban children of 26 States/Union Territories (Deshpande,2011). The pace of urbanization in India is quite faster.This has unfortunately been found to be accompaniedby urban poverty. The urban poor live in slums whichare an integral component of human settlements indeveloping countries. India’s urban population has grownfrom 285 million in 2001 to 377 million in 2011. India’sslum population during the same period has increased,from 52.4 million in 2001 to 93 million (projected) in2011 and is projected to grow at 5 percent per year,according to the Census of India. As per Census of India2011, the slum population in Indian cities is roughly 25percent to total urban population.
About 4473 slums were estimated to be existence inurban West Bengal in 2008-09, 32 percent of them werelocated along nullahs (open drain with stagnant water)and drains and 11 percent along railway lines. About 24percent of slums were built on public land, owned mostlyby local bodies, state government, etc. In 54 percent ofnotified slums, a majority of the dwellings were pucca(concrete), the corresponding percentage for the non-notified ones being 31 percent (Govt. of West Bengal,2013)
A significant proportion of this slum population iswithout access to even the most basic services prerequisitefor enjoying decent quality of life. Kolkata MetropolitanArea (KMA) is no exception to this phenomenon. Thesocio-economic profile of households in KMA undertakenin 1996-97 by Kolkata Metropolitan DevelopmentAuthority (KMDA) revealed that about 45 percent ofthe households lived in slum like environment (Sarkar,2012).

221
KMDA’s development endeavours pay specialattention to the needs and aspirations of urban poor,especially the slum dwellers. KMDAs pioneering role inslum improvement has been replicated elsewhere. Startingwith a package of physical infrastructure developmentinterventions and gradually moving to a comprehensivedevelopment of slums including physical and socio-economic developmental inputs, KMDA, under differentprograms like CUDPs, CSIPs & IPP-8 has benefited 2.5million slum dwellers. IPP-8 that covered urban pooreven outside slum areas benefited more than 3.8 millionurban poor and achieved spectacular results in basichealth indicators as noted in the table below (KMDA,2006).
Population size, its distribution and age- sex wisecomposition are the main aspect of demography, datarelating to this phenomena are basically obtained fromcensus (Premi,2009). It is noticed from the availabledemographic data of Kolkata that there is great variationof demographic structure as well as social, cultural andenvironment aspect between slum area and non-slumarea. Slum is the deprived human settlement which isdemographically, socially, economically andenvironmentally vulnerable (Bose, 1995). Here an attempthas been taken to evaluate the differentiation ofdemographic as well socio-economic status of slum andnon-slum area.
Objectives of the Study
to evaluate the dissimilarity of demographiccomposition over slum and non-slum area
to study the overall socio-economic status of peoplein slum and non-slum area
to recognize helpless income group in slum andnon-slum area in demographic point of view,
A Geographical View of Demographi of Urban Poor

Life and Living Through Newer Spectrum of Geography222
Database and Methodology
Present study is totally based on empirical observation;during the field observation with the help of a welldesigned questionnaire required data have been collectedthrough direct interview with the respondent.Households were selected at random from slumhouseholds of Tangra (ward number 58) and non-slumhouseholds of Narkeldanga of Kolkata MetropolitanCorporation (KMC). The sample households were selectedas 2.5 percent (approximately) of the total householdsof both area, which accounted for 50 slum householdsand 50 non-slum households. For proper understandingof actual fact simple percentages technique have beenadopted to analyse collected information. To determinethe minor variation of demographic factors, samplehouseholds have been categorised into different monthlyper capita income group, this income division is donenot only based on market price but it is a simple divisionof surveyed household’s monthly per capita income. Fewsnapshoot also used to show the ground reality of thestudy area.
Study Area
Kolkata is located in the eastern part of India at 22º33ºN’ and 88º 20Ê E and spread roughly north–southalong the east bank of the Hooghly River, Kolkata. Thecity’s elevation is 1.5–9 m (5–30 ft). Much of the citywas originally a wetland that was reclaimed over thedecades to accommodate a burgeoning population. Kolkatahas total population 4,486,679 persons, accounting2,362,662 male and 2,124,017 female. Total slum populationin Kolkata accounts for 1,457,273 persons (32.48 percent).Population density is 24,252/km2 (62,810 /sq mi). Literacyrate accounts for 87.14 percent exceeding all India average74 percent. The sex ratio of the study area is 899 femalesper 1000 males lower than the national average 940(Census of India 2011). The ratio is depressed by the

223
influx of working males from surrounding rural areas,from the rest of West Bengal, and from neighbouringstates, mainly Bihar, Uttar Pradesh, and Orissa; thesemen commonly leave their families at their original home.Total population of Kolkata urban agglomeration is1,41,12,536 persons in 2011 accounting a decadal increaserate of 7.6 percent much lesser than 19.0 percent during1991-2001 and 19.9 percent during 1981-1991 revealingdeclining growth statistics of Kolkata urban agglomeration(Census of India 2011)
A Geographical View of Demographi of Urban Poor
Life and Living Through Newer Spectrum of Geography224
Analysis and Finding
Distribution of sample slum and non-slum householdsin Income groups
Total sample respondent have been categorised intofive income group according to their per capita monthlyfamily income. This categorisation is not based on themarket price, it is the simple division of monthly incomeof the respondent’s family.
The distribution of households of different incomegroups in slum and non-slum area is exposed from Table1. The study revealed that maximum (87 percent)households belong from very low to medium monthlyper capita income group (i.e. Monthly per capita incomebetween <2000 to 5000). It is derived from Table 1 thatonly 10 percent and 3 percent sample households belongsfrom high and very high income group.
A significant lateral variation in comparative shareof households has been observed in slum and non-slumarea over the different income groups. In the very lowincome group as highest as more than 65 percenthouseholds are slum dweller where only remaining 34.28percent households are non-slum dwellers. In high (Rs.5001-10000) and very high (more than Rs. 10000) incomegroups 70 percent and 100 percent households are non-slum. This unquestionably derived the discrepancy ofincome distribution among the households of slum andnon-slum area.
Male-Female Ratio in Slum and Non-slum Area
A noticeable variation in sex-ratio over slum andnon-slum area has been experimental in the present study.It is derived from the table 3 that higher share of malepopulation is observed in medium, high and very highincome group, in the other hand very low and low incomegroup’s households of the study area irrespective of slumand non-slum habitat share high percentage of female

225
Tab
le 1
: D
istr
ibu
tio
n o
f sa
mp
le h
ou
seh
old
s b
ased
on
mon
thly
per
cap
ita
inco
me,
Tan
gra
(S
lum
) &
Nar
kel
dan
ag (
No
n-s
lum
), K
olk
ata,
201
4
Inco
me
grou
pM
onth
ly p
er
capi
taTo
tal
sam
ple
Slu
mN
on-s
lum
inco
me
(Rs.
)ho
use
hold
sho
use
hold
sho
use
hold
s
Nu
mbe
r%
Nu
mbe
r%
Nu
mbe
r%
Ver
y l
ow
Les
s th
an
2000
3535
2365
.72
1234
.28
Lo
w20
01-3
500
2323
1669
.56
730
.44
Med
ium
3501
-500
029
298
27.5
921
72.4
1
Hig
h50
01-1
0000
1010
330
770
Ver
y
hig
hM
ore
th
an
1000
03
3N
AN
A3
100
Tota
l10
010
050
5050
50
Sou
rce:
Fie
ld
surv
ey,
2014
, N
A-
Sam
ple
N
ot
Av
aila
ble
.
A Geographical View of Demographi of Urban Poor

Life and Living Through Newer Spectrum of Geography226
population. However, considering the male –female ratio,slum habitat reported overall high male –female ratio(1024) ratio in relation to non-slum area (946) and overallstudy area (989). Regarding to sex-ratio, the fact can bederived that the sex-ratio is declining as with the increaseof monthly per capita income of the households. Theconstancy of declining of sex-ratio over gradual increaseof monthly per capita income is maintained in non-slumhabitat and among all sample households of respectiveincome groups.
From the Table 2 it can be concluded that the familyearning and thereby household per capita income of bothslum and non-slum area totally depend on male workparticipation and their earning. Due to low percentageof male workforce (male workforce) in slum area themonthly per capita income is low, however higherpercentage of male workforce population in non-slumarea leading to higher earning and thereby overall highermonthly per capita income of households.
Distribution of slum and non-slum population inaccordance of Age-sex
The volume of dependent population can be calculatedfrom age-sex ratio of any area which further is an indicatorof people’s standard of living of concerned region.Thevariation of age sex wise distribution in slum and non-slum area is revealed from table 3. Percentage of slumpopulation is found to be higher than non-slum populationin each income group. Overall more than 75 percentpopulations are residents of slum area however rest 20are non-slum residents. Another glimpse of this regardsis that percentage of slum population of each age groupdecreasing with the increasing of monthly per capitaincome, however the fact is reverse in non-slum area.
In very low monthly per capita income grouppercentage of slum population is more than 75 percenthowever, in medium and high income groups the

227
Tab
le 2
: M
ale-
Fem
ale
Rat
io a
mo
ng
dif
fere
nt
inco
me
gro
up
s, T
ang
ra (
Slu
m a
rea)
&N
ark
eld
anga
(N
on
-slu
m a
rea)
Ko
lkat
a, 2
014
Inco
me
grou
pP
opul
atio
n St
ruct
ure
(in
%)
and
Mal
e-Fe
mal
e ra
tio
Tota
lS
lum
Non
-slu
m
Mal
eFe
mal
eSe
x-ra
tio
Mal
eFe
mal
eSe
x-ra
tio
Mal
eFe
mal
eSe
x-ra
tio
Ver
y lo
w49
.05
50.9
510
3948
.44
51.5
610
6451
.02
48.9
896
0
Lo
w48
.66
51.3
410
5448
.18
51.8
210
7550
5010
00
Med
ium
52.0
547
.95
921
53.8
446
.16
857
51.2
648
.74
950
Hig
h53
.34
46.6
687
553
.85
46.1
585
753
.12
46.8
888
2
Ver
y H
igh
52.9
547
.05
888
NA
NA
NA
52.9
547
.05
888
Stu
dy
area
50.2
549
.75
989
49.4
050
.60
1024
51.3
648
.64
946
Sour
ce:
Fiel
d s
urv
ey,
2014
.NA
- Sa
mp
le N
ot A
vai
labl
e
A Geographical View of Demographi of Urban Poor

Life and Living Through Newer Spectrum of Geography228
Tab
le 3
: A
ge-
sex
wis
e d
istr
ibu
tio
n o
f sl
um
an
d n
on
-slu
m p
op
ula
tion
ov
er i
nco
me
gro
up
s, K
olk
ata,
201
3
Per
cap
ita
inco
me
Les
s th
an20
01-
3501
-50
01-
Mo
re
than
gro
up
(in
R
s.)
2000
3500
5000
1000
010
000
Ag
e-Se
xTo
tal
Po
pu
lati
on
TS
76.6
773
.33
30.4
028
.89
NA
wis
e d
istr
ib-
N-S
23.3
326
.67
59.6
071
.11
100
uti
on
of
SM
48.4
448
.18
53.8
453
.84
NA
sam
ple
F51
.55
51.8
246
.15
46.1
6N
Ap
op
ula
tio
nN
-SM
51.0
250
51.2
653
.13
53.1
3(i
n %
)F
48.9
850
48.7
446
.87
46.8
7
0-6
TS
72.4
165
3233
.33
NA
N-S
27.5
835
6866
.67
100
SM
42.8
553
.84
62.5
50N
AF
57.1
546
.16
37.5
50N
AN
-SM
5057
.15
52.9
575
33.3
3F
5042
.85
47.0
525
66.6
7
06 t
o14
TS
72.5
073
.33
38.2
430
NA
N-S
27.5
026
.67
61.7
670
100
SM
44.8
240
.90
53.8
466
.67
NA
F55
.18
59.1
046
.15
33.3
3N
AN
SM
63.6
337
.557
.14
42.8
550
F36
.37
62.5
42.8
657
.15
50

229
15-4
0T
S76
.82
72.5
429
.31
33.3
3N
A
N-S
23.1
827
.46
70.6
966
.67
100
SM
50.9
451
.35
52.9
450
NA
F49
.06
48.6
547
.05
50N
A
NS
M50
5046
.34
5066
.67
F50
5053
.66
5033
.33
40-6
0T
S83
.02
78.3
725
18.1
8N
A
N-S
16.9
821
.63
7581
.82
100
SM
47.7
244
.82
54.5
410
0N
A
F52
.28
55.1
845
.46
0N
A
N-S
M55
.55
5051
.51
66.6
750
F44
.46
5048
.49
33.3
350
>60
TS
73.6
875
36.3
633
.33
NA
N-S
26.3
225
63.6
466
.67
0
SM
57.1
455
.55
500
NA
F42
.86
44.4
550
100
NA
N-S
M20
66.6
757
.14
250
F80
33.3
342
.85
750
Not
e: S
- Sl
um
, N
-S –
Non
-slu
m,
T
– To
tal,
M –
Mal
e, F
- F
emal
e,
NA
- Sa
mp
le
No
t A
vai
labl
e
Sou
rce:
Fie
ld
surv
ey,
2013
A Geographical View of Demographi of Urban Poor

Life and Living Through Newer Spectrum of Geography230
Tab
le 4
: D
iffe
ren
tiat
ion
of
aver
age
fam
ily
size
an
d i
ts a
cros
s in
com
e g
rou
ps,
in
Tan
gra
(Slu
m a
rea)
& N
ark
eld
ang
a (n
on-s
lum
are
a) K
olk
ata,
201
4
Inco
me
grou
p%
of
hou
seho
lds
wit
h av
erag
e fa
mil
y si
ze (
pers
ons
per
hous
ehol
d)A
vera
ge
<2
3-6
7-8
>9
fam
ily
size
SN
-SS
N-S
SN
-SS
N-S
Ver
y l
ow
8.69
33.3
382
.60
504.
3416
.67
4.34
06
Lo
w6.
2528
.57
81.2
542
.86
6.25
28.5
76.
250
5
Med
ium
12.5
38.1
062
.25
23.8
025
38.1
00
04
Hig
h0
42.8
666
.67
57.1
433
.33
0N
A0
4
Ver
y
Hig
hN
A33
.33
NA
66.6
7N
A0
NA
04
Av
erag
e %
o
f7.
2037
.64
74.7
748
.38
5.41
13.9
812
.62
04
ho
use
ho
lds
Not
e:
S- S
lum
, N
-S –
N
on
-Slu
m,
Sou
rce:
Fi
eld
su
rvey
, 20
14.

231
percentage of slum population has been found to belesser than non-slum population, even very high incomegroup 100 percent population are non-slum population.In the slum area the percentage of female population ishigher than male population in very low and mediumincome group, where in non-slum area this percentageis lower in very low monthly per capita income groups.
Average Family Size and its Variation over Slum andNon-slum Area
Family size has been analysed in term of the numberof person per family. Table 4 deals with the variation offamily size in slum and non-slum area according todifferent income group. In very low income groupmaximum slum households (more than 90 percent) arewith family size ranging from three to 6 people perhouse, few slum households also are having 9 personsper family.
Fig. 1: (Ground Reality of slum dwellers)
A Geographical View of Demographi of Urban Poor

Life and Living Through Newer Spectrum of Geography232
In same income group 50 percent and 33.33 percentnon-slum households have registered family size threeto six persons per family and family size less than 2persons per family.
Table 4 further reveals that maximum slum householdsin each income group have registered three to six personsper family, where few slum households of low andmedium income group do have family size less thantwo persons each. Present observation find out thataverage family size is decreasing with the increasing ofmonthly per capita income in both slum and non-slumarea.
Disparity of Literacy rate Between Slum and Non-slumPopulation
It is derived from the Table 5 that the literacy rateof the study area (both slum and non-slum area) is varyingwith the monthly per capita income group. On an averagein the study area more than 70 percent population areliterate but individually 68.01 percent of slum area and83.71 percent population of non-slum area are literate(Table 5).In the slum area highest literacy rate is observedin low income group (75.75 percent) and in non-slumarea highest literacy rate is found in very high incomegroup (i.e. 100 percent population are literate).
Certain variation of male and female literacy rate isobserved in the study area. Both in slum and non-slumarea, the average literacy of male is greater than femaleliteracy rate.
It can be extracted from the table 5 that the percentageof literate population is lower in every income groupsin slum area in relation to non-slum area, which representthe manifestation of providing educational facilities inthe slum and non-slum area. Another fact is that thepercentage of female literate is higher in lower incomegroup, and this rate is decreasing with increasing monthlyper capita income.

233
Tab
le 5
: D
iffe
ren
tial
of
Lit
erac
y r
ate
amon
g d
iffe
ren
t in
com
e g
rou
ps,
Tan
gra
(S
lum
are
a)&
Nar
kel
dan
ga
(No
n-s
lum
are
a) K
olk
ata,
201
4
Inco
me
grou
pLit
erac
y ra
te (
%)
Tota
lS
lum
Non
-Slu
m
TM
FT
MF
TM
F
Ver
y l
ow
63
.49
45.8
454
.16
64.7
847
.82
52.1
778
.05
43.7
556
.25
Lo
w76
.33
5347
75.7
556
4481
.81
44.4
555
.55
Med
ium
77.7
060
4062
.22
57.1
442
.86
83.4
959
.30
40.7
0
Hig
h87
.50
6040
63.3
657
.14
45.4
693
.10
55.5
544
.45
Ver
y
Hig
h10
062
.25
37.7
5N
AN
AN
A10
062
.25
37.7
5
Av
erag
e73
.25
54.5
045
.50
68.0
152
.48
47.5
283
.71
54.0
545
.94
Not
e: T
- To
tal,
M-
Mal
e, F
- F
emal
e,
Sou
rce:
Fie
ld
surv
ey,
2014
A Geographical View of Demographi of Urban Poor

Life and Living Through Newer Spectrum of Geography234
Disparity of Work Force in Slum and Non-slum Areain Accordance of Monthly Income
Table 6 shows the discrepancy of work force amongslum and non-slum area in respect to different incomegroup. In the very low income group out of total workforce (67.14 percent of total population) only 54.61 percentare employed remaining are unemployed. Percentage ofemployed person increases with increasing per capitamonthly income. Though the percentage of workingpeople is slightly low in very high income, because peoplebelongs to 14 to 24 years old in this group are engagein their study, as their family income is high in respectto other income group, they have less obstacles to readthan others.
Table 6 also depict the nature of variation of workforce in slum and non- slum area individually .In thevery low income group out of total work force (67.14percent of total population) less than 50 percent areemployed of the slum area, where in the same incomegroup in non-slum area more than 75 percent of totalwork force are employed.
The percentage of employed increase with increasingof monthly per capita income both in slum and non-slum area though the rate of increasing employed personwith increasing monthly per capita income is higher innon-slum area than slum area.
It can be derived from the Table 6 that slum peopleget less work to lend their life, which can be detectedfrom their low standard life style in relation to non-slum people. The table also derived the biasness ofgovernment to assign work to slum and non-slum people.The low rate of unemployment in the slum area may beassociated with less participation of female worker forearning. Dr. Venkatarayappa pointed out a statement inher book in relation of women work participation. Aman, head of a family had rightly stated that “I don’twant my daughter for work; I would rather starve, but

235
Tab
le 6
: D
egre
e of
dif
fere
nce
of
emp
loy
men
t ra
te a
mo
ng
in
com
e gr
ou
ps
of
slu
m a
nd
non
-slu
m p
op
ula
tio
n,
Tan
gra
(S
lum
are
a) &
Nar
kel
dan
ga (
No
n-s
lum
are
a) K
olk
ata,
201
4
Mon
thly
per
cap
ita
inco
me
grou
pV
ery
low
Low
Med
ium
Hig
hV
ery
high
Ave
rage
Wo
rkTo
tal
Po
pu
lati
on
210
150
171
4517
593
par
tici
pat
ion
(35.
41)
(25.
30)
(28.
84)
(75.
89)
(2.8
7)(1
00)
Wo
k fo
rce
(%)
67.1
466
.66
65.5
064
.44
58.8
266
.10
Em
plo
yed
(%
)54
.61
6465
.17
68.9
760
61.4
7
Un
emp
loy
ed (
%)
45.3
936
34.8
331
.03
4038
.53
Slu
mP
op
ula
tio
n16
1(47
.91)
110(
32.7
3)52
(15.
48)
13(3
.86)
NA
336(
56.6
6)
Wo
k fo
rce
(%)
68.9
468
.18
59.6
161
.53
NA
77.3
1
Em
plo
yed
(%
)47
.74
54.6
667
.74
62.5
NA
53.3
3
Un
emp
loy
ed (
%)
52.2
645
.34
32.2
637
.5N
a46
.67
No
n-S
lum
Po
pu
lati
on
49(1
9.07
)40
(15.
56)
119(
46.3
0)32
(12.
45)
17(6
.61)
257(
43.3
3)
Wo
k fo
rce
(%)
61.2
262
.50
68.0
665
.62
58.8
264
.98
Em
plo
yed
(%
)80
9264
.19
71.4
270
72.4
5
Un
emp
loy
ed (
%)
208
35.8
128
.58
3027
.55
Sou
rce:
Fie
ld
surv
ey,
2014
A Geographical View of Demographi of Urban Poor

Life and Living Through Newer Spectrum of Geography236
Tab
le 7
: D
iffe
ren
tial
of
occ
up
atio
nal
co
mp
osi
tio
n a
mon
g d
iffe
ren
t in
com
e gr
ou
ps,
Tan
gra
(S
lum
are
a) &
Nar
kel
dan
ga
(No
n-s
lum
are
a) K
olk
ata,
201
4
Mon
thly
per
cap
ita
inco
me
grou
pV
ery
low
Low
Med
ium
Hig
hV
ery
high
Ave
rage
Lab
ou
rer
(%)
Tota
l40
.25
255.
475
021
.57
Slu
m54
.84
7510
025
NA
65.3
8N
on
-Slu
m45
.16
250
750
34.6
2
Van
/R
ick
shaw
Tota
l9.
1010
.93
9.60
100
9.54
pu
ller
(%
)Sl
um
85.7
171
.42
42.8
510
0N
A60
.87
No
n-S
lum
14.2
928
.58
57.1
40
039
.13
Dri
ver
(%
)To
tal
11.6
817
.18
12.3
30
14.2
812
.45
Slu
m66
.67
63.6
455
.55
0N
A60
No
n-S
lum
33.3
336
.36
45.4
50
100
40
Bu
sin
ess
(%)
Tota
l3.
1014
.06
23.2
855
42.8
617
.84
Slu
m33
.33
33.3
311
.76
27.2
8N
A20
.93
No
n-S
lum
66.6
766
.67
88.2
372
.72
079
.07
Go
ver
nm
ent
Tota
l5.
199.
3712
.32
1514
.28
9.54
Em
plo
yee
(%
)Sl
um
2533
.33
11.1
10
NA
17.4
0N
on
-Slu
m75
66.6
788
.89
100
082
.60
Oth
ers
(%)
Tota
l29
.87
23.4
436
.10
1528
.57
29.0
5Sl
um
95.6
580
22.2
233
.33
NA
58.5
8N
on
-Slu
m4.
3520
77.7
866
.67
041
.42
Sou
rce:
Fie
ld
surv
ey,
2014
.
237
not allow her who has come of age to go and workwith others (Venkatarayappa, 1972). From this statementthe mental set up of male dominating society is comingout.
Occupational Composition Over Slum and Non-slumArea
It is derived from Table 7 that occupationalcomposition of both slum and non-slum area is varyingwith the monthly per capita income. It is evidential fromthe study that on an average more than 20 percent peopleare working as day labourer out of which 65.38 percentare belongs from slum area. Considering the occupationof business and government employee it is observedthat maximum occupant are belongs from non-slum area.
The table 7 revels that in the very low income groupmain occupation of maximum residence is day labourand maximum of day labourer in this group belongsfrom slum area, where few people engage as van/rickshaw puller, driver, business and other occupation.Population in low income group whose occupation isother than day labour belongs from non-slum area.Another fact noticed from the table that maximum peopleengage in business, government job belongs from non-slum area. Considering the high and vary high incomegroup it can derive that people of these income groupare engage in the occupation of business, governmentjob and other respective occupation.The manifestationof occupational composition between slum and non-slumarea is the evident of manmade socio-economicdifferentiation of present day world. Because of theirbirth place and living place, slum people are facingdifficulties to get good job, this is the social law createdby the dominating(called upper class) unsocial peoplefor the poor(to whom direct or indirectly they depends)of urban area that.
A Geographical View of Demographi of Urban Poor

Life and Living Through Newer Spectrum of Geography238
Conclusion
Different demographic indicator, such as family size,age-sex ratio, literacy pattern, work force, occupationalcomposition evident the distinction of demographicphenomena between slum and non-slum area. Therelationship between standard of living and monthly percapita income has properly understood from the forgoingdiscussion.
The study derived many problems faced by the urbanpoor such as- monthly per capita income of slum peopleis lower than non-slum people, it can be noticed fromthe absence of slum people in the very high monthlyper capita income group and much concentration of slumhouseholds in very low monthly per capita income group.The overall percentage of male population of slum areais lower than female population, which have direct impacton the monthly per capita income (as female dependencyration to male is very high in slum area). Maximumslum people live with difficulty sharing number of peopleonly a single room. They have no privacy, they have tolive in un-healthy indoor environment .In the other handexcept very low per capita income group, people of otherincome group in the non-slum area live more or less inhealthy and peaceful indoor environment with keepingtheir privacy. The literacy rate of slum area (63.01 percent)also is not good in relation to average literacy rate (73.25percent)but the average literacy rate is non-slum areais more than 80 percent. In the same way the educationalstatus of slum people also is not too good. But in non-slum area (83.71 percent) the educational status isrelatively high to slum area. In slum area out of totalwork force less than 50 percent are employed where inthe non-slum area more than 80 percent work force areemployed. This scenario derived the obstacles to earnsufficient monthly per capita income in slum area.Occupational composition statistics revels that maximumslum dwellers have low grade work (day labour, Rickshaw

239
puller etc) where non-slum dwellers have relatively highgrade work (business, Government Employee etc).
The fact derived from the analysis is that beforeaccusing slum dweller for the birth place of crime andfor acting as an obstacles to urban development oneshould remember about their miserable livelihoodcondition, this miserable condition make them to do thosethings. The study revealed that the slum people are notsocially marginal but under estimated, not economicallyweaker but created.
It is the government and others well do social groupsresponsibility to get back the slum dwellers into themain stream of society which that they can act as humanresources other than the obstacles of society. To achievethis situation first of all educational facility should beprovided to them. Employment generation is anotherfact which can be used as a tool to improve theirlivelihood. Besides that others non-governmentalorganisation with others educated people should takeimportant part for the improvement of slum dwellers. Ifthe awareness of family planning can be reached to themthen most of demographic problems can be resolved.Finally it can be said that the changes of mental set upof slum dweller (i.e. we are slum dweller) is badlyrequired for their improvement. According to Shelar slumare not only the inevitable, they are a mark of successof a city.
References
Shelar, S. K. (2013), Urban Settlement, Chandraok Prakashan,Kanpur, India
Desia, Vandana. (1995), Community Participation and Slum housing:A study of Bombay, Sage Publication, New Delhi, India
Venkatarayappa, K. N. (1972), Slums (A study in Urban Problems),Sterling Publication, New Delhi, India
Rahman, Maseeh. (2013), India’s Slumdog census reveals poorconditions for one in six urban dwellers, The Gurdian,
A Geographical View of Demographi of Urban Poor

Life and Living Through Newer Spectrum of Geography240
Delhi 22nd March, 2013, http://www.guardian.co.uk/world/2013/mar/22/india-slumdog-census-poor-conditions,(accessed on 16.07.2012).
Bose, Ashish (1995), Urbanisation and Slums, Roy, P and DasGupta Shangon (eds), Urbanisation and Slums.
Deshpande, Vinaya. (2011), ‘Slums in India – A statisticalcompendium 2011’ in The Hindu, (News Paper) Mumbai,October 15, 2011, Retrieved from http://www.thehindu.com/news/national/every-eighth-urban-child-in-india-lives-in-slum-report/artic le2541052.ece,(accessed on 15.07.2013).
Premi, M.K(2009), India’s Changing Population Profile, NationalBook Trust, India.
Nair, Bin. (2009), Water Aid India, Retrieved from http://www.indiawaterportal.org/sites/indiawaterportal.org/files/UrbanisationWatSan_WaterAid_India.pdf, (accessed on 6thJune 2013).
Sarkar, Punyabrata (2012), An Impact Evaluation Study of BSUPProgramme Intervening in Kolkata Metropolitan Area,KMDA, Kolkata.
Mandal, R. B. (2007), Urban Geography, Concept Publication,New Delhi.
Un-Habitat (2003), The Challenge of slums, Global Report onHuman Settlement, London: Earthscan Publications Ltd.
Primary Census Abstract for Slum, 2011, Office of the RegistrarGeneral & Census Commissioner, New Delhi, India
Govt. of West Bengal (2013) Some Characteristics of Urban Slumsin Kolkata (Report).

241
14The Handloom Industryand its Gender Dimension:A Study in Assam
Nazneen Akhtar
ABSTRACT
Handloom weaving has an overwhelmingpresence in thesocio-economic life of Assam since timeimmemorial. The largestconcentration of women weavers in the country not onlyunderlines the prominence of this sector in Assam but alsolends to it a significant gender dimension. However, the currentonslaught of globalisation and liberalisation in the countryhas infused competition in the recent years with a severeimpact on the women weavers of the State. The present paper,therefore, tries to explore the role of women weavers insustaining the handloom industry of Assam, the nature ofgender relations within the weaver households and the impactof the New Market Economy on the women weavers andtheir gender relationships in the family and in the society.Thestudy is based on both primary and secondary data collectedthrough field surveys, govt.reports from institutions likeMinistry of Textiles, Govt. of India etc. The results showthat improvement in the weaving sector in the manner ofcontinued employment for women will lead to a more equitablegender situation. Lossof income will adversely impact theirgender relations in the family and society.
Keywords: Globalisation, Gender Relations, Handloom.
The Handloom Industry and its Gender Dimension

Life and Living Through Newer Spectrum of Geography242
1. Introduction
Indian society commonlyis considered to be highlycentralized and patriarchal.Women’s control over anduse ofeconomic resources remains mysteriouslydisconnected from gender norms thatsubordinated womento men in other arenas.Women’s participation in thenational economy has, in fact, been recognized as oneofthe most difficult aspects of women’s lives to integrateinto a patriarchal model thatdepicts women as perpetualminors under the tutelage of fathers and husbands.However, presentresearches on women’s economic rolesdomore than change our vision of women; it forces usto reconsider our view of Indiansociety itself. Women’scommercial activities, both independent from men andin jointventures with them, defy division of society intoseparate gendered spheres—thesupposedly private,domestic world of women and the public, and theeconomically driven worldof men. A perfect example tothis is the case of women weavers in the handloomindustry of Assam.
1.1 Women in Handloom Industry
Handloom sector has been the mainstay of ruralindustrialisation in India. Modern textile industry hasgrown on the foundations of this sector, throughmechanization and modernization. However, a uniquefeature of this sector is that it is the only manufacturingsector wherein one finds large number of womenproducing products which are worn by large number ofwomen; in other words, women producing for women.In fact, women weavers have been the principalstabilisation force through years of crises and problemsfor the handloom sector.
According to the Third National Handloom Censusof weavers and allied workers, 2010, work participationin handloom activity for India as a wholeis dominatedby females. Nearly 29.98 lakh (77.9%) of the total adult

243
handloom workers are female, of which a huge majority(88.2%) resides in rural areas. Besides this,the dominanceof female weavers in the total weavers’ workforce ishighest in the North-Eastern states, where it is 99 percent.
Handloom weaving has an overwhelmingpresence inthe socio-economic life of Assam since timeimmemorial.The loom is a prized possession and hasbeen a way oflife in the state. Assam has the largest concentration ofweavers in the country, of which 1388637 are adult femaleweavers (NCAER Report, 2010). This not only underlinesthe prominence of this sector but also lends to it asignificant gender dimension.
2. What the Literature Says
The breadth of women’s commercial activities has,indeed, attracted the attention of numerous researchscholars over the years. This has not only increased ourknowledge about the kinds of economic activities in whichwomen participated, but also, as a collective body ofscholarship, has shown the universal character of women’sinvolvement in the Indian economy. The entire handloomindustry of Assam pivots round the performance of thefemale weaver and it is for her that the industry stillthrives. It is the women weavers who are to be creditedfor preserving the state’s heritage by laboriously producingtextiles by hand.
However, at present, the changing economic scenarioand the removal of trade barriers have led economists,planners, administrators and others to fear that thesewomen working at the looms will be slowly wiped outof employment with the full onslaught of globalisation.TheReport of the Sub-Group on Economic Empowerment ofWomen states that, “Post Globalisation women are likelyto be rendered jobless in traditional sectors like farming,textiles etc........” (Begum, 2009).
The Handloom Industry and its Gender Dimension

Life and Living Through Newer Spectrum of Geography244
Similar studies across the world have also providedgainful insights into this significant dimension. Devi (2012)in her paper has tried to explore the lives of Manipuriwomen weavers who have expressed their feminism inan essentially patrilinealculture by aiming for self-reliance,being financially active and collectively powerful throughtheir weaving activity. But recently, these weavers arefacing conflict and compromise due to changes in themarket structure and growing competition.
Bortamuly and Goswami (2012) in their paper greatlyextendour understanding of the wage earnings scenarioin Assam’s handloom sector fromgender perspective. Theremoval of import quota restriction for textile productsopened up newavenues and challenges for the Indianhandloom industry, which infused competitionin recentyears. As majority of the workers in the industry arewomen, who work mostlyas weavers, reelers and helpers,such competition often influences the nature andpatternof earnings of women workers.
Goswami (2006) also attempted to analyse the impactof globalisation of silk industry in NE India from genderperspectives. He analysed that the process of globalisationof the industry although generated economic gains fromrapid growth of export, the negative aspects such asinadequate healthcare, education, training and creditfacilities are a few problems that deprived mostly womenworkers involved in this industry.
Jayaweera (1999) in his study of women workers ingarment and textile industries in Sri Lanka has givenuseful insights into the economic and gender specificfactors that have contributed to continuity and changein the lives of these workers and their families. It isfound that the quality of employment available to womenas a consequence of macro-economic reforms hasdeteriorated and that women in low incomefamilies haveborne a disproportionate share of the burden of‘adjustment’ to reforms.

245
3. Need for a Study
At this critical juncture, when trade barriers havebegun tocollapse and markets of the globe are mergingtogether, the haunting question is will the labourers ofyesterday’s skills be able to reap benefits today. If thissituation continues, Assam’s great strength of havingthe largest women handloom workforce in the countryis likely to be reduced to a glaring weakness. Hence,need is to document the actual state of handloom industryin Assam with particular reference to these womenweavers.
4. Study Area
Kamrup, the capital district of Assam bifurcated intoKamrup metro and Kamrup rural occupies its own placeof pride in the handloom sector in Assam. Apart fromthe urbanweaving centres of Sualkuchi, Guwahati, Rangiyaand Palashbari, there exists weaving concentrations inalmost all the 17 Development Blocks of the district.Out of the 1.26 million weavers (11,66,025) of the State,12.85 percent accounting for 1,61,895 weavers live inKamrup only. Women comprise 91.13 percent of theweavers here with a strength of 1,47,543 (Begum, 2009).
Weavers in Kamrup either work at home or areemployed in small manufacturing units. However, thetrend towards commercialisation in urban Kamrup unitsattracts young weavers from rural areas and less industrialdistricts like Nalbari, Darrang, Sonitpur, North Lakhimpuretc. in search of a living.
5. Objectives
i. Toanalyse the nature of gender relations in theweaver families; and
ii. Toassess the impact of New Market Economy onthe women weavers and their gender relationshipsin the family and society.
The Handloom Industry and its Gender Dimension

Life and Living Through Newer Spectrum of Geography246
6. Database and Methodology
It is based on empirical view substantiated by bothprimary and secondary data obtained through field visits,project reports, government documents etc. fromDepartment of Handloom and Textiles, Directorate ofSericulture, Govt. of Assam.
The study is based on the findings of an intensivesample study of 100 samples of weavers in KamrupDistrict (both rural and urban). Participatory RuralAppraisal (PRA) exerciseswere conducted. Semi-structuredinterviews, focus group discussions and questionnairesurveys were carried out among the sample units.
7. Results and Discussion
7.1. Weaving scenario in the state of Assam
Traditionally weaving is a household activity for everywoman in Assam. According to tradition, the skill toweave was theprimary qualification of a young girl for
Map not to scale

247
Tab
le 1
: N
um
ber
of
Ad
ult
(18
Yea
rs &
Ab
ov
e) H
and
loo
mW
ork
ers
in A
ssam
by
Gen
der
(20
09-1
0)
Ass
am
(Loc
atio
n)
Tota
l A
dult
wor
kers
Adu
lt
wea
vers
Adu
lt a
llie
d w
orke
rs
Mal
eF
emal
eTo
tal
Mal
eF
emal
eTo
tal
Mal
eF
emal
eTo
tal
Ru
ral
1525
314
4388
714
5914
012
641
1366
176
1378
817
2612
7771
180
323
Urb
an15
824
566
2472
412
222
461
2258
336
2105
2141
Tota
l15
411
1468
453
1483
864
1276
313
8863
714
0140
026
4879
816
8246
4
Sou
rce:
Han
dlo
om
C
ensu
s o
f In
dia
, N
CA
ER
, 20
09-1
0.
The Handloom Industry and its Gender Dimension

Life and Living Through Newer Spectrum of Geography248
her eligibility formarriage. This perhaps explains whyAssam has thelargest concentration of handlooms andweavers in India (Phukan, 2012).
7.2. Weaving and Gender Relations
Sexual discrimination of labour is at the root of genderimbalance in the family and therefore, in society. Societyburdens women with three major roles- productive,reproductive and managerial but entrusts men with onlytwo: productive and managerial. Therefore, to analysethe nature of gender relations within the families of thewomen weavers, it becomes necessary to examine theextent of this sexual discrimination of labour in the family.
7.2.1 Performance of household chores
Table 2. Sharing of Household Chores in WeaverFamilies (Percentage)
Area By husband By female By hired By weavers Totaland other family help themselves
male family membersmembers
Rural 4.67 30.33 - 65.00 100
Urban unmarried 5.1 3.99 0.49 63.00 100
Urban married 20 6.66 6.66 66.66 100
Source: Field survey, 2012.
In rural areas, 65 percent of the weavers have toperform all the household chores. A mere 4.67 per centof the rural weavers are assisted by their husbands orother male members in the family which indicates amarked sexual discrimination of labour.
Of the 30 percent of urban weavers who are married,husbands or hired help to almost 20 percent of themprovide relief, thereby, indicating a lesser degree of sexualdiscrimination in the family.

249
7.2.2 Child Rearing
Table 3: Sharing of Child Rearing Responsibility(Percentage)
Area By husband By female By hired By self Totaland other family help
male family membersmembers
Rural 7.33 41.81 Nil 50.86 100
Urban 14.81 22.22 7.41 55.56 100
Source: Field Survey, 2012.
Half of the married female weavers in rural areasare fortunate enough to be able to devote themselves totheir work as their children are looked after by theirimmediate or extended family while only 7.33 percentare helped by their husbands. On the other hand, 14.81percent of weavers share their responsibility of childbearing with their husbands in urban weaver households.
7.2.3 Family Decision-making
Table 4: Level of Participation in Family Decision-Making (Percentage)
Area Always Never Sometimes Total
Rural 86.33 0.67 13.00 100
Urban 85.00 - 15.00 100
Source: Field Survey, 2012.
It is observed that an increase in the weaving incomeled to greater levels of participation in household decisionmaking. In other words, if the women weavers contributedto food, education and child-upbringing, they could havea better say in the family.
Thus, weaving as a livelihood provided the womenweavers of Assam an opportunity to hold on to an
The Handloom Industry and its Gender Dimension
Life and Living Through Newer Spectrum of Geography250
enhanced economic and social position in the familyand the community.
7.3 The impact of New Market Economy on the womenweavers
As women have not been a specific target of macro-economic policies and adequategender disaggregated datais not available, it is difficult to identify clearly theirimpacton women. However, international and crosscountry studies (Jayaweera, 1999; CENWOR, 1995)indicatethat the quality of employment available to women asa consequenceof these macro-economic reforms hasdeteriorated and that women in low incomefamilies haveborne a disproportionate share of the burden of‘adjustment’ to reforms.
One of the immediate consequences of marketliberalization is the collapse ofsmall local industries whichhad been protected earlier and cannot compete nowwithcheaper and better quality imports. Similar is the caseof the women weavers of Kamrup district of Assam whoare now struggling hard to sustain their livelihood inthe wake of current scenario of macro-economic reformsin the country. The Report of the Working group onWomen Empowerment for the Tenth Plan hinted at theloss of jobs for the women weavers in this quota-freeregime.
Women weavers contribute towards a major share offamily income in the weaver households. Moreover, itis the weaving income of the women that sustains thefamily during the regular monsoon floods spanning 4-6months and lean agricultural season of a further 2 months.
Therefore, a loss of jobs of the women weavers mayresult in the declining share of contribution to the familyincome. If this happens, the traditionally feminineoccupation of weaving which once gave them aheightened status in society, would fail to provide them

251
this requisite position. This will in turn lead to declinein the established set of gender relationships in the family.
Table 5: Proportion of Weavers’ Contribution toFamily Income
Area Upto 25 % 25-50% 50-75% 75-100% Total
Rural 14.22 48.78 11.33 25.67 100
Urban - - 59.52 40.48 100
Source: Field Survey, 2012
8. Recommendations
Women weavers need to be enabled to keep oncontributing to their family and the rural economy toprevent deterioration in the gender relationships in thefamily and consequently in the society. Trade policiesare accentuating the imbalance in man-womenrelationships onproduction floor, against the women.Textile modernisation excludes women from the valueaddition roles and reducestheir role to routine tasks whichsuggests a kind of deskilling. Cost competition, a resultof trade policies, burdens the women workforce intermsof increasing the number of working hours, decrease inwages, increasingstress and decrease in access to qualityworking facilities.
Steps therefore, are needed to be taken urgently toprevent this from happening.
Specific programmes and policies have to bedeveloped for women in handloomsector. Theseprogrammes should aim at providing continuousemploymentthrough special budget allocations.
Women should get identity cards, artisan creditcards and insurance coverage.
Exclusively for women, handloom cooperativesocieties have to be established.
The Handloom Industry and its Gender Dimension

Life and Living Through Newer Spectrum of Geography252
Hank yarn should be supplied to women throughwomen cooperatives and groups.
Overall, there should be technology upgradation,efficient organisational structure and marketingstrategy, and particular emphasis on the needsand aspirations of women weavers of the areathrough research and development.
9. Conclusion
Weaving, as a livelihood, provides a large numberof women in Assam with access to income enabling themto make a significant contribution to their family andpaving the way for their economic as well as socialempowerment. This impacts gender relationship in thefamily and community in their favour. However, withthe liberalisation of market,the issue now is how tosafeguard small andvulnerable sections from the big andstrongsegments. If no adequate attention is paid to thisproblem of rising competition and change in marketstructure, women weavers are sure to face huge loss inweaving income which will adversely affect their positionin the family and society.Therefore, the weavers shouldbe motivated enough to abandontheir old concepts ofself-sufficiency and their outdated loom technologytocreate a wider market. The implementation of atechnologypolicy, if any, should be carefully monitoredto ensure continued employmentfor these women weaversof Assam.
10. References
Begum, R. A. (2009). Dreams that women weave. Assam: DibrugarhUniversity.
Bortamuly, A. B., & Goswami, K. (2012). Factors influencing wagestructure of Handloom workers in Assam. Journal of RuralDevelopment, 31 (2), 139-150.
CENWOR. (1995). Structural Adjustment and women, The Sri LankaExperience. Colombo.

253
Devi, C. V. (2012). Exploring the Lives of Manipuri’s womenweavers. Indian Journal of Gender Studies, 19 (1), 31-55.
Goswami, K. (2006). Impact of Globalisation on silk industry in NorthEast India: An assessment from gender perspectives. RetrievedMarch 20, 2014, from http://faculty.washington.edu/karyiu/confer/beijing06/papers/goswami.pdf
Jayaweera, S. (1999). Continuity and change: Women workers ingarment and textile industries in Sri Lanka. Colombo: Centrefor Women’s Research.
NCAER. (2009-10). Handloom Census of India. Govt.of India, Ministryof Textiles.
Phukan, R. (2012). Handloom Weaving in Assam: Problems andProspects. Global journal of Human Social Science, 12 (8),17-22.
The Handloom Industry and its Gender Dimension

Life and Living Through Newer Spectrum of Geography254
15Health Problems of Lock IndustryWorkers: A Case Study of AligarhCity in Uttar Pradesh
Nida Fatima & Razia Bano
ABSTRACT
In general, when any discussion have taken place on smallscale industry workers health conditions remain untouchedby planners and academicians. The small scale industry havingsmall space poor ventilation and ill management leads severalhealth problems. Health of workers play very significant rolein enhancing efficiency and productivity of industry. The labourintensive small scale industry absorbs the bulk of labour andmakes them skillful. Small scale industry although play keyrolein economic development of India and provide ampleopportunity to earn livelihood of lakh of artisans. SSI has adynamic characteristic of employment generation because itinvolves the intricate manner of manufacturing. In India,total numbers of SSI units are 311.52 lakh and which employed732.17 lakh work force of India and contribute 8% of GDPof India. But workers of small scale industry are sufferingwith major diseases which need to raise the concern of plannersand academicians. As many district of Utter Pradesh got asymbolized specialty in their art and craft for example- Silksari of Varanasi, Brass work of Moradabad, Bangles of

255
Firozabad, carpets of Bhadohi, Chicken works of Lucknow,Aligarh is also well renounced over the world market for itslock industry. It is household and labour oriented industryprovides means of earning of depressed class of society inAligarh.The Present paper is an attempt to analyze the health conditionof workers of lock industry. Data has been collected fromprimary survey, for which questionnaire have filled throughrespondent in October 2013. Survey has been covered 1.5%household of lock industry workers in 70 wards of Aligarh.The main objective behind this study are the body systemaffecting workers of lock industry in Aligarh, their economiccondition meanwhile this study also discussed the cause ofthese problems and suggest the remedial measure to overcomethe health problems of industry workers.
Introduction
Health and productivity of workers are expected tobe highly correlated. The better the health condition ofa worker, it is likely that the higher his/her productivityand vice versa. The workers of the unorganized sectorare mostly uneducated and have nothing to sell in thelabour market except their services as a labour. Thereforea a good health condition is important for them, as theyhaving the long hours of working in the hazardouscondition without any security because the lock industryin Aligarh city are un organized and does not followany rules and norms which had government form forthe security of labour and due to poverty and illiteracythe workers are unfair about that. It is well said, healthis wealth. It is health which enables the worker to gothrough his work & complete it in time cheerfully. Ifworkers health is good, they can work with full capacityand efficiency. It helps to increase the production andprofit of the organization. Then the organization canprovide better wages & other welfare facilities to theworkers. Thus employees’ welfare, health and safetymeasures are related with each other. Hence, every
Health Problems of Lock Industry Workers

Life and Living Through Newer Spectrum of Geography256
organization should take care of employees’ health byproviding proper safety measures.
An industrial accident may affect the working capacityof the worker. Some workers may become permanentlyhandicapped. Accidents affect the industrial productivitywhich in turn affects the economy. A company, in whichaccidents are frequently occurring, create poor image inthe public eye. An employer has to pay large amount ascompensation. It increases costs of industry resulting fromthe separation of the disabled worker. If the workerdisabled is highly skilled and experienced one, this lossis greater. Injured worker can’t work with full capacity.It also affects his family. The factories Act, 1948 laysdown certain provisions of safety and health of theworkers to be adopted by the factories. Whenever anaccident occurs it gives rise to pain for the victim andhis family and retards industrial productivity which inturn affects the economy of the country. It results in thefinancial loss for the employees and the employer andlarge payments by the later in the shape of compensation.
Conceptual Framework
Healthy people constitute the healthy nation. Healthwould be that level which would enable the individualto live life to the fullest. Health is the ability of thebody to sustain adaptive effort to employ body power,vitality and ability to resist fatigue. Health is sometimeconsidered the total outcome of organic, neuro-muscular,interpretive and emotional development”. Health isessential a sub domain of physical, mental and socialhealth. The capacities or limitations of an individual inrelation to his working and occupation to that desiretarget play an important role in promoting physical, social,and mental health. Vocational health emphasis upon theproblems of lively hood and ensure the fulfillment ofeconomic needs of an individual (Ajmer singh at .al 2003).According to WHO: “Occupational health should aim at
257
the promotion and maintenance of the highest degree ofthe physical, mental, and social wellbeing of workers inall occupations. The preventions among workers ofdepartments from health caused by their workingconditions; The protection of workers in their employmentfrom risk resulting from factors adverse health; the placingthe maintenance of the workers in an occupationalemployment adopted to his physiological andphysiological equipment and to summarize, the adaptionof work to the man and of each man to his job”. (A.K.Shrivastavam 2001) Having a healthy body is consideredto be great importance of an individual from theprofessional point of view of society, too, the remaininghealth of an individual is considered to be important,because if a person is sick or disease affected, he canpose a risk for the society, directly or indirectly. Healthhas been accepted as of great importance for the countryand the society for the sake of development for thecountry,for ones’s own self and professional progress.Man has to face many problems in modern age. Modernman has become the victim of many complex problems.He has to face difficulties at every step and these problemmay be physical, emotional, social, political or any othertype; but they effect the man and he become the victimof physical and emotional disturbance”. (S.Dheer andMitra Basu 1984)
Literature Review
The review of related literature is an important pre-requisite to actual planning and execution of any researchwork. A review of literature on the research topic makesthe researcher familiar with the existing studies.Enhancement of health is a crucial part of development.Health condition of workers and economic prosperityare directly related to each other. Better health, alsocontributes directly to economic growth as it reducesproduction losses on account of illness of workers or,
Health Problems of Lock Industry Workers

Life and Living Through Newer Spectrum of Geography258
potentially, also in terms of higher work productivityfor healthy workers.
Kapil R.C Thakur(2007) conducted study on the HealthStatus And Health Awareness Among Employee Workingin Sant Gadge Baba Amarvati University and find outsthat the most of the employees working in this placewere grieved by many muscle- skeleton other diseases.And Employee showed the negative expression abouttheir health. Saastamoinen et al.(2006) examined that theeffects of pain on employees, health related by bodilylocation of pain, number of painful location and whetherpain was acute or chronic. K. R. Nayar, (2007) statedthat Poverty and social exclusion are important socio-economic variables which are often taken for grantedwhile considering ill-health effects. Social exclusion mainlyrefers to the inability of our society to keep all groupsand individuals within reach of what we expect as societyto realize their full potential.
Aligarh Lock Industry
Lock Industry in Aligarh having a interestinghistory.In1870, a gentle man established a firm Johnson andCompany to import locks from England for sale inAligarh. And in 1930 Johnson and Company and smallscale units started manufacturing locks sheet metal byduplicating Germans lock. The lock industry of Aligarhis over is over a hundred year old and considered to betraditional occupation of the people (Burra 1995: 55).Areal development of the lock industry in Aligarh startedin 1926 when the Government of the country establisheda metal work shop to train the artisans in lock makingand today the locks of different types aremanufacturedinAligarh, sent to different areas in thecountry and exported to many countries of the world.Thepresent annual turnover of lock industry is estimatedaround Rs.450 crore in 2006. On an average, a workercan produce 3 to 4 Locks per day and receive a salary
259
of about Rs35 to 60, which are engaged in different processsuch as mould, welding, assembling etc(www.aligarhlockindustry.com). The lock industry in Aligarh city mainlycomes under small scale and cottage sectors a large partof it comprises house hold units and they are largelyunorganized or unregistered. In Aligarh lock industrieslocks are made up of both by the traditional and modernmethods. Lock industry gives the employment not onlythe male but female and children also .Nearly about2lakh people are associated, directly or indirectly, withatlaest 5,000 lock manufacturing units, majority of artisansin this industry are Muslims where as ownership of bigmanufacturing units and household units are both Hinduand Muslim . Muslim artisans manufactured 80% of thelock of Aligarh (cited in Saha 2006: 216).
Product Range
Cameo Locks
These types of locks are available in various sizesranging from 10mm to 25mm and various materials likebrass, steel, chromium plated, galvanized etc. the differenttypes of locking system made are; double L Triple Locking,Master Locking, Lock and Trip locking withinterchangeable keys etc. these Locks have a verticallysliding shackle with chromium plating to avoid rusting.They usually have 7 lever systems with flat keys.
Trick Lock
Trick locks are available in 50mm to 70mm sizes,and have levers made pf pure brass and iron shackles.They are called trick lock because they have a specialtype of pad lock with moveable hold plate and trickyarrangement that can be operated only by a knownperson.
Excise Lock
It is a marvelous high security lock with triple
Health Problems of Lock Industry Workers

Life and Living Through Newer Spectrum of Geography260
arrangement to avoid outer sealing. The inbuiltarrangement provides high security and can be madeonly by experienced crafts men. These locks have a doublelocking mechanism with cautions and warming seal-breaking mechanism.
Export Locks
Export locks are wonderful designed for ease andcomfort couple with high security mechanism. They areavailable in antique style and finish and attractive design.Door locks in pure brass and in milt steel are availablewith ordinary models to high tech, trick and bell securitysystems.
Elmira Lock
Elmira Locks are available in pure brass from 50mmto 75mm.
Drawer Lock
Drawer locks are available in pre brass in 50mm to70mm sizes with duplicate key sets.
Use of technology in making locks
There are two type of mechanism use in making lock
Lever mechanism
Pin Cylinder mechanism
The key inserted in the key slot and then rotated toshift the bolt in a locking or unlocking position whilerotating the key some detainer (level/ pins) are providedin pre-arranged position to restrict the movement of thekey, if it is not designed to function in that particularlock. This lever/pin with specific thickness and profileare pressed down with the help of springs. The key isprovided with specific slot on its blank face so that itcan rotate in the lock with that specific combination oflevers/pins to operate locking bolt. The quality of locks

261
depends on the selection of material of different part towithstand environment conditions, mechanical propertiesand precision to achieve the required result for a longertime.
Locking or unlocking the spider shifts and spiderneedle passes through the gate of lever. The clearancebetween the gate and the needle decide the quality oflocks. If it is more the quality of lock is considered bad.Since this can allow the lock to operate with anotherkey. When the clearance is précised lock can be operatedonly with its own key. Reena lock has the privilege ofproviding optimum clearance to achieve this quail.
Objectives of the Study
To highlights the health problems of workers inlock industry.
To discuss the diseases, mostly found in the lockindustry workers.
To discuss the causes of the health problems.
To suggest the remedial measure to sort out theirproblem.
Data Base and Methodology
This present paper “Health Problems of Lock IndustryWorkers: A Case Study of Aligarh City (U.P)” is basedon field survey. The data collected through questionnairefilled by respondent of 1.5% of the Lock industry workersof Aligarh City. The questionnaire had been filled bythe workers of the industry and also assessing from themknowledge about issues and problem in their lockindustry. The respondents arebelonging the lock industryonly. There are 70 wards in Aligarh city and 1.5% ofhousehold selected from each ward through simplerandom sampling. The total 125 respondent are surveyed,the survey was conducted in the month of October 2013.
Health Problems of Lock Industry Workers

Life and Living Through Newer Spectrum of Geography262
Study Area
Aligarh is the city of administrative headquarters forAligarh district, in the Northern Indian state of UttarPradesh. Aligarh city is located 27º 291 North latitudeand 78º361 cast longitude, at a distance of 130 km tothe south east of Delhi – Kolkata railway line and grandtrunk Road. The climate upto 48ºC and cold dry in winterwith a minimum temperature down to 2ºC andintervening rainy season upto 60 – 100 cm. Aligarh isan important city of Uttar Pradesh. The total area ofAligarh city is 33.98 sq. km and its total population is909, 559 out of which 482, 828 are males (Provisionallydata of 2011 census). The literacy rate of the city is 70.54percent. The number of household in the city at thattime reached about one lakh, since independence Aligarhcity has grown from a small town to an important centrefor industries and learning.
There are three factors which have contributed tothe development of Aligarh city; these include theestablishment of Aligarh Muslim University during pre-independence period the growth of trade through theestablishment of light industrial and its demarcation asthe district headquarter, which gave its administrativeimportance. Aligarh city is divided in two district parts,the old city civil lines; these two parts are the districtform in appearance, occupations distribution and socialliving conditions. The city is an agricultural tradecentre.Agricultural product processing and manufacturingare important. Aligarh is an important business centreof Uttar Pradesh and is most famous for its lockindustry.Aligarh locks are exported across the world. In 1870,Johnson & Co. was the first English lock firm in Aligarh.In 1890, the company initiated production of locks on asmall scale here.Aligarh is also famous for brass hardwareand sculpture. Today, the city holds thousands ofmanufacturers, exporters and suppliers involved in thebrass, bronze, iron and aluminum industries Aligarh

263
District is well known for manufacturing the differenttype of locks used in Building doors, Automobiles, V.I.PSuitcases, Wooden & Steel Furniture etc. due to whichAligarh possess an important position in the industrialmap of India and Aligarh is known as “Tala Nagri”.Locks and Hardware industries are the main industriesof Aligarh. Aligarh there are 7 – 10large lockmanufacturers; 30-35 medium sized & 1500+ smallmanufacturers (www.aligarhlock industry.com) .Total of1683 lock industrial units are functioning in Aligarh city.In Aligarh city the main lock manufacturing is locatedin main industrial area, while the small scalemanufacturing industries are located randomly but clusterof industries are located all along the railway tract andcentre of the city.
Discussion
In lock industries the work is divided into muchsection like; polishing, filling soldering, hammering andpacking. Polishing & filing appeared to be the mosthazardous type of the work, 56.6%workers reported offacing problem due to polishing, 38.3%by filling workand remaining 5 % by soldering hammering and packing.People in the lock factories are mostly engaged inpolishing and fixing work and mechanical work. Besidesother hazardous work are buffing, hand press, assembling,electroplating and spray painting. The dust and chemicalswere released from the work. They inhale dust andchemical from polish material, which leads to varioushealth diseases like Respiratory problems, problemsrelated with shoulders, back, lower limbs. Besides theseproblems workers feel sleepy and stress.
The health problems are divided into three categories.
i. Ergonomic: It is physiological link between workerand his environment. This would effect on theworkers body like back, neck, shoulder, hand/arm and feet /leg/ thighs.
Health Problems of Lock Industry Workers

Life and Living Through Newer Spectrum of Geography264
ii. Systematic problems: These problems are foundin respiratory system, cardiovascular system,central nervous system, gastrointestinal problem,eye, ear, throat, skin etc.
iii. Psychological problems: These areincluding stressand sleep. In general the major problems are thoserelated to the respiratory tract diseases (73.3percent) while the remaining 26.7 percent arerelated with ergonomic problems, psychologicaland systematic problems except respiratoryproblem.
Table 1: Health Problems by Type of Diseases(Ergonomic Problem)
Ergonomic Problem
S.No. Location Percentage of WorkersSuffering
1. Back 20.15
2. Neck 36.85
3. Shoulder 3.84
4. Hand 16.16
5. Arms 11.22
6. Thigh 3.88
7. Legs 3.85
8. Feet 4.05
Source: Calculation is based on sample survey October2013
Ergonomic problems the maximum workers are facingthe back problem (20.15%) and in this category the othersmajor problems are related with hands (16.16%) arms(11.22%) and neck (36.85) remaining problems are atmarginal level like feet, legs, thighs and shoulders .Astudy of medical and accident records of workers inseveral lock industries found that a significantly highernumber of reported accidents occurred.
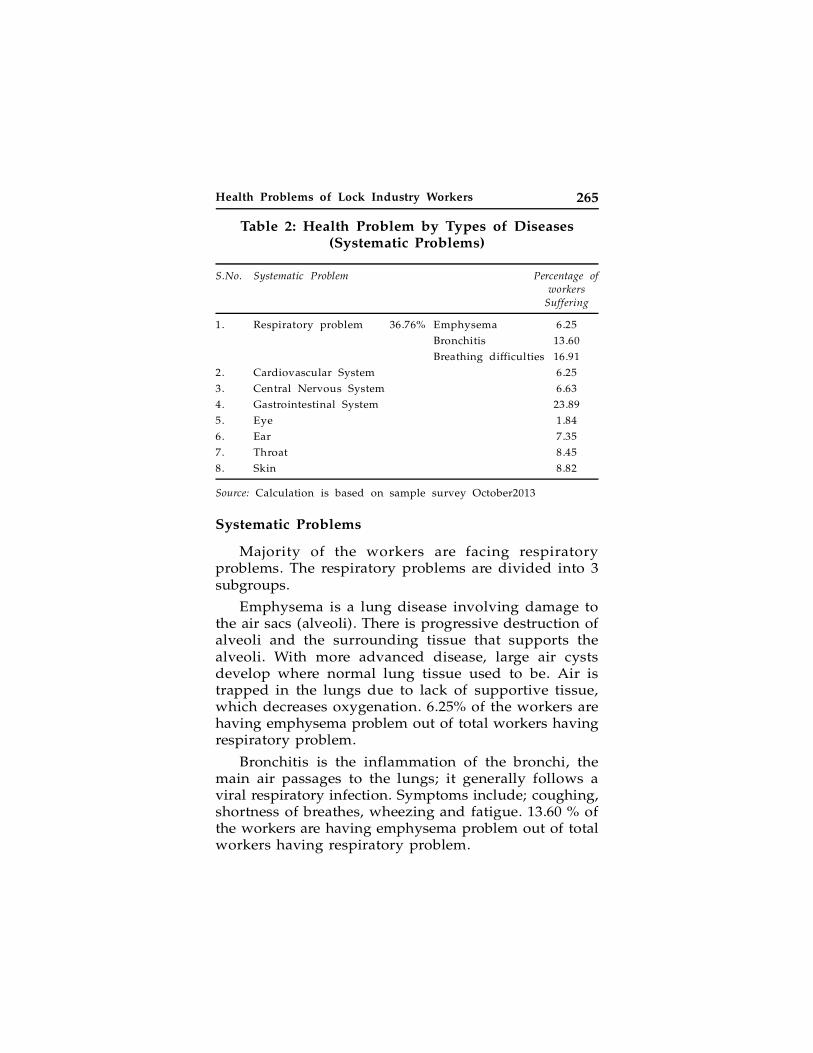
265
Table 2: Health Problem by Types of Diseases(Systematic Problems)
S.No. Systematic Problem Percentage ofworkers
Suffering
1. Respiratory problem 36.76% Emphysema 6.25
Bronchitis 13.60
Breathing difficulties 16.91
2. Cardiovascular System 6.25
3. Central Nervous System 6.63
4. Gastrointestinal System 23.89
5. Eye 1.84
6. Ear 7.35
7. Throat 8.45
8. Skin 8.82
Source: Calculation is based on sample survey October2013
Systematic Problems
Majority of the workers are facing respiratoryproblems. The respiratory problems are divided into 3subgroups.
Emphysema is a lung disease involving damage tothe air sacs (alveoli). There is progressive destruction ofalveoli and the surrounding tissue that supports thealveoli. With more advanced disease, large air cystsdevelop where normal lung tissue used to be. Air istrapped in the lungs due to lack of supportive tissue,which decreases oxygenation. 6.25% of the workers arehaving emphysema problem out of total workers havingrespiratory problem.
Bronchitis is the inflammation of the bronchi, themain air passages to the lungs; it generally follows aviral respiratory infection. Symptoms include; coughing,shortness of breathes, wheezing and fatigue. 13.60 % ofthe workers are having emphysema problem out of totalworkers having respiratory problem.
Health Problems of Lock Industry Workers

Life and Living Through Newer Spectrum of Geography266
Breathing difficulties involve a sensation of difficultor uncomfortable breathing or a feeling of not gettingenough air. This is the most widespread problem ofworkers working in lock industry because 16.91% of theworkers having breathing problem out of total workershaving respiratory Problem.
In systematic problems gastrointestinal problem isfound in 65% workers because the work is mostly downby workers in sitting position so the gases are developedin their bellies. This creates lot of problems to the workersand indirectly influences the digestive tract. The workersinhaled the chemicals and dust during work from rawmaterials as well as polishing cause problems in theirthroat because this is the most sensitive part of our body.Besides central nervous system, eye, ear and skin is alsoinfluenced but at marginal level.
Sleep Disruption: -The workers get disturbed duringthe night due to noise and during whole time the noise,which created in their surrounding, disturbed their sleep,which causes two major diseases.
Insomnia
Instability
Table 3: Health problemsby type of diseases(Psychological Problem)
Psychological Problem Percentage ofworkers suffering
Stress 47
Sleep 23
Source: Calculation is based on sample survey October2013
The diseases caused by regular working at particularplaces are called the “diseases of adaptation.” Stress isalso a disease of adaptation. These diseases of stressinclude ulcers, asthma, high blood pressure, headaches,

267
and colitis. In psychological problems stress problem isfound in 43% workers while sleep disruption among23% workers.
Conclusion and Suggestion
Health is very crucial need for the living beings; ahealthy person can do more work and in less time thananunhealthy person do. The present study reveals, workersin lock industry having various kind of diseases andhealth problems as they are working in the hazardouscondition for long working hours. The workers/employeesare not satisfy with the health and medical facilities thatare given by the owner of the industry, so proper healthfacilities should be provided to them by the industry,Use of safety device to safeguard the workers fromindustrial accidents, Time to time bonus should be given,welfare facilities should be improved, wearing of maskand other method to prevent from exposure, Absoluterequirement for rest and relaxation at regular intervalto maintain adequate mental and physical health, lackof new technology and training, non availability offacilities, poor salaries, environment faced by the workersmust be removed, the employer attitude towards workersshould be fair and taking corrective action to solve theproblems and conflict between the workers, Cooperationand encouragement on the part of government willprovide the necessary filling to the business .Theprosperity of lock industry depends up on the unifiedapproach of government and industry on issues relatedto supply of raw material at low wages, supply ofelectricity should be given at low prices, and amendmentof labour laws, government should import advance lockmanufacturing machine to suit the Indian condition, whichshould be made available at reasonable rates to themanufactures.
Health Problems of Lock Industry Workers

Life and Living Through Newer Spectrum of Geography268
References
1. Singh A and Jagtar Singh J, Jagdish Singh Bains, NirmaljeetSingh Rathi, (2003) “Essentaials of Physical Education”,Ludhiana : kalyani Publishers, pp 207-238.
2. Shrivastava A. K., Physical Education and Health (2001),Delhi : B R . International Publishers, pp 55-57.
3. Burra, Neera(1995)Born to Work: Child Labour in India,New Delhi: Oxford University Press.
4. John A.L. (1919), Health Problem of Industrial Worker,Annals of American Academy of Political Social Science.
5. Nayar, K R (2007) Social Exclution, Caste and Health : AReview Based On the Social Determinants Frame work,New Delhi Centre Of Social Medicine and CommunityHealth, August 14, Jawahar lal Nehru University.
6. Peppina Saastamoinen, Palvi tieno – Arjas, Mikko Laakonen,Pekka Martikanen and Eero Lahelma (2006), “Pain andHealth related functioning among Employees”. Journal ofEpidemiology andCommunity Health, Vol. 60, pp.793-798.
7. Kapil R. C. and ThakurR. (2007) “A Study of Health Statusand Health Awarnessamong Employees Working in SantGadge Baba University, Amarvati” Journal in sport andexercises” Vol.3. Jan, pp 6- 10.
8. Saha G. (2006) Clustering: A key to Protect Lock Industryof Aligarh in Globalizing Economy”. Pp 214- 225 in MuslimArtisans, craftsman and traders: Issues in Entrepreneurship,edited by Abdul Wahid, New Delhi, Icon Publication. Pvt,Ltd.
9. S Dheer S. and Mitra B. (1984) “Introduction to HealthEducation”. Jalandhar : A P Publishers, pp 244.
10. www. Indian lock industry.com
11. Wikipedia.org/wiki/Aligarh

269
16Mid Day Meal: A Historic Stepfor Elimentary Education in India
Dr. Sanjit Kumar Shil Sharma
ABSTRACT
India is one of the poorest countries of the world. A largepart of the people of the country remains far away from thelight of education. Earning is more important than educationfor the hungry poor people. Empty stomach cannot bear theweight of education. Poor children avoid the school. Evenwho initially go to school very soon they become drop outstudent. Government of India realized the real fact about thebackwardness in education and tries to minimize the problemsabout the education of the poor people and try to solve theproblems. Regarding this the Mid Day Meal Scheme has beenintroduced throughout the country. The result is very positiveof this very important scheme.
Key words: Mid Day Meal, SSA, NCLP, CMDM, ASER.
Introduction
The English word ‘education’ derived from Greekword ‘Educare’ means to bring up or to nourish or theword ‘Education’ derived from Latin word ‘Educatum’means acting of teaching or instruction. According toMahatma Gandhi education means an alround drawing
Mid Day Meal: A Historic Step for Elimentary . . .

Life and Living Through Newer Spectrum of Geography270
out of the best in child and man body mind and spirit.Ancient Philosopher Plato also told that educationdevelops in the body and soul of the pupils all thebeauty and all the perfection he is capable. India followModern education is Tripolar system in which Teacher,Society and of course Child lies on three sides. Moderneducation is child oriented. In Indian education mostchildren came from poor families so they gradually startedto avoid the school and enter in job for food. Which isthe main cause of drop out from school and it is themain failure of school education system in our country.So the government of India adopts the Mid Day MealScheme. The Mid Day Meal Scheme is a multi-facetedprogramme of the Government of India that, among otherthings, seeks to address issues of food security, lack ofnutrition and access to education on a pan nation scale.1
The level of malnutrition is of great concern in Indiawith over 40% of children being classified asundernourished. Under nutrition is highly prevalentamong rural children in India. Survey among ruralpopulation of India, by National Nutrition MonitoringBureau in 2002, reported prevalence of malnutrition, usingGomez classification to be 94.6% among 6-9 year and97.1% in 10-13 year old. Anaemia affects over 3/4th ofthe school children due to low intake of iron and folicacid. The reasons for such high levels of malnutritionand anaemia are poverty, gender inequity, specific dietarypatterns and recurrent illness etc.
Objectives
The main objectives of the paper are to assess theimpact and influence of Mid Day Meal Scheme in primaryas well as education system in our society and countryand suggestions to improve the scheme.
Methodology
The present study is based on mainly secondary data

271
and from different journal and publication of governmentand non government agencies. Collected data andinformation proceed and analyzed and used as per needs.
History of MDM Scheme in our country
Sl. Name of States Year of GlimpsesNo. launching
of MDM
1 Tamil Nadu 1923 Started in Madras City by MadrasMunicipal Corporation & extended to fullState in 1982.
2. West Bengal 1928 Started in Calcutta city by KeshavAcademy of Calcutta as compulsory Mid-day Tiffin on payment basis at the rateof four annas per child per month.
3. Maharashtra 1942 Started free mid day meal in Bombay. Itwas launched in 1995-96 as a centrallysponsored scheme.
4. Karnataka 1946 Started in Bangalore city to providecooked rice and yoghurt. There wasprovision of giving 3 kg of rice/wheatper month /per child who had 80% ormore attendance in 1995. Cooked mealwas started in 7 north eastern districtsduring 2002-03.
5. Uttar Pradesh 1953 It introduced a scheme on voluntary basisto give boiled gram, ground-nut, puffedrice and seasonal fruits.
6. Kerala 1960 Scheme had been funded by CARE(Cooperate American Relief Everywhere)under US Assistance during the period1960-1983 (in a pilot manner).
7. Bihar 1995 Started with dry ration of 3 kg/perstudent/per month and started providingcooked meal in 30 blocks of 10 districtsin 2003-04
8. Andhra Pradesh 1995 There was provision of giving 3 kg ofrice/wheat per month per child with 80%or more attendance in school.
Mid Day Meal: A Historic Step for Elimentary . . .

Life and Living Through Newer Spectrum of Geography272
9. Madhya Pradesh 1995 Initially dry rations or Dalia wasprovided.
10. Rajasthan 1995 Students of Government Primary schoolswere provided wheat at the rate of 3kg/ per student /per month
11. Arunachal 1995 Initially only dry ration was providedPradesh in five districts of the state, extended to
all schools since 2004.
12. Punjab 1995 Students of Government Primary schoolswere provided wheat at the rate of 3 kgper student/ per month and switchedover to cooked meal in one block of everydistrict in 2002-03.
13. Haryana 1995 Initially implemented in 17 blocks of 6districts & extended to 44 blocks wherefemale literacy rate was lower than thenational level in 1996-97.
14. Himachal 1995 Initially dry ration was providedPradesh
15. Jammu & 1995 Initially dry ration was providedKashmir
16. Meghalaya 1995 Started with dry ration of 3 kg perstudent /per month.
17. Jharkhand 2003 It was taken up on a pilot basis in 3140government primary schools in 19 districtsinitially.
Source: Planning Commission, Govt.of India, 2010
National Programme of Nutrition Support to PrimaryEducation
The Government of India started a NationalProgramme of Nutritional Support to Primary Educationon 15 August 1995. It is fully sponsored by centralgovernment. The objectives of the scheme are to give aboost to universalisation of primary education bymitigating classroom hunger and improving nutritionalstatus of primary school children. Under this programme,a cooked mid-day meal with 300 calories and 12 gram

273
of proteins is provided to all children enrolled in classesI to VIII. The name was changed from NationalProgramme for Nutrition Support to Primary Educationto National Programme of Mid Day Meals in Schools.The scheme became legal right after the Supreme Courtorder. Dated 28 November 2001, directed all governmentand government-assisted primary schools to providecooked midday meals making, children (or their parents)demand school meals as a matter of right, and enforcethis right through Courts if necessary. “Every child inevery Government and Government assisted PrimarySchools with a prepared mid day meal with a minimumcontent of 300 calories and 8-12 grams of protein eachday of school for a minimum of 200 days”
Present Situation of MDM Scheme
The Cooked Mid-Day Meal (CMDM) was introducedin all government and government-aided primary schoolsin April 2002. CMDM scheme proposed to supply mealcontaining 300 calories and 8-12 grams of proteins to allchildren studying in classes I to V in government andgovernment aided schools and Education GuaranteeScheme (EGS)/Alternative and Innovative Education (AIE)centres w.e.f. September, 2004 (revised to 450 caloriesand 12 grams of protein for the children of primaryschools and 700 calories and 20 grams of protein for thechildren of upper primary school with adequate quantitiesof micronutrients like iron, folic acid, and vitamin-A etc.w.e.f. June, 2006.Initially the scheme was introduced in2408 blocks and by 1997-1998 the scheme reached to allblocks of the country. Annual Status of Education Report(ASER) 2010 reported that in 83.4% schools served MDMon a day of visit and almost same percent of schools(81.3%) schools were having kitchen sheds for cookingmid day meal.
Mid Day Meal: A Historic Step for Elimentary . . .

Life and Living Through Newer Spectrum of Geography274
Prescribed specific nutritional content in the MidDay Meal
Display of Information under Right to Information Act
In order to ensure that there is transparency andaccountability, all schools and centres where theprogramme is being implemented are required to displayinformation suo-moto. This includes information on:
1. Quality of food grains received, date of receipt.
2. Quantity of food grains utilized.
3. Other ingredients purchased, utilized
4. Number of children given mid day meal.
5. Daily Menu
Responsibility for Cooking
In rural areas the cocking is done by women selfhelp groups and in urban areas different Non GovernmentOrganizations take the responsibility of cocking The MDMScheme is carried out by the local authority with thehelp of the village Panchayat, School ManagingCommittee.
School Calories Protein
Primary 450 12gms
Upper Primary 700 20gms.

275
Achievements in MDM Scheme from 2005-06 to2011-12
Source: Minister of human Resource Development, GOI, Annual Report2012-13
Positive aspects of Mid Day Meal Scheme
Research finding in 2010 by Pratichi Trust of Prof.Amarty Sen that implementation of MDM Scheme hasbeen success throughout the country.
1. It has helped in increase in attendance andenrolment of children particularly girls.
2. The Scheme increases the retention, learning abilityof the children.
3. It increases good practices like washing handsbefore eating and after eating among the children.
4. The Scheme has played the crucial role in reducingdrop out specially the girls.
5. It has been reduced the burden of providing onetime meal to the poor children and support thepoor families.
Year Children covered (in
Crore )
Food grain Allocated (in Lakh MTs)
Budget Allocation
( in Crore)
Total Expenditure
( in Crore)
2005-06 11.94 22.51 3345.26 3186.33
2006-07 10.68 21.60 5348 5233.47
2007-08 11.37 24.79 6678 5835.44
2008-09 11.19 29.30 8000 6688.02
2009-10 11.36 27.71 7359.15 6937.79
2010-11 10.46 29.40 9440 9128.44
2011-12 10.35 29.09 10380 7697.24 Up to 29.12.11
Mid Day Meal: A Historic Step for Elimentary . . .

Life and Living Through Newer Spectrum of Geography276
6. Mid day meal acts as a regular source of“supplementary nutrition” for children.
7. Mid Day Meal aided in active learning as wellas academic performance of children.
8. MDM has created new employment opportunitiesfor underprivileged sections.
9. It has created a platform for children of all socialand economic backgrounds to take meals together,thereby facilitating achieving the objective of socialequity.
10. Poor children enjoy varied menu of MDM inschool.
11. MDM Scheme increases the economic strength ofthe poor people who are engaged in cooking andhelping MDM. and local market of grocery andvegetable and farmers.
Negative aspects of Mid Day Meal Scheme
1. The MDM Scheme is for classes I to VIII. But ina high school and higher secondary school it isnot good matter that some students are gettingcocked meal and rest are deprived from meal.
2. The programme diverts the attention of teachersand students on activities related to it, rather thantowards teaching and learning activities, whichresults in loss of studies.
3. Shortage of basic infrastructural facilities andmanpower are common problems in most schools.
4. Quality of supplied rice is not very good in manyschools.
5. In most school there are no sitting arrangementsfor taking food.
6. In many school preservation of cocked meal innot hygienic.

277
7. Corruption in high level to grass root level alsocreate problems the scheme.
8. Repetition of the same menu every day.
9. Due to paucity of fund, most of the school dependson soybeans as protein supplement, and many ofthem offer Khichury at least twice a week.
Recommendations and Suggestions
Recommendations and suggestion for improvementthe popular project MDM Scheme are-
1. The MDM Scheme should be introduced for allstudents and all classes of a school. It may bePrimary, Upper Primary, High or High SecondarySchool.
2. The quality of cooking food served should beimproved.
3. The quantities of meal have to be increased.
4. Strictly maintain the hygienic conditions for mealand others.
5. There is a need to narrow the gap betweenenrolment vs. actual number of the childrenavailing MDM.
6. Allocation of fund should be increased.
7. Monitoring and supervision mechanisms shouldbe implemented effectively.
8. Corruption in all level regarding the MDM Schemeshould be strictly stopped.
9. Every School should follow the students andguardians opinion to improve the quality, menuvariety of MDM.
10. Self Help groups and others who are engaged incocking and helping in MDM have to take training
Mid Day Meal: A Historic Step for Elimentary . . .

Life and Living Through Newer Spectrum of Geography278
about hygiene, health, sanitation, cocking andserving
11. Proper infrastructure for mid day meals shouldbe mandatory, including cooking sheds storagespace, drinking water, ventilation, utensils etc.
12. Priority should be given to backward communitiesin the appointment of cooks and helpers.
13. There should be no social discrimination andcasteism in appointment of cooks and helpers andserving meals to students.
14. All cooks and helpers should be paid not lessthan statutory minimum wage.
15. Mid day meal should be linked with nutritioneducation and related educational activities.
16. Nutritious items such as eggs and green vegetablesshould be provided regularly.
Conclusion
Mid Day Meal Scheme or Programme already becamea popular scheme among the students parents and teachersas the prgrammme has helped in increase in attendanceand enrolment of children particularly girls and acts asa platform for children of all social and economicbackgrounds to take meals together, thereby facilitatingachieving the objective of social equity. Though somedrawbacks, the scheme have immense impact in thedevelopment of elementary education in our country andhealth of the students as well as \future physical andcultural strength of our country.
References
1. Azad, Das and Islam, (2013): Impact of Mid Day Meal onEducation in Cooch Behar, Sitalkuchi College, Cooch Behar,pp. 261- 274

279
2. UNICEF, (1997): The State of the World’s Children, OxfordUniversity Press.
3. The pratichi Report on MDM- Right to food campaign http:// ww w.r i ght tof o odi ndi a .o rg/ data / pr a ti c hi _ rep o rt_on_mid_day_meal.pdf
4. Bandhyapadhyaya, S.2009: Sabar jonya shiksha: Right toEducation,Joyona,Kolkata, pp.16 – 19.
5. Deb, P, (2012): Elementary Education in rural Education: AReview , Journal of Geo-Environment Observer,vol.1,No.2,oct,2012,pp.78-83
6. www.vidyaranya.org
7. www.akshayapatra.org
8. mdm.nic.in/
9. en.wikipedia.org/wiki/Midday_Meal_Scheme
10. www.archive.india.gov.in/sectors/education/index.php?id
11. www.trgmdm.nic.in/mdm_production/login.aspx
12. http:/www.yojana.govt.in/web-exclusives asp
Mid Day Meal: A Historic Step for Elimentary . . .

Life and Living Through Newer Spectrum of Geography280
17Thriving Art at Cost of Childhood:Present Scenario of Child Workersin Indian Carpet Industry
Razia Bano & Nida Fatma
ABSTRACT
This paper is an attempt to show present scenario ofchild worker in carpet industry in India. Carpet industry inIndia comes under the textile ministry and then further comesunder the handicraft department of India. It is labour orientedindustry as like other small scale industry in India providesbest opportunity for employment generation. It is also becomesthe significant industry due to the large source of foreignexchange in India and contribute its best in path of economicdevelopment. Carpet industry has been spotted as involvementof child labour in India. Although lots of efforts have beenmade by the different Government Organizations, NGO’s andseveral laws have been implemented to eradicate this socialevil from India. But all these efforts did not achieve its desiredgoal. Present study shows the involvement only in core carpetindustry area of India. Data has been used in this paper isbased on secondary sources by published literature, governmentreports, reports of various organization. The objective of thisstudy to just present the picture of involvement of child workersin India, Child workers in carpet industry in India, socio and

281
demographic condition of child workers in carpet industry inIndia.
Introduction
“Bestow blessing on those little innocent lives bloomedon earth who have brought the massage of joy fromheavenly garden” Ravindranath Tagore. Every child is agift of god. A gift must be protected with love andaffection in family and society. A child is an incarnationof angle over the earth…..according to Islam….Child oftoday is the future of tomorrow….. All these saying seemmeaningless in if we have look upon status of childlabor in India. Being an Indian we are fortunate of havinggreat number of child population but on the same groundwe are very ashamed that India having great number ofchild workers. Child labor is one of the heinous socialevil practicing intensively in India despite of severalgovernmental efforts. The great numbers of children arejust wasting their childhood for earning bread and butterfor their livelihood. According to the census 2001,thereare 370 million children and (15 years) in India andabout more than one third (36%of India’s population)five states having more than one million working childrentwo of those were major carpet producing states (UtterPradesh and Rajasthan) in India. Utter Pradesh the coreof carpet belt was the most populous state of the Indiaand had most (19million) working children. Though thechild labour prevalent in many industries in India noother industry has received such widespread attentionas the carpet industry .carpet industry is most labourintensive in comparison to other small scale industry.The use of child labour in carpet production of handknotted carpet in has been widely reported anddocumented in India. Child labor is not a new issue inIndia but it has been a burning issue since the time ofindustrialization. Since that period “Child labor” continuesas a social evil in India as well as whole world. Manycountries have achieved a great success to get overcome
Thriving Art at Cost of Childhood: Present Scenario . . .

Life and Living Through Newer Spectrum of Geography282
on this social crises but India remain stagnant. Indiahave been achieved several milestone of success in itsdevelopment story after independence but can’t eradicatethe curse of child labor. Inspite of several efforts havetaken by government and non government organizationsto eliminate the worst form of child labor but verymoderately attained success. This paper is an attemptto present the picture of shameless scenario of childlabour in India, the government policies, schemes haveformulated for eradication of child labour, the trend ofchild labour in India .This paper is try to analyses theimpact and effect of child labour and lastly this papertry to highlight the causes and consequences of childlabour.
Objective of Study
Study on the child labor in carpet industry has beendiscussed since 1980’s by various groups of scholars andacademicians. The objectives behind this paper arementioned below:
1. To depict the present scenario of child labour inIndia,
2. To highlight the indulgence of child labour incarpet industry in India.
3. To show the socio and demographic condition ofchild labour in carpet industry in India.
4. To present the efforts of governments and NGO’sto eliminate child labour in carpet industry inIndia.
5. To suggest the remedial measures to curb thissocial evil as a child labor.
Database and Methodology
The present paper on child labor in carpet industryis an effort to depict the present scenario of child workers

283
in carpet industry in India. In present study secondarydata has been used through various ministry reports,NGO’s work and different organizations report .The dataon child labour in carpet industry is taken by a reportsubmitted in United State Department of Child laboroffice of Child labor, forced labor and human trafficking(OCCFT) And also collected from a report presented bygovernment of India .Information about carpet industryhas been provided by Carpet Export Promotion Council(CEPC) and various published article . Data on carpetindustry cover mainly the core industry area of Indiai.e. Sant Ravidas Nagar (Bhadohi), Mirzapur, Varanasi,Agra, Panipat, and Jammu and Kashmir.
Discussion
The country has a great diversity in its socio anddemographic dimensions the magnitude of child labourvariation depends on it demographic, social cultural,religion, cast and gender. The magnitude is different inrural and urban India as well as in major Indian states.India has made moderate advancement in efforts toeliminate the worst form of child labor. The efforts havebeen taken by law makers and governing body of India,various scholars and social workers has been made theirvaluable contribution. At some extent they got successin their objectives and plan but not at the satisfactorylevel. India as a developing economy has a great potentialfor the household industry. These are labour orientedindustry and need to digest huge amount of labour force.Because of small cottage industry it needs cheap labourand children are the best option for cheap labour.
Child Labour in the Major State of India
According to the recent data of 2010 issued by NSS,data has categorized into rural and urban then it furtherdivided into male and female child worker.NSS has taken21 major state in the case of child under age of 5-14
Thriving Art at Cost of Childhood: Present Scenario . . .

Life and Living Through Newer Spectrum of Geography284
labor in which Utter Pradesh and Assam comes the majorstate in child labor in India.
Table 1: Child labor in major states of India(2009-10)
Carpet Industry: An Overview
The history of carpet has got its roots from mughalperiod. The charismatic art of carpet weaving in Indiabrought by mughal since then it is the part of Indianart and handicraft. Some of the majestic carpets were
S.N All Indian Major State Age group 5-14
Rural Urban Male Female Male Female
1 Andhra Pradesh 88156 110191 20767 15548 2 Assam 1446555 31909 11833 757 3 Bihar 224292 38665 11017 2548 4 Chhattisgarh 3669 7321 636 0 5 Delhi - - 18576 0 6 Gujarat 150487 207973 15945 16282 7 Haryana 22554 17471 28073 3988 8 Himachal Pradesh 2300 2942 2156 0 9 Jammu and Kashmir 11274 16872 1139 0 10 Jharkhand 63684 14661 4123 0 11 Karnataka 89786 113429 20793 2479 12 Kerala 1182 0 0 1583 13 Madhya Pradesh 9145 32812 57688 9063 14 Maharashtra 66370 127996 54230 12077 15 Orissa 54390 38288 36522 5363 16 Punjab 16802 6433 15664 9937 17 Rajasthan 93055 261871 43184 7826 18 Tamil Nadu 0 13880 3471 0 19 Uttarakhand 14810 7239 3219 2103 20 Uttar Pradesh 1012294 546320 174820 68899 21 West Bengal 357265 134657 31945 27714 All India 2511101 1727271 546897 198602
Source: Data on Child Labour based on Employment Unemployment Survey During NSS 66th Round (2009-10)16

285
woven during this Mogul era. Over the period, the weaverhas become an artist imbibing the magical exotic colorsto the Indian carpets. Based on individualistic skill ofthe weaver, there is an aesthetic touch of the coloringand beauty in the carpets. Over the period, various clustershave emerged in the northern part of India. Initially,carpet weaving was done only at few centers. Due toseveral historical reasons and availability of resources,carpet manufacturing spread across the northern India.Major centers have been Bhadohi, Agra, Jaipur& Kashmir.During the last few decades, hand-tufted carpets haveemerged as one of the major categories. Due to proximityto Home furnishing products, Panipat has emerged asanother major center for carpet manufacturing. Over theyears, various carpet weaving center have emerged inIndia. Each center has its own competitive advantage.These centers employ millions of people. These areBhadohi – Mirzapur and Agra belt in Uttar Pradesh Jaipur-Bikaner belt in Rajasthan, Panipatbelt in Haryana Kashmirbelt.
Value and Importance of the Carpet Industry in India
In the late 1970’s,increased international demand fromEurope and the U.S stimulate the industry’s rapid growthduring the 19780’s and 1990’s, the carpet industry inIndia became an important employer and also becamean important sector for generating foreign capital, asalmost all the handmade carpet were exported . Europeis the traditional markets offer small potential for growththough the volumes are high. The scenario may changein future if southern European countries start drivingthe growth. For most of the players, USA offers a goodmarket based on its size and growth. Also, demand fordifferent kinds of carpets is not widely varying as inthe case of other countries. Hence, USA offers anopportunity for both, traditional as well as moderndesigns. Similar case is for Hand knotted and hand tuftedcarpets
Thriving Art at Cost of Childhood: Present Scenario . . .

Life and Living Through Newer Spectrum of Geography286
Socio Economic Structure of Carpet Industry
In general, carpet production is a small-scale cottageindustry, almost all (perhaps 95 percent) carpet productionwas located in small workshops (sheds) and in householdsthat mostly used family workers. Most sheds were invillages, and most shed owners owned only a few loomsand employed very few workers, including children. Thoseshed owners were not wealthy and, often, not even middleclass. A smaller number of much larger sheds ownedand operated by manufacturers supplying exporters withcarpets and processors supplying exporters with othermaterials and services. At the top are the major exportersand carpet manufacturers who owned hundreds of loomsand relied on a hierarchy of managers and contractors.Some of their carpets have produced in big factoriesoperated directly by the exporters or their managers.For other carpets, the exporters give orders to contractors,who distribute orders (and often the looms) among manysheds and households in rural villages and (less common)urban neighborhoods. The base of the industry’ssocioeconomic structure consisted of the weavers andlower level employees. They were predominantly maleand low ranking in all studies. India’s labor laws regulatedonly factories (enterprises employing 10 or more workers),did not regulate smaller workshops, and explicitlyexempted family-based work sites from regulation, whichmeant that working conditions in small sheds and family-based HHs are unregulated..
The carpet industry in India is concentrated in easternUP state in traditional core “carpet belt” districts andan extension area. The core area accounted for 70 to 90percent of the total carpet production in India. The long-established carpet industry in Jammu & Kashmirspecialized in silk.

287
Type of the Works Performed By Children in CarpetIndustry
Carpet industry involved in itself an intricate mannerof manufacturing carpet. Workers involved in variouslevel of work while manufacturing carpet .Children incarpet industry, primarily involved in weaving, that is44.4% involved in hand knotted carpets, 12.05 in handtufted carpets and 10.35 in hand looming carpets. Butmany are also involved in wool processing activities,such as balling, joining, and plying thread. The factory-based child carpet workers are much more focused oncarpet production (hand-tufting, hand-knotting, and hand-looming).
Present Scenario of Child Workers in Carpet IndustryThere are 135717 establishments recorded in India
and 128268 are house hold and 75499 are factories, thetotal estimated number of child workers is 273897 andin household they are 218665 and 55232 are in factories.Total estimated numbers of child workers are 13,131 inwhich 12374 are in household and 757 are in factories.Thus simply, table shows that the household carpetindustry are more in numbers in total establishment andchild labor are also more in numbers in householdindustry.
Table 2: Estimated number of child workers incarpet industry
Total Household Factories
Total estimated number of 135,717 128,268 7,449establishments (100%) (94.5) (5.5%)
Total estimated number of Carpet 273,897 218,665 55,232Workers (100%) (79.8%) (20.2%)
Total estimated number of child 13,131 12,374 757Carpet Workers (100%) (94.2%) (5.8%)
Industry prevalence of Child Workers 4.8% 5.7% 1.4%
Source: Research Project on Children working in the carpet industry inIndia, Nepal and Pakistan (2012), submitted to OCAT, US department ofLabour by ICFI international.inc
Thriving Art at Cost of Childhood: Present Scenario . . .

Life and Living Through Newer Spectrum of Geography288
Social and Demographic Characteristics of Child Workers
Thesocio and demography is multifaceted term usedin any interpretation. Socio and demography has discussedin broader aspect such as number of people, differentage group, educational status and health condition etc.The table no.3 shows the actual number of childrenindulged in carpet industry, their percentage to the totalworkers, categorized the workers sex wise, number ofworkers of different age group and their educationalstatus. Table shows that the indulgence of child workerin carpet industry is more prominent in the case of female.There are 43.2% boys and 56.8% girls in carpet industry,the reason behind the outnumbering of girls are becausecarpet industry is largely based on household industryprovide, manufacturing of carpet indulge a net of stepsdone under the shed of their house. The indulgence ofworkers categorized in different age group, that is 4.5%of children is under the age of 5-8, 23.4% are under theage of 9-13 and the largest percentage of child workersfound under the age group of 14-17.table no 4 furthershows the educational status of child working in theindustry. Children those have currently attended schoolsare 32.4%.
Table 3: Demography of child workers in carpetindustry
Gender Total Household Factories
Male 46.3% 43.2% 96.6%
Female 53.7% 56.8% 3.4%
Age Total Household Factories
5-8 years 4.2% 4.5% 0.0%
9-13 22.2% 22.3% 0.0%
14-17 73.7% 72.1% 100.0%
Source: Research Project on Children working in the carpet industry inIndia, Nepal and Pakistan (2012),submitted to OCAT,US department ofLabour by ICFI international.inc

289
Table 4: Educational characteristics of child labourin carpet industry
Total Children Childrenworking in working inin carpet factoriesindustry
School attendance Status 32.1% 32.4% 27.1%
Not attended in past - - 46.3%
Never Attended - - 26.6%
Source: Research Project on Children working in the carpet industry inIndia, Nepal and Pakistan (2012), submitted to OCAT, US department ofLabour by ICFI international.inc.
Cause of Children Indulgence in Carpet Industry
There are various factors which cause to any socialcrime, Child labour is also provoked by several causes.Child labour in carpet industry in India enforced byseveral socio and economic causes. The major reasonbehind any social crises, poverty comes first. Becausepoverty leads illiteracy and illiteracy generates furtherproblems in society. Poverty becomes the leading factorto enforce the child labour in carpet industry. Thepercentage of the population of India living in povertyis high. Poverty has an obvious relationship with childlabour (Mehra-Kerpelman 1996, 8). Families need moneyto survive; children are a source of additional income.According to Nangia, 63.74% of child laborers said thatpoverty was the reason they worked (1987, p. 174). Thecombination of poverty and the lack of a social securitynetwork form the basis of an even worse type of childlabour – bonded child labour. For the poor, there arefew sources of loans of any type – and even if there aresources available, few Indians living in poverty qualify.For a small amount parents exchange their child’s labourfor money (HRW 1996, 17). Since the salary of a bondedchild labour is less than the interest on the loan, theloan grows. It is impossible for the poor to pay off such
Thriving Art at Cost of Childhood: Present Scenario . . .

Life and Living Through Newer Spectrum of Geography290
loans (HRW 1996, 17) and the child must continue towork until the loan is repaid.Even though poverty iscited as the major cause of child labour, it is not theonly cause. Poor schools, a lack of schools, or even theexpenses of schooling leaves some children with littleelse to do but work. The attitudes of parents alsocontribute to child labour; some parents feel that childrenshould work in order to develop useful skills.
The core belt of carpet industry spread in UtterPradesh India which is most poor states. Illiteracy comesanother cause which enhances the involvement of childlabour. Another cause behind children working in carpetindustry is tradition of making children learn the familyskills. India’s state of education is not effective enoughto give basic literacy skills to the population. It hasbeen observed that “the overall condition of the educationsystem can be a powerful influence on the supply ofchild labour” (Grootaert and Kanbur 1995, 193) India’sprimary –school completion rate of 38.0% was also lowerthan China’s rate of 70% and Sri Lanka’s rate of 90.8%(UNESCO cited in Weiner 1991, 159). Few students arereaching fifth or sixth grade, and dropout rates supportthis conclusion. One possible reason given by Nangia(1987) is that the family needs money and thinks schoolis a waste of time. This causes parents to take childrenfrom school and place them in the labour force. In thiscase, poverty and the inadequacy of the school systemplay significant roles in causing child labour, and alsoaffect each other. Poverty forces high dropout rates,and so no matter how good schools are, school completionrates and literacy rates will still remain low.
Carpet weaving is an art passing from one generationto another and children start learning this art since theirchildhood. This is also become the cause of child labourin carpet industry. The reason is behind involvement ofchild labour is that labour oriented industry requiredcheap labour and poor children are the main source ofcheap labour. Several efforts have been taken to eradicate

291
child labour from India getting failed due to ineffectiveenforcement of the legal provisions pertaining to childlabour in India.
Efforts of Indian Government to Eradicate Child Labour
Indian government has been worried about thenuisance of this evil since very earlier, passed severalacts and policies to remove it. The efforts of governmentof India succeed to remove this evil at some extentbut not at large. Some efforts are:
The Constitution of India (26 January 1950), throughvarious articles enshrined in the Fundamental Rights andthe Directive Principles of State Policy, lays down that:
I. No child below the age of 14 years shall beemployed to work in any factory or mine orengaged in any other hazardous employment(Article 24)
II. The State shall provide free and compulsoryeducation to all children of the age six to 14 years.(Article 21 (A))
III. The State shall direct its policy towards securingthat the health and strength of workers, men andwomen and the tender age of children are notabused and that they are not forced by economicnecessity to enter vocations unsuited to their ageand strength (Article 39-e)
IV. Children shall be given opportunities and facilitiesto develop in a healthy manner and in conditionsof freedom and dignity and that childhood andyouth shall be protected against moral and materialabandonment (Article 39-f)
V. The State shall endeavor to provide within a periodof 10 years from the commencement of theConstitution for free and compulsory education
Thriving Art at Cost of Childhood: Present Scenario . . .

Life and Living Through Newer Spectrum of Geography292
for all children until they complete the age of 14years (Article 45).
VI. Child labour is a matter on which both the UnionGovernment and state governments can legislate.A number of legislative initiatives have beenundertaken at both levels. The major nationallegislative developments include the following:
The Child Labour (Prohibition and Regulation) Act,1986
The Act prohibits the employment of children belowthe age of 14 years in 16 occupations and 65 processesthat are hazardous to the children’s lives and health.These occupations and processes are listed in the Scheduleto the Act. In October 2006, the Government has includedchildren working in the domestic sector as well asroadside eateries and motels under the prohibited listof hazardous occupations. More recently, in September2008 diving as well as process involving excessive heat(e.g. working near a furnace) and cold; mechanical fishing;food processing; beverage industry; timber handling andloading; mechanical lumbering; warehousing; andprocesses involving exposure to free silica such as slate,pencil industry, stone grinding, slate stone mining, stonequarries as well as the agate industry were added tothe list of prohibited occupations and processes;
The Factories Act, 1948
The Act prohibits the employment of children belowthe age of 14 years. An adolescent aged between 15 and18 years can be employed in a factory only if he obtainsa certificate of fitness from an authorized medical doctor.The Act also prescribes four and a half hours of workper day for children aged between 14 and 18 years andprohibits their working during night hours.

293
The Mines Act, 1952
The Act prohibits the employment of children below18 years of age in a mine. Further, it states that apprenticesabove 16 may be allowed to work under propersupervision in a mine.
The Juvenile Justice (Care and Protection) of ChildrenAct, 2000
This Act was last amended in 2002 in conformitywith the UN Convention on the Rights of the Childcovers young persons below 18 years of age. Section 26of this Act deals with the Exploitation of a Juvenile orChild Employee, and provides in relevant part, thatwhoever procures a juvenile or the child for the purposeof any hazardous employment and keeps him in bondageand withholds his earnings or uses such earning for hisown purposes shall be punishable with imprisonmentfor a term which may extend to three years and shallalso be liable for fine. In some States, including Karnatakaand Maharashtra, this provision has been used effectivelyto bring to book many child labour employers who areotherwise not covered by any other law and to giverelief and rehabilitation benefits to a large number ofchildren.
The Minimum Wages Act, 1948
Prescribes minimum wages for all employees i n allestabilishments or to those working at home in certainsectors specified in the schedule of the Act. Central andState Governments can revise minimum wages specifiedin the schedule. Some consider this Act as an effectiveinstrument to combat child labour in that it is beingused in some States (such as Andhra Pradesh) as thebasis on which to prosecute employers who are employingchildren and paying those lower wages.
Thriving Art at Cost of Childhood: Present Scenario . . .

Life and Living Through Newer Spectrum of Geography294
The Right of Children to Free and Compulsory EducationAct, 2009
Provides for free and compulsory education to allchildren aged 6 to 14 years. This legislation also envisagesthat 25 per cent of seats in every private school shouldbe allocated for children from disadvantaged groupsincluding differently disabled children.
An important judicial intervention in the action againstchild labour in India was the M.C. Mehta case (1996) inwhich The Supreme Court, directed the Union and stategovernments to identify all children working in hazardousprocesses and occupations, to withdraw them from work,and to provide them with quality education. The Courtalso directed that a Child Labour Rehabilitation-cum-Welfare Fund be set up using contributions fromemployers who contravene the Child Labour Act.Additionally, in 1993, the Supreme Court in Unnikrishnanv. State of Andhra Pradesh ruled that each child has theright to free education until he or she completes the ageof 14 years. Article 21-A which was incorporated intothe Constitution, reflects this standard. In 2005, the M.V.Foundation, an NGO working on child rights brought apublic interest litigation petition which argues that childlabour up to the age of compulsory education isunconstitutional and is a negation of rights under Article21-A which provides for compulsory education up tothe age of 14. This case is still pending before the SupremeCourt. Notably however, under this case the Court hasasked the Government to file a status report on theimplementation of Sarva Shiksha Abhiyan, a governmentprogramme providing free and compulsory educationto all children.
Government Policies and Programmes
In pursuance of India’s development goals andstrategies, a National Child Labour Policy was adoptedin 1987 following the Child Labour (Prohibition and

295
Regulation) Act, 1986. The national policy reiterates thedirective principle of state policy in India’s Constitution.It resolves to focus general development programmesto benefit children wherever possible and have projectbased action plans in areas of high concentration of childlabour engaged in wage/quasi-wage employment.
The Ministry of Labour and Employment has beenimplementing the national policy through theestablishment of National Child Labour Projects (NCLPs)for the rehabilitation of child workers since 1988. Initially,these projects were industry specific and aimed atrehabilitating children working in traditional child labourendemic industries. A renewed commitment to fulfil theconstitutional mandate resulted in enlarging the ambitof the NCLPs in 1994 to rehabilitate children workingin hazardous occupations in child labour endemic districts.
The strategy for the NCLPs includes the establishmentof special schools to provide non-formal education andpre-vocational skills training; promoting additional incomeand employment generation opportunities; raising publicawareness, and conducting surveys and evaluations ofchild labour.
The experience gained by the Government in runningthe NCLPs over several years resulted in the continuationand expansion of the projects during the Ninth Five-Year Plan (1997/02). Around 100 NCLPs were launchedacross the country to rehabilitate children working inhazardous industries such as glass and bangles, brassware,locks, carpets, slate tiles, matches, fireworks, and gems.The Central Government made a budgetary allocationof Rs 2.5 billion (about US$57 million) for these projectsduring the Ninth Five-Year Plan. The Government ofIndia has expanded the coverage of the NCLPs to anadditional 150 districts and increases the budgetaryallocation to over Rs 6 billion (about US$131 million)during the Tenth Five-Year Plan (2003/07). Children inthe age group of 5 - 9 years were enrolled directly under
Thriving Art at Cost of Childhood: Present Scenario . . .

Life and Living Through Newer Spectrum of Geography296
the Sarva Shiksha Abhiyan or the Education for AllMovement commenced under the 10th Five Year Plan.Further, those in the age group of 9 - 14 were admittedto special schools under the NCLP schemes. Besides this,components of healthcare and vocational training werealso augmented.
Most significantly in 2001 - 02 the Governmentlaunched the Sarva Shiksha Abhiyan or the Educationfor All Programme which is an effort to universalizeelementary education. This programme aims to achievethe goal of universal elementary education of satisfactoryquality by 2010.
Schemes for Children under the 10th Five Year planinclude the Planning Commission’s Integrated Programmefor Street Children which aims to prevent the destitutionof children and engineer their withdrawal from streetsby providing facilities like shelter, nutrition, health care,education, recreation and protection against abuse andexploitation. Accordingly to the Government, during the10th Five Year Plan, over 200,000 children benefitted fromthis.
Further, the Scheme for Working Children in Needof Care and Protection by the Ministry of Women andChild Development provides non-formal education,vocational training to working children to facilitate theirentry into mainstream education. This scheme has beenimplemented through NGOs. According to theGovernment, around 7,000 children benefited from thisprogramme from 2005 - 2007.
The strategy outlined for the 11th Five Year plan(2007 - 12) includes expanding the NCLP scheme to ensureuniversal enrolment of children in the 6 - 14 age groupto cover those in the hard-to-reach segment. It alsoincludes substantial improvements in the quality andstandard of education and teacher training. Anothernotable Government initiative under the 11th plan is toamend all laws to recognize everyone under the age of

297
18 as children and to take appropriate measures to protecttheir rights accordingly.
In September 2009, IPEC launched a ConvergenceProject against Child Labour which covers 5 States -Bihar, Gujarat, Jharkhand, Madhya Pradesh and Orissa.The project will demonstrate effective convergence-basedmodels for elimination and prevention of child labourincluding trafficking/migration of children in each state.
Contribution by National Institutions
A number of national institutions such as the V.V.Giri National Labour Institute (VVGNLI) and the NationalInstitute of Rural Development (NIRD) and some statelevel institutes have played an important role in theareas of training and capacity building of governmentfunctionaries, factory inspectors, and officials of Panchayatraj institutions, NCLP project directors, and heads ofNGOs. These institutions have also made a significantcontribution in the areas of research and surveys,awareness raising and sensitization, thus bringing thediscussions on this issue to the forefront.
Suggestions and Conclusions
Carpet Industry in India is the largest source of foreignexchange and contributes a lot in the path of economicdevelopment .It became the significant small scale industryin India by providing an ample opportunity ofemployment. The magical art of Indian carpet gainedmuch popularity over the world market and rejuvenatedthe artistic skills of artisans of India. Although Indiancarpet industry achieved its best but under its artisticcomposition the social evil of child labours also thriving.There are number of efforts have been taken to eliminatethe child labour from this industry but still they havenot fully achieved their aim. No doubt the trend of childlabour from carpet industry has declining but not removedat desired level. Child labour is a significant problem in
Thriving Art at Cost of Childhood: Present Scenario . . .

Life and Living Through Newer Spectrum of Geography298
thriving art of carpet industry in India. The major causeof child labour is poverty. Even though children arepaid less than adults are, whatever income they earn isof benefit to poor families. In addition to poverty, thelack of adequate and accessible sources of credit forcespoor parents to use their children as bonded child laborers.Some parents also feel that a formal education is notuseful, and that children learn work skills throughworking. Art of weaving is passing through generationto generation leads one of the major cause for indulgenceof child labour in carpet industry in India. Another causeis poor access to education. In some areas, education isnot affordable, or is found to be inadequate. With noother alternatives, children inevitably spend their timein working. The Constitution of India clearly states thatchild labour is wrong and that measures should be takento end it. The government of India has set a minimumage of employment. If child labour is to be stopped inIndia, the government and those responsible forenforcement need to start doing their jobs. Policieswithout enforcement become useless. Education in Indiaalso needs to be improved. High illiteracy and dropoutrates reflect the low quality of the educational system.Poverty plays a role in the ineffectiveness of theeducational system. Dropout rates are high becausechildren are forced to work in order to support theirfamilies. The attitudes of the parents also contribute tothe lack of enrollment. Compulsory education may helpin regard to these attitudes. Hopefully the future willshow that progress will be made towards universaleducation, and stopping child labour. Child labour cannotbe eliminated by focusing on one cause, for exampleeducation, or by strict enforcement of child labour laws.The government of India must ensure that the needs ofthe poor are filled before attacking child labour. If povertyis addressed, the need for child labour will automaticallybe reduced. Children grow up illiterate because theyare working and not attending school. A cycle of poverty

299
is formed and the need for child labour is constant fromone generation to the next. India needs to deal withthe underlying causes of child labour and the enforcementof laws. Only then will India succeed in the fight againstchild labour.
References
1. “Children working in Carpet Industry in India: Prevelance andconditions”, research project in child labour working in carpetindustry in India, Nepal and Pakistan(2012), Submitted toUS Department of Labour by ICF international.inc.
2. D. C. Reddy (2007) “Child Labour –A case Study”, SerialPublication New Delhi
3. Grootaert, Christiaan; Kanbur, Ravi. 1995. “Child labour:An economic perspective”, International Labour Review(Geneva), Vol. 134 (1995), No. 2, pp. 187-203
4. Mehra-Kerplman,K(1996):Children at work:How many andwhere ?World of work,15:8-9
5. Nangia, P. (1987). Child Labour: cause-effect syndrome.Janak Publishers, New Delhi.
6. The Small hands of Slavery: Bonded Child Labour in India(1996). Human rights watch/Children’s Right project/Asia.
Thriving Art at Cost of Childhood: Present Scenario . . .

Life and Living Through Newer Spectrum of Geography300
18Tourism Development andUrbanization in Himalayas:A Case Study of Gangtok, Sikkim
Subrata Roy & Dr. Md. Julfikar Ali
ABSTRACT
Tourism is not only a growth engine but also anemployment generator. It provides 6-7 per cent of the world’stotal jobs directly and millions more indirectly through themultiplier effect as per the UN’s World Tourism Organization(UNWTO). During 2011, the number of Foreign TouristArrivals (FTAs) in India reached the level of 6.29 million,registering a growth of 8.9 percent over the FTAs of 5.78million in 2010. The growth rate of 8.9 percent in touristarrivals in India was almost double the growth of 4.4 percentin tourist arrivals worldwide (Annual Report – 2011-12).The Planning Commission has identified tourism as the secondlargest sector in the country in providing employmentopportunities for low-skilled workers. Tourism plays animportant role in economic development and creation of jobsin India. Tourism plays a key role in socio-economic progressthrough creation of jobs, enterprise, infrastructure developmentand revenue earnings.
The present paper analyses the symbiotic relation betweentourism development as well as increase of hospitality and
301
growth of urbanization. To investigate the impact onurbanization by the tourism development, different quantitativeand qualitative techniques have been adopted.
Key Words: Tourism, Eco-tourism, Hospitality industry,Urbanization.
Introduction
Tourism is not only a growth engine but also anemployment generator within the dimension of modernconcept of eco-tourism. The concept of tourism havebeen flourished back to ancient times when peopletravelled with a view of acquiring knowledge of virginlands and people, for the development of trade andcommerce, for religious preaching and also for the sheeradventure of discovery (Paul, 2013). The concept hasbeen changed in the period of great age of exploitation.The World Tourism Organization (WTO) has defined thattourism involves travelling to relatively undisturbednatural areas with a specific object of studying,appreciating and enjoying with nature and its virgin floraand fauna as well as the existing cultures of the originalinhabitants of the tourist centres. In the modern timethe concept of tourism has been rejuvenated by eco-tourism. The term 'ecotourism', like 'sustainable tourism',is considered by many to be an oxymoron. Ecotourismis a form of tourism involving visiting fragile, pristine,and relatively undisturbed natural areas, intended as alow impact and often small scale alternative to standardcommercial (mass) tourism. Its purpose may be to educatethe traveler, to provide funds for ecological conservation,to directly benefit the economic development and politicalempowerment of local communities, or to foster respectfor different cultures and for human rights. Since the1980s ecotourism has been considered a critical endeavorby environmentalists, so that future generations mayexperience destinations relatively untouched by humanintervention. Generally, ecotourism deals with living parts
Tourism Development and Urbanization in Himalayas
Life and Living Through Newer Spectrum of Geography302
of the natural environments. Ecotourism focuses onsocially responsible travel, personal growth, andenvironmental sustainability. Ecotourism typically involvesthe travel to destinations where flora, fauna, and culturalheritage are the primary attractions. In fact the systemof ecotourism involves a combination of travel, destinationand marketing, which lead to a process of its culturaldimension. Tourism is the world’s largest growingindustry, with 691 million international tourist arrivalsworldwide, generating $US 523 billion per year (WTO,2004), with an expectation of annual growth rate of 4.1percent over the next 20 years (Lama and Sattar, 2002).As per an estimation mountains have approximately 15-20 percent share of the global tourism market, generatingbetween $US 70 and 90 billion per year (PAIA, 2005).After coastal regions, mountains are thought to be secondin global popularity as tourist destinations (Walder, 2000).
Research on tourism has been highly fragmented,with researchers following separate and often divergentways. There are different researchers who had workedon different paper for tourism. Paul, (2013) focused ontourist prefer Gangtok city to start their travel originfor the basic transport, lodging, tour information etc.facilities. Rizal, et al. (2013) focused on the per capitaState Gross Domestic Product is increasing along withthe growth of the tourism sector, and it also resulted inthe economic benefit in the regional growth. Baneerjee,et. al. (2011) tried to analyse the challenges of tourismdevelopment in west Bengal. She had given an overview of how tourism can be improved in west Bengaland observed that both tourism and urban developmentare complementary. Chakrabati, (2009) studied that thegrowth story and rapid expansion of tourism activitiesmay be viewed as one of the prime contributors towardsthis positive turn around in sustaining overall growthof the state’s economy. Chettri, et. al. (2008) in his paperhad focused on mass tourist spots digging their owngraves and the emerging global market for ethnic and

303
unique experiences has given rise to enterprises operatingunder the banner of ecotourism in various parts of theworld. He also focused on the increasing importance asa business opportunity and its phenomenal growth withinthe larger tourism industry has made the concept ofecotourism quite popular in developing countries, it alsohelped the urban development. Eward, et.al. (2007) studiedthe tourism development of Australia, found major touristspots in Australia and its relation to other urbandevelopment. Jago, et. al. (2007), mainly focused on thesignificance of urban tourism in Australia, and analysehow it has demand and supply factors, and observedthe impact of tourism. Lal (2002) focused on her studyhow urban tourism can reduce urban poverty; she hadfocused on the pink city of Jaipur. She had focused onthe changing role of tourism and how tourism has amultiplier effect in income generation and employmentgeneration. Lew, (1987) studied the tourism planningsystem and its effect on the traditional way of urbandevelopment. Estelaji, et. al. (2011) tried to examine theimpact of urban tourism on the urban sustainabledevelopment as well as sustainable urban environment.
Study Area
Indian state of Sikkim has been considered a potentialtourist zone in the Himalayan region. Gangtok is amunicipality, the capital and the largest town of the Indianstate of Sikkim. It is the headquarters of the East Sikkimdistrict. Gangtok is located in the eastern Himalayanrange, at an altitude of 1,650 m (5,410 ft). The city ofGangtok as well as state of Sikkim characterized bybeautiful terrains, varying in altitude from lofty mountainsto valley floors dissected by perennial rivers. It is Tista,Sebozung, Rangit, Lachen, Zemu, Lhonak, Lachung rivesdivide the region into several units. The major wildlifesanctuaries o f the state is FambongLho, Alpine Sanctuary,Shingba Rhododendron Sanctuary, Maenam Wild LifeSanctuary and Kanchendzonga National Park. Yumthang
Tourism Development and Urbanization in Himalayas

Life and Living Through Newer Spectrum of Geography304
Valley, Chopta Valley, Lachen Valley comprises withvariety of natural fauna which includes almost 3000species of flowering plants, 11 species of oak, 250 speciesof ferns, 40 species of primulas and 350 species ofmedicinal plants and herbs(Paul, Suman.2013). Moreover,some high altitudes Lake especially, Gurudongmar Lake,Tsomgo Lake, Khechipalri Lake, Green Lake, MemanchoLake enrich the beauty of the natural landscape. Fromthe general survey, we know that tourist are preferGangtok city to start their travel origin for the basictransport, lodging, tour information etc. facilities. Mostof the time tourist spent their time to acclimatize withthe alpine climate and necessary tourist information.Within this short time of two to three days, touriststravel the surrounding places of Gangtok.

305
During the past few years Gangtok has beenexperiencing a regular growth in the number of touristsvisiting the state accounting an increase from 41,000persons in 1985 and to 2, 25,500 persons in 2005 (Paul,2013). As a result it is expected that in the next 20 yearsthe number of tourists visiting Gangtok would increaseby at least 10,000 per year (Master plan for Gangtok,2020-UD & HD, Government of Sikkim).
Gangtok is the major city of Sikkim has potentialcommand area over various tourist spots in East Sikkimas well as state of Sikkim which are directly connectedby road network and the Gangtok is a nodal point. Thetourist attractions of Sikkim are clustered mostly in andaround Gangtok, the state capital. The town is knownas Gangtok Municipal Corporation. Gangtok town arehill station in the north, which is gradually increasedtheir altitude and leading up to the ranges of theKanchendzonga, which are towards the north west ofGangtok and the third highest mountain of the world.Trade and commerce are the most important functionallinkages between Gangtok and its neighboring regionsand the city is known as best hospitality industry in themountain Himalaya.
Tourism in Gangtok
The precise meaning of the name Gangtok is unclear,though the most popular meaning is hill top. Gangtokrose to prominence as a popular Buddhist pilgrimagesite after the construction of the Enchey Monastery in1840. In 1894, the ruling Sikkimese Chogyal, ThutobNamgyal, transferred the capital to Gangtok. In the early20th century, Gangtok became a major stopover on thetrade route between Lhasa in Tibet and cities such asCalcutta in British India. After India won its independencefrom Britain in 1947, Sikkim chose to remain anindependent monarchy, with Gangtok as its capital. Today,Gangtok is a centre of Tibetan Buddhist culture and
Tourism Development and Urbanization in Himalayas

Life and Living Through Newer Spectrum of Geography306
learning, with the presence of several monasteries,religious educational institutions. Due to lack ofagricultural land and scanty of minerals, the industrialdevelopment has not been established. But tourism andeco-tourism have been reduced the luck of industrialdevelopment. The hospitality industry is the largestindustry in Gangtok as the city is the main base forSikkim tourism. Summer and spring seasons are the mostpopular tourist seasons. Many of Gangtok's residentsare employed directly and indirectly in the tourismindustry, with many residents owning and working inhotels and restaurants. Ecotourism has emerged as animportant economic activity in the region which includestrekking, mountaineering, river rafting and other natureoriented activities. The tourist attraction in Gangtok canbe classified under (i) Monasteries, (ii) Naturalsightseeing, (iii) Cultural and historical places. (iv)Manmade sightseeing and (v) Sanctuaries of differentkinds viz., alpine and wildlife sanctuaries.
The tourist attraction places of Gangtok as well asSikkim are-
1. Monasteries-Rumtek Monastery, Enchey Monastery
2. Natural sightseeing-Tsomgo Lake, Tashi ViewPoint, Bridge B2 Water Falls, Nathula Pass.
3. Cultural and historical places-Directorate ofHandicraft and Handloom, Do-Drul Chorten,Tibetology, Sa-ngor-Chotshog Centre.
4. Manmade sightseeing-Ganesh Tok, Hanuman Tok,Flower Show, Saramsa Garden, JLN BotanicalGarden, Tourist Village, Rumtek, ZoologicalGarden, Coronation Garden and Deer Park.
5. Sanctuaries of different kinds viz., alpine andwildlife sanctuaries-Fambhong-Lho WildlifeSanctuary, Kyagnos-la Alpine Sanctuary.
6. Mountains - Mt. Kanchendzonga is the third

307
highest Mountains of the World., Mt. Siniolchuis the most beautiful Mountain of the World.
7. Hot Springs-Phurchachu (Reshi), Yumthang,Borong. (Sikkim Hot Springs are known for theirmedicinal and therapeutic value.)
8. Passes-Nathula Jelepla, Bamchho La and Sese Laetc.
9. Other major type of tourist spots are Lachen,Lachung, Yamthang, Chungthang, Gyalshing,peling, Dentam, Bakhim Cave, Namchi, Borng,Singtham, Rongpo, Chuzachen etc.
Objectives
Major objectives of the present paper are as follows;
1. To assess the tourism infrastructure and as wellas hospitality industry in the Gangtok city.
2. To find out the tourism is the main causes ofurbanization and urban expansion in state capitalof Sikkim.
3. To demarcate the zone of influence of the studyarea.
4. To project future urban trend and urban populationpattern.
Database and Methodology
To analyze the impact of tourism on Gangtok urbansettlement, the data have been collected from varioussources. Secondary data have been collected from Censusof India, District Statistical Handbook and GangtokMunicipal Corporation. Primary data have been collectedthrough field investigation of different wards of GangtokMunicipal Corporation and the adjoining area of GangtokUrban settlement.
Tourism Development and Urbanization in Himalayas

Life and Living Through Newer Spectrum of Geography308
To investigate the impact on urbanization by thetourism development, both qualitative and quantitativemethods have been adopted. However, in quantitativeanalysis both simple and standard statistical techniqueshave been used for analyzing the study.
1. A more accurate method of showing therelationship between two variables is Regression Co-efficient analysis.
The equation is Yc= a+bx.
Data Analysis and Discussion
The Regional Economy and Tourism
The economy of the Indian state of Sikkim vastlydepends on the natural beauty, forest resources andagricultural activities. Sikkim is a small Himalayan state,but there has been remarkable growth in the regionaleconomy by the help of natural beauty, forest andagriculture. The increase in the state’s Gross DomesticProduct (GDP) shows the similar fact. Table 1 showsper capita state’s GDP in US$, which is increasing everyyear. The average annual growth rate of per capita state’sGDP has increased at a CAGR (Compound AnnualGrowth Rate) of 23.7 per cent from 2004-05 to 2011-12.It has increased from $ 683.0 in the year 2000-01 to $2844 in the year 2011-12. (Sikkim –IBEF report, August2013). Trade, tourism, transport and agriculture are thekey drivers to the state’s GDP (Sikkim –IBEF report,November 2010). Among all the three sectors, tertiarysector is the highest contributor to the state economy. Itis 48 percent and mainly driven by the real estate, trade,transportation, communication, hotels which arecollectively known as hospitality industry (Rizal, 2013).Tourism is one of the important economic sectors of thestate. Sikkim is one of the best hill destinations for thetourist at the global level. Sikkim has the perfect blendof natural wealth and topography, which ranges fromtropical to temperate to alpine. The state is richly endowed

309
with thick forests, flora and fauna, lakes, glaciers andmountain peaks, which makes it a tourist paradise. Thestate is well known for nature and trekking tourism,ecotourism, village and home stay tourism, adventuretourism, culture and heritage tourism (Sikkim –IBEFreport, august 2013). The growth in tourism sector canbe observed with the increasing inflows of tourists overa period of time in the region.
Table 1: Per capita state’s GDP (US $ million) andinflows of tourists and Degree of urbanization
Sl. Year Domestic Foreign Total Per capita UrbanizationNo. Year tourist tourist number GSDP rate
(persons) (persons) of tourist (US$arrival million)
(persons)
1 2001 192354 7757 200111 431.5 11.07 %
2 2002 203835 8539 212374 475.4
3 2003 220824 10954 231778 553.0
4 2004 286687 13528 300215 683.5
5 2005 347650 16518 364168 785.1
6 2006 421943 18049 439992 821.5
7 2007 465204 17837 483041 1060.9
8 2008 512373 21162 533535 1182.1
9 2009 615628 17730 633358 2148.7
10 2010 700000 20800 720800 2574.4
11 2011 552500 23900 576400 2844.4 25.15%
Source: Computed by authors from department of tourism, Governmentof Sikkim, India Brand Equity Foundation
It is clear from the Table 1 that, the inflows of touristshave increased over time. It has increased from 200111in 2001 to 576400 in 2012 at an average decadal growthrate of 188.04 percent. As per record of tourist inflowsin Sikkim, the increase of domestic tourist was 187.23percent and foreign tourist 208.10 percent from 2001 to2011 (decadal growth rate). In 2011, the inflow of domestictourist has decreased by 21.07 percent from that in 2010.The major cause of decrease of inflows of domestic tourist
Tourism Development and Urbanization in Himalayas

Life and Living Through Newer Spectrum of Geography310
was abundant rain fall, landslides and social and politicalfactors. But the Tourism industry has its wide impacton state economy. The increasing rate of tourist inflowin Sikkim are providing employment and money to thelocal people and it results are shown in the income levelof the people of the Sikkim. Due to the increase of touristin the Sikkim, the Per Capita GSDP also increased inlast decade in 559.19 percent.
The Government of Sikkim addressed eco-tourismas a priority sector and therefore, the Sikkim eco-tourismpolicy has been developed proactively by the state withan aim not only to ensure sustainable livelihood of thelocal people but to protect and manage forest, as well.The Sikkim government has been creating touristcomplexes, ecotourism, adventure tourism, ethnic–culturetourism, health farms, hotels, convention centres, touristtravel services etc.
Fig. 1 Relationship between Tourist Arrival and Per Capita GSDP

311
The economy of the Gangtok town is mainly basedon the tourism and business sector. Tourism infrastructureare consist of mainly a large number of good hotels,well networked to different tourist spots, good connectedtransport, health units, marketing etc. to promote thegrowth and development of tourism. The hospitalityindustry is the largest industry in Gangtok as the city isthe main base for Sikkim tourism. Summer and springseasons are the most popular tourist seasons. Many ofGangtok’s residents are employed directly and indirectlyin the tourism industry, with many residents owningand working in hotels and restaurants.
Relationship between tourist arrival and per capitaGSDP of Sikkim
Figure 1 analyses the relationship between touristarrival and the per capita GSDP in Sikkim. The trendline of the regression analysis is revealing very positiverelation. Both tourist arrival and per capita GSDP increasesproportionately over time. The tourist arrival has increasedfrom 200111 persons in 2001 to 576400 persons in 2012at an average decadal growth rate of 188.04 percent. Asper record of tourists inflows in Sikkim, the increase ofdomestic tourists was 187.23 percent and foreign tourists208.10 percent from 2001 to 2011 (Table 1). It can beconcluded that the hospitality development has attracteddomestic as well as foreign tourists. Presently the Gangtokis flourishing with 211 hotels (17 hotels of grade-1, 137hotels of grade-2 and 57 hotels of grade-3) (SikkimTourism, Govt. of Sikkim). Beside many of Gangtok’sresidents are employed directly and indirectly in thetourism industry, with many residents owning andworking in hotels and restaurants.
Tourism as the Catalyst of Urbanization and Urban Growth
The uniform Urbanization has not been seen all overthe world. The dawn of modern civilization saw the
Tourism Development and Urbanization in Himalayas

Life and Living Through Newer Spectrum of Geography312
Tab
le 3
: D
egre
e of
Urb
aniz
atio
n a
nd
Rat
e o
f U
rban
izat
ion
of
Sik
kim
In
200
1 To
201
1
Dis
tric
tsTo
tal
Pop
ula
tion
Urb
anU
rban
izat
ion
(%G
row
th o
f(R
ural
+ u
rban
)P
opu
lati
onu
rban
po
pula
tion
to
urb
anto
tal
popu
lati
on)
popu
lati
on
(%)
2011
2001
Gro
wth
(%
)20
1120
0120
1120
01
No
rth
Dis
tric
ts43
709
4103
06.
5346
4412
4810
.62
3.04
272.
12
Sou
th D
istr
icts
1468
5013
1525
11.6
521
199
3946
14.4
33.
0043
7.23
Wes
t D
istr
icts
1364
3512
3256
10.6
952
4818
243.
851.
4818
7.72
Eas
t D
istr
icts
2835
8324
5040
15.7
312
2487
5285
243
.19
21.5
713
1.75
Stat
e o
f Si
kk
im61
0577
5408
5112
.89
1535
7859
870
25.1
511
.07
156.
52
Sou
rce:
Co
mp
ute
d b
y a
uth
ors
, d
ata
fro
m C
ensu
s of
In
dia
200
1 an
d 2
011.
313
spread of urbanization to all over the world and withthe spread of globalization, all the places get connectedwith each other. Developed and developing places aremoving towards more urbanized condition. Thephenomenon of urbanization therefore occurs on an areaand involves links and nodes to create a total system.Urbanization is not a simple phenomenon, no it is uniformspatially.
Gangtok is located in Sikkim which is Indian leastpopulous state. In 2011 it had 607688 inhabitants withpopulation density 86 persons per square kilometers. Itsgrowth rate between 2001 and 2011 was 12.89 percent.The urban population constitutes 11.07 percent to totalpopulation. Urbanization in the state of Sikkim has beenunequal over the years. As per 2011 census there are 9urban centres which are accommodating a populationof 151726 persons. The east districts have 4 urban centresincluding Gangtok the capital of the state with apopulation of 98658 persons (Census 2011). More than79 percent of urban population of the state is concentratedin the east district of which 82 percent resides in GangtokMunicipal Corporation. Gangtok indicates the highestgrowth rate along with greater population size amongstall urban centres in the state. The Rate of urbanizationhas been geometrically increased in all districts excepteast district. Highest 437.23 percent growth rate of urbanpopulation has been recorded in south district in thestate. A vast gap between very little growth of totalpopulation and exceptionally higher growth of urbanpopulation reveals a mass concentration of urbanpopulation due to the fast growth of hospitality industriesthere.
Tourism is one of the important sectors of the state.The 48 percent of state GDP is driven by the real estate,trade, transportation, communication, hotels which arecollectively known as hospitality industry (Rizal, 2013).Sikkim is one of the best hill destinations at the globallevel. Sikkim is the perfect blend of natural wealth and
Tourism Development and Urbanization in Himalayas
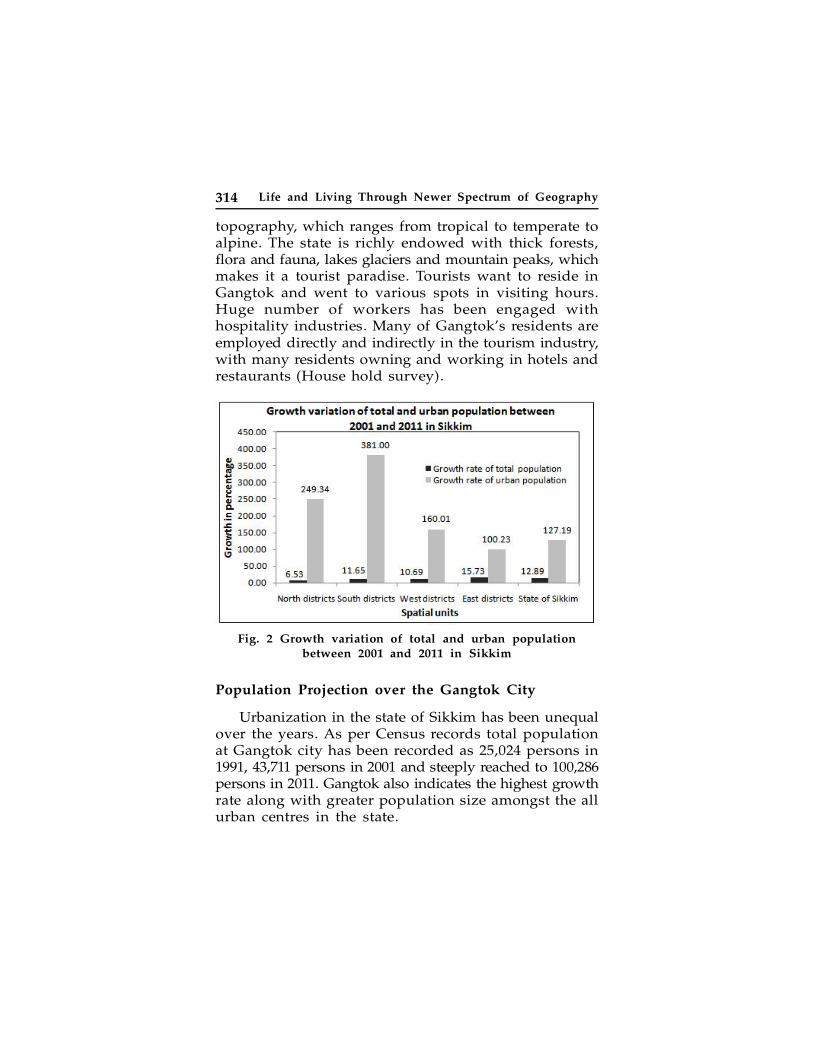
Life and Living Through Newer Spectrum of Geography314
topography, which ranges from tropical to temperate toalpine. The state is richly endowed with thick forests,flora and fauna, lakes glaciers and mountain peaks, whichmakes it a tourist paradise. Tourists want to reside inGangtok and went to various spots in visiting hours.Huge number of workers has been engaged withhospitality industries. Many of Gangtok's residents areemployed directly and indirectly in the tourism industry,with many residents owning and working in hotels andrestaurants (House hold survey).
Fig. 2 Growth variation of total and urban populationbetween 2001 and 2011 in Sikkim
Population Projection over the Gangtok City
Urbanization in the state of Sikkim has been unequalover the years. As per Census records total populationat Gangtok city has been recorded as 25,024 persons in1991, 43,711 persons in 2001 and steeply reached to 100,286persons in 2011. Gangtok also indicates the highest growthrate along with greater population size amongst the allurban centres in the state.

315
Table 5: Estimated populations, Gangtok
Source: Computed by authors from Census of India 1991, 2001 & 2011
On the basis of simple arithmetic progression method,population for the years 2021 and 2031 have beenestimated as 156, 861 persons and 213,436 personsrespectively (Table 5).
Conclusion
The settlement of Gangtok initially established toprominence as a popular Buddhist pilgrimage site afterthe construction of the Enchey Monastery in 1840. Inthe early 20th century, Gangtok became a major stopoveron the trade route between Lhasa in Tibet and citiessuch as Calcutta in British India. In 1990, the Gangtokcity as well as all the tourist spots of Sikkim has beenopened out to foreign tourist. In the present periodGangtok city would be able to maintain a sustainablegrowth in tourism. The concept of eco-tourism is alsohelpful for this sustainable growth. The eastern Himalayais known as bio-diversity hotspot, so the natural sitealso a tourist destination in mountain Sikkim. The averageannual growth rate of per capita Gross State DomesticProduct has increased at a CAGR (Compound AnnualGrowth Rate) of 23.7 per cent between 2004-05 and 2011-12. It is 48 percent and it is driven by the real estate,trade, transportation, communication, hotels which arecollectively known as hospitality industry. TheGovernment of Sikkim addresses eco-tourism as a prioritysector and therefore, the Sikkim Eco-tourism Policy hasbeen developed proactively by the State with an aim
Census Year Population of Gangtok city Actual Arithmetic progression
1991 25,024 - 2001 43,711 - 2011 100,286 - 2021 - 156,861 2031 - 213,436
Tourism Development and Urbanization in Himalayas

Life and Living Through Newer Spectrum of Geography316
not only to ensure sustainable livelihood of the localpeople but to protect and manage forest, as well. Thenew employment (hospitality industry) opportunities dueto fast flourishing tourism Gangtok is showing animpressive growth of urban population. At present 79percent of urban population in the state is concentratedin the east district of which 82 percent reside in GangtokMunicipal Corporation. For further tourism developmentin the study area Government of Sikkim may take acomprehensive plan and policy, since it is moneygenerative industry and contributed a lion’s share inthe state gross domestic product.
References
Annual Report – 2010-11, Department of Tourism, Governmentof Sikkim.
Annual Report – 2011-12, Ministry of Tourism, Government ofSikkim.
Chakrabarti, Anjan. (2009), “Tourism in Sikkim: Quest for A Self-Reliant Economy”. The NEHU Journal, Vol VII, No. 1,pp89-104
Chettri, Nakul.et.al. (2008), “Ecotourism development in theKangchenjunga Landscape: potentials and challenges”,Biodiversity Conservation in the Kangchenjunga Landscape,Ed. Chettri, N., Shakya, B., Sharma, E. Kathmandu: ICIMOD,pp.123-131
Govt. of Sikkim 1991, Master Plan for Gangtok, 2020, Urbandevelopment and Housing Department, Govt. of Sikkim
Joshi, R. and Dhyani, P. P. (2009) “Environmental sustainabilityand tourism –implications of trend synergies of tourismin Sikkim Himalaya”. CURRENT SCIENCE, VOL. 97, NO.1, PP-33-41
Lama, W.B., and Sattar, N. (2002), “Mountain Tourism, and theConservation of Biological and Cultural Diversity”.ThematicPaper for the Bishkek Global Mountain Summit. Nairobi:UNEP.
PAIA (2005), Mountain Tourism: Making it Work for the Poor.Rome: Sustainable Management of Mountains, PAIA (PAIA-MTNS), FAO.

317
Paul, Suman. (2013) “Analysis Of Tourism Attractiveness UsingProbabilistic Travel Model: A Study On Gangtok And ItsSurroundings.” European Journal of Geography Volume 4,Issue2: pp 46-54.
Rizal, Praveen.et.al. (2013) “An Overview of Tourism Industryand Its Impact on the Heath Status in SikkimState.”Language in India, Vol. 13:4, pp-145-152.
Sikkim ecotourism policy, Sikkim Biodiversity Conservation andForest Management Project (SBFP) Department Of Forest,Environment And Wildlife Management, Government OfSikkim, Deorali, Gangtok - 737102 India.
Sikkim: A Statistical Journal 2013 (Draft). Department of Economics,Statistics, Monitoring & Evaluation Government of Sikkim.
Sikkim: A statistical profile - (2012–13), Directorate of Economics,Statistics, Monitoring and Evaluation, Government of Sikkim.
Walder, G. (2000) Tourism Development and EnvironmentalManagement in Nepal: A Study of Sagarmatha NationalPark and the Annapurna Conservation Area Project, withSpecial Reference to Upper Mustang, MSc Thesis.Bournemouth: International Centre for Tourism andHospitality Management, Bournemouth University.
Tourism Development and Urbanization in Himalayas