Focal mechanisms and depths of earthquakes in central Pakistan: A tectonic interpretation
12
JOURNAL OF GEOPHYSICAL RESEARCH, VOL. 89, •0. B4, PAGES 2459-2470, APRIL 10, 1984 FOCAL MECHANISMS AND DEPTHS OF EARTHQUAKES IN CENTRAL PAKISTAN: A TECTONIC INTERPRETATION Richard C. Quirtmeyer,I, 2 Alan L. Kafka,3 and John G. Armbruster Lamont-Doherty Geological Observatory of Columbia University Abstract. Focal mechanisms and depths for nodal planes have been significantly different in seven earthquakes in central Pakistan were de•er- some cases. Thus it has not been possible to mined from an analysis of Rayleigh waves of 20- gain a clear understanding of the tectonic to 50-s periods. In east-central Pakistan, the processes at work in this region of complicated nodal planes for some solutions strike obliquely structure. to the grain of surface structures. This obser- To resolve more precisely the focal parameters vation supports the contention of other workers for at least some of these earthquakes, we have that a thin surficial unit, decoupled from the analyzed the vertical component of Rayleigh basement along a surface of dacollement, waves, as recorded at stations of the World-Wide characterizes this region. In west-central Standard Seismograph Network (WWSSN), to deter- Pakistan, relative movement between the Indian mine the focal mechanisms and depths of seven and Eurasian plates is at least partially shocks in central Pakistan. An event-pair method accommodated by seismic slip along the Chaman was used in which both amplitude and phase of fault. Other faults, which are situated to the Rayleigh waves are analyzed. This method east of and lie subparallel to the Chaman fault, involves a trial-and-error search of a solution may also take up some of the relative plate space, composed of the depth, strike, slip, and motion. Observed activity within the zone of dip of both events, to minimize simultaneously convergent-type structure in central Pakistanmay the average residuals (02 ) between observed and be a result of the greater component of conver- calculated values for the following parameters: gence across the Indian-Eurasian plate boundary the difference in focal phase between the two north of Quetta, Pakistan. events, the ratio of spectral amplitudes between the two events, and the spectral amplitude of the Introduction individual events [Weidner and Aki, 1973; Kafka and Weldher, 1979]. If the two events being The central portion of Pakistan, where the compared are located near to each other, the north-south structural grain of the Central paths from the epicenters to stations in common Brahui range bends sharply to the east for about will be very similar. Thus by considering phase 250 km before resuming a northerly trend in the difference rather than phase, the effect of Sulaiman range (Figure 1), has one of the higher propagation on the phase data is largely levels of seismic activity observed in Pakistan. eliminated. The surface wave methods are Although no great earthquakes (M s > 8) are discussed in detail by Quirtmeyer and Kafka [this documented for this area, at least 16 moderate to issue]. large shocks (6 < M s < 8) have occurred since The tectonic processes in central Pakistan are the late 1800's within the region bounded by reevaluated in this paper based on the focal latitudes 28 ø and 31øN and longitudes 66ø and mechanisms and depths of the seven events 71øE (Figure 1). Fault plane solutions, based on studied, the distribution of seismicity deter- the first motions of P waves and the polarization mined from both teleseismic and local networks, of S waves, have been determined for a number of and the orientation of rupture zones inferred the more recent of these events [Nowroozi, 1972; from aftershocks and intensity data. Seismic Molnar et al., 1973; Chandra, 1978; Quittmeyer et data from the Marri Bugti Hills (Figure 1) are al., 1979]. Unfortunately, the quality of the consistent with, but do not rigorously confirm, body wave arrivals and their distribution on the the suggestion of several workers that the focal sphere do not allow the orientation of the surficial layers in this area are decoupled from nodal planes to be constrained rigorously. the basement along a dacollement surface. In the Different authors have interpreted data for the west, near the Chaman fault, left-lateral move- same earthquake to show drastically different ment between the Indian and Eurasian plates is types of fault motion (e.g., strike slip versus accommodated within a broad shear zone. Taken thrust). Even when the type of faulting is together, these observations suggest a rough agreed upon, estimates of the strikes of the analogy between the transform fault system in Pakistan and the San Andreas fault system in California. .., Three of the moderate-sized earthquakes that 1Also at Department of Geological Sciences, occurred in the Marri Bugti Hills were preceded Columbia University. by foreshocks. Several cases have been docu- 2Now at Woodward-Clyde Consultants. mented in which the focal mechanism of a fore- 3Now at Departmentof Geology and Geophysics, shock differs from that of its associated main Boston College. shock [e.g., Ishida and Kanamori, 1978; Kisslinger, 1980]. In central Pakistan, however, Copyright 1984 by the American Geophysical Union. this type of change was not observed. Within the precision of the methods used, the mechanisms of Paper number 3B1512. the foreshocks and associated main shocks were 0148-0227/84/003B-1512505.00 the same. 2459
-
Upload
rizzoassoc -
Category
Documents
-
view
0 -
download
0
Transcript of Focal mechanisms and depths of earthquakes in central Pakistan: A tectonic interpretation

JOURNAL OF GEOPHYSICAL RESEARCH, VOL. 89, •0. B4, PAGES 2459-2470, APRIL 10, 1984
FOCAL MECHANISMS AND DEPTHS OF EARTHQUAKES IN CENTRAL PAKISTAN: A TECTONIC INTERPRETATION
Richard C. Quirtmeyer,I, 2 Alan L. Kafka, 3 and John G. Armbruster
Lamont-Doherty Geological Observatory of Columbia University
Abstract. Focal mechanisms and depths for nodal planes have been significantly different in seven earthquakes in central Pakistan were de•er- some cases. Thus it has not been possible to mined from an analysis of Rayleigh waves of 20- gain a clear understanding of the tectonic to 50-s periods. In east-central Pakistan, the processes at work in this region of complicated nodal planes for some solutions strike obliquely structure. to the grain of surface structures. This obser- To resolve more precisely the focal parameters vation supports the contention of other workers for at least some of these earthquakes, we have that a thin surficial unit, decoupled from the analyzed the vertical component of Rayleigh basement along a surface of dacollement, waves, as recorded at stations of the World-Wide characterizes this region. In west-central Standard Seismograph Network (WWSSN), to deter- Pakistan, relative movement between the Indian mine the focal mechanisms and depths of seven and Eurasian plates is at least partially shocks in central Pakistan. An event-pair method accommodated by seismic slip along the Chaman was used in which both amplitude and phase of fault. Other faults, which are situated to the Rayleigh waves are analyzed. This method east of and lie subparallel to the Chaman fault, involves a trial-and-error search of a solution may also take up some of the relative plate space, composed of the depth, strike, slip, and motion. Observed activity within the zone of dip of both events, to minimize simultaneously convergent-type structure in central Pakistan may the average residuals (0 2 ) between observed and be a result of the greater component of conver- calculated values for the following parameters: gence across the Indian-Eurasian plate boundary the difference in focal phase between the two north of Quetta, Pakistan. events, the ratio of spectral amplitudes between
the two events, and the spectral amplitude of the Introduction individual events [Weidner and Aki, 1973; Kafka
and Weldher, 1979]. If the two events being The central portion of Pakistan, where the compared are located near to each other, the
north-south structural grain of the Central paths from the epicenters to stations in common Brahui range bends sharply to the east for about will be very similar. Thus by considering phase 250 km before resuming a northerly trend in the difference rather than phase, the effect of Sulaiman range (Figure 1), has one of the higher propagation on the phase data is largely levels of seismic activity observed in Pakistan. eliminated. The surface wave methods are Although no great earthquakes (M s > 8) are discussed in detail by Quirtmeyer and Kafka [this documented for this area, at least 16 moderate to issue]. large shocks (6 < M s < 8) have occurred since The tectonic processes in central Pakistan are the late 1800's within the region bounded by reevaluated in this paper based on the focal latitudes 28 ø and 31øN and longitudes 66 ø and mechanisms and depths of the seven events 71øE (Figure 1). Fault plane solutions, based on studied, the distribution of seismicity deter- the first motions of P waves and the polarization mined from both teleseismic and local networks, of S waves, have been determined for a number of and the orientation of rupture zones inferred the more recent of these events [Nowroozi, 1972; from aftershocks and intensity data. Seismic Molnar et al., 1973; Chandra, 1978; Quittmeyer et data from the Marri Bugti Hills (Figure 1) are al., 1979]. Unfortunately, the quality of the consistent with, but do not rigorously confirm, body wave arrivals and their distribution on the the suggestion of several workers that the focal sphere do not allow the orientation of the surficial layers in this area are decoupled from nodal planes to be constrained rigorously. the basement along a dacollement surface. In the Different authors have interpreted data for the west, near the Chaman fault, left-lateral move- same earthquake to show drastically different ment between the Indian and Eurasian plates is types of fault motion (e.g., strike slip versus accommodated within a broad shear zone. Taken thrust). Even when the type of faulting is together, these observations suggest a rough agreed upon, estimates of the strikes of the analogy between the transform fault system in
Pakistan and the San Andreas fault system in California.
.., Three of the moderate-sized earthquakes that 1Also at Department of Geological Sciences, occurred in the Marri Bugti Hills were preceded
Columbia University. by foreshocks. Several cases have been docu- 2Now at Woodward-Clyde Consultants. mented in which the focal mechanism of a fore- 3Now at Department of Geology and Geophysics, shock differs from that of its associated main
Boston College. shock [e.g., Ishida and Kanamori, 1978; Kisslinger, 1980]. In central Pakistan, however,
Copyright 1984 by the American Geophysical Union. this type of change was not observed. Within the precision of the methods used, the mechanisms of
Paper number 3B1512. the foreshocks and associated main shocks were 0148-0227/84/003B-1512505.00 the same.
2459
2460 Quittmeyer et al.: Tectonics of Central Pakistan
• • J7 FEB 66, 2$HI
40'
MARRI • INDIAN "•' HILLS ..
i i i as ø 74 •
Fig. 1. Regional tectonic setting for central Pakistan. Earthquakes with magnitudes greater than 5 that occurred from January 1914 through April 1975 [Quirtmeyer and Jacob, 1979] are represented by the following: hexagon, 8>M<7; circle, 7>M>6; square, 6>M>5. Three earthquakes located along the Chaman fault after April 1975 (October 3, 1975; March 16, 1978; and May 6, 1978) are also shown. The symbols for those events analyzed in this study are solid and labeled with their dates. The dashed lines enclose areas that reached intensity VIII during four large earthquakes. The numbers
' within the hexagon symbols denote the following earthquakes: 1, August 24, 1931, Sharigh earthquake; 2, August 27, 1931, Mach earthquake; 3, May 30, 1935, Quetta earth- quake. The inset shows a simplified view of the plate tectonic setting.
Tectonic Setting the Hazara region of the northwestern Himalayas [Seebet and Armbruster, 1979]). Klootwijk et
Relative movement between the Indian and al. [1981] found, based on paleomagnetic data, Eurasian plates appears to be responsible, that sediments near Loralai (Figure 5) have directly or indirectly, for most of the seismic undergone a clockwise rotation of 50 ø since early activity and tectonic structure that is observed Eocene. Samples obtained south of Quetta exhibit in central Pakistan. The Chaman fault, which no rotation relative to India; those obtained in extends for about 900 km from southern Pakistan the southern Sulaiman range, east of the Kingri to north of Kabul, Afghanistan [Wellman, 1966], fault (Figure 5), show a complicated history of is the most prominent fault observed at the rotations that is not easily unraveled. surface that is directly associated with this Klootwijk et al. [1981] interpret these observa- movement. Geomorphic evidence [Wellman, 1966; tions as further evidence of a d•collement style Lawrence and Yeats, 1979], surface offset during of deformation in this region. The focal a large earthquake in 1892 [Griesbach, 1893], and mechanisms and depths of the earthquakes focal mechanisms for more recent events considered in this study will be examined in [Quittmeyer et al., 1979; this study] all light of these hypotheses regarding thin-skinned indicate that movement along the Chaman fault is tectonics. left lateral in nature. Slip vectors for recent earthquakes trend slightly east of north, in good Data Sources and Analysis agreement with the direction of relative motion predicted from a worldwide model of plate inter- The focal mechanisms and depths of the earth- actions [Minster and Jordan, 1978]. quakes considered in this study were determined
As India has converged with Eurasia, or with from an analysis of the vertical component of continental blocks and island arcs that eventu- Rayleigh waves as recorded by long-period seis- ally were incorporated into Eurasia, the sedi- toometers of the WWSSN. Rayleigh waves in the mentary deposits along the edge of the Indian period range of 20-50 s formed the basis of the plate were deformed to produce a typical foreland analysis. An event-pair technique was used to fold-and-thrust belt [e.g., Powell, 1979; determine the focal mechanisms and depths; a Klootwijk et al., 1981]. In central Pakistan single-event method provided starting models for this fold belt is festooned, forming a syntaxis each solution. A short description of the method with its apex near Quetta (Figure 1). Recently, of analysis is given below; details of the a number of workers have suggested that the lobe procedure can be found in a companion paper of this festoon is allochthonous [Seeber and [Quittmeyer and Kafka, this issue]. Armbruster, 1979; Powell, 1979; Sarwar and In the event-pair method, two events that are DeJong, 1979; Klootwijk et al., 1981]. Its located near to each other are compared, and appearance is similar, although on a larger their focal parameters are estimated simultane- scale, to structures in other regions where ously. Since the distance between the events is evidence of detachment is more abundant (e.g., small, the paths from the two earthquakes to any
Quittmeyer et al.: Tectonics of Central Pakistan 2461
given station will be similar. Hence the effect western and southern margins of the Marri Bugti on the phase and amplitude spectra caused by Hills. A low level of activity is also observed propagation along these paths will be nearly the to the north, along the eastern edge of the same for both shocks. By considering the Sulaiman range. difference in phase between the two events and The Chaman fault ruptured in a large earth- their spectral amplitude ratio, the propagation quake in 1892. Left-lateral slip of 0.75 m was effects that are common to the observed spectra measured where a railroad crossed the fault near
for both earthquakes are largely canceled. Thus the town of Chaman [Griesbach, 1893]. The l•ngth we are able to base our estimate of the focal of the zone of rupture was at least 30 km, parameters not just on amplitude but also on suggesting that the earthquake had a seismic phase data. moment of at least 1026 dyn cm [Quirtmeyer and
The focal parameters are estimated, in the Jacob, 1979]. No other moderate to large event-pair method, by simultaneously minimizing (M o > 1025 dyn cm) earthquakes were located the average residual for the phase difference and along the Chaman fault until 1975. At that time spectral amplitude ratio between the two events an earthquake with a magnitude of 6.7 (M s) (o2(A•f) and o2(Ak/A1 ), respectively) and occurred just south of the known extent of the also for the spectral amplitude of the individual 1892 rupture. In 1978 two more earthquakes events (o2(Ak)). A trial-and-error search is occurred near the Chaman fault about 20-30 km used to find the values of depth, strike, slip, south of the 1975 event. These two shocks had and dip for both earthquakes that produce con- moments of 4 and 8 x 10²• dyn cm. The regional current minima in the residuals. The precision distribution of intensity for one of these events with which the focal parameters are known is suggests that the earthquake occurred on the thought to be, in general, about ñ15 ø for strike, Chaman fault [Yeats et al., 1979]. All three of slip, and dip and about ñ10 km for depth. the recent shocks were characterized by strike-
Initial solutions for the two earthquakes in •lip motion in a left-lateral sense along a an event pair (i.e., a starting model) are north-northeasterly striking nodal plane determined by a stepwise, linearized inversion [Quirtmeyer et al., 1979; this study]. for the components of the moment tensor based on In 1935 a large earthquake severely damaged only spectral amplitude data [Mendiguren, 1977]. the town of Quet•a. The distribution of after- Phase data are not included in this inversion shocks and intensity [Quirtmeyer and Jacob, 1979; procedure because the phase spectra for indivi- West, 1935] indicate that the 1935 earthquake dual events cannot be corrected for the effect of occurred on a fault subparallel to and east of propagation without more detailed knowledge of the Chaman fault. In the spring of 1978 a small the phase velocities for the various paths network of telemetered seismic stations was involved. established in the region around Quetta
[Armbruster et al., 1980]. Only a few earth- Recent and Historical Seismicity quakes were located withi n the inferred rupture
zone of the 1935 shock. Along a northward A number of large and damaging earthquakes extension of this inferred zone, however, a
have occurred in central Pakistan since the late higher level of activity was detected. A compo- !800's. Most of these shocks, however, occurred site focal mechanism for these local shocks before the advent of the World-Wide Standard [Armbruster et al., 1980] indicates that this Seismograph Network (WWSSN). Therefore the fault zone, and by inference the 1935 earthquake, quality and quantity of the data that can be used is characterized by left-lateral "•strike-slip to analyze these events are limited. Inferences motion. about these events are based largely on the Singh and Gupta [1980], however, analyzed distribution of intensity and of aftershocks records of surface waves produced by the 1935 recorded at a sufficient number of teleseismic shock and concluded that the earthquake was a stations to be locatable. For one event, in thrust-type event. Their solution also shows a 1935, surface waves were analyzed to obtain a significant component of strike-slip motion (in a focal mechanism [Singh and Gupta, 1980]. right-lateral sense for the nodal plane that most Unfortunately, different types of evidence do not closely agrees with the aftershock distribu- always support a consistent' view of the orienta- tion). They estimated a rupture length of about tion and sense of faulting for these events. 100 km and slip of approximately 30 m for this Thus detailed studies of more recent earthquakes, earthquake. While this value of rupture length even if small, play an important role in is in rough agreement with the length of' the unraveling the tectonics of this region. aftershock zone (100 versus 150 km) [QUirtmeyer
The seismicity of central Pakistan (M > 5), and Jacob, 1979], their estimate of the slip is determined fromminstrumental records, is shown in extraordinarily large. In fact, it is more than Figure 1 for the period January 1914 to April an order o f magnitude larger than values of slip 1975. Three earthquakes located along the Chaman reliably documented for other strike-slip earth- fault after that period, in October 1975 and quakes along transform faults and in intraplate March and May 1978, are also included. In west- settings and even exceeds the slip estimated for central Pakistan the seismic activity is the great Chilean earthquake of•1960 [e.g., Sykes associated with the Chaman fault and the and Quirtmeyer, 1981]. Thus either this earth- Pakistani fold belt that lies subparallel to it. quake is highly unusual in terms of its slip as a In east-central Pakistan the seismicity forms two function of fault length, or else the estimated trends [Quirtmeyer and Jacob, 1979]. One trend slip, and the value of moment from which it is has an east-west strike along the northern derived, are in error. Slip of the order of 1-2 portion of the Marri Bugti Hills. The other is m would be determined for this earthquake on the arcuate and convex to the south and follows the basis of relations between fault length and
2462 Quittmeyer et al.: Tectonics of Central Pakistan
slip. Also, if the focal mechanism based on the strike east to east-southeasterly. Most of the surface wave analysis is correct, one must solutions, however, are not well determined conclude that present motion along the northward [Molnar et al., 1973]. They interpreted the extension of the 1935 rupture zone is different earthquakes as caused by release of a north-south from the motion that occurred in 1935. compressive stress that is associated with the
Two large earthquakes were located to the east offset of the Pakistani fold belt. of the 1935 rupture zone in 1931. These shocks Chandra [1978] has also determined fault plane occurred within 3 days of each other (August 24, solutions for four of these earthquakes on the 1931, and August 27, 1931). The first earthquake basis of P wave first motions and S wave polari- was most damaging near the town of Sharigh, east zations. He inferred thrusting on nodal planes of Quetta (Figure 5). The severe, but localized, that strike northeast-southwesterly for three nature of the damage led West [1934] to conclude events in early 1966, while for the event of that the earthquake occurred at a shallow depth. August 1, 1966 (2100 UTC), he obtained a strike- The event was situated near the western limit of slip solution with left-lateral motion on a the easterly trending mountain ranges in central northerly striking plane. Chandra suggested that Pakistan. left-lateral motion within the Central Brahui
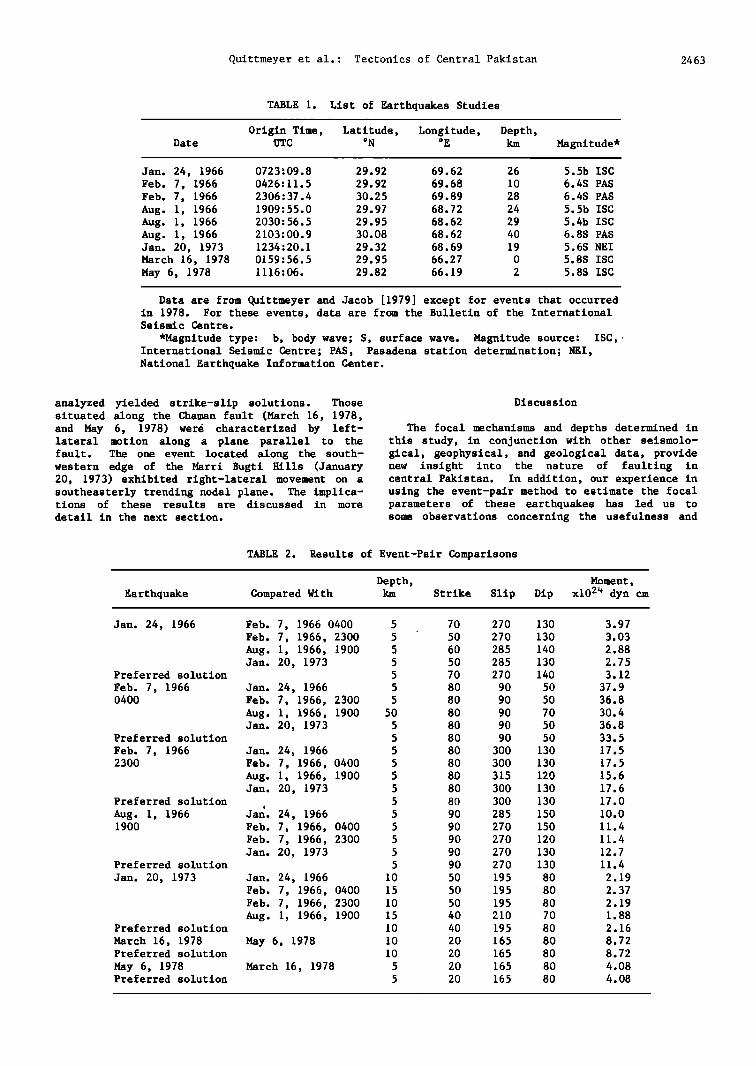
The rupture associated with the second large range was causing compression in the southern shock in 1931 initiated near the town of Mach, Sulaiman range. southeast of Quetta (Figure 5). The direction in No large earthquakes have occurred along the which rupture proceeded, however, is ambiguous. southern portion of the Marri Bugti Hills since The trend of the isoseismals is to the south, the establishment of the WWSSN. However, a fault along the eastern edge of the Central Brahui plane solution was determined by Quittmeyer et range (Figure 1). All of the aftershocks except al. [1979] for a small shock (M s = 5.6; M o = one, however, were located along a zone that 2 x 1024 dyn cm) located along the western extended out into the Kachhi plain to the east- segment of the arcuate band of activity. P wave southeast. The Kachhi plain has also been the first motions, from both long- and short-period site of other seismic activity including a large instruments, and S wave polarizations allow the earthquake in 1909. The orientation of the sense of motion to be determined, but the rupture zone, as inferred from intensity data for solution is not rigidly constrained. The focal the 1909 earthquake, is southeast-northwest mechanism for this event has been reexamined in [Heron, 1911; Quittmeyer and Jacob, 1979]. Two this study on the basis of an analysis of its alternative hypotheses are suggested to explain Rayleigh waves. these observations [Quittmeyer and Jacob, 1979]. The Mach earthquake either ruptured a fault along The Earthquakes That Were Studied the eastern edge of the Central Brahui range, oriented subparallel to the Chaman fault, and A detailed dicsussion of the Rayleigh wave triggered sympathetic shocks along a fault zone analysis for each earthquake studied is presented in the Kachhi plain, or else the 1931 earthquake in the appendixl; only the results are summarized ruptured a southeasterly trending fault, and the here. Table 1 contains information defining the distribution of intensity is related to amplifi- locations and origin times of the earthquakes cation effects at the boundary between the studied. In Table 2 the results of all the mountains and the alluvial plain. event-pair comparisons and the preferred focal
In 1966, three moderate-to-large earthquakes, mechanism and depth for each earthquake are and associated foreshocks and aftershocks, shown.
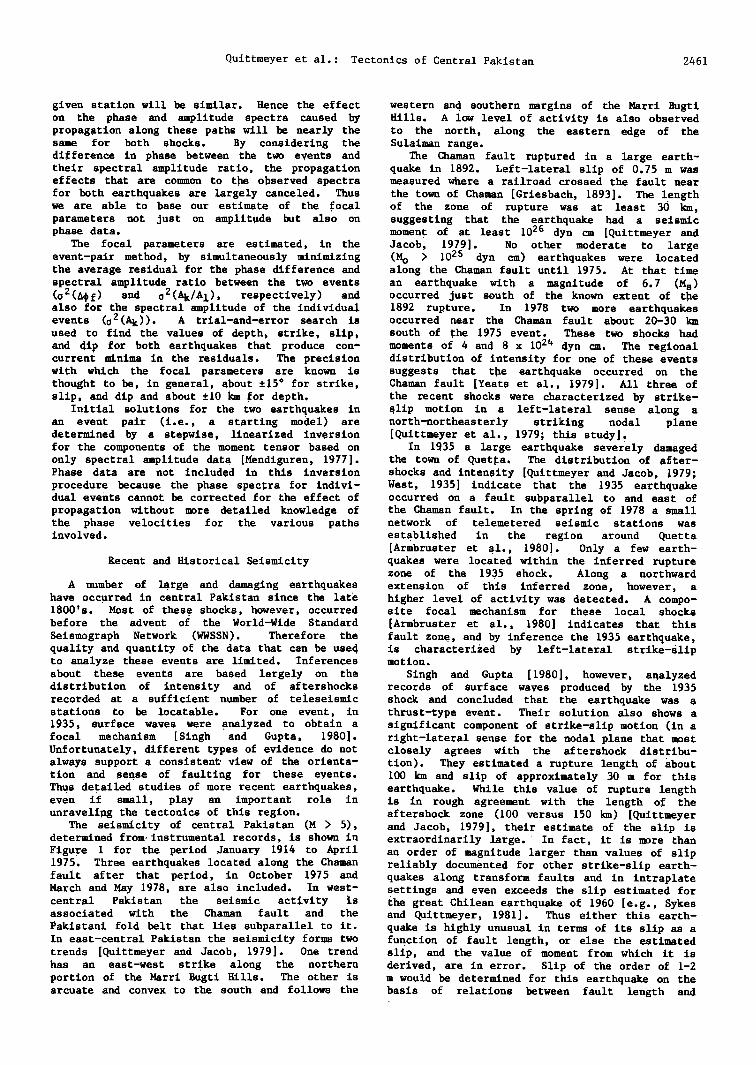
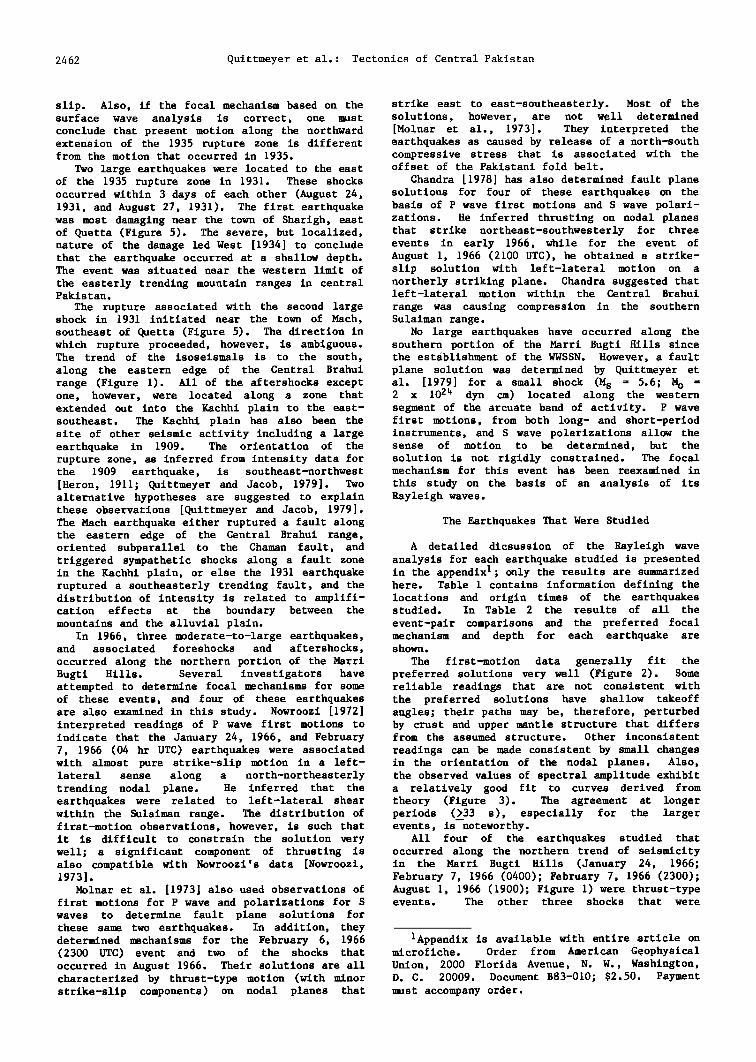
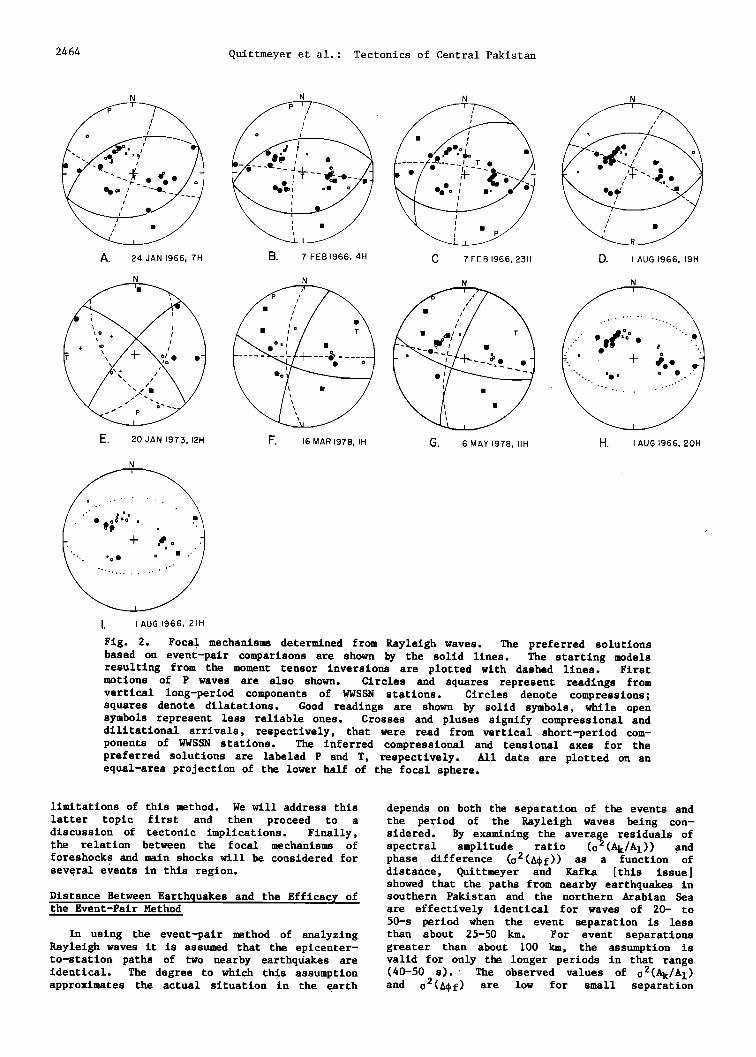
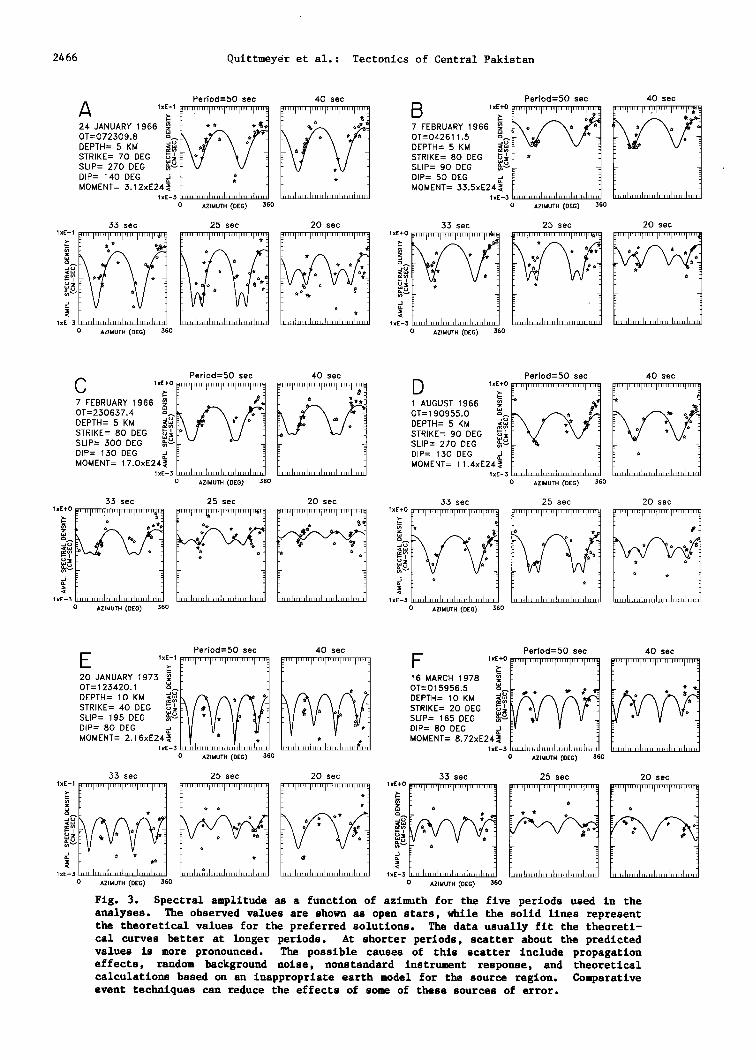
occurred along the northern portion of the Marri The first-motion data generally fit the Bugti Hills. Several investigators have preferred solutions very well (Figure 2). Some attempted to determine focal mechanisms for some reliable readings that are not consistent with of these events, and four of these earthquakes the preferred solutions have shallow takeoff are also examined in this study. Nowroozi [1972] angles; their paths may be, therefore, perturbed interpreted readings of P wave first motions to by crust and upper mantle structure that differs indicate that the January 24, 1966, and February from the assumed structure. Other inconsistent 7, 1966 (04 hr UTC) earthquakes were associated readings can be made consistent by small changes with almost pure strike-slip motion in a left- in the orientation of the nodal planes. Also, lateral sense along a north-northeasterly the observed values of spectral amplitude exhibit trending nodal plane. He inferred that the a relatively good fit to curves derived from earthquakes were related to left-lateral shear theory (Figure 3). The agreement at longer within the Sulaiman range. The distribution of periods (>33 s), especially for the larger first-motion observations, however, is such that events, is noteworthy. it is difficult to constrain the solution very All four of the earthquakes studied that ß
well; a significant component of thrusting is occurred along the northern trend of seismicity also compatible with Nowroozi's data [Nowroozi, in the Marri Bugti Hills (January 24, 1966; 1973]. February 7, 1966 (0400); February 7, 1966 (2300);
Molnar et al. [1973] also used observations of August 1, 1966 (1900); Figure 1) were thrust-type first motions for P wave and polarizations for S events. The other three shocks that were waves to determine fault plane solutions for these same two earthquakes. In addition, they determined mechanisms for the February 6, 1966 1Appendix is available with entire article on (2300 UTC) event and two of the shocks that microfiche. Order from American Geophysical occurred in August 1966. Their solutions are all Union, 2000 Florida Avenue, N. W., Washington, characterized by thrust-type motion (with minor D.C. 20009. Document B83-010; $2.50. Payment strike-slip components) on nodal planes that must accompany order.
Quittmeyer et al.: Tectonics of Central Pakistan 2463
TABLE 1. List of Earthquakes Studies
Date Origin Time, Latitude, Longitude, Depth,
UTC øN øE km Magnitude*
Jan. 24, 1966 0723•09.8 29.92 69.62 26 5.5b ISC Feb. 7, 1966 0426:11.5 29.92 69.68 10 6.4S PAS Feb. 7, 1966 2306:37.4 30.25 69.89 28 6.4S PAS Aug. 1, 1966 1909:55.0 29.97 68.72 24 5.5b ISC Aug. 1, 1966 2030:56.5 29.95 68.62 29 5.4b ISC Aug. 1, 1966 2103:00.9 30.08 68.62 40 6.8S PAS Jan. 20, 1973 1234:20.1 29.32 68.69 19 5.6S NEI March 16, 1978 0159:56.5 29.95 66.27 0 5.8S ISC May 6, 1978 1116:06. 29.82 66.19 2 5.8S ISC
Data are from Quittmeyer and Jacob [1979] except for events that occurred in 1978. For these events, data are from the Bulletin of the International Seismic Centre.
*Magnitude type: b, body wave; S, surface wave. Magnitude source: ISC, International Seismic Centre; PAS, Pasadena station determination; NEI, National Earthquake Information Center.
analyzed yielded strike-slip solutions. Those Discussion situated along the Chaman fault (March 16, 1978, and May 6, 1978) were characterized by left- The focal mechanisms and depths determined in lateral motion along a plane parallel to the this study, in conjunction with other seismolo- fault. The one event located along the south- gical, geophysical, and geological data, provide western edge of the Marri Bugti Hills (January new insight into the nature of faulting in 20, 1973) exhibited right-lateral movement on a central Pakistan. In addition, our experience in southeasterly trending nodal plane. The implica- using the event-pair method to estimate the focal tions of these results are discussed in more parameters of these earthquakes has led us to detail in the next section. some observations concerning the usefulness and
TABLE 2. Results of Event-Pair Comparisons
Depth, Earthquake Compared With km
Moment, Strike Slip Dip x1024 dyn cm
Jan. 24, 1966 Feb. 7, 1966 0400 5 70 270 130 3.97 Feb. 7, 1966, 2300 5 50 270 130 3.03 Aug. 1, 1966, 1900 5 60 285 140 2.88 Jan. 20, 1973 5 50 285 130 2.75
Preferred solution 5 70 270 140 3.12
Feb. 7, 1966 Jan. 24, 1966 5 80 90 50 37.9 0400 Feb. 7, 1966, 2300 5 80 90 50 36.8
Aug. 1, 1966, 1900 50 80 90 70 30.4 Jan. 20, 1973 5 80 90 50 36.8
Preferred solution 5 80 90 50 33.5
Feb. 7, 1966 Jan. 24, 1966 5 80 300 130 17.5 2300 Feb. 7, 1966, 0400 5 80 300 130 17.5
Aug. 1, 1966, 1900 5 80 315 120 15.6 Jan. 20, 1973 5 80 300 130 17.6
Preferred solution 5 80 300 130 17.0
Aug. 1, 1966 Jan. 24, 1966 5 90 285 150 10.0 1900 Feb. 7, 1966, 0400 5 90 270 150 11.4
Feb. 7, 1966, 2300 5 90 270 120 11.4 Jan. 20, 1973 5 90 270 130 12.7
Preferred solution 5 90 270 130 11.4
Jan. 20, 1973 Jan. 24, 1966 10 50 195 80 2.19 Feb. 7, 1966, 0400 15 50 195 80 2.37 Feb. 7, 1966, 2300 10 50 195 80 2.19 Aug. 1, 1966, 1900 15 40 210 70 1.88
Preferred solution 10 40 195 80 2.16
March 16, 1978 May 6, 1978 10 20 165 80 8.72 Preferred solution 10 20 165 80 8.72
May 6, 1978 March 16, 1978 5 20 165 80 4.08 Preferred solution 5 20 165 80 4.08
2464 Quittmeyer et al.: Tectonics of Central Pakistan
N
A. 24 JAN 1966, 7H
N N N
/ ".d•.x ß '
B. ? FEB 1966, 4H C. 7 FEB 196;6, 23H D. I AUG 1966, 19H
N N N
E. 20 JAN 1973, 12H F. 16 MAR 1978, IH G. 6 MAY 1978, IIH
N
H. I AUG 1966, 20H
N
I. I AUG 1966, 21H
Fig. 2. Focal mechanisms determined from Rayleigh waves. The preferred solutions based on event-pair comparisons are shown by the solid lines. The starting models resulting from the moment tensor inversions are plotted with dashed lines. First motions of P waves are also shown. Circles and squares represent readings from vertical long-period components of WWSSN stations. Circles denote compressions; squares denote dilatations. Good readings are shown by solid symbols, while open symbols represent less reliable ones. Crosses and pluses signify compressional and dilitational arrivals, respectively, that were read from vertical short-period com- ponents of WWSSN stations. The inferred compressional and tensional axes for the preferred solutions are labeled P and T, respectively. All data are plotted on an equal-area projection of the lower half of the focal sphere.
limitations of this method. We will address this depends on both the separation of the events and latter topic first and then proceed to a the period of the Rayleigh waves being con- discussion of tectonic implications. Finally, sidered. By examining the average residuals of the relation between the focal mechanisms of spectral amplitude 2 , ratio (o (Ak/A1)) and foreshock• and main shocks will be considered for phase difference (o2(A•f)) as a function of several events in this region. distance, Quittmeyer and Kafka [this issue]
showed that the paths from nearby earthquakes in Distance Between Earthquakes and the Efficacy of southern Pakistan and the northern Arabian Sea the Event-Pair Method are effectively identical for waves of 20- to
'50-s period when the event separation is less In using the event-pair method of analyzing than about 25-50 km. For event separations
Rayleigh waves it is assumed that the epicenter- greater than about 100 km, the assumption is to-station paths of two nearby earthquakes are valid for only the longer periods in that range identical. The degree to which this assumption (40-50 s). The. observed values of o2(Ak/A1) approximates the actual situation in the earth and o2(A•f) are low for small separation

Quittmeyer et al.: Tectonics of Central Pakistan 2465
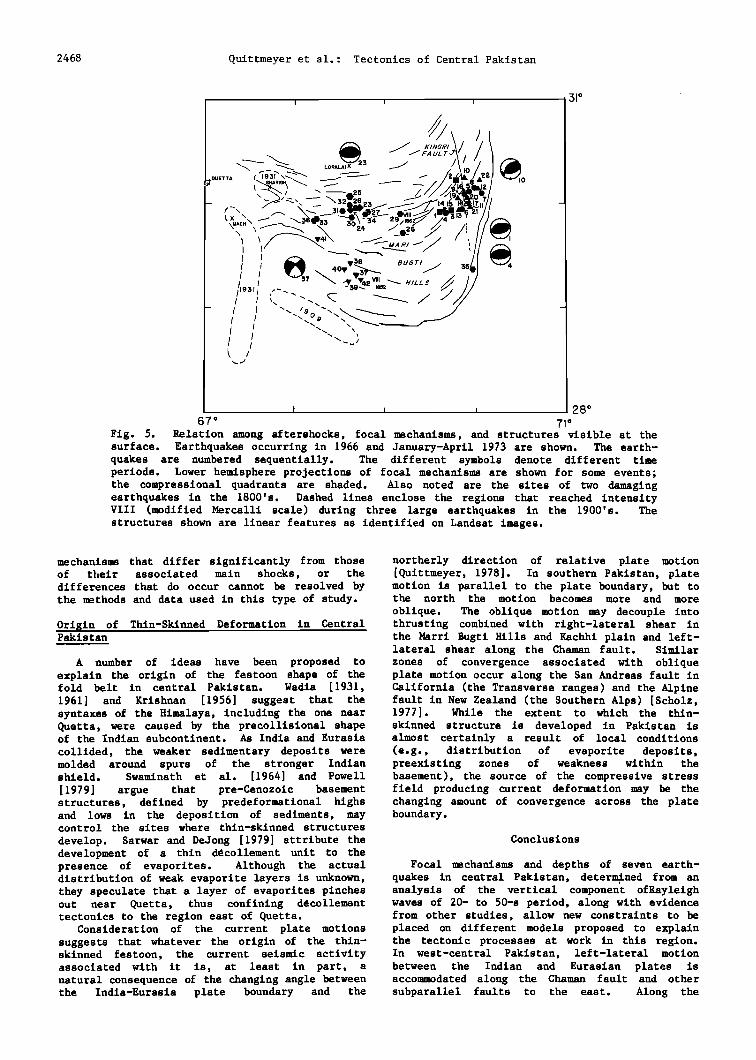
distances and scatter about constant values for area. The differences in strike are significant distances greater than 100 km. Separation given the precision of the event-pair method of distances for event pairs in this study vary from analysis. These earthquakes therefore are about 10 to 150 km; many fall in the transition probably not related to surficial features. If range (50-100 km) that was not covered in the the observed structural grain is related to companion study. The average value of the deformation within a thin, detached sheet, as residuals for spectral amplitude ratio and phase several investigators have suggested [Seeber and difference increases linearly as the distance Armbruster, 1979; Powell, 1979; Sarwar and between events becomes larger (Figure 4). Hence, DeJong, 1979; Klootwijk et al., 1981], seismic combining the results of both studies, the degree activity on faults confined to the basement would of similarity between epicenter-to-station paths explain the observations. appears to decrease linearly as event separation The interpretation of the second large earth- increases to about 100 km, after which the quake on February 7, 1966 (2300) (event 10, similarity remains approximately constant up to Figure 5), is equivocal. The northwesterly at least 300 km. dipping nodal plane for this event strikes to the
This observation is not unexpected. The northeast in approximate alignment with the depths at which earth structure more strongly strike of faults and folds. This focal mechanism affects the propagation of Rayleigh waves are therefore is consistent with faulting near the dependent on the period and wavelength of the surface, within the basement, or both. If the waves being considered. The variation of solution were slightly altered, however, to o2(Ak/A1) and o2(A•f) as a function of produce better agreement with the first-motion event separation simply indicates that the earth data (Figure 2), the strike of the nodal plane is more nearly laterally homogeneous at the would differ from that of structures at the greater depths "felt" by waves of 40- to 50-s surface. Slip on a basement fault situated below period than it is at the depths that strongly a decoupled surface layer would then be the a,ffect the propagation of waves in the period preferred interpretation for this earthquake. range 20-30 s. For both of these reasonS, the The foreshocks, main shocks, and aftershocks dispersion of Rayleigh waves propagating over that constitute the seismic activity of early nearby paths is more similar at longer periods 1966 (events 1-2, Figure 5), when considered than it is at shorter periods. In addition, the together, define a zone that trends north- longer-period waves "feel" average properties and easterly. If the size and orientation of the are not severely affected by details of earth rupture zone is estimated from locations of the structure. first main shock on February 7, 1966 (event 4),
along with subsequent events preceeding the Relation Among Aftershocks, Structures Visible at second main shock (events 5-9, Figure 5), then the Surface of the Earth, and Focal Mechanisms two observations can be made. First, the rupture Determined From Surface Waves zone would extend across the Kingri fault. This
would further support the contention that this In regions where a d•collement style of earthquake is unrelated to surface structures.
tectonics is active, faulting and seismic Second, there may be a slight discrepancy between activity in the basement may not be directly the strike of the rupture zone as determined from manifested in structures observed at the aftershocks and from the analysis of Rayleigh surface. In the Hazara arc, about 400 km north- waves. This discrepancy is marginal, however, east of the region considered in this study, a given the precision with which the strike can be thin (10-20 km) layer of presumably sedimentary determined from both sources. deposits is decoupled from the underlying base- A close examination of the distribution of ment. Major faults in the basement have no aftershocks following the second large earthquake structural expression at the surface, although on February 7, 1966 (event 10, Figure 5), they may be related to topographic features suggests that the Kingri fault may be seismically [Seeber and Armbruster, 1979]. In central active. Beginning on February 17, 1966 (event Pakistan, a similar situation may exist. Results 16), epicenters for activity over the next 3 of this study suggest that at least some of the months (events 16-21) all fall very close to the earthquakes occur on basement faults that do not surface trace of the Kingri fault. It is not penetrate through a detachment zone into the possible from the data available to determine overlying layers. whether this activity was located within an
The earthquakes that affected the northeastern upper, decoupled unit or the •basement. portion of the Marri Bugti Hills in early 1966 To the west, in the region affected by the (events 1-22, Figure 5) occurred in a region August 1966 earthquakes (events 24, 25, 27, 28, where the trend of structures observed at the 30, 31, 32, and 34), structures trend approxi- surface is approximately N30øE (Figure 5). In mately east-west. Here, both the strike of the addition to northeasterly striking features, a nodal planes for one of the foreshocks and the prominent fault, the Kingri fault [Rowlands, distribution of aftershocks suggest the rupture 1978], has a north-south trend (Figure 5). zone has the same orientation as the structures Rowlands [1978] inferred strike-slip motion in a observed at the surface. Whether these earth- left-lateral sense for this fault based on quakes occurred in the basement or in the geomorphic features observed on Landsat imagery. overlying sedimentary deposits is not known.
Nodal planes for both the February 7, 1966 The earthquakes that occurred along the south- (0400) (event 4, Figure 5), earthquake and for western edge of the Marri Bugti Hills are located its foreshock on January 24, 1966 (event 1, in a region of broad folds that trend east- Figure 5), strike obliquely to the structural southeasterly (Figure 5). The focal mechanism of grain observed at the surface in the epicentral the January 20, 1973, earthquake (event 37,
2466 Quittmeyer et al.: Tectonics of Central Pakistan
Period=50 sec 40 sec
A "?'• .... , ..... , ..... , ..... , ..... , .... 24 JANUARY 1966
DE•TH: •K• •1• • • ? I
STRIKE= 70 DEG SLIP= 270 DEG DIP: 140 DEG
o •z•um (D[•)
Period=50 sec 40 sec
•xE+O .... I ..... 1 ..... I ..... I ..... '1 .... [•""1"'"1 ..... I ..... I ..... I",-'• B •" •"j , . 7 FEBRUARY 1966 0T:042611.5 DEPTH= 5 KU STRIKE= 80 DEG SLIP: 90 DEG • - , DiP= 50 DEG MOMENT= •.5xE24•
•E-S I I ••• ..... I ..... I .... 0 AZ•Um (•[g)
0 AZIMUTH (DEG) 360 0 AZIMUTH (DEG) $60
Period=50 sec 40 sec
C 'tol, , , , ,l l, , , , ,";• .... ..... ..... ..... ..... .... .... ..... ..... ..... ..... 7 FEBRUARY 1966 •z [ '• oT:•o•7.•- ,• k • •
STR•KE= SO DEG •' I•\ / t / • SLIP= •00 DEG •ab • *• • D•: •SO DEC • • • MOMENT= 17.0xE24• F •
•[-sl,,,I d.,,d ..... I ..... I ..... I I ..... I ..... I ..... I ..... I ..... I ..... I 0 AZIMUTH (DEG) •60
55 sec 25 sec 20 sec
,•o• .... , ..... , ..... , ..... , ..... I',•,'• j• .... , ..... ,: .... , ..... , ..... ,,,,,• • .... , ..... , ..... , ..... , ..... , .... •
1xE-3 .... I ..... I ..... I ..... I ..... I ..... I ..... I .... ,I ..... I ..... I,,, 0 AZIMUTH (DEG) ,360
Period=50 sec 40 sec
D '•"ø•'", , , , , ] •'", , , , , 1 ..... ..... ..... ..... .... ..... ..... ..... ..... .... 1 AUGUST 1966 z • OT= 190955.0 •.... DEPTH= 5 KM • STRIKE= 90 DEG • SLIP= 270 DEG • DIP= 150 DEG • MOMENT= 11.4xE24•
IxE-S I,,1•,1,,,,,• ,,,,I .... I .... I ..... I 0 AZIMUTH (DEG) ,360
53 sec 25 sec
?l .... ' ..... ..... ' ..... ' .... -.F ..... ' ..... ' ....
xE-`3 .... I,, ,I,,u,I ..... t ..... I .... I ..... I ..... I ..... I ..... I ..... I 0 AZIMUTH (DEG) `360
IxE-1
z
i--i
lxE-`3
Period=50 sec 40 sec
STRIKE= 40 DEG SLIP= 195 DEG DIP= 80 DEG
.o.•.= lxE-• o AZ•Um
Period=50 sec 40 sec
F .... ..... ..... ..... ..... .... .... ..... ..... ..... ..... .... 16 MARCH 1978 0T=015956 5 • L- •,, . .-J * ß _•. ** . . DEPTH= 10 KM STRIKE= 20 DEG • I•/ *\/ \/ \/" :1 SLIP= 165 DEG DIP= 80 DEG
•o•.•- •'•x•2_• 0 AZIMUTH (DEG) ,360
55 sec 25 sec
',,',1 I I I II p I I I 1•- ..... ..... ..... ..... .... ..... ..... ..... ..... .... P V . V
,,,,I ..... I ..... I .... I ............ I,,,*,,I .... ,1 ..... I ..... 1 .... 0 AZIMUTH (DEG) `360
20 sec 33 sec 25 sec 20 sec
•, i,, ,,.i, 1 .... ..... ..... ..... ..... 1xE.o I .... i,,,:,,, i ..... ..... ..... '.""1 P'' :' I F "' I ' ..... ..... .... ..... .... ..... ..... ..... '"""1
I ..... h,.,l .... I ..... I ..... I ..... I •xE-`3 o AZIMUTH (DEG) 360
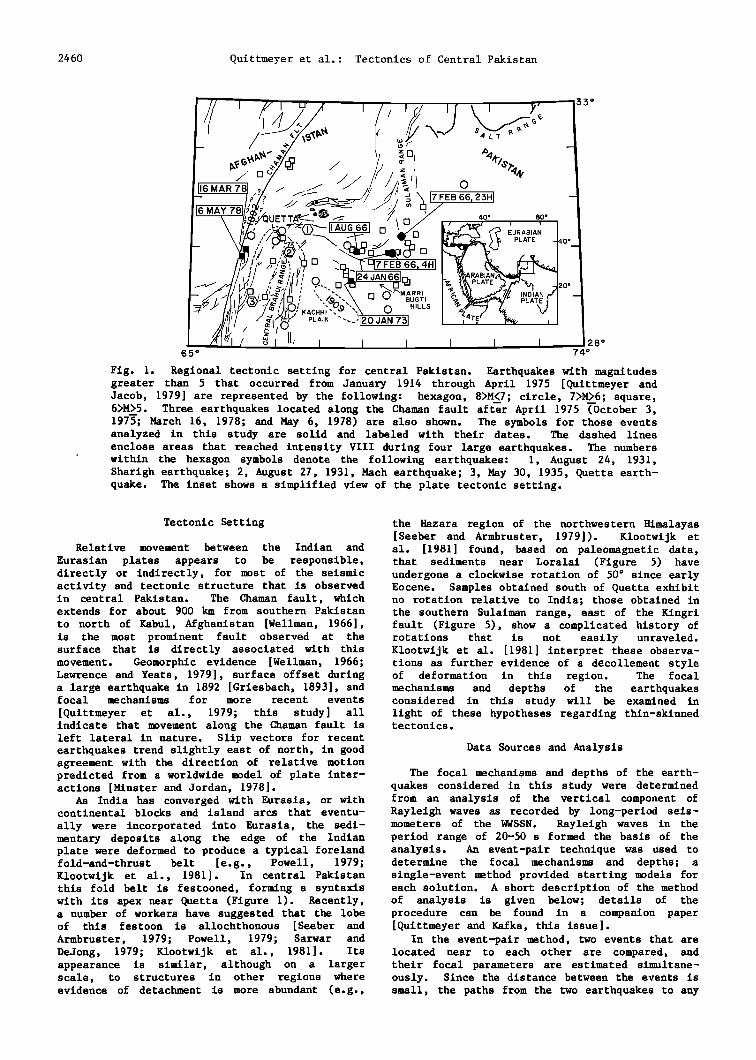
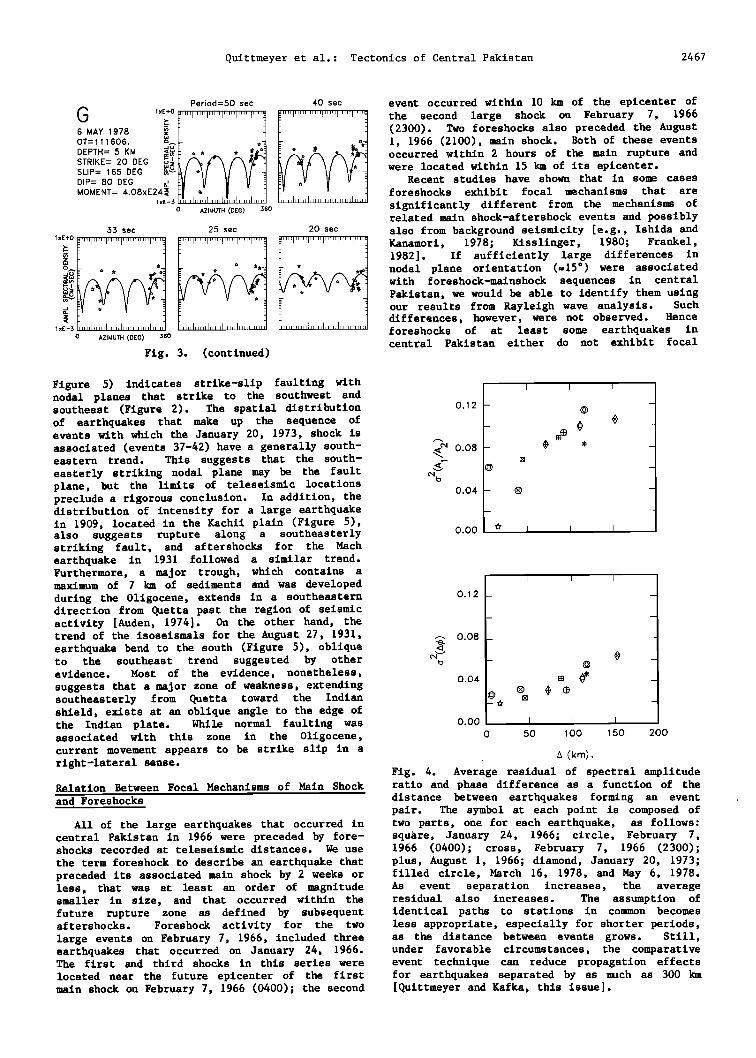
Fig. 3. Spectral amplitude as a function of azimuth for the five periods used in the analyses. The observed values are shown as open stars, while the solid lines represent the theoretical values for the preferred solutions. The data usually fit the theoreti- cal curves better at longer periods. At shorter periods, scatter about the predicted values is more pronounced. The possible causes of this scatter include propagation effects, random background noise, nonstandard instrument response, and theoretical calculations based on an inappropriate earth model for the source region. Comparative event techniques can reduce the effects of some of these sources of error.
Quittmeyer et al.: Tectonics of Central Pakistan 2467
Period=50 sec 40 sec
6 MAY 1978 • • • OT= 1 I 1606. •.-. • .---I DEPTH= 5 KM •z• • * * * -•*• * • J•*- STRIKE= 20 BEG • I[/"¾ • /'• •A•
DIP= 80 DEG • •ll V •l V •
.... , ..... o Azm•UTH (DEO) 360
53 sec 25 sec 20 sec
lxœ+o• i i i )I • i i i )f i i I .... ..... ..... ..... ..... .... .... ..... ..... ..... ..... .... .... i1,,,,,i i i i 1 ..... ..... ..... ....
1xE-$
0 AZIMUTH (DEG) ,360
Fig. 3. (continued)
event occurred within 10 km of the epicenter of the second large shock on February 7, 1966 (2300). Two foreshocks also preceded the August 1, 1966 (2100), main shock. Both of these events occurred within 2 hours of the main rupture and were located within 15 km of its epicenter.
Recent studies have shown that in some cases foreshocks exhibit focal mechanisms that are
significantly different from the mechanisms of related main shock-aftershock events and possibly also from background seismicity [e.g., Ishida and Kanamori, 1978; Kisslinger, 1980; Frankel, 1982]. If sufficiently large differences in nodal plane orientation (•15 ø) were associated with foreshock-mainshock sequences in central Pakistan, we would be able to identify them using our results from Rayleigh wave analysis. Such differences, however, were not observed. Hence foreshocks of at least some earthquakes in central Pakistan either do not exhibit focal
Figure 5) indicates strike-slip faulting with nodal planes that strike to the southwest and southeast (Figure 2). The spatial distribution of earthquakes that make up the sequence of events with which the January 20, 1973, shock is associated (events 37-42) have a generally south- eastern trend. This suggests that the south- easterly striking nodal plane may be the fault plane, but the limits of teleseismic locations preclude a rigorous conclusion. In addition, the distribution of intensity for a large earthquake in 1909, located in the Kachii plain (Figure 5), also suggests rupture along a southeasterly striking fault, and aftershocks for the Mach earthquake in 1931 followed a similar trend. Furthermore, a major trough, which contains a maximum of 7 km of sediments and was developed during the Oligocene, extends in a southeastern direction from Quetta past the region of seismic activity [Auden, 1974]. On the other hand, the trend of the isoseismals for the August 27, 1931, earthquake bend to the south (Figure 5), oblique to the southeast trend suggested by other evidence. Most of the evidence, nonetheless, suggests that a major zone of weakness, extending southeasterly from Quetta toward the Indian shield, exists at an oblique angle to the edge of the Indian plate. While normal faulting was associated with this zone in the Oligocene, current movement appears to be strike slip in a right-lateral sense.
0.12
..•.c• 0.08
0.04
0.00
I I I
0.12
0.08
0.04
O.OO
I I I
¸ []
I I I
0 ,50 100 150 200
A (kin).
Fig. 4. Average residual of spectral amplitude Relation Between Focal Mechanisms of Main Shock ratio and phase difference as a function of the and Foreshocks distance between earthquakes forming an event
pair. The symbol at each point is composed of
All of the large earthquakes that occurred in two parts, one for each earthquake, as follows: central Pakistan in 1966 were preceded by fore- square, January 24, 1966; circle, February 7, shocks recorded at teleseismic distances. We use 1966 (0400); cross, February 7, 1966 (2300); the term foreshock to describe an earthquake that plus, August 1, 1966; diamond, January 20, 1973; preceded its associated main shock by 2 weeks or filled circle, March 16, 1978, and May 6, 1978. less, that was at least an order of magnitude As event separation increases, the average smaller in size, and that occurred within the residual also increases. The assumption of future rupture zone as defined by subsequent identical paths to stations in common becomes aftershocks. Foreshock activity for the two less appropriate, especially for shorter periods, large events on February 7, 1966, included three as the distance between events grows. Still, earthquakes that occurred on January 24, 1966. under favorable circumstances, the comparative The first and third shocks in this series were event technique can reduce propagation effects located near the future epicenter of the first for earthquakes separated by as •mch as 300 km main shock on February 7, 1966 (0400); the second [Quirtmeyer and Kafka, this issue].
2468 Quittmeyer et al.: Tectonics of Central Pakistan
I I I
I I I
:51 ø
28 ø
7 ø 67 ø
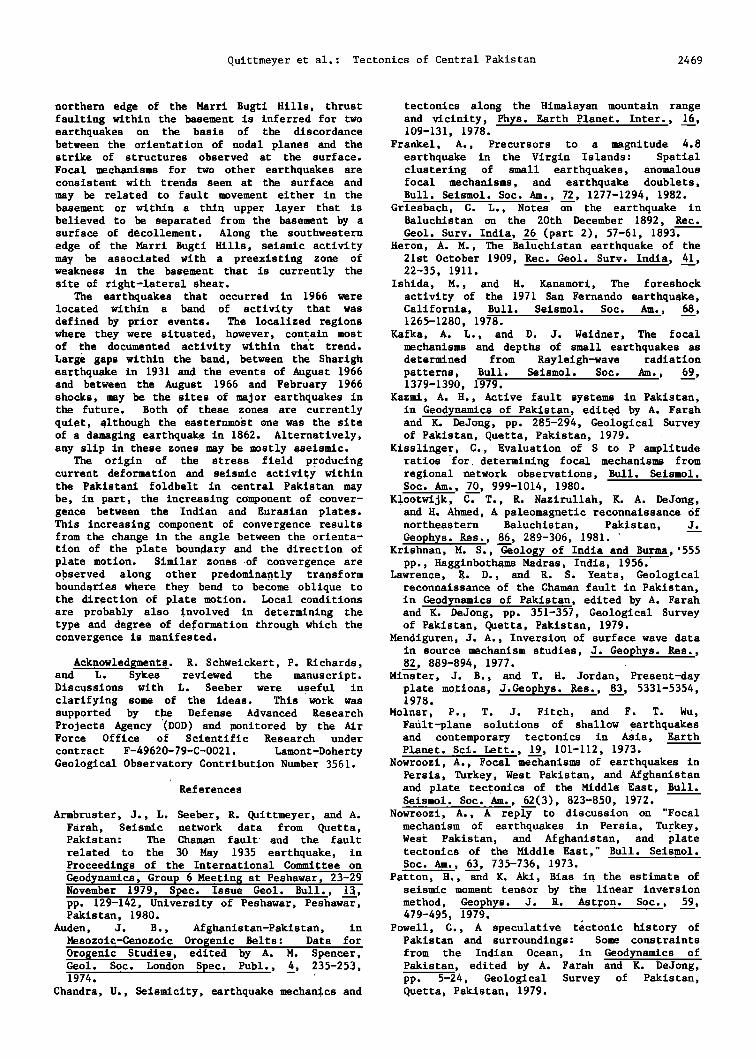
Fig. 5. Rmlatton among aftershocks, focal mechanisms, and structures visible at the surface. Earthquakes occurring in 1966 and January-April 1973 are shown. The earth- quakes are numbered sequentially. The different symbols denote different time periods. Lower hemisphere projections of focal mechanism• are shown for some events; the compressional quadrants are shaded. Also noted are the sites of two damaging earthquakes in the 1800's. Dashed lines enclose the regions that reached intensity VIII (modified Mmrcalli scale) during three large earthquakes in the 1900's. The structures shown are linear features as identified on Landsat images.
mechanism• that differ significantly from those northerly direction of relative plate motion of their associated main shocks, or the [Quittmeyer, 1978]. In southern Pakistan, plate differences that do occur cannot be resolved by motion is parallel to the plate boundary, but to the methods and data used in this type of study. the north the motion becomes more and more
oblique. The oblique motion may decouple into Origin of Thin-Skinned Deformation in Central thrusting combined with right-lateral shear in Pakistan the Marri Bugti Hills and Kachhi plain and left-
lateral shear along the Chaman fault. Similar A number of ideas have been proposed to zones of convergence associated with oblique
explain the origin of the festoon shape of the plate motion occur along the San Andreas fault in fold belt in central Pakistan. Wadia [1931, California (the Transverse ranges) and the Alpine 1961] and Krishnan [1956] suggest that the fault in New Zealand (the Southern Alps) [Scholz, syntaxes of the Himalaya, including the one near 1977]. While the extent to which the thin- Quetta, were caused by the precollisional shape skinned structure is developed in Pakistan is of the Indian subcontinent. As India and Eurasia almost certainly a result of local conditions collided, the weaker sedimentary deposits were (e.g., distribution of evaporite deposits, molded around spurs of the stronger Indian preexisting zones of weakness within the shield. Swaminath et al. [1964] and Powell basement), the source of the compressive stress [ 1979] argue that pre-Cenozoic basement field producing current deformation may be the structures, defined by predeformational highs changing amount of convergence across the plate and lows in the deposition of sediments, may boundary. control the sites where thin-skinned structures
develop. Sarwar and DeJong [1979] attribute the Conclusions development of a thin d•collement unit to the presence of evaporites. Although the actual Focal mechanisms and depths of seven earth- distribution of weak evaporite layers is unknown, quakes in central Pakistan, determined from an they speculate that a layer of evaporites pinches analysis of the vertical component of Rayleigh out near Quetta, thus confining d•collement waves of 20- to 50-s period, along with evidence tectonics to the region east of Quetta. from other studies, allow new constraints to be
Consideration of the current plate motions placed on different models proposed to explain suggests that whatever the origin of the thin- the tectonic processes at work in this region. skinned festoon, the current seismic activity In west-central Pakistan, left-lateral motion associated with it is, at least in part, a between the Indian and Eurasian plates is natural consequence of the changing angle between accommodated along the Chaman fault and other the India-Eurasia plate boundary and the subparallel faults to the east. Along the
Quittmeyer et al.: Tectonics of Central Pakistan 2469
northern edge of the Marri Bugti Hills, thrust tectonics along the Himalayan mountain range faulting within the basement is inferred for two and vicinity• Phys. Earth Planet. Inter., 16, earthquakes on the basis of the discordance 109-131, 1978. between the orientation of nodal planes and the Frankel, A., Precursors to a magnitude 4.8 strike of structures observed at the surface. earthquake in the Virgin Islands: Spatial Focal mechanisms for two other earthquakes are clustering of small earthquakes, anomalous consistent with trends seen at the surface and focal mechanisms, and earthquake doublets, may be related to fault movement either in the Bull. Seismol. Soc. Am., 72, 1277-1294, 1982. basement or within a thin upper layer that is Griesbach, C. L., Notes on the earthquake in believed to be separated from the basement by a Baluchistan on the 20th December 1892, Rec. surface of d•collement. Along the southwestern Geol. Surv. India, 26 (part 2), 57-61, 1893. edge of the Marri Bugti Hills, seismic activity Heron, A.M., The Baluchistan earthquake of the may be associated with a preexisting zone of 21st October 1909, Rec. Geol. Surv. India, 41, weakness in the basement that is currently the 22-35, 1911. site of right-lateral shear. Ishida, M., and H. Kanamori, The foreshock
The earthquakes that occurred in 1966 were activity of the 1971 San Fernando earthquake, located within a band of activity that was California, Bull. Seismol. Soc. Am., 68, defined by prior events. The localized regions 1265-1280, 1978. where they were situated, however, contain most Kafka, A. L., and D. J. Weldnet, The focal of the documented activity within that trend. mechanisms and depths of small earthquakes as Large gaps within the band, between the Sharigh determined from Rayleigh-wave radiation earthquake in 1931 and the events of August !966 patterns, Bull. Seismol. Soc. Am., 69, and between the August 1966 and February 1966 1379-1390, 1979. shocks, may be the sites of major earthquakes in Kazmi, A. H., Active fault systems in Pakistan, the future. Both of these zones are currently quiet, although the easternmost one was the site of a damaging earthquake in 1862. Alternatively, any slip in these zones may be mostly aseismic.
The origin Qf the stress field producing current deformation and seismic activity within the Pakistani foldbelt in central Pakistan may
in Geodynamics of Pakistan, edited by A. Farah and K. DeJong, pp. 285-294, Geological Survey of Pakistan, Quetta, Pakistan, 1979.
Kisslinger, C., Evaluation of S to P amplitude ratios •for• determining focal mechanisms from regional network observations, Bull. Seismol. Soc. Am., 70, 999-1014, 1980.
be, in part, the increasing component of conver- K!ootwijk , C. T., R. Nazirullah, K. A. DeJong, gence between the Indian and Eurasian plates. and H. Ahmed, A paleomagnetic reconnaissance of This increasing component of convergence results northeastern Baluchistan, Pakistan, J. from the change in the angle between the orienta- Geophys. Res., 86, 289-306, 1981. ' tion of the plate boundary and the direction of Krishnan, M. S.,-•ology of India and Burma,'555 plate motion. Similar zones of convergence are pp., Hagginbothams Madras, India, 1956. observed along other predominantly transform Lawrence, R. D., and R. S. Yeats, Geological boundaries where they bend to become oblique to the direction of plate motion. Local conditions are probably also involved in determining the type and degree of deformation through which the convergence is manifested.
Acknowledgments. R. Schweickert, P. Richards,
reconnaissance of the Chaman fault in Pakistan, in Geodynamics of Pakistan, edited by A. Farah and K. DeJong, pp. 351-357, Geological Survey of Pakistan, Quetta, Pakistan, 1979.
Mendiguren, J. A., Inversion of surface wave data •in source mechanism studies, J. qeO?hys. Res.,
89-894, and L. Sykes reviewed the manuscript. Minster, J. B., and T. H. Jordan, Present-day Discussions with L. Seebet were useful in plate motions, J.Geophys. Res., 83, 5331-5354, clarifying some of the ideas. This work was 1978. supported by the Defense Advanced Research Molnar, P., T. J. Fitch, and F. T. Wu, Projects Agency (DOD) and monitore• by the Air FaUlt-plane solutions of shallo• earthquakes Force Office of Scientific Research under and contemporary tectonics in Asia, Earth contract F-49620-79-C-0021. Lamont-Doherty Planet. Sci. Lett., 19, 101-112, 1973. Geological Observatory Contribution Number 3561. Nowroozi, A., Focal mechanisms of earthquakes in
Persia, Turkey, West Pakistan, and Afghanistan References and plate tectonics of the Middle East, Bull.
Seismol. Soc. Am., 62(3), 823-850, 1972. Armbruster, J., L. Seebet, R. Quittmeyer, and A. Nowroozi, A., A reply to discussion on "Focal
Farah, Seismic network data from Quetta, mechanism of earthquakes in Persia, Turkey, Pakistan: The Chaman fault • and the fault West Pakistan, and Afghanistan, and plate related to the 30 May 1935 earthquake, in tectonics of the Middle East," Bull. Seis•ol. ProCeedings of the International Committee on Soc. Am., 63, 735-736, 1973. Geodynamics, Group 6 Meeting at Peshawar, 23-29 Patton, H., and K. Aki, Bias in the estimate of November '1979, Spec. Issue Geol Bull., 13, seismic moment tensor by the linear inversion pp. 129-142, University of Peshawar, Peshawar, method, Ge0Phys. J. R. Ast•on. Soc., 59, Pakistan, 1980. 479-495, 1979.
Auden, O. B., Afghanistan-Pakistan, in Powell, C., A speculative tectonic history of Mesozoic-Cenozoic Orogenic Belts: Data for Pakistan and surroundings: Some constraints Orogenic Studies, edited by A. M. Spencer, from the Indian Ocean, in Geodynamics of Geol. Soc. 'London Spec. Publ., 4, 235-253, Pakistan, edited by A. Farah and K. DeJong, 1974. • pp. 5-24, Geological Survey of Pakistan,
Chandra, U., Seismicity, earthquake mechanics and Quetta, Pakistan, 1979.
2470 Quittmeyer et al.: Tectonics of Central Pakistan
Quittmeyer, R. C., The Quetta-Sibi (Pakistan) subcontinent, Proc. Int. Geol. Congr. 22nd, syntaxis: Evidence for its origin from section II, 316-331, 1964. seismicity and plate tectonics (abstract), Sykes, L. R., and R. C. Quittmeyer, Repeat times EOS Trans. AGU, 59, 323, 1978. of great earthquakes along simple plate
Quittmeyer, R. C., and K. H. Jacob, Historical boundaries, in Earthquake Prediction, An and modern seismicity of Pakistan, Afghanistan, International Review, Maurice Ewing Ser., vol. northwestern India and southeastern Iran, 4, edited by D. W. Simpson and P. G. Richards, Bull. Seismol. Soc. Am., 69, 773-823, 1979. pp. 217-247, AGU, Washington, D.C., 1981.
Quirtmeyer, R. C., and A. L. Kafka, Constraints Wadia, D. N., The syntaxis of the northwest on 'plate motion in southern Pakistan and the Himalayas, its rocks, tectonics and orogeny, northern Arabian Sea from the focal mechanisms Mem. Geol. Surv. India, 65, 189-220, 1931. of small earthquakes, J. Geophys. Res., this Wadia, D. N., Geology of India, 3rd ed.
•issue. (revised), 536 pp., MacMillan, London, 1961. Quirtmeyer, R. C., A. Farah, and K. H. Jacob, The Weidner, D. J., and K. Aki, Focal depth and
seismicity of Pakistan and its relation to mechanism of mid-ocean ridge earthquakes, J. surface faults, in Geodynamics of Pakistan, Geophys. Res., 78, 1818-1831, 1973. edited by A. Farah and K. DeJong, pp. 271-284, Wellman, H. W., Active wrench faults of Iran, Geological Survey of Pakistan, Quetta, Afghanistan, and Pakistan, Geol. Rundschau, 55, Pakistan, 1979. 716-735, 1966.
Rowlands, D., The structure and seismicity of a West, W. D., The Baluchistan earthquakes of portion of the southern Sulaiman range, August 25 and 27, 1931, Mem. Geol. Surv. India, Pakistan, Tectonophysics, 51, 41-56, 1978. 67, 1-82, 1934.
Sarwar, G., and K. A. DeJong, Arcs, oroclines, West, W. D., Preliminary geological report on the syntaxes: The curvatures of mountain belts in Pakistan, in Geodynamics of Pakistan, edited by A. Farah and K. DeJong, pp. 341-349, Geological Survey of Pakistan, Quetta, Pakistan, 1979.
Scholz, C. H., Transform fault systems of California and New Zealand: Similarities in
their tectonic and seismic styles, J. Geol. Soc. London, 133, 215-219, 1977.
Seeber, L., and J. Armbruster, Seismicity of the Hazara Arc in Northern Pakistan: D•collement
Baluchistan (Quetta) earthquake of May 31st, 1935, Rec. Geol. Surv. India, 69, 203-240, 1935.
Yeats, R. S., R. D. Lawrence, S. Jamil-Ud-Din, and S. Hassan Khan, Surface effects of the 16 March 1978 earthquake, Pakistan-Afghanistan border, in Geodynamics of Pakistan, edited by A. Farah and K. DeJong, pp. 359-361, Geological Survey of Pakistan, Quetta, Pakistan, 1979.
vs. basement faulting, in Geodynamics of -- Pakistan, edited by A. Farah and K. DeJong, J. G. Armbruster, Lamont-Doherty Geological pp. 131-142, Geological Survey of Pakistan, Observatory of Columbia University, Palisades, NY Quetta, Pakistan, 1979. 10964.
Singh, D. D., and H. K. Gupta, Source dynamics of A. L. Kafka, Department of Geology and two great earthquakes of the Indian Geophysics, Boston College, Chestnut Hill, MA subcontinent: The Bihar-Nepal earthquake of 02167. January 15, 1934, and the Quetta earthquake of R. C. Quittmeyer, Woodward-Clyde Consultants, May 30, 1935, Bull. Seismol. Soc. Am., 70, 201 Willowbrook Blvd., Wayne, NJ 07470. 757-773, 1980.
Swaminath, J., V. Venkatesh, and R. K. Sundaram, (Received June 25, 1983; Role of Precambrian lineaments in the evolution revised June 14, 1983; of Cenozoic festoons of the Indian accepted September 6, 1983.)