Focal brain matter differences associated with lifetime alcohol intake and visual attention in male...
10
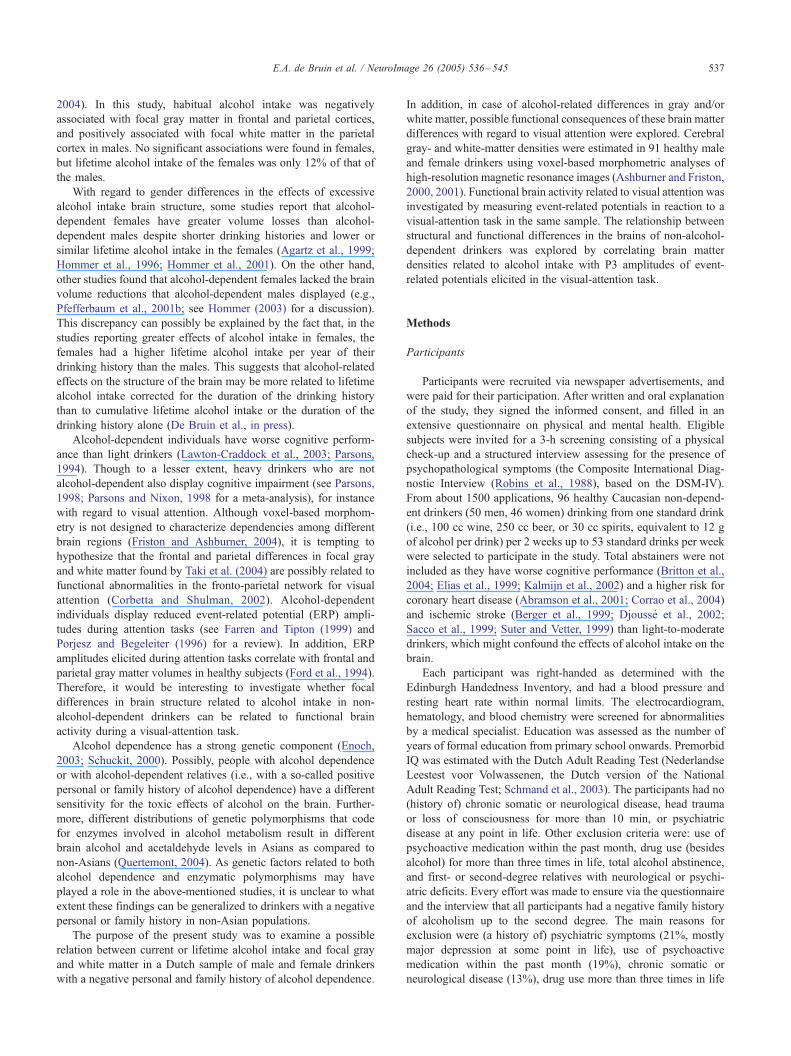
Focal brain matter differences associated with lifetime alcohol intake and visual attention in male but not in female non-alcohol-dependent drinkers Eveline A. de Bruin, a, T Hilleke E. Hulshoff Pol, b Hugo G. Schnack, b Joost Janssen, b Suzanne Bijl, a Alan C. Evans, d J. Leon Kenemans, a,c Ren2 S. Kahn, b and Marinus N. Verbaten a a Department of Psychopharmacology, Utrecht Institute of Pharmaceutical Sciences, Utrecht University, Sorbonnelaan 16, NL-3584 CA Utrecht, The Netherlands b Department of Psychiatry, Rudolf Magnus Institute, University Medical Center Utrecht, Utrecht, The Netherlands c Department of Psychonomics, Helmholtz Institute, Utrecht University, Utrecht, The Netherlands d McConnel Brain Imaging Centre, Montreal Neurological Institute, Montreal, QC, Canada Received 27 September 2004; revised 11 January 2005; accepted 26 January 2005 Available online 11 March 2005 Abstract The purpose of this study was to investigate whether current or lifetime alcohol intake is related to focal gray and white matter in healthy non-alcohol-dependent drinkers, and, if so, whether these densities are related to functional brain activity associated with visual attention. Voxel-based morphometric analyses of gray- and white-matter densities, and event-related potentials in response to a visual-attention task were determined in 47 male drinkers (current alcohol intake 20 drinks per week, lifetime alcohol intake 240 kg) and 44 female drinkers (current alcohol intake 15 drinks per week, lifetime alcohol intake 170 kg). All participants had a negative personal and family history of alcohol dependence to reduce possible confounding by genetic factors related to alcohol dependence. In males, mean lifetime alcohol intake was negatively associated with gray-matter density and positively associated with white-matter density in the right frontal gyrus (BA 6) and the right parietal region (BA 40). Right frontal (but not right parietal) gray and white matter in males correlated with the P3 amplitude of the event-related potentials elicited in a visual-attention task. In females, mean lifetime alcohol intake was not associated with gray- or white-matter density. Current alcohol intake was unrelated to gray or white matter in both males and females. In conclusion, lifetime alcohol intake is associated with focal gray-matter decreases and white-matter increases in the right frontal and right parietal brain regions in non-alcohol-dependent males, but not in females. These alcohol- related differences in focal brain matter in males are associated with differences in brain function related to visual attention. As the confounding effects of genetic factors were reduced, the present results may selectively relate to the effects of alcohol intake on focal brain matter. D 2005 Elsevier Inc. All rights reserved. Keywords: Lifetime alcohol intake; Current alcohol intake; Voxel-based morphometry; Gray matter; White matter; Event-related potentials; Visual attention; P3 Introduction Alcohol-dependent individuals have smaller total-brain and gray- and white-matter volumes, and greater cerebrospinal-fluid (CSF) volumes than light drinkers (e.g., Agartz et al., 2003; Hommer et al., 2001; Pfefferbaum et al., 1992). The effects of alcohol dependence on brain volumes are regionally specific and particularly involve frontal-lobe volume decreases (Fein et al., 2002; Jernigan et al., 1991; Lingford-Hughes et al., 1998; Pfefferbaum et al., 1997) and neuronal loss (Harper et al., 2003; Kril et al., 1997). In addition, the effects of alcohol dependence on brain metabolism (Dao-Castellana et al., 1998; Johnson-Greene et al., 1997) and brain metabolite concentrations (Meyerhoff et al., 2004; Parks et al., 2002; Schweinsburg et al., 2001) also vary across brain regions. There are suggestions that heavy drinkers who are not alcohol- dependent have ventricular and sulcal widening that is similar to, but less prominent than that in alcohol-dependent individuals (Ding et al., 2004; Kubota et al., 2001; Mukamal et al., 2001). It appears that the effects of alcohol on the brain are also regionally differentiated in non-alcohol-dependent drinkers, as suggested by a voxel-based morphometry study on aging in Japanese (Taki et al., 1053-8119/$ - see front matter D 2005 Elsevier Inc. All rights reserved. doi:10.1016/j.neuroimage.2005.01.036 T Corresponding author. Fax: +31 30 253 7900. E-mail address: [email protected] (E.A. de Bruin). Available online on ScienceDirect (www.sciencedirect.com). www.elsevier.com/locate/ynimg NeuroImage 26 (2005) 536 – 545
-
Upload
independent -
Category
Documents
-
view
3 -
download
0
Transcript of Focal brain matter differences associated with lifetime alcohol intake and visual attention in male...
www.elsevier.com/locate/ynimg
NeuroImage 26 (2005) 536 – 545
Focal brain matter differences associated with lifetime alcohol
intake and visual attention in male but not in female
non-alcohol-dependent drinkers
Eveline A. de Bruin,a,T Hilleke E. Hulshoff Pol,b Hugo G. Schnack,b Joost Janssen,b
Suzanne Bijl,a Alan C. Evans,d J. Leon Kenemans,a,c
Ren2 S. Kahn,b and Marinus N. Verbatena
aDepartment of Psychopharmacology, Utrecht Institute of Pharmaceutical Sciences, Utrecht University, Sorbonnelaan 16,
NL-3584 CA Utrecht, The NetherlandsbDepartment of Psychiatry, Rudolf Magnus Institute, University Medical Center Utrecht, Utrecht, The NetherlandscDepartment of Psychonomics, Helmholtz Institute, Utrecht University, Utrecht, The NetherlandsdMcConnel Brain Imaging Centre, Montreal Neurological Institute, Montreal, QC, Canada
Received 27 September 2004; revised 11 January 2005; accepted 26 January 2005
Available online 11 March 2005
AbstractThe purpose of this study was to investigate whether current or
lifetime alcohol intake is related to focal gray and white matter in
healthy non-alcohol-dependent drinkers, and, if so, whether these
densities are related to functional brain activity associated with
visual attention. Voxel-based morphometric analyses of gray- and
white-matter densities, and event-related potentials in response to a
visual-attention task were determined in 47 male drinkers (current
alcohol intake 20 drinks per week, lifetime alcohol intake 240 kg)
and 44 female drinkers (current alcohol intake 15 drinks per week,
lifetime alcohol intake 170 kg). All participants had a negative
personal and family history of alcohol dependence to reduce possible
confounding by genetic factors related to alcohol dependence. In
males, mean lifetime alcohol intake was negatively associated with
gray-matter density and positively associated with white-matter
density in the right frontal gyrus (BA 6) and the right parietal
region (BA 40). Right frontal (but not right parietal) gray and white
matter in males correlated with the P3 amplitude of the event-related
potentials elicited in a visual-attention task. In females, mean lifetime
alcohol intake was not associated with gray- or white-matter density.
Current alcohol intake was unrelated to gray or white matter in
both males and females. In conclusion, lifetime alcohol intake is
associated with focal gray-matter decreases and white-matter
increases in the right frontal and right parietal brain regions in
non-alcohol-dependent males, but not in females. These alcohol-
related differences in focal brain matter in males are associated with
differences in brain function related to visual attention. As the
confounding effects of genetic factors were reduced, the present
1053-8119/$ - see front matter D 2005 Elsevier Inc. All rights reserved.
doi:10.1016/j.neuroimage.2005.01.036
T Corresponding author. Fax: +31 30 253 7900.
E-mail address: [email protected] (E.A. de Bruin).
Available online on ScienceDirect (www.sciencedirect.com).
results may selectively relate to the effects of alcohol intake on focal
brain matter.
D 2005 Elsevier Inc. All rights reserved.
Keywords: Lifetime alcohol intake; Current alcohol intake; Voxel-based
morphometry; Gray matter; White matter; Event-related potentials; Visual
attention; P3
Introduction
Alcohol-dependent individuals have smaller total-brain and
gray- and white-matter volumes, and greater cerebrospinal-fluid
(CSF) volumes than light drinkers (e.g., Agartz et al., 2003;
Hommer et al., 2001; Pfefferbaum et al., 1992). The effects of
alcohol dependence on brain volumes are regionally specific and
particularly involve frontal-lobe volume decreases (Fein et al., 2002;
Jernigan et al., 1991; Lingford-Hughes et al., 1998; Pfefferbaum et
al., 1997) and neuronal loss (Harper et al., 2003; Kril et al., 1997). In
addition, the effects of alcohol dependence on brain metabolism
(Dao-Castellana et al., 1998; Johnson-Greene et al., 1997) and brain
metabolite concentrations (Meyerhoff et al., 2004; Parks et al.,
2002; Schweinsburg et al., 2001) also vary across brain regions.
There are suggestions that heavy drinkers who are not alcohol-
dependent have ventricular and sulcal widening that is similar to,
but less prominent than that in alcohol-dependent individuals
(Ding et al., 2004; Kubota et al., 2001; Mukamal et al., 2001). It
appears that the effects of alcohol on the brain are also regionally
differentiated in non-alcohol-dependent drinkers, as suggested by a
voxel-based morphometry study on aging in Japanese (Taki et al.,
E.A. de Bruin et al. / NeuroImage 26 (2005) 536–545 537
2004). In this study, habitual alcohol intake was negatively
associated with focal gray matter in frontal and parietal cortices,
and positively associated with focal white matter in the parietal
cortex in males. No significant associations were found in females,
but lifetime alcohol intake of the females was only 12% of that of
the males.
With regard to gender differences in the effects of excessive
alcohol intake brain structure, some studies report that alcohol-
dependent females have greater volume losses than alcohol-
dependent males despite shorter drinking histories and lower or
similar lifetime alcohol intake in the females (Agartz et al., 1999;
Hommer et al., 1996; Hommer et al., 2001). On the other hand,
other studies found that alcohol-dependent females lacked the brain
volume reductions that alcohol-dependent males displayed (e.g.,
Pfefferbaum et al., 2001b; see Hommer (2003) for a discussion).
This discrepancy can possibly be explained by the fact that, in the
studies reporting greater effects of alcohol intake in females, the
females had a higher lifetime alcohol intake per year of their
drinking history than the males. This suggests that alcohol-related
effects on the structure of the brain may be more related to lifetime
alcohol intake corrected for the duration of the drinking history
than to cumulative lifetime alcohol intake or the duration of the
drinking history alone (De Bruin et al., in press).
Alcohol-dependent individuals have worse cognitive perform-
ance than light drinkers (Lawton-Craddock et al., 2003; Parsons,
1994). Though to a lesser extent, heavy drinkers who are not
alcohol-dependent also display cognitive impairment (see Parsons,
1998; Parsons and Nixon, 1998 for a meta-analysis), for instance
with regard to visual attention. Although voxel-based morphom-
etry is not designed to characterize dependencies among different
brain regions (Friston and Ashburner, 2004), it is tempting to
hypothesize that the frontal and parietal differences in focal gray
and white matter found by Taki et al. (2004) are possibly related to
functional abnormalities in the fronto-parietal network for visual
attention (Corbetta and Shulman, 2002). Alcohol-dependent
individuals display reduced event-related potential (ERP) ampli-
tudes during attention tasks (see Farren and Tipton (1999) and
Porjesz and Begeleiter (1996) for a review). In addition, ERP
amplitudes elicited during attention tasks correlate with frontal and
parietal gray matter volumes in healthy subjects (Ford et al., 1994).
Therefore, it would be interesting to investigate whether focal
differences in brain structure related to alcohol intake in non-
alcohol-dependent drinkers can be related to functional brain
activity during a visual-attention task.
Alcohol dependence has a strong genetic component (Enoch,
2003; Schuckit, 2000). Possibly, people with alcohol dependence
or with alcohol-dependent relatives (i.e., with a so-called positive
personal or family history of alcohol dependence) have a different
sensitivity for the toxic effects of alcohol on the brain. Further-
more, different distributions of genetic polymorphisms that code
for enzymes involved in alcohol metabolism result in different
brain alcohol and acetaldehyde levels in Asians as compared to
non-Asians (Quertemont, 2004). As genetic factors related to both
alcohol dependence and enzymatic polymorphisms may have
played a role in the above-mentioned studies, it is unclear to what
extent these findings can be generalized to drinkers with a negative
personal or family history in non-Asian populations.
The purpose of the present study was to examine a possible
relation between current or lifetime alcohol intake and focal gray
and white matter in a Dutch sample of male and female drinkers
with a negative personal and family history of alcohol dependence.
In addition, in case of alcohol-related differences in gray and/or
white matter, possible functional consequences of these brain matter
differences with regard to visual attention were explored. Cerebral
gray- and white-matter densities were estimated in 91 healthy male
and female drinkers using voxel-based morphometric analyses of
high-resolution magnetic resonance images (Ashburner and Friston,
2000, 2001). Functional brain activity related to visual attention was
investigated by measuring event-related potentials in reaction to a
visual-attention task in the same sample. The relationship between
structural and functional differences in the brains of non-alcohol-
dependent drinkers was explored by correlating brain matter
densities related to alcohol intake with P3 amplitudes of event-
related potentials elicited in the visual-attention task.
Methods
Participants
Participants were recruited via newspaper advertisements, and
were paid for their participation. After written and oral explanation
of the study, they signed the informed consent, and filled in an
extensive questionnaire on physical and mental health. Eligible
subjects were invited for a 3-h screening consisting of a physical
check-up and a structured interview assessing for the presence of
psychopathological symptoms (the Composite International Diag-
nostic Interview (Robins et al., 1988), based on the DSM-IV).
From about 1500 applications, 96 healthy Caucasian non-depend-
ent drinkers (50 men, 46 women) drinking from one standard drink
(i.e., 100 cc wine, 250 cc beer, or 30 cc spirits, equivalent to 12 g
of alcohol per drink) per 2 weeks up to 53 standard drinks per week
were selected to participate in the study. Total abstainers were not
included as they have worse cognitive performance (Britton et al.,
2004; Elias et al., 1999; Kalmijn et al., 2002) and a higher risk for
coronary heart disease (Abramson et al., 2001; Corrao et al., 2004)
and ischemic stroke (Berger et al., 1999; Djouss2 et al., 2002;
Sacco et al., 1999; Suter and Vetter, 1999) than light-to-moderate
drinkers, which might confound the effects of alcohol intake on the
brain.
Each participant was right-handed as determined with the
Edinburgh Handedness Inventory, and had a blood pressure and
resting heart rate within normal limits. The electrocardiogram,
hematology, and blood chemistry were screened for abnormalities
by a medical specialist. Education was assessed as the number of
years of formal education from primary school onwards. Premorbid
IQ was estimated with the Dutch Adult Reading Test (Nederlandse
Leestest voor Volwassenen, the Dutch version of the National
Adult Reading Test; Schmand et al., 2003). The participants had no
(history of) chronic somatic or neurological disease, head trauma
or loss of consciousness for more than 10 min, or psychiatric
disease at any point in life. Other exclusion criteria were: use of
psychoactive medication within the past month, drug use (besides
alcohol) for more than three times in life, total alcohol abstinence,
and first- or second-degree relatives with neurological or psychi-
atric deficits. Every effort was made to ensure via the questionnaire
and the interview that all participants had a negative family history
of alcoholism up to the second degree. The main reasons for
exclusion were (a history of) psychiatric symptoms (21%, mostly
major depression at some point in life), use of psychoactive
medication within the past month (19%), chronic somatic or
neurological disease (13%), drug use more than three times in life
E.A. de Bruin et al. / NeuroImage 26 (2005) 536–545538
(9%), first- or second-degree relatives with alcoholism (8%), first-
or second-degree relatives with neurological or psychiatric deficits
(7%), head trauma or loss of consciousness for more than 10 min
(5%), or conditions that preclude MRI scanning (3%).
Lifetime alcohol intake (cumulative lifetime alcohol intake in
kg) and duration of the drinking history (in years) were assessed by
a questionnaire in Dutch, based on the Lifetime Drinking History
interview (Lemmens et al., 1997; Skinner and Sheu, 1982). To
estimate current alcohol intake, subjects filled in a diary during a
two-week period in which they recorded the number of alcoholic
drinks and the type of glass, bottle, or can on a daily basis.
Reported alcohol intake was converted into number of standard
drinks (i.e., units containing 12 g of alcohol) per week. To achieve
a homogeneous distribution of age, gender, Mini Mental State
Examination (MMSE) score and body-mass index, the drinkers
were stratified on the basis of the diary. The following drinking
levels were defined: �5 alcoholic drinks per week (14 men, 16
women), 6–20 alcoholic drinks per week (17 men, 15 women),
and 21–60 alcoholic drinks per week (19 men, 15 women). The
cut-off of 21 drinks per week was based on the results of a meta-
analysis by Parsons (1998), demonstrating that non-alcohol-
dependent drinkers with an alcohol intake of 21 or more alcoholic
drinks per week had worse cognitive functioning than drinkers
consuming less than 21 drinks per week. For five participants (one
male and one female drinking �5 drinks per week, and two males
and one female drinking 21–60 drinks per week), the quality of the
magnetic resonance imaging (MRI) scans was too poor for a
satisfying separation of gray and white matter; these participants
were removed from all analyses. For a summary of the
demographics of the 91 participants in the final analyses, see
Table 1.
This study was approved by the Utrecht University medical
ethics committee, and all participants were treated in accordance
with the Helsinki Declaration and amendments.
MRI scan acquisition and analysis
Magnetic resonance images were acquired using a 1.5-T Philips
NT scanner (Philips Medical Systems, Best, the Netherlands). T1-
weighted three-dimensional fast-field echo scans with 160–180
1.2-mm contiguous coronal slices (TE = 4.6 ms, TR = 30 ms, flip
angle 30-, field of view 256 mm/80%; in-plane voxel sizes 1 � 1
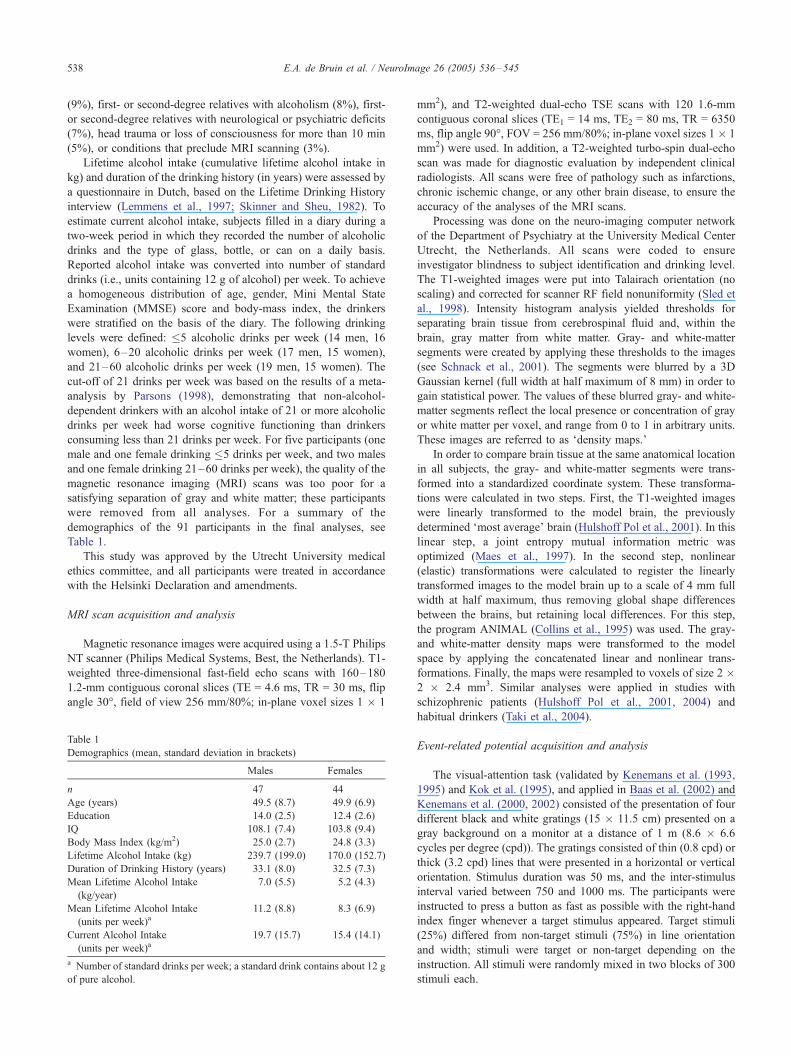
Table 1
Demographics (mean, standard deviation in brackets)
Males Females
n 47 44
Age (years) 49.5 (8.7) 49.9 (6.9)
Education 14.0 (2.5) 12.4 (2.6)
IQ 108.1 (7.4) 103.8 (9.4)
Body Mass Index (kg/m2) 25.0 (2.7) 24.8 (3.3)
Lifetime Alcohol Intake (kg) 239.7 (199.0) 170.0 (152.7)
Duration of Drinking History (years) 33.1 (8.0) 32.5 (7.3)
Mean Lifetime Alcohol Intake
(kg/year)
7.0 (5.5) 5.2 (4.3)
Mean Lifetime Alcohol Intake
(units per week)a11.2 (8.8) 8.3 (6.9)
Current Alcohol Intake
(units per week)a19.7 (15.7) 15.4 (14.1)
a Number of standard drinks per week; a standard drink contains about 12 g
of pure alcohol.
mm2), and T2-weighted dual-echo TSE scans with 120 1.6-mm
contiguous coronal slices (TE1 = 14 ms, TE2 = 80 ms, TR = 6350
ms, flip angle 90-, FOV = 256 mm/80%; in-plane voxel sizes 1 � 1
mm2) were used. In addition, a T2-weighted turbo-spin dual-echo
scan was made for diagnostic evaluation by independent clinical
radiologists. All scans were free of pathology such as infarctions,
chronic ischemic change, or any other brain disease, to ensure the
accuracy of the analyses of the MRI scans.
Processing was done on the neuro-imaging computer network
of the Department of Psychiatry at the University Medical Center
Utrecht, the Netherlands. All scans were coded to ensure
investigator blindness to subject identification and drinking level.
The T1-weighted images were put into Talairach orientation (no
scaling) and corrected for scanner RF field nonuniformity (Sled et
al., 1998). Intensity histogram analysis yielded thresholds for
separating brain tissue from cerebrospinal fluid and, within the
brain, gray matter from white matter. Gray- and white-matter
segments were created by applying these thresholds to the images
(see Schnack et al., 2001). The segments were blurred by a 3D
Gaussian kernel (full width at half maximum of 8 mm) in order to
gain statistical power. The values of these blurred gray- and white-
matter segments reflect the local presence or concentration of gray
or white matter per voxel, and range from 0 to 1 in arbitrary units.
These images are referred to as Fdensity maps._In order to compare brain tissue at the same anatomical location
in all subjects, the gray- and white-matter segments were trans-
formed into a standardized coordinate system. These transforma-
tions were calculated in two steps. First, the T1-weighted images
were linearly transformed to the model brain, the previously
determined Fmost average_ brain (Hulshoff Pol et al., 2001). In this
linear step, a joint entropy mutual information metric was
optimized (Maes et al., 1997). In the second step, nonlinear
(elastic) transformations were calculated to register the linearly
transformed images to the model brain up to a scale of 4 mm full
width at half maximum, thus removing global shape differences
between the brains, but retaining local differences. For this step,
the program ANIMAL (Collins et al., 1995) was used. The gray-
and white-matter density maps were transformed to the model
space by applying the concatenated linear and nonlinear trans-
formations. Finally, the maps were resampled to voxels of size 2 �2 � 2.4 mm3. Similar analyses were applied in studies with
schizophrenic patients (Hulshoff Pol et al., 2001, 2004) and
habitual drinkers (Taki et al., 2004).
Event-related potential acquisition and analysis
The visual-attention task (validated by Kenemans et al. (1993,
1995) and Kok et al. (1995), and applied in Baas et al. (2002) and
Kenemans et al. (2000, 2002) consisted of the presentation of four
different black and white gratings (15 � 11.5 cm) presented on a
gray background on a monitor at a distance of 1 m (8.6 � 6.6
cycles per degree (cpd)). The gratings consisted of thin (0.8 cpd) or
thick (3.2 cpd) lines that were presented in a horizontal or vertical
orientation. Stimulus duration was 50 ms, and the inter-stimulus
interval varied between 750 and 1000 ms. The participants were
instructed to press a button as fast as possible with the right-hand
index finger whenever a target stimulus appeared. Target stimuli
(25%) differed from non-target stimuli (75%) in line orientation
and width; stimuli were target or non-target depending on the
instruction. All stimuli were randomly mixed in two blocks of 300
stimuli each.
E.A. de Bruin et al. / NeuroImage 26 (2005) 536–545 539
The electroencephalogram (EEG) was recorded during execu-
tion of the visual-attention task from 62 tin electrodes placed
according to the international 10–10 system with the left mastoid
as a reference and AFz as a ground (QuikCap, Neurosoft, El Paso,
USA). The EEG signal was filtered online between 0.10 and 50
Hz, and digitized at a rate of 250 Hz. Off-line, the signal was
filtered with a 30-Hz low-pass filter, and re-referenced to an
average reference. Epochs of 1000 ms from 100 ms before stimulus
onset to 900 ms after stimulus onset were created, of which the first
100 ms served as a baseline. Based on Kenemans et al. (1995), the
P3 amplitude was determined at the Pz electrode on the peak of the
difference wave (target stimuli minus non-target stimuli with the
same line orientation) between 390 and 440 ms post-stimulus.
More information about the acquisition and analysis of ERP data,
and about the relationship between alcohol intake and the N1, N2b,
and P3 amplitudes can be found in Bijl et al. (submitted). Here,
only the association between the amplitude of the P3 component
and alcohol-related brain matter differences possibly found by
voxel-based morphometry are reported.
Statistical analyses
Mean lifetime alcohol intake was calculated by dividing
cumulative lifetime alcohol intake by the number of years of
drinking. The data were analyzed for outliers, normality of the
distribution, and homogeneity of the variance. The data of current
alcohol intake, mean lifetime alcohol intake, and cumulative
lifetime alcohol intake were square-root transformed to achieve a
normal distribution and variance homogeneity. Multiple univariate
linear regression analyses were performed for each voxel sepa-
rately through all gray- and white-matter density maps, with
densities as dependent variables. Age, gender, and alcohol intake
(current alcohol intake, mean lifetime alcohol intake, or cumulative
lifetime alcohol intake) were entered into the analyses as predictor
variables. To evaluate interactions with gender, the interaction
between gender and alcohol intake was added as a predictor
variable.
Results from the regression analyses were expressed as
unstandardized regression coefficients B with a standard error
SEB and an intercept. The relative importance of the predictors in
the model was indicated by a t statistic and a corresponding P
value. The statistical significance level was corrected for multiple
comparisons according to random field theory (Worsley et al.,
1996). The critical t value corresponding to an alpha-level of 0.05,
for a search volume of 1350 cm3, a blur kernel of 8 mm, and 86
degrees of freedom, was )t) > 5.30. The predictability of the
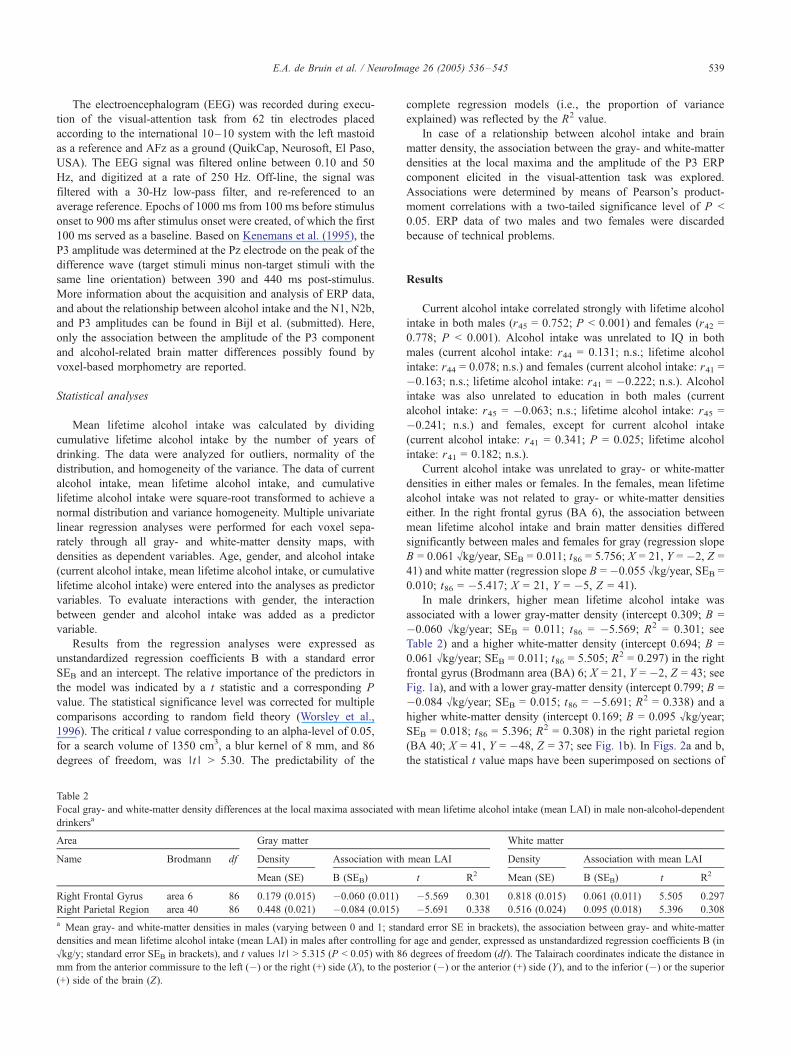
Table 2
Focal gray- and white-matter density differences at the local maxima associated w
drinkersa
Area Gray matter
Name Brodmann df Density Association with
Mean (SE) B (SEB)
Right Frontal Gyrus area 6 86 0.179 (0.015) �0.060 (0.011)
Right Parietal Region area 40 86 0.448 (0.021) �0.084 (0.015)
a Mean gray- and white-matter densities in males (varying between 0 and 1; stan
densities and mean lifetime alcohol intake (mean LAI) in males after controlling fo
�kg/y; standard error SEB in brackets), and t values )t) > 5.315 (P < 0.05) with 86
mm from the anterior commissure to the left (�) or the right (+) side (X), to the po
(+) side of the brain (Z).
complete regression models (i.e., the proportion of variance
explained) was reflected by the R2 value.
In case of a relationship between alcohol intake and brain
matter density, the association between the gray- and white-matter
densities at the local maxima and the amplitude of the P3 ERP
component elicited in the visual-attention task was explored.
Associations were determined by means of Pearson’s product-
moment correlations with a two-tailed significance level of P <
0.05. ERP data of two males and two females were discarded
because of technical problems.
Results
Current alcohol intake correlated strongly with lifetime alcohol
intake in both males (r45 = 0.752; P < 0.001) and females (r42 =
0.778; P < 0.001). Alcohol intake was unrelated to IQ in both
males (current alcohol intake: r44 = 0.131; n.s.; lifetime alcohol
intake: r44 = 0.078; n.s.) and females (current alcohol intake: r41 =
�0.163; n.s.; lifetime alcohol intake: r41 = �0.222; n.s.). Alcohol
intake was also unrelated to education in both males (current
alcohol intake: r45 = �0.063; n.s.; lifetime alcohol intake: r45 =
�0.241; n.s.) and females, except for current alcohol intake
(current alcohol intake: r41 = 0.341; P = 0.025; lifetime alcohol
intake: r41 = 0.182; n.s.).
Current alcohol intake was unrelated to gray- or white-matter
densities in either males or females. In the females, mean lifetime
alcohol intake was not related to gray- or white-matter densities
either. In the right frontal gyrus (BA 6), the association between
mean lifetime alcohol intake and brain matter densities differed
significantly between males and females for gray (regression slope
B = 0.061 �kg/year, SEB = 0.011; t86 = 5.756; X = 21, Y = �2, Z =
41) and white matter (regression slope B = �0.055 �kg/year, SEB =
0.010; t86 = �5.417; X = 21, Y = �5, Z = 41).
In male drinkers, higher mean lifetime alcohol intake was
associated with a lower gray-matter density (intercept 0.309; B =
�0.060 �kg/year; SEB = 0.011; t86 = �5.569; R2 = 0.301; see
Table 2) and a higher white-matter density (intercept 0.694; B =
0.061 �kg/year; SEB = 0.011; t86 = 5.505; R2 = 0.297) in the right
frontal gyrus (Brodmann area (BA) 6; X = 21, Y = �2, Z = 43; see
Fig. 1a), and with a lower gray-matter density (intercept 0.799; B =
�0.084 �kg/year; SEB = 0.015; t86 = �5.691; R2 = 0.338) and a
higher white-matter density (intercept 0.169; B = 0.095 �kg/year;
SEB = 0.018; t86 = 5.396; R2 = 0.308) in the right parietal region
(BA 40; X = 41, Y = �48, Z = 37; see Fig. 1b). In Figs. 2a and b,
the statistical t value maps have been superimposed on sections of
ith mean lifetime alcohol intake (mean LAI) in male non-alcohol-dependent
White matter
mean LAI Density Association with mean LAI
t R2 Mean (SE) B (SEB) t R2
�5.569 0.301 0.818 (0.015) 0.061 (0.011) 5.505 0.297
�5.691 0.338 0.516 (0.024) 0.095 (0.018) 5.396 0.308
dard error SE in brackets), the association between gray- and white-matter
r age and gender, expressed as unstandardized regression coefficients B (in
degrees of freedom (df). The Talairach coordinates indicate the distance in
sterior (�) or the anterior (+) side (Y), and to the inferior (�) or the superior
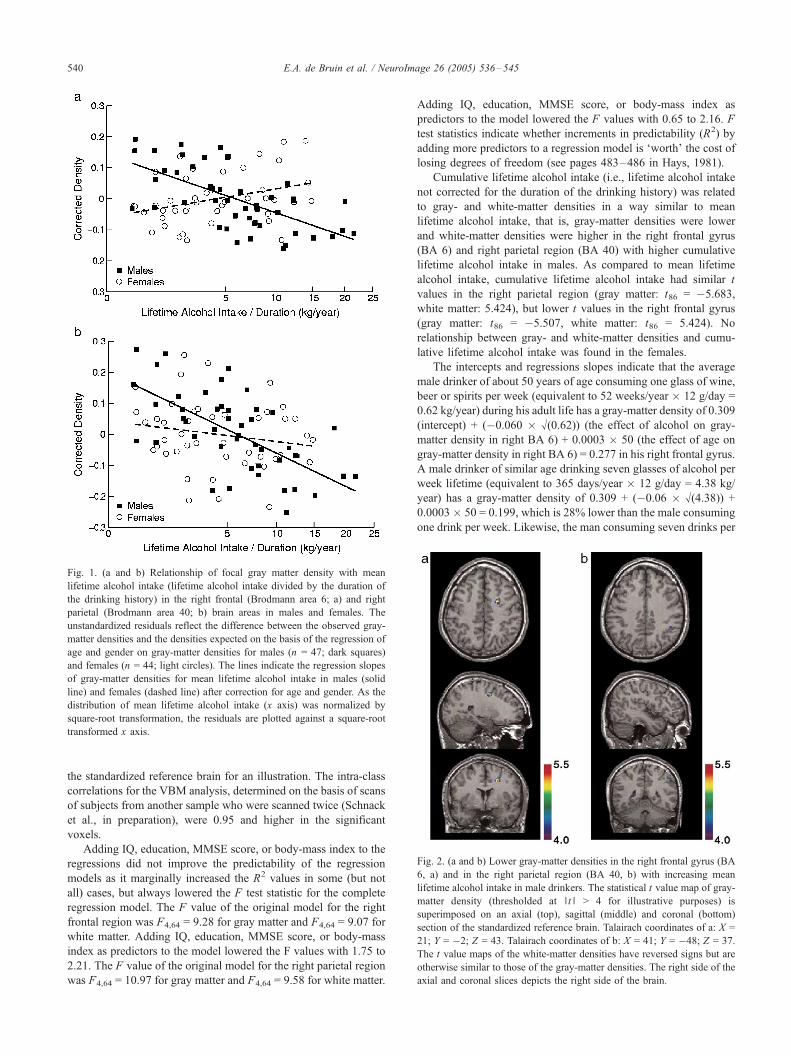
Fig. 2. (a and b) Lower gray-matter densities in the right frontal gyrus (BA
6, a) and in the right parietal region (BA 40, b) with increasing mean
lifetime alcohol intake in male drinkers. The statistical t value map of gray-
matter density (thresholded at )t) > 4 for illustrative purposes) is
superimposed on an axial (top), sagittal (middle) and coronal (bottom)
section of the standardized reference brain. Talairach coordinates of a: X =
21; Y = �2; Z = 43. Talairach coordinates of b: X = 41; Y = �48; Z = 37.
The t value maps of the white-matter densities have reversed signs but are
otherwise similar to those of the gray-matter densities. The right side of the
axial and coronal slices depicts the right side of the brain.
Fig. 1. (a and b) Relationship of focal gray matter density with mean
lifetime alcohol intake (lifetime alcohol intake divided by the duration of
the drinking history) in the right frontal (Brodmann area 6; a) and right
parietal (Brodmann area 40; b) brain areas in males and females. The
unstandardized residuals reflect the difference between the observed gray-
matter densities and the densities expected on the basis of the regression of
age and gender on gray-matter densities for males (n = 47; dark squares)
and females (n = 44; light circles). The lines indicate the regression slopes
of gray-matter densities for mean lifetime alcohol intake in males (solid
line) and females (dashed line) after correction for age and gender. As the
distribution of mean lifetime alcohol intake (x axis) was normalized by
square-root transformation, the residuals are plotted against a square-root
transformed x axis.
E.A. de Bruin et al. / NeuroImage 26 (2005) 536–545540
the standardized reference brain for an illustration. The intra-class
correlations for the VBM analysis, determined on the basis of scans
of subjects from another sample who were scanned twice (Schnack
et al., in preparation), were 0.95 and higher in the significant
voxels.
Adding IQ, education, MMSE score, or body-mass index to the
regressions did not improve the predictability of the regression
models as it marginally increased the R2 values in some (but not
all) cases, but always lowered the F test statistic for the complete
regression model. The F value of the original model for the right
frontal region was F4,64 = 9.28 for gray matter and F4,64 = 9.07 for
white matter. Adding IQ, education, MMSE score, or body-mass
index as predictors to the model lowered the F values with 1.75 to
2.21. The F value of the original model for the right parietal region
was F4,64 = 10.97 for gray matter and F4,64 = 9.58 for white matter.
Adding IQ, education, MMSE score, or body-mass index as
predictors to the model lowered the F values with 0.65 to 2.16. F
test statistics indicate whether increments in predictability (R2) by
adding more predictors to a regression model is Fworth_ the cost oflosing degrees of freedom (see pages 483–486 in Hays, 1981).
Cumulative lifetime alcohol intake (i.e., lifetime alcohol intake
not corrected for the duration of the drinking history) was related
to gray- and white-matter densities in a way similar to mean
lifetime alcohol intake, that is, gray-matter densities were lower
and white-matter densities were higher in the right frontal gyrus
(BA 6) and right parietal region (BA 40) with higher cumulative
lifetime alcohol intake in males. As compared to mean lifetime
alcohol intake, cumulative lifetime alcohol intake had similar t
values in the right parietal region (gray matter: t86 = �5.683,
white matter: 5.424), but lower t values in the right frontal gyrus
(gray matter: t86 = �5.507, white matter: t86 = 5.424). No
relationship between gray- and white-matter densities and cumu-
lative lifetime alcohol intake was found in the females.
The intercepts and regressions slopes indicate that the average
male drinker of about 50 years of age consuming one glass of wine,
beer or spirits per week (equivalent to 52 weeks/year � 12 g/day =
0.62 kg/year) during his adult life has a gray-matter density of 0.309
(intercept) + (�0.060 � �(0.62)) (the effect of alcohol on gray-
matter density in right BA 6) + 0.0003 � 50 (the effect of age on
gray-matter density in right BA 6) = 0.277 in his right frontal gyrus.
A male drinker of similar age drinking seven glasses of alcohol per
week lifetime (equivalent to 365 days/year � 12 g/day = 4.38 kg/
year) has a gray-matter density of 0.309 + (�0.06 � �(4.38)) +
0.0003� 50 = 0.199, which is 28% lower than the male consuming
one drink per week. Likewise, the man consuming seven drinks per
E.A. de Bruin et al. / NeuroImage 26 (2005) 536–545 541
week lifetime has an 11% higher white-matter density in his right
frontal gyrus (BA 6), a 19% lower gray-matter density and a 34%
higher white matter in his right parietal region (BA 40) at the local
maxima as compared to the man drinking one alcoholic consump-
tion per week lifetime.
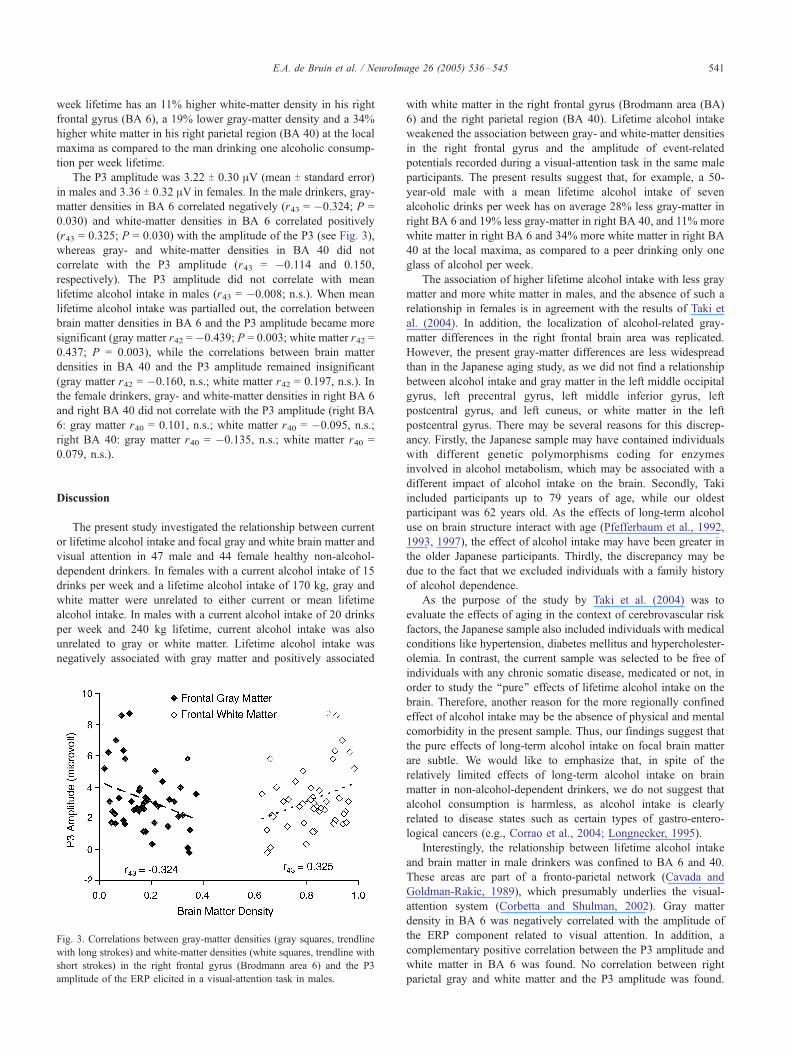
The P3 amplitude was 3.22 T 0.30 AV (mean T standard error)
in males and 3.36 T 0.32 AV in females. In the male drinkers, gray-
matter densities in BA 6 correlated negatively (r43 = �0.324; P =
0.030) and white-matter densities in BA 6 correlated positively
(r43 = 0.325; P = 0.030) with the amplitude of the P3 (see Fig. 3),
whereas gray- and white-matter densities in BA 40 did not
correlate with the P3 amplitude (r43 = �0.114 and 0.150,
respectively). The P3 amplitude did not correlate with mean
lifetime alcohol intake in males (r43 = �0.008; n.s.). When mean
lifetime alcohol intake was partialled out, the correlation between
brain matter densities in BA 6 and the P3 amplitude became more
significant (gray matter r42 =�0.439; P = 0.003; white matter r42 =
0.437; P = 0.003), while the correlations between brain matter
densities in BA 40 and the P3 amplitude remained insignificant
(gray matter r42 = �0.160, n.s.; white matter r42 = 0.197, n.s.). In
the female drinkers, gray- and white-matter densities in right BA 6
and right BA 40 did not correlate with the P3 amplitude (right BA
6: gray matter r40 = 0.101, n.s.; white matter r40 = �0.095, n.s.;
right BA 40: gray matter r40 = �0.135, n.s.; white matter r40 =
0.079, n.s.).
Discussion
The present study investigated the relationship between current
or lifetime alcohol intake and focal gray and white brain matter and
visual attention in 47 male and 44 female healthy non-alcohol-
dependent drinkers. In females with a current alcohol intake of 15
drinks per week and a lifetime alcohol intake of 170 kg, gray and
white matter were unrelated to either current or mean lifetime
alcohol intake. In males with a current alcohol intake of 20 drinks
per week and 240 kg lifetime, current alcohol intake was also
unrelated to gray or white matter. Lifetime alcohol intake was
negatively associated with gray matter and positively associated
Fig. 3. Correlations between gray-matter densities (gray squares, trendline
with long strokes) and white-matter densities (white squares, trendline with
short strokes) in the right frontal gyrus (Brodmann area 6) and the P3
amplitude of the ERP elicited in a visual-attention task in males.
with white matter in the right frontal gyrus (Brodmann area (BA)
6) and the right parietal region (BA 40). Lifetime alcohol intake
weakened the association between gray- and white-matter densities
in the right frontal gyrus and the amplitude of event-related
potentials recorded during a visual-attention task in the same male
participants. The present results suggest that, for example, a 50-
year-old male with a mean lifetime alcohol intake of seven
alcoholic drinks per week has on average 28% less gray-matter in
right BA 6 and 19% less gray-matter in right BA 40, and 11% more
white matter in right BA 6 and 34% more white matter in right BA
40 at the local maxima, as compared to a peer drinking only one
glass of alcohol per week.
The association of higher lifetime alcohol intake with less gray
matter and more white matter in males, and the absence of such a
relationship in females is in agreement with the results of Taki et
al. (2004). In addition, the localization of alcohol-related gray-
matter differences in the right frontal brain area was replicated.
However, the present gray-matter differences are less widespread
than in the Japanese aging study, as we did not find a relationship
between alcohol intake and gray matter in the left middle occipital
gyrus, left precentral gyrus, left middle inferior gyrus, left
postcentral gyrus, and left cuneus, or white matter in the left
postcentral gyrus. There may be several reasons for this discrep-
ancy. Firstly, the Japanese sample may have contained individuals
with different genetic polymorphisms coding for enzymes
involved in alcohol metabolism, which may be associated with a
different impact of alcohol intake on the brain. Secondly, Taki
included participants up to 79 years of age, while our oldest
participant was 62 years old. As the effects of long-term alcohol
use on brain structure interact with age (Pfefferbaum et al., 1992,
1993, 1997), the effect of alcohol intake may have been greater in
the older Japanese participants. Thirdly, the discrepancy may be
due to the fact that we excluded individuals with a family history
of alcohol dependence.
As the purpose of the study by Taki et al. (2004) was to
evaluate the effects of aging in the context of cerebrovascular risk
factors, the Japanese sample also included individuals with medical
conditions like hypertension, diabetes mellitus and hypercholester-
olemia. In contrast, the current sample was selected to be free of
individuals with any chronic somatic disease, medicated or not, in
order to study the ‘‘pure’’ effects of lifetime alcohol intake on the
brain. Therefore, another reason for the more regionally confined
effect of alcohol intake may be the absence of physical and mental
comorbidity in the present sample. Thus, our findings suggest that
the pure effects of long-term alcohol intake on focal brain matter
are subtle. We would like to emphasize that, in spite of the
relatively limited effects of long-term alcohol intake on brain
matter in non-alcohol-dependent drinkers, we do not suggest that
alcohol consumption is harmless, as alcohol intake is clearly
related to disease states such as certain types of gastro-entero-
logical cancers (e.g., Corrao et al., 2004; Longnecker, 1995).
Interestingly, the relationship between lifetime alcohol intake
and brain matter in male drinkers was confined to BA 6 and 40.
These areas are part of a fronto-parietal network (Cavada and
Goldman-Rakic, 1989), which presumably underlies the visual-
attention system (Corbetta and Shulman, 2002). Gray matter
density in BA 6 was negatively correlated with the amplitude of
the ERP component related to visual attention. In addition, a
complementary positive correlation between the P3 amplitude and
white matter in BA 6 was found. No correlation between right
parietal gray and white matter and the P3 amplitude was found.
E.A. de Bruin et al. / NeuroImage 26 (2005) 536–545542
The current finding of a correlation between frontal gray matter
and ERP amplitudes in an attention task corresponds with the study
of Ford et al. (1994). However, the direction of the correlation
between frontal gray matter and P3 amplitude was different, and
the correlation with parietal gray matter was not found. These
differences may be related to differences in the modality in which
the ERP stimuli were presented (visual instead of auditory), or to
the type of MRI analysis (focal brain structure as opposed to global
brain volumes).
Partialling out the effects of mean lifetime alcohol intake made
the correlations between frontal gray and white matter and the P3
amplitude stronger. The fact that mean lifetime alcohol intake had
this effect while only correlating with brain matter densities in BA
6 and not with the P3 amplitude, suggests that alcohol intake may
have influenced the P3 amplitude only indirectly through its
relationship with brain matter densities in BA 6. This may indicate
that lifetime alcohol intake influences the relationship between
frontal gray and white matter and functional brain activity related
to visual attention in non-alcohol-dependent drinkers.
The finding of a higher white-matter density with greater
lifetime alcohol intake is in agreement with our earlier
volumetric finding of greater frontal white-matter volume with
higher mean lifetime alcohol intake in the same sample of male
non-alcohol-dependent drinkers (De Bruin et al., in press). The
second parallel with the volumetric study is that mean lifetime
alcohol intake was associated with brain densities in the same
way as cumulative lifetime alcohol intake (i.e., in the same brain
areas and in males only), but that this association was stronger
for mean lifetime alcohol intake than for cumulative lifetime
alcohol intake, particularly in the right frontal gyrus. This
substantiates our hypothesis that lifetime alcohol intake corrected
for the duration of the drinking history may be a stronger
indicator for differences in brain structure than uncorrected
lifetime alcohol intake.
It is not clear why the effects of lifetime alcohol intake in this
study are limited to the right hemisphere. Lowering the critical
threshold t value for exploratory reasons did not reveal a similar
pattern in the left hemisphere, as illustrated in Figs. 2a and b. For
these figures, the threshold was set to )t) > 4 for illustrative
purposes, while the critical )t) was 5.30. These figures illustrate
that there was no mirror effect on the left side of the brain.
With regard to the interpretation of more white matter with
higher lifetime alcohol intake, one can only speculate. A possible
explanation is that more white matter reflects a higher number of
glial cells, which are associated with repair processes in the brain
(Hansson and RPnnb.ck, 2003). This would be in accordance with
a post-mortem study in which alcohol-dependent individuals were
reported to have a higher number of glial cells in the superior
frontal cortex (Harper et al., 1987). Alternatively, more white
matter could be a sign of more axonal sprouting (Chen et al.,
2002), possibly related to functional reorganization.
In the female drinkers, no association between lifetime alcohol
intake and gray or white matter was found. This may be related
to the slightly lower cumulative and mean lifetime alcohol intake
of the female drinkers. However, the existence of many other
gender differences with respect to alcohol, such as a more
beneficial effect of light and moderate alcohol intake on cognition
in females than in males (Britton et al., 2004; Dufouil et al.,
1997; Elias et al., 1999), suggests a genuine gender difference in
the long-term effects of alcohol intake on the brains of non-
alcohol-dependent drinkers. Possible behavioral explanations are
differences in drinking patterns or beverage choice between males
and females (Green et al., 2004). Biological explanations are
gender differences in alcohol metabolism (Graham et al., 1998;
Mumenthaler et al., 1999), lower sensitivity of brain metabolism
to acute alcohol effects in females (Wang et al., 2003), or a
protective effect of estrogen against glutamate toxicity in neuro-
nal and glial cells (Shy et al., 2000; Singer et al., 1996). On the
other hand, alcohol intake could be a proxy marker for good
physical and mental health in non-alcohol-dependent females
(Britton et al., 2004; Dufouil et al., 2001).
In recently detoxified alcoholics, CSF volume decreases
(Pfefferbaum et al., 1995; Schroth et al., 1988; Shear et al.,
1994; Zipursky et al., 1989) and gray- and white-matter volume
increase (Pfefferbaum et al., 1995; Shear et al., 1994) relatively
shortly after the onset of abstinence. This recovery of brain volume
in abstinent alcoholics as compared to relapsed alcoholics can be
measured as early as 3 to 5 weeks after the onset of sobriety, while
over the same interval brain volumes of control groups remain
virtually unchanged. This suggests that changes in brain structure
related to alcohol intake occur relatively fast. In the current sample
of non-alcohol-dependent drinkers, gray and white matters were
not associated with current alcohol intake. This may be explained
by the fact that brain recovery in abstinent alcoholics is a process
that is different from brain damage in active non-alcohol-depend-
ent drinkers. Alternatively, non-alcohol-dependent drinkers with-
out alcohol-dependent relatives, having a low influence of genetic
factors related to alcohol dependence, may have a different brain
reaction to recent alcohol intake than alcohol-dependent individ-
uals with a high influence of those genetic factors.
This study is limited in that the exploration of functional
consequences of alcohol-related differences in focal brain matter
was confined to brain activity related to visual attention. Brodmann
areas 6 and 40 are also involved in motor activity (Fink et al.,
1997) and visual working memory (Tsukiura et al., 2001). In
previous studies, alcohol-dependent individuals showed lower
functional activation of, among other regions, BA 6 and 40 during
a visual working memory task (Pfefferbaum et al., 2001; Tapert et
al., 2001). Therefore, associations between focal brain matter and
visual working memory or motor activity in non-alcohol-depend-
ent drinkers could complement the present findings on visual
attention. Furthermore, we are well aware of the methodological
limitations of voxel-based morphometry concerning spatial nor-
malization and smoothing of the data and statistical issues
(Ashburner and Friston, 2000, 201; Bookstein, 2001; Davatzikos,
2004). However, the present associations between lifetime alcohol
intake and brain matter densities are conservative due to stringent
corrections for multiple comparisons based on the random-field
theory (Worsley et al., 1996).
In conclusion, lifetime alcohol intake is negatively associated
with focal gray matter and positively associated with focal white
matter in the right frontal gyrus (BA 6) and the right parietal region
(BA 40) in male non-alcohol-dependent drinkers. Lifetime alcohol
intake attenuates the relationship between right frontal gray and
white matter and the P3 amplitude, indicating an influence of
alcohol intake on brain function via its relation with brain structure
in the right frontal gyrus in male non-alcohol-dependent drinkers.
In female non-alcohol-dependent drinkers, lifetime alcohol intake
was unrelated to focal gray or white matter. Current alcohol intake
was unrelated to gray and white matter in both males and females.
By reducing the influence of confounding genetic factors such as a
personal or family history of alcohol dependence and chronic
E.A. de Bruin et al. / NeuroImage 26 (2005) 536–545 543
medical conditions as much as possible, the present results may
selectively relate to the effects of alcohol intake on focal gray and
white matter.
Acknowledgments
The authors are grateful to William Verheul and Hanneke
Palmen for their assistance with subject recruitment, and to Neeltje
van Haren for data flow management.
This study was supported by the Dutch Foundation for
Scientific Research (NWO/ZonMW grant 960-40000-39.
References
Abramson, J.L., Williams, S.A., Krumholz, H.M., Vaccarino, V., 2001.
Moderate alcohol consumption and risk of heart failure among older
persons. JAMA 285, 1971–1977.
Agartz, I., Momenan, R., Rawlings, R.R., Kerich, M.J., Hommer, D.W.,
1999. Hippocampal volume in patients with alcohol dependence. Arch.
Gen. Psychiatry 56, 356–363.
Agartz, I., Brag, S., Franck, J., Hammarberg, A., Okugawa, G., Svinhufvud,
K., Bergman, H., 2003. MR volumetry during acute alcohol withdrawal
and abstinence: a descriptive study. Alcohol Alcohol. 38, 71–78.
Ashburner, J., Friston, K.J., 2000. Voxel-based morphometry: the methods.
NeuroImage 11, 805–821.
Ashburner, J., Friston, K.J., 2001. Why voxel-based morphometry should
be used. NeuroImage 14, 1238–1243.
Baas, J.M., Kenemans, J.L., Mangun, G.R., 2002. Selective attention to
spatial frequency: an ERP and source localization analysis. Clin.
Neurophysiol. 113, 1840–1854.
Berger, K., Ajani, U.A., Kase, C.S., Gaziano, J.M., Buring, J.E., Glynn,
R.J., Hennekens, C.H., 1999. Light-to-moderate alcohol consumption
and risk of stroke among U.S. male physicians. N. Engl. J. Med. 341,
1557–1564.
Bookstein, F.L., 2001. ‘‘Voxel-based morphometry’’ should not be used
with imperfectly registered images. NeuroImage 14, 1454–1462.
Britton, A., Singh-Manoux, A., Marmot, M., 2004. Alcohol consumption
and cognitive function in the Whitehall II study. Am. J. Epidemiol. 160,
240–247.
Cavada, C., Goldman-Rakic, P.S., 1989. Posterior parietal cortex in rhesus
monkey: II. Evidence for segregated corticocortical networks linking
sensory and limbic areas with the frontal lobe. J. Comp. Neurol. 287,
422–445.
Chen, R., Cohen, L.G., Hallett, M., 2002. Nervous system reorganization
following injury. Neuroscience 111, 761–773.
Collins, D.L., Holmes, C.J., Peters, T.M., Evans, A.C., 1995. Automatic 3-
D model-based neuroanatomical segmentation. Hum. Brain Mapp. 3,
190–208.
Corbetta, M., Shulman, G.L., 2002. Control of goal-directed and stimulus-
driven attention in the brain. Nat. Rev., Neurosci. 3, 201–215.
Corrao, G., Bagnardi, V., Zambon, A., La Vecchia, C., 2004. A meta-
analysis of alcohol consumption and the risk of 15 diseases. Prev. Med.
38, 613–619.
Dao-Castellana, M.H., Samson, Y., Legault, F., Martinot, J.L., Aubin, H.J.,
Crouzel, C., Feldman, L., Barrucand, D., Rancurel, G., Feline, A.,
Syrota, A., 1998. Frontal dysfunction in neurologically normal chronic
alcoholic subjects: metabolic and neuropsychological findings. Psychol.
Med. 28, 1039–1048.
Davatzikos, C., 2004. Why voxel-based morphometric analysis should be
used with great caution when characterizing group differences. Neuro-
Image 23, 17–20.
De Bruin, E.A., Hulshoff Pol, H.E., Bijl, S., Schnack, H.G., Fluitman, S.,
BPcker, K.B.E., Kenemans, J.L., Kahn, R.S., Verbaten, M.N., in press.
Associations between alcohol intake and brain volumes in male and
female moderate drinkers. Alcohol. Clin. Exp. Res.
Ding, J., Eigenbrodt, M.L., Mosley Jr., T.H., Hutchinson, R.G., Folsom,
A.R., Harris, T.B., Nieto, F.J., 2004. Alcohol intake and cerebral
abnormalities on magnetic resonance imaging in a community-based
population of middle-aged adults: the Atherosclerosis Risk in Com-
munities (ARIC) study. Stroke 35, 16–21.
Djouss2, L., Ellison, R.C., Beiser, A., Scaramucci, A., D’Agostino, R.B.,
Wolf, P.A., 2002. Alcohol consumption and risk of ischemic stroke: the
Framingham Study. Stroke 33, 907–912.
Dufouil, C., Ducimetiere, P., Alperovitch, A., 1997. Sex differences in the
association between alcohol consumption and cognitive performance.
Am. J. Epidemiol. 146, 405–412.
Dufouil, C., Kersaint-Gilly, A., Besancon, V., Levy, C., Auffray, E.,
Brunnereau, L., Alperovitch, A., Tzourio, C., 2001. Longitudinal study
of blood pressure and white matter hyperintensities: the EVA MRI
cohort. Neurology 56, 921–926.
Elias, P.K., Elias, M.F., D’Agostino, R.B., Silbershatz, H., Wolf, P.A., 1999.
Alcohol consumption and cognitive performance in the Framingham
Heart Study. Am. J. Epidemiol. 150, 580–589.
Enoch, M.A., 2003. Pharmacogenomics of alcohol response and addiction.
Am. J. Pharmacogenomics 3, 217–232.
Farren, C.K., Tipton, K.F., 1999. Trait markers for alcoholism: clinical
utility. Alcohol Alcohol. 34, 649–665.
Fein, G., Di Sclafani, V., Cardenas, V.A., Goldmann, H., Tolou-Shams,
M., Meyerhoff, D.J., 2002. Cortical gray matter loss in treatment-
naive alcohol dependent individuals. Alcohol.: Clin. Exp. Res. 26,
558–564.
Fink, G.R., Frackowiak, R.S., Pietrzyk, U., Passingham, R.E., 1997.
Multiple nonprimary motor areas in the human cortex. J. Neurophysiol.
77, 2164–2174.
Ford, J.M., Sullivan, E.V., Marsh, L., White, P.M., Lim, K.O., Pfefferbaum,
A., 1994. The relationship between P300 amplitude and regional gray
matter volumes depends upon the attentional system engaged. Electro-
encephalogr. Clin. Neurophysiol. 90, 214–228.
Friston, K.J., Ashburner, J., 2004. Generative and recognition models for
neuroanatomy. NeuroImage 23, 21–24.
Graham, K., Wilsnack, R., Dawson, D., Vogeltanz, N., 1998. Should
alcohol consumption measures be adjusted for gender differences?
Addiction 93, 1137–1147.
Green, C.A., Perrin, N.A., Polen, M.R., 2004. Gender differences in the
relationships between multiple measures of alcohol consumption and
physical and mental health. Alcohol.: Clin. Exp. Res. 28, 754–764.
Hansson, E., RPnnb.ck, L., 2003. Glial neuronal signaling in the central
nervous system. FASEB J. 17, 341–348.
Harper, C., Kril, J., Daly, J., 1987. Are we drinking our neurones away?
BMJ (Clin. Res. Ed.) 294, 534–536.
Harper, C., Dixon, G., Sheedy, D., Garrick, T., 2003. Neuropathological
alterations in alcoholic brains: studies arising from the New South
Wales Tissue Resource Centre. Prog. Neuro-Psychopharmacol. Biol.
Psychiatry 27, 951–961.
Hays, W.L., 1981. Statistics, third ed. CBS College Publishing, New York,
USA.
Hommer, D.W., 2003. Male and female sensitivity to alcohol-induced brain
damage. Alcohol Res. Health 27, 181–185.
Hommer, D., Momenan, R., Rawlings, R., Ragan, P., Williams, W., Rio, D.,
Eckardt, M., 1996. Decreased corpus callosum size among alcoholic
women. Arch. Neurol. 53, 359–363.
Hommer, D.W., Momenan, R., Kaiser, E., Rawlings, R.R., 2001. Evidence
for a gender-related effect of alcoholism on brain volumes. Am. J.
Psychiatry 158, 198–204.
Hulshoff Pol, H.E., Schnack, H.G., Mandl, R.C., van Haren, N.E.,
Koning, H., Collins, D.L., Evans, A.C., Kahn, R.S., 2001. Focal gray
matter density changes in schizophrenia. Arch. Gen. Psychiatry 58,
1118–1125.
Hulshoff Pol, H.E., Schnack, H.G., Mandl, R.C., Cahn, W., Collins, D.L.,
Evans, A.C., Kahn, R.S., 2004. Focal white matter density changes in
E.A. de Bruin et al. / NeuroImage 26 (2005) 536–545544
schizophrenia: reduced inter-hemispheric connectivity. NeuroImage 21,
27–35.
Jernigan, T.L., Butters, N., DiTraglia, G., Schafer, K., Smith, T., Irwin, M.,
Grant, I., Schuckit, M., Cermak, L.S., 1991. Reduced cerebral grey
matter observed in alcoholics using magnetic resonance imaging.
Alcohol.: Clin. Exp. Res. 15, 418–427.
Johnson-Greene, D., Adams, K.M., Gilman, S., Koeppe, R.A., Junck, L.,
Kluin, K.J., Martorello, S., Heumann, M., 1997. Effects of abstinence
and relapse upon neuropsychological function and cerebral glucose
metabolism in severe chronic alcoholism. J. Clin. Neuropsychol. 19,
378–385.
Kalmijn, S., van Boxtel, M.P., Verschuren, M.W., Jolles, J., Launer, L.J.,
2002. Cigarette smoking and alcohol consumption in relation to
cognitive performance in middle age. Am. J. Epidemiol. 156, 936–944.
Kenemans, J.L., Kok, A., Smulders, F.T., 1993. Event-related potentials to
conjunctions of spatial frequency and orientation as a function of
stimulus parameters and response requirements. Electroencephalogr.
Clin. Neurophysiol. 88, 51–63.
Kenemans, J.L., Smulders, F.T., Kok, A., 1995. Selective processing of
two-dimensional visual stimuli in young and old subjects: electro-
physiological analysis. Psychophysiology 32, 108–120.
Kenemans, J.L., Baas, J.M., Mangun, G.R., Lijffijt, M., Verbaten, M.N.,
2000. On the processing of spatial frequencies as revealed by evoked-
potential source modeling. Clin. Neurophysiol. 111, 1113–1123.
Kenemans, J.L., Lijffijt, M., Camfferman, G., Verbaten, M.N., 2002. Split-
second sequential selective activation in human secondary visual cortex.
J. Cogn. Neurosci. 14, 48–61.
Kok, A., Zeef, E.J., Kenemans, J.L., Sonke, C., 1995. Age-related
decline in visual selective attention functioning: evidence derived
from ERP paradigms. Electroencephalogr. Clin. Neurophysiol., Suppl.
44, 347–357.
Kril, J.J., Halliday, G.M., Svoboda, M.D., Cartwright, H., 1997. The
cerebral cortex is damaged in chronic alcoholics. Neuroscience 79,
983–998.
Kubota, M., Nakazaki, S., Hirai, S., Saeki, N., Yamaura, A., Kusaka, T.,
2001. Alcohol consumption and frontal lobe shrinkage: study of 1432
non-alcoholic subjects. J. Neurol., Neurosurg. Psychiatry 71, 104–106.
Lawton-Craddock, A., Nixon, S.J., Tivis, R., 2003. Cognitive efficiency in
stimulant abusers with and without alcohol dependence. Alcohol.: Clin.
Exp. Res. 27, 457–464.
Lemmens, P.H., Volovics, L., De Haan, Y., 1997. Measurement of lifetime
exposure to alcohol: data quality of a self-administered questionnaire
and impact on risk assessment. Contemp. Drug Probl. 24, 581–600.
Lingford-Hughes, A.R., Acton, P.D., Gacinovic, S., Suckling, J., Busatto,
G.F., Boddington, S.J., Bullmore, E., Woodruff, P.W., Costa, D.C.,
Pilowsky, L.S., Ell, P.J., Marshall, E.J., Kerwin, R.W., 1998. Reduced
levels of GABA-benzodiazepine receptor in alcohol dependency in the
absence of grey matter atrophy. Br. J. Psychiatry 173, 116–122.
Longnecker, M.P., 1995. Alcohol consumption and risk of cancer in
humans: an overview. Alcohol 12, 87–96.
Maes, F., Collignon, A., Vandermeulen, D., Marchal, G., Suetens, P., 1997.
Multimodality image registration by maximization of mutual informa-
tion. IEEE Trans. Med. Imaging 16, 187–198.
Meyerhoff, D.J., Blumenfeld, R., Truran, D., Lindgren, J., Flenniken, D.,
Cardenas, V., Chao, L.L., Rothlind, J., Studholme, C., Weiner, M.W.,
2004. Effects of heavy drinking, binge drinking, and family history of
alcoholism on regional brain metabolites. Alcohol.: Clin. Exp. Res. 28,
650–661.
Mukamal, K.J., Longstreth Jr., W.T., Mittleman, M.A., Crum, R.M.,
Siscovick, D.S., 2001. Alcohol consumption and subclinical findings on
magnetic resonance imaging of the brain in older adults: the
Cardiovascular Health Study. Stroke 32, 1939–1946.
Mumenthaler, M.S., Taylor, J.L., O’Hara, R., Yesavage, J.A., 1999.
Gender differences in moderate drinking effects. Alcohol Res. Health
23, 55–64.
Parks, M.H., Dawant, B.M., Riddle, W.R., Hartmann, S.L., Dietrich, M.S.,
Nickel, M.K., Price, R.R., Martin, P.R., 2002. Longitudinal brain
metabolic characterization of chronic alcoholics with proton magnetic
resonance spectroscopy. Alcohol.: Clin. Exp. Res. 26, 1368–1380.
Parsons, O.A., 1994. Neuropsychological measures and event-related
potentials in alcoholics: interrelationships, long-term reliabilities, and
prediction of resumption of drinking. J. Clin. Psychol. 50, 37–46.
Parsons, O.A., 1998. Neurocognitive deficits in alcoholics and social
drinkers: a continuum? Alcohol.: Clin. Exp. Res. 22, 954–961.
Parsons, O.A., Nixon, S.J., 1998. Cognitive functioning in sober social
drinkers: a review of the research since 1986. J. Stud. Alcohol 59,
180–190.
Pfefferbaum, A., Lim, K.O., Zipursky, R.B., Mathalon, D.H., Rosenbloom,
M.J., Lane, B., Ha, C.N., Sullivan, E.V., 1992. Brain gray and white
matter volume loss accelerates with aging in chronic alcoholics: a
quantitative MRI study. Alcohol.: Clin. Exp. Res. 16, 1078–1089.
Pfefferbaum, A., Sullivan, E.V., Rosenbloom, M.J., Shear, P.K., Mathalon,
D.H., Lim, K.O., 1993. Increase in brain cerebrospinal fluid volume is
greater in older than in younger alcoholic patients: a replication study
and CT/MRI comparison. Psychiatry Res. 50, 257–274.
Pfefferbaum, A., Sullivan, E.V., Mathalon, D.H., Shear, P.K., Rosenbloom,
M.J., Lim, K.O., 1995. Longitudinal changes in magnetic resonance
imaging brain volumes in abstinent and relapsed alcoholics. Alcohol.:
Clin. Exp. Res. 19, 1177–1191.
Pfefferbaum, A., Sullivan, E.V., Mathalon, D.H., Lim, K.O., 1997. Frontal
lobe volume loss observed with magnetic resonance imaging in older
chronic alcoholics. Alcohol.: Clin. Exp. Res. 21, 521–529.
Pfefferbaum, A., Desmond, J.E., Galloway, C., Menon, V., Glover, G.H.,
Sullivan, E.V., 2001a. Reorganization of frontal systems used by
alcoholics for spatial working memory: an fMRI study. NeuroImage 14,
7–20.
Pfefferbaum, A., Rosenbloom, M., Deshmukh, A., Sullivan, E.V., 2001b.
Sex differences in the effects of alcohol on brain structure. Am. J.
Psychiatry 158, 188–197.
Porjesz, B., Begeleiter, H., 1996. Effects of alcohol on electrophysiological
activity of the brain. In: Begleiter, H., Kissin, B. (Eds.), The
Pharmacology of Alcohol and Alcohol Dependence, 1st edR Oxford
Univ. Press, New York, pp. 207–247.
Quertemont, E., 2004. Genetic polymorphism in ethanol metabolism:
acetaldehyde contribution to alcohol abuse and alcoholism. Mol.
Psychiatry 9, 570–581.
Robins, L.N., Wing, J., Wittchen, H.U., Helzer, J.E., Babor, T.F., Burke, J.,
Farmer, A., Jablenski, A., Pickens, R., Regier, D.A., 1988. The
composite international diagnostic interview: an epidemiologic instru-
ment suitable for use in conjunction with different diagnostic systems
and in different cultures. Arch. Gen. Psychiatry 45, 1069–1077.
Sacco, R.L., Elkind, M., Boden-Albala, B., Lin, I.F., Kargman, D.E.,
Hauser, W.A., Shea, S., Paik, M.C., 1999. The protective effect of
moderate alcohol consumption on ischemic stroke. JAMA 281, 53–60.
Schmand, B., Lindeboom, J., Van Harskamp, F., 2003. NLV: Neder-
landse Leestest voor volwassenen. Zwets and Zeitlinger, Lisse, The
Netherlands.
Schnack, H.G., Hulshoff Pol, H.E., Baar2, W.F.C., Staal, W.G., Viergever,
M.A., Kahn, R.S., 2001. Automated separation of gray and white matter
from MR images of the human brain. NeuroImage 13, 230–237.
Schroth, G., Naegele, T., Klose, U., Mann, K., Petersen, D., 1988.
Reversible brain shrinkage in abstinent alcoholics, measured by MRI.
Neuroradiology 30, 385–389.
Schuckit, M.A., 2000. Genetics of the risk for alcoholism. Am. J. Addict. 9,
103–112.
Schweinsburg, B.C., Taylor, M.J., Alhassoon, O.M., Videen, J.S., Brown,
G.G., Patterson, T.L., Berger, F., Grant, I., 2001. Chemical pathology in
brain white matter of recently detoxified alcoholics: a 1 H magnetic
resonance spectroscopy investigation of alcohol-associated frontal lobe
injury. Alcohol.: Clin. Exp. Res. 25, 924–934.
Shear, P.K., Jernigan, T.L., Butters, N., 1994. Volumetric magnetic
resonance imaging quantification of longitudinal brain changes in
abstinent alcoholics. Alcohol.: Clin. Exp. Res. 18, 172–176.
Shy, H., Malaiyandi, L., Timiras, P.S., 2000. Protective action of 17b-
E.A. de Bruin et al. / NeuroImage 26 (2005) 536–545 545
estradiol and tamoxifen on glutamate toxicity in glial cells. Int. J. Dev.
Neurosci. 18, 289–297.
Singer, C.A., Rogers, K.L., Strickland, T.M., Dorsa, D.M., 1996. Estrogen
protects primary cortical neurons from glutamate toxicity. Neurosci.
Lett. 212, 13–16.
Skinner, H.A., Sheu, W.J., 1982. Reliability of alcohol use indices.
The lifetime drinking history and the MAST. J. Stud. Alcohol 43,
1157–1170.
Sled, J.G., Zijdenbos, A.P., Evans, A.C., 1998. A nonparametric method for
automatic correction of intensity nonuniformity in MRI data. IEEE
Trans. Med. Imaging 17, 87–97.
Suter, P.M., Vetter, W., 1999. Alcohol and ischemic stroke. Nutr. Rev. 57,
310–314.
Taki, Y., Goto, R., Evans, A., Zijdenbos, A., Neelin, P., Lerch, J., Sato, K.,
Ono, S., Kinomura, S., Nakagawa, M., Sugiura, M., Watanabe, J.,
Kawashima, R., Fukuda, H., 2004. Voxel-based morphometry of human
brain with age and cerebrovascular risk factors. Neurobiol. Aging 25,
455–463.
Tapert, S.F., Brown, G.G., Kindermann, S.S., Cheung, E.H., Frank, L.R.,
Brown, S.A., 2001. fMRI measurement of brain dysfunction in alcohol-
dependent young women. Alcohol.: Clin. Exp. Res. 25, 236–245.
Tsukiura, T., Fujii, T., Takahashi, T., Xiao, R., Inase, M., Iijima, T.,
Yamadori, A., Okuda, J., 2001. Neuroanatomical discrimination
between manipulating and maintaining processes involved in verbal
working memory: a functional MRI study. Cogn. Brain Res. 11, 13–21.
Wang, G.J., Volkow, N.D., Fowler, J.S., Franceschi, D., Wong, C.T.,
Pappas, N.R., Netusil, N., Zhu, W., Felder, C., Ma, Y., 2003. Alcohol
intoxication induces greater reductions in brain metabolism in male than
in female subjects. Alcohol.: Clin. Exp. Res. 27, 909–917.
Worsley, K.J., Marrett, S., Neelin, P., Vandal, A.C., Friston, K.J.,
Evans, A.C., 1996. A unified statistical approach for determining
significant signals in images of cerebral activation. Hum. Brain
Mapp. 4, 58–73.
Zipursky, R.B., Lim, K.C., Pfefferbaum, A., 1989. MRI study of brain
changes with short-term abstinence from alcohol. Alcohol.: Clin. Exp.
Res. 13, 664–666.