Expansions of CD8CD28- and CD8TcRVbeta5.2 T Cells in Peripheral Blood of Heavy Alcohol Drinkers
9
I ( 0145-6008/00/2404-0519$03.00/0 ALCOHOLI SM: C LINICAL AND E XPERIMENTAL R ES EARCH Vo l. 24 , No. 4 Apri l 2000 Expansions of CD8+CD28- and CD8+TcRVfl5.2+ T Cells -in Peripheral Blood of Heavy Alcohol Drinkers Fernando A. Aros<( Grac;;a Porto, Jose Manuel Cabeda, Rosa Lacerda, Dolores Resende, Eugenia Cruz, Carla Cardoso, Mafalda Fonseca, Carla Sim6es, Pedro Rodrigues, Fernanda Bravo, Jose Carlos Oliveira, Helena Alves, Jose Fraga, Benvindo Justic;;a, and Maria de Sousa Background: Despite heavy alcohol consumption, only a low percentage of heavy drinkers develop li ver di sease. Imbalances in T-ce ll subsets and iron metabo li sm parameters are common findings in heavy drinkers, yet the possible role played by discrete T-lymphocyte subsets und er heavy alcohol consumption remains unclear. Methods: To gain new in sights into the possible role played by T lymphocytes during alcohol consump- tion, characterization of CD28 ex pression and TcR repertoire in peripheral blood CD4+ and CD8+ T cells by two and three-calor flow cytometry was performed. A group of heavy alcohol drinkers (AHD , n = 71) and a group of age-matched contro ls (n = 81 ), both HLA-phenotyped and HFE-genotypcd, constituted the groups under study . Results: Marked expansions of CD28- T cells within the CD8+ but not the CD4+ T-cell pool were observed in AHD compared with controls. These CD8+ CD28- expansions were paralleled by expansions of CD8+ T cells bearing specific TcR Vcx/{3 chains, namely V{35.2. Moreover, AHD, but not controls, carrying the H63D mutation in the HFE gene showed significan tl y higher percentages of CD28- T ce ll s within the CD8+ T-cell pool than AHD carrying the normal HFE gene. Finall y, hi gh numbers of CD8+ CD28- T ce lls in AHD were associated with lower levels of the li ver-related enzymes AL T and GGT. Conclusions: This study showed that under acti ve ethanol consumption, expansions of discrete COS + T-cell sub sets occur within the CD8+ T-cell pool, that molecules of the MHC-class I locus seem tu influence the extent of the expansions, and that high numbers of CD8+CD28 - T cells arc associated with low leve ls of liver enzymes in AHD. Key Words: Alcohol, Liver, CD8, CD28, MHC-Ciass l. S TUDIES IN HEMOCHROMATOSIS have demon- strated that low numbers of peripheral blood CD8+ T cells predispose to a more severe clinical picture of iron overload (Porto et al., 1994, 1997; Reimao et al. , 1991) . The association between low CD8+ T-cell numbers and liver disease remains clinically significant in patients with mut a- tions in the hemochromatosis gene HFE (reviewed by de Sousa and Porto, 1998). The liver is the primary target organ injured during heavy alcohol consumption, and anomalies of iron metabolism parameters are also frequent (Ludwig et al., 1997). Despite the known association be- tween liver disease and alcohol intake, only a low percent- age of heavy drinkers develop liver disease (Bellentani et al., 1997). Among the pathogenetic factors involved in the development of liver disease, alterations in T-ce ll immune functions have been postulated to play an important role (Batey et al., 1999). From the In stitute for Molecular and Cell Biology (F.A.A., G. P. , E. C., C.C., M.F., C.S. , P.R., M.dS.), Abel Sa/azar Institute for the Biomedical Sciences (G.P., J.M.C., R.L., D.R., P.R., M.dS.), Santa Ant6nio General Hospital (G.P., .!.M. C., F. B., B.J.), Regional Center of Alcoholism (J.C.O.), North Histo compatibility Center (J.A . ), Porta, Portugal; and Vi/a Nova de Gaia Central Hospital (J.F.), Vi/a Nova de Gaia, Portugal. Received for publication September 9, 1999; accepted January 19 , 2000. Femando A. Arosa is a postdoctora/ fellow from the American Portuguese Biomedical Research Fund (APBRF). Reprint requests: Fern ando A . Arosa, Ph.D., Laborato1y of Molecular Immunology, institute for Molecular and Cell Biology, Rua do Campo Alegre, "823, 4150 Porta, Portugal; Fax: 351-2-6098480; £-mail.· farosa @ibmc.up.pt Copyright © 2000 by the Research Society on Alcoholism. Alcohol C/in Exp Res, Vol24 , No 4, 2000: pp 519-527 Studies of lymphocytes in alcoholics have consistently shown phenotypic anomalies in CD4+ and CD8+ T-cell subsets, low numbers of B cells, and decreased NK cell activity (Cook et al., 1991 , 1995, 1996, 1997 ; Laso et al., 1997; Muller et al. 1995; Schirren et al., 1997; Spinozzi et al., 1987). Some of these anomalies appear not to be re- lated to alcohol consumption, and therefore the role played by discrete T lymphocytes either in the development or the prevention of liver disease during heavy alcohol consump- tion remains unclear (Couzigou et al., 1984; Laso et al., 1997). Among the T -l ymphocyte coreceptors, CD28 ap- pears to be of critical importance. CD28 is a key costimu- latory molecule that is expressed on nearly all human pe- ripheral CD4+ T cells, whereas its expression in peripheral CD8+ T cells is highly variable (Lum et al., 1982; Yamada et al., 1985). Peripheral blood CD28- T lymphocytes, namely CD8+, usually express CDllb and CD57, and have 519
-
Upload
independent -
Category
Documents
-
view
0 -
download
0
Transcript of Expansions of CD8CD28- and CD8TcRVbeta5.2 T Cells in Peripheral Blood of Heavy Alcohol Drinkers
I (
0145-6008/00/2404-0519$03.00/0 ALCOHOLISM: C LI NICAL AND E X PERIMENTAL R ES EARCH
Vol. 24, No. 4 Apri l 2000
Expansions of CD8+CD28- and CD8+TcRVfl5.2+ T Cells -in Peripheral Blood of Heavy Alcohol Drinkers
Fernando A. Aros<( Grac;;a Porto, Jose Manuel Cabeda, Rosa Lacerda, Dolores Resende, Eugenia Cruz, Carla Cardoso, Mafalda Fonseca, Carla Sim6es, Pedro Rodrigues, Fernanda Bravo, Jose Carlos Oliveira, Helena Alves, Jose Fraga,
Benvindo Justic;;a, and Maria de Sousa
Background: Despite heavy alcohol consumption, only a low percentage of heavy drinkers develop liver disease. Imbalances in T-cell subsets and iron metabo lism parameters are common findings in heavy drinkers, yet the possible role played by discrete T-lymphocyte subsets under heavy alcohol consumption remains unclear.
Methods: To gain new insights into the possible role played by T lymphocytes during alcohol consumption, characterization of CD28 expression and TcR repertoire in peripheral blood CD4+ and CD8 + T cells by two and three-calor flow cytometry was performed. A group of heavy alcohol drinkers (AHD, n = 71) and a group of age-matched controls (n = 81 ), both HLA-phenotyped and HFE-genotypcd, constituted the groups under study.
Results: Marked expansions of CD28 - T cells within the CD8 + but not the CD4+ T-cell pool were observed in AHD compared with controls. These CD8 + CD28- expansions were paralleled by expansions of CD8+ T cells bearing specific TcR Vcx/{3 chains, namely V{35.2. Moreover, AHD, but not controls, carrying the H63D mutation in the HFE gene showed significan tly higher percentages of CD28- T cells within the CD8+ T-cell pool than AHD carrying the normal HFE gene. Finally, high numbers of CD8 + CD28- T cells in AHD were associated with lower levels of the liver-related enzymes AL T and GGT.
Conclusions: This study showed that under active ethanol consumption, expansions of discrete COS + T-cell subsets occur within the CD8+ T-cell pool , that molecu les of the MHC-class I locus seem tu influence the extent of the expansions, and that high numbers of CD8+CD28 - T cells arc associated with low levels of liver enzymes in AHD.
Key Words: Alcohol, Liver, CD8, CD28, MHC-Ciass l.
STUDIES IN HEMOCHROMATOSIS have demonstrated that low numbers of peripheral blood CD8+ T
cells predispose to a more severe clinical picture of iron overload (Porto et al., 1994, 1997; Reimao et al. , 1991). The association between low CD8+ T-cell numbers and liver disease remains clinically significant in patients with mutations in the hemochromatosis gene HFE (reviewed by de Sousa and Porto, 1998). The liver is the primary target organ injured during heavy alcohol consumption, and anomalies of iron metabolism parameters are also frequent (Ludwig et al., 1997). Despite the known association be-
tween liver disease and alcohol intake, only a low percentage of heavy drinkers develop liver disease (Bellentani et al., 1997). Among the pathogenetic factors involved in the development of liver disease, alterations in T-cell immune functions have been postulated to play an important role (Batey et al., 1999).
From the Institute for Molecular and Cell Biology (F.A.A., G. P. , E. C., C.C., M.F., C.S., P.R., M.dS.), Abel Sa/azar Institute for the Biomedical Sciences (G.P. , J.M.C., R.L., D.R., P.R. , M.dS.) , Santa Ant6nio General Hospital (G.P. , .!.M. C., F. B., B.J.), Regional Center of Alcoholism (J.C.O.) , North Histocompatibility Center (J.A .), Porta, Portugal; and Vi/a Nova de Gaia Central Hospital (J.F.) , Vi/a Nova de Gaia, Portugal.
Received for publication September 9, 1999; accepted January 19, 2000. Femando A. Arosa is a postdoctora/ fellow from the American Portuguese
Biomedical Research Fund (APBRF). Reprint requests: Fernando A . Arosa, Ph.D. , Laborato1y of Molecular
Immunology, institute for Molecular and Cell Biology, Rua do Campo Alegre, "823, 4150 Porta, Portugal; Fax: 351-2-6098480; £-mail.· farosa @ibmc.up.pt
Copyright © 2000 by the Research Society on Alcoholism.
Alcohol C/in Exp Res, Vol24, No 4, 2000: pp 519-527
Studies of lymphocytes in alcoholics have consistently shown phenotypic anomalies in CD4+ and CD8+ T-cell subsets, low numbers of B cells, and decreased NK cell activity (Cook et al., 1991, 1995, 1996, 1997 ; Laso et al., 1997; Muller et al. 1995; Schirren et al. , 1997; Spinozzi et al., 1987). Some of these anomalies appear not to be related to alcohol consumption, and therefore the role played by discrete T lymphocytes either in the development or the prevention of liver disease during heavy alcohol consumption remains unclear (Couzigou et al., 1984; Laso et al., 1997). Among the T-lymphocyte coreceptors, CD28 appears to be of critical importance. CD28 is a key costimulatory molecule that is expressed on nearly all human peripheral CD4+ T cells, whereas its expression in peripheral CD8+ T cells is highly variable (Lum et al., 1982; Yamada et al., 1985). Peripheral blood CD28 - T lymphocytes, namely CD8+, usually express CDllb and CD57, and have
519
520
shortened telomeres, features of cells that have undergone several cycles of cell division (Azuma et al., 1993; Monteiro et al., 1996). In vitro and in vivo studies indicate that CD8+CD28- T cells most likely ongmate from CD8+CD28 + precursors that have lost CD28 expression after several cycles of cell division. In culture, CD8+CD28 - T cells accumulate after several weeks of cell stimulation and also in peripheral blood of centenarians, a change concomitant with a decrease in CD8+CD28+ T-cell numbers (Effros et al., 1994; Fagnoni et al., 1996; Fiorentini et al. , 1999; Posnett et al., 1999). High percentages of CD8+CD28- T cells are also common in some viral diseases, such as during HIV infection and acute infectious mononucleosis (Borthwick et al., 1994; Callan et al., 1996). Finally, expansions of CD8+CD28 - T cells are usually paralleled and/or contain expanded clones of cells using specific TcR V a{3 chains both in health and disease (Morley et al. , 1995; Posnett et al., 1994; Weekes et al., 1999).
To gain further insights into the possible role played by classical MHC-class I molecules, HFE mutations, and T lymphocytes during heavy alcohol consumption, we undertook a study to characterize peripheral blood CD4+ and CD8+ T cells for CD28 expression and TcR repertoire in a population of 71 heavy alcohol drinkers and 81 agematched controls. HFE belongs to the nonclassical MHCclass I family (Feder et al. , 1996). Although formal proof for HFE influencing immune functions is still lacking, other nonclassical MHC-class I molecules, such as MICA, were recently shown to activate NK and T cells (Bauer et al., 1999). The results of the study are correlated with clinical parameters of liver function.
METHODS
Subjects and Blood Tests
The aim of this study was to analyze a population of heavy alcohol drinkers who did not have evidence of liver disease. For that purpose, a total of 176 apparently healthy individuals from the North of Portugal were recruited into the study by their local physicians. Selection criteria were the absence of known acute or chronic illnesses, as assessed by review of their medical records, and a registered history of daily alcohol consumption, which allowed a clear classification of subjects either as heavy alcohol drinkers (AHD, more than lOO g of ethanol/day, fo r at least 10 years) or controls (ethanol consumption less than 20 g/day in women and less than 40 g/day in men). Intermediate subjects were not selected. Recruited subjects volunteered for an interview, and a questionnaire was filled in with relevant information to confirm their general health status and dietary habits, namely the level of daily alcohol consumption . The alcohol in take was self-assessed in terms of daily consumption, duration, and preferred drink (wine, beer, or spirits). Peripheral blood samples were obtained during morning fasting by venipuncture. EDTA-containing tubes were used to collect blood samples for determination of hematologic parameters, T-lymphocyte subsets, HLA-phenotyping, HFE gcnotyping, and markers of viral disease, namely, HbsAg, anti-Hbs, anti-Hbc, antiHbe, anti-HCV, anti-HIV1, anti-HTV2, and anti-HTLV [all by enzymelinked immunosorbent assay (ELISA)]. Anticoagulant-free tubes were used for serum collection for determination of biochemical parameters of ir~n metabolism (serum iron, transferrin, and ferrit in) , liver enzymes gamma-glutamyltransferase (GGT), aspartate aminotransferase (AST),
AROSA ET AL.
and alanine aminotransferase (ALT). The a posteriori exclusion cr iteria were an inability to quanti fy alcohol use, recent modification of habits (some changed from a heavy to light use) , or a detoxication treatment. Positivity for one or more viral markers (except anti-Hbs) was also an exclusion criteria. Subjects in whom all liver enzymes were found abnormally high (h igher than the mean + 3 SO for the values in controls, n = 9) were offered a liver biopsy. Only six gave their consent. One showed evidence of liver cirrhosis and therefore was excluded from the study. The remaining five had normal histology or light to moderate steatosis. These were not excluded. After analysis of the questionnaire and the results of the blood tests and liver biopsy, 152 subjects were included for further studies. They could confidently be divided into two groups: heavy alcohol drinkers (AHD, n = 71) and controls (n = 81). Both groups were HLA-class I phenotyped hy microlymphocytotoxic techniques and HFE genotyped using the Haemochromatosis Gene Mutation Assay (Vienna Lab, Vienna, Austria) according to the manufacturer's instructions.
Cells and Flow Cytumet1y Analysis
Fresh collected peripheral blood mononuclear cells were sta ined from whole blood as previously described (Arosa et al. , 1997). Erythrocytes were first lysed in lysis solution (10 mM Tris , 150 mM H4CI, pH 7.4). Staining was performed at 4°C for 30 min in staining solution (PBS, 0.2% bovine serum albumin, 0.1% NaN3 ) in round-bottomed microtiter plates (Greiner, Germany) with ~0.5 X 10" cells/well. The following moAbs were used: CD4-PERCP and Simultest CD8-FITC/CD28- PE (Becton Oickinson, Mountain View, CA), CD3-FITC, CDS-PE and CD4-PE (Dakopatts, Copenhagen, Denmark), and Fl (Va2.3), LC4 (Vf35.1 ), 1C1 (Vf35 .2+5.3), W112 (V/35.3) , S511 (Vf3l2), OT145 (Vf36.7a) , and 16G8 (V/38) , all FITC-conjugated (T-cell Sciences, USA). A mouse IgGI FITC/PE (Dakopatts) was used as negative control. After staining, cells were acquired within 24 hr in a FACScan (Becton Oickinson). For each sample, 10,000 to 20,000 viable lymphocytes were acquired, using forward and side scatter characteristics, and subsequently analyzed using the program Lysys Il.
Quantification ofT-Cell Suhsets and Definition of T-Ce/1 Expansions
Total lymphocyte numbers were determined using a Coulter JS automatic cell counter (Beckman Coulter Miami, Miami, FL) . The percentages of CD8 + T cells that were positive and negative for C028 expression, and positive for each TcR Va/13 chain, were determined after setting quadrants on CD8hcight cells. They are referred to as CD8 + T cell s as described (Arosa et al. , 1997). The percentage of CDS+ and C04+ TcR Va/13 + cells was considered an expansion when it was 3 times higher than the corresponding median value in controls according to Esin et a!. (1997) .
Statistical Analysis
The differences found between group means were analyzed by Student's t test or ANOV A. To explain the high interindividual variation found in the percentages of C028- T cells among CDS+ T ce lls, which were not explained by age, we analyzed those changes as a function of the total COS+ T-ce ll pool by linear regression analys is. The objective was to determine the relative contribution of each subpopulation to the expansion of the total pool as previously described (Arosa et al. , 1997). The computation of the product-moment correlation coefficient was used as a measure of the part-whole correlation between dependent variables (Sokal and Rohlf, 1969). The significance of the difference found in frequencies was tested using two-by-two contingency tables and)(- test. All testing was performed at the 0.05 level of significance. Data were analyzed using the Statgraphics Statistical Graphics System (STSC, Inc., Rockville, MD).
T CELLS IN PERIPHERAL BLOOD OF HEAVY ALCOHOL DRINKERS 52 1
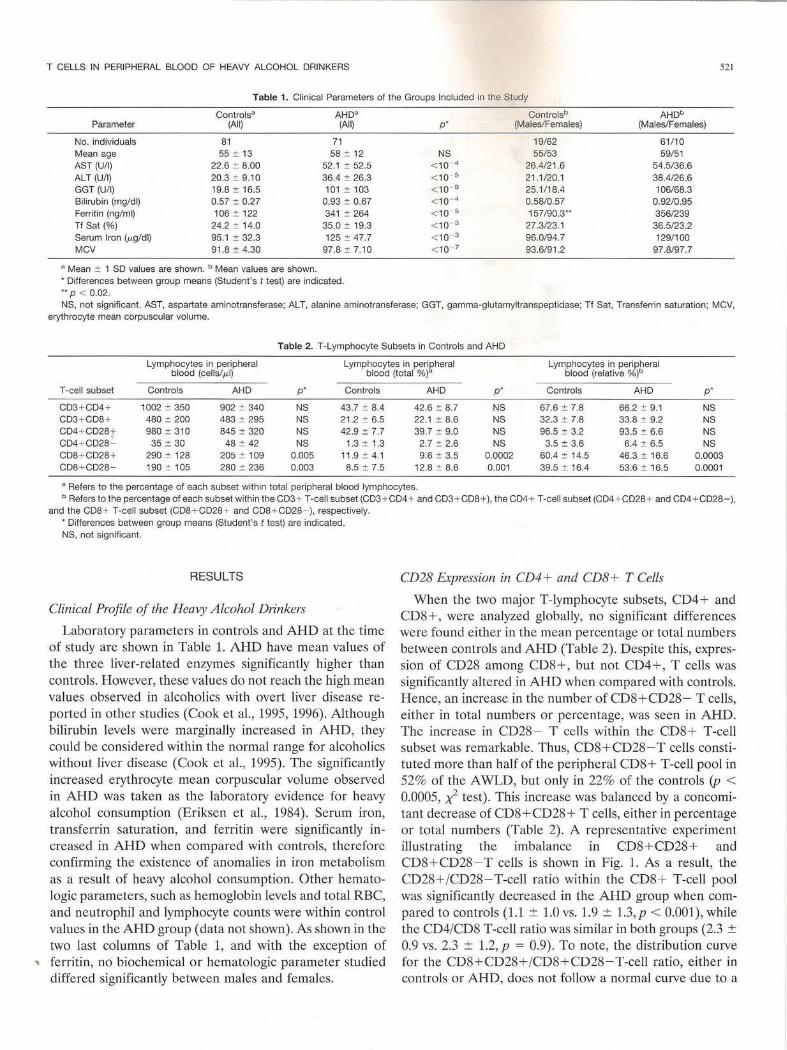
Table 1. Clinical Parameters of the Groups Included in the Study
Controls" AHD" Parameter (All) (All)
No. individuals 81 71 Mean age 55 :!: 13 58:!: 12 AST (U/1) 22.6 :!: 8.00 52.1 :!: 52.5 ALT (U/1) 20.3 :!: 9.10 36.4:!: 26.3 GGT (U/1) 19.8 :!: 16.5 101 :!: 103 Bilirubin (mg/dl) 0.57 :!: 0.27 0.93:!: 0.67 Ferritin (ng/ml) 106 :!: 122 341 :!: 264 Tf Sat(%) 24.2 :!: 14.0 35.0 :!: 19.3 Serum Iron (p.g/dl) 95.1 :!: 32.3 125 :!: 47.7 MCV 91.8 :!: 4.30 97.8 :!: 7.10
• Mean :!: 1 SD values are shown. b Mean values are shown. • Differences between group means (Student's t test) are indicated . •• p < 0.02.
p•
NS < 10- 4
< 10- 5
< 10- 9
< 10- 4
< 10- 5
< 10- 3
< 10- 3
< 10- 7
Controlsb (Males/Females)
19/62 55/53
26.4/21.6 21.1/20.1 25.1 / 18.4 0.58/0.57 157/90.3 ..
27.3/23.1 96.0/94.7 93.6/91.2
AHDb (Males/Females)
61/10 59/51
54.5/36.6 38.4/26.6 106/68.3
0.92/0.95 356/239 36.5/23.2 129/ 100
97.8/97.7
NS, not significant. AST, aspartate aminotransferase; AL T, alanine aminotransferase; GGT, gamma-glutamyltranspeptidase; Tf Sat, Transferrin saturation; MCV, erythrocyte mean corpuscular volume.
Table 2. T-Lymphocyte Subsets in Controls and AHD
Lymphocytes in peripheral blood (cells/ p.l)
Lymphocytes in peripheral blood (total %)"
Lymphocytes in peripheral blood (relative %)b
T -cell subset Controls AHD p* Controls AHD p * Controls AHD p ·
CD3+ CD4+ 1002 :!: 350 902 :!: 340 NS 43.7 :!: 8.4 42.6 :!: 8.7 NS 67.6 :!: 7.8 66.2 :!: 9.1 NS CD3 + CD8 + 480 :!: 200 483 :!: 295 NS 21.2 :!: 6.5 22.1 :!: 8.6 NS 32.3 :!: 7.8 33.8:!: 9.2 NS CD4+ CD28 t 980 :!: 310 845 :!: 320 NS 42.9 :!: 7.7 39.7 :!: 9.0 NS 96.5 :!: 3.2 93.5 :!: 6.6 NS CD4 + CD28 .:._ 35:!: 30 48 :!: 42 NS 1.3 :!: 1.3 2.7 :!: 2.6 NS 3.5:!: 3.6 6.4 :!: 6.5 NS CD8 + CD28 + 290:!: 128 205 :!: 109 0.005 11.9 :!: 4.1 9.6 :!: 3.5 0.0002 60.4 :!: 14.5 46.3:!: 16.6 0.0003 CD8 + CD28 - 190:!: 105 280 :!: 236 0.003 8.5 :!: 7.5 12.8 :!: 8.6 0.001 39.5 :!: 16.4 53.6 :!: 16.5 0.0001
a Refers to the percentage of each subset within total peripheral blood lymphocytes. b Refers to the percentage of each subset within the CD3 + T-cell subset (CD3 + CD4+ and CD3 + CD8+), the CD4+ T-cell subset (CD4 + CD28+ and CD4+CD28-) ,
and the CD8 + T-cell subset (CD8 + CD28 + and CD8 + CD28 -), respectively. • Differences between group means (Student 's t test) are indicated. NS, not significant.
RESULTS
Clinical Profile of the Heavy Alcohol Drinkers
Laboratory parameters in controls and AHD at the time of study are shown in Table 1. AHD have mean values of the three liver-related enzymes significantly higher than controls. However, these values do not reach the high mean values observed in alcoholics with overt liver disease reported in other studies (Cook et al. , 1995, 1996). Although bilirubin levels were marginally increased in AHD, they could be considered within the normal range for alcoholics without liver disease (Cook et al. , 1995). The significantly increased erythrocyte mean corpuscular volume observed in AHD was taken as the laboratory evidence for heavy alcohol consumption (Eriksen et al., 1984). Serum iron, transferrin saturation, and ferritin were significantly increased in AHD when compared with controls, therefore confirming the existence of anomalies in iron metabolism as a result of heavy alcohol consumption. Other hematologic parameters, such as hemoglobin levels and total RBC, and neutrophil and lymphocyte counts were within control values in the AHD group (data not shown). As shown in the two last columns of Table 1, and with the exception of
.. ferritin, no biochemical or hematologic parameter studied differed significantly between males and females.
CD28 Expression in CD4+ and CDB+ T Cells
When the two major T-lymphocyte subsets, CD4+ and CD8+, were analyzed globally, no significant differences were found either in the mean percentage or total numbers between controls and AHD (Table 2). Despite this, expression of CD28 among CD8+ , but not CD4+, T cells was significantly altered in AHD when compared with controls. Hence, an increase in the number of CD8+CD28- T cells, either in total numbers or percentage, was seen in AHD. The increase in CD28 - T cells within the CD8 + T-cell subset was remarkable. Thus, CD8+CD28-T cells constituted more than half of the peripheral CD8+ T-cell pool in 52% of the A WLD, but only in 22% of the controls (p < 0.0005, x2 test). This increase was balanced by a concomitant decrease of CD8+ CD28 + T ceJls, either in percentage or total numbers (Table 2). A representative experiment illustrating the imbalance in CD8+CD28+ and CD8 + CD28-T cells is shown in Fig. 1. As a result, the CD28+/CD28-T-cell ratio within the CD8 + T-cell pool was significantly decreased in the AHD group when compared to controls (1.1 ± 1.0 vs. 1.9 ± 1.3, p < 0.001 ), while the CD4/CD8 T-cell ratio was similar in both groups (2.3 ± 0.9 vs . 2.3 ± 1.2, p = 0.9). To note, the distribution curve for the CD8 +CD28+/CD8+CD28-T-cell ratio, either in controls or AHD, does not follow a normal curve due to a
----------------------------------------------------------------------------- -----
522
A B
D
c
AROSA ET AL.
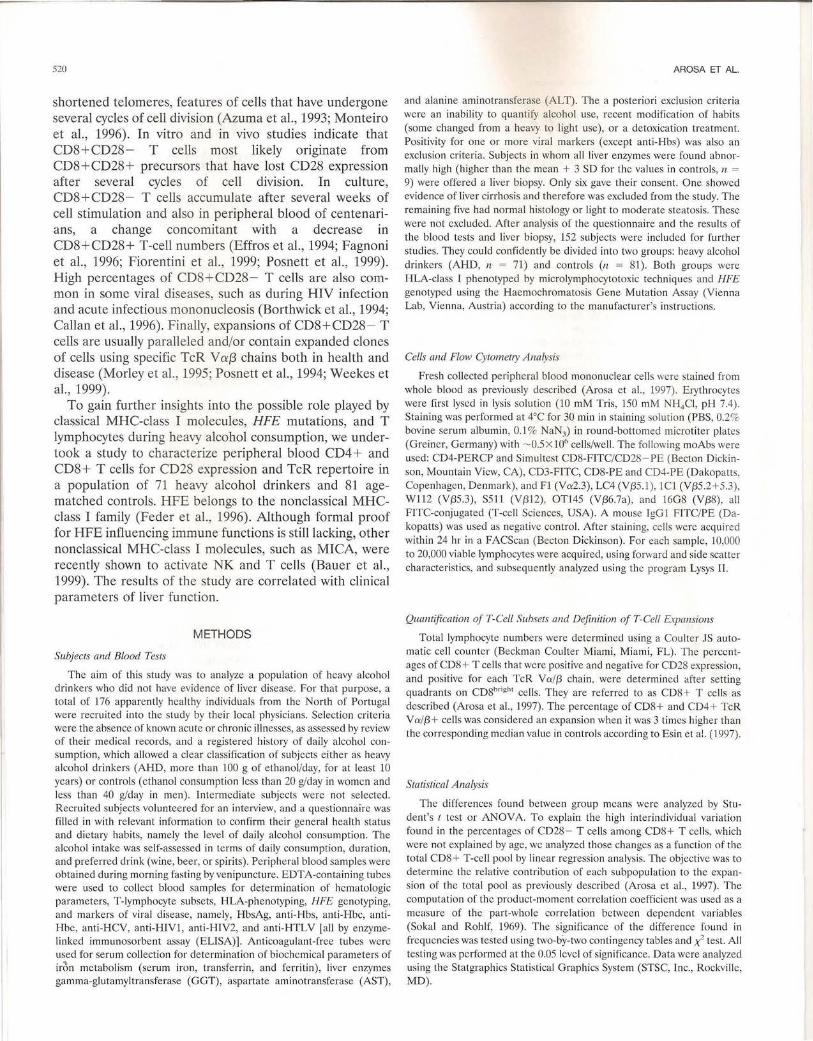
Fig. 1. CDB + CD2B - and CDB + V/35.2+ T-cell expansions in AHD. Peripheral blood lymphocytes from a heavy alcohol drinker (upper row) and a control (bottom row) were stained with CDB-FITC/CD2BPE, COB-PE, and the several Va{3-FITC conjugated antibodies and acquired in a FACScan. Dot blots show CDB-FITC versus CD2B-PE stain ing in a heavy alcohol drinker (A) and an age-matched control (D) , and COB-PE versus V/35.2-FITC or V/312-FITC staining in the same AHD (B and C) and control (E and F). The percentage of the different relevant subsets is indicated . Note the high percentage of CDB + CD2B T cel ls in the AHD, which parallels the expansion in CDB + V{35.2 + T cel ls
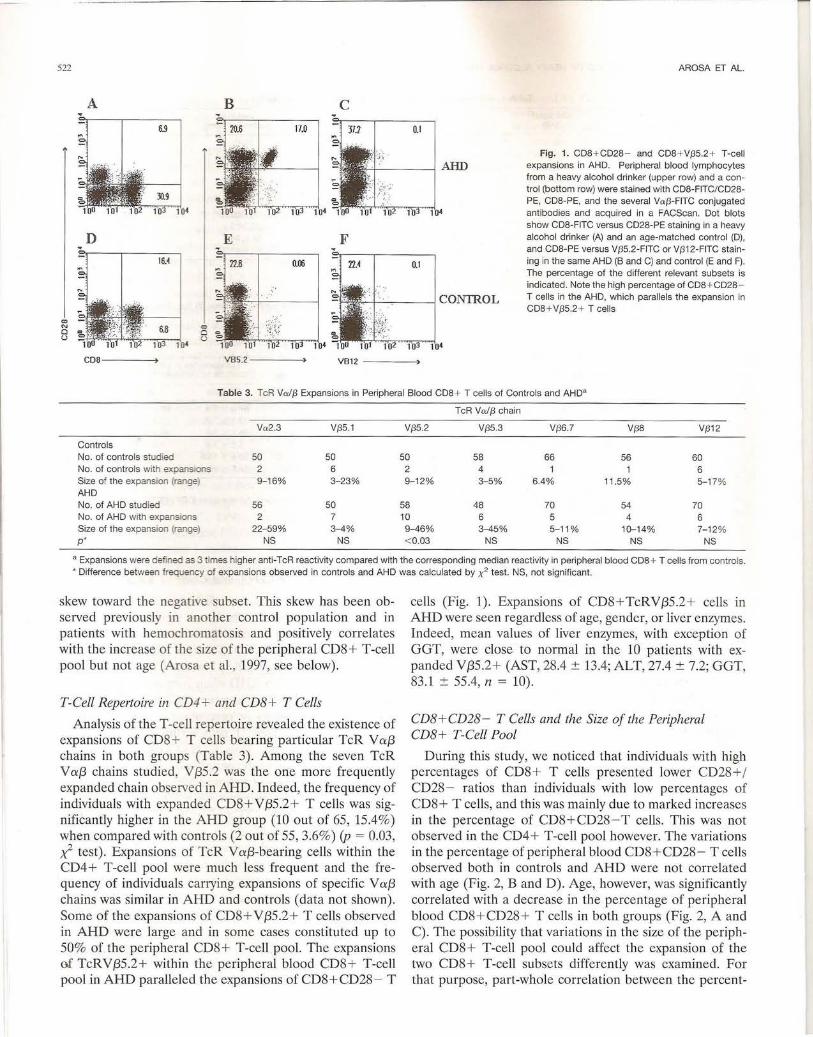
Table 3. TcR Va/{3 Expansions in Peripheral Blood COB + T cells of Controls and AHD"
TcR Va/{3 chain
Va2.3 V{35.1 V{35 .2 V{35.3 V{36.7 V{38 V{312
Controls No. of controls studied 50 50 50 58 66 56 60 No. of controls with expansions 2 6 2 4 6 Size of the expansion (range) 9-1 6% 3-23% 9-12% 3- 5% 6.4% 11.5% 5- 17% AHD No. of AHD studied 56 50 58 48 70 54 70 No. of AHD with expansions 2 7 10 6 5 4 6 Size of the expansion (range) 22-59% 3-4% 9-46% 3-45% 5-11% 10-14% 7-1 2% p* NS NS < 0.03 NS NS NS NS
a Expansions were defined as 3 times higher anti-TcR reactivity compared with the corresponding median reactivity in peripheral blood CD8+ T cells from controls. * Difference between frequency of expansions observed in contro ls and AHD was calculated by x2 test. NS, not significant.
skew toward the negati e subset. This skew has been observed previously in another control population and in patients with hemochromatosis and positively correlates with the increase of the size of the peripheral CD8 + T-cell pool but not age (Arosa et al. , 1997, see below).
T-Cell Repertoire in CD4 + and CDB + T Cells
Analysis of the T -cell repertoire revealed the existence of expansions of CD8 + T cells bearing particular TcR V a::{3 chains in both groups (Table 3). Among the seven TcR V a::{3 chains studied, V {35 .2 was the one more frequently expanded chain observed in AHD. Indeed, the frequency of individuals with expanded CD8+ V{35.2+ T cells was significantly higher in the AHD group (10 out of 65, 15.4%) when compared with controls (2 out of 55, 3.6%) (p = 0.03, ;,(- test) . Expansions of TcR V a::{3-bearing cells within the CD4+ T-cell pool were much less frequent and the frequency of individuals carrying expansions of specific V a::{3 chains was similar in AHD and controls (data not shown). Some of the expansions of CD8+ V{35 .2+ T cells observed in AHD were large and in some cases constituted up to 50% of the peripheral CD8+ T-cell pool. The expansions m TcRV{35.2+ within the peripheral blood CD8+ T-cell pool in AHD paralleled the expansions of CD8+CD28 - T
cells (Fig. 1). Expansions of CD8+TcRV{35.2+ cells in AHD were seen regardless of age, gender, or liver enzymes. Indeed, mean values of liver enzymes, with exception of GGT, were close to normal in the 10 patients with expanded V{35.2+ (AST, 28.4 ± 13.4; ALT, 27.4 ± 7.2; GGT, 83.1 ± 55.4, n = 10).
CD8+CD28 - T Cells and the Size of the Peripheral CDB+ T-Cell Pool
During this study, we noticed that individuals with high percentages of CD8+ T cells presented lower CD28+/ CD28- ratios than individuals with low percentages of CD8+ T cells, and this was mainly due to marked increases in the percentage of CD8 + CD28-T cells. This was not observed in the CD4+ T-cell pool however. The variations in the percentage of peripheral blood CD8+CD28- T cells observed both in controls and AHD were not correlated with age (Fig. 2, Band D). Age, however, was significantly correlated with a decrease in the percentage of peripheral blood CD8+CD28+ T cells in both groups (Fig. 2, A and C) . The possibility that variations in the size of the peripheral CD8 + T-cell pool could affect the expansion of the two CD8+ T-cell subsets differently was examined . For that purpose, part-whole correlation between the percent-
T CELLS IN PERIPHERAL BLOOD OF HEAVY ALCOHOL DRINKERS 523
A 50
B 50 P<0.0001 jCONTROLSj jcONTROLSI
.!!! 40 Slope=-0.16 .!!! 40 Q;
R-squared=31 .3% Q;
" " f- ~ 30 + 30 "' "' N N • Cl Cl
<:; 20 ••• <:; 20 • "' ~ "' Cl Cl
,:1~1· ..... u u • ~ 10 ~ ..... '(/!. 10 • • -~ ... ., .. • • • 0 0
Fig. 2. Lack of correlation between the 20 40 60 80 100 20 40 60 80 100 percentage of CD8 + CD28- T cells and age. Age (years) Age (years) The percentage of CD8 + CD28+ and
CDB+CD28 - T cells in peripheral blood of controls (A and B) and AHD (C and D) were plotted against age. p values, slopes and r2 c D values for the regression curves are indicated .
50 jAHoJ
50 jAHDj P<0.01
.!!! 40 Slope=-0.09 .!!! 40
Q; R-squared=11 .1% Q;
" " •• f- f-+ 30
"' 30
"' N N • • Cl Cl • u u + 20 + 20 •••• "' "' ,. Cl Cl • • • •• u u •.:;• .. ·;r ;;e 10 ~ 10
0 0 ·~ : ••• • tt
20 40 60 80 100 20 40 60 80 100
Age (years) Age (years)
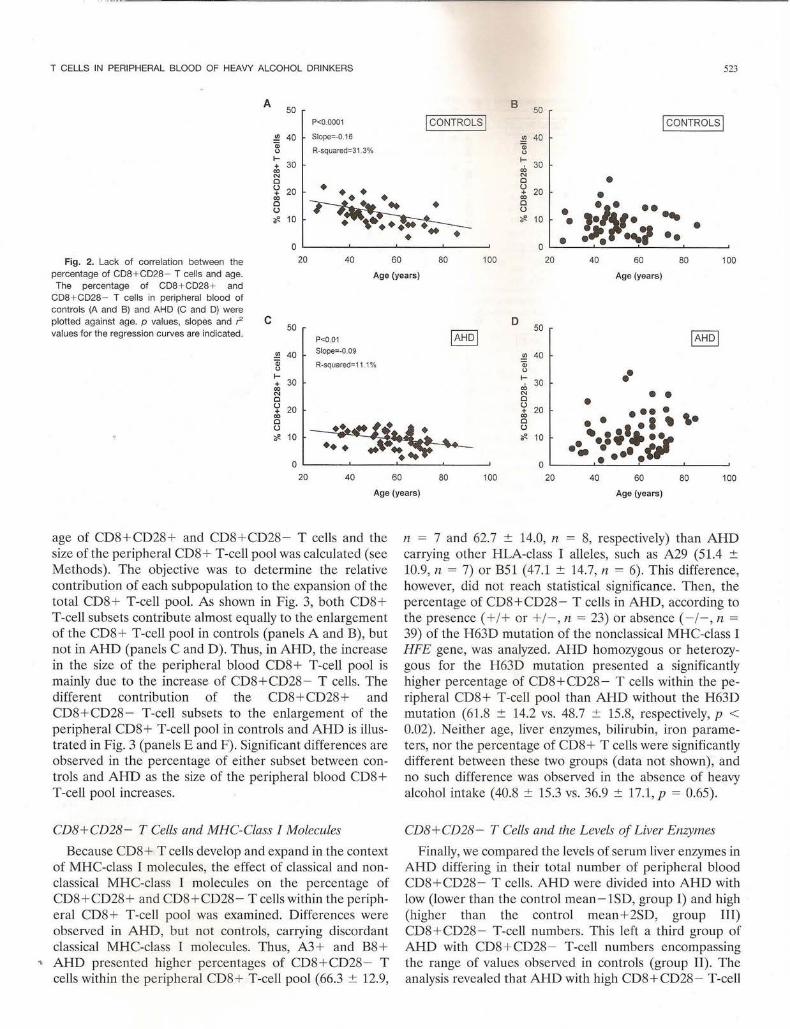
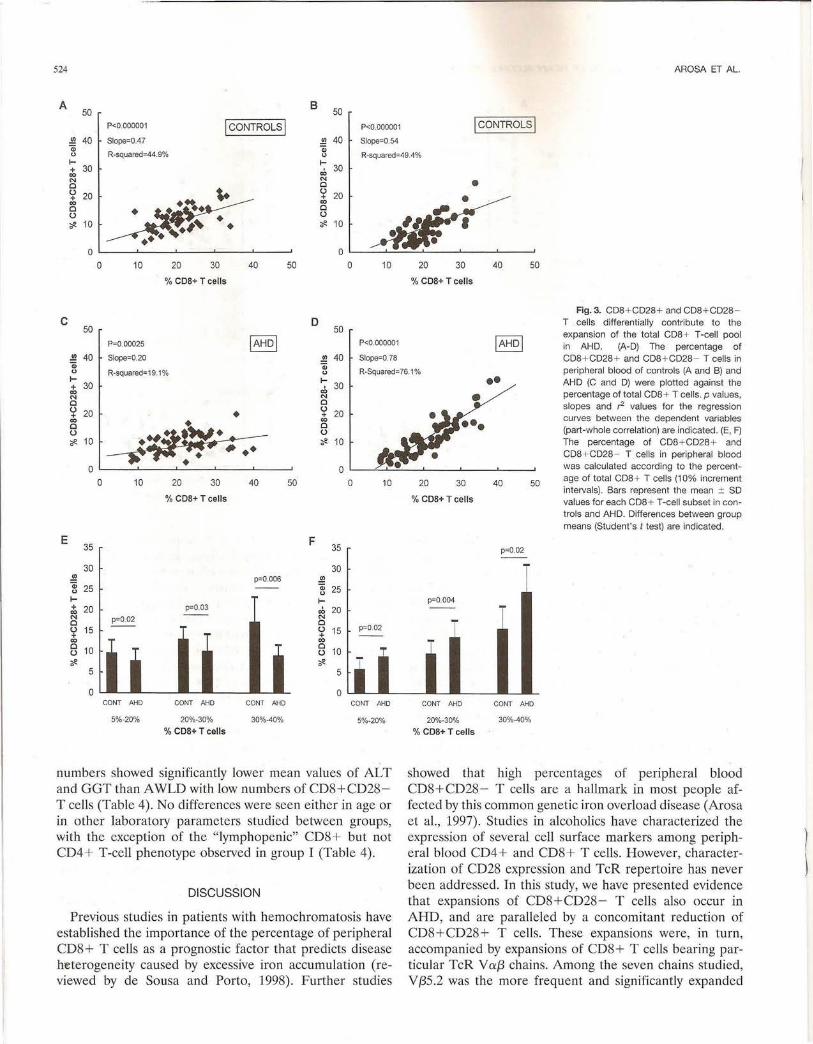
age of CD8+CD28+ and CD8 + CD28- T cells and the size of the peripheral CD8+ T-cell pool was calculated (see Methods). The objective was to determine the relative contribution of each subpopulation to the expansion of the total CD8+ T-cell pool. As shown in Fig. 3, both CD8+ T-cell subsets contribute almost equally to the enlargement of the CD8 + T-cell pool in controls (panels A and B), but not in AHD (panels C and D). Thus, in AHD, the increase in the size of the peripheral blood CD8+ T-cell pool is mainly due to the increase of CD8+CD28 - T cells. The different contribution of the CD8+ CD28+ and CD8 + CD28- T-cell subsets to the enlargement of the peripheral CD8+ T-cell pool in controls and AHD is illustrated in Fig. 3 (panels E and F). Significant differences are observed in the percentage of either subset between controls and AHD as the size of the peripheral blood CD8+ T-cell pool increases.
CD8+CD28 - T Cells and MHC-Class I Molecules
Because CD8+ T cells develop and expand in the context of MHC-class I molecules, the effect of classical and nonclassical MHC-class I molecules on the percentage of CD8+CD28+ and CD8+CD28- T cells within the peripheral CD8+ T-cell pool was examined. Differences were observed in AHD, but not controls, carrying discordant classical MHC-class I molecules. Thus, A3+ and B8+
.. AHD presented higher percentages of CD8+CD28- T cells within the peripheral CD8+ T-cell pool (66.3 ± 12.9,
n = 7 and 62.7 ± 14.0, n = 8, respectively) than AHD carrying other HLA-class I alleles, such as A29 (51.4 ± 10.9, n = 7) or B51 (47.1 ± 14.7, n = 6). This difference, however, did not reach statistical significance. Then, the percentage of CD8+CD28- T cells in AHD, according to the presence( + /+ or+/- , n = 23) or absence( -/-, n = 39) of the H63D mutation of the nonclassical MHC-class I HFE gene, was analyzed. AHD homozygous or heterozygous for the H63D mutation presented a significantly higher percentage of CD8+CD28- T cells within the peripheral CD8+ T-cell pool than AHD without the H63D mutation (61.8 ± 14.2 vs. 48.7 ± 15.8, respectively, p < 0.02). Neither age, liver enzymes, bilirubin, iron parameters, nor the percentage of CDS + T cells were significantly different between these two groups (data not shown), and no such difference was observed in the absence of heavy alcohol intake ( 40.8 ± 15.3 vs. 36.9 ± 17.1, p = 0.65).
CD8+CD28- T Cells and the Levels of Liver Enzymes
Finally, we compared the levels of serum liver enzymes in AHD differing in their total number of peripheral blood CD8+CD28- T cells. AHD were divided into AHD with low (lower than the control mean - 1SD, group I) and high (higher than the control mean + 2SD, group Ill) CD8 + CD28- T-cell numbers. This left a third group of AHD with CD8 + CD28- T-cell numbers encompassing the range of values observed in controls (group II) . The analysis revealed that AHD with high CD8+CD28 - T-cell
524 AROSA ET AL.
A 50
8 50
P<0.000001 !CONTROLS! P<0.000001 !CONTROLS!
..!!! 40 Slope=0.47 Qi
!!1 40 Slope=0.54
0 R-squared=44.9% Qi
R-squared=49.4% 0 1-+ 30 00 N 0
~ u 20 + 00 • 0 u ~ 10 • ••
1-30 .;,
N 0 u 20 + CO 0 u ~ 10
• •
0 0 0 10 20 30 40 50 0 10 20 30 40 50
% COS+Tcells %COS+ Tcells
Fig. 3. CD8 + CD28 + and CD8 + CD28 -c
50 P=0.00025 IAHDI
D T cells differentially contribute to the 50 expansion of the total CDB + T-cell pool
P<0.000001 IAHDI in AHD. (A-D) The percentage of ..!!! 40 Slope=0.20 ..!!! 40 Slope=0.78 CD8+ CD28 + and CDB + CD28- T cells in Qi 0 R-squared:;;19.1%
Qi R-Squared=76.1% peripheral blood of controls (A and B) and 0 1-+ 30 CO N 0 u 20 • + 00
~ 0 u ~ 10 •
• 0
1-30 .;,
N 0 u 20 + 00 0 u ~ 10
0 0 10 20 30 40 50 0 10
% COS+Tcells
E 35 F
35
30 30 ..!!! p=0.006 ..!!! Qi 25 Qi 25 u u 1- 1-+ 20 p=0.03 .;, 20 00 N p=0.02 N 0 0 u 15 . u 15 p=0.02 + + 00 00 0 10 0
10 T u
11
u ~
11 ~ 0
5 5
0 0 CONT AHD CONT AHD CONT AHD CONT AHD
5%-20% 20%-30% 30%-40% 5%-20%
% COS+Tcells
numbers showed significantly lower mean values of AL T and GGT than A WLD with low numbers of CD8+CD28-T cells (Table 4). No differences were seen either in age or in other laboratory parameters studied between groups, with the exception of the "lymphopenic" CD8+ but not CD4+ T-cell phenotype observed in group I (Table 4).
DISCUSSION
Previous studies in patients with hemochromatosis have established the importance of the percentage of peripheral CD8+ T cells as a prognostic factor that predicts disease ht:terogeneity caused by excessive iron accumulation (reviewed by de Sousa and Porta, 1998). Further studies
•• AHD (C and D) were plotted against the
• percentage of total CDB + T cells. p values, slopes and ,-2 values for the regression curves between the dependent variables (part-whole correlation) are indicated. (E, F) The percentage of CD8 + CD28 + and CDB+ CD28- T cells in peripheral blood was calculated according to the percent-
20 30 40 50 age of total CD8 + T cells (1 0% increment intervals). Bars represent the mean :!:: SD
% COS+ T cells values for each COB+ T-cell subset in con-trois and AHD. Differences between group means (Student's t test) are indicated.
p=0.02
p=0.004
CONT AHD CONT AHD
20%-30% 30%-40%
% COB+Tcells
showed that high percentages of peripheral blood CD8+CD28 - T cells are a hallmark in most people affected by this common genetic iron overload disease (Arosa et al., 1997). Studies in alcoholics have characterized the expression of several cell surface markers among peripheral blood CD4+ and CD8 + T cells. However, characterization of CD28 expression and TcR repertoire has never been addressed. In this study, we have presented evidence that expansions of CD8 + CD28 - T cells also occur in AHD, and are paralleled by a concomitant reduction of CD8+CD28+ T cells. These expansions were, in turn, accompanied by expansions of CD8+ T cells bearing particular TcR V af3 chains. Among the seven chains studied, Vf35.2 was the more frequent and significantly expanded
T CELLS IN PERIPHERAL BLOOD OF HEAVY ALCOHOL DRINKERS 525
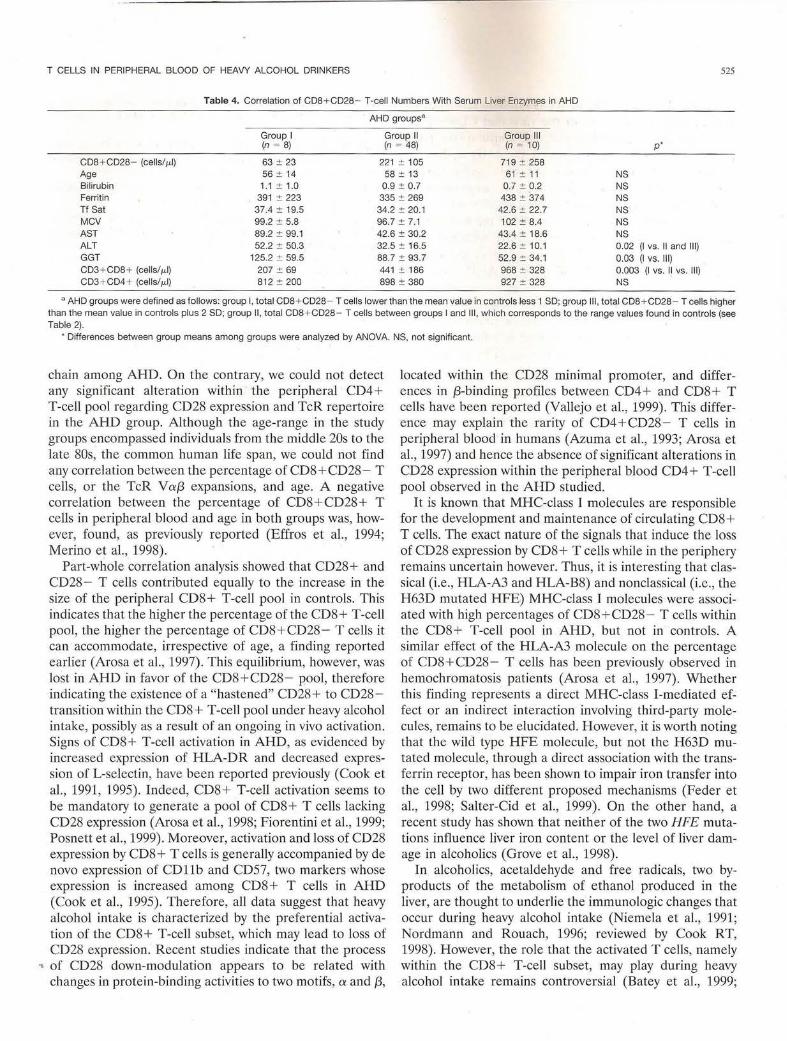
Table 4. Correlation of CDB+ CD28 - T-cell Numbers With Serum Liver Enzymes in AHD
AHD groups•
Group I Group 11 Group Ill (n = 8) (n = 48) (n = 10) p •
CDB + CD28 - (cells/ILl) 63 :!: 23 221 :!: 105 719 :!: 258 Age 56 :!: 14 58 :!: 13 61 :!: 11 NS Bilirubin 1.1 :!: 1.0 0.9 :!: 0.7 0.7 :!: 0.2 NS Ferritin 391 :!: 223 335 :!: 269 438 :!: 374 NS Tf Sat 37.4 :!: 19.5 34.2 :!: 20.1 42.6 :!: 22.7 NS MCV 99.2 :!: 5.8 96.7:!: 7.1 102 :!: 8.4 NS AST 89.2 :!: 99.1 42.6:!: 30.2 43.4 :!: 18.6 NS ALT 52.2 :!: 50.3 32.5:!: 16.5 22.6 :!: 10.1 0.02 (I vs. 11 and Ill) GGT 125.2 :!: 59.5 88.7 :!: 93.7 52.9 :!: 34.1 0.03 (I vs . Ill) CD3+CD8 + (cells/ILl) 207 :!: 69 441 :!: 186 968 :!: 328 0.003 (I VS. I! vs. Ill) CD3 + CD4 + (cells/ILl) 812 :!: 200 898 :!: 380 927 :!: 328 NS
• AHD groups were defined as follows: group I, total CDB + CD28 - T cells lower than the mean value in controls less 1 SD; group Ill, total CDB + CD28- T cells higher than the mean value in controls plus 2 SD; group 11, total CDB+ CD28- T cells between groups I and Ill , which corresponds to the range values found in controls (see Table 2).
• Differences between group means among groups were analyzed by ANOVA. NS, not significant.
chain among AHD. On the contrary, we could not detect any significant alteration within the peripheral CD4+ T-cell pool regarding CD28 expression and TcR repertoire in the AHD group. Although the age-range in the study groups encompassed individuals from the middle 20s to the late 80s, the common human life span, we could not find any correlation between the percentage of CD8+CD28- T cells, or the TcR Vaf3 expansions, and age. A negative correlation between the percentage of CD8 + CD28+ T cells in peripheral blood and age in both groups was, however, found, as previously reported (Effros et al., 1994; Merino et al. , 1998).
Part-whole correlation analysis showed that CD28+ and CD28 - T cells contributed equally to the increase in the size of the peripheral CD8+ T-cell pool in controls. This indicates that the higher the percentage of the CD8+ T-cell pool, the higher the percentage of CD8+ CD28- T cells it can accommodate, irrespective of age, a finding reported earlier (Arosa et al., 1997). This equilibrium, however, was lost in AHD in favor of the CD8+CD28 - pool, therefore indicating the existence of a "hastened" CD28+ to CD28-transition within the CD8+ T-cell pool under heavy alcohol intake, possibly as a result of an ongoing in vivo activation. Signs of CD8+ T-cell activation in AHD, as evidenced by increased expression of HLA-DR and decreased expression of L-selectin, have been reported previously (Cook et al., 1991, 1995). Indeed, CD8 + T-cell activation seems to be mandatory to generate a pool of CD8+ T cells lacking CD28 expression (Arosa et al. , 1998; Fiorentini et al. , 1999; Posnett et al., 1999). Moreover, activation and loss of CD28 expression by CD8+ T cells is generally accompanied by de novo expression of CDllb and CD57, two markers whose expression is increased among CD8+ T cells in AHD (Cook et al., 1995). Therefore, all data suggest that heavy alcohol intake is characterized by the preferential activation of the CD8+ T-cell subset, which may lead to loss of CD28 expression. Recent studies indicate that the process
" of CD28 down-modulation appears to be related with changes in protein-binding activities to two motifs, a and {3,
located within the CD28 minimal promoter, and differences in {3-binding profiles between CD4+ and CD8+ T cells have been reported (Vallejo et al., 1999). This difference may explain the rarity of CD4+CD28- T cells in peripheral blood in humans (Azuma et al., 1993; Arosa et al., 1997) and hence the absence of significant alterations in CD28 expression within the peripheral blood CD4+ T-cell pool observed in the AHD studied.
It is known that MHC-class I molecules are responsible for the development and maintenance of circulating CD8+ T cells. The exact nature of the signals that induce the loss of CD28 expression by CD8+ T cells while in the periphery remains uncertain however. Thus, it is interesting that classical (i.e., HLA-A3 and HLA-B8) and nonclassical (i .e. , the H63D mutated HFE) MHC-class I molecules were associated with high percentages of CD8+CD28- T cells within the CD8+ T-cell pool in AHD, but not in controls. A similar effect of the HLA-A3 molecule on the percentage of CD8+CD28- T cells has been previously observed in hemochromatosis patients (Arosa et al., 1997). Whether this finding represents a direct MHC-class !-mediated effect or an indirect interaction involving third-party molecules, remains to be elucidated. However, it is worth noting that the wild type HFE molecule, but not the H63D mutated molecule, through a direct association with the transferrin receptor, has been shown to impair iron transfer into the cell by two different proposed mechanisms (Feder et al., 1998; Salter-Cid et al., 1999). On the other hand, a recent study has shown that neither of the two HFE mutations influence liver iron content or the level of liver damage in alcoholics (Grove et al. , 1998).
In alcoholics, acetaldehyde and free radicals, two byproducts of the metabolism of ethanol produced in the liver, are thought to underlie the immunologic changes that occur during heavy alcohol intake (Niemela et al., 1991; Nordmann and Rouach, 1996; reviewed by Cook RT, 1998). However, the role that the activated T cells, namely within the CD8+ T-cell subset, may play during heavy alcohol intake remains controversial (Batey et al., 1999;
-----------------------------·----------------------------------------------------------------~
526
Cook RT, 1998; Schleifer et al., 1999). The results of the present study do not support the view that CD8+ T-cell activation, as a result of heavy alcohol consumption, might be involved in liver damage. Indeed, the AHD studied had no major signs of liver injury and were well-nourished individuals despite the presence of expansions of CD8+CD28- T cells, and CD8 + TcRV{35.2 + cells, which in most cases constitute more than 50% of the total peripheral CD8+ T-cell pool. Furthermore, AHD with high numbers of CD8+CD28- T cells presented lower levels of the liver enzymes ALT and GGT than AHD with low CD8+CD28- T-cell numbers. Although correlative, this observation might be an indication that the expanded CD8+CD28 - T cells in AHD could be protective rather than injurious, as previously observed in follow-up studies with hemochromatosis patients (reviewed by de Sousa et al., 2000). Further studies are therefore needed to characterize the signaling mechanisms that drive the appearance of large numbers of CD8+ CD28- T cells in peripheral blood of AHD as well as the role that these T cells play in liver function. Particular attention should be given to the discrete expansions of CD8 + V a{3 T -cell subsets reported in this study.
REFERENCES
Arosa FA, Oliveira L, Porta G, da Silva BM, Kruijer W, Veltman 1, de Sousa M (1997) Anomalies of the CD8+ T-cell pool in haemochromatosis: HLA-A3-linked expansions of CD8+CD28- T cells. Clin Exp Immunol 107:548-554.
Arosa FA, Irwing C, Mayer L, de Sousa M, Posnett DN (1998) Interactions between peripheral blood CD8 T lymphocytes and intestinal epithelial cells (iEC). Cl in Exp Immunol 112:226-236.
Azuma M, Phillips JH, Lanier LL (1993) CD28 - lymphocytes: antigenic and functional properties. 1 Immunol 150:1147- 1159.
Batey RG, Clancy R, Pang G, Cao Q (1999) Alcoholic hepatitis as aT-cell mediated disorder: An hypothesis. Alcohol Cl in Exp Res 23:1207- 1209.
Baucr S, Groh V, Wu 1, Steinle A, Phillips 1H, Lanier LL, Spies T (1999) Activation of NK cells and T cells by NKG2D, a receptor for stressinducible MICA. Science 285:727- 729.
Bellentani S, Saccoccio G, Costa G, Tiribelli C, Manenti F, Sodde M, Saveria Croce L, Sasso F, Pozzato G, Cristianini G, Brandi G, the Dionysos Study Group (1997) Drinking habits as cofactors of risk for alcohol induced liver damage. Gut 41:845- 850.
Borthwick NJ, Bofill M, Gombert WM, Akbar AN, Medina E, Sagawa K, Lipman MC, Johnson MA, Janossy G (1994) Lymphocyte activation in HIV-1 infection. II. Functional defects of CD28 - T cells. AIDS 8:431-441.
Callan MFC, Steven N, Krausa P, Wilson 1DK, Moss PAH, Gillcspic GM, Bell JI, Rickinson AB, McMichael AJ (1996) Large clonal expansions of CD8+ T cells in acute infectious mononucleosis. Nat Med 2:906-911.
Cook RT, Garvey M1, Booth BM, Goeken 1A, Stewart B, Noel M (1991) Activated CD-8 cells and HLA-DR expression in alcoholics without overt liver disease. 1 Clin Immunol 11:246-253.
Cook RT, Ballas ZK, Waldschmidt T1 , Vandersteen D, LaBrecque DR, Cook BL (1995) Modulation of T-cell adhesion markers, and the
., CD45R and CD57 antigens in human alcoholics. Alcohol Clin Exp Res 19:555-563.
AROSA ET AL
Cook RT, Waldschmidt TJ, Cook BL, LaBrecque DR, McClatchie K (1996) Loss of the CD5+ and CD45RAh; B cell subsets in alcoholics. Clin Exp Immunol 103:304-310.
Cook RT, Li F, Vandersteen D, Ballas ZK, Cook BL, LaBrecque DR (1997) Ethanol and natural killer cells: L Activity and immunophenotype in alcoholic humans. Alcohol Clin Exp Res 21:974-980.
Cook RT (1998) Alcohol abuse, alcoholism, and damage to the immune system. A review. Alcohol Clin Exp Res 22:1927-1942.
Couzigou P, Vincendeau P, Fleury B, Richard-Molar B, Pierron A, Bergeron J L, Bezian 1H, Amouretti M, Beraud M (1984) Changes in circulating lymphocyte subsets in alcoholic hepatopathies. Role of alcohol, hepatocellular insufficiency, and malnutrition. Gastroenterol Clin Bioi 8:915- 919.
de Sousa M, Porta G (1998) The immunological system in hemochromatosis. 1 Hepatol 28:1-7.
de Sousa M, Porta G, Arosa FA, Cardoso C, Cabeda 1M, Lacerda R, Fraga 1 (2000) T lymphocyte expression and function in hemochromatosis, in Hemochromatosis (J.C. Barton 1.C. Edwards C. eds) , pp 396 -407 Cambridge University Press, UK
Effros RB, Boucher N, Porter V, Zhu X, Spaulding C, Walford RL, Kronenberg M, Cohen D, Schachter F (1994) Decline in CD28+ Tcells in centenarians and in long-term T-cell cultures: A possible cause for both in vivo and in vitro immunosenescence. Exp Gerontal 9:601-609.
Eriksen J, Olsen PS, Thomsen AC (1984) Gamma-glutamyltransferase, aspartate aminotransferase, and erythrocyte mean corpuscular volume as indicators of alcohol consumption in liver disease. Scand 1 Gastroenterol 19:813- 819.
Esin S, Giil A, Hodara V, 1eddi-Tehrani M, Dilsen N, Konic;e M, Andersson R, Wigzell H (1997) Peripheral blood T-cell expansions in patients with Behc;et disease. Clin Exp Immunol 107:520- 527.
Fagnoni FF, Yescovini R, Mazzola M, Bologna G, NigraE, Lavagetto G, Francheschi C, Passeri M, Sansoni P (1996) Expansion of cytotoxic CD8+CD28- T cells in healthy ageing people, including centenari ans. Immunology 88:501-507.
Feder JN, Penny DM, Irrinki A, Lee YK, Lebr6n JA, Watson N, Tsuchi hashi Z, Sigal E, Bjorkman P1 , Schatzman RC (1998) The hcmochromatosis gene product complexes with the transferrin receptor and lowers its affinity for ligand binding. Proc Natl Acad Sci USA 95:1472-1477.
Fiorentini S, Malacarne F, Ricotta D, Licenziati S, Solis AA, Ausenda S, de Francesco M, Garrafa E, Simonini A, Imberti L, Balsari A, Turano A, Caruso A (1999) Generation of CD28 - cells from long-term stimulated CD8+CD28+ T cells: A possible mechanism accounting for the increased number of CD8+CD28- T cells in HIV-1 infected patients. 1 Leukoc Bioi 65:641- 648.
Grove 1, Daly AK, Burt AD, Guzail M, James OFW, Bassendine MF, Day CP (1998) Heterozygotes for HFE mutations have no increased risk of advanced alcoholic liver disease. Gut 43:262-266.
Laso FJ, Madruga 1I, Gir6n 1A, L6pez A, Ciudad 1, San Miguel 1F, Alvarez-Mon M, Orfao A (1997) Decreased natural killer cytotoxic activity in chronic alcoholism is associated with alcohol liver disease but not active ethanol consumption. Hepatology 25:1096-1100.
Ludwig J , Hashimoto E, Porayko MK (1997) Hemosiderosis in cirrhosis: A study of 447 native livers. Gastroenterology 112:882- 888.
Lum LG, Orcutt-Thordarson N, Seigneuret MC, Hansen JA (1982) In vitro regulation of immunoglobulin synthesis by T-cell subpopulations defined by a newT-cell antigen (9.3). Cell lmmunol 72:122- 131.
Merino J, Martinez-Gonzalez MA, Rubio M, Inoges S, Sanchez-Tbarrola A, Subira ML (1998) Progressive decrease of CD8 + CD28 + CD57- cells with ageing. Clin Exp Immunol 112:48-51.
Monteiro J, Batliwalla F, Ostrer H, Gregersen PK (1996) Shortened telomercs in clonally expanded CD28 - CD8 + T cells imply a replicativc history that is distinct from their CD28 + CD8+ counterparts. J Immunol 156:3587-3590.
. ,
T CELLS I PERIPHERAL BLOOD OF HEAVY ALCOHOL DRINKERS
Morley JK BatliwaUa FM, Hingorani R, Gregersen PK (1995) Oligoclonal CD8+ T cells are preferentially expanded in the CD57 + subset. J Immunol 154:6182- 6190.
Muller C, Wolf H, Gottlicher J, Eibl MM (1995) Helper-inducer and suppressor-inducer lymphocyte subsets in alcoholic cirrhosis. Scand J Gastroenterol 26:295-301.
Niemela 0 , Juvonen T, Parkkila S (1991) Immuno histochemical demonstration of aceta ldehyde-modified epitopes in human liver after alcohol consumption. J Clin Invest 87: 1367-1374.
Nordmann R, Rouach H (1996) Alcohol and free radicals: From basic research to clinical prospects. Ann Gastroenterol Hepatol (Paris) 32: 128-133.
Porta G, Reimao R, Gon~alves C, Vicente C, Justi<;a B, de Sousa M (1994) Haemochromatosis as a window in to the study of the immunological system: A novel correlation between CD8+ lymphocytes and iron overload. Eur J Haematol 52:283-290.
Porto G, Vicente C, Teixeira MA, Martins 0 , Cabeda JM, Lacerda R, Gon<;alves C, Fraga J, Macedo G, Silva BM, Alves H , Justi<;a B, de Sousa M (1997) Relative impact of HLA phenotype and CD4-CD8 ratios on the clinical expression of hcmochromatosis. Hepatology 25: 397-402.
Posnett DN, Edinger JW, Manavalan JS, Irwin C, Marodon G (1999) Differentiation of human CD8 T cells: Implications for in vivo persistence of CD8+CD28- cytotoxic effector clones. Int Immunol11:229-241.
Posnett DN, Sinha R, Kabak S, Russo C (1994) Clonal populations ofT cells in normal elderly humans: The T cell equivalent to "benign monoclonal gammapathy." J Exp Med 179:609-618.
Reimiio R, Porto G, de Sousa M (1991) Stability of CD4/CD8 ratios in man: New correlation between CD4/CD8 profiles and iron overload in idiopathic haemochromatosis patients. C R Acad Sci Paris 313:481-487 .
527
Salte r-Cid L, Brunmark A, Li Y, Leturcq D, Peterson PA, Jackson MR, Yang Y (1999) Transferrin receptor is negatively modulated by the hemochromatosis protein HFE: Implications for cellular iron homeostasis. Proc Natl Acad Sci USA 96:5434- 5439.
Schirren CA, Jung MC, Zachoval R, Diepolder H , Hoffmann R, Riethmiiller G, Pape GR (1997) Analysis ofT-cell activation pathways in patients with liver cirrhosis, impaired delayed hypersensitivi ty and other T-cell dependent functions. Clin Exp Immunol 108:144-150.
Schleifer SJ, Keller S, Schiflett S, Benton T, Eckholdt H (1999) Immune changes in alcohol-dependent patients without medical disorders. Alcohol Clin Exp Res 23:1199-1206.
Sokal RR, Rohlf FJ (1969) Computation of the product-moment correlation coefficient, in Biomet1y: The Principles and Practice of Statistics in Biological Research (Emerson R, Kennedy D, Park RB, Beadle GX, Whitaker DN, eds), pp 508-515, W.H. Freeman and Co., San Francisco.
Spinozzi F, Rambotti P, Gerli R, Cernetti C, Rondoni P, Frascarelli A, Bertotto A, Grignani F (1987) Immunoregulatory T ce lls in alcoholic liver disease: Phenotypical dissection of circulating Leu3+/T4+ inducer T-lymphocytes. J Clin Lab Immunol 23:161-167.
Vallejo AN, Brandes JC, Weyand CM, Goronzy JJ (1999) Modulation of CD28 expression: Distinct regulatory pathways during activation and replicative senescence. J Irnmunol 162:6572- 6579.
Weekes MP, Carmichael AJ, Wills MR, Mynard K, Sissons JGP (1999) Human CD8 + CD28- T cells contain greatly expanded functional vi rus-specific memory CTL clones. J Immunol 162:7569-7577.
Yamada H , Martin PJ, Bean MA, Braun MP, Beatty PG, Sadaoto K, Hansen JA (1985) Monoclonal an tibody 9.3 and anti-CDllb antibodies define reciprocal subsets of lymphocytes. Eur J Immunol15 :1164- 11 68.