FM - 13. Capital budgeting techniques
32
Capital budgeting is the process of identifying, analyzing, and selecting investment projects whose returns (cash flows) are expected to extend beyond one year. Capital budgeting techniques
Transcript of FM - 13. Capital budgeting techniques

Capital budgeting is the process of identifying, analyzing, and selecting investment projects whose returns (cash flows) are expected to extend beyond
one year.
Capital budgeting techniques

• Generate investment proposals consistent with the firm’s strategic objectives.
• Estimate after-tax incremental operating cash flows for the investment projects.
• Evaluate project incremental cash flows.• Select projects based on a value-
maximizing acceptance criterion.• Reevaluate implemented investment
projects continually and perform post-audits for completed projects.
The capital budgeting process

• New products or expansion of existing products
• Replacement of existing equipment or buildings
• Research and development• Exploration• Other (e.g., safety or pollution related)
Classification of investment project proposals

• Payback Period (PBP)• Discounted Payback Period (DPBP)• Net Present Value (NPV)• Internal Rate of Return (IRR)• Profitability Index (PI)
Project evaluation: different methods

Joshimuddin is evaluating a new project for his business, Jambura Farm (JF). He has determined that the after-tax cash flows for the project will be Tk 10,000; Tk 12,000; Tk 15,000; Tk 10,000; and Tk 7,000, respectively, for each of the Years 1 through 5. The initial cash outlay will be Tk 40,000.
Project evaluation example

For this project, assume that it is independent of any other potential projects that Jambura Farm may undertake.
Independent – A project whose acceptance (or rejection) does not prevent the acceptance of other projects under consideration.
Independent project

PBPPBP is the period of time required for the cumulative expected cash
flows from an investment project to equal the initial cash outflow.
0 1 2 3 4 5 -40 K 10 K 12 K
15 K 10 K 7 K
Payback period solution

(c)10 K 22 K 37 K 47 K 54 K
PBPPBP = a + ( b - c ) / d= 3 + (40 - 37)
/ 10 = 3 + (3) / 10= 3.3 Years3.3 Years
0 1 2 3 4 5 -40 K 10 K 12 K 15 K
10 K 7 K
CumulativeInflows
(a)
(-b) (d)
Payback period solution #1

PBPPBP = 3 + ( 3K ) / 10K= 3.3 Years3.3 Years
Note: Take absolute value of last negative cumulative cash flow value.
CumulativeCash Flows
-40 K 10 K 12 K 15 K 10 K 7 K
0 1 2 3 4 5
-40 K -30 K -18 K -3 K 7 K 14 K
Payback period solution #2

Payback period solution # 3Yr Project JF
CF Cum CF 0-40,000-40,000 1 10,000-30,000 2 12,000-18,000 3 15,000-3,000 4 10,0007,000 5 7,000
Payback Periods: 3 + (3,000/10,000)* = 3.33 years
(*3rd yr Cum CF/4th yr CF)

Yes! JF will receive back the initial cash outlay in less than 3.5 years. [3.3 Years < 3.5 Year
Max.]
The management of Jambura Farm has set a maximum PBP of 3.5 years for projects
of this type.
Should this project be accepted?
Payback period example

StrengthsStrengths::– Easy to use and understand– Can be used as a measure of liquidity– Easier to forecast ST than LT flows
WeaknessesWeaknesses::– Does not account for TVM– Does not consider cash flows beyond the PBP– Cutoff period is subjective
PBP Strengths & Weaknesses

NPV is the present value of an investment project’s net cash flows minus the project’s initial cash outflow.
CF1 CF2 CFn (1+k)1 (1+k)2 (1+k)n+ . . . ++ - ICOICONPV =
Net Present Value
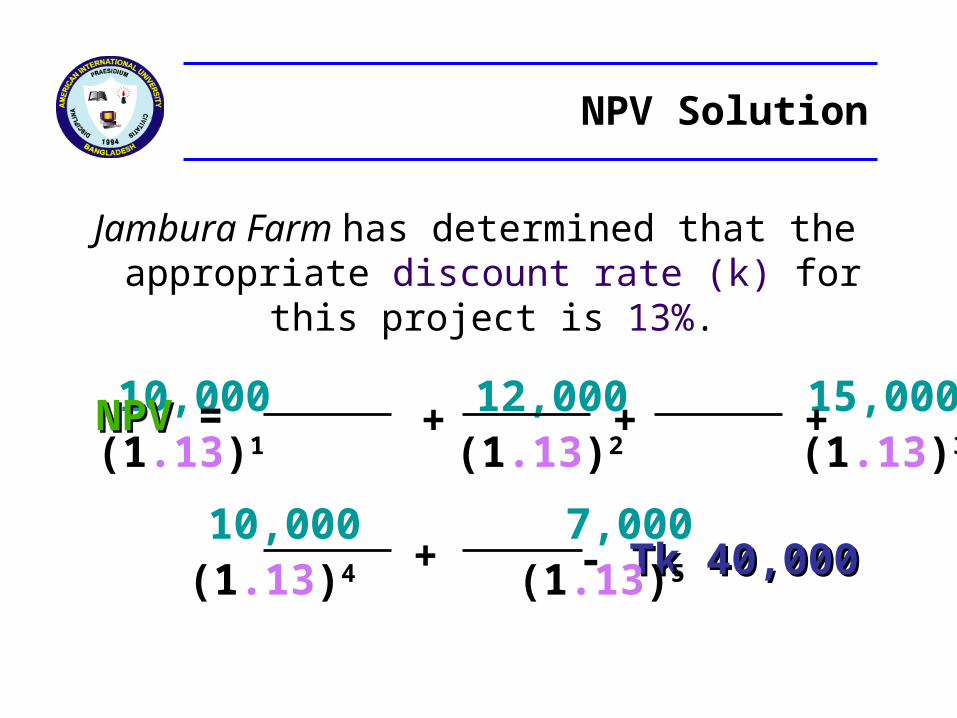
Jambura Farm has determined that the appropriate discount rate (k) for
this project is 13%.
10,000 7,000
10,000 12,000 15,000 (1.13)1 (1.13)2 (1.13)3 + +
+ - Tk 40,000Tk 40,000 (1.13)4 (1.13)5
NPVNPV = +
NPV Solution

NPVNPV = 10,000(PVIF13%,1) + 12,000(PVIF13%,2) + 15,000(PVIF13%,3) + 10,000(PVIF13%,4) +
7,000(PVIF13%,5) - 40,00040,000NPVNPV = 10,000(.885) + 12,000(.783) +
15,000(.693) + 10,000(.613) +
7,000(.543) - 40,00040,000NPVNPV = 8,850 + 9,396 + 10,395 + 6,130 + 3,801 - 40,00040,000 = - Tk 1,428Tk 1,428
NPV Solution

No! The NPV is negative. This means that the project is reducing
shareholder wealth. [Reject Reject as NPVNPV < 00 ]
The management of Jambura Farm has determined that the required rate is
13% for projects of this type.
Should this project be accepted?
NPV Acceptance Criterion

StrengthsStrengths::
– Cash flows assumed to be reinvested at the hurdle rate.– Accounts for TVM.– Considers all cash flows.
WeaknessesWeaknesses::
– A bit complicated than PBP–May not include managerial options embedded in the project.
NPV Strengths & Weaknesses

Discount Rate (%)0 3 6 9 12 15
IRRNPV@13%
Sum of CF’s Plot NPV for eachdiscount rate.Three of these points are easy now!
Net Present Value
$000s15
10
5
0-4
NPV Profile
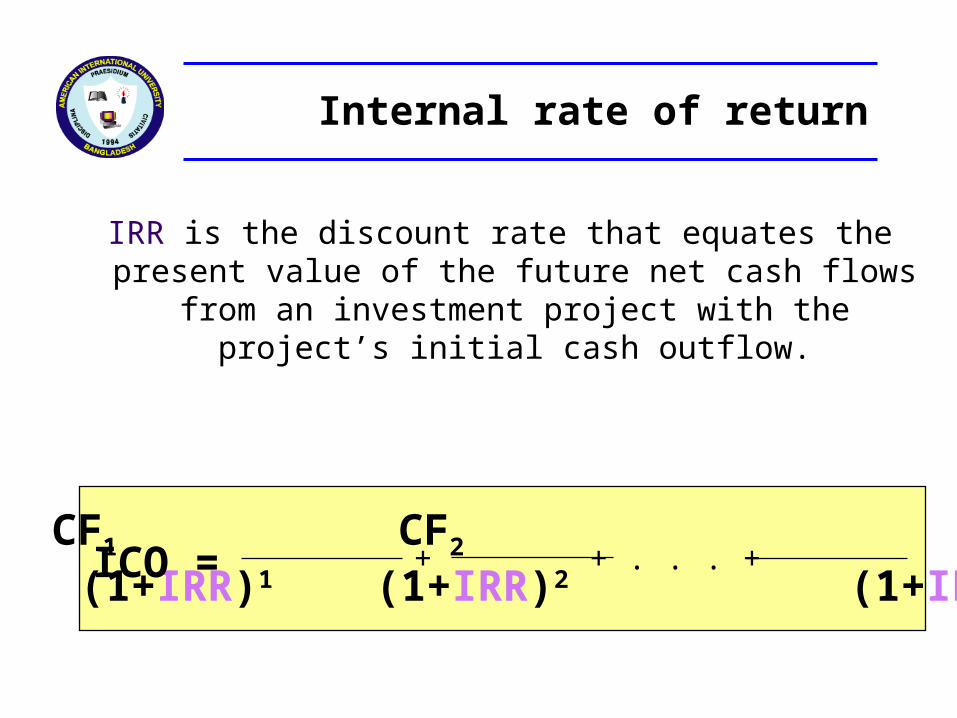
IRR is the discount rate that equates the present value of the future net cash flows
from an investment project with the project’s initial cash outflow.
CF1 CF2 CFn (1+IRR)1 (1+IRR)2 (1+IRR)n+ . . . ++ICO =
Internal rate of return

15,000 10,000 7,000
10,000 12,000(1+IRR)1 (1+IRR)2
Find the interest rate (IRR) that causes the discounted cash flows to
equal Tk 40,000.
+ +
++Tk. 40,000 =
(1+IRR)3 (1+IRR)4 (1+IRR)5
IRR Solution

Tk 40,000Tk 40,000 = 10,000(PVIF10%,1) + 12,000(PVIF10%,2) + 15,000(PVIF10%,3) + 10,000(PVIF10%,4) + 7,000(PVIF10%,5)
Tk 40,000Tk 40,000 = 10,000(.909) + 12,000(.826) + 15,000(.751)
+ 10,000(.683) + 7,000(.621)Tk 40,000Tk 40,000 = 9,090 + 9,912 + 11,265 +6,830 + 4,347 = 41,44441,444 [[Rate is too Rate is too low!!low!!]]
IRR Solution (10%)

Tk 40,000Tk 40,000 = 10,000(PVIF15%,1) + 12,000(PVIF15%,2) + 15,000(PVIF15%,3) + 10,000(PVIF15%,4) + 7,000(PVIF15%,5)
Tk 40,000Tk 40,000 = 10,000(.870) + 12,000(.756) + 15,000(.658)
+ 10,000(.572) + 7,000(.497)Tk 40,000Tk 40,000 = 8,700 + 9,072 + 9,870 + 5,720 + 3,479 = 36,84136,841 [[Rate is too Rate is too high!!high!!]]
IRR Solution (15%)

.10 41,444.05 IRR 40,000
4,603.15 36,841
X 1,444
.05 4,603
1,444X
=
Interpolate

.10 41,444.05 IRR 40,000
4,603.15 36,841
X 1,444
.05 4,603
=
X 1,444
Interpolate

.10 41,444.05 IRR 40,000
4,603.15 36,841
(1,444)(0.05) 4,603
1,444
X = X = .0157
IRR = .10 + .0157 = .1157 or 11.57%
X
Interpolate

No! JF will receive 11.57% for each dollar invested in this
project at a cost of 13%. [ IRR < Hurdle Rate ]
The management of Jambura Farm has determined that the hurdle rate is 13%
for projects of this type.
Should this project be accepted?
IRR Acceptance Criterion

StrengthsStrengths::
– Accounts for TVM– Considers all cash flows– Less subjectivity
WeaknessesWeaknesses::
– Assumes all cash flows reinvested at the IRR– Difficulties with project rankings and multiple IRRs
IRR Strengths & Weaknesses

PI is the ratio of the present value of a project’s future net cash flows to the
project’s initial cash outflow.
CF1 CF2 CFn (1+k)1 (1+k)2 (1+k)n+ . . . ++ ICOICOPI =
PI = 1 + [ NPVNPV / ICOICO ]<< OR >>
Profitability Index (PI)

No! The PI is less than 1.00. This means that the project is not
profitable. [Reject as PI < 1.00 ]
PI = 38,572 / 40,000 = .9643
Should this project be accepted?
PI Acceptance Criterion

StrengthsStrengths::
– Same as NPV– Allows comparison of different scale projects
WeaknessesWeaknesses::
– Same as NPV– Provides only relative profitability– Potential ranking problems
PI Strengths & Weaknesses

M ethod Project Com parison Decision PBP 3.3 3.5 Accept IRR 11.47% 13% Reject NPV -1,424 0 Reject PI .96 1.00 Reject
Jambura Farm’s Independent Project
Evaluation Summary

• Mutually ExclusiveMutually Exclusive – A project whose acceptance precludes the acceptance of one or more alternative projects.
DependentDependent – A project whose acceptance depends on the acceptance of one or more other projects.
Other Project Relationships