
National development level effects on capital budgeting ...
21
National development level effects on capital budgeting practices: a comparative study of nature vs nurture Pratheepkanth Puwanenthiren University of Jaffna, Jaffna, Sri Lanka Abstract Purpose – This research should help determine whether development should focus on individual firms or will raising the national development level act like a rising tide and raise the performance of all corporations. Design/methodology/approach – The comparative data used in this study come from 150 Australian (ASX200 index listed) firms and 150 Sri Lankan (Colombo Stock Exchange listed) firms. The research questions are answered via a quantitative research design that uses primary and secondary data. Findings – The findings demonstrate that capital budgeting practices are more influenced by contingency features and sophistication in Australia and Sri Lanka. Also, Australian firms tend to use capital budget models with good-to-strong predictive power (except for ROE) and Sri Lankan firms tend to use capital-budget models with fair-to-poor predictive power. Further, the analysis of Australian firms yielded much stronger and more statistically significant results than the analysis of Sri Lankan firms. Practical implications – In complex real-world situations, reconciling the outputs of a multifaceted approach to capital budgeting methods is more likely to give the depth and width of input needed to achieve an optimal capital investment plan. Originality/value – The results of this study can provide rich information for stakeholders about new findings in capital budgeting (CB) practices and their contributions to firm performance in a comparative perspective. Keywords Capital budgeting, Discounted cash flow, Non-discounted cash flow Paper type Research paper 1. Introduction 1.1 Capital budgeting and firm performance According to the traditional theory of the firm, the firm’s objective is to maximise shareholder wealth (Gervais et al., 2012). Capital budgeting, a key input to maximising shareholder wealth, is the rational allocation of limited capital across a plethora of viable prospective investments (Bennouna et al., 2010; Gervais et al., 2012; Proctor and Canada, 1992). As such, capital budgeting (CB) is defined as the evaluation of investment prospects in long-term assets (Peterson and Fabozzi, 2002; Van Horne et al., 1995). Effective capital-investment budgeting and management is key to optimal firm performance (Arnold and Hatzopoulos, 2000; Farragher et al., 1999). Such processes enhance capital-investment decisions by assuring that corporate strategies are known and followed, available investment opportunities are considered and unplanned/unjustified Capital budgeting JEL Classification — G10, G11 and G31 © Pratheepkanth Puwanenthiren. Published in PSU Research Review. Published by Emerald Publishing Limited. This article is published under the Creative Commons Attribution (CC BY 4.0) licence. Anyone may reproduce, distribute, translate and create derivative works of this article (for both commercial and non-commercial purposes), subject to full attribution to the original publication and authors. The full terms of this licence may be seen at http://creativecommons.org/licences/by/4.0/ legalcode. The current issue and full text archive of this journal is available on Emerald Insight at: https://www.emerald.com/insight/2399-1747.htm Received 23 August 2021 Revised 21 November 2021 7 December 2021 Accepted 8 January 2022 PSU Research Review Emerald Publishing Limited 2399-1747 DOI 10.1108/PRR-08-2021-0043
-
Upload
khangminh22 -
Category
Documents
-
view
0 -
download
0
Transcript of National development level effects on capital budgeting ...

National development level effectson capital budgeting practices:a comparative study of nature
vs nurturePratheepkanth PuwanenthirenUniversity of Jaffna, Jaffna, Sri Lanka
Abstract
Purpose –This research should help determine whether development should focus on individual firms or willraising the national development level act like a rising tide and raise the performance of all corporations.Design/methodology/approach – The comparative data used in this study come from 150 Australian(ASX200 index listed) firms and 150 Sri Lankan (Colombo Stock Exchange listed) firms. The research questionsare answered via a quantitative research design that uses primary and secondary data.Findings – The findings demonstrate that capital budgeting practices are more influenced by contingencyfeatures and sophistication in Australia and Sri Lanka. Also, Australian firms tend to use capital budgetmodels with good-to-strong predictive power (except forROE) and Sri Lankan firms tend to use capital-budgetmodels with fair-to-poor predictive power. Further, the analysis of Australian firms yieldedmuch stronger andmore statistically significant results than the analysis of Sri Lankan firms.Practical implications – In complex real-world situations, reconciling the outputs of a multifacetedapproach to capital budgetingmethods is more likely to give the depth andwidth of input needed to achieve anoptimal capital investment plan.Originality/value – The results of this study can provide rich information for stakeholders about newfindings in capital budgeting (CB) practices and their contributions to firm performance in a comparativeperspective.
Keywords Capital budgeting, Discounted cash flow, Non-discounted cash flow
Paper type Research paper
1. Introduction1.1 Capital budgeting and firm performanceAccording to the traditional theory of the firm, the firm’s objective is tomaximise shareholderwealth (Gervais et al., 2012). Capital budgeting, a key input tomaximising shareholderwealth,is the rational allocation of limited capital across a plethora of viable prospective investments(Bennouna et al., 2010; Gervais et al., 2012; Proctor and Canada, 1992). As such, capitalbudgeting (CB) is defined as the evaluation of investment prospects in long-term assets(Peterson and Fabozzi, 2002; Van Horne et al., 1995).
Effective capital-investment budgeting and management is key to optimal firmperformance (Arnold and Hatzopoulos, 2000; Farragher et al., 1999). Such processesenhance capital-investment decisions by assuring that corporate strategies are known andfollowed, available investment opportunities are considered and unplanned/unjustified
Capitalbudgeting
JEL Classification — G10, G11 and G31© Pratheepkanth Puwanenthiren. Published in PSU Research Review. Published by Emerald
Publishing Limited. This article is published under the Creative Commons Attribution (CC BY 4.0)licence. Anyone may reproduce, distribute, translate and create derivative works of this article (for bothcommercial and non-commercial purposes), subject to full attribution to the original publication andauthors. The full terms of this licence may be seen at http://creativecommons.org/licences/by/4.0/legalcode.
The current issue and full text archive of this journal is available on Emerald Insight at:
https://www.emerald.com/insight/2399-1747.htm
Received 23 August 2021Revised 21 November 2021
7 December 2021Accepted 8 January 2022
PSU Research ReviewEmerald Publishing Limited
2399-1747DOI 10.1108/PRR-08-2021-0043
decision making is minimised. Studies on CB suggest that firms are increasingly employingmore refined CB techniques for investment decisions (Arnold and Hatzopoulos, 2000;Farragher et al., 2001; Kashyap, 2014; Klammer andWalker, 1984; Klammer, 1973; Mustaphaand Mooi, 2001; Ruhan, 1998; Wnuk-Pel, 2014). Vadeei et al. (2012), Hasan et al. (2011),Farragher et al. (2001), Haka et al. (1985), Pike (1984) and Kim (1981) researched extensivelyinto links between CB and firm performance.
This research contributes to the extant CB literature by considering the relativeimportance of a firm’s nature vs the nurture of its national environment (e.g. developmentlevel of the nation in which the firm is embedded). This is a vital issue for CB management infirms and for directing development efforts in less developed nations. Specifically, aspreviously noted, good CB practices play a vital role in enhancing firm performance. Giventhat firms are contributors to Gross Demostic Product (GDP), the quality of firm CB practicescan create and perpetuate a virtuous/(vicious) cycle of rising/(falling) firm and nationalperformance (Chen, 1991). This is one of a few studies that contain a comparative perspectiveof the CB practises of firms in a developed nation with firms in an emerging nation (Brounenet al., 2004; Peel, 1999; Graham and Harvey, 2001; Hermes et al., 2007). The two countriesunder consideration in this study are Australia and Sri Lanka:
Australia is a developed nation with: a relatively small open economy, a population of 23.7 millionresidents, business practices and regulation that are respected (e.g. its Corruption Perceptions index(CPI) is 80/100 where 100 is no corruption), with institutions that helped to comfortably weather theGlobal Financial Crises (GFC).
Sri Lanka is an emerging country with: a rapidly growing economy (after the 30 year civil war endedin 2009), a population of 20.48 million residents, ongoing economic reforms, a mid to high level ofcorruption (e.g. its CPI is 38/100), and major effort to reintegrate into international markets.
The paper is organised as follows. Section 2 reviews literature on CB practices and firmperformance; Section 3 provides the methodology of the research and also discusses the firmand its managers’ features; Section 4 discusses findings; and Section 5 gives the conclusions,limitation of the study and suggestions for future research.
2. Literature reviewAs noted previously, CB is a key driver of investment choice and implementation (Kashyap,2014; Farragher et al., 2001). As a result, CB contributes tomaximising stakeholder value. Thecorporate finance literature distinguishes two key concepts in CB: CB processes and CBtechnqiues. CB processes explain how firms treat investment decisions in practice (Batra andVerma, 2014; Farragher et al., 2001). On the other hand, CB technqiues are defined as themethods and techniques used to evaluate and select an investment (Bennouna et al., 2010).
2.1 Capital budgeting processThe CB process, by improving investment decisions quality and implementation (Kashyap,2014; Farragher et al., 2001), helps to maximise stakeholder wealth (Andor et al., 2015). In thiscontext, Pinches (1982) and Mintzberg et al. (1976) emphasised a CBmodel that encompassesidentification, development, selection and control stages. The identification stage, perNorthcott (1995), provides recognition of an opportunity for investment. The identifiedinvestments should be subjected to preliminary screening by management, to separateunreliable investments. If an investment survives the analysis phase, a judgement is thenmade to accept or reject the investment. Once the investment passes the acceptance phase, itshould be implemented by management. Post-audit reviews create useful feedback to theinvestment appraisal process.
PRR
Lam et al. (2008), Farragher et al. (2001), Han (1986) and Kim (1981) focus on the CB processfrom different perspectives (e.g. Farragher et al. (2001) examined the impact of sophisticatedCB practices on corporate performance in the USA; Kim (1981) tested the empiricalrelationship between CB practices and earnings performance. This is one of a few studies thatconcentrates on the CB processes in comparative perspective.
2.2 Capital budgeting techniquesThe selection of appropriate CB techniques for investment decisions is a key managerialactivity (Wnuk-Pel, 2014). CB-technique-focused studies have an extensive tradition incorporate finance literature. Mainly these researches focus on developed nations (e.g. theUSA: Graham andHarvey (2001), Shao andAlan (1996); Canada: Baker et al. (2011), Bennounaet al. (2010), Vijay and Ashwani (1995), the UK: Alkaraan and Northcott (2006), Arnold andHatzopoulos (2000); and Australia: Truong et al. (2008), Freeman and Hobbes (1991). Grahamand Harvey (2001) investigated the theory and practice of corporate finance in USA. Theyinterviewed 392 chief financial officers (CFOs) about capital structure, cost of capital and CBand found the most popular evaluation techniques were net present value (NPV) and internalrate of return (IRR). Also, Discount cashflow (DCF) techniques and capital asset pricingmodel(CAPM) are increasingly used by large firms to evaluate CB and that small firms tend to useless sophisticated techniques. DCF has become the main appraisal technique in Canada(Bennouna et al., 2010; Jog and Srivastava, 1995; Vijay and Ashwani, 1995). In particular, theuse of DCF appears to have increased from a low of around 35% in the early 1960s to over90% in the early 1990s. NPV is now widely used among Candian firms, but a sizeablepercentage use IRR as their primary model in capital decision-making (Bennouna et al., 2010).In the UK, Pike (1988) noted that the use of DCF methods had increased from 58 to 84% from1975 to 1986. However, the PBPmethod is still widely used in the UK, and DCF seems to havealso increased (Alkaraan and Northcott, 2006). Freeman and Hobbes (1991) found DCFtechniques increased in use in Australia from 52 to 75%between 1979 and 1989. Truong et al.(2008) found that 94%of CFOs in their survey usedNPV, followed by PBP and IRR. They alsofound that real-options analysis is gaining relevance in Australia CB, but it is not yet a main-stream method.
Only a limited number of studies emphasise CB evaluation techniques in emergingcountries (e.g. Malaysia, Indonesia, China and Singapore) which were considered by Farahet al. (2008), Chan et al. (2004) and Kester and Chong (1998); African economies were reviewedbyMaroyi and Van Der Poll (2012), Hassan et al. (2011), Pradeep and Lemay (2009), Sulaiman(2007) and Coltman (1995); India was looked by Manoj (2002), Satish et al. (2009), Singh et al.(2012). Some earlier studies of CB practices in Southeast Asia (Malaysia, Hong Kong,Philippines and Singapore) ascribe equal significance to DCF and Non-Discount Cashflow(NDCF) methods. It appears that Asian and African CFOs tend to rely more on NDCFmethods than sophisticted methods, when selecting long-term investments.
2.3 Capital budgeting practices and firm performanceFinancial theory suggests that sophisticated CB systems should enhance firm performance,but this assertion appears to have had only limited empirical testing. Vadeei et al. (2012),Farragher et al. (2001), Pike (1984), Kim (1981) and Klammer (1973) looked at the impact of CBon firm performance. Klammer (1973), in a survey of 369 USAmanufacturing firms, found nosignificant relationship between CB techniques and firm performance. In contrast, Kim (1981)and Vadeei et al. (2012) found a positive association between the CB process and firmperformance. In other research, Pike (1984) found a negative association between CBevaluation techniques and firm performance and Farragher et al. (2001), Pike (1984), andChristy (1966) found no significant relationships between the sophistication of CB processes
Capitalbudgeting
and firm performance. Thus, for the most part, these studies have focused on the applicationand enhancement of the modelling techniques applied. The trend towards the adoption ofmore refined CB practices has led researchers to consider whether these refinements haveenhanced performance and profitability. The mixed outcomes of that research suggest that asignificant gap exists in understanding the nature, intensity and direction of the relationshipbetween CB practises and performance. Further, the relationship between firm performancesand different variables are analysed by researchers (Aldamen et al., 2012; Aldamen andDuncan, 2012), the impact of CB process, techniques, nature of firms and the developmentlevel of the country on firm performances are yet to be researched.
3. MethodologyIn addressing the gap discussed in the previous section, this study focuses on two key driversof CB sophistication: (1) the relative sophistication of the firms conducting the CB and (2) thedevelopment level of the nations in which the firms are embedded. This issue is essentiallynature vs nurture. Specifically, does nature of a firm trump the nurture of the developmentlevel of the nation in which it is embedded?
Initially, the population of interest in this study was 200 Australian Securities Exchange(ASX) listed firms (S&P/ASX200) and 289 Colombo Stock Exchange (CSE) listed firms. Inselecting the study population, this study excludes financial, investment and securities-sectorfirms, because their unique financial attributes, intensity of regulation, and/or intensive use ofleverage are likely to confuse and/or foul the outcomes being studied. Also, the risk ofmissingdata was reduced by excluding firms that were not listed throughout the review period. Afterthe eliminations, the remaining population was 150 Australian ASX-listed firms and 150 SriLankan CSE-listed firms. The results of the questionnaire survey of firms was, respectively,45 completed questionnaires from Australia and 73 from Sri Lanka, giving an effectiveresponse rate of, 31.5 and 48.7%, respectively. Secondary data were obtained in recent fiveyears, and ASX, CSEs and SIRCA databases were used to calculate return on assets (ROA),return on equity (ROE), Tobin’s Q (TQ) and earnings per share (EPS) for the relevant firms.
Data were collected in two phases. The first phase constituted a structured surveyquestionnaire which was followed by a second phase of gathering the appropriate financialstatements for the relevant period. The integration of multi-method data collection was seento offer a deeper insight into the research findings. A quantitative research design utilisingboth primary and secondary data was used to answer the research questions.
In phase one, a structured questionnaire survey was used to explore the CB practices ofAustralian and Sri Lankan firms as an example of a developed and emerging market. Thequestionnaire sought information on the CB practices of the responding firms and includedtwo types of questions. The first set of questions sought to describe attributes of the firm andits respondents while the second set investigated attributes of the CB practice. Phase onegives a descriptive study of CB practices in Australian and Sri Lankan listed firms and thecomparison of those CB practices and techniques identifies similarities and differences in thepractices between firms in a developed (Australia) and emerging economy (Sri Lanka). Phaseone sought to determine, whether CB practices differed significantly between Australia andSri Lanka firms and if any differences can be explained by differences in levels of nationaleconomic development after adjusting for conflating factors such as firm and CFO attributes.
Phase two examines CB practices via the lens of a process approach and an evaluationapproach; which allows for a connection between these different perspectives and firmperformance in Australian- and Sri Lankan-listed firms. Phase two links the primary datagathered in phase one with secondary data, annual reports of the relevant firms during 2007–16, taken from the ASX, CSE’s and SIRCA database to provide ROA, ROE,TQ and EPS. Theintention of phase two is to explore for relationships between (on one hand) the CB process
PRR
and choice of appraisal techniques used by developed and emerging countries and (on theother) firm performance (both from an accounting and a market perspective). It wasconsidered that these findings would assist CFOs in shedding light on the numerouscorporate finance theories associated with firm performance and the stakeholders’ wealth ofthe firm inAustralia and Sri Lanka. Thus, the data used in the quantitative stage of this studywas gathered in two phases:
3.1 Measurement of variables3.1.1 Capital budgeting process of firm j (CBPj ). Following an approach used by Batra andVerma (2014), Farragher et al. (2001), Pike (1984) and Kim (1981), the CB sophistication of firmrespondents was defined via:
CBPj ¼Xn
K¼i
ðSjkÞðWkÞ (1)
where Sjk 5 Score for CB for firm j, activity k
Wk 5 Weighting for CB activity k
Building of CBPj is done in two stages:
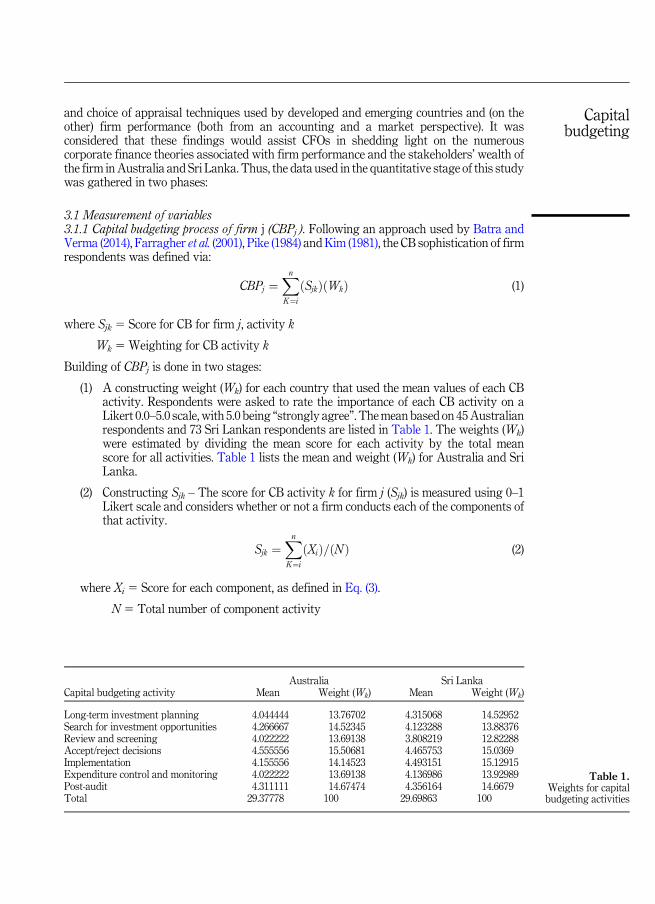
(1) A constructing weight (Wk) for each country that used the mean values of each CBactivity. Respondents were asked to rate the importance of each CB activity on aLikert 0.0–5.0 scale, with 5.0 being “strongly agree”. Themean based on 45Australianrespondents and 73 Sri Lankan respondents are listed in Table 1. The weights (Wk)were estimated by dividing the mean score for each activity by the total meanscore for all activities. Table 1 lists the mean and weight (Wk) for Australia and SriLanka.
(2) Constructing Sjk – The score for CB activity k for firm j (Sjk) is measured using 0–1Likert scale and considers whether or not a firm conducts each of the components ofthat activity.
Sjk ¼Xn
K¼i
ðXiÞ=ðNÞ (2)
where Xi 5 Score for each component, as defined in Eq. (3).
N 5 Total number of component activity
Capital budgeting activityAustralia Sri Lanka
Mean Weight (Wk) Mean Weight (Wk)
Long-term investment planning 4.044444 13.76702 4.315068 14.52952Search for investment opportunities 4.266667 14.52345 4.123288 13.88376Review and screening 4.022222 13.69138 3.808219 12.82288Accept/reject decisions 4.555556 15.50681 4.465753 15.0369Implementation 4.155556 14.14523 4.493151 15.12915Expenditure control and monitoring 4.022222 13.69138 4.136986 13.92989Post-audit 4.311111 14.67474 4.356164 14.6679Total 29.37778 100 29.69863 100
Table 1.Weights for capitalbudgeting activities
Capitalbudgeting
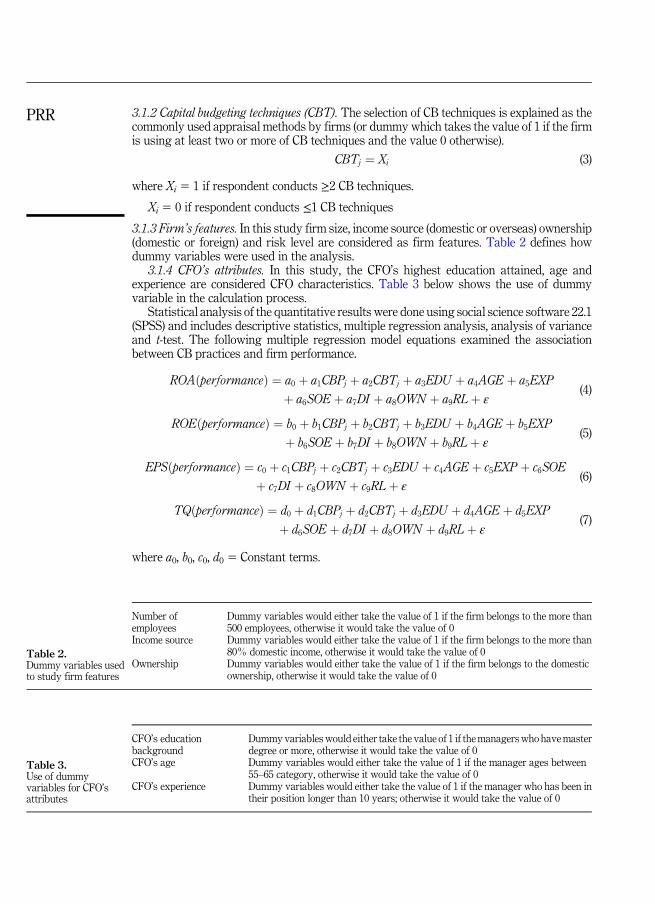
3.1.2 Capital budgeting techniques (CBT). The selection of CB techniques is explained as thecommonly used appraisal methods by firms (or dummy which takes the value of 1 if the firmis using at least two or more of CB techniques and the value 0 otherwise).
CBTj ¼ Xi (3)
where Xi 5 1 if respondent conducts ≥2 CB techniques.
Xi 5 0 if respondent conducts ≤1 CB techniques
3.1.3 Firm’s features. In this study firm size, income source (domestic or overseas) ownership(domestic or foreign) and risk level are considered as firm features. Table 2 defines howdummy variables were used in the analysis.
3.1.4 CFO’s attributes. In this study, the CFO’s highest education attained, age andexperience are considered CFO characteristics. Table 3 below shows the use of dummyvariable in the calculation process.
Statistical analysis of the quantitative results were done using social science software 22.1(SPSS) and includes descriptive statistics, multiple regression analysis, analysis of varianceand t-test. The following multiple regression model equations examined the associationbetween CB practices and firm performance.
ROAðperformanceÞ ¼ a0 þ a1CBPj þ a2CBTj þ a3EDU þ a4AGE þ a5EXP
þ a6SOE þ a7DI þ a8OWN þ a9RLþ ε(4)
ROEðperformanceÞ ¼ b0 þ b1CBPj þ b2CBTj þ b3EDU þ b4AGE þ b5EXP
þ b6SOE þ b7DI þ b8OWN þ b9RLþ ε(5)
EPSðperformanceÞ ¼ c0 þ c1CBPj þ c2CBTj þ c3EDU þ c4AGE þ c5EXP þ c6SOE
þ c7DI þ c8OWN þ c9RLþ ε(6)
TQðperformanceÞ ¼ d0 þ d1CBPj þ d2CBTj þ d3EDU þ d4AGE þ d5EXP
þ d6SOE þ d7DI þ d8OWN þ d9RLþ ε(7)
where a0, b0, c0, d0 5 Constant terms.
Number ofemployees
Dummy variables would either take the value of 1 if the firm belongs to the more than500 employees, otherwise it would take the value of 0
Income source Dummy variables would either take the value of 1 if the firm belongs to the more than80% domestic income, otherwise it would take the value of 0
Ownership Dummy variables would either take the value of 1 if the firm belongs to the domesticownership, otherwise it would take the value of 0
CFO’s educationbackground
Dummyvariableswould either take the value of 1 if themanagerswho havemasterdegree or more, otherwise it would take the value of 0
CFO’s age Dummy variables would either take the value of 1 if the manager ages between55–65 category, otherwise it would take the value of 0
CFO’s experience Dummy variables would either take the value of 1 if the manager who has been intheir position longer than 10 years; otherwise it would take the value of 0
Table 2.Dummy variables usedto study firm features
Table 3.Use of dummyvariables for CFO’sattributes
PRR
a1–9, b1–9, c1–9, d1–9 5 Regression coefficients
CBPj 5 Capital budgeting practices for firm j
CBTj 5 Choice of capital budgeting techniques for firm j
EDU 5 CFO Education
AGE 5 CFO Age
EXP 5 CFO Experience
SOE 5 Firm Size of employees
DI 5 Firm Domestic income
OWN 5 Firm Ownership
RL 5 Firm Risk level
ε 5 error term
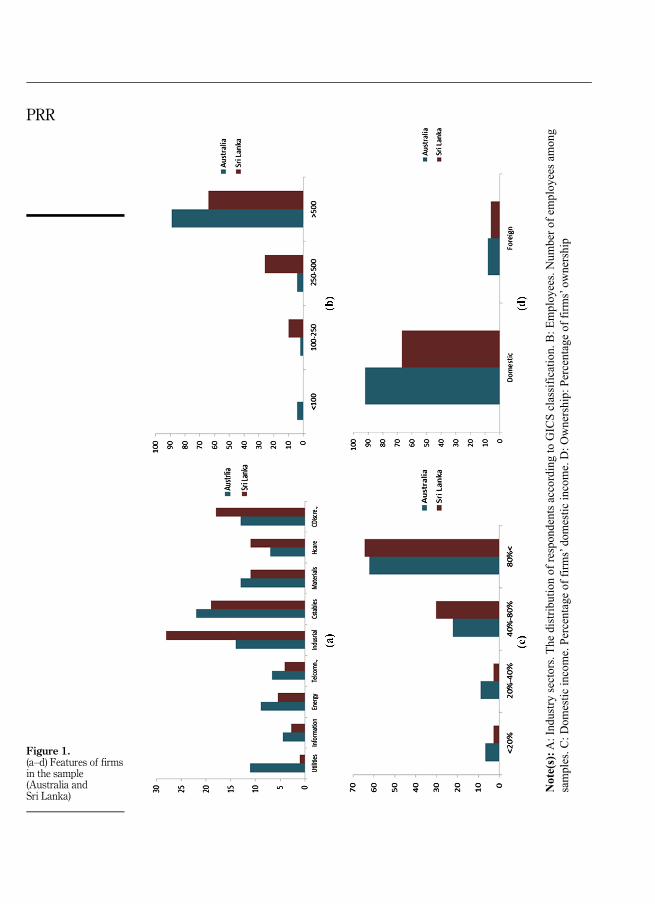
3.2 Sample: firm and CFO’s attributesFigure 1a–d summarise the information on the firm features (i.e. industry sectors, employeenumbers, domestic income and ownership). A majority of sample firms are in the consumerstaples industry sector (22 and 28% in, respectively, Australia and Sri Lanka), and the lowestrepresentation is in the information and utilities sector (respectively, 3 and 2% in Australiaand Sri Lanka). Figure 1b illustrates that 89% of Australian firms have over 500 employees,and 64% of Sri Lankan firms have over 500 employees. Australian and Sri Lankan firmsaccounted more than one-half respondents (i.e. 62 and 64% of total respondents have morethan 80% of domestic income respectively). Figure 1d shows that 92 and 67% aredomestically-owned firms in, respectively, Australia and Sri Lanka. However, foreignownership of firms in both countries is similar.
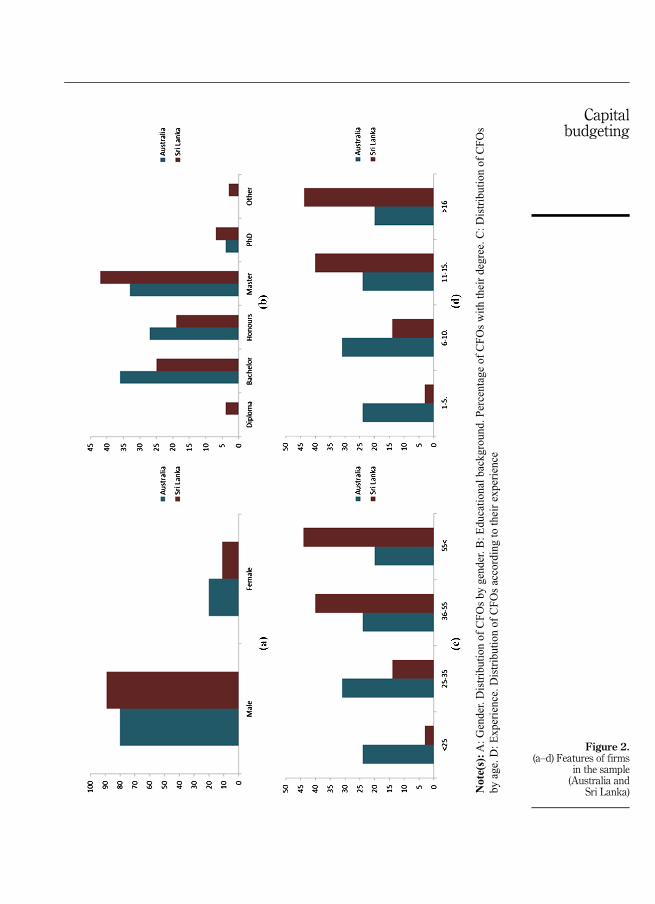
Figure 2a–d display CFO’s profiles (i.e. gender, education, age and experience). There aremostlymale CFOs (80 and 89%, respectively, in Australia and Sri Lanka) with 63 and 44%of,respectively, Australian and Sri Lankan CFOs holding a bachelor or honours degree as theirhighest level of education accomplishment. Further, 55% of Australian CFOs are under35 years of age. In contrast, 84% of the CFOs of Sri Lanka respondent firms are over 36 andless than 16% are under 35. Finally, only 31% of Australia CFOs have been in their positions6 to 10 years. In contrast, 44% of the CFOs of respondent Sri Lanka firms have over 16 years’experience.
4. Results and discussion4.1 Independent samples t-test4.1.1 Capital budgeting process–Australia and Sri Lanka. This section examines the way inwhich Australian and Sri Lankan firms evaluate investments. CB practices examined are CBprocess (e.g. long-term strategic planning, search for investment opportunities, review andscreening, accept/reject decisions, implementation, expenditure control and monitoring, andpost-audit and CB appraisal techniques (including investment analysis techniques, riskanalysis techniques and cost of capital). Table 4 indicates that there are significantdifferences between Australia and Sri Lanka in the use of CB process except search forinvestment opportunities, review and screening, and accept/reject decisions as indicated bythe t-values such as long-term strategic planning (t 5 �2.698, p < 0.05), implementation(t 5 �4.931, p < 0.05), expenditure control and monitoring (t 5 �4.347, p < 0.05) and post-
Capitalbudgeting
Note(s): A
: Ind
ustry
sect
ors.
The
dist
ribut
ion
of re
spon
dent
s acc
ordi
ng to
GIC
S cl
assi
ficat
ion.
B: E
mpl
oyee
s. N
umbe
r of e
mpl
oyee
s am
ong
sam
ples
. C: D
omes
tic in
com
e. P
erce
ntag
e of
firm
s’ do
mes
tic in
com
e. D
: Ow
ners
hip:
Per
cent
age
of fi
rms’
owne
rshi
p
Figure 1.(a–d) Features of firmsin the sample(Australia andSri Lanka)
PRR
Note(s): A
: Gen
der.
Dis
tribu
tion
of C
FOs b
y ge
nder
. B: E
duca
tiona
l bac
kgro
und.
Per
cent
age
of C
FOs w
ith th
eir d
egre
e. C
: Dis
tribu
tion
of C
FOs
by a
ge. D
: Exp
erie
nce.
Dis
tribu
tion
of C
FOs a
ccor
ding
to th
eir e
xper
ienc
e
Figure 2.(a–d) Features of firms
in the sample(Australia and
Sri Lanka)
Capitalbudgeting
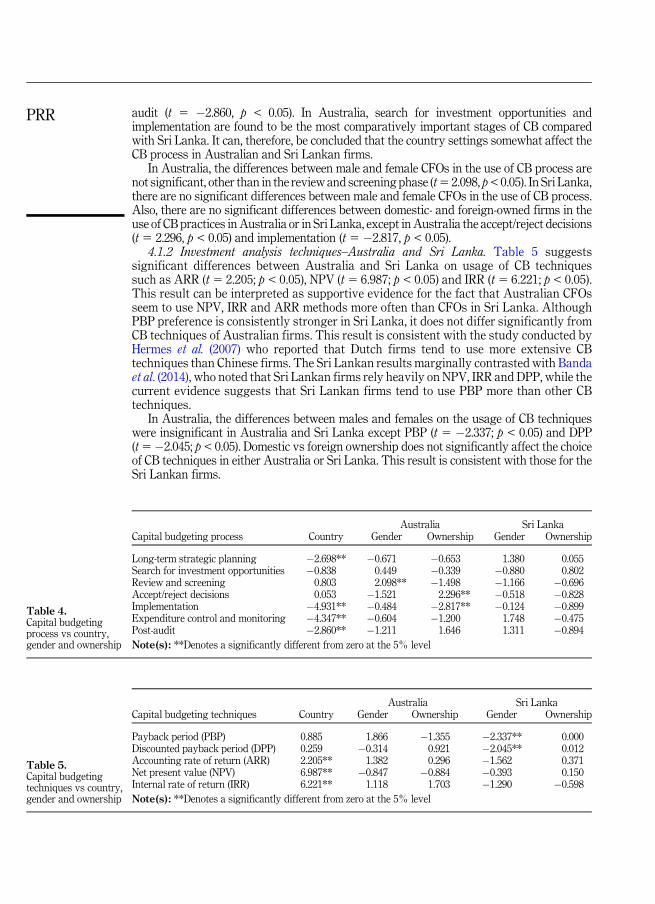
audit (t 5 �2.860, p < 0.05). In Australia, search for investment opportunities andimplementation are found to be the most comparatively important stages of CB comparedwith Sri Lanka. It can, therefore, be concluded that the country settings somewhat affect theCB process in Australian and Sri Lankan firms.
In Australia, the differences between male and female CFOs in the use of CB process arenot significant, other than in the review and screening phase (t5 2.098, p<0.05). In Sri Lanka,there are no significant differences between male and female CFOs in the use of CB process.Also, there are no significant differences between domestic- and foreign-owned firms in theuse of CB practices inAustralia or in Sri Lanka, except inAustralia the accept/reject decisions(t 5 2.296, p < 0.05) and implementation (t 5 �2.817, p < 0.05).
4.1.2 Investment analysis techniques–Australia and Sri Lanka. Table 5 suggestssignificant differences between Australia and Sri Lanka on usage of CB techniquessuch as ARR (t 5 2.205; p < 0.05), NPV (t 5 6.987; p < 0.05) and IRR (t 5 6.221; p < 0.05).This result can be interpreted as supportive evidence for the fact that Australian CFOsseem to use NPV, IRR and ARR methods more often than CFOs in Sri Lanka. AlthoughPBP preference is consistently stronger in Sri Lanka, it does not differ significantly fromCB techniques of Australian firms. This result is consistent with the study conducted byHermes et al. (2007) who reported that Dutch firms tend to use more extensive CBtechniques than Chinese firms. The Sri Lankan results marginally contrasted with Bandaet al. (2014), who noted that Sri Lankan firms rely heavily on NPV, IRR and DPP, while thecurrent evidence suggests that Sri Lankan firms tend to use PBP more than other CBtechniques.
In Australia, the differences between males and females on the usage of CB techniqueswere insignificant in Australia and Sri Lanka except PBP (t 5 �2.337; p < 0.05) and DPP(t5�2.045; p < 0.05). Domestic vs foreign ownership does not significantly affect the choiceof CB techniques in either Australia or Sri Lanka. This result is consistent with those for theSri Lankan firms.
Capital budgeting process CountryAustralia Sri Lanka
Gender Ownership Gender Ownership
Long-term strategic planning �2.698** �0.671 �0.653 1.380 0.055Search for investment opportunities �0.838 0.449 �0.339 �0.880 0.802Review and screening 0.803 2.098** �1.498 �1.166 �0.696Accept/reject decisions 0.053 �1.521 2.296** �0.518 �0.828Implementation �4.931** �0.484 �2.817** �0.124 �0.899Expenditure control and monitoring �4.347** �0.604 �1.200 1.748 �0.475Post-audit �2.860** �1.211 1.646 1.311 �0.894
Note(s): **Denotes a significantly different from zero at the 5% level
Capital budgeting techniques CountryAustralia Sri Lanka
Gender Ownership Gender Ownership
Payback period (PBP) 0.885 1.866 �1.355 �2.337** 0.000Discounted payback period (DPP) 0.259 �0.314 0.921 �2.045** 0.012Accounting rate of return (ARR) 2.205** 1.382 0.296 �1.562 0.371Net present value (NPV) 6.987** �0.847 �0.884 �0.393 0.150Internal rate of return (IRR) 6.221** 1.118 1.703 �1.290 �0.598
Note(s): **Denotes a significantly different from zero at the 5% level
Table 4.Capital budgetingprocess vs country,gender and ownership
Table 5.Capital budgetingtechniques vs country,gender and ownership
PRR
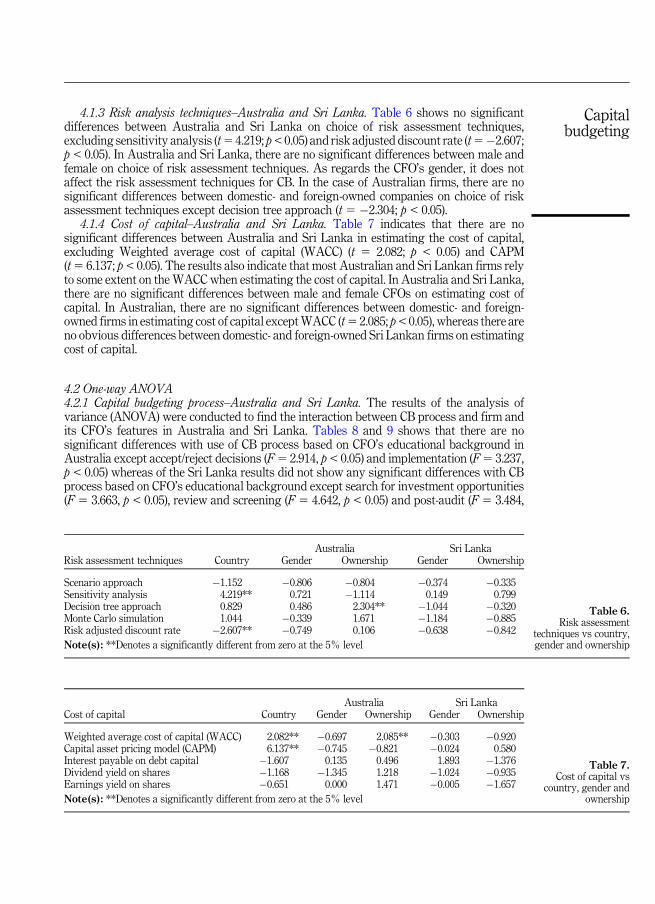
4.1.3 Risk analysis techniques–Australia and Sri Lanka. Table 6 shows no significantdifferences between Australia and Sri Lanka on choice of risk assessment techniques,excluding sensitivity analysis (t5 4.219; p<0.05) and risk adjusted discount rate (t5�2.607;p < 0.05). In Australia and Sri Lanka, there are no significant differences between male andfemale on choice of risk assessment techniques. As regards the CFO’s gender, it does notaffect the risk assessment techniques for CB. In the case of Australian firms, there are nosignificant differences between domestic- and foreign-owned companies on choice of riskassessment techniques except decision tree approach (t 5 �2.304; p < 0.05).
4.1.4 Cost of capital–Australia and Sri Lanka. Table 7 indicates that there are nosignificant differences between Australia and Sri Lanka in estimating the cost of capital,excluding Weighted average cost of capital (WACC) (t 5 2.082; p < 0.05) and CAPM(t5 6.137; p < 0.05). The results also indicate that most Australian and Sri Lankan firms relyto some extent on theWACC when estimating the cost of capital. In Australia and Sri Lanka,there are no significant differences between male and female CFOs on estimating cost ofcapital. In Australian, there are no significant differences between domestic- and foreign-owned firms in estimating cost of capital exceptWACC (t5 2.085; p<0.05), whereas there areno obvious differences between domestic- and foreign-owned Sri Lankan firms on estimatingcost of capital.
4.2 One-way ANOVA4.2.1 Capital budgeting process–Australia and Sri Lanka. The results of the analysis ofvariance (ANOVA) were conducted to find the interaction between CB process and firm andits CFO’s features in Australia and Sri Lanka. Tables 8 and 9 shows that there are nosignificant differences with use of CB process based on CFO’s educational background inAustralia except accept/reject decisions (F5 2.914, p < 0.05) and implementation (F5 3.237,p < 0.05) whereas of the Sri Lanka results did not show any significant differences with CBprocess based on CFO’s educational background except search for investment opportunities(F 5 3.663, p < 0.05), review and screening (F 5 4.642, p < 0.05) and post-audit (F 5 3.484,
Risk assessment techniques CountryAustralia Sri Lanka
Gender Ownership Gender Ownership
Scenario approach �1.152 �0.806 �0.804 �0.374 �0.335Sensitivity analysis 4.219** 0.721 �1.114 0.149 0.799Decision tree approach 0.829 0.486 2.304** �1.044 �0.320Monte Carlo simulation 1.044 �0.339 1.671 �1.184 �0.885Risk adjusted discount rate �2.607** �0.749 0.106 �0.638 �0.842
Note(s): **Denotes a significantly different from zero at the 5% level
Cost of capital CountryAustralia Sri Lanka
Gender Ownership Gender Ownership
Weighted average cost of capital (WACC) 2.082** �0.697 2.085** �0.303 �0.920Capital asset pricing model (CAPM) 6.137** �0.745 �0.821 �0.024 0.580Interest payable on debt capital �1.607 0.135 0.496 1.893 �1.376Dividend yield on shares �1.168 �1.345 1.218 �1.024 �0.935Earnings yield on shares �0.651 0.000 1.471 �0.005 �1.657
Note(s): **Denotes a significantly different from zero at the 5% level
Table 6.Risk assessment
techniques vs country,gender and ownership
Table 7.Cost of capital vs
country, gender andownership
Capitalbudgeting
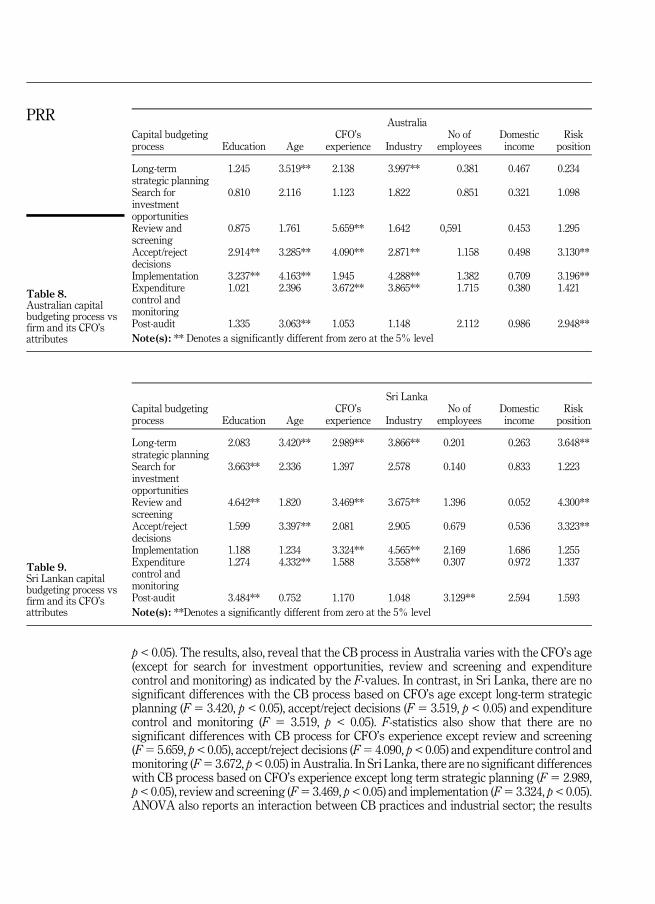
p < 0.05). The results, also, reveal that the CB process in Australia varies with the CFO’s age(except for search for investment opportunities, review and screening and expenditurecontrol and monitoring) as indicated by the F-values. In contrast, in Sri Lanka, there are nosignificant differences with the CB process based on CFO’s age except long-term strategicplanning (F 5 3.420, p < 0.05), accept/reject decisions (F 5 3.519, p < 0.05) and expenditurecontrol and monitoring (F 5 3.519, p < 0.05). F-statistics also show that there are nosignificant differences with CB process for CFO’s experience except review and screening(F5 5.659, p< 0.05), accept/reject decisions (F5 4.090, p< 0.05) and expenditure control andmonitoring (F5 3.672, p< 0.05) in Australia. In Sri Lanka, there are no significant differenceswith CB process based on CFO’s experience except long term strategic planning (F5 2.989,p< 0.05), review and screening (F5 3.469, p< 0.05) and implementation (F5 3.324, p< 0.05).ANOVA also reports an interaction between CB practices and industrial sector; the results
Capital budgetingprocess
Australia
Education AgeCFO’s
experience IndustryNo of
employeesDomesticincome
Riskposition
Long-termstrategic planning
1.245 3.519** 2.138 3.997** 0.381 0.467 0.234
Search forinvestmentopportunities
0.810 2.116 1.123 1.822 0.851 0.321 1.098
Review andscreening
0.875 1.761 5.659** 1.642 0,591 0.453 1.295
Accept/rejectdecisions
2.914** 3.285** 4.090** 2.871** 1.158 0.498 3.130**
Implementation 3.237** 4.163** 1.945 4.288** 1.382 0.709 3.196**Expenditurecontrol andmonitoring
1.021 2.396 3.672** 3.865** 1.715 0.380 1.421
Post-audit 1.335 3.063** 1.053 1.148 2.112 0.986 2.948**
Note(s): ** Denotes a significantly different from zero at the 5% level
Capital budgetingprocess
Sri Lanka
Education AgeCFO’s
experience IndustryNo of
employeesDomesticincome
Riskposition
Long-termstrategic planning
2.083 3.420** 2.989** 3.866** 0.201 0.263 3.648**
Search forinvestmentopportunities
3.663** 2.336 1.397 2.578 0.140 0.833 1.223
Review andscreening
4.642** 1.820 3.469** 3.675** 1.396 0.052 4.300**
Accept/rejectdecisions
1.599 3.397** 2.081 2.905 0.679 0.536 3.323**
Implementation 1.188 1.234 3.324** 4.565** 2.169 1.686 1.255Expenditurecontrol andmonitoring
1.274 4.332** 1.588 3.558** 0.307 0.972 1.337
Post-audit 3.484** 0.752 1.170 1.048 3.129** 2.594 1.593
Note(s): **Denotes a significantly different from zero at the 5% level
Table 8.Australian capitalbudgeting process vsfirm and its CFO’sattributes
Table 9.Sri Lankan capitalbudgeting process vsfirm and its CFO’sattributes
PRR
show significant differences for long-term strategic planning (F 5 3.997, p < 0.05), accept/reject decisions (F 5 2.871, p < 0.05), implementation (F 5 4.288, p < 0.05) and expenditurecontrol and monitoring (F5 3.865, p < 0.05) in Australia, while those of the Sri Lanka firms,the results show significant differences for long-term strategic planning (F5 3.558, p< 0.05),review and screening (F 5 3.675, p < 0.05), implementation (F 5 4.565, p < 0.05) andexpenditure control and monitoring (F5 3.866, p < 0.05). In addition, the results did not findany significant differences with CB process based on number of employees in Australia whilein Sri Lanka, there are no significant differenceswith CBprocess except post-audit (F5 3.129,p < 0.05). The results also did not find any significant differences with CB practices fordomestic income levels in Australia. This result is consistent with Sri Lankan firms. Theresults also revealed that there are significant differences with CB process based on riskposition as indicated by the F-values such as accept/reject decisions (F 5 3.130, p < 0.05),implementation (F5 3.196, p< 0.05) and post-audit (F5 2.948, p< 0.05) in Australia whereasin those of Sri Lankan firms, there are significant differences with CB process based on riskposition as indicated by the F-values such as long-term strategic planning (F 5 3.648,p < 0.05), review and screening (F 5 4.300, p < 0.05) and accept/reject decisions (F 5 3.323,p < 0.05). The empirical evidence suffices that CB process appears to be influenced by firmand CFO’s attributes. It is exhibited that there is no structure guideline regarding CB processin Australia and Sri Lanka.
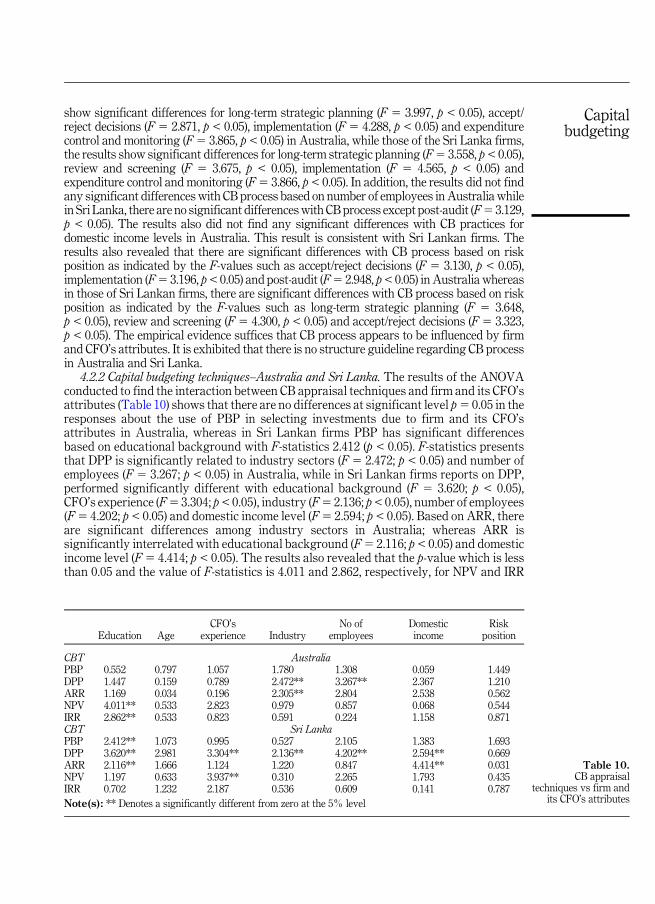
4.2.2 Capital budgeting techniques–Australia and Sri Lanka. The results of the ANOVAconducted to find the interaction between CB appraisal techniques and firm and its CFO’sattributes (Table 10) shows that there are no differences at significant level p5 0.05 in theresponses about the use of PBP in selecting investments due to firm and its CFO’sattributes in Australia, whereas in Sri Lankan firms PBP has significant differencesbased on educational background with F-statistics 2.412 (p < 0.05). F-statistics presentsthat DPP is significantly related to industry sectors (F 5 2.472; p < 0.05) and number ofemployees (F 5 3.267; p < 0.05) in Australia, while in Sri Lankan firms reports on DPP,performed significantly different with educational background (F 5 3.620; p < 0.05),CFO’s experience (F5 3.304; p< 0.05), industry (F5 2.136; p< 0.05), number of employees(F5 4.202; p < 0.05) and domestic income level (F5 2.594; p < 0.05). Based on ARR, thereare significant differences among industry sectors in Australia; whereas ARR issignificantly interrelated with educational background (F5 2.116; p < 0.05) and domesticincome level (F5 4.414; p < 0.05). The results also revealed that the p-value which is lessthan 0.05 and the value of F-statistics is 4.011 and 2.862, respectively, for NPV and IRR
Education AgeCFO’s
experience IndustryNo of
employeesDomesticincome
Riskposition
CBT AustraliaPBP 0.552 0.797 1.057 1.780 1.308 0.059 1.449DPP 1.447 0.159 0.789 2.472** 3.267** 2.367 1.210ARR 1.169 0.034 0.196 2.305** 2.804 2.538 0.562NPV 4.011** 0.533 2.823 0.979 0.857 0.068 0.544IRR 2.862** 0.533 0.823 0.591 0.224 1.158 0.871CBT Sri LankaPBP 2.412** 1.073 0.995 0.527 2.105 1.383 1.693DPP 3.620** 2.981 3.304** 2.136** 4.202** 2.594** 0.669ARR 2.116** 1.666 1.124 1.220 0.847 4.414** 0.031NPV 1.197 0.633 3.937** 0.310 2.265 1.793 0.435IRR 0.702 1.232 2.187 0.536 0.609 0.141 0.787
Note(s): ** Denotes a significantly different from zero at the 5% level
Table 10.CB appraisal
techniques vs firm andits CFO’s attributes
Capitalbudgeting
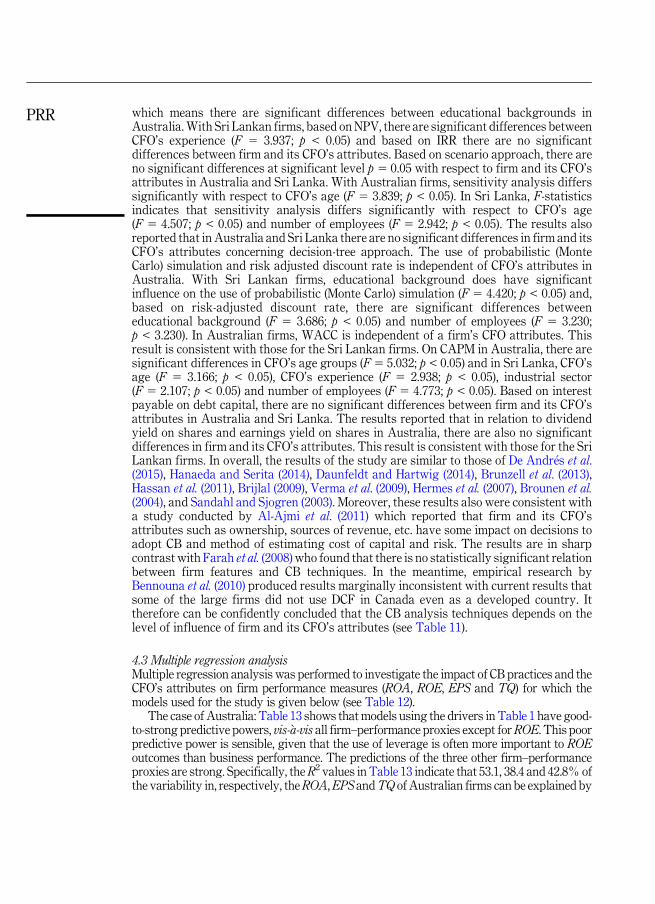
which means there are significant differences between educational backgrounds inAustralia.With Sri Lankan firms, based on NPV, there are significant differences betweenCFO’s experience (F 5 3.937; p < 0.05) and based on IRR there are no significantdifferences between firm and its CFO’s attributes. Based on scenario approach, there areno significant differences at significant level p 5 0.05 with respect to firm and its CFO’sattributes in Australia and Sri Lanka. With Australian firms, sensitivity analysis differssignificantly with respect to CFO’s age (F 5 3.839; p < 0.05). In Sri Lanka, F-statisticsindicates that sensitivity analysis differs significantly with respect to CFO’s age(F 5 4.507; p < 0.05) and number of employees (F 5 2.942; p < 0.05). The results alsoreported that in Australia and Sri Lanka there are no significant differences in firm and itsCFO’s attributes concerning decision-tree approach. The use of probabilistic (MonteCarlo) simulation and risk adjusted discount rate is independent of CFO’s attributes inAustralia. With Sri Lankan firms, educational background does have significantinfluence on the use of probabilistic (Monte Carlo) simulation (F 5 4.420; p < 0.05) and,based on risk-adjusted discount rate, there are significant differences betweeneducational background (F 5 3.686; p < 0.05) and number of employees (F 5 3.230;p < 3.230). In Australian firms, WACC is independent of a firm’s CFO attributes. Thisresult is consistent with those for the Sri Lankan firms. On CAPM in Australia, there aresignificant differences in CFO’s age groups (F 5 5.032; p < 0.05) and in Sri Lanka, CFO’sage (F 5 3.166; p < 0.05), CFO’s experience (F 5 2.938; p < 0.05), industrial sector(F 5 2.107; p < 0.05) and number of employees (F 5 4.773; p < 0.05). Based on interestpayable on debt capital, there are no significant differences between firm and its CFO’sattributes in Australia and Sri Lanka. The results reported that in relation to dividendyield on shares and earnings yield on shares in Australia, there are also no significantdifferences in firm and its CFO’s attributes. This result is consistent with those for the SriLankan firms. In overall, the results of the study are similar to those of De Andr�es et al.(2015), Hanaeda and Serita (2014), Daunfeldt and Hartwig (2014), Brunzell et al. (2013),Hassan et al. (2011), Brijlal (2009), Verma et al. (2009), Hermes et al. (2007), Brounen et al.(2004), and Sandahl and Sjogren (2003). Moreover, these results also were consistent witha study conducted by Al-Ajmi et al. (2011) which reported that firm and its CFO’sattributes such as ownership, sources of revenue, etc. have some impact on decisions toadopt CB and method of estimating cost of capital and risk. The results are in sharpcontrast with Farah et al. (2008) who found that there is no statistically significant relationbetween firm features and CB techniques. In the meantime, empirical research byBennouna et al. (2010) produced results marginally inconsistent with current results thatsome of the large firms did not use DCF in Canada even as a developed country. Ittherefore can be confidently concluded that the CB analysis techniques depends on thelevel of influence of firm and its CFO’s attributes (see Table 11).
4.3 Multiple regression analysisMultiple regression analysis was performed to investigate the impact of CB practices and theCFO’s attributes on firm performance measures (ROA, ROE, EPS and TQ) for which themodels used for the study is given below (see Table 12).
The case of Australia: Table 13 shows that models using the drivers in Table 1 have good-to-strong predictive powers, vis-�a-vis all firm–performance proxies except forROE. This poorpredictive power is sensible, given that the use of leverage is often more important to ROEoutcomes than business performance. The predictions of the three other firm–performanceproxies are strong. Specifically, theR2 values in Table 13 indicate that 53.1, 38.4 and 42.8% ofthe variability in, respectively, theROA,EPS andTQ of Australian firms can be explained by
PRR

the CB practices of the firm and CFO features. The F-statistics and significance levels (sig) inTables 8 and 9 show that these three models generate statistically significant outcomes.
Table 14 shows that all variables do not have significant impact on ROA excluding CBP(B5 79.497 and p5 0.047), educational background (B5�221.487 and p5 0.009), number ofemployees and (B 5 �770.762 and p 5 0.000) and except CBT, education background andnumber of employees all have positive signs. CBP is statistically significant at 5% level whileeducational background and number of employees are statistically significant at 1% level.Although educational background and number of employees have negative signs, neither ofthem are statistically significant at 1% level. The results also indicate that all variables do not
Education AgeCFO’s
experience IndustryNo of
employeeDomesticincome
Riskposition
CC AustraliaWACC 0.514 0.641 2.182 1.377 0.469 1.225 1.225CAPM 0.983 0.168 2.266 1.315 5.032** 1.843 0.685IPOD 0.381 0.291 0.584 1.577 0.741 2.103 0.512Dividend 0.327 0.063 0.970 0.509 1.339 1.928 0.608Earnings 1.026 0.442 0.059 1.170 0.765 0.781 0.263CC Sri LankaWACC 1.290 0.484 0.297 0.532 1.004 0.031 1.639CAPM 0.795 3.166** 2.938** 2.107** 4.773** 0.416 1.005IPOD 1.034 0.842 1.750 0.541 0.035 0.915 0.879Dividend 0.850 2.703 0.422 1.501 1.626 0.814 1.156Earnings 1.632 0.794 1.441 1.713 1.397 1.451 1.595
Note(s): ** Denotes a significantly different from zero at the 5% level
ROA ROE EPS TQ
R 0.729 0.467 0.620 0.654R2 0.531 0.218 0.384 0.428F-statistics 4.399 1.087 2.425 2.910Significance levels 0.001 0.397 0.029 0.011
Education AgeCFO’s
experience IndustryNo of
employeeDomesticincome
Riskposition
RAT AustraliaScenario 2.130 1.576 0.549 1.461 2.274 1.516 0.607Sensitivity 0.701 3.839** 0.672 0.370 1.460 1.406 1.427Decision 0.897 1.599 0.975 1.468 1.534 0.997 1.563Monte 0.924 0.965 0.325 1.338 2.524 2.210 1.214R adjusted 0.294 0.863 1.082 1.077 0.270 1.759 0.540RAT Sri LankaScenario 1.216 2.070 1.579 0.499 1.293 1.386 0.506Sensitivity 1.354 4.507** 1.045 2.005 2.942** 0.362 0.842Decision 1.477 0.294 0.729 1.337 0.288 0.762 0.076Monte 0.729 4.420** 2.040 0.729 0.170 0.242 0.330R adjusted 0.555 3.686** 1.061 0.678 3.230** 1.084 0.541
Note(s): ** Denotes a significantly different from zero at the 5% level
Table 12.Cost of capital vs firm
and its CFO’sattributes
Table 13.Predictors of ROA,ROE, EPS and TQ–
model summary(Australia)
Table 11.Risk assessment
techniques vs firm andits CFO’s attributes
Capitalbudgeting
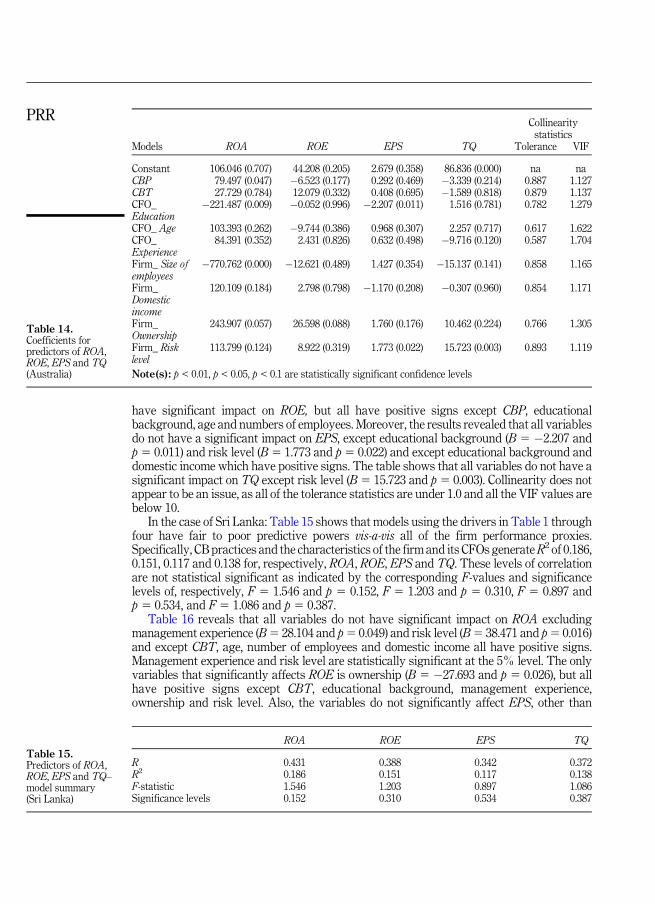
have significant impact on ROE, but all have positive signs except CBP, educationalbackground, age and numbers of employees. Moreover, the results revealed that all variablesdo not have a significant impact on EPS, except educational background (B 5 �2.207 andp5 0.011) and risk level (B5 1.773 and p5 0.022) and except educational background anddomestic income which have positive signs. The table shows that all variables do not have asignificant impact on TQ except risk level (B5 15.723 and p5 0.003). Collinearity does notappear to be an issue, as all of the tolerance statistics are under 1.0 and all the VIF values arebelow 10.
In the case of Sri Lanka: Table 15 shows that models using the drivers in Table 1 throughfour have fair to poor predictive powers vis-a-vis all of the firm performance proxies.Specifically, CB practices and the characteristics of the firm and its CFOs generateR2 of 0.186,0.151, 0.117 and 0.138 for, respectively, ROA, ROE, EPS and TQ. These levels of correlationare not statistical significant as indicated by the corresponding F-values and significancelevels of, respectively, F 5 1.546 and p 5 0.152, F 5 1.203 and p 5 0.310, F 5 0.897 andp 5 0.534, and F 5 1.086 and p 5 0.387.
Table 16 reveals that all variables do not have significant impact on ROA excludingmanagement experience (B5 28.104 and p5 0.049) and risk level (B5 38.471 and p5 0.016)and except CBT, age, number of employees and domestic income all have positive signs.Management experience and risk level are statistically significant at the 5% level. The onlyvariables that significantly affects ROE is ownership (B 5 �27.693 and p 5 0.026), but allhave positive signs except CBT, educational background, management experience,ownership and risk level. Also, the variables do not significantly affect EPS, other than
Models ROA ROE EPS TQ
Collinearitystatistics
Tolerance VIF
Constant 106.046 (0.707) 44.208 (0.205) 2.679 (0.358) 86.836 (0.000) na naCBP 79.497 (0.047) �6.523 (0.177) 0.292 (0.469) �3.339 (0.214) 0.887 1.127CBT 27.729 (0.784) 12.079 (0.332) 0.408 (0.695) �1.589 (0.818) 0.879 1.137CFO_Education
�221.487 (0.009) �0.052 (0.996) �2.207 (0.011) 1.516 (0.781) 0.782 1.279
CFO_ Age 103.393 (0.262) �9.744 (0.386) 0.968 (0.307) 2.257 (0.717) 0.617 1.622CFO_Experience
84.391 (0.352) 2.431 (0.826) 0.632 (0.498) �9.716 (0.120) 0.587 1.704
Firm_ Size ofemployees
�770.762 (0.000) �12.621 (0.489) 1.427 (0.354) �15.137 (0.141) 0.858 1.165
Firm_Domesticincome
120.109 (0.184) 2.798 (0.798) �1.170 (0.208) �0.307 (0.960) 0.854 1.171
Firm_Ownership
243.907 (0.057) 26.598 (0.088) 1.760 (0.176) 10.462 (0.224) 0.766 1.305
Firm_ Risklevel
113.799 (0.124) 8.922 (0.319) 1.773 (0.022) 15.723 (0.003) 0.893 1.119
Note(s): p < 0.01, p < 0.05, p < 0.1 are statistically significant confidence levels
ROA ROE EPS TQ
R 0.431 0.388 0.342 0.372R2 0.186 0.151 0.117 0.138F-statistic 1.546 1.203 0.897 1.086Significance levels 0.152 0.310 0.534 0.387
Table 14.Coefficients forpredictors of ROA,ROE, EPS and TQ(Australia)
Table 15.Predictors of ROA,ROE, EPS and TQ–model summary(Sri Lanka)
PRR
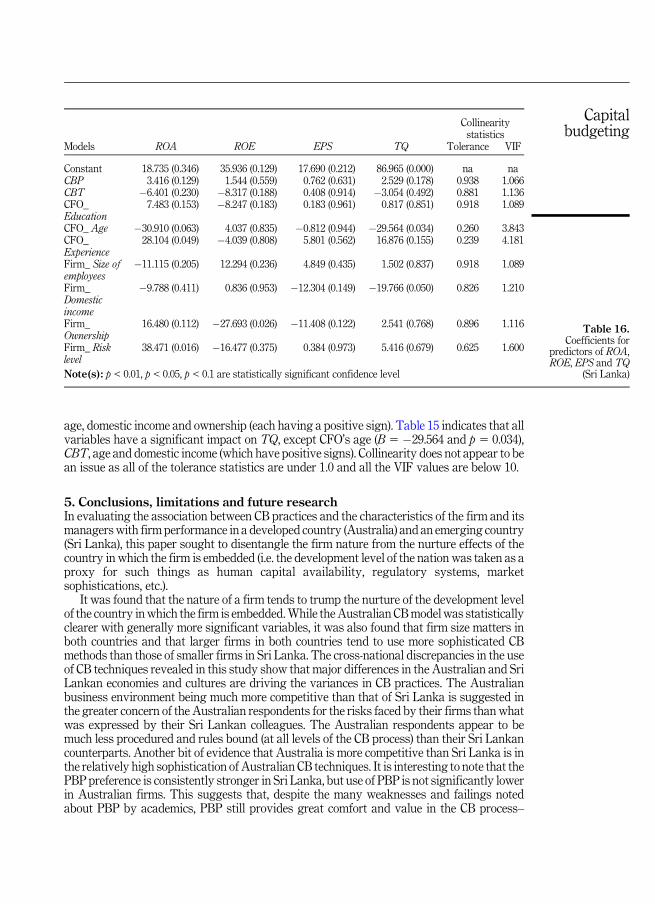
age, domestic income and ownership (each having a positive sign). Table 15 indicates that allvariables have a significant impact on TQ, except CFO’s age (B 5 �29.564 and p 5 0.034),CBT, age and domestic income (which have positive signs). Collinearity does not appear to bean issue as all of the tolerance statistics are under 1.0 and all the VIF values are below 10.
5. Conclusions, limitations and future researchIn evaluating the association between CB practices and the characteristics of the firm and itsmanagerswith firm performance in a developed country (Australia) and an emerging country(Sri Lanka), this paper sought to disentangle the firm nature from the nurture effects of thecountry in which the firm is embedded (i.e. the development level of the nation was taken as aproxy for such things as human capital availability, regulatory systems, marketsophistications, etc.).
It was found that the nature of a firm tends to trump the nurture of the development levelof the country inwhich the firm is embedded.While theAustralian CBmodel was statisticallyclearer with generally more significant variables, it was also found that firm size matters inboth countries and that larger firms in both countries tend to use more sophisticated CBmethods than those of smaller firms in Sri Lanka. The cross-national discrepancies in the useof CB techniques revealed in this study show that major differences in the Australian and SriLankan economies and cultures are driving the variances in CB practices. The Australianbusiness environment being much more competitive than that of Sri Lanka is suggested inthe greater concern of the Australian respondents for the risks faced by their firms than whatwas expressed by their Sri Lankan colleagues. The Australian respondents appear to bemuch less procedured and rules bound (at all levels of the CB process) than their Sri Lankancounterparts. Another bit of evidence that Australia is more competitive than Sri Lanka is inthe relatively high sophistication of Australian CB techniques. It is interesting to note that thePBP preference is consistently stronger in Sri Lanka, but use of PBP is not significantly lowerin Australian firms. This suggests that, despite the many weaknesses and failings notedabout PBP by academics, PBP still provides great comfort and value in the CB process–
Models ROA ROE EPS TQ
Collinearitystatistics
Tolerance VIF
Constant 18.735 (0.346) 35.936 (0.129) 17.690 (0.212) 86.965 (0.000) na naCBP 3.416 (0.129) 1.544 (0.559) 0.762 (0.631) 2.529 (0.178) 0.938 1.066CBT �6.401 (0.230) �8.317 (0.188) 0.408 (0.914) �3.054 (0.492) 0.881 1.136CFO_Education
7.483 (0.153) �8.247 (0.183) 0.183 (0.961) 0.817 (0.851) 0.918 1.089
CFO_ Age �30.910 (0.063) 4.037 (0.835) �0.812 (0.944) �29.564 (0.034) 0.260 3.843CFO_Experience
28.104 (0.049) �4.039 (0.808) 5.801 (0.562) 16.876 (0.155) 0.239 4.181
Firm_ Size ofemployees
�11.115 (0.205) 12.294 (0.236) 4.849 (0.435) 1.502 (0.837) 0.918 1.089
Firm_Domesticincome
�9.788 (0.411) 0.836 (0.953) �12.304 (0.149) �19.766 (0.050) 0.826 1.210
Firm_Ownership
16.480 (0.112) �27.693 (0.026) �11.408 (0.122) 2.541 (0.768) 0.896 1.116
Firm_ Risklevel
38.471 (0.016) �16.477 (0.375) 0.384 (0.973) 5.416 (0.679) 0.625 1.600
Note(s): p < 0.01, p < 0.05, p < 0.1 are statistically significant confidence level
Table 16.Coefficients for
predictors of ROA,ROE, EPS and TQ
(Sri Lanka)
Capitalbudgeting

possibly as a rough-and-ready measure of relative risk that ensures that the decision makersdo not get led up the garden path by the more sophisticated CB techniques. Also of greatinterest is that Australian firms are more likely to use multiple modes of CB appraisaltechniques than Sri Lankan firms–perhaps because their appetite for risky investmentsappears to be significantly greater than that of their Sri Lankan counterparts. n complex real-world situations, reconciling the outputs of a multifaceted approach to CB methods is morelikely to give the depth and width of input needed to achieve an optimal capital investmentplan. Concurrently as Sri Lanka passes through its post-war recovery phase, reform of itsfinancial and capital market is essential to sustain economic growth and development. Whilea wider diffusion of better investment appraisal method in Sri Lankan firms could improvethe cost-effectiveness of investment decisions and generally increase efficiency, this isunlikely to occur until competition is more of a spur.
The key limitations inherent in the use of any questionnaire survey were mitigated to adegree by using official and third-party sources of data were possible for the analysis. Anadded limitation is the difficulties inherent in discovering and adjusting for variations in theCB mechanisms, business scope and/or financing portfolio across firms. Like most previousstudies, this study examines only selected firm–performance proxies. Difficulties arisingfrom accounting standards and principles varying across countries have greatly eased overthe past decade as International Financial Reporting Standards (IFRS) have increasinglybeen adopted and applied.
Future research should consider generating more generalised conclusions by expandingthe study to include many more countries across the emerging-country to developed-countrydivide. Also, future research should expand consideration of the influence of firm size andsophistication on the CB process.
References
Al-Ajmi, J., Al-Saleh, N. and Hussain, H. (2011), “Investment appraisal practices: a comparative studyof conventional and Islamic financial institutions”, Advances in Accounting, Vol. 27, pp. 111-124.
Aldamen, H. and Duncan, K. (2012), “Does adopting good corporate governance impact the cost ofintermediated and non-intermediated debt?”, Accounting and Finance, Vol. 52, pp. 49-76.
Aldamen, H., Duncan, K., Kelly, S., McNamara, R. and Nagel, S. (2012), “Audit committeecharacteristics and firm performance during the global financial crisis”, Accounting andFinance, Vol. 52, pp. 971-1000.
Alkaraan, F. and Northcott, D. (2006), “Capital investment decision making: a role for strategicmanagement accounting”, British Accounting Review, Vol. 38, pp. 149-173.
Andor, G., Mohanty, S. and Toth, T. (2015), “Capital budgeting practices: a survey of Central andEastern European firms”, Emerging Markets Review, Vol. 23, pp. 148-172.
Arnold, G. and Hatzopoulos, P. (2000), “The theory-practice gap in capital budgeting: evidence fromthe United Kingdom”, Journal of Business Finance and Accounting, Vol. 27, pp. 603-625.
Baker, K., Dutta, S. and Samir, S. (2011), “Management views on real options in capital budgeting”,Journal of Applied Finance, Vol. 21, pp. 18-29.
Banda, W., Koralalage, Y., Ratnayake, C. and Mudiyanselage, R. (2014), “The use of capital budgetingtechniques in large businesses: evidence from Sri Lanka”, International Journal of Arts andCommerce, Vol. 3, pp. 77-84.
Batra, R. and Verma, S. (2014), “An empirical insight into different stages of capital budgeting”, GlobalBusiness Review, Vol. 15, pp. 339-362.
Bennouna, K., Meredith, G. and Marchant, T. (2010), “Improved capital budgeting decision making:evidence from Canada”, Management Decision, Vol. 48, pp. 225-247.
PRR
Brijlal, P. (2009), “The use of capital budgeting techniques in businesses: a perspective from theWestern Cape”, The Journal of Applied Business Research, Vol. 25, pp. 37-46.
Brounen, D., Jong, A. and Koedijk, K. (2004), “Corporate finance in Europe: confronting theory withpractice”, Journal Financial Management, Vol. 33, pp. 1-40.
Brunzell, T., Liljeblom, E. and Vaihekoski, M. (2013), “Determinants of capital budgeting methods andhurdle rates in Nordic firms”, Accounting and Finance, Vol. 53, pp. 85-110.
Chan, H., Kamal, H. and William, S. (2004), “Capital budgeting practices of Chinese firms”, The Journalof Global Business Management, Vol. 1, pp. 20-26.
Chen, N. (1991), “Financial investment opportunities and the macro economy”, Journal of Finance,Vol. 46, pp. 529-554.
Christy, G. (1966), Capital Budgeting Current Practices and Their Efficiency, University of Oregon.
Coltman, G. (1995), An Analysis of Capital Budgeting Techniques and Their Impact on ShareholderWealth, University of Cape Town.
Daunfeldt, S. and Hartwig, F. (2014), “What determines the use of capital budgeting methods?Evidence from Swedish listed companies”, Journal of Finance and Economics, Vol. 2,pp. 101-112.
De Andr�es, P., De Fuente, G. and San Mart�ın, P. (2015), “Capital budgeting practices in Spain”, BRQBusiness Research Quarterly, Vol. 18, pp. 37-56.
Farah, M., Mansor, I. and George, W. (2008), “Capital budgeting practices of listed Indonesiancompanies”, Asian Journal of Business and Accounting, Vol. 1, pp. 175-192.
Farragher, E., Kleiman, R. and Sathu, A. (1999), “Current capital investment practices”, EngineeringEconomist, Vol. 44, pp. 137-141.
Farragher, E., Kleiman, R. and Sathu, A. (2001), “The association between the use of sophisticatedcapital budgeting practices and corporate performance”, The Engineering Economist, Vol. 46,pp. 300-311.
Freeman, M. and Hobbes, G. (1991), “Capital budgeting: theory versus practice”, AustralianAccountant, Vol. 61, pp. 36-41.
Gervais, S., Heaton, J. and Odean, T. (2012), “Overconfidence, compensation contracts, and capitalbudgeting”, The Journal of Finance, Vol. 66, pp. 1735-1777.
Graham, J. and Harvey, C. (2001), “The theory and practice of corporate finance: evidence from thefield”, Journal of Financial Economics, Vol. 2, pp. 187-243.
Haka, S., Lawrence, A. and George, E. (1985), “Sophisticated capital budgeting selection techniquesand firm performance”, The Accounting Review, Vol. 9, pp. 651-669.
Han, C. (1986), “The sophistication of capital budgeting in Malaysian companies”, Omega, Vol. 14,pp. 175-181.
Hanaeda, H. and Serita, T. (2014), “Capital budgeting practices: evidence from Japan”, available at:http://papers.ssrn.com/sol3/papers.cfm?abstract_id52312264.
Hasan, H., Al Mutairi, M. and Risik, A. (2011), The Impact of Corporte Financing Decision on CorporatePerformance in the Absence of Taxes: Panel Data from Kuwait Stock Market, pp. 1-27.
Hassan, M., Hosny, L. and Vasilya, S. (2011), “Capital investment practices: a survey of largecorporation in developing market”, Global Review of Accounting and Finance, Vol. 2, pp. 39-60.
Hermes, N., Smid, P. and Yao, L. (2007), “Capital budgeting practices: a comparative study of theNetherlands and China”, International Business Review, Vol. 16, pp. 630-654.
Jog, M. and Srivastava, A. (1995), “Capital budgeting practices in corporate Canada”, FinancialPractice and Education, Vol. 5, pp. 37-43.
Kashyap, A. (2014), “Capital allocating decisions: time value of money”, Asian Journal of Management,Vol. 5, pp. 106-110.
Capitalbudgeting
Kester, G. and Chong, T. (1998), “Capital budgeting practices of listed firms in Singapore”, SigaporeManagement Review, Vol. 20, pp. 9-23.
Kim, S.H. (1981), “An empirical study on the relationship between capital budgeting practices andearnings performance”, The Engineering Economist, Vol. 27, pp. 185-196.
Klammer, T. (1973), “The association of capital budgeting and firm performance”, The AccountingReview, Vol. 48, pp. 353-364.
Klammer, T. and Walker, M. (1984), “The continuing increase in the use of sophisticated capitalbudgeting techniques”, California Management Review, Vol. 27, pp. 137-148.
Lam, K., Wang, D. and Lam, M. (2008), “Practices of Hong Kong building contractors in strategic assetallocation process: longitudinal approach”, Journal of Financial Management of Property andConstruction, Vol. 13, pp. 176-186.
Manoj, A. (2002), “Corporate finance practices in India: a survey”, Vikalpa, Vol. 27, pp. 29-56.
Maroyi, V. and Van Der Poll, V. (2012), “A survey of capital budgeting techniques used by listedmining companies in South Africa”, African Journal of Business Management, Vol. 6,pp. 9279-9292.
Mintzberg, H., Raisinghini, D. and Theoret, A. (1976), “The structure of unstructured decisionprocesses”, Administrative Science Ouarterly, Vol. 21, pp. 246-275.
Mustapha, M. and Mooi, S. (2001), “Firm performance and degree of sophistication of capitalbudgeting practice: some Malaysian evidence”, Proceedings of the Asia Pacific ManagementConference, Kuala Lumpur, pp. 279-290.
Northcott, D. (1995), Capital Investment Decision Making, Dryden Press, London.
Peel, M. (1999), “Planning, business objectives and capital budgeting in Japanese, German anddomestic SMEs: some evidence from the UK manufacturing sector”, Journal of Small Businessand Enterprise Development, Vol. 6, pp. 350-365.
Peterson, P. and Fabozzi, F. (2002), Capital Budgeting: Theory and Practice, John Wiley and Sons, NewYork, available at: http://160592857366.free.fr/joe/ebooks/tech/Wiley%20Capital%20Budgeting%20Theory%20and%20Practice.pdf.
Pike, R. (1984), “Sophisticated capital budgeting systems and their association with corporateperformance”, Managerial and Decision Economics, Vol. 5, pp. 91-97.
Pike, R. (1988), “An empirical study of the adoption of sophisticated capital budgeting practices anddecision-making effectiveness”, Accounting and Business Research, Vol. 18, pp. 341-351.
Pinches, G. (1982), “Myopia, capital budgeting and decision making”, Financial Management,Vol. 11, pp. 6-19.
Pradeep, B. and Lemay, Q. (2009), “The use of capital budgeting techniques in business: a perspectivefrom the western cape”, The Journal of Applied Business Research, Vol. 25, pp. 37-46.
Proctor, M. and Canada, J. (1992), “Past and present methods of manufacturing investment evaluation:a review of the empirical and theoretical literature”, The Engineering Economist, Vol. 38,pp. 45-58.
Ruhan, A. (1998), “Malaysian capital budgeting methods: survey and analysis”, Annual PACAP/FMAFinance Conference on Asia Pacific Financial Market, Kuala Lumpur.
Sandahl, G. and Sjogren, S. (2003), “Capital budgeting methods among Sweden’s largets groups ofcompanies”, Production Economics, Vol. 84, pp. 51-69.
Satish, V., Sanjeev, G. and Roopali, B. (2009), “A survey of capital budgeting practices in corporateIndia”, The Journal of Business Perspective, Vol. 13, pp. 1-17.
Shao, L. and Alan, S. (1996), “Risk analysis and capital budgeting techniques of U.S. multinationalenterprises”, Managerial Finance, Vol. 22, pp. 41-57.
Singh, S., Jain, P.K. and Yadav, S.S. (2012), “Capital budgeting decisions: evidence from India”, Journalof Advances in Management Research, Vol. 9, pp. 96-112.
PRR
Sulaiman, K. (2007), “Capital investment appraisal practices of quoted firms in Nigeria”, available at:http://ssrn.com/abstract51000075 or doi: 10.2139/ssrn.1000075.
Truong, G., Partington, G. and Peat, M. (2008), “Cost-of-capital estimation and capital-budgetingpractice in Australia”, Australian Journal of Management, Vol. 33, pp. 95-122.
Vadeei, M., Mahmoudi, P. and Saeid, A. (2012), “An analysis and explanation of therelationship between techniques of capital budgeting and the performance of companiesadmitted to Tehran stock exchange”, Journal of Basic and Applied Scientific Research, Vol. 2,pp. 6420-6423.
Van Horne, J., Wachowicz, J., Davis, K., Jr and Lawriwsky, M. (1995), Financial Management and Policyin Australia, 4th ed., Prentice-Hall, Sydney.
Verma, S., Gupta, S. and Batra, R. (2009), “A survey of capital budgeting practices in corporate India”,The Journal of Business Perspective, Vol. 13, pp. 1-17.
Vijay, J. and Ashwani, S.S. (1995), “Capital budgeting practices in corporate Canada”, Journal ofFinancial Management, Vol. 1, pp. 37-43.
Wnuk-Pel, T. (2014), “Capital budgeting practices in non manufacturing firms in Poland”, SocialSciences, Vol. 82, pp. 59-69.
Corresponding authorPratheepkanth Puwanenthiren can be contacted at: [email protected]
For instructions on how to order reprints of this article, please visit our website:www.emeraldgrouppublishing.com/licensing/reprints.htmOr contact us for further details: [email protected]
Capitalbudgeting