
Advertising Budgeting for Industrial Products (A Nontechnical ...
27
THE ADVISOR* PROJECT: Advertising Budgeting for Industrial Products (A Nontechnical Overview) Gary L. Lilien John D. C. Little November 1975 WP 823-75
-
Upload
khangminh22 -
Category
Documents
-
view
0 -
download
0
Transcript of Advertising Budgeting for Industrial Products (A Nontechnical ...
THE ADVISOR* PROJECT:Advertising Budgeting for Industrial Products
(A Nontechnical Overview)
Gary L. LilienJohn D. C. Little
November 1975 WP 823-75
Abstract
Companies selling to industrial and business markets face the problem
of determining how much to spend for various elements in the marketing mix.
Setting budgets for advertising expenditures is especially difficult.
This paper reviews the results of the ADVISOR project, a multi-company
study of current practice in setting advertising budgets for industrial
products. The motivation for the study is that, since information about
advertising's effect on sales is virtually nonexistent for industrial pro-
ducts, managers should tap the collective wisdom of those currently making
advertising budgeting decisions.
Data on products from a number of large industrial companies have
been analyzed to determine those product and market characteristics that
affect advertising budgets as well as how those budgets are allocated across
media. The study has produced new forms of guidelines for industrial pro-
duct managers, both for setting the overall advertising budget and for divid-
ing it among media. In addition, new insight into the budgeting process is
gained by studying the process in two steps: setting an overall marketing
budget and determining advertising's percentage of that budget.
1. Overview
We recently asked a product manager at a large manufacturing company,
"How much do you spend in advertising your top-of-the-line filter pumps?
"Five percent of sales," he replied.
"Why 5%?" we asked.
"Because 5% is what we have been spending and I'd have to explain 4%
or 6% to my management!"
Realistic? Certainly. But satisfactory? Not really.
The ADVISOR* project, a joint ANA-MIT study of industrial advertising,
has produced a new form of advertising budget guideline for industrial
product managers. The data needed to produce the guideline are a few pieces
of information about the product and its market. The guideline draws upon
marketers' experience as evidenced by their decisions: budgeting behavior
is inferred from a study of a broadly diversified sample of industrial products.
Analysis of the products under study indicates that the most significant
product and market characteristics affecting advertising budgets are
- stage in the life cycle
- purchase frequency
- product quality, uniqueness and company association
- market share
- customer concentration
- growth rate in number of customers.
Deeper study shows that budgeting practice can fruitfully be analyzed as
a two-stage process:
* ADVertising Industrial products: Study of Operating Relationships
-2-
(1) setting the ratio of Marketing/Sales and
(2) setting the ratio of Advertising/Marketing
Together, these two figures determine the Advertising/Sales ratio and form
budget guidelines.
The two-stage view of budgeting clarifies the role of different product
and market characteristics. Stage in life cycle, customer concentration and
market share primarily affect the Marketing/Sales ratio. By contrast, pur-
chase frequency and product uniqueness, quality and company association
primarily affect the Advertising/Marketing ratio. The growth rate in num-
ber of customers affects each slightly. Putting together these separate
effects generates budget norms.
Further analysis of the data shows that product and market charac-
teristics affect the way the advertising budget is split into
the major categories of Space, Direct Mail, Shows, and Promotion (sales
promotions and other minor categories). This split is most strongly
influenced by
- product sales
- customer concentration
- stage in the life cycle
- number of customers
This information is also used to develop norms for communications managers
on the breakdown of the budget into major categories.
-3-
2. Study Background:
The ADVISOR study is an MIT research project coordinated by the Asso-
ciation of National Advertisers and sponsored by 12 ANA member companies.
The objective of the study has been to provide guidance for setting indus-
trial advertising budgets through an empirical study of current practice.
Other studies have indicated that management decision-makers, while not
making "optimal" decisions, on the average are good decision makers (see
Bowman [1] and Kunreuther [2]). Thus a study of empirical practice which
uncovers industry norms is of value to management, because those norms can
be used to create guidelines. Put succinctly, everybody likes to know how
other people are doing things.
A review of current budgeting methods (see Lilien et al. [3]) indi-
cates that there are at least three techniques for allocating communications
expenditures:
1. Guidelines Methods (Rules of Thumb). These include such sugges-
tions as "budget a constant percent of sales," "match competition," etc.
2. "Objectives"(Task) Method. This uses intermediate measures of
effectiveness for evaluating communication programs and establishes
cost constraints for various portions of the total expense. The
Task Method calls for explicit thought about various issues such
as position in the product life cycle, state of the marketing
environment and corporate objectives.
3. Explicit Modeling and/or Experimentation. This approach
relates marketing actions to profit or other objectives via
theory and direct measurement.

-4-
None of these methods have been found to be a miracle cure. Present guide-
line methods fail to answer the hard questions like "What percent of sales?"
or "Why match competition -- what makes us think they're right?" Task
methods introduce intermediate variables but have difficulty relating them
clearly to final measures of effectiveness. Explicit modeling and experimen-
tation are generally expensive.
A review of the published material (Lilien et al. [31) indicates that
(1) industrial advertising and personal selling can perform comple-
mentary and/or synergistic roles;
(2) increasing the share of total selling expense spent on adver-
tising may be associated with lower selling costs relative to
sales; and
(3) economies of scale (regions of expenditure in which additional
increments of advertising yield increasing return) may exist for
industrial advertising.
These phenomena carry major implications for expenditure policy. However,
empirical evidence in this area is presently limited and can only be
regarded as suggestive. The study of the process and effects of industrial
advertising has simply not progressed to the point where it can offer defini-
tive guidance to industrial advertisers faced with specific expenditure deci-
sions.
Current budgeting practice reflects the lack of knowledge about indus-
trial advertising response. Both simple heuristics and the task method pro-
vide a mechanism for controlling advertising spending. However, there are
good reasons to believe that these methods can lead to inappropriate spending
levels.
-5-
In light of this lack of quantitative guidance from the literature,
ADVISOR infers budgeting norms from practice. The objective is to relate
budgeting practice to product/market and environmental characteristics.
But which characteristics? A review of advertising literature yielded a
list of variables to start with including stage in the life cycle, product
uniqueness, frequency of purchase,-etc.
This initial set of characteristics was augmented by a series of un-
structured interviews with product and advertising managers at some of the
participating companies. The interview formats were basically similar: the
product manager was asked to think of a product with a "high" ad budget and
to describe its market and competitive situation. Then he was asked to con-
sider a product with a low advertising budget and repeat the procedure. This
procedure, repeated with 10-15 product managers in 5 companies, isolated a set
of key characteristics which formed the basis for the first draft of a ques-
tionnaire that finally included about 190 separate pieces of information in
46 questions.
Each participating company was asked to complete as many questionnaires
(one for each product) as possible. A product is the physical item or set
of items that is used as the basis for completing the questionnaire. Companies
were given considerable flexibility in the definition of a product; the
definition chosen in a specific instance was to be one which had operational
meaning for financial and planning purposes in that organization.
Judgmental answers or answers with some tolerance (say + 10%) were
acceptable. This answer-tolerance fits into the project's objectives:
since the goal is to relate advertising budgets to product/market environ-
mental characteristics, the decision-maker's perceptions of characteristics
-6-
are the determining factors in the budget decisions. If a manager thinks
he has 1000 potential customers, he will advertise accordingly even if he
really has 10,000 potential customers.
A total of 65 completed questionnaires were returned by the partici-
pating companies. The data were carefully screened for consistency and
cross-checked with the companies before processing.
A statistical analysis of these data yielded the following:
a. The relationships of questionnaire variables indicates that
Advertising/Sales may be modeled as the joint effect of
Advertising/Marketing and Marketing/Sales.
b. The independent variables that are closely related to the dependent
variable ratios listed in (a) above fall into the following
general categories.
1. Stage in the Life Cycle
2. Product perception
3. Growth rate
4. Frequency, quantity purchased
5. Buyer concentration
6. Company position, market share
7. Plant utilization
8. Price, margin
-7-
3. Guidelines for Setting the Advertising Budget
A review of the unstructured interviews held with advertising managers
revealed the following kinds of explanations for certain high advertising
budgets: "The product is early in its life cycle ... it has a large number
of customers... we have much unused plant capacity ... etc." The specific,
quantitative values (say, 12,800 customers) associated with these High-Low
or Large-Small breaks never were mentioned.
If advertising managers make decisions on perceptions like High vs. Low
in a particular variable category, then such two-level or dichotomous variables
should be included in models of that budgeting process. Such a decision process
also suggests that the output-norms should perhaps be in a High vs. Low or a
High, Medium, Low form.
How should High and Low categories be constructed? In some cases the
answer is unambiguous -- Stages 1 and 2 of the life cycle are "Early", 3 and
4 are "Late". In most cases, no such logical break-point exists and the sample
medians from the questionnaire data were used.
The above discussion outlines a conceptual framework for the budgeting
process. In this framework, the decision-maker is considered to have a check-
list of product/market characteristics relevant to the budget decision. The
values of the characteristics are known only roughly (High vs. Low, e.g.).
The decision-maker then considers these characteristics one at a time, with
the value of each characteristic adding or subtracting some value from the
final budget score.
The guidance that the budgeter gets from the checklist is not a given
budget amount but rather a range of amounts. He may be told that the advertising

-8-
budget for this particular product should be low (< 1/3% of sales, e.g.) to
be consistent with industry norms. Figure 1 illustrates the procedure con-
ceptually. One takes a particular product through the checklist and gets
guidance on whether the product's advertising budget should be High, Medium
or Low.
Factor Level
Life Cycle I Hi (Lo)
Ad Budget
v n, -L
Plant Capacity I Hi (Lo) ) · ....... Medium
T LowVumDer oU Hi (LoCustomers
FIGURE 1: Conceptual Framework of the Budgeting Process
A modification of the above framework, suggested by analysis of the ques-
tionnaire data, would be to consider the process as having two steps:
(1) Set an overall marketing budget where marketing here refers to
advertising and personal selling, primarily. This might be done
as a fraction of sales (Marketing/Sales).
(2) Decide what fraction of that marketing budget is to be allocated
to advertising (Advertising/Marketing).
The advertising budget could then be viewed as
Advertising = Advertising MarketingMarketing Sales x Sales.
Ii
'�x���'"I-�"^�I^---�~-"--"-�II------���
1
.. _ . . . , _
,kT- __ 1- - - - C I
YI �···
-9-
The valuable aspect of viewing this process as a two step procedure is
that some variables are associated with Advertising/Marketing, others with
Marketing/Sales, still others with both. Separating the procedure into two
parts allows insight into the determinants of the separate processes where
a single step process may mask important information.
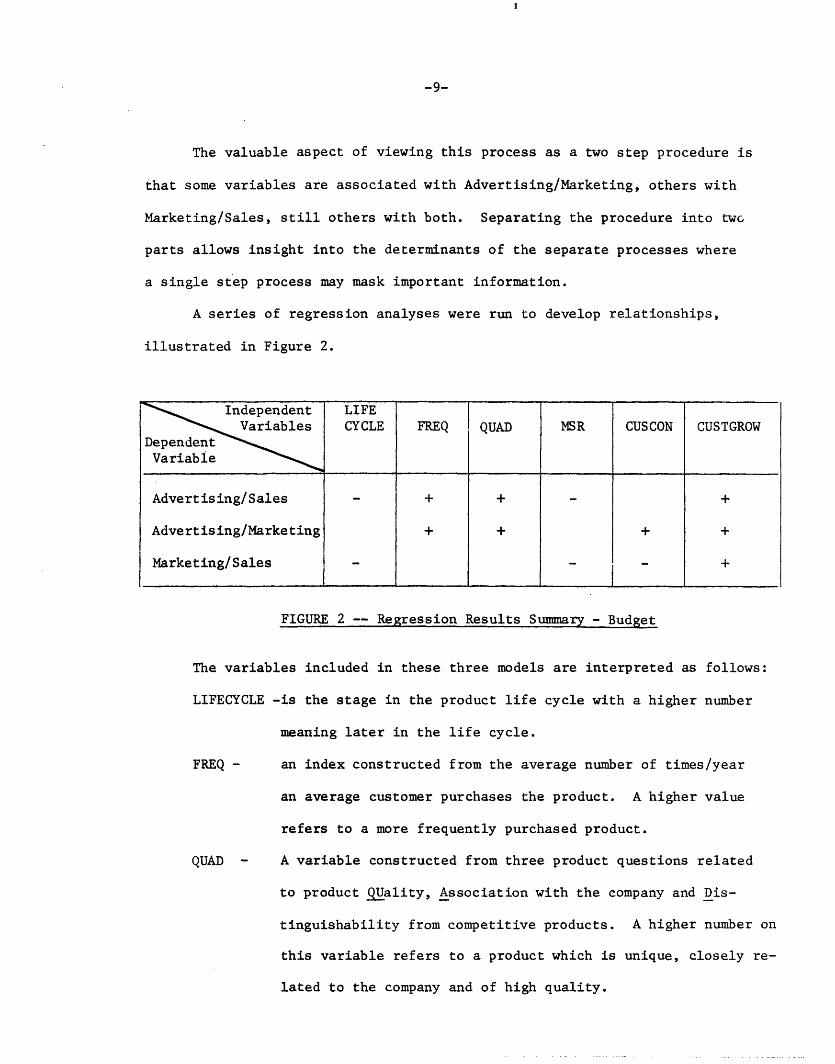
A series of regression analyses were run to develop relationships,
illustrated in Figure 2.
FIGURE 2 -- Regression Results Summary - Budget
The variables included in these three models are interpreted as follows:
LIFECYCLE -is the stage in the product life cycle with a higher number
meaning later in the life cycle.
FREQ - an index constructed from the average number of times/year
an average customer purchases the product. A higher value
refers to a more frequently purchased product.
QUAD - A variable constructed from three product questions related
to product QUality, Association with the company and Dis-
tinguishability from competitive products. A higher number on
this variable refers to a product which is unique, closely re-
lated to the company and of high quality.
Independent LIFEVariables CYCLE FREQ QUAD MSR CUSCON CUSTGROW
DependentVariable
Advertising/Sales - + + - +
Advertising/Marketing + + + +
Marketing/Sales -- - - +
____________________________________________ _______________ ________________- ,________________ ______________________
-10-
MSR - Product market share. Higher number here is a high mnarket
share.
CUSCON - An index of customer concentration. A higher number here
occurs if a large fraction of product sales go to the three
largest customers.
CUSTGROW - Rate of growth in the number of company customers for the
product. Higher values occur when there are many more cus-
tomers in 1973 than in 1972.
To interpret the relationships in Figure 2, consider the rows of that
figure one at a time. For Advertising/Sales:
(1) The earlier in the life cycle, the larger Advertising/Sales (A/S).
(2) The more frequent the purchase, the larger A/S.
(3) The greater the product-company association, the larger A/S.
(4) The smaller the market share, the larger A/S.
(5) The higher the growth rate, the larger A/S.
For Advertising/Marketing:
(1) The greater the purchase frequency, the larger Advertising/
Marketing (A/M).
(2) The closer the product-company association, the larger A/M.
(3) The greater the customer concentration, the larger A/M.
(4) The greater the customer growth rate, the greater A/M.
For Marketing/Sales:
(1) the earlier in the life cycle, the larger Marketing/Sales (M/S).
(2) The smaller the market share, the greater M/S .
(3) The lower the customer concentration, the greater M/S.
(4) The greater the customer growth rate, the greater M/S.
I I��__�__..

-11-
Now consider the independent variables in Figure 2 one at a time.
Stage in the life cycle is related in the same way to Advertising/Sales
and Marketing/Sales.
Purchase frequency affects Advertising/Sales by affecting
the Advertising/Marketing ratio, not Marketing/Sales.
Product-company association affects Advertising/Sales in the same
way as purchase frequency.
Market share is associated with the Advertising/Sales ratio through the
Marketing/Sales ratio, not the Advertising/Marketing ratio.
Customer concentration does not affect the Advertising/Sales ratio.
However, there is a negative relationship between customer concentration and
the Marketing/Sales ratio and a positive, counteracting relationship between
customer concentration and the Advertising/Marketing ratio.
Customer Growth Rate is positively related to all three ratios.
Thus, most independent variables related to A/S seem to be highly related
to either A/M or M/S, supporting the contention that modeling the A/S bucgeting
procedure in two stages makes sense.
Variables that are missing, here, in the sense that contemporary marketing
wisdom suggests they should be included in a relationship but which do not emerge
statistically include:
- margin
- plant utilization
- user perception of price
- industry profitability
- number of competitors
III

-12-
- number of deciders/company
- directness of distribution channels
The non-inclusion of these variables could be due to one of several reasons --
(a) they are in fact associated but not strongly enough to show up; (b) their
effects are accounted for in combinations of other variables or (c) decision
makers do not in fact consider these variables. Further study on a larger
sample would be needed to give insight into these issues.
The sample was broken down into three groups of equal size according
to the empirical A/S ratios and the groups were labeled High, Medium and Low.
The model equations were used to predict (given the values of the independent
variables) what the advertising to sales would be. The two-step procedure
(using the A/M and M/S equations) did a bit better than the single equation in
predicting the correct group 56% of the time. (A random classification would
be expected to accurately classify 33% of the sample). Thus, given values
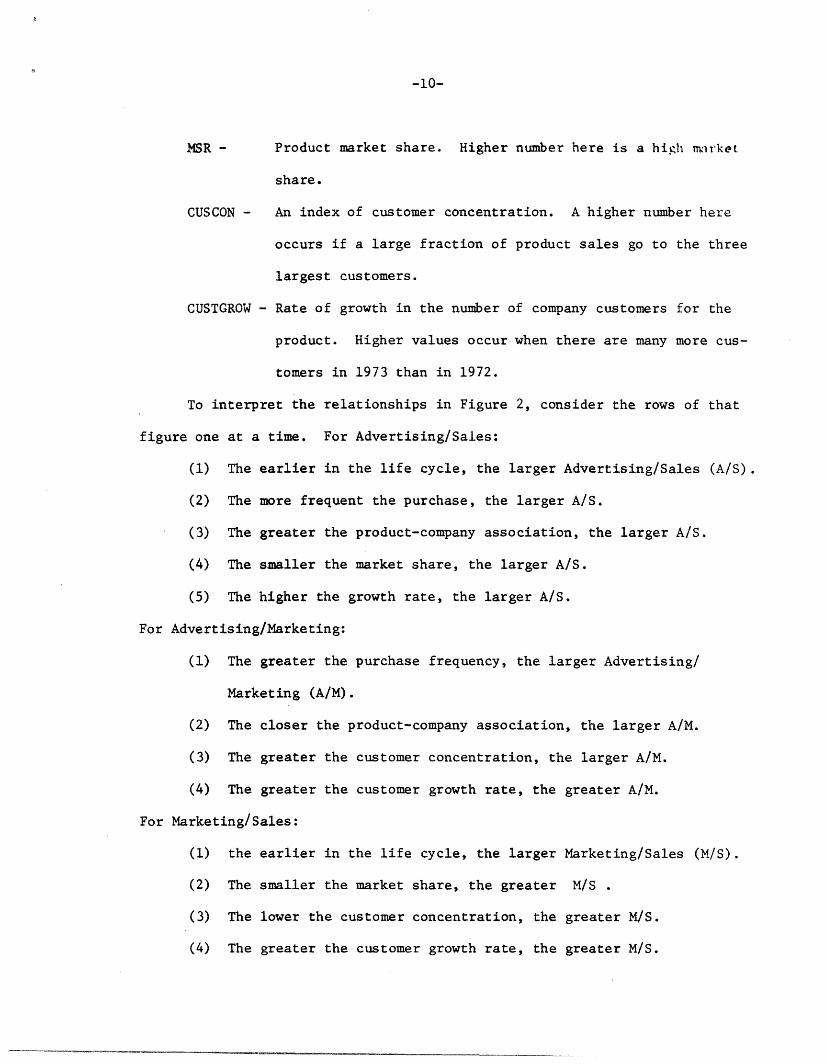
of the independent variables in Figure 2, industry norms have been developed
to suggest a High, Medium or Low advertising budget (relative to sales) for
the product. Figure 3 gives a conceptual illustration of the role the model
can play in the budgeting decision process.
1�� _�_^_____�_1_1____1�_�_
III
-13-
Factor
I Life Cycle
PurchaseFrequency
I Association I
Market Share
Level Ad Budge
i Hi (Lo)
Hi (Lo
) Hi (Lo
(Lo
"-->------ Medium
Low
\ Hi (Lo
Hi (Lo
FIGURE 3: ADVISOR's Role In The Decision Process
ADVISOR
CustomerConcentration
CustomerGrowth Rate
- . _
J Hi
-14-
4. Guidelines for Allocating the Advertising Budget
The results of the previous section provide guidelines to aid in the
development of an overall advertising budget. The next decision is how to
allocate those budget dollars to media. The analysis presented here suggests
a breakdown into four categories:
Space = Trade, Technical press and House Journals
Direct Mail = Leaflets, brochures, catalogues and other direct mailpieces
Shows = Trade Shows plus industrial films
Promo = Sales promotion and other miscellaneous categories suchas T.V., radio, and press releases
How should this breakdown be made? The logic of Figure 1 in the previous
section holds here as well: The decision maker is viewed as having a checklist
of characteristics (dollar sales, number of customers, etc.) known only roughly
(High vs. Low) and he considers these characteristics one at a time, with the
value of each characteristic adding or subtracting from a final budget score.
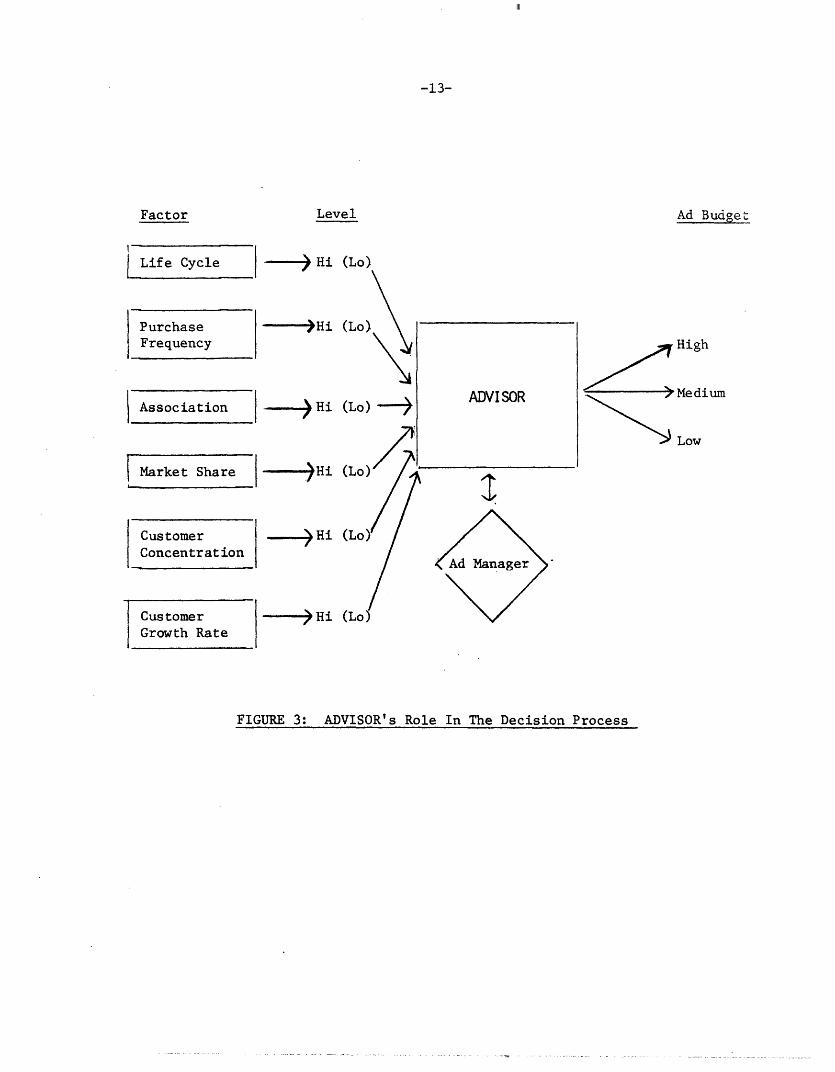
Figure 4 summarizes the results of a series of regression analyses which
produced a set of four equations, one for each media category.
SIZE LIFECYCLE CUSCON NUMBER
SPACE
SHOWS
PROMO
FIGURE 4 -- Regression Results Summary - Allocation
- + I_
+ - J +

-15-
The variables included in the models are:
SIZE - a variable indicating dollar product sales. High valuesof this variable indicate high dollar sales.
LIFECYCLE - Stage in the product life cycle with a high number meaninglater in the life cycle.
CUSCON - An index of customer concentration. A higher number hereoccurs if a large fraction of product sales go to the threelargest customers.
NUMBER - Variable indicating number of customers for the product.High on this variable means many customers.
Let us summarize the results of the analysis in words below and offer
some possible interpretations.
SPACE: The fraction of the budget allocated to SPACE is related only
to the dollar sales of the product. As dollar sales go up,
fraction in SPACE goes down. This is also the poorest of the
equations, a possible indication that SPACE is a relatively
fixed fraction of most budgets, not easily affected by product/
market characteristics.
SHOWS: The larger the dollar sales, the more spent on SHOWS. Similarly,
the less concentrated the sales to large customers (more custo-
mers, effectively) the more spent on SHOWS. There is also a
relationship (too weak to include in the model) with purchase
frequency -- the less frequent the average purchase, the more
is spent on SHOWS.
MAIL: The larger the dollar sales of the product, the smaller the frac-
tion spent on MAIL (due to a saturation effect, perhaps). Products
late in the life cycle spend proportionally more on MAIL (custo-
mers are likely to be better known; few new customers are sought).

-16-
The more customers the lower the fraction spent on MAIL (Mail
becomes inefficient when the number of customers is large).
PROMO: The larger are dollar sales, the more is spent on sales promo-
tion and other media (this could be due to saturation in the
SPACE category). The earlier in the life cycle, the more is
spent on PROMO (More sales promotion is likely in the product
introduction stage). The higher the degree of customer concen-
tration the more is spent on PROMD.
(Note that CUSCON and NUMBER are almost different views of the same
phenomenon and, hence, are not included in the same model).
In the same way as in the previous section, for each of the equations
above the sample was broken down into High, Medium and Low categories to
test the predictive ability of the models. The fraction properly classified
ranged from 55% to 74%, compared with an expected random classification
accuracy (given three groups) of 33%. Thus, given data about the variables
included in Figure 3, guidance or norms can be generated for the ad manager
who wishes to allocate his budget across media.

-17-
5. Use of the Results
The results of the ADVISOR project can be used in a variety of ways
to audit and support budget decisions. A review of the sample of products
studied showed that 58% of the product-budgets were within guideline limits.
The remaining 42%, outside of guideline limits, suggest the need for deeper
product analysis.
An interactive computer program on time-sharing has been developed
for the project participants. The program allows operation of the model in
the user's office via a remote terminal. The program asks the user rele-
vant questions from the project questionnaire and then prints back the
budgeting and allocation guidelines determined by the model.
The program and the model are used in several ways. Currently the
most frequent use, as a tool for Managerial Control, is outlined in Figure
5. Here characteristics for an existing product are collected and input
to the program via a remote terminal. The program feeds back budgeting
guidelines which are then compared with the actual budget. If the guide-
lines agree with the budget, no further analysis is performed. If they
disagree, reasons for the differences are sought. If special situations
exist specific to the product or company, then, again, no further review
is indicated. If no such conditions are found, either the product budget
is modified or a special product audit is undertaken. In this mode of use,
the model acts as a control procedure for exception analysis -- to find
those product cases most in need of more detailed review.

-18-
PRODUCTCHARACTERISTICS
ADVERTISINGGUIDELINES
OMPABUDGET + WITH AGREE
As~~ ~UDGE
DISAGREE+-
MODIFY BUDGETor
INITIATE AUDIT
1
Mode of Use 1 -- Managerial Control for an Existing Product
A case summary of such use follows.
A product called BRITEBOLT (ficticious name) has $10,000,000 in sales,
and an advertising budget of $160,000. It has the following product/market
characteristics.
Characteristic
LIFECYCLEFREQ (Mean Purchase Frequency)QUAD (Association Index)MSR (Market share)CUSCON (Customer Concentration)CUSGROW (Customer Growth Rate)
Level
EARLY3 times/year (HIGH).6 (HIGH).13 (LOW).20 (LOW).0 (LOW)
The model generates the following budgeting norms (as well as other
output on allocation):
SPECIALFACTORSPRESENT?
FIGURE 5:
II
.
.
- - -
-19-
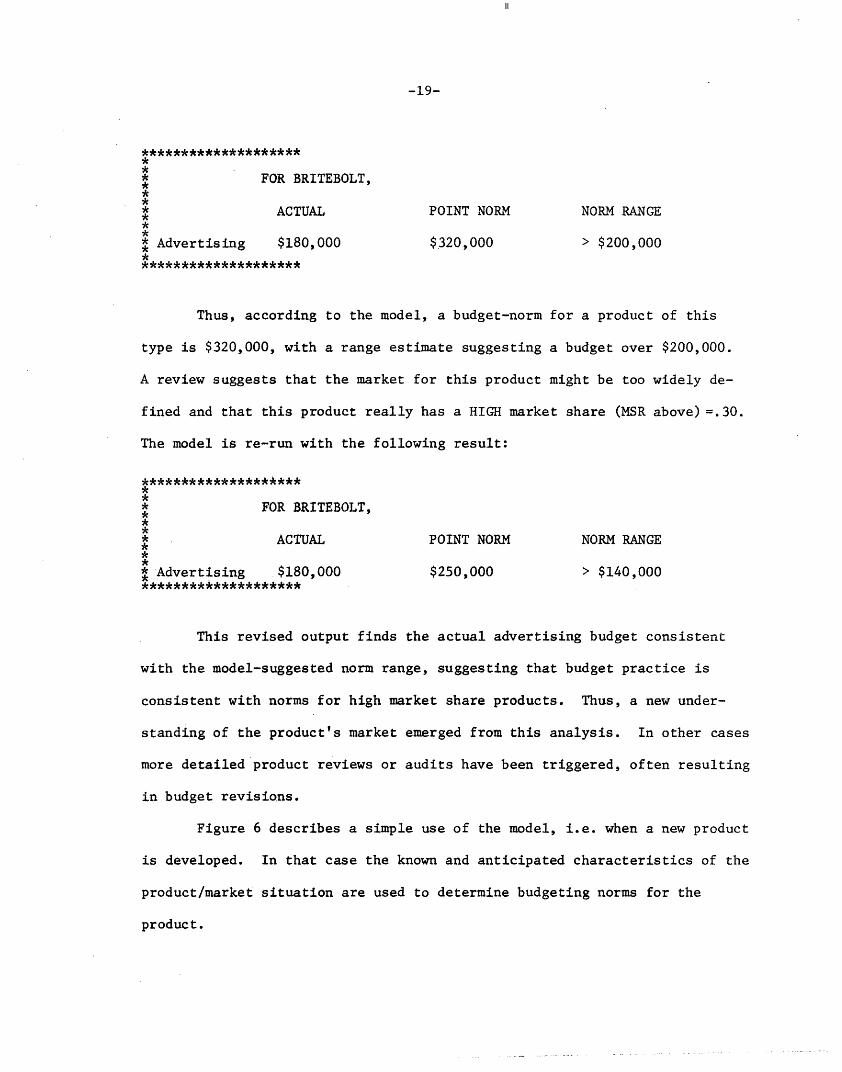
FOR BRITEBOLT,
ACTUAL POINT NORM NORM RANGE
* Advertising $180,000 $320,000 > $200,000
********************
Thus, according to the model, a budget-norm for a product of this
type is $320,000, with a range estimate suggesting a budget over $200,000.
A review suggests that the market for this product might be too widely de-
fined and that this product really has a HIGH market share (MSR above) =.30.
The model is re-run with the following result:
FOR BRITEBOLT,
* ACTUAL POINT NORM NORM RANGE
* Advertising $180,000 $250,000 > $140,000* *******************
This revised output finds the actual advertising budget consistent
with the model-suggested norm range, suggesting that budget practice is
consistent with norms for high market share products. Thus, a new under-
standing of the product's market emerged from this analysis. In other cases
more detailed product reviews or audits have been triggered, often resulting
in budget revisions.
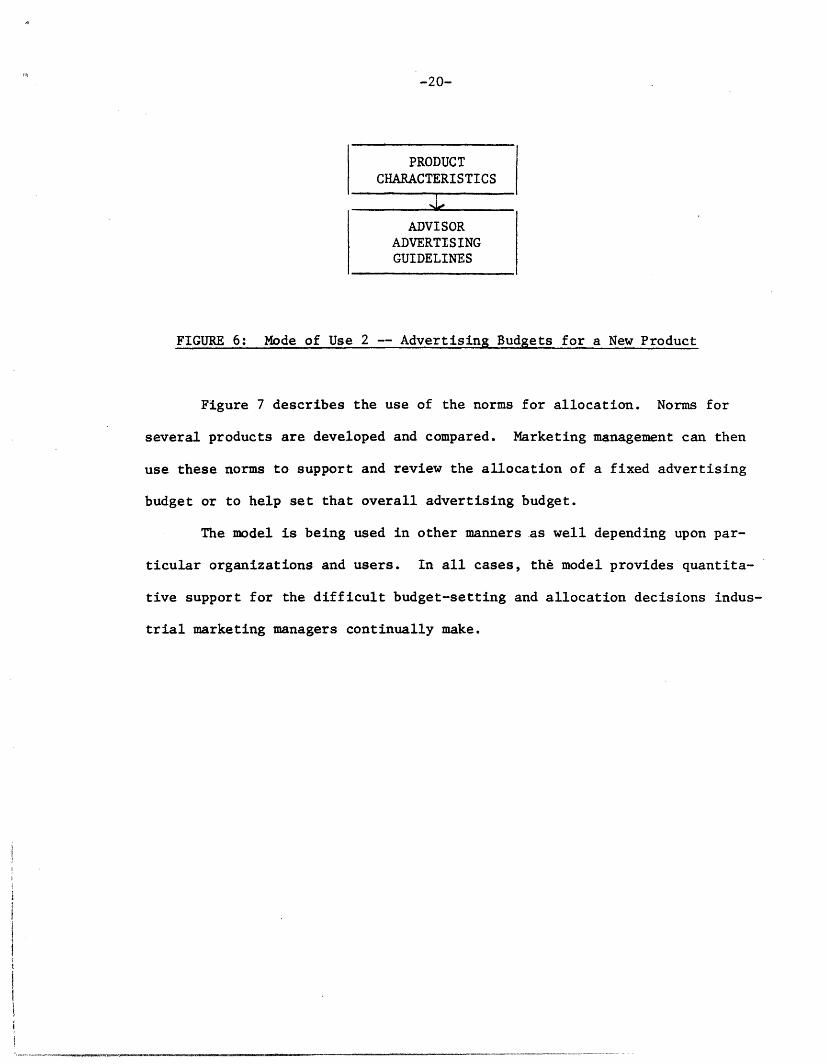
Figure 6 describes a simple use of the model, i.e. when a new product
is developed. In that case the known and anticipated characteristics of the
product/market situation are used to determine budgeting norms for the
product.
III
-20-
PRODUCTCHARACTERISTICS
1,,
FIGURE 6: Mode of Use 2 -- Advertising Budgets for a New Product
Figure 7 describes the use of the norms for allocation. Norms for
several products are developed and compared. Marketing management can then
use these norms to support and review the allocation of a fixed advertising
budget or to help set that overall advertising budget.
The model is being used in other manners as well depending upon par-
ticular organizations and users. In all cases, the model provides quantita-
tive support for the difficult budget-setting and allocation decisions indus-
trial marketing managers continually make.
ADVISORADVERTISINGGUIDELINES
.�-.I�� -----------

-21-
.4
REVIEW
YES
FINISH
FIGURE 7: Mode of Use 3 - Allocation of Fixed Budget Across Product
III

-22-
6. Are the Effects Real?
The ADVISOR study breaks new ground as the first extensive cross-
sectional study of how product and market characteristics affect advertising
budgeting practice. It is important, therefore, that potential users under-
stand both the advantages and limitations of the research.
It is necessary to distinguish between the reality of an effect and
the accuracy of its measurement. When you strain to see the details of a
snowy TV picture, there is no doubt in your mind that the station is trans-
mitting but you may have considerable doubt about what you are receiving.
Similarly, most of the advertising managers involved in the ADVISOR
study believe that the major variables in the above models do, in fact,
affect the advertising budget decision in an aggregate industry-average
way. However, in their personal experience with a limited number of products,
they would be hard pressed to say which variable had how much effect.
The ADVISOR results improve this situation substantially. Certainly
they confirm the original hypothesis that product and market characteristics
affect advertising budgets. Furthermore the direction of the causality is
clear for most of the variables because of their inherent nature. Thus,
advertising cannot cause a product's stage-in-life-cycle and would not be
expected-to affect its frequency of purchase in any substantial way. In-
stead, stage-in-life-cycle and frequency of purchase affect advertising
budgets.
Besides confirming the basic presumption of the study, the ADVISOR
results place magnitudes and ranges on the effects of key variables. This
is obviously new knowledge. The accuracy of the measurement varies from
_�_··*-·s�-Ll(lli�·lI�ICI-·--_^l_ �-- I__�_____XC--^I�__l��---�
-23-
case to case and is limited by the sample size that the study was able to
achieve. Nevertheless the results are what they were intended to be: play-
backs of business practice which identify significant effects and which can
be used as norms and guidelines by industrial marketing communications
managers.
Another important point in understanding the results is the difference
between the accuracy of measuring an effect and accuracy of prediction. If
the study had contained a hundred times again as many products, we would
have had dramatically better measurements of the contributions of specific
variables to the A/S ratio (about 10 times more accurate). Almost certainly,
a number of variables not now statistically significant would be success-
fully measured. These would be variables whose contributions are small
and are now swamped out by measurement variance.
On the other hand a dramatically larger sample would probably not
increase very much our predictive accuracy for individual A/S ratios. This
is because there are extraneous factors affecting the A/S ratio (e.g.,
specific budget pressures in companies at particular points in time).
Special local factors will not be accounted for by any set of variables
that can reasonably be included in such a study. The situation is analogous
to determining the mean height of U.S. males. Increasing a sample from
100 to 10,000 would increase the accuracy of measuring the mean greatly
but would not improve the mean as a predictor of a given person's height.
In summary, therefore, we say, yes, real effects have been measured.
The measurements vary in accuracy and must be interpreted in the context of
the data base and the analysis, but they represent substantive new knowledge
about setting of industrial advertising budgets.
-24-
7. Further Work
The ADVISOR study breaks new ground in providing empirical support for
industrial marketing decision-making. There is no claim that these results
are a "final answer." The data base was small as was the number
of companies. In addition, no study of practice can develop results which
can unambiguously be adopted for use -- users must be convinced that industry's
collective wisdom is valid for their particular problems.
Thus, there are several alternatives for further work in this area.
One would be to extend the number of companies and the data base to test and
improve the models developed. Many of the results would be more definitive
if verified on a larger sample.
Another direction for future work is to explicitly study what industrial
marketers should do, even if they are not now doing it. Fewer products would
be used in such a study, but much more detailed analysis would be performed.
Time series data would be collected, alleviating some cause and effect diffi-
culties always present in purely cross-sectional analyses. Some experimenta-
tion, either of the controlled or natural variety, would help lead to stronger
results.
Both of the above research directions are now being followed in a
follow-up study, which promises even deeper insight into the budgeting
process and more powerful results for industrial marketing management.
��� I �------
-25-
References
1. Bowman, E. H. "Consistency and Optimality in Managerial DecisionMaking," Management Science, Vol. 9 (January 1963), pp. 310-321.
2. Kunreuther, Howard. "Extensions of Bowman's Theory of ManagerialDecision-Making," Management Science, Vol. 15 (April 1969), pp.B-415-439.
3. Lilien, G.L., A.J. Silk, J-M Choffray and M. Rao, "Industrial Adver-tising Effects and Budgeting Practices: A Review," Journal ofMarketing, (January 1976), forthcoming.
III