An Introduction to Comparative Budgeting - JBLearning
18
An Introduction to Comparative Budgeting Charles E. Menifield I n order to completely understand the nature and culture of a country, it is neces- sary to understand the budgeting process. This process not only reveals national policy choices, but it also provides evidence of governance. Hence, as the world becomes more global, it is necessary and feasible to examine how countries engage in the budgeting process from a comparative perspective. In fact, one only needs to look at the changes in Europe and the establishment of the European Union in order to get a glimpse of the changing nature of budgeting at the national level. It is through changes like this that nations learn from the successes and failures of other countries. However, examining budgeting processes throughout the globe is not an easy task given the vast array of cultures, governments, social structures, and economic conditions in the world. Nonetheless, the authors of the various chapters in this text went about the task of describing the budgeting process in a variety of different countries around the globe. Originally, this book was poised to simply fill a gap in the literature examining budgeting at the national level from a comparative perspective. Hence, the following question was posed: How does public budgeting occur in other countries and can we learn from their successes and failures? In so doing, the authors were initially given a specific set of factors to examine with a bit of latitude to focus on a policy area or other important reform(s) that significantly impacted the budgeting process in the Chapter © Jones & Bartlett Learning, LLC. NOT FOR SALE OR DISTRIBUTION.
-
Upload
khangminh22 -
Category
Documents
-
view
2 -
download
0
Transcript of An Introduction to Comparative Budgeting - JBLearning

�
An Introduction to Comparative Budgeting
Charles E. Menifield
In order to completely understand the nature and culture of a country, it is neces-sary to understand the budgeting process. This process not only reveals national policy choices, but it also provides evidence of governance. Hence, as the world
becomes more global, it is necessary and feasible to examine how countries engage in the budgeting process from a comparative perspective. In fact, one only needs to look at the changes in Europe and the establishment of the European Union in order to get a glimpse of the changing nature of budgeting at the national level. It is through changes like this that nations learn from the successes and failures of other countries. However, examining budgeting processes throughout the globe is not an easy task given the vast array of cultures, governments, social structures, and economic conditions in the world. Nonetheless, the authors of the various chapters in this text went about the task of describing the budgeting process in a variety of different countries around the globe.
Originally, this book was poised to simply fill a gap in the literature examining budgeting at the national level from a comparative perspective. Hence, the following question was posed: How does public budgeting occur in other countries and can we learn from their successes and failures? In so doing, the authors were initially given a specific set of factors to examine with a bit of latitude to focus on a policy area or other important reform(s) that significantly impacted the budgeting process in the
Chapter�
© Jones & Bartlett Learning, LLC. NOT FOR SALE OR DISTRIBUTION.
© Jones & Bartlett Learning, LLCNOT FOR SALE OR DISTRIBUTION
© Jones & Bartlett Learning, LLCNOT FOR SALE OR DISTRIBUTION
© Jones & Bartlett Learning, LLCNOT FOR SALE OR DISTRIBUTION
© Jones & Bartlett Learning, LLCNOT FOR SALE OR DISTRIBUTION
© Jones & Bartlett Learning, LLCNOT FOR SALE OR DISTRIBUTION
© Jones & Bartlett Learning, LLCNOT FOR SALE OR DISTRIBUTION
© Jones & Bartlett Learning, LLCNOT FOR SALE OR DISTRIBUTION
© Jones & Bartlett Learning, LLCNOT FOR SALE OR DISTRIBUTION
© Jones & Bartlett Learning, LLCNOT FOR SALE OR DISTRIBUTION
© Jones & Bartlett Learning, LLCNOT FOR SALE OR DISTRIBUTION
© Jones & Bartlett Learning, LLCNOT FOR SALE OR DISTRIBUTION
© Jones & Bartlett Learning, LLCNOT FOR SALE OR DISTRIBUTION
© Jones & Bartlett Learning, LLCNOT FOR SALE OR DISTRIBUTION
© Jones & Bartlett Learning, LLCNOT FOR SALE OR DISTRIBUTION
© Jones & Bartlett Learning, LLCNOT FOR SALE OR DISTRIBUTION
© Jones & Bartlett Learning, LLCNOT FOR SALE OR DISTRIBUTION
© Jones & Bartlett Learning, LLCNOT FOR SALE OR DISTRIBUTION
© Jones & Bartlett Learning, LLCNOT FOR SALE OR DISTRIBUTION
© Jones & Bartlett Learning, LLCNOT FOR SALE OR DISTRIBUTION
© Jones & Bartlett Learning, LLCNOT FOR SALE OR DISTRIBUTION

� | Chapter � An Introduction to Comparative Budgeting
country of interest. The results of their analysis, however, were much more revealing than expected. Analyses of the individual chapters show that there is a great disparity among many countries in terms of pressing issues as well as their budgeting processes. Many countries were found to be very progressive and existing on the cutting edge of budgeting and financial management techniques, while other countries continue to struggle with overt corruption, poor institutional structures, poor (and limited) rev-enue streams, and other factors that prohibit economic and social advancement.
Framing Comparative Budgeting
Understanding the political and social structure of a country requires an understanding of the budgeting process. Axelrod (1995) refers to it as the “nerve center of government” (p. 1). From one perspective, a budget provides insight into spending on education, health care, social programs, military spending, and a variety of other priorities. Another perspec-tive indicates who will pay for these expenditures. An examination of a budget can also reveal how countries plan, control, and improve accountability in their country.
Over time, the budgeting process has changed dramatically around the world and these changes make it fairly difficult to study. However, we developed and grounded our analysis on two pivotal pieces of research. First, we examine a comparative bud-geting model developed by Wildavsky (1975). Second, we focus our attention on a more modern budget decision-making model by Rubin (2010).
WILDAVSKY’S MODEL
Wildavsky (1975) argues that in order to understand the budgeting process of a country, you must first determine the resources available to a country and the level of predict-ability in the budget process. Only after comprehending these two variables is it feasible to examine other factors. Thus, his foundational model is based on four possible outcomes that focus on the level of wealth (rich or poor) in a country and the degree of predictability (certain or uncertain) in the budgeting process.1 In the model, he asserts that, “rich and certain environments lead to incremental budgeting; poverty and predictability gen-erate revenue budgeting; unpredictability combined with poverty generates repetitive budgeting; and riches plus uncertainty produce alternating incremental and repetitive budgeting” or supplemental budgeting (p. 12). Therefore, he expects countries such as the United States and the United Kingdom to produce incremental budgets while countries like Thailand and Ghana are expected to engage in repetitive budgeting. That is, given the lack of resources, government officials in poorer countries find themselves writing and rewriting the budget throughout the year to address the most pressing needs at the time.
In addition to his Five Budgetary Process Model, Wildavsky (1975) goes on to say that it is necessary to compare wealth, taxes, and politics in a nation in order to fully understand the budgeting process. The variables listed below provide a summary of the factors that he viewed as critical when examining the budgeting process in a country:
n Gross domestic product (GDP),n Per capita income,
© Jones & Bartlett Learning, LLC. NOT FOR SALE OR DISTRIBUTION.
© Jones & Bartlett Learning, LLCNOT FOR SALE OR DISTRIBUTION
© Jones & Bartlett Learning, LLCNOT FOR SALE OR DISTRIBUTION
© Jones & Bartlett Learning, LLCNOT FOR SALE OR DISTRIBUTION
© Jones & Bartlett Learning, LLCNOT FOR SALE OR DISTRIBUTION
© Jones & Bartlett Learning, LLCNOT FOR SALE OR DISTRIBUTION
© Jones & Bartlett Learning, LLCNOT FOR SALE OR DISTRIBUTION
© Jones & Bartlett Learning, LLCNOT FOR SALE OR DISTRIBUTION
© Jones & Bartlett Learning, LLCNOT FOR SALE OR DISTRIBUTION
© Jones & Bartlett Learning, LLCNOT FOR SALE OR DISTRIBUTION
© Jones & Bartlett Learning, LLCNOT FOR SALE OR DISTRIBUTION
© Jones & Bartlett Learning, LLCNOT FOR SALE OR DISTRIBUTION
© Jones & Bartlett Learning, LLCNOT FOR SALE OR DISTRIBUTION
© Jones & Bartlett Learning, LLCNOT FOR SALE OR DISTRIBUTION
© Jones & Bartlett Learning, LLCNOT FOR SALE OR DISTRIBUTION
© Jones & Bartlett Learning, LLCNOT FOR SALE OR DISTRIBUTION
© Jones & Bartlett Learning, LLCNOT FOR SALE OR DISTRIBUTION
© Jones & Bartlett Learning, LLCNOT FOR SALE OR DISTRIBUTION
© Jones & Bartlett Learning, LLCNOT FOR SALE OR DISTRIBUTION
© Jones & Bartlett Learning, LLCNOT FOR SALE OR DISTRIBUTION
© Jones & Bartlett Learning, LLCNOT FOR SALE OR DISTRIBUTION

n Interaction among the various levels of government,n Revenue structure,n Expenditure structure,n Growth ratesn Educational level,n Political structure and volatility in government, andn Political culture.
RUBIN’S MODEL
Although written primarily from a US budgeting perspective, Rubin’s (2010) model is quite applicable in our study because it hones in on key political processes that affect budgeting from formulation to implementation. In her decision-making model, she posits that the budgeting environment affects the process, individual strategies, and outcomes, and the process affects the outcomes.
The model is based on five decision-making clusters with a number of different actors in each cluster. Hence, the politics of each cluster changes as the number of actors change. Therefore, the outcome is affected by the politics associated with each set of actors. The first cluster is the revenue cluster: Technical data are used to determine how much revenue will be available. Important political questions include, “Will taxes be raised or lowered? Will tax breaks be granted, and if so, to whom, and for what purpose?” “Given the scarcity of resources, revenues are sensitive to the environment because changes in the economy influence revenue level and because the perception of public opinion influences the public officials’ willingness to increase taxes” (Rubin, 2010, p. 29).
The budget process is the second cluster and it pertains to how budget decisions will be made. Critical questions include, “Who should participate in the budget delib-erations? Should agency heads have power independent of the central budget office? How much power should the legislature have?” (Rubin, 2010, p. 29). Rubin argues that groups jockey for position as well as for power in order to improve their standing in the budget process and for control over the budget process.
The third cluster is the expenditure cluster: Technical data provide estimates of proposed expenditures. Despite the limited discretionary spending available in a budget, issues such as funding levels of existing programs, who will benefit from these programs, etc., are often the source of much competition and trade offs among competing groups.
The balance cluster addresses the basic question of balancing the budget. That is, “does the budget have to be balanced each year with each year’s revenue or whether borrowing is allowed to balance the budget?” (Rubin, 2010, p. 30). The answers to these questions are political and are important to citizens because they could see an increase in taxes, a decrease in services, or a combination of the two. Other issues include how to reduce and manage deficits.
Rubin’s (2010) last cluster focuses on the politics surrounding budget implemen-tation. Key questions include, “How close should actual expenditures be to the ones planned in the budget? How can one justify variation from the budget plan? Can the
Framing Comparative Budgeting | �
© Jones & Bartlett Learning, LLC. NOT FOR SALE OR DISTRIBUTION.
© Jones & Bartlett Learning, LLCNOT FOR SALE OR DISTRIBUTION
© Jones & Bartlett Learning, LLCNOT FOR SALE OR DISTRIBUTION
© Jones & Bartlett Learning, LLCNOT FOR SALE OR DISTRIBUTION
© Jones & Bartlett Learning, LLCNOT FOR SALE OR DISTRIBUTION
© Jones & Bartlett Learning, LLCNOT FOR SALE OR DISTRIBUTION
© Jones & Bartlett Learning, LLCNOT FOR SALE OR DISTRIBUTION
© Jones & Bartlett Learning, LLCNOT FOR SALE OR DISTRIBUTION
© Jones & Bartlett Learning, LLCNOT FOR SALE OR DISTRIBUTION
© Jones & Bartlett Learning, LLCNOT FOR SALE OR DISTRIBUTION
© Jones & Bartlett Learning, LLCNOT FOR SALE OR DISTRIBUTION
© Jones & Bartlett Learning, LLCNOT FOR SALE OR DISTRIBUTION
© Jones & Bartlett Learning, LLCNOT FOR SALE OR DISTRIBUTION
© Jones & Bartlett Learning, LLCNOT FOR SALE OR DISTRIBUTION
© Jones & Bartlett Learning, LLCNOT FOR SALE OR DISTRIBUTION
© Jones & Bartlett Learning, LLCNOT FOR SALE OR DISTRIBUTION
© Jones & Bartlett Learning, LLCNOT FOR SALE OR DISTRIBUTION
© Jones & Bartlett Learning, LLCNOT FOR SALE OR DISTRIBUTION
© Jones & Bartlett Learning, LLCNOT FOR SALE OR DISTRIBUTION
© Jones & Bartlett Learning, LLCNOT FOR SALE OR DISTRIBUTION
© Jones & Bartlett Learning, LLCNOT FOR SALE OR DISTRIBUTION

� | Chapter � An Introduction to Comparative Budgeting
budget be remade after it is approved?” (p. 31). Rubin notes that the issue here is implementing the budget as it was written and making changes during the budget year because of changes in the environment.
Rubin’s (2010) work really provides us a nice model to work from because the questions that she posits in each cluster really delves into the real issues that we face when comparing budget processes among nations. She notes, by focusing on budgetary actors (microbudgeting), you limit the opportunity for more exploratory analysis of top-down systemic perspectives (macrobudgeting). Many of the countries that we examine are so different that it is difficult to simply compare them by just looking at factors. These and other questions that she has posed allow us to expand our framework by examining the political environment of budget processes.
APPLYING THESE FRAMEWORKS IN A COMPARATIVE SETTING
As noted previously, Wildavsky’s (1975) and Rubin’s (2010) works serve as the point of departure for our analysis and one does not have to look very far to see the saliency of their models. For example, in Chapter 2, Maher refers to an extensive report by the World Bank that examined financial management in Ghana. One of the find-ings considered predictability and control in budget execution. More specifically, the report indicated weaknesses in Ghana’s management and oversight of control systems. Wildavsky (1975) would argue that management and oversight of control systems in Ghana are tied to the poorly functioning political institutions and revenue structures. Similarly, Bailey and McCabe, in Chapter 10, found that the budget process in the United Kingdom has remained quite predictable despite numerous reforms that have taken place over the last 3 decades. As a result, the budget process remains incremental in nature. Again, Wildavsky would argue that this behavior is a by-product of a rich nation with predictable budget processes.
The authors of the 18 country-specific chapters (Ghana, China, Korea, Philippines, Taiwan, Thailand, Vietnam, Italy, United Kingdom, Iraq, Jordan, Pakistan, Saudi Arabia, United Arab Emirates [UAE], Canada, Mexico, United States, and Brazil) were charged with describing the budgeting process in their respective countries as well as discussing recent reforms that affect the budgeting process. Beyond the descriptive information, several prominent themes and factors are discussed. They include an examination of:
n Transparency in the budget process,n Improving accountability in the budget process,n Reforming the budget and financial management systems,n Managing stable revenue streams,n Reforming the accounting systems,n Strong institutional structures with clearly delineated roles,n Financial dependence on other countries,n GDP,n Decentralization,n Performance budgeting,n Procurement reform,
© Jones & Bartlett Learning, LLC. NOT FOR SALE OR DISTRIBUTION.
© Jones & Bartlett Learning, LLCNOT FOR SALE OR DISTRIBUTION
© Jones & Bartlett Learning, LLCNOT FOR SALE OR DISTRIBUTION
© Jones & Bartlett Learning, LLCNOT FOR SALE OR DISTRIBUTION
© Jones & Bartlett Learning, LLCNOT FOR SALE OR DISTRIBUTION
© Jones & Bartlett Learning, LLCNOT FOR SALE OR DISTRIBUTION
© Jones & Bartlett Learning, LLCNOT FOR SALE OR DISTRIBUTION
© Jones & Bartlett Learning, LLCNOT FOR SALE OR DISTRIBUTION
© Jones & Bartlett Learning, LLCNOT FOR SALE OR DISTRIBUTION
© Jones & Bartlett Learning, LLCNOT FOR SALE OR DISTRIBUTION
© Jones & Bartlett Learning, LLCNOT FOR SALE OR DISTRIBUTION
© Jones & Bartlett Learning, LLCNOT FOR SALE OR DISTRIBUTION
© Jones & Bartlett Learning, LLCNOT FOR SALE OR DISTRIBUTION
© Jones & Bartlett Learning, LLCNOT FOR SALE OR DISTRIBUTION
© Jones & Bartlett Learning, LLCNOT FOR SALE OR DISTRIBUTION
© Jones & Bartlett Learning, LLCNOT FOR SALE OR DISTRIBUTION
© Jones & Bartlett Learning, LLCNOT FOR SALE OR DISTRIBUTION
© Jones & Bartlett Learning, LLCNOT FOR SALE OR DISTRIBUTION
© Jones & Bartlett Learning, LLCNOT FOR SALE OR DISTRIBUTION
© Jones & Bartlett Learning, LLCNOT FOR SALE OR DISTRIBUTION
© Jones & Bartlett Learning, LLCNOT FOR SALE OR DISTRIBUTION

n Budget deficits and debt management,n Improving fiscal stress in regional governments,n Improving the political systems,n The World Bank and International Monetary Fund (IMF), andn Microbudgeting versus macrobudgeting.
Through an examination of these topics, it is the ultimate intention of this book to stimulate thinking and analysis of the practice of budgeting and financial manage-ment around the globe. Individually, these chapters do not discuss every single aspect of budgeting and financial management. On the contrary, our main objective is to provide a foundation and framework to an understudied field.
Economic and Country Overviews
Given Wildavsky’s (1975) focus on the level of national wealth as a point of departure for comparing budgeting processes around the globe, this section of the chapter pro-vides a brief overview of the economy and economic outlook in each country. Unless noted otherwise, all of the information and data in this section were derived from the subsequent chapters or from various Web sites and scholarly articles.
GHANA
Ghana is one of the few countries in the world that has an abundance of natural resources. It reigns as the most economically stable country in West Africa with roughly twice the per capita output of the poorest country in the region. The domestic economy revolves around agriculture, which accounts for about 35% of GDP and employs about 55% of the workforce. However, the country is quite dependent on international support and technical assistance. In fact, Ghana received funding under the Heavily Indebted Poor Country (HIPC) program in 2002. Priorities under its current Growth and Poverty Reduction Strategy, which also provides the framework for development partner assistance, include human resource development, private sector competitive-ness, macroeconomic stability, and good governance and civic responsibility. In 2006, Ghana signed the Millennium Challenge Corporation (MCC) Compact, which aims to assist in transforming Ghana’s agricultural sector. Sound macroeconomic management along with high prices for gold and cocoa helped sustain GDP growth in 2007 (Central Intelligence Agency, 2009d; The World Bank, 2006; The World Bank, 2008).
CHINA
China has become a major participant in the global economy during the last quarter century. During this period, the country moved away from a centrally planned economy that focused on domestic markets to a market-based economy. The major economic reforms in China began in the late 1970s, with the phasing out of collectivized agriculture and expanded to include the gradual liberalization of prices, increased
Economic and Country Overviews | �
© Jones & Bartlett Learning, LLC. NOT FOR SALE OR DISTRIBUTION.
© Jones & Bartlett Learning, LLCNOT FOR SALE OR DISTRIBUTION
© Jones & Bartlett Learning, LLCNOT FOR SALE OR DISTRIBUTION
© Jones & Bartlett Learning, LLCNOT FOR SALE OR DISTRIBUTION
© Jones & Bartlett Learning, LLCNOT FOR SALE OR DISTRIBUTION
© Jones & Bartlett Learning, LLCNOT FOR SALE OR DISTRIBUTION
© Jones & Bartlett Learning, LLCNOT FOR SALE OR DISTRIBUTION
© Jones & Bartlett Learning, LLCNOT FOR SALE OR DISTRIBUTION
© Jones & Bartlett Learning, LLCNOT FOR SALE OR DISTRIBUTION
© Jones & Bartlett Learning, LLCNOT FOR SALE OR DISTRIBUTION
© Jones & Bartlett Learning, LLCNOT FOR SALE OR DISTRIBUTION
© Jones & Bartlett Learning, LLCNOT FOR SALE OR DISTRIBUTION
© Jones & Bartlett Learning, LLCNOT FOR SALE OR DISTRIBUTION
© Jones & Bartlett Learning, LLCNOT FOR SALE OR DISTRIBUTION
© Jones & Bartlett Learning, LLCNOT FOR SALE OR DISTRIBUTION
© Jones & Bartlett Learning, LLCNOT FOR SALE OR DISTRIBUTION
© Jones & Bartlett Learning, LLCNOT FOR SALE OR DISTRIBUTION
© Jones & Bartlett Learning, LLCNOT FOR SALE OR DISTRIBUTION
© Jones & Bartlett Learning, LLCNOT FOR SALE OR DISTRIBUTION
© Jones & Bartlett Learning, LLCNOT FOR SALE OR DISTRIBUTION
© Jones & Bartlett Learning, LLCNOT FOR SALE OR DISTRIBUTION

� | Chapter � An Introduction to Comparative Budgeting
autonomy for state enterprises, the foundation of a diversified banking system, the development of stock markets, fiscal decentralization, the rapid growth of the nonstate sector, and the opening to foreign trade and investment. Implementing reforms have been incremental and piecemeal at best. Positive moves include the sale of minority shares in four of China’s largest state banks to foreign investors, and refinements in foreign exchange and bond markets in 2005. In July 2005, after keeping its currency tightly linked to the US dollar for years, the country revalued its currency by 2.1% against the US dollar and moved to an exchange rate system that references an array of currencies. GDP has increased more than 10 times since 1978 as a result of restructuring the economy. Measured on a purchasing power parity (PPP) basis, China, in 2007, stood as the second largest economy in the world after the United States, although in per capita terms, the country is still lower middle income. Annual inflows of foreign direct investment in 2007 rose to $75 billion. The Chinese government still faces sev-eral economic development challenges: (1) to sustain adequate job growth for tens of millions of workers laid off from state-owned enterprises, migrants, and new entrants to the workforce; (2) to contain environmental damage and social strife related to the economy’s rapid transformation; and (3) to reduce corruption and other economic crimes. Despite an aging workforce and a deteriorating environment, China has intensi-fied government efforts to improve environmental conditions by tying the evaluation of local officials to environmental targets, publishing a national climate change policy, and establishing a high-level leading group on climate change, headed by Premier Wen Jiabao. The Chinese government seeks to add energy production capacity from sources other than coal and oil as its double-digit economic growth increases demand (Central Intelligence Agency, 2009c; Economy Watch, 2009c; Li, 2001; Tsui, 1996; Woo, 2008).
SOUTH KOREA
Unlike its neighbor to the north, South Korea has seen unprecedented growth in the integration into the high-tech world economy since the 1960s. Roughly 40 years ago, South Korea’s GDP was comparable to those of third-world countries. By 2004, they joined a short list of countries in the trillion dollar club of world economies. In 2004, the GDP was $17,930 compared to $12,850 in Saudi Arabia, and $7,480 in Brazil. Success was achieved with a system of close government/business ties including directed credit, sponsorship of specific industries, import restrictions, and a strong labor effort. The government promoted the import of raw materials and technology at the expense of consumer goods, and encouraged savings and investment over consump-tion. Longstanding weaknesses in South Korea’s development model were exposed during the Asian financial crisis of 1997–1998. This included high debt/equity ratios, massive foreign borrowing, and an undisciplined financial sector. The GDP plunged by 6.9% in 1998, recovered by 9.5% in 1999 and by 8.5% in 2000. Due to the slowing global economy, falling exports, and the perception that much-needed corporate and financial reforms had stalled, growth fell to 3.3% in 2001. Growth in 2002 was an impressive 7%, led by consumer spending and exports despite faint global growth.
© Jones & Bartlett Learning, LLC. NOT FOR SALE OR DISTRIBUTION.
© Jones & Bartlett Learning, LLCNOT FOR SALE OR DISTRIBUTION
© Jones & Bartlett Learning, LLCNOT FOR SALE OR DISTRIBUTION
© Jones & Bartlett Learning, LLCNOT FOR SALE OR DISTRIBUTION
© Jones & Bartlett Learning, LLCNOT FOR SALE OR DISTRIBUTION
© Jones & Bartlett Learning, LLCNOT FOR SALE OR DISTRIBUTION
© Jones & Bartlett Learning, LLCNOT FOR SALE OR DISTRIBUTION
© Jones & Bartlett Learning, LLCNOT FOR SALE OR DISTRIBUTION
© Jones & Bartlett Learning, LLCNOT FOR SALE OR DISTRIBUTION
© Jones & Bartlett Learning, LLCNOT FOR SALE OR DISTRIBUTION
© Jones & Bartlett Learning, LLCNOT FOR SALE OR DISTRIBUTION
© Jones & Bartlett Learning, LLCNOT FOR SALE OR DISTRIBUTION
© Jones & Bartlett Learning, LLCNOT FOR SALE OR DISTRIBUTION
© Jones & Bartlett Learning, LLCNOT FOR SALE OR DISTRIBUTION
© Jones & Bartlett Learning, LLCNOT FOR SALE OR DISTRIBUTION
© Jones & Bartlett Learning, LLCNOT FOR SALE OR DISTRIBUTION
© Jones & Bartlett Learning, LLCNOT FOR SALE OR DISTRIBUTION
© Jones & Bartlett Learning, LLCNOT FOR SALE OR DISTRIBUTION
© Jones & Bartlett Learning, LLCNOT FOR SALE OR DISTRIBUTION
© Jones & Bartlett Learning, LLCNOT FOR SALE OR DISTRIBUTION
© Jones & Bartlett Learning, LLCNOT FOR SALE OR DISTRIBUTION

Between 2003 and 2007, growth moderated to about 4 to 5% annually. Moderate inflation, low unemployment, and an export surplus in 2007 characterize this solid economy, but inflation and unemployment are increasing in the face of rising oil prices (Central Intelligence Agency, 2009l; Economy Watch, 2009j; Ha, 2004; Koo, 2008; Lee & Lee, 1992).
PHILIPPINES
Higher government spending in the years leading up to 2007, as well as a resilient service sector and large remittances from the millions of Filipinos who work abroad led to GDP growth exceeding 7%. Since 2001, economic growth has averaged 5% since President Macapagal-Arroyo took office. Nonetheless, the Philippine govern-ment will need still higher, sustained growth to make progress in alleviating poverty, given its high population growth (30% in 2003) and unequal distribution of income. The president avoided a fiscal crisis by advocating new revenue measures and cutting expenditures. Recent efforts to increase spending on infrastructure and social services, tapering debt and debt service ratios, and declining fiscal deficits have increased the economic outlook for the country. While the general macroeconomic outlook has improved significantly over time, the nation continues to face important obstacles and must continue the reform movement in order to compete with regional competitors, improve employment opportunities, and alleviate poverty. Fiscal stability hinges on sustainable revenue sources, rather than nonrecurring revenues from privatization (Central Intelligence Agency, 2009j; Economy Watch, 2009i; Kwiatkowski, 2005).
TAIWAN
As the government has slowly allowed market forces to drive Taiwan’s economy, the country has flourished economically. In fact, the country has privatized some of the large state banks as well as industrial firms. This behavior is the result of a strong export market. The country has a large trade surplus and its foreign reserves are among the largest in the world. Despite economic and political limitations, China is now the largest export market for Taiwan. China is also the island’s number one destination for direct foreign investment. Strong trade performance in 2007 pushed Taiwan’s GDP growth rate above 5%, unemployment is below 4%, and the poverty rate was less than 1% in 2007 (Central Intelligence Agency, 2009m; Khatkhate, 1977).
THAILAND
Similar to other regional countries, Thailand appears to have recovered from the 1997–1998 Asian Financial Crisis. The country has a well-developed infrastructure, a free-enterprise economy, and generally pro-investment policies. Boosted by strong export growth, the Thai economy grew 4.5% in 2007 and was one of East Asia’s best eco-nomic performers from 2002 to 2004. This growth was the result of the government’s efforts in pursuing preferential trade agreements with an array of partners. By 2007,
Economic and Country Overviews | �
© Jones & Bartlett Learning, LLC. NOT FOR SALE OR DISTRIBUTION.
© Jones & Bartlett Learning, LLCNOT FOR SALE OR DISTRIBUTION
© Jones & Bartlett Learning, LLCNOT FOR SALE OR DISTRIBUTION
© Jones & Bartlett Learning, LLCNOT FOR SALE OR DISTRIBUTION
© Jones & Bartlett Learning, LLCNOT FOR SALE OR DISTRIBUTION
© Jones & Bartlett Learning, LLCNOT FOR SALE OR DISTRIBUTION
© Jones & Bartlett Learning, LLCNOT FOR SALE OR DISTRIBUTION
© Jones & Bartlett Learning, LLCNOT FOR SALE OR DISTRIBUTION
© Jones & Bartlett Learning, LLCNOT FOR SALE OR DISTRIBUTION
© Jones & Bartlett Learning, LLCNOT FOR SALE OR DISTRIBUTION
© Jones & Bartlett Learning, LLCNOT FOR SALE OR DISTRIBUTION
© Jones & Bartlett Learning, LLCNOT FOR SALE OR DISTRIBUTION
© Jones & Bartlett Learning, LLCNOT FOR SALE OR DISTRIBUTION
© Jones & Bartlett Learning, LLCNOT FOR SALE OR DISTRIBUTION
© Jones & Bartlett Learning, LLCNOT FOR SALE OR DISTRIBUTION
© Jones & Bartlett Learning, LLCNOT FOR SALE OR DISTRIBUTION
© Jones & Bartlett Learning, LLCNOT FOR SALE OR DISTRIBUTION
© Jones & Bartlett Learning, LLCNOT FOR SALE OR DISTRIBUTION
© Jones & Bartlett Learning, LLCNOT FOR SALE OR DISTRIBUTION
© Jones & Bartlett Learning, LLCNOT FOR SALE OR DISTRIBUTION
© Jones & Bartlett Learning, LLCNOT FOR SALE OR DISTRIBUTION

� | Chapter � An Introduction to Comparative Budgeting
the tourism sector had largely recovered from the 2004 major tsunami. Following the military coup in September 2006, investment and consumer confidence stagnated due to the uncertain political climate that lasted through the December 2007 elections. Foreign investor sentiment was further tempered by a 30% reserve requirement on capital inflows instituted in December 2006, and discussion of amending Thailand’s rules governing foreign-owned businesses. Economic growth in 2007 was due almost entirely to robust export performance. Exports have performed at record levels, rising to 16.7% in 2006 and 12.1% in 2007. Export-oriented manufacturing (especially auto-mobile production) and farm outputs are the driving forces behind these gains (Central Intelligence Agency, 2009n; International Monetary Fund, 2009).
VIETNAM
Vietnam is a densely populated developing country that has had to recover from the ravages of war, the loss of financial support from the former Soviet Union, and the rigidities of a centrally planned economy in the last 3 decades. The country experienced extreme economic stagnation after the reunification from 1975 to 1985. However, in 1986, the congress approved a broad economic reform package that introduced market reforms and set the groundwork for Vietnam’s improved investment climate. As a result of these reforms, substantial progress was achieved from 1986 to 1997 in moving for-ward from an extremely low level of development and significantly reducing poverty (14.7% in 2007). Economic recovery was temporarily halted as a result of the 1997 Asian financial crisis, when opponents of reform were able to highlight the problems in the Vietnamese economy and slow the progress toward a market-oriented economy. Despite the background of the Asian financial crisis and a global recession, GDP growth averaged 6.8% per year from 1997 to 2004. After reaffirming their commitment to eco-nomic liberalization and international integration in 2001, government officials have made changes to implement the structural reforms needed to modernize the economy and to produce more competitive, export-driven industries. The economy grew 8.5% in 2007. Other efforts, such as joining the Association of Southeast Asian Nations (ASEAN) Free Trade Area (AFTA) and the entering into a United States–Vietnam Bilateral Trade Agreement in December 2001 have led to more positive economic changes. Vietnam’s exports to the United States increased 900% between 2001 and 2007. In 2007, Vietnam joined the World Trade Organization (WTO) after a decade-long negotiation process. Membership in the WTO has provided Vietnam an access point to the global market and reinforced the domestic economic reform process (Beresford, 2008; Bjornestad, 2009; Economy Watch, 2009m; Glewwe, Gragnolati, & Zaman, 2002).
ITALY
Despite boasting a diversified industrial economy with roughly the same total and per capita output as France and the United Kingdom, Italy is in need of further economic reform. Economically, the capitalist country is segregated into two halves. The northern part of the country is well developed from an economic perspective and driven by private companies, whereas the south is less developed, has an agriculturally based
© Jones & Bartlett Learning, LLC. NOT FOR SALE OR DISTRIBUTION.
© Jones & Bartlett Learning, LLCNOT FOR SALE OR DISTRIBUTION
© Jones & Bartlett Learning, LLCNOT FOR SALE OR DISTRIBUTION
© Jones & Bartlett Learning, LLCNOT FOR SALE OR DISTRIBUTION
© Jones & Bartlett Learning, LLCNOT FOR SALE OR DISTRIBUTION
© Jones & Bartlett Learning, LLCNOT FOR SALE OR DISTRIBUTION
© Jones & Bartlett Learning, LLCNOT FOR SALE OR DISTRIBUTION
© Jones & Bartlett Learning, LLCNOT FOR SALE OR DISTRIBUTION
© Jones & Bartlett Learning, LLCNOT FOR SALE OR DISTRIBUTION
© Jones & Bartlett Learning, LLCNOT FOR SALE OR DISTRIBUTION
© Jones & Bartlett Learning, LLCNOT FOR SALE OR DISTRIBUTION
© Jones & Bartlett Learning, LLCNOT FOR SALE OR DISTRIBUTION
© Jones & Bartlett Learning, LLCNOT FOR SALE OR DISTRIBUTION
© Jones & Bartlett Learning, LLCNOT FOR SALE OR DISTRIBUTION
© Jones & Bartlett Learning, LLCNOT FOR SALE OR DISTRIBUTION
© Jones & Bartlett Learning, LLCNOT FOR SALE OR DISTRIBUTION
© Jones & Bartlett Learning, LLCNOT FOR SALE OR DISTRIBUTION
© Jones & Bartlett Learning, LLCNOT FOR SALE OR DISTRIBUTION
© Jones & Bartlett Learning, LLCNOT FOR SALE OR DISTRIBUTION
© Jones & Bartlett Learning, LLCNOT FOR SALE OR DISTRIBUTION
© Jones & Bartlett Learning, LLCNOT FOR SALE OR DISTRIBUTION
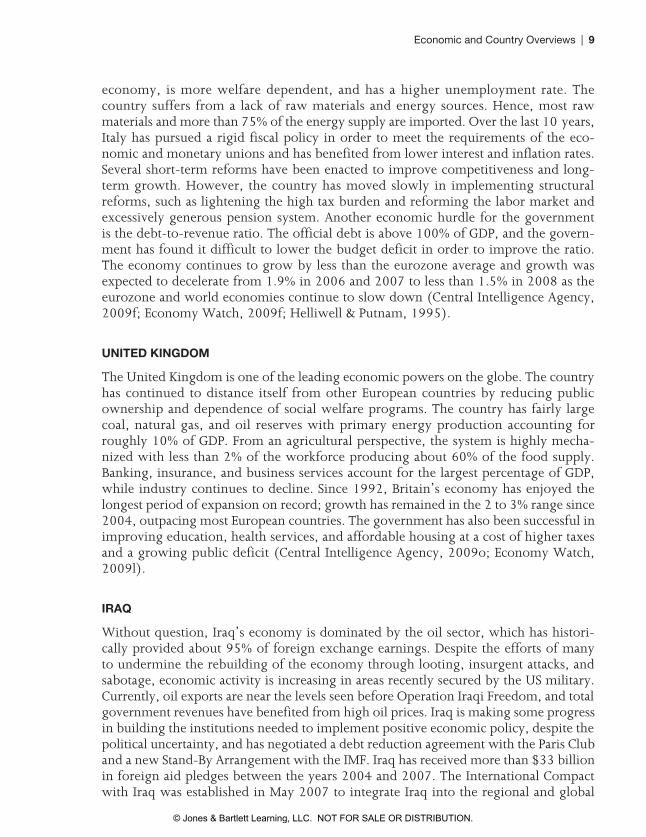
economy, is more welfare dependent, and has a higher unemployment rate. The country suffers from a lack of raw materials and energy sources. Hence, most raw materials and more than 75% of the energy supply are imported. Over the last 10 years, Italy has pursued a rigid fiscal policy in order to meet the requirements of the eco-nomic and monetary unions and has benefited from lower interest and inflation rates. Several short-term reforms have been enacted to improve competitiveness and long-term growth. However, the country has moved slowly in implementing structural reforms, such as lightening the high tax burden and reforming the labor market and excessively generous pension system. Another economic hurdle for the government is the debt-to-revenue ratio. The official debt is above 100% of GDP, and the govern-ment has found it difficult to lower the budget deficit in order to improve the ratio. The economy continues to grow by less than the eurozone average and growth was expected to decelerate from 1.9% in 2006 and 2007 to less than 1.5% in 2008 as the eurozone and world economies continue to slow down (Central Intelligence Agency, 2009f; Economy Watch, 2009f; Helliwell & Putnam, 1995).
UNITED KINGDOM
The United Kingdom is one of the leading economic powers on the globe. The country has continued to distance itself from other European countries by reducing public ownership and dependence of social welfare programs. The country has fairly large coal, natural gas, and oil reserves with primary energy production accounting for roughly 10% of GDP. From an agricultural perspective, the system is highly mecha-nized with less than 2% of the workforce producing about 60% of the food supply. Banking, insurance, and business services account for the largest percentage of GDP, while industry continues to decline. Since 1992, Britain’s economy has enjoyed the longest period of expansion on record; growth has remained in the 2 to 3% range since 2004, outpacing most European countries. The government has also been successful in improving education, health services, and affordable housing at a cost of higher taxes and a growing public deficit (Central Intelligence Agency, 2009o; Economy Watch, 2009l).
IRAQ
Without question, Iraq’s economy is dominated by the oil sector, which has histori-cally provided about 95% of foreign exchange earnings. Despite the efforts of many to undermine the rebuilding of the economy through looting, insurgent attacks, and sabotage, economic activity is increasing in areas recently secured by the US military. Currently, oil exports are near the levels seen before Operation Iraqi Freedom, and total government revenues have benefited from high oil prices. Iraq is making some progress in building the institutions needed to implement positive economic policy, despite the political uncertainty, and has negotiated a debt reduction agreement with the Paris Club and a new Stand-By Arrangement with the IMF. Iraq has received more than $33 billion in foreign aid pledges between the years 2004 and 2007. The International Compact with Iraq was established in May 2007 to integrate Iraq into the regional and global
Economic and Country Overviews | �
© Jones & Bartlett Learning, LLC. NOT FOR SALE OR DISTRIBUTION.
© Jones & Bartlett Learning, LLCNOT FOR SALE OR DISTRIBUTION
© Jones & Bartlett Learning, LLCNOT FOR SALE OR DISTRIBUTION
© Jones & Bartlett Learning, LLCNOT FOR SALE OR DISTRIBUTION
© Jones & Bartlett Learning, LLCNOT FOR SALE OR DISTRIBUTION
© Jones & Bartlett Learning, LLCNOT FOR SALE OR DISTRIBUTION
© Jones & Bartlett Learning, LLCNOT FOR SALE OR DISTRIBUTION
© Jones & Bartlett Learning, LLCNOT FOR SALE OR DISTRIBUTION
© Jones & Bartlett Learning, LLCNOT FOR SALE OR DISTRIBUTION
© Jones & Bartlett Learning, LLCNOT FOR SALE OR DISTRIBUTION
© Jones & Bartlett Learning, LLCNOT FOR SALE OR DISTRIBUTION
© Jones & Bartlett Learning, LLCNOT FOR SALE OR DISTRIBUTION
© Jones & Bartlett Learning, LLCNOT FOR SALE OR DISTRIBUTION
© Jones & Bartlett Learning, LLCNOT FOR SALE OR DISTRIBUTION
© Jones & Bartlett Learning, LLCNOT FOR SALE OR DISTRIBUTION
© Jones & Bartlett Learning, LLCNOT FOR SALE OR DISTRIBUTION
© Jones & Bartlett Learning, LLCNOT FOR SALE OR DISTRIBUTION
© Jones & Bartlett Learning, LLCNOT FOR SALE OR DISTRIBUTION
© Jones & Bartlett Learning, LLCNOT FOR SALE OR DISTRIBUTION
© Jones & Bartlett Learning, LLCNOT FOR SALE OR DISTRIBUTION
© Jones & Bartlett Learning, LLCNOT FOR SALE OR DISTRIBUTION

�0 | Chapter � An Introduction to Comparative Budgeting
economy, and the Iraqi government is seeking to pass laws to strengthen its economy. The Central Bank has also been successful in controlling inflation through appreciation of the dinar against the US dollar. The key to Iraq’s success is reducing corruption and implementing structural reforms, such as bank restructuring and developing the private sector (Central Intelligence Agency, 2009e; Economy Watch, 2009e; Vrijer, Kock, & Grigorian, 2008).
JORDAN
Unlike a number of other countries in the region, Jordan has an insufficient amount of water, oil, and other natural resources. In addition, poverty (14.2% in 2002), unemploy-ment, and inflation are fundamental problems that have lingered for years. Nonetheless, the government has been more proactive since 1999 when King Abdallah II assumed the throne. His broad economic reforms have attempted to improve living standards. Since 2002, Amman has continued to follow IMF guidelines by practicing careful mon-etary policy, improving privatization, and opening the trade regime. Jordan’s exports have significantly increased under the free trade accord with the United States and the Jordanian Qualifying Industrial Zones (QIZ), which allow Jordan to export goods tax free to the United States. In 2006, Jordan reduced its debt-to-GDP ratio significantly. These measures have helped improve productivity and have made Jordan more attrac-tive for foreign investment. In the recent past, Jordan imported most of its oil from Iraq. Since 2003, however, Jordan has been more dependent on oil from other Gulf nations. The government ended subsidies for petroleum and other consumer goods in 2008 in an effort to control the budget. Today, the main challenges facing Jordan are reducing dependence on foreign grants, reducing the budget deficit, attracting invest-ments, and creating jobs (Central Intelligence Agency, 2009g; Khaldi, 2008; USAID in Jordan, 2009).
PAKISTAN
Pakistan is an impoverished (24% poverty rate in 2006) and underdeveloped country that has suffered from decades of political disputes, low levels of foreign invest-ment, and a costly and ongoing quarrel with India. The country has, however, begun reforming its economic system. In 2001, the IMF approved the privatization of the banking sector. In addition, the country has been assisted by generous foreign assis-tance and renewed access to global markets. As a result, the country has had a degree of macroeconomic recovery. GDP growth was in the 6 to 8% range from 2004 to 2007. This was spurred by gains in the industrial and service sectors. In 2007, the fiscal deficit—a result of chronically low tax collection and increased spending—exceeded the government’s target of 4% of GDP. Inflation remains the top concern among the public, jumping from 6.9% in 2007 to more than 11% during the first few months of 2008, primarily because of rising world commodity prices (Central Intelligence Agency, 2009i; Economy Watch, 2009h; Khan & Qayyum, 2007).
© Jones & Bartlett Learning, LLC. NOT FOR SALE OR DISTRIBUTION.
© Jones & Bartlett Learning, LLCNOT FOR SALE OR DISTRIBUTION
© Jones & Bartlett Learning, LLCNOT FOR SALE OR DISTRIBUTION
© Jones & Bartlett Learning, LLCNOT FOR SALE OR DISTRIBUTION
© Jones & Bartlett Learning, LLCNOT FOR SALE OR DISTRIBUTION
© Jones & Bartlett Learning, LLCNOT FOR SALE OR DISTRIBUTION
© Jones & Bartlett Learning, LLCNOT FOR SALE OR DISTRIBUTION
© Jones & Bartlett Learning, LLCNOT FOR SALE OR DISTRIBUTION
© Jones & Bartlett Learning, LLCNOT FOR SALE OR DISTRIBUTION
© Jones & Bartlett Learning, LLCNOT FOR SALE OR DISTRIBUTION
© Jones & Bartlett Learning, LLCNOT FOR SALE OR DISTRIBUTION
© Jones & Bartlett Learning, LLCNOT FOR SALE OR DISTRIBUTION
© Jones & Bartlett Learning, LLCNOT FOR SALE OR DISTRIBUTION
© Jones & Bartlett Learning, LLCNOT FOR SALE OR DISTRIBUTION
© Jones & Bartlett Learning, LLCNOT FOR SALE OR DISTRIBUTION
© Jones & Bartlett Learning, LLCNOT FOR SALE OR DISTRIBUTION
© Jones & Bartlett Learning, LLCNOT FOR SALE OR DISTRIBUTION
© Jones & Bartlett Learning, LLCNOT FOR SALE OR DISTRIBUTION
© Jones & Bartlett Learning, LLCNOT FOR SALE OR DISTRIBUTION
© Jones & Bartlett Learning, LLCNOT FOR SALE OR DISTRIBUTION
© Jones & Bartlett Learning, LLCNOT FOR SALE OR DISTRIBUTION

SAUDI ARABIA
Saudi Arabia controls more than 20% of the world’s proven petroleum reserves and leads the world in oil exports. With respect to the budget, the petroleum sector makes up nearly 75% of the budget revenues, 45% of GDP, and 90% of export earnings. About 40% of the GDP comes from the private sector. Recent high oil prices have boosted growth, govern-ment revenues, and Saudi ownership of foreign assets. As a result, the country has been able to pay down domestic debt. More recently, the government has been facilitating private sector growth (especially in telecommunications, power generation, natural gas exploration, and petrochemicals) with the objective of decreasing the country’s depen-dence on oil exports and to increase employment opportunities. Unemployment is high, and the large youth population (40% of the total population is younger than 15 years of age) generally lacks the education and technical skills the private sector needs. Hence, the country has substantially boosted spending on job training and education, infrastruc-ture development, as well as government salaries. Saudi Arabia acceded to the WTO in December 2005 after many years of negotiations in order to attract foreign investment and to diversify the economy (Central Intelligence Agency, 2009k).
UNITED ARAB EMIRATES
Since oil was discovered in the country more than 30 years ago, the UAE has developed a prosperous (and open) economy with a high per capita income ($40,000 in 2008) and a large annual trade surplus ($151 billion exports in 2007). Efforts aimed at eco-nomic diversity have been successful, but almost 40% of GDP is still based on oil and gas output. Private sector investment has increased as the government has increased spending on job creation and infrastructure expansion. Early in 2004, the country signed a Trade and Investment Framework Agreement with the United States and later in 2004, agreed to undertake negotiations toward a Free Trade Agreement with the United States. Foreign investors have been drawn to the country as a result of the coun-try’s Free Trade Zones, which offer 100% foreign ownership and zero taxes. Higher oil revenue, strong liquidity, housing shortages, and cheap credit in the years 2005 to 2007 led to a surge in asset prices (in shares and real estate) and consumer inflation. In addition, rising prices have increased the operating costs for businesses in the UAE and adversely impacted government employees and others on fixed incomes. Diversification and the creation of more opportunities for nationals through improved education and increased private sector employment are a part of the UAE’s strategic plan for the next few years (Central Intelligence Agency, 2009p; Economy Watch, 2009d).
CANADA
Following the 1989 United States–Canada Free Trade Agreement (FTA) and the 1994 North American Free Trade Agreement (NAFTA), Canada has seen a dramatic increase in trade and economic integration. The country has a market-based economic system with substantial growth in the manufacturing, mining, and service sectors. In addition,
Economic and Country Overviews | ��
© Jones & Bartlett Learning, LLC. NOT FOR SALE OR DISTRIBUTION.
© Jones & Bartlett Learning, LLCNOT FOR SALE OR DISTRIBUTION
© Jones & Bartlett Learning, LLCNOT FOR SALE OR DISTRIBUTION
© Jones & Bartlett Learning, LLCNOT FOR SALE OR DISTRIBUTION
© Jones & Bartlett Learning, LLCNOT FOR SALE OR DISTRIBUTION
© Jones & Bartlett Learning, LLCNOT FOR SALE OR DISTRIBUTION
© Jones & Bartlett Learning, LLCNOT FOR SALE OR DISTRIBUTION
© Jones & Bartlett Learning, LLCNOT FOR SALE OR DISTRIBUTION
© Jones & Bartlett Learning, LLCNOT FOR SALE OR DISTRIBUTION
© Jones & Bartlett Learning, LLCNOT FOR SALE OR DISTRIBUTION
© Jones & Bartlett Learning, LLCNOT FOR SALE OR DISTRIBUTION
© Jones & Bartlett Learning, LLCNOT FOR SALE OR DISTRIBUTION
© Jones & Bartlett Learning, LLCNOT FOR SALE OR DISTRIBUTION
© Jones & Bartlett Learning, LLCNOT FOR SALE OR DISTRIBUTION
© Jones & Bartlett Learning, LLCNOT FOR SALE OR DISTRIBUTION
© Jones & Bartlett Learning, LLCNOT FOR SALE OR DISTRIBUTION
© Jones & Bartlett Learning, LLCNOT FOR SALE OR DISTRIBUTION
© Jones & Bartlett Learning, LLCNOT FOR SALE OR DISTRIBUTION
© Jones & Bartlett Learning, LLCNOT FOR SALE OR DISTRIBUTION
© Jones & Bartlett Learning, LLCNOT FOR SALE OR DISTRIBUTION
© Jones & Bartlett Learning, LLCNOT FOR SALE OR DISTRIBUTION

�� | Chapter � An Introduction to Comparative Budgeting
the country has great natural resources, a skilled labor force, and modern capital facili-ties. As a result of good fiscal management, the country has produced balanced budgets since 1997. However, public debate continues over the equitable distribution of federal funds to the Canadian provinces. Exports account for roughly one third of GDP. Canada has a large trade surplus with its principal trading partner, the United States, which absorbs 80% of Canadian exports each year. Canada is the largest foreign supplier of energy, including oil, gas, uranium, and electric power to the United States. In 2007, Canada enjoyed good economic growth, moderate inflation, and the lowest unem-ployment rate in more than 30 years (Central Intelligence Agency, 2009b; Economy Watch, 2009b).
MEXICO
Similar to other North American countries, Mexico also has a free market economy in the trillion-dollar group. The economy is dominated by the private sector and focuses mainly on industry and agriculture. More recently, the country has attempted to diver-sify the economy by expanding into seaports, railroads, telecommunications, electricity generation, natural gas distribution, and airports. Per capita income is $14,200 (2008), about one fourth that of the United States, and the poverty rate was 13.8% in 2006. Also a major beneficiary of NAFTA, trade with the United States and Canada has tripled since 1994. Currently, Mexico has 12 free trade agreements with over 40 countries placing more than 90% of trade under free trade agreements. The government con-tinues to face many obstacles in improving the country’s infrastructure, labor force, and energy sector (Central Intelligence Agency, 2009h; Economy Watch, 2009g).
UNITED STATES
In 2008, per capita income in the United States was $47,000, and it operated as the largest and most powerful economy on the globe. The market economy is dominated by the private sector where all levels of government purchase goods and services. Although US business firms enjoy great flexibility in determining their fiscal outlook (expansion of capital plant, laying off surplus workers, and developing new products) when compared to other nations, they also face more obstacles when attempting to compete with home markets. US firms exist on the cutting edge in computer tech-nology, medicine, aerospace engineering, and military equipment. The response to the terrorist attacks of September 11, 2001 showed the resilience of the economy. The war between a US-led coalition and Iraq, and the subsequent occupation of Iraq required major shifts in national resources to the military. The rise in GDP in the years 2004 to 2007 was undergirded by substantial gains in labor productivity. Natural disasters such as Hurricane Katrina caused extensive damage in the Gulf Coast region in August 2005, but had a small impact on overall GDP growth for the year. Soaring oil prices in the years 2005 to 2007 threatened inflation and unemployment, yet the economy continued to grow through year-end 2007. Imported oil accounts for about two thirds of US consumption. Long-term problems include inadequate invest-ment in economic infrastructure, rapidly rising medical and pension costs of an aging
© Jones & Bartlett Learning, LLC. NOT FOR SALE OR DISTRIBUTION.
© Jones & Bartlett Learning, LLCNOT FOR SALE OR DISTRIBUTION
© Jones & Bartlett Learning, LLCNOT FOR SALE OR DISTRIBUTION
© Jones & Bartlett Learning, LLCNOT FOR SALE OR DISTRIBUTION
© Jones & Bartlett Learning, LLCNOT FOR SALE OR DISTRIBUTION
© Jones & Bartlett Learning, LLCNOT FOR SALE OR DISTRIBUTION
© Jones & Bartlett Learning, LLCNOT FOR SALE OR DISTRIBUTION
© Jones & Bartlett Learning, LLCNOT FOR SALE OR DISTRIBUTION
© Jones & Bartlett Learning, LLCNOT FOR SALE OR DISTRIBUTION
© Jones & Bartlett Learning, LLCNOT FOR SALE OR DISTRIBUTION
© Jones & Bartlett Learning, LLCNOT FOR SALE OR DISTRIBUTION
© Jones & Bartlett Learning, LLCNOT FOR SALE OR DISTRIBUTION
© Jones & Bartlett Learning, LLCNOT FOR SALE OR DISTRIBUTION
© Jones & Bartlett Learning, LLCNOT FOR SALE OR DISTRIBUTION
© Jones & Bartlett Learning, LLCNOT FOR SALE OR DISTRIBUTION
© Jones & Bartlett Learning, LLCNOT FOR SALE OR DISTRIBUTION
© Jones & Bartlett Learning, LLCNOT FOR SALE OR DISTRIBUTION
© Jones & Bartlett Learning, LLCNOT FOR SALE OR DISTRIBUTION
© Jones & Bartlett Learning, LLCNOT FOR SALE OR DISTRIBUTION
© Jones & Bartlett Learning, LLCNOT FOR SALE OR DISTRIBUTION
© Jones & Bartlett Learning, LLCNOT FOR SALE OR DISTRIBUTION
population, sizable trade and budget deficits, and stagnation of family income in the lower economic groups. The merchandise trade deficit reached a record $847 billion in 2007. Together, these problems caused a marked reduction in the value and status of the dollar worldwide in 2007 (Banerjee & Marcellino, 2006; Central Intelligence Agency, 2009q; Economy Watch, 2009k).
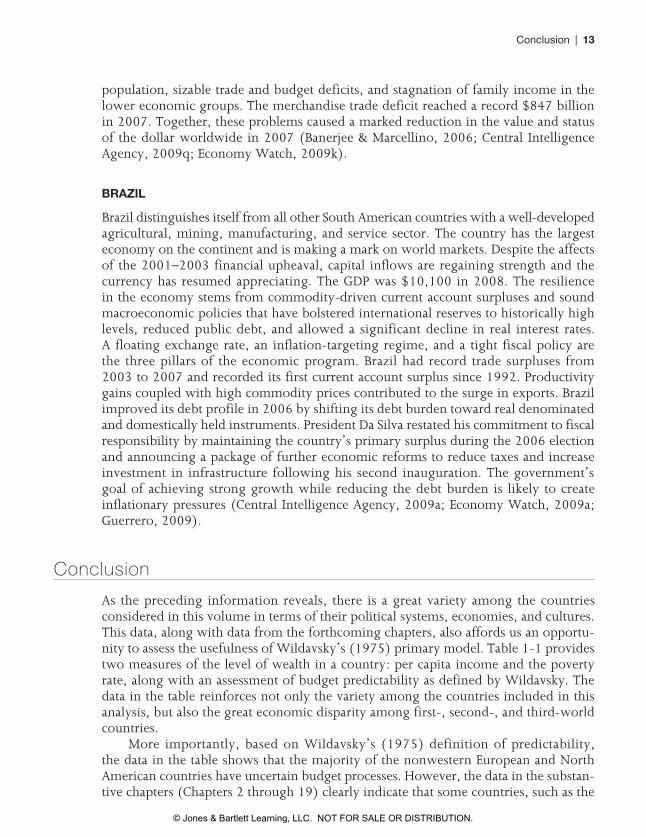
BRAZIL
Brazil distinguishes itself from all other South American countries with a well-developed agricultural, mining, manufacturing, and service sector. The country has the largest economy on the continent and is making a mark on world markets. Despite the affects of the 2001–2003 financial upheaval, capital inflows are regaining strength and the currency has resumed appreciating. The GDP was $10,100 in 2008. The resilience in the economy stems from commodity-driven current account surpluses and sound macroeconomic policies that have bolstered international reserves to historically high levels, reduced public debt, and allowed a significant decline in real interest rates. A floating exchange rate, an inflation-targeting regime, and a tight fiscal policy are the three pillars of the economic program. Brazil had record trade surpluses from 2003 to 2007 and recorded its first current account surplus since 1992. Productivity gains coupled with high commodity prices contributed to the surge in exports. Brazil improved its debt profile in 2006 by shifting its debt burden toward real denominated and domestically held instruments. President Da Silva restated his commitment to fiscal responsibility by maintaining the country’s primary surplus during the 2006 election and announcing a package of further economic reforms to reduce taxes and increase investment in infrastructure following his second inauguration. The government’s goal of achieving strong growth while reducing the debt burden is likely to create inflationary pressures (Central Intelligence Agency, 2009a; Economy Watch, 2009a; Guerrero, 2009).
Conclusion
As the preceding information reveals, there is a great variety among the countries considered in this volume in terms of their political systems, economies, and cultures. This data, along with data from the forthcoming chapters, also affords us an opportu-nity to assess the usefulness of Wildavsky’s (1975) primary model. Table 1-1 provides two measures of the level of wealth in a country: per capita income and the poverty rate, along with an assessment of budget predictability as defined by Wildavsky. The data in the table reinforces not only the variety among the countries included in this analysis, but also the great economic disparity among first-, second-, and third-world countries.
More importantly, based on Wildavsky’s (1975) definition of predictability, the data in the table shows that the majority of the nonwestern European and North American countries have uncertain budget processes. However, the data in the substan-tive chapters (Chapters 2 through 19) clearly indicate that some countries, such as the
Conclusion | ��
© Jones & Bartlett Learning, LLC. NOT FOR SALE OR DISTRIBUTION.
© Jones & Bartlett Learning, LLCNOT FOR SALE OR DISTRIBUTION
© Jones & Bartlett Learning, LLCNOT FOR SALE OR DISTRIBUTION
© Jones & Bartlett Learning, LLCNOT FOR SALE OR DISTRIBUTION
© Jones & Bartlett Learning, LLCNOT FOR SALE OR DISTRIBUTION
© Jones & Bartlett Learning, LLCNOT FOR SALE OR DISTRIBUTION
© Jones & Bartlett Learning, LLCNOT FOR SALE OR DISTRIBUTION
© Jones & Bartlett Learning, LLCNOT FOR SALE OR DISTRIBUTION
© Jones & Bartlett Learning, LLCNOT FOR SALE OR DISTRIBUTION
© Jones & Bartlett Learning, LLCNOT FOR SALE OR DISTRIBUTION
© Jones & Bartlett Learning, LLCNOT FOR SALE OR DISTRIBUTION
© Jones & Bartlett Learning, LLCNOT FOR SALE OR DISTRIBUTION
© Jones & Bartlett Learning, LLCNOT FOR SALE OR DISTRIBUTION
© Jones & Bartlett Learning, LLCNOT FOR SALE OR DISTRIBUTION
© Jones & Bartlett Learning, LLCNOT FOR SALE OR DISTRIBUTION
© Jones & Bartlett Learning, LLCNOT FOR SALE OR DISTRIBUTION
© Jones & Bartlett Learning, LLCNOT FOR SALE OR DISTRIBUTION
© Jones & Bartlett Learning, LLCNOT FOR SALE OR DISTRIBUTION
© Jones & Bartlett Learning, LLCNOT FOR SALE OR DISTRIBUTION
© Jones & Bartlett Learning, LLCNOT FOR SALE OR DISTRIBUTION
© Jones & Bartlett Learning, LLCNOT FOR SALE OR DISTRIBUTION

�� | Chapter � An Introduction to Comparative Budgeting
UAE have made significant strides in changing their budget predictability status. That is, recent reforms and subsequent political behavior are beginning to coincide.
The next 18 chapters will focus on various aspects of public finance and budgeting according to the level of individual expertise and interest of the author. In most cases, the factors examined will coincide with Wildavsky’s (1975) and Rubin’s (2010) models.
References
Axelrod, D. (1995). Budgeting for modern government. New York: St. Martins.Banerjee, A., & Marcellino, M. (2006). Are there any reliable leading indicators of US inflation and GDP
growth? International Journal of Forecasters, 22(1), 137–151. Available at: http://dx.doi.org/10.1016/j.ijforecast.2005.03.005. Accessed March 4, 2010.
Table �-�
Wildavsky’s Model Applied Today
Country Per capita income Poverty rate Predictability
Brazil $10,100 31%(2005) Certain
Canada $39,300 10.8%(2005)a Certain
China $6,000 8%(2006est.)b Uncertain
Ghana $1,500 28.5%(2007est.) Uncertain
Iraq $4,000 N/A Uncertain
Italy $31,000 N/A Certain
Jordan $5,000 14.2%(2002) Uncertain
Korea $26,000 15%(2003est.) Certain
Mexico $14,200 13.8%(2006)c Uncertain
Pakistan $2,600 24%(FY05/06est.) Uncertain
Philippines $3,300 30%(2003est.) Uncertain
SaudiArabia $20,700 N/A Uncertain
Taiwan $31,900 0.95%(2007est.) Uncertain
Thailand $8,500 10%(2004est.) Uncertain
UnitedArabEmirates $40,000 19.5%(2003) Certain
UnitedKingdom $36,600 14%(2006est.) Certain
UnitedStates $47,000 12%(2004est.) Certain
Vietnam $2,800 14.75%(2007est.) Uncertain
Adaptedfromhttp://siakhenn.tripod.com/exports-total.html.Copyright2000byTongSiakHenn.
aThisfigureistheLowIncomeCut-Off(LICO),acalculationthatresultsinhigherfiguresthanfoundinmanycomparableeconomies;Canadadoesnothaveanofficialpovertyline.
b21.5millionoftheruralpopulationlivebelowtheofficial“absolutepoverty”line(approximately$90peryear),whereasanadditional35.5millionresidentsliveabovethatlinebutbelowtheofficial“lowincome”line(approximately$125peryear).
cUsingthefood-baseddefinitionofpoverty;asset-basedpovertyamountedtomorethan40%ofthepopulation.
© Jones & Bartlett Learning, LLC. NOT FOR SALE OR DISTRIBUTION.
© Jones & Bartlett Learning, LLCNOT FOR SALE OR DISTRIBUTION
© Jones & Bartlett Learning, LLCNOT FOR SALE OR DISTRIBUTION
© Jones & Bartlett Learning, LLCNOT FOR SALE OR DISTRIBUTION
© Jones & Bartlett Learning, LLCNOT FOR SALE OR DISTRIBUTION
© Jones & Bartlett Learning, LLCNOT FOR SALE OR DISTRIBUTION
© Jones & Bartlett Learning, LLCNOT FOR SALE OR DISTRIBUTION
© Jones & Bartlett Learning, LLCNOT FOR SALE OR DISTRIBUTION
© Jones & Bartlett Learning, LLCNOT FOR SALE OR DISTRIBUTION
© Jones & Bartlett Learning, LLCNOT FOR SALE OR DISTRIBUTION
© Jones & Bartlett Learning, LLCNOT FOR SALE OR DISTRIBUTION
© Jones & Bartlett Learning, LLCNOT FOR SALE OR DISTRIBUTION
© Jones & Bartlett Learning, LLCNOT FOR SALE OR DISTRIBUTION
© Jones & Bartlett Learning, LLCNOT FOR SALE OR DISTRIBUTION
© Jones & Bartlett Learning, LLCNOT FOR SALE OR DISTRIBUTION
© Jones & Bartlett Learning, LLCNOT FOR SALE OR DISTRIBUTION
© Jones & Bartlett Learning, LLCNOT FOR SALE OR DISTRIBUTION
© Jones & Bartlett Learning, LLCNOT FOR SALE OR DISTRIBUTION
© Jones & Bartlett Learning, LLCNOT FOR SALE OR DISTRIBUTION
© Jones & Bartlett Learning, LLCNOT FOR SALE OR DISTRIBUTION
© Jones & Bartlett Learning, LLCNOT FOR SALE OR DISTRIBUTION

Beresford, M. (2008). Doi Moi in review: The challenges of building market socialism in Vietnam. Journal of Contemporary Asia, 38(2), 221–243.
Bjornestad, L. (2009). Fiscal decentralization, fiscal incentives, and pro-poor outcomes: Evidence from Viet Nam. ADB Economics Working Paper Series, 168. Manila, Philippines: Asian Development Bank. Available at: http://www.adb.org/Documents/Working-Papers/2009/Economics-WP168.pdf. Accessed March 4, 2010.
Central Intelligence Agency. (2009a). Brazil’s Economy. Available at: https://www.cia.gov/library/publications/ the-world-factbook/geos/br.html. Accessed on November 25, 2009.
Central Intelligence Agency. (2009b). Canada’s Economy. Available at: https://www.cia.gov/library/publications/ the-world-factbook/geos/ca.html. Accessed on November 25, 2009.
Central Intelligence Agency, (2009c). The Chinese Economy. Available at: https://www.cia.gov/library/publications/ the-world-factbook/geos/ch.html. Accessed November 25, 2009.
Central Intelligence Agency. (2009d). Ghana’s Economy. Available at: https://www.cia.gov/library/publications/ the-world-factbook/geos/gh.html. Accessed November 25, 2009.
Central Intelligence Agency. (2009e). Iraq’s Economy. Available at: https://www.cia.gov/library/publications/the-world-factbook/geos/iz.html. Accessed on November 25, 2009.
Central Intelligence Agency. (2009f). Italy’s Economy. Available at: https://www.cia.gov/library/publications/the-world-factbook/geos/it.html. Accessed on November 25, 2009.
Central Intelligence Agency. (2009g). Jordan’s Economy. Available at: https://www.cia.gov/library/publications/ the-world-factbook/geos/jo.html. Accessed on November 25, 2009.
Central Intelligence Agency. (2009h). Mexico’s Economy. Available at: https://www.cia.gov/library/publications/ the-world-factbook/geos/mx.html. Accessed on November 25, 2009.
Central Intelligence Agency. (2009i). Pakistan’s Economy. Available at: https://www.cia.gov/library/publications/ the-world-factbook/geos/pk.html. Accessed November 25, 2009.
Central Intelligence Agency. (2009j). Philippine’s Economy. Available at: https://www.cia.gov/library/publications/ the-world-factbook/geos/rp.html#. Accessed on November 25, 2009.
Central Intelligence Agency. (2009k). Saudi Arabia’s Economy. Available at: https://www.cia.gov/library/ publications/the-world-factbook/geos/sa.html. Accessed on November 25, 2009.
Central Intelligence Agency. (2009l). South Korea’s Economy. Available at: https://www.cia.gov/library/publications/the-world-factbook/geos/ks.html. Accessed on November 25, 2009.
Central Intelligence Agency. (2009m). Taiwan’s Economy. Available at: https://www.cia.gov/library/publications/ the-world-factbook/geos/tw.html. Accessed on November 25, 2009.
Central Intelligence Agency. (2009n). Thailand’s Economy. Available at: https://www.cia.gov/library/publications/ the-world-factbook/geos/th.html. Accessed on November 25, 2009.
Central Intelligence Agency. (2009o). UK’s Economy. Available at: https://www.cia.gov/library/publications/the-world-factbook/geos/uk.html. Accessed November 25, 2009.
Central Intelligence Agency. (2009p). United Arab Emirate’s Economy. Available at: https://www.cia.gov/library/publications/the-world-factbook/geos/ae.html. Accessed on November 25, 2009.
Central Intelligence Agency. (2009q). U.S. Economy. Available at: https://www.cia.gov/library/publications/the-world-factbook/geos/us.html. Accessed on November 25, 2009.
Economy Watch. (2009a). Brazil’s Economy. Available at: http://www.economywatch.com/world_economy/brazil/. Accessed on November 25, 2009.
Economy Watch. (2009b). Canada Economy. Available at: http://www.economywatch.com/world_economy/canada/. Accessed on November 25, 2009.
Economy Watch. (2009c). China Economy China’s Economic Profile, The Chinese Economy, Economy of China. Available at: http://www.economywatch.com/world_economy/china/. Accessed November 25, 2009.
Economy Watch. (2009d). Dubai Economy. Available at: http://www.economywatch.com/world_economy/dubai/. Accessed November 25, 2009.
Economy Watch. (2009e). Iraq’s Economy. Available at: http://www.economywatch.com/world_economy/iraq/. Accessed November 25, 2009.
References | ��
© Jones & Bartlett Learning, LLC. NOT FOR SALE OR DISTRIBUTION.
© Jones & Bartlett Learning, LLCNOT FOR SALE OR DISTRIBUTION
© Jones & Bartlett Learning, LLCNOT FOR SALE OR DISTRIBUTION
© Jones & Bartlett Learning, LLCNOT FOR SALE OR DISTRIBUTION
© Jones & Bartlett Learning, LLCNOT FOR SALE OR DISTRIBUTION
© Jones & Bartlett Learning, LLCNOT FOR SALE OR DISTRIBUTION
© Jones & Bartlett Learning, LLCNOT FOR SALE OR DISTRIBUTION
© Jones & Bartlett Learning, LLCNOT FOR SALE OR DISTRIBUTION
© Jones & Bartlett Learning, LLCNOT FOR SALE OR DISTRIBUTION
© Jones & Bartlett Learning, LLCNOT FOR SALE OR DISTRIBUTION
© Jones & Bartlett Learning, LLCNOT FOR SALE OR DISTRIBUTION
© Jones & Bartlett Learning, LLCNOT FOR SALE OR DISTRIBUTION
© Jones & Bartlett Learning, LLCNOT FOR SALE OR DISTRIBUTION
© Jones & Bartlett Learning, LLCNOT FOR SALE OR DISTRIBUTION
© Jones & Bartlett Learning, LLCNOT FOR SALE OR DISTRIBUTION
© Jones & Bartlett Learning, LLCNOT FOR SALE OR DISTRIBUTION
© Jones & Bartlett Learning, LLCNOT FOR SALE OR DISTRIBUTION
© Jones & Bartlett Learning, LLCNOT FOR SALE OR DISTRIBUTION
© Jones & Bartlett Learning, LLCNOT FOR SALE OR DISTRIBUTION
© Jones & Bartlett Learning, LLCNOT FOR SALE OR DISTRIBUTION
© Jones & Bartlett Learning, LLCNOT FOR SALE OR DISTRIBUTION

�� | Chapter � An Introduction to Comparative Budgeting
Economy Watch. (2009f). Italy Economic Overview. Available at: http://www.economywatch.com/world_economy/italy/. Accessed on November 25, 2009.
Economy Watch. (2009g). Mexico’s Economy. Available at: http://www.economywatch.com/world_economy/mexico/. Accessed on November 25, 2009.
Economy Watch. (2009h). Pakistan Economy. Available at: http://www.economywatch.com/world_economy/pakistan/. Accessed on November 25, 2009.
Economy Watch. (2009i). Philippine Economy. Available at: http://www.economywatch.com/world_economy/philippines/. Accessed on November 25, 2009.
Economy Watch. (2009j). South Korea’s Economy. Available at: http://www.economywatch.com/world_economy/south-korea/. Accessed November 25, 2009.
Economy Watch. (2009k). The US Economy. Available at: http://www.economywatch.com/world_economy/usa/. Accessed on November 25, 2009.
Economy Watch. (2009l). UK Economy. Available at: http://www.economywatch.com/world_economy/united-kingdom/. Accessed November 25, 2009.
Economy Watch. (2009m). Vietnam Economy. Available at: http://www.economywatch.com/world_economy/vietnam/. Accessed on November 25, 2009.
Glewwe, P., Gragnolati, M., & Zaman, H. (2002). Who gained from Vietnam’s boom in the 1990s? Economic Development and Cultural Change, 50(4), 773–792.
Guerrero, A. (2009). Emerging Markets: EM roundup Brazil. Global Finance, 23(5), 10.Ha, Y. (2004). Budgetary and financial management reforms in Korea: Financial crisis, new public manage-
ment, and fiscal administration. International Review of Administrative Sciences, 70, 511–525.Helliwell, P. J. F., & Putnam, R. D. (1995). Economic growth and social capital in Italy. Eastern Economic Journal,
21(3), 295–307.International Monetary Fund (2009). Thailand: 2009 Article IV consultation—Staff report; staff statement; public infor-
mation notice on the executive board discussion; and statement by the Executive Director for Thailand. Washington, DC: Author.
Khaldi, M. D. (2008). Impact of foreign aid on economic development in Jordan (1990–2005). Journal of Social Sciences, 4(1), 16–20.
Khan, M. A., & Qayyum, A. (2007). Trade, financial and growth nexus in Pakistan. Economic Analysis Working Papers, 6(14). Available at: http://mpra.uni-muenchen.de/6523/. Accessed March 4, 2010.
Khatkhate, D. R. (1977). Evolving open market operations in a developing economy: The Taiwan experience. Journal of Development Studies, 13(2), 92–101.
Koo, C. M. (2008). Fiscal sustainability and it implications for fiscal policy in Korea. The Journal of the Korean Economy, 9, 497–521.
Kwiatkowski, L. (2005). Globalization, change and diversity in the Philippines. Urban Anthropology and Studies of Cultural Systems and World Economic Development, 34(4), 345–359.
Lee, C. H., & Lee. K. (1992). Sustaining economic development in South Korea: Lessons from Japan. The Pacific Review, 5, 13–24.
Li, S. M. (2001). Regional development in China: States, globalization, and inequality. China Review International, 8, 572–579.
Rubin, I. (2010). The politics of public budgeting: Getting and spending, borrowing and balancing. Washington, DC: CQ Press.The World Bank. (2006). Ghana—External review of public financial management (Vol. 1). Available at: http://
go.worldbank.org/M2ABLBG3H0. Accessed March 4, 2010.The World Bank. (2008). Development of the cities of Ghana: Challenges, priorities and tools (Africa region working
paper series number 110). Available at: http://www.worldbank.org/afr/wps/wp110.htm. Accessed March 4, 2010.
Tsui, K. (1996). Economic reform and interprovincial inequalities in China. Journal of Development Economics, 50(2), 353–368.
© Jones & Bartlett Learning, LLC. NOT FOR SALE OR DISTRIBUTION.
© Jones & Bartlett Learning, LLCNOT FOR SALE OR DISTRIBUTION
© Jones & Bartlett Learning, LLCNOT FOR SALE OR DISTRIBUTION
© Jones & Bartlett Learning, LLCNOT FOR SALE OR DISTRIBUTION
© Jones & Bartlett Learning, LLCNOT FOR SALE OR DISTRIBUTION
© Jones & Bartlett Learning, LLCNOT FOR SALE OR DISTRIBUTION
© Jones & Bartlett Learning, LLCNOT FOR SALE OR DISTRIBUTION
© Jones & Bartlett Learning, LLCNOT FOR SALE OR DISTRIBUTION
© Jones & Bartlett Learning, LLCNOT FOR SALE OR DISTRIBUTION
© Jones & Bartlett Learning, LLCNOT FOR SALE OR DISTRIBUTION
© Jones & Bartlett Learning, LLCNOT FOR SALE OR DISTRIBUTION
© Jones & Bartlett Learning, LLCNOT FOR SALE OR DISTRIBUTION
© Jones & Bartlett Learning, LLCNOT FOR SALE OR DISTRIBUTION
© Jones & Bartlett Learning, LLCNOT FOR SALE OR DISTRIBUTION
© Jones & Bartlett Learning, LLCNOT FOR SALE OR DISTRIBUTION
© Jones & Bartlett Learning, LLCNOT FOR SALE OR DISTRIBUTION
© Jones & Bartlett Learning, LLCNOT FOR SALE OR DISTRIBUTION
© Jones & Bartlett Learning, LLCNOT FOR SALE OR DISTRIBUTION
© Jones & Bartlett Learning, LLCNOT FOR SALE OR DISTRIBUTION
© Jones & Bartlett Learning, LLCNOT FOR SALE OR DISTRIBUTION
© Jones & Bartlett Learning, LLCNOT FOR SALE OR DISTRIBUTION

USAID in Jordan. (2009). The Jordanian Economy. Available at: http://jordan.usaid.gov/sectors.cfm?inSector=18. Accessed November 25, 2009.
Vrijer, E., Kock, U., & Grigorian, D. (2008). Iraq makes progress on economic front. International Monetary Fund. Available at: http://www.imf.org/external/pubs/ft/survey/so/2008/car021308b.htm. Accessed March 4, 2010.
Wildavsky, A. (1975). Budgeting: A comparative theory of budgetary processes. Boston: Little Brown.Woo, W. T. (2008). Understanding the sources of friction in U.S.–China trade relations: The exchange rate
debate diverts attention from optimum adjustment. Asian Economic Papers, 7(3), 61–95.
ENDNOTE
1. Wildavsky’s model is based on a two-by-two table with five outcomes based on the two variables. There are two possible outcomes for rich nations that are uncertain.
References | ��
© Jones & Bartlett Learning, LLC. NOT FOR SALE OR DISTRIBUTION.
© Jones & Bartlett Learning, LLCNOT FOR SALE OR DISTRIBUTION
© Jones & Bartlett Learning, LLCNOT FOR SALE OR DISTRIBUTION
© Jones & Bartlett Learning, LLCNOT FOR SALE OR DISTRIBUTION
© Jones & Bartlett Learning, LLCNOT FOR SALE OR DISTRIBUTION
© Jones & Bartlett Learning, LLCNOT FOR SALE OR DISTRIBUTION
© Jones & Bartlett Learning, LLCNOT FOR SALE OR DISTRIBUTION
© Jones & Bartlett Learning, LLCNOT FOR SALE OR DISTRIBUTION
© Jones & Bartlett Learning, LLCNOT FOR SALE OR DISTRIBUTION
© Jones & Bartlett Learning, LLCNOT FOR SALE OR DISTRIBUTION
© Jones & Bartlett Learning, LLCNOT FOR SALE OR DISTRIBUTION
© Jones & Bartlett Learning, LLCNOT FOR SALE OR DISTRIBUTION
© Jones & Bartlett Learning, LLCNOT FOR SALE OR DISTRIBUTION
© Jones & Bartlett Learning, LLCNOT FOR SALE OR DISTRIBUTION
© Jones & Bartlett Learning, LLCNOT FOR SALE OR DISTRIBUTION
© Jones & Bartlett Learning, LLCNOT FOR SALE OR DISTRIBUTION
© Jones & Bartlett Learning, LLCNOT FOR SALE OR DISTRIBUTION
© Jones & Bartlett Learning, LLCNOT FOR SALE OR DISTRIBUTION
© Jones & Bartlett Learning, LLCNOT FOR SALE OR DISTRIBUTION
© Jones & Bartlett Learning, LLCNOT FOR SALE OR DISTRIBUTION
© Jones & Bartlett Learning, LLCNOT FOR SALE OR DISTRIBUTION