China's Profits and Losses from Currency Intervention, 1994-2011

NBER WORKING PAPER SERIES
PRIVATE PROFITS AND PUBLIC HEALTH:DOES ADVERTISING SMOKING CESSATION
PRODUCTS ENCOURAGE SMOKERS TO QUIT?
Rosemary AveryDonald KenkelDean R. LillardAlan Mathios
Working Paper 11938http://www.nber.org/papers/w11938
NATIONAL BUREAU OF ECONOMIC RESEARCH1050 Massachusetts Avenue
Cambridge, MA 02138January 2006
This research was supported by Award # R01 CA094020-01 from the National Cancer Institute toCornell University, an award from the Substance Abuse Policy Research Program of the RobertWood Johnson Foundation to the National Bureau of Economic Research, and an unrestrictededucational grant to Cornell University from The Merck Company Foundation, the philanthropic armof Merck & Co. Inc. Eamon Molloy and Vandana Plassmann provided valuable research assistance.Participants at seminars at the Medical University of South Carolina, the 2005 International HealthEconomics Association Conference, the University of Kentucky, and the 2005 Robert Wood JohnsonFoundation Substance Abuse Policy Research Program Annual Grantee Meeting provided helpfulcomments. The views expressed herein are those of the author(s) and do not necessarily reflect theviews of the National Bureau of Economic Research.
©2006 by Rosemary Avery, Donald Kenkel, Dean R. Lillard and Alan Mathios. All rights reserved.Short sections of text, not to exceed two paragraphs, may be quoted without explicit permissionprovided that full credit, including © notice, is given to the source.

Private Profits and Public Health: Does Advertising Smoking Cessation Products EncourageSmokers to Quit?Rosemary Avery, Donald Kenkel, Dean R. Lillard and Alan MathiosNBER Working Paper No. 11938January 2006JEL No. I1, L1
ABSTRACT
To shed new light on the role private profit incentives play in promoting public health, in this paper
we conduct an empirical study of the impact of pharmaceutical industry advertising on smoking
cessation decisions. We link survey data on individual smokers with an archive of magazine
advertisements. The rich survey data allow us to measure smokers' exposure to smoking cessation
advertisements based on their magazine-reading habits. Because we observe the same information
about the consumers that the advertisers observe, we can control for the potential endogeneity of
advertising due to firms' targeting decisions. We find that when smokers are exposed to more
advertising, they are more likely to attempt to quit and are more likely to have successfully quit.
While some of the increased quitting behavior involves purchases of smoking cessation products,
our results indicate that advertisements for smoking cessation products also increase the probability
of quitting without the use of any product. Thus, the public health returns to smoking cessation
product advertisements exceed the private returns to the manufacturers. Because advertising of a
wide range of consumer products may have important and under-studied spillover effects on various
non-market behaviors, our results have broad implications for the economics of advertising.
Rosemary AveryDepartment of Policy Analysisand ManagementCornell UniversityIthaca, NY [email protected]
Donald KenkelDepartment of Policy Analysisand ManagementCornell UniversityIthaca, NY 14850and [email protected]
Dean R Lillard Department of Policy Analysisand ManagementCornell UniversityIthaca, NY [email protected]
Alan MathiosDepartment of Policy Analysisand ManagementCornell UniversityIthaca, NY [email protected]
1
I. Introduction
An on-going public health initiative, Healthy People 2010, aims to cut the prevalence of
smoking among U.S. adults almost in half, to 12 percent by 2010 (USDHSS 2000). Although
preventing youth from starting to smoke has probably attracted more attention, experts point out
that the Healthy People 2010 objective can not be met unless the rate of smoking cessation
increases (Mendez and Warner 2000, 2004). The Centers for Disease Control and Prevention
“Best Practices” call for State tobacco control programs to spend about $1 billion annually for
smoking cessation counseling and services (CDC 1999); but on average, States’ investments in
tobacco control are substantially below the Best Practices guidelines (CDC 2001a). At the
federal level, the U.S. Interagency Committee on Smoking and Health has endorsed a new
National Action Plan for Tobacco Cessation that includes $3.2 billion per year for a national
quitline and $1 billion per year for a national media campaign (Fiore et al. 2004).
Although many smokers quit ‘cold turkey’ without assistance, smokers are more likely to
successfully quit if they use a pharmaceutical smoking cessation product such as a nicotine
replacement therapy (Fiore et al. 2000). The cessation product industry’s estimated retail sales
are nearly $1 billion annually, and in recent years the industry has spent between $100 to $200
million annually advertising these products (Marketdata Enterprises 2000; MarketResearch
2005; Competitive Media Reports, various years). The potential public health benefits of this
advertising have not been overlooked. For example, in 1996 the American Cancer Society’s
Great American Smoke Out (GASO) included an advertising campaign that was jointly
sponsored with a manufacturer of a cessation product. Burton et al. (1997) estimate that paid
advertisements from the 1996 GASO campaign reached 122 million adults. To shed new light

1Bradford and Kleit (2006) provides a review of this research. Notable examples includeBerndt et al. (1995), Iizuka and Jin (2005a. 2005b), Ling, Berndt and Kyle (2002), Calfee,Winson and Stempski (2002), Rosenthal et al. (2003), Tauras, Chaploupka and Emery (2005),and Wosinska (2003, 2005).
2
on the role private profit incentives play in promoting public health, in this paper we conduct an
empirical study of the impact of pharmaceutical industry advertising on smoking cessation
decisions.
Advertising’s role in the economy is controversial, and advertising in health-related
markets is especially so. Currently, the U.S. and New Zealand are the only countries that allow
direct-to-consumer (DTC) advertising of pharmaceutical products. The U.S. pharmaceutical
industry’s expenditures on DTC advertising increased from $300 million in 1993 to $3.75 billion
in 2002 (Rosenthal et al. 2002). Empirical studies provide a growing body of evidence on the
impact of DTC advertising on consumer demand for pharmaceutical products1. Recently,
however, manufacturers have been forced to withdraw heavily-advertised products for safety
reasons, prompting new concerns about DTC advertising. In other health-related markets,
producer advertising has been shown to be an important source of health information that leads
to changes in dietary fiber and fat consumption (Ippolito and Mathios 1990, 1995).
To contribute a case study to the academic and policy debates about advertising, this
paper develops estimates of the key impacts of magazine advertisements of smoking cessation
products. As discussed in more detail in section II below, private incentives to advertise these
products partially align with the public health objective to increase smoking cessation. But to
the extent product advertising spills over and encourages cold turkey cessation, the

3
advertisements create positive externalities and some of the social returns to advertising are not
captured as private profits.
Our data and econometric approach are discussed in sections III and IV. Identifying the
causal impact of advertising is a difficult empirical challenge. The relationship between
advertising and consumption is literally a textbook example of simultaneous equations (Berndt
1991): Are consumers responding to the advertising, or are advertisers responding to the
consuming? Studies that rely on instrumental variables to identify the causal impact of
pharmaceutical advertisements face the almost inevitable questions about the validity and
strength of the IVs. Our alternative approach is to instead exploit rich data that provide what we
argue is a strong identification strategy. We link survey data on individual smokers with an
archive of magazine advertisements. The rich survey data allow us to measure the smokers’
exposure to smoking cessation advertisements based on their magazine-reading habits. Because
we observe the same information about the consumers that the advertisers observe, we can
control for the potential endogeneity of advertising due to firms’ targeting decisions. In addition,
we control for the general category of magazines consumers read: general interest, women’s, and
so on. With these controls, our identification is based on within-category variation in exposure
to advertisements, for example because one smoker reads Time while another reads Newsweek.
Our results are presented in section V. We find that when smokers are exposed to more
advertising, they are more likely to attempt to quit and are more likely to have successfully quit.
While some of the increased quitting behavior involves purchases of smoking cessation products,
our results indicate that advertisements for smoking cessation products also increase the
probability of quitting without the use of any product. Thus, the public health returns to smoking

4
cessation product advertisements exceed the private returns to the manufacturers. Section VI
closes the paper with discussion of the broader implications of our results.
II. Background and Framework for Analysis
Profit-Maximizing Advertising of Smoking Cessation Products
Smokers’ desires to quit create a healthy demand for smoking cessation products. In
surveys, most smokers claim that they want to quit, and nearly half of current smokers report
having stopped smoking for at least one day in the past year in an attempt to quit (CDC 2005).
When they attempt to quit, at least two-thirds of smokers use a method like ‘cold turkey’ that
does not involve a product purchase. However, in recent years about 20 percent of smokers who
attempt to quit report using a pharmaceutical smoking cessation product (Plassman et al. 2005).
To set the stage for the role of advertising, first consider a simple utility-maximizing
model of consumer demand for smoking cessation products. Assume that smoking cessation, q,
is produced in the household through some combination of smoking cessation products, s, which
are purchased in the market, and non-market inputs of time and effort: q = q(s, .). The demand
for smoking cessation products is thus derived from the demand for smoking cessation. The
demand for smoking cessation, in turn, is derived from the demand for health. The private value
of smoking cessation v could be formally defined as the difference in lifetime utility from
quitting and the lifetime utility from continuing to smoke (Becker and Murphy 1988; Suranovic,
Goldfarb, and Leonard 1999; Jones 1999). To find the utility-maximizing choice of smoking
cessation products (s*), the consumer sets the marginal benefits equal to the market price (PS ):
(1) v C qS = PS

2Bagwell (2005) provides an excellent review of the economics of advertising. AlthoughNicorette gum’s monopoly ended in 1992 with the introduction of the nicotine patch, as Bagwell(2005, p. 54) argues, the monopoly case “represents a simple setting within which to begin theformal analysis of advertising.” The model traces back to Dorfman and Steiner (1954) andSchmalensee (1972).
5
where qS is the consumer’s perception of the marginal product of smoking cessation products in
producing a successful quit.
Advertising can provide consumers information about the health benefits of quitting (v),
and it can provide information about the usefulness of the products as an aid to quitting (qS ).
(Price advertising does not seem common in this market.) This implies a market demand
function for smoking cessation products as a function of product price and advertising messages
(M): S = S( PS , M). Our approach focuses on informative advertising for a smoking cessation
product as a search good. Although an advertisement can provide information about the average
effectiveness of the product in helping smokers quit, there appears to be substantial individual
heterogeneity so that a product may or may not be that helpful for a specific smoker. In this way
a smoking cessation product also has the characteristics of an experience good. However, unlike
other experience goods, once the smoker finds the product that works for him, there will not be
repeat purchases. While we use a simple static model, we recognize that in reality smoking
cessation is a process that often involves multiple attempts (Prochaska and DiClemente 1983,
DiClemente et al 1991).
We use a standard model of the economics of monopoly advertising to examine the profit
incentives to advertise smoking cessation products.2 Let the profits of a monopolist
manufacturer of a smoking cessation product be given by:
(2) Profits = PS S( PS , M) - C( ) - M PM

6
where in addition to terms defined above, C ( ) is the firm’s cost function for producing smoking
cessation products and PM is the price it pays for advertising messages (as a price taker in the
advertising market).
The first order condition for the profit-maximizing level M* of advertising messages is:
(3) (PS - MC) [MS/MM] = PM
In words, equation (3) simply states that the manufacturer equates the marginal impact of
an advertising message on its profits (PC -MC) to the price of an advertising message. If there
were competing firms in the market, the relevant version of equation (3) would include
additional terms that capture the impact of the conjectured reactions of its competitors to the
firm’s own advertising.
Advertising of Smoking Cessation Products and Public Health
While the manufacturer is concerned with sales of its product, the public health objective
concerns successful smoking cessation. A simple analysis suggests three reasons that, compared
to the socially desirable level, private smoking cessation product manufacturers may fail to
advertise enough due to: (i) the public health externalities from the advertising; (ii) the public
health externalities from smoking cessation; and (iii) the monopoly distortion in the market.
Consider an aggregate or societal production function that shows the annual number of
smokers who quit (Q) as a function of the aggregate use of smoking cessation products (S) and
the use of ‘cold turkey’ or non-purchased methods (T) of smoking cessation: Q = Q (S, T).
Empirical studies suggest that DTC advertising of one pharmaceutical product can spill over and
increase demand for related products (Ling, Berndt and Kyle 2002, Rosenthal et al. 2003,
Wosinska 2003, 2005 and Iizuka and Jin 2005a). Analogously, we assume that advertising

3Clearly, this would not hold in a dynamic setting where future potential consumers ofthe product could learn about its ineffectiveness.
7
messages for smoking cessation products not only increase product sales (MS/MM > 0), but may
also spill over and affect smokers’ attempts to quit without purchasing any product (MT/MM > 0).
If V is the social value or societal willingness to pay per successful smoking cessation, the net
social benefits of advertising smoking cessation products are:
(4) Net social benefits = V C Q (S (PS , M), T (., M) ) - PM M
The socially optimal amount of advertising M** is where the social marginal benefits
equal the marginal cost of advertising:
(5) V C QS ( MS/MM) + V QT (MT/MM)] = PM
Comparing the left hand sides of equations (3) and (5) reveals the extent to which private
profit incentives to advertise are aligned with public health goals. The first point to note is that in
the static framework used, in equation (3) the manufacturer’s profits do not depend on whether
the product is actually effective (QS > 0)3. This point is moot for the case of modern smoking
cessation products, because there is strong evidence of effectiveness. Based on a meta-analysis
of evidence from clinical trials, the current Public Health Service’s Clinical Practice Guidelines
concludes that: “Numerous effective pharmacotherapies for smoking cessation now exist....that
reliably increase long-term abstinence rates,” and identifies buproprion, nicotine gum, nicotine
inhaler, nicotine nasal spray, and the nicotine patch as first-line pharmacotherapies (Fiore et al.
2000). The results of the meta-analysis suggest that compared to the control groups (cold turkey
quitting), product use approximately doubles the probability of successful smoking cessation.
Note that ‘cold turkey’ quitting is sometimes successful, however, so QT is also positive.

4Some estimates suggest that current cigarette taxes are sufficiently high so that the netnegative externality of smoking is small or zero (Manning et al 1991; Viscusi 1995). Morerecently, Sloan et al. (2004) estimate that the external cost of smoking is $2.20 per pack,substantially higher than the average excise tax on cigarettes in the U.S. The remaininguninternalized external costs of smoking imply that the social value of quitting, V, is greater thanthe private value of quitting, v. By the same token, if by lowering the perceived addiction costs,smoking cessation product advertisements have the unintended consequence of increasingsmoking initiation, the advertisements could generate negative externalities. Because we do nothave data on smoking initiation, our empirical analysis focuses on smoking cessation.
8
The spillover effects of product advertising on cold turkey quitting are given by the
second term on the left hand side of equation (5). The sign and magnitude of the impact of
private advertising on cold turkey quitting, MT/MM, is an empirical question. Given that product
advertising may often serve to inform or remind smokers of the private value of quitting, it is
reasonable to expect that MT/MM is also positive, creating positive public health externalities from
private advertising.
In addition to the advertising externalities, comparing the first terms in equations (3) and
(5) reveals the possible public health externalities from smoking cessation and the monopoly
distortion in the market. These suggest additional reasons that the profit-maximizing level of
advertising M* will fail to reach the socially desirable level M**. Because utility maximization
implies that the consumer sets the marginal benefits of product use equal to its market price,
from equation (1) we can substitute v C qS for PS in the first term in equation (3). The
comparison of the first terms then hinges on how (v C qS - MC) compares to V C QS . If consumer
perceptions of the effectiveness of the products are on average correct, then qS = QS . Public
health externalities from smoking cessation – including the reduction of secondhand smoke and
insurance externalities – may mean that the social value of smoking cessation is greater than the
private value: V > v.4 The monopoly distortion in the product market also means that increasing

9
product use is socially valuable at the margin. Although the smoking cessation product market
is no longer a pure monopoly, this type of distortion is probably still relevant because patents
and the FDA approval process limit the extent of market competition. Under these assumptions,
(V C QS ) > (v C qS ) - MC.
Our analysis thus suggests a number of reasons to expect that the marginal social benefits
of advertising smoking cessation products are larger than the marginal impact on the firm’s
profits. Assuming diminishing marginal effectiveness of advertising messages implies that the
socially optimal level of advertising M** must therefore exceed the profit-maximizing level M*.
This conclusion emerges from a simple model that highlights some of the main tradeoffs in the
welfare economics of advertising smoking cessation products. In our empirical analysis we
estimate whether and how advertising affects several types of smoking cessation behavior. Our
estimates shed light on the private and public returns from smoking cessation product
advertisements. In terms of private profits, we directly estimate whether and how much
advertisements change the probability that a smoker attempts to quit using a smoking cessation
product. This estimate corresponds to the term MS/MM in equation (3). In terms of public health,
we also estimate whether and how much advertising affects the probability that a smoker
successfully quits - both overall and with or without the use of a product. These estimates of the
total impact of advertising correspond to the terms QS C MS/MM and QT C MT/MM in equation (5).
III. The Data and the Variables of Analysis
Data
Our individual-level data comes from a marketing survey, the Simmons National
Consumer Survey (NCS). The NCS provides detailed information on consumer behavior and

10
magazine-reading and television-viewing habits (NCS 2005). The Data Appendix provides
additional information about the NCS. We pool data from the Fall 1995, Spring 1996, Spring
1997, Fall 1997, Spring 1998, Fall 1998, and Fall 1999 cross-sections of the NCS. Because we
are studying smoking cessation, we restrict our sample to the 36,097 current or former smokers
who report having been a smoker within the past year.
We draw our advertising data from the Smoking Cessation Advertisements (SCADS)
archive that we compiled. The SCADS archive is a collection of all print advertisements for
smoking cessation products, tobacco products, and smoking-related public service
announcements that appeared between January 1985 and May 2002 in 26 consumer magazines.
The magazine set includes: Better Homes & Gardens, Black Enterprise, Business Week,
Cosmopolitan, Ebony, Essence, Family Circle, Glamour, Good Housekeeping, Jet, McCall's,
Modern Maturity, Money, National Geographic, Newsweek, People, Playboy, Readers Digest,
Rolling Stone, Seventeen, Sports Illustrated, Time, TV Guide, U.S. News &World Report,
Vogue, and Women's Day. We selected these magazines to represent magazines most frequently
read by individuals with particular demographic characteristics. Using magazine circulation and
readership data from three independent sources, we estimate that the 26 magazines in SCADS
account for between 30.0 and 57.5 percent of magazine circulation or readership in the US. (The
Data Appendix provides additional discussion of the choice of magazines and the sources of
these estimates.)
Although the SCADS magazines are a substantial portion of the market, the sample of
advertisements in SCADS is not a strictly random sample of all magazine advertisements. To
establish how well advertising in SCADS magazines tracks all magazine advertising, we

5A simple regression of monthly advertising expenditures on the number of SCADSadvertisements in that month confirms that the variation in the SCADS data explains most of thevariation in advertising expenditures (R-squared = 0.79).
11
Figure 1SCADS advertisements versus CMR magazine advertising expenditures
0
100
200
300
400
500
600
700
800
1986 1987 1988 1989 1990 1991 1992 1993 1994 1995 1996 1997 1998 1999 2000 2001 2002
Year
Page
s of
adv
ertis
emen
ts
0
10000
20000
30000
40000
50000
60000
70000
Adv
ertis
ing
expe
nditu
res
('000
s)
PagesExpenditures
Source: SCADS data archive and CMR/TNS Media E dit
compare the number of advertisements of smoking cessation products in SCADS to data from
Competitive Media Reports on magazine advertising expenditures for the same products. Figure
1 plots the pages of advertisements that appeared in the SCADS magazines in each year and total
magazine advertising expenditures in the same years. Figure 1 shows that the advertising in
SCADS closely tracks total advertising expenditures.5 The only deviation between the SCADS
advertisements and the annual advertising expenditures is in 2002. That difference occurs
because currently the SCADS archive ends in May, before the October 2002 launch and
subsequent advertising of the Commit nicotine lozenge.

12
Table 1 presents the definitions and descriptive statistics for the main variables of interest
created from the NCS and the SCADS data. Appendix Table A1 presents summary statistics for
the other variables we include in our models. We now turn to a more detailed discussion of the
key measures of smoking cessation behavior, advertising exposure, and other control variables
used in our analysis.
Measures of Smoking Cessation Behavior
We created a series of measures of smoking cessation behavior using responses to several
questions posed to all NCS respondents. We use responses to the question, “Did you attempt to
quit smoking in the past 12 months?” to code our measure of a quit attempt. Forty-three percent
of our sample of smokers attempted to quit in the past 12 months; this is comparable to estimates
from the National Health Interview Survey and other national health surveys. We combine the
response to the question about quit attempts with answers to the question, “Do you currently
smoke?” to identify respondents who “successfully” quit. These individuals are smokers who
tried to quit smoking the past year and do not currently smoke. Measured this way, 9.4 percent
of our sample successfully quit. This quit rate is higher than other estimates that suggest that
less than 5 percent of current smokers successfully quit each year. This difference is at least
partly because the time frame of the NCS does not allow us to measure long-term abstinence
from smoking. Although for convenience we use the term “successful quitting” in the remainder
of this paper, this caveat should be kept in mind. Another caveat is that the self-reported quitting
behavior may not always be accurate. However, a meta-analysis of studies that compared self-
reported smoking with biochemical markers of smoking shows that most people accurately

13
report their smoking status (Patrick et al 1994), which provides indirect support for the accuracy
of self-reported quitting behavior.
The NCS also asked all respondents who attempted to quit smoking about the methods
they used in the attempt. We combined these responses with our measures of attempted and
successful quits to create additional measures of smoking cessation: a quit attempt with the use
of a smoking cessation product; a quit attempt without the use of a smoking cessation product; a
successful quit with the use of a smoking cessation product; and a successful quit without a
smoking cessation product. When we use the various measures of smoking cessation behavior as
dependent variables in our econometric models, except for the probability of a quit attempt, the
probability being estimated is the joint probability of each previous decision. For example, when
we estimate the probability of a successful quit attempt using a smoking cessation product, we
are estimating a model of the joint probability that a smoker attempts to quit, the probability he
uses a smoking cessation product, and the probability that he succeeds.
Measure of Individual Exposure to Advertising
To construct measures of the advertising to which each NCS respondent was exposed we
merge all of the SCADS advertising data to each person in the NCS sample. In the NCS, each
respondent is shown copies of the covers of over 100 consumer magazines. He then reports how
many of the last four issues of each magazine that he read. The variable Readim is the fraction of
issues of magazine m read by person i. For each SCADS magazine that an NCS respondent
reported having read, we multiply the fraction of the last four issues he read times the number of
advertisements that appeared in that magazine over the previous 12 months. Note that, in doing
so, we assume that an individual’s reading habits over the past four issues reflects his reading

14
habits over the past year. We then sum over all magazines in the SCADS sample. The result is
our estimate of advertising to which a person was potentially exposed by reading the SCADS
magazines. For example, the exposure to smoking cessation product advertising of respondent i
(AdExpi) is given by:
(6) AdExpi = Ads adimm
im=∑
1
26
* Re
where subscript m refers to each of the 26 magazines in the SCADS sample. Our measurement
approach assumes that two people who read the same number of issues of the same magazines
were exposed to the same number of advertisements. This is imperfect because we do not know
if both people actually saw the advertisements, but it represents a vast improvement over
previous research. Previous studies use market-level data on advertising, which requires the
implicit assumption that all individuals in a given market are exposed to the same advertising.
We construct exposure measures for smoking cessation products, cigarettes, other
tobacco products, and smoking-related public service announcements (PSA). Based on our
measures, the average current or former smoker in our sample was exposed to 13.5
advertisements for smoking cessation products over a 12 month period. By contrast, the average
current or former smoker was exposed to more than ten times as many advertisements for
cigarettes in the same magazines –about 144.9 advertisements over a 12 month period, but was
exposed to very few (less than one) anti-smoking PSAs.
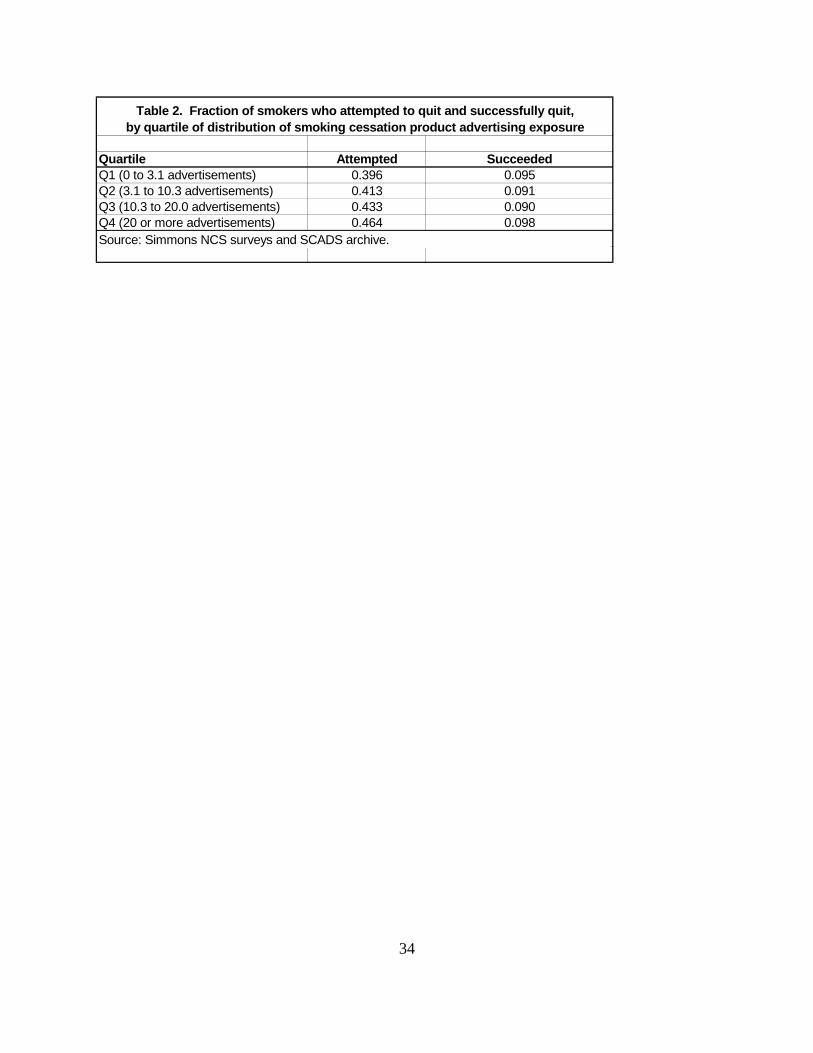
To get a first glimpse of the relationship between cessation behavior and exposure to
advertising of smoking cessation products, Table 2 shows the fraction of past-year smokers who
attempt to quit and the fraction who successfully quit across different quartiles of the distribution

15
of exposure to advertisements for smoking cessation products. Table 2 shows a clear
relationship between the number of smoking cessation product advertisements a past-year
smoker potentially saw and the propensity to attempt to quit. While 39.6 percent of smokers in
the first quartile of the exposure distribution attempted to quit, 46.4 percent attempted to quit if
they were in the highest quartile of the exposure distribution. The fraction of past-year smokers
who attempt to quit steadily increases as they are exposed to more smoking cessation product
advertising. However, when one plots the fraction of past-year smokers who successfully quit
against exposure to smoking cessation product advertising no clear pattern emerges. Roughly
the same fraction of past-year smokers in the first and fourth quartiles succeeded in their quit
attempt (9.5 and 9.8 percent respectively).
Other Control Variables
We also include in our models standard socio-economic control variables (age, sex, race,
education, marital status, family size, presence of children in the household, employment status,
family income) as well as controls for overall magazine-reading habits, television-viewing
habits, and radio-listening habits. Over the previous 12 months, the average person in our
sample read 144 issues of one or more of the magazines consistently included in the NCS. Note
that only four percent of respondents reported that they read no magazines. The average current
or former smoker in our sample watched 23 hours of television per week and listened to the radio
about 4 hours per week. Sixteen percent of the sample watched no television and 26 percent did
not listen to the radio in an average week.

6For example, for the latent variable y* that describes the net benefits of attempting toquit with a smoking cessation product, equation (1) implies that y* = v qS - PS. As discussedabove, advertising may change the value a smoker attaches to quitting (v) and how effective hethinks the product will be qS. Characteristics such as age and schooling are included in thevector of explanatory variables Z in equation (7) as additional possible determinants of v. Ourdata lack measures of PS, the price of the product. Below we discuss why we expect productprice to be uncorrelated with our measure of advertising exposure.
16
IV. Econometric model and identification
As defined above, we use various discrete measures of smoking cessation behavior in the
past year as our key dependent variables. We adopt the usual approach by assuming that the
discrete outcomes we observe are related to underlying latent variables describing the net
benefits of the smoking cessation behaviors6. We assume the underlying latent variables are
linear functions of exposure to advertising and characteristics of the person and his household.
We specify the general relationship as:
(7) Yi* = (0 + (1 AdExpi + Z (2 + ,i
where AdExpi refers to exposure to smoking cessation advertising, Z is a vector of other control
variables, and ,it is an error term. We observe the given smoking cessation behavior (denoted by
Yi), only if the continuous latent variable exceeds a critical threshold. Under the standard
formulation, Yi = 1 if Yi* >0 and Yi = 0 otherwise. We estimate equation (7) by maximum
likelihood probit.
Our econometric approach uses variation in exposure to advertisements due to magazine-
reading habits as a natural experiment to identify the causal effect of advertising on smoking
cessation. Because the NCS data allow us to include a rich set of control variables in our
models, we believe that the identifying variation in advertising exposure is exogenous, i.e.,
AdExpi is uncorrelated with the error term ,i in equation (7). In addition to including standard

17
controls for individual socio-economic characteristics, we take several steps to further strengthen
our identification strategy. First, our models include controls for general magazine-reading
habits and exposure to other media. In this way, we control for the possibilities, say, that heavy
magazine-readers or television-watchers somehow differ in their unobserved propensity to quit
smoking. Second, and probably more important, our models include a set of dummies reflecting
whether an individual read at least one issue of a SCADS magazine in the following general
categories: general interest, women’s, young women’s, men’s, and African-American. We also
include a set of over 100 dummies reflecting whether an individual read at least one issue of
each of the over 100 other magazines not included in SCADS. With these controls, our
identification is based on within-category variation in exposure to advertisements in the SCADS
magazines, for example because one person reads Time while another reads Newsweek.
The richness of our data allow us to address two potential challenges to relying on this
type of natural experiment for identification. First, it would be an invalid source of identification
if there are unobserved characteristics that determine people’s choices to read Time instead of
Newsweek that also determine their smoking cessation decisions. In other consumer contexts,
this seems likely. For example, some speciality magazines cater to consumers with specific
spending propensities; consumers who read a magazine devoted to firearms are more likely to
purchase ammunition, independent of their exposure to ammunition advertisements. In our
context, the measure of advertising is unlikely to be correlated with unobservable characteristics
in this way because we measure advertising in magazines read by general audiences or by broad
sub-groups (women’s, men’s, etc.). We believe it is implausible that smokers who plan to quit
choose to read Time because it contains more advertisements for smoking cessation products.

7Of course, we do not include literally every possible explanatory variable from the NCSdata. Our claim is that our econometric specification approximates the model firms use to targettheir advertisements.
18
Second, our identification strategy would be weaker if we did not observe the individual
characteristics the firms might use to target advertisements across magazines. Table 3 reports
the results of an auxiliary regression that suggests that firms do in fact use the characteristics of
magazines’ readers to target advertising. The regression shows that our measure of advertising
exposure (AdExpi ) is statistically and significantly associated with a number of observable
characteristics. For example, past-year smokers are exposed to more advertisements if they are
older (up to the age of about 60), more educated, female, higher income, and have health
insurance. These characteristics are also very plausibly associated with a higher propensity to
attempt to quit, even independent of differences in advertising exposure. The patterns in Table 3
are thus consistent with profit-maximizing producers targeting their advertisements to magazines
read by many potential quitters, in order to capture a larger market share of those quitters as
buyers of their products. So even if the advertisements do not encourage cessation, this reverse
causality would yield spurious results in our probit models of the effect of advertising on
smoking cessation behaviors.
However, the strength of our data largely eliminates the potential for reverse causality.
We are using exactly the same data that producers use for their advertising decisions: The NCS
website’s promotion materials state that their data are used by every major marketing firm and
advertising agency in the U.S. (NCS 2005). Therefore, as econometricians we can observe and
control for the same characteristics that firms use to target advertising. Instead of being in the
error term ,i in equation (7), we include these characteristics in the Z vector.7 Because we

8Although it has many advantages, the NCS data set does not contain prices of smokingcessation products and does not consistently provide information on respondents’ geographiclocation (which could be used to merge market-level price measures and policy variables). The1999 wave of the NCS contains information on the state of residence of all respondents. For the1995-1998 waves, the NCS contains information on the city of residence for respondents livingin the largest markets. Using this information, it is possible to identify state of residence forabout half of these samples.
19
control for the same characteristics, we econometrically identify the effect of advertising using
differences in exposure for people who are observationally equivalent on the observed
characteristics. For example, while all college-educated smokers are exposed to more
advertisements, our identification does not use between-educational-group variation and only
relies on the within-group variation among past-year smokers with similar levels of education.
Our identification strategy should also minimize any bias stemming from the fact that
data limitations force us to omit from our empirical models: product prices; cigarette prices; and
measures of tobacco control policies.8 Because firms simultaneously choose advertising levels
and product prices, in some empirical contexts it would be important to control for the product
prices consumers face. Similarly, because firms might adjust their advertising of smoking
cessation products in reaction to a state cigarette tax hike or enactment of a new worksite
smoking ban, it could be important to control for these variables as well. However, we exploit
individual level variation in advertising exposure that arises because individuals read different
nationally distributed magazines. In this empirical context, the variation in advertising exposure
can be expected to be uncorrelated with state and local variation in product prices, cigarette
prices, and tobacco control policies. Product prices could be correlated with our measure of
advertising exposure only if firms can price discriminate across consumers. Although firms may
be able to price discriminate across consumers by providing coupons, of the advertisements for

9Rather than an actual coupon, the advertisements typically include a reference to a toll-free telephone number or a website where coupons can be obtained.
20
smoking cessation products in the SCADS archive from 1994 - 1999, only 8 percent (38 of 451
advertisements) contained references to coupons.9 This suggest our empirical strategy will
mainly identify an advertising effect, not a coupon effect.
As a final note, we compare our identification strategy to approaches used in previous
studies of pharmaceutical advertising. Other studies that use market-level data rely on temporal
variation in advertising and/or differences in advertising expenditures across markets to identify
the effects of advertising (see the references in footnote 1). In contrast to our approach, these
studies are more likely to face the reverse causality problem if producers react to underlying
variation in the propensity to quit smoking and target their advertising efforts to capture market
share. For example, over the calendar year the propensity to quit smoking is probably higher in
January due to New Year’s resolutions. Producers also advertise smoking cessation products
more heavily in January: average advertising expenditures in January are twice as high as in the
summer months (Avery et al. 2005a). If producers compete for market share among a fixed
stock of New Year’s- inspired cessation attempts, it could create a positive association between
monthly advertising and cessation rates even if advertising does not causally affect cessation.
Relying on variation in advertising expenditures across markets could create a similar bias. For
example, according to CDC (2001b) estimates, across major metropolitan areas the rate of adult
smoking prevalence varies from a high of 31 percent in Knoxville Tennessee to a low of 13
percent in Orange County California. It would not be surprising for manufacturers of smoking
cessation products to compete for market share of potential quitters by targeting heavier-smoking

10Berndt (1991) uses the firm’s cost of advertising as his textbook example of an IV thatcan be excluded as a direct determinant of consumer demand. Advertising costs will be a validIV, only if they vary over time and/or across markets independently of unobserved determinantsin consumer demand. In practice such variation may be hard to find. For example, Iizuka andJin (2005b) use the average wage in occupations related to the costs of media production as anIV for pharmaceutical advertising. This source of identification will be invalidated, however, ifunobserved market-specific shocks drive up wages in media-related occupations and also makethe same markets more lucrative places in which to advertise. Our intent here is not to single outfor criticism this or any other study that uses IVs, but to stress that the IV approach requiresuntestable and often controversial assumptions.
21
metropolitan areas like Knoxville. Some previous studies use the method of instrumental
variables and treat advertising as endogenous, but these studies face the challenge of finding
sufficiently powerful IVs that can be excluded from a model like equation (7) and are
uncorrelated with the error term.10 Given the well-known challenges of IV estimation, we
believe our data-driven identification strategy provides a compelling alternative approach.
V. Results
Tables 4, 5 and 6 report selected coefficients from our probit models of smoking
cessation behaviors. Overall, the results suggest that exposure to smoking cessation advertising
does indeed influence the behavior of smokers. When smokers see more advertising, they are
more likely to attempt to quit and are more likely to successfully quit (Table 4). In the models
reported in Tables 5 and 6, we distinguish whether the quit attempts or successful quits involved
the use of a smoking cessation product. We find that exposure to more smoking cessation
product advertisements increases quit attempts and successful quits with or without the use of
products. In columns 2 and 4 of the Tables we add a quadratic term to allow the probit index to
be nonlinear in advertising exposure. In two of the three quit attempt models, we find evidence
that the relationship is non-linear. We find no evidence of non-linearities in the models of

11Estimates from these alternative specifications are relatively imprecise. If firmsdiscover over time that advertisements in certain magazines are more effective, we would expectto find that the estimated impact of the advertisements is higher in later survey waves. Thiswould be problematic for our identification strategy, but we find no evidence it is occurring. Wehave also examined the pattern of advertisements across magazines over time, and find noobvious signs that advertisers are changing the targeting of their advertisements in response towhat they learn over time.
22
successful quits. We have explored several other specification issues in additional models that
are not reported but are available upon request: (i) we find that the effects of advertisements for
prescription products were generally similar to the effects of exposure to advertisements for
products available over the counter; and (ii) we find that the effects of advertisements across
survey waves are generally similar.11
Table 7 presents results that illustrate the magnitude of the estimated relationships
between advertising exposure and the smoking cessation behaviors. In Table 7 we use our
model estimates to predict the probability of the smoking cessation behaviors at different levels
of exposure to advertisements for smoking cessation products. To predict each probability, we
calculate the underlying index with each person’s actual value of all independent variables
except for the smoking cessation product advertising. We then construct five versions of the
underlying index with values of smoking cessation advertisements set to 0, 5, 10, 15, and 20
advertisements. These values span the range of observed magazine advertising for smoking
cessation products in our sample during our sample period. For each outcome, we then average
the predicted probability across all respondents.
Reading across the top row in Table 7, our model predicts that exposure to an additional
five advertisements increases the probability of attempting to quit by almost 1.5 percentage
points. The impact of additional advertisements on quit attempts slightly diminishes at higher

23
levels of advertising exposure. Interestingly, our results suggest that quit attempts that involve
the use of a product are not very responsive to advertisements; quit attempts that do not involve
the use of a product are much more responsive. Our model of a successful quit predicts that
exposure to an additional five advertisements increase the probability by a little less than ½
percentage point. In this case, the impact of additional advertisements on quit attempts slightly
increases at higher levels of advertising exposure. Successful quits with and without the use of a
product show similar responsiveness to advertising.
The models reported in Tables 4- 6 include a rich set of control variable, but we only
report here our findings for exposure to other types of smoking-related advertisements. (An
Appendix with complete results is available on request.) The results suggest that exposure to
cigarette advertising reduces the probability of attempted and successful quits; this question is
explored in detail in Avery et al. (2005b). There is also some evidence that exposure to
advertising for other types of tobacco products reduces the probability of a successful quit. We
find no evidence that smokers who are exposed to more anti-smoking public service
announcements in magazines are more likely to attempt or to successfully quit smoking.
VII. Discussion
Our empirical results help quantify both the private profits and public health returns to
smoking cessation product advertising. A back-of-the-envelope calculation illustrates the
magnitude of these returns. If the industry increased its average annual expenditures on
magazine advertising by about $2.6 million or 10 percent, we calculate that it would expose the

12Over the period covered in our sample (1996-1999), annual expenditures on magazineadvertising averaged about $26 million (Competitive Media Reports various years). Assumingconstant average costs, a 10 percent increase in expenditures corresponds to a 10 percentincrease in the number of advertisements. In our sample the average respondent was exposed to13.5 advertisements in SCADS magazines. Because the SCADS magazines account forsomewhere between 30.0 and 57.5 percent of magazine circulation or readership, our measuresof advertising exposure probably account for a similar fraction of total advertising exposure.This implies that respondents were exposed to between 23.5 to 45 advertisements in total. Weassume the average exposure was 35 advertisements, the approximate mid-point of this range, soa ten percent increase corresponds to 3.5 more advertisements.
13Our back-of-the-envelope calculation is too uncertain to draw strong conclusions aboutthe profitability of advertising, but these numbers seem roughly consistent with the first ordercondition for profit maximization given by equation (3). A key assumption in the calculation isthe amount of spending by the typical product user. In 1996, estimates of the maximum cost of three months of the nicotine gum or patch range from $400 to $745 (Novotny et al 2000, pp.297-298). The usual recommendation is that the products should be used for up to 10 weeks, sosome users may be spending much less than $400 - $745. Nicotine gum and patches aretypically sold in packages containing a 1-week supply or more, so at a minimum product useprobably involves expenditures of at least $35.
24
average consumer to about 3.5 more advertisements each year.12 Our empirical models predict
that such an increase in advertising would increase cessation attempts by about 1.0 percentage
points, from a baseline of 43 percent. In the mid-1990s there were (in round numbers) 50
million smokers, so a 1.0 percentage point increase corresponds to 500,000 new attempts to quit
smoking. However, our empirical results also suggest that only about 11,000 of these new quit
attempts would involve the use of a smoking cessation product. Assuming the typical user
spends about $300 on the products, our results suggest that increasing advertising expenditures
by $2.6 million might increase sales by about $3.3 million.13 The industry might see some
additional future return from stimulating 489,000 attempts where products were not used, to the
extent that smokers who fail in their first attempt eventually resort to products in their future
attempts. Psychological research suggests that smokers typically make multiple attempts before

25
they successfully quit, moving through stages of change from contemplation to action
((Prochaska and DiClemente 1983, DiClemente et al 1991). Advertising might move smokers
along in this process.
Our models predict that the public health gains from increasing advertising exposure by
3.5 advertisements would be to increase successful cessation by 0.2 percentage points. With
about 50 million current smokers, this implied effect translates into 100,000 additional quits each
year. One way to consider the longer-term implications of 100,000 extra quits annually is in
terms of steady state smoking prevalence. In the steady state, the rate of smoking prevalence =
i / (i + c), where i is the smoking initiation rate and c is the smoking cessation rate. In the mid-
1990s, the smoking initiation rate was about 0.01 (1.5 million new smokers/ 150 million
non-smoking adults), and the smoking cessation rate was about 0.03 (1.5 million quits/ 50
million smoking adults), yielding a steady state smoking rate of 25 percent. Increasing the
smoking cessation rate by 0.2 percentage points implies that the steady state smoking rate falls to
23.8 percent. Although not a large drop, it is more than half of the observed drop over the
1990s, when actual smoking prevalence fell from 25.5 percent in 1990 to 23.3 percent in 2000.
Tobacco control efforts have since intensified, especially after the 1998 Master Settlement
Agreement with the cigarette industry, and smoking prevalence has fallen further to 20.9 percent
(CDC 2005). Private advertising of smoking cessation products may have contributed to some
of this drop as well.
Public health advocates have called for more government expenditures on programs to
promote smoking cessation. Our analysis and empirical results could be used to argue for
subsidies for cessation product advertisements, but it is even simpler to argue for less regulation.

26
Avery et al. (2005a) note the irony that in some ways, advertisements of pharmaceutical
products for smoking cessation have been more heavily regulated than cigarette advertisements.
Food and Drug Administration (FDA) regulations increase the cost of magazine advertisements
for prescription products by requiring an extra page of disclosures about side effects. Avery et
al. (2005a) estimate if the FDA had allowed all smoking cessation products to be sold over the
counter instead of by prescription only, thus escaping this requirement, the number of smoking
cessation advertisements would have increased by 80 percent. Looking to the future, the
pharmaceutical industry continues to develop new products for smoking cessation; for example,
Varenicline, a nicotine agonist, is currently in phase III clinical trials. The Federal Trade
Commission has urged the FDA drop its requirement that pharmaceutical print advertisements
include detailed drug side-effects listings, in favor of allowing "brief summary" risk warnings
(Federal Trade Commission 2004). This regulatory reform could lead to more advertisements
for Vanenicline and other new prescription products for smoking cessation. Another potentially
very significant regulatory change was the reform of FDA regulations in 1997 which made
television advertising of pharmaceuticals much more prevalent. An important direction for future
work is to explore the impact of televison advertisements on smoking cessation.
The spillover effects we identify have broader implications for the economics of
advertising. Many theoretical and empirical studies of the economics of advertising focus on
strategic interactions between firms selling competing products in a market. In our case study,
advertisements for smoking cessation products generate spillover benefits because smokers can
also quit smoking by cold turkey, do-it-yourself methods that do not involve market purchases.
Non-market household production is central to the economics of health behaviors (Grossman

27
1972, 2000), and advertisements for other pharmaceutical products may generate spillover
effects for health behaviors other than smoking cessation. For example, statin drugs to reduce
high blood cholesterol are heavily advertised. Because the Clinical Practice Guidelines for
cholesterol control recommend dietary changes, exercise, and weight loss before beginning drug
therapy (National Institutes of Health 2001), DTC advertisements for statins could lead to these
healthier behaviors. In fact, in a survey of consumers who discussed an advertised drug during a
physician visit, 52 percent report that their physician suggested a health behavior change, while
only 43 percent report receiving a prescription for the advertised drug (Weissman et al. 2003).
Because consumers may also substitute advertised products for health behavior changes, the net
public health impact of DTC advertising is ambiguous, although presumably consumer welfare
increases. Even more generally than DTC advertising and health behaviors, advertising of a
wide range of consumer products may have important and under-studied spillover effects on
various non-market behaviors.

28
References
Audit Bureau of Circulations (2003). Magazine trend report. Schaumburg, IL.
Avery, Rosemary, Kenkel, Donald S., Lillard, Dean R., and Mathios, Alan D. (2005a) “Regulating Advertisements: The Case of Smoking Cessation Products.” WorkingPaper, Department of Policy Analysis and Management, Cornell University.
________. (2005b) “Cigarette Advertisements and Smoking Cessation.” Presentation given atthe International Health Economics Association Conference, Barcelona, Spain, July2005.
Bagwell, Kyle (2005). The Economics of Advertising. Online Paper, Department of Economics,Columbia University, August 2005.
Bradford, W. David and Andrew N. Kleit (2006). “Direct to Consumer Advertising.” InAndrew Jones, editor, Elgar Companion to Health Economics (forthcoming).
Becker, Gary S. and Kevin M. Murphy (1988). "A Theory of Rational Addiction," Journal ofPolitical Economy 96 (4): 675-700.
Berndt, Ernst R. (1991). The Practice of Econometrics: Classic and Contemporary. Addison-Wesley
Berndt, Ernst R., Linda Bui, David R. Reiley, and Glen L. Urban (1995). “Information,Marketing, and Pricing in the U.S. Antiulcer Drug Market.” American Economic ReviewPapers and Proceedings 85 (2): 100 - 105.
Burton, SL, KE Kemper, TA Baxter, S Shiffman, J Gitchell, and C Currence. (1997). “Impactof Promotion of the Great American Smokeout and Availability of Over-the-CounterNicotine Medications, 1996.” Morbidity and Mortality Weekly Report 46 (37): 867 -869.
Calfee, John E., Winston, Clifford, and Stempski, Randolph. (2002). “Direct-to-ConsumerAdvertising and the Demand for Cholesterol-Reducing Drugs.” The Journal of Law andEconomics, 45: 673–690 .
Centers for Disease Control and Prevention [CDC]. (1999). Best Practices for ComprehensiveTobacco Control Programs – August 1999. Atlanta, Georgia: U.S. Department of Healthand Human Services, Centers for Disease Control and Prevention, National Center forChronic Disease Prevention and Health Promotion, Office on Smoking and Health.
Centers for Disease Control and Prevention [CDC]. (2001a). Investment in Tobacco Control:State Highlights 2001. U.S. Department of Health and Human Services.

29
Centers for Disease Control and Prevention [CDC]. (2001b). “Cigarette Smoking in 99Metropolitan Areas.” Morbidity and Mortality Weekly Reports 50 (49): 1107-1111.
Centers for Disease Control and Prevention [CDC]. (2005) “Smoking Prevalence Among U.S.Adults.” Http://www.cdc.gov/tobacco/research_data/adults_prev/prevali.htm. AccessedDecember 22, 2005.
Competitive Media Reports (various years). "AdSpender." www.tnsmi-mi.com/
DiClemente, C.C., Proschaska, J.O., Fairhurst, S.K., Velicer, W.F., Velasquez, M.M., and Rossi,J.S. (1991). “The Process of Smoking Cessation: An Analysis of Precontemplation,Contemplation, and Preparation Stages of Change.” Journal of Consulting and ClinicalPsychology 59 (2): 295-304.
Dorfman, R. and Steiner, P.O. (1954). “Optimal Advertising and Optimal Quality” AmericanEconomic Review 44: 826-836.
Federal Trade Commission (2004). Comments of the Staff of the Bureau of ConsumerProtection, the Bureau of Economics, and the Office of Policy Planning. “Before theDepartment of Health and Human Services Food and Drug Administration, In the Matterof Request for Comments on Agency Draft Guidance Documents Regarding Consumer-Directed Promotion.” Docket No. 2004D-0042.
Fiore, Michael C., William C. Bailey, Stuart J. Cohen, et al. (2000). Treating Tobacco Use andDependence. Clinical Practice Guideline. Rockville, MD: U.S. Department of Healthand Human Services. Public Health Service. June 2000.
Fiore, Michael C., Robert T. Croyle, Susan J. Curry, et al. (2004). “Preventing 3 MillionPremature Deaths and Helping 5 Million Smokers Quit: A National Plan for TobaccoCessation.” American Journal of Public Health 94 (2): 205-210.
Grossman, Michael (1972). “On the Concept of Health Capital and the Demand for Health.” Journal of Political Economy 80 (2) 223-255.
Grossman, Michael (2000). “The Human Capital Model,”in the Handbook of Health Economics,A.J. Cuyler and J.P. Newhouse, editors. North-Holland, pp. 349-408.
Ippolito, Pauline M. and Alan Mathios (1990) “Information, Advertising and Health Choices: AStudy of the Cereal Market.” RAND Journal of Economics 21 (3):459-480.
Ippolito, P. and Mathios, A., (1995) "Information and Advertising: The Case of FatConsumption in the United States," American Economic Review: Papers andProceedings, 85 (2) May.

30
Iizuka, Toshiaki, and Jin, Ginger Z. (2005a). “The Effect of Prescription Drug Advertising onDoctor Visits” Journal of Economics & Management Strategy14: 701 (September).
Iizuka, Toshiaki, and Jin, Ginger Z. (2005b). “Drug Advertising and Health Habits.” NBERWorking Paper 11770.
Jones, Andrew M. (1999). “Adjustment Costs, Withdrawal Effects, and Cigarette Addiction.”Journal of Health Economics 18 (1): 125-137.
Ling, Davina C., Ernst R. Berndt, and Margaret K. Kyle (2002). “Deregulating Direct-to-Consumer Marketing of Prescription Drugs: Effects on Prescription and Over-the-Counter Product Sales.” Journal of Law and Economics, XL: 691-723.
Manning, Willard, Emmett Keeler, Elizabeth Sloss, Jeffery Wasserman and Joseph P.Newhouse, (1991) The Costs of Poor Health Habits, Harvard University Press,Cambridge, Mass.
Marketdata Enterprises (2000). Smoking Cessation Products & Services: A Market Analysis. Tampa, Florida: Marketdata Enterprises, Inc.
Market Research.com. (2005). “Market Trends: Smoking Cessation Products” http://www.marketresearch.com/product/display.asp?ProductID=1073655&g=1
Mendez, David and Kenneth E. Warner (2000). “Smoking Prevalence in 2010: Why theHealthy People Goal is Unattainable.” American Journal of Public Health 90: 401-403.
________. (2004). “Adult Cigarette Smoking Prevalence: Declining as Expected (Not asDesired).” American Journal of Public Health 94: 251-252.
National Consumer Survey [NCS] (2005). http://www.directionsmag.com/companies/Simmons_Market_Research_Bureau/
National Institutes of Health (2001). Detection, Evaluation, and Treatment of High BloodCholesterol in Adults (Adult Treatment Panel III). Third Report of the NationalCholesterol Education Program Expert Panel. National Heart, Lung, and Blood Institute,National Institutes of Health. NIH Publication No. 01-3670.
Novotny, T.E., Cohen, J.C., Yureliki, A., Sweanor, D., and de Beyer, J. (2000). “Smokingcessation and nicotine replacement therapies.” in P. Jha and F. Chaloupka, editors. Tobacco Control in Developing Countries. Oxford and New York: Oxford UniversityPress, pp. 287-307.

31
Patrick, D.L., Cheadle, A., Thompson, D.C., Diehr, P., Koepsell, T., and Kinne, S. (1994). "TheValidity of Self-Reported Smoking: A Review and Meta-Analysis." American Journalof Public Health (July): 1086-1093.
Plassmann, V., Kenkel, D., Lillard, D.R., and Mathios, A. (2005). “Smoking Cessation: AnAnalysis of Quit Methods” Working Paper, Department of Policy Analysis andManagement, Cornell University.
Prochaska J O and C C DiClemente (1983). “Stages and Process of Self-change of Smoking:Toward an Integrative Model of Change.” Journal of Consulting and ClinicalPsychology 51 (3): 390-395.
Rosenthal, Meredith B., Ernst R. Berndt, Julie M. Donohue, Richard G. Frank, and Arnold M.Epstein (2002). “Promotion of Prescription Drugs to Consumers,” New England Journalof Medicine 346 (7): 498 - 505.
Rosenthal, Meredith B., Ernst R. Berndt, Julie M. Donohue, Arnold M. Epstein, and Richard G.Frank (2003). “Demand Effects of Recent Changes in Prescription Drug Promotion.” InFrontiers in Health Policy Research, Vol. 6, edited by Alan M. Garber and David M.Cutler. Cambridge, Mass.: MIT Press (for National Bureau of Economic Research).
Schmalensee, R. (1972). The Economics of Advertising Amsterdam: North Holland.
Sloan, Frank A., Jan Ostermann, Gabriel Picone, Christopher Conover, and Donald H. Taylor, Jr. (2004). The Price of Smoking. Cambridge Massachusetts: The MIT Press.
Suranovic, Steven M., Robert S. Goldfarb and Thomas C. Leonard (1999). “An EconomicTheory of Cigarette Addiction.” Journal of Health Economics 18(1):1-29.
Tauras, John A., Frank J. Chaloupka, and Sherry Emery (2005). “The Impact of Advertising onNicotine Replacement Therapy Demand.” Social Science & Medicine 60: 2351-2358.
U.S. Department of Health and Human Services [USDHHS] (2000). Healthy People 2010. 2nd
Edition. With Understanding and Improving Health and Objectives for ImprovingHealth. 2 vols. Washington, DC: U.S. Government Printing Office.
Viscusi, Kip W. (1995). “Cigarette Taxation and the Social Consequences of Smoking.” InJames Porteba (ed.), Tax Policy and the Economy. Cambridge, Mass: The MIT Press.
Weissman, Joel S., David Blumenthal, Alvin J. Silk, Kinga Zapert, Michael Newman, andRobert Leitman (2003). “Consumers’ Reports on the Health Effects of Direct-To-Consumer Drug Advertising.” Health Affairs Web Exclusive W3-82 - W3-95.

32
Wosinska, Marta (2003). “Just What the Patient Ordered? Direct-to-Consumer Advertising andthe Demand for Pharmaceutical Products.” Harvard Business School Working Paper No.03-058.
Wosinska, Marta (2005). “Direct-to-Consumer Advertising and Drug Therapy Compliance.” Journal of Marketing Research (August 2005).

33
Table 1 Descriptive statistics for selected variables
VariableMean
(Std. Dev.) Variable definitionAttempted to quit* 0.43 = 1 if tried to quit in past 12 months, 0 otherwise
Attempted to quit and used product* 0.02= 1 if tried to quit in past 12 months and used product, 0 otherwise
Successfully quit* 0.09 = 1 if tried to quit and non smoker, 0 otherwise
Successfully quit and used product* 0.10= 1 if tried to quit, used product, and non smoker, 0 otherwise
Attempted to quit and did not use product* 0.32= 1 if tried to quit in past 12 months and did not use product, 0 otherwise
Successfully quit and did not use product* 0.07= 1 if tried to quit, did not use product, and non smoker, 0 otherwise
Advertising exposureAdvertisements (in SCADS magazines read over past 12 months) for:
Smoking cessation products 13.49(12.88)
-Habitrol, Nicoderm patch, Nicorette Gum, Nicotrol (Inhaler, patch), Prostep patch, Zyban
Cigarettes 144.88(138.12)
-all cigarettes
Other tobacco products 4.57(9.13)
-snuff, chewing tobacco, rolling tobacco, cigars, and cigarillos
Public service announcements 0.77 -public service announcements aimed at getting smokers to quit
Media exposureMagazine issues read in year 144.25
(137.56)Number of magazine issues read in previous 12 months
Read no magazines* 0.04= 1 if read no magazines in previous 12 months, 0 otherwise
No cigarette advertising magazine* 0.58 = 1 if read at least one issue of Good Housekeeping, Modern Maturity, National Geographic, Seventeen, or Reader's Digest
TV hours 23.15(22.73)
Hours watch television in average week
Watch no TV in average week* 0.16 = 1 if watch no television in average weekRadio hours 4.14
(6.61)Hours listen to radio in average week
Listen to no radio in average week* 0.26 = 1 if listen to no radio in average week*Indicator variables - figure denotes percent of sample. N=36,097 Source: Multiple waves of NCS surveys and SCADS archive.
34
Quartile Attempted SucceededQ1 (0 to 3.1 advertisements) 0.396 0.095Q2 (3.1 to 10.3 advertisements) 0.413 0.091Q3 (10.3 to 20.0 advertisements) 0.433 0.090Q4 (20 or more advertisements) 0.464 0.098
Table 2. Fraction of smokers who attempted to quit and successfully quit, by quartile of distribution of smoking cessation product advertising exposure
Source: Simmons NCS surveys and SCADS archive.

35
Table 3. OLS coefficients - Advertising exposure as a function of individual socio-dem ographic characteristicsO LS results
Variable
Age 0.1691 *** -0.2985(0.0287) (0.2992)
Age squared -0.1395 *** -0.4751(0.0309) (0.3221)
HS dropout (vs high school graduate) -1.4573 *** -12.3668(0.2105) (2.1962) ***
Some college (vs high school graduate) 1.4326 *** 6.1819(0.1610) (1.6801) ***
College BA or more (vs high school graduate) 1.1201 *** -4.7045(0.1913) (1.9964) **
Hispanic (vs. W hite) 1.8916 *** 26.6610(0.3019) (3.1499) ***
Black (vs. W hite) 5.1435 *** 89.5911(0.2415) (2.5200) ***
Asian and other (vs. W hite) 0.9956 *** 10.3354(0.3699) (3.8598) ***
Female 3.2432 *** 34.7751(0.1348) (1.4065) ***
Employed -0.5401 *** -4.1136(0.1656) (1.7276) **
Family income*10-3 0.1869 *** 1.0318(0.0460) (0.4805) **
Family income squared*10-8 -0.0400 * -0.0475(0.0216) (0.2256)
Divorced/widowed/separated (vs. married) 0.0692 8.5065(0.1672) (1.7444) ***
Never married (vs. married) 0.2775 11.6737(0.1994) (2.0812) ***
Family size 0.2899 *** 4.1124(0.0492) (0.5130) ***
Number of children 0.1045 2.2316(0.1770) (1.8472)
M edicaid -0.0112 -0.4350(0.3581) (3.7372)
M edicare+M edigap 0.9069 * 9.3343(0.5431) (5.6673)
No insurance -0.5940 *** -3.8411(0.1599) (1.6686) **
Data from Fall 95 survey (vs.Fall 99) -0.6502 *** 105.8713(0.2383) (2.4868) ***
data from Spring 96 survey (vs. Fall 99) 6.1697 *** 73.3369(0.2279) (2.3781) ***
data from Spring 97 survey (vs. Fall 99) 5.2736 *** 37.4814(0.2207) (2.3033) ***
data from Fall 97 survey (vs. Fall 99) 5.2559 *** 53.4440(0.2220) (2.3169) ***
data from Spring 98 survey (vs. Fall 99) 7.1556 *** 24.0165(0.2215) (2.3117) ***
data from Fall 98 survey (vs. Fall 99) 1.3128 *** -16.2891(0.2820) (2.9429) ***
intercept 1.5009 ** 81.6164(0.7147) (7.4582) ***
R-squared 0.0915 0.1391Adj R-squared 0.0909 0.1385N
Sm oking cessation products ads Cigarette ads
36097Notes: *** denotes statistical significance with p-value <0.01, ** denotes significance with p-value < .05, * denotes significance with p-value < .10.

36
Variable 1 2 1 2Smoking cessation product advertisements 0.0045 *** 0.0086 *** 0.0053 *** 0.0033
(0.0012) (0.0021) (0.0016) (0.0029)Smoking cessation product advertising2*10-2 -0.0075 ** 0.0037
(0.0032) (0.0044)Other advertising exposure:Cigarette advertisements*10-2 -0.0397 *** -0.0404 *** -0.0506 *** -0.0505 ***
(0.0125) (0.0126) (0.0178) (0.0178)Advertisements for other tobacco products -0.0012 -0.0009 -0.0042 ** -0.0043 ***
(0.0011) (0.0011) (0.0016) (0.0016)Public service announcements -0.0096 -0.0100 -0.0100 -0.0097
(0.0071) (0.0071) (0.0101) (0.0101)LR chi2(k) 867.17 872.6 660.43 661.11k 148 149 148 149Prob > chi2 0 0 0 0Log likelihood -24196.6 -24193.9 -10886.8 -10886.4Pseudo R2 0.0176 0.0177 0.0294 0.0295
Tried to quitDidn't try to quitTotal NSuccessfully quitDidn't try to quit or tried and failedTotal N 36097
Table 4. Selected probit coefficients - Quit attempt and successful quit
36097337832719
Quit Attempt Successful Quit
1539920698
Notes: *** denotes statistical significance with p-value <0.01, ** denotes significance with p-value < .05, * denotes significance with p-value < .10. Other controls include age, age squared, education (three categories), race (three categories), sex, employment status, family income, family income squared, marital status (two categories), family size, presence of children in household, indicators for survey wave (season and period), indicator for SCADS magazines that accept no cigarette advertising, total issues of magazines read, indicator for people who read no magazines, TV hours watched in average week, Radio hours listened in average week, watch no TV, listen to no radio, indicators for four categories of SCADS magazines (womens’, young womens’, African American, men’s, general interest), and indicator for individual magazines other than SCADS.

37
Table 5. Selected probit coefficients - Quit attempt and successful quit using smoking cessation product
Variable 1 2 1 2Smoking cessation product advertisements 0.0027 * 0.0002 0.0064 ** 0.0030
(0.0016) (0.0029) (0.0028) (0.0050)Smoking cessation product advertising2*10-2 0.0044 0.0062
(0.0043) (0.0075)Other advertising exposure:Cigarette advertisements*10-2 -0.0397 ** -0.0397 ** 0.0095 0.0096
(0.0176) (0.0176) (0.0314) (0.0314)Advertisements for other tobacco products -0.0006 -0.0008 -0.0049 * -0.0051 *
(0.0016) (0.0016) (0.0029) (0.0029)Public service announcements -0.0067 -0.0063 -0.1357 *** -0.1338 ***
(0.0102) (0.0102) (0.0221) (0.0221)LR chi2(k) 940.74 941.82 429.53 430.19k 148 149 148 149Prob > chi2 0 0 0 0Log likelihood -11404.8 -11404.261 -3183.3534 -3183.0206Pseudo R2 0.0396 0.0397 0.0632 0.0633
Tried to quit with smoking cessation productAll othersTotal NSuccessfully quit with smoking cessation productAll othersTotal N
6863541136097
36743242336097
Quit Attempt Successful Quit
Notes: *** denotes statistical significance with p-value <0.01, ** denotes significance with p-value < .05, * denotes significance with p-value < .10. Other controls include age, age squared, education (three categories), race (three categories), sex, employment status, family income, family income squared, marital status (two categories), family size, presence of children in household, indicators for survey wave (season and period), indicator for SCADS magazines that accept no cigarette advertising, total issues of magazines read, indicator for people who read no magazines, TV hours watched in average week, Radio hours listened in average week, watch no TV, listen to no radio, indicators for four categories of SCADS magazines (womens’, young womens’, African American, men’s, general interest), and indicator for individual magazines other than SCADS.

38
Table 6. Selected probit coefficients - Quit attempt and successful quit without using smoking cessation product
Variable 1 2 1 2Smoking cessation product advertisements 0.0033 *** 0.0092 *** 0.0046 *** 0.0040
(0.0012) (0.0022) (0.0018) (0.0032)Smoking cessation product advertising2*10-2 -0.0108 *** 0.0010
(0.0033) (0.0048)Other advertising exposure:Cigarette advertisements*10-2 -0.0212 * -0.0222 * -0.0472 ** -0.0471 **
(0.0129) (0.0129) (0.0192) (0.0192)Advertisements for other tobacco products -0.0009 -0.0005 -0.0035 ** -0.0035 **
(0.0011) (0.0012) (0.0018) (0.0018)Public service announcements -0.0063 -0.0068 -0.0098 -0.0097
(0.0073) (0.0073) (0.0105) (0.0105)LR chi2(k) 1041.68 1052.25 684.45 684.49k 148 149 148 149Prob > chi2 0 0 0 0Log likelihood -22236.473 -22231.185 -9235.0349 -9235.0111Pseudo R2 0.0229 0.0231 0.0357 0.0357
Tried to quit without smoking cessation productAll othersTotal NSuccessfully quit without smoking cessation productAll othersTotal N
Successful Quit
26923340536097
117252437236097
Quit Attempt
Notes: *** denotes statistical significance with p-value <0.01, ** denotes significance with p-value < .05, * denotes significance with p-value < .10. Other controls include age, age squared, education (three categories), race (three categories), sex, employment status, family income, family income squared, marital status (two categories), family size, presence of children in household, indicators for survey wave (season and period), indicator for SCADS magazines that accept no cigarette advertising, total issues of magazines read, indicator for people who read no magazines, TV hours watched in average week, Radio hours listened in average week, watch no TV, listen to no radio, indicators for four categories of SCADS magazines (womens’, young womens’, African American, men’s, general interest), and indicator for individual magazines other than SCADS.

39
Table 7 Predicted effects of changes in smoking cessation product advertising
Advertisements seen in past year0 5 10 15 20
Probability of attempted quit 0.392 0.408 0.422 0.435 0.447
Probability of attempted quit using product 0.099 0.099 0.100 0.101 0.102
Probability of attempted quit without using product 0.295 0.310 0.323 0.334 0.344
Probability of successful quit 0.085 0.088 0.091 0.094 0.098
Probability of successful quit using product 0.017 0.017 0.018 0.019 0.020
Probability of successful quit without using product 0.067 0.070 0.073 0.075 0.079Notes: Predicted probabilities generated using coefficient estimates from Model 2 from Tables 4-6. Actual value of all other variables used in calculation.

40
Appendix Table 1 Descriptive statistics
Variable Mean Std. DeviationAttempted to quit* 42.66Successfully quit* 9.36Advertising exposureSmoking cessation products 13.49 12.88Cigarettes 144.88 138.12Other tobacco products 4.57 9.13Anti-smoking public service announcements 0.77 1.49Type of health insurance heldPrivate* 70.23Medicaid* 3.74Medicaid+Medigap* 1.55No insurance* 24.49Media exposureMagazine issues read in year 144.25 137.56Read no magazines* 4.32Reader of 1+ magazines that accept no cigarette advertising* 57.8Average weekly hours of television viewing 23.15 22.73Watch no TV in average week* 15.8Average weekly hours of radio listening 4.14 6.61Listen to no radio in average week* 26.33Other control variablesAge 43.04 14.39Family income 51311.43 41612.85Family size 3.01 1.74Children in household* 59.31Education less than high school* 13.82Education high school diploma* 33.06Education some college* 33.21Education B.A. and higher* 19.91White* 83.56Hispanic* 4.98Black* 8.24Asian and other* 3.21Female* 52.92Employed* 71.31Married* 51.35Divorced/widowed/separated* 26.87Never married* 21.78Survey waveFall 1995* 11.71Spring 1996* 14.82Spring 1997* 15.08

41
Appendix Table 1 continued
Variable Mean Std. DeviationFall 1997* 14.65Spring 1998* 14.67Fall 1998* 6.91Fall 1999* 22.15N=36,097*Indicator variables - figure denotes percent of sampleSource: Multiple waves of NCS surveys. See Table 2 for variable definitions.

42
DATA APPENDIX
The SCADS Archive
The SCADS archive is a collection of all print advertisements for smoking cessationproducts, tobacco products, and smoking-related public service announcements that appearedbetween January 1985 and May 2002 in 26 consumer magazines. The magazine set includes:Better Homes & Gardens, Black Enterprise, Business Week, Cosmopolitan, Ebony, Essence,Family Circle, Glamour, Good Housekeeping, Jet, McCall's (name changed to Rosie’s onJanuary 1, 2001), Modern Maturity, Money, National Geographic, Newsweek, People, Playboy,Readers Digest, Rolling Stone, Seventeen, Sports Illustrated, Time, TV Guide, U.S. News&World Report, Vogue, and Women's Day. SCADS also includes advertisements from twomedical journals: the Journal of the American Medical Association and the New EnglandJournal of Medicine. Because the NCS does not ask whether respondents read these journals,we do not include them in our analysis.
We selected these magazines to represent magazines most frequently read by individualswith particular demographic characteristics. We defined 22 groups by race (3 groups), education(5 groups), income (5 groups), age (5 groups), gender (2 groups), and smoking status (2 groups). Using data on magazine reading from the 1998 NCS we chose the ten magazines most frequentlyread by members of each group. Although we defined 22 groups, members of each group oftenread the same magazines. Consequently, instead of 220 magazines, the final set includes theabove 26 magazines. We were unable to use three magazines because we could not locate allissues in our sample period. In those three cases we substituted the next most widely readmagazine for the group in question. Using magazine circulation data from three independentsources, we estimate that the 26 magazines in SCADS account for between 30.0 and 57.5 percentof magazines circulating in the US. The lower figure is based on total circulation across 580magazines reported in Audit Bureau of Circulation’s (2003) Magazine Trend Report. The higherfigure is estimated from readership data for the 172 magazines included in the NCS. TheSCADS magazines represents 5% of the 580 magazines in the Magazine Trend Report data butaccount for 30.0 percent of circulation.
The Simmons National Consumer Survey (NCS)
The NCS is a repeated cross-sectional survey. The sample for each wave isindependently drawn. The NCS employs a multi-stage stratified probability sample. The finalsample represents a representative probability sample of all adults living in households in theU.S. (excluding Hawaii and Alaska). In order to minimize respondent fatigue the data arecollected in several phases. In Phase 1 respondents are interviewed (face-to-face). In Phase 1interviewers collect demographic data and data on the magazines respondents read. To collectthis information interviewers present respondents with a deck of cards on each of which is printed the logo of one of the 182 magazines in the Simmons sample. If a respondent reportsthat he has read any portion of a magazine he is asked a set of questions about readership,including whether he reads the whole magazine. During the second part of Phase 1 respondents
43
report, by filling out a questionnaire, whether they purchase and use specific products, includingsmoking cessation products.
Survey response rates in the NCS are generally high (approximately 70 percent) andcompare well with other widely-used surveys in health economics and health services research. For example: in the 2002 Behavioral Risk Factor Surveillance Survey the median response rateacross states was 58 percent (range: 42 percent to 83 percent); for the 2002 National HealthInterview Survey (NHIS) the total household response rate was approximately 90 percent andthe final response rate for the Adult Sample Person was 74 percent (CDC 2003, 2004).
The rates of smoking behaviors in the NCS are very similar to rates estimated from othernational data sets. In the NCS, approximately 26 percent of the 1995 sample smoke and 24percent of the 1998 sample smoke. By comparison, from the NHIS, the CDC (1997, 2003)estimates that the prevalence of smoking among adults was 25 percent in 1995 and 24 percent in1998. In the pooled waves of the 1995-1999 NCS, about 43 percent of smokers reported thatthey attempted to quit during the past year. By comparison, in the 1995 NHIS, 46 percent ofcurrent daily smokers had stopped smoking for at least one day during the past year because theywere trying to quit; in the 1998 and 2000 NHIS the quit attempt rates were 39 percent and 49percent, respectively. (The slight differences between the NCS and the 1995 and 2000 NHISestimates of the prevalence of quit attempts are probably due to differences in the wording of thesurvey questions used to define a quit attempt; it is not clear why the rate of quit attempts islower in the 1998 NHIS.) In the pooled waves of the 1995-1998 NCS, of those who attempted toquit, 22 percent were not smoking at the time of the survey. In the 2000 NHIS, 22 percent ofthose who attempted to quit were successful. Of smokers who attempted to quit: 21.9 percent ofNCS respondents using a smoking cessation product, compared to 20.1 percent in the NHIS. Wehave also completed a descriptive study that uses the 1995-1999 NCS data and the 2000 NHIS toexplore socio-economic differences in quit attempts and in quit methods used (Plassman et al.2005). The NCS and NHIS samples are very similar in terms of socio-economic characteristicssuch as age, family income, education, ethnicity, and health insurance status.
Additional References
Centers for Disease Control and Prevention (1997). “Cigarette Smoking Among Adults – UnitedStates, 1995.” Morbidity and Mortality Weekly Report 46 (51): 1217-1220.
Centers for Disease Control and Prevention (2003). “Cigarette Smoking Among Adults – UnitedStates, 1998.” Morbidity and Mortality Weekly Report 49 (39): 881-884.
Centers for Disease Control and Prevention (2004). “State-Specific Prevalence of CurrentCigarette Smoking Among Adults – United States, 2002.” Morbidity and MortalityWeekly Report 52 (53): 1277-1280.
Copyright © 2022 FDOKUMEN