
FLYING HIGH - Lloyd's List
81
LLOYDSLIST.COM OCTOBER/NOVEMBER 2020 INSIDE Greek focus Supply chain shift Northern Sea Route FLYING HIGH New measures herald comeback for lagging Greek flag
-
Upload
khangminh22 -
Category
Documents
-
view
0 -
download
0
Transcript of FLYING HIGH - Lloyd's List

LLOYDSLIST.COM OCTOBER/NOVEMBER 2020
INSIDE
Greek focus
Supply chain shift
Northern Sea Route
FLYING HIGHNew measures herald comeback
for lagging Greek flag
LL-Oct-Nov-2020-Cover.indd 1LL-Oct-Nov-2020-Cover.indd 1 22/10/2020 23:50:0222/10/2020 23:50:02

October/November 2020 | Lloyd’s List | 3
ww
w.lloydslist.com
Cyber-crime has been thrust into the shipping spotlight once more after another spate of high-profile hacks, emphasising the heightened
risk faced by the industry. The latest victims to fall foul of this
online menace were French shipping juggernaut CMA CGM and the International Maritime Organization.
Much of CMA CGM’s online functionality was down for two weeks after the company sought to protect and restore its IT systems, which had been attacked using Ragnar Locker ransomware in late September.
This came just three days before news that the IMO had similarly been hit by hackers, making its website and internal intranet services unavailable. This was not the first time the UN agency’s online systems had been compromised — but it was by far the most serious.
The size and stature of the two organisations once again reiterated that all shipping companies and entities are at risk. Nobody is safe.
Experts too were quick to point to how most would have fallen victim to the same attack, given the sector’s low level of cyber-maturity.
CMA CGM’s hacking means that four of the five largest carriers have had their online systems infiltrated by cyber criminals.
Maersk, Mediterranean Shipping Co and Cosco have all been targeted, either directly or indirectly, by hackers in recent years — and at substantial cost.
With container shipping increasingly digitised, the attack space for would-be hackers is growing.
As such, so too is susceptibility to having online systems compromised.
Sea-Intelligence chief executive and renowned box shipping analyst Alan Murphy says this does not mean digitalisation should be slowed down, rather that the industry must devote serious efforts and resources into both cyber-defence and contingency planning.
“The risk cannot be reduced to zero,” he said. “Every company should see it as absolutely vital to have clear contingency plans.”
Somewhat ironically, the two latest incidents come shortly before a new IMO resolution requiring shipping companies to address cyber-risks in safety management systems comes into effect. The resolution will be enforced at the start of 2021.
These unfortunate events serve as a timely reminder for the industry not to get complacent.
More victims will follow. Failing to mitigate for the impact of a cyber-attack, too, is criminal.
THE EDITOR’S LETTER
ContentsCOMMENT4 Australian soul-searching at coal face
6 IMO’s greenhouse gas plan is outdated
COVER STORY9 Historic industry delivers the goodsGreece is the envy of the shipping world
GREECE14 Europe’s global shipping powerhouseNation is a major player across all trades
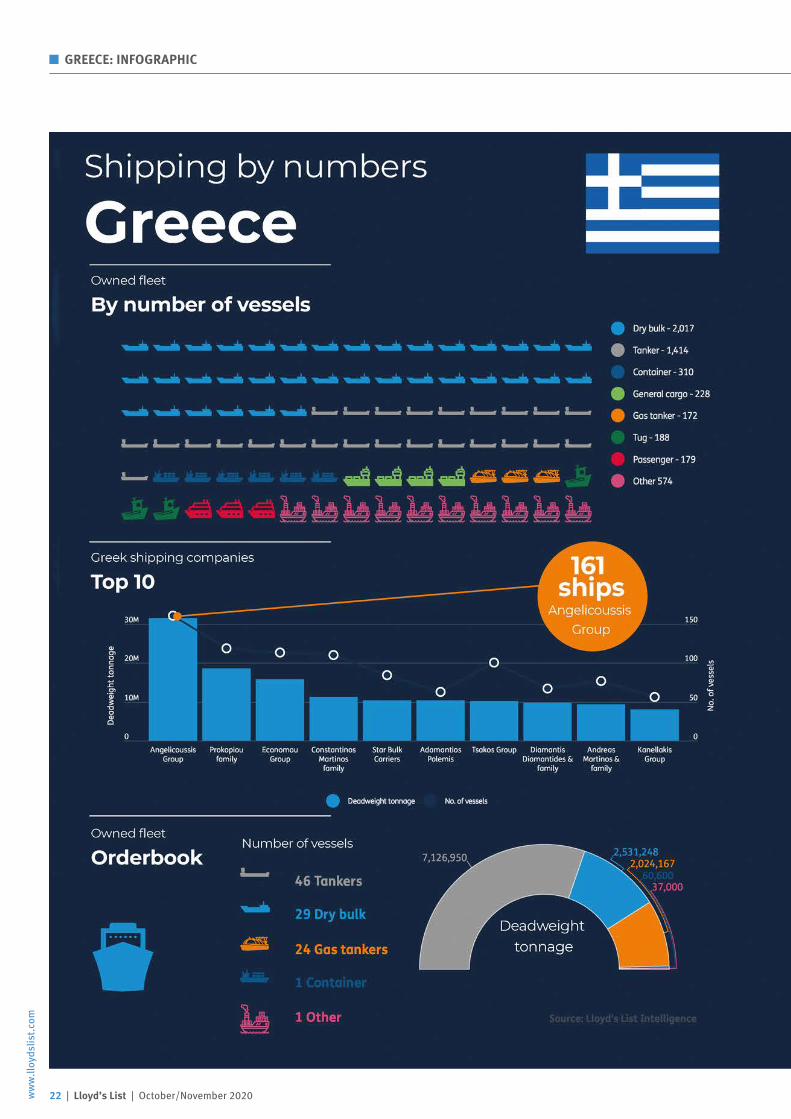
22 Shipping by numbersAnalysis of the Greek fleet
24 Ferries feel full brunt of pandemicTough winter and renewal challenges ahead
26 The show must go on!Greek Shipping Awards will be online for 2020
30 Greek bank comeback gathers paceCommitment shown to country’s key industry
CHANGING TRADE LANES36 Carriers follow manufacturing movesNew services support Southeast Asian hubs
40 Shipping on thin ice: Russia’s NSRRegion’s future is far from clear
44 Crude exports defy poor prognosisSpotlight on US Gulf shows high levels
48 Brexit: the final countdownUK freight sector prepares for major changes
ANALYSIS50 Economic outlookWeak oil demand and lower spending hit trade
52 Shipbuilding outlookEnergy efficiency and reduced costs are key
54 The month in chartsCapesize index nosedives; scrubbers ‘bad bet’
MARKETS62 Dry bulk: Crew changes in Philippines
64 Tankers: Recovery on hold
68 Containers: World fleet update
70 Containers: Trade statistics
72 Containers: Between the lines
76 Containers: Changing lanes
REGULARS60 Yard Talk: Battle for ultra large boxships
78 Last Word: Springboard for change
A timely reminder Cyber-attacks on two of the industry’s giants just prove that nobody is safe; it is vital to have a contingency plan in place
Experts were quick to point to how most would have fallen victim to the same attack, given the sector’s low level of cyber-maturity
The editor’s letterLINTON NIGHTINGALE

4 | Lloyd’s List | October/November 2020ww
w.ll
oyds
list.c
om
LLOYD’S LIST LEADER
“You can sell your soul for a pile of soyabeans, or you can protect your people,” US Secretary of State Mike Pompeo warned
Australia last year as diplomatic relations between China and Australia continued to decline in the wake of security spats.
Australia does not actually sell soyabeans in any great quantity — but it does sell rather a lot of coal... $56bn worth, to be precise.
This goes a long way to explaining why the sight of at least 27 coal-laden bulk carriers waiting at anchorage off China’s northern Caofeidian and Tangshan coal terminals in mid-October was making security analysts and economists equally uneasy.
Shipowners should also have been paying attention. Most were just pleased that the 10-week delay in shipments from Australia’s north Queensland coast had served as an earnings boost, briefly lending supporting to Pacific charter rates.
Yet these ships waiting so long to discharge also served as a reminder that the fragility of the current demand dynamics are more vulnerable to political manoeuvring than they have been for many years.
The exact reasons for the delays were not clear. Initially, they were explained away as congestion due to stockpiling and stricter implementation of coal import quotas.
Then it emerged that Australian miner BHP’s Chinese customers had asked them to defer metallurgical coal shipments.
The security hawks immediately jumped to the conclusion that this was a clear sign of politics at play — and not without good reason.
China has already taken a range of actions against Australian exporters this year, including imposing prohibitive tariffs on barley, suspending some meat imports and launching trade investigations into wine.
Tech may have garnered the international attention when it comes to trade spats recently, but China has used trade as a diplomatic tool in many sectors before.
Given the anger and mistrust between the countries that has been bubbling under the surface for years, a diplomatic spat surrounding coal would not be without precedent.
Analysts have already noted a shift in the political agenda that has seen China taking more coal from Russia and Mongolia over Australia, which has been very vocal about its national security concerns, voiced by politicians keen to position themselves as defending their domestic economy.
They should be wary of pushing such rhetoric too far.
More than two-thirds of met-coal Chinese imports in the first half of 2020 were from Australia — so if China is shunning Australia’s exports, that is bad news for Australia.
China, meanwhile, has its own supply of domestic coal and, if the increased Russian and Mongolian connections fall through, Indonesia and South Africa could easily make up for any shortfalls.
Of course, the decline in Australian coal exports might have nothing to do with diplomacy. Slower imports could also be a signal that the strength and pace of the Asian tiger’s post-pandemic economic recovery is weaker than first thought.
Either way, these are trends that have an impact for shipping supply chains.
Such calculations are a delicate balance beyond the control of shipping, but as China prepares to advance a new export control law that would ban Chinese suppliers from dealing with specific foreign companies on national security grounds — taking a page from the US crackdown on Huawei Technologies and its peers — the shipping industry looks on with growing concern.
US foreign policy sent tanker rates soaring above $300,000 daily a year ago; oil-price wars did the same six months later.
If pandemic politics from China threatens to destabilise bulk carrier trades, this could be one unexpected reconfiguration of global supply chains too far this year.
Australian soul-searching at coal face of pandemic politicsSouring relations between China and Australia could be behind the decision to shun shipments of coal — another reminder of the curveball in geopolitics during 2020
Given the anger and mistrust between the countries that has been bubbling under the surface for years, a diplomatic spat surrounding coal would not be without precedent
MICHELLE WIESE BOCKMANN
Reporter

WorldwideShipping and Logistics
MaritimeTransport and Logistics Solutions for any type ofROLLING CARGO • EARTH MOVING EQUIPMENT • STANDARD AND SPECIAL CONTAINERS
FORESTRY PRODUCT • PROJECT AND HEAVY LIFT CARGOS
www.grimaldi.napoli.it
ANTWERPGRIMALDI BELGIUM
TEL: +32 3 5459430
HAMBURGGRIMALDI GERMANY
TEL: +49 40 789707 12
LONDONGRIMALDI AGENCY UKTEL: +44 207 9305683

ww
w.ll
oyds
list.c
om
6 | Lloyd’s List | October/November 2020
LLOYD’S LIST LEADER
It is not only Greta Thunberg and Extinction Rebellion who want rapid action to stop climate change — and 2020 is showing that, in ways unimaginable when the
industry was drawing up its game plan at London’s Albert Embankment little more than two years ago.
Trafigura, the giant commodity trader, is calling on the International Maritime Organization to impose a $300 per tonne carbon levy on shipping fuels, even though it would be one of the big names on the hook for the costs.
BP — again, nobody’s idea of an anti-capitalist beatnik hippy wingnut outfit — thinks a properly designed scheme on these lines would mark a major contribution to slashing pollution.
Meanwhile, other major charterers have agreed to disclose annual shipping greenhouse gas emissions, and assess alignment with IMO decarbonisation targets.
That would mean not only greater transparency, but make emissions performance a key aspect in chartering negotiations, further incentivising reduction.
Yet the dominant sentiment in shipping is still deference to the IMO’s half-decarbonisation by 2050 strategy, which increasingly resembles some kind of lowest common denominator.
It is in the nature of United Nations agencies to seek consensus, of course — but that consensus is crumbling fast.
Shipowners have been put on notice of what is to come, and what will increasingly be expected of them.
The great English romantic poet Percy Bysshe Shelley once contended: “Poets are the unacknowledged legislators of the world.”
Kirstin Holth, the former DNB ship finance chief, recently updated that axiom for shipping in the 21st century.
“In our case, it is the charterers and financiers rather than the regulators that ultimately make the pace — and, for many of them, the IMO blueprint comes over as too little, too late.
“I will not rank one ahead of the other, but you will, over time, not get access to the best resources, being human or capital, unless you have a sustainable business model, financially and environmentally, socially and corporate governance wise,” she said.
Important catalystTo give IMO its due, its 2018 carbon reduction strategy has been an important catalyst — and that historic agreement would likely have been impossible without industry support.
However, if shipping wants a say on its future — and support from lawmakers when it requires their help — it is going to have to prove its progressive environmental credentials.
Ultimately, entirely decarbonised supply chains are inevitable — and the industry is going to have to be part of them.
IMO’s greenhouse gas plan is already outdatedIf shipping wants a say on its future — and support from lawmakers when it requires their help — it is going to have to prove its progressive environmental credentials
It is in the nature of United Nations agencies to seek consensus, of course — but that consensus is crumbling fast. Shipowners have been put on notice of what is to come, and what will increasingly be expected of them

8 | Lloyd’s List | October/November 2020ww
w.ll
oyds
list.c
om
COVER STORY: GREECE
Greece
A special report

October/November 2020 | Lloyd’s List | 9
ww
w.lloydslist.com
COVER STORY: GREECE
A long history steeped in shipping, human resources and a community spirit among ship operators are some of the ingredients that make Greece the envy of the shipping world, Nigel Lowry reports
Maran Gas M
aritimeT here could be no stronger
reminder of Greece’s maritime history than the celebrations in recent weeks of the 2,500-year
anniversary of the Battle of Salamis, coupled with remembrance of the land battle of Thermopylae.
The events commemorated the historic defeat meted out to a numerically superior Persian armada when the triremes built by Athenian statesman Themistocles lured the invaders’ fleet into the Salamis Strait, just three miles from where ferries steer in and out of the bustling port of Piraeus today.
The sea victory, which has been dated to September 29, 480 BC, has long been seen not only as securing Athenian naval power in the Aegean, but as a triumph for western democracy that has reverberated down the centuries ever since.
Historians, including shipowner and former International Chamber of Shipping chairman Spyros Polemis, make a powerful case for seeing Greek seamanship and maritime skills as a continuum to the present day.
Yett modern Greek shipping in the industrial age has its own strong pedigree.
It is three-quarters of a century already since the likes of Onassis and Niarchos led the surge in Greek shipping after the end of the Second World War, when they were given a helping hand with the allocation of 98 Liberty ships and a handful of T-2 tankers from the US war surplus fleet.
The long reign by Greeks at the top of world shipownership, in terms of aggregate fleet capacity, shows scant signs of faltering.
Although technological advances, decarbonisation and the coronavirus pandemic present an unprecedented mix of challenges to shipping worldwide, Greek owners have demonstrated their ability to adapt and their commitment to the business over many decades.
Even if the number of individual shipping outfits in Greece has shrunk by
Increasing sophistication: Maran Gas Maritime’s Excelerate Sequoia, the first FSRU delivered to a Greek owner.
Historic industry that is delivering the goods todayone-third in the past 20 years, to less than 600 today, the fleet has continued growing.
Lloyd’s List Intelligence data shows a live fleet of 4,981 vessels of an aggregate 327.3m dwt in October 2020. This compares with a fleet of 4,965 ships of 320.3m dwt a year ago, indicating a 2.2% increase in tonnage.
Most of the increase can be traced to the tanker and gas carrier sectors, which added 4.7m dwt and 1.8m dwt, respectively, in the past year.
The liquefied natural gas carrier segment, in particular, has been something of a poster child for the gradual increase in the sophistication of Greek shipping in the modern era, to the point where some of the country’s leading owners have given Greece a dominating position in the ordering of modern LNG vessels.
Underlining the point, June 2020 saw delivery by Daewoo Shipbuilding and Marine Engineering of the first-ever Greek-owned floating storage regasification unit (FSRU).
Built for the Angelicoussis LNG shipping arm Maran Gas Maritime,
Excelerate Sequoia has gone onto a five-year bareboat charter to Excelerate Energy.
Just a few weeks prior to that, Chinese yard Hudong-Zhonghua launched Transgas Power, the first of two FSRUs being built for Dynagas. The pair are expected to be delivered to the Greek owner in 2021.
A third Greece-based company, Peter Livanos-backed GasLog, is also entering the FSRU sector.
In addition to competing in third-party tenders, it is involved as a partner in Gastrade, an FSRU project to create a floating LNG import terminal at the port of Alexandroupolis in northern Greece.
A notable general feature of the Greek-owned fleet is that Greeks are drawn to larger ships on average than their counterparts elsewhere.
Based on recent Lloyd’s List Intelligence data, the average Greek-owned vessel weighs in at 66,730 dwt, compared to a world average of 15,901 dwt, which in part reflects their overwhelming concentration on bulk tonnage.
However, even in the dry and wet bulk sectors, they still have a clear edge on size.

COVER STORY: GREECE
The average Greek bulker is roughly of kamsarmax proportions at 80,154 dwt, whereas the international average is an older panamax of 73,073 dwt, with the non-Greek average being smaller than that.
When it comes to tankers, the Greek-owned average size is 100,463 dwt versus a world fleet average of 45,688 dwt — a yawning disparity that in part reflects the Greek leadership in the crude oil tanker space, compared with a somewhat more modest presence in product tankers.
There has been a noticeable recent trend for Greek owners to shy away from newbuilding commitments.
While there has been a reluctance internationally to avoid adding to capacity in an age of uncertainty, technological opaqueness and financing shortages, Greeks have been more reluctant than most.
Their combined orderbook shrank to just 101 vessels of 11.8m dwt under construction in October, down from 142 vessels of 15.1m dwt a year earlier — and the lowest number on order for many years.
Significantly, there are currently almost as many gas carriers as bulkers on order for Greeks, although almost half the current orderbook by number of vessels — and more than two-thirds of the tonnage — is for tankers.
Tankers have certainly dominated the trickle of orders by Greek owners during 2020.
Kyklades Maritime, Central Shipping, and Dynacom Tankers have all ordered pairs of very large crude carriers, while Pantheo Tankers has contracted two suezmaxes.
Aegean Shipping, Neda Maritime, Pleiades Shipping and Samos Steamship have all ordered aframaxes.
The VanNoort Collection
10 | Lloyd’s List | October/November 2020ww
w.ll
oyds
list.c
om
Greeks lead in crude oil tankers: East Mediterranean Maritime’s Agios Fanourios I, a four-year-old very large crude carrier.
Instead of newbuildings, most owners have concentrated on the secondhand market, topping the number of acquisitions and spending in terms of the mainstream sectors of dry bulk, tankers, containerships and gas carriers.
In the first three quarters of 2020, Greeks spent close to $1.8bn on 115 vessels across these sectors, with Chinese owners in second place, with 113 purchases worth $1.2bn.
The two nations combined did more deals than owners of all other nationalities put together.
The majority of Greek acquisitions were of bulkers — 63 in total — although the greater spending — $855.9m — went on acquiring 39 tankers.
Also acquired during the first nine months of the year were 10 container vessels and three gas carriers.
One longtime concern has been the strength of the Greek-flag fleet, which has been in steady decline.
According to Lloyd’s List Intelligence figures, it lost a further 10m dwt over the previous year to stand at 1,590 vessels of 71m dwt, including 40 vessels on order.
The 12% drop in capacity leaves the Greek-flagged fleet representing just 21% of the overall Greek-owned fleet.
However, the government of Kyriakos Mitsotakis has provided some cause for hope that the fall can be arrested and the national registry’s fortunes turned around, with new legislation introduced over the summer.
The measures promise to make the Greek flag more competitive and create more opportunity for Greek youth to go to sea by enabling companies to sign up Greek seamen, based on current International Transport Workers’ Federation contracts.
George D. Pateras President
Hellenic Chamber of Shipping
The first step is always the hardest, but I think we will see a return to the Greek flag in a big way. There will not be a mad rush, but all sizes will steadily come back

www.alpha.gr
We have so much in common with Greek shipping.The vision, the goals, the colour.
For more than 20 years, our experience and credibility allow us to providecontemporary financing solutions as well as a wide range of integrated and specialised
services that cover the needs of the Greek-owned merchant shipping.
Shipping Finance Division & Shipping Branch 93, Akti Miaouli, GR-185 38 PiraeusTel: 0030 210 4290116 E-mail: [email protected]
Blue.Our
colour.
KX_Nautilia_210x297-NEW-ENG+Bleed_3-diorth.indd 1KX_Nautilia_210x297-NEW-ENG+Bleed_3-diorth.indd 1 14/10/2020 18:4214/10/2020 18:42

ww
w.ll
oyds
list.c
om
12 | Lloyd’s List | October/November 2020
COVER STORY: GREECE
In a related reform, the government is also introducing measures to upgrade the country’s maritime education system, including enabling private marine education.
The requirement for Greek officers for Greek-flag ships — in spite of their insufficient numbers — is regularly cited as one of the main reasons why the country’s owners often steer clear of the flag.
“The legislation is a very positive move in the right direction. It should have been done many years ago,” says Hellenic Chamber of Shipping president George D. Pateras.
“The first step is always the hardest, but I think we will see a return to the Greek flag in a big way. There will not be a mad rush, but all sizes will steadily come back to the flag and to the advantages of a national flag.
“It gives us a chance to build up our crew pool. With more ships will come more crew — and, with more crew, the confidence of owners will increase and it will pick up faster and faster.”
Maritime clusterMr Pateras is also optimistic about Greece’s future as a maritime cluster — an aspect in which international studies tend to rank it below the likes of Singapore, London, Shanghai, Dubai or Hamburg.
“Our maritime cluster has existed for thousands of years, since Greeks first went to sea, and it is beginning to be heard,” he says.
“But it’s not a matter of ticking boxes, some of which are related mainly to port functions.
“Most other nations had to create a cluster to tap into the benefit of the
Another leading Greek vessel: Delta Commander, a 2010-built Delta Tankers suezmax.
maritime community. We did not have to do that.
“We erroneously tried to model our cluster on the clusters of other countries.
“Ours is a different concept. We had the biggest fleet in the world and we are the cluster,” he says.
His optimism is shared by Dimitris Koukas, who heads Optima Shipping Services, the country’s largest ship brokerage.
Optima acts as a broker for newbuildings, secondhand sales and purchase and demolition, but provides a ‘one-stop-shop’ of services that include financing, repairs, project management, valuations and research.
The company has also been instrumental in encouraging start-ups, innovation and maritime technology businesses in the Greek market.
“Greece deserves to be a proper shipping centre,” Mr Koukas tells Lloyd’s List.
“You can’t be number one in the world as far as shipowning is concerned and number five, say, as a shipping centre because you don’t properly tick all those boxes.
“Shipowning is the backbone that you need in order to attract the right calibre of services and everything else.
“Apart from having the owners here, an extremely important ingredient as far as creating a shipping centre is concerned is the human factor,” Mr Koukas says.
“Thankfully we have it and it is a competitive advantage that we have not fully capitalised on yet.
“I’m confident that in five years from now, we won’t have to ask this question. I believe we will be in pole position.”
The VanNoort Collection
Dimitris Koukas Chief executive
Optima Shipping Services
Greece deserves to be a proper shipping centre. Apart from having the owners here, an extremely important ingredient as far as creating a shipping centre is concerned is the human factor

14 | Lloyd’s List | October/November 2020ww
w.ll
oyds
list.c
om
GREECE: FLEET
I n 2019, Greek-owned ships increased their activity — both globally and in most major regions — according to Lloyd’s List Intelligence data,
covering more than 230,000 port calls and aggregating more than 11.9bn dwt.
This was up from about 221,000 international calls, representing 11.3bn dwt, in 2018, reflecting trade patterns and demand but also an increase in the capacity of the fleet in the interim.
Greece’s own trade traditionally contributes less than 1% of the cargoes carried by Greek shipping companies in the course of a year.
Given the cross-trading nature of the fleet and the itinerant nature of the bulk tramping trades in which Greek owners are mostly concentrated, the
stability of their presence in many of the major trades from year to year can be surprising.
Thus, for example, 633m dwt of Greek calls, of which 82% concerned dry bulk tonnage, are registered as having been made in Australasia last year, versus 632m dwt in 2018.
The Middle East was the only major shipping region to see less Greek-owned tonnage last year than the previous year, while activity to just about everywhere else increased.
Following the cargo has, for a long while, meant a steady increase in Greek shipping’s operations in Asia — and last year, the region accounted for just over 35% of the fleet’s global port calls by aggregate capacity.
Exclusive Lloyd’s List Intelligence data shows that Greek shipping is a powerful player in trades across the globe, whether serving the massive demand for dry bulk commodities and crude oil in Asia, or maintaining a major share of dry and wet tramp shipping calls in European ports, Nigel Lowry reports
Europe’s global shipping powerhouse
Source: Lloyd’s List Intelligence


GREECE: FLEET
ww
w.ll
oyds
list.c
om
16 | Lloyd’s List | October/November 2020
That closely shadows Asia’s share of global economic output, now considered to be around 40%.
In 2018, the steady growth of Greek tonnage calling in China suffered a minor blip as Chinese growth slowed.
However, last year, the overall trend reasserted itself and Greek owners more or less matched their peak year of 2017, racking up about 1.5bn dwt of port calls in China.
Meanwhile, calls in India clearly set a new record of 482m dwt.
Yet if economic growth in Asia has been an increasingly powerful magnet for Greek shipping, its continuing importance as a servant of Europe’s economy and population was also underlined last year.
Lloyd’s List Intelligence data suggests that Greek-owned shipping lifted or delivered as much as 100m more tonnes of cargo in European ports in 2019 than the year before.
Altogether, last year saw well over 2.2bn dwt of Greek shipping port calls in Europe. Representing 18.6% of the fleet’s global activity, this was an increase from 2.1bn dwt in 2018, when European calls equated to 18.3% of Greek shipping activity.
Overall, 13.1% of all tonnage calling in ports around the world last year — across almost 5.4m port calls tracked by Lloyd’s List Intelligence — was identified as Greek-owned.
In many areas, though, Greek shipping’s presence comfortably exceeds this — and, unsurprisingly, this is true of a number of European sub-regions.
For example, Greek shipping
represented 20.4% of the traffic in terms of capacity in Black Sea ports last year.
Other 2019 data indicative of a high market share for Greek-controlled tonnage includes 18.6% of capacity port calls in the eastern Mediterranean and 17.9% of port traffic by dwt in southern Europe.
Greek shipowners have long argued that the European Union should pay more heed to shipping’s role in serving external trade and they currently represent more than half of the capacity of the EU fleet.
Correspondingly, though, they retain a huge presence in other regions.
The total capacity of Greek-owned shipping calling in the Americas last year also rose, to nearly 2.55bn dwt — although this reflected 21.4% of the Greek-owned fleet’s aggregate capacity in port calls worldwide, a slight decrease from 2018.
The increase was fuelled mainly by greater cargo movement in South America, which has outstripped North America as a destination for Greek tonnage.
Dry bulk carriersFor the Greek-owned dry bulk fleet, Asia remained overwhelmingly the most important destination in 2019, with calls to the China Sea sub-region increased to about 1.17bn dwt.
The Asea region of Southeast Asia — including Cambodia, Indonesia, Malaysia, the Philippines, Singapore, Thailand and Vietnam — remained the second-busiest destination for Greek tonnage, despite dipping slightly to 573m dwt of calls.
Much of the cargo came from South America and Australasia, which ranked the third- and fourth-most important regions for Greek bulkers, with 12.1% and 10.8%, respectively, of global calls by tonnage.
Overall, 13.1% of all tonnage calling in ports around the world last year — across almost 5.4m port calls tracked by Lloyd’s List Intelligence — was identified as Greek-owned
Source: Lloyd’s List Intelligence
Source: Lloyd’s List Intelligence

ww
w.ll
oyds
list.c
om
18 | Lloyd’s List | October/November 2020
GREECE: FLEET
Altogether, Asia saw a staggering 44.5% of Greek bulker tonnage calling worldwide, with the Americas attracting 19.7% of tonnage and European ports in third place, with 11.8%.
Some 934m dwt of Greek-owned dry bulk capacity called in China in 2019, although this was a relatively modest 12.3% of all bulker traffic in Chinese ports.
The country’s dry bulk trade is dominated by Chinese owners, whose ships represented 54% of the bulker calls last year by number and 43% by capacity.
In India, where domestic owners control a smaller fleet and less market share, Greek-owned tonnage represented
nearly one-quarter of the bulker capacity in Indian ports, compared with 9% operated by Indian owners.
India is a far from negligible destination for dry bulk, ranking fifth last year in terms of calls by Greek-owned bulker tonnage.
Crude oil tankersWhile Greece’s dry bulk owners nowadays play second fiddle to Chinese owners in serving China’s dry bulk needs, the same is not true for crude oil tankers.
The powerful Greek crude-carrying fleet appears to have transported more crude to China last year than domestic owners.
An aggregate of 291m dwt of Greek-owned oil tankers called in the country’s ports, representing 20.7% of total traffic, compared with about 264m dwt of Chinese-owned tankers.
A feature of Greek-owned shipping is the significantly larger ships that Greeks, on average, own in comparison with worldwide norms.
In the crude trade serving China, the disparity is particularly marked, with the average Greek call last year being by a vessel of 228,988 dwt, hinting at a fairly even split between very large crude carriers and suezmaxes.
By contrast, the average Chinese-owned tanker calling in the country’s ports was 126,916 dwt.
Overall, Asia was the top destination for Greek crude tankers, with 29.6% of tonnage calls.
Meanwhile, 823m dwt called in the Americas and 809m dwt was logged in at
The powerful Greek crude-carrying fleet appears to have transported more crude to China last year than domestic owners
Source: Lloyd’s List Intelligence
For Greek crude tankers, 809m dwt was logged in at European ports, representing 0.8% of Greek crude activity.

20 | Lloyd’s List | October/November 2020ww
w.ll
oyds
list.c
om
GREECE: FLEET
European ports, representing 21.2% and 20.8% of Greek crude activity, respectively.
In terms of specific sub-regions, however, the Middle East Gulf saw the greatest amount of Greek-owned crude capacity, with an aggregate of about 670m dwt lifting crude cargoes from the region.
America, the Americas represented one-third of global Greek product tanker calls by tonnage, easily the most of any region.
Significant increases of Greek calls in the Black Sea and the eastern Mediterranean contributed towards an aggregate of 218m dwt of Greek product tanker calls in Europe.
That was enough to make Europe the second-most important destination for the Greek-owned products fleet, with 23.3% of their global footprint.
Asia attracted 178m dwt of Greek product tanker calls in 2019 and was the third-most important major region for the fleet in this sector. That was mostly due to the Asean, which ranks fourth in terms of sub-regions, with 19% of all Greek product tanker movements by tonnage.
Greeks scored relatively low shares of 4.1% and 7.9% of product tanker traffic in the ports of China and India, respectively, where the product tanker trades are dominated by domestic owners.
Relative to the other bulk shipping sectors, Africa is a significant destination for Greek product tanker owners, drawing a total of 100m dwt of port calls in 2019, or 10.7% of overall Greek product tanker tonnage calls.Source: Lloyd’s List Intelligence
Product tankersGreek product tanker trading is focused more on the Atlantic Basin than the Pacific and last year saw a sharp increase in tonnage calling in the US Gulf and in North America overall.
Despite a reduction in calls to South
Europe is the second-most important destination for the Greek-owned products fleet, with 23.3% of their global footprint.
22 | Lloyd’s List | October/November 2020ww
w.ll
oyds
list.c
om
GREECE: INFOGRAPHIC

October/November 2020 | Lloyd’s List | 23
ww
w.lloydslist.com
GREECE: INFOGRAPHIC

24 | Lloyd’s List | October/November 2020ww
w.ll
oyds
list.c
om
GREECE: FERRIESAttica Group
A vital contributor to the economy as well as a lifeline to the country’s island population, Greece’s ferries face a tough winter but also have longer-term renewal challenges to overcome, Nigel Lowry reports
T o say that a year has not quite played out as expected is something of an understatement when it comes to the experience
of the Greek ferry industry in 2020. Companies entered the year braced
for the challenge of compliance with the global sulphur cap and the market shakeout that this would surely trigger as some players suffered the full brunt of higher fuel costs — all too often the sector’s undoing.
Of the major operators, Minoan Lines seemed to have stolen a march on its competitors by installing scrubbers last year on its three 37,000 gt ropax ferries serving Crete and Santorini.
The debt-free subsidiary of Italy’s Grimaldi Group seemed well-poised to benefit from an expected further round of consolidation in the sector once fuel costs started biting.
The market’s largest owner, Attica Group, started the year with some fresh liquidity after issuing a €175m ($207m) bond that, after repayment of €99m of debt, had proceeds left over towards investing in scrubbers for certain ships.
By July, it had completed installation of scrubbers on two of its ships, Superfast XI and Blue Star Patmos.
However, the spread of the coronavirus pandemic upended most expectations and, by all accounts, has halved passenger volumes in the course of the year so far.
Many vessels remained idle during the first half of the year and, despite a resumption of activity during the summer months, the market has remained depressed.
According to a recent report by XRTC Business Consultants, which has been covering the sector for many years, the
By July, Attica Group had completed installation of scrubbers on its vessel Superfast XI.
Ferries feel full brunt of pandemic
industry is unlikely to survive the shock without support from public funding, either from the Greek state or the EU.
The 2020-2021 winter would be “exceptionally difficult for the sector, as the revenues from the first half of 2020 and from the summer will not suffice to cover the operating costs”, it said.
“The only way for the ferry companies to meet their obligations on a financial as well as an operating level would be a direct state or European grant to ensure their unhindered operation.”
While the focus of the ferry sector has mainly been on applying new operating procedures to ensure the health of its passengers during the coronavirus crisis, as well as surviving the financial damage wrought by the pandemic, future challenges are not being entirely ignored.
The Hellenic Chamber of Shipping has instigated an analysis of the renewal challenge facing the industry, with the help of consultancy PwC.
The coastal maritime sector is estimated to contribute more than 9% of the country’s gross domestic product, based on 2016 levels when it generated €16.1bn.
It serves 116 islands — the vast majority of them without an airport — and an island population of 1.4 million inhabitants, as well as the country’s tourism industry.
However, three-quarters of the fleet of 105 ropax vessels is already more than 20 years of age, with conventional ships the oldest, aged 28 on average. Of these, 13 are more than 40 years old.
Renewal processThe Chamber has called for the renewal process to begin immediately, given a likely development period of two to four years.
The analysis estimates that at least €4.5bn will be needed, based on preliminary estimates of two of the tranches of renewal, although the overall figure is likely to be much higher.
“The ageing fleet and the need for renewal are a vital issue for Greek and EU transport, which must be addressed,” says the Chamber.
Replacement of the oldest vessels will have to be done through constructing new ferries of energy-efficient design and green technologies, while only vessels of less than 20 years old are likely to be candidates for retrofitting.
The Chamber will be exploring potential funding with EU officials, with an eye on grants under the Connecting Europe Facility and the Cohesion Fund’s support for transport infrastructure projects, as well as loans from the European Fund for Strategic Investments and the European Investment Bank’s Green Shipping Guarantee programme.
The only way for the ferry companies to meet their obligations on a financial as well as an operating level would be a direct state or European grant to ensure their unhindered operation

Our VIRTUAL 2020 Awards Ceremonyis dedicated to Greek shipping’s virtues
Welcome Reception SponsorChampagne Toast Sponsor:
Event Sponsor:
Virtual Greek ShippingAwards 2020
17th Annual Awards CeremonyFriday 4 December 2020
For the first time, the 2020 Lloyd's List Greek Shipping Awards, the world's best-supported shipping awards event,will unfold excitingly before an even larger, worldwide online audience.The Greek Shipping Awards is used to attracting audiences of 1,000 or more guests and has become an unmissableannual event for the Greek shipping community and its partners. Our aim is to ensure that this year is no exception.Accordingly, we are holding our 2020 event as a Virtual Awards Ceremony, guaranteeing the qualityof the event and protecting the health of our many friends, colleagues and supporters in the maritime community.This is a boundless opportunity to attract greater attention than ever before to the achievements ofGreek shipping, comprising both industry leaders and unsung heroes as well as emerging talent from a new generationinvolved in the business. Don't miss it !
JOIN US AT 18:00 TBC (GREEK TIME) ON FRIDAY, DECEMBER 4, 2020 FOR THIS YEAR'S VIRTUAL GREEK SHIPPING AWARDS,
LIVE STREAMING ON WWW.GREEKSHIPPINGAWARDS.GR

26 | Lloyd’s List | October/November 2020ww
w.ll
oyds
list.c
om
Celebrating in 2019; this year, for the first time since it was established in 2004, the event will unfold online, not in front of a live audience.
GREECE: AWARDS
W hile many of this year’s marquee industry events have been cancelled, the Lloyd’s List Greek Shipping Awards
is following the time-worn mantra ‘the show must go on!’,
In this, the event is simply following the example that Greek shipping and the international shipping industry at large have set in coping with the unprecedented conditions created by the coronavirus pandemic and providing a largely uninterrupted service to global trade.
However, it is not quite a case of business as normal. For the first time since it was established in 2004, the drama of the Greek Shipping Awards will not play out in front of a packed house in Athens.
Instead, the world’s best-supported shipping awards will unfold online as a virtual event.
It will hope to attract an even larger, worldwide audience than its traditional in-person incarnation, which generally draws more than 1,000 guests.
Since the organising team felt committed to ensuring that the annual event recognising merit and achievement in the Greek shipping community should
continue, a virtual awards ceremony — guaranteeing the quality of the event and protecting the health of its many supporters in the maritime community — was clearly the best answer.
As usual, the awards will seek to identify deserving achievers within Greek shipping and the broader Greek maritime marketplace, comprising both industry leaders and unsung heroes, as well as emerging talent from a new generation involved in the business.
The task of choosing the winners falls to a panel of judges broadly representing the industry and including luminaries heading key national and international industry organisations.
No fewer than half of the members of the 2020 jury are making their debut on the panel.
The new faces are: Intercargo chairman Dimitris Fafalios; Semiramis Paliou, chairperson of the Hellenic Marine Environment Protection Association; Wista Hellas president Elpi Petraki; Costis Frangoulis, president of the Propeller Club, Port of Piraeus; and Danae Bezentakou, concept founder of the Young Executives Shipping Forum.
Boldly embracing and perhaps even expanding the possibilities of digital, this year’s Lloyd’s List Greek Shipping Awards are still being held, taking their cue from an industry that has kept going admirably throughout the pandemic, Nigel Lowry reports
The show must go on!

GREECE: AWARDS
ww
w.ll
oyds
list.c
om
28 | Lloyd’s List | October/November 2020
This year’s Virtual Greek Shipping Awards will unveil the winners in an exciting online ceremony on Friday, December 4, 2020
At last year’s awards ceremony:Above: the champagne toast, sponsored by China Classification Society.Left: Shipping Personality of the Year winner 2019, George Economou.Right, from top:The hosts, ERT broadcaster Andriana Paraskevopoulou and Nigel Lowry;The reception at the Athenaeum InterContinental Hotel; The band, Percussion4one.
Dry Cargo Company of the Yearsponsored by Marichem MarigasesTanker Company of the Yearsponsored by Bureau VeritasPassenger Line of the Yearsponsored by SWSShipbroker of the Yearsponsored by The Tsakos GroupShipping Financier of the Yearsponsored by Tototheo MaritimePiraeus International Centre Awardsponsored by SRH Marine SAITTechnical Achievement Awardsponsored by DNV GLInternational Personality of the Yearsponsored by Capital Ship Management Corp
The Safety Awardsponsored by SeaJetsShip of the Year sponsored by RightShipAward for Achievement in Education or Trainingavailable to sponsorThe Sustainability Awardsponsored by Lloyd’s RegisterThe Next Generation Shipping Awardsponsored by IRI/The Marshall Islands RegistryLloyd’s List Intelligence Big Data Award*sponsored by ABS* award not decided by the panel Greek Shipping Personality of the Yearsponsored by Eurobank
Lloyd’s List/Propeller Club Lifetime Achievement Awardsponsored by Shipping Deputy Ministry, Cyprus
Awards not open to outside nominations:Seafarer of the Year sponsored by Safe Bulkers IncGreek Shipping Newsmaker of the Yearsponsored by ExxonMobil
Event sponsor: ClassNKChampagne toast sponsor:China Classification SocietyWelcome reception:Vernicos Scafi Maritime
Awards categories and sponsors 2020

ww
w.lloydslist.com
GREECE: AWARDS
October/November 2020 | Lloyd’s List | 29
They join experienced panelists including George D. Pateras, president of the Hellenic Chamber of Shipping; Haralambos Fafalios, chairman of the Greek Shipping Co-operation Committee; Capt John Chalas, general secretary of the Panhellenic Seaman’s Federation; and Eleni Polychronopoulou, president of manufacturers’ association Hemexpo.
The awards are expected to be hotly contested in a year when Greek shipping has once again proved its adaptability and durability, continuing to ensure vital commodities and goods reach their destinations.
Many of the industry’s service partners have also risen to the challenges, innovating with new technologies or services that have enabled the country’s shipowners to operate globally with little or no interruption.
Maintaining high levels of efficiency, safety and service under these circumstances, while successfully protecting the health of employees ashore and at sea, is a remarkable achievement in which the industry as a whole can take pride. Yet each of the 18 awards must have an individual winner.
Let excellence navigate youSee why Maritime Cyprus
www.shipping.gov.cyShipping Deputy Ministry, Republic of Cyprus
Quality Sovereign Ship Registry Leading Maritime Centre Service of Excellence 24/7
Shipping Deputy Ministry
In alphabetical order:
Danae BezantakouConcept Founder, Young Executives Shipping ForumCapt John ChalasGeneral secretary of the Panhellenic Seamen’s Federation Dimitris FafaliosChairman of IntercargoHaralambos FafaliosChairman of the Greek Shipping Co-operation CommitteeCostis FrangoulisPresident of Propeller Club, Port of PiraeusNigel LowryAthens correspondent, Lloyds ListSemiramis PaliouChairperson of HelmepaGeorge D. PaterasPresident of the Hellenic Chamber of Shipping
Elpi PetrakiPresident of Wista HellasEleni PolychronopoulouPresident of Hemexpo
Judging panel 2020
The task of choosing the winners falls to a panel of judges broadly representing the industry and including luminaries heading key national and international industry organisations

30 | Lloyd’s List | October/November 2020ww
w.ll
oyds
list.c
om
GREECE: SHIP FINANCE
Joop Hoek/Shutterstock.com
In a much-changed ship finance landscape, Greek banks are demonstrating their commitment to one of the country’s key industries, Nigel Lowry reports
A esop’s fable about the hare and the tortoise, meant to convey a message that being slow but steady can win you the race,
may seem at first glance applicable to the re-emergence of Greek banks as prime players in the financing of Greek shipowners. However, it does not entirely capture the dynamic of the comeback.
Certainly, five Greek banks have managed to hang around in the ship finance market while a number of bigger and supposedly stronger international competitors have retired from the fray.
Yet by many accounts they have also been showing themselves to be nimble of strategy and speedy in their response by comparison with some of their international counterparts that have been slowed by regulation and increasing cumbersome internal processes.
Nor are the numbers very tortoise-like. According to a Petrofin Bank Research study, at end-2019, Greek banks were calculated to have a combined 17.9%
At end-2019, Greek banks were calculated to have a combined 17.9% share of the $53.1bn aggregate banking exposure to Greek shipping.
Greek bank comeback gathers pace
share of the $53.1bn aggregate banking exposure to Greek shipping among 55 banks that have made ship finance loans to owners.
The four banks deemed ‘systemic’ to the country’s financial system — Alpha Bank, Eurobank, National Bank of Greece and Piraeus Bank — each had a portfolio topping $2bn and ranked among the top dozen lenders to the sector.
This year, despite global conditions, they appear to be on track to rack up an aggregate of $2bn in fresh lending to owners while most other banks have been relatively quiet.
Since the Greek financial crisis that made it difficult for domestic banks to lend to shipping for several years, there is general agreement that banking oversight has become tougher.
Conspicuously, though, none of the Greek banks have yet subscribed to the Poseidon Principles, obliging signatory banks to regularly report on how their portfolios align with global reduction targets for greenhouse gas emissions.

Today, you need more than connectivity; you need a smart network solutions partner. One who knows your challenges. Who keeps you connected, no matter how remote your operations. One who provides customised network solutions and manages them for you. A partner determined to exceed your expectations every day. We are Marlink. And we are going ABOVE AND BEYOND.
www.marlink.com
Your quest for efficiency never ends. So we go Above and Beyond.

LASKARIDIS SHIPPING CO. LTD.
HEAD OFFICE
5, Xenias str. & Ch. Trikoupi
14562, Athens, Greece
Tel.: +30 210 62 84 200
e-mail: [email protected]
www.laviniabulk.com
A globally integrated shipping group
- Transportation (dry bulk, wet, reefer)
- Shipyards
- Ship Agency
- Logistics
- Terminals
- Fuel Supplies at High Seas
- Pelagic Fish Trading
On time - any time!

October/November 2020 | Lloyd’s List | 33
ww
w.lloydslist.com
GREECE: SHIP FINANCE
“Everyone else is more regulated than us,” says one insider.
“Most of the other European banks are adhering more to the Basel IV rules that in effect are putting shipping business in competition with other lines of business — and they are also adopting green shipping principles faster.
“At some stage, though, all these things will become obligatory.”
History may have played a role in leaving Greek banks in relatively good shape to do shipping business — at least for now.
National Bank of Greece was doing shipping business in the 1960s and 1970s and was eventually joined by the other leading banks in the 1990s, so all have decades of experience.
While Greek banks – which numbered 15 back in 2003 – expanded during the China-fuelled shipping boom of subsequent years, they were unable to match the ultra-aggressive pricing of some of their foreign competitors, resulting in fewer bad loans to be dealt with down the road.
Several of the Greek banks have sold off loan portfolios, trimming their overall exposure.
Last year, for example, Piraeus Bank sold its ‘Nemo’ package of about $580m in non-performing loans to US-based fund manager Davidson Kempner Capital Management.
National Bank of Greece offloaded about $300m in bad loans to funds represented by Cross Ocean Partners.
However, many of the bad loans in the case of Greek banks have been a legacy of the consolidation of the Greek banking market in past years.
Overall, Greek banks do not have legacy loans that have burdened down their portfolios in the same way that non-Greek banks have. They have always been a little bit more conservative than their overseas counterparts
Katerina Stathopoulou Executive director
Investments & Finance
Greek shipping portfolios as of end 2019
*Market estimate Petrofin Bank Research © June 2020 The four banks deemed ‘systemic’ to the country’s financial system.
Having been inherited in many cases due to merger transactions, they have had less of an impact on senior management faith in their bank’s course in shipping.
“Yes, they have sold NPL loan portfolios and have thus cleaned their balance sheets — but that has not stopped them continuing to put new business on the books,” says Katerina Stathopoulou, executive director at Investments & Finance, a financial advisory based in Piraeus.
“Greek banks are prominent again in the industry, as they have the capacity to lend, whereas their foreign competitors’ appetite for shipping loans is rapidly decreasing.
“Overall, Greek banks do not have legacy loans that have burdened down their portfolios in the same way that non-Greek banks have.
“They have always been a little bit more conservative than their overseas counterparts.
“In the high of the market, where their overseas counterparts were more aggressive, their loan book was not increasing at the same pace.
“However, they are always there and available for their clients,” she says.
“Loyalty is a two-way street, which pays off in the long-run.
“Shipping finance is one of the core business units of Greek banks and no Greek bank has closed down its shipping finance department, as international counterparts have.”
Another key difference has been that, by and large, Greek banks have remained true to the relationship banking model.
“By being close to the client and understanding their business model and risk appetite, it gives them the advantage of providing shipping loans structured around the company’s profile and not based on a rigid policy financing model,” says Ms Stathopoulou.
Bank ranking (in $)

October/November 2020 | Lloyd’s List | 35
ww
w.lloydslist.com
“Greek banks are very seasoned in risk analysis of the proposed project at hand, but they also structure the loan with a commercial viewpoint and customer knowledge,” she adds.
Piraeus Bank, the largest of the country’s system banks, took a “proactive approach” to updating its lending strategy for shipping, according to Eleni Vrettou, the bank’s executive general manager and chief of corporate and investment banking.
That included not only selling the problematic portfolio, but also expanding its clientele and strengthening the quality of the core portfolio.
“Greek banks have benefited from the exit of several international traditional lenders in shipping,” says Ms Vrettou.
“Despite the challenges they have faced in the past, they have remained strongly committed to the sector, which also offers a nice hedge against Greek domestic activities.
“The strongest advantage Greek banks have is that they consider this sector as strategic.”
Also, they had appetite for smaller fleets and sometimes for older vessels than tend to be considered by most international banks.
Other factors that have added to the growing competitiveness of Greek banks include their ability to secure liquidity at a reduced cost, thanks to European Central Bank policy; and the fact that Greece’s enhanced credit status has enabled them to better compete on margins with non-Greek lenders, Ms Vrettou says.
In addition, Greek banks “discerned the pandemic as an opportunity to enhance their positions with a group of target Greek clients who faced limited finance possibilities” from elsewhere.
GREECE: SHIP FINANCE Ink Drop/Shutterstock.com
Despite global conditions, Greek banks may be on track to rack up an aggregate of $2bn in fresh lending to owners.
“Given the highly strategic nature of shipping for Greece, it goes without saying that it is a core sector for Piraeus Bank,” she says.
“We will continue to support our customers in this sector, while at the same time cautiously adding new names to the portfolio.”
According to Ms Vrettou, the approach “remains conservative, focusing on the optimal management of the existing portfolio, and on improving its quality, by providing targeted new financing”.
This has seen the bank already conclude fresh lending of $400m this year and, by end-2020, that is expected to rise to $500m, replicating Piraeus Bank’s performance in 2019.
Piraeus Bank is not the only Greek lender that has been very active in 2020.
Alpha Bank is expected to have provided about $800m in fresh lending to shipping clients in the course of the year, a near-record for the bank.
Eurobank, too, has been busy with drawdowns exceeding $600m. This is forecast to increase the bank’s portfolio by about $200m to $2.4bn at year’s end.
Collectively, it seems likely that in the near future, Greek banks will be further increasing their share of the Greek ship finance market — but the rise may have limits.
“I think Greek banks will expand in shipping, but perhaps not massively,” says Eurobank’s head of shipping Christina Margelou.
“It’s difficult to grow because the money is being repaid! You need to retain flexibility. You need to trust the owner first and then the asset. This is the way Greek shipping developed in the past.”
Ms Margelou also underlines the need for maintaining a disciplined approach to doing new business.
“We don’t want to be biggest, but rather best in class,” she says.
“As Greeks banks, we need to have memory because for us, shipping is continuing. We remain in the market. In Greece, you can’t walk out of shipping.”
As Greeks banks, we need to have memory, because for us, shipping is continuing. We remain in the market. In Greece, you can’t walk out of shipping
Christina Margelou Head of shipping
Eurobank
We will continue to support our customers in this sector, while at the same time cautiously adding new names to the portfolio
Eleni Vrettou Executive general manager,
Chief of corporate and investment banking Piraeus Bank

36 | Lloyd’s List | October/November 2020ww
w.ll
oyds
list.c
om
Container throughput at the main deepwater port at Cai Mep-Thi Vai in south Vietnam increased by an annual rate of 27% in 2019.
SPECIAL REPORT: CHANGING TRADE LANES
T here has been a shift from South China manufacturing hubs to new production centres in Southeast Asia taking place over the past
couple of years, accelerated by recent events such as supply chain disruptions due to the coronavirus pandemic and Sino-US tensions.
While some segments of the container shipping sector have benefited from it to some extent, the pace and scale of change has been moderate overall.
“Even in the mid term, say three to five years, there is only so much that can move,” said CTI Consultancy partner Andy Lane.
“But 10% of a huge base shifting to elsewhere is still a significant quantity of cargo,” he said, adding that this shift would also be divided between Southeast Asia and nearsourcing initiatives to bring plants closer to the large consumer markets of North America and Europe.
“A lot of manufacturing has moved from China to Southeast Asia and has been happening for years now,” said AlixPartners’ Brian Nemeth.
“We are seeing volumes move to Vietnam, Thailand, Cambodia, the Philippines and Indonesia,” he said, adding that there has also been a lot of movement to South Asia and especially India.
Providing more colour to the type of
shifts involved, Mr Nemeth said: “We see movements of sub-assemblies and components travelling from South China to places such as Vietnam for final assembly.”
“Even before the Covid-19 pandemic, we had witnessed companies diversifying their supply chain to better respond to the changing market trends and customer demands,” added Kuehne+Nagel Asia Pacific senior vice-president for sea logistics Casper Ellerbaek.
He noted that while companies in Europe, US and Japan were the first to initiate this diversification, an increasing trend has also been seen recently among Asian companies. Mr Ellerbaek also pointed out that more Chinese companies are moving their production/sourcing from China to Southeast Asia.
“One critical factor for this shift is the efforts made to reduce geopolitical and other risks by individual companies,” he said, adding that financial and investment incentives offered by Southeast Asian countries is another main driver.
“For some time now, we have already seen a shift in production bases away from China to other countries, especially the Southeast Asian markets and I believe the trend will continue,” said Karsten Michaelis, DHL Global Forwarding Asia Pacific head of ocean freight.
SSIT
Carriers have been quick to respond to the manufacturing shift, rolling out a host of new services to Vietnam, Thailand, Cambodia and other Southeast Asian hubs, Vincent Wee and Linton Nightingale report
Container sector follows as manufacturing shifts south

ww
w.lloydslist.com
October/November 2020 | Lloyd’s List | 37
SPECIAL REPORT: CHANGING TRADE LANES
“Some may be due to geopolitical tensions, but for a lot of customers, they now realise that they have been too reliant on a single market, which proved to be very challenging when there were restrictions due to Covid-19 measures,” he added.
Liner industry players corroborated these trends. Charlie Chu, executive vice-president for business and logistics with major intra-Asia feeder player Regional Container Lines, said: “RCL’s liftings from South China did not grow in past years due to manufacturing hubs shifting out, whereas the liftings in Southeast Asian countries like Vietnam, Thailand and Malaysia have obvious growth.”
Till Ole Barrelet, managing director of CMA CGM intra-Asia line CNC, said: “While China remains the largest exporter of the world’s production, we have observed more export volumes from locations like Vietnam, Indonesia, Taiwan and Bangladesh, among others; and a change in the types of commodity being transported.”
Ocean Network Express, however, was slightly more cautious. “We understand that manufacturing hub shifts have been taking place for some time. However, it is too early to see a big influence on our services yet because some customers have manufacturing plants in both South China and Southeast Asia and they are flexible where to put weight, depending on the situation,” said a ONE spokesperson.
Another prominent regional feeder line source also cautioned against reading too much into the shifts. Pointing to the fact that the top 10 port rankings in terms of throughput numbers between the first half of 2020 and the same period in 2019 have not changed much, she said. With China and Hong Kong accounting for 70% of them, China’s ports will remain the most important ports of call for mother vessels.
intra-Southeast Asia services to meet the growth in demand from the changes.
Mr Barrelet noted that in the first nine months of 2020, approximately 21 new and enhanced CNC services were introduced for the intra-Asia shortsea market, including special services such as the China-Vietnam-Cambodia service launched in April to serve as an alternative Cambodia-Vietnam sea route when the land border between the two countries was closed due to coronavirus.
While capacity demand for feeder operators has not been as strong as before, recent months have seen a lot of occasional extra demand for feeder capacity in various feeder ports, caused by blank sailings in the hubs combining with the mainlines’ inability to cope with demand through their own feeder connections, Mr Chu pointed out.
Total exports by country (2016-2019)
Source: Container Trades Statistics
Total exports by country (year-on-year percentage change)
“Omitting China and adding Southeast Asian ports instead is rare these days,” she said, while maintaining that Chinese ports are still more suitable for large vessels to make direct calls because of factors such as port facilities and geographic restrictions.
AlixPartners’ Mr Nemeth also pointed out the huge disparity in volumes. “In order to even come close to the volumes that have historically been shipped from China only to the US, you would need to aggregate almost all the Southeast Asian origins.”
The lines have nonetheless mostly been quick to cater to these shifts, putting on new services and with even some mainline players seen joining the party.
RCL’s Mr Chu said in the intra-Asia segment, there were “quite a few new services launched into the market, to take advantage of the business growth”, with many mainlines also deploying their
European exports by country (year-on-year percentage change)
Source: Container Trades StatisticsSource: Container Trades Statistics
Despite the ongoing manufacturing shift, the disparity between China’s exports and those of other Southeast Asian nations is striking

SPECIAL REPORT: CHANGING TRADE LANES
ww
w.ll
oyds
list.c
om
38 | Lloyd’s List | October/November 2020
US imports from Southeast Asian countries
Source: Container Trades Statistics
Total mainline port calls (selected Southeast Asian ports, 2017-2020)
Source: Sea-Intelligence
In line with its cautious stance, ONE said due to the impact of Covid-19 and the accompanying restrictions, it had been responding “flexibly in terms of frequencies, number of calls per service, and service patterns” in the first half of 2020, with continued volatility in the second half of the year.
The port operators that have the right facilities and location to take advantage have also seen some benefits.
“Container throughput at the main deepwater port at Cai Mep-Thi Vai in south Vietnam increased by an annual rate of 27% in 2019 and, in the seven months to July 2020, volumes increased by 16% compared to the same period last year,” said Hutchison Ports Southeast Asia managing director Stephen Ashworth.
Hutchison has a flagship terminal at Laem Chabang in Thailand, as well as gateway terminals in Tanjung Priok in Indonesia and Thilawa in Myanmar.
“I would attribute such percentage increases to the lower base in previous years. As [Cai Mep] mainly handles shipping line services on the main east-west trades, this indicates that Vietnam is possibly the main beneficiary so far of the manufacturing shift from China,” added Mr Ashworth.
At the northern end of Vietnam, Tan Cang Haiphong International Container Terminal has also benefited from early investments, being the only facility in the area capable of handling ultra large container vessels.
Noting the shifting production trend, TC-HICT marketing manager Huy Bui Quang said the area within a 100km radius
298,000 teu to the end of August, up 32% from the same period in 2019. TC-HICT has a 50% market share of this trade. Meanwhile, total volumes through the terminal almost doubled compared to the same period in 2019, up to 398,000 teu.
Much of this has been driven by new services. Mr Huy said TC-HICT, which only started operations in 2018, now receives 12 calls per week, including three transpacific services, in addition to two subcontinent services and seven intra-Asia services.
“We expect the shipping lines will continue to deploy new direct services to the US so as to meet the increasing cargo volume in the coming time,” he said.
Mr Huy added the terminal operator is working to get approval to handle 14,000 teu vessels in the near future, while its Phase II terminal expansion is expected to start in 2021.
Placing his bets on more mainline calls, Mr Huy said: “We see the trend is that the big shipping lines will have more market share, while the smaller shipping lines and NVOCC will lose its market share.”
Hutchison’s Mr Ashworth also sees this trend: “Shipping lines are now increasingly deploying larger vessels on their service loops where possible, especially in markets where volumes are expected to increase.”
In line with this has come an increasing interest from shipping lines to deploy larger vessels on longer-haul US and European services rather than transhipping at one of the region’s hub ports such as Singapore, he noted. Its new fully remote-controlled Terminal D at Laem Chabang is set to benefit from this.
of the port had attracted many businesses moving from China. These include big electronics manufacturers, such as Pegatron, Foxconn, Samsung Electronics and USI, who all announced investment plans in the first eight months of 2020.
The liner source also noted the growing foreign investment and increasing shift of factories to Vietnam and acknowledged that despite draught limitations in many Southeast Asian ports, a few longhaul mother vessels have started to make direct calls at Cai Mep.
According to Mr Huy, exports from Haiphong port to the US reached
The number of mainline calls has not changed dramatically at the major ports in Southeast Asia over the past few years. However, Chittagong and Haiphong have seen a definitive increase in direct services. Although Cai Mep has seen a slight fall, volumes have surged, with larger vessels frequenting the port
China remains the largest single exporter to the US — and by a distance, despite the rise in goods shipped in by other Southeast Asian countries in recent years

ww
w.lloydslist.com
SPECIAL REPORT: CHANGING TRADE LANES
October/November 2020 | Lloyd’s List | 39
Looking ahead, however, the multi-million-dollar question is how the various industry players should position themselves for the future trading environment. This really depends on how significant and permanent they think the shift is — and it seems the jury is out on this.
While some believe this is a seismic shift, others are more hesitant.
Mr Chu said: “This is a systemic paradigm shift — the industry has to face and deal with this.”
Mr Ashworth shares this view. He said: “There is existing and growing evidence of cargo volumes migrating from China to markets in Southeast Asia and South Asia.
“We are aware of a possible increase in volumes in the longer term at our Southeast Asian terminals post-Covid (over and above normal market growth), arising from the China to Southeast Asia manufacturing shift and we are monitoring this carefully,” he added.
“It is too early to make any strategic decisions under the current circumstances,” said ONE, adding:
“We need to monitor the trade pattern changes closely at least for half a year.”
Mr Nemeth from AlixPartners said: “We are not sure that the volumes are large enough at this point for broad-ranging network changes yet.”
On the tricky question of investment, he highlighted the current disconnect between ports able to handle mainline vessels and the new Southeast Asian alternative production centres.
While acknowledging that these ports will need to invest in upgrades in order to handle the large vessels, Mr Nemeth emphasised that this depended on strategic decisions around how long the manufacturing boom in Southeast Asia will last.
Source: Container Trades Statistics
US imports by country (year-on-year percentage change)
With deepsea calls of any magnitude not being seen in north Vietnam or the Philippines or Indonesia in the near future, if at all, CTI’s Mr Lane ventured that the region’s traditional transhipment ports will not be replaced in the short to mid term.
“The ports will follow the developments, try to predict the future, and scale accordingly,” he forecasted.

40 | Lloyd’s List | October /November 2020ww
w.ll
oyds
list.c
om
CHANGING TRADE LANES: ARCTIC
Melting Arctic ice has long tempted shipping with its potential to slash travel times, costs and emissions between Europe and Asia. But its punishing logistics, fragile environment and geopolitics make the region’s future far from clear, Declan Bush reports
R ussia has long touted the potential of its Northern Sea Route through the Arctic to upend sea trade by slashing voyage times from
Europe to Asia. The NSR, which runs across Russia’s
north coast from the Barents Sea to the Bering Strait, is increasingly navigable as the ice recedes each year.
In September, ice coverage shrank to 3.74m sq km, the second-lowest level seen in nearly 42 years of satellite records.
Shipping traffic on the mostly frozen route, which cuts one to two weeks off Asia-Europe trade, has surged.
There were 71 vessels and 935 sailings across the NSR from January to June this year, according to the NSR information office — up from 47 vessels and 572 sailings in the same period two years ago.
Cargo has grown from 2.8m tonnes in 2013 to a projected 32m tonnes by the end of this year — just above last year’s 31.5m tonnes. Russia hopes to reach 110m tonnes by 2030.
About 80% of this cargo is linked to two hydrocarbon export projects: Gazprom’s Novy Port crude oil project (7.7m tonnes last year) and Novatek’s Yamal liquefied natural gas project (18.4m tonnes).
Novatek, Russia’s biggest private gas company, hopes to ship 57m-70m tonnes of LNG a year by 2050, supported by 15 Arc7 ice-class LNG carriers. It has two floating storage and transhipment units due for delivery in 2022.
Russia’s nuclear icebreaker Arktika set off in September for use by Rosatom.
Shipping on thin ice: Russia’s Northern Sea Route
Russia has invested heavily in nuclear icebreakers to make the route useable year-round. The first of these, Arktika, set off in September for use by Russia’s nuclear energy agency Rosatom, which runs the NSR.
Yet such ships may soon be less crucial for some of the year. An LNG carrier was cleared to travel unescorted in September; a 100-year-old tall ship reportedly made it through the following month.
Companies including China’s Cosco Shipping also use the route for
point-to-point project cargoes, such as wind turbine blades.
Ake Rohlen, managing director of Arctic Marine Solutions, a consulting firm, calls the increase in cargoes “quite phenomenal”.
While transit cargoes made up just 580,000 tonnes this year, “for sure the actual shipments are there”.
“It is absolutely no competitor to the Panama or the Suez Canal; but it is for sure living comfortably on the traffic of raw materials,” Mr Rohlen says.

CHANGING TRADE LANES: ARCTIC
ww
w.ll
oyds
list.c
om
42 | Lloyd’s List | October/November 2020
Malte Humpert, founder of non-profit research group the Arctic Institute, says the route is still “very niche” but its growth has been significant.
He says about 5% of LNG is being produced in the Arctic and could exceed 10% in the future.
However, while the NSR prospers from oil and gas, few believe it can work for containerships.
Mr Humpert says the route lacks the necessary port infrastructure and population centres. “The economics just aren’t there,” he says.
Mr Rohlen says shifting ice conditions are still a challenge and less total ice coverage does not always make for easier navigation.
The route is still frozen for much of the year and requires specialised ships and crew. Parts of it are too shallow for ships of more than 5,000 teu.
Also the prospects of cleaning up an Arctic oil spill, removing a shipwreck, or rescuing sailors from a casualty far from shore in sub-zero temperatures are still daunting.
Maersk, the world’s biggest container shipping operator, made headlines when it sent the boxship Venta Maersk on a trial voyage through the NSR in 2018 — but this looks increasingly like a one-off.
“We found that the Northern Sea Route is not a commercially viable alternative to our current routes,” the company tells Lloyd’s List, adding it has “no plans to pursue the NSR”.
Container lines including Hapag-Lloyd and France’s CMA CGM have pledged not to use the NSR on environmental grounds — though observers note it is easy to vow not to do something that is likely to lose you money.
Mr Humpert suggests vehicle carriers as one group of potential new users in the future, since they stop less often than containerships and do not need to be as punctual.
However, Wallenius Wilhelmsen, the Scandinavian car carrier, says: “In view of current and foreseeable commercial, sustainability and operational considerations, we do not believe the Northern Sea Route will become viable for us.”
GeopoliticsYet the NSR’s future also depends on geopolitics. Russia has rebuilt Cold War military bases, hoping that by being the first power in the region, it can set the rules.
China, meanwhile, needs to lessen its energy dependence on global trade chokepoints like the Strait of Malacca and Suez Canal, which an opposing power could blockade in the event of war.
The prospects of cleaning up an Arctic oil spill, removing a shipwreck, or rescuing sailors from a casualty far from shore in sub-zero temperatures are still daunting
Pressure is also growing to protect the environment. A proposed ban on the use and carriage of heavy fuel oil in the Arctic is working its way through the International Maritime Organization, but green groups say it has too many loopholes to work.
There is also pressure on the IMO to reduce black carbon emissions, which heat the ice and hasten climate change.
Silver liningsThere may be silver linings. Mr Rohlen says pressure on companies to avoid accidents will lead to “some of the highest standards applied in shipping”, which could set an example for the rest of the industry.
He says Arctic gas could one day be used to produce cleaner-burning shipping fuels, such as methanol.
State-owned Russian shipowner Sovcomflot hopes to ensure Arctic shipping is sustainable through rigorous crew training, energy-efficient vessels and supporting policy bodies like the Arctic Economic Council.
“In particular, we believe cleaner-burning LNG fuel has good prospects for adoption as a fuel for vessels operating in the Arctic to reduce the emissions footprint of vessels — a vital step, given the sensitivity of the Arctic environment,” the company says.
Mr Humpert says in the end, the reason Russia has spent so many billions of dollars in the region while other countries have not is because it needs to.
“In Russia, 20% of the GDP is being generated above the Arctic Circle,” he says. “The future of Russian oil and gas lies in the Arctic.”
Maersk sent the boxship Venta Maersk on a trial voyage through the NSR in 2018 — but this looks increasingly like a one-off.

October/November 2020 | Lloyd’s List | 43
ww
w.lloydslist.com
At ONE, we like to think of ourselves as ‘movers of life’. We connect people and businesses with commodities and manufactured products by transporting them efficiently, reliably and safely across the globe. Despite the latest pandemic, life will find a way to go on. And as ‘movers of life’, we will be with you every step of the way as we navigate these challenging waters together
ONE
The resilience of the shipping industry is currently being tested by the Covid-19 pandemic, which has further exacerbated industry struggles
following the collapse of Hanjin Shipping in 2016 through to the recent protracted US-China trade war.
Although many countries are in various stages of exiting lockdown, it would be naïve of us to expect a simple return to normality immediately. According to estimates by the International Labour Organisation (ILO), nearly 25 million jobs could be structurally lost globally due to the coronavirus.
While the future holds much uncertainty, the container shipping industry globally has risen to the challenge. At Ocean Network Express (ONE), we remain optimistic about the future and are looking forward to working constructively with all our customers and business partners to build a better post Covid-19 future.
In the first quarter of 2020, ONE reported $167m profit compared to $5m in the same period last year despite a 20% dip in cargo demand year-on-year.
We have a strong balance sheet, a strong and motivated global team and minimal debt. Amid the pandemic, we stayed agile by optimising our global network and recalibrating product offerings based on market dynamics, managing capacity and keeping utilisation rates low.
Most importantly, our 8,000-strong global workforce has the flexibility, whether working at the office or from home, to continue to provide a high level of service quality and focus on process excellence throughout these challenging times.
We remain optimistic about the future and are looking forward to working constructively with all our customers and business partners to build a better post Covid-19 future.
Keeping the world moving amid an ongoing pandemicThe people who move lifeTo the average person, the shipping industry is made up of lifeless ships (approximately 5,500 container vessels operate globally) and huge metal containers (the industry makes around 400 million individual unit journeys per year). Yet behind every container shipment and sailing lies a dedicated network of people who ensure goods are moved efficiently and safely across the world.
In terms of container shipping, we’re talking about around 400,000 seafarers, 250,000 port workers and some 100,000 dedicated office staff worldwide. And millions more people who form part of the extended global logistics network, providing trucking, barge, rail, warehouse, customs brokerage and local forwarding services.
These are the people who work tirelessly around the clock, 365 days a year, to support global trade. Without them, our supermarket shelves would be empty. Our hospitals would face a severe shortage of essential medicine and medical equipment. Without functioning ports, cargoes including those with life-saving supplies cannot be transported to where they are needed.
At ONE, we like to think of ourselves as ‘movers of life’, because that’s exactly what we do every single day. We connect people and businesses with commodities and manufactured
products by transporting them efficiently, reliably and safely across the globe.
In this time of global crisis, ‘movers of life’ play a critical role in ensuring that the increased demand for cross-border movement of relief, goods such as food and medical supplies, are adequately met. It is therefore more important than ever to keep supply chains open and maritime trade and transport moving.
This means keeping the world’s ports open, facilitating crew changes and the movement of ships and containers with as few restrictions as possible. Shipping, ports and inland logistic services hold the world economy together. They connect countries, markets, businesses and people, on a scale not otherwise possible.
Moving ahead into the futureDespite the latest pandemic and other likely future challenges, life will find a way to go on. And, as ‘movers of life’, we will be there with you every step of the way as we navigate these challenging waters together.
We remain committed to ensuring that humanity and commerce can continue to have access to the goods and services they need to preserve our quality of life, protect the environment and keep the wheels of the global economy moving as efficiently as possible.
Sponsored by Ocean Network Express

44 | Lloyd’s List | October/November 2020ww
w.ll
oyds
list.c
om
CHANGING TRADE LANES: US GULF
FOTOGRIN/Shutterstock.com
Monthly tonne-mile demand is tracked at its second-highest level in September as European and Asian refineries keep buying, contradicting the negative post-pandemic predictions, Michelle Wiese Bockmann reports
The global pandemic briefly dented the record-breaking pace of crude exports from Texan ports, but they are again gathering pace.
Spotlight on US Gulf shows crude exports defy poor prognosis
M onthly crude exports from the US Gulf are now exceeding 3m bpd for the first time since March, as data reveals a rapid
recovery for this trade route, even after recent hurricane-related port closures.
Shale oil shipped from the US Gulf has transformed global crude flows over the past four years, with 20 different blends going to more than 40 countries.
Shipments surged after the ban on crude exports lifted in December 2015.
Volumes are now 15 times higher than the initial trickle of condensate cargoes that launched the shale boom in 2015.
Even after the Covid-19 oil demand slump, the US fossil-fuel energy juggernaut is by no means over.
The global pandemic briefly dented the record-breaking pace of crude exports from Texan ports, but they are again gathering pace.
Exports peaked at 3.5m bpd in
February, according to US Energy Information Administration data.
US Gulf exports then dipped to an 11-month low in June, and surpassed 3m bpd in July, the latest month for which EIA statistics on PADD 3 are available.
PADD 3 covers US Gulf ports from where shale oil is exported after being piped, railed or trucked from the Permian and other basins.
Tonne-mile demandTonne-mile demand from Gulf coast ports, measuring volumes carried by distance travelled, was tracked at the second-highest level in September, according to Lloyd’s List Intelligence data.
Tonne-mile demand is used as a proxy for tanker demand. The 86.7bn tonne-miles measured in September is only surpassed by March’s figure of 93bn tonne-miles.
The numbers appear to defy gloomier forecasts in September from S&P Global Platts that exports would track lower, to dip at 1.4m bpd by April 2021.

ww
w.lloydslist.com
CHANGING TRADE LANES: US GULF
Higher tonne-miles reflect not only the recovery in volumes but the rise in longhaul cargoes heading to Asia, where China and South Korea are the biggest buyers of the light, sweet crude.
The tanker market has welcomed the shale oil boom for its tonne-miles and employment — from aframax tankers to very large crude carriers.
VLCCs account for 33% of barrels exported for these longer voyages to Asia.
In all, 30% of barrels are shipped on aframax tankers. These smaller vessels are used for cargoes to European ports, as well as reverse-lightering operations to VLCCS at anchor offshore.
Largest buyersRefineries in the EU27 plus the UK combined are now the largest buyers of US crude.
Much has been written about Chinese imports, which have been patchy and dictated by price and geopolitics.
Under Phase One of a trade agreement, China has to buy $200bn more in goods and services over two years from 2020.
Energy commodities, such as crude and liquefied natural gases, will comprise much of this deal.
May’s exports to China were the highest monthly volumes ever, at 1.26m bpd, when oil prices were at 21-year lows, EIA data shows.
Because Asian economies, especially China, are recovering faster than Europe and North America, trade flows are steady. That is benefiting the largest tankers and generates the most tonne-miles.
Arbitrage economics surrounding price, freight and discounts to other oil grades largely dictate flows.
Europe purchases are recovering at a slower pace, as refinery utilisation remains well below average and has not recovered from April’s demand shock.
By July, EIA statistics showed monthly exports to the EU27 plus UK at 1.2m bpd, doubling from two months prior, when shipments fell to a 12-month low.
October/November 2020 | Lloyd’s List | 45
Even after the Covid-19 oil demand slump, the US fossil-fuel energy juggernaut is by no means over
US Gulf exports by vessel type
Source: Lloyd’s List Intelligence
US Gulf (PADD 3) crude flows (’000 bpd)
Source: US Energy Information Administration
Tonne-mile demand for US Gulf crude exports
Source: Lloyd’s List Intelligence

46 | Lloyd’s List | October/November 2020ww
w.ll
oyds
list.c
om
CHANGING TRADE LANES: US GULF
Lowest levels of refinery utilisation are reported in France, UK and the Netherlands. August utilisation reached 58% and 66%, respectively, with overall OECD Europe at 74%, International Energy Agency figures show.
The second wave of coronavirus is stalling Europe’s nascent recovery in demand for land transport fuels in 2020’s final quarter.
Newly imposed lockdown restrictions inject fresh uncertainty about the impact this will have on gasoline, jet fuel, diesel and gasoil consumption.
US-Europe crude imports likely showed month-on-month gains in July because the light sweet crude grades from the Permian basin are suited for European refineries, which are mostly configured for producing higher yields of gasoline. Motor fuel has shown the most resilience as demand for air and land transport was affected by the Covid-19 outbreak.
Profits to refine crude at European refineries dipped to multi-decade lows in September. Preliminary data suggest that US exports to the UK, the Netherlands and France were lower in August and September because of this.
Nevertheless, volumes still reflect the rapid shift in trade flows arising from shale exports.
For some months in 2019, US-EU crude flows equalled Urals crude to Europe from Russia.
For five consecutive months, US imports exceeded the production of the Brent, Forties, Oseberg, and Esofisk grades that comprise the Brent index
Additional pipeline capacity totalling 2m bpd, added in 2019, has augmented shale oil flowing to the export port of Corpus Christi from the Permian basin.
Port of Corpus Christi
last year, presentations from price report agency Argus Media showed.
US crude production has yet to return to the record-breaking levels of 13m bpd seen earlier this year, hovering around 11m bpd.
Yet crude imports to the US Gulf, where half of the country’s refinery capacity is based, reached 2.2m bpd in July, EIA data shows. That is already higher than the year-ago period, when 2m bpd were imported.
The PADD 3 region so far remains a net crude exporter in 2020, shipping more crude than it imports each month, even at the height of oil demand destruction.
Pipeline capacityExports in 2019 were 69% higher than 2018, at 2.9m bpd, EIA data shows. This growth was due to additional pipeline capacity totalling 2m bpd, added in 2019, augmenting shale oil flowing to the export port of Corpus Christi from the Permian basin.
Since the pandemic outbreak, several other pipeline projects to the US Gulf have been deferred, as well as plans for mooring buoys to accommodate VLCCs at ports.
Still going ahead (as of October 2020) was ExxonMobil’s Wink-to-Webster pipeline. This will transport another 1m bpd of Permian shale oil to the US Gulf from 2021.
The Phillips 66-owned, 900,000 bpd-capacity Gray Oak pipeline from Cushing to Corpus Christi and Houston also began in April.
US crude monthly exports by key countries (’000 bpd)
Source: US Energy Information Administration
Since the pandemic outbreak, several pipeline projects to the US Gulf have been deferred, as well as plans for mooring buoys to accommodate VLCCs at ports

October/November 2020 | Lloyd’s List | 47
ww
w.lloydslist.com
New tunnels creating a vital roadway link under the Suez Canal provide SCCT access to the previously inaccessible lucrative Egyptian market. The transhipment facility is now looking to elevate its status in the region as a dual hub, offering a new gateway proposition to customers
The Suez Canal Container Terminal, located on the eastern side of Egypt’s Port Said, has long been established as one of the key transhipment hubs
in the east Mediterranean, serving as a vital stopover for east-west cargoes transiting the infamous waterway that bears its name.
However, SCCT is reinventing itself as a dual hub, or hybrid facility, off the back of a landmark infrastructure project that looks set to be a game changer for the terminal and its customers.
The Egyptian government recently opened a series of road tunnels underneath the Suez Canal, including two near Port Said, as one of the main projects under its wider ‘Egypt Vision 2030’ initiative to boost economic growth in the country.
The tunnels have created vital links between the east’s sparsely populated Sinai Peninsula and Egypt’s industrial heartland and capital Cairo in the west. Journeys that previously took hours — or even days — can now be completed in a matter of minutes, and 24/7.
For SCCT, located on the eastern side of the canal, this provides a newfound opportunity to tap into a lucrative and previously inaccessible market, according to its chief executive, Lars Vang Christensen.
“We are now extremely well connected to all the key industrial areas in and around Cairo — so as well as being a transhipment hub, we are now positioned as a key gateway for Egypt.
“More importantly from a customer perspective, they can actually leverage on both of these options by having a hybrid service.”
Tunnel vision: Suez Canal Container Terminal eyes gateway gains as landmark project opens window of opportunity
Impressive offering The option of handling gateway cargoes adds to an already impressive offering to customers utilising SCCT.
Not only does the modern terminal boast one of the highest levels of crane productivity in the whole Mediterranean, deepwater berths catering for the largest containerships on the water, ample yard space and long quay walls — but it also requires only minimal deviation for lines transiting the Suez Canal. In this case, the terminal is literally a stone’s throw away from the key trade route.
“When convoys travel through the canal, we can just bring ships out or phase them directly into the convoy,” explains Mr Christensen.
In terms of numbers, SCCT is already reaping the rewards of its unrivalled regional proposition.
The Port Said terminal has witnessed a 20% year on year hike in total port liftings over the past two years — and, more significantly, a 65% jump in gateway traffic in the past 12 months. This increase is even more impressive, considering this has come amid a global pandemic.
With SCCT majority owned by global port operator APM Terminals — which has more than 70 terminals under its portfolio, including a significant number handling predominately gateway cargoes — Mr Christensen says this has helped to smooth its transition into a hybrid port. “Their expertise has been invaluable,” he claims.
He expects annual throughput numbers to continue their upward trajectory as more and more customers take advantage of SCCT’s enhanced inland links.
This goes to explain why SCCT has also embarked on a significant investment programme to upgrade terminal equipment, costing more than $60m, in preparation for an influx of cargo.
Everything is in place for SCCT to become a regional hub to envy all its rivals.
Sponsored by SCCT

CHANGING TRADE LANES: BREXIT
ww
w.ll
oyds
list.c
om
48 | Lloyd’s List | October/November 2020
With just over two months to go until the end of the transition period, the UK freight sector is preparing for major changes in how trades occur with the EU. But there are concerns that some businesses have not yet done enough to prepare for the new trading environment, James Baker reports
Some firms in the UK will be in for a rude awakening come New Year’s Day 2021.
Brexit: the final countdownT he UK’s exit from the European
Union faces its final denouement in a little over two months’ time, when the transition period ends
on the last day of this year.From January 1, 2021, the UK will no
longer be in the EU customs union or the single market, which means the free movement of goods will come to an end.
For companies in the UK, this will mean trade with the UK will be done on a third-country basis.
Regardless of what trade agreement may or may not be arranged at the last minute, big changes are coming for the UK freight ecosystem.
There are concerns, however, that many firms in the UK are not yet ready for what is coming towards them at speed.
Even the government, in the form of Cabinet Office Minister Lord Agnew, has warned that some companies have their “heads in the sand” over Brexit — a charge fiercely decried by many in the transport sector.
Nevertheless, some will be in for a rude awakening come New Year’s Day.
“Our contact with customers has been mixed,” says Martin Meacock, product management director at customs software developer Descartes Systems.
“Some companies have done a lot of
work but there are some that have not done any preparation. Some believe a deal with the EU will make this go away, but it won’t.
“As soon as it was decided the UK would be leaving the single market and the customs union, free movement of goods would come to an end.”
For some, only in the past month has it become apparent that customs declarations will be required, no matter what happens, he adds.
Andy Cliff, managing director of logistics and supply chain advisory firm Straightforward Consultancy, says although large multinational import and export traders may have clarity on how they need to prepare for the end of this year, many logistics firms have still not presented their SME clients with a clear, simple and practical outline or checklist of what they need to do and when.
He believes that needs to include key elements such as the information they will need from their client in order to make the customs declarations that will become needed; and the cost and administrative implications — and who will pay them.
“The key thing to remember is that it doesn’t matter whether we get a deal or not,” Mr Cliff says.
DesignRage/Shutterstock.com

ww
w.lloydslist.com
CHANGING TRADE LANES: BREXIT
October/November 2020 | Lloyd’s List | 49
“We are leaving the customs union, so your exports to or imports from Europe will be affected, both in terms of costs and delivery times.
“In 2021, your imports or exports with the EU will be treated in a very similar way to shipments imported from the US or exported to China.”
The reality of this will go beyond the transport sector, says Mr Meacock.
“Take the example of garden designers, who have been importing plants from the Netherlands as if they were getting them from their local garden centre, with next-day delivery,” he says.
“Now there will have to be all the bio-security certificates and phytosanitary checks.
“Over a period of time, the supply chain will evolve to become a local distributor and will bring in these goods in bulk; but on day one, that is not going to be there, so those businesses will be severely affected.”
The same conditions will be faced by those exporting to Europe, too.
“People who would normally have shipped overnight to Paris may now take two to three days,” he says.
“But if the customer in Paris still wants it tomorrow, they will look elsewhere.”
Moreover, while the UK is offering deferral on customs declarations on shipments from the EU to the UK until July — something Mr Cliff says is providing a false sense of security — Mr Meacock warns that the same won’t apply for exporters.
“There is no deferral on export declarations,” he says.
“From day one, companies will need export documentation. Getting goods out of the country won’t help you if they are then stuck on the other side.
“French customs are warning ferry companies to not allow any goods on board unless they have a transit declaration or a French import declaration.”
Given the complexity of supply chains, there is a risk that the chain will only be as strong as the weakest link, says Peel Ports commercial director Stephen Carr.
“One of the things we’re most conscious of is that for Brexit to work, you have multiple parties, from cargo owners to vessel operators to the various border agencies,” he says.
“No one party can control the preparedness of anyone else in that chain. That weakness will probably manifest itself at the port.
“The port can be as prepared as it possibly can, but if any one party in
that chain hasn’t followed the process completely, and cargo gets stopped, it will become visible at the port.”
Because of this, Peel Ports is backing the unaccompanied freight model to help avoid hold-ups.
“If an accompanied vehicle is stopped for something, that driver cannot move and is stuck. But if an unaccompanied trailer is held, when the haulier arrives, he can be transferred to a trailer that has been cleared,” Mr Carr says.
“Container carriers have operated this model for years. Border agencies don’t stop every unit, so bringing in machinery from the US will have a lower rate of inspection than if you were bringing in a powdered product from Colombia.”
And, while cross-Channel ferry and accompanied freight services may face challenges, Mr Carr sees a better future for longer sea routes that remove the need for truck haulage across Europe.
“The starting point pre-Brexit was that there was a growing shortage of drivers,” he says.
“If you layer on the difficulties of drivers coming through borders and licensing, factors say the pool of haulage drivers will be smaller than it was. That will push towards the longer-distance, unaccompanied sea freight model.”
Both Brexit and Covid-19 are likely to bring long-term shifts to the way goods are imported to and exported from the UK, Mr Carr says.
Yet as the clock counts down to December 31, anyone involved in the transport of goods between the UK and Europe will need to have a plan in place — and quickly.
The key thing to remember is that it doesn’t matter whether we get a deal or not. We are leaving the customs union, so your exports to or imports from Europe will be affected, both in terms of costs and delivery times. In 2021, your imports or exports with the EU will be treated in a very similar way to shipments imported from the US or exported to China
Peel Ports is backing the unaccompanied freight model to help avoid hold-ups.
Peel Ports/Twitter

50 | Lloyd’s List | October/November 2020ww
w.ll
oyds
list.c
om
ANALYSIS: ECONOMIC OUTLOOK
Coronavirus-related travel restrictions and a decline in household spending are the main factors behind a decrease in global seaborne trade this year, Niklas Bengtsson reports
Container and general cargo trade has been the most negatively impacted this year in percentage terms.
Weak oil demand and lower spending hit seaborne trade
Travelerpix/Shutterstock.comG lobal seaborne trade fell in the first half of 2020 — but the drop has not been as bad as many anticipated.
This has largely been due to China continuing — and at times even increasing — its imports of raw materials. The Asian country has also exported containers at a good pace.
Total seaborne trade globally is forecast to decrease by around 3% this year, compared with 2019, to 11.1bn tonnes.
All shipping sectors will record lower volumes, but trade is expected to recover strongly in 2021, with preliminary estimates of a 5% uplift on the current year to 11.7bn tonnes.
Most negatively affected this year in percentage terms will be the container and general cargo sectors, down by around 3.7%
and 3.8%, respectively. In tonnage terms, the liquid bulk market will see the biggest drop of 171.2m tonnes year on year due to the weak demand in the crude oil market.
Overall, the average growth in global seaborne trade in the 2020-2024 period is forecast at 2.4% annually, down from the growth of 3.7% seen yearly in the 2015-2019 period.
Lower economic activity in the world has decreased the demand for oil substantially and it is predicted it will not be back to 2019 levels until 2022.
Brent crude oil spot prices averaged $45 per barrel in August but were down to an average of $42 per barrel in late September. That is still $20 per barrel more than when the price crashed in April due to inventories all over the globe filling up.
There is still a lot of crude and products in storage and the US Energy Information Administration expects that the high inventory levels and surplus crude oil production capacity will limit upward pressure on oil prices in the near term.
EIA forecasts monthly Brent prices at $44 per barrel during the fourth quarter of 2020 and an average of $49 per barrel in 2021 as oil markets become more balanced.
It estimates that global consumption of petroleum and liquid fuels averaged 94.3m barrels per day in August 2020, down 8.2m bpd from August 2019.
It further estimates that global liquid fuels production averaged 91.5m bpd in August, down 9.7m bpd year on year.
The decline reflects the voluntary production cuts by the Opec-plus group of oil-producing nations, along with the reductions in drilling activity and production in the US due to the low oil prices. The EIA expects that global liquid fuels production will rise to 99.3m bpd in 2021.
Energy analyst Platts recently predicted US Gulf crude exports will drop by half over the next six months and bottom out at 1.4m bpd by April 2021, which decreases the tonne-mile demand for tankers.
Total seaborne trade by sector in tonnes
NOTE: *estimate **forecast Source: Lloyd’s List Intelligence

ww
w.lloydslist.com
ANALYSIS: ECONOMIC OUTLOOK
October/November 2020 | Lloyd’s List | 51
Before the Covid-19 pandemic, this forecast stood at 4m bpd for the same period. Asia-bound exports to countries including South Korea and China accounted for just over half of all volumes shipped from the US Gulf in the second quarter of the year.
In June 2020, exports were 2.8m bpd, 900,000 bpd below the peak of 3.7m bpd in February, according to the EIA.
Given decreased demand for refined products, refineries also have problems with their margins and cannot pay a higher price for the crude.
For other major commodities, the drop in value has not been as dramatic as has been seen with crude oil. The chart above shows major raw material prices on an average monthly basis from 2007, with forward projections from the IMF included.
In the great recession of 2008-2009, prices fell significantly, but from much higher levels. In 2020, the drop has not been so steep, but then prices were not as high before either.
Copper has seen the largest fall and coal prices are still depressed, but almost all
OECD forecast for GDP growth (%)
Source: OECD September economic outlook
Average monthly values for major raw material commodities
NOTE: forecasts for 2020 and beyond are IMF projections Source: Lloyd’s List Intelligence and IMF
In the forecast featured in the table (below left), sporadic outbreaks of the virus are assumed to occur in all economies and continue in the emerging-market economies that have not yet peaked.
Due to the large economic impacts from containment, the forecasts going forward are based on local mobility or activity restrictions, rather than economy-wide lockdowns.
The revisions made so far this year have seen the forecast for China moved up, as well as for the US and some European countries — although by not as much. China will be the only large economy that will see growth in 2020 and it will thus have an even bigger share of the total world economy.
India and the UK are the countries with the largest forecast drop in gross domestic product in 2020, with both these economies shrinking by more than 10%.
France is not far behind, with a decrease of 9.5%. Elsewhere in Europe, Italy, Greece, Spain and Portugal have all been hard hit by the Covid-19 pandemic.
The virus has been widespread domestically and much of the economy in these countries depend on tourism, which has suffered due to the extensive travel restrictions.
On a global level, this forecast means that by year-end 2021, total GDP will be the same as it was at year-end 2019.
Therefore, the ‘cost’ of the virus has been two years of world GDP growth.
However, this is spread unevenly across the planet and it is fair to say that poorer countries have lost the most.
This also means that the number of poor people in the world has increased for the first time in many years.
other commodities have shown a certain level of resilience to the current economic environment.
Global economic output in the second quarter of 2020 was more than 10% lower than at the end of 2019, representing a unique, sudden drop.
All economies experienced a sharp contraction in economic activity when containment measures were implemented. Output declined by more than 20% in some European economies and in India, which all implemented hard lockdowns.
This hit the economies that are largely dependent on tourism and other service sector activities requiring social interactions very hard.
In contrast, a rather swift recovery took place in China, with activity returning quickly to pre-pandemic levels by the end of the second quarter.
The countries that saw the largest cutbacks in private consumption also experienced the greatest declines in GDP in the second quarter of 2020, highlighting that the drop in output was due largely to weaker household spending.
Coal, Iron Ore, Logs Copper, Aluminium

52 | Lloyd’s List | October/November 2020ww
w.ll
oyds
list.c
om
ANALYSIS: SHIPBUILDING OUTLOOK
Container vessels and crude, LNG and chemical tankers in the current orderbook for 2020-2024 will be more energy efficient than vessels built in the past 10 years, with less installed power in kW terms, according to new data from Lloyd’s List Intelligence, Adam Sharpe reports
The flexibility to meet future decarbonisation requirements is at the forefront of shipowners’ minds when it comes to ordering new vessels.
Energy efficiency and reducing costs are key factors in orders
T raditionally, the average amount of installed power in a shipping fleet has increased over time, as ships have gradually increased in size
— but new figures from the Lloyd’s List Intelligence Shipbuilding Outlook show that for larger vessel types, that trend is set to reverse in the coming years.
This is largely a result of regulatory measures such as the Energy Efficiency Design Index for new ships, which is aimed at promoting the use of more energy-efficient equipment and engines, as well as new technology and the environmental concerns of shipowners and operators.
“When owners order a new ship today, the only thing they know for sure is that the environmental performance will be a topic for the remainder of the ship’s lifecycle,” explained Niklas Bengtsson, director of maritime insight at Lloyd’s List Intelligence.
“The ability to meet with EEDI regulations and the flexibility to meet with future decarbonisation requirements have the potential to reduce costs even beyond better fuel efficiency. Simply put, the ships are slightly more future-proof and, having lower installed power than the previous standard, could even reduce costs.”
There will be a significant drop in the average installed power for container vessels, with the current orderbook pointing to an average of 13,404 kW for new orders, compared with 28,173 kW as a fleet average and 31,985 kW in the past 10 years.
For crude tankers, Lloyd’s List Intelligence data shows that the fleet has an average of 18,909 kW of installed power at present and, for ships built since 2010, that figure has been raised to 19,737 kW. However, for crude tankers currently on the orderbook, the average installed power is reduced to 12,417 kW.

ww
w.lloydslist.com
ANALYSIS: SHIPBUILDING OUTLOOK
October/November 2020 | Lloyd’s List | 53
It is with the largest vessels on order where the biggest drops will be seen.
For crude tankers over 2,000 dwt, the average installed power on order is 16,077 kW, compared with a fleet average of 26,411 kW.
For LNG tankers, it is a similar story, with an average of 10,043 kW in installed power in the orderbook, which is around half the current fleet average of 19,395 kW and around one-third lower than the average of 14,105 kW for ships delivered in the past 10 years.
However, while newbuilding chemical tankers will have a lower average kW of installed power in comparison with the 2010-2020 period, the average of 3,962 kW on order is still above the fleet average of 3,642 kW.
Also, product tankers, LPG and ‘other’ tankers on order will also see greater levels of installed power than in the past 10 years and the fleet average, the Shipbuilding Outlook — which, in October, focuses on shipping equipment — shows.
Top brandsThe MAN engine brands hold a dominant position in terms of the total power delivered to the world fleet. This is due to the strong market share they have in the two-stroke, large engine part of the market.
Average installed power by vessel type (kW)
Source: Lloyd’s List Intelligence
The Lloyd’s List Intelligence Shipbuilding Outlook offers accurate forecasts and unique insight into each shipping market segment. For more information, go to: http://lloydslist.maritimeintelligence.informa.com/products-and-services/lloyds-list-intelligence/ shipbuilding-outlook
The current world fleet has a total installed main engine power of 569 gigawatts. Since 2010, the total delivered power amounted to 237 GW, according to Lloyd’s List Intelligence. MAN and Wärtsilä together provided 188 GW of the total deliveries.
For new ship deliveries from 2010 to date, MAN has 69% of the delivered power, Wärtsilä 10% and Caterpillar 4%.
It is with the largest vessels on order where the biggest drops will be seen.
Nightman1965/Shutterstock.com

54 | Lloyd’s List | October/November 2020ww
w.ll
oyds
list.c
omw
ww
.lloy
dslis
t.com
Following a 13-month high, capesize spot rates dropped sharply in mid-October, following the ban on Australian coal imports by China; research shows scrubber installations are looking increasingly like a losing bet for investors; while floating storage numbers continue to ease
Capesize index nosedives; ‘bad bet’ on scrubbers; falling floating storage
Following an uptick in spot rates in previous weeks, the capesize average weighted time charter quoted on the Baltic Exchange was in steep decline
come mid-October amid renewed trade tension between China and Australia.
The index surged to a 13-month high of $34,896 per day on October 6, helped by capesize and panamax bulkers being re-routed to Manila in order to facilitate crew changes, among other factors, but as of October 16, that figure had fallen to $19,952 per day.
The nosedive was expected, with reports of China unofficially placing import restrictions on Australian coal, leaving the dry bulk market concerned about the potential impact on freight rates for the larger bulkers that ply the route.
A Chinese state utility recently cancelled 12 cargoes of Australian coal that had been due for delivery in November and December, while a second broker said he had not seen any bids for Australian coal for weeks.
There had also been an issue with congestion at Chinese ports because of a heavy buying spree ahead of the annual Golden Week holiday.
While coal exports from Australia are unlikely to be materially impacted this year from China’s reported ban, volumes in 2021 could be hard hit, according to pricing agency S&P Platts.
It estimates that up to 32m tonnes of thermal coal could be displaced in the first quarter of next year alone.
‘Bad bet’ on scrubbersInvestments in scrubbers to lower fuel costs are now looking like a losing gamble by shipowners because of the steep drop in oil prices and the increased focus on decarbonisation in the industry.
Lloyd’s List markets editor Michelle Wiese Bockmann presented her analysis on scrubbers at the Connecticut Maritime Association conference in early October, finding that a collective investment of $6bn has already been made by the industry, based on a “very rough figure” of $2m each for installations on some 3,000 ships worldwide.
Baltic Capesize Index rates ($ per day)
Scrubber uptake by beneficial owner in number of vessels
Source: Lloyd’s List Intelligence
with Linton Nightingale
Source: Baltic Exchange

October/November 2020 | Lloyd’s List | 55
ww
w.lloydslist.com
ww
w.lloydslist.com
THE MONTH IN CHARTS
“In most cases, the cost is much higher, but this is around $6bn spent essentially on an exercise that was not to make shipping greener, but to lower fuel costs,” she told the virtual conference.
The idea of saving on fuel came from the belief of investors that the spread between the price of compliant low-sulphur fuel and non-compliant high-sulphur fuel would more than compensate for the cost of installing scrubbers — and fast.
However, this was based on the pre-pandemic assumption of a $200 price spread between cheaper high-sulphur fuel and more expensive very low-sulphur fuel oil or gasoil — a price spread that would guarantee the investment in scrubbers.
Yet factors such as the pandemic-led drop in oil demand and Saudi Arabia-Russia price war saw oil prices plummet, while the later Opec production cuts reduced the amount on medium sour crude on the market.
Investors in scrubbers “underestimated” how much compliant fuel would be available. Instead of putting effort into producing high-cost compliant fuel for an uncertain market, however, refiners and traders “were able to blend sufficient 0.5% sulphur fuels to meet demand”.
According to Lloyd’s List Intelligence data, the Angelicoussis Group has been the biggest investor in scrubbers in deadweight tonnage terms, followed by China Cosco Shipping and China Merchants.
Falling floating storage Crude and clean products held in floating storage have declined to the lowest level since early May.
Around 232m barrels on 172 tankers were tracked by October, according to data from Lloyd’s List Intelligence.
The figure is the lowest since shortly after Brent crude futures slipped to a 21-year low amid a steep contango that promoted traders to buy and store oil and refined products for future sale at a profit.
At the beginning of February, floating storage was tracked at 117.6m barrels.
Since peaking at just over 307m barrels on 254 tankers in early July, volumes held in floating storage have eased gradually but have remained higher than anticipated.
The month in charts is taken from Lloyd’s List’s regular column The week in charts, published online each and every Friday
Source: Lloyd’s List Intelligence
Scrubber uptake by beneficial owner in DWT
NOTE: Methodology incorporates ships from panamax-sized tankers and larger, at anchor for 20 days or more
Short-term floating storage for crude and clean products
Source: Lloyd’s List Intelligence

56 | Lloyd’s List | October/November 2020ww
w.ll
oyds
list.c
om
INSURANCE DAY
In these unprecedented times, it is incumbent on P&I clubs to do all they can to exercise discretion in favour of their members, Mark Cracknell, of Marsh JLT Specialty, reports
Amid the tragic human impact of Covid-19 and governments’ restrictions on travel and commerce, businesses are feeling the economic
consequences of the pandemic. Covid-19 has reshaped the marine
sector’s risk landscape, as well as raising questions about shipowners’ protection and indemnity (P&I) coverage and how this may be triggered.
The rules of the International Group clubs are very similar, so there should be little difference in the P&I coverage they provide; but Covid-19 has highlighted some discrepancies, particularly relating to quarantine.
Giving definitive answers on all aspects of cover is not possible, as many claims will be subject to club boards’ discretion. This will leave many shipowners in a difficult position, with one club possibly covering a risk that is rejected by another.
For this article, I have referenced the rules of the UK Club, although I strongly recommend checking with the specific club or clubs when considering any of the issues referenced below.
As an “infectious disease”, Covid-19 is most likely to trigger claims under the following aspects of P&I cover:• liability to persons other than seamen (including passengers);• illness and death of seamen; repatriation and substitute expenses;• loss of or damage to the effects of seamen and other persons on board;• diversion expenses;• quarantine expenses;• fines; • cargo-related claims.
There may also be claims that give rise to inquiry expenses, “expenses incidental to the operation of ships”, sue and labour costs
and expenses incurred “at the direction of” the club.
Some of these claims will, by their very nature, be entirely discretionary.
Liability to pay damages or compensation to persons other than seamen owing to Covid-19 seems most likely to arise in relation to passengers, although cover will also exist where a shipowner is deemed to have a liability to, say, shore workers (such as steve dores), state personnel and third-party surveyors attending the ship.
Passenger risk has received much media coverage and several clubs are handling significant claims.
Liability to passengers covers illness and death claims and also extends to damages and compensation to passengers on board (our emphasis) “as a consequence of a casualty to that ship”.
So how can a shipowner best cope in a sea of uncertainty surrounding the Covid-19 pandemic?
Covid-19 claims highlight cracks in P&I coverage
peterschreiber.media/Shutterstock.com

October/November 2020 | Lloyd’s List | 57
ww
w.lloydslist.com
INSURANCE DAY
A casualty is defined in the UK Club rules, inter alia, as “a threat to the life, health or safety of passengers in general”.
A Covid-19 outbreak clearly falls under that definition and would therefore, in our opinion, fall under club cover.
Cover can also include “the cost of forwarding passengers to destination or return to port of embarkation” and “maintenance of passengers ashore”.
Illness and deathLiability to seamen again has illness or death triggers and is likely to be defined under a contract of employment, although liability could additionally arise in tort.
Cover for seamen should also extend to repatriation and substitution expenses arising from a statutory obligation, to which Covid-19 could clearly give rise.
Claims for mental injury might also arise as a result of an outbreak of Covid-19 — especially after an extended period of quarantine (this applies equally to passengers, seamen and “others”).
Liability to pay compensation for the loss or damage to the “effects of seamen or others” could result from quarantine and disinfection — although these costs may equally be recoverable under the quarantine rule itself (see below).
Diversion expenses (like quarantine expenses) do not require a liability on the part of the shipowner to trigger cover.
These are covered where they represent the net loss to the member above what would otherwise have been incurred in respect of fuel, insurance, wages and so on, and where they are incurred “solely for the purpose of securing treatment for an injured or sick person”.
Some vessels (mainly passenger) appear to have been diverted for this purpose, but it could equally happen with cargo vessels.
How cover for quarantine expenses is triggered varies between the clubs, with the UK Club covering “additional expenses incurred… as a direct consequence of an outbreak of infectious disease… including quarantine and disinfection expenses”, without any requirement for a formal quarantine order.
Other clubs’ rules, however, require one.In practice, this should not be a problem,
as it seems unlikely a ship would be quarantined because of Covid-19 without the close attention of a government authority.
As mentioned above, the disposal of crew or passenger effects could potentially be a recoverable cost under the quarantine rule.
Shipowners could be subject to fines because of Covid-19 — for example, for breaches of the Maritime Labour Convention regulations on crew changes, or allegations of misdeclarations about the true health of all the crew/passengers on board.
Except in a limited number of specified circumstances, P&I cover for fines is discretionary, so careful examination of the rules and circumstances will be necessary in each case.
For most heads of claim, P&I cover requires the shipowner has a legal liability to pay a claim — quarantine being an exception.
All clubs will therefore expect shipowners to preserve all potential defences, both in relation to liability and quantum, and to keep accurate records of expenses incurred and their decision-making processes.
In respect of illness and death claims, the clubs have a wealth of experience from which to assess whether it is best to defend or settle a claim and, if settling, how much to pay.
It is therefore important always to follow their advice.
Cargo claimsCovid-19 is causing severe imbalances in world trade and shipowners (especially in the liner trades) are increasingly facing port congestion, requiring containerised cargoes
to be offloaded short of their ultimately intended port of delivery and stored, pending delivery at a later date.
Although this is a normal feature of the container trades, much longer delays than usual are anticipated, making it more difficult to assess what constitutes reasonable dispatch.
This may result in a technical deviation under the contract of carriage, the potential loss of Hague-Visby (or similar) defences and the risk of a breach of club cover.
With banks physically closed in more than one-third of the world, there is also the problem of bills of lading not being processed by the banking system, resulting in pressure on shipowners to release cargo without production of the bill of lading.
Any resultant claims will generally only be covered by the clubs at the discretion of their boards of directors.
Finally, while it is inevitable some of the extra expenditure falling on shipowners is simply the enhanced cost of operating vessels (albeit in these most unusual circumstances), a considerable amount of additional expense will be incurred to mitigate claims that would otherwise fall under P&I Club cover.
In these unprecedented times, we believe strongly it is incumbent on the P&I clubs to do all they can to exercise their discretion in favour of their members.
So how can a shipowner best cope in a sea of uncertainty?
The clubs have built a reputation for providing quick and clear advice and, in all the situations described above, they should be consulted as to the best course of action and involved as much as possible in the decision-making process.
This is especially true where potential claims may be at the board’s discretion.
Even if a club cannot say what will and what will not be covered, it can advise on the best reasonable course of action and highlight any actions that might risk prejudicing a claim.
The International Group has created a Covid-19 sub-committee to consider the issues that may arise. It is hoped this might ensure some uniformity of approach between clubs.
Mark Cracknell is head of P&I at Marsh JLT Specialty
This article first appeared in Insurance Day
Get uniquely comprehensive coverage of the specialist insurance industry.We provide the authoritative journalism and trusted data analysis you need to avoid market risks and spot the opportunities emerging for your business.
The clubs have built a reputation for providing quick and clear advice and, in all the situations described above, they should be consulted as to the best course of action and involved as much as possible in the decision-making process

58 | Lloyd’s List | October/November 2020ww
w.ll
oyds
list.c
omw
ww
.lloy
dslis
t.com
I-LAW
Sarah Barnes and Beth Bradley, at Hill Dickinson, highlight some of the key concerns and implications of managing crew through Covid-19
Crewing crisis needs attention to detail
Due to ongoing Covid-19 travel restrictions, seafarers are struggling to sign off from ships and are facing an unprecedented extended period
of time on board. It has been estimated that at least
200,000 seafarers worldwide require immediate repatriation and there have been reports that some ports have refused to allow ships to enter, which has not only prevented crew changes, but also obstructed ships from obtaining essential supplies.
This raises concerns in relation to seafarer fatigue and mental health issues and has led to the International Labour Organization asking member states to recognise seafarers as key workers to facilitate crew changes.
Pressure has also been brought to bear on governments to facilitate the ability of seafarers to travel to and from vessels, given the various quarantine and transport restrictions in place.
On July 9, 2020, 13 countries signed the Joint Statement of the International Maritime Virtual Summit on Crew Changes, in which governments pledged to facilitate crew changes and gave seafarers enhanced rights as key workers.
The relevant countries are: Denmark, France, Germany, Georgia, Greece, Indonesia, Netherlands, Norway, the Philippines, Saudi Arabia, Singapore, the United Arab Emirates, the UK and the US.
The International Maritime Organization is encouraging other member states to follow so that crew changes can be more easily facilitated.
This is also imperative, bearing in mind concerns about a second wave of Covid-19. The plight of seafarers in this regard is also impacted by and has implications for the network of contracts that underpin maritime trade, principally — but not uniquely — charterparties and bills of lading.
Owners’ obligations to seafarersShipowners have a duty to take reasonable care for the health, safety and welfare of their seafarers, even when faced with such an
unprecedented pandemic as Covid-19. This duty is derived from a number of sources:
The Maritime Labour Convention 2006 – minimum employment requirements:Under the Maritime Labour Convention 2006 (MLC), flag states must ensure all seafarers on ships flying their flag are covered by adequate measures to protect their health and that they have access to prompt and appropriate medical care while working on board. It is also imperative that shipowners provide mental health support to seafarers.
The MLC sets out minimum working and living rights for seafarers. It requires shipowners to provide assistance and support if a crew member suffers sickness during their employment, which begins when the crew member commences their duty and ends when they are repatriated.
The following costs should be covered:• the cost of medical treatment and any medication; • food and accommodation costs until the crew member has recovered or until the sickness has been declared permanent; • full wages while the crew member remains on board or until they are repatriated.
This includes any situation where a crew
member is isolated, on or off the ship, or where a crew member has left a ship but has not been able to secure transport home.
When the seafarer has been repatriated, they are entitled to wages as detailed in national laws or regulations or as provided for in collective bargaining agreements until they have recovered.
Additionally, the MLC provides for a default maximum period at sea of 11 months. Owing to Covid-19, many seafarers have been required to stay on board for durations beyond that period.
Consequently, the MLC guidance has been updated to provide that seafarers must be kept informed about the reasons why they are required to stay on board and a seafarer’s employment agreement (SEA) must remain in force until repatriation.
If any of the SEAs have expired, then they must be extended or new ones issued on the same terms and conditions, with the seafarer’s consent.
Ship safety management system and the IMO:In addition to the MLC requirements for minimum employment standards, a shipowner must also provide a safe environment to
Concerns have been raised in relation to seafarer fatigue and mental health issues.
Nieuwland Photography/Shhutterstock.com

October/November 2020 | Lloyd’s List | 59
ww
w.lloydslist.com
ww
w.lloydslist.com
I-LAW
Legal research can now be done in minutes; and without compromising qualityi-law is a vast online database of commercial law knowledge. It contains thousands of pages from many trusted legal sources. Sources that top lawyers and companies rely on daily.
work in, together with advice and support for safely joining and leaving a vessel.
Shipowners are also obligated to ensure they have a ship safety management system, which includes an obligation to have an outbreak management plan in place to deal with infections on board.
In terms of Covid-19, the outbreak management plan should include procedures recommended by the World Health Organization (WHO) and the IMO.
On May 5, 2020, the IMO published protocols for seafarers joining and leaving a ship safely, which cover the advice to be given to seafarers when travelling to and from a vessel, together with their time on board.
These protocols cover key issues, including the requirements for shipping companies to instruct seafarers to comply with standard infection protection and control precautions related to social distancing, self-isolation and hygiene.
In particular, prior to joining and leaving the ship, seafarers are to check their temperature twice daily and to advise shipowners if they show any Covid-19 symptoms.
There is also an obligation on the ship’s captain to notify the port health authority at the next port of call if there is a suspected Covid-19 case and they should be able to assist with medical assistance for an ill seafarer.
Shipowners must arrange for seafarers to be provided with personal protective equipment (PPE) to cover their period of travel to and from the ship.
The position under chartering contracts:The obligations that an owner has towards the crew have been outlined above. However, as more and more countries started to lock down their populations and close borders in response to the pandemic, the position of seafarers became acute.
Unsurprisingly, since Covid-19 is unique in terms of the breadth of its reach and the actions taken to combat it, charterparty terms are simply not well equipped to deal with some of the issues relating to the safety of seafarers and handling crew changes.
Most charterparties provide that the voyage to be performed must be done through the contractual route (voyage charters) and with upmost despatch (time charters), such that any deviation would be a breach of charterparty, capable of amounting to a repudiatory breach.
This gives rise to two potentially thorny issues. First — and probably more difficult
to surmount — is the situation where the crew needs to be changed but the only opportunity to do so is by deviation.
None of the standard form charterparties (time or voyage) permit a deviation in these circumstances.
Consequently, for an owner to discharge their obligations to seafarers and deviate to perform a crew change without being in breach of their obligations under the applicable charter or bill of lading contract, requires the agreement of the other parties in the chain and insurers. That is not necessarily an easy negotiation.
The second issue relates to whether an owner can deviate to land a seafarer who is unwell.
In that situation, owners are able, under most time and voyage charters and potentially under bills of lading incorporating the Hague/Hague-Visby Rules, to deviate for the purpose of saving life, which is a very limited right.
Where a crew change cannot be performed as envisaged, because the port is refusing entry due to quarantine restrictions, article 2 rule IV(h) of the Hague/Hague Visby Rules may relieve owners of liability for losses claimed by the bill of lading holder and possibly the charterer, if the charterparty expressly incorporates the rule.
These are limited grounds and bespoke clauses should be developed to ensure that, in the ongoing situation, crew changes can take place.
One clause has recently been proposed by BIMCO, the “Covid-19 Crew Change for Time Charter Parties 2020” clause, which expressly permits owners to deviate for crew changes where restrictions are in place at the port or place to which the vessel had been ordered.
The clause, where adopted, is to be expressly incorporated in sub-charters, waybills, bills of lading and other contracts of carriage. In terms of risk allocation, the default position is for the vessel to be on
hire but at a reduced rate and for costs in the deviations to be for owners’ account.
Mental health: When there are delays in seafarers being repatriated, it is important that support is provided for them to maintain good mental health and wellbeing. These are examples of some basic steps that can be implemented:• implementing or reinforcing access to employee support and providing the ability for seafarers to seek any counselling or other support they may need;• providing access to stay connected to family and friends;• encouraging seafarers to support each other and be sociable — for example, by encouraging exercise and arranging socially distanced activities;• providing access where possible to healthy food;• providing a positive workplace culture to encourage seafarers to talk openly and honestly about any feelings they have — particularly when they are struggling — and to enable them to feel safe in asking for help and support.
The best role models to take this position while at sea are the senior officers and captains, although there should be a general awareness among all crew.
The UK government, in conjunction with the Merchant Navy Welfare Board and Seafarers UK, has announced a programme to support seafarers in UK shores with mobile internet routers — MiFi units — on board ships where hundreds of seafarers are still waiting to return home. This will give seafarers free internet access on board.
The International Seafarers’ Welfare and Assistance Network (ISWAN) is a membership organisation that works to promote and support the welfare of seafarers all over the world.
A guide issued by ISWAN provides information on mental health, maintaining psychological help on board ships, and on managing stress and problems with sleep. This guide can be downloaded.
The seafarer helpline is also available both by telephone and by online live chat.
Sarah Barnes is legal director and Beth Bradley, partner, at Hill Dickinson
This article was first published in MRI, an Informa publication: www.maritime-risk-intl.com
Barnes, left, and Bradley: guidance offered for fair treatment of seafarers.
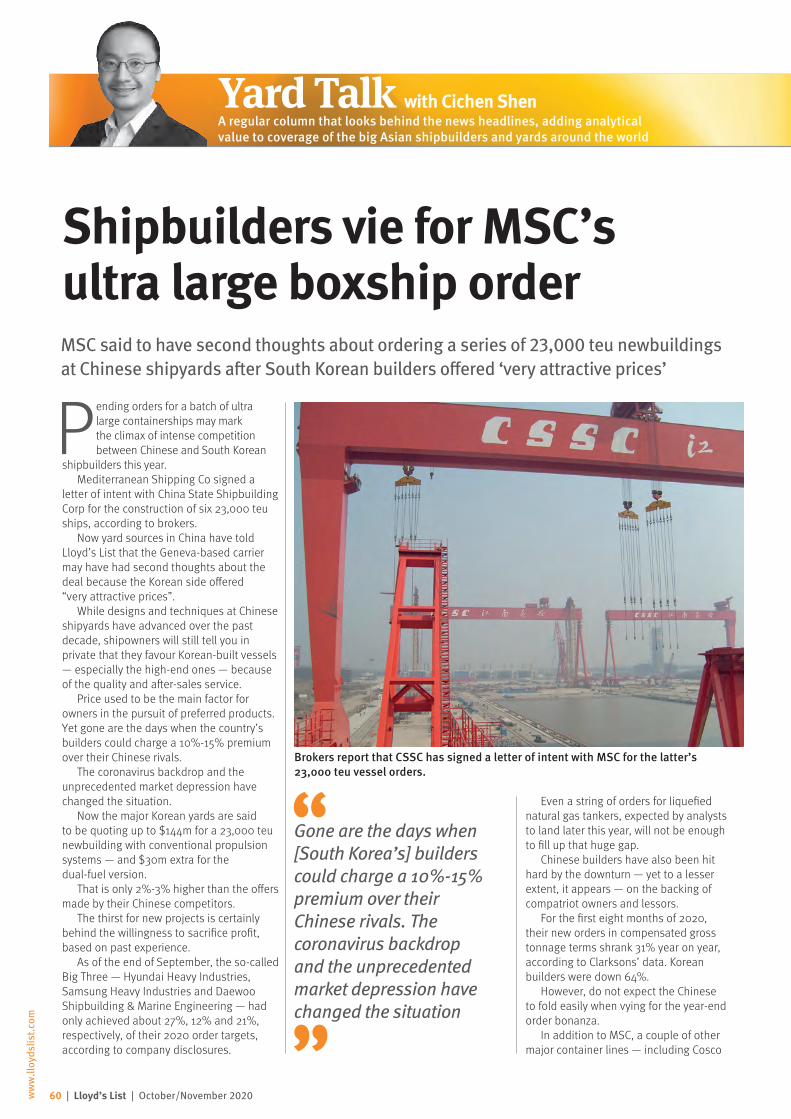
60 | Lloyd’s List | October/November 2020ww
w.ll
oyds
list.c
om
Shipbuilders vie for MSC’s ultra large boxship orderMSC said to have second thoughts about ordering a series of 23,000 teu newbuildings at Chinese shipyards after South Korean builders offered ‘very attractive prices’
Pending orders for a batch of ultra large containerships may mark the climax of intense competition between Chinese and South Korean
shipbuilders this year.Mediterranean Shipping Co signed a
letter of intent with China State Shipbuilding Corp for the construction of six 23,000 teu ships, according to brokers.
Now yard sources in China have told Lloyd’s List that the Geneva-based carrier may have had second thoughts about the deal because the Korean side offered “very attractive prices”.
While designs and techniques at Chinese shipyards have advanced over the past decade, shipowners will still tell you in private that they favour Korean-built vessels — especially the high-end ones — because of the quality and after-sales service.
Price used to be the main factor for owners in the pursuit of preferred products.Yet gone are the days when the country’s builders could charge a 10%-15% premium over their Chinese rivals.
The coronavirus backdrop and the unprecedented market depression have changed the situation.
Now the major Korean yards are said to be quoting up to $144m for a 23,000 teu newbuilding with conventional propulsion systems — and $30m extra for the dual-fuel version.
That is only 2%-3% higher than the offers made by their Chinese competitors.
The thirst for new projects is certainly behind the willingness to sacrifice profit, based on past experience.
As of the end of September, the so-called Big Three — Hyundai Heavy Industries, Samsung Heavy Industries and Daewoo Shipbuilding & Marine Engineering — had only achieved about 27%, 12% and 21%, respectively, of their 2020 order targets, according to company disclosures.
Even a string of orders for liquefied natural gas tankers, expected by analysts to land later this year, will not be enough to fill up that huge gap.
Chinese builders have also been hit hard by the downturn — yet to a lesser extent, it appears — on the backing of compatriot owners and lessors.
For the first eight months of 2020, their new orders in compensated gross tonnage terms shrank 31% year on year, according to Clarksons’ data. Korean builders were down 64%.
However, do not expect the Chinese to fold easily when vying for the year-end order bonanza.
In addition to MSC, a couple of other major container lines — including Cosco
Brokers report that CSSC has signed a letter of intent with MSC for the latter’s 23,000 teu vessel orders.
Yard Talk with Cichen ShenA regular column that looks behind the news headlines, adding analytical value to coverage of the big Asian shipbuilders and yards around the world
Gone are the days when [South Korea’s] builders could charge a 10%-15% premium over their Chinese rivals. The coronavirus backdrop and the unprecedented market depression have changed the situation

October/November 2020 | Lloyd’s List | 61
ww
w.lloydslist.com
YARD TALK
lloydslist.com/yardtalk
Shipping, Hapag-Lloyd, Evergreen and Ocean Network Express — are reportedly considering investment in fresh tonnage of 15,000 teu-23,000 teu, worth billions of dollars in total.
There is no chance for the Korean yards to win orders from Cosco, which is bound to support its compatriot builders. Yet the decisions of the other carriers seem to
remain up in the air. Taiwan’s Evergreen, for example, chose to bet on both sides when placing its super-sized ship orders last year.
Nevertheless, these newbuilding contracts will provide financing opportunities for Chinese leasing houses to profit.
Some lessors, backed by large Chinese-owned banks, have worked with
shipping lines, such as MSC, for many years on many deals. However, the choice of a shipyard’s nationality will probably put them in an awkward position.
The leasing lenders must support domestic yards to be politically correct. That said, it will be difficult for them to reject their client’s selection, as well as ships boasting a higher price-performance ratio.
The conversion of existing containerships to LNG propulsion is not yet commercially viable, according to the first company to have attempted the process, writes James Baker.
Work began in September on converting Hapag-Lloyd’s 15,000 teu Sajir at China’s Huarun Dadong yard, after being delayed by the coronavirus pandemic.
However, chief executive Rolf Habben Jansen has warned that the cost of converting the ship to LNG means the decision on whether to convert any of its other vessels is on hold.
“The conversion is not trivial,” he said in a briefing.
This was despite the vessel — one of 17 it acquired through its merger with United Arab Shipping Co — being designed to be LNG-ready.
“Even then, it is turning out to be a fairly costly exercise,” said Mr Habben Jansen.
“We’ll have to see if we convert more ships. In this case, we will be looking at around $35m in investment, which we will not earn back in the lifetime of this ship.”
The cost of conversion would need to come down closer to $25m to be commercially viable, he said.
“We need to find ways to bring those costs down, otherwise it will be economically very difficult to do more ships.
“It has been a good pilot, but we may not be able to proceed with any more. We’re still looking at ways to get those costs down.”
The company would, however, continue to look for ways to reduce its CO2 emissions.
“We need to step up our efforts to further reduce our environmental footprint,” said Mr Habben Jansen.
“We will start making a new plan for what we will do over the next three to five years. It is one thing to be climate neutral
in 30 years from today, but for us it is equally important that we make progress every year and that when we look back at 2020-2025, we can demonstrate that we made material progress.”
The company is already trialling the use of biofuel blends in its bunkers and would consider LNG as a power source in any newbuilding orders.
However, Mr Habben Jansen reiterated that no orders were imminent.
“We have said before that at some point, we will have to order some new ships, simply because the last order we put out was in 2015,” he said.
“We are constantly looking at that but you should not expect that an order from us is around the corner.”
Mr Habben Jansen said that beyond LNG, the future of zero-emission fuels remained clouded.
“I still think the overall picture on what future fuels will be is not yet fully clear.
Hydrogen will definitely play a role in the future, but I think there is going to be some sort of synthetic fuel that is gas-based.”
LNG boxship conversions not economically viable
Sajir is the first containership to undergo a conversion to liquefied natural gas.
Hapag-Lloyd
We need to find ways to bring those costs down, otherwise it will be economically very difficult to do more ships. It has been a good pilot, but we may not be able to proceed with any more
Rolf Habben Jansen Chief executive
Hapag-Lloyd

62 | Lloyd’s List | October/November 2020ww
w.ll
oyds
list.c
om
MA
RK
ETS
0
50
100
150
200
250
>200000120000-199999100000-11999980000-9999965000-7999935000-64999<35000
mill
ion
dwt
In service October 2020In service October 2019
>200000120000-199999
100000-119999
80000-99999
65000-79999
35000-64999
<35000
The global active fleet of bulkers totalled 12,156 vessels comprising 891.3m dwt in early October, according to Lloyd’s List Intelligence. In terms of carrying capacity, this represented a rise of 4.6% against last year.
Ships with a capacity greater than 20,000 dwt continue to be the main fleet driver of growth, climbing 11.7% on the year-ago level. This is in addition to a
9.1% jump in smaller dry bulk units in the post-panamax sector, or between 80,000 dwt and 99,999 dwt, on 2019 levels.
The dry bulk orderbook stood at 1,626 units at the start of October, with a combined capacity of 159.4m dwt. In 2020, 738 more ships are due for delivery, with an additional 667 vessels due next year, and a further 221 from 2022 onwards.
World active bulker fleet
DRY
BU
LK MARKETS: DRY BULK
Capesize and panamax dry bulkers have been stopping off in the Philippines in order to enable crew changes — a factor that has contributed to tonnage tightness, mainly in the Pacific Basin.
According to Lloyd’s List Intelligence data, Manila’s anchorage has been the most prolific stop for vessels plying the Australia-China-Australia route.
The data shows that from August to October this year, at the peak of the crewing crisis, 196 vessels stopped in the anchorage. That compares with just 62 in the same period a year earlier.
Examples include the 2020-built, 207,600 dwt Berge Dachstein, which called at Manila anchorage on September 20 from China and left on September 22 for Port Hedland in Australia; while the 2016-built 207,765 dwt Star Libra called on July 31 and left two days later, bound for China from its original calling point at Port Hedland.
Likewise, 10 vessels made a pit-stop in Manila from the Atlantic Basin en route to China — slightly higher than the same period last year, the data shows — while eight vessels called in at Indian ports on the
Large bulkers divert to Philippines for crew changesManila anchorage has been the most popular choice for crew changes, Lloyd’s List Intelligence data shows; but cases of crew testing positive for Covid-19 could thwart the activity, write Inderpreet Walia and Nidaa Bakhsh
Many capesizes have been stopping off in Manila to do crew changes.
same route versus none last year.The tightening of tonnage had been cited as a reason for the uptick in spot rates in early October, when the capesize average weighted time-charter quoted on the Baltic Exchange surged to a 13-month high of $34,896 per day.
Spot rates have since declined, dragged down by news of a potential ban on Australian coal by Chinese authorities.
WANT MORE DRY BULK INSIGHT?Go to: http://bit.ly/drybulkLL

October/November 2020 | Lloyd’s List | 63
ww
w.lloydslist.com
lloydslistintelligence.com
Lloyd’s List IntelligenceLloyd’s List IntelligenceMaritime intelligence |
Data from:
MARKETS: DRY BULK
Congestion at discharge ports is also playing a role at a time of higher volumes of iron ore from Brazil and Australia.
Crew changes have been critical for the safety of operations during the coronavirus pandemic, which has seen some 400,000 seafarers stranded at sea awaiting disembarkation.
A similar figure has been reported for those waiting to sign on.
Yet most ports have strict rules on crew changes — in some cases only allowing own-country nationals to sign on and off ships, with protocols to follow regarding quarantine and testing.
However, two incidents —namely from the Philippines — may put a damper on crew change activity.
On October 12, Japanese owner Mitsui OSK Lines reported an outbreak of coronavirus cases on its capesize Vega Dream, with seven of its 20 crew members testing positive while at Port Hedland, in the northern part of Western Australia.
The vessel had carried out a crew change in the Philippines before making its way to Australia.
Before that, Germany’s Oldendorff Carriers reported that 17 of its crew had been infected and quarantined at Port Hedland after they joined the bulker Patricia Oldendorff in Manila.
The incidents have prompted trade association InterManager to seek clarity on quarantine measures. It is calling for a 14-day quarantine period before testing to avoid potential future cases.
0
10
20
30
40
50
60
70
80
0
100
200
300
400
500
600
700
800
milli
on d
wt
Total dwt (left scale)Number (right scale)
>200000120000-199999
100000-119999
80000-99999
65000-79999
35000-64999
<35000 0
5
10
15
20
25
30
35
40
mill
ion
dwt
2020 2021 2022+
120000-199999>200000
100000-11999980000-9999965000-7999935000-64999<35000
Total bulker orderbook Dry bulk delivery schedule
Western Australia’s health minister Roger Cook called on the federal government to take action to make sure that the Philippines was adhering to crew change protocols.
The state’s Chamber of Minerals and Energy, along with major mining companies, were reported to be considering a ban on vessels with Filipino crew on board.
Braemar ACM noted how the Philippines emerged as “a convenient place” for capesizes to change crew, given how difficult it has been in many other countries.
The brokerage recorded more than 420 detours to the Philippines since the start of the year, and believes that “the majority of these did so to facilitate crew changes”.
In recent weeks, almost all visits have been on vessels ballasting towards load ports, it said in a note.
Braemar analyst Nick Ristic said it seemed unlikely that
any vessel that had made crew changes in Manila would be prevented from calling in Australia, given the sheer number of ships to have done so, with the total figure representing 84.5m dwt, or about 23% of the capesize trading fleet.
Ban would be costly“As such, banning the use of these ships would be costly for charterers in the region, as vessels freshly crewed with seafarers from other regions would be extremely scarce.”
The capesize paper market has thus priced in this sentiment, with a muted reaction, Braemar said.
October FFA contracts were trading at $26,000 per day as of October 13, with November at $20,000 per day, according to GFI, a Forward Freight Agreement broker.
Meanwhile, China was considering relaxing its restrictions on crew changes for foreign crew.
Braemar ACM noted how the Philippines emerged as ‘a convenient place’ for capesizes to change crew, given how difficult it has been in many other countries.It recorded more than 420 detours to the Philippines since the start of the year, and believes ‘the majority of these did so to facilitate crew changes’
Vessel tracking shows how the 2020-built, 207,600 dwt Berge Dachstein called at Manila anchorage on September 20 from China and left on September 22 for Port Hedland in Australia.

64 | Lloyd’s List | October/November 2020ww
w.ll
oyds
list.c
om
MA
RK
ETS
0
50
100
150
200
250
300
mill
ion
dwt
In service October 2020In service October 2019
>200000120000-199999
70000-119999
<70000
The active crude carrier fleet comprised of 2,461 ships, equivalent to 471.2m dwt, at the start of October, according to Lloyd’s List Intelligence. This represented an increase of 3.5% over last year.
Very large crude carriers, of 200,000 dwt and above, continue to lead the growth, with numbers up 4.7% on year to 281.1m dwt. Suezmax
tankers of between 120,000 dwt and 200,000 dwt are also driving fleet advances, up 2.3% on 2019 levels to 647 vessels, representing 100.6m dwt.
The global orderbook was composed of 533 ships with a carrying capacity of 98.4m dwt. A further 28.2m dwt is due for delivery in 2020, with 44.1m dwt due in 2021 and 26.1m dwt from 2022 onwards.
World dirty tanker fleet
CRU
DE
TA
NK
ERS
The resurgence of coronavirus is seen as lengthening any global recovery in crude and product tanker rates for at least seven months, as analysis points to contracting oil demand growth.
Saudi Arabia and Russia, the world’s biggest oil exporters, have said the recovery has slowed.
They outlined the current situation at a meeting of the Organisation of the Petroleum Exporting Countries.
The Opec group plus other key producers held a ministerial monitoring committee that was reviewing existing production cuts of 7.7m barrels per day, due to be eased in January.
Volatile markets Amid volatile markets, demand for tankers has fallen 14.5% this year, with global fleet utilisation at 80%, Cleaves Securities said in its quarterly outlook for the shipping sector.
The Norwegian investment bank is among the most cautious of shipping analysts on 2021, citing the size of the overhang of inventories of crude and refined products that has built since economies went into lockdown in March.
Based on figures from the
MARKETS: TANKERS
Tanker recovery on hold as pandemic worsensAmid volatile markets, demand for tankers has fallen 14.5% this year, with global fleet utilisation at 80%, writes Michelle Wiese Bockmann
WANT MORE TANKERS?Go to http://bit.ly/tankersandgas
Crude and product tanker rates will adjust as politicians in key global economies join forces to impose further lockdowns.
StockStudio Aerials/Shutterstock.com
US Energy Administration, the pace of inventories’ drawdown means “the oil tanker market will experience the negative effects of net destocking until mid-2021”, the outlook said.
Daily tanker rates for smaller suezmax, aframax and medium range tankers have hovered around rates equivalent to operating expenses since mid-September.

October/November 2020 | Lloyd’s List | 65
ww
w.lloydslist.com
mill
ion
dwt
Total dwt (left scale)Number (right scale)
0
10
20
30
40
50
60
0
50
100
150
200
>200000120000-199999
70000-119999
<70000
Total dirty tanker orderbook Dirty tanker delivery schedule
lloydslistintelligence.com
Lloyd’s List IntelligenceLloyd’s List IntelligenceMaritime intelligence |
Data from:
Very large crude carrier rates are also lower, defying the normal fourth-quarter boost in earnings that typically reflects additional crude needed to refine gasoil and kerosene, middle distillates used for heating
MARKETS: TANKERS
0
5
10
15
20
25
30
2020 2021 2022+
mill
ion
dwt
120000-19999970000-119999<70000
>200000
Supply constraints to boost product tanker prospectsProduct tanker owners remain optimistic about the post-pandemic prospects, saying that demand growth for their vessels is not anchored to faltering oil demand growth, writes Michelle Wiese Bockmann.
Ardmore Shipping Corp’s Anthony Gurnee joined four other upbeat executives to talk up the sector at a Capital Link forum.
Demand for product tankers would be growing by 3% a year through to 2030, “instead of 4% or 5%” before the global coronavirus pandemic hit the oil markets, Mr Gurnee said.
That compared with 0.5% growth for the crude market.
“Product tanker demand and growth is not the same as oil demand growth,” he said.
“Product tanker demand growth has been 4% or 5%, despite oil consumption growing at only 1.1%.
“Even with no growth in oil consumption, we can still enjoy ongoing product tanker demand.”
New export-driven refineries starting up in the
Middle East and China over the next four years were also cited as buoyant factors for product tankers.
“Even with a flat increase in consumption, we can have much more trade in refined products, possibly — and also over longer distances,” said Carlos di Mottola from d’Amico International Shipping.
Mikael Skov, from Olso-listed Hafnia, one of the largest product tanker shipowners, said
third-quarter demand growth for refined products “had gone substantially faster than expected” — especially compared with 2015 and 2016, the last period when floating storage was at high levels.
The positive sentiments were expanded on by Scorpio Tankers chief executive Robert Bugbee, who said these new refineries in the Middle East Gulf would export greater refined products “at the direct cost of crude shipments”.
Hafnia, Scorpio Tankers, Diamond S Shipping, Ardmore and d’Amico collectively own and operate around 400 product tankers.
Most reported second-quarter record profits on the back of elevated rates, thanks to floating storage and an oil price war, although the coronavirus downturn dented daily tanker rates and share prices have dipped.
All companies are convinced that tanker scrapping will increase in 2021 as elderly vessels are removed from trading. Scrapping in the tanker sector is currently at a 19-year low.
There is also a shortfall in newbuilding orders because of technical uncertainty over which future fuels to invest in, a factor that is said to limit supply.
Mr Skov said that ordering a ship with a dual-fuel engine added an additional $6m-$7m on the contract price of $33m for a medium range tanker.
“You’re buying into something which you probably can’t use for the next five years, because the infrastructure won’t be there to give you the alternative fuel,” he said.
“You’re basically adding on a capex without being able to harvest anything. Even if people had the money [to order ships], I think that in itself is also holding back the supply.”
The ratio of new product tankers on order compared to the existing trading fleet is the lowest since 1996, at 6.7%, according to figures from New York investment bank Jefferies.
Some 23% of the fleet was more than 15 years of age.
oil over the colder northern hemisphere winter.
“With the second wave of coronavirus bringing about a resurgence in restrictions in Europe, the recovery in underlying oil demand is by no means
assured and is likely to waver. We may see a return to more extreme oil market oversupply,” said the latest report by MSI, the research division of shipbrokers Howe Robinson Partners.
“We maintain our view of a
depressed market in the first quarter of 2021. Extending the outlook to the second quarter, we expect similar conditions, albeit with modest improvements in spot markets as oil production increases and refining recovers.”
Gurnee: remaining positive about the sector.

Make the connection. Integrated infrastructure and digital applications that keep you in the know and freight on the move.
portvancouver.com

ww
w.lloydslist.com
October/November 2020 | Lloyd’s List | 67
MARKETS: TANKERS
0
20
40
60
80
100
mill
ion
dwt In service October 2020
In service October 2019
80000-119999
60000-79999
30000-59999
<10000 10000-29999
>120000
0
5
10
15
20
25
>65000<5000
mill
ion
cu m
In service October 2020In service October 2019
50000-64999
25000-49999
5000-24999
0
10
20
30
40
50
60
70
80
>250000200000-249999
140000-199999
100000-139999
<100000m
illio
n c
u m
In service October 2020In service October 2019
0
5
10
15
20
25
>250000<1000000
30
60
90
120
150
mill
ion
cu m
Total cu m (left scale)Number (right scale)
140000-199999
110000-139999
200000-249999
0
3
6
9
12
15
>120000<10000 0
50
100
150
200
250
300
mill
ion
dwt
Total dwt (left scale)Number (right scale)
80000-119999
60000-79999
30000-59999
10000-29999
0
1
2
3
4
5
6
0
10
20
30
40
50
60
70
80
mill
ion
cu m
Total cu m (left scale)Number (right scale)
>6500050000-64999
25000-49999
5000-24999
<5000
World product tanker fleet
World LPG tanker fleet
World LNG tanker fleet
Total product tanker orderbook
Total LPG tanker orderbook
Total LNG tanker orderbook
LNG
TA
NK
ERS
LPG
TA
NK
ERS
PRO
DU
CT
TAN
KER
S
The global active fleet of liquefied natural gas carriers comprised 582 vessels totalling 88.7m cu m as of early October, a 5.3% increase on its year-ago total, according to Lloyd’s List Intelligence.
The LNG orderbook stood at 186 units, representing 25.3m cu m of carrying capacity. Of this, 3.5m cu m is scheduled for delivery in the rest of 2020; 9.9m cu m in 2021; and 11.9m cu m in 2022 and beyond.
For liquefied petroleum gas tankers, the active global fleet was composed of 1,579 ships, with a carrying capacity of 36.7m cu m, up 5.6% on year.
The LPG orderbook is still dominated by very large gas carriers. Of the 146 vessels on order, 68 VLGCs, or 23.5% of the fleet, are due for delivery.
The global fleet of product tankers comprised 8,846 vessels with a carrying capacity of 197.8m dwt, a rise of 2.2%.
The product tanker orderbook stood at 581 ships, comprising 29.8m dwt: 288 MR vessels, 63 LR1s and 42 LR2s.
Data from:
lloydslistintelligence.com
Lloyd’s List IntelligenceLloyd’s List IntelligenceMaritime intelligence |
The oil market will begin to recover in 2021 as coronavirus lockdowns ease and demand for transportation fuels increases. Weaker (crude tanker) rates in the short run might incentivise owners of older vessels to retire or scrap vessels in the coming months as breaker yards have begun to reopen
Jefferies has the most positive spin, citing supply pressures on the fleet, including the low ordering of new tankers and scrapping at a 19-year low. This was expected to pick up pace next year.
VLCC rates will remain under pressure over the fourth quarter and the seasonally weakest first quarter of next year, the New York investment bank said.
The quarterly report said unwinding floating storage, inventory destocking and pace of oil demand recovery was pivotal to rates rising.
“The oil market will begin to recover in 2021 as coronavirus lockdowns ease and demand for transportation fuels increases,” the report said.
“Weaker (crude tanker) rates in the short run might incentivise
owners of older vessels to retire or scrap vessels in the coming months as breaker yards have begun to reopen.”
Global supply of crude is forecast at 92m bpd over the fourth quarter, up from 91.3m bpd in the prior three-month period, according to the International Energy Agency’s October Oil Market Report.
Russia and Saudi Arabia will add an additional 300,000 bpd between them.
About half of crude produced is shipped to export destinations on the global trading fleet of some 8,500 crude tankers.
Refinery runs last quarter were stable but profits to produce products were the lowest in more than a decade in some countries.
Runs are forecast to rebound to levels last seen in 2015,
with large product stock draws anticipated this quarter.
Surging new infection statistics in the US and Europe mean demand growth in September will show the smallest gain since May, the IEA said.
Diesel and gasoline should be back at 98% of last year’s consumption by the end of 2020, whereas demand for jet fuel will remain one-third lower, it added.
Product tanker owners are touting additional refinery capacity being added in China and the Middle East Gulf as a positive for their vessels.
Any benefit can only be derived by increased tonne-mile demand. The IEA forecasts global refinery throughput to rebound by 4.9m bpd in 2011. That is two-thirds of the 7.2m bpd lost in 2020, and the lowest since 2015.

68 | Lloyd’s List | October/November 2020ww
w.ll
oyds
list.c
omM
AR
KET
S
mill
ion
teu
Total teu (left scale)
Number (right scale)
0
500
1000
1500
2000
2500
3000
0
2
4
6
8
10
18000+14000-17999
11000-13999
5000-10999
3000-4999
0-2999
The global boxship fleet edged up to more than 23m teu in September, according to Lloyd’s List Intelligence.
In the latest reported month, capacity on the water advanced by nearly 90,000 teu upon the delivery of the final deliveries of HMM’s dozen 23,000 teu units.
This was in addition to the first of CMA CGM’s
15,000 teu LNG-fuelled vessels.
The containership order dearth continued through September, with only two new vessels reported over the course of the month.
With carriers still cautious to commit to new orders amid pandemic uncertainty, the orderbook has fallen to around 10% of the existing fleet.
World active containership fleet
CON
TAIN
ERS
The twin uncertainties of future fuels and the state of the global economy are continuing to hold back fleet renewal plans and are likely to do so for some time.
Figures from Lloyd’s List Intelligence reported only two confirmed vessel orders during September, with a combined capacity of just 4,300 teu.
The global containership fleet edged up by 89,678 teu during the month, but this was driven by the final deliveries of HMM’s 12-ship order for 23,000 teu tonnage, plus the first of CMA CGM’s 15,000 teu LNG-fuelled vessels.
While orders made several years ago will continue to replenish the fleet, the question is now arising as to from where the next orders will emerge.
Carriers and non-operating owners alike appear to be holding back now — and with good reason.
The recently published Global Maritime Issues Monitor pointed to high levels of uncertainty in the shipping market.
The main concerns were over the global economic recovery from the coronavirus pandemic and what energy source will be used to replace fossil fuels.
These known unknowns are important considerations when
World boxship fleet update: Engines and economics put orders on holdContainer shipping is going through a boom period, despite ongoing concerns over the direction of the pandemic; yet instead of increasing fleet sizes, carriers are staying away from the yards, writes James Baker
MARKETS: CONTAINERS
WANT MORE CONTAINER INSIGHT?Go to: http://bit.ly/ boxship
planning to spend large sums on expensive and long-lived assets.
Who would spend billions now on ships that will still be in service approaching 2050 — particularly when demand is uncertain and the engines that power those ships rely on fuels that are becoming increasingly regulated?
“We are seeing some reluctance due to the energy transition, as no solution on the type of fuel or engine to use has been found yet to meet decarbonisation goals,” says Jefferies transport analyst David Kerstens. “It is limiting new vessel ordering.”
World Containership Fleet: September
Source: Lloyd’s List Intelligence
World containership fleet September 2020*
*Excluding newbuilding postponements and cancellations under negotiation
The collapse in newbuilding orders has seen the orderbook fall to around 10% of the existing fleet. This compares to the 60% level it was at during the global financial crisis of 2008-2009.
Yet will carriers, with their balance sheets buoyed up by strong freight rates, be tempted back to the yards in order to gain market share?
The slow, painful recovery of box shipping following the last crisis appears to be focusing minds this time around.
“We can never rule out any of the carriers placing newbuilding

October/November 2020 | Lloyd’s List | 69
ww
w.lloydslist.com
mill
ion
teu
Total teu (left scale)Number (right scale)
0
0.1
0.2
0.3
0.4
0.5
0.6
0.7
0.8
0
50
100
150
200
250
300
18000+14000-17999
11000-13999
5000-10999
3000-4999
0-2999
0
50000
100000
150000
200000
250000
300000
350000
40000018000+14000-17999
11000-139995000-109993000-49990-2999
2020 2021
teu
2022+
Containership orderbook Containership delivery schedule
lloydslistintelligence.com
Lloyd’s List IntelligenceLloyd’s List IntelligenceMaritime intelligence |
Data from:
orders, because they always do — but I think that they are taking a more cautious approach,” Mr Kerstens said.
“In the past, carriers have always focused on market share but they have been surprised this year by how the rates have held up from controlling capacity. This could be a new way of thinking.”
Hapag-Lloyd has been in discussions with yards, but has continued to say it is not in any hurry to order the six 23,000 teu ships it is considering.
Mediterranean Shipping Co is also rumoured to be interested in another series following the delivery of its Gülsün-class 24,000 teu ships; while Cosco subsidiary OOCL could place more orders.
Yet none of these — even if ordered immediately — would likely be delivered before 2023, so the orderbook will remain unchanged in percentage terms for the next year or two.
“If there is no further vessel ordering, we will see a shrinkage in capacity coming in 2023 and beyond,” Mr Kerstens says.
“Any new ordering of capacity is likely held back by uncertainties over energy transition for the industry to become carbon neutral by 2050. We are likely to see a tight containership market with a low idle rate and a record low orderbook while the economy recovers.”
The idle rate, which peaked at 12% of total fleet capacity in May, has since fallen sharply as carriers bring blanked sailings back into service.
“This has now fallen to less than 3% — so nearly 10% of the
MARKETS: CONTAINERS
If there is no further vessel ordering, we will see a shrinkage in capacity coming in 2023 and beyond. Any new ordering of capacity is likely held back by uncertainties over energy transition for the industry to become carbon neutral by 2050. We are likely to see a tight containership market with a low idle rate and a record low orderbook while the economy recovers
Boxship tonnage providers benefit from carrier bonanzaCarrier discipline on capacity management has benefited the lines and the vessel owners they charter from as charter rates surge
http://lloydslist.maritimeintelligence.informa.com/LL1134293
READ MORE ONLINEwww.lloydslist.com
global fleet was redeployed over the summer,” Mr Kerstens says.
Alphaliner says the capacity of idle tonnage had fallen to 500,000 teu as factories in China ramped up production ahead of the Golden Week holidays, which fall in the first week of October.
“With a rise in the number of extra loaders and resumed sailings on formerly suspended or thinned-out regular services in the past weeks, demand for ships of 6,000 teu or above has been particularly high,” the analyst said.
This was having a corresponding effect on charter vessel rates, as supply tightened across most vessel sizes.
The Howe Robinson Containership Index had seen a steady rise in rates, with figures in early October showing larger vessel sizes gaining the most.
Alphaliner recorded one 5,000 teu vessel achieving $20,000 per day for a transpacific voyage — a level not seen since 2011. While longer-term rates are lower, another vessel had been chartered for 12 months for $16,000 per day.
With demand for tonnage riding high, there is more incentive for owners to keep their vessels trading, limiting the number of containership going for demolition.
Lloyd’s List Intelligence reported only two vessels, comprising 2,000 teu, being sold for recycling in September.
According to Clarksons, recycling — which had picked up in the second quarter when demand was at its weakest — stood at 180,000 teu by the end of September, a year-on-year increase of 14%.

70 | Lloyd’s List | October/November 2020ww
w.ll
oyds
list.c
om
CONTAINERS: TRADE STATISTICS
Latest figures for August show container volumes climbing above last year for the first time in 2020 after the coronavirus-induced demand slump, Linton Nightingale reports
Monthly global container volumes climbed above last year’s level for the first time in August as carriers reaped the
rewards of an unlikely peak season on the trunk trades.
Container Trades Statistics’ data shows while volumes fell back slightly on July traffic — which was the busiest since the corresponding month of last year — figures of 14.8m teu in August represented a 1.5% increase on the 2019 monthly tally.
Figures in July were up for the third consecutive month following a decline in April attributed to the impact of the coronavirus outbreak, CTS said in its monthly commentary.
It said numbers for the month narrowly missed matching last year’s total.
Even so, the healthy traffic numbers raised expectations for a sustained volume rebound and hopes for a peak season that had seemed highly unlikely at one stage.
Transpacific trade increased 16% above last year in August, according to CTS figures.
Global container volumes jump on unlikely peak season
Container trade volumes (2017-2020)
Source: Container Trades Statistics
Port of Los Angeles

ww
w.lloydslist.com
CONTAINERS: TRADE STATISTICS
October/November 2020 | Lloyd’s List | 71
Container lines carried 2m teu from the Far East to North America, up 4% on July but 16% on year, according to CTS. This reflects too the record increasing throughput volumes reported at US west coast ports in August, including Los Angeles, Long Beach and Oakland
CMA CGM recently noted that it expects volumes in the second half of 2020 to come in above last year.
This optimism will be lifted further by August’s official numbers, buoyed most notably by positive sentiment and a surge in traffic on the transpacific trade.
Container lines carried 2m teu from the Far East to North America, up 4% on July but 16% on year, according to CTS. This also reflects the record increasing throughput volumes reported at US west coast ports in August, including Los Angeles, Long Beach and Oakland.
On the Far East to Europe trade, the latest official volume figures show that growth was much more moderate, rising 2% on July and 1.6% over last year at just under 1.5m teu.
“Year-to-date totals of 12.1m teu and 10.1m teu, respectively, on these two key trades [transpacific and Far East to Europe] are -2% and -10% down on last year; so, while there’s some catching up to do, it looks like there is a peak season to speak of this year,” it said.
Combined volumes on the two trade lanes made up nearly one-quarter of total traffic in August, according to CTS.
Box growth on the two routes helped the year-to-date total through the first eight months of 2020 rise to 107.7m teu. Although down 4.8% on 2019, the gains made in August continued to narrow the gap.
With reports of continued strong growth and, with it, high vessel utilisation through September, this gap is expected to close further upon the release of next month’s official box numbers.
The hope will be that volume growth is sustained through to the end of the year, and not solely a post-Covid-19 bump.
Offsetting the transpacific and Far East to Europe contribution to the total global figures, however, was a marked drop in North American exports.
CTS noted how exports from the region were down 14% on year to slightly below 1.2m teu in August.
“This is quite a change in fortune considering the year started with great promise,” it said, adding that the first quarter ended 3.3% ahead of last year, while the next three months was down 20.5% on last year.
The CTS Global Price Index held firm at 70 points in August.
However, the big mover was its index for the Far East to North America that month, climbing three points to 93 and up 11 points on last year.
This reflected the near-historical highs recorded on both Drewy’s World Container Index and the Shanghai Containerised
Container Trades Statistics Ltd (CTS) has been reporting teu volumes and price indices since 2008.
Appointed independent data service provider to World Liner Data Ltd (WLDL) in 2010, CTS now manages WLDL’s database of global teu liftings and pricing data contributed by WLDL members, which include the top global container carriers.
CTS reports on 49 regional trades, estimating — where necessary — non-WLDL member volumes to produce estimated total trade figures.
On some trades, including Far East-Europe, reports are based on 100% contributed data. For further information, visit: www.containerstatistics.com
The CTS Global Aggregated Price Index
Source: Container Trades Statistics
Freight Index, as unprecedented demand on the trade put the squeeze on capacity. “Such a level has not been seen on this trade since September 2015,” said CTS.
The Far East to Europe index also improved on its month-ago value in August — albeit marginally, by one point, to 58.
“Although consistently ahead of last year, this price index has been in decline throughout this year from a high of 67 in January,” it said.

Golden Week capacity increasesBefore we delve into that, though, we will look at the capacity developments for Golden Week, the Chinese national holiday running from October 1-7, which typically marks the end of the peak cargo season.
This year, however, carriers continued to ramp up capacity during Golden Week.
While one of the reasons is inevitably demand-related, another is the supposed intervention from the Chinese authorities to curb the continued increase in transpacific spot rates.
The purpose of this intervention was to encourage carriers to cancel their general rate increases (GRIs) and reinstate previously announced Golden Week blank sailings on the transpacific.
While carriers did, in fact, reinstate a significant portion of their announced blank sailings, we cannot tell if it is due to stronger demand or due to the pressure from the Chinese authorities.
What we can do, however, is put a number to the capacity increase.
Figures 1 and 2 show the combined transpacific and Asia-Europe offered capacity in week 40, which is Golden
72 | Lloyd’s List | October/November 2020ww
w.ll
oyds
list.c
om
CONTAINERS: BETWEEN THE LINES
xxxxxx/Shutterstock.com
Carriers serving the transpacific trade have pulled the plug on planned blanked sailings amid a demand surge and encouragement from China, as they in turn look to curb rate increases. With capacity reductions down, questions remain how long volumes will stay resilient against the backdrop of a pandemic-induced recession, writes Sea-Intelligence chief executive Alan Murphy
Transpacific carriers have reinstated blank sailings and continued the roll-out of extra-loaders post-Golden Week.
Carriers ramp up transpacific capacity despite Golden Week
T he container shipping industry continues to defy the global macroeconomic fundamentals, as evidenced by the latest
Container Trade Statistics’ measurements of global demand.
For the first time this year, global demand recorded year-on-year monthly growth in August of 1.5%. This translates roughly into a growth of 212,000 teu.
That said, this improvement is very lopsided across different geographies, with Europe imports contracting by a marginal -0.1% in August against last year, while North America import growth continued to accelerate, rising 12.4%.
This strong volume growth on the transpacific is set against a background of a pandemic-induced recession — and even though recent data suggests this is not as severe as initially anticipated, it is still a recession.
This begs the question: why, despite all macroeconomic fundamentals saying otherwise, is demand on the transpacific growing at such a strong pace? Is this growth sustainable, or is short-term? And, if it is short-term, what is the timeframe?

October/November 2020 | Lloyd’s List | 73
Week (GW), and the three following weeks (GW+1 to GW+3).
There are two metrics for 2020: ‘2020 Old’, which is based on announcements from week 37, i.e. before these blank sailing reinstatements were made; and ‘2020 New’, which is based on announcements made in week 40, i.e. after these blank sailing reinstatements were announced. This is to give an idea of how much capacity was reinjected into the trades.
On the transpacific, offered capacity during Golden Week 2020 is considerably higher than in the first three weeks of this period in previous years, whereas the week 43 (GW+3) offered capacity is in line with recent years.
There is also a significant capacity injection announced between week 37 and 40, especially for the first two weeks of the Golden Week period.
On Asia-Europe, the capacity injection announced between week 37 and 40 is not as high as on the transpacific, but offered capacity for the first two weeks (GW and GW+1) is considerably higher than in previous years.
Figures 3 and 4 show the percentage of capacity reduced for both trades in the
ww
w.lloydslist.com
CONTAINERS: BETWEEN THE LINES
four-week Golden Week period for 2014-2020, with the same metrics for 2020.
On the transpacific, carriers were initially slated to reduce 9.2% of the total four-week capacity; however, according to the latest schedules, capacity reductions will be a lot lower, at just 3.6%. This is the lowest in the analysed period — and considerably lower than the 2014-2019 average of 8.9%.
On Asia-Europe, although the latest capacity reduction levels are lower than previously announced (now 19.2% instead of 22.3%), they are still the highest in the analysed period. This is likely driven by the fact that carriers have opted for outright service cancellations on Asia-Europe, rather than blank sailings.
The reinstatements of blank sailings and the continuation of extra-loaders are, according to the carriers, a result of strong demand; but how strong is the demand?
In the following, we will look at transpacific demand and US consumption patterns to get a better understanding of the primary drivers behind this strong demand.
As previously mentioned, the August demand data released by CTS shows that
North America imports are growing at an accelerated pace.
What CTS does not show, however, is a demand split for the two North America coasts. To get an idea of how import growth stacks up for the two regions, figure 5 (on page 74) shows the year-on-year changes in the August laden import volumes for the major US ports for 2013-2020.
It is interesting to note that the volume development is drastically different across the west and the east coast.
The US west coast ports saw laden imports grow by 12.1% year on year in 2020, which is nearly the highest growth for August in the analysed period.
On the other hand, the US east coast ports saw a -0.4% contraction in volumes, which is the first time that laden August imports have contracted in this period.
This is slightly surprising, considering that the Asia-North America east coast trade lane saw capacity increase by 7.7% year on year in the third quarter of 2020.
The data underlying this section of the analysis is from the US Bureau of Economic Analysis (BEA), using the data published on October 1 and covering August.
Figure 1: Transpacific offered capacity
Source: Sea-Intelligence
Figure 2: Asia-Europe offered capacity
Source: Sea-Intelligence
Figure 3: Transpacific % of blanked capacity
Source: Sea-Intelligence
Figure 4: Asia-Europe % of blanked capacity
Source: Sea-Intelligence

CONTAINERS: BETWEEN THE LINES
ww
w.ll
oyds
list.c
om
74 | Lloyd’s List | October/November 2020
For the past 60 years, US consumption has seen a continually increasing shift from goods to services. This does not mean that the consumption of goods has failed to grow over the past 60 years; it just means that the consumption of services has grown at a slightly higher pace than the consumption of goods.
Figure 6 shows the year-on-year growth for consumption of goods and services during 2020. The impact of the pandemic in early 2020 is clearly seen, as consumption in goods contracted by -13% and services contracted by -17% at peak impact in April. However, the two then deviate sharply from each other.
Goods stage a rebound and have been growing by 5%-6% for three consecutive months, whereas consumption of services continues to contract on annual basis. The question then becomes: how much of an anomaly is this shift really?
In order to quantify the shift, we have calculated how much the ratio of the
share accounted for by goods in the total consumption has changed over a three-month period.
The result of this is shown in figure 7.As we can see, the change in the ratio is
significantly larger than any other shift seen in the past 60 years. The closest comparison would be to the impact of the 2008 financial crisis, where the ratio for goods dropped quite sharply — but this was still not as sharp a change as we have seen in 2020.
When these developments are placed into context, it becomes quite clear that the driver underlying the boom on the transpacific is a shift in consumption from services to physical goods, with especially strong drivers being housing and garden projects, as well as electronic equipment related to home offices, plus toys and games, as well as recreational vehicles.
While the overall consumption is in decline due to the recession, this is for now counteracted by people shifting consumption from services into physical goods. Once given the opportunity, it appears highly likely spending will revert back to services, when bars, restaurants, travel, events, etc. reopen for business.
If we do see a shift back to services once the pandemic abates, the current boom on the transpacific will be counteracted by a volume reversal. The key question then becomes: how fast would such a reversal take place?
The timing is more difficult to ascertain — but given that US importers appear to favour the faster west coast routing over the east coast, evidenced by the difference in laden import growth between the two seaboards, this does give an indication that the current strength could have a relatively short lifespan.
Alan Murphy is chief executive of consultancy firm Sea-Intelligence
Figure 5: Annual change in US laden imports (August)
Source: Sea-Intelligence
Figure 6: Consumer spending year-on-year growth
Source: Sea-Intelligence
Figure 7: Percentage change in goods’ share of consumption on prior three months (1959-2020)
Source: Sea-Intelligence
While the overall consumption is in decline due to the recession, this is for now counteracted by people shifting consumption from services into physical goods. Once given the opportunity, it appears highly likely that the spending will revert back to services

October/November 2020 | Lloyd’s List | 75
ww
w.lloydslist.com
CONTAINERS: BETWEEN THE LINES
Schedule reliability in August 2020Even during the peak of the pandemic, schedule reliability was not negatively impacted, leading us to the conclusion that carriers were finding it easier to manage fewer vessels per service string.
We also noted that an increase in capacity in the third quarter might signal a decline in schedule reliability — a glimpse of which we saw in July.
With carriers ramping up capacity significantly in the third quarter and reinstating previously blanked sailings, global schedule reliability in August plummeted to 63.7%, dropping by 11.6 percentage points month on month. This is the lowest recorded overall figure in the analysed period.
On a year-on-year level, the August 2020 figure was 15 percentage points lower. That said, the global average delay for ‘late’ vessel arrivals continued to improve, decreasing by 0.08 days month on month in August 2020 to 4.44 days, although still the highest figure for this month. The August 2020 delays were 0.24 days higher against last year.
Hamburg Süd was the most reliable top-15 carrier in August 2020, with schedule reliability of 76.5%, followed
by Maersk Line with 70.1%. The next eight carriers recorded global schedule reliability between 60% and 70%, with five carriers recording schedule reliability of lower than 60%, of which PIL recorded the lowest August 2020 schedule reliability of 47.7%.
None of the top-15 deepsea carriers recorded a month-on-month improvement in schedule reliability in August 2020, with Hamburg Süd recording the lowest decline of a considerably high nine percentage points.
The remaining carriers all recorded double-digit month-on-month declines in schedule reliability.
None of the top-15 carriers recorded annual improvements in schedule reliability either, with all carriers recording double-digit declines. Hamburg Süd recorded the smallest year-on-year decline of 11.5 percentage points.
In line with the schedule reliability trend we have seen so far this year, the industry schedule reliability on the east-west trades also declined month on month, by 8.8 percentage points to 73.5%.
All three carrier alliances also recorded a monthly decline in schedule
reliability, with 2M the most reliable carrier alliance in July/August 2020 with schedule reliability of 75.2%, followed by Ocean Alliance with 74.6%.
The Alliance was the least reliable carrier alliance, with 65.9%, but the gap between The Alliance and Ocean Alliance — which was the smallest in May/June 2020 — widened to ‘normal’ levels once more.
In July/August 2020, schedule reliability declined year on year on all six main east-west trade lanes. Asia-North America east coast recorded a decline of -18.2 percentage points in schedule reliability against last year, whereas Asia-North America west coast recorded a considerably smaller decline of -4.2 percentage points.
Both Asia-Europe trades recorded double-digit year-on-year declines, with Asia-Northern Europe declining by -11.1 percentage points and Asia-Mediterranean declining by -12.6 percentage points, respectively.
Transatlantic eastbound recorded a -1.6 percentage point decline, while transatlantic westbound recorded a decline of -5.5 percentage points.
Figure 8: Global schedule reliability Figure 9: Global top 15 carrier ranking (August 2020)
Source: Sea-Intelligence Source: Sea-Intelligence
Figure 10: Alliance schedule reliability (2019-20)
Source: Sea-Intelligence
Figure 11: Trade lane schedule reliability change
Source: Sea-Intelligence

76 | Lloyd’s List | October/November 2020ww
w.ll
oyds
list.c
om
CONTAINERS: CHANGING LANESNuno21/Shutterstock.com
The dynamics of global containerised trade will be jolted by events including Brexit, the WTO leadership run-in and the US presidential elections, Antonella Teodoro reports
T he Covid-19 pandemic is undeniably the single most important event to have affected global containerised trade this year, making 2020
the most challenging for international business in many years.
Without the health crisis, other major events would have registered bigger headlines around the globe, be it Brexit; the decision on the aircraft dispute by the World Trade Organisation; WTO leadership; the US presidential elections; or progress on how to harmonise global tax legislation for digital corporations.
Regardless of whether the UK and the rest of the European trading partners will reach an agreement on their future trading relationship by the end of this year, trade barriers of some kind will be introduced from January 2021.
November’s US presidential elections could have major implications for global trade.
Changing lanes: Trade faces challenges beyond pandemic
The UK has the right to choose not to apply tariffs on goods imported from the EU, in which case this would also mean no tariffs on goods imported from every WTO member.
In October last year, the WTO ruled that the US could target $7.5bn of imports from the EU over illegal subsidies to Airbus.
The EU has asked the WTO to be authorised to impose tariffs on $11.2bn of products from the US for their illegal subsidies to Boeing Co.
At the end of September, Reuters reported that the WTO had authorised the EU to impose tariffs on US goods worth $4bn to retaliate against subsidies to Boeing Co BA.N.
Settlement of the 15-year dispute would bring an enormous relief to European exporters currently under threat of US ‘tit-for-tat’ tariffs.
The settlement would also be welcomed by the industries at the receiving end of the WTO-authorised tariffs.
Another reason for the world to keep its eyes on the WTO will be the race for its leadership, expected to be highly competitive on both an individual and national level.
The organisation, currently operating without a chief following Roberto Azevedo’s resignation in August, is under enormous pressure to reform, which is crucial to its survival.
Figure 1: Global deployed capacity on deepsea routes (Index Q1 2017=100)
Source: MDS Transmodal, Containership Databank August 2020
Should negotiations on a tariff-free and quota-free agreement fail, trade between the two parties will fall under the rules set by the WTO, with each party entitled to set tariffs — or taxes — on imports from either party.
So, cars from the UK to the European Union could be charged at 10% of their value, with some agricultural goods being exposed to much higher tariffs (for instance, the tariffs on dairy products could average more than 35% of their value).

ww
w.lloydslist.com
CONTAINERS: CHANGING LANES
October/November 2020 | Lloyd’s List | 77
Should reform proposals fail to address member state requirements, one or more major economies could decide to leave the WTO
likely lead to an increase in US tariffs on foreign trade.
Based on the data available at the beginning of October, MDS Transmodal observes that, after a contraction of circa 3% in the capacity offered on the deepsea market in the first half of 2020 (compared with the same period of 2019), in the third quarter, carriers have increased their offer, with deployed capacity now marginally higher than the capacity offered this time last year (see Figure 1 on page 76).
Looking at ships on order, lines are showing a willingness to put more capacity into the container shipping market.
We estimate an increase of more than 6% in the total fleet capacity in teu terms by the end of 2021 and a further increase of circa 2% in 2022. Unsurprisingly, we expect the percentage of ships of 15,000 teu or more to increase the most (21.8% by 2021).
Antonella Teodoro is a senior analyst at MDS Transmodal
Table 3: US total imports/exports by world regions, tonnes* (2016 vs 2019)
Source: MDS Transmodal, Containership Databank August 2020
In the past few years, various proposals have been put forward to the WTO, including stronger punitive measures against repetitive or intentional non-compliance by member states, and updates to the rules on self-classification for developing countries.
Should reform proposals fail to address member state requirements, one or more major economies could decide to leave the WTO, as President Donald Trump has already threatened.
Another event with the potential to affect global trade and exacerbate the impact of the pandemic on the global economy is the foreign taxation on US technology corporations such as Facebook and Google.
Countries around the world, mainly European, are aiming to reach a consensus on new tax rules for international digital firms that generate vast revenues in their territories.
By contrast, Mr Trump and his administration consider this move as discrimination against US companies and has threatened retaliatory tariffs.
Discussions on finding a solution were
under way. However, the US withdrew from talks in June, reducing the likelihood of an early resolution.
The size of the impact of any or all of the above events on global trade will also be influenced by the outcome of the US Presidential election in November.
Should Mr Trump win a second term, there is the potential for an escalation in the geopolitical fight between the US and China for global leadership, which will
Table 4: Fleet capacity
Source: MDS Transmodal, Containership Databank August 2020
Table 1: UK to/from EU/Non-EU by top 10 SITC2D*, ’000 tonnes, 2019** (ranked by UK-EU flow)
Source: MDS Transmodal, Containership Databank August 2020
Table 2: US to/from EU/Non-EU by top 10 SITC2D*, ’000 tonnes, 2019** (ranked by US-EU flow)
* SITC2D (Standard International Trade Classification at a two-digit level)** Excludes energy goods
Source: MDS Transmodal, Containership Databank August 2020
* SITC2D (Standard International Trade Classification at a two-digit level)** Excludes energy goods
*Excludes energy goods

78 | Lloyd’s List | October/November 2020
EditorLinton Nightingale
Lloyd’s List Managing EditorRichard Meade
ContributorsAnastassios Adamopoulos, James Baker, Nidaa Bakhsh, Declan Bush, Richard Clayton, Nigel Lowry, David Osler, Adam Sharpe, Cichen Shen, Hwee Hwee Tan, Inderpreet Walia, Eric Watkins, Vincent Wee, Michelle Wiese Bockmann, Fred Williams
Sales Director, Marketing ServicesNatasha Dwyer: [email protected]
To advertise please email:[email protected]
Asia PacificArundhati Saha
AmericasStacey Teicher
EMEA Janet Wood (Greece and Cyprus), Deborah Fish, Luke Perry, Adrian Skidmore
Classified Maxwell Harvey
Advertising Production Manager Mark Leech
Production EditorFelicity Monckton
CoverKapusniak Design
PrintingParagon Customer Communications
EditorialLloyd’s List, 240 Blackfriars Road, London SE1 8BFTel: +44 (0)20 7017 5000Email: [email protected] by Informa UK Ltd.© Informa UK Ltd 2020. No part of this publication may be reproduced, stored in a retrieval system, or transmitted in any form or by any means electronic, mechanical, photographic, recorded or otherwise without the written permission of the publisher of Lloyd’s List.Lloyd’s List is available online in every country in the world by placing a subscription with the publishers in London, Informa UK Ltd. Please place your order with the Lloyd’s List marketing team at Informa. This special supplement is issued free to subscribers. For further information please email: subscription.enquiry@ lloydslist.com or telephone: +44 (0)20 3377 3792Lloyd’s is the registered trademark of the society incorporated by the Lloyd’s Act 1871 by the name of Lloyd’s.
ww
w.ll
oyds
list.c
om
Springboard for change The ICS leadership webinar identified progress made during the pandemic as a platform for change. In spite of short- and medium-term threats, the industry should see its response as positive
Shipping has proved its resilience during the past six months. No-one could see the impact of the coronavirus pandemic, so no-one had made an emergency plan.
However, far from buckling under the strain, resources have been redeployed, homeworking has become widespread and digital solutions have been hurried into service.
The speed at which shipping has responded has been impressive, according to a recent International Chamber of Shipping leadership webinar. Although the crew change crisis has dampened the celebrations, there is still much to applaud.
“Shipping is now talking with many stakeholders we didn’t talk to before,” said Torunn Biller White, chief risk officer at Gard, the Norwegian P&I club.
The industry has developed contingency plans and become much more agile in its thinking, she stated. There is greater willingness to invest in digital technology, new learning opportunities are being explored, and improved levels of communication created.
More broadly, shipping has been forced to embrace collaboration as a way to tackle external threats, such as the current pandemic.
Covid-19 has reinforced underlying consumer patterns, argued Lars Karlsson, a former director of the World Customs Organization.
This has been achieved by a rapid transition from ‘just-in-time’ to ‘just-in-case’; by a focus on transparency and predictability; and by an accelerated uptake of digitalisation.
However, he warned that protectionist activity has become more intense over the past three years than for decades.
Jan Hoffmann, chief of the Trade Logistics Branch at the United Nations Conference on Trade and Development, suggested technological progress has increased in speed “and will get even faster”.
This prompted Jeremy Nixon, chief executive of Ocean Network Express, to wonder whether shipping would have been capable of responding quite so well a decade ago.
This discussion revealed that the post-pandemic norms for shipping are becoming clearer. The health crisis has undoubtedly pushed the search for digital solutions, and there is an acceptance that sustainability and decarbonisation of the industry will never be achieved company by company. Collaboration is key, transparency is the pathway and cyber-secure digitalisation is the driver.
The elephant in the virtual room is no longer what should be done, but when it should be done.
Latching on to the comment by ICS chairman Esben Poulsson that “this industry is not for the faint-hearted”, observers might have wondered whether decarbonisation goals stretching out to 2050 are valid any longer.
If shipping can respond to an immediate threat like coronavirus as well as it has, a timeline for clean emissions 30 years distant looks outdated.
This insightful webinar separated the immediate threats (crew change crisis, supply chain resilience, trade conflicts) from the longer-term dangers (increasing protectionism, decarbonisation and regional fuel levies).
It asked whether shipping should take courage from its response to the pandemic to be more ambitious with its decarbonisation goals.
Shipping exists in a global knowledge economy. The industry must lock in the progress it has made during the pandemic and use it as a springboard for change.
If maritime leaders achieve this, the International Maritime Organization’s goals can be achieved with time to spare. However, if progress is allowed to slip back, even 2050 will be a tall order.
If shipping can respond to an immediate threat like coronavirus, a timeline for clean emissions 30 years distant looks outdated.
WhiteHaven/Shutterstock.com
with Richard Clayton


Specialist in repair and conversion
Keppel Shipyard is the trusted partner for the repair and upgrading of a diverse range of vessels. We are the market leader in FPSO, FSO, FSRU and FLNG conversions as well as turret, mooring systems and topside modules fabrication.
Keppel Shipyard Limited (A member of Keppel Offshore & Marine Limited)
51 Pioneer Sector 1 Singapore 628437 Tel: (65) 68614141 Fax: (65) 68617767 Email: [email protected] www.keppelom.com