Ethanol induces locomotor activating effects in preweanling Sprague-Dawley rats

1
Fluorogen activating proteins: Technology for imaging and assaying cell surface proteins.
Methods and Supplementary Figures
Christopher Szent-Gyorgyi1*, Brigitte A Schmidt1, Yehuda Creeger1, Gregory W Fisher1, Kelly L Zakel1, Sally Adler2, James AJ Fitzpatrick1, Carol A Woolford2, Qi Yan2, Kalin V Vasilev2, Peter B Berget2, Marcel P Bruchez1,3, Jonathan W Jarvik2, Alan Waggoner1**
1Molecular Biosensor and Imaging Center, Carnegie Mellon University, Pittsburgh, PA 15213, 2Department of Biological Sciences, Carnegie Mellon University, Pittsburgh, PA 15213, 3Department of Chemistry, Carnegie Mellon University, Pittsburgh, PA 15213
*MBIC/Mellon Institute, 4400 Fifth Avenue, Pittsburgh, PA 15213.
E-mail: [email protected], Telephone: 412-268-4773, Fax: 412-268-6571.
**MBIC/Mellon Institute, 4400 Fifth Avenue, Pittsburgh, PA 15213. E-mail: [email protected], Telephone: 412-268-3456, Fax: 412-268-6571.

2
FAP nomenclature. FAP names consist of three components: i) the scFv chain configuration, with H designating the heavy variable (VH) region and L designating the light variable (VL) region; ii) a unique numerical identifier designating the parent isolate and its maturant lineage in the format ‘parent#.1stgeneration#.2ndgeneration#’. An entry of ‘0’ describes the case where the ‘parent’ is a population of different isolates whose DNA may be recombined; and iii) the unpegylated version of the dye used to isolate the FAP. Yeast display library and yeast strains. A yeast cell surface display library, composed of ~109 recombinant human scFv’s derived from cDNA representing a naïve germline repertoire, was obtained from Pacific Northwest National Laboratory (PNNL, http://www.sysbio.org/dataresources/singlechain.stm)1. The original version of the library was obtained in April 2004 from PNNL and was the source of our first isolated FAP, HL1-TO1. We obtained another library (a gift of Dane Wittrup, MIT) that represents a subset of the original PNNL library. The estimated complexity of this library is ~8 x 10⁸ independent scFvs. This library was the source of all other FAPs isolated for this study, and is currently available from PNNL.
EBY100 was host to the yeast display library and YVH10 was used to secrete scFvs as described1. For studies of individual FAPs, pPNL6 plasmids were transferred to JAR200 (Mat a ura3-52, trp1, leu2!200, his3!200, pep4:HIS3, prbd1.6R, can1, GAL, GAL promoter-AGA1::URA3:G418r), provided by Andrew Rakestraw, MIT. Cloning of single chain antibody FAPs. We employed a modified PBS buffer (PBS pH 7.4, 2 mM EDTA, 0.1% w/v Pluronic F-127 (Molecular Probes, Invitrogen)) for magnetic bead enrichment, FACS experiments, and all assays of yeast surface displayed or purified scFvs. Inclusion of Pluronic F-127 was found to greatly reduce absorption of low concentrations of TO1 and MG dyes to plastic and glass surfaces; microplate samples of 500 nM free dye gave stable readings for at least 18 hours.
All FAPs other than HL1-TO1 were cloned essentially as described1 except that a 2-color FACS enrichment screen based on enhanced fluorescence of the fluorogen (Fig. 1b) was employed instead of a 2-color screen based on antigen labeled with independent fluorophore. FACS enrichment was carried out on a Becton Dickinson FACSVantage SE with FACSDiva option; candidate FAPS were autocloned onto agar plates prior to characterization. 1 µM TO1-PEG5000-biotin or 500 nM MG-PEG5000-biotin were used to magnetically enrich and sort for respective FAPS, except that 50 nM MG-PEG5000-biotin was used to autoclone highest affinity MG FAP candidates.
For cloning of HL1-TO1, we initially tried a simplification of the standard protocol. Rather than outgrow cells and induce scFv expression between each cycle of FACS enrichment, a large population of induced cells was directly enriched for FAPs by 3 successive rounds of FACS. Briefly, cells were enriched for affinity by two rounds of magnetic bead treatment, and the output cells grown and induced. 108 of these cells were sorted at 20,000 cells/s on a MoFlo high speed flow cytometer, and the output 9 x 10⁶ cells were immediately resorted under the same conditions to give 7 x 10⁴ cells. These cells were again sorted to give ~1500 cells as final output. After growth and induction, these cells were sorted on an Epics Elite cytometer, and the small population of cells (~0.5%) with significantly improved fluorogen signal was collected, regrown and

3
resorted. These cells exclusively displayed HL1-TO1. Subsequent attempts at cloning other FAPs using this direct approach failed. Identification of FAPs. Autocloned yeast cells displaying candidate FAP isolates were grown in small cultures, and yeast plasmid DNA isolated using a Zymoprep kit (Zymo Research). The scFv insert was PCR amplified, and the amplified DNA product purified on an agarose gel and then DNA sequenced. scFv variable region sequences were classified as to human germline composition by analysis on the IMGT/V-QUEST website2. Spectral characterization of yeast surface displayed FAPs. Yeast surface displayed scFvs were spectrally characterized using fluorescence bottom reading in 96 well microplates on a Tecan Safire2 plate reader. 106 cells in 200 µl yeast buffer were assayed with 100-1000 nM MG-2p or TO1-2p. Spectra were corrected by subtraction of fluorescence of control cells not expressing scFvs (see Fig. 1c). Directed evolution of HL1-TO1. Maturation of HL1-TO1 followed described methods for random mutagenesis and selection of improved clones3, except that the 2-color FACS screen used in our standard cloning procedure was employed using TO1-2p as the fluorogen. Secretion and purification of soluble FAPs. Induction and secretion of scFvs were at 20º or 25ºC as described1 (http://www.sysbio.org/dataresources/singlechain.stm) except that YEPD was replaced by a tryptone-based secretion medium ( 5 g/L casamino acids (-ade, -ura, -trp), 50 g/L Bacto-Tryptone (BD #211705), 1.7 g/L Yeast Nitrogen Base w/out ammonium sulfate & amino acids (BD #233520), 5.3 g/L ammonium sulfate, 10.19 g/L Na2HPO4 · 7 H2O, 8.56 g/L NaH2PO4 · H2O (formulation provided by Lynn Dansey and Bill Brown, CMU)).
FAP secretion in 1 liter cultures was monitored during the 2-5 day course of induction by assaying the fluorescence of culture supernatants on a 96-well Tecan Safire2 plate reader. 100 µl of 2x assay buffer (100 mM NaxHxPO4, pH 7.4, 4 mM EDTA, 0.2% Pluronic F-127) containing either 1 µM TO1-2p or 200 nM MG-2p was added to 100 µl of culture supernatant for reading; readings were corrected for background by subtracting the fluorescence of identically treated virgin secretion medium. Tryptone secretion medium gave 2 to 10-fold increased yields of secreted scFvs as compared to YEPD.
Culture supernatants were dialysed and concentrated 3 times against 6 liters PBS on an Amicon Model 2000 high performance ultrafiltration cell (Millipore) using a 10,000 mw cut-off cellulose membrane. To purify the His6-tagged FAPs, the concentrated dialysate (~50 ml) was subjected to Ni2+-NTA agarose chromatography (Qiagen) according to manufacturer’s instructions. Appropriate dilutions of eluted fractions were assayed for fluorogenic activity using essentially the same assay as for secretion. Fluorescent fractions were pooled, assayed for protein content using a BCA protein assay kit (Pierce), and analyzed by SDS gel electrophoresis (Supplementary Fig. 2 online).

4
Determination of fluorogen binding affinity to yeast surface displayed FAPs. A homogenous assay under equilibrium binding conditions was devised to determine the binding affinity of fluorogen to yeast displayed scFvs. A flow cytometric method for titrating yeast displayed scFvs with fluorescently labeled antigen3 was adapted to the use of fluorogens. 106 induced yeast in 200 µl modified PBS (~1 nM displayed scFvs) containing fluorogen over a concentration range of 0.1-1000 nM were assayed in duplicate for fluorescence in 96 well microplates on a Tecan Safire2 reader. As controls, mock induced JAR200 cells that do not express scFvs were treated with equal concentrations of fluorogen; fluorescence was corrected by subtraction of the fluorescence of control cells. Cell surface KD values were determined on Prism Graphpad Prism 4.0 software (GraphPad Software, Inc.) by non-linear regression analysis using a one-site binding algorithm for saturation binding:
! "XKXBY D #$%& max where X is the concentration of fluorogen (Supplementary Fig. 3 online). Determination of fluorogen binding affinity to soluble FAPs. Binding affinity to soluble scFvs was determined by monitoring fluorogenic signal under conditions of ligand depletion using a homogenous 96 well microplate assay similar to above. 1 nM HL1.0.1-TO1, 10 nM L5-MG, 100 nM HL4-MG, and 200 nM H6-MG were each assayed with a 0.1 to 1000 nM range of fluorogen. Fluorescence of each FAP+dye sample was corrected by subtracting the fluorescence of a dye only sample. The KD of H6-MG was determined using the above one site algorithm; all other KD values were determined by non-linear regression using Graphpad Prism 4.0 and a ligand depletion algorithm4.
! " 242 $'()*
+, %%-----##& RXRKXRKXY DD
where X is the concentration of fluorogen, and R is the concentration of FAP/fluorogen complex at the observed or extrapolated plateau at maximum fluorescence (Supplementary Fig. 3 online).
Determination of Quantum yields. Quantum yields were determined by comparing integrated spectra of FAP/fluorogen complexes with those of reference dyes.
For HL4-MG/MG-2p, L5-MG/MG-2p and H6-MG/MG-2p complexes, quantum yield determinations were carried out using 2 µM of respective scFv + 440 nM MG-2p, or 440 nM MG-2p as the control. Cy5.18 in PBS5 and Di-S-C2-(5)6 in MeOH were used as reference fluorophores for the determination of MG-FAP quantum yields.
Quantum yield determinations of soluble HL1.0.1-TO1/TO1-2p and TO1-2p were carried out using 2 µM scFv + 520 nM TO1-2p, or 520 nM TO1-2p as the control. Fluorescein in 0.1 N NaOH7 and Rhodamine-6-G in MeOH8 were used as reference fluorophores for the determination of this TO1 FAP quantum yield.
Corrected emission spectra were taken on a Quantamaster monochromator fluorimeter (Photon Technology International) using the above concentrations of FAP/fluorogen complex and fluorogen, and concentrations of the reference dyes giving

5
similar absorbances at the excitation wavelength. The intensity integral was then computed. FAP/fluorogen absorbance values and extinction coefficients were corrected for partial FAP/fluorogen complex formation as described below. Quantum yields were calculated by the relation:
2
2
RR
RR AI
AI..
%%%%
%/&/
where / is the quantum yield, I is the integrated intensity, A is the absorbance, . is the refractive index, and R designates the reference dye. Absorbance correction and extinction coefficient determination for FAP/fluorogens. Raw absorbance values of respective MG FAPs and MG-2p were measured on a PerkinElmer Lambda45 spectrophotometer using 2 µM scFv + 440 nM MG-2p (for the FAP/MG-2p complex) or 440 nM MG-2p (for the MG-2p control). Absorbances of the respective complexes were significantly higher than free MG-2p and red shifted (Supplementary Fig. 4 online).
These differences in absorbance magnitude underrepresent actual differences because of incomplete complexation at these concentrations. Extent of complexation was modeled on Graphpad Prism 4.0 software using affinity values determined for soluble FAPs (Table 1 and Supplementary Fig. 3 online). The complexed proportion of HL4-MG/MG-2p, L5-MG/MG-2p and H6-MG/MG-2p were respectively found to be 0.74, 0.83 and 0.97.
Absorbance values used for quantum yield calculations were corrected so as to represent only FAP/fluorogen complexes (AFAP) by using the following relation, determined for the wavelength at which fluorescence emission spectra were excited. Absorbance of an equal concentration of free fluorogen (no FAP present) was measured at this wavelength in a separate experiment.
ATot is total observed absorbance of the FAP/fluorogen and free fluorogen AFAP is absorbance of the FAP/fluorogen complex AF is absorbance of free fluorogen X is proportion of fluorogen present in complex
Extinction coefficients of FAP/fluorogen complexes (EFAP) were determined by
separately measuring the extinction coefficient of the free fluorogen at the wavelength used to monitor the complex. This product of this extinction coefficient (EF) and the fluorogen concentration (C, note that the fluorogen concentration is constant) was then substituted for the AF term in the above relation to give EFC, and the AFAP term was analogously replaced by EFAPC. The relation was then evaluated.
QY determination of soluble HL1.0.1-TO1/TO1-2p required no absorbance correction because virtually complete complexation is expected at the employed concentrations of 2 µM scFv and 520 nM TO1-2p. A slight increase in absorbance of the
FFAPTot AXXAA )1( -#&

6
complex relative to free dye was observed (Supplementary Fig. 4 online), corresponding to a slight increase in extinction coefficient (Table 1). Determination of fluorogenic enhancement. Fluorogenic enhancement of HL4-MG, L5-MG, H6-MG and HL1.0.1-TO1 was measured in 96 well microplates on a Tecan Safire2 reader by comparison of the fluorescence of 440-550 nM free fluorogen with the fluorescence of a mixture of 440-550 nM fluorogen and 2 µM respective FAP. After a 1 hour incubation to allow complex formation, fluorescence was measured at the excitation and emission maxima of the fluorogen/FAP complexes. Fluorescence of yeast PBS buffer was subracted from all samples. Fluorescence readings were stable for at least 16 hours.
Extended gain settings were used to increase numerical accuracy. For HL4-MG and L5-MG, the differences in fluorescence between complexes and free dye exceeded the extended gain range of the instrument, so intermediate concentrations of Cy5 were also measured to allow interpolation between the extreme values. Two independent experiments, each with triplicate measurements, were carried out for each of the 4 FAPs; standard deviations for averaged values of FAPs, free fluorogen or PBS were less than 8%. The fold-enhancement values for HL4-MG, L5-MG and H6-MG were respectively multiplied by 1.35, 1.20 and 1.03 to correct for partial complexation at these concentrations. Mammalian cell-surface expression of FAP molecules. Plasmids expressing surface-displayed scFv's were generated as follows. A 375 bp PCR-amplicon was amplified from E. coli C600 DNA using as primers: 5’GGGGCTACCAGTTTGAGGGGACGACGA-3’ (forward), 5’-GGCCCCTGCGGCCGTTAGCTCACTCATTAGGCA-3’ (reverse). This molecule, which contains the lac promoter and 271 nucleotides of beta-galactosidase coding sequence flanked by SfiI sites, was cut with XmaI and ligated into pDisplay (Invitrogen) between the SmaI and XmaI sites to produce vector pDisplayBlue. Individual scFv sequences were prepared for insertion between the SfiI sites in pDisplayBlue by PCR-amplifying the scFv sequences from pPNL6 clones using as primers: 5’-TATATAGGCCCAGCCGGCCTACCCATACGACGTTCCAGAC-3’ (forward), 5’-TATATAGGCCCCTGCGGCCAATTCCGGATAGGACGGTGAG-3’ (reverse).
These amplicons were cut with SfiI, ligated into SfiI-cut vector, transformed into DH50 E. coli to ampicillin resistance, and Lac- colonies picked for DNA sequencing. DNA was prepared from selected transformants using Qiagen Mini-Prep kits and transfected into NIH3T3 cells or M21 human melanoma cells (~ 1 ug DNA per 105 cells) in 24-well plates using Lipofectamine 2000 (Invitrogen) following the protocols supplied by the manufacturer. Stable transfectants were isolated by successive rounds of FACS using cells exposed to the appropriate fluorogens. Microscopy. Images in Fig. 3a were acquired on a Zeiss LSM510 META laser scanning microscope using a 63x objective. A single scan of 1.27 "s per pixel was employed. L5-MG was excited at 488 nm with an argon laser at 100% power (30 mW) and emission monitored in a 668-700 nm window; HL1.0.1-TO1 was excited at 488 nm at 1.9% power (0.6 mW) and emission monitored in a 518-573 nm window. The difference in laser flux compensates for the relatively low quantum yield of L5-MG/MG-2p. Images are

7
unprocessed. Fluorogenic binding of TO1-2p and MG-2p to their cognate FAPs is highly specific; only 6 pixels of the total 23714 fluorescent pixels in both channels were colocalized. Images in Fig. 3b were acquired on a Zeiss LSM510 META laser scanning microscope using a 63x objective. GFP native fluorescence image is an average of 4 scans at 1.60 "s per pixel excited at 488 nm at 3.9% laser power using a 500-530 nm emission window. Other images are averages of 4 scans excited at 633 nm and monitored in a 650-710 nm emission window. HL4-MG/MG-11p image was acquired using a 1.60 "s per pixel scan time at 25% laser power; HL4-MG/immunolabeled anti-c-myc image was acquired using a 1.28 "s per pixel scan time at 20.8% laser power; and GFP/immunolabeled anti-c-myc image was acquired using a 1.60 "s per pixel scan time at 10.8% laser power. Images are unprocessed. Images in Fig. 3c were acquired on a Zeiss LSM510 META laser scanning microscope using a 63x objective. Fluorescence images represent an average of 4 scans at 1.60 "s per pixel excited at 633 nm at 9.9% laser power using a 650 nm long pass emission window. Fluorescence images are unprocessed; interference lines on DIC images were removed using a Fourier transform filter in Photoshop.
Images in Fig. 3d, e were acquired on an Olympus IX50 microscope with a QLC100 spinning confocal attachment (Solomere, Salt Lake City, UT). Images were reconstructed from 72 1 "m sections, displayed as 15º projections in NIH Image software, and false colored in Adobe Photoshop. In Fig. 3d, a 700/75 nm bandpass filter was used to visualize the 488 nm excitation of HL4-MG (see Fig. 2a). Low cellular background fluorescence at MG emission wavelengths allows compensation for weak excitation at 488 nm by increasing time of exposure (60 seconds in this experiment). The HL1.1-TO1 expressing cells in Fig. 3e were excited at 488 nm and visualized with a 500 nm long pass filter.
Image in Fig. 3f was acquired on a Zeiss Axioplan 2 with Apotome microscope. Green false color (TO1-2p) was imaged using 540/25 and 605/55 nm excitation and emission filters; red false color was imaged using 560/55 and 710/75 nm excitation and emission filters.

8
Syntheses of Fluorogens.
N
S N
SO3
NH3=Cl-
N
S
SO3
SCH3N
N
O
O
N
S N
SO3
H N
N H
O
O
O
NH2
N
S N
SO3
H N
PEG5000-Biotin
O
2
a) Boiling EtOH/NEt3 3; b) HClconc/EtOH/1
N H
O
O
O
NHBoc
Br
a,b
TO1
TO1-2P
TO1-PeG5000-Biotin
HO
2
c,d,e
c) DCC/HOSu/TO1 6; d) 1N HCl /EtOH e) NaHCO3 dil
Biotin-PEG500-NHS ester + TO1f
f) NaHCO3
1
24
5
7
8 49
2-[(1-[3-[3[(1,3-Dihydro-1,3-dioxo-2H-isoindol-2-yl)propyl]-4(1H)-quinolinylidene)methyl]-3-(3-sulfopropyl) benzothiazolinium inner salt 3 1-(3-N-Phthalimidopropyl)-4-methyl-quinolinium bromide 2 (822 mg, 2 mmol) and 3-(3-Sulfopropyl)-2-methylthio-benzothiazole 1 (1.2 g, 4 mmol) were dissolved in 150 ml boiling anhydrous ethanol. Triethylamine (0.28 ml, 4 mmol) was gradually added over a 15 minutes time period. The reaction mixture was refluxed for one hour. The precipitated solid was filtered off from the hot reaction mixture to give 822 mg of a red powder. Yield: 820 mg (70 %); C31H27N3O5S2 MW= 585.7 g/mol Theory: C 63.57 % H 4.65 %; N 7.17 % Found: C 63. 62% H 4.61% N 7.05 % 1H -NMR (CDCl3/MeOD): 8.85 (1H,d); 8.33 (1H,d); 7.68-7.87 (8H,m); 7.52-7.62 (2H,m); 7.31 (2H,m); 7.06 (1H,s); 4.75 (2H,t); 4.51 (2H,t); 3.84 (2H,t); 3.11 (2H,t); 2.34 (4H,m). 2-[(1-(3-Aminopropyl)-4(1H)-quinolinylidene)methyl]-3-(3-sulfopropyl) benzothiazolinium hydrochloride “TO1” 4 2-[(1-[3-[3[(1,3-dihydro-1,3-dioxo-2H-isoindol-2-yl)propyl]-4(1H)-quinolinylidene)methyl]-3-(3-sulfopropyl) benzothiazolinium inner salt 3 (585.7 mg; 1 mmol) was suspended in 20 ml concentrated hydrochloric acid and 5 ml ethanol. The reaction mixture was refluxed for 48 hrs. The solvent was removed under vacuum. The residue was dissolved in 10 ml of methanol and the dye was precipitated with 50 ml methylene chloride. The dye was filtered off; dissolved in water and filtered. The filtrate was concentrated under vacuum to give 400 mg of a red powder. Yield: 394 mg (80 %)

9
C23H26ClN3O3S2 MW: 492.06 g/mol; Theory: C 54.16 % H 5.53 % N 8.23 %; Found: C 54.39 % H 5.70 % N 7.82 % 1H -NMR (D2O): 7.64 (1H,d); 7.63 (1H); 7.53 (1H); 7.43 (1H); 7.23 (1H); 7.1(1H); 6.92 (1H); 6.9 (1H); 6.54 (1H); 6.29 (1H); 5.9 (1H); 3.7 (4H); 2.95 (2H); 2.82 (2H); 1.81 (4H). C23H26ClN3O3S2 x H2O; MW 510.07 g/mol; UV/VIS 2max = 488 nm; 3mol = 58000
[2-[(1-(Boc-18-amino-4,9-diaza-12,15-dioxa-5,8-dioxo-octadecanyl)-4(1H)-quinolinylidene)methyl]-3-(3-sulfopropyl) benzothiazolinium] inner salt "TO1-2P-NHBOC" 6 Boc-14-amino-5-aza-8,11-dioxa-4-oxo-tetradecanoic acid 5 (700 mg, 2 mmol)Ref was dissolved in dry CH3CN (10 ml). N-Hydroxysuccinimide (2.1 mmol, 300 mg) and dicyclohexylcarbodiimide (500 mg, 2.1 mmol) were added. The reaction mixture was stirred at RT overnight. The precipitated urea was filtered off and the filtrate was used in the next reaction step. TO1-amine (500 mg, 1 mmol) was dissolved in a mixture of water (10 ml) and acetonitrile (10 ml). The active ester solution was added in portions of 0.5 ml. After 30 min of stirring a precipitate formed. TLC control (silica gel) showed the product in the solution phase (9:1 CHCl3 / MeOH /1 % TFA). The solid was filtered off and the filtrate concentrated under vacuum. The residue was purified by column chromatography on silica gel. Yield: 1.1 g (75%); C33H44ClN5O7S2 MW: 725.48 g/mol 1H -NMR (MeOD): 8.64 (1H,d); 8.31 (1H,d); 7.75 (2H,m); 5.59 (2H,m); 7.44 (2H,m); 7.12 (1H,t); 7.07 (1H,d); 6.79 (1H,s); 4.65 (2H, bt); 4.39 (2H,t); 3.60 (4H,s); 3.5 (4H,m); 3.38 (2H,t); 3.21 (2H,t); 3.13 (2H,t); 2.58 (4H.m); 2.33 (2H,m); 2.06 (2H,m); 1.42 (9H,m). UV/VIS 2max = 508 nm
[2-[(1-(18-amino-4,9-diaza-12,15-dioxa-5,8-dioxo-octadecanyl)-4(1H)-quinolinylidene)methyl]-3-(3-sulfopropyl) benzothiazolinium] triflouroacetate "TO1-2P" 7 TO1-2P-BOC 6 (368 mg, 0.5 mmol) was dissolved in methanol (50 ml) and 1N hydrochloric acid 5 ml was added. The reaction mixture was stirred overnight at RT. The solvent was removed under vacuum to give an orange resin. The product was purified by HPLC; Waters 4-Bondapak C18; gradient 10-40% water/ acetonitrile/ 0.1%TFA 1H -NMR(MeOD): 8.53 (1H,d); 8.27 (1H,d); 7.75 (1H,t); 7.68 (1H,d); 7.55 (1H,t); 7.49 (1H,d); 7.43 (1H,d); 7.37 (1H,t); 7.05 (1H,t); 7.01 (1H,d); 6.68 (1H,d-exchanges); 4.57 (2H,t); 4.35 (2H t); 3.72 (2H,t); 3.65 (4H,m); 3.57 (2H, t); 3.39 (2H, t); 3.31 (2H, t); 3.14 (2H,m); 3.12 (2H,m); 2.26 (2H,m); 2.04 (2H,m); C35H44F3N5O9S2 MW: 799.9 g/mol 3mol (2504 in H2O) 34 000; 3mol (2504 in MeOH) 49500 Biotin-PEG5000-TO1 9 2-[(1-(3-Aminopropyl)-4(1H)-quinolinylidene)methyl]-3-(3-sulfopropyl) benzothiazolinium hydrochloride TO1 4 (5.8 mg; 0.01 mmol) was dissolved in 0.1 ml of water. Biotin-PEG5000-NHS ester 8 (Nektar Therapeutics) (50 mg; 0.01 mmol)

10
dissolved in 0.1 ml of DMF was added to the TO1 solution followed by 0.1 ml of saturated sodium bicarbonate solution. The reaction mixture was stirred for 1 hr. The solvents were removed under vacuum and the residue was taken up in a minimum of water and passed through a P4 sized exclusion column to remove free TO1. The PEG fraction was concentrated and purified on Q-Sepharose (Amerscham Biosciences) to separate unlabeled Biotin-PEG from Biotin-PEG5000-TO1. MS: Mn=5743.56;
H
O
O
O
O
N N
N
OOC2H5
O
13
10 a,b11
a) ZnCl2/EtOH : 12 b) TCB/ ethyl acetate
+
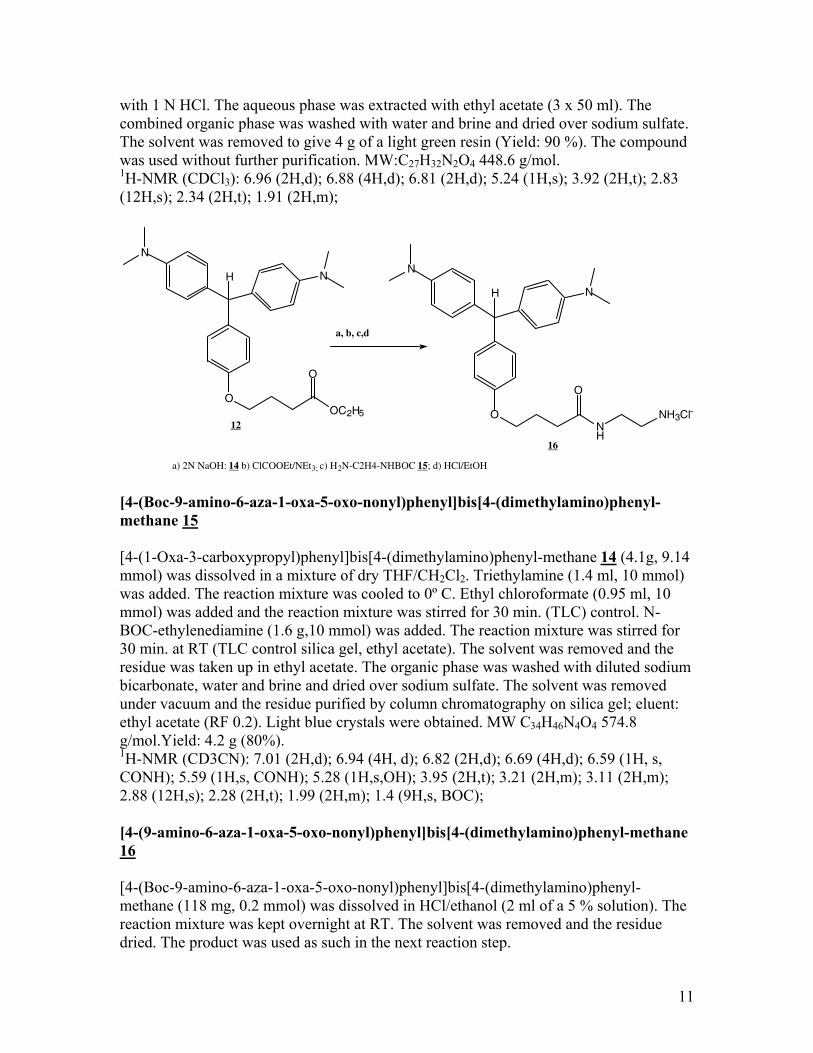
[4-(1-Oxa-3-carboethoxypropyl)phenyl]bis[4-(dimethylamino)phenyl-methane 12 Dimethylaniline 10 (7.27g; 60 mmol) and ethyl 4(4-formylphenoxy)butanoate 11 (7.08 g; 30 mmol) were dissolved in anhydrous ethanol (300 ml). Anhydrous zinc chloride (8.2g) was added and the reaction mixture was refluxed for 2 days, distilling off the ethanol 4-5 times and replacing it with anhydrous ethanol. After cooling to RT, the reaction mixture was concentrated. The residue was taken up in ethyl acetate and water. The organic phase was separated, washed with water, dried, concentrated and purified on silica gel. Eluent: Ethyl acetate. MW C29H36N2O4 476.62 g/mol; yield: 11.4 g (80%); 1H-NMR (CDCl3): 7.1 (2H,d); 7.05 (4H,d); 6.85 (2H,d), 6.75 (2H,d); 5.4 (1H.s,OH); 4.25 (2H,q); 4.05 (2H,t); 2.95 (12H,s); 2.6 (2H,t); 2.25 (2H,m), 1.35 (3H,t); Methylium, bis[4-(dimethylamino)phenyl](4-(3-carboethoxypropyl)phenyl)-chloride 13 [4-(1-Oxa-3-carboethoxypropyl)phenyl]bis[4-(dimethylamino)phenyl-methane 12 (460 mg, 1 mmol) was dissolved in 25 ml ethyl acetate. Tetrachloro-p-benzochinone (490 mg/ 2 mmol) was added and the reaction mixture was refluxed for 1 hr. The reaction mixture was cooled to RT. Ethyl acetate (75 ml) was added and the product was extracted with water (5 x 50 ml). The combined aqueous phase was washed with ethyl acetate (2 x 50 ml) and concentrated to give 200 mg (40 %) of product. MW C29H35Cl N2O4 511.1 g/mol 1H-NMR (CD3CN): 7.33 (4H,d); 7.08 (2H,d); 6.92 (4H,d); 4.15 (2H,t); 4.10 (2H,q); 3.23 (12H,s); 2.48 (2H,t); 2.08 (2H, m); 1.21 (3H, t); [4-(1-Oxa-3-carboxypropyl)phenyl]bis[4-(dimethylamino)phenyl-methane 14 [4-(1-Oxa-3-carboxypropyl)phenyl]bis[4-(dimethylamino)phenyl-methane 12 (5g, 10.5 mmol) was dissolved in acetone (30 ml). Sodium hydroxide (10 ml of a 2 N aqueous solution) was added. The reaction mixture was stirred at RT until the ester was cleaved (TLC control). The acetone was removed and the aqueous solution adjusted to pH 3-4
11
with 1 N HCl. The aqueous phase was extracted with ethyl acetate (3 x 50 ml). The combined organic phase was washed with water and brine and dried over sodium sulfate. The solvent was removed to give 4 g of a light green resin (Yield: 90 %). The compound was used without further purification. MW:C27H32N2O4 448.6 g/mol. 1H-NMR (CDCl3): 6.96 (2H,d); 6.88 (4H,d); 6.81 (2H,d); 5.24 (1H,s); 3.92 (2H,t); 2.83 (12H,s); 2.34 (2H,t); 1.91 (2H,m);
H
N
N
OOC2H5
O
H
N
N
ON H
O
NH3Cl-
a, b, c,d
a) 2N NaOH: 14 b) ClCOOEt/NEt3; c) H2N-C2H4-NHBOC 15; d) HCl/EtOH
12
16
[4-(Boc-9-amino-6-aza-1-oxa-5-oxo-nonyl)phenyl]bis[4-(dimethylamino)phenyl-methane 15 [4-(1-Oxa-3-carboxypropyl)phenyl]bis[4-(dimethylamino)phenyl-methane 14 (4.1g, 9.14 mmol) was dissolved in a mixture of dry THF/CH2Cl2. Triethylamine (1.4 ml, 10 mmol) was added. The reaction mixture was cooled to 0º C. Ethyl chloroformate (0.95 ml, 10 mmol) was added and the reaction mixture was stirred for 30 min. (TLC) control. N-BOC-ethylenediamine (1.6 g,10 mmol) was added. The reaction mixture was stirred for 30 min. at RT (TLC control silica gel, ethyl acetate). The solvent was removed and the residue was taken up in ethyl acetate. The organic phase was washed with diluted sodium bicarbonate, water and brine and dried over sodium sulfate. The solvent was removed under vacuum and the residue purified by column chromatography on silica gel; eluent: ethyl acetate (RF 0.2). Light blue crystals were obtained. MW C34H46N4O4 574.8 g/mol.Yield: 4.2 g (80%). 1H-NMR (CD3CN): 7.01 (2H,d); 6.94 (4H, d); 6.82 (2H,d); 6.69 (4H,d); 6.59 (1H, s, CONH); 5.59 (1H,s, CONH); 5.28 (1H,s,OH); 3.95 (2H,t); 3.21 (2H,m); 3.11 (2H,m); 2.88 (12H,s); 2.28 (2H,t); 1.99 (2H,m); 1.4 (9H,s, BOC); [4-(9-amino-6-aza-1-oxa-5-oxo-nonyl)phenyl]bis[4-(dimethylamino)phenyl-methane 16 [4-(Boc-9-amino-6-aza-1-oxa-5-oxo-nonyl)phenyl]bis[4-(dimethylamino)phenyl-methane (118 mg, 0.2 mmol) was dissolved in HCl/ethanol (2 ml of a 5 % solution). The reaction mixture was kept overnight at RT. The solvent was removed and the residue dried. The product was used as such in the next reaction step.

12
N
N
ON H
OH N
16
O
O
H N
O
OH N
O
MG 2P: a) BOC-NH-PEG2-Succ-OSu 17; b) TCB; c) 1N HCl/EtOH MG 11: a) BOCNH-PEG11-Glycol-O-SU 19; b) TCB; c) 1N HCl/EtOH
O
O
Cl-a,b,c
11
MG-2P R= 18 2
MG-11P R= 20
R
NH2
NH2
[4-(Boc-9-Aminoethyl-PEG2)-6,9,15-triaza-1,12-dioxa-5,10,14-trioxo-pentaundecanyl)phenyl]bis[4-(dimethylamino)phenyl-methane Leuco-MG-2P 17 [4-(9-Amino-6-aza-1-oxa-5-oxo-nonyl)phenyl]bis[4-(dimethylamino)phenyl-methane (118 mg, 0.2 mmol) 16 was reacted with the NHS-ester of boc-14-amino-5-aza-8,11-dioxa-4-oxo-tetradecanoic acid 5 in 1 DMF (1 ml) /1N NaHCO3 (1 ml). The reaction mixture was concentrated and purified by chromatography on silica gel (eluent: ethyl acetate /10-30 % methanol). MW: C34H46N4O4 574.8 g/mol [4-(9-Aminoethyl-PEG2)-6,9,15-triaza-1,12-dioxa-5,10,14-trioxo-pentaundecanyl)- MG-2P 18 Leuco-MG-2P 17 (161 mg/0.28 mmol) was dissolved in 25 ml of ethyl acetate. Tetrachloro-p-benzochinone (100 mg/ 0.4 mmol) was added and the reaction mixture was refluxed for 1 hr. The reaction mixture was concentrated to 2 ml. Hydrochloric acid (2 ml of a 1N solution) was added and the reaction mixture was stirred at RT for 1 hr. The reaction mixture was partitioned between 100 ml ethyl acetate and 150 ml of water. The water phase was separated and washed with ethyl acetate (2x100 ml). The aqueous phase was concentrated. The residue was dried at 60º C under high vacuum to give 130 mg of dye (yield: 88 %). MW: C29H37N4O2Cl 509.1 g/mol 1H-NMR (MeOD): 7.42 (4H,d); 7.36 (2H,d); 7.17 (2H,d); 7.04 (4H,d); 4.25 (2H,t); 3.71 (2H,m); 3.65 (4H,m); 3.55 (2H,t); 3.36 (2H,t); 3.31 (12H,s); 3.30 (2H,m); 3.07 (2H,m); 2.49 (4H;m); 2.44 (2H,t); 2.15 (2H,q). [4-(Boc-Aminoethyl-PEG11)-6,9,15-triaza-1,12-dioxa-5,10,14-trioxo-pentaundecanyl) Leuco-MG-NHBOC 19 O-[2-Boc-amino)-ethyl]-O'-[2-(diglycolyl-amino)ethyl]decaethylene glycol P11 (152 mg, 0.2 mmol) were dissolved in dry DMF (0.5 ml). TSTU (66 mg, 2.2 mmol) and DEA (39

13
4L, 2.2 mmol) were added. The reaction mixture was kept overnight at RT. [4-(9-Amino-6-aza-1-oxa-5-oxo-nonyl)phenyl]bis[4-(dimethylamino)phenyl-methane (100 mg, 0.2 mmol) 16 was dissolved in dry DMF (0.2 ml) and added to the active ester of P11. The reaction mixture was kept at RT for 3 hrs. The solvent was removed under vacuum and the residue purified on silica gel (eluent: ethyl acetate/10-30 % methanol). MW C62H91N6O18 1208.5 g/mol. Yield: 150 mg (62%). (MG(H)- O-(CH2) 3-CONH-C2H4-NHCO-CH2-O-CH2-CONH-(C2H4O)11-C2H2-NH2-NHBOC; 1H-NMR (CD3CN): 7.28 (1H,d), 7.17 (2H,d), 7.11 (1H,d), 7.02 (2H,d), 6.80 (2H,dd), 6.67 (2H,dd), 5.4 (1H,s), 3.95 (2H,m), 3.91 (2H,d), 3.88 (2H,s), 3.54 (42H,m), 3.45 (2H,t), 3.39 (2H,m), 3.29 (2H,m), 3.27 (2H,m), 2.89 (12H,s), 2.30 (2H,m), 2.00 (2H,m), 1.40 (9H,s). MG-11P 20 Leuco-MG-11P-NHBoc 19 (150 mg, 0.124 mmol) was dissolved in 25 ml acetonitrile. The reaction mixture was heated to 50º C. Tetrachloroquinone (100 mg, 0.4 mmol) was dissolved in 30 ml boiling acetonitrile and dropwise added under stirring to the leucobase. The dark green dye formation was followed by 1H-NMR control. After several hours the reaction mixture was cooled to RT. The acetonitrile was removed and the reaction mixture was partitioned between water (150 ml) and ethyl acetate (50 ml). The water phase was separated and washed several times with ethyl acetate. The water phase was concentrated to give a green residue. Hydrochloric acid in ethanol (2 ml of a 20% solution) was added and the reaction mixture was stirred for 1 hr. The reaction mixture was concentrated to dryness to give 60 mg of a green powder. Yield :53 % MG-O-(CH2) 3-CONH-C2H4-NHCO-CH2-O-CH2-CONH-(C2H4O)11-C2H2-NH2 1H-NMR (MeOD): 7.43 (4H,d); 7.36 (2H,d), 7.17 (2H,d), 7.05 (4H,d), 4.20 (2H,t), 4.06 (2H,d); 4.05 (2H,d), 3.77 (2H,t), 3.78-3.58 (44H,m), 3.45 (2H,t), 3.32 (12H,s), 3.18 (2H,t), 2.45 (2H,t), 2.15 (2H,m). C57H91N6O16
+ MS/M+= 1116.53 MG-11P-Biotin MG-11p 20 (11 mg; 0.01 mmol) was dissolved in 0.2 ml DMSO. A solution of Biotin-NHS ester (6.5 mg; 0.02 mmol) in 0.1 ml DMSO was added followed by 0.02 ml of DEA (1mmol in DMSO). The reaction mixture was stirred for 2hrs at RT, then passed through a short column of neutral aluminum oxide. DMSO and DEA were eluted with chloroform. The product was eluted with chloroform/10-20% methanol to give 8 mg of a green solid. Yield: 58 %. MG-O-(CH2) 3-CONH-C2H4-NHCO-CH2-O-CH2-CONH-(C2H4O) 11-C2H4-NH-Biotin 1H-NMR (MeOD): 7.43 (4H,d), 7.37 (2H,d), 7.18 (2H,d), 7.06 (4H,d), 4.51 (1H,m), 4.32 (1H,m), 4.21 (2H,m), 4.06 (2H,s), 4.05 (2H,s), 3.65 (44H,m), 3.55 (2H,m), 3.47 (2H,m), 3.38 (6H,m), 3.32 (12H,s), 3.25 (4H,m), 3.06 (1H,m), 2.93 (3H,m), 2.45 (2H,m), 2.22 (2H,m), 2.16 (2H,qui). C67H105Cl N8O18 S+; MS/ M+= 1342.60

14
Biotin-PEG5000-MG MG-2P 18 (5 mg; 0.01 mmol) and Biotin-PEG5000-NHS ester 8 (Nektar Therapeutics) (50 mg; 0.01 mmol) were dissolved in 0.2 ml of DMF and 0.01 ml of DEA (1mmol in DMF) was added. The reaction mixture was stirred for 1 hr. The reaction mixture was passed through a short column of neutral aluminum oxide. DMF and DEA were eluted with chloroform. The product was eluted with chloroform/10-20% methanol. Mn=5747.8. N-[4-[(4-Carboxyphenyl)[4-(dimethylamino)phenyl]methylene]-2,5-cyclohexadien-1-ylidene]-N-methyl- methanaminium chloride 21 was prepared by a literature procedure9.
N
N
OH
Cl-
O
21

15
References 1. Feldhaus, M.J. et al. Flow-cytometric isolation of human antibodies from a
nonimmune Saccharomyces cerevisiae surface display library. Nat Biotechnol 21, 163-170 (2003).
2. Giudicelli, V. et al. IMGT/LIGM-DB, the IMGT comprehensive database of immunoglobulin and T cell receptor nucleotide sequences. Nucleic Acids Res 34, D781-784 (2006).
3. Colby, D.W. et al. Engineering antibody affinity by yeast surface display. Methods in enzymology 388, 348-358 (2004).
4. Motulsky, H. & Christopoulos, A. Fitting models to biological data using linear and nonlinear regression : a practical guide to curve fitting. (Oxford University Press, Oxford ; New York; 2004).
5. Mujumdar, R.B., Ernst, L.A., Mujumdar, S.R., Lewis, C.J. & Waggoner, A.S. Cyanine dye labeling reagents: sulfoindocyanine succinimidyl esters. Bioconjugate chemistry 4, 105-111 (1993).
6. Sims, P.J., Waggoner, A.S., Wang, C.H. & Hoffman, J.F. Studies on the mechanism by which cyanine dyes measure membrane potential in red blood cells and phosphatidylcholine vesicles. Biochemistry 13, 3315-3330 (1974).
7. Lacowicz, J. Principles of Fluorescence Spectroscopy, 2nd edition. (Kluwer Academic/Plenum, 1999).
8. Kubin, R.F. & Fletcher, A.N. Fluorescence quantum yields of some rhodamine dyes. J. Lumin 27, 455–462 (1982).
9. Mueller, W.H., Hattesohl, I., Schuetz, H.J. & Meyer, G. Polyethylene glycol derivatives of base and sequence specific DNA ligands: DNA interaction and application for base specific separation of DNA fragments by gel electrophoresis. Nucleic Acids Res. 9, 95–119 (1981).

Supplementary Table 1. Peptide sequence of scFvs >HL1-TO1 QVQLVESEAEVKKPGSSVKVSCKASGGTFSSYAISWVRQAPGQGLEWMGGIIPIFGTANYAQKFQGRVTI TADESTSTAYMELSSLRSEDTAVYYCVLLDTTMVTGYYFDYWGQGTLVTVSSGILGSGGGGSGGGGSGGG GSNFMLTQPPSASGTPGQSVTISCSGSGSNIGNNKVNWYQQLPGTAPKLLIYSNNQRPSGVPDRFSGSKS GTSASLAISGLQSEDEADYYCAAWDDSLNGYVFGTGTKLTVL >HL2-TO1 QVQLQQGGAGLLKPSETLSLTCGVYGGSFSGYYWSWIRQSPGKGLEWIGEINHSGSANYNPSVKSRVTIS VDTSKNQFSLQLSSVTAADTAVYYCARDRAVLTGEGWYFDLWGRGTLVTVSSGILGSGGGGSGGGGSGGG GSSYELTQPPSVSVSPGQTASITCSGDKLGDKYTCWYQQKPGQSPVLVLYEDTKRPSGIPERFSGSNSGN TATLTISRVEAGDEADYYCQLWDSSSDHYVFGSGTKLTVL >HL1.0.1-TO1 QVQLVESEAEVKKPGSSVKVSCKASGGTFSSYAISWVRQAPGQGLEWMGGTIPIFGTADYAQEFQGRVTI TTDESTSTAYMELSGLRSEDTAVYYCVLLGTTMVTGHYFDYWGQGTLVTVSSGILGSGGGGSGGGGSGGG GSNFMLTQPPSASGTPGQSVTISCSGSGSNIGNNKVNWYQQLPGTAPKLLIYSNNQRPSGVPDRFSGSKS GTSASLAISGLQSEDEADYYCAAWDDGLSGYVFGTGTKLTVL >HL1.1-TO1 QVQLVESEAEVKKPGSSVKVSCKASGGTFSSYAISWVRQAPGQGLEWMGGTIPIFGTANYAQKFQGRVTI TADESTSTAYMELSSLRSEDTAVYYCVLLGTTMVTGYYFDYWGQGTLVTVSSGILGSGGGGSGGGGSGGG GSNFTLTQPPSASGTPGQSVTISCSGSGSNIGNNKVNWYQQLPGTAPKLLIYSNNQRPSGVPDRFSGSKS GTSASLAISGLQSEDEADYYCAAWDDSLNGYVFGTGTKLTVL >HL4-MG QVQLVESEGGLVQPGGSLRLSCAASGFTFSSYEMNWVRQAPGKGLEWVSRIDGDGSSTNYADSVKGRFTI SRDNAKSTLYLQMNSLRAEDTAVYYCTRARYFGSVSPYGMDVWGQGTTVTVSSGILGSGGGGSGGGGSGG GGSDIRVTQSPSSVSASVGDRVTISCRASQGIATWLGWYQQKPGKPPQLLIYSASTLQTGVPSRFSGSGS GTDFTLTISSLQPEDVATYYCQEGSTFPLTFGGGTKVDIKSGILEQKLISEEDL >L5-MG SASTGSFDSWGQGTLVTVSSGILGSGGGGSGGGGSGGGGSQAVVTQEPSVTVSPGGTVILTCGSSTGAVT SGHYANWFQQKPGQAPRALIFETDKKYSWTPGRFSGSLLGAKAALTISDAQPEDEAEYYCLLSDVDGYLF GGGTQLTVLSGILEQKLISEEDL >H6-MG QVQLQESGPGLVKPSETLSLTCTVSGASISSSHYYWGWIRQPPGKGPEWIGSMYYSGRTYYNPALKSRVT ISPDKSKNQFFLKLTSVTAADTAVYYCAREGPTHYYDNSGPIPSDEYFQHWGQGTLVTVSSGILGSGGGG SGGGGSGGGGLQEF >HL7-MG QVQLQQWDAGLVKPSQTLSLTCAISGDSVSSNSAAWNWIRQSPSRGLEWPGRTYYRSKWQNNYALSVQGR ITINPDTSNNQFSLQLDSMTPEDTGVYYCTRGGGSLDYWGQGTLVTVSSGSASAPTGILGSGGGGSGGGG SGGGGSSYELTQPPSVSVSPGQTATITCSGDEMGDKYAYWYQQKPGQAPVLVIYKDSERPSGIPERFSGS SSGTTVTLTISGVQAEDEADYYCQSADSSGTSVVFGGGTKVTVLSGILEQKLISEEDL >H8-MG QVQLQQSGPGLVRPSQTLSLTCAISGDSVPKNGASWNWIRLSPSRGLEWLGRTHYSSRWYHDYAFFVKSR ITINVDTSETQVSLQLDSVTPDDTGVYYCARESQRRGWFDLWGQGTLVTVSQEF >HL9-MG QVQLQQSGPGRVKPSQTLSLTCDISGDSVSSNSVAWNWIRQSPSRGLEWLGRTYYRSKWINEYGPFVRSR ITINPDTSKNQFSLQLNSVTPEDTAVYYCATMANSGYDRSSGHNYGMDVWGQGTTVTVSSGSASAPTGIL GSGGGGSGGGGSGGGGSSYELTQPPSVSVSPGQTARITCSGDALPKQYTYWYQQKAGQAPVLVIYKDTER PSGIPERFSGTSSGTTVTLTISGVQAEDEADYYCQSADSSGSYVFFGGGTKVTVLSGILEQKLISEEDL

HL1-TO1 QVQLVESEAEVKKPGSSVKVSCKASGGTFSSYAISWVRQAPGQGLEWMGGIIPIFGTANYAQKFQGRVTITADESTSTAYMELSSLRSEDTAVYYCVLLDTTMVTGYYFDYWGQGTLVTVS
HL1.1-TO1 ..................................................T................................................G.....................
HL1.0.1-TO1 ..................................................T.......D...E........T............G..............G......H..............
1 2 3
Supplementary Figure 1. Improvement of binding affinity and intrinsic brightness of HL1-TO1 by directed evolution. Affinity and total cellular
brightness were measured using yeast cell surface displayed scFvs. Affinity was determined as described in Methods. Total cellular brightness was
measured at saturating fluorogen concentration on a Tecan Safire2 plate reader, and intrinsic brightness calculated by normalizing total signal to
the relative number of scFvs, determined separately by FACS analysis of immunolabeled c-myc epitope.
The graph depicts relative intrinsic brightness for selected scFvs employed in this study after one (green) or two (red) generations of directed
evolution. Numbers on bars represent cell surface binding KD (nM). The sequence alignments show the distribution of acquired mutations within
the heavy chain variable region of HL1-TO1. Complementarity Determining Regions (CDRs) implicated in antigen recognition are underlined and
numbered as identified in the IMGT/V-QUEST database (http://imgt.cines.fr/). Amino acid replacements in bold color depict residues found in
multiple instances within each family of improved descendants; these dominant replacements tend to accumulate in CDRs. For HL1-TO1,
accumulation of dominant replacements occurs in the heavy chain rather than the light chain; among 16 unique second generation descendants that
were analyzed, 8 positions in the heavy chain accumulated dominant mutations but only 1 position in the light chain. For the selected clones, it can
be seen that the first generation replacements improved both affinity and brightness, whereas second generation replacements improved only
affinity.
HL1-TO1 HL1.1-TO1 HL1.0.1-TO1
0.0
0.5
1.0
1.5
2.0
Re
lative
Intr
insic
Brig
htn
ess
360
11.9 3.1

0 50 100 150 200
0
10000
20000
30000
HL4-MG
MG-2p (nM)
Flu
ore
scen
ce
0 50 100 150 200
0
10000
20000
30000
L5-MG
MG-2p (nM)
Flu
ore
scen
ce
0 50 100 150 200
10000
30000
50000
H6-MG
MG-2p (nM)F
luo
res
ce
nc
e
0 50 100 150 200
0
20000
40000
60000
HL1.0.1-TO1
TO1-2p (nM)
Flu
ore
scen
ce
(x100)
200 600 1000
0
50
100
150
200
H6-MG
MG-2p (nM)
H6
-MG
/MG
-2p
(nM
)
0 50 100 150 200
0
2
4
6
8
10
HL1.0.1-TO1
TO1-2p (nM)
HL
1.0
.1-T
O1
/TO
1-2
p(n
M)
0 1000 2000 3000
0
2
4
6
8
10
12
L5-MG
MG-2p (nM)
L5
-MG
/MG
-2p
(nM
)
0 1000 2000 3000
0
20
40
60
80
100
HL4-MG
MG-2p (nM)
HL
4-M
G/M
G-2
p(n
M)
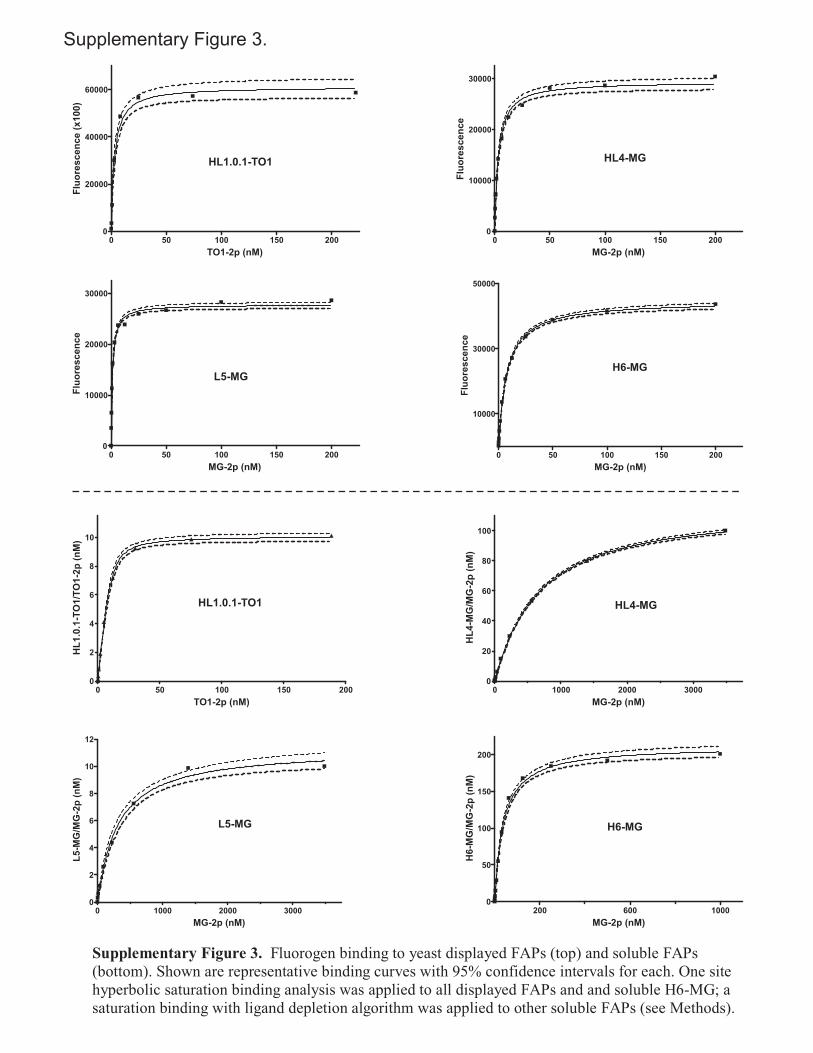
Supplementary Figure 3. Fluorogen binding to yeast displayed FAPs (top) and soluble FAPs(bottom). Shown are representative binding curves with 95% confidence intervals for each. One sitehyperbolic saturation binding analysis was applied to all displayed FAPs and and soluble H6-MG; asaturation binding with ligand depletion algorithm was applied to other soluble FAPs (see Methods).
Supplementary Figure 3.

400 500 600 700
0.00
0.01
0.02
0.03
0.04
0.05
Wavelength (nm)
Ab
so
rban
ce
MG-2p
HL4-MG
L5-MG
400 500 600 700
0.00
0.01
0.02
0.03
Wavelength (nm)
Ab
so
rban
ce
HL1.0.1-TO1
TO1-2p
MG-2p
H6-MG
400 500 600 700
0.00
0.01
0.02
0.03
0.04
0.05
Wavelength (nm)
Ab
so
rban
ce
Supplementary Figure 4. Absorbance of fluorogens and FAP/fluorogen complexes. Shown aresamples used in quantum yield determinations. The absorbance of FAP/fluorogen complexes wasobtained on a dual beam PerkinElmer Lambda 45 spectrophotometer using an equalconcentration of FAP without fluorogen as the reference.
Supplementary Figure 4.


Supplementary Figure 7. (a) Photobleaching of TO1-FAP and EGFP displayed on yeast. JAR200 yeast
strains displaying HL1.0.1-TO1 and EGFP as described in Fig. 3 were immobilized on concanavalin-A treated
35 mm petri dishes with 14 mm optical microwell (MatTek Corp) and bleached in 2 ml modified PBS using an
Olympus IX50 inverted microscope equipped with a 100W Hg lamp, 40x 1.3NA oil objective and a
Photometrics CoolSnap HQ camera. Using HQ470/40 excitation and HQ500 LP emission filters (Chroma set
#41018, total irradiance at the specimen plane was measured at 30 mW (13.6 µW/µm2). Each curve represents
an average of scans of 8-12 individual cells. Fluorescence of EGFP was normalized (scaled down ~2.5-fold) to
match HL1.0.1-TO1 cells visualized with 375 nM TO1-2p. (b) Determination of photobleaching lifetime of
yeast displayed TO1-FAP and EGFP. JAR200 yeast cells treated as in (a) were bleached on a Leica DMI 6000
B confocal microscope using 488 nm laser excitation at 100% power and monitoring emission with a 500-600
nm window. Data from individual cells were averaged as above, and EGFP signal was normalized (scaled down
~3-fold) to match initial HL1.0.1-TO1 fluorescence. Plotted data points are displayed with a single exponential
decay curve (Graphpad Prism 4.0 software). Lifetimes were corrected by comparing excitation intensities of
these cells at 488 nm to the intensity at their excitation maxima (EGFP at 502 nm, HL1.0.1-TO1 at 512 nm),
determined on a Tecan Safire2 plate reader. (c) Photobleaching of MG-FAP displayed on mammalian cells.
NIH 3T3 cells stably expressing both HL4-MG and HL1.1-TO1 simultaneously were isolated using FACS (See
Methods), and grown as a layer on the optical window of 35 mm petri dishes. Bleaching experiments were
carried out as in (a) in PBS w/Ca & Mg; using HQ620/60 excitation and HQ665 LP emission filters (Chroma
set #41024), total specimen plane irradiance was measured at 30 mW.
HL1.0.1-TO1 & EGFP bleaching in yeast
0 100 200 300 400 500 600 700
0
10
20
30
40
50
60
70
80
90
100
HL1.0.1-TO1 fluorescence with 500 nM TO1-2p
EGFP fluorescence
EGFP: corrected !! = 40
!!
!!
HL1.0.1-TO1: corrected !! = 40
= 62
= 85
Seconds
No
rmalized
Flu
ore
scen
ce
b
HL4-MG bleaching in NIH3T3 cells
0 60 120 180 240 300
0
100
200
300
400
500
2 nM
10 nM
250 nM
Seconds
Flu
ore
sc
en
ce
MG-11p
c
Supplementary Figure 7.
HL1.0.1-TO1 & EGFP bleaching in yeast
0 60 120 180 240 300
0
20
40
60
80
100
120
140
160
15 nM
45 nM
75 nM
375 nM
EGFP
TO1-2p
Seconds
Flu
ore
sc
en
ce
a

0 4 8 12 16 20
0.25
0.5
1
2
4
8
16No dye
50 nM TO1-2p
500 nM TO1-2p
50 nM MG-2p
500 nM MG-2p
50 nM MG-ester
500 nM MG-ester
50 nM MG
500 nM MG
Hours growth at 30ºC
Ab
so
rban
ce
at
600
nm
(lo
g2)
Supplementary Figure 8. Effect of fluorogens on yeast cell growth. JAR200 cells were
inoculated at ~106 cells/ml into 35 ml SD+CAA medium in 125 ml baffled flasks and allowed to
grow at 30°C at 300 RPM for 2 hours prior to addition of fluorogens at the indicated
concentrations. One ml samples were removed at indicated time points, and growth halted by
addition of 75 µl of 300 mM NaN3 prior to reading absorbance. Doubling time of about 1.9 hrs
was unchanged by most fluorogen treatments. For 500 nM MG-ester (R-group I in Fig. 2b), the
doubling time was about 2.8 hrs; for 500 nM MG, doubling time was over 24 hrs.
Supplementary Figure 8.
Copyright © 2022 FDOKUMEN