Use of fast protein liquid chromatography for the purification of synthetic oligonucleotides
Fluorescence of Unmodified Oligonucleotides: A Tool to ProbeG-Quadruplex DNA Structure
Miguel Angel Mendez, Veronika A. SzalaiDepartment of Chemistry and Biochemistry, University of Maryland, Baltimore County, Baltimore, MD 21250
Received 20 February 2009; revised 12 June 2009; accepted 13 June 2009
Published online 22 June 2009 in Wiley InterScience (www.interscience.wiley.com). DOI 10.1002/bip.21268
This article was originally published online as an accepted
preprint. The ‘‘Published Online’’date corresponds to the preprint
version. You can request a copy of the preprint by emailing the
Biopolymers editorial office at [email protected]
INTRODUCTION
Molecules of DNA rich in guanine present signifi-
cantly higher fluorescence than homologous
chains without consecutive guanines (G).1 To
demonstrate the usefulness of this electronic
property, we have studied several sequences ca-
pable of forming a particular superstructure known as a gua-
nine-quadruplex (G-quadruplex, Scheme 1). G-quadru-
plexes, four stranded structures mediated by hydrogen-
bonded Gs (Scheme 1), have been implicated in gene control
and other biological processes.2,3 They are used as drugs for
treating cancer4 and as sources for new materials.5–7 Use of
fluorescently modified DNA, either labeled with extrinsic flu-
orophores8 or intrinsic fluorescence enhanced by metallic
particles,9 is a common means to detect and monitor the
structure, hybridization, and binding properties of DNA.
These technologies have enabled the creation of broadly used
tools such as molecular beacons, DNA chips, and aptamer-
based fluorescence sensors.9–14 Fluorescence resonance elec-
tron transfer (FRET) in molecular beacons has been
exploited in the detection of folded and unfolded states of ol-
igonucleotides.15–17 These changes have been coupled with
sensing capabilities to detect a variety of analytes. FRET also
has been used to detect movements of nanomachines.5 In
some instances, however, addition of a fluorescent tag—often
Fluorescence of Unmodified Oligonucleotides: A Tool to ProbeG-Quadruplex DNA Structure
Additional Supporting Information may be found in the online version of this
article.Correspondence to: V. A. Szalai; e-mail: [email protected]
ABSTRACT:
Fluorescence of unmodified oligonucleotides has not been
exploited for guanine-quadruplex (G-quadruplex)
characterization. We observe that G-rich sequences
fluoresce more strongly than duplex or single-stranded
DNA but much more weakly than fluorophores like
fluorescein. This increase in the intrinsic fluorescence is
not due to an increase in absorption at the excitation
wavelength but rather to a change in the quantum yield.
We show that unlabeled oligonucleotides that form
G-quadruplexes can be differentiated on the basis of their
emission spectra from similar sequences that do not
contain consecutive guanines. Intermolecular
quadruplexes formed by the oligonucleotides
50-T4GnT4-30 (n 5 4–10) display a nonlinear, but
continuous, increase in emission intensity as the G
content increases. The sequence 50-GGGT-30, which has
been proposed to form a monomeric quadruplex and an
interlocked quadruplex (Krishnan-Ghosh et al. J Am
Chem Soc 2004, 126, 11009), was compared with the
similar sequence 50-TGGG-30, the structure of which has
not been characterized. Both the maximum emission
intensity and the spectral shape differ for these
oligonucleotides as a function of sample preparation,
indicating that different types of quadruplexes form for
both sequences. Our work is the first to demonstrate that
the suprastructure of G-rich sequences can be probed
using fluorescence signatures of unmodified
oligonucleotides. # 2009 Wiley Periodicals, Inc.
Biopolymers 91: 841–850, 2009.
Keywords: guanine; quadruplex; fluorescence; exciplex
VVC 2009 Wiley Periodicals, Inc.
Biopolymers Volume 91 / Number 10 841

a large aromatic molecule or other bulky group—is not de-
sirable. For example, addition of a single 30T residue to oligo-
nucleotides can interfere with supramolecular assembly of
DNA.18,19 In such cases, monitoring intrinsic DNA fluores-
cence to probe DNA structure would be advantageous.
Although the intrinsic fluorescence of DNA has not been
exploited previously for the characterization of G-quadru-
plexes, we reasoned that DNA sequences with runs of contig-
uous guanines should provide sufficient fluorescence signal
to monitor DNA structure.20 Native DNA has a low-quan-
tum yield,9 on the order of 1024 to 1025 compared with
strongly fluorescent dyes like fluorescein 0.95,21 Cy3 0.04,22
or tryptophan 0.13.21 Upper limits for the lowest excited sin-
glet lifetimes are 1 ps for the mononucleotides cytosine and
thymine and 10 ps for adenine and guanine.23 Some DNA
polymers have been reported to have excited-state lifetimes
of �100 ps and even upto 1 ns.14,24,25 The quantum yield of
polyG at room temperature in aqueous solution, however, is
4.7 3 1024, which makes it the native DNA sequence with
the highest intrinsic fluorescence.1 Excited-states generated
by UV-irradiation of short duplexes and hairpins containing
GC base pairs have been shown to decay more slowly than
their mononucleotide counterparts.26 The sequence d(G)20has been reported to have the highest average fluorescence
lifetime (11.3 ps) out of a series of single-stranded and
duplex oligonucleotides probed.27 On the basis of this infor-
mation, we demonstrate that emission from unmodified-oli-
gonucleotides can be used to expand our understanding of
the structure and properties of polymers rich in G, in partic-
ular, G-quadruplexes.
RESULTS
Emission Intensities
Our first step toward the implementation of emission spec-
troscopy to characterize unmodified G-quadruplexes was
evaluation of the feasibility of distinguishing the emission of
G-quadruplexes from homologous nonquadruplex forming
sequences. Figure 1 shows that the emission intensity of the
G4, G7, and G9 oligonucleotides increases as the number of
SCHEME 1 Four hydrogen-bonded guanines make a G-quartet plane (left); R is the sugar-phos-
phate backbone of DNA. Four d(TG4T) strands (different colors) form a G quadruplex that con-
tains four G-quartet planes (right, pdbid 352D, modified). The G quartet on the left is rotated 908compared with the boxed G-quartet on the right. Thymines in the structure on the right have been
removed for clarity.
FIGURE 1 Emission spectra of G4, G7, G9, G4na, G7na, G9na,
and 9G-1:9G-2 (duplex) in 10 mM KPi, 50 mM KCl, pH 7.0. The ol-
igonucleotide strand concentration was 30 lM; the duplex concen-
tration also was 30 lM so that the concentration of Gs was matched
to the G9 sample. Experiment was performed at room temperature,
excitation at 270 nm.
842 Mendez and Szalai
Biopolymers
adjacent Gs increases from four to seven to nine. This
increase is not due to the total number of guanines in the
sequence because the oligonucleotides G4na, G7na, and
G9na all have approximately the same emission intensity as
one another, even though these oligonucleotides also contain
four (G4na), seven (G7na), and nine (G9na) Gs. Note that
the emission intensity of these oligonucleotides is four-to-
five times lower than the emission intensity of their counter-
parts with adjacent Gs. The double-stranded DNA (9G-1:9G-
2) that contains nine randomly positioned Gs presents even
lower emission intensity than the single-stranded sequence
with nine Gs. These results encouraged us to proceed with
exploiting the observed increased emission intensity as a
means to characterize quadruplex structures.
Our next logical step was to explore whether the observed
increase in emission intensity was due exclusively to the pres-
ence of consecutive Gs in a sequence or the unique environ-
ment of these consecutive Gs in a G-quadruplex. We used the
oligonucleotides G3T28 and 4G in the absence and presence
of potassium ions to test this idea. The oligonucleotide G3T
forms an intermolecular quadruplex.28 The sequence 4G has
not been used previously as a G-quadruplex forming
oligonucleotide to the best of our knowledge, but several
sequences containing a GGGG repeat have been character-
ized and they form parallel-stranded intramolecular quadru-
plexes.29–32 Note that the oligonucleotides G4, G7, and G9
from Figure 1 are not suitable for testing the idea that quad-
ruplex formation is requisite for enhanced-emission intensity
because the single-stranded:quadruplex equilibrium favors
quadruplex for these sequences. We have observed that quad-
ruplexes formed by these sequences are very difficult to dis-
rupt by melting or other methods.33
The emission intensities of 4G and G3T samples that were
heated to 908C and allowed to cool slowly in the presence of
potassium were higher than the emission of matched samples
in water that were heated to 908C and immediately immersed
in ice to discourage quadruplex formation (Figures 2A and
3A). Circular dichroism (CD) spectra of these same samples
confirmed that quadruplex structures form in buffer contain-
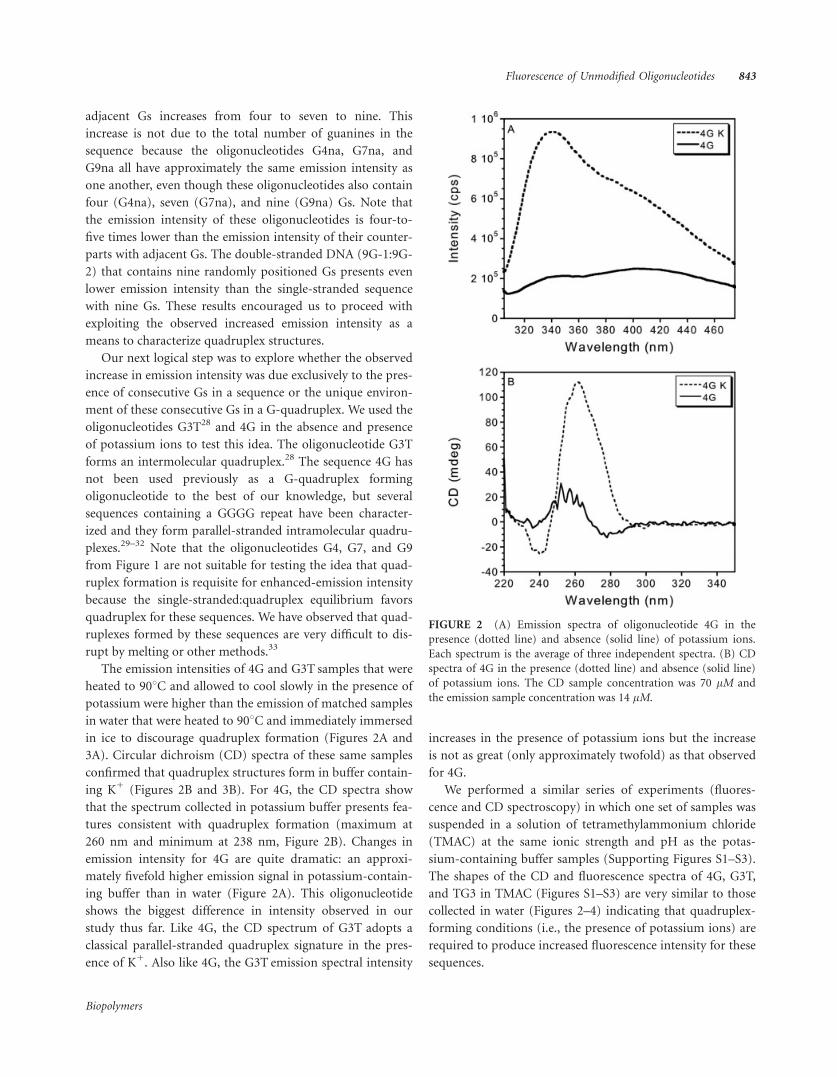
ing K1 (Figures 2B and 3B). For 4G, the CD spectra show
that the spectrum collected in potassium buffer presents fea-
tures consistent with quadruplex formation (maximum at
260 nm and minimum at 238 nm, Figure 2B). Changes in
emission intensity for 4G are quite dramatic: an approxi-
mately fivefold higher emission signal in potassium-contain-
ing buffer than in water (Figure 2A). This oligonucleotide
shows the biggest difference in intensity observed in our
study thus far. Like 4G, the CD spectrum of G3T adopts a
classical parallel-stranded quadruplex signature in the pres-
ence of K1. Also like 4G, the G3T emission spectral intensity
increases in the presence of potassium ions but the increase
is not as great (only approximately twofold) as that observed
for 4G.
We performed a similar series of experiments (fluores-
cence and CD spectroscopy) in which one set of samples was
suspended in a solution of tetramethylammonium chloride
(TMAC) at the same ionic strength and pH as the potas-
sium-containing buffer samples (Supporting Figures S1–S3).
The shapes of the CD and fluorescence spectra of 4G, G3T,
and TG3 in TMAC (Figures S1–S3) are very similar to those
collected in water (Figures 2–4) indicating that quadruplex-
forming conditions (i.e., the presence of potassium ions) are
required to produce increased fluorescence intensity for these
sequences.
FIGURE 2 (A) Emission spectra of oligonucleotide 4G in the
presence (dotted line) and absence (solid line) of potassium ions.
Each spectrum is the average of three independent spectra. (B) CD
spectra of 4G in the presence (dotted line) and absence (solid line)
of potassium ions. The CD sample concentration was 70 lM and
the emission sample concentration was 14 lM.
Fluorescence of Unmodified Oligonucleotides 843
Biopolymers

Quantum Yield
Using G9, the longest quadruplex-forming sequence in our
series, an upper limit on the quantum yield of quadruplexes
was determined to be 2.39 3 1024. This value was obtained
by comparison to the standard guanine in water, which
was secondarily calibrated to the standard 2,5-diphenyl-
oxazole.21 Plots of the integrated intensity of the fluorescence
vs. absorption required for calculation of the quantum yield
are presented in the Supporting Information (Figures S8
and S9).
Using Emission to Probe G-Rich DNA Structures
To develop emission of unmodified quadruplexes as a sensi-
tive structural probe, we next sought to correlate emission,
CD, and nondenaturing PAGE of the structurally uncharac-
terized sequence TG3. The emission spectra of TG3 with or
without K1 are very similar in shape and differ only slightly
in intensity (Figure 4) even though CD spectra indicate that
the structure has changed (Figure 4B). In fact, the CD spectra
of TG3 and G3T in K1 are very similar in shape and intensity
(Figure S4). The emission intensities in TMAC differ for the
two sequences, but the spectral shapes are similar (Figure
S4). The low signal to noise in the CD spectra, in particular
in TMAC, is because short oligonucleotides have low-CD
spectral intensities unless they form larger supramolecular
structures with extended helicity.34 The major difference
between the two sequences is the emission intensity in the
presence of added K1, which hints at structural differences
FIGURE 3 (A) Emission spectra of the oligonucleotide G3T in
the presence (dotted line) and absence (solid line) of potassium
ions. Each spectrum is the average of three independent spectra. (B)
CD spectra of G3T in the presence (dotted line) and absence (solid
line) of potassium ions. The CD sample concentration was 68 lM
and the emission sample concentration was 15 lM.
FIGURE 4 (A) Emission spectra of oligonucleotide TG3 in the
presence (dotted line) and absence (solid line) of potassium ions.
Each spectrum is the average of three independent spectra. (B) CD
spectra of TG3 in the presence (dotted line) and absence (solid line)
of potassium ions. The CD sample concentration was 67 lM and
the emission sample concentration was 13 lM.
844 Mendez and Szalai
Biopolymers

between the two sequences that CD spectroscopy does not
provide.
Next, we applied the thermal cycling protocol of
Krishnan-Ghosh et al. to both G3T and TG3. G3T forms an
interlocked quadruplex upon thermal cycling (Scheme 2),
but structures formed by TG3 have not been investigated.
After cycling in the presence of potassium, both sequences
produce emission spectra similar in shape and intensity
(Figures 5 and 6). The CD spectra of G3Tcyc and TG3cyc are
consistent with formation of parallel-stranded quadruplexes
(Figure S5). The emission spectra of G3Tcyc and TG3cyc are
most similar to spectra observed for the quadruplexes
formed by G7 or G10 (Figure 1), because they lack an
obvious shoulder at 390 nm. The emission spectrum of
G3Tcyc, which corresponds to a majority of the ‘‘interlocked’’
species in solution on the basis of our PAGE results (vide
infra) and previous NMR characterization,28 presents a max-
imum at �335 nm. In comparison, the spectrum of TG3cycpresents a maximum at 330 nm. Both cycled species display
emission spectra with higher intensities than spectra col-
lected after the exact same samples were heated to 958C and
subsequently cooled rapidly. The spectra of the annealed
samples also are broader. For G3Tcyc, the spectrum collected
after annealing and then slow cooling is the same as that col-
lected after a second annealing step followed by fast cooling.
In contrast, TG3cyc displays a difference in intensity following
the reannealing and cooling steps. The reheating and rapid
or slow cooling protocol was designed to disrupt the inter-
SCHEME 2 Proposed structures22 of the quadruplexes formed by
G3T (top) and G3Tcyc (bottom). The blue parallelogram represents
a G-quartet plane; green circles are thymines; blue circles are gua-
nines, the different shades (light and dark) indicate the two mono-
meric quadruplexes that have interlocked to create (G3T)8.
FIGURE 5 Emission spectrum of a sample of G3Tcyc in buffer
containing 10 mM KPi, 50 mM KCl, pH 7.0 (dotted line). Experi-
ment was performed at room temperature, excitation at 270 nm.
The strand concentration was 12 lM (absorbance of 0.15 in a
0.3 cm path length cuvette). The dashed line is a spectrum of the
cycled sample after heating to 958C, rapid cooling on ice, and equili-
bration to 48C for 24 h. The solid line is a spectrum of the same
sample after heating to 958C, slow cooling over 3 h, and equilibra-
tion to 48C for 24 h.
FIGURE 6 Emission spectrum of a sample of TG3cyc in buffer
containing 10 mM KPi, 50 mM KCl, pH 7.0 (dotted line). Experi-
ment was performed at room temperature, excitation at 270 nm.
The strand concentration was 13 lM (absorbance of 0.15 in a
0.3 cm path length cuvette. The dashed line is a spectrum of the
cycled sample after heating to 958C, rapid cooling on ice, and equili-
bration to 48C for 24 h. The solid line is a spectrum of the same
sample after heating to 958C, slow cooling over 3 h, and equilibra-
tion to 48C for 24 h.
Fluorescence of Unmodified Oligonucleotides 845
Biopolymers
locked quadruplex species formed by G3T (and potentially
TG3). The control sequence G4na has a much smaller emis-
sion intensity following thermal cycling than either G3T or
TG3 (Figure S6). To further explore the structures formed by
TG3 and G3T with and without thermal cycling, native poly-
acrylamide gel electrophoresis (PAGE) was employed.
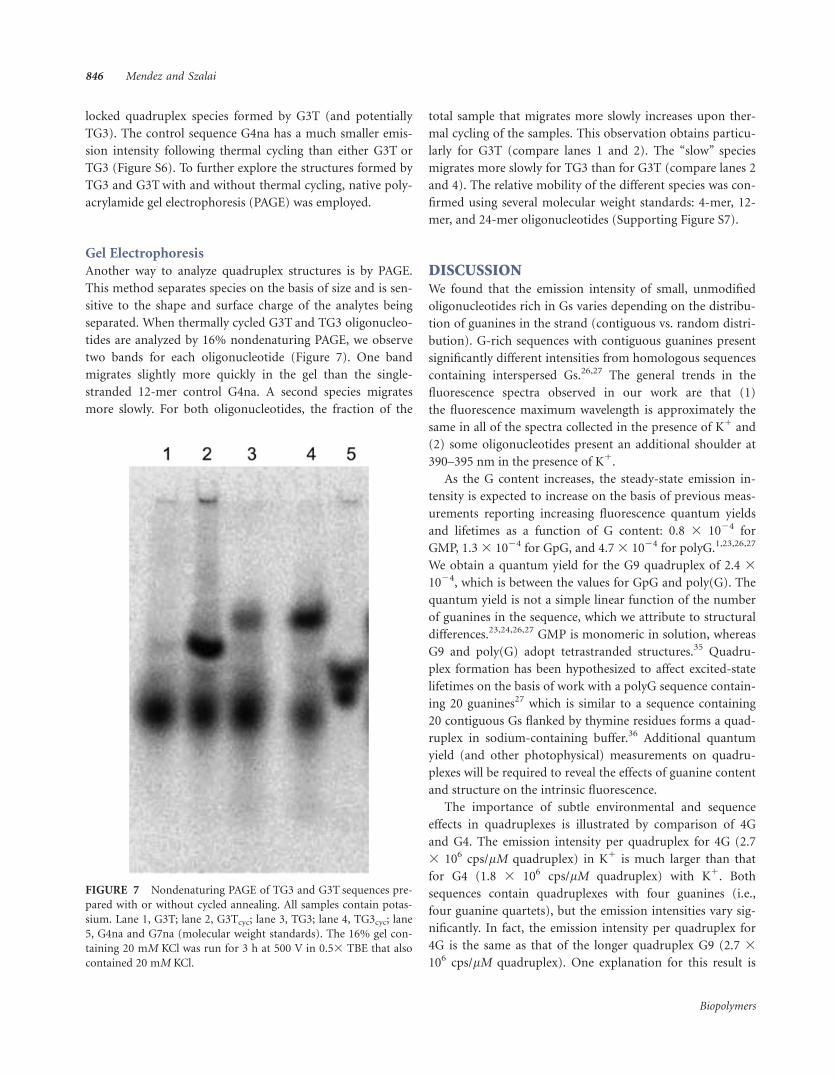
Gel Electrophoresis
Another way to analyze quadruplex structures is by PAGE.
This method separates species on the basis of size and is sen-
sitive to the shape and surface charge of the analytes being
separated. When thermally cycled G3T and TG3 oligonucleo-
tides are analyzed by 16% nondenaturing PAGE, we observe
two bands for each oligonucleotide (Figure 7). One band
migrates slightly more quickly in the gel than the single-
stranded 12-mer control G4na. A second species migrates
more slowly. For both oligonucleotides, the fraction of the
total sample that migrates more slowly increases upon ther-
mal cycling of the samples. This observation obtains particu-
larly for G3T (compare lanes 1 and 2). The ‘‘slow’’ species
migrates more slowly for TG3 than for G3T (compare lanes 2
and 4). The relative mobility of the different species was con-
firmed using several molecular weight standards: 4-mer, 12-
mer, and 24-mer oligonucleotides (Supporting Figure S7).
DISCUSSIONWe found that the emission intensity of small, unmodified
oligonucleotides rich in Gs varies depending on the distribu-
tion of guanines in the strand (contiguous vs. random distri-
bution). G-rich sequences with contiguous guanines present
significantly different intensities from homologous sequences
containing interspersed Gs.26,27 The general trends in the
fluorescence spectra observed in our work are that (1)
the fluorescence maximum wavelength is approximately the
same in all of the spectra collected in the presence of K1 and
(2) some oligonucleotides present an additional shoulder at
390–395 nm in the presence of K1.
As the G content increases, the steady-state emission in-
tensity is expected to increase on the basis of previous meas-
urements reporting increasing fluorescence quantum yields
and lifetimes as a function of G content: 0.8 3 1024 for
GMP, 1.33 1024 for GpG, and 4.73 1024 for polyG.1,23,26,27
We obtain a quantum yield for the G9 quadruplex of 2.4 3
1024, which is between the values for GpG and poly(G). The
quantum yield is not a simple linear function of the number
of guanines in the sequence, which we attribute to structural
differences.23,24,26,27 GMP is monomeric in solution, whereas
G9 and poly(G) adopt tetrastranded structures.35 Quadru-
plex formation has been hypothesized to affect excited-state
lifetimes on the basis of work with a polyG sequence contain-
ing 20 guanines27 which is similar to a sequence containing
20 contiguous Gs flanked by thymine residues forms a quad-
ruplex in sodium-containing buffer.36 Additional quantum
yield (and other photophysical) measurements on quadru-
plexes will be required to reveal the effects of guanine content
and structure on the intrinsic fluorescence.
The importance of subtle environmental and sequence
effects in quadruplexes is illustrated by comparison of 4G
and G4. The emission intensity per quadruplex for 4G (2.7
3 106 cps/lM quadruplex) in K1 is much larger than that
for G4 (1.8 3 106 cps/lM quadruplex) with K1. Both
sequences contain quadruplexes with four guanines (i.e.,
four guanine quartets), but the emission intensities vary sig-
nificantly. In fact, the emission intensity per quadruplex for
4G is the same as that of the longer quadruplex G9 (2.7 3
106 cps/lM quadruplex). One explanation for this result is
FIGURE 7 Nondenaturing PAGE of TG3 and G3T sequences pre-
pared with or without cycled annealing. All samples contain potas-
sium. Lane 1, G3T; lane 2, G3Tcyc; lane 3, TG3; lane 4, TG3cyc; lane
5, G4na and G7na (molecular weight standards). The 16% gel con-
taining 20 mM KCl was run for 3 h at 500 V in 0.53 TBE that also
contained 20 mM KCl.
846 Mendez and Szalai
Biopolymers

that 4G forms longer species via quadruplex-stacking. Quad-
ruplex stacking has been observed in crystal structures of
quadruplex sequences with three or four guanines that also
contain flanking bases.31,37–39 Such stacking will protect
more guanines from water, preventing solvent mediated
quenching pathways (dynamic quenching).
Another factor to consider is the dynamic nature of G-
rich oligonucleotides involving equilibration between single
stranded and quadruplex structural forms. For G4 and G7,
our previous mass spectrometry and gel electrophoresis
data33 indicate that the equilibrium almost completely favors
the G-quadruplex form ([95%). A small amount of single-
stranded oligonucleotide is observed, however, indicating
that single-stranded oligonucleotide fluorescence contrib-
utes. We would argue, however, that the majority of the fluo-
rescence we observe is due to quadruplexed, rather than sin-
gle-stranded, oligonucleotide on the basis of our experiments
in TMAC vs. potassium-containing solutions.
To further investigate the impact of an increasing number
of quadruplex stacks on fluorescence intensity using the
same sequence, we used the oligonucleotide G3T. This
sequence forms a simple ‘‘monomeric’’ quadruplex com-
posed of four strands and an ‘‘interlocked’’ species assembled
from eight strands (Scheme 2). Using this sequence tests if
there is a correlation between emission intensity and quadru-
plex extent (i.e., the number of quartet stacks in the quadru-
plex). As expected based on our results with the oligonucleo-
tides G4, G7, and G9, we observe differences in the emission
spectra of G3T in its monomeric (G3T with K1) and inter-
locked (G3Tcyc with K1) quadruplex forms. We speculate
that the differences observed in the emission spectra are due
to changes in the stacking interactions in these different
structures plus the contribution of more Gs being protected
from solvent in the interlocked form. Furthermore, we
probed the structurally uncharacterized sequence TG3. For
TG3, we observe very similar emission spectra following ther-
mal cycling that are consistent with the idea that TG3 forms
two quadruplex-containing species with or without thermal
cycling. These results suggest that emission spectroscopy cor-
relates with structure and can differentiate the effects of the
different temperature treatments. The features of the emis-
sion spectra as well as CD suggest that TG3 forms a larger
structure than a monomeric G-quadruplex, possibly with
similar geometry, but not identical to, the interlocked quad-
ruplex formed by G3T.
On the basis of the native PAGE results, G3Tcyc and
TG3cyc both form monomeric quadruplex and an interlocked
or extended quadruplex structure that migrates slowly. The
monomeric quadruplex is expected to run faster than a sin-
gle-stranded 12-mer because the quadruplex is structurally
more compact. The decreased mobility of the slowly migrat-
ing species for TG3cyc compared with G3Tcyc could be either
because the species has a larger molecular weight—which
seems unlikely—or because the structure is different. A struc-
tural difference also can explain why the emission spectra of
these two thermally cycled oligonucleotides are different.
The exact reason for the enhanced fluorescence observed
for quadruplex-forming oligonucleotides is not absolutely
clear because current understanding of the excited states and
electronic properties of complex macromolecules like DNA
is incomplete.23 The emission of DNA in its polymeric form
has been attributed to excimers that give rise to broad, fea-
tureless spectra like those we observe.23,40 We, therefore,
speculate that the main contributor to the emission observed
for our samples is a 1G*G excimer. On the basis of this
assignment, the sequence, base-stacking, and structural het-
erogeneity for each quadruplex structure is expected to
impact the excited-state and energy transfer properties of the
system with effects, ultimately, on the intensity of the steady-
state fluorescence spectrum.
There are several observations that show the importance
of base stacking for energy transfer between bases and its
effect on the DNA emission profile.1,23,24,26,27 Singlet energy
transfer between bases has been observed for photo-induced
electron transfer between guanine and 2-aminopurine (2AP),
a fluorescent analog of guanosine and adenosine, and
between guanine and 1,N6 ethenoadenine.41 In that case, it
was hypothesized that quenching of the fluorescent nucleo-
tide (2AP or 1,N6-ethenoadenine) depends on the extent of
stacking interaction of the fluorescent probe with flanking
bases. These authors observed that 1,N6 ethenoadenine was
not quenched as readily as 2AP, which was attributed to a
lower stacking interaction of 1,N6 ethenoadenine with G.
Another group found that energy transfer from bases to 2AP
was increased at low temperature.42 This phenomenon
occurs because decreasing the temperature reduces DNA
motion, and maximizes stacking interactions. These authors
observed that the sequence (GGGG[2AP]GGGG) displayed
the least temperature-dependent change in the intensity of
the 2AP excitation peak, which was explained as being due to
nonstacking electronic interactions. We propose, however,
that the lack of temperature dependence of the energy trans-
fer between G and 2AP could be explained if the sequence in
question forms a quadruplex, which is already somewhat
rigid. If the sequence forms a quadruplex, decreasing the
temperature should not change stacking interactions as
much as for the other single-stranded sequences investi-
gated.42 Our observations could thus be explained by
increased stacking favoring the formation of emissive static
excimer-like species that is increased when several Gs are
Fluorescence of Unmodified Oligonucleotides 847
Biopolymers

together without interrupting bases to block singlet energy
transfer.
In summary, we have shown that the emission intensity of
G-rich sequences with contiguous Gs is higher than for sin-
gle-stranded and double-stranded sequences lacking consec-
utive Gs. This observation allows us to monitor G-quadru-
plex structure using emission spectroscopy and reveal differ-
ences in the solution superstructure that cannot be easily
detected by UV absorbance or CD spectroscopy. As a result,
we envisage that emission can be used to characterize other
systems where use of unmodified oligonucleotides is critical
to conserve the native structure of G quadruplexes, in partic-
ular, under conditions where supramolecular structure for-
mation is mediated by quadruplex stacking interactions.
In addition to further work to determine contributions to
the fluorescence intensity, we are exploiting the emission
properties of untagged G-quadruplexes to evaluate ligand
binding.43
EXPERIMENTAL SECTION
MaterialsAll deoxyoligonucleotides were purchased from Midland Oligos
(Midland, TX). Oligonucleotides were resuspended in MilliQ water
(TOC 5 34 ppb or less, O 5 18.2 conductivity), ethanol precipi-
tated using a previously reported protocol, and resuspended in
MilliQ water.33 Alternatively, very short oligonucleotides with fewer
than five bases were directly resuspended in water without ethanol
precipitation. The strand concentration was determined using a
Jasco spectrophotometer V-560. The extinction coefficients for each
sequence (given in Table I) were obtained by the nearest neighbor
approximation method.44 Tetramethylethylenediamine, ammonium
persulfate, mercaptoethanol, magnesium chloride, potassium chlo-
ride, 2,5-diphenyloxazole (99%, scintillation grade), guanine
(991%), cyclohexane (spectrophotometric grade 991%) were sup-
plied by Acros (Morris Plains, NJ). Microcon centrifugal filter devi-
ces were purchased from Millipore Corporation (Bedford, MA).
MicroSpin G-50 Columns were ordered from GE Healthcare (Amer-
sham, UK). Solutions of 40% acrylamide–bisacrylamide in a 19:1
ratio were purchased from National Diagnostics (Atlanta, GA).
Tris(hydroxymethyl)aminomethane (Tris), boric acid, monobasic
and dibasic potassium phosphate were purchased from Fisher
(Pittsburgh, PA).
Emission SpectroscopyAll emission spectra are the sum of three scans with an integration
time of 0.5 s, an excitation and emission slit width of 5 nm, path
length 0.3 cm, collected in the range from 300 to 480 nm. The exci-
tation wavelength was 270 nm. The spectra were collected on a
Jobin-Yvon-Spex Fluorolog 3-11 fluorimeter or a Fluoromax-3 fluo-
rimeter. The instrument-specific photomultiplier tube correction
file supplied by the manufacturer was applied to all spectra.
For spectra of samples with potassium, oligonucleotides G4, G7,
G9, G4na, G7na, G9na (30 lM strand concentration), and double-
stranded DNA (9G-1:9G-2, 30.0 lM duplex concentration) were
suspended in buffer containing 10 mM KPi and 50 mM KCl,
pH 7.0. The duplex contains the same number of guanines as the
G9 oligonucleotide.
To test if a change in the supramolecular structure of G rich oli-
gonucleotides has an effect on the emission spectra, we prepared
matched oligonucleotide samples (G3T, TG3, 4G) with and without
added potassium. G-quadruplex formation is favored in the pres-
ence of monovalent cations such as potassium.6,45,46 Samples for
emission spectroscopy had an absorbance of �0.15 in a 0.3 cm path
length cuvette. Samples were prepared either in 10 mM KPi, 50 mM
KCl, pH 7.0, or in deionized water. CD spectra also were collected,
but for these samples, the absorbance was 0.8 in a 0.3 cm path
length cuvette. A total volume of 300 lL was used for each sample.
Samples with and without added K1 were heated to 908C for 10
min. The sample with potassium was cooled to room temperature
over �3 h. The sample in water was placed on ice for 5 min and
then stored at 48C. This rapid-cooling procedure was used to mini-
mize quadruplex formation. Both sets of samples were equilibrated
to room temperature immediately before collection of the emission
and CD spectra (vide infra). Samples were placed in a 0.3 cm quartz
cuvette and emission spectra were collected with the parameters
previously described. Spectra were collected in triplicate and multi-
ple times for all samples.
Comparison of the Emission of Different
G-Quadruplex StructuresSamples of the deoxyoligonucleotides G3T and TG3 were prepared
using several protocols to induce different structures. The first
method applied was temperature cycling. The interlocked quadru-
plex formed by G3T was prepared using the protocol described by
Krishnan-Ghosh et al.28 In brief, lyophilized deoxyoligonucleotide
G3T was resuspended in buffer 10 mM KPi, 50 mM KCl, pH 7.0 to
give a concentration of �500 lM strand. The sample was heated at
558C for 16 h, then cooled to 308C, and reheated to 558C three
times at a rate of 0.58C/min in a thermal cycler (Eppendorf Master-
Table I Abbreviations, Sequences, and Extinction Coefficients
of Deoxyoligonucleotides
Abbreviation Sequence
Nearest
Neighbor
e (mM21 cm21)
G4na 50TTGTGTGTGATT30 112.7
G7na 50TGTGTGTGTGTGAGT30 144.8
G9na 50TGGTGTGTGTGATGTGTG30 173.3
G4 50TTTTGGGGTTTT30 106.4
G7 50TTTTGGGGGGGTTTT30 136.7
G9 50TTTTGGGGGGGGGTTTT30 156.9
9G-1 50GATGAGAGTTAGTGATGAGTG30 222.7
9G-2 50CACTCATCACTAACTCTCATC30 190.2
G3T 50GGGT30 40.2
TG3 50TGGG30 39.2
4G 50GGGG30 41.8
848 Mendez and Szalai
Biopolymers

cycler). Samples were cooled to 108C at a rate of 0.58C/min and
equilibrated at 58C for 24 h. The same protocol was applied to the
TG3 oligonucleotide, the structure of which has not been examined
following thermal cycling. The control oligonucleotide G4na, a
sequence that does not form quadruplexes, also was submitted to
the same procedure. Samples prepared by thermal cycling are la-
beled G3Tcyc, TG3cyc, and G4nacyc throughout the text. For emission
spectra, the stock solutions of G3Tcyc, TG3cyc, and G4nacyc were
diluted with the appropriate amount of buffer to give an absorbance
of 0.15 in a 0.3 cm path length cuvette. The samples for emission
spectroscopy were further subjected to two sequential procedures
that were expected to change the suprastructure. Emission spectra
were collected after each of the procedures. First, the samples were
heated to 958C, cooled slowly over 2 h, and equilibrated to 48C for
24 h. Then, the same samples were heated to 958C and cooled
quickly by immersion on ice followed by equilibration at 48C for
24 h before collection of the emission spectra.
Quantum Yield MeasurementsThe following protocol was followed to cross calibrate the standards
and later to derive the quantum yield of G9. UV-vis absorbance
spectra were collected of the solvent background (cyclohexane for
2,5-diphenyloxazole or water for guanine), and of the sample in a
1 cm path length cuvette. Due to the low concentrations of 2,5-
diphenyloxazole required ensure that the emission intensity was
within the linear range of the Jobin-Yvon-Spex Fluorolog 3-11 fluo-
rimeter, the absorption spectrum of only the stock solution was
measured. Samples for the quantum yield measurements were pre-
pared by serial dilution of the stock to generate the low absorbances
required. Cyclohexane was purged with nitrogen before dissolution
of 2,5-diphenyloxazole. Guanine was directly dissolved in MilliQ
water rather than buffer as a means to minimize external variables
and to be able to cross compare our values with those reported by
Danies and Hauswirth.47 The fluorescence spectrum of at least three
samples was collected at every concentration. All spectra were cor-
rected using the correction file for the instrument, the solvent spec-
trum was subtracted, and an average of at least three spectra was used
to calculate final values. Fluorescence spectra were integrated to obtain
areas and a plot of integrated fluorescence intensity vs. absorbance
was generated. Data were fit with linear least squares regression
method, with the intercept fixed at 0, to obtain the gradient [Grad in
Eq. (1)]. The quantum yield was estimated using the equation:
uX ¼ uST
GradX
GradST
� �g2Xg2ST
� �ð1Þ
where uX is the quantum yield of the unknown, uST is the quantum
yield of the standard, gX and gST are the refractive indices of the sol-vents for the unknown (X) and standard (ST) samples, GradX and
GradST are the slopes of the integrated-fluorescence intensity vs. ab-
sorbance plots for the unknown and standard, in that order. We
cross-calibrated the guanine to 2,5-diphenyloxazole and then did a
reverse cross-calibration (i.e., 2,5-diphenyloxazole as the standard
and guanine as the unknown). For the quantum yield spectral col-
lection, the following parameters were used: excitation bandwidth 5
nm, emission bandwidth 5 nm (the same bandwidth was used for
the absorbance spectra), integration time of 0.1 s. Samples were
excited at 275.5 nm to match the conditions in Daniels and Haus-
wirth.47 The quantum yield of G9 was measured in 10 mKPi, 50
mM KCl buffer, pH 7.2.
Circular Dichroism SpectroscopyCD spectroscopy is a useful means to detect and characterize paral-
lel vs. antiparallel quadruplexes.48 CD spectra were collected at
room temperature using a Jasco J-715 spectropolarimeter coupled
to a Dell Optiplex GX110 personal computer for data collection.
Quartz cuvettes with path lengths of 0.3 or 1.0 cm (Starna, Atasca-
dero, CA) were used. Each spectrum is the average of three scans
and the spectrum for the blank was subtracted from this average.
The spectra were collected with the following conditions: response
0.5 s, bandwidth 1 nm, and speed 200 nm min21.
The concentration of stock solutions was verified spectrophoto-
metrically before each experiment. Stock solutions were vortexed
and then centrifuged at 15,000 rcf in an Eppendorf microcentrifuge
for 5 s. The concentration of DNA in the supernatant was deter-
mined by UV absorption at 260 nm. This protocol was adopted
because we noticed that the oligonucleotides G3T, TG3, and 4G
tend to aggregate into insoluble species at high concentration. CD
spectra of G3T, TG3, 4G, and G4na oligonucleotides prepared in
water or in buffer with and without temperature cycling were col-
lected. An appropriate amount of the lyophilized oligonucleotide
that had been resuspended in MilliQ water was used to make sam-
ples for CD spectroscopy. Samples labeled ‘‘cyc’’ were prepared by
combining the appropriate volume of the previously cycled oligonu-
cleotide stock solution with 100 mM KPi, 500 mM KCl, pH 7.0
buffer, and MilliQ water to give the desired final concentration of
DNA in water or in pH 7.0 buffer with final concentrations of
10 mM KPi, 50 mM KCl.
General 32P-Radiolabeling and Polyacrylamide
Gel ElectrophoresisOligonucleotides were gel-purified and 32P-radiolabeled with
[c-32P] ATP (10 mCi mL21, PerkinElmer Life Sciences, Boston,
MA) using T4 polynucleotide kinase (Invitrogen, Carlsbad, CA) as
previously described.49 The following changes were introduced in
the 32P labeling protocol to improve labeling efficiency of G-quad-
ruplex-forming sequences. A volume of 1 lL of a 5 lM oligonucleo-
tide solution was added to 2 lL modified forward reaction buffer
(350 mM Tris-HCl (pH 7.6), 50 mM MgCl2, 5 mM 2-mercaptoetha-
nol), and 3 lL of MilliQ water. The sample was heated to 908C for
5 min and chilled on ice for 5 min before addition of T4 poly-
nucleotide kinase and c-32P-ATP. Samples were applied to a Micro-
Spin G-50 Column according to the manufacturer’s directions and
the filtrate (�50 lL) was ethanol precipitated by adding 10 lL of
5M ammonium acetate and 500 lL ethanol. After removal of the
supernatant, oligonucleotide pellets were air dried—rather than
dried in a speed-vacuum system—to aid resuspension in gel-loading
buffer. The samples for gel electrophoresis were prepared by mixing32P-radiolabeled oligonucleotide with unlabeled oligonucleotide to
give a final concentration of 500 lM strand. The noncycled controls
were prepared by heating them to 908C for 5 min and cooling them
quickly to 48C using the thermocycler. Cycled radiolabeled oligonu-
cleotides were prepared by combining 32P-labeled oligonucleotide
with unlabeled oligonucleotide to give a final concentration 500 lM
strand and submitting the mixture to the temperature cycling
Fluorescence of Unmodified Oligonucleotides 849
Biopolymers

protocol described previously. Nondenaturing polyacrylamide gel
electrophoresis (PAGE) was performed on 16% polyacrylamide gels
containing 20 mM KCl and run in 0.53 Tris-borate-ethylenediami-
netetraacetic acid (TBE) buffer containing 20 mM KCl.33 TBE
(103) contains 0.89M Tris, 20 mM Na2EDTA, and 0.89M boric
acid, pH 8.3. Gel electrophoresis was performed at 48C for 2–3 h at
500 V. Gels were wrapped in plastic wrap and placed on a phosphor
screen, exposed from 30 min–1 h for quantification of band inten-
sities, scanned on an Amersham Biosciences Typhoon 9200 instru-
ment, and analyzed using Image QuaNTTM software. A slightly dif-
ferent protocol was used for 32P-radiolabeling of oligonucleotide
used for the gel in Figure S7. This protocol is described in the Sup-
porting Information.
REFERENCES1. Callis, P. R. Annu Rev Phys Chem 1983, 34, 329–357.
2. Kikin, O.; D’Antonio, L.; Bagga, P. S. Nucleic Acids Res 2006,
34, W676–W682.
3. Wieland, M.; Hartig, J. S. Chem Biol 2007, 14, 757–763.
4. Neidle, S.; Parkinson, G. N. Biochimie 2008, 90, 1184–1196.
5. Alberti, P.; Bourdoncle, A.; Sacca, B.; Lacroix, L.; Mergny, J.-L.
Org Biomol Chem 2006, 4, 3383–3391.
6. Miyoshi, D.; Karimata, H.; Wang, Z.-M.; Koumoto, K.; Sugi-
moto, N. J Am Chem Soc 2007, 129, 5919–5925.
7. Kotlyar, A. B.; Borovok, N.; Molotsky, T.; Cohen, H.; Shapir, E.;
Porath, D. Adv Mater 2005, 17, 1901–1905.
8. Kimura, T.; Kawai, K.; Fujitsuka, M.; Majima, T. Tetrahedron
2007, 63, 3585–3590.
9. Lakowicz, J. R.; Shen, B.; Gryczynski, Z.; D’Auria, S.; Gryczyn-
ski, I. Biochem Biophys Res Commun 2001, 286, 875–879.
10. Ramsay, G. Nat Biotechnol 1998, 16, 40–44.
11. Goel, G.; Kumar, A.; Puniya, A.; Chen, W.; Singh, K. J Appl
Microbiol 2005, 99, 435–442.
12. Stojanovic, M. N.; de Prada, P.; Landry, D. W. J Am Chem Soc
2001, 123, 4928–4931.
13. Radi, A. E.; Acero Sanchez, J. L.; Baldrich, E.; O’Sullivan, C. K.
J Am Chem Soc 2006, 128, 117–124.
14. Huang, W.; Tanaka, H.; Ogawa, T. J Phys Chem C 2008, 112,
11513–11526.
15. Wiederholt, K.; McLaughlin, L. W. Nucleic Acids Res 1999, 27,
2487–2493.
16. Green, J. J.; Ladame, S.; Ying, L.; Klenerman, D.; Balasubrama-
nian, S. J Am Chem Soc 2006, 128, 9809–9812.
17. Ying, L.; Green, J. J.; Li, H.; Klenerman, D.; Balasubramanian, S.
Proc Natl Acad Sci USA 2003, 100, 14629–14634.
18. Lu, M.; Guo, Q.; Kallenbach, N. R. Biochemistry 1992, 31,
2455–2459.
19. Green, J. J.; Ying, L.; Klenerman, D.; Balasubramanian, S. J Am
Chem Soc 2003, 125, 3763–3767.
20. Markovitsi, D.; Gustavsson, T.; Sharonov, A. Photochem Photo-
biol 2004, 79, 526–530.
21. Lakowicz, J. R. Principles of Fluorescence; Kluwer Academic/
Plenum: New York, 1999.
22. Mujumdar, R. B.; Ernst, L. A.; Mujumdar, S. R.; Lewis, C. J.;
Waggoner, A. S. Bioconjug Chem 1993, 4, 105–111.
23. Crespo-Hernandez, C. E.; Cohen, B.; Hare, P. M.; Kohler, B.
Chem Rev 2004, 104, 1977–2019.
24. Crespo-Hernandez, C. E.; Kohler, B. J Phys Chem B 2004, 108,
11182–11188.
25. Markovitsi, D.; Sharonov, A.; Onidas, D.; Gustavsson, T. Chem
Phys Chem 2003, 4, 303–305.
26. Crespo-Hernandez, C. E.; de La Harpe, K.; Kohler, B. J Am
Chem Soc 2008, 130, 10844–10845.
27. Schwalb, N. K.; Temps, F. Science 2008, 322, 243–245.
28. Krishnan-Ghosh, Y.; Liu, D.; Balasubramanian, S. J Am Chem
Soc 2004, 126, 11009–11016.
29. Stefl, R.; Cheatham, T. I.; Spackova, N.; Fadrna, E.; Berger, I.;
Koca, J.; Sponer, J. Biophys J 2003, 85, 1787–1804.
30. Sen, D.; Gilbert, W. Nature 1988, 334, 364–366.
31. Phillips, K.; Dauter, Z.; Murchie, A. I. H.; Lilley, D. M. J.; Luisi,
B. J Mol Biol 1997, 273, 171–182.
32. Aboul-ela, F.; Murchie, A. I.; Lilley, D. M. Nature 1992, 360,
280–282.
33. Evans, S. E.; Mendez, M. A.; Turner, K. B.; Keating, L. R.;
Grimes, R. T.; Melchoir, S.; Szalai, V. A. J Biol Inorg Chem
2007, 12, 1235–1249.
34. Fasman, G. D. Circular Dichroism and the Conformational
Analysis of Biomolecules; Plenum Press: New York, 1996.
35. Arnott, S.; Chandrasekaran, R.; Martilla, C. M. Biochem J 1974,
141, 537–543.
36. Ren, J.; Chaires, J. B. Biochemistry 1999, 38, 16067–16075.
37. Laughlan, G.; Murchie, A. I. H.; Norman, D. G.; Moore, M. H.;
Moody, P. C. E.; Lilley, D. M. J.; Luisi, B. Science 1994, 265,
520–524.
38. Parkinson, G. N.; Lee, M. P. H.; Neidle, S. Nature 2002, 417,
876–880.
39. Parkinson, G. N.; Ghosh, R.; Neidle, S. Biochemistry 2007, 46,
2390–2397.
40. Eisinger, J.; Shulman, R. G. Science 1968, 161, 1311–1319.
41. Kelley, S. O.; Barton, J. K. Science 1999, 283, 375–381.
42. Xu, D.-G.; Nordlund, T. M. Biophys J 2000, 78, 1042–1050.
43. Mendez, M. A.; Szalai, V. A. Abstr Pap Am Chem Soc 2008,
INOR-167.
44. Borer, P. N. In Handbook of Biochemistry and Molecular Biol-
ogy; Fasman, G., Ed.; CRC Press: Cleveland, 1975; p 589.
45. Wang, Y.; Patel, D. J. Biochemistry 1992, 31, 8112–8119.
46. Gu, J.; Leszczynski, J. J Phys Chem A 2002, 106, 529–532.
47. Daniels, M.; Hauswirth, W. Science 1971, 171, 675–677.
48. Nagatoishi, S.; Tanaka, Y.; Tsumoto, K. Biochem Biophys Res
Commun 2007, 352, 812–817.
49. Szalai, V. A.; Thorp, H. H. J Am Chem Soc 2000, 122, 4524–4525.
Reviewing Editor: Nils Walter
850 Mendez and Szalai
Biopolymers
Copyright © 2022 FDOKUMEN


![Solution Structure of the Na+ form of the Dimeric Guanine Quadruplex [d(G3T4G3)]2](https://static.fdokumen.com/doc/165x107/6318f44265e4a6af370f95cf/solution-structure-of-the-na-form-of-the-dimeric-guanine-quadruplex-dg3t4g32.jpg)