A theoretical and experimental kinetic study of phenyl radical addition to butadiene
Fluorescence Efficiency and Visible Re-emissionSpectrum of Tetraphenyl Butadiene Films at Extreme
Ultraviolet Wavelengths
V. M. Gehmana,∗, S. R. Seiberta,b,∗∗, K. Rielagea, A. Himea, Y. Sunc, D.-M.Meic, J. Maassend, D. Moored
aLos Alamos National Laboratory, Los Alamos, NM 87545bUniversity of Pennsylvania, Philadelphia, PA 19104cUniversity of South Dakota, Vermillion SD 57069
dDakota State University, Madison, SD 57042
Abstract
A large number of current and future experiments in neutrino and dark mat-ter detection use the scintillation light from noble elements as a mechanism formeasuring energy deposition. The scintillation light from these elements is pro-duced in the extreme ultraviolet (EUV) range, from 60–200 nm. Currently, themost practical technique for observing light at these wavelengths is to surroundthe scintillation volume with a thin film of Tetraphenyl Butadiene (TPB) to actas a fluor. The TPB film absorbs EUV photons and reemits visible photons,detectable with a variety of commercial photosensors. Here we present a mea-surement of the re-emission spectrum of TPB films when illuminated with 128,160, 175, and 250 nm light. We also measure the fluorescence efficiency as afunction of incident wavelength from 120 to 250 nm.
Keywords: Noble gasses; Scintillation light; Ultraviolet photons; Dark matter;neutrinos
1. Introduction and Motivation
Detecting the scintillation light from liquid noble elements (“noble liquids”)is an important component of several large experimental programs engaged inefforts to directly detect dark matter[2–4] as well as neutrinos from both theSun[5] and accelerator beam-lines[6–8]. Liquid noble elements have a numberof characteristics that make their use as scintillators very attractive. They havegood stopping power compared to other liquid scintillators, with densities be-tween 1.2 and 3.1 g/cm3[1]. Their scintillation yield is also very high, typically
∗Corresponding author: [email protected]∗∗Corresponding author: [email protected]
Preprint submitted to Elsevier April 19, 2011
arX
iv:1
104.
3259
v1 [
astr
o-ph
.IM
] 1
6 A
pr 2
011
tens of photons per keV[9] (similar to that of NaI[10]). The time structure ofscintillation light from the noble elements also offers excellent particle identifi-cation capability, a property that will be discussed in Section 2.1. Lastly, nobleliquids are essentially transparent to their own scintillation light, eliminatingthe need to dissolve fluors directly into the scintillation volume, as is the casewith most organic liquid scintillators[11].
The primary difficulty in using noble elements as a scintillator comes notfrom the cryogenics required to keep them in a liquid state, but from the chal-lenges of efficiently detecting the short wavelength scintillation light. Nobleelements scintillate in the extreme ultraviolet (EUV) wavelength range. Mostcurrent interest in the community involves xenon and argon, which have scintil-lation emission spectra ranging from roughly 120 to 200 nm. As such, the bulkof the work presented in this article will focus on this wavelength band. Thereis also interest in using neon[5] and helium[12, 13] as scintillators, both of whichemit scintillation light at much shorter wavelengths, from 60 to 100 nm.
The detection of EUV photons is a very challenging problem. Their wave-length is short enough that they are strongly absorbed by nearly all materialsused for visible optics, such as the quartz or glass windows of photomultipliertubes, but they are not energetic enough to be treated calorimetrically like xrays or γ rays. This obstacle can be side-stepped by down-scattering EUV pho-tons into the visible wavelength band with a fluor. One very common techniqueis to coat a surface in contact with the noble element with a thin film of theorganic compound tetra-phenyl butadiene (TPB). This article will explore theefficiency with which a TPB film converts EUV to visible photons as well asthe spectrum of the re-emitted photons as a function of the wavelength of theabsorbed EUV photons.
We will begin Section 2 with a discussion of noble element scintillation. Wewill present a summary of previous measurements involving TPB films, includ-ing both the fluorescence efficiency and the visible re-emission spectrum. Wewill also discuss how previous noble element scintillation detectors avoided theproblem of the large uncertainty on both of these quantities. Section 3 willdiscuss the experimental apparatus used for this study, with special attentionpaid to the improvements made over previous measurements. Section 4 willdetail our measurements of the TPB visible re-emission spectrum as a functionof input wavelength, and Section 5 will present our fluorescence efficiency mea-surements. Last, we will draw some conclusions from this work and discuss ourplans for future measurements in Section 6.
2. Previous Measurements
2.1. Noble Element Scintillation
As discussed above, noble elements are transparent to their own scintillationlight, unlike organic scintillators. This is due to the somewhat unusual way inwhich scintillation occurs in noble elements. This is discussed in detail in [14].Rather than simply exciting an atomic or molecular state which then emits
2

light as it relaxes to the ground state, scintillation in noble elements is actuallyproduced by the de-excitation of dimer molecules formed from combinations ofexcited or ionized atoms and a ground state atom. This scintillation light hastwo components arising from two different states: a short-lived, singlet state,and a long-lived, triplet state. The lifetime difference comes from whether thenoble atom in question is ionized or simply excited when it forms the dimermolecule. Dimers formed from an excited atom can decay very quickly with atypical lifetime of > 10 ns. Ionized dimers, on the other hand, must recombinewith a nearby electron before the dimer state can decay. This dramaticallyincreases the lifetime of the dimer to microseconds or longer. Because the scin-tillation light corresponds to a transition in a temporary dimer state, there isno corresponding transition in the surrounding monoatomic medium to absorbphotons once produced. As a result, these scintillation photons have a very longpath length in the bulk liquid, making noble elements essentially transparentat their scintillation wavelengths. Figure 1 shows the scintillation spectra ofall five noble elements along with the percent transmittance of several commonoptical window materials. The data presented in Figure 1 are reproduced fromReferences [15–18]. Each spectrum has been normalized to unit area to facilitatecomparison of their shapes.
Wavelength [nm]80 100 120 140 160 180
]-1
Scin
tilla
tion
Pro
babi
lity
Den
sity
[nm
0.02
0.04
0.06
0.08
0.1
0.12
Tra
nsm
itta
nce
[%]
10
20
30
40
50
60
70
80
90Helium Scint. Trans.
2MgF
Neon Scint. Sapphire Trans.
Argon Scint. Synth. Sil. Trans.
Krypton Scint. UVT Glass Trans.
Xenon Scint.
Figure 1: Left axis/solid lines: scintillation spectra for helium (reproduced from [15]), neon(reproduced from [16]), argon, krypton and xenon (reproduced from [17]). Right axis/dottedlines: percent transmittance of several common optical window material (reproduced from[18, Figure 4.5]).
3
2.2. TPB Re-emission Spectrum
Several measurements of the visible re-emission spectrum of TPB films havebeen made[19, 20]. However, the TPB was excited with UV sources at 253.7 nm[20] and 185 nm [19], which are both longer wavelength than the scintillationspectrum of argon, neon, and helium. Furthermore, the spectra measured inthese references are quite different, leading to the possibility of a significantdependence on the input EUV wavelength or the details of the TPB depositionmethod. Rather than use one of these existing measurements of the re-emissionspectrum as an input to the fluorescence efficiency measurement, we directlymeasured the re-emission spectrum of our TPB samples using several excitationwavelengths from 128 nm to 250 nm.
2.3. TPB Fluorescence Efficiency
There have also been several measurements of the fluorescence efficiency ofTPB films. Reference [20] measured this efficiency relative to sodium salicylate,for several TPB coating thicknesses from about 100 to above 300 nm. To con-vert this to an absolute efficiency, one requires the absolute efficiency of sodiumsalicylate. Reference [20] refers its readers to Reference [22, Table 7.1] for theseefficiency numbers. Unfortunately, the absolute efficiency numbers in [22, Table7.1] differ by more than a factor of three. Reference [23] also measures the fluo-rescence efficiency of TPB along with several other fluors, but does so at muchshorter wavelengths, ranging from 0.989 to 6.76 nm. The uncertainties of theefficiencies measured in Reference [23] are quite good compared to most others,at roughly 25%. TPB represents a significant improvement over other fluors(like sodium salicylate) because it can be applied to a substrate via vacuumdeposition rather than by wet-dipping a slide. This dramatically enhances filmreproducibility as allowing for cleaner application of the wavelength shifter. Thisis particularly important in low-background applications like direct dark matterdetection, where the low levels of naturally occurring uranium and thorium canserve to obscure the signal of interest.
3. Experimental Apparatus
Our experimental apparatus consists of three stages: an EUV light source,a filter wheel with several 2.5 cm diameter acrylic sample disks, and then oneof two photon sensors. A diagram of the experimental apparatus can be foundin Figure 2. In the first configuration, light was observed by a UV/visible spec-trometer, and in the second configuration, a calibrated, silicon photodiode cellwas installed. In order to minimize the effect of attenuation on our sensitivity,the entire space from the exit window of the deuterium lamp to the photonsensor was kept at a very low pressure, never exceeding 2.5× 10⁻⁶ mBar. Thevacuum space also included the entire filter wheel assembly, and the photonsensor. Additionally, in the first configuration, the spectrometer was coupled tothe vacuum space through a collimating lens and fiber feedthrough.
4

Deuterium Lamp
MgF2 Window
Focusing Mirror
Diffraction GratingEntrance Slit
Exit Slit
Filter WheelPhoton Sensor
Under Vacuum
TPB Film
Figure 2: Diagram of the experimental apparatus. The parts of apparatus shaded gray areunder vacuum. The deuterium arc lamp is separated from the rest of the light source by aMgF2 window, and the TPB film was evaporated onto the side of the sample disc facing themonochromator.
3.1. Light Source
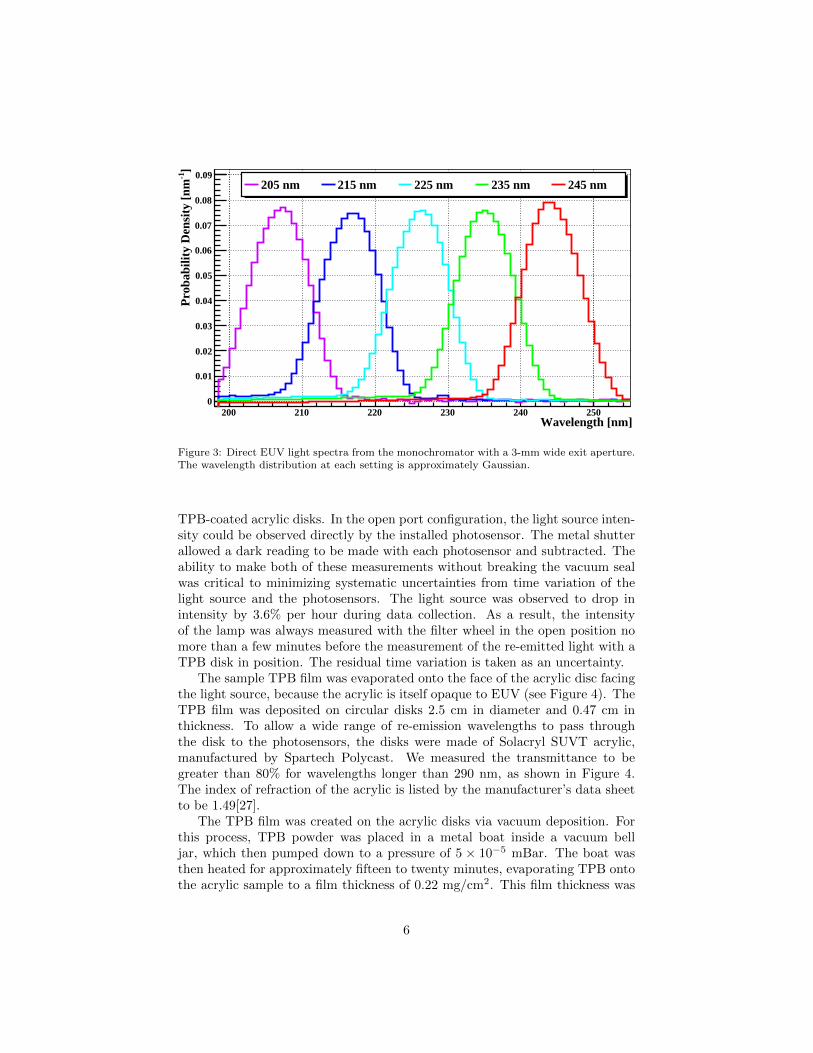
The light source used in our measurement was a Model 632 Deuterium Lightsource, combined with a Model 234/302VM 0.2-Meter EUV Monochromatorfrom McPherson, Inc. This light source has strong peaks at 128 nm and 160nm, with a long high-wavelength tail that extends up to approximately 250nm. The MgF2 window separating the deuterium arc lamp from the rest ofthe light source means that the intensity of the lamp cuts off at 110 nm (seeFigure 1 for the transmittance of MgF2 as a function of wavelength). Themonochromator was built around a 1200 G/mm holographic diffraction grating,which is rotated with respect to the instrument’s entrance and exit slits to selectspecific wavelengths. Both slits are 10 mm high, and have adjustable widthsfrom 0.01 mm to 3 mm. We took data for all measurements with the entranceand exit slits set to 3 mm to maximize the light output of our system. Thereis a range from 205 nm to 245 nm where our visible spectrometer is sensitiveto the direct light from the lamp (see Figure 3). In this range, we measure thefull-width, half-maximum resolution of the monochromator to be 8.5 ± 0.5 nmfor our slit configuration, after subtracting the resolution of the spectrometeritself. We use this for our estimate of the monochromator resolution at allwavelengths.
3.2. Filter Wheel and TPB Samples
After leaving the exit slit of the light source, the monochromatic light en-tered a Model 648 Vacuum Filter Wheel, also from McPherson. This allowed forselection between an open port, a fully absorbing metal shutter or one of several
5
Wavelength [nm]200 210 220 230 240 250
]-1
Pro
babi
lity
Den
sity
[nm
0
0.01
0.02
0.03
0.04
0.05
0.06
0.07
0.08
0.09205 nm 215 nm 225 nm 235 nm 245 nm
Figure 3: Direct EUV light spectra from the monochromator with a 3-mm wide exit aperture.The wavelength distribution at each setting is approximately Gaussian.
TPB-coated acrylic disks. In the open port configuration, the light source inten-sity could be observed directly by the installed photosensor. The metal shutterallowed a dark reading to be made with each photosensor and subtracted. Theability to make both of these measurements without breaking the vacuum sealwas critical to minimizing systematic uncertainties from time variation of thelight source and the photosensors. The light source was observed to drop inintensity by 3.6% per hour during data collection. As a result, the intensityof the lamp was always measured with the filter wheel in the open position nomore than a few minutes before the measurement of the re-emitted light with aTPB disk in position. The residual time variation is taken as an uncertainty.
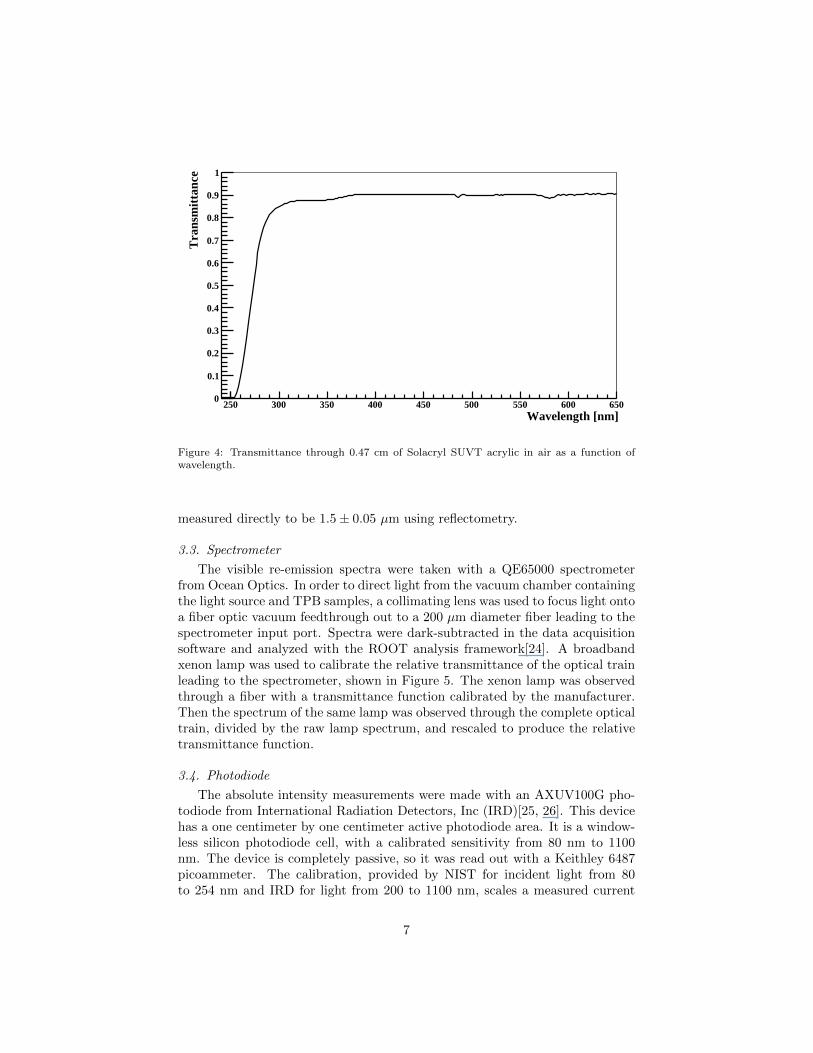
The sample TPB film was evaporated onto the face of the acrylic disc facingthe light source, because the acrylic is itself opaque to EUV (see Figure 4). TheTPB film was deposited on circular disks 2.5 cm in diameter and 0.47 cm inthickness. To allow a wide range of re-emission wavelengths to pass throughthe disk to the photosensors, the disks were made of Solacryl SUVT acrylic,manufactured by Spartech Polycast. We measured the transmittance to begreater than 80% for wavelengths longer than 290 nm, as shown in Figure 4.The index of refraction of the acrylic is listed by the manufacturer’s data sheetto be 1.49[27].
The TPB film was created on the acrylic disks via vacuum deposition. Forthis process, TPB powder was placed in a metal boat inside a vacuum belljar, which then pumped down to a pressure of 5 × 10⁻⁵ mBar. The boat wasthen heated for approximately fifteen to twenty minutes, evaporating TPB ontothe acrylic sample to a film thickness of 0.22 mg/cm2. This film thickness was
6
Wavelength [nm]250 300 350 400 450 500 550 600 650
Tra
nsm
itta
nce
0
0.1
0.2
0.3
0.4
0.5
0.6
0.7
0.8
0.9
1
Figure 4: Transmittance through 0.47 cm of Solacryl SUVT acrylic in air as a function ofwavelength.
measured directly to be 1.5± 0.05 µm using reflectometry.
3.3. Spectrometer
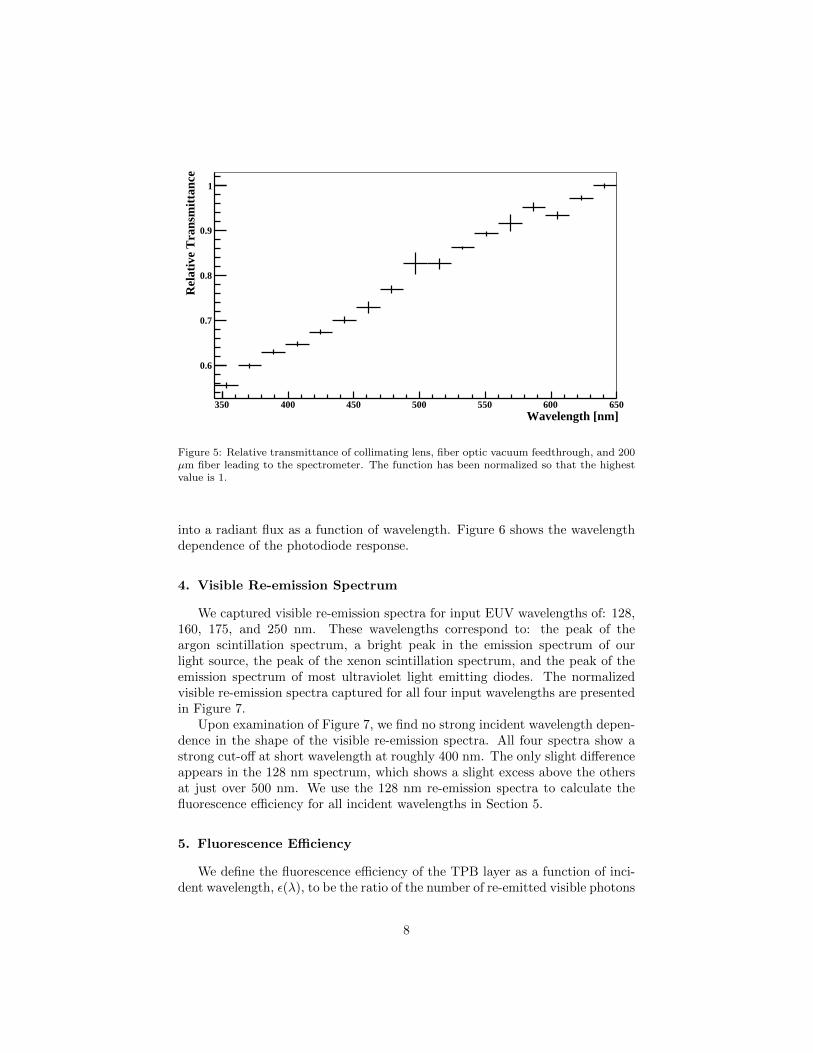
The visible re-emission spectra were taken with a QE65000 spectrometerfrom Ocean Optics. In order to direct light from the vacuum chamber containingthe light source and TPB samples, a collimating lens was used to focus light ontoa fiber optic vacuum feedthrough out to a 200 µm diameter fiber leading to thespectrometer input port. Spectra were dark-subtracted in the data acquisitionsoftware and analyzed with the ROOT analysis framework[24]. A broadbandxenon lamp was used to calibrate the relative transmittance of the optical trainleading to the spectrometer, shown in Figure 5. The xenon lamp was observedthrough a fiber with a transmittance function calibrated by the manufacturer.Then the spectrum of the same lamp was observed through the complete opticaltrain, divided by the raw lamp spectrum, and rescaled to produce the relativetransmittance function.
3.4. Photodiode
The absolute intensity measurements were made with an AXUV100G pho-todiode from International Radiation Detectors, Inc (IRD)[25, 26]. This devicehas a one centimeter by one centimeter active photodiode area. It is a window-less silicon photodiode cell, with a calibrated sensitivity from 80 nm to 1100nm. The device is completely passive, so it was read out with a Keithley 6487picoammeter. The calibration, provided by NIST for incident light from 80to 254 nm and IRD for light from 200 to 1100 nm, scales a measured current
7
Wavelength [nm]350 400 450 500 550 600 650
Rel
ativ
e T
rans
mit
tanc
e
0.6
0.7
0.8
0.9
1
Figure 5: Relative transmittance of collimating lens, fiber optic vacuum feedthrough, and 200µm fiber leading to the spectrometer. The function has been normalized so that the highestvalue is 1.
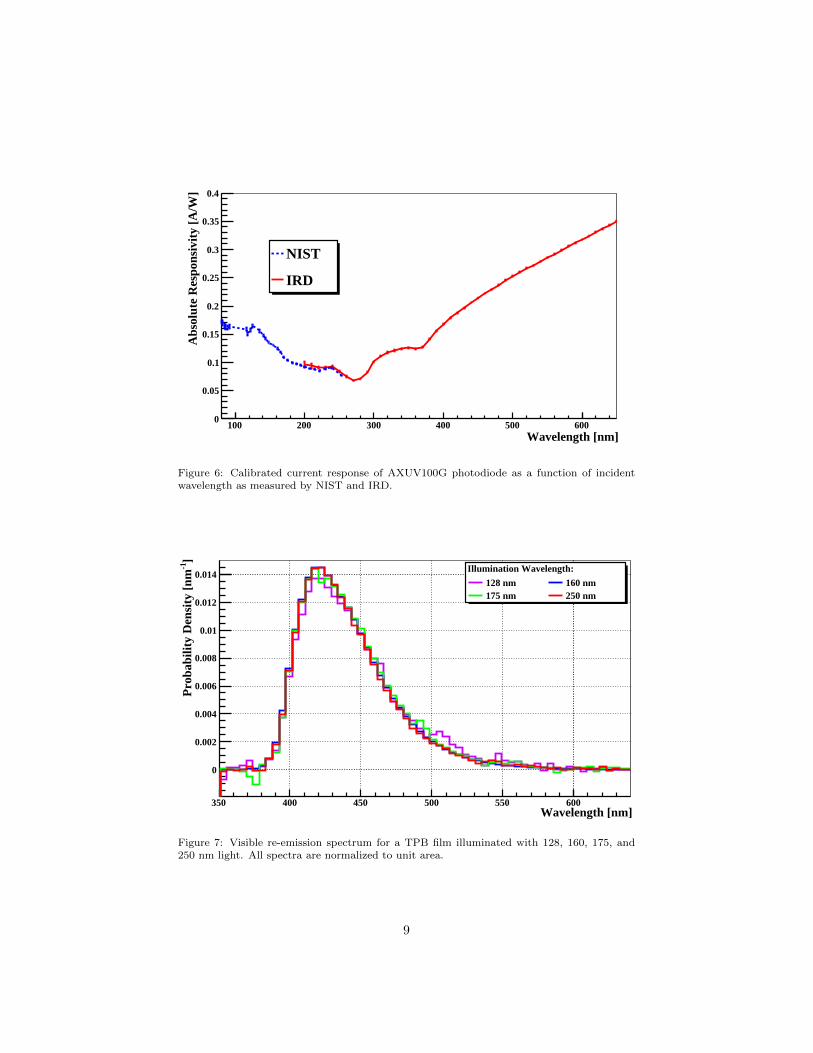
into a radiant flux as a function of wavelength. Figure 6 shows the wavelengthdependence of the photodiode response.
4. Visible Re-emission Spectrum
We captured visible re-emission spectra for input EUV wavelengths of: 128,160, 175, and 250 nm. These wavelengths correspond to: the peak of theargon scintillation spectrum, a bright peak in the emission spectrum of ourlight source, the peak of the xenon scintillation spectrum, and the peak of theemission spectrum of most ultraviolet light emitting diodes. The normalizedvisible re-emission spectra captured for all four input wavelengths are presentedin Figure 7.
Upon examination of Figure 7, we find no strong incident wavelength depen-dence in the shape of the visible re-emission spectra. All four spectra show astrong cut-off at short wavelength at roughly 400 nm. The only slight differenceappears in the 128 nm spectrum, which shows a slight excess above the othersat just over 500 nm. We use the 128 nm re-emission spectra to calculate thefluorescence efficiency for all incident wavelengths in Section 5.
5. Fluorescence Efficiency
We define the fluorescence efficiency of the TPB layer as a function of inci-dent wavelength, ε(λ), to be the ratio of the number of re-emitted visible photons
8
Wavelength [nm]100 200 300 400 500 600
Abs
olut
e R
espo
nsiv
ity
[A/W
]
0
0.05
0.1
0.15
0.2
0.25
0.3
0.35
0.4
NIST
IRD
Figure 6: Calibrated current response of AXUV100G photodiode as a function of incidentwavelength as measured by NIST and IRD.
Wavelength [nm]350 400 450 500 550 600
]-1
Pro
babi
lity
Den
sity
[nm
0
0.002
0.004
0.006
0.008
0.01
0.012
0.014Illumination Wavelength:
128 nm 160 nm175 nm 250 nm
Figure 7: Visible re-emission spectrum for a TPB film illuminated with 128, 160, 175, and250 nm light. All spectra are normalized to unit area.
9
to the number of UV photons incident on the TPB layer. The efficiency at agiven wavelength, λ, is computed from the current produced by the photodiodewhen directly viewing the light source, Ilamp(λ), the current when viewing theopaque shutter, Idark(λ), and the current when viewing the acrylic disk withTPB film on it, ITPB(λ). The dark-subtracted current ratio is converted to anefficiency using the equation
ε(λ) =ITPB − IdarkIlamp − Idark
× g∫dλ′ hcλ′C(λ′)S(λ− λ′)∫dλ′′ hcλ′′C(λ′′)R(λ′′)
, (1)
where g is a geometric efficiency based on the configuration of the apparatus,C(λ) is the photodiode response function shown in Figure 6, S(λ − λ′) is theGaussian wavelength distribution of the monochromator centered around λ, andR(λ′′) is the re-emission spectrum of TPB shown in Figure 7.
The geometric efficiency, g, is the ratio of the number of UV photons reach-ing the photodiode when the filter wheel is in the open position to the numberof visible photons observed by the photodiode when a TPB sample is in posi-tion, assuming unit fluorescence efficiency. This constant is independent of thewavelength of the incident EUV light and the re-emission spectrum of visiblelight. In general, g is different from 1 due to the different angular distributionsof incident and reemitted light, the effects of refraction at the acrylic-vacuuminterface of the TPB sample disk, and the limited solid angle of the photodi-ode. We evaluate g using a simple photon-tracing Monte Carlo simulation thatinitiates photons at the diffraction grating of the monochromator, propagatesthem through the exit aperture to the 2.3 cm diameter hole in the filter wheelwhere they can interact with a TPB layer deposited on an acrylic disk beforearriving at the photodiode. Fresnel reflection and refraction at the TPB andacrylic surfaces is included in the Monte Carlo, but reflection at the variousinterior black walls of the apparatus are neglected as second-order effects.
Not only does the geometric efficiency depend on the physical location andsize of objects in the measurement apparatus, but it also depends on the in-trinsic angular distribution of re-emitted light from the TPB film. The angulardistribution of re-emission from vapor-deposited thin films of TPB has not beenmeasured yet, so we would like to report an efficiency measure that is indepen-dent of this unknown angular distribution. Therefore, we define the forwardefficiency, F(λ), to be
F(λ) =ITPB − IdarkIlamp − Idark
× g′∫dλ′ hcλ′C(λ′)S(λ− λ′)∫dλ′′ hcλ′′C(λ′′)R(λ′′)
, (2)
where g′ is the ratio of the number of UV photons reaching the photodiodewhen the filter wheel in the open position to the number of UV which reach theTPB surface. The arrangement of our apparatus is such that g′ is exactly 1. Bydefining forward efficiency in this manner, the total efficiency can be calculatedgiven an angular distribution of TPB re-emission,
ε(λ) =F(λ)
A, (3)
10
where A is the acceptance fraction of a 1 cm by 1 cm square illuminated by theTPB angular distribution from a distance of 2.1 cm away after passing through7 mm of SUVT acrylic.
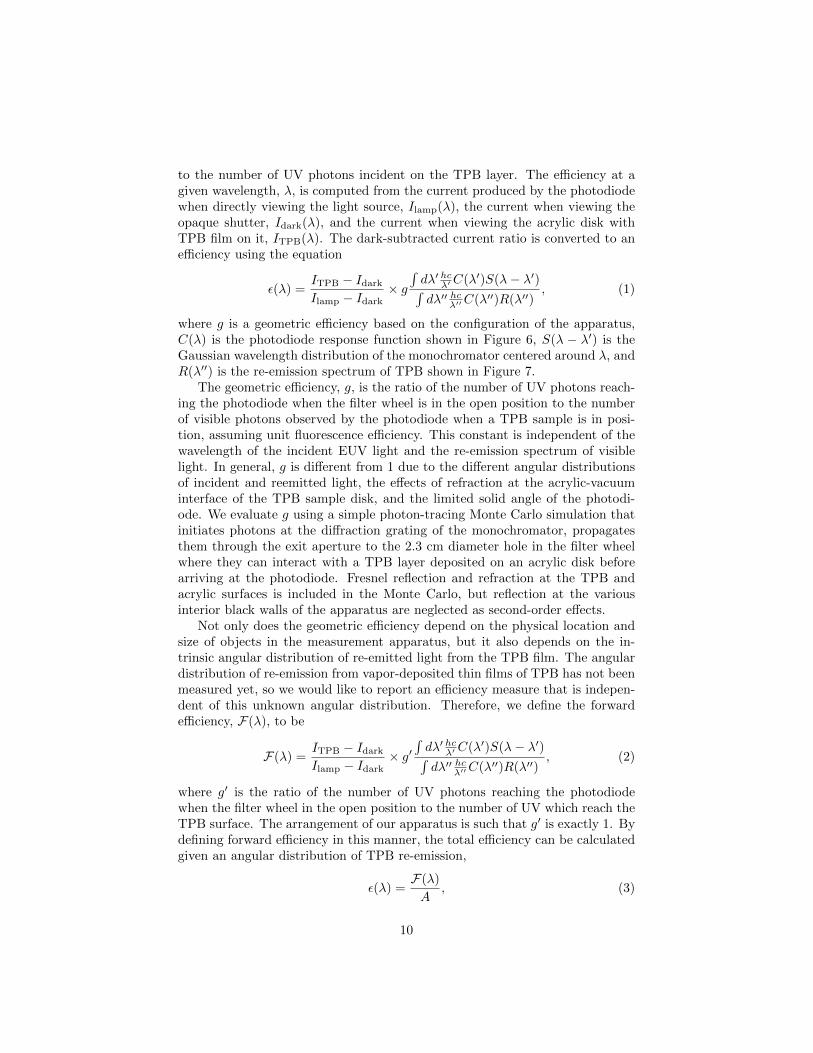
The forward efficiency of our TPB film is presented in Figure 8. There isa general trend below 190 nm toward increasing fluorescence efficiency withdecreasing UV wavelength. To illustrate the relative sizes of the componentsof the overall uncertainty, Table 1 shows the fractional uncertainties for theTPB efficiency with 130 nm incident light. The statistical uncertainty in allcurrent measurements was estimated by considering the RMS variation in thecurrent values taken with the metal shutter closed throughout the data collectionprocess. This uncertainty was propagated through dark-subtracted current ratiofrom Equation 2. The systematic uncertainty caused by short term variation inthe lamp was estimated by observing the lamp intensity at 120 nm, where theeffect was most significant, at different times and dividing this difference over thetime between measurements at the other wavelengths. The final two systematicuncertainties account for the uncertainty in the response of the photodiodeintegrated over the ultraviolet and visible bands. This includes not only theuncertainty in the calibration, but also the uncertainty in the spectrum of thelight source and TPB re-emission. By far, the dominant uncertainty in theoverall measurement is statistical, caused by relatively large fluctuations in thecurrent measurement relative to the low intensity of the light source at 130 nm.
Wavelength [nm]120 140 160 180 200 220 240 260
For
war
d E
ffic
ienc
y
0.01
0.012
0.014
0.016
0.018
0.02
0.022
0.024
0.026
0.028
0.03
Figure 8: Number of visible photons observed at photodiode sensor per incident EUV photona function of input EUV photon wavelength.
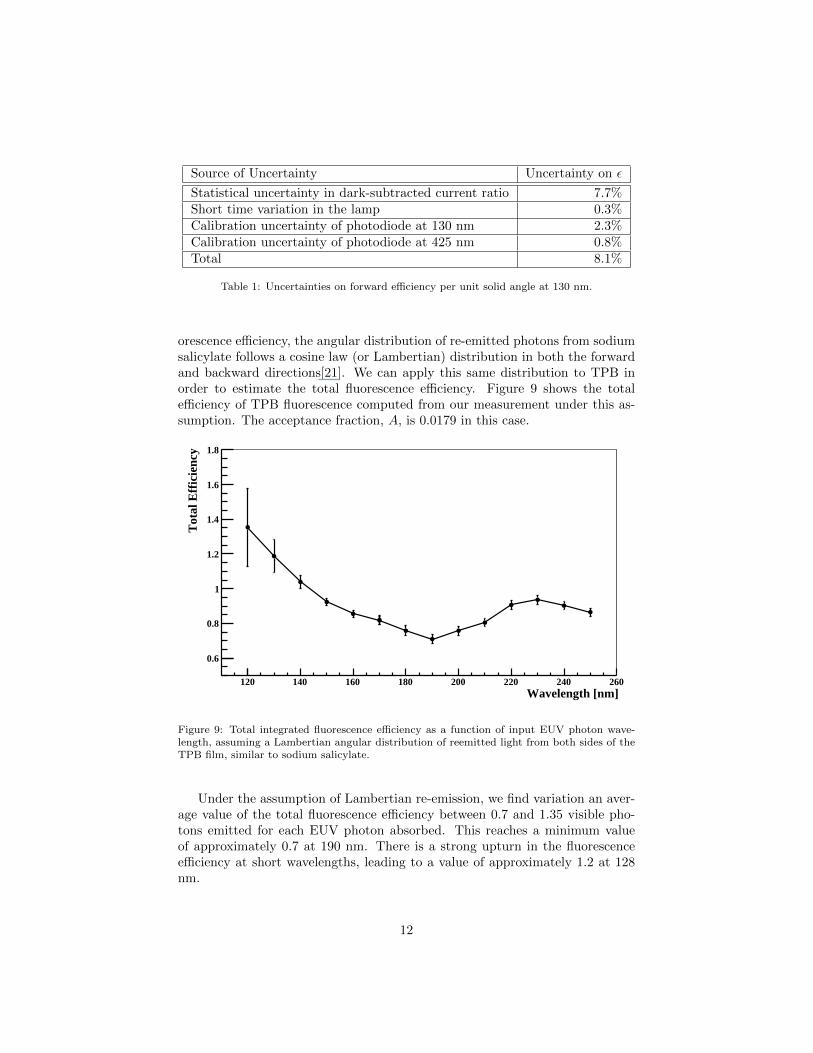
To illustrate what the total fluorescence efficiency of TPB could be givena reasonable assumption about the angular distribution of re-emission, we canlook to a similar fluor: sodium salicylate. For film thicknesses that maximize flu-
11
Source of Uncertainty Uncertainty on ε
Statistical uncertainty in dark-subtracted current ratio 7.7%Short time variation in the lamp 0.3%Calibration uncertainty of photodiode at 130 nm 2.3%Calibration uncertainty of photodiode at 425 nm 0.8%Total 8.1%
Table 1: Uncertainties on forward efficiency per unit solid angle at 130 nm.
orescence efficiency, the angular distribution of re-emitted photons from sodiumsalicylate follows a cosine law (or Lambertian) distribution in both the forwardand backward directions[21]. We can apply this same distribution to TPB inorder to estimate the total fluorescence efficiency. Figure 9 shows the totalefficiency of TPB fluorescence computed from our measurement under this as-sumption. The acceptance fraction, A, is 0.0179 in this case.
Wavelength [nm]120 140 160 180 200 220 240 260
Tot
al E
ffic
ienc
y
0.6
0.8
1
1.2
1.4
1.6
1.8
Figure 9: Total integrated fluorescence efficiency as a function of input EUV photon wave-length, assuming a Lambertian angular distribution of reemitted light from both sides of theTPB film, similar to sodium salicylate.
Under the assumption of Lambertian re-emission, we find variation an aver-age value of the total fluorescence efficiency between 0.7 and 1.35 visible pho-tons emitted for each EUV photon absorbed. This reaches a minimum valueof approximately 0.7 at 190 nm. There is a strong upturn in the fluorescenceefficiency at short wavelengths, leading to a value of approximately 1.2 at 128nm.
12
6. Conclusions
We have presented measurements of both the visible re-emission spectrumand fluorescence efficiency of thin TPB films evaporated onto acrylic. The visiblespectrum we measure here is somewhat closer to that presented in Reference[19] than it is to the one from [20], although our spectrum seems cuts off at asomewhat shorter wavelength than seems apparent in [19].
The details of the work presented in this article are somewhat specific tothe MiniCLEAN experiment in terms of the preparation of the TPB film. Thenext step in TPB characterization is to measure the angular distribution of re-emission in order to test the assumption of a Lambertian distribution in both theforward and backward directions. As a future study, it also would be interestingto vary the manner in which the TPB film is prepared. Additionally, our lampintensity cuts off at approximately 110 nm because of the transmittance of itsMgF2 window (see Figure 1). Clearly, it would be advantageous to extendthese efficiency measurements down to 70–80 nm so that we could characterizethese films near the scintillation wavelengths of neon and helium as well. Itis also possible that we could examine other fluor molecules as candidates foruse in noble element scintillation detectors. All of these efforts will help tocontinue to make these noble element scintillation detectors a viable technologyin the coming years, and will continue to push forward the optimization of thisradiation detection technique.
7. Acknowledgments
This work was supported by Los Alamos National Laboratory’s Directed Re-search and Development program, the Department of Energy’s NA-22 Office ofNonproliferation Research & Development, National Science Foundation grantnumber PHY-0758120, and a Research Excellence Development grant from theUniversity of South Dakota. The authors thank Victor H. Gehman, Jr. andStephen H. Jaditz for their careful reading and constructive comments. Theauthors would also like to thank Hugh Lippincott, James Nikkel and Dan McK-insey for the preparation of the sample disks and valuable discussions regardingdetection of EUV scintillation light with TPB as well as Andrew M. Dattelbaumand Anatoly V. Efimov for assistance with reflectometry measurements of ourTPB film thickness.
References
[1] E. Aprile, A. E. Bolotnikov, A. I. Bolozdynya, and T. Doke. Noble GasDetectors. Wiley-VCH Verlag GmbH & Co. KGaA. Weinheim, Germany,(2006).
[2] R. Brunetti, et al. WARP Liquid Argon Detector for Dark Matter Survey.New Astron. Rev., 49, 265 (2005).
13
[3] M. Haranczyk, et al. The ArDM Experiment. Acta Physica Polonica B, 41,1441 (2010).
[4] D.N. McKinsey and the MiniCLEAN Collaboration. The Mini-CLEAN Ex-periment. Nucl. Phys. B - Proc. Suppl., 173, 152.
[5] D.N. McKinsey and K.J. Coakley. Neutrino Detection with CLEAN. As-tropart. Phys., 22, 355 (2005).
[6] ICARUS Collaboration. A Second-Generation Proton Decay Experimentand Neutrino Observatory at the Gran Sasso Laboratory. LNGS-P28/2001,(2001).
[7] M. Soderberg and the MicroBooNE Collaboration. MicroBooNE: A NewLiquid Argon Time Projection Chamber Experiment. AIP Conf. Proc.,1189, 83 (2009).
[8] V. Barger, et al. Report of the US Long Baseline Neutrino ExperimentStudy. Fermilab-0801-AD-E, (2007).
[9] R.A. Michniak, R. Alleaume, D.N. McKinsey, and J.M. Doyle. Alpha andBeta Particle Induced Scintillations in Liquid and Solid Neon. Nuclear In-struments and Methods in Physics Research A, 482, 387 (2002).
[10] Glenn F. Knoll. Radiation Detection and Measurements, Third Edition.John Wiley and Sons, Inc. Hoboken, NJ. (2000)
[11] J.B. Birks. Scintillation Counters. McGraw-Hill Book Co, New York,(1953).
[12] The nEDM experiment (M. D. Cooper and B. W. Filippone, spokesper-sons). http:p25ext.lanl.gov/edm/edm.html
[13] R. Golub and S.K. Lamoreaux, Physics Reports, 237, 1 (1994)
[14] W.H. Lippincott. Direct Detection of Dark Matter With Liquid Argon andNeon. PhD Thesis. Yale University (2010).
[15] M. Stockton, J.W. Keto and W.A. Fitzsimmons. Ultraviolet Emission Spec-trum of Electron-Bombarded Superfluid Helium. Physical Review Letters,24, 654 (1970).
[16] R.E. Packard, F. Reif and C.M. Surko. Ultraviolet Emission Spectra ofElectron-Excited Solid and Liquid Neon. Physical Review Letters, 25, 1435(1970).
[17] K. Saito, et al. Absolute Number of Scintillation Photons Emitted byAlpha-particles in Rare Gases. IEEE Transactions on Nuclear Science, 49,1674 (2002).
14
[18] Hamamatsu Photonics. Photomultiplier Tubes: Basics and Applications,Third Edition. http://sales.hamamatsu.com/assets/applications/ETD/pmt handbook complete.pdf (2006)
[19] C.H. Lally, et al. UV Quantum Efficiencies of Organic Fluors. Nuclear In-struments and Methods in Physics Research B, 117, 421 (1996).
[20] W.M. Burton and B.A. Powell. Fluorescence of Tetraphenyl-Butadiene inthe Vacuum Ultraviolet. Applied Optics, 12, 87 (1973).
[21] R. Allison, J. Burns, and A. J. Tuzzolino. Absolute Fluorescent QuantumEfficiency of Sodium Salicylate. J. Opt. Soc. Am., 54, 747–750 (1964).
[22] J.A.R. Samson. Techniques of Vacuum Ultraviolet Spectroscopy. John Wi-ley & Sons, Inc. (1967).
[23] S.P. Regan, et al. Measured Conversion Efficiencies of P45, Paraterphenyl,Tetraphenyl Butadiene, and Sodium Salicylate Phosphors in the Soft-X-Ray Wavelength Range. Applied Optics, 33, 3595 (1994).
[24] R. Brun and F. Rademakers. ROOT - An Object Oriented Data Analy-sis Framework. Proceedings AIHENP’96 Workshop, Lausanne, Sep. 1996,Nuclear Instruments and Methods in Physics Research A, 389 81-86 (1997).
[25] L.R. Canfield, et al. Absolute Silicon Photodiodes for 160 nm to 254 nmPhotons. Metrologia, 35, 329 (1998)
[26] E.M. Gullikson, et al. Stable Silicon Photodiodes for Absolute IntensityMeasurements in the VUV and Soft X-ray Regions. Journal of ElectronSpectroscopy and Related Phenomena, 80, 313 (1996)
[27] Spartech Polycast. Solacryl Stabilized UV Transmitting Acrylic Datasheet.http://www.spartech.com/polycast/Spartech-Polycast-SUVT.pdf
15
Copyright © 2022 FDOKUMEN