Biomarkers in Czech workers exposed to 1, 3-butadiene: a transitional …
174
HEA L TH E FF E CTS I N STI T U T E Biomarkers in Czech Workers Exposed to 1,3-Butadiene: A Transitional Epidemiologic Study Richard J Albertini, Radim J Šrám, Pamela M Vacek, Jeremiah Lynch, Janice A Nicklas, Nico J van Sittert, Peter J Boogaard, Rogene F Henderson, James A Swenberg, Ad D Tates, Jonathan B Ward Jr, Michael Wright, and Others Number 116 June 2003 RESEARCH REPORT Includes a Commentary by the Institute’s Health Review Committee
-
Upload
independent -
Category
Documents
-
view
1 -
download
0
Transcript of Biomarkers in Czech workers exposed to 1, 3-butadiene: a transitional …

H E A L T HE F F E CTSINSTITUTE
Biomarkers in Czech WorkersExposed to 1,3-Butadiene:A Transitional Epidemiologic StudyRichard J Albertini, Radim J Šrám, Pamela M Vacek,
Jeremiah Lynch, Janice A Nicklas, Nico J van Sittert,
Peter J Boogaard, Rogene F Henderson, James A Swenberg,
Ad D Tates, Jonathan B Ward Jr, Michael Wright, and Others
Number 116June 2003
R E S E A R C H R E P O R T
Charlestown Navy Yard
120 Second Avenue
Boston MA 02129 USA
+1-617-886-9330
www.healtheffects.org
H E A L T HE F F E CTSINSTITUTE
R E S E A R C HR E P O R T
Number 116
June 2003
Includes a Commentary by the Institute’s Health Review Committee
June 2003R
EPORT
116B
iom
arkers in C
zech W
orkers E
xpo
sed to
1,3-Bu
tadien
e

H E A L T HE F F E C T SI N S T I T U T E
The Health Effects Institute, established in 1980,
is an independent and unbiased source of
information on the health effects of motor
vehicle emissions. HEI supports research on all
major pollutants, including regulated pollutants
(such as carbon monoxide, ozone, nitrogen
dioxide, and particulate matter) and unregulated
pollutants (such as diesel engine exhaust,
methanol, and aldehydes). To date, HEI has
supported more than 220 projects at institutions
in North America and Europe and has published
over 140 research reports.
Typically, HEI receives half its funds from the
US Environmental Protection Agency and half
from 28 manufacturers and marketers of motor
vehicles and engines in the United States.
Occasionally, funds from other public and private
organizations either support special projects or
provide a portion of the resources for an HEI
study. For the work described in this Research
Report, HEI received additional funds from the
American Chemistry Council, the European
Chemical Industry Council, and the International
Institute of Synthetic Rubber Producers.
Furthermore, HEI gratefully acknowledges fund-
ing to the Vermont Cancer Center Analysis Facility
from the National Cancer Institute, a grant that
supported part of the DNA analyses performed
for this study.
Regardless of funding sources, HEI exercises
complete autonomy in setting its research
priorities and in reaching its conclusions. An
independent Board of Directors governs HEI. The
Institute’s Health Research and Health Review
Committees serve complementary scientific
purposes and draw distinguished scientists as
members. The results of HEI-funded studies are
made available as Research Reports, which
contain both the Investigators’ Report and the
Review Committee’s evaluation of the work’s
scientific quality and regulatory relevance.
Richard F Celeste ChairPresident, Colorado College
Archibald Cox Chair EmeritusCarl M Loeb University Professor (Emeritus), Harvard Law School
Donald Kennedy Vice Chair EmeritusEditor-in-Chief, Science; President (Emeritus) and Bing Professor ofBiological Sciences, Stanford University
Purnell W ChoppinPresident Emeritus, Howard Hughes Medical Institute
Jared L CohonPresident, Carnegie Mellon University
Alice HuangSenior Councilor for External Relations, California Instituteof Technology
Richard B StewartProfessor, New York University School of Law, and Director,New York University Center on Environmental and Land Use Law
Robert M WhitePresident (Emeritus), National Academy of Engineering, and SeniorFellow, University Corporation for Atmospheric Research
Mark J Utell ChairProfessor of Medicine and Environmental Medicine, Universityof Rochester
Melvyn C BranchJoseph Negler Professor of Engineering, Mechanical EngineeringDepartment, University of Colorado
Kenneth L DemerjianProfessor and Director, Atmospheric Sciences Research Center,University at Albany, State University of New York
Peter B FarmerProfessor and Section Head, Medical Research Council Toxicology Unit,University of Leicester
Helmut GreimProfessor, Institute of Toxicology and Environmental Hygiene, TechnicalUniversity of Munich
Rogene HendersonSenior Scientist and Deputy Director, National EnvironmentalRespiratory Center, Lovelace Respiratory Research Institute
Stephen I RennardLarson Professor, Department of Internal Medicine, University ofNebraska Medical Center
Howard RocketteProfessor and Chair, Department of Biostatistics, Graduate School ofPublic Health, University of Pittsburgh
Jonathan M SametProfessor and Chairman, Department of Epidemiology, BloombergSchool of Public Health, Johns Hopkins University
Ira TagerProfessor of Epidemiology, School of Public Health, University ofCalifornia, Berkeley
Clarice R WeinbergChief, Biostatistics Branch, Environmental Diseases and MedicineProgram, National Institute of Environmental Health Services
BOARD OF DIRECTORS
HEALTH RESEARCH COMMITTEE
HEALTH REVIEW COMMITTEE
OFFICERS & STAFFDaniel S Greenbaum PresidentRobert M O’Keefe Vice PresidentJane Warren Director of ScienceSally Edwards Director of PublicationsJacqueline C Rutledge Director of Finance and AdministrationRichard M Cooper Corporate SecretaryCristina I Cann Staff ScientistAaron J Cohen Principal ScientistMaria G Costantini Principal ScientistDebra A Kaden Senior Scientist
Geoffrey H Sunshine Senior ScientistAnnemoon MM van Erp Staff ScientistTerésa Fasulo Science Administration ManagerGail A Hamblett Office and Contracts ManagerMelissa Harke Administrative AssistantL Virgi Hepner Senior Science EditorJenny Lamont Science EditorFrancine Marmenout Senior Executive AssistantTeresina McGuire Accounting AssistantRobert A Shavers Operations Manager
Daniel C Tosteson ChairProfessor of Cell Biology, Dean Emeritus, Harvard Medical School
Ross AndersonProfessor and Head, Department of Public Health Sciences, St George’s Hospital Medical School, London University
John C Bailar IIIProfessor Emeritus, The University of Chicago
John R HoidalProfessor of Medicine and Chief of Pulmonary/Critical Medicine,University of Utah
Thomas W KenslerProfessor, Division of Toxicological Sciences, Department ofEnvironmental Sciences, Johns Hopkins University
Brian LeadererProfessor, Department of Epidemiology and Public Health, Yale University School of Medicine
Thomas A LouisProfessor, Department of Biostatistics, Bloomberg School of PublicHealth, Johns Hopkins University
Edo D PellizzariVice President for Analytical and Chemical Sciences, ResearchTriangle Institute
Nancy ReidProfessor and Chair, Department of Statistics, University of Toronto
William N RomProfessor of Medicine and Environmental Medicine and Chief ofPulmonary and Critical Care Medicine, New York University Medical Center
Sverre VedalProfessor, University of Colorado School of Medicine; Senior Faculty,National Jewish Medical and Research Center
Synopsis of Research Report 116
S T A T E M E N T
Biomarkers in Butadiene-Exposed Workers
BACKGROUND
Butadiene is a four-carbon gaseous chemical syn-thesized for the manufacture of resins, plastics, andsynthetic rubber. It is also produced by combustion;butadiene is present in cigarette smoke and emissionsfrom motor vehicles and some stationary sources. Thehighest exposures, those that occur in occupationalsettings, may present a health concern because buta-diene is known to be carcinogenic in rats and miceand some epidemiologic studies have implicated it asa human carcinogen by inhalation. Those studieshave indicated that workers exposed to butadiene inrubber-producing factories also have an increasedincidence of two types of cancer: cancers of the lym-phatic system and cancers of the organs and systemsof the body that produce blood cells. More recent andcomprehensive studies of the same workers haveindicated an increased risk of leukemia (but not othertypes of cancers) in workers with a long duration ofemployment in the rubber industry. On the basis ofthese epidemiologic studies, various government andinternational agencies have conducted risk assess-ments of butadiene’s carcinogenicity and designatedit as “potentially carcinogenic to humans,” “a prob-able human carcinogen,” and a “known humancarcinogen.”
In 1994, HEI initiated a research program to addressthe health risks of exposure to a series of chemicals,including butadiene, designated as toxic air pollut-ants by the US Environmental Protection Agency. In1995, HEI issued Request for Qualifications 95-3,“Transitional Epidemiology Studies for Benzene or1,3-Butadiene Biomarkers,” which sought researcherswith access to human populations exposed to eitherbenzene or butadiene. The goal of RFQ 95-3 was tofund research to determine whether human exposurecould be quantified by measuring the levels of certainbiomarkers. Biomarkers are chemical compounds orphysical characteristics that appear in bodily fluids ortissues after exposure to an exogenous agent. Theycan be specific indicators of exposure such as stable
metabolites, metabolites bound to proteins or DNA,or genetic material that was altered because of theexposure.
Epidemiologic studies have encountered two pri-mary difficulties in assessing exposure to carcino-genic agents. First, because the incidence of certaincancers is low, they have needed to study large popu-lations to
find an association between exposure anddisease. Second, it is often difficult to accuratelyassess the level or time course of exposure to a pos-sible cancer-causing agent in order to link past expo-sures to recent disease occurrences. In contrast withthis, populations known to have been exposed to cer-tain chemicals (such as groups of workers in a specificindustry) show relatively high levels of biomarkers.Therefore, if biomarkers can accurately reflect thelevel or timing of exposure to a suspected carcinogen,they may be able to enhance exposure assessment inepidemiologic studies.
Dr Richard Albertini at the University of Vermontin Burlington organized groups of researchers fromhis own laboratory and laboratories in Galveston,Texas; Chapel Hill, North Carolina; Prague, CzechRepublic; Amsterdam and Leiden, The Netherlands;and Sheffield, United Kingdom. Each group hadexpertise in identifying different biomarkers thatappear after butadiene exposure. Dr Radim rám ofthe Laboratory of Genetic Ecotoxicology in Pragueprovided contact with butadiene-exposed workers intwo production units of a factory near Prague.
APPROACH
The researchers proposed to determine whetherbiomarkers in the blood and urine of the exposedworkers correlated with their personal exposure tobutadiene. rám and coworkers in Prague collectedblood and urine from male workers employed eitherin the butadiene monomer production plant or in thepolymerization facility that used butadiene and sty-rene to produce rubber polymer. They also collected
S
S
This Statement, prepared by the Health Effects Institute, summarizes a research project funded by HEI and conducted by Dr Richard J Albertiniat the University of Vermont, Burlington VT, with collaborators in seven European and US institutions. The following Research Report containsboth the detailed Investigators’ Report and a Commentary on the study prepared by the Institute’s Health Review Committee.

Research Report 116
Copyright © 2003 Health Effects Institute, Boston MA USA. Asterisk Typographics, Barre VT, compositor. Printed at Capital City Press, Mont-pelier VT. Library of Congress Catalog Number for the HEI Report Series: WA 754 R432.The paper in this publication meets the minimum standard requirements of the ANSI Standard Z39.48-1984 (Permanence of Paper) effectivewith Report 21, December 1988; and effective with Report 92, the paper is recycled from 100% postconsumer waste, with Reports 25, 26, 32,51, 65 Parts IV, VIII, and IX, and 91 excepted. These excepted Reports are printed on acid-free coated paper.
blood and urine from male administrative workers atthe plant who had no direct occupational exposure tobutadiene and served as control subjects. Each worker’spersonal exposure to butadiene in air was measuredusing a small air sampler attached to his clothes. Sam-plers were worn on several occasions over a 60-dayperiod preceding and during the three days on whichblood or urine samples were acquired. The air sam-plers were sent to a laboratory in Sheffield wherebutadiene levels were analyzed. For biomarker anal-yses, the Prague researchers sent portions of eachblood and urine sample to the other research groupsand kept a portion for their own use.
The study was conducted in a blinded fashion.Subject identities were known only to Albertini andthe biostatistician for the study in Burlington, wherecodes were maintained, data were analyzed, and thenmatched to the three exposure groups.
The investigators focused their investigation on twotypes of biomarkers. The first type comprised
biomarkersof exposure
that were chosen specifically to indicatethe level of butadiene in the body that resulted froman exposure. The researchers in Amsterdam and ChapelHill determined the concentrations of two adductsthat form when butadiene metabolites bind to hemo-globin in red blood cells. The Amsterdam researchersalso measured levels of other exposure-related bio-markers, two metabolites that are excreted in urinewhen butadiene is detoxified in the body.
The second type of biomarker comprised
biomarkersof effect
, including gene mutations and structuralchanges in chromosomes. The researchers in Leidenand Galveston analyzed mutations in the
HPRT
gene
by different methods and the Prague researchers deter-mined the types and degrees of chromosomal changes.
In addition, the Prague and Burlington groups lookedat factors that may affect
susceptibility
to carcinogens,such as changes in the genes that code for enzymes thatmetabolize butadiene. Such differences can modify anenzyme’s activity and may affect an individual’sresponse to possible butadiene-induced effects.
RESULTS AND INTERPRETATIONS
All the biomarkers of exposure were correlatedwith the measurements of butadiene recorded by theair samplers. Although the correlation between hemo-globin adducts and exposure levels was strongest, uri-nary metabolites were also found to be very usefulmeasures of butadiene exposure.
No statistically significant correlations were foundbetween any of the biomarkers of effect and butadieneexposure. Although these biomarkers were investi-gated, they were evaluated against exposure, notagainst health outcomes. Thus, no conclusions abouthealth outcomes can be drawn from these results.
This very important and valuable study establishedthe linkage between exposure to butadiene, as measuredby comprehensive conventional sampling techniques,and several biological markers of such exposures. Theintegration of a comprehensive exposure assessmentwith a series of logical biomarker analyses was an out-standing feature of this complex international study.Of the many biomarkers analyzed, the biomarkers ofexposure (particularly hemoglobin adducts) mayprove to be valuable in future epidemiologic studiesof the health effects of butadiene exposure.
CONTENTS
Research Report 116
Biomarkers in Czech Workers Exposed to 1,3-Butadiene:A Transitional Epidemiologic Study
Richard J Albertini, Radim J rám, Pamela M Vacek, Jeremiah Lynch, Janice A Nicklas,Nico J van Sittert, Peter J Boogaard, Rogene F Henderson, James A Swenberg,Ad D Tates, Jonathan B Ward Jr, Michael Wright
with Marinel M Ammenheuser, Blanka Binkova, Walter Blackwell, Franz A de Zwart,Dean Krako, Jennifer Krone, Hendricus Megens, Petra Musilová, Gabriela Rajská,Asoka Ranasinghe, Judah I Rosenblatt, Pavel Rössner, Jiri Rube , Linda Sullivan,Patricia Upton, and Ailko H Zwinderman
University of Vermont, Burlington VT; Laboratory of Genetic Ecotoxicology, Prague,Czech Republic; Shell International Chemicals, BV, Amsterdam, The Netherlands; Lovelace Respiratory Research Institute, Albuquerque NM; University of North Carolina, Chapel Hill NC; Leiden University, Leiden, The Netherlands; University of Texas Medical Branch at Galveston, Galveston TX; Health and Safety Laboratory, Sheffield, UK
HEI STATEMENT
This Statement is a nontechnical summary of the Investigators’ Report and the Health Review Committee’s Commentary.
INVESTIGATORS’ REPORT
When an HEI-funded study is completed, the investigators submit a final report. The Investigators’ Report is firstexamined by three outside technical reviewers and a biostatistician. The report and the reviewers’ comments arethen evaluated by members of the HEI Health Review Committee, who had no role in selecting or managing theproject. During the review process, the investigators have an opportunity to exchange comments with the ReviewCommittee and, if necessary, revise the report.
Abstract
. . . . . . . . . . . . . . . . . . . . . . . . . . . . . . . . . . . . . 1
Overview
. . . . . . . . . . . . . . . . . . . . . . . . . . . . . . . . . . . 2Epidemiologic Studies in Humans . . . . . . . . . . . 3Cancer Studies in Rodents . . . . . . . . . . . . . . . . . . 4BD Metabolism . . . . . . . . . . . . . . . . . . . . . . . . . . . . 4BD Metabolism in Rodents . . . . . . . . . . . . . . . . . 6Molecular Dosimetry . . . . . . . . . . . . . . . . . . . . . . 7Genotoxicity of BD . . . . . . . . . . . . . . . . . . . . . . . . 8 Molecular Epidemiologic Studies in Humans 9The Current Study . . . . . . . . . . . . . . . . . . . . . . . . 11
Specific Aims
. . . . . . . . . . . . . . . . . . . . . . . . . . . . . . 12Phase I . . . . . . . . . . . . . . . . . . . . . . . . . . . . . . . . . . 12Phase II . . . . . . . . . . . . . . . . . . . . . . . . . . . . . . . . . . 12Supplemental Analyses . . . . . . . . . . . . . . . . . . . 13
Study Design: Subject Selection, Sample Acquisition and Handling, and StatisticalMethods
. . . . . . . . . . . . . . . . . . . . . . . . . . . . . . . . . . 14Subject Selection and Exposure Assessment 14
Procedure to Assure Blinded Analyses . . . . . . 15Chain of Custody . . . . . . . . . . . . . . . . . . . . . . . . . 15Sample Acquisition and Handling . . . . . . . . . . 15
Subjects’ Biological Samples . . . . . . . . . . . . . 15Urine . . . . . . . . . . . . . . . . . . . . . . . . . . . . . . . 15Blood . . . . . . . . . . . . . . . . . . . . . . . . . . . . . . . 15
Isolation of MNCs and Plasma . . . . . . 16Isolation of Erythrocytes . . . . . . . . . . . 16
Sorbent Tubes for BD and VOCs . . . . . . . . . . 16Data Processing and Statistical Analysis . . . . . 16
Data Processing . . . . . . . . . . . . . . . . . . . . . . . . 16Statistical Analysis . . . . . . . . . . . . . . . . . . . . . . 17
Workers’ Exposure Groups, Personal Characteristics, and Metabolic Genotypes
. . . 18Exposure Groups . . . . . . . . . . . . . . . . . . . . . . . . . 18
Workplace Environment . . . . . . . . . . . . . . . . 18Results: Job and Task Analysis . . . . . . . . . . . 18
Personal Characteristics . . . . . . . . . . . . . . . . . . . 19
S
s
Continued

Research Report 116
Questionnaires . . . . . . . . . . . . . . . . . . . . . . . . 19Results: Characteristics and Coexposures 21
Metabolic Genotypes . . . . . . . . . . . . . . . . . . . . . 23Genotyping Methods . . . . . . . . . . . . . . . . . . . 25
GSTM1
and
GSTT1
. . . . . . . . . . . . . . . . . . . 25
ADH2
,
ADH3
,
EH
, and
CYP2E1
. . . . . . . . 25Results: Genotypes . . . . . . . . . . . . . . . . . . . . . 26
Measurement of OccupationalExposure to BD
. . . . . . . . . . . . . . . . . . . . . . . . . . . 28Exposure Assessment Protocol . . . . . . . . . . . . . 28
Exposure Measurements from Personal Monitors . . . . . . . . . . . . . . . . . . . . . . . . . . . . . 28
Workplace Area Measurements . . . . . . . . . . 29Exposure Sampling and Analysis . . . . . . . . . . . 29
BD: Materials and Methods . . . . . . . . . . . . . 29VOCs: Materials and Methods . . . . . . . . . . . 31Quality Control . . . . . . . . . . . . . . . . . . . . . . . . 31Statistical Methods . . . . . . . . . . . . . . . . . . . . . 32
Results . . . . . . . . . . . . . . . . . . . . . . . . . . . . . . . . . . 32BD Exposure Measurements from Personal
Monitors . . . . . . . . . . . . . . . . . . . . . . . . . . . . . 32Summary Metrics for BD Exposure from
Personal Monitors . . . . . . . . . . . . . . . . . . . . . 34Workplace Area Measurements of BD . . . . 38Concurrent VOC Exposure Measurements
from Personal Monitors . . . . . . . . . . . . . . . . 40Workplace Area Measurements of VOCs . . 41
Discussion . . . . . . . . . . . . . . . . . . . . . . . . . . . . . . . 42
Biomarkers of Exposure: BD Metabolitesin Urine
. . . . . . . . . . . . . . . . . . . . . . . . . . . . . . . . . . 43Metabolism of BD to Form Urinary
M2 and M1 . . . . . . . . . . . . . . . . . . . . . . . . . . . . . 43M2 and M1 as Biomarkers of Exposure . . . . . 43Methods . . . . . . . . . . . . . . . . . . . . . . . . . . . . . . . . . 44
Synthesis of Reference and InternalStandards . . . . . . . . . . . . . . . . . . . . . . . . . . . . 45
Calibration Standards and Curves . . . . . . . . 45QC Urine Standards . . . . . . . . . . . . . . . . . . . . 45QC Procedures . . . . . . . . . . . . . . . . . . . . . . . . . 45Analysis of Urinary M2 and M1 . . . . . . . . . . 45Statistical Methods . . . . . . . . . . . . . . . . . . . . . 46
Results . . . . . . . . . . . . . . . . . . . . . . . . . . . . . . . . . . 46Measurement of Urinary M2 and M1 . . . . . 46Correlations Among Urinary Biomarkers
and Personal Exposure MonitoringResults . . . . . . . . . . . . . . . . . . . . . . . . . . . . . . . 47
Influence of Genotypes and Metabolic Pathways (GSH Conjugation vs EH Hydrolysis) . . . . . . . . . . . . . . . . . . . . . . . . . . . 49
Discussion . . . . . . . . . . . . . . . . . . . . . . . . . . . . . . . 50
Biomarkers of Exposure: Hb Adducts
. . . . . . . . 53Materials and Methods for HBVal Analysis . . . 56
Synthesis of Reference and InternalStandards . . . . . . . . . . . . . . . . . . . . . . . . . . . . 56
Calibration Standards and Curves . . . . . . . 57QC Procedures . . . . . . . . . . . . . . . . . . . . . . . . . 57HBVal Analysis . . . . . . . . . . . . . . . . . . . . . . . . . 57
Materials and Methods for THBVal Analysis 57Synthesis of Internal Standards . . . . . . . . . . 57Calibration Standards and Curves . . . . . . . 57QC Standards . . . . . . . . . . . . . . . . . . . . . . . . . . 57QC Procedures . . . . . . . . . . . . . . . . . . . . . . . . . 58THBVal Analysis . . . . . . . . . . . . . . . . . . . . . . . 58
Statistical Analyses . . . . . . . . . . . . . . . . . . . . . . . 58Results . . . . . . . . . . . . . . . . . . . . . . . . . . . . . . . . . . 58
HBVal Adduct Concentrations . . . . . . . . . . . 58HBVal Adducts and Genotypes . . . . . . . . . . 60THBVal Adduct Concentrations . . . . . . . . . . 60THBVal Adducts and Genotypes . . . . . . . . . 60Correlation Between HBVal and THBVal . . 61Ratio of THBVal to HBVal . . . . . . . . . . . . . . . 61
Discussion . . . . . . . . . . . . . . . . . . . . . . . . . . . . . . 61
Biomarkers of Effect: Assays of
HPRT
Mutations in Human Lymphocytes
. . . . . . . . . 63Materials and Methods . . . . . . . . . . . . . . . . . . . 65
Cloning Assay . . . . . . . . . . . . . . . . . . . . . . . . . 65Receipt and Handling of Samples . . . . . . 65Quality Control Procedures . . . . . . . . . . . 65Thawing Frozen Samples . . . . . . . . . . . . . 65Preincubation . . . . . . . . . . . . . . . . . . . . . . . 65Culture Medium . . . . . . . . . . . . . . . . . . . . . 67Cloning Lymphocytes . . . . . . . . . . . . . . . . 67Scoring Clones and Calculating CEs
and MFs . . . . . . . . . . . . . . . . . . . . . . . . . . . 67Autoradiographic Assay . . . . . . . . . . . . . . . . . 67
Receipt and Handling of Samples . . . . . . 67Quality Control Procedures . . . . . . . . . . . 68Thawing Frozen Samples . . . . . . . . . . . . . 68Culture Medium . . . . . . . . . . . . . . . . . . . . . 68Incubating Samples for
HPRT
Variant Selection . . . . . . . . . . . . . . . . . . . 68Fixing Cells and Preparing Slides . . . . . . 68Scoring Slides and Calculating VFs . . . . . 68Duplicate Scoring . . . . . . . . . . . . . . . . . . . . 68
Statistical Analysis of Cloning and Autoradiographic Assay Data . . . . . . . . . . . 69
Results of the Cloning Assay . . . . . . . . . . . . . . . 69MFs . . . . . . . . . . . . . . . . . . . . . . . . . . . . . . . . . . 69Differences in MFs Among the Exposure
Groups . . . . . . . . . . . . . . . . . . . . . . . . . . . . . . . 70Association Between MF and Exposure
to BD . . . . . . . . . . . . . . . . . . . . . . . . . . . . . . . . 70Effect of Smoking on MFs . . . . . . . . . . . . . . . . 70
Continued
Research Report 116
Effect of Age on MFs . . . . . . . . . . . . . . . . . . . . 71Effect of Genotype on MFs . . . . . . . . . . . . . . 71Correlations of MFs with Urinary
Metabolites or Hb Adducts . . . . . . . . . . . . . 71CEs . . . . . . . . . . . . . . . . . . . . . . . . . . . . . . . . . . . 71Differences in CEs Among the
Exposure Groups . . . . . . . . . . . . . . . . . . . . . . 72Association Between CE and
Exposure to BD . . . . . . . . . . . . . . . . . . . . . . . 72Numbers of Clonable Cells . . . . . . . . . . . . . . 72Numbers of Living Cells . . . . . . . . . . . . . . . . . 72
Results of the Autoradiographic Assay . . . . . . 72Quality of the Lymphocyte Samples . . . . . . 72Results for VF by Exposure Group . . . . . . . . 73ECs . . . . . . . . . . . . . . . . . . . . . . . . . . . . . . . . . . . 75Consistency of Slide Scoring . . . . . . . . . . . . . 75
Comparison of Autoradiographic andCloning Assays . . . . . . . . . . . . . . . . . . . . . . . . . . 76
Discussion . . . . . . . . . . . . . . . . . . . . . . . . . . . . . . . 76The Cloning Assay . . . . . . . . . . . . . . . . . . . . . . 76The Autoradiographic Assay . . . . . . . . . . . . . 78
Sample Quality . . . . . . . . . . . . . . . . . . . . . . 78Relation of
HPRT
VF to BD Exposure . . 79Factors That Could Affect the Results
of
HPRT
Assays . . . . . . . . . . . . . . . . . . . . . 81Comparison of the Cloning and
Autoradiographic Assays . . . . . . . . . . . . . . . 82Conclusion . . . . . . . . . . . . . . . . . . . . . . . . . . . . 82
Biomarkers of Effect:
HPRT
MutationalSpectra
. . . . . . . . . . . . . . . . . . . . . . . . . . . . . . . . . . . 83Methods . . . . . . . . . . . . . . . . . . . . . . . . . . . . . . . . . 83
Expansion of Clones . . . . . . . . . . . . . . . . . . . . 83PCR Amplification and DNA Sequencing 86Statistical Analysis . . . . . . . . . . . . . . . . . . . . . . 87
Results . . . . . . . . . . . . . . . . . . . . . . . . . . . . . . . . . . 87Discussion . . . . . . . . . . . . . . . . . . . . . . . . . . . . . . . 93
Biomarkers of Effect: Cytogenetic Analysis
. . . 97Methods . . . . . . . . . . . . . . . . . . . . . . . . . . . . . . . . . 98
Chromosomal Aberrations Identifiedby the Conventional Method . . . . . . . . . . . 98
Chromosomal Changes Identified by FISH 98SCEs . . . . . . . . . . . . . . . . . . . . . . . . . . . . . . . . . . 99
Statistical Methods . . . . . . . . . . . . . . . . . . . . . 99Results . . . . . . . . . . . . . . . . . . . . . . . . . . . . . . . . . . 99
Chromosomal Aberrations Identifiedby the Conventional Method . . . . . . . . . . . 99
Chromosomal Changes Identified by FISH 104SCEs . . . . . . . . . . . . . . . . . . . . . . . . . . . . . . . . . 106
Discussion and Conclusions . . . . . . . . . . . . . . 107
Correlations Among Biomarkers
. . . . . . . . . . . 108Correlations Among Biomarkers of Exposure 108Correlations Among Biomarkers of
Exposure and Biomarkers of Effect . . . . . . . 109
HPRT
Mutations Assessed by the Cloning Assay (Mutant Frequencies) . . . . . . . . . . . 109
HPRT
Mutations Assessed by the Auto-radiographic Assay (Variant Frequencies) 109
Cytogenetic Changes . . . . . . . . . . . . . . . . . . 110Chromosomal Aberrations Identified
by the Conventional Method . . . . . . . . 110Chromosomal Changes Identified
by FISH . . . . . . . . . . . . . . . . . . . . . . . . . . . 110SCEs . . . . . . . . . . . . . . . . . . . . . . . . . . . . . . 110
Correlations Among the Biomarkers ofEffect:
HPRT
Mutations and CytogeneticEndpoints . . . . . . . . . . . . . . . . . . . . . . . . . . . 111
Conclusions . . . . . . . . . . . . . . . . . . . . . . . . . . . . 111
Discussion and Conclusions
. . . . . . . . . . . . . . . 112Exposure Assessment . . . . . . . . . . . . . . . . . . . . 112Study Subjects . . . . . . . . . . . . . . . . . . . . . . . . . . 113Urinary Metabolites . . . . . . . . . . . . . . . . . . . . . 113Hemoglobin Adducts . . . . . . . . . . . . . . . . . . . . 115Genotoxicity . . . . . . . . . . . . . . . . . . . . . . . . . . . . 116Conclusion . . . . . . . . . . . . . . . . . . . . . . . . . . . . . 118
Acknowledgments
. . . . . . . . . . . . . . . . . . . . . . . . 119
References
. . . . . . . . . . . . . . . . . . . . . . . . . . . . . . . 119
Appendix A. HEI Quality Assurance Report
. . 135
About the Primary Authors
. . . . . . . . . . . . . . . . 137Collaborating Institutions . . . . . . . . . . . . . . . . 138
Other Publications Resulting fromThis Research
. . . . . . . . . . . . . . . . . . . . . . . . . . . . 139
Abbreviations and Other Terms
. . . . . . . . . . . . 139Alternate Terms for Butadiene and
Its Metabolites and Adducts . . . . . . . . . . . . . 141
COMMENTARY Health Review Committee
The Commentary about the Investigators’ Report is prepared by the HEI Health Review Committee and staff. Itspurpose is to place the study into a broader scientific context, to point out its strengths and limitations, and to dis-cuss remaining uncertainties and implications of the findings for public health.
Introduction
. . . . . . . . . . . . . . . . . . . . . . . . . . 143
Scientific Background
. . . . . . . . . . . . . . . . . . 144
What Is a Transitional Epidemiologic Study? 145Biomarkers and Molecular Epidemiology . . 145
Biomarkers Chosen for This Study . . . . . . . . 145Biomarkers of Exposure . . . . . . . . . . . . . . . . 146
Urinary Metabolites . . . . . . . . . . . . . . . . . 146Hb Adducts . . . . . . . . . . . . . . . . . . . . . . . . 146
Continued

Biomarkers of Effect . . . . . . . . . . . . . . . . . . . 147
HPRT
Mutations . . . . . . . . . . . . . . . . . . . . 147Mutational Spectra . . . . . . . . . . . . . . . . . . 148SCEs and Chromosomal Aberrations . . 148
Factors That May Affect Susceptibility . . . 148Genetic Polymorphisms and
Cytogenetic Damage . . . . . . . . . . . . . . . . . . . 149
Technical Evaluation
. . . . . . . . . . . . . . . . . . . . . . 149Study Design . . . . . . . . . . . . . . . . . . . . . . . . . . . . 149Methods . . . . . . . . . . . . . . . . . . . . . . . . . . . . . . . . 151
Exposure Assessment . . . . . . . . . . . . . . . . . . 151Biomarkers of Exposure . . . . . . . . . . . . . . . . 152
Urinary Metabolites . . . . . . . . . . . . . . . . . 152Hb Adducts: HBVal and THBVal . . . . . . 152
Biomarkers of Effect . . . . . . . . . . . . . . . . . . . 152
HPRT
Mutants and Variants . . . . . . . . . . 152
HPRT
Mutational Spectra . . . . . . . . . . . . 152Cytogenetic Changes: SCEs and
Chromosomal Aberrations . . . . . . . . . 152Factors That May Affect Susceptibility:
Metabolic Genotypes . . . . . . . . . . . . . . . . . 153Statistical Analyses . . . . . . . . . . . . . . . . . . . . . . 153Results and Interpretations . . . . . . . . . . . . . . . 153
Exposure Assessment . . . . . . . . . . . . . . . . . . 153
Biomarkers of Exposure . . . . . . . . . . . . . . . . 154Urinary Metabolites . . . . . . . . . . . . . . . . . 154Hb Adducts . . . . . . . . . . . . . . . . . . . . . . . . 155
Biomarkers of Effect . . . . . . . . . . . . . . . . . . . 155
HPRT
Mutant Cells Assessed via theCloning Assay . . . . . . . . . . . . . . . . . . . . . 155
HPRT
Variant Cells Assessed via the Autoradiographic Assay . . . . . . . . . . . . 156
Mutational Spectra . . . . . . . . . . . . . . . . . 156Cytogenetic Analyses . . . . . . . . . . . . . . . . 156
Factors That May Affect Susceptibility . . . 157Correlations Among Biomarkers . . . . . . . . 157
Correlations Among the Biomarkersof Exposure . . . . . . . . . . . . . . . . . . . . . . . 157
Correlations Among the Biomarkers of Exposure and the Biomarkers of Effect . . . . . . . . . . . . . . . . . . . . . . . . . . 157
Correlations Among the Biomarkersof Effect . . . . . . . . . . . . . . . . . . . . . . . . . . 157
Discussion of Mutation Findings
. . . . . . . . . . . 157
Summary
. . . . . . . . . . . . . . . . . . . . . . . . . . . . . . . . 158
Acknowledgments
. . . . . . . . . . . . . . . . . . . . . . . . 159
References
. . . . . . . . . . . . . . . . . . . . . . . . . . . . . . . . 160
RELATED HEI PUBLICATIONS
Publishing History: This document was posted as a preprint on
www.healtheffects.org
and then finalized for print.
Citation for whole document:
Albertini RJ, rám RJ, Vacek PM, Lynch J, Nicklas JA, van Sittert NJ, Boogaard PJ, Henderson RF, Swenberg JA, Tates AD, Ward Jr JB, Wright M and others. 2003. Biomarkers in Czech Workers Exposed to 1,3-Butadiene: A Transitional Epidemiologic Study.Research Report 116. Health Effects Institute, Boston MA.
When specifying a section of this report, cite it as a chapter of the whole document.
S
Health Effects Institute Research Report 116 © 2003 1
INVESTIGATORS’ REPORT
Biomarkers in Czech Workers Exposed to 1,3-Butadiene: A Transitional Epidemiologic Study
Richard J Albertini, Radim J rám, Pamela M Vacek, Jeremiah Lynch, Janice A Nicklas, Nico J van Sittert, Peter J Boogaard, Rogene F Henderson, James A Swenberg, Ad D Tates, Jonathan B Ward Jr, Michael Wright, and Others
S
ABSTRACT
A multiinstitutional, transitional epidemiologic studywas conducted with a worker population in the CzechRepublic to evaluate the utility of a continuum of non-disease biological responses as biomarkers of exposure to1,3-butadiene (BD)* in an industrial setting. The study siteincluded two BD facilities in the Czech Republic. Institu-tions that collaborated in the study were the University ofVermont (Burlington, Vermont, USA); the Laboratory ofGenetic Ecotoxicology (Prague, the Czech Republic); ShellInternational Chemicals, BV (Amsterdam, The Nether-lands); the University of North Carolina at Chapel Hill(Chapel Hill, North Carolina, USA); University of TexasMedical Branch at Galveston (Galveston, Texas, USA); LeidenUniversity (Leiden, The Netherlands); and the Health andSafety Laboratory (Sheffield, United Kingdom).
Male volunteer workers (83) participated in the study:24 were engaged in BD monomer production, 34 in poly-merization activities, and 25 plant administrative workersserved as unexposed control subjects.
The BD concentrations experienced by each exposedworker were measured by personal monitor on approximately
ten separate occasions for 8-hour workshifts over a 60-dayexposure assessment period before biological sampleswere collected. Coexposures to styrene, benzene, and tol-uene were also measured. The administrative controlworkers were considered to be a homogeneous, unexposedgroup for whom a series of 28 random BD measurementswere taken during the exposure assessment period. Ques-tionnaires were administered in Czech to all participants.
At the end of the exposure assessment period, blood andurine samples were collected at the plant; samples werefractionated, cryopreserved, and kept frozen in Pragueuntil they were shipped to the appropriate laboratories forspecific biomarker analysis. The following biomarkerswere analyzed:
• polymorphisms in genes involved in BD metabolism(Prague and Burlington);
• urinary concentrations of 1-hydroxy-2-(
N
-acetyl-cysteinyl)-3-butene and 2-hydroxy-1-(
N
-acetylcys-teinyl)-3-butene (M2 [refers to an isomeric mixture ofboth forms]) (Amsterdam);
• urinary concentrations of 1,2-dihydroxy-4-(
N
-acetyl-cysteinyl)-butane (M1) (Amsterdam);
• concentrations of the hemoglobin (Hb) adducts
N
-(1-[hydroxymethyl]-2-propenyl)valine and
N
-(2-hydroxy-3-butenyl)valine (HBVal [refers to an isomeric mixtureof both forms]) (Amsterdam);
• concentrations of the Hb adduct
N
-(2,3,4-trihydroxy-butyl)valine (THBVal) (Chapel Hill);
• T cell mutations in the
hypoxanthine phosphoribo-syltransferase
(
HPRT
) gene (autoradiographic assayin Galveston with slide review in Burlington; cloningassay in Leiden with mutational spectra determinedin Burlington); and
• chromosomal aberrations by the conventional methodand by fluorescence in situ hybridization [FISH]), andcytogenetic changes (sister chromatid exchanges [SCEs](Prague).
*A list of abbreviations and other terms appears at the end of the Investiga-tors’ Report. That list includes other names by which butadiene and itsmetabolites and adducts might be known.
This Investigators’ Report is one part of Health Effects Institute ResearchReport 116, which also includes a Commentary by the Health ReviewCommittee, and an HEI Statement about the research project. Correspon-dence concerning the Investigators’ Report may be addressed to Dr Rich-ard J Albertini, Genetic Toxicology Laboratory, University of Vermont, 655Spear Street, Building C, Burlington VT 05405;
Although this document was produced with partial funding by the UnitedStates Environmental Protection Agency under Assistance Award R82811201to the Health Effects Institute, it has not been subjected to the Agency’speer and administrative review and therefore may not necessarily reflectthe views of the Agency, and no official endorsement by it should beinferred. The contents of this document also have not been reviewed byprivate party institutions, including those that support the Health EffectsInstitute; therefore, it may not reflect the views or policies of these parties,and no endorsement by them should be inferred.
2
Biomarkers in Czech Workers Exposed to 1,3-Butadiene
All assay analysts were blinded to worker and sampleidentity and remained so until all work in that laboratoryhad been completed and reported. Assay results weresent to the Biometry Facility in Burlington for statisticalanalyses.
Analysis of questionnaire data revealed that the threeexposure groups were balanced with respect to age andyears of residence in the district, but the control group hadsignificantly more education than the other two groupsand included fewer smokers.
Group average BD exposures were 0.023 mg/m
3
(0.010ppm) for the control group, 0.642 mg/m
3
(0.290 ppm) forthe monomer group, and 1.794 mg/m
3
(0.812 ppm) for thepolymer group; exposure levels showed considerable vari-ability between and within individuals. Styrene exposureswere significantly higher in the polymer group than in theother two groups.
We found no statistically significant differences in thedistributions of metabolic genotypes over the three expo-sure groups; genotype frequencies were consistent withthose previously reported for this ethnic and national pop-ulation. Although some specific genotypes were associatedwith quantitative differences in urinary metabolite con-centrations or Hb adduct dose-response characteristics,none indicated a heightened susceptibility to BD.
Concentrations of both the M2 and M1 urinary metabo-lites and both the HBVal and THBVal Hb adducts were sig-nificantly correlated with group and individual mean BDexposure levels; the Hb adducts were more strongly corre-lated than the urinary metabolites. By contrast, no signifi-cant relations were observed between BD exposures and
HPRT
gene mutations (whether determined by the auto-radiographic or the cloning method) or any of the cyto-genetic biomarkers (whether determined by the conventionalmethod or FISH analysis). Neither the mutational nor thecytogenetic responses showed any association with geno-types. The molecular spectrum of
HPRT
mutations in BD-exposed workers showed a high frequency of deletions;but the same result was found in the unexposed controlsubjects, which suggests that these were not due to BDexposure. This lack of association between BD exposuresand genetic effects persisted even when control subjectswere excluded from the analyses or when we conductedregression analyses of individual workers exposed todifferent levels of BD.
OVERVIEW
BD is a highly volatile, four-carbon chemical (C
4
H
6
; CAS106-99-0). It is colorless and mildly aromatic, has a molec-ular weight of 54.09, and the chemical structure of CH
2
�
CH–CH
�
CH
2
(Weast 1989). With a boiling point of
�
4.4
�
C,a vapor pressure of 1900 mm Hg at 20
�
C, and low watersolubility, BD exists naturally as a gas and partitionsalmost entirely to the atmosphere on release (Kirshen-baum 1978). Once released, atmospheric destruction of BDoccurs in several ways, including reactions with ozone,nitrate radicals, or photochemically produced hydroxylradicals. BD spontaneously forms the 4-vinyl-cyclo-hexane dimer, is flammable, and can form explosive per-oxides at the appropriate atmospheric concentrations (Kirsh-enbaum 1978; US Department of Health and HumanServices [DHHS] 1992).
BD is an important industrial chemical used as an inter-mediate in the production of polymers, elastomers, andother chemicals. Although its major uses are in the manu-facture of styrene-BD rubber (SBR) and thermoplasticresins, it is present in many products including the fungi-cides captan and captfol (US Environmental ProtectionAgency [EPA] 1994).
Worldwide, the annual industrial production of BD isapproximately 12 billion pounds, of which 3 billion areproduced in the United States alone (Morrow 1990; USInternational Trade Commission 1990). Industrial workersare exposed to the highest BD levels; 8-hour time-weightedaverage (TWA) levels between 10 and 370 ppm (22.1 to817.7 mg/m
3
) have been reported (reviewed in Melnickand Kohn 1995; European Centre for Ecotoxicity andToxicology of Chemicals 1997; Himmelstein et al 1997;International Agency for Research on Cancer [IARC] 1999).These exposures and, to a lesser extent, those in thevicinity of industrial plants that produce or use the chem-ical are of most immediate concern because of the highconcentrations to which workers may be exposed.
Despite its importance as an industrial chemical, themajor source of BD in the ambient environment is emis-sions from gasoline- and diesel-powered vehicle engines.BD is formed as a product of incomplete combustion offossil fuels and is also released from burning tobacco, bio-mass, and automobile tires. More than 98% of the BDreleased to the environment is from mobile and other mis-cellaneous combustion sources (EPA 1994). Section 112 ofthe Clean Air Act Amendments of 1990 (US Congress1991) lists BD as 1 of 188 chemicals designated as haz-ardous; Section 211 of the Amendments lists it as 1 of5 chemicals designated as mobile-source toxic air pollut-ants. Furthermore, the EPA includes BD in its lists of

3
hazardous air pollutants and mobile-source air toxics (EPA1999, 2001). The EPA is required to develop a nationalstrategy to control the emissions of these hazardous airpollutants and reduce the cancer risk attributable to them.
A population much larger than industrial workers isexposed, albeit at lower individual levels, to 98% of thetotal BD released into the atmosphere from nonindustrialsources; these concentrations are estimated to be in therange of less than 2.21 to 22
�
g/m
3
(
�
1 to 10 parts perbillion [ppb]), with the highest levels found in urban air.Exposures at these levels may also have potential healthconsequences. Nonindustrial indoor exposures may ex-ceed outdoor exposures, especially when tobacco smoke ispresent. Measured BD levels in smoke-filled bars haveranged from 2.7 to 19
�
g/m
3
(1.2 to 8.6 ppb) (Löfroth et al1989; Brunnemann et al 1990). The high volatility andpoor water solubility of BD ensures that inhalation is themajor route of human exposure.
The potential for widespread human exposure to BD hasfocused attention on its health effects. Initially, BD wasthought to be relatively nontoxic; early control measureswere directed at the irritating effects that result from short-term exposures. On this basis, the permissible occupa-tional exposure limit (OEL) was set at 2210 mg/m
3
(1000ppm) (US Occupational Safety and Health Administration[OSHA] 1990). This standard did not take into consider-ation, however, that by the mid-1980s, long-term animalstudies of BD inhalation had revealed carcinogenicity inrodents (Huff et al 1985; Owens et al 1987; Irons et al1989). At the present time, reproductive and heritable dis-orders and cancer are the major human health concernsrelated to BD exposure.
Several risk assessments of BD carcinogenicity havebeen conducted by US and other health agencies over thepast 15 years. The California Air Resources Board (CARB;1991), US National Institute for Occupational Safety andHealth (NIOSH) (DHHS 1991), and OSHA (1996) haveevaluated BD for its potential carcinogenicity; CARB pro-vided no formal classification, but NIOSH and OSHA bothconcluded that it is at least potentially carcinogenic tohumans. As early as 1985, the EPA classified BD as a prob-able human carcinogen (EPA 1985). The most recentCancer Risk Assessment by EPA (2002) has concluded thatBD is carcinogenic to humans exposed by inhalation, witha lifetime exposure of 0.01 ppb producing an increase ofone cancer per million exposed individuals. This determi-nation of risk was based on the human data discussedabove. The US National Toxicology Program (NTP) namedBD as a known human carcinogen in the 9th edition ofits
Report on Carcinogens
(DHHS 2000). The Canadian En-vironmental Protection Act (Environment Canada 1999)
proposed a classification of known human carcinogen.IARC designated BD as a probable human carcinogen(Class 2A) in 1992; this classification was reviewed in1999 and, although upgrading BD to known human carcin-ogen (Class 1) had much support, the final decision was toretain Class 2A until more definitive human data are avail-able (IARC 1999).
Both great concerns and considerable uncertainties existabout the human cancer risks resulting from BD exposure.The uncertainties are due to (1) marked species differencesbetween rats and mice in their cancer susceptibility thatmake extrapolating study results to humans problematic;(2) inconsistencies in human epidemiologic data that allowfor varied interpretations; and (3) the limited informationabout levels of human exposures.
In the following sections, we summarize briefly the datarelevant to BD’s possible carcinogenicity and reproductivetoxicity for humans (much of which is based on studies inanimals) and the gaps in knowledge that limit toxicologicevaluation of this agent. We present the potential formolecular epidemiologic studies to fill these gaps andthe need for transitional epidemiologic studies, whichare the bridge between laboratory and field studies, toproperly interpret applied molecular studies.
EPIDEMIOLOGIC STUDIES IN HUMANS
Studies have been reported both for workers having rel-atively pure BD exposures (ie, in BD monomer production)and for workers with more complex exposures (ie, engagedin BD polymerization such as in the SBR industry). Thelargest study of monomer production workers involved2795 persons employed for at least 6 months between 1952and 1994 (Divine 1990; Divine et al 1993; Divine andHartman 1996). Two smaller studies of monomer produc-tion workers were also conducted (Downs et al 1987; Wardet al 1995, 1996a; Cowles et al 1994). Although one of thesmall studies and earlier updates of the large-cohort studyreported increases in hematologic malignancies (mainlylymphomas), these findings were inconsistent. Overall,the evidence for cancer induction in monomer produc-tion workers has been weak and without dose-relatedresponses. Positive associations between BD exposureand malignancies in monomer production workers werereported only for workers employed before 1950.
Different results have been found in studies of BD poly-merization workers. The largest SBR industry study of15,649 men from eight North American SBR plants, whichhas been reported in whole or in part in several publica-tions, found an increased leukemia risk (Meinhardt et al1982; Matanoski et al 1982, 1993; Santos-Burgoa et al 1992;
Overview

4
Biomarkers in Czech Workers Exposed to 1,3-Butadiene
Delzell et al 1996a,b; Macaluso et al 1996, 1997). However,that study found no increases in other lymphohematopoi-etic malignancies. The excess leukemia deaths were in jobcategories with relatively high BD exposures. Retrospec-tive dose reconstructions suggested an exposure-responserelation for BD, but no relation for styrene (Macaluso et al1996, 1997).
The epidemiologic findings in BD-exposed workers sug-gest but do not prove BD’s carcinogenicity for humans. Dif-ficulties in interpreting these findings result from lack ofconcurrent information on BD exposures, potentially con-founding factors, and the discordance between results inthe monomer production and SBR workers. Because theseepidemiologic studies have included almost the entireNorth American BD worker population, it is unlikely thatadditional data on direct human carcinogenicity will beforthcoming in the near future.
CANCER STUDIES IN RODENTS
The different carcinogenicity classifications of BD arebased in part on studies of mice and rats. Three of thesewere long-term bioassay studies with mice: In the first study,mice were exposed to 625 or 1250 ppm (1381.3 or 2762.5mg/m
3
) BD; but the study was terminated early because ofexcess mortality due to lymphomas (Huff et al 1985). In thesecond study, mice were exposed to 6.25, 20, 62.5, 200, or625 ppm (13.8, 44.2, 138.1, 442.0, or 1381.3 mg/m
3
) BD andshowed significantly increased incidences of tumors atmultiple organ sites in both sexes down to 20 ppm and oflung tumors in females down to 6.25 ppm (Melnick et al1990; DHHS 1993). A third study compared tumor inci-dences in B6C3F
1
mice and US National Institutes of HealthSwiss mice; this study demonstrated that BD-induced lym-phomas were not solely attributable to retroviral activationin the B6C3F
1
mice (Irons et al 1989). In the single cancerbioassay study with rats, Sprague-Dawley rats wereexposed to 1000 or 8000 ppm (2210 or 17,680 mg/m
3
) BD(Owen et al 1987). This study also showed different neo-plasms at multiple organ sites; however, the rats were twoto three orders of magnitude less sensitive to BD cancerinduction than mice. Differential sensitivity between thetwo species has been a major source of uncertainty inextrapolating animal data to humans.
In addition to the standard, intact-animal cancer bio-assays, other toxicologic evaluations have indicated thatBD and some of its metabolites are carcinogenic. Morethan thirty years ago, studies showed skin cancers in miceinduced by local applications of the metabolites 1,2-epoxy-3-butene (BDO) and 1,2,3,4-diepoxybutane (BDO
2
)(Van Duuren et al 1963, 1965). Early research also showed
that (1)
DL
-isomeric mixtures of BDO
2
(made up of equalquantities of isomers that are structural mirror images ofeach other) induced local sarcomas in both rats and miceafter subcutaneous injections, and (2) the
L
form wascarcinogenic to mice after intraperitoneal injections (VanDuuren et al 1966). BDO
2
administered to Sprague-Dawleyrats by injection produced elevated levels of guanylatecyclase (which was considered to be a surrogate marker forcancer) in liver, kidney, bladder, stomach, pancreas, colon,heart, and lung; this suggested that BDO
2
could producemalignancies (Vesely and Levey 1978). Finally, rat embryofibroblasts treated
in vitro
with BDO
2
showed features ofstructural transformation; injecting these cells into neo-natal rats resulted in malignant tumors (Wolman and Sivak1975).
Certain mutations (eg, K-
ras
and H-
ras
) and rearrange-ments of genomic regions associated with tumor suppressorgenes have been observed in the BD-induced tumors ofmice, which implicates genetic changes as the carcino-genic mechanism (Goodrow et al 1990, 1994). Althoughgenetic change is a mechanism applicable to all species(including humans), the chemical metabolites actuallyresponsible for carcinogenicity must be produced in thespecies for cancer to occur. Therefore, one explanationfor the differential susceptibility to BD’s carcinogenicitybetween mice and rats—with relevance for human riskassessment—is differential metabolism of BD in the tworodent species.
BD METABOLISM
BD itself is not biologically active. It must be meta-bolized in vivo to produce carcinogenic products. Anextremely complex metabolic pathway common to allspecies has been identified for BD; a simplified version isdepicted in
Figure 1 (modified from Himmelstein et al1997). All species oxidize BD to intermediates that canreact with DNA and are therefore potentially carcinogenic;all species can also detoxify these intermediates by con-verting reactive regions to less reactive sites and, in theprocess, making the compounds more water-soluble forexcretion in the urine.
BD is initially oxidized to BDO, a reaction mediated pri-marily by cytochrome P450 2E1 (CYP2E1) (reviewed inCsanády et al 1992; Dueschere and Elfarra 1994; Himmel-stein et al 1997). Further oxidation of BDO produces BDO
2
(Seaton et al 1995). BDO can also be detoxified by conjuga-tion with GSH (mediated by glutathione
S
–transferase[GST]) or by hydrolysis (mediated by epoxide hydrolase[EH]); the latter produces 1,2-dihydroxy-3-butene (BD-diol) (reviewed in Himmelstein et al 1997). Both BDO
2
and

5
Fig
ure
1.
A s
imp
lifi
ed,
com
mon
met
abol
ic s
chem
e fo
r B
D s
how
ing
the
uri
nar
y m
etab
olit
es a
nd
hem
oglo
bin
add
uct
s re
leva
nt
to t
his
stu
dy.
Th
e bo
x ar
oun
d a
ch
emic
al s
tru
ctu
re i
nd
icat
es t
hat
it
is a
n e
lect
rop
hil
ic (
or r
eact
ive)
epox
ide
met
abol
ite;
arr
ow w
ith
bro
ken
lin
es i
nd
icat
e so
me
un
cert
ain
ty a
bou
t th
is p
ath
way
.
Overview

6
Biomarkers in Czech Workers Exposed to 1,3-Butadiene
BD-diol undergo further conversions, BDO
2
by EH-mediatedhydrolysis and BD-diol presumably by oxidation medi-ated by cytochrome P450–related enzymes (CYP), toproduce 1,2-dihydroxy-3,4-epoxybutane (BDO-diol). BDO,BDO
2
, and BDO-diol are reactive electrophilic compounds;that is, they react with nucleophilic centers in macromole-cules (such as proteins and nucleic acids). Such reactionswith nucleic acids can result in direct damage to DNA.Thus, these three compounds, possibly among others, arethe potential carcinogenic intermediates of BD metabolismin vivo.
The BD metabolism scheme depicted in Figure 1 iscomplicated by the fact that the three electrophilic inter-mediates may exist in more than one stereoisomeric form(Krause and Elfarra 1997; Nieusma et al 1997, 1998; re-viewed in HEI 2000). Stereoisomers are different three-dimensional forms of a compound that have identicalchemical composition but that arise because of atomsbonding asymmetrically to a carbon atom (Figure 2). Forexample, BDO has one such asymmetric center that allowsfor two stereoisomeric forms, referred to as the left-hand(
S
) and right-hand (
R
) isomers. BDO
2
has two asymmetriccenters that allow for three stereoisomeric forms: the (
S
,
S
)
and (
R
,
R
) forms, in which the asymmetric centers are bothin the
S
or
R
configuration, and a third
meso
form, inwhich one center has the (
S
) and the other center has the(
R
) configuration to produce overall spatial symmetry inthe molecule. An isomeric mixture of BDO
2
(also referredto as
�
BDO
2
) contains both the
S
,
S
and
R
,
R
forms. Hydra-tion of these stereoisomeric forms of BDO
2
can result infour stereoisomers of BDO-diol: the (2
S
,3
R
), (2
R
,3
S
),(2
R
,3
R
), and (2
S
,3
S
) forms. Therefore, the metabolism ofBD according to the scheme shown in Figure 1 can yieldnine different stereoisomeric forms of the three electro-philic intermediates (Figure 2). Because enzyme reactionswith an intermediate may be specific to a particular stereo-isomer, its level may dictate the final
metabolic outcomesin vivo.
Figure 1 also depicts the pathways that lead to the uri-nary M2 and M1 metabolites. First, direct GST-mediatedconjugation of BDO with glutathione (GSH) leads to thedetoxification product M2, which is a biomarker of the con-jugation detoxification pathway. Second, further metabo-lism of BD-diol by multiple steps involving alcohol dehy-drogenase and aldehyde dehydrogenase (ADH), CYP, andGST-mediated conjugation with GSH leads to the produc-tion of M1. M1 is a biomarker of the hydrolytic detoxifica-tion pathway for BDO (via BD-diol) because it is mediatedinitially by EH. The ratio of M1/(M1
�
M2) in urine de-fines the relative importance of hydrolysis vs conjugationin the detoxification of BDO (Bechtold et al 1994; reviewedin Henderson et al 1996).
BD METABOLISM IN RODENTS
In vitro studies have shown that mice are more efficientthan rats in oxidizing BD to BDO (Csanády et al 1992). Thesecond oxidation step from BDO to BDO
2
also has beenshown in vitro; this reaction occurs more readily in mouseliver microsomes than in rat or human liver microsomes(Csanády et al 1992; Seaton et al 1995; Krause and Elfarra1997).
In vivo studies of BD metabolism in mice and rats havealso shown large interspecies differences. Mice exposed byinhalation removed BD from the atmosphere twice as rap-idly as rats but retained fivefold more radioactivity frominhaled [
14
C]BD (Bond et al 1986; Kreiling et al 1986; Dahlet al 1991; Richardson et al 1999). Mean concentrations ofBDO in liver and lung following BD exposure by inhala-tion were approximately 10-fold to 15-fold greater in micethan in rats (Himmelstein et al 1995). Thornton-Manningand colleagues (1995) found both BDO and BDO
2
in miceand rats exposed to BD by inhalation; concentrations ofboth metabolites were greater in mice than in rats: BDO
Figure 2. Stereochemistry of BD. In some molecules, the asymmetricbonding of some atoms to a carbon atom causes “left hand” (S) and “righthand” (R) forms (called stereoisomers) to exist. These forms with asym-metric centers, which are considered mirror images, are chemically sim-ilar but differ in their three-dimensional configuration. Oxidation of BDto BDO produces one asymmetric center, hence (S)- and (R)-BDO. Furtheroxidation converts (R)- and (S)-BDO to three forms of BDO2. [The desig-nations (R,R) and (S,S) indicate two asymmetric centers; the meso formalso has two asymmetric centers, but their spatial configurations yieldoverall symmetry within the molecule.] Hydration of the three BDO2
forms can produce four forms of BDO-diol. Thus, nine possible ster-eochemical configurations exist for the three BD epoxides. (Adapted withpermission from Nieusma et al 1998.)
7
was threefold to eightfold greater, and BDO
2
was 40-fold to160-fold greater. M1/(M1
�
M2) ratios in urine for mice(0.19) and rats (0.52) exposed to BD by inhalation indicatethat detoxification by GSH conjugation predominates inmice, but that hydrolysis is more important in rats (Hen-derson et al 1996).
Thus, mice are more efficient in oxidizing BD to electro-philic metabolites (especially to BDO
2
), whereas rats aremore efficient in hydrolytic detoxification. This may be themajor reason why BD is more carcinogenic in mice than inrats. It is of extreme importance, therefore, that the humanmetabolic profile of this agent be determined because itmay indicate which, if either, of the rodent species is theappropriate cancer model for risk extrapolation.
MOLECULAR DOSIMETRY
Chemical carcinogens that act through damage to DNAare referred to as electrophilic; that is, they react withnucleophilic centers in macromolecules such as proteinsand nucleic acids. This electrophilic property is foundin the BD metabolites. Some chemicals that are boundcovalently to proteins neither damage the genetic materialnor lead directly to cancer. However, the resulting adductscan be measured to provide an indication of the internaldose of the in vivo concentrations of different metabolitesof a chemical to which a subject has been exposed. The BDmetabolite BDO has been shown to react with Hb to formHBVal adducts (Osterman Golkar et al 1991, 1993; VanSittert and Van Vliet 1994); THBVal, a second Hb adduct,has also been identified (Perez et al 1997; Swenberg et al2000a). These two adducts are particularly useful asinternal dosimeters of BD metabolites (Osterman-Golkar etal 1993; Perez et al 1997; Swenberg et al 2000a).
Osterman-Golkar and associates (1991, 1993) measuredthe HBVal Hb adducts produced by BDO in both B6C3F
1
mice and Sprague-Dawley rats exposed to BD by inhala-tion; they found linearity in the mouse and nonlinearity(supralinearity) in the rat; that is, at 10 to 100 ppm BD(22.1 to 221 mg/m
3
), mice showed a fivefold greater adductconcentration than rats, whereas at exposures of less than10 ppm, the concentration in mice was only 1.7-foldhigher. Swenberg and coworkers (2000a) showed that miceexposed to higher levels of BD showed 2.3-fold (males)and 1.9-fold (females) greater HBVal adduct concentrationsthan did rats.
The THBVal Hb adducts can be produced by eitherBDO
2
or BDO-diol, although current evidence indicatesthat they derive almost entirely from BDO-diol (Perez et al1997; Koivisto et al 1999). After exposure to 1000 ppm(2210.0 mg/m
3
) BD by inhalation, the average concentrations
of THBVal adducts in males and females were 4.3-foldgreater in mice than in rats (Swenberg et al 2000a). Withina species, the ratio of total THBVal to total HBVal adductconcentrations was 6.3 for male mice, 3.4 for female mice,1.8 for male rats, and 2.5 for female rats; this indicatesthat the BDO-diol metabolite is the most abundant elec-trophilic product of in vivo BD metabolism in both spe-cies and that mice produce more than rats (Perez et al1997; Koivisto et al 1999; Swenberg et al 2000a).
BD metabolites also form covalent adducts with DNA inall species (Citti et al 1984; Jelitto et al 1989; Leuratti et al1994; Neagu et al 1995; Bolt and Jelitto 1996; Kumar etal 1996; Selzer and Elfarra 1996a,b; Koivisto et al 1996,1997, 1998a,b, 1999; Tretyakova et al 1997a,b,c, 1998; Boo-gaard et al 1998, 2000, 2001, unpublished results 2003; Kocet al 1999; Blair et al 2000). N7-(2-hydroxy-3-butenyl)gua-nine or N6-adenine adducts (or both) derived from BDOhave been found in lung, liver, and testes of mice and inlung and liver of rats exposed to BD by inhalation(Koivisto et al 1996, 1997, 1998; Blair et al 2000). N7-(2,3,4-trihydroxybutyl)guanine adducts derived fromBDO-diol
have also been detected in liver DNA from miceand rats exposed to BD by inhalation (Tretyakova et al1998; Blair et al 2000). Compared with rats, mice showedbetween twofold and threefold more liver DNA damagefrom these adducts.
Identifying the levels of BDO, BDO
2
, and BDO-diol inhumans would help to identify which rodent species maybe the better model of cancer risks in humans. BD metabo-lism studies using human liver have suggested thathumans are more like rats than mice in the amount and typeof metabolites formed; however, considerable interindi-vidual variation has been noted (Seaton et al 1995; Boo-gaard and Bond 1996; Boogaard et al 1996). Recent molec-ular dosimetry studies on DNA adducts of BD in rodentshave shown results similar to those of analogous studies ofHb adducts of BD in rodents: BDO-diol was the major elec-trophilic metabolite of BD and accounted for approxi-mately 98% of the DNA adducts formed (Koc et al 1999;Koivisto et al 1999; Boogaard et al 2000, 2001, unpub-lished results 2003; Swenberg et al 2000b; van Sittert et al2000). This was a highly significant finding because (1)none of the earlier metabolism studies had measured BDO-diol, and (2) it is the weakest mutagen of the three electro-philic metabolites in that it is 1/200th as potent as BDO
2
(Cochrane and Skopek 1994a). Although BDO-diol can beformed by either oxidation of BD-diol or hydrolysis ofBDO
2
, the molecular dosimetry studies of DNA adductsstrongly support hydrolysis as the primary pathway (Kocet al 1999; Boogaard et al unpublished results 2003). TheHb and DNA adduct data are consistent with the results of
Overview

8
Biomarkers in Czech Workers Exposed to 1,3-Butadiene
metabolic studies in mice and rats, all of which indicatethat mice are more efficient than rats in oxidizing BD to itselectrophilic intermediates.
GENOTOXICITY OF BD
BD is unambiguously an animal carcinogen. This raisesthe question as to whether BD poses a cancer risk tohumans. Although the studies of differential metabolismin animals help to identify the appropriate animal modelto apply to human health risk assessment, it is even morefundamental to identify the underlying carcinogenic mech-anisms. The degree to which animal carcinogenicity datamay be extrapolated to humans depends in large part onthese mechanisms, some of which may be unique to thetest species. If a carcinogenic mechanism is unique to ananimal test species, then the animal test results are not rel-evant for assessing risks to humans.
Most carcinogenic agents, however, produce cancer bymechanisms that are common to all species. One suchmechanism is genotoxicity, in which the agent of concernis carcinogenic because it induces mutations in cancer-relevant genes or genetic regions in its target tissues.
The genotoxicity of BD metabolites has been demon-strated in all experimental systems that have providedmetabolism (reviewed in de Meester 1988; Adler et al1994, 1995a,b,c; Adler and Anderson 1994; Jacobson-Kram and Rosenthal 1995; Himmelstein et al 1997;Pacchierotti et al 1998; Jackson et al 2000). The mutage-nicity of BD has been demonstrated many times over withthe Ames test, in which metabolic activation is achievedby adding S9 fractions of liver from various species(deMeester et al 1980; Rosenthal 1985; deMeester 1988;Arce et al 1990; Norppa and Sorsa 1993; Jacobson-Kramand Rosenthal 1995). BDO
2
was the most potent mutagenwhen the three electrophilic BD intermediates were testedseparately. BD metabolites have also induced gene muta-tions in eukaryotic microorganisms and insects (deMeester1988), as well as in mammalian cells in vitro (Sernau et al1986; McGregor et al 1991; Cochrane and Skopek 1993,1994a,b; Recio et al 2000). Comparing the mutagenicpotencies of BDO, BDO
2, and BDO-diol in cultured humancells showed that, on a molar basis, BDO2 was 100-foldmore potent than BDO and 350-fold more potent thanBDO-diol (Cochrane and Skopek 1994a).
The kinds of mutational changes induced by BD metab-olites in vitro have been studied by analyses of mutationalspectra. Early studies showed increased frequencies ofA→T base substitutions, which suggests that adenineadducts have a greater mutagenic potential than guanineadducts (Steen et al 1997a,b). More recent studies, however,
found base substitutions of guanine in addition to thechanges at adenine sites (Recio et al 2000). Of note, BDO2,which preferentially induces A→T base substitutions inhuman cells, also significantly increased the frequenciesof large gene deletions (Recio et al 2000). These spectraare consistent with the monofunctional or bifunctionalalkylations expected by the BDO and BDO2 metabolites,respectively.
Mammalian cells in culture, including those fromhumans, have also shown chromosome-level genetic changesfollowing BDO or BDO2 exposures (IARC 1999). BDO2 wasagain the more potent of the two metabolites; effectiveBDO2 concentrations for inducing SCEs were 10-foldlower in Chinese hamster ovary cells and 50-fold lower inhuman lymphocytes than BDO concentrations (Sasiadek etal 1991a,b). Detoxification of the BD metabolites is appar-ently important in protecting human cells from chromo-some-level changes. Lymphocytes from individuals whowere homozygous for the GSTT1-null allele (the allele thatlacks function and cannot produce the GSTT1 isozyme)showed significantly higher percentages of SCEs followingexposure to BDO2 in vitro; this was not true for lympho-cytes from individuals who are homozygous for theGSTM1-null allele (Kelsey et al 1995; Norppa et al 1995).By contrast, lymphocytes from individuals with theGSTM1-null genotype were more susceptible to SCEinduction by BDO in vitro (Uuskula et al 1995), althoughneither GSTT1 nor GSTM1 genotypes affected SCE levelsfollowing exposure to BDO-diol in vitro (Bernadini et al1996).
Mutation studies in animals exposed to BD in vivoallow comparisons with animal carcinogenicity data andpotential extrapolations to humans (Recio et al 1992, 1998;Adler et al 1994; Cochrane and Skopek 1994b; Sisk et al1994; Tates et al 1994; Recio and Meyer 1995; Meng et al1998, 1999; Tates et al 1998; Walker and Meng 2000).Exposures of mice and rats to BD by inhalation haveshown induction of somatic gene mutations (mostly atHPRT). In mice, the dose-response curves suggest that BDhas greater mutagenic potency at low doses than at highdoses (Walker and Meng 2000). In vivo studies using dif-ferent BD metabolites have indicated that BDO2 is themetabolite responsible for BD’s in vivo mutagenicity atlow exposure concentrations. Furthermore, molecular anal-yses of HPRT mutations showed a statistically significantincrease in large deletions of genes in BD-exposed mice,which is also consistent with BDO2 being the importantmutagenic intermediate (Walker and Meng 2000).
Studies of rats exposed in vivo to BD showed significantincreases in HPRT mutations at only the highest concen-tration (625 ppm; 1381.3 mg/m3) of a multidose experiment;

9
the mutagenic potency in rats was 8.5-fold lower than inmice (Meng et al 1998, 1999; Walker and Meng 2000).Administration of BDO2 also induced HPRT mutations inrats at even higher frequencies than it did in mice, whichindicates that this metabolite is mutagenic in rats. How-ever, direct administration of BDO2 circumvented the met-abolic pathways necessary to produce BDO2 in vivo; andin rats exposed to BD (rather than directly to BDO2), theformation of BDO2 is minor (Thornton-Manning et al1995).
Numerous investigators have measured BD-inducedchromosomal changes in vivo in blood cells of mice (Ironset al 1987; Tice et al 1987; Jauhar et al 1988; Shelby 1990;Autio et al 1994; Xiao and Tates 1995; Xiao et al 1996;Stephanou et al 1997, 1998; reviewed in Pacchierotti et al1998 and Jackson et al 2000). Significant increases havebeen observed for SCEs, micronuclei, and chromosomalaberrations. Dose-response relations were usually non-linear (supralinear) (Autio et al 1994). BDO, BDO2, andBDO-diol have also been shown to produce micronuclei inmurine blood cells in vivo after injection (Xiao and Tates1995; Adler et al 1997; Stephanou et al 1997, 1998;reviewed in Pacchierotti et al 1998). Again, BDO2 wasmost effective, followed by BDO and BDO-diol. Signifi-cantly, chromosome-level genotoxic changes have neverbeen demonstrated in vivo in somatic cells of rats fol-lowing exposure to the parent compound BD (reviewedin Pacchierotti et al 1998). However, both the BDO andBDO2 metabolites administered by injection did producechromosomal changes in rats; once again, BDO2 wasmore effective than BDO (Xiao and Tates 1995; Andersonet al 1997; Lähdetie and Grawé 1997). Again, directadministration of the metabolites circumvented the in vivoproduction in rats.
The germ cells of rodents exposed to BD or its metabo-lites or both also show genetic changes. Dominantlethality, an expression of chromosomal aberrations ingerm cells, was shown in mice (Anderson et al 1996, 1998;Adler et al 1998) but not in rats (Anderson et al 1998). Aswas found for somatic cells, therefore, the germ cells ofrats appear to resist chromosome-level genetic damage dueto BD, although chromosome-level changes induced invivo in germ cells by BD metabolites (as distinct from theparent compound) has been demonstrated in both speciesby many investigators (Adler et al 1995c, 1997; Xiao andTates 1995; Anderson et al 1997; Lähdetie et al 1997).
In summary, the BD metabolites BDO, BDO2, and BDO-diol are mutagenic in all systems; potencies follow theorder of BDO2 � BDO � BDO-diol. In vivo, both gene-leveland chromosome-level mutations have been shown inmice, but only gene-level changes have been shown in rats
following exposure to BD. Even at the gene level, BD’smutagenic potency is much greater in mice than in rats. Incontrast to the parent compound BD, the metabolites of BDare mutagenic in vivo at both levels in both species. Theseobservations are consistent with the results of metabolicstudies, Hb adduct data, and the relative susceptibility toBD’s carcinogenicity in the two species.
MOLECULAR EPIDEMIOLOGIC STUDIES IN HUMANS
Several health regulatory agencies, including the EPA,are considering methodologic modifications for assessingchemicals as carcinogens. As a complement to direct car-cinogenicity data in animals or humans, a weight-of-evidence approach that includes noncancer endpoints isbeing considered. BD clearly causes cancer in animals andis genotoxic; therefore, it is a genotoxic carcinogen. Withthe newer methodologic approach, conclusive evidence ofits genotoxicity in humans may be used to assess the riskof cancer in humans.
Molecular epidemiology is an emerging subdisciplineof epidemiology, which is the study of human popula-tions. Rather than reporting disease distributions, molec-ular epidemiology seeks to detect deleterious environ-mental agents or their metabolites in accessible bodymatrices, measure the biological responses to these agents,and define genotypic or phenotypic factors that modify anindividual’s susceptibility to a specific agent. Molecularepidemiology might be thought of as the study ofsurrogates—surrogates of exposure, surrogates of effect,and surrogates of susceptibility—for the purpose of identi-fying causes of disease in humans, for predicting potentialdisease outcomes, for developing strategies for risk assess-ment, and, ultimately, for designing effective preventivemeasures.
Molecular epidemiologic studies of humans exposed toBD could provide evidence that this agent is metabolizedto genotoxic intermediates, characterize this metabolism,and determine if overt genotoxicity can be demonstrated atthe exposure levels encountered. Several such studieshave now been completed and have provided preliminarydata (see Table 1 and the references included in it) to com-pare with data from animals exposed to BD.
Several investigators have measured biomarkers of BDmetabolism in subjects exposed in occupational settings.These biomarkers have included the urinary M1 metabo-lite and the Hb adducts HBVal and THBVal. One studyof Texas monomer production workers showed thatHBVal adducts are produced by an average BD exposure of3.5 ppm (7.7 mg/m3) at a rate of 0.004 pmol/g globin/hr(Osterman-Golkar et al 1993). In a study of Chinese workers,
Overview

10
Biomarkers in Czech Workers Exposed to 1,3-Butadiene
Tabl
e 1.
Su
mm
ary
Res
ult
s fr
om S
tud
ies
of F
our
BD
Wor
ker
Coh
orts
in
Wh
ich
Exp
osu
re L
evel
s W
ere
Com
par
ed w
ith
Bio
mar
kers
a
Texa
s M
onom
er P
rod
uct
ion
Wor
kers
Texa
s S
BR
Pro
du
ctio
n
Wor
kers
Cze
ch R
epu
blic
Mon
omer
an
d S
BR
P
rod
uct
ion
Wor
kers
Ch
ines
e P
olym
eriz
atio
n
Wor
kers
En
dp
oin
tS
tud
y 1
Stu
dy
2S
tud
y 1
Stu
dy
2
Uri
nar
y M
etab
olit
eM
1D
ose-
resp
onse
el
evat
ion
[W
ard
et
al
1994
]
Equ
ivoc
al e
leva
tion
[War
d e
t al
199
6b]
Ele
vate
d w
ith
BD
ex
pos
ure
[Am
men
heu
ser
et a
l 20
01]
Ad
du
cts
Hb
Few
wor
kers
sh
owed
elev
atio
n [
Ost
erm
an-
Gol
kar
et a
l 19
93]
Ele
vate
d H
BV
al w
ith
BD
ex
pos
ure
[S
orsa
et
al
1994
]
Elev
ated
TH
BV
al w
ith
BD
ex
posu
re [H
ayes
et
al
2000
; Sw
enbe
rg e
t al
20
00a]
DN
AE
leva
ted
N-1
-TH
B-A
w
ith
BD
exp
osu
re
[Zh
ao e
t al
200
0]
Met
hod
of
Ass
essi
ng
Som
atic
Gen
e M
uta
tion
sA
uto
rad
iogr
aph
yD
ose-
resp
onse
el
evat
ion
[W
ard
et
al
1994
]
Ele
vate
d w
ith
BD
ex
pos
ure
[W
ard
et
al
1996
b]
Ele
vate
d w
ith
BD
exp
osu
re
[War
d e
t al
199
6b, 2
001;
A
mm
enh
euse
r et
al
2001
]
Clo
nin
gE
leva
ted
wit
h B
D
exp
osu
re (
mu
tati
on
spec
tra
con
sist
ent
wit
hB
D e
ffec
t) [
Ma
et a
l 20
00]
No
chan
ges
[Tat
es e
t al
199
6]N
o ch
ange
s[T
ates
et
al 1
996]
No
chan
ges
[Hay
es e
t al
200
0]
Ch
rom
osom
al M
uta
tion
s or
Met
hod
of
Ass
essi
ng
Th
emA
berr
atio
ns
No
chan
ges;
then
ele
vate
d
wh
en r
eeva
luat
ed b
y G
ST
sta
tus
[Sor
sa e
t al
19
94, 1
996]
Ele
vate
d w
ith
BD
exp
osu
re
[rá
m e
t al
199
8]
SC
Es
Ele
vate
d w
ith
BD
exp
osu
re
[rá
m e
t al
199
8]N
o ch
ange
s[H
ayes
et
al 2
000]
Mic
ron
ucl
eus
assa
yN
o ch
ange
s; a
lso
no
chan
ges
by c
omet
ass
ay[
rám
et
al 1
998]
An
eup
loid
yN
o ch
ange
s[H
ayes
et
al 2
000]
Ch
alle
nge
ass
ayE
leva
ted
wit
h B
D
exp
osu
re [
Au
et
al
1995
]
a E
xpos
ure
s w
ere
mea
sure
d b
y p
erso
nal
mon
itor
ing,
air
mon
itor
ing,
or
both
at
a si
ngl
e ti
me
poi
nt,
usu
ally
wh
en b
iolo
gica
l sa
mp
les
wer
e co
llec
ted
.
S S S

11
THBVal adduct concentrations were plotted against meanexposure levels for 33 workers (range 1–3.5 ppm) and 25control subjects (0 ppm); the plot showed a regressionslope significantly greater than 0 (r2 � 0.33) (Swenberg etal 2000a). One point of note was that the THBVal adductconcentrations in this and other studies were occasionallyhigher than expected in unexposed control subjects; thissuggests that either the adduct was not specific for BD, or itwas endogenously produced, or both.
DNA adducts in BD-exposed workers have also beenstudied (Zhao et al 2000) (Table 1). Workers in a monomerproduction facility with BD exposures ranging from lessthan 0.02 to 37.6 mg/m3 (� 0.009 to 17.01 ppm) had N-1-(2,3,4-trihydroxybutyl)adenine (N-1-THB-A) adduct levelsranging from less than 0.1 (limit of detection [LOD]) to25.0 adducts/109 nucleotides (mean of 4.5 adducts/109
nucleotides). By contrast, mean N-1-THB-A levels weresignificantly lower in the 11 unexposed control subjects.Adduct levels in exposed workers appeared to correlatewith BD exposures.
Overt genotoxicity has also been investigated in BD-exposed humans with inconsistent findings. One labora-tory conducted four studies of BD-exposed workers inTexas facilities (Osterman-Golkar et al 1993; Ward et al1994, 1996b, 2001; Au et al 1995; Ma et al 2000; Ammen-heuser et al 2001); three of these studies showed positiveresults using the autoradiographic assay for HPRT muta-tions and the fourth study (Ma et al 2000) showed positiveresults using the cloning assay for HPRT mutations. Muta-tional spectra data were compatible with the HPRT muta-tions being induced by exposure to BD in that an excess ofdeletions was found. By contrast, two studies in other lab-oratories, both using the cloning assay, failed to findincreases in mutations in BD-exposed Chinese (Hayes et al2000) and Czech (Tates et al 1996) workers even thoughthe BD concentrations were similar to those in the studiesof Texas workers.
Furthermore, no increases in chromosomal aberrationswere found in the Texas facilities, although a challenge assay,possibly measuring unexpressed chromosomal damage,was positive (Au et al 1995). A study of Czech BD workersalso failed to show evidence of BD-induced chromosomalaberrations, SCEs, or micronuclei on original analysis(Sorsa et al 1994). However, reanalysis with respect to GSTgenotypes showed that the BD-exposed workers who werehomozygous for the GSTT1-null genotype had signifi-cantly higher aberration frequencies than the subjects whowere not (Sorsa et al 1996). A later in vivo study of theseCzech workers did show significant elevations in chromo-somal aberrations and SCEs in the BD-exposed group
(average 1.6 to 1.8 ppm [3.5 to 4.0 mg/m3]) compared withthe control workers ( rám et al 1998). However, the studyof Chinese BD polymerization workers referenced aboveproduced negative results for SCEs and aneuploidy (Hayeset al 2000).
THE CURRENT STUDY
The current study was designed to address some of thesignificant knowledge gaps in the toxicity profile for BD inhumans and to focus on methods that may be used in thefuture to evaluate human health risks. Definitive evi-dence for human carcinogenicity must come from humanstudies, which to date have produced only suggestiveresults. Interpretation of both the in vivo genotoxicitystudies and the epidemiologic studies has been complicatedby uncertainties about exposure doses and by potentialconfounders. Measures for overcoming these limitationswere the focus of the current study.
One method for reducing uncertainties of exposure inepidemiologic studies is to use biomarkers to determinedoses (Albertini 1998). The mere availability of biomarkers,however, does not mean that they will be useful for humanstudies directed at public health issues. Although the cur-rent armamentarium is large, few biomarkers have beenvalidated to the point of known usefulness for epidemio-logic studies (Albertini 1998). The human studies thatassess and validate a biomarker have been termed “tran-sitional” studies because they bridge the gap betweenpurely laboratory investigations and field studies. A transi-tional study focuses on the biomarker, which is the depen-dent variable; the environmental exposure or adversehealth outcome, which the biomarker is supposed to reflector predict, is the independent variable. Such a study de-signed to validate a biomarker as a true measure of expo-sure or effect must first accurately measure the exposure orthe health outcome because these are the standards againstwhich the biomarker is assessed.
Several studies have measured biomarkers in humansoccupationally exposed to BD (Table 1). However, inmost instances, these assessments of biomarkers wereuseful to prove the principle that biomarkers could beidentified rather than providing definitive validation ofwhat the biomarker reflects. In terms of validating a bio-marker as a surrogate measure of exposure, few if any ofthe studies thus far conducted have measured BD expo-sure levels exhaustively over time or at a given point intime determined to be appropriate for the biomarkerbeing studied.
The current research was designed to rigorously evaluateseveral biomarkers for their utility as in vivo indicators of
S
Overview

12
Biomarkers in Czech Workers Exposed to 1,3-Butadiene
BD exposure levels in workers and thereby validate themfor use in future epidemiologic studies. To this end,exhaustive external measurements of the workers’ expo-sures were made. We evaluated several conventionalbiomarkers of exposure: BD urinary M2 and M1 metaboliteconcentrations, and HBVal and THBVal Hb adducts.However, conventional biomarkers of effect also reflectinternal doses of deleterious agents; thus, we evaluatedseveral measures of genetic effects. These includedHPRT gene mutations, measured by the two differentassays used in past studies, and a variety of indicators ofchromosomal damage. We also genotyped all subjects sowe could evaluate certain genotypes as biomarkers ofsusceptibility that might indicate heightened individualresponses to BD.
Although this study was designed to evaluate biomarkersonly for their sensitivity in detecting BD exposures, theresults provide additional evidence about the genotoxicityof BD for humans. Evidence for genotoxicity was evaluatedin the context of (1) exhaustive external BD exposure mea-surements and (2) biomarkers of exposure that can corrob-orate the exposure measurements. This will add to theweight-of-evidence evaluations of BD’s carcinogenicity orreproductive toxicity for humans.
SPECIFIC AIMS
The overall objective of this research was to rigorouslyevaluate a series of discrete nondisease biological end-points (specifically, biomarkers in blood or urine) for theirutility as in vivo indicators of BD exposure levels in theoccupational setting. These endpoints represent pointsalong a continuum from external BD exposure to the mani-festation of disease. The overall research proceeded in twodistinct phases. Phase I was a preliminary assessment toestablish conditions for the definitive study in Phase II.Later, data and biological materials that had been collectedin Phase II underwent supplemental analyses. Each phaseand the supplemental analyses portion had its own set ofspecific aims.
PHASE I
Phase I began on 1 April 1997 and concluded on 31March 1998. The final report for Phase I was submitted tothe Health Effects Institute on 7 June 1998 and is notincluded here. Its specific aims were:
1. to identify potential factors that could compromisethe definitive study;
2. to select a Study Coordinating Committee responsiblefor finalizing the definitive study protocol and ana-lyzing the results;
3. to develop an exposure assessment protocol for PhaseII; and
4. to propose a definitive protocol and budget for PhaseII of the project.
PHASE II
Phase II began on 1 January 1998. Its specific aims were:
1. to precisely characterize BD exposures in workers byserial personal monitoring and replicate workplacearea measurements in the industrial facilities nearPrague;
2. to obtain blood and urine samples from each exposedworker and appropriate control subjects for imme-diate processing;
3. to measure biomarkers in laboratories with demon-strated expertise in the following specific assays:
• biomarkers of exposure: concentrations of urinaryM2 and M1 metabolites and of HBVal and THBValHb adducts;
• biomarkers of effect (for validation as exposure sur-rogates): HPRT mutations in T cells determined byboth autoradiography and cloning as evidence of
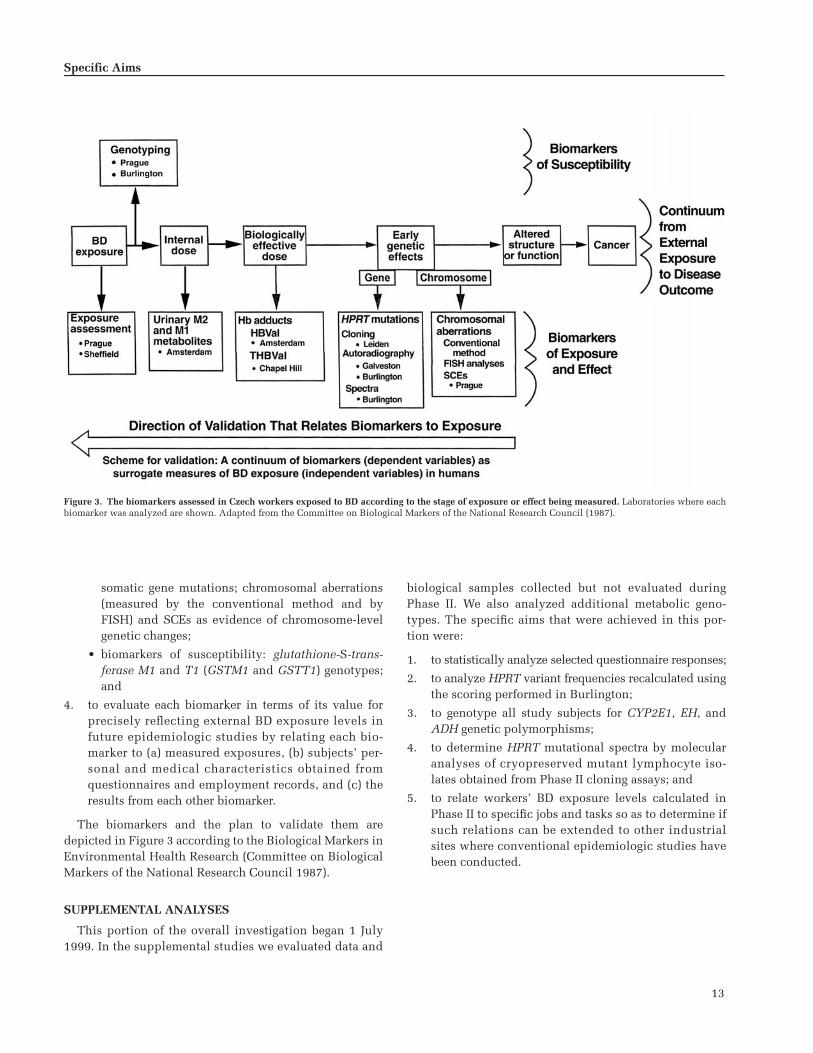
13
somatic gene mutations; chromosomal aberrations(measured by the conventional method and byFISH) and SCEs as evidence of chromosome-levelgenetic changes;
• biomarkers of susceptibility: glutathione-S-trans-ferase M1 and T1 (GSTM1 and GSTT1) genotypes;and
4. to evaluate each biomarker in terms of its value forprecisely reflecting external BD exposure levels infuture epidemiologic studies by relating each bio-marker to (a) measured exposures, (b) subjects’ per-sonal and medical characteristics obtained fromquestionnaires and employment records, and (c) theresults from each other biomarker.
The biomarkers and the plan to validate them aredepicted in Figure 3 according to the Biological Markers inEnvironmental Health Research (Committee on BiologicalMarkers of the National Research Council 1987).
SUPPLEMENTAL ANALYSES
This portion of the overall investigation began 1 July1999. In the supplemental studies we evaluated data and
biological samples collected but not evaluated duringPhase II. We also analyzed additional metabolic geno-types. The specific aims that were achieved in this por-tion were:
1. to statistically analyze selected questionnaire responses;
2. to analyze HPRT variant frequencies recalculated usingthe scoring performed in Burlington;
3. to genotype all study subjects for CYP2E1, EH, andADH genetic polymorphisms;
4. to determine HPRT mutational spectra by molecularanalyses of cryopreserved mutant lymphocyte iso-lates obtained from Phase II cloning assays; and
5. to relate workers’ BD exposure levels calculated inPhase II to specific jobs and tasks so as to determine ifsuch relations can be extended to other industrialsites where conventional epidemiologic studies havebeen conducted.
Specific Aims
Figure 3. The biomarkers assessed in Czech workers exposed to BD according to the stage of exposure or effect being measured. Laboratories where eachbiomarker was analyzed are shown. Adapted from the Committee on Biological Markers of the National Research Council (1987).

14
Biomarkers in Czech Workers Exposed to 1,3-Butadiene
STUDY DESIGN: SUBJECT SELECTION, SAMPLE ACQUISITION AND HANDLING, AND STATISTICAL METHODS
This transitional epidemiologic study evaluated severalbiomarkers for their sensitivity to reflect known, low-doseBD exposure levels in occupational settings. The studyfocused on biomarkers, which were the dependent vari-ables; BD exposures were carefully determined as theindependent variables. The cross-sectional design wascombined with a longitudinal component: BD exposureswere measured at several time points before the biologicalsamples were obtained to determine whether the bio-markers would reflect the exposures. Medical informationwas obtained for each subject to identify and adjust for fac-tors that could modify the biomarkers’ responses to BDexposure.
Eight institutions cooperated to accomplish the variousstages and activities of this study (bold type indicates theplace name used to identify each institution throughoutthe report):
• the BD and SBR manufacturing facilities near Prague,the Czech Republic; all exposed and control subjectswere employed, exposures occurred in the course ofwork activities, exposure levels were assessed, ques-tionnaires were completed, and biological sampleswere collected;
• the Laboratory of Genetic Ecotoxicology, Prague, theCzech Republic; biological samples were processed,coded, and cryopreserved; some biomarker assayswere conducted; samples for other assays were shippedto other laboratories;
• Health and Safety Laboratory, Sheffield, United King-dom; sorbent tubes used for personal monitoring wereanalyzed for concentrations of BD and other volatileorganic compounds (VOCs);
• Leiden University, Leiden, The Netherlands; HPRTmutation assays were undertaken using the cloningprotocol;
• University of Texas Medical Branch at Galveston,Galveston, Texas, USA; HPRT mutation assays wereundertaken using the autoradiographic protocol;
• Shell International Chemicals, BV, Amsterdam, TheNetherlands; urinary M2 and M1 metabolites andHBVal Hb adduct assays were conducted;
• University of North Carolina at Chapel Hill, ChapelHill, North Carolina, USA; THBVal Hb adduct assayswere conducted; and
• University of Vermont, Burlington, Vermont, USA;the central study office; procedures for genotyping
subjects for CYP2E1, ADH, and EH were carried out;autoradiographic slides for HPRT variant frequencieswere scored for verification; HPRT mutational spectrawere determined; codes and data were maintainedand analyzed; final reports were prepared.
The experimental protocol was approved by the Institu-tional Review Boards at both the Regional Institute ofHygiene of Central Bohemia and the University of Ver-mont, USA. All research was conducted in accordancewith the Helsinki principles.
SUBJECT SELECTION AND EXPOSURE ASSESSMENT
All 83 subjects in this study were men employed by asingle company. Two groups of workers with possibleoccupational exposures to BD were included: 24 in the BDmonomer production facility (which comprised the entireproduction staff) and 34 in the BD polymerization facility(about half the work force). Of those not studied at thepolymerization facility, most worked for an independentcontractor who chose not to participate; a few wereemployed by the primary company and declined partici-pation. The control group consisted of 25 administrativeworkers employed by the same company; they were selectedbecause (1) they were male, and (2) they were willing toparticipate. No attempt was made to randomly select con-trol subjects. (We had considered using power-plantworkers as control subjects but were concerned that theymay have some degree of exposure to other pollutants suchas polycyclic aromatic hydrocarbons [PAHs].) All subjectsreceived 1200 Czech crowns (�40 US dollars) as compen-sation for their participation. The research was explainedto each participant in Czech and each one signed anInformed Consent form.
Workers’ exposures were assessed during the periodfrom 19 March through 12 June 1998. Personal monitorswere used to assess BD exposure levels for all study sub-jects with multiple, semirandomly distributed measure-ments taken over a 60-day period for each exposed worker.The aim was to obtain BD exposure measurements near thebeginning, middle, and end of each subject’s assessmentperiod. Exposure assessment also included concurrentlevels of the VOCs benzene, toluene, and styrene. To sup-plement personal monitoring for BD and the VOCs, work-place area measurements were obtained from selected sitesthroughout the facilities. The details of the exposureassessment are provided in the later section Measurementof Occupational Exposure to BD.
Information about possible BD exposures before ourassessment period was obtained from workplace measure-ments that had been made by the company during the

15
preceding five years and from personnel records of changesin workers’ jobs. In addition, detailed employment histo-ries for all subjects were obtained by questionnaires, admin-istered by trained interviewers, which included questionsabout exposure to radiation, chemicals, and other haz-ardous materials in previous employment environments;recent exposures outside of work; smoking; alcohol andcaffeine consumption; dietary habits; illnesses; and medi-cations. Further health information for each subject wasobtained from medical records in the company clinic,where all workers received their health care. Detailedinformation about the subjects is presented in the later sec-tion Workers’ Exposure Groups, Personal Characteristics,and Metabolic Genotypes.
PROCEDURE TO ASSURE BLINDED ANALYSES
Each worker participating in the study was assigned asequential identification number between 101 and 184 (thesamples from subject 163 in the polymerization unit werelost to analysis). In addition, for each subject, a set of 11unique random numbers between 1000 and 9999 was alsogenerated and printed onto adhesive labels. One of thesewas affixed to each fraction of the blood and urine samplesobtained from the subject before they were distributed tothe laboratories doing the biomarker assays. Thus, eachsample container had a label with a four-digit number sothat the investigator performing the assay on that samplewas blinded to which other samples were obtained fromthe same subject. A master list of the subject numbers andthe 11 four-digit numbers assigned to the subject waskept in duplicate in Prague and Burlington. Codes wererevealed to an assay investigator only after all assays bythat investigator had been completed and the results hadbeen transmitted to Burlington.
CHAIN OF CUSTODY
At the point of origin (Prague) and the time of each ship-ment, the four-digit random number identifying eachsample or fraction being sent to each investigator in theshipment was listed on triplicate copies. Copy 1 was keptin Prague; copies 2 and 3 accompanied the shipment.When received, each investigator reviewed the samplesand signed both copies; the investigator kept copy 2 andsent copy 3 to Burlington. The study office in Burlingtonmade a fourth copy of the list; copy 3 was archived in thestudy’s records and copy 4 was returned to Prague. InPrague, copy 4 was checked against copy 1, to ensure thatall materials had been received and acknowledged by eachinvestigator, thus completing the chain of custody foreach sample.
Each investigator was responsible for the assay of eachsample received. All samples were accounted for and allentries were complete at the time of data analyses forall samples. (If a sample had been lost, destroyed, or couldnot be analyzed, the study protocol specified a procedurethrough which an investigator would notify Burlington sothat a proper adjustment could be made in the chain-of-custody records.)
SAMPLE ACQUISITION AND HANDLING
Subjects’ Biological Samples
We obtained blood and urine samples for biomarkerdetermination at the conclusion of each subject’s exposureassessment period; blood was collected once on the lastday and urine on six occasions: before and after workshiftson the last three days. Collections were scheduled forsmall groups of subjects on different days. Urinary metab-olites are believed to be short-lived; this influenced oursample acquisition plan in two ways: First, we scheduledthe first day of sampling after a two-day rest period toallow the retained metabolites from earlier exposuresto fully wash out, which would ensure a purer before-shifturine sample. Second, we planned to measure BD expo-sure for each exposed worker on the day of sampling.However, timing the urine sampling to allow for the wash-out period and to coincide with exposure measurementproved difficult; thus, same-day exposure measurementswere acquired for only a subset (5 monomer productionworkers � 15 polymerization workers � 20/58 � 34%) ofthe exposed workers and for 3 of the 25 (12%) controlsubjects.
The samples were transported on ice by automobilefrom the manufacturing facilities to the Prague laboratorywithin hours of collection, processed immediately, cryo-preserved at �70�C, and maintained in the vapor phase ofliquid nitrogen until and while they were sent to collabo-rating laboratories by air express in dry shippers.
Urine Urine samples from each worker were aliquotedinto 50-mL fractions and frozen at �70�C. Each aliquotedfraction received a four-digit random identification number.Samples from day 1 were sent to Amsterdam where theywere stored frozen at �20�C until analyzed; samples fromdays 2 and 3 were kept in Prague as a repository.
Blood Blood samples of approximately 60 mL per donor(later in the study, 100 mL) were collected in heparinizedvacutainers (Greiner, Kremsmunster, Austria) in the med-ical unit of the industrial facility at the work site. At thePrague laboratory, a small amount (5–10 mL) of whole
Study Design
16
Biomarkers in Czech Workers Exposed to 1,3-Butadiene
blood from each subject was cultured immediately forcytogenetic analyses to be performed in Prague; thesewhole-blood samples were coded only with the subject’sthree-digit identification number. The remainder of eachblood sample was fractionated into plasma, mononuclearcells (MNCs), and red blood cells (RBCs); each componentwas aliquoted for different biomarker assays. Each fractionor aliquot was assigned a random four-digit code.
Isolation of MNCs and Plasma Lymphocytes were sepa-rated from whole blood at room temperature using theLeucoSep system (Greiner), which consists of three com-ponents: a 50-mL tube, a porous filter disc, and histo-paque. Histopaque (15 mL; density 1.077; Pharmacia,Peapack NJ) was pipetted into each LeucoSep tube andcentrifuged for 30 seconds at 1000g to transfer the histo-paque under the filter disc. The whole blood was trans-ferred into one or more LeucoSep tubes and filled to the50-mL mark with washing medium consisting of RPMI1640 medium with 5% bovine calf serum (BCS). Blood andwashing medium were mixed by inverting the tube a fewtimes. Tubes were centrifuged for 10 minutes at 1000g.After centrifugation, erythrocytes were below the filter andthe lymphocytes and other MNCs were just above the filteras a buffy coat. Each buffy coat was transferred to a 50-mLdisposable tube, which was filled to the 50-mL mark withphosphate-buffered saline (PBS) (Sigma, St Louis MO).The tube was centrifuged for 10 minutes at 250g. Thepellet was washed once more with PBS, mixed withmedium A, which consisted of 80% RPMI 1640 and 20%BCS (Bioveta, Ivanovice ma Hane, the Czech Republic),and centrifuged for 10 minutes at 200g. The pellet wasresuspended in 3 mL ice-cold medium A and mixed with3 mL ice-cold medium B, which consisted of 80% BCS and20% dimethylsulfoxide (DMSO). The final concentrationof medium components in the lymphocyte suspension wasDMSO 10%, RPMI 1640 40%, and BCS 50%. The ice-coldlymphocyte suspension was divided into 1.0-mL quanti-ties, transferred to cryotubes, and kept on ice. Cryotubeswere coded with random four-digit numbers, transferredfrom ice to a polystyrene box (with wall thickness of 2 cm),and stored frozen at �70�C until they were transferred in adry shipper with liquid nitrogen to Leiden or Galveston.
When the whole blood was centrifuged in LeucoSeptubes, a large quantity of plasma collected on top of thebuffy coat. The plasma from each donor was collected andstored at �70�C until it was shipped to Galveston in a dryshipper. Plasma samples were coded with the same randomnumbers as the MNC fractions from the same individual.
Isolation of Erythrocytes After the MNCs, plasma, andhistopaque (Pharmacia) had been removed from the 50-mL
LeucoSep tubes, the RBC layer remained. The RBCs werewashed three times by adding 30 mL of isotonic saline toeach 50-mL tube and centrifuging for 10 minutes at 485g at4�C, after which the saline solution supernatant was aspi-rated and discarded. After the third wash, the RBCs weretransferred to 2-mL vials, labeled with a four-digit randomnumber, and stored at �70�C until shipped by dry shipperto collaborating laboratories. RBCs were sent to Amsterdamand Chapel Hill for determination of Hb adducts.
Sorbent Tubes for BD and VOCs
Diffusive thermal desorption tubes (PerkinElmer, Bea-consfield UK) prepared by Sheffield were used for personalmonitoring and for the workplace area measurements. Eachtube had its own engraved three-digit number and wasmarked with a red dot for BD and a green dot for VOCs.Workplace area monitors used pumps (type SKC) and sam-pling lasted for 15 minutes. After sampling, tubes weresent by Federal Express to Sheffield for analysis. Includedwith each shipment of 25 sample tubes was one blank tubeand one positive control tube (using a short BD exposure),and the lists of numbers for the red and green tubes.
The original study design specified that BD exposurelevels be monitored at 10 semirandomly spaced times foreach exposed subject and once for each control subject,and that VOCs be monitored only once for several subjects;this plan would cover exposures for each individual overthe course of 60 days. However, due to temporary short-ages of available tubes resulting from turnover time lagsbetween Prague and Sheffield, tubes were distributed assoon as they became available. Despite this change, eachexposed subject was monitored for BD exposure at leastonce near the beginning of their own 60-day assessmentperiod, several times at midterm, and for the last 3 daysbefore blood was collected.
DATA PROCESSING AND STATISTICAL ANALYSIS
Data Processing
Subjects’ questionnaires were mailed to Burlington,where they were screened for completeness and consis-tency; any problems were forwarded to Prague for resolu-tion. Experienced data-entry personnel then entered thedata into ASCII computer files directly from the question-naires; this was done in duplicate and independently toverify data-entry accuracy.
Exposure and biomarker data from participating labora-tories were transferred electronically to Burlington; mostlaboratories also mailed a diskette and printed copy oftheir data. Data were transferred from spreadsheets toASCII data files and checked against printed copies of the

17
original files to verify the accuracy of data transfer. Eachbiomarker data file was then linked to a file containingthe subject identification numbers corresponding to therandom four-digit sample and aliquot numbers. For uri-nary metabolites, data from specimens obtained before andafter the workshift were linked so that the results fromeach worker were contained on a single record.
Exposure results from Sheffield were matched to subjectidentification numbers and exposure assessment datesusing the number etched on the sorbent tubes and thedates of shipment to Sheffield. For each tube, results pro-vided in nanogram units were converted to TWA concen-trations of BD or VOCs using the length of time in minutesthat each exposure monitor was worn and the followingequations supplied by Sheffield. The equations, as definedin Methods for the Determination of Hazardous Sub-stances (MDHS) 63 (Bianchi et al 1996), are based on theamount in micrograms that is adsorbed in 400 minuteswhen the concentration is 2.5 ppm:
ppm BD � ng (400/min) (2.5/1.3) 0.001;
ppm benzene � ng (400/min) (2.5/1.72) 0.001;
ppm toluene � ng (400/min) (2.5/1.95) 0.001; and
ppm styrene � ng (400/min) (2.5/2.15) 0.001.
An LOD of 1 ng was established for each measurement;this corresponded to TWA concentrations of 0.0016 ppm BD,0.0012 ppm benzene, 0.0011 ppm toluene, and 0.0010 ppmstyrene for an 8-hour workshift. Workers with exposuresbelow 1 ng were given values of half the LOD, or 0.5 ng.Exposure concentrations in ppm were converted to mg/m3
by multiplying each by the following conversion factor:BD, 2.21; benzene, 3.19; toluene, 3.77; and styrene, 4.26.
Exposure data were aggregated by subject to create adata file in which each record contained one subject’sidentification number and the dates and concentrations ofhis exposures in chronologic order. This file was linked toinformation on the dates of urine and blood sampling tocalculate summary exposure metrics for each worker. Var-ious exposure metrics were examined and the arithmeticmean was chosen for statistical analyses.
Workplace area BD and VOC concentrations were com-puted from the Sheffield results (provided in nanograms)and the rate in liters per minute at which air was pumpedthrough the monitor during the 15-minute assessmentperiod using the following equation:
workplace area mg/m3 � ng/(rate 15 min) 0.001.
Statistical Analysis
To characterize the variability in the many exposuremeasurements obtained for each worker, variance compo-nent analysis was performed using a random effects modelwith both day of exposure and subject as random effects(Lindsey 1999). Separate analyses were performed for themonomer and polymer groups. Frequency distributionsand descriptive statistics of all summary exposure metricsand biomarkers were computed for each of the three expo-sure groups (administrative control subjects, monomerproduction workers, and polymerization workers). Vari-ables with substantially skewed distributions were trans-formed (usually by taking the natural logarithm) to obtainapproximate normality and all parametric statistical anal-yses were performed on the transformed values. For allanalyses, P values of 0.05 and lower were considered to bestatistically significant.
Differences among the three exposure groups for allexposure metrics and biomarkers were assessed both byone-way analysis of variance (ANOVA), using the Student-Newman-Keuls procedure for pairwise multiple compari-sons, and by the nonparametric Kruskal-Wallis test, usingBonferroni-adjusted Mann-Whitney tests for pairwise com-parisons (Montgomery 1991; Conover 1999). t Tests andMann-Whitney tests were used to test differences betweengenotypes and between smokers and nonsmokers. Two-way ANOVA, with group as one factor and either genotypeor smoking status as the other factor, was used to test forpotential interactions between the effects of BD exposureand genotype or smoking on the biomarkers (Montgomery1991). For most variables, the parametric and nonpara-metric tests gave very similar results. Because discrepan-cies occurred only when the assumptions of the para-metric tests were violated, only the nonparametric resultsare presented in this report.
Bivariate relations between different biomarkers andbetween biomarkers and exposure variables were assessedby computing Spearman correlation coefficients to testwhether larger values of one variable tended to be pairedwith larger values of the other variable, regardless of thefunctional form of the relation (Conover 1999). Pearsoncorrelation coefficients were also computed to assess thelinearity of relations. Unless otherwise noted, correlationresults are presented as the Spearman coefficient (r).Regression analysis was used to quantify the relationsbetween each Hb adduct and the average BD exposure.Multiple regression was used to examine the effects ofexposure, as quantified by (a) average BD exposure, (b)average BD exposure 70 to 50 days before blood sampling,or (c) the Hb adducts, on the cytogenetic and HPRT muta-tion biomarkers after adjusting for age and smoking status.
Study Design

18
Biomarkers in Czech Workers Exposed to 1,3-Butadiene
Exposure group was included in some models to identifyany group differences that were independent of BD expo-sure. For all regressions the exposure metrics and the Hbadducts were transformed by taking their natural loga-rithms. Transformations of the dependent variables wereused when residuals were not normally distributed. Forthe cytogenetic marker of percentage of high-frequencycells, similar analyses were done using data from indi-vidual cells in a logistic regression with a random effect torepresent the correlation between cells from the sameindividual (Bonassi et al 1999).
Multiple regression was also used to examine whethergenotype modified the relation between BD exposure andbiomarkers. As a first step, one-way ANOVA was used totest differences in biomarker levels among administrativecontrol subjects with different genotypes, all of whomwere assumed to have similar low-level exposures. If nodifferences were evident, a common intercept was as-sumed for all genotypes in regression analyses of data fromexposed subjects. Genotype-exposure interaction termswere included to test for differences in slope. If genotypedifferences were evident in the control group, regressionmodels for exposed workers also included genotype toallow for different intercepts.
Urinary metabolite data obtained at multiple timepoints (day 1 and day 3 before and after work) were ana-lyzed by repeated-measures ANOVA using the logarithmsof the four values as dependent variables. Day and timewere the within-subject factors and group was thebetween-subjects factor. A similar analysis was performedon data from a subset of subjects for whom exposure hadbeen measured on all three days of urine sampling toexamine how the changes in urinary metabolites over timerelated to BD exposure. For all such analyses, BD exposureduring the work period immediately preceding each urinesampling was included in the analysis as a time-varyingcovariate with the exception of the before-work sample onday 1. This sampling took place after a weekend away fromwork, so the prior exposure was assumed to be at anambient environmental level of 0.011 mg/m3 (0.005 ppm).
WORKERS’ EXPOSURE GROUPS,PERSONAL CHARACTERISTICS, ANDMETABOLIC GENOTYPES
EXPOSURE GROUPS
Workplace Environment
The concentrations of BD exposure and the possibilityof coexposure to other chemical agents are different in theseveral industries using BD. For example, BD monomersare produced in a closed process that allows less BD gas toescape into the workplace environment, whereas BD poly-merization, as in SBR production, uses an open processthat allows more BD and other gases to escape. Past BDexposure assessments have indicated that concentrationsin the monomer production facility were routinely lowerthan those in the polymerization facility. Similarly, BDmonomer production involves fewer coexposures toother agents, whereas polymerization uses numerousother chemicals. These differences may be one reason forthe different epidemiologic findings between the twoworker exposure groups (Delzell et al 1996b; Divine andHartman 1996).
Total workplace exposure to BD is the sum of the back-ground level in the plant plus task-related exposure(Lynch 2000). The background level of BD results frommany small and large releases that occur throughout theplant. A worker moving about is continually exposed tothis background level, which is higher or lower dependingon the pattern of BD release and location in the plant.However, usually a worker’s most intense exposure resultsfrom performing certain tasks; for example, when extractingsamples, changing filters, preparing pumps for mainte-nance, and cleaning reactors, a worker is very close to theequipment and in intimate contact with any chemicalsreleased. Such tasks are intermittent, often of short dura-tion, and may be unscheduled and unpredictable. Detailsabout workers’ jobs and locations were provided by thecompany, including information about tasks performedwithin each job. However, specific tasks performed duringthe exposure assessment phase of this project were notrecorded. Levels of exposure for different jobs were esti-mated by linking job titles, work locations, and task infor-mation with workers’ exposure measurements.
Results: Job and Task Analysis
Table 2 shows the number of study subjects in themonomer production and polymerization exposure groupsby job titles and work locations. The polymerizationworkers include those in the elastomer and latex units.

19
Each worker’s BD exposure was measured on approxi-mately 10 days during a 60-day exposure assessmentperiod and the mean of all measurements from workerswith the same job title and work location were computed.The rank order of jobs by mean exposure from lowest tohighest is shown in Table 3. In a study of BD exposure inUS SBR plants (Macaluso et al 2000), past exposures wereestimated by a complex method involving process historyand mathematical modeling. That study ranked workers’BD exposure by task in the order shown in Table 4.
By comparing Tables 3 and 4, allowing for some differ-ences in task nomenclature, we can understand workerexposures in terms of job, location, and task. Operatorswho spend their time in control rooms have background
exposure but infrequent task exposures and are lessexposed than operators who work in the various unitsclose to the equipment. Workers in locations with largequantities of BD, such as the reactor hall, have higherexposures than those in locations where BD has beenstripped from the latex. Closed-process units such as themonomer production unit have lower exposures thanthe more open-process polymerization units. Cleaningfouled equipment and sampling BD or latex rich in BD aresources of high exposure.
PERSONAL CHARACTERISTICS
Certain biomarkers examined in this research project,including the urinary metabolites and Hb adducts, are rel-atively specific for BD and are considered biomarkers ofexposure. Two biomarkers of effect were also studied: themutational endpoints, in which the frequencies of HPRTmutations in lymphocytes were examined, and the cytoge-netic endpoints, in which several chromosomal changeswere examined using a variety of techniques. Mutationsand chromosomal changes are nonspecific and may besimilarly affected by many genotoxic chemicals. HPRTmutational spectra were also determined in this study;they define kinds of mutational events that can be pro-duced by classes of genotoxic agents rather than specificevents caused by single chemicals. For these reasons,workers’ employment histories, personal characteristics,coexposures to hazardous substances, and health historieswere assessed by questionnaire to determine if any of thesefactors differed significantly among worker exposure groupsor if any were correlated with given biomarkers.
Questionnaires
Questionnaires were developed in collaboration withproject investigators and consultants. English versionswere pretested by experienced interviewers at the Bur-lington Biometry Facility and a Czech version was thenprepared by a translator in Prague. Subjects were inter-viewed and questionnaires completed by trained per-sonnel from the Bohemian Department of Hygiene. Allinterviews were conducted in Czech; the time requiredwas approximately 1 hour.
In the employment history portion of the interview, sub-jects were asked to describe the first job they had held forsix months or longer, then all other jobs, and finally theircurrent job. They provided the employer’s name, a descrip-tion of the work performed, the year they began and lefteach job, and the number of hours worked per week. Ifthey held different jobs within the same company, theydescribed each job. Subjects were then asked if they hadbeen exposed to radiation or specific chemicals at any of
Exposure Groups and Subjects’ Personal Characteristics
Table 2. Number of Exposed Subjects in Each Job and Work Location
Locationa
Job Title
OperatorPipeFitter
ShiftForeman
RotatingRelief
Worker
Monomer UnitAll locations 3 5Control room 3Additive
preparation1
Extraction 4Distillation 8
Elastomer UnitAll locations 1 5 1 1Control room 2Polymerization
line4
Latex degassing 1Degassing 1Absorption
compressors2
Latex UnitAll locations 1 2 1Control room 3Additive
preparation4
Polymerization line
3
Degassing 1Absorption
compressors1
a The elastomer and latex units comprise the polymerization unit.

20
Biomarkers in Czech Workers Exposed to 1,3-Butadiene
their previous places of employment. They were alsoasked about specific exposures outside of work (such asthose associated with hobbies, gardening, and home orautomobile repair) during the previous 3 months.
The smoking history portion of the questionnaire includedquestions about passive exposure to tobacco smoke, bothat work and outside of work. Subjects were also askedabout the amount of alcohol and caffeine they consume;
the number of servings of fruit, vegetables, and meats theyhave each week; and their use of specific medications. Aseparate questionnaire was designed to elicit medicalinformation about chronic illnesses, recent acute illnesses,diagnostic x-rays, and medical therapies. This informationwas provided by physicians responsible for the workers’health care, who completed a questionnaire for each sub-ject from medical records in the company clinic.
Table 3. Subjects’ Jobs Ranked by BD Exposure
Job Title Location Task
Lower ExposureOperator Monomer unit (control room) Controls processPipe fitter Monomer unit (all locations) Installs and repairs pipesOperator Latex unit (degassing control rooma) Controls processOperator Monomer unit (additive preparation) Operates equipment, mixes additivesOperator Elastomer unit (control room) Controls process
Rotating shift foremanb Latex unit (all locations) Supervises unit operators and processShift foreman Elastomer unit (polymerization) Supervises unit operatorsRotating relief worker Latex unit (all locations) Operates and repairs equipmentShift foreman Monomer unit (all locations) Supervises unit operators and process
Operator Latex unit (degassing) Operates equipment, monitors unitPipe fitter Elastomer unit (all locations) Installs and repairs pipes, weldsOperator Monomer unit (extraction) Operates extraction equipmentDay shift foremanb Monomer unit (all locations) Supervises process controlPipe fitter Monomer unit (all locations) Installs and repairs pipes, operates and
cleans equipment
Medium ExposureOperator Latex unit (polymerization control rooma) Controls process, collects BD samplesPipe fitter Elastomer unit (all locations) Installs and repairs pipesShift foreman Latex unit (polymerization unitc) Supervises unit operatorsOperator Elastomer unit (latex degassing) Operates equipment, monitors unit
Operator Latex unit (absorption compressors) Operates equipment, collects samplesOperator Elastomer unit (polymerization line) Operates equipment, collects samplesOperator Elastomer unit (control room) Controls productionCleanerb Elastomer unit (all locations) Flushes coagulate from vessels and pipes
Operator Latex unit (polymerization line) Operates equipment, collects samples,mixes additives
Operator Monomer unit (distillation) Operates distillation equipmentOperator Elastomer unit (degassing) Operates equipment, monitors unitOperator Elastomer unit (polymerization hallc) Operates equipment, collects samples,
feeds additives
Higher ExposureRotating relief worker Elastomer unit (all locations) Operates equipment, collects samplesOperator Elastomer unit (absorption compressors) Operates equipment, collects samplesPipe fitter Latex unit (polymerization unitc) Installs and repairs pipes, adjusts and
operates equipment
a Included under “control room” as a location in Table 2.b Included under “shift foreman” as a job title in Table 2.c Included under “polymerization line” as a location in Table 2.

21
Results: Characteristics and Coexposures
Analysis of questionnaire data revealed the three expo-sure groups to be fairly well balanced with respect to age,years of employment by the company, and years of resi-dence in the district (Table 5). Mean ages were 39.5, 40.6,and 39.3 for control, monomer, and polymer groups,respectively. Mean years employed by the company were12.4, 18.3, and 15.1; and mean years of residence were27.7, 33.0, and 30.6 for the three exposure groups, respec-tively. Educational status, however, was significantly dif-ferent among the three exposure groups: the control grouphad a higher mean number of years in school (48% withmore than 12 years) than either the monomer group (0%with more than 12 years) or the polymer group (6% withmore than 12 years) (P � 0.05 by 2 test).
Subjects’ health habits, medication usage, and healthhistories are summarized in Table 6. In the control group,one current nonsmoker did not provide information abouthis smoking history and one subject did not provide infor-mation about his current smoking status. Therefore, n � 23for this characteristic. For later analyses in which current
smoking is a factor, n values are 9 smokers, 15 non-smokers, and 24 instead of 25 for the total control group.Fewer control subjects were current smokers (39% versus54% and 47% for the monomer and polymer groups,respectively) but the differences were not statistically sig-nificant; in all exposure groups at least 70% of the workershad smoked at some time during their lives. As a conse-quence, we found no significant difference among theexposure groups in total cigarette consumption as mea-sured by pack-years (the number of packs of cigarettessmoked per day multiplied by the number of years smoked).Average pack-years for the control, monomer, and polymergroups were 9.9, 8.4, and 13.1, respectively. All workers(100%) in the monomer group spent time in the presenceof other smokers at work or outside of work, comparedwith 72% of the control group and 74% of the polymergroup (P � 0.05 by 2 test).
The three exposure groups were similar in their dietaryhabits, including alcohol and caffeine consumption, exceptthat the average number of vegetable servings per weekwas significantly higher in the control group (P � 0.05 byANOVA). Subjects in the control group were also morelikely to take vitamins regularly and to have had a vaccina-tion within the past year (P � 0.05 by 2 test).
The medications most frequently used during the pre-vious 3 months were antibiotics, cough or cold remedies,and blood pressure pills; usage was similar among thethree exposure groups (Table 6). A number of subjects alsoreported taking medications other than those specified; theproportion of these subjects was highest in the monomergroup (P � 0.05 by 2 test). A higher proportion of controlsubjects had an infectious illness during the previous 3months (P � 0.05 by 2 test), but the prevalence of chronic
Exposure Groups and Subjects’ Personal Characteristics
Table 4. United States Rubber Reserve Workers’ Tasks Ranked by BD Exposure
Level of Exposure Task
Lower Sample styrene shipmentsClean stripping columnPerform minor maintenance of styrene
pumpsDraw off water from recycled-styrene tanksOpen heat exchangersPerform minor maintenance of unit
Medium Change small filtersMonitor transfers from pump houseInspect unit for leaks or minor problemsOpen blow-down manholesDrain large filtersOpen flash-tank manholesPerform minor maintenance of BD pumpsPerform minor maintenance of recovery
compressors
Higher Clean reactor vesselClean blow-down tankOpen reactor manholesClean flash tankTest BD inhibitor (process control)Sample BD
Table 5. Demographic Information on Workers
Control(n � 25)
Monomer(n � 24)
Polymer(n � 34)
Mean � SD Mean � SD Mean � SD
Age 39.5 � 13.4 40.6 � 13.1 39.3 � 12.1Years at company 12.4 � 12.3 18.3 � 13.7 15.1 � 11.2Years in district 27.7 � 13.3 33.0 � 11.9 30.6 � 11.9
n (%) n (%) n (%)
Educationa
�12 Years 1 (4) 16 (67) 24 (70)12 Years 12 (48) 8 (33) 8 (24)�12 Years 12 (48) 0 (0) 2 (6)
a Groups differ significantly at P � 0.05 by 2 test.
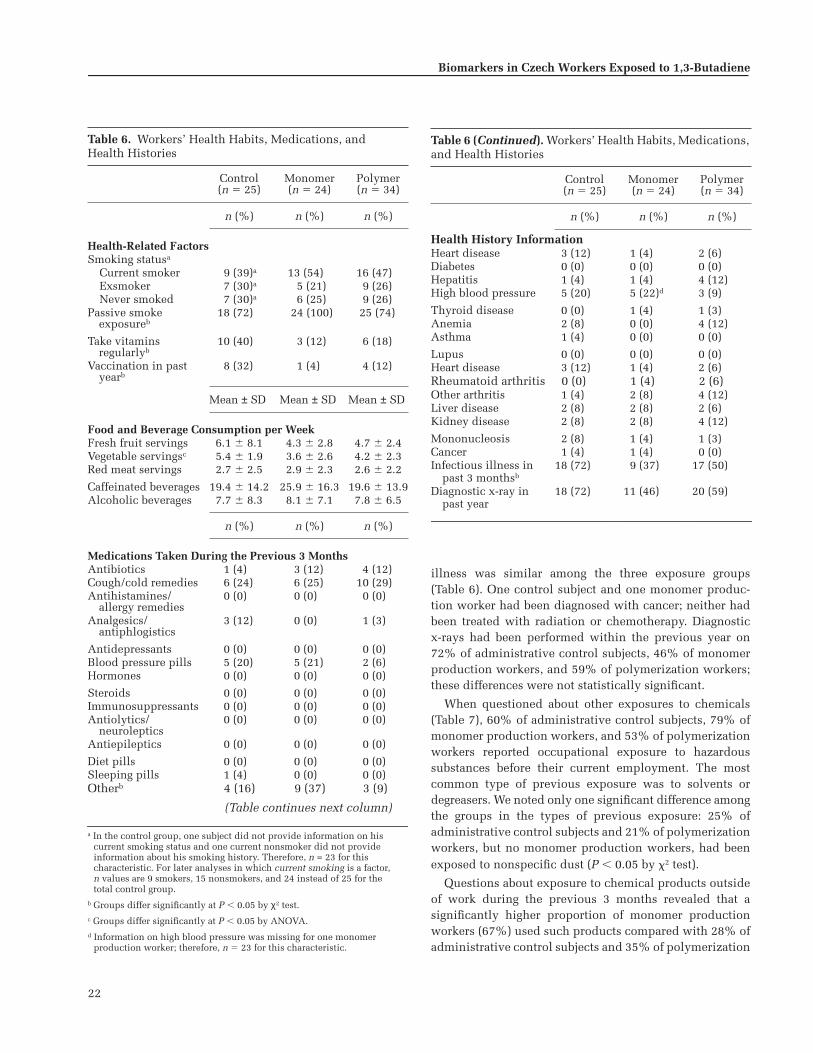
22
Biomarkers in Czech Workers Exposed to 1,3-Butadiene
illness was similar among the three exposure groups(Table 6). One control subject and one monomer produc-tion worker had been diagnosed with cancer; neither hadbeen treated with radiation or chemotherapy. Diagnosticx-rays had been performed within the previous year on72% of administrative control subjects, 46% of monomerproduction workers, and 59% of polymerization workers;these differences were not statistically significant.
When questioned about other exposures to chemicals(Table 7), 60% of administrative control subjects, 79% ofmonomer production workers, and 53% of polymerizationworkers reported occupational exposure to hazardoussubstances before their current employment. The mostcommon type of previous exposure was to solvents ordegreasers. We noted only one significant difference amongthe groups in the types of previous exposure: 25% ofadministrative control subjects and 21% of polymerizationworkers, but no monomer production workers, had beenexposed to nonspecific dust (P � 0.05 by 2 test).
Questions about exposure to chemical products outsideof work during the previous 3 months revealed that asignificantly higher proportion of monomer productionworkers (67%) used such products compared with 28% ofadministrative control subjects and 35% of polymerization
Table 6. Workers’ Health Habits, Medications, andHealth Histories
Control(n � 25)
Monomer(n � 24)
Polymer(n � 34)
n (%) n (%) n (%)
Health-Related FactorsSmoking statusa
Current smoker 9 (39)a 13 (54) 16 (47)Exsmoker 7 (30)a 5 (21) 9 (26)Never smoked 7 (30)a 6 (25) 9 (26)
Passive smoke exposureb
18 (72) 24 (100) 25 (74)
Take vitamins regularlyb
10 (40) 3 (12) 6 (18)
Vaccination in past yearb
8 (32) 1 (4) 4 (12)
Mean ± SD Mean ± SD Mean ± SD
Food and Beverage Consumption per WeekFresh fruit servings 6.1 � 8.1 4.3 � 2.8 4.7 � 2.4Vegetable servingsc 5.4 � 1.9 3.6 � 2.6 4.2 � 2.3Red meat servings 2.7 � 2.5 2.9 � 2.3 2.6 � 2.2
Caffeinated beverages 19.4 � 14.2 25.9 � 16.3 19.6 � 13.9Alcoholic beverages 7.7 � 8.3 8.1 � 7.1 7.8 � 6.5
n (%) n (%) n (%)
Medications Taken During the Previous 3 MonthsAntibiotics 1 (4) 3 (12) 4 (12)Cough/cold remedies 6 (24) 6 (25) 10 (29)Antihistamines/
allergy remedies0 (0) 0 (0) 0 (0)
Analgesics/antiphlogistics
3 (12) 0 (0) 1 (3)
Antidepressants 0 (0) 0 (0) 0 (0)Blood pressure pills 5 (20) 5 (21) 2 (6)Hormones 0 (0) 0 (0) 0 (0)
Steroids 0 (0) 0 (0) 0 (0)Immunosuppressants 0 (0) 0 (0) 0 (0)Antiolytics/
neuroleptics0 (0) 0 (0) 0 (0)
Antiepileptics 0 (0) 0 (0) 0 (0)
Diet pills 0 (0) 0 (0) 0 (0)Sleeping pills 1 (4) 0 (0) 0 (0)Otherb 4 (16) 9 (37) 3 (9)
(Table continues next column)
a In the control group, one subject did not provide information on his current smoking status and one current nonsmoker did not provide information about his smoking history. Therefore, n = 23 for this characteristic. For later analyses in which current smoking is a factor,n values are 9 smokers, 15 nonsmokers, and 24 instead of 25 for the total control group.
b Groups differ significantly at P � 0.05 by χ2 test.c Groups differ significantly at P � 0.05 by ANOVA.d Information on high blood pressure was missing for one monomer
production worker; therefore, n � 23 for this characteristic.
Table 6 (Continued). Workers’ Health Habits, Medications, and Health Histories
Control(n � 25)
Monomer(n � 24)
Polymer(n � 34)
n (%) n (%) n (%)
Health History InformationHeart disease 3 (12) 1 (4) 2 (6)Diabetes 0 (0) 0 (0) 0 (0)Hepatitis 1 (4) 1 (4) 4 (12)High blood pressure 5 (20) 5 (22)d 3 (9)
Thyroid disease 0 (0) 1 (4) 1 (3)Anemia 2 (8) 0 (0) 4 (12)Asthma 1 (4) 0 (0) 0 (0)
Lupus 0 (0) 0 (0) 0 (0)Heart disease 3 (12) 1 (4) 2 (6)Rheumatoid arthritis 0 (0) 1 (4) 2 (6)Other arthritis 1 (4) 2 (8) 4 (12)Liver disease 2 (8) 2 (8) 2 (6)Kidney disease 2 (8) 2 (8) 4 (12)
Mononucleosis 2 (8) 1 (4) 1 (3)Cancer 1 (4) 1 (4) 0 (0)Infectious illness in
past 3 monthsb18 (72) 9 (37) 17 (50)
Diagnostic x-ray in past year
18 (72) 11 (46) 20 (59)

23
workers (P � 0.05 by 2 test). Again, the types of exposureswere fairly similar (Table 7), but fewer monomer produc-tion workers had exposure to paints or varnishes and tooils or gasoline (P � 0.05 by 2 test).
Of 110 questionnaire variables pertaining to health andpossible toxic exposures outside of work, responses for 11variables were significantly different among the threeexposure groups. These included (1) the health-relatedand dietary variables of taking medications or vitamins,having vaccinations, consuming tea and vegetables, andhaving a recent infectious illness; and (2) prior possiblytoxic exposures to dusts, paints, oil, and passive smoke, orunusual exposures at work. These 11 statistically signifi-cant differences are more than the five or six that would beexpected due to chance if the three groups of workers camefrom the same population and the variables being tested
were truly independent. Many of the variables are, in fact,correlated and some, such as passive exposure to cigarettesmoke, are related to the different work settings of thethree exposure groups. Thus, it is difficult to determinethe number of differences that would be expected to arisefrom random variation.
We found a significant difference among exposure groupson the basis of which of two interviewers administeredthe questionnaires (P � 0.05 by 2 test). One interviewerworked with all subjects in the monomer productionfacility (100%) and most subjects in the polymerizationfacility (65%); the other worked with all but one of theadministrative control subjects (96%). This assignment ofinterviewers could have introduced bias in the informa-tion about job histories and exposure to toxic chemicalsoutside of the workplace. Most of the health informa-tion, however, was obtained directly from medical recordsby a physician in the company clinic and therefore isindependent of the assigned interviewers.
METABOLIC GENOTYPES
How specific and nonspecific biomarkers respond to BDexposure can be influenced by metabolic genotypes. [Notethat all discussions of genotyping and other geneticcontent use nomenclature that was accurate at the timeof this study; as the field of genetics continues to evolve,the names and assigned locations of some genes arechanging.] As described in the Overview, BD itself is notgenotoxic, but must be metabolized in vivo to its genotoxicmetabolites, which produce DNA damage. The activities ofseveral enzymes mediate this metabolism. The oxidationreactions depend on at least two CYP-dependent mono-oxygenases: CYP2E1 and CYP2A6 (Okino et al 1987). Invivo detoxification of BD metabolites depends on threeenzymes: EH, ADH, and GST.
CYP2E1 is a major enzyme expressed in liver and othertissues; it can be induced by ethanol and other chemi-cals, and its activity varies widely among individuals(Guengerich and Turvy 1991; Lucas et al 1995). CYP2E1 isknown to be involved in the metabolism of many chemi-cals, such as PAHs and nitrosamines, and can convert BDto BDO, and BDO to BDO2 in humans (Seaton et al 1995).Seaton and colleagues (1995) found a 60-fold variation inenzyme activity in human tissue samples that varied withCYP2E1 protein levels, which suggests a genetic compo-nent to the enzyme’s activity.
The CYP2E1 gene, which is located at chromosome10q24.3 (on the long arm of chromosome 10 at band 24.3),is known to have several polymorphisms. The RsaI andPstI polymorphisms in the 5� flanking region of the gene
Exposure Groups and Subjects’ Personal Characteristics
Table 7. Other Exposures to Chemicals
Control(n = 25)
Monomer(n = 24)
Polymer(n = 34)
n (%) n (%) n (%)
Occupational Exposures Before Current EmploymentRadiation 2 (8) 0 (0) 0 (0)Asbestos 2 (8) 1 (4) 4 (12)Coal products 1 (4) 2 (8) 1 (3)
Pesticides/herbicides 1 (4) 0 (0) 1 (3)Metal fumes/particles 3 (12) 3 (12) 6 (18)Gases 1 (4) 0 (0) 3 (9)
Petroleum products 3 (12) 3 (12) 3 (9)Dyes 2 (8) 3 (12) 4 (12)Solvents/degreasers 4 (17)a 4 (17) 9 (26)
Paints/stains/varnish 3 (12) 3 (12) 4 (12)Dustsb 6 (25)a 0 (0) 7 (21)Other chemicals 3 (12) 0 (0) 3 (9)
Exposure Outside Work During the Previous 3 MonthsPesticides/herbicides 4 (16) 2 (8) 1 (3)Paint/turpentine/
varnishb10 (40) 2 (8) 13 (38)
Glues/adhesives 2 (8) 0 (0) 0 (0)
Lead 3 (12) 1 (4) 2 (6)Oils/gasolineb 11 (44) 4 (17) 17 (50)Hair dyes 0 (0) 0 (0) 0 (0)
Solvents 4 (16) 3 (12) 4 (12)Fumes/gases 4 (16) 0 (0) 2 (6)Other chemicals 0 (0) 1 (4) 0 (0)
a Information on exposure to solvents/degreasers and exposure to dusts was missing for one control subject; therefore n � 24 for these characteristics.
b Groups differ significantly at P � 0.05 by χ2 test.

24
Biomarkers in Czech Workers Exposed to 1,3-Butadiene
(alleles C1 and C2) are in complete linkage disequilibrium(Watanabe et al 1990) and are known to affect gene tran-scription (Hayashi et al 1991). The C2 allele codes forincreased enzymatic activity. In addition, the A•T poly-morphism in intron 6 causes the loss of a DraI restrictionsite (alleles C and D) (Uematsu et al 1991). Associations ofthese polymorphisms with susceptibility to certain can-cers has been reported by some researchers (Yu et al 1995;Shields et al 1996; El-Zein et al 1997; Le Marchand et al1998; Lin et al 1998), although others have not found theserelations (Hirvonen et al 1993). For example, Lin andcoworkers (1998) found that C1/C1 individuals had a five-fold increased risk of esophageal cancer; and Tan and asso-ciates (2000) found an increased frequency of the C1 allelein patients with esophageal cancer. However, anotherstudy found that risk of airway cancer doubled in patientswith the CYP2E1 C allele and the C2 allele (Bouchardy etal 2000). A decrease in gastric cancer has been associatedwith the C2 allele (Nishimoto et al 2000), but no effect ofCYP2E1 genotype was found on hepatocellular carcinoma(Wong et al 2000b). The C2 allele produced an odds ratio of1.91 with colon cancer (Kiss et al 2000). Kim and associ-ates (1994), however, found no difference in CYP2E1activity in response to chlorzoxazone among the differentgenotypes in 55 white subjects, although only one indi-vidual with the C1/C2 genotype and one individual withthe C/C genotype were identified. The importance of thesepolymorphisms to the formation of BDO and BDO2 is thusuncertain; although no difference in response to chlorzox-azone was reported, differences in response to BD mayexist among the different CYP2E1 genotypes.
EH is located at 1q24.1 (the long arm of chromosome 1);it has two polymorphic sites (amino acids 113 and 139)that have variants with sufficiently high frequencies to bedetected in small-group studies (Hassett et al 1994). Sub-stituting histidine for tyrosine at position 113 in exon 3(His113) results in a 40% decrease in EH enzyme activitycompared with the tyrosine allele (Tyr113). Substitutingarginine for histidine at position 139 in exon 4 (Arg139)produces approximately a 25% increase in enzyme activitycompared with the histidine allele (His139) (Hassett et al1994). A number of studies have found associations betweenthese alleles and cancer: His113 with an increase in afla-toxin-associated hepatocarcinoma, but also with a decreasein ovarian cancer (McGlynn et al 1995; Lancaster et al1996); increased relative risk of lung cancer with increasedEH activity (Benhamou et al 1998); a high number of indi-viduals carrying the Arg139 mutation in a group withhepatocellular carcinoma (Wong et al 2000a); increasedEH activity with squamous cell carcinoma (Lin et al2000), whereas decreased EH activity with colon cancer
(Harrison et al 1999); and EH genotypes with slow hydrox-ylation and high HPRT mutant frequencies (Viezzer et al1999).
ADH is a family of isoforms (different forms of the ADHprotein) that catalyze the oxidation of alcohols andketones. ADH1 is not polymorphic in humans but ADH2and ADH3, both located at chromosome region 4q22, arepolymorphic (Xu et al 1988; Matsuo et al 1989; Osier et al1999). ADH2 has a well-known polymorphism (ADH2*2;His47 instead of Arg47) that is found at much lower fre-quencies in people of Chinese origin who have alcoholism(Muramatsu et al 1995; Higuchi et al 1996). The maximalvelocity of enzyme reaction (Vmax) for the ADH2*2 allele is40-fold greater than for the ADH2*1 allele (Edenberg andBosron 1997). Another rare allele, ADH2 Indianapolis(Cys369 instead of Arg369), is found primarily in blackpopulations (Bosron et al 1980; Xu et al 1988). One studyfound no relation between ADH2 genotype and hepatocel-lular carcinoma (Takeshita et al 2000), although a relationbetween esophageal cancer and ADH2 genotype has beenreported (Hori et al 1997; Yokoyama et al 2001). Two poly-morphisms at the ADH3 locus are in tight linkage disequi-librium resulting in two common alleles: The ADH3*1allele has Arg271 and Ile349, whereas the ADH3*2 allelehas Gln271 and Val349. The enzyme produced by ADH3*1has a higher Vmax (about 2.5-fold) than ADH3*2 (Edenbergand Bosron 1997). As with the ADH2*2 allele, higher fre-quencies of the ADH3*2 allele have been found in peopleof Chinese origin who have alcoholism (Higuchi et al 1996;Osier et al 1999). Increased risk of breast cancer has beenreported for premenopausal women with the ADH3*1/*1genotype (Freudenheim et al 1999), although the ADH3genotype has not been associated with cancer in the upperairways (Bouchardy et al 2000).
GST is also a family of isoforms that catalyzes the addi-tion of GSH to a number of carcinogens to form thioesters,a first step in detoxification. There are five GSTM genesthat map to 1p13.3, of which GSTM1 and GSTT1 are themost relevant to this study. The GSTM1 gene has a high-frequency (0.4–0.7) null allele (an allele that does notallow the GST enzyme to be produced) in most popula-tions around the world (Board et al 1990), which is theresult of crossing over between the homologous GSTMgenes (Xu et al 1998). The GSTM1 gene also has twocommon coding polymorphisms, GSTM1*A and GSTM1*B,which differ by a single base in exon 7 (Fryer et al 1993).The GSTM1-null allele has been associated with increasedcancer risk (including lung [Seidegard et al 1990; Charrieret al 1999], colon [Zhong et al 1993], cervical [Kim et al2000; Malats et al 2000], lung and bladder [Salagovic et al1998], and oral cavity [Katoh et al 1999] cancers) and with

25
higher DNA adduct levels in people who live in pollutedareas of Poland (Butkiewicz et al 1999). Individuals whohave GSTM1*A/*B had a reduced risk of upper aerodiges-tive tract cancer (Matthias et al 1998).
The GSTT1 gene (chromosome location 22q11.2) alsohas a null allele that occurs with relatively high frequencyin certain people (approximately 40% in white popula-tions) (Pemble et al 1994). GSTT1-null genotypes are asso-ciated with cervical, renal, and bladder cancer, and withadult leukemia (Salagovic et al 1998; Kim et al 2000; Rol-linson et al 2000; Sweeney et al 2000), but not with breastcancer (Curran et al 2000) or lung cancer (To-Figueras et al1997). Subjects with the GSTM1-null or GSTT1-null geno-type had reduced risk of relapse of childhood acute lym-phoblastic leukemia (Stanulla et al 2000). When infantswith leukemia were studied (Garte et al 2000), the deletionof GSTM1 and GSTT1 from their parents’ genotypes wassignificantly higher than expected. Subjects who were nullfor both GSTM1 and GSTT1 had an odds ratio of 3.64 forhead and neck cancer (Cheng et al 1999). Having a GSTT1-positive genotype and the GSTM1-null phenotype increasedthe number of DNA adducts in coke oven workers (Viezzeret al 1999).
Subjects in the current study were genotyped for CYP2E1,EH, two isoforms of ADH (ADH2 and ADH3), GSTM1, andGSTT1, to determine if these might be genetic suscepti-bility factors that influence biomarkers of BD exposure.
Genotyping Methods
GSTM1 and GSTT1 Genotyping for GSTM1 and GSTT1was performed in Prague using MNCs isolated from freshblood samples. The GST deletions within these genes wereidentified using a polymerase chain reaction (PCR) pro-tocol for simultaneous analysis with primers (Zhong et al1993; Premble et al 1994). This PCR assay employs five oli-gonucleotide primers (T1, T2, M1, M2, and M3); T1 and T2are homologous to sequences in the GSTT1 gene, M1 andM2 are homologous to sequences in both the GSTM1 andGSTM4 genes, and M3 is unique to sequences of theGSTM1 gene (Genset, Paris France). Sequences of theseprimers are:
T1 5�-TTCCT TACTG GTCCT CACAT CTC-3�
T2 5�-TCACC GGATC ATGGC CAGCA-3�
M1 5�-CGCCA TCTTG TGCTA CATTG CCCG-3�
M2 5�-ATCTT CTCCT CTTCT GTCTC-3�
M3 5�-TTCTG GATTG TAGCA GATCA-3�
Using the five primers in a single amplification reaction,the T1/T2 primer pair yields the GSTT1 fragment of 480bp, the M1/M2 primer pair anneals to sequences in both
the GSTM1 and GSTM4 genes to yield fragments of 157 bp,and the M1/M3 primer pair generates a product of 230 bpfrom the GSTM1 gene only.
DNA for analysis was extracted from MNCs from studysubjects by standard methods. The PCR master mixture(total volume of 50 �L) contained 2 mM magnesium chlo-ride (MgCl2; Promega, Madison WI), 0.16 mM deoxynucleo-side triphosphates (dNTPs; Fermentus, Vilnius Lithuania),10 pmol primer T1, 18 pmol primer T2, 32 pmol primerM1, 16 pmol primer M2, 16 pmol primer M3, and 1.5 UThermus aquaticus (Taq) DNA polymerase (Promega) inPromega buffer (50 mM potassium chloride [KCl], 10 mMTris-hydrochloric acid [HCl] [pH � 8], and 1% TritonX-100) 1; to this mixture was added 100 ng DNA in 50 �LH2O. PCR conditions included an initial 4 minutes at94�C for primary denaturation, then 36 cycles of: 57�C for1 minute for annealing, 72�C for 1 minute for extension,and 94�C for 1 minute for denaturing; and a final cycle for5 minutes at 72�C for the final elongation. Amplificationproducts were made visual by mixing 15 �L of PCR productwith loading buffer and performing electrophoresis onthe samples on 2% agarose gel with ethidium bromide(25 �g/100 mL of gel). Electrophoresis, using Maxi Agagel(Biometra, Göttingen Germany) was carried out at 90V for1.5 hours. The products were made visual with UV illumi-nation and a photograph was recorded.
Assays were repeated twice for each sample. If theresults differed, the assay was repeated again. Results of allreplicates are reported. Amplification of a region of theGSTM4 gene served as the internal control for the PCRreaction. A DNA size marker, pUC mix (MBI Fermentas,Vilnius, Lithuania; 0.5 �g/mL, 1 �L mixed with 4 �L ofloading buffer), was loaded together with samples to accu-rately identify the sizes of the PCR products. Only fragmentsof the same intensity of luminescence were evaluated.
Amplification of DNA from individuals possessing twowild-type GSTM1 and GSTT1 alleles yielded PCR prod-ucts of 480, 230, and 157 bp. DNA from individuals whoare homozygous for both the GSTM1 and GSTT1 genedeletions generated only the 157-bp product from theGSTM4 gene. DNA from individuals lacking the GSTM1alleles but possessing the GSTT1 gene generated fragmentsof 480 and 157 bp. Amplification of DNA possessing onlythe GSTM1 gene yielded fragments of 230 and 157 bp.Individuals who are heterozygous for GSTM1 or GSTT1 orboth alleles could not be distinguished from individualswith homozygous wild-type genotypes using this assay.
ADH2, ADH3, EH, and CYP2E1 Genotyping for the ADH2,ADH3, EH, and CYP2E1 polymorphisms was performed inVermont using DNA isolated from cloned T cells obtained
Exposure Groups and Subjects’ Personal Characteristics

26
Biomarkers in Czech Workers Exposed to 1,3-Butadiene
during the HPRT cloning assays (see the later sectionBiomarkers of Effect: Assays of HPRT Mutations in HumanLymphocytes). The polymorphisms and primers used foramplification are listed in Table 8. DNA was isolated fromthe clones using standard methods.
PCR was performed using HotStar Taq (Qiagen, ValenciaCA) and Qiagen’s proprietary buffers in a 25-�L reactionmixture. For the ADH2 polymorphism, reactions con-tained 1 HotStar buffer, 5 �L Qiagen (Q) buffer, 20 �MdNTPs, 10 pmol each primer, and a final MgCl2 concentra-tion of 3.5 mM. For the ADH3, EH113, and EH139 poly-morphisms, reactions contained 1 HotStar buffer, 5 �L Qbuffer, 20 �M dNTPs, 10 pmol each primer, and a finalMgCl2 concentration of 4.5 mM. For the CYP2E1 5� poly-morphism, reactions contained 1 HotStar buffer, 20 �MdNTPs, 10 pmol each primer, and a final MgCl2 concentra-tion of 3.5 mM. For the CYP2E1 intron 6 polymorphism,reactions contained 1 HotStar buffer, 5 �L Q buffer, 20 �MdNTPs, 10 pmol each primer, and a final MgCl2 concentra-tion of 1.5 mM.
PCR conditions included an initial 95�C for 15 minutesto activate the HotStar Taq, and then 36 cycles of: 94�C for10 seconds, 55�C for 20 seconds, and 72�C for 1 minute;and finalized with 72�C for 10 minutes. Annealing wasat 62�C instead of 55�C for the EH139 polymorphism and at57�C for the CYP2E1 5� polymorphism. Amplificationproducts were digested with the appropriate restrictionenzyme (Table 8) for 3 hours according to the manufac-turer’s recommendations (New England Biolabs, BeverlyMA). The products were made visual on an ethidium-stained (25 �g/100 mL gel) 2% agarose gel (except for theEH113 polymorphism, which was separated on an acryla-mide gel because of the small difference in the size of thecleaved and uncleaved product). The products were madevisual with UV illumination and a photograph wasrecorded. The expected fragments for each polymorphismare shown in Table 8.
Results: Genotypes
We determined the GSTM1 and GSTT1 genotypes foreach of the 83 study subjects. Of all workers, 30 (36.1%)were shown to be homozygous for the GSTM1-null allele.Assuming a Hardy-Weinberg equilibrium, this calculatesto a gene frequency of 0.60 for the null allele. Analyzingthe distribution of GSTM1 genotypes over the exposuregroups showed that 9 of the 25 (36.0%) administrativecontrol subjects, 10 of the 24 (41.7%) monomer productionworkers, and 11 of the 34 (32.4%) polymerization workerswere homozygous for the null allele. The differencesamong the exposure groups were not statistically signifi-cant (Table 9). Ta
ble
8.P
olym
orp
his
ms
for
Met
abol
ism
Gen
es
Gen
ePo
lym
orph
ism
Res
tric
tion
Enzy
me
Frag
men
t Si
zes
Freq
uenc
yFo
rwar
d Pr
imer
Rev
erse
Pri
mer
Ref
eren
ce
AD
H2
Arg
47H
is47
aTs
p45
I u
ncu
tTs
p45
I cu
t10
8 bp
44 b
p &
64
bp0.
950.
05A
AT
CT
TT
TC
T G
AA
TC
TG
AA
C A
GG
AA
GG
GG
GG
T C
AC
CA
GG
TT
G C
Xu
et
al 1
988
AD
H3
Ile3
49b
Val
349c
Ssp
I cu
tS
spI
un
cut
83 b
p &
56
bp14
0 bp
0.50
0.50
CT
TT
A A
GA
GT
AA
AG
A A
TC
TG
TC
CA
CC
TC
TT
TC
C A
GA
GC
GA
AG
C A
GX
u e
t al
198
8
EH
Tyr1
13H
is11
3dP
flF
I u
ncu
tP
flF
I cu
t23
1 bp
209
bp &
22
bp
0.60
0.40
C
TT
GA
GC
TC
T G
TC
CT
TC
CC
A T
CC
CA
AT
CT
TA
GT
C T
TG
AA
GT
GA
C G
GT
Lan
cast
er e
t al
1996
EH
His
139
Arg
139e
Rsa
I cu
tR
saI
un
cut
174
bp, 2
1 bp
& 6
2 bp
295
bp &
62
bp0.
220.
78G
GG
GT
AC
CA
G A
GC
CT
GA
CC
G T
AA
CA
C C
GG
GC
CC
AC
C C
TT
GG
CH
asse
tt e
t al
1994
CY
P2E
1C
1 (5
�)C
2 (5
�)R
saI
cut
Rsa
I u
ncu
t35
0 bp
& 6
0 bp
410
bp0.
980.
02C
CA
GT
CG
AG
T C
TA
CA
TT
GT
C A
TT
CA
T T
CT
GT
CT
TC
T A
AC
TG
GL
e M
arch
and
et a
l 19
98
CY
P2E
1C
(in
tron
6)
D (
intr
on 6
)D
raI
un
cut
Dra
I cu
t68
6 bp
335
bp &
351
bp
0.29
0.71
CT
GC
T G
CT
AA
TG
GT
C A
CT
TG
GG
AG
T T
CA
AG
AC
CA
G C
CT
AC
Lin
et
al 1
998
a A
DH
2*2
alle
le �
His
47 i
nst
ead
of
Arg
47.
b A
DH
3*1
alle
le �
Arg
271
and
Ile
349.
c A
DH
3*2
alle
le �
Gln
271
and
Val
349.
d E
H*1
13 a
llel
e �
His
113
inst
ead
of
Tyr1
13.
e E
H*1
39 a
llel
e �
Arg
139
inst
ead
of
His
139.
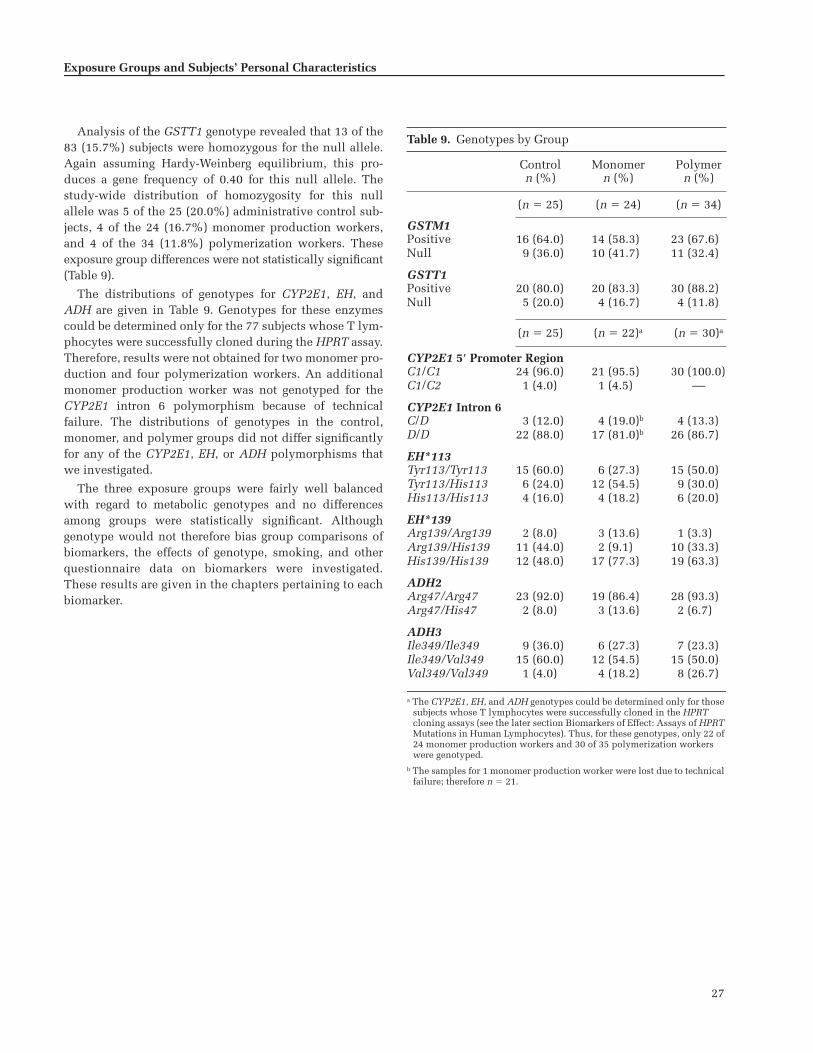
27
Analysis of the GSTT1 genotype revealed that 13 of the83 (15.7%) subjects were homozygous for the null allele.Again assuming Hardy-Weinberg equilibrium, this pro-duces a gene frequency of 0.40 for this null allele. Thestudy-wide distribution of homozygosity for this nullallele was 5 of the 25 (20.0%) administrative control sub-jects, 4 of the 24 (16.7%) monomer production workers,and 4 of the 34 (11.8%) polymerization workers. Theseexposure group differences were not statistically significant(Table 9).
The distributions of genotypes for CYP2E1, EH, andADH are given in Table 9. Genotypes for these enzymescould be determined only for the 77 subjects whose T lym-phocytes were successfully cloned during the HPRT assay.Therefore, results were not obtained for two monomer pro-duction and four polymerization workers. An additionalmonomer production worker was not genotyped for theCYP2E1 intron 6 polymorphism because of technicalfailure. The distributions of genotypes in the control,monomer, and polymer groups did not differ significantlyfor any of the CYP2E1, EH, or ADH polymorphisms thatwe investigated.
The three exposure groups were fairly well balancedwith regard to metabolic genotypes and no differencesamong groups were statistically significant. Althoughgenotype would not therefore bias group comparisons ofbiomarkers, the effects of genotype, smoking, and otherquestionnaire data on biomarkers were investigated.These results are given in the chapters pertaining to eachbiomarker.
Exposure Groups and Subjects’ Personal Characteristics
Table 9. Genotypes by Group
Controln (%)
Monomern (%)
Polymern (%)
(n � 25) (n � 24) (n � 34)
GSTM1Positive 16 (64.0) 14 (58.3) 23 (67.6)Null 9 (36.0) 10 (41.7) 11 (32.4)
GSTT1Positive 20 (80.0) 20 (83.3) 30 (88.2)Null 5 (20.0) 4 (16.7) 4 (11.8)
(n � 25) (n � 22)a (n � 30)a
CYP2E1 5� Promoter RegionC1/C1 24 (96.0) 21 (95.5) 30 (100.0)C1/C2 1 (4.0) 1 (4.5) ––
CYP2E1 Intron 6C/D 3 (12.0) 4 (19.0)b 4 (13.3)D/D 22 (88.0) 17 (81.0)b 26 (86.7)
EH*113Tyr113/Tyr113 15 (60.0) 6 (27.3) 15 (50.0)Tyr113/His113 6 (24.0) 12 (54.5) 9 (30.0)His113/His113 4 (16.0) 4 (18.2) 6 (20.0)
EH*139Arg139/Arg139 2 (8.0) 3 (13.6) 1 (3.3)Arg139/His139 11 (44.0) 2 (9.1) 10 (33.3)His139/His139 12 (48.0) 17 (77.3) 19 (63.3)
ADH2Arg47/Arg47 23 (92.0) 19 (86.4) 28 (93.3)Arg47/His47 2 (8.0) 3 (13.6) 2 (6.7)
ADH3Ile349/Ile349 9 (36.0) 6 (27.3) 7 (23.3)Ile349/Val349 15 (60.0) 12 (54.5) 15 (50.0)Val349/Val349 1 (4.0) 4 (18.2) 8 (26.7)
a The CYP2E1, EH, and ADH genotypes could be determined only for those subjects whose T lymphocytes were successfully cloned in the HPRT cloning assays (see the later section Biomarkers of Effect: Assays of HPRT Mutations in Human Lymphocytes). Thus, for these genotypes, only 22 of 24 monomer production workers and 30 of 35 polymerization workers were genotyped.
b The samples for 1 monomer production worker were lost due to technical failure; therefore n � 21.

28
Biomarkers in Czech Workers Exposed to 1,3-Butadiene
MEASUREMENT OF OCCUPATIONALEXPOSURE TO BD
This section describes the methods used to estimateworkers’ exposure to BD and their coexposure to the VOCsbenzene, toluene, and styrene. Evaluating the usefulnessof a biomarker as a measure of BD exposure requires thatpersonal exposures be accurately estimated. This is bestaccomplished by personal monitors that record BD expo-sure concentrations over the period of time that is relevantto the formation and persistence of the biomarker. The lon-gitudinal concentration data are then combined to summa-rize an individual’s exposure over the entire time period.
A number of methods have been developed to measure aworker’s exposure to BD both to evaluate health hazardsand to monitor compliance with safety standards. Suchmethods have been reviewed by an Analytical WorkingGroup that consists of experts from the Lower OlefinsSector Group of the European Chemical Industry Council(CEFIC) and from the Environmental Health and ProductSafety Committee of the International Institute of Syn-thetic Rubber Producers (IISRP). In a report issued in Sep-tember 1996, the Working Group identified three solidsorbent methods of analysis to provide high levels of accu-racy and precision: NIOSH 1024, 3M3520, and MDHS 63(Bianchi et al 1996). With the NIOSH 1024 method, apump is used to draw air through a glass tube packed witha solid sorbent. In the other two methods air is notpumped; instead, BD diffuses from the air onto a sorbent ineither a plastic badge (for method 3M3520) or a stainless-steel tube (for method MDHS 63) (Health and Safety Exec-utive [HSE] 1989; DHHS 1994; Minnesota Mining andManufacturing Corp 1996). In NIOSH 1024 and 3M3520,BD is desorbed with a solvent and in MDHS 63 it is ther-mally desorbed. In all three methods, BD is analyzed bygas chromatography (GC).
Several factors about laboratories and the samplersthemselves contributed to our decision to use the MDHS63 method of sampler analysis. First, because our studysubjects were employed in the Czech Republic and sam-ples would be collected there, it was important to use aEuropean laboratory (which generally do not perform anal-yses via the NIOSH 1024 method). Second, to maximizeaccuracy, it was essential to choose a laboratory that rou-tinely conducts a high volume of analytic work and haveour samples analyzed using its preferred method.
Thus, we ruled out the NIOSH 1024 method because (1)it would not be used in a European laboratory, and (2) asampler that employs a pumped tube may feel more intru-sive to the subjects (who are unaccustomed to wearing per-sonal samplers) and may reduce participation in the study.
Although both the 3M3520 and MDHS 63 methods werejudged to be acceptable, we eliminated 3M3520 as anoption; BD recovery by this method is sometimes as low as75% and, although in theory low desorption efficiencywill work if it is known and constant, variability stilloccurs and reduces the accuracy of the results. Further-more, MDHS 63 has been validated and approved for usein sampling BD by a national or international authority orregulator, whereas 3M3520 has not, even though it hasbeen specifically recommended by its manufacturer to beused for BD sampling (Bianchi et al 1996).
Finally, the government Health and Safety Laboratory ofthe UK (in Sheffield) met all of our criteria for a laboratory,uses the MDHS 63 method of analysis routinely, and wasavailable to do the work.
EXPOSURE ASSESSMENT PROTOCOL
Exposure is not a single quantity, but is rather a functionthat describes the fluctuations in exposure intensity over aperiod of time; thus, the sampling design and the choiceof metric to estimate exposure depends on the purpose ofthe study. Continuously monitoring each worker over theduration of the study would provide the most completecharacterization of exposure, but this was not feasible.Instead, we monitored each subject on a sample of work-shifts and used those data to estimate exposure over thetime period of interest. Because fluctuations in bothtiming and intensity would affect the biomarkers in thisstudy differently, we designed a protocol that wouldallow for both short-term and intermediate-term exposureto be monitored.
Exposure Measurements from Personal Monitors
The protocol specified that each exposed subject bepersonally monitored for BD over his entire workshift(usually 8 hours) on 10 workdays during a 60-day expo-sure assessment period. The sampler measured the cumu-lative amount of BD the subject was exposed to during thetime the device was worn. We divided this quantity by theduration of the monitoring period to yield the TWA BDconcentration for the subject’s workshift.
We planned for three of the BD measurements to bemade on the last 3 workshifts of the 60-day assessmentperiod to coincide with collecting urine samples to assessbiomarkers that would reflect recent (short-term) exposure(eg, urinary metabolites). The remaining seven measure-ments were to be made at irregular intervals during the60-day assessment period, with the first one scheduled atthe beginning. These seven semi-random measurements,together with the three measurements made at the end of

29
the period, would be used to summarize each subject’sexposure over the 60-day period to assess biomarkers thatwould reflect intermediate-term exposure (eg, Hb adductsand genetic effects). The 25 control subjects were to beconsidered a homogeneous, unexposed group, and eachworker would have one 8-hour BD measurement on oneworkshift during the assessment period.
To assess concurrent exposure to the VOCs benzene, sty-rene, and toluene, six sets of seven measurements eachwould be made at irregular intervals that would cover allshifts for six exposed groups of workers (a total of 42 mea-surements). Seven additional measurements were to bemade at irregular intervals to cover all shifts of the controlsubjects. The protocol for these VOC measurements wasdesigned to determine if any coexposures might track withBD and confound the interpretation of exposure results. Amore extensive assessment of VOCs was not thought to bewarranted because of the cost, the availability of personalmonitors, and the fact that VOCs were not the primaryfocus of this study. (We had also planned to measure expo-sure to dimethyldithiocarbamate, but we learned that thiscompound is not used at the facilities participating in thestudy and therefore these measurements were not made.)
Availability of the sorbent tubes used for monitoring BDand VOC exposure precluded strict adherence to ourexposure assessment protocol. It was not possible to fullyimplement the semi-random sampling plan, but all ex-posed subjects had BD exposure measurements near thebeginning, middle, and end of their exposure assessmentperiod. The actual timing of both the BD and VOC expo-sure measurements are given for each subject later in theResults section.
Workplace Area Measurements
In addition to personal monitoring for TWA BD and con-current VOC exposures, we took workplace area measure-ments of BD and VOCs. The exposure assessment protocolinitially included a plan to measure time-intensity pat-terns of BD exposure (peaks) using a mini photoionizationdetector connected to a data logger. However, because of adefect in the apparatus (and because of concerns expressedby the company participating in the study), this methodwas not used. Instead, workplace area BD levels were mea-sured as 15-minute concentrations using pumped samplesfrom selected locations (18 in administration, 60 in themonomer production unit, and 89 in the polymerizationunit; total of 167 measurements). Concentrations from 15minutes of sampling (rather than from a full workshift, forexample) were deemed sufficient to evaluate workplacearea levels of the agents of interest because these measure-ments were made primarily to assess whether the personal
monitoring results (recorded as workshift TWAs) were“reasonable” as determinants of the workers’ exposure.
Workplace area concentrations of benzene, styrene, andtoluene were also measured in the same manner (12 inadministration, 11 in the monomer production unit, and14 in the polymerization unit; total of 37 measurements).
EXPOSURE SAMPLING AND ANALYSIS
BD: Materials and Methods
In the MDHS 63 method used by Sheffield, BD is sam-pled by exposing a passive diffusive sampler to air for ameasured time period (Fields 1986; Hamlin and Saunders1986; HSE 1989). The sampling rate is determined by cali-brating the equipment in a standard atmosphere beforeuse. BD gas migrates down the tube by diffusion and issorbed on the molecular sieve. The collected gas is de-sorbed by heat and is transferred under inert carrier gasinto a gas chromatograph equipped with a flame ionizationdetector (FID), where it is analyzed. This method wasdeveloped to determine TWA concentrations of BD gas inworkplace atmospheres. The method is suitable for sam-pling over periods that range from 30 minutes to 8 hoursand it can be used for both personal and fixed-locationmonitoring.
The validity of this method for measuring BD exposurehas been examined by following a diffusive sampler eval-uation protocol (HSE 1983) that uses a PerkinElmer dif-fusive tube containing a molecular sieve sorbent and asilicone membrane in the diffusion cap (Cox 1985; Cox etal 1987). From laboratory experiments, the uptake rate, orcalibration factor, has been found to be 0.59 cm3/min or1.30 ng/ppm/min; the random error of the uptake rate is15%, which is expressed as a coefficient of variation. Theuptake rate does not vary significantly with the time orconcentration of exposure; high humidity does not adverselyaffect it; and it is not significantly affected by ambient airmovement, provided a minimum of about 2 ft/min (ap-proximately 0.01 m/sec) is maintained. In tests conductedat Sheffield on samplers spiked with either 1.3 �g or 6.7 �gBD and stored at 4�C or 20�C for 14 or 28 days, the mean re-covery of BD compared with freshly prepared standardswas 89% or higher; neither time nor temperature signifi-cantly affected the percentage of recovery. Similar resultswere obtained on samplers stored at 40�C for 10 days.
In a field evaluation performed by Sheffield apart fromthis study, paired sets of diffusive samplers and pumpedmolecular sieve tubes were exposed simultaneously on thelapels of people at work (Cox et al 1987). The resultsobtained from log-transformed data yielded a correlationcoefficient of 0.937 over exposure concentrations ranging
Exposure Measurements

30
Biomarkers in Czech Workers Exposed to 1,3-Butadiene
from 0.4 mg/m3 (0.2 ppm) to 39.8 mg/m3 (18.0 ppm). Inregression analysis, the slope and intercept did not differsignificantly from 1 and 0, respectively, which indicatesequivalence. The data from the field evaluation were alsoexamined by paired t test. For the 24 pairs of observations,the mean � SD difference was 0.77 � 3.5 mg/m3 (0.35 �1.6 ppm). The t test results indicated that the mean differ-ence was not significantly different from zero and thusthere was no systematic difference in the results obtainedby the two methods. These findings demonstrated that theresults from the diffusive sampler were unbiased com-pared with the pumped sampler within the random errorsassociated with the two methods.
Sheffield assessed the precision and accuracy of theMDSH 63 method by spiking 1.3 �g BD, which is equiva-lent to about 5.5 mg/m3 (or 2.5 ppm) BD, onto replicatesamplers for 400 minutes each. The relative SD amongthe results of the spiked samplers was 4% using gas sy-ringes and a static, fresh dilution of pure BD as thesource. A bias due to incomplete recovery is not detectedin this test and in thermal desorption bias is not easy todetect. By plotting recovery from 200�C to 300�C, the lab-oratory was able to establish that 270�C was an optimaldesorption temperature for BD. However, this was notcertain proof that the percentage of recovery would meetthe criterion of greater than 95% for thermal desorptionsamplers that is required by European Standard EN 838(British Standards Institution 1996). An alternative verifi-cation was accomplished by spiking a second sorbentthat was completely different in character: dual-bed airtoxics tubes (Supelco, St Louis MO, USA) consisting ofgraphitized carbon and a carbon molecular sieve. SpikingBD and n-pentane mixtures on the air toxics tubes estab-lished agreement with the recovery from molecular sieve13X within 5%.
Any compound that coelutes with the BD at the oper-ating conditions chosen by the analyst is a potential inter-ferant. Using an FID, coelutions are occasionally possible;but from the chromatograms in this study, it appeared thatsamples with significant amounts of BD were unaffectedby such interferants. Interfering peaks could have someeffect at 0.4 mg/m3 (0.2 ppm) but not at 4.4 mg/m3 (2 ppm).
Given the testing described thus far, we decided to usediffusive thermal desorption tube samplers (PerkinElmer).These stainless-steel tubes are 89 mm in length, have anoutside diameter of 6.34 mm, an inside diameter of 5.00 mm,and a nominal air gap of 1.50 mm (Brown et al 1981). Oneend of the tube sampler has a machined internal groove intowhich a 100-mesh stainless-steel screen is fitted. The cylin-drical air gap is defined by the distance between the screenand a removable diffusion cap with a 50-�m silicone
membrane (PerkinElmer part L407 0208) to exclude waterduring BD sampling. The effective air gap between the sor-bent and the diffusion cap is nominally 1.50 mm. Emptytubes and screens from PerkinElmer were packed with500 � 50 mg molecular sieve 13X, 40–60 mesh (Chrompack;Varian, Walton-on-Thames Surrey, UK). The distance fromthe screen to the open end of the tube was measured towithin 0.02 mm and tubes outside the limits of 14.3 �0.3 mm were not used. Assuming that variance in theinternal diameter was negligible, the variance of the area/length ratio contributed � 1% to the overall sampling vari-ance from all causes.
Before use, the sorbent tubes were conditioned byheating them slowly under inert carrier gas to 300�C for atleast 16 hours. Tubes were then analyzed to ensure that thethermal desorption blank was � 50 ng (HSE 1983). Thedesorption blank of freshly conditioned tubes was about0.5 ng BD, equivalent to about 0.0018 mg/m3 (1 ppb) for an8-hour sample. Sample blanks were prepared by usingtubes identical to those used for sampling and subjectingthem to the same handling procedure as the samplingtubes. Spiked sorbent tubes were prepared by injectingknown aliquots of BD gas onto clean sorbent tubes. Freshstandards were prepared with each batch of samples withat least three standards at each tube loading level (typicaltube loading levels for the replicate standards were in therange of 0.1 to 2 �g BD). When the sampling tubes weresent for analysis, Sheffield was blinded to the identity often field blanks and they were analyzed together with thesampling tubes used for exposure monitoring; BD levels inthe field blanks ranged from 0 to 7 ng.
Two types of end caps were used with these samplers.For sealing the tubes when they were stored, closed metalend caps with polytetrafluoroethylene (PTFE) or Vitron(Dupont Dow Elastomers, Wilmington DE) seals wereused. For sampling, a diffusive end cap that allowed theingress of vapor through a silicone membrane and metalgauze was used on one end of the tube (the size of theopening matches the cross-section of the tube). To collect asample, the closed end cap was removed and replacedwith a diffusion end cap. For personal sampling, thetube was mounted in the worker’s breathing zone (eg, onthe lapel). At the end of a measured period of exposure,the diffusion end cap was removed and replaced with theclosed cap.
To quantify BD exposure, the sorbent tube was placed ina thermal desorption apparatus. The tube was heated todisplace the sorbed gases, which were passed to a gas chro-matograph by means of a carrier gas stream. Sample blanksand the samples used to determine desorption efficiencywere analyzed in the same way. A PerkinElmer model

31
ATD-400 was used for desorption with the followingconditions:
Primary desorb temperature: 270�C
Desorb time: 10 minutes
Desorb flow: 20 mL/min helium
Typical split ratio: 30:1
Peltier-effect cold-trap: 70 mg Tenax GR at �30�C, back-flush configuration
Cold-trap desorb temperature: 300�C
The gas chromatograph was a PerkinElmer Autosystem XLwith the following specifications:
Column: fused silica 60 m 0.25 mm VOCOL (Supelco)
Film thickness df: 1.5 �m
Carrier gas: helium at 32 psi inlet pressure
Temperature program: 35�C held for 4 minutes, 4�C/minto 60�C, postrun 200�C for 5 minutes (BD approximateretention time 6 minutes)
Detector: Flame ionization
Data acquisition: PerkinElmer Turbochrom v4.2
To determine desorption efficiency, aliquots of BD gaswere injected directly into the gas chromatograph and acalibration graph was prepared showing the peak responseplotted against the analyte injected. Then the spiked tubestandards were analyzed and a second calibration graphwas prepared. The response of a tube standard was within95% of that of the corresponding gas standard injecteddirectly.
VOCs: Materials and Methods
The methods used by Sheffield to measure exposures tobenzene, toluene, and styrene by thermally desorbed diffu-sive passive samplers were essentially the same as thosefor BD. PerkinElmer diffusive tube validations for ben-zene, toluene, and styrene followed the generic methodMDHS 80 (HSE 1995). Benzene and styrene were fully val-idated by protocol EN 838 (British Standards Institute1996). Toluene was partially validated, but its assessmentincluded field comparisons with a reference source.
The methods for benzene, toluene, and styrene measure-ment met the following precision and accuracy require-ments: desorption efficiency was greater than 98%; recoveryafter 2 weeks at ambient temperature was greater than98%; and expanded uncertainty of the final result (sam-pling rate � analysis) within 30% (95% confidence interval[CI]) was up to twice the workplace limit value (for 0.5–8hours exposure, 20%–80% relative humidity, 10–30�C).
The same PerkinElmer tube sampler used for BD wasused for VOC sampling except that a diffusion cap withoutthe silicone membrane was used (PerkinElmer part L4070207). The tubes were packed with 250 � 25 mg Chro-mosorb 106, 60–80 mesh (Chrompack). For thermal de-sorption, a PerkinElmer model ATD-400 was used with thefollowing conditions:
Primary desorb temperature: 230�C
Desorb time: 10 minutes
Desorb flow: 50 mL/min helium
Typical split ratio: 30:1
Peltier-effect cold-trap: 30 mg Tenax TA at �30�C, for-ward flush configuration
Cold-trap desorb temperature: 300�C
The gas chromatograph was a PerkinElmer Autosystemwith the following specifications:
Columns: dual columns (SGE Europe, Milton KeynesUK) fitted in parallel from the thermal desorber to thetransfer line• Fused silica 50 m 0.22 mm BP-1; film thickness df:
1.0 �m
• Fused silica 50 m 0.22 mm BP-10; film thickness df:0.5 �m
Carrier gas: helium at 46 psi inlet pressure
Temperature program: 50�C to 180�C at 5�C/min
Detectors: Dual flame ionization
Data acquisition: PerkinElmer Turbochrom v4.2
To calibrate the equipment Sheffield used the liquidspiking technique (HSE 1995; Woolfenden and McClenny1997). Known quantities of benzene, toluene, and styrenewere each diluted in methanol and prepared by gravim-etry. Aliquots were spiked on calibration tubes packedwith Chromosorb 106, and the tubes were analyzed usingthe same procedure used for the samples. VOC calibrationsprepared in this form are traceable to primary standards.European certified reference thermal desorption tubesloaded with benzene, toluene, and xylene (which is theclosest chemical to the BD and VOC analyses in question;Certified Reference Material 112) were used as an addi-tional check on the procedure.
Quality Control
Internal quality control (QC) procedures for both BDand VOCs were in accordance with MDHS 71 analyticalquality in workplace air monitoring (HSE 1991). Forexternal quality assurance, Sheffield takes part in the UnitedKingdom’s Workplace Analysis Scheme for Proficiency
Exposure Measurements

32
Biomarkers in Czech Workers Exposed to 1,3-Butadiene
(WASP) and a separate unit within Sheffield administersWASP. (This is similar to the American Industrial HygieneAssociation’s Proficiency Analytical Testing scheme in theUSA, except that in the Proficiency Analytical Testingscheme, membership involves American Industrial HygieneAssociation laboratory accreditation, whereas in the UnitedKingdom, accreditation is achieved via a separate organiza-tion, United Kingdom Accreditation Scheme, that takes noteof performance in proficiency schemes, but does not admin-ister them. About 100 laboratories participate in WASP, ofwhich about 75% are in the United Kingdom; most of therest are in other European countries and a few laboratoriesare in the United States, Japan, and Australia.) WASP rankslaboratories according to a long-term performance statistic(best performance in four out of the last five quarterly
rounds). The long-term performance of Sheffield in thermaldesorption of benzene, toluene, and xylene is equivalent to arelative SD of 2% from the reference or “true” value.
Statistical Methods
A complete description of all statistical methods is pre-sented in the earlier section Study Design: Subject Selec-tion, Sample Acquisition and Handling, and StatisticalMethods / Data Processing and Statistical Analysis.
RESULTS
BD Exposure Measurements from Personal Monitors
Between 19 March 1998 and 12 June 1998, 536 indi-vidual workshift BD exposure measurements were obtained
Figure 4. Times of exposure monitoring for administrativecontrol subjects, monomer production workers, and poly-merization workers. Subject numbers are given on the leftaxis. = BD measurements; � = VOC measurements.

33
for the exposed workers using diffusive solid sorbent tubes:217 measurements for the 24 BD monomer productionworkers and 319 measurements for the 34 BD polymeriza-tion workers (each measurement was recorded as the TWAfor the subject’s workshift). Some workers had less thanthe scheduled 10 measurements due to discrepancies intube identification numbers recorded in Prague and Shef-field, but most workers had at least eight measurements. Inaddition, 28 individual workshift BD exposure measure-ments were made on the 25 control subjects. Figure 4shows the dates of exposure measurement for each subject;a � marks the days on which concurrent exposures to ben-zene, toluene, and styrene were measured.
The length of time between a worker’s first and lastexposure measurement was not always 60 days due to theavailability of diffusive solid sorbent tubes. The actualexposure assessment period for individual subjects rangedfrom 28 to 84 days; but for 48 of the 58 exposed subjects, itranged from 50 to 70 days. The time over which all expo-sure assessments were made for an individual is hereafterreferred to as “over the entire exposure assessment period”.Each worker had several measurements made during theinterim 70 to 50 days before biological samples wereobtained; hereafter, this subset of measurements is referredto as “the exposure interval 70 to 50 days before blood (orurine) sampling”. As planned, most subjects had measure-ments at the beginning, middle, and end of their assess-ment periods.
The measurements of BD exposure levels, both in themonomer production and in the polymerization facilities,were highly variable. The distributions of individual BDconcentrations from the monomer production and polymer-ization workers, plotted in Figure 5 on a logarithmic scale,show this variability. The lowest values in each histogramcorrespond to exposures below the LOD (0.0036 mg/m3
[0.0016 ppm] for an 8-hour exposure monitoring period,but this varied depending on the length of the workshiftduring which the sorbent tube was worn). Although thevalues above the LOD appear to approximate a lognormaldistribution, more values are below the LOD than wouldbe expected with this distribution (Singh et al 1997). Thedata are better described by the delta distribution, inwhich nonzero values are lognormally distributed but aproportion of values are essentially zero (Owen and De-Rouen 1980).
Descriptive statistics for the individual BD exposuremeasurements are presented in Table 10 for each group ofworkers. For all statistics except the maximum, percentiles,and mean of the delta distribution, a value of 0.0018 mg/m3
(half the LOD) was used for undetectable exposures. Of allthe BD exposure measurements, 8 for administrative
control subjects, 22 for monomer production workers, and24 for polymerization workers were below the LOD. Themean � SD BD concentration to which the monomer pro-duction workers were exposed, calculated from the 217individual TWA measurements, was 0.643 � 2.056 mg/m3
(0.291 � 0.930 ppm). The exposures of the polymerizationworkers were greater, with a mean � SD concentration of1.760 � 4.692 mg/m3 (0.796 � 2.123 ppm) calculated fromthe 319 individual TWA measurements. The control sub-jects were exposed to quite low BD concentrations, with a
Exposure Measurements
Figure 5. Individual BD exposure measurements for various workshiftsby group. Administrative control subjects: 28 measurements; monomerproduction workers: 217 measurements; and polymerization workers: 319measurements. BD concentrations are shown on a log scale.
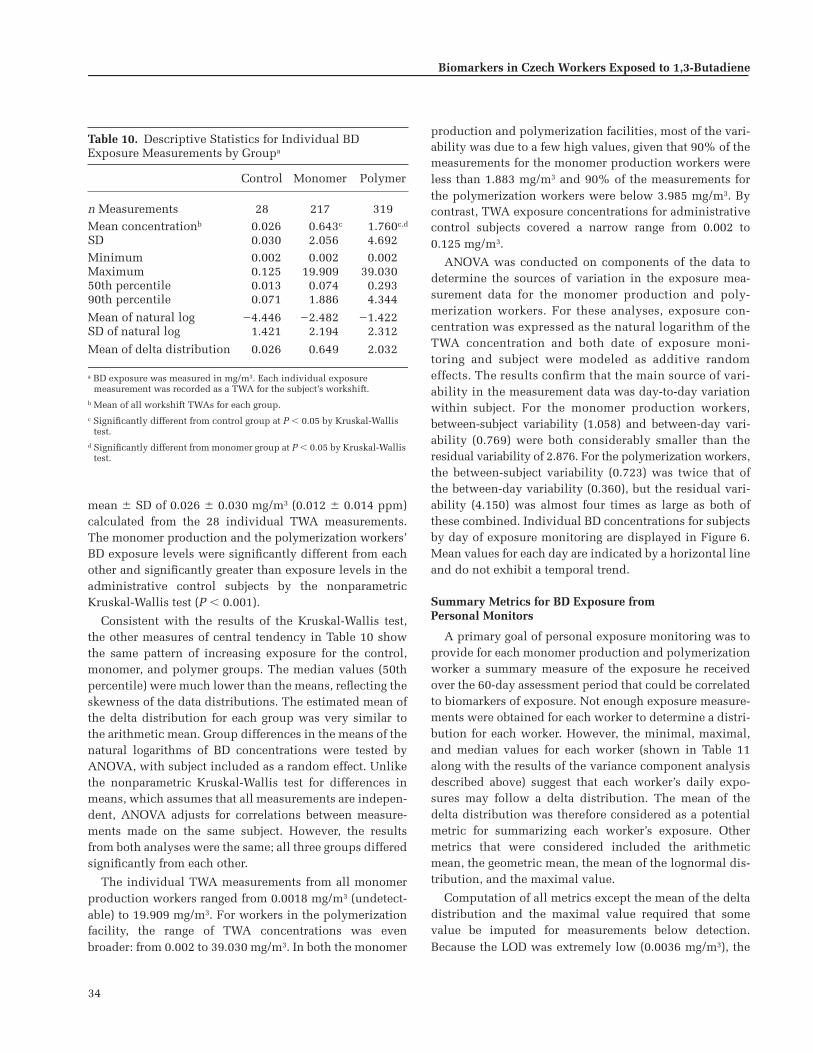
34
Biomarkers in Czech Workers Exposed to 1,3-Butadiene
mean � SD of 0.026 � 0.030 mg/m3 (0.012 � 0.014 ppm)calculated from the 28 individual TWA measurements.The monomer production and the polymerization workers’BD exposure levels were significantly different from eachother and significantly greater than exposure levels in theadministrative control subjects by the nonparametricKruskal-Wallis test (P � 0.001).
Consistent with the results of the Kruskal-Wallis test,the other measures of central tendency in Table 10 showthe same pattern of increasing exposure for the control,monomer, and polymer groups. The median values (50thpercentile) were much lower than the means, reflecting theskewness of the data distributions. The estimated mean ofthe delta distribution for each group was very similar tothe arithmetic mean. Group differences in the means of thenatural logarithms of BD concentrations were tested byANOVA, with subject included as a random effect. Unlikethe nonparametric Kruskal-Wallis test for differences inmeans, which assumes that all measurements are indepen-dent, ANOVA adjusts for correlations between measure-ments made on the same subject. However, the resultsfrom both analyses were the same; all three groups differedsignificantly from each other.
The individual TWA measurements from all monomerproduction workers ranged from 0.0018 mg/m3 (undetect-able) to 19.909 mg/m3. For workers in the polymerizationfacility, the range of TWA concentrations was evenbroader: from 0.002 to 39.030 mg/m3. In both the monomer
production and polymerization facilities, most of the vari-ability was due to a few high values, given that 90% of themeasurements for the monomer production workers wereless than 1.883 mg/m3 and 90% of the measurements forthe polymerization workers were below 3.985 mg/m3. Bycontrast, TWA exposure concentrations for administrativecontrol subjects covered a narrow range from 0.002 to0.125 mg/m3.
ANOVA was conducted on components of the data todetermine the sources of variation in the exposure mea-surement data for the monomer production and poly-merization workers. For these analyses, exposure con-centration was expressed as the natural logarithm of theTWA concentration and both date of exposure moni-toring and subject were modeled as additive randomeffects. The results confirm that the main source of vari-ability in the measurement data was day-to-day variationwithin subject. For the monomer production workers,between-subject variability (1.058) and between-day vari-ability (0.769) were both considerably smaller than theresidual variability of 2.876. For the polymerization workers,the between-subject variability (0.723) was twice that ofthe between-day variability (0.360), but the residual vari-ability (4.150) was almost four times as large as both ofthese combined. Individual BD concentrations for subjectsby day of exposure monitoring are displayed in Figure 6.Mean values for each day are indicated by a horizontal lineand do not exhibit a temporal trend.
Summary Metrics for BD Exposure fromPersonal Monitors
A primary goal of personal exposure monitoring was toprovide for each monomer production and polymerizationworker a summary measure of the exposure he receivedover the 60-day assessment period that could be correlatedto biomarkers of exposure. Not enough exposure measure-ments were obtained for each worker to determine a distri-bution for each worker. However, the minimal, maximal,and median values for each worker (shown in Table 11along with the results of the variance component analysisdescribed above) suggest that each worker’s daily expo-sures may follow a delta distribution. The mean of thedelta distribution was therefore considered as a potentialmetric for summarizing each worker’s exposure. Othermetrics that were considered included the arithmeticmean, the geometric mean, the mean of the lognormal dis-tribution, and the maximal value.
Computation of all metrics except the mean of the deltadistribution and the maximal value required that somevalue be imputed for measurements below detection.Because the LOD was extremely low (0.0036 mg/m3), the
Table 10. Descriptive Statistics for Individual BD Exposure Measurements by Groupa
Control Monomer Polymer
n Measurements 28 217 319Mean concentrationb 0.026 0.643c 1.760c,d
SD 0.030 2.056 4.692Minimum 0.002 0.002 0.002Maximum 0.125 19.909 39.03050th percentile 0.013 0.074 0.29390th percentile 0.071 1.886 4.344
Mean of natural log �4.446 �2.482 �1.422SD of natural log 1.421 2.194 2.312
Mean of delta distribution 0.026 0.649 2.032
a BD exposure was measured in mg/m3. Each individual exposure measurement was recorded as a TWA for the subject’s workshift.
b Mean of all workshift TWAs for each group.c Significantly different from control group at P � 0.05 by Kruskal-Wallis
test.d Significantly different from monomer group at P � 0.05 by Kruskal-Wallis
test.

35
choice of value for imputation had little effect on the arith-metic mean. For example, average exposures for monomerproduction and polymerization workers with one or moreundetectable exposures varied in the fourth decimal pointor less when zero, half the LOD, or the LOD was substi-tuted for these exposures. The imputed value had a largereffect on the mean of the lognormal distribution, which isbased on both the mean and variance of the logarithm ofBD concentration. Because values close to zero have large,negative logarithms, a small change in the imputed valuecould have a substantial effect on the variance estimate andhence the estimated mean of the lognormal distribution.
The various exposure metrics computed for each mono-mer production and polymerization worker are given inTable 11. Although using the mean of the delta distribu-tion has the advantage of not requiring imputation ofvalues below the LOD, it has several drawbacks. Its com-putation is based on estimates of the proportion of valuesbelow the LOD and the mean and variance of the logarithmof values above the LOD, all of which are imprecisebecause most subjects have 10 or fewer measurements.Lack of stability is also an issue, as it is for the estimatedmean of the lognormal distribution, and both methods canlead to estimates that are not very meaningful. For example,the means of the lognormal and delta distributions for sub-ject 101 in the polymer group are much larger than the max-imal value observed for this worker. Such results may alsooccur when the lognormal or delta distributions are notappropriate representations of the empirical distributions.
The arithmetic mean, on the other hand, is a validdescriptive measure regardless of the data distribution. Inaddition, the arithmetic mean reflects cumulative expo-sure over the study period, which may be the most rele-vant exposure parameter for adduct production and forsome of the biomarkers of effect being evaluated in thisstudy. In light of these advantages, and because it is stablewhen different values must be imputed for undetectableexposures, the arithmetic mean was selected as the pri-mary exposure metric for subsequent correlation analyseswith biomarker data. However, when used to rank sub-jects’ exposures, all of the metrics were highly correlated(Table 12) and because most statistical analyses werebased on nonparametric methods, very similar resultswere obtained regardless of the metric used.
Exposure data for workers in the control group (most ofwhom had only one exposure measurement) are also pre-sented in Table 11. In designing the study, we assumedthat all control subjects would have similar, low-levelexposures and that the average of all measurements for thegroup would provide a good estimate of each worker’sexposure. Although this appears to be the case, using the
Exposure Measurements
Figure 6. Measurements of BD presented on a log scale by date of moni-toring for each group of workers. • � 8-hour TWA BD concentrations;— � daily mean concentrations.
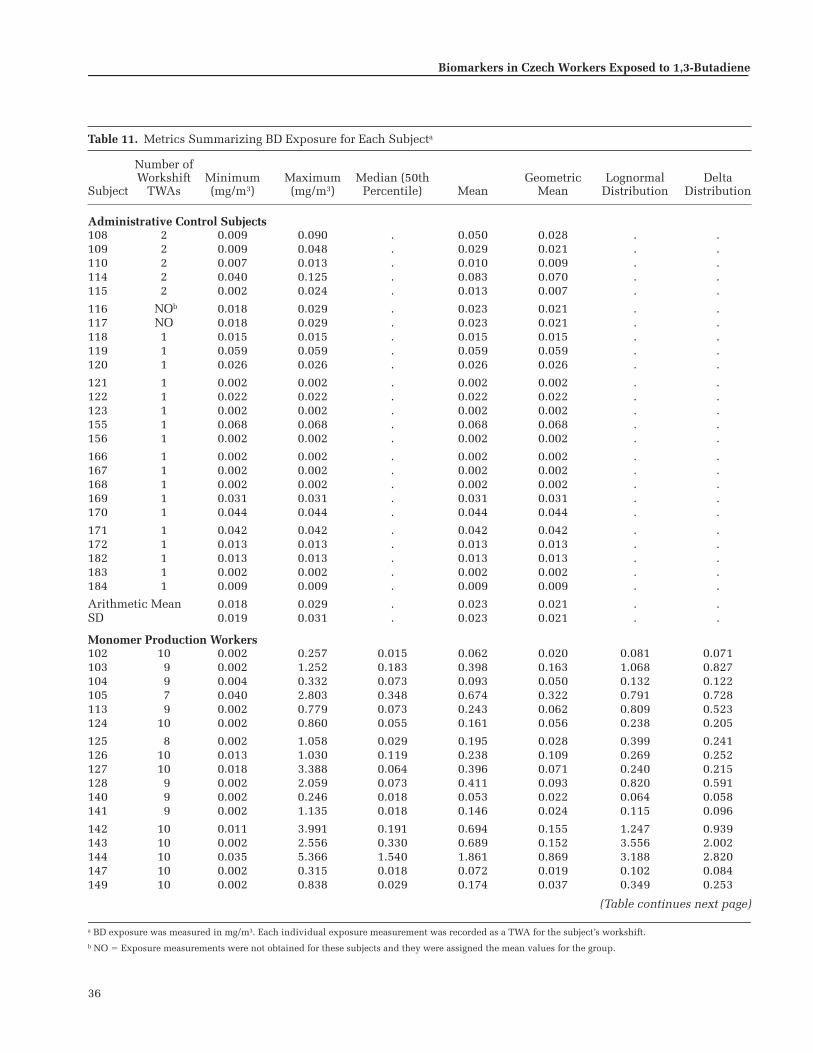
36
Biomarkers in Czech Workers Exposed to 1,3-Butadiene
Table 11. Metrics Summarizing BD Exposure for Each Subjecta
Subject
Number ofWorkshift
TWAsMinimum(mg/m3)
Maximum(mg/m3)
Median (50thPercentile) Mean
GeometricMean
LognormalDistribution
DeltaDistribution
Administrative Control Subjects108 2 0.009 0.090 . 0.050 0.028 . .109 2 0.009 0.048 . 0.029 0.021 . .110 2 0.007 0.013 . 0.010 0.009 . .114 2 0.040 0.125 . 0.083 0.070 . .115 2 0.002 0.024 . 0.013 0.007 . .
116 NOb 0.018 0.029 . 0.023 0.021 . .117 NO 0.018 0.029 . 0.023 0.021 . .118 1 0.015 0.015 . 0.015 0.015 . .119 1 0.059 0.059 . 0.059 0.059 . .120 1 0.026 0.026 . 0.026 0.026 . .
121 1 0.002 0.002 . 0.002 0.002 . .122 1 0.022 0.022 . 0.022 0.022 . .123 1 0.002 0.002 . 0.002 0.002 . .155 1 0.068 0.068 . 0.068 0.068 . .156 1 0.002 0.002 . 0.002 0.002 . .
166 1 0.002 0.002 . 0.002 0.002 . .167 1 0.002 0.002 . 0.002 0.002 . .168 1 0.002 0.002 . 0.002 0.002 . .169 1 0.031 0.031 . 0.031 0.031 . .170 1 0.044 0.044 . 0.044 0.044 . .
171 1 0.042 0.042 . 0.042 0.042 . .172 1 0.013 0.013 . 0.013 0.013 . .182 1 0.013 0.013 . 0.013 0.013 . .183 1 0.002 0.002 . 0.002 0.002 . .184 1 0.009 0.009 . 0.009 0.009 . .
Arithmetic Mean 0.018 0.029 . 0.023 0.021 . .SD 0.019 0.031 . 0.023 0.021 . .
Monomer Production Workers102 10 0.002 0.257 0.015 0.062 0.020 0.081 0.071103 9 0.002 1.252 0.183 0.398 0.163 1.068 0.827104 9 0.004 0.332 0.073 0.093 0.050 0.132 0.122105 7 0.040 2.803 0.348 0.674 0.322 0.791 0.728113 9 0.002 0.779 0.073 0.243 0.062 0.809 0.523124 10 0.002 0.860 0.055 0.161 0.056 0.238 0.205
125 8 0.002 1.058 0.029 0.195 0.028 0.399 0.241126 10 0.013 1.030 0.119 0.238 0.109 0.269 0.252127 10 0.018 3.388 0.064 0.396 0.071 0.240 0.215128 9 0.002 2.059 0.073 0.411 0.093 0.820 0.591140 9 0.002 0.246 0.018 0.053 0.022 0.064 0.058141 9 0.002 1.135 0.018 0.146 0.024 0.115 0.096
142 10 0.011 3.991 0.191 0.694 0.155 1.247 0.939143 10 0.002 2.556 0.330 0.689 0.152 3.556 2.002144 10 0.035 5.366 1.540 1.861 0.869 3.188 2.820147 10 0.002 0.315 0.018 0.072 0.019 0.102 0.084149 10 0.002 0.838 0.029 0.174 0.037 0.349 0.253
(Table continues next page)
a BD exposure was measured in mg/m3. Each individual exposure measurement was recorded as a TWA for the subject’s workshift.b NO � Exposure measurements were not obtained for these subjects and they were assigned the mean values for the group.

37
Exposure Measurements
Table 11 (Continued). Metrics Summarizing BD Exposure for Each Subjecta
Subject
Number ofWorkshift
TWAsMinimum(mg/m3)
Maximum(mg/m3)
Median (50thpercentile) Mean
GeometricMean
LognormalDistribution
DeltaDistribution
Monomer Production Workers (Continued)150 9 0.002 0.585 0.055 0.165 0.062 0.290 0.242151 9 0.011 2.970 1.155 1.266 0.559 3.412 2.687152 10 0.029 19.910 1.489 3.516 1.063 6.131 4.973157 8 0.002 1.956 0.037 0.416 0.055 0.829 0.495177 5 0.029 1.896 0.367 0.607 0.304 0.954 0.813178 8 0.002 19.532 0.084 2.530 0.049 9.908 2.170181 9 0.002 2.851 0.018 0.348 0.025 0.366 0.228
Arithmetic Mean 0.009 3.249 0.266 0.642 0.182 1.473 0.901SD 0.012 5.240 0.453 0.854 0.274 2.332 1.201
Polymerization Workers101 7 0.002 6.765 2.937 2.421 0.402 58.406 13.472106 9 0.037 10.619 0.156 1.503 0.310 1.385 1.167107 10 0.068 4.415 0.411 1.119 0.469 1.317 1.215111 10 0.029 3.247 0.550 0.838 0.322 1.427 1.220112 11 0.002 1.762 0.330 0.641 0.175 2.832 1.825129 10 0.062 39.030 1.602 7.408 1.712 13.073 9.963
130 8 0.011 0.689 0.084 0.188 0.079 0.243 0.217131 8 0.002 2.317 0.185 0.470 0.131 1.269 0.865132 10 0.002 2.317 0.031 0.326 0.035 0.513 0.332133 10 0.011 4.715 0.147 1.154 0.173 2.457 1.597134 10 0.002 1.177 0.167 0.286 0.111 0.603 0.495135 9 0.002 3.155 0.724 1.045 0.384 4.724 3.105
136 10 0.011 2.893 0.196 0.657 0.194 1.002 0.832137 10 0.002 0.587 0.079 0.144 0.070 0.242 0.216138 10 0.002 1.208 0.156 0.262 0.091 0.689 0.526139 10 0.002 7.341 0.020 1.076 0.045 10.787 2.589145 10 0.020 1.740 0.099 0.251 0.091 0.213 0.201146 13 0.031 5.243 0.385 1.211 0.448 1.623 1.471
148 7 0.011 0.726 0.183 0.336 0.167 0.578 0.499153 10 0.002 9.530 0.266 1.754 0.208 7.465 3.664154 11 0.002 6.613 0.660 1.903 0.368 12.882 6.636158 10 0.002 0.801 0.191 0.232 0.096 0.527 0.432159 10 0.167 4.343 0.587 0.990 0.590 1.003 0.980160 9 0.002 19.362 0.684 3.650 0.726 25.765 12.123
161 7 0.018 2.570 0.744 1.206 0.430 3.651 2.506162 10 0.002 18.718 0.414 2.335 0.371 5.503 3.535164 8 0.029 37.376 2.442 9.244 1.835 46.019 23.220165 9 0.011 0.117 0.022 0.040 0.029 0.040 0.040173 7 0.002 0.405 0.191 0.173 0.051 0.884 0.482174 9 0.002 6.365 1.014 2.088 0.739 13.458 7.879175 10 0.002 19.659 2.446 4.669 1.211 45.750 22.076176 7 0.002 27.562 1.179 4.733 0.653 45.152 14.417179 10 0.002 28.228 0.317 3.792 0.262 14.864 6.236180 10 0.110 18.229 0.781 2.848 0.918 2.949 2.666
Arithmetic Mean 0.019 8.818 0.599 1.794 0.409 9.685 4.374SD 0.035 10.745 0.731 2.108 0.443 15.715 6.102
a BD exposure was measured in mg/m3. Each individual exposure measurement was recorded as a TWA for the subject’s workshift.b NO � Exposure measurements were not obtained for these subjects and they were assigned the mean values for the group.

38
Biomarkers in Czech Workers Exposed to 1,3-Butadiene
same exposure value for each worker is problematic in sta-tistical analyses based on individual subjects rather thangroups because it ignores the variability in exposure mea-surements. Average exposures for control subjects weretherefore based on the one or two measurements made foreach worker. For seven of the workers, the single exposuremeasurement was below the LOD and a value of 0.0018mg/m3 (half the LOD) was used. This had no effect on thenonparametric statistical analyses because these workerswere always ranked as having the lowest exposure. Twoworkers had no usable BD exposure measurement due todiscrepancies in sorbent tube numbers and they wereassigned the mean of the average exposures of the othercontrol subjects.
As seen in Table 11, the mean of the average exposurescomputed for each subject are slightly different from thevalues given in Table 10 because not all subjects had thesame number of measurements. The mean of the averageBD concentrations for the 25 administrative control sub-jects was 0.023 � 0.023 mg/m3 (0.010 � 0.010 ppm), forthe 24 monomer production workers was 0.642 � 0.854mg/m3 (0.290 � 0.386 ppm), and for the 34 polymeriza-tion workers was 1.794 � 2.108 mg/m3 (0.812 � 0.954ppm) (see Table 11). All group means were significantlydifferent from each other (Kruskal-Wallis test; P � 0.001).The large standard deviations reflect the variability inaverage 60-day exposures among workers in the samegroup. The distributions of average exposure concentra-tions for the workers in each group are shown in Figure 7on a logarithmic scale. Because average values for mostadministrative control subjects were based on one mea-surement, the distribution for the control group is nearlythe same as in Figure 5, where the separate exposure mea-surements were plotted. The average exposures for the
monomer production and polymerization workers haveapproximately lognormal distributions. None of theseworkers had undetectable BD levels for all of their expo-sure measurements, so none had average exposures belowthe LOD.
Workplace Area Measurements of BD
The different BD concentrations experienced by workersin the different facilities, as measured by personal moni-toring, were also reflected in the 167 workplace area
Table 12. Spearman Correlations Between Metrics for Summarizing BD Exposurea
ArithmeticMean
GeometricMean
Mean ofLognormal
Distribution
Mean of Delta
Distribution
Maximum 0.964 0.744 0.872 0.877Arithmetic
mean0.843 0.942 0.955
Geometric mean
0.775 0.843
Mean oflognormaldistribution
0.988
a Correlations were based on data from the 58 (24 monomer production and 34 polymerization) exposed workers. All correlations were significantly different from zero at P � 0.001.
Figure 7. BD exposure for each group averaged over all days of moni-toring. Administrative control subjects: n � 25; monomer productionworkers: n = 24; and polymerization workers: n � 34. BD concentrationsare shown on a log scale.

39
measurements that were obtained (18 in the controladministration unit, 60 in the monomer production unit,and 89 in the polymerization unit). The LOD for thesemeasurements was 0.0005 mg/m3 (0.0002 ppm) and 18values were undetectable: 5 in the control administrationunit, 4 in the monomer production unit, and 9 in the poly-merization unit. Descriptive statistics for the workplacearea BD measurements are shown in Table 13; undetect-able levels were given a value of 0.00025 mg/m3 (half theLOD) for computing all statistics except the maximalvalue, percentiles, and mean of the delta distribution. Themonomer production and polymerization units had meanconcentrations of 0.316 � 0.388 mg/m3 (0.146 � 0.176ppm) and 0.892 � 1.223 mg/m3 (0.404 � 0.553 ppm),respectively. In the control administration unit, 18 work-place area measurements showed a low-level mean con-centration of 0.043 � 0.098 mg/m3 (0.019 � 0.044 ppm).The means for all three areas were significantly different(Kruskal-Wallis test; P � 0.001). The distributions of work-place area BD concentrations for the control administra-tion, monomer production, and polymerization units areshown in Figure 8 on a logarithmic scale and, like the per-sonal exposure measurements, more values are near zerothan would be expected with a lognormal distribution.
The mean workplace area concentrations of BD that wemeasured during the spring of 1998 are somewhat lowerthan the mean concentrations measured nonrandomly by
the company during the preceding 5 years; the ranges ofvalues for area measurements over those years include theaverage concentrations we recorded (Table 14). The areameasurements made by the company during the springmonths of 1993 through 1997 were roughly similar tothose made during other months of those years, with mostdiscrepancies in the means being due to one or two veryhigh measurements. However, in 1993 and 1996, the meanBD concentrations in the monomer production unit weresignificantly higher in the spring months than during therest of the year and, in 1997, the mean BD concentration inthe polymerization unit was significantly lower during thespring months (Kruskal-Wallis test, P � 0.050).
Exposure Measurements
Table 13. Descriptive Statistics for Workplace Area Measurements of BDa
Adminis-tration
MonomerUnit
PolymerUnit
n Measurements 18 60 89Mean concentration 0.043 0.316b 0.892b,c
SD 0.098 0.388 1.223Minimum 0.00025 0.00025 0.00025Maximum 0.391 1.824 6.24150th percentile 0.005 0.153 0.41490th percentile 0.183 0.989 2.400
Mean of natural log �5.269 �2.272 �1.773SD of natural log 2.350 2.226 2.850
Mean of delta distribution
0.039 0.500 1.898
a BD concentrations were measured in mg/m3.b Significantly different from administration (control) at P � 0.05 by
Kruskal-Wallis test.c Significantly different from monomer unit at P � 0.05 by Kruskal-Wallis
test.
Figure 8. BD measurements in each workplace area. Administration: 18measurements; monomer production facility: 60 measurements; and poly-merization facility: 89 measurements. BD concentrations are shown on alog scale.

40
Biomarkers in Czech Workers Exposed to 1,3-Butadiene
Concurrent VOC Exposure Measurements fromPersonal Monitors
One personal workshift TWA exposure was measuredfor each of 7 administrative control subjects, 10 monomerproduction workers, and 27 polymerization workers. TheseVOC exposure measurements are given in Table 15 and thedescriptive statistics for each group are in Table 16.
The mean benzene exposure concentration for the con-trol group was 0.030 � 0.015 mg/m3 (0.009 � 0.005 ppm),compared with 0.039 � 0.011 mg/m3 (0.012 � 0.003 ppm)for the monomer group and 0.064 � 0.118 mg/m3 (0.020 �0.037 ppm) for the polymer group; differences betweenthese mean concentrations were not statistically signifi-cant. For toluene, the mean exposure concentrations were0.295 � 0.280 mg/m3 (0.078 � 0.074 ppm), 0.162 � 0.125mg/m3 (0.043 � 0.033 ppm), and 0.681 � 1.241 mg/m3
(0.181 � 0.329 ppm) for the same groups, respectively;likewise, these concentrations were also not significantlydifferent. For styrene, the mean exposure concentrationswere 0.118 � 0.046 mg/m3 (0.028 � 0.011 ppm), 0.147 �0.087 mg/m3 (0.035 � 0.020 ppm), and 2.121 � 2.202 mg/m3
(0.498 � 0.517 ppm) for the same groups, respectively; thislast value was significantly greater than the mean values forboth other groups (Kruskal-Wallis test, P � 0.001).
Except for five subjects (two administrative control sub-jects, two monomer production workers, and one polymer-ization worker), a personal BD measurement was obtained
Table 14. Yearly Averages of Nonrandom Workplace Area BD Measurements Made by the Company 1993−1997a
All Months April, May, June
Year
nMeasure-
ments Mean Range
nMeasure-
ments Mean Range
Monomer Unit1993 172 1.512 0–12 48 2.271 0–101994 143 0.692 0–10 36 0.778 0–61995 158 2.975 0–300 50 7.240 0–3001996 137 0.891 0–10 15 2.933 0–101997 165 0.455 0–9 40 0.650 0–9
Polymer Unit1993 193 1.269 0–16 57 1.509 0–161994 201 0.771 0–20 56 0.964 0–201995 202 2.356 0–34 54 1.796 0–211996 183 3.934 0–50 20 1.350 0–51997 151 4.377 0–50 46 1.630 0–20
a BD concentrations were measured in mg/m3.
Table 15. VOC Exposure Measurements for Those Subjects Selected for Personal Monitoringa
Subject Benzene Toluene Styrene
Administrative Control Subjects108 0.028 0.309 0.216109 0.025 0.545 0.077110 0.022 0.011 0.107114 0.027 0.671 0.089116 0.058 0.487 0.099118 0.038 0.027 0.112166 0.011 0.016 0.127
Monomer Production Workers102 0.040 0.145 0.131103 0.035 0.305 0.078113 0.052 0.067 0.178149 0.035 0.083 0.087150 0.035 0.157 0.112152 0.062 0.157 0.131157 0.040 0.452 0.380177 0.035 0.119 0.103178 0.024 0.082 0.156181 0.035 0.053 0.110
Polymerization Workers101 0.053 0.043 0.288107 0.047 0.043 0.504111 0.040 0.072 2.027112 0.035 0.038 1.211
129 0.035 0.093 3.136130 0.032 0.016 3.252131 0.046 4.678 0.572132 0.058 4.370 6.224
133 0.058 1.745 0.316134 0.020 0.030 0.886135 0.062 1.123 1.435
136 0.028 0.134 0.481137 0.034 0.912 0.776138 0.034 0.506 0.307145 0.065 0.985 0.405153 0.024 0.009 0.178154 0.035 0.028 9.628158 0.653 0.151 3.631159 0.036 0.014 3.270160 0.036 0.018 0.673162 0.030 0.018 2.945164 0.046 1.849 3.128165 0.030 1.303 0.369174 0.033 0.049 2.886175 0.042 0.046 3.075
179 0.058 0.050 4.909180 0.067 0.054 0.763
a Exposure to VOCs was measured in mg/m3 and recorded as a TWA for the subject’s workshift. Subjects were selected such that measurements could be made at irregular intervals to cover all shifts for exposed workers and administrative control subjects. Each selected subject had one measurement.

41
on the same day as the benzene, toluene, and styrene mea-surements. Spearman correlations between these exposuresare shown in Table 17 for the 39 subjects with same-daymeasurements of the four chemicals. Benzene exposurewas moderately correlated with BD, styrene, and tolueneexposures; and toluene concentrations were unrelated toBD and styrene concentrations. However, the Spearmancorrelation between BD and styrene was 0.710 (P � 0.001);this relation is shown in Figure 9.
Workplace Area Measurements of VOCs
Workplace area measurements were also made for ben-zene, toluene, and styrene; these mean concentrationswere consistent with the measurements made by personalmonitoring, although (like the workplace area BD concen-trations) they were lower than the personal exposure con-centrations (Table 18).
Exposure Measurements
Table 16. Descriptive Statistics for Individual VOC Exposure Measurements by Groupa
Control Monomer Polymer
n Measurements 7 10 27
BenzeneMean 0.030 0.039 0.064SD 0.015 0.011 0.118
Minimum 0.011 0.024 0.020Maximum 0.058 0.062 0.65350th percentile 0.027 0.035 0.03690th percentile 0.058 0.057 0.065
TolueneMean 0.295 0.162 0.681SD 0.280 0.125 1.241Minimum 0.011 0.053 0.009Maximum 0.671 0.452 4.67850th percentile 0.309 0.132 0.05490th percentile 0.671 0.378 1.849
StyreneMean 0.118 0.147 2.121b
SD 0.046 0.087 2.202Minimum 0.077 0.078 0.178Maximum 0.216 0.380 9.62850th percentile 0.107 0.121 1.21190th percentile 0.216 0.279 4.909
a All VOCs were measured in mg/m3 and recorded as TWAs for the subjects’ workshifts.
b Significantly different from both the control and monomer groups atP � 0.05 by Kruskal-Wallis test.
Figure 9. BD and styrene exposure measured on the same day. � �administrative control subjects; � � monomer production workers; � �polymerization workers.
Table 17. Spearman Correlations Between BD, Styrene, Benzene, and Toluene Exposures Measured on theSame Daya
Styrene Benzene Toluene
r P r P r P
BD 0.710 �0.001 0.320 0.049 0.009 0.959Styrene 0.334 0.038 �0.040 0.808Benzene 0.338 0.035
a Correlations computed for the 39 control and exposed subjects who had concurrent personal BD and VOC exposure measurements.
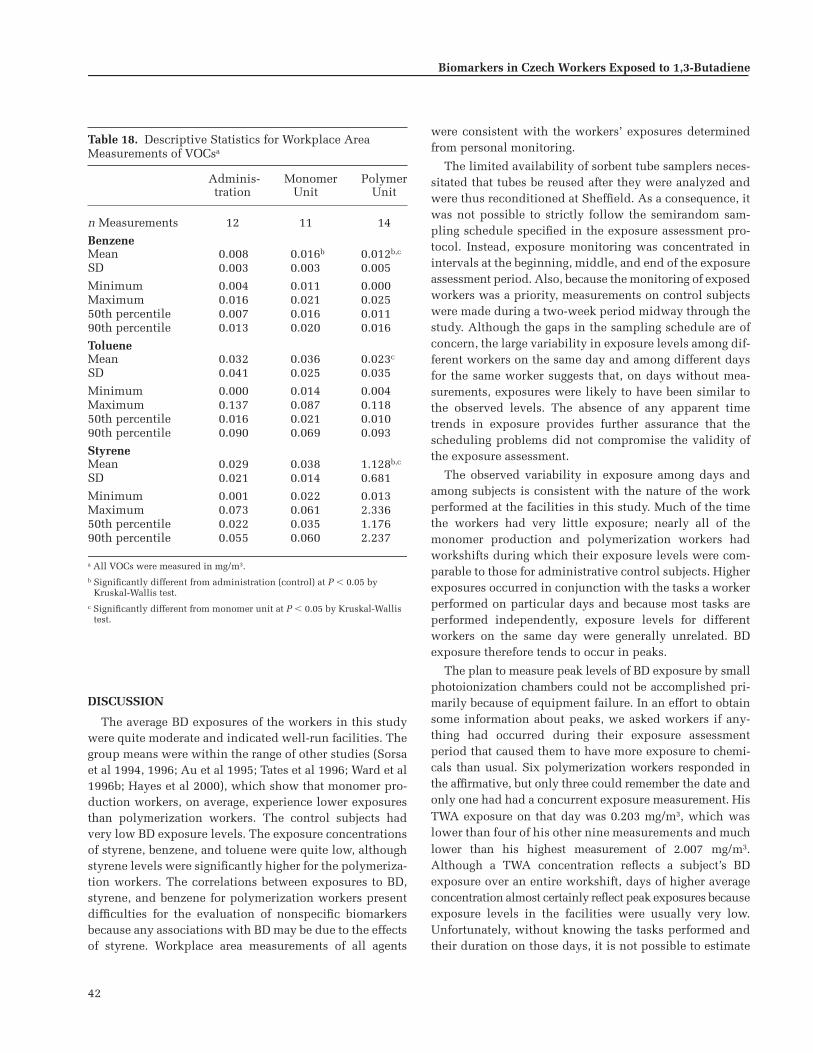
42
Biomarkers in Czech Workers Exposed to 1,3-Butadiene
DISCUSSION
The average BD exposures of the workers in this studywere quite moderate and indicated well-run facilities. Thegroup means were within the range of other studies (Sorsaet al 1994, 1996; Au et al 1995; Tates et al 1996; Ward et al1996b; Hayes et al 2000), which show that monomer pro-duction workers, on average, experience lower exposuresthan polymerization workers. The control subjects hadvery low BD exposure levels. The exposure concentrationsof styrene, benzene, and toluene were quite low, althoughstyrene levels were significantly higher for the polymeriza-tion workers. The correlations between exposures to BD,styrene, and benzene for polymerization workers presentdifficulties for the evaluation of nonspecific biomarkersbecause any associations with BD may be due to the effectsof styrene. Workplace area measurements of all agents
were consistent with the workers’ exposures determinedfrom personal monitoring.
The limited availability of sorbent tube samplers neces-sitated that tubes be reused after they were analyzed andwere thus reconditioned at Sheffield. As a consequence, itwas not possible to strictly follow the semirandom sam-pling schedule specified in the exposure assessment pro-tocol. Instead, exposure monitoring was concentrated inintervals at the beginning, middle, and end of the exposureassessment period. Also, because the monitoring of exposedworkers was a priority, measurements on control subjectswere made during a two-week period midway through thestudy. Although the gaps in the sampling schedule are ofconcern, the large variability in exposure levels among dif-ferent workers on the same day and among different daysfor the same worker suggests that, on days without mea-surements, exposures were likely to have been similar tothe observed levels. The absence of any apparent timetrends in exposure provides further assurance that thescheduling problems did not compromise the validity ofthe exposure assessment.
The observed variability in exposure among days andamong subjects is consistent with the nature of the workperformed at the facilities in this study. Much of the timethe workers had very little exposure; nearly all of themonomer production and polymerization workers hadworkshifts during which their exposure levels were com-parable to those for administrative control subjects. Higherexposures occurred in conjunction with the tasks a workerperformed on particular days and because most tasks areperformed independently, exposure levels for differentworkers on the same day were generally unrelated. BDexposure therefore tends to occur in peaks.
The plan to measure peak levels of BD exposure by smallphotoionization chambers could not be accomplished pri-marily because of equipment failure. In an effort to obtainsome information about peaks, we asked workers if any-thing had occurred during their exposure assessmentperiod that caused them to have more exposure to chemi-cals than usual. Six polymerization workers responded inthe affirmative, but only three could remember the date andonly one had had a concurrent exposure measurement. HisTWA exposure on that day was 0.203 mg/m3, which waslower than four of his other nine measurements and muchlower than his highest measurement of 2.007 mg/m3.Although a TWA concentration reflects a subject’s BDexposure over an entire workshift, days of higher averageconcentration almost certainly reflect peak exposures becauseexposure levels in the facilities were usually very low.Unfortunately, without knowing the tasks performed andtheir duration on those days, it is not possible to estimate
Table 18. Descriptive Statistics for Workplace Area Measurements of VOCsa
Adminis-tration
MonomerUnit
PolymerUnit
n Measurements 12 11 14
BenzeneMean 0.008 0.016b 0.012b,c
SD 0.003 0.003 0.005
Minimum 0.004 0.011 0.000Maximum 0.016 0.021 0.02550th percentile 0.007 0.016 0.01190th percentile 0.013 0.020 0.016
TolueneMean 0.032 0.036 0.023c
SD 0.041 0.025 0.035
Minimum 0.000 0.014 0.004Maximum 0.137 0.087 0.11850th percentile 0.016 0.021 0.01090th percentile 0.090 0.069 0.093
StyreneMean 0.029 0.038 1.128b,c
SD 0.021 0.014 0.681
Minimum 0.001 0.022 0.013Maximum 0.073 0.061 2.33650th percentile 0.022 0.035 1.17690th percentile 0.055 0.060 2.237
a All VOCs were measured in mg/m3.b Significantly different from administration (control) at P � 0.05 by
Kruskal-Wallis test.c Significantly different from monomer unit at P � 0.05 by Kruskal-Wallis
test.

43
the peak concentrations. The lack of data on peak expo-sures limited our ability to determine the effects of veryhigh but brief exposures on biomarker production. How-ever, even with more detailed data this would have beenvery difficult without daily exposure monitoring to ensurethat all peaks were observed.
The day-to-day variation in BD exposure demonstratesthe importance of obtaining multiple measurements fromeach worker. In addition to permitting the construction ofalternative metrics to reflect different aspects of exposurepatterns, multiple measurements would provide a moreprecise estimate of a worker’s average exposure. It is pos-sible, even with 10 measurements per subject during the60-day assessment period, that some high-exposure dayswere missed, which would lead to an underestimation ofaverage exposure for some workers. Nevertheless, the cur-rent exposure assessment is the most extensive achieved inthe BD industry. Most studies of the effects of occupationalexposure to BD have obtained only one measurement perperson (Sorsa et al 1994, 1996; Au et al 1995; Tates et al1996; Ward et al 1996b; Hayes et al 2000). A single mea-surement is likely to be a very poor estimate of a worker’saverage exposure over time if exposure patterns are similarto those observed in this study.
BIOMARKERS OF EXPOSURE:BD METABOLITES IN URINE
METABOLISM OF BD TO FORM URINARY M2 AND M1
The process of BD metabolism has been described in theearlier Overview section (see Figures 1 and 2). Here wefocus on the epoxide metabolite BDO and its hydrolyzedmetabolite BD-diol because they are integral to the path-ways through which urinary M2 and M1 are formed(Figure 10).
The pathway to form M2 starts with BDO directly conju-gating (thus referred to as the “conjugation pathway”) withGSH (catalyzed by GST). The GSH conjugate is furthermetabolized to the corresponding cysteine-S conjugate ofBDO that is N-acetylated to form the isomeric mixtureof M2.
The pathway to form M1 is more complex. It begins withBDO being hydrolyzed (thus referred to as the “hydrolysispathway”) by EH to form BD-diol, which is then conju-gated with GSH (catalyzed by GST). The exact mechanismof GSH conjugation of BD-diol is not known. The mostcommon hypothesis is that ADH catalyzes the conversionof BD-diol to 1-hydroxy-2-oxo-3-butene, which would rap-idly react with GSH along the unsaturated bond (Sabourinet al 1992; Kemper et al 1996). Once formed, the GSH con-jugate is further metabolized to M1, the correspondingmercapturic acid that is excreted in the urine.
Human metabolism of BD has been investigated verysuperficially. In contrast, the metabolism of BD in miceand rats has been studied in depth. One study exposedmice and rats via a 6-hour inhalation of 200 ppm (442 mg/m3)[2,3-14C]-BD ([Richardson et al. 1999). Despite the differ-ences in metabolism between rats and mice, all urinarymetabolites that could be identified were formed throughan epoxy intermediate. These metabolites accounted formore than 98% (in rats) and more than 88% (in mice) of allurinary radioactivity. This makes it likely that, in humansalso, epoxides are the major if not only precursor for uri-nary metabolites. Thus, studying epoxide-derived metabo-lites as biomarkers of BD exposure in humans is a validapproach.
M2 AND M1 AS BIOMARKERS OF EXPOSURE
Monitoring occupational exposure to BD may be con-ducted by using one or more urinary metabolites as bio-markers. Mercapturic acids have proved to be very suitablebiomarkers for human exposure to a variety of industrialchemicals (eg, allyl chloride, 1,3-dichloropropene, epichloro-hydrin, ethylene oxide, benzene) (Van Welie et al 1991;
Urinary Metabolites

44
Biomarkers in Czech Workers Exposed to 1,3-Butadiene
Popp et al 1994; Boogaard and van Sittert 1995, 1996; deRooij et al 1997a,b). When mercapturic acid metaboliteswere first proposed as biomarkers for occupational expo-sure to BD (Osterman-Golkar et al 1991; Osterman-Golkarand Bond 1996), assays were developed to measure M2and M1 (Bechtold et al 1994). The assay for M1 wasdesigned to be sensitive enough to measure average BDexposures of 3 to 4 ppm (6.6 to 8.8 mg/m3) during theworkshift. However, when it was applied, relatively highconcentrations of M1 could also be detected in urine fromadministrative control subjects. When the assay for M2was applied, levels of M2 in urine from administrativecontrol subjects were below the LOD of 100 �g/L (Bechtoldet al 1994). In the present study, we modified the methods
for determining urinary M2 and M1 to increase their sensi-tivity and then applied them to (1) investigate whetherthey are sensitive indicators of exposure to BD, and (2)establish the relation between exposure to BD and theselected biomarkers. Characterizing such a relation mightpermit setting a biological exposure limit (BEL) for BD thatwould be equivalent to the airborne OEL values.
METHODS
For a review of how urinary samples were collected andhandled, see the earlier section Study Design: SubjectSelection, Sample Acquisition and Handling, and Statis-tical Methods / Sample Acquisition and Handling / Sub-jects’ Biological Samples.
Figure 10. Diagram of only those pathways of BD and BDO metabolism that lead to the formation of the urinary metabolites M2 and M1. This is a portion ofFigure 1, which shows more of a simplified metabolic scheme for BD to its various metabolites. The box around a chemical structure indicates that it is anelectrophilic (or reactive) epoxide metabolite.

45
Synthesis of Reference and Internal Standards
Reference standards of M1 and M2 were prepared asdescribed by Sabourin and colleagues (1992) and Elfarraand associates (1995), respectively. Internal standardswere also made: N-Acetyl-S-(2,3-dihydroxypropyl)-L-cys-teine (DHP-MA) was prepared as described by Jones (1975)and used as an internal standard for urinary M1. A deute-rium [d6]-labeled isomeric mixture of M2 ([d6]-M2) wasprepared as described by Elfarra and associates (1995) andused as an internal standard for urinary M2. All referenceand internal standards were prepared in methanol in con-centrations of 100 �g/L M2 or [d6]-M2 and 10 mg/L M1 orDHP-MA and stored at �20�C.
Calibration Standards and Curves
An aliquot from each urine sample from all administra-tive control subjects was pooled and the pool was con-firmed to have low natural background levels of M2 andM1; the pool was then spiked with a range of knownquantities of the M2 (0–200 �g/L) and M1 (0–20 mg/L)reference standards. These calibration standards wereanalyzed using gas chromatography with negative-electron-capture ionization and tandem mass spectrometry (GC-NECI-MS/MS) to generate calibration curves; the peakareas of M2 and M1 derivatives increased linearly withM2 and M1 concentrations over the entire range of spikedquantities. The calibration standards were also analyzedwith each batch of subjects’ urine samples as part of theQC procedures.
QC Urine Standards
From the same pool of administrative control subjects’background urine, two QC urine standards were pre-pared: one with low concentrations of both M2 and M1(0.76 � 0.05 �g/L and 257 � 27.6 �g/L, respectively) andone with high concentrations of both M2 and M1 (6.75 �0.26 �g/L and 1605 � 90 �g/L, respectively). Both QCurine standards were analyzed 15 times and the meanconcentrations of high and low M2 and M1 were calcu-lated to use as assigned QC values. QC urine standardswere analyzed at the beginning and end of each day’sbatch of subjects’ urine samples to ensure run-to-runreproducibility.
QC Procedures
Standard operating procedures for handling (see the ear-lier section Study Design: Subject Selection, Sample Acqui-sition and Handling, and Statistical Methods / Chain of Cus-tody), cleaning up and derivatizing, and analyzing sampleswere designed and documented in accordance with the
requirements of the Shell Research and Technology CentreAmsterdam Management System (NEN-EN-ISO 14001–certified). All staff members were required to keep boundlaboratory notebooks acceptable to Good Laboratory Prac-tices (GLP) standards. All data gathered and produced(printed copies and electronic versions) and all notebookswere stored in the Amsterdam central archives when fullor not in use. Printed and electronic versions of all final-ized data were sent to the central study office in Burlingtonfor statistical analysis and storage.
Before each use, the GC-NECI-MS/MS apparatus wascarefully tuned and the sensitivity was checked by mea-suring the signal-to-noise ratio (S/N) of the m/z 272 peak in aselected ion chromatogram after injecting 1 pg octafluo-ronaphthalene. If the sensitivity was satisfactory (S/N � 10),the system was calibrated and the performance checked byanalyzing (1) 100 pg of the two reference and two internalM2 and M1 standards in full-scan mode to verify thatselected ion chromatograms of m/z 653 (for M1), 639 (forDHP-MA), 441 (for M2), and 447 (for [d6]-M2) had intensi-ties ranging from 105 to 106; (2) 100 pg of the two referenceand two internal M2 and M1 standards in product ion full-scan mode to verify that product ion spectra contained theparent→daughter ion pairs 653→167 and 653→211 forM1, 639→167 and 639→211 for DHP-MA, 441→175 and441→176 for M2, and 447→175 and 447→176 for [d6]-M2;and (3) 10 pg of the two reference and two internal M2 andM1 standards in multiple-reaction monitoring (MRM)mode to verify that S/N for M2 and M1 was 10.
Additional QC procedures were incorporated before,during, and after analyzing each day’s batch of subjects’urine samples. First, at the beginning and end of eachseries, at least two QC urine standards (both low and highconcentrations of M2 and M1) were analyzed. The analyt-ical results of a daily batch were accepted if the deviationsin all QC urine standards were less than 5% of theirassigned values. Second, a series of calibration standardswas randomly spread throughout the samples of the dailybatch. About 10% of all subjects’ urine samples plus about10% of all QC urine standards and calibration standardswere randomly chosen and divided into duplicates or trip-licates. Thus, about 20% of all samples and standards pro-vided QC data. All QC data (from all QC urine standardsand from all calibration standards) were checked to ensurerun-to-run reproducibility and stability of calibration beforedata from the daily batch of samples were released foranalysis.
Analysis of Urinary M2 and M1
Aliquots (0.1 mL) of internal standards [d6]-M2 andDHP-MA and 200 mg sodium chloride were added to 1.0-mL
Urinary Metabolites
46
Biomarkers in Czech Workers Exposed to 1,3-Butadiene
urine samples (pH 2.5); the metabolites were extractedwith ethyl acetate containing 20% methanol (v/v). Afterevaporating the organic phase, metabolites were deriva-tized by methylation in 1.0 mL methanol:anhydrous HCl(1:10) for 15 minutes at room temperature, followed bypentafluorobenzoylation by reaction with pentafluoroben-zoylchloride (7.0 �L) in toluene (400 �L) and pyridine(2.0 �L) for 60 minutes at 60�C. The methylated and penta-fluorobenzoylated metabolites were dried and the residuewas dissolved in toluene (100 �L).
Derivatized metabolites were analyzed by GC-NECI-MS/MS and MRM on a Finnigan TSQ700 triple-quadrupolemass spectrometer equipped with a Varian 3400 gas chro-matograph. The analyses were performed by a 1.0-�L coldon-column injection using a DB-1 column (15 m 0.32 mm;0.25 �m film thickness; J&W Scientific) with helium as thecarrier gas moving at a flow rate of 1 mL/min. The initialoven temperature was 80�C; after 1 minute, the tempera-ture was increased at a rate of 10�C/min to 320�C and heldfor 5 minutes. Methane was used as the moderator gas andargon as the collision gas at a source temperature of 120�Cand a source pressure of 5000 mTorr (6.67 hPa). Ions(parent→daughters) of the derivatives were monitored atm/z 653→167 and 653→211 for M1; m/z 639→167 and639→211 for DHP-MA; m/z 441→175 and 441→176 forM2; and m/z 447→175 and 447→176 for [d6]-M2.
Concentrations of a metabolite in urine may depend onthe rate of urine production; measuring the metabolite ineither a too-dilute or too-concentrated urine sample maylead to misinterpretation. Therefore, in all subjects’ urinesamples, urinary creatinine was also measured using thepicrate method on a clinical autoanalyzer (Cobas Mira,Roche). However, when samples in which the creatinineconcentrations fell within the range of 4 to 30 mmol/L (theacceptable range) were compared with samples in whichthe creatinine concentrations fell outside of that range, theresults were statistically equivalent. Therefore, we saw noreason to exclude data or samples from the statistical anal-yses on the basis of creatinine levels.
Statistical Methods
A complete description of all statistical methods is pre-sented in the earlier section Study Design: Subject Selec-tion, Sample Acquisition and Handling, and StatisticalMethods / Data Processing and Statistical Analysis.
RESULTS
Measurement of Urinary M2 and M1
The LOD for M2 in methanol was 0.1 �g/L; this sensi-tivity allowed us to quantify the urinary background
concentrations. The LOD for M1 in methanol was 5 �g/L;the relatively high urinary background concentrations(mostly � 100 �g/L) could be easily measured.
M2 and M1 urinary metabolites of BD were determinedfor the 25 administrative control subjects, the 24 monomerproduction workers, and the 34 polymerization workers.One before-work urine sample from a polymerizationworker was not sent to the laboratory due to insufficientvolume; therefore, before-work and net (after-work minusbefore-work) concentrations were determined for 33 of the34 polymerization workers (see Table 19). The before-workmean concentrations for both metabolites were higher forthe polymer group than for monomer or control groups,but group differences were statistically significant only forM2 (Kruskal-Wallis test, P � 0.001). As expected, M2 con-centrations were 1 to 2 orders of magnitude lower thanthose observed for M1.
The mean urinary concentration of M1 after work was353 �g/mL for the control group, 764 �g/L for the monomergroup, and 4647 �g/L for the polymer group (Table 19).Despite the variability among values within each group, asreflected by large standard deviations, all group means dif-fered significantly from each other (Kruskal-Wallis test;P � 0.001) and paralleled the differences in the mean BDexposures of the groups (see Table 10). The mean urinaryconcentrations of M2 after work also differed among theexposure groups: 1.70 �g/L for the control group, 9.44 �g/Lfor the monomer group, and 120.17 �g/L for the polymergroup. Again the urinary concentrations were quite vari-able but group differences were statistically significant(Kruskal-Wallis test; P � 0.001) and were in the same rankorder as the mean BD exposure concentrations.
Results based on net concentrations (after-work valuesminus before-work values) were consistent with the after-work results, but the difference in M2 concentrationsbetween monomer and polymer groups was not statisti-cally significant. For the control group, the mean net uri-nary concentrations for both M2 and M1 were negative andfor M1 the value was significantly lower than zero (Wil-coxon signed-rank test, P � 0.001). This probably reflects abefore-work urinary excretion level somewhat higher thanthe after-work level for many of the administrative controlsubjects, as indicated by creatinine concentrations beinghigher before work than after work (data not shown; Wil-coxon signed-rank test P � 0.032). Mean net metaboliteconcentrations for the monomer and polymer groups werepositive; but negative M2 and M1 net concentrations wereobserved for some individual workers in these groups (thepolymerization workers had the most extreme negativevalues). Large decreases in metabolite concentrationsoccurred among subjects with high before-work values and

47
were not due to differences in creatinine concentrationsbefore and after work (data not shown).
Urinary M2 and M1 metabolite concentrations were nor-malized to creatinine levels by computing their ratio(micrograms of metabolite per millimole creatinine) foreach subject; all statistical analyses were repeated usingthese values. Results were very similar to those describedabove, but in general the normalized values had greatervariability than the original concentrations. Urinary creat-inine concentrations were outside the 4 to 30 mmol/Lrange in four samples from administrative control subjects,one sample from a monomer production worker, and foursamples from polymerization workers. We also performedanalyses after excluding those samples because assayresults from samples with creatinine concentrations out-side the 4 to 30 mmol/L range may be unreliable (Hoet1996). However, the results were very similar to thoseobtained using the entire data set.
Correlations Among Urinary Biomarkersand Personal Exposure Monitoring Results
After-work urinary metabolite concentrations wererelated to BD exposure levels determined on the day ofurine collection (Table 20). For the 22 subjects (3 adminis-trative control subjects, 5 monomer production workers,and 14 polymerization workers) for whom same-day expo-sure data were available, the Spearman correlation (r) withafter-work M1 was 0.618 (P � 0.002). After-work M2 con-centrations showed a very similar relation to same-dayexposures (r � 0.614; P � 0.002). Expanding the analysisto include the additional 22 administrative control sub-jects for whom same-day BD exposure measurements werenot obtained but who presumably had negligible expo-sures (a total of 44 subjects) did not affect the significanceof these relations, although the correlation coefficients weresomewhat lower. For the M1 metabolite, the Spearman cor-relation coefficient was 0.540 for this expanded group
Table 19. Urinary Metabolites by Groupa
Control(n � 25)
Monomer(n � 24)
Polymer(n � 34)b
M1Before work
Mean � SD 571 � 273 551 � 290 1493 � 2081Median 465 479 610
After workMean � SD 353 � 157 764 � 728c 4647 � 6630c,d
Median 314 542 1420
Net (after � before)Mean � SD −219 � 274e 213 � 565c 2683 � 5868c,d
Median −162 40 513
M2Before work
Mean � SD 2.20 � 1.53 4.16 � 6.36 25.50 � 51.03c,d
Median 2.00 2.65 5.30
After workMean � SD 1.70 � 1.54 9.44 � 12.97c 120.17 � 228.17c,d
Median 1.30 3.70 17.95
Net (after � before)Mean ± SD �0.50 � 1.22 5.28 � 8.54c 84.26 � 225.95c
Median �0.70 1.80 10.70
a Data are given in µg/L.b One before-work urine sample was not analyzed due to insufficient sample volume; therefore the before-work and net values were calculated for 33 of the
34 polymerization workers.c Significantly different from control group at P � 0.05 by Kruskal-Wallis test.d Significantly different from monomer group at P � 0.05 by Kruskal-Wallis test.e Significantly lower than 0 at P � 0.001 by Wilcoxon signed-rank test.
Urinary Metabolites
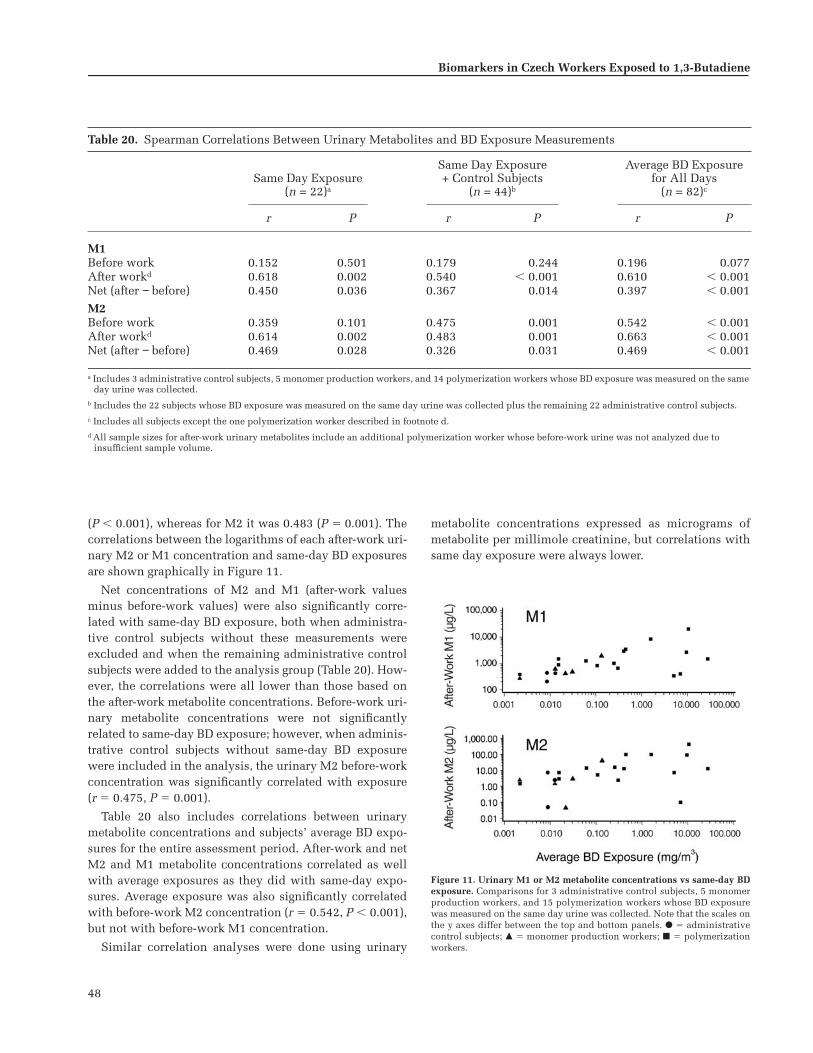
48
Biomarkers in Czech Workers Exposed to 1,3-Butadiene
(P � 0.001), whereas for M2 it was 0.483 (P � 0.001). Thecorrelations between the logarithms of each after-work uri-nary M2 or M1 concentration and same-day BD exposuresare shown graphically in Figure 11.
Net concentrations of M2 and M1 (after-work valuesminus before-work values) were also significantly corre-lated with same-day BD exposure, both when administra-tive control subjects without these measurements wereexcluded and when the remaining administrative controlsubjects were added to the analysis group (Table 20). How-ever, the correlations were all lower than those based onthe after-work metabolite concentrations. Before-work uri-nary metabolite concentrations were not significantlyrelated to same-day BD exposure; however, when adminis-trative control subjects without same-day BD exposurewere included in the analysis, the urinary M2 before-workconcentration was significantly correlated with exposure(r � 0.475, P � 0.001).
Table 20 also includes correlations between urinarymetabolite concentrations and subjects’ average BD expo-sures for the entire assessment period. After-work and netM2 and M1 metabolite concentrations correlated as wellwith average exposures as they did with same-day expo-sures. Average exposure was also significantly correlatedwith before-work M2 concentration (r � 0.542, P � 0.001),but not with before-work M1 concentration.
Similar correlation analyses were done using urinary
metabolite concentrations expressed as micrograms ofmetabolite per millimole creatinine, but correlations withsame day exposure were always lower.
Table 20. Spearman Correlations Between Urinary Metabolites and BD Exposure Measurements
Same Day Exposure(n = 22)a
Same Day Exposure+ Control Subjects
(n = 44)b
Average BD Exposure for All Days
(n = 82)c
r P r P r P
M1Before work 0.152 0.501 0.179 0.244 0.196 0.077After workd 0.618 0.002 0.540 � 0.001 0.610 � 0.001Net (after − before) 0.450 0.036 0.367 0.014 0.397 � 0.001
M2Before work 0.359 0.101 0.475 0.001 0.542 � 0.001After workd 0.614 0.002 0.483 0.001 0.663 � 0.001Net (after − before) 0.469 0.028 0.326 0.031 0.469 � 0.001
a Includes 3 administrative control subjects, 5 monomer production workers, and 14 polymerization workers whose BD exposure was measured on the same day urine was collected.
b Includes the 22 subjects whose BD exposure was measured on the same day urine was collected plus the remaining 22 administrative control subjects.c Includes all subjects except the one polymerization worker described in footnote d.d All sample sizes for after-work urinary metabolites include an additional polymerization worker whose before-work urine was not analyzed due to
insufficient sample volume.
Figure 11. Urinary M1 or M2 metabolite concentrations vs same-day BDexposure. Comparisons for 3 administrative control subjects, 5 monomerproduction workers, and 15 polymerization workers whose BD exposurewas measured on the same day urine was collected. Note that the scales onthe y axes differ between the top and bottom panels. � � administrativecontrol subjects; � � monomer production workers; � � polymerizationworkers.

49
Influence of Genotypes and Metabolic Pathways(GSH Conjugation vs EH Hydrolysis)
Statistical analyses were performed to examine the pos-sible influence of GSTM1 and GSTT1 genotypes on urinaryexcretion concentrations of the M2 and M1 metabolites.No significant effects of genotype expression were de-tected in any of the groups or through the entire study pop-ulation as a whole. We also found no significant effect ofsmoking on either the M2 or M1 metabolite concentration,and no significant interactions between exposure group andeither genotype or smoking.
M2 represents the conjugation pathway of BD metabo-lism because it results from the detoxification of BDO bydirect GSH conjugation, whereas M1 represents thehydrolysis pathway of BD metabolism because it resultsfrom detoxification of BDO by epoxide hydrolysis as thefirst step. Hence, the ratio of urinary M2/(M1 � M2) isdirectly related to the activity of the GSH conjugationpathway mediated by GST and inversely related to theactivity of the hydrolysis pathway mediated by EH. Theratio M2/(M1 � M2) was determined for the BD urinarymetabolite data to investigate whether this ratio is influ-enced by BD exposure. When M2 and M1 concentrationswere determined on after-work urine samples, the mean � SDratio was 0.0049 � 0.0043 for the control group, 0.0115 �0.0110 for the monomer group, and 0.0182 � 0.0153 for thepolymer group. The rank order of these mean ratios,polymer group � monomer group � control group, is thesame as the rank order of group mean BD exposures. Thecontrol group mean differs significantly from both themonomer and the polymer group means (Kruskal-Wallistest; P � 0.001). The after-work ratio M2/(M1 � M2) was
significantly correlated with average BD exposure over theentire assessment period (r � 0.539, P � 0.001) and withsame-day exposure concentration among workers who hadthis measurement on the first day of urine sampling(r � 0.451, P � 0.031).
In Table 21, mean values for the ratio M2/(M1 � M2) aregiven for GSTM1 and GSTT1 genotypes. The mean ratiofor workers of the GSTM1-null genotype was always lowerthan the mean ratio for workers in the same group who hadthe positive phenotype; when all subjects were included,the difference between the null and positive GSTM1 geno-types was statistically significant (ANOVA, P � 0.036). Wefound no significant exposure-group–by–genotype inter-action, which indicates that the size of the differencebetween the null genotype and positive genotype did notvary significantly among the three exposure groups. How-ever, regression analysis of M2/(M1 � M2) ratios on BDexposure by genotype (assuming a common intercept andexcluding unexposed administrative control subjects)showed a significantly positive difference between slopesfor after-work values for workers of GSTM1-positive geno-type (P � 0.027) (Figure 12). This difference in slope wasnot significant, however, when the logarithms of the ratioswere used in the analysis. (We had compared GST geno-types in unexposed administrative control subjects todetermine that it is appropriate to assume a common inter-cept at low BD exposure levels for the regression analysisof these genotypes.)
Workers with the GSTT1-null genotype also had lowermean ratios than workers in the same group with theGSTT1-positive phenotype, but the average differenceacross groups was not statistically significant and we
Urinary Metabolites
Table 21. Urinary Metabolite Ratio M2/(M1 � M2) After Work by Group and Genotypea
Control(n � 25)
Monomer(n � 24)
Polymer(n � 34)
All Groups(n � 83)
GSTM1n 16 14 23 53Positive 0.0052 � 0.0041 0.0137 � 0.0131 0.0211 � 0.0168 0.0143 � 0.0146
n 9 10 11 30Null 0.0044 � 0.0048 0.0085 � 0.0067 0.0121 � 0.0097 0.0086 � 0.0079b
GSTT1n 20 20 30 70Positive 0.0054 � 0.0046 0.0130 � 0.0116 0.0190 � 0.0158 0.0134 � 0.0134
n 5 4 4 13Null 0.0029 � 0.0016 0.0044 � 0.0013 0.0117 � 0.0096 0.0060 � 0.0063
a Data are presented as the mean � SD for the number of subjects in the row above.b Significantly different from positive genotype at P � 0.036 by two-way ANOVA. No significant exposure-group–by–genotype interactions were found.

50
Biomarkers in Czech Workers Exposed to 1,3-Butadiene
found no significant exposure-group–by–genotype inter-action. We also noted no significant slope differences inthe regression analysis using this genotype.
Workers were also genotyped for CYP2E1, EH, and ADHpolymorphisms. EH and ADH genotypes showed no asso-ciation with M1 or M2 concentrations or the ratio. How-ever, regression analysis on BD exposure by genotyperevealed a significantly positive slope difference for bothafter-work M2 concentrations (P � 0.030; Figure 13) andM2/(M1 � M2) ratios (P � 0.013; Figure 14) for workerswho are homozygous for the CYP2E1 D/D intron 6 poly-morphism compared with workers who are heterozygousfor C/D. The slope difference for the ratio, however, wasonly significant when the logarithm of the ratio was used
in the analysis. Although the functional significance of theD mutation is not certain in the homozygous form, it wasassociated with greater in vivo production of the M2metabolite of BD in these workers.
We found no significant differences in the M2/(M1 � M2)ratios for current smokers compared with nonsmokers inthis study population.
DISCUSSION
Because of the potential carcinogenicity of BD tohumans, it is important to minimize occupational andenvironmental exposures. To evaluate the effectiveness ofcontrol measures, reliable biomarkers are needed thatallow detection of low-level BD exposure in occupation-ally exposed workers. In addition, measuring biomarkersmay provide insight into the human metabolism of BD andallow a comparison of metabolism among species (mouse,rat, human), which would be useful in assessing cancerrisk in humans. We modified the urinary M2 and M1 tests,which were first used by Bechtold and coworkers (1994) asbiomarkers of exposure to BD, to enable detection of thelow BD exposure levels now present in occupational set-tings. In the method as developed in Amsterdam for deter-mining urinary M2, the sensitivity was improved enoughto allow detection of low natural background levels. In theunexposed administrative control subjects, concentrationsranging from � 0.1 to 8.2 �g/L were measured. Natural back-ground levels of M1 were markedly higher than those of M2(generally � 100 �g/L). From the background value, the 97.5percentile concentration of M2 was 5.5 �g/L and of M1was 700 �g/L. This means that workers whose after-workurine samples contained M2 or M1 in concentrations thatexceeded these values were most likely exposed to BD.
Figure 12. Urinary metabolite ratio M2/(M1 � M2) vs average BD expo-sure by GSTM1 genotype. and solid line indicate GSTM1-positive phe-notype; and broken line indicate GSTM1-null genotype. Slopes differsignificantly (P � 0.027) as determined by regression analysis assuming acommon intercept for both genotypes.
Figure 13. Urinary M2 vs average BD exposure by CYP2E1 genotype. and solid line indicate C/D genotype; and broken line indicate D/D geno-type. Slopes differ significantly (P � 0.030) as determined by regressionanalysis assuming a common intercept for both genotypes.
Figure 14. Urinary M2/(M1 � M2) vs average BD exposure by CYP2E1genotype. and solid line indicate C/D genotype; and broken line indi-cate D/D genotype. Slopes differ significantly (P � 0.013) as determined byregression analysis assuming a common intercept for both genotypes.

51
Results for both urinary biomarkers correlated well withthe personal exposure monitoring results for BD. The bestcorrelations were obtained using the concentrations of M2or M1 measured in after-work samples. Surprisingly, thecorrelation between personal BD exposure and the netincrease of M2 or M1 was not as good as that obtained withafter-work samples, even when only urinary samples andexposure data that were collected on the same day wereused in the analysis. In urine samples from polymerizationworkers collected before work on the first urine samplingday, M2 and M1 concentrations were both higher than insamples from administrative control subjects. However,only for M2 was this higher value statistically significant,which indicates that M2 from previous BD exposure hadnot yet been completely eliminated after the presumed48-hour period without occupational BD exposure.
When we designed this study, we assumed that the half-lives of M2 and M1 would be short enough to allow a com-plete washout in a period of 2 days. The elimination half-lives for the mercapturates of several industrial chemicalshave been determined through biological monitoring ofoperators and found to be short. For compounds that donot require a first phase of metabolism but undergo directGSH conjugation (such as allyl chloride, 1,3-dichloropro-pene, and epichlorohydrin), half-lives range from 2.5 to5.0 hours (Van Welie et al 1991; de Rooij et al 1997a,b); thisindicates that the excretion of mercapturates from humansis very rapid. For compounds such as BD that require oxi-dation metabolism before GSH conjugation and subse-quent second-phase metabolism to mercapturates, some-what longer half-lives were observed, but still short enoughto allow a washout in 2 days. For benzene, for instance, ahalf-life of 9.1 hours was determined (Boogaard and vanSittert 1995, 1996). Thus far, the only exception reported isdimethylformamide, which is metabolized via N-methyl-formamide and methyl isocyanate to N-methylcarbamoylmercapturic acid, and then excreted in the urine with anapparent half-life of 23 hours. In this case the long half-lifecan be explained by the rate-limiting reversible proteinbinding of the methylisocyanate intermediate before theGSH conjugation (Mraz et al 1991; Mraz and Nohova1992); but such a protein binding is not expected for BD.
As previously noted, urine samples were collected fromworkers on the last 3 days of exposure assessment and theday-2 and day-3 samples were stored for possible analysislater. In an attempt to further characterize the unexpect-edly prolonged half-lives of the M2 and M1 metabolites,attempts were made to analyze day-3 samples in a dif-ferent laboratory, but this was unsuccessful.
The measurement of relatively high natural backgroundlevels of M1 in urine from individuals with no known
exposure to BD demonstrates that M1 is not only producedfrom exposure to BD but also from other sources. After BDexposure, M1 is formed by hydrolysis of BDO to BD-dioland then conjugation of BD-diol with GSH. It is unknownwhere the background levels of M1 originate. We postulatedthat endogenous M1 originates from endogenous BD-diol.What these natural background levels imply for cancer riskfrom BD exposure are currently unknown.
The data on biomarkers obtained in this study can beused to explore relative pathways of metabolism of BD inhumans, which can be compared with metabolism datafrom rats and mice. First, that the M1 values were so muchhigher than the M2 values (usually one to two orders ofmagnitude higher in the same urine sample) indicates thathydrolysis is the primary route of detoxification in humans.Second, the linear regression models of the relations betweensame-day BD air exposure and urinary M2 or M1 indicatethat the proportion of inhaled BD that is excreted as M2 orM1 in urine decreases with increasing BD exposures, prob-ably because other metabolic pathways take precedence.Third, because M2 is formed through direct GSH conjuga-tion and M1 through EH-catalyzed hydrolysis and thenGSH conjugation, the ratio M2/(M1 � M2) is a direct mea-sure for the importance of the GSH conjugation pathway inthe detoxification of BDO. Table 22 summarizes the excre-tion of urinary metabolites from rat, mouse, monkey, andhuman after exposure to BD. The ratio M2/(M1 � M2)ranks human � monkey � rat � mouse for the conjugationpathway, which is consistent with previous reports (Sab-ourin et al 1992; Bechtold et al 1994; Dahl and Henderson2000). This shows that hydrolysis is a much more impor-tant pathway in primates than in rodents.
The ratio M2/(M1 � M2) was lower in all three groups ofworkers with null genotypes of both GSTM1 and GSTT1.This indicates that, most likely, workers with both GSTgenotypes are catalyzing the direct conjugation of BDOwith GSH. Although for workers with either the GSTM1-null or GSTT1-null genotype the mean ratio was alwayslower than for the workers with the positive genotype, theeffect was only statistically significant for workers withthe GSTM1 genotypes. The effects were not very strong,again indicative of the relatively minor importance of theconjugation pathway compared with the hydrolysis pathwayfor BDO.
Other researchers have hypothesized that the formationof M1 involves ADH (Sabourin et al 1992; Kemper et al1996). However, in this study, neither the excretions of M2and M1 nor the ratio M2/(M1 � M2) showed any correla-tion with ADH genotypes. Although no effect of ADHgenotypes on the ratio M2/(M1 � M2) was observed, wecannot rule out that ADH is involved in the formation of
Urinary Metabolites

52
Biomarkers in Czech Workers Exposed to 1,3-Butadiene
M1. For ADH2, which was one of the ADH polymorphismswe studied, very few workers carried the variant allele (seethe earlier section Workers’ Exposure Groups, PersonalCharacteristics, and Metabolic Genotypes / Metabolic Geno-types / Results: Genotypes).
After exposure to [2,3-14C]BD for 6 hours, the ratio of[total metabolites formed via GSH pathway]/[total metabolitesformed via hydrolytic plus GSH pathways] was even smallerin rats and greater in mice than the ratio M2/(M1 � M2)(Richardson et al 1998c, 1999; van Sittert et al 2000). Thesefindings, along with those from the current study and fromSabourin and associates (1992), also indicate that, in pri-mates compared with rodents, a much greater proportionof BDO is metabolized by hydrolysis and a much smallerproportion is detoxified via direct conjugation with GSH.Also in the current study, however, the M2/(M1 � M2)ratio for all subjects was found to increase at increasing BDexposures, even though the changes were small. Regardless,these data indicate that, as the BD exposure concentrationsincreased, a somewhat smaller proportion of BDO was
hydrolyzed into BD-diol and a somewhat greater proportionwas detoxified by direct conjugation with GSH.
An unexpected observation was an association betweenthe CYP2E1 D/D genotype and increased production of theM2 metabolite with higher M2/(M1 � M2) ratios relative toBD exposure levels. The significance of this remains to bedefined. Comparative studies in transgenic rodents mayhelp to clarify this and further elucidate the metabolicpathways of BD. This finding illustrates how molecularepidemiologic findings in humans can be used, along withanimal data, for the overall toxicologic evaluation of achemical.
From the findings described above about the metabo-lism of BDO in humans, rats, and mice after exposure toBD, it may be expected that the proportion of BDO thatundergoes further oxidation to BDO2 is of the rank order ofmouse � rat � human. Even if BDO2 is formed in humans,one would expect it to be rapidly hydrolyzed to BDO-diol,or erythritol, or both, or to be further metabolized bydirect conjugation with GSH (Boogaard and Bond 1996;
Table 22. Comparison of Urinary Metabolite Excretion and Metabolite Ratios Among Human, Monkey, Rat, and Mouse After BD Exposure
M2 (Conjugation Pathway
from BDO)
M1 (Hydrolysis Pathway
from BDO) M2/(M1 + M2)
HumanPresent studya
BD for 8 hours at 2.21 mg/m3 (1 ppm)Amount of metabolite (µg/L) 21.5 2257 0.0094
MonkeySabourin et al 1992BD for 2 hours at 663 mg/m3 (300 ppm)
Percentage of total metabolites 6 55 0.098
Rat and MouseBechtold et al 1994BD for 4 hours at 25.86 mg/m3 (11.7 ppm)
Rat: Amount of metabolite (nmol) 150 156 0.49Mouse: Amount of metabolite (nmol) 34 10.3 0.767
Rat and MouseRichardson et al 1999[14C]BD for 6 hours at 442 mg/m3 (200 ppm)
Rat: Percentage of total metabolites 18.6 17.5 0.515Mouse: Percentage of total metabolites 16.6 10.1 0.622
a The monkey, rat, and mouse studies reported here each used a predetermined and fixed BD exposure level. In the current study, each human subject was exposed to a different concentration of BD. Therefore, to more easily compare the human data with those from other species, we chose a concentration of 2.21 mg/m3 (1 ppm) because, first, it is commonly used in similar calculations for carcinogens such as ethylene oxide and propylene oxide; and second, it is the internal exposure limit for BD used by Shell, where this work was done. Furthermore, we arrived at the M2 and M1 values by substituting the value of 2.21 in the equations representing the regressions depicted in Figure 11. (These equations ignore incomplete washout, which potentially affects the data points from which the equations were derived.)

53
Boogaard et al 1996) and released as a detoxificationproduct. Thus, the extent to which BDO2 would be avail-able, if at all, to react with either DNA or Hb is very small.This is, indeed, in line with the results on Hb adducts ofmetabolites of BD that were obtained in this study (see thenext section Biomarkers of Exposure: Hb Adducts), whichalso led to the conclusion that BDO-diol and not BDO2 isthe most important circulating reactive metabolite of BD.
BIOMARKERS OF EXPOSURE: Hb ADDUCTS
Exposure assessment is one of the most important butleast accurate parameters in epidemiologic studies. Expo-sure is often estimated only from job descriptions; andindustrial hygiene measurements are usually made in des-ignated areas of the workplace and may not reflect indi-vidual worker’s exposures. In addition, peak exposuresmay not be captured in routine monitoring.
Measurements of Hb adducts offer some importantadvantages over industrial hygiene measurements and othermeasurements of internal dose:
• Blood samples are readily available and contain largeamounts of Hb.
• The analysis of protein adducts is highly sensitiveand specific. Small Hb adducts are not repaired andtherefore accumulate for the life span of the erythro-cyte (120 days in humans); this allows studies to becarried out at low exposure levels.
• Studies of Hb adducts in humans, which seek to inte-grate exposure over time, can provide considerablyimproved exposure assessments because the adductsaccumulate for about 120 days.
• Hb adducts provide a measure of the dose of reactivechemicals in laboratory animals and in humans,thereby eliminating some of the difficulties in extra-polating from high doses to low doses and across spe-cies (Osterman-Golkar et al 1993).
• Hb adducts provide information on the internal doseof the reactive intermediates of a chemical; in the caseof BD, these intermediates have vastly different poten-cies as genotoxins.
Nevertheless, Hb adducts also have clear limitations.They provide information on the average exposure of anindividual over the life span of the erythrocyte, but they donot provide information on tissue-specific alkylation. Forexample, inhalation exposure to propylene oxide yieldsone value for its Hb adduct hydroxypropylvaline; whereasthe same exposure produces 43-fold differences in DNAadducts in different tissues (Ríos-Blanco et al 2000). Hbadducts do not directly reflect persistent DNA damage. Asmentioned above, Hb adducts are not repaired, whereasDNA adducts are subject to repair; unless exposure occursunder very similar patterns each day, the relations be-tween Hb and DNA adducts become extremely complex.Thus, Hb adducts provide excellent measures of systemicexposure, but have clear limitations in predicting theextent of DNA damage associated with that exposure.
The BD metabolite BDO (see Figure 15) has been shown
Hemoglobin Adducts

54
Biomarkers in Czech Workers Exposed to 1,3-Butadiene
to react with Hb to form HBVal adducts. Two major andtwo minor peaks have been identified using GC-MS. Thetwo major peaks were shown to be diastereomers resultingfrom attack on the N-terminal valine-NH2 at the C1 positionof BDO (Osterman-Golkar et al 1991, 1993; van Sittert andVan Vliet 1994). Adduct concentrations of 1 to 3 pmol/g
globin have been recorded in humans (nonsmokers)working in a production area with �1 ppm (2.21 mg/m3)BD exposure levels. Adducts have also been measured incigarette smokers not occupationally exposed to BD. Thereported adduct levels were lower in humans than in miceand rats exposed to 2 ppm (4.42 mg/m3) BD, and were
Figure 15. Diagram highlighting the metabolism of BD to BDO, BDO2, and BDO-diol, which lead to the formation of the Hb adducts HBVal and THBVal.This is a portion of Figure 1, which shows more of a simplified metabolic scheme for BD to its various metabolites. The box around a chemical structureindicates that it is an electrophilic (or reactive) epoxide metabolite; arrow with broken lines indicate some uncertainty about this pathway.
55
much lower than hydroxyethylvaline adducts associatedwith occupational exposures to ethylene oxide and eth-ylene (Osterman-Golkar et al 1991, 1993; van Sittert andVan Vliet 1994). Albrecht and colleagues (1993) reportedadduct amounts five times higher in mice than in rats (17and 3.5 nmol/g globin, respectively, at exposure levels of500 ppm [1105 mg/m3], 6 hours/day, for 5 days), althoughthe diastereomers were not resolved by GC-MS.
It is clear that BD exposure results in a nonlinear dose-response that is characteristic of metabolic activationreaching saturation, and that mice have higher amounts ofthe HBVal adducts than rats (Albrecht et al 1993; La andSwenberg 1997; Koc et al 1999). This conclusion is alsosupported by two studies on the induction of micronucleiin rats and mice in that micronuclei could not be inducedin rats (Adler et al 1994; Autio et al 1994). In pilot studies,we compared male and female rats and mice exposed to1000 ppm (2210 mg/m3) BD for 13 weeks and found thatfemales had higher levels of HBVal adducts than males(Tretyakova et al 1996). This was confirmed in a largerstudy (Swenberg et al 2000a) and in subsequent compari-sons of rats and mice (Upton et al 2000). All of the Hb studieshave utilized the modified Edman degradation method ofTörnqvist and associates (1986), which is based on GC-MSmeasurements that use an internal standard of [d4]-N-(2-hydroxyethyl)valine, [14C]-N-(2-hydroxypropyl)valine, orN-(2-hydroxy-3-butenyl)valine-glycine-glycine, or anexternal standard of N-(2-hydroxy-3-butenyl)-[13C5]-valine.
A second Hb adduct of BD, THBVal, was initially thoughtto arise from BDO2, which was subsequently hydrolyzed tothe adduct. Two facts about BDO2 highlighted the impor-tance of developing methods to quantify the relativeamounts of Hb adducts so that comparisons could be madeamong species: BDO2 is formed in greater amounts by themouse than by the rat; and the mutagenicity of BDO2 ismuch greater than other BD metabolites. Pérez andcoworkers (1997) reported the formation of THBValadducts of Hb in rats and two humans and provided evi-dence that they were primarily formed by BDO-diol ratherthan by BDO2. Furthermore, the THBVal adducts wereformed in greater amounts than previous measurements ofHBVal adducts. The authors concluded that BDO-diolappeared to be an important metabolite of BD. In rodentsexposed to [4-14C]BDO (1–50 mg/kg by intraperitonealinjection), both HBVal and THBVal increased in nonlinearfashion with dose. In both rats and mice, the concentrationof THBVal was two orders of magnitude higher than theconcentration of HBVal. In rats, the ratio THBVal:HBValwas constant with increasing dose; in mice this ratio wasabout twice as large and decreased with increasing dose,which suggests metabolic saturation (Richardson et al
1996, 1997, 1998b). In rats and mice exposed by nose-onlyinhalation to 200 ppm (442 mg/m3) [2,3-14C]BD for 6 hours,the ratio of THBVal:HBVal was higher in mice than in rats(Richardson et al 1998a,b; van Sittert et al 2000).
The THBVal adducts were further explored in humanand animal studies by Swenberg and colleagues (2000a) andin a molecular epidemiology study by Hayes and associates(2000). Both adducts appeared to be excellent biomarkers ofexposure to BD, but data have not been analyzed to system-atically demonstrate the relations between HBVal andTHBVal in humans. The present investigation was the firststudy to show that the ratio THBVal:HBVal is approximately400 in humans exposed to � 2.21 mg/m3 (� 1 ppm) BD.
Furthermore, the presence of THBVal adducts has beenclearly demonstrated in unexposed animals and humans(Richardson et al 1998a,b; Hayes et al 2000; Swenberg et al2000a). The sources of the endogenous THBVal are notpresently known, but it may not actually arise from expo-sure to BD.
Currently no methods are available to quantify specific Hbadducts of BDO2. A cyclic adduct on the N-terminus of valine[N,N-(2,3-dihydroxybuta-1,4-diyl)valine] has been proposedby Rydberg and coworkers (1996). A major problem in devel-oping ultrasensitive methods to identify this adduct is thatthe modified Edman degradation cannot be applied. Amethod involving acid hydrolysis and derivatization for gaschromatography with electron-capture negative chemicalionization and high-resolution mass spectrometry (GC-ECNCI-HRMS) is being developed. When human globin wasexposed to BDO2 (�0.02 mmol), elevated levels of N,N-(2,3-dihydroxybuta-1,4-diyl)valine (6 nmol/mg globin) were dem-onstrated using GC-MS/MS (Ranasinghe et al 2000).
Several investigators have shown that mice producemuch greater amounts of BDO2 than rats. Metabolismstudies of BD using human liver suggest that humans aremore like rats than mice in the amount and type of metab-olites formed; however, considerable interindividual vari-ation has been noted (Seaton et al 1995; Boogaard andBond 1996; Boogaard et al 1996).
Recent molecular dosimetry studies on DNA adducts ofBD in rodents have shown that BDO-diol is the major elec-trophilic metabolite of BD and accounts for �98% of theadducts formed (Koc et al 1999; Koivisto et al 1999; VanSittert et al 2000; Swenberg et al 2000b; Boogaard et al2000, 2001, unpublished results 2003). This was a highlysignificant finding; none of the metabolism studies hadmeasured BDO-diol and it is the weakest mutagen of thethree electrophilic metabolites, being 1/200th as potent asBDO2 (Cochrane and Skopek 1994a,b). Although it can beformed from either oxidation of BD-diol or hydrolysis ofBDO2, the molecular dosimetry studies of DNA adducts
Hemoglobin Adducts

56
Biomarkers in Czech Workers Exposed to 1,3-Butadiene
strongly support the hydrolysis of BDO2 as the primarypathway (Koc et al 1999; Boogaard et al unpublished results2003). The previous measurements of BDO and BDO2 arethought to represent the amounts of these metabolites thatescape from the endoplasmic reticulum before hydrolysisof BDO2 to BDO-diol. The species differences for BDO2,with mice having much higher amounts, represents thegreater role of GSH detoxification in mice compared withrats and humans, in which EH is the dominant pathway fordetoxification of BD.
Hb adducts may be considered to be surrogates for thefunctionally important DNA adducts. Although not inves-tigated in the current study population, the identificationand quantification of DNA adducts formed by BD and itsmetabolites have been actively studied by several researchteams. DNA adducts have been characterized at the N7 posi-tion of guanine and the N1, N3, and N6 positions of adenine(Citti et al 1984; Leuratti et al 1994; Neagu et al 1995; Trety-akova et al 1996, 1997a,b,c, 1998; Koivisto et al 1996, 1998b;Boogaard et al 1998, 2000, 2001, unpublished results2003). Multiple DNA adducts are formed at each of theabove positions because attack at the C1 and C2 positions ofBDO, BDO-diol, and BDO2 are possible. This is furthercomplicated by diastereomers if nucleosides or nucle-otides are being measured, and by stereoisomers of the tri-hydroxybutyl-adenine and trihydroxybutyl-guanine adductsformed by BDO-diol and isomeric or meso-BDO2.
The molecular dosimetry study of Koc and coworkers(1999) compared BD-DNA adducts in rats and mice acrossexposures ranging from 20 to 625 ppm (44.2–1381.3 mg/m3)for 4 weeks. Using liquid chromatography with tandemmass spectrometry (LC-MS/MS), the study demonstratedthat the trihydroxybutyl adducts at N7 of guanine (THB-G)were formed in much greater amounts than the hydroxy-butenyl adducts at N7 of guanine {HB-G; the total of N7-(1-[hydroxymethyl]-2-propenyl)guanine and N7-(2-hydroxy-3-butenyl)guanine} in both rats and mice. In addition, thestudy demonstrated that the exposure-response curve forTHB-G was nonlinear, a result of metabolic activationreaching saturation. In contrast, the exposure-responsecurve for HB-G was linear. This study also strongly sug-gested that BDO-diol was the main electrophile to formTHB-G. It also showed that similar numbers of adductswere present in all tissues examined, which suggests thatthe electrophilic metabolites circulate in the blood.
Koivisto and colleagues (1999) confirmed these findingsusing 32P-postlabeling. When rats and mice were exposed vianose only to [2,3-14C]-BD (200 ppm [442 mg/m3] for 6 hours),the major DNA adduct formed in liver, lung, and testes wasalso THB-G. The concentrations of THB-G were more thanan order of magnitude higher than concentrations of HB-G
in both mice and rats. In rats and mice exposed to 14C-BDO,HB-G was formed; the levels in rats were 2 to 3 times higherthan those in mice. THB-G was also formed, but at muchhigher concentrations (Boogaard et al 1998, 2000, 2001,unpublished results 2003). In vitro reactions of 2�-deoxy-guanosine and DNA with the stereoisomers of BDO-diol,isomeric BDO2, and meso-BDO2 showed specific formationof the THB-G adducts from the different epoxides; thisconfirms that BDO-diol is the most important epoxide ofBD with regard to macromolecular binding (Boogaard et al2000, 2001, unpublished results 2003).
In the present study, we modified the methods for deter-mining HBVal and THBVal to gain sensitivity and thenapplied them to:
1. investigate the sensitivity of the Hb adducts as bio-markers of human exposure to BD;
2. establish the relation between workplace exposure toBD and the levels of HBVal and THBVal (determiningsuch a relation may permit setting a BEL for BD thatcorresponds with airborne OEL values);
3. investigate the correlation between HBVal and THBVallevels;
4. use the molecular dosimetry of Hb adducts as an indi-vidual’s internal dosimeter of BD exposure to investi-gate exposure-response relations for genotoxicitystudies in the same individual; and
5. examine the 95% CI for THBVal as a predictor of inter-individual differences in the metabolism of BD.
MATERIALS AND METHODS FOR HBVal ANALYSIS
Synthesis of Reference and Internal Standards
HBVal in globin was used as the reference standard andprepared as described by Osterman-Golkar and Bond(1996).
An isomeric mixture of [d6]HBVal in globin was used asan internal standard and prepared as follows: [d6]-LabeledBDO was prepared from [d6]BD as described by Handley(1994). A 70-�L aliquot of a solution of [d6]BDO in DMSO(30 mg BDO in 300 �L DMSO) was added to washedhuman erythrocytes and then placed in a shaker incubatorat 35�C for 16 hours. Globin was extracted from the eryth-rocytes and purified as described previously (Mowrer et al1986). The level of [d6]HBVal in globin was determined using[14C]-labeled HBVal in globin as a reference standard in theEdman degradation method. The amount of [14C]HBVal inglobin was measured by protein hydrolysis and chromatog-raphy. Using this procedure, the level of [d6]HBVal in globinwas determined to be 951 nmol/g globin.
57
Reference and internal standard solutions were pre-pared in formamide and stored at �20�C.
Calibration Standards and Curves
Calibration curves with known quantities of HBVal(0–50 pmol/g globin) were prepared from the calibrationstandard of HBVal (200 pmol/g globin/mL formamide). Thepeak areas of the pentafluorophenylthiohydantoin (PFPTH)derivative of HBVal increased linearly with HBVal in globinconcentrations over the entire range.
QC Procedures
We followed the QC procedures outlined for the urinarymetabolites M2 and M1 (see the earlier section Biomarkers ofExposure: BD Metabolites in Urine / Methods / QC Proce-dures / second paragraph) with the following exception.Once the GC-MS/MS apparatus was tuned and the sensitivitywas satisfactory, the system was calibrated and the perfor-mance checked by analyzing (1) 70 pg of each of the referenceand internal standards in full-scan mode to verify thatselected ion chromatograms of m/z 374 and 380 had intensi-ties ranging from 105 to 106; (2) 70 pg of each of the referenceand internal standards in product ion full-scan mode to verifythat product ion spectra contained the parent → daughter ionpairs 380 → 320 and 374 → 318; and (3) 0.7 pg of each of thereference and internal standards in MRM mode to verify thatS/N ratios for both HBVal and [d6]HBVal were 5.
Each day at least two QC standards, a high and a lowconcentration standard, were analyzed following the pro-cedures outlined for urinary metabolites in the earlier sec-tion Biomarkers of Exposure: BD Metabolites in Urine /Methods / Calibration Standards and Curves; and QC Pro-cedures / third paragraph.
HBVal Analysis
HBVal was measured as described previously (Rich-ardson et al 1996, 1998a) except that [d6]HBVal was usedas an internal standard and that analysis of the sampleswas carried out by gas chromatography with negativechemical ionization and tandem mass spectrometry (GC-NCI-MS/MS) with MRM. In brief, globin was isolated andthe internal standard solution (10 pmol [d6]HBVal/g globin)was added to 200-mg globin samples dissolved in forma-mide (6 mL). The pH was adjusted to between pH 6.6 and7 and pentafluorophenylisothiocyanate (PFPITC; 30 �L;Fluka, Buchs, Switzerland) was added and the mixtureincubated (about 16 hours) in the dark at room tempera-ture. The reaction mixture was heated to 45�C for 90 min-utes and then cooled to room temperature; 1.0 mL waterwas added to the PFPTH derivatives, followed by 2.0 mLether. After shaking and centrifugation for 10 minutes at
1000g, the ethereal phase was removed; further aliquots ofwater (1.0 mL) and ether (3.0 mL) were added and the par-tition was repeated; the ethereal phases were combinedand evaporated to dryness under a gentle stream of nitrogen.The residue was dissolved in 1 to 2 mL toluene and thesolution partitioned with 2.0 mL water; aqueous sodiumcarbonate was added and the phases were mixed for10 minutes; the phases were separated by centrifugationfor 10 minutes at 1000g; the organic phase was washedwith 2.0 mL water and then evaporated to dryness under agentle stream of nitrogen. The dry samples were stored at�20�C until required for analysis.
The samples were redissolved in toluene (50 �L) andthe substituted PFPTH of the alkylated N-terminal valineadduct was analyzed by GC-NECI-MS/MS with MRM on aFinnegan TSQ 700 triple-quadrupole mass spectrometerequipped with a Varian 3400 gas chromatograph. The anal-yses were performed by a 1-�L cold on-column injectionusing a DB5 MS column (30 mm 0.25 mm; 0.25 �m filmthickness; J&W Scientific) with helium as a carrier gasmoving at a flow rate of 1 mL/min. The initial oven tem-perature was 80�C. After 1 minute, the temperature wasincreased at a rate of 30�C/min to 190�C and then by anincrease of 3�C/min to 320�C. Methane was used as themoderator gas and argon as the collision gas at a sourcetemperature of 120�C and a source pressure of 5000 mTorr(6.67 hPa). Ions of the derivatives at m/z 374 → 304 andm/z 374 → 318 for HBVal-PFPTH and m/z 380 → 304and m/z 380 → 320 for [d6]HBVal-PFPTH were measured.
MATERIALS AND METHODS FOR THBVal ANALYSIS
Synthesis of Internal Standards
The internal standard, THB[13C5]Val, was synthesizedby Dr J Krzeminski of the American Health Foundationunder contract from the National Cancer Institute Chem-ical Carcinogen Reference Standards Repository and fur-ther derivatized, purified, and characterized as previouslyreported (Swenberg et al 2000a). All other reagents andsolvents used were analytic-reagent or HPLC grade.
Calibration Standards and Curves
Calibration curves were constructed by adding the internalstandard, THB[13C5]Val-PFPTH, and analyte, THBVal-PFPTH,to 10 mg unexposed rat globin, performing the Edman deg-radation as described below and acetylating the THBValadducts as described below.
QC Standards
A calibration standard of known amounts of THBVal-PFPTH and THB[13C5]Val-PFPTH was made and injected
Hemoglobin Adducts
58
Biomarkers in Czech Workers Exposed to 1,3-Butadiene
as every tenth sample to ensure run-to-run reproducibility.Corrective action was taken if any significant changeoccurred in the relative response factor.
QC Procedures
The GC-ECNCI-HRMS instrument was calibrated withperfluorokerosene before the quantitative analysis of eachset of samples. A calibration standard was injected asevery tenth sample to check for run-to-run reproducibility.
THBVal Analysis
The methods used to measure THBVal adducts in codedsamples in this study have been reported in detail previ-ously (Swenberg et al 2000a). The study analyzed THBValin coded samples. Globin was isolated according to themethod of Mowrer and associates (1986). Briefly, washedred cells were lysed with an equal volume of distilleddeionized water and then 9 mL of 50 mM HCl in 2-pro-panol was added for each milliliter of red cells. This solu-tion was centrifuged at 1500g for 30 minutes at 4�C. Thepellet was discarded and to the supernatant was added4 mL ethyl acetate for each milliliter of red cells. This solu-tion was centrifuged at 1500g for 5 minutes at 4�C. Theglobin was washed four times with ethyl acetate. The pelletwas washed one more time with n-pentane, centrifuged asdescribed above, and the pellet was dried under nitrogen;it was further dried under vacuum and then frozen at�80�C until analyzed.
The N-alkyl Edman degradation procedure of Törnqvistand coworkers (1986) was used with further modificationsof Pérez and associates (1997) and Swenberg and col-leagues (2000a). Briefly, 50-mg to 250-mg samples weresubjected to Edman degradation in 3 mL formamide with20 �L PFPITC (Törnqvist et al 1986). The internal stan-dard, THB[13C5]Val-PFPTH, was added after Edman degra-dation, the mixture was heated to 45�C for 90 minutes, andthe samples were extracted three times with ether, driedunder nitrogen, and dissolved in 1 mL of 0.1 M sodiumcarbonate. The samples were then loaded onto preparedC18 columns (which had been prewashed with methanoland 50% aqueous formamide), washed with water, and theTHBVal was eluted with 3 mL acetonitrile. The acetonitrilewas dried; the residue was then resuspended in 188 �L ace-tonitrile and acetylated with 32.5 �L triethylamine and32.5 �L acetic anhydride for 30 minutes at room tempera-ture. The samples were dried under vacuum, resuspended in3 mL n-pentane, and washed with 40% aqueous methanol.The aqueous layer was removed and the solution was driedunder vacuum and reconstituted in 50 �L toluene.
Samples were analyzed by GC-ECNCI-HRMS (Rana-singhe et al 1998) with methane as the reagent gas (3 10�5
mbar), using a VG 70-250SEQ hybrid mass spectrometerwith a Hewlett-Packard 5890 gas chromatograph. The GCseparation was performed on an Alltech SE-54 column (30mm 0.32 mm; 1.0 �m film thickness; Alltech Associates,Deerfield IL) with helium at 10 psi head pressure and300�C injector temperature. Injections were made in thedirect mode starting at 100�C and increasing to 300�C atthe rate of 10�C/min. The instrument was operated at 70 eVand emission current at 500 �A. The source temperaturewas 250�C during THBVal analysis. Quantitative selectedion monitoring measurements using the ions [M—HF] atm/z 534.1084 and m/z 539.1254 were performed at aresolving power of 10,000.
STATISTICAL ANALYSES
A complete description of all statistical methods is pre-sented in the earlier section Study Design: Subject Selec-tion, Sample Acquisition and Handling, and StatisticalMethods / Data Processing and Statistical Analysis.
RESULTS
HBVal Adduct Concentrations
With the methods used, the LOD for HBVal in humanblood was approximately 0.1 pmol/g globin. This methodapplied [d6]HBVal as the internal standard, which was cal-ibrated against [14C]HBVal of known specific radioactivity(Richardson et al 1998c, 1999). Using [d6]HBVal as theinternal standard produced fivefold higher concentrations ofHBVal compared with the concentrations other researchersobtained when using [d4]-(2-hydroxyethyl)valine as theinternal standard (Osterman-Golkar and Bond 1996; Rich-ardson et al 1996).
Results of HBVal concentrations in blood by exposuregroup are given in Table 23. The mean adduct concentra-tion was 0.224 pmol/g globin for the control group, 0.466pmol/g globin for the monomer group, and 2.230 pmol/gglobin for the polymer group. The differences in mean con-centrations parallel the differences in BD exposure levels:polymerization workers � monomer production workers �administrative control subjects. Furthermore, each groupmean differed significantly from every other group’s mean(Kruskal-Wallis test; P � 0.001).
Genotypes did not significantly affect the mean HBValadduct concentrations, either overall or within any expo-sure group (data not shown). In the control group, adductlevels for smokers were significantly higher than for non-smokers (P � 0.027 by Mann-Whitney test). The 97.5thpercentile HBVal in the control group was 0.61 pmol/gglobin (data not shown). Therefore, monomer production

59
and polymerization workers who had HBVal concentra-tions that exceeded this value were most likely occupa-tionally exposed to BD.
HBVal concentrations were also significantly correlated(P � 0.001) with workers’ average BD concentrations overthe entire exposure assessment period, as well as with theaverage of only those exposure measurements obtainedduring the period 70 to 50 days before blood sampling.The Spearman correlation coefficients were 0.676 for theentire assessment period average BD exposure and 0.648for the 70–50-day assessment period average BD expo-sure. Figure 16 shows the relation between HBVal adductconcentrations and average BD exposure levels over theentire assessment period. The gap to the right of thelowest BD values is an artifact of the LOD of the personalmonitors. Six administrative control subjects with mea-sured exposures of zero were assigned values of 0.002 mg/m3, which is half the BD LOD of approximately 0.004 mg/m3. Because this value is below reported environmentallevels of BD, their actual values were probably higher.When these points were excluded, the Pearson correlationbetween ln(adduct concentration) and ln(average BDexposure) was 0.700 (R2 � 0.491). This relation is shownby the equation:
ln(HBVal in pmol/g globin) �
0.098 � 0.491 (ln[average BD exposure in mg/m3]),
which is equivalent to
HBVal in pmol/g globin �
1.101 (average BD exposure in mg/m3)0.491.
Table 23. Hemoglobin Adductsa by Exposure Group
Control(n = 25)
Monomer(n = 24)
Polymer(n = 34)
HBValMean � SD 0.224 � 0.205 0.466 � 0.452b 2.230 � 1.399b,c
Median 0.164 0.272 1.877
THBValMean � SD 94.77 � 38.71 178.73 � 101.31b 716.70 � 425.72b,c
Median 78.70 142.60 605.65
Ratio THBVal / HBValMean � SD 599.9 � 326.8 540.0 � 289.5 367.8 � 191.6b,c
Median 568.9 473.9 302.2
a Adducts were measured as pmol adduct/g globin.b Significantly different from control group at P � 0.05 by Kruskal-Wallis test.c Significantly different from monomer group at P � 0.05 by Kruskal-Wallis test.
Figure 16. HBVal or THBVal Hb adducts vs average BD exposure. � �administrative control subjects; � � monomer production workers; � �polymerization workers.
Hemoglobin Adducts

60
Biomarkers in Czech Workers Exposed to 1,3-Butadiene
HBVal Adducts and Genotypes
As noted, worker genotype did not influence groupmean HBVal adduct concentrations. However, regressionanalyses on BD exposure by genotype showed that workershomozygous for the Arg139 allele of the EH139 polymor-phism (Arg139/Arg139) had significantly lower HBValadduct concentrations relative to their BD exposure levelsthan did the workers who had His139/Arg139 or His139/His139 genotypes (Figure 17). The workers with theHis139/His139 genotype also had significantly loweradduct concentrations relative to the BD exposure levelsthan did the workers with the His139/Arg139 genotype.The Arg139 allele is reported to have 25% increased func-tion over the His139 allele (Hassett et al 1994).
THBVal Adduct Concentrations
With the methods used, the LOD for THBVal in globinwas approximately 1 pmol/g globin. Mean concentrations
of THBVal by exposure group are given in Table 23. Asshown, the mean was 94.77 pmol/g globin for the controlgroup, 178.73 pmol/g globin for the monomer group, and716.70 pmol/g globin for the polymer group. This rankorder again follows the same order as the mean BD exposurelevels for each group. The THBVal mean concentration foreach group differed significantly from each other group’smean (Kruskal-Wallis test; P � 0.001); and the THBValconcentrations are 321 to 423 times greater than the meanHBVal concentrations. The 97.5th percentile of the 95% CI forTHBVal in the control group was 192 pmol/g globin. There-fore, monomer production and polymerization workers withTHBVal concentrations that exceeded this value were mostlikely occupationally exposed to BD. As we found withHBVal, genotype produced no significant effect on meanadduct concentrations; smokers in the control group, how-ever, had higher concentrations of THBVal than non-smokers (P � 0.011 by Mann-Whitney test).
Again as we found with HBVal, the correlations betweenworkers’ THBVal concentrations and their average BD expo-sure levels were highly significant (P � 0.001) both over theentire exposure assessment period and during the periodfrom 70 to 50 days before blood sampling. The Spearmancorrelation coefficients were 0.737 for the entire assessmentperiod average exposure and 0.731 for the 70–50-day assess-ment period average exposure. The relation between THBValconcentration and average BD exposure is depicted in Figure16. Excluding workers with exposures below the LOD, thePearson correlation between ln(adduct concentration) andln(average BD exposure) was 0.718 (R2 � 0.515). Thisrelation is shown by the equation:
ln(THBVal in pmol/g globin) �
6.01 � 0.395 (ln[average BD exposure in mg/m3]),
which is equivalent to
THBVal in pmol/g globin �
409 (average BD exposure in mg/m3)0.395.
THBVal Adducts and Genotypes
As we found with the HBVal adducts, regression anal-ysis of THBVal adduct concentrations on BD exposurelevels by genotype showed that workers with the Arg139/Arg139 genotype of the EH139 polymorphism had signifi-cantly lower THBVal adduct concentrations relative totheir BD exposure levels than did workers who had theHis139/His139 or His139/Arg139 genotype (Figure 17).However, the workers with the His139/Arg139 genotypealso had significantly greater THBVal adduct concentra-tions relative to their BD exposure levels than did theworkers with the His139/His139 genotype.
Figure 17. HBVal or THBVal Hb adducts vs average BD exposure by workerswith the EH139 genotype. � and solid line indicate workers with Arg139/Arg139 genotype; � and short-dashes line indicate workers with Arg139/His139 genotype; � and long-dashes line indicate workers with His139/His139 genotype. Slope for Arg139/Arg139 (solid line) differs significantlyfrom slopes for Arg139/His139 (short-dashes line) (HBVal: P � 0.004; THBVal:P � 0.002) and His139/His139 (long-dashes line) (HBVal: P � 0.030; THBVal:P � 0.035). Slopes for Arg139/His139 and His139/His139 also differ signifi-cantly (HBVal: P � 0.041; THBVal: P = 0.008).

61
Correlation Between HBVal and THBVal
The concentrations of HBVal and THBVal in bloodwere highly and significantly (P � 0.001) correlated. TheSpearman correlation coefficient was 0.853. The Pearsoncorrelation was 0.879 (R2 � 0.773) when the natural loga-rithms of both adducts were used (Figure 18). This relationis shown by the equation:
ln(HBVal in pmol/g globin) �
�6.57 � 1.101 ln(THBVal in pmol/g globin),
which is equivalent to
HBVal in pmol/g globin �
0.00140 (THBVal in pmol/g globin)1.101.
Ratio of THBVal to HBVal
THBVal/HBVal ratios were computed for each workerand the mean ratios for the control, monomer, and polymergroups are given in Table 23. THBVal concentrations forthe polymerization workers were 368-fold higher thanHBVal concentrations; this ratio was significantly lowerthan the 540-fold ratio for the monomer productionworkers, and the 600-fold ratio for the administrative con-trol subjects (Kruskal-Wallis test; P � 0.003). We alsonoted an inverse relation between subjects’ THBVal/HBValratios and their average exposure concentrations (r � 243;P � 0.027). This was due to the endogenous background ofTHBVal, which contributes more to the lower exposures.
DISCUSSION
The procedure for measuring HBVal, the Hb adduct ofBDO, as a biomarker of BD exposure was developed in theearly nineties (Osterman-Golkar et al 1991) and valueshave been reported for rodents and humans (Osterman-Golkar et al 1993; van Sittert and Van Vliet 1994; Osterman-Golkar and Bond 1996). In the present study, the commonlyused internal standard, [d4]-(2-hydroxyethyl)valine, was
replaced by [d6]HBVal to improve the accuracy and the reli-ability of the method. Using [d6]HBVal as an internal stan-dard suggests that previously published values for HBValin Hb (which had been determined using [d4]-(2-hydroxy-ethyl)valine as the internal standard; Osterman-Golkar etal 1991, 1993; Osterman-Golkar and Bond 1996; Rich-ardson et al 1996) were most likely underestimated by afactor of 5. In the current study, the natural backgroundlevels of HBVal adducts were very low, ranging from belowthe LOD (0.1 pmol/g globin) to 1.0 pmol/g globin in admin-istrative control subjects who were not occupationally ex-posed. The measurement techniques for THBVal, the Hbadduct of BDO-diol, were developed more recently (Pérezet al 1997) and have been successfully applied in an epide-miologic study (Swenberg et al 2000a; Hayes et al 2000).
Both HBVal and THBVal were successful as biomarkersfor BD exposure because the average values for eachadduct in the three exposure groups ranked in the sameorder as the exposure levels for the same groups. In addi-tion, we found highly significant correlations between theindividual subjects’ exposure levels and both types of Hbadducts. Linear regression models of the relation betweenBD exposure (average 60 days) and HBVal or THBVal in Hbfitted best following logarithmic transformation of the vari-ables. This demonstrates that the proportion of inhaled BDthat binds with Hb to form HBVal or THBVal decreases atincreasing BD exposures. From the regression equations,HBVal and THBVal adduct levels in Hb can be calculatedfor specific BD airborne exposures. For instance, an 8-hourTWA exposure of 22 mg/m3 (10 ppm) corresponds to about5 pmol HBVal/g globin and to 1400 pmol THBVal/g globin.
The finding of relatively high natural background levelsof the M1 urinary metabolite of BD and of THBVal adductsin Hb from individuals with no known exposures to BD(the administrative control subjects in this study) demon-strates that THBVal is not only produced by exposure toBD but also by other sources. Results of an epidemiologicstudy (Hayes et al 2000), in which THBVal was determinedby the same method as in the current study, suggest thatthe naturally occurring background of THBVal is variable:The median background THBVal value for unexposedworkers in the Hayes study was 38 pmol/g globin, which ismuch lower than the median value determined in thepresent study (79 pmol/g globin). After BD exposure,THBVal adducts are formed by the reaction of BDO2 orBDO-diol (or both) with Hb. (BDO-diol can be formedeither by hydrolysis of BDO2 or by CYP-mediated oxida-tion of BD-diol [Csanády et al 1992; Kemper et al 1996].) Itis unlikely that background levels of THBVal originatesolely from BDO2 or BDO-diol arising primarily as metab-olites from environmental or exogenous BD exposure.
Hemoglobin Adducts
Figure 18. Relation between HBVal and THBVal Hb adducts. � � admin-istrative control subjects; � � monomer production workers; � � poly-merization workers.
62
Biomarkers in Czech Workers Exposed to 1,3-Butadiene
Endogenous THBVal may also originate from one or moreendogenous chemicals that are presently unknown. Thedata from both the current study and the study by Hayesand associates (2000) suggest that other factors such as dietor genetics affect the endogenous production of THBVal.The implications of these natural background levels forcancer risk of BD exposure are currently unknown. How-ever, THBVal may be less sensitive than HBVal for detectinglow levels of BD exposure due to the relatively high andvariable background levels.
Genotypes for CYP2E1, GST, EH, and ADH polymor-phisms were obtained for all workers involved in thisstudy. Although the CYP2E1, GST, and ADH polymor-phisms did not show associations with Hb adducts, one ofthe EH polymorphisms did. Workers with Arg139/Arg139in the EH gene (an allele with increased activity) had sig-nificantly lower HBVal and THBVal adduct concentrationsrelative to BD exposure levels than did workers with theother two genotypes of this polymorphism. In addition,the workers with the His139/Arg139 genotype actuallyhad greater concentrations of both adducts compared withworkers with the other two genotypes. The decreased con-centration of HBVal adducts derived from the BDO metab-olite of BD might be explained by an increase in hydrolysisof BDO in workers with the Arg139/Arg139 genotype. Thisdoes not explain, however, that HBVal adduct productionwas greater in workers with the His139/Arg139 genotypethan in workers with the His139/His139 genotype. Otherobservations are also not in accord with this rationale; forexample, the increased concentrations of the THBValadducts in workers with the His139/Arg139 genotype andin workers with the His139/His139 genotype require a dif-ferent explanation because THBVal adducts are thought toderive primarily from the BDO-diol metabolite of BD, pro-duction of which is dependent on the hydrolytic pathway(see Figures 1, 2, and 15). These data suggest that the EHgenotypes have differential kinetics for the three epoxidemetabolites of BD. The increased production of THBValadducts in workers with the His139/His139 genotype andwith the His139/Arg139 genotype might reflect the smallproportion of the THBVal adducts that are derived fromthe BDO2 metabolite of BD. This does not explain, though,that the THBVal adduct production in workers with theHis139/Arg139 genotype was significantly greater than inworkers with the His139/His139 genotype. However, thenumbers and distributions of the workers with differentEH139 genotypes in this study are far too small to permitdefinitive assessments of these possibilities (especiallybecause only four subjects had the Arg139/Arg139 geno-type). Nevertheless, the current study does provide geno-typic data that may be combined with findings from other
molecular epidemiologic studies to suggest further animalstudies in rodents genetically modified in these metabolicpathways.
The mean THBVal adduct levels in each exposure groupwere manyfold higher than the mean HBVal levels in thesame group: control group 600-fold higher, monomergroup 540-fold higher, and polymer group 368-fold higher.This suggests that THBVal is also being formed by anendogenous material other than BD and its metabolites.This endogenous THBVal is likely to be relatively constant,so the ratios change as BD-derived THBVal increases. It maybe more correct to subtract the control value for THBValfrom each of the exposed values and then use the ratio BD-THBVal:BD-HBVal. (The same effect has also been observedin mice but not in rats [Richardson et al 1997, 1998a].)
The current study has demonstrated that both of theseHb adducts can be used as biomarkers to monitor groups ofworkers for low levels of exposure to BD. The excellentcorrelation between exposure measurements and these Hbadducts also permits exposure ranking of individuals fornonspecific biomarkers of genetic effects such as somaticmutations and cytogenetic changes. This permits researchersto examine exposure-response relations within the exposedpopulation and to eliminate confounding by problems thatarise in control groups. Such exposure ranking was used inthe comparative studies of genetic effects in this investiga-tion (see the later sections Biomarkers of Effect: Assays ofHPRT Mutations in Human Lymphocytes; and Biomarkersof Effect: Cytogenetic Analysis). By combining exposureranking on the basis of biomarker assessments with therequirement that all assays had to be completed beforethe exposure coding of the individual samples wasrevealed, this study was conducted with a high degree ofscientific rigor.

63
BIOMARKERS OF EFFECT: ASSAYS OF HPRT MUTATIONS IN HUMAN LYMPHOCYTES
An obvious question is whether occupational exposureto BD could induce mutations in exposed workers.Because BD is mutagenic in animals and in cells in cul-ture, it seems logical that exposure at some level wouldcause mutations in humans. A useful biomarker of humanexposure to mutagens is the assay for mutations at theHPRT gene in T lymphocytes. An increased frequency ofmutant lymphocytes in members of a population exposedto a known mutagen would suggest a possibly hazardoussituation that warrants further investigation. This type ofbiomarker would constitute an early warning of a potentialhealth hazard, thus providing an opportunity to institutemeasures to reduce future exposures and possibly preventexposure-related illness.
The frequency of mutations at the HPRT gene can bemeasured in two ways: the cloning assay and the auto-radiographic assay (Albertini 1985; O’Neill et al 1987;Ammenheuser et al 1988). In both methods, mutant cellsare selected by growing T lymphocytes in the presence of apurine analogue, 6-thioguanine (TG). The cloning assay forHPRT mutations involves growing clones of TG-resistantlymphocytes cultured in microwell plates over a period of10 to 14 days. This permits the mutant frequency (MF; thefrequency of mutant lymphocytes) in the peripheral bloodto be determined and provides a source of viable mutantcells from which DNA and RNA can be obtained for molec-ular analysis to ascertain the nature of the HPRT muta-tions. In the autoradiographic version of the assay, TG-resistant cells are selected on the basis of their ability toincorporate tritiated thymidine ([3H]TdR) during a 42-hourculture period in the presence of TG. Radiolabeled mutantcells are then identified on microscope slides by autora-diography. This method does not provide viable cells forfurther analysis, so mutant cells are referred to as variants.The assay is very suitable, however, for analyzing rela-tively large numbers of samples. In addition, the assay hasproven to be a sensitive biomarker for mutagen exposure.For example, the baseline variant frequency (VF) in non-smokers who have no other known mutagen exposure hasbeen consistently measured in the range of 1 to 4 variantsper million viable cells (Ammenheuser et al 1997b, 1998).
Somatic cell mutation has several unique strengths as abiomarker of the effects of human exposure to genotoxicagents. First, mutation is the end product of the mutagen-esis process. The induction of mutations by a chemicalexposure integrates the effects of biotransformation, DNAdamage, DNA repair, and cytotoxicity. Second, becausemutations are heritable, they represent a type of toxic
effect that, if it occurs in specific genes, can lead to dis-eases such as cancer. In contrast, unstable chromosomalaberrations represent a form of DNA damage that may beeliminated by cell death. Third, somatic mutation assays,such as the HPRT assay in lymphocytes, respond well tomutagens that generate base substitution, frameshift, ordeletion mutations. In many cases the HPRT assay is com-plementary to assays that detect large-scale chromosomalaberrations (Ammenheuser et al 1991; Tates et al 1996).The HPRT cloning assay provides an opportunity to fur-ther examine the mechanisms of mutation associated withan exposure by evaluating the spectrum of the types ofmutations that have been induced (Nicklas et al 1990;Hüttner and Holzapfel 1996; Ma et al 2000).
Because mutations are the end product of the mutagenesisprocess, they are nonspecific to the causes. For example,many exposures encountered in the course of daily living,such as certain medications, tobacco smoke, or the use ofdrugs such as cocaine or marijuana may influence the fre-quency of mutations (Ammenheuser et al 1988, 1997a,b,1998); even age gradually increases mutation frequency(Tates et al 1991b, Robinson et al 1994). Factors that influ-ence the in vivo proliferation of lymphocytes may alsoincrease mutation frequency. For example, cycling lym-phocytes are more susceptible to mutation, so autoimmunediseases or other processes that stimulate lymphocyte pro-liferation could increase the observed MF (Cannons et al1998). In addition, proliferation of a mutant lymphocytewill produce a clone of identical mutants, which can alsoincrease the MF (Nicklas et al 1989). It is therefore impor-tant in studies of mutagen exposures to obtain accuratemeasurements of exposure and to control as much as pos-sible for other factors that may influence the MF.
Workers exposed to BD have been investigated for the fre-quency of HPRT mutants in several studies with conflictingresults. In an early study (Ward et al 1994), a small cohort ofnonsmoking workers in a BD monomer production plant inPort Neches, Texas, was evaluated. Using the autoradio-graphic assay, workers in high-exposure production unitshad a significant threefold elevation (P � 0.01) in HPRT VFrelative to workers in low-exposure areas and unexposedcontrol subjects. No concurrent measurements of BD expo-sure were made in this study, but the average BD levels wereestimated to be 2 to 7 mg/m3 (1–3 ppm) based on an exposurestudy conducted by the company about 3 to 9 months prior tosample collection (Ward et al 1994). Furthermore, the con-centration of the BD-related metabolite urinary M1 was deter-mined and levels of this BD metabolite correlated well withthe HPRT VF (r � 0.85). This study generated a great deal ofinterest in the question of the potential mutagenic effects ofoccupational exposure to BD (OSHA 1996).
Assays of HPRT Mutations
64
Biomarkers in Czech Workers Exposed to 1,3-Butadiene
A follow-up study was conducted in the same facilityabout eight months after the first study (Ward et al 1996b).During this interval, a modernization project had beencompleted that included several measures intended toreduce workers’ exposures to BD. Concurrent BD measure-ments were made and the HPRT VF and urinary M1 levelswere again determined in a somewhat larger group ofworkers. In this second study, workers were divided intothree exposure categories and exposures were lower than inthe earlier survey: high (0.66 mg/m3 [0.30 ppm]), interme-diate (0.46 mg/m3 [0.21 ppm]), and low (0.27 mg/m3
[0.12 ppm]). The urinary M1 concentrations for high-exposure subjects were reduced to levels slightly higherthan the concentrations for subjects with low BD exposures.The HPRT VF was still significantly elevated (P � 0.01), butthe increase in the high-exposure group was now only about2.5-fold over the low-exposure group (Ward et al 1996b).
Two larger biomarker studies were conducted, aboutthree years apart, in a BD-styrene polymer productionplant, also in Port Neches, Texas. In both studies (Ammen-heuser et al 2001; Ward et al 2001), workers in areas of theplant with higher and lower exposures to BD were com-pared. In the first study, concurrent exposures were mea-sured with the workers wearing passive badge dosime-ters that provided a minimum LOD of about 0.55 mg/m3
(0.25 ppm) for an 8-hour workshift. The HPRT VF wasmeasured by autoradiography and levels of urinary M1were determined. The average exposure for 22 of the24 workers in the high-exposure areas (two high valuesexcluded) was 3.26 mg/m3 (1.48 ppm), whereas all but twoexposures in the low-exposure areas were below the LODfor the assay (0.55 mg/m3). For workers from the high-exposure areas, the average urinary M1 concentration wasmore than three times greater and the average HPRT VFwas almost three times greater than the same values forworkers from the low-exposure areas (P � 0.0002). Expo-sure, M1, and HPRT VF were all correlated, with coeffi-cients between 0.4 and 0.6 (Ammenheuser et al 2001).
A subset of samples from nonsmoking high-exposure-area workers was also assayed by the HPRT cloningmethod, and isolates were analyzed to determine the typesof mutations found (Ma et al 2000). Although the numberof workers evaluated in this subset was not stated, 12 hadexposures above the LOD with a range of 0.55–45.97 mg/m3
(0.25–20.80 ppm). The HPRT MF was about twofoldgreater (P � 0.05) in this exposed subset (MF � SD � 17.63 10�6 � 5.05 10�6) than in an unexposed control group(8.47 10�6 � 2.88 10�6). The proportion of single-exonand multiple-exon deletions and frameshift mutations wassignificantly greater in the exposed group (P � 0.05) thanin the control group. This is of interest because cell culture
and animal studies have shown that the BDO2 metabolite ofBD induces a high proportion of deletion mutations in theHPRT gene (Cochrane and Skopek 1994b; Meng et al 2000).
In the second study, a follow-up of 37 workers con-ducted three years later in the same facility, the sameresearchers again tested lymphocytes for HPRT VF, and moredetailed measures of exposure and M1 were taken (Ward et al2001). The average exposure for the high-exposure group inthis study was 3.63 mg/m3 (1.65 ppm) compared with theaverage exposure of 0.15 mg/m3 (0.07 ppm) for the low-exposure group. The average HPRT VF was again aboutthreefold greater in the high-exposure group comparedwith the low-exposure group (P � 0.001). In this secondstudy, the subset of high-exposure workers who weretobacco smokers had a mean VF that was more than1.5-fold greater than the high-exposure nonsmokers. Theurinary M1 levels were higher in the high-exposure groupthan in the low-exposure group (Ward et al 2001), but themagnitude was not as great as in the earlier study (Ward etal 1994; Ammenheuser et al 2001).
Other studies of occupational exposure to BD have beenconducted in China and in the Czech Republic. Two ofthese studies used the HPRT cloning assay to assess themutagenic effects of BD exposure. The study conducted inChina evaluated the exposure of workers in a polybuta-diene rubber production facility, which included bothmonomer production and polymerization units. Workers(41) in three exposure areas were compared with unexposedsubjects (38). Median air exposure to BD was 4.42 mg/m3
(1.97 ppm), but this relatively high value was reported tobe due largely to intermittent high exposures that wereassociated with activities such as pump repair. The HPRTMF was similar in the exposed and control groups and wasnot affected by cigarette smoking (Hayes et al 2000).
The study conducted in the Czech Republic (Tates et al1996; rám et al 1998) evaluated workers from the sameBD production facility near Prague that we studied in thecurrent project. In 1993 and 1994, 19 BD-exposed workersin the monomer production unit were compared with 19unexposed workers from a heat production unit. Expo-sures were measured using passive badge dosimeters andranged between 0.03 and 43.69 mg/m3 ([0.01–19.78 ppm]with a mean of 3.89 mg/m3 [1.76 ppm]) for the exposedworkers. Average BD exposure for the unexposed workerswas 0.09 mg/m3 (0.04 ppm). No significant difference wasnoted between exposed and control subjects in the geo-metric mean HPRT MF, adjusted for cloning efficiency(CE), smoking, and age; and no effect of smoking on MFwas noted (Tates et al 1996). In the 1994 portion of thatstudy, however, the analysis of cells for chromosomalaberrations showed a small but significant increase in the
S

65
percentage of aberrant lymphocytes in BD-exposedworkers (P � 0.01; rám et al 1998). No such increases hadbeen found in the earlier samples from these workers(Sorsa et al 1994).
Overall, studies of the mutagenic effects of occupa-tional exposure to BD are conflicting. In the Texas studiesusing the autoradiographic assay, an increase in VF ofaround threefold was noted in workers with mean BDexposures of about 3.32 to 6.63 mg/m3 (1.50–3 ppm).Studies in China evaluating workers with similar or some-what higher exposures, and in the Czech Republic evalu-ating workers with somewhat lower exposures, found noeffect of BD exposure using the HPRT cloning assay. Theonly direct comparison of the two types of HPRT assayswas with a selected subset of workers in the first TexasSBR study (Ma et al 2000) in which workers were exposedto a median BD level of 1.90 mg/m3 (0.86 ppm). A twofoldincrease in HPRT MF in exposed workers was foundwhen compared with outside control subjects (P � 0.05);and in parallel assays, a threefold increase in VF wasnoted. One goal of the current study was to attempt toresolve the conflict in the results of BD exposure studiesby using both types of HPRT assays to evaluate a signifi-cant population of workers after careful assessment oftheir exposure to BD.
MATERIALS AND METHODS
Cloning Assay
Receipt and Handling of Samples On 2 June 1998 at2 PM, samples of isolated peripheral blood lymphocytes(PBLs) were sent in a dry shipper with liquid nitrogenfrom Prague to Leiden. The dry shipper arrived in Leidenon 5 June at 2 PM containing blood samples from 82subjects: 25 administrative control subjects, 23 (not 24)monomer production workers, and 34 polymerizationworkers. (The volume of blood collected from two exposedsubjects was insufficient to divide among all the laborato-ries performing assays; therefore, the blood from onemonomer production worker was not sent to Leiden for thecloning assay and the blood from one polymerizationworker was not sent to Galveston for the autoradiographicassay. Thus, in the Leiden cloning assays, the monomergroup n � 23 rather than 24.) Each sample consisted of twoampules, except those from subjects 133 and 135 for whomjust one ampule was received. The numbering of the sam-ples in the dry shipper from Prague was in conformity withthe list of samples received by mail from Prague. Uponarrival, the ampules looked normal and were transferred toa container with liquid nitrogen where they remained
Suntil they were used to screen for HPRT mutants with thecloning assay.
Quality Control Procedures Usually, six randomly pickedPrague samples (a total of twelve ampules) were processedsimultaneously in one set during a particular workingweek. During later statistical treatment of the results, suchsets could be identified by a special code so that eventualmishaps or irregularities during the performance of thecloning assay could be easily found.
Apart from the 82 subject samples from Prague, frozenPBLs from one healthy Leiden subject were processed con-currently with each set of six Prague samples (starting withthe fourth of 13 sets) and used as internal QC standards.For the QC standard PBLs, we measured nonselection CEsto monitor the capacity of T lymphocytes to grow in vitroin medium without the selection agent TG (�TG). CEs forthe internal QC standards were not included in the tables;the mean � SD CE for the QC standards was 24.08% �
2.73% (range: 19.70–28.01%; n � 10 [one internal QCstandard analyzed with 10 of 13 sets of Prague samples]).
Thawing Frozen Samples Ampules were thawed bygently agitating them in a water bath at 37�C. When thawingwas complete, ampules were placed on crushed ice. Thecontents of each ampule were transferred into a prechilledcentrifuge tube. Prechilled thawing medium (RPMI 1640culture medium supplemented with 40% BCS) was addeddrop-wise to the cell suspension (meaning: add one drop,gently agitate, repeat a few times, then add two drops,repeat, etc). About 8 mL thawing medium was added in atime span of 20 to 30 minutes.
After centrifugation (260g) for 10 minutes at room tem-perature, the cell pellet was suspended in culture medium(see below) and the cell density counted with a Fuchs-Rosenthal hemocytometer. For the first 24 subjects (4 sets),only the number of living cells per subject was counted;later, numbers of dead and living cells were recorded.Cells were counted using phase-contrast microscopy. Darkgray cells were interpreted as being dead whereas lightgray transparent cells were classified as living (Table 24).
Preincubation PBLs were preincubated for 24 hours at1 106 living PBLs/mL culture medium (see below) inhorizontal 50-mL or 250-mL tissue culture flasks in ahumidified incubator at 37�C in an atmosphere of 5% to6% CO2 in air. This was done to remove monocytes, whichremained attached to the flask surface.
For all subjects, the number of live cells was counted atthe end of preincubation (as well as after thawing). The num-bers of cells alive after thawing and alive after preincubation
Assays of HPRT Mutations
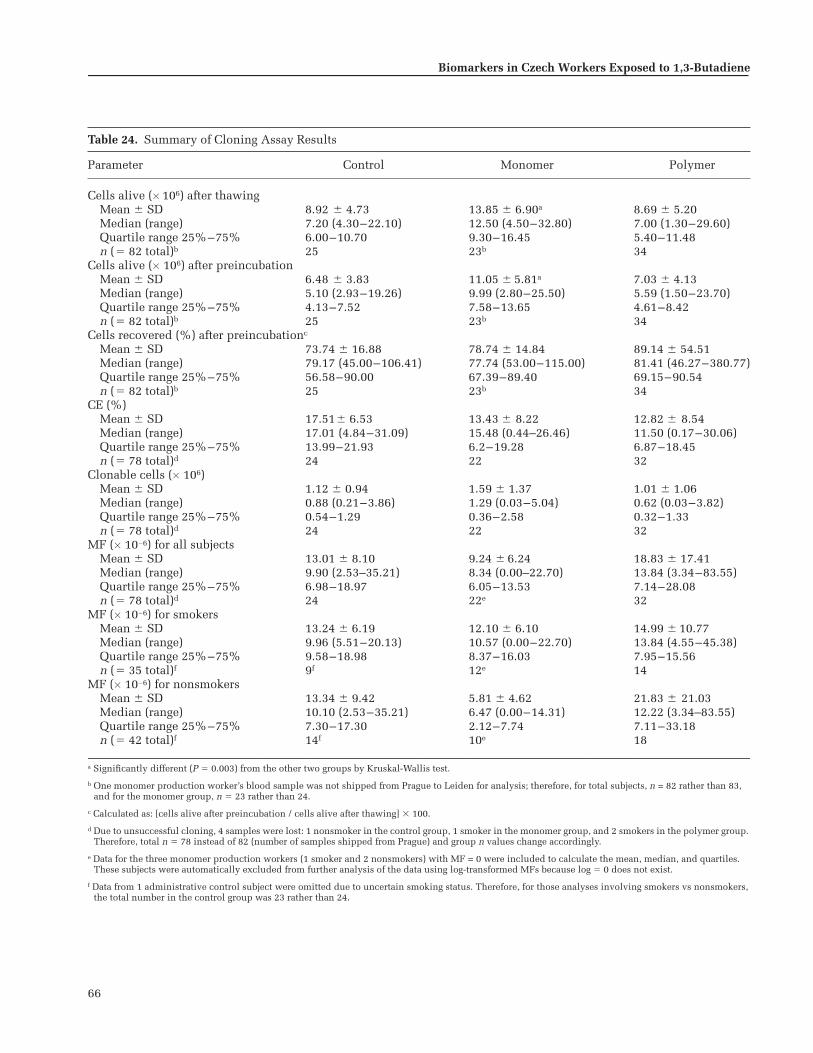
66
Biomarkers in Czech Workers Exposed to 1,3-Butadiene
Table 24. Summary of Cloning Assay Results
Parameter Control Monomer Polymer
Cells alive ( 106) after thawingMean � SD 8.92 � 4.73 13.85 � 6.90a 8.69 � 5.20Median (range) 7.20 (4.30–22.10) 12.50 (4.50–32.80) 7.00 (1.30–29.60)Quartile range 25%–75% 6.00–10.70 9.30–16.45 5.40–11.48n (� 82 total)b 25 23b 34
Cells alive ( 106) after preincubationMean � SD 6.48 � 3.83 11.05 � 5.81a 7.03 � 4.13Median (range) 5.10 (2.93–19.26) 9.99 (2.80–25.50) 5.59 (1.50–23.70)Quartile range 25%–75% 4.13–7.52 7.58–13.65 4.61–8.42n (� 82 total)b 25 23b 34
Cells recovered (%) after preincubationc
Mean � SD 73.74 � 16.88 78.74 � 14.84 89.14 � 54.51Median (range) 79.17 (45.00–106.41) 77.74 (53.00–115.00) 81.41 (46.27–380.77)Quartile range 25%–75% 56.58–90.00 67.39–89.40 69.15–90.54n (� 82 total)b 25 23b 34
CE (%) Mean � SD 17.51� 6.53 13.43 � 8.22 12.82 � 8.54Median (range) 17.01 (4.84–31.09) 15.48 (0.44–26.46) 11.50 (0.17–30.06)Quartile range 25%–75% 13.99–21.93 6.2–19.28 6.87–18.45n (� 78 total)d 24 22 32
Clonable cells ( 106) Mean � SD 1.12 � 0.94 1.59 � 1.37 1.01 � 1.06Median (range) 0.88 (0.21–3.86) 1.29 (0.03–5.04) 0.62 (0.03–3.82)Quartile range 25%–75% 0.54–1.29 0.36–2.58 0.32–1.33n (� 78 total)d 24 22 32
MF ( 10�6) for all subjectsMean � SD 13.01 � 8.10 9.24 � 6.24 18.83 � 17.41Median (range) 9.90 (2.53–35.21) 8.34 (0.00–22.70) 13.84 (3.34–83.55)Quartile range 25%–75% 6.98–18.97 6.05–13.53 7.14–28.08n (� 78 total)d 24 22e 32
MF ( 10�6) for smokersMean � SD 13.24 � 6.19 12.10 � 6.10 14.99 � 10.77Median (range) 9.96 (5.51–20.13) 10.57 (0.00–22.70) 13.84 (4.55–45.38)Quartile range 25%–75% 9.58–18.98 8.37–16.03 7.95–15.56n (� 35 total)f 9f 12e 14
MF ( 10�6) for nonsmokersMean � SD 13.34 � 9.42 5.81 � 4.62 21.83 � 21.03Median (range) 10.10 (2.53–35.21) 6.47 (0.00–14.31) 12.22 (3.34–83.55)Quartile range 25%–75% 7.30–17.30 2.12–7.74 7.11–33.18n (� 42 total)f 14f 10e 18
a Significantly different (P � 0.003) from the other two groups by Kruskal-Wallis test.
b One monomer production worker’s blood sample was not shipped from Prague to Leiden for analysis; therefore, for total subjects, n = 82 rather than 83, and for the monomer group, n � 23 rather than 24.
c Calculated as: [cells alive after preincubation / cells alive after thawing] 100.
d Due to unsuccessful cloning, 4 samples were lost: 1 nonsmoker in the control group, 1 smoker in the monomer group, and 2 smokers in the polymer group. Therefore, total n � 78 instead of 82 (number of samples shipped from Prague) and group n values change accordingly.
e Data for the three monomer production workers (1 smoker and 2 nonsmokers) with MF = 0 were included to calculate the mean, median, and quartiles. These subjects were automatically excluded from further analysis of the data using log-transformed MFs because log � 0 does not exist.
f Data from 1 administrative control subject were omitted due to uncertain smoking status. Therefore, for those analyses involving smokers vs nonsmokers, the total number in the control group was 23 rather than 24.

67
were used to calculate the percentage of cells recovered afterpreincubation [(cells alive after preincubation / cells aliveafter thawing) 100] (Table 24).
Culture Medium Culture medium consisted of RPMI1640 (Dutch modification, Gibco) with 25 mM HEPES, 2 g/Lsodium bicarbonate (NaHCO3), and 2 mM L-glutamine(Gibco); supplemented with 20% AIM-V serum-free me-dium (Gibco), 15% heat-inactivated DBS (iron-supplementeddefined BCS; Hyclone, Logan UT), 1% �-mercaptoethanol(final concentration 50 �M), 1% L-glutamax (Gibco; finalconcentration 2 mM), 1% sodium pyruvate (Gibco; finalconcentration 1 mM), and antibiotics 1% (final concentra-tion 100 units/mL penicillin and 100 �g/mL streptomycinsulfate).
The culture medium was freshly prepared in bulk foreach set of six randomly selected Prague samples. By fol-lowing this procedure we excluded the possibility that amistake in preparing the culture medium would result inan accidental failure to measure values for CE or MF orboth for a particular subject.
Cloning Lymphocytes We cloned PBLs in 96-well round-bottom microtiter plates (Nunc-Roskilde, Denmark). Foreach subject, two plates without TG with 3 preincubatedPBLs/well, plus two plates with 6 cells/well were used tomeasure the mean CE (%) in nonselection medium. Thenumber of PBLs per well pertains to the number of livingcells per well regardless of whether they were stimulated[or activated (lymphoblastoid)].
In addition, each well contained 1 104 irradiated TK6feeder cells. Feeder cells were HPRT � TK6 36X4 lympho-blastoid cells (gift from RJ Albertini). The growth of TK6cells was arrested by irradiation with 40-Gy 200-kV 4-mAx-rays (filtering 1 mm Al) at a dose rate of 15 Gy/min(Andrex 225, Andrex Radiation Products, Copenhagen,Denmark). For selecting mutant cells, 1 to 10 �TG-selection plates (depending on the number of PBLs avail-able for a particular subject) with 2 104 preincubatedPBLs per well and 1 104 irradiated TK6 feeder cells perwell were used. Each well, for both CE and selectionplates, contained 200 �L culture medium supplementedwith phytohemagglutinin (PHA) (PHA HA16; WellcomeDiagnostics, Murex, Dublin, Ireland) at a final concentra-tion of 0.25 �g/mL and recombinant interleukin-2 (IL-2;EuroCetus, CHIRON, Emeryville CA) at a final concentra-tion of 100 U/mL. The selection plates also contained TG(Sigma) at a final concentration of 2.5 �g/mL (1.5 10�5 M).After incubation in a humidified incubator at 37�C in anatmosphere of 5% to 6% CO2 in air for 10 to 14 days, plateswere scored for colony growth using an inverted microscope.
As described above, TK6 cells were added to the PBLs in�TG and �TG plates, but they were also seeded in a platewithout PBLs. This was done to verify that irradiated TK6cells could not form clones. TK6 cells were maintained inRPMI 1640 medium supplemented with 10% DBS, 1%�-mercaptoethanol (50 �M) and antibiotics at final concen-trations of 100 units/mL penicillin and 100 �g/mL strepto-mycin sulfate. Cell densities ranged from 1 105 to 1 106
cells/mL and subculturing occurred thrice weekly. Thecells were diluted to 0.5 106 cells/mL 24 hours prior touse in the cloning assay.
Scoring Clones and Calculating CEs and MFs Wells carry-ing clones consisting of at least 50 healthy-looking cellswere recorded as positive wells. For each subject, wecounted (1) the number of positive and negative wells in�TG plates and (2) the number of positive wells (equal tothe number of mutants) among the total number of wells in�TG plates. This information was used to calculate foreach subject: (1) CE (%) for 3 and 6 cells per well, (2) meanCE (%), and (3) MF ( 10�6) plus 95% CI. CEs were calcu-lated on the basis of a Poisson distribution using the for-mula (O’Neill et al 1987)
CE � (�ln P0)/N,
where P0 is the fraction of negative wells and N is theaverage number of cells plated per well. Thus:
CE � �ln(Neg/Tot)/N
where Neg and Tot represent the numbers of negativewells or total wells, respectively. MF is the ratio of the CEin the presence and absence of TG, or CE �TG/CE �TG. Thevariance, Vi, was calculated with the formula
(1 � Neg/Tot)/{Neg [ln(Neg/Tot)]2}.
The 95% CI for MF was determined with the equation
CI � MF
All calculations were performed using Excel spreadsheets.
Autoradiographic Assay
Receipt and Handling of Samples Cryopreserved lympho-cyte samples and plasma samples in separate shipping con-tainers with liquid nitrogen were sent from Prague, CzechRepublic on 2 June 1998 to Galveston, Texas, USA. UnitedStates Customs detained the shipment for several days until
exp 1.96� Vi TG�( ) Vi �TG( ) 4��[ ]{ } .
Assays of HPRT Mutations

68
Biomarkers in Czech Workers Exposed to 1,3-Butadiene
additional information about the contents was received fromPrague. We received the two nitrogen shippers at the labora-tory on 10 June 1998; they contained 82 samples, each ofwhich consisted of three cryotubes per subject. (The volumeof blood collected from two exposed subjects was insuffi-cient to divide among all the laboratories performing assays;therefore, the blood from one monomer production workerwas not sent to Leiden for the cloning assay and the bloodfrom one polymerization worker was not sent to Galvestonfor the autoradiographic assay. Thus, in the Galveston auto-radiographic assays, the polymer group n � 33 rather than34.) The cryotubes containing lymphocytes appeared to beadequately frozen; but some of the plasma, in 15-mL tubes,had begun to thaw in the second shipper. The lymphocytesamples were quickly sorted, placed on canes, and stored ina Dewar flask with liquid-nitrogen. The plasma was refrozenand stored in a freezer at �20�C.
Quality Control Procedures During the same period whenwe cultured and analyzed the samples from subjects inPrague, we also thawed and assayed frozen lymphocyte sam-ples (two to four per batch of Prague samples) to serve asinternal QC standards. Those cells (27 additional samples)were from BD-exposed subjects in a study being conducted ata Texas SBR plant or from nonexposed Texas subjects whohad volunteered for other studies conducted in our laboratory.
Thawing Frozen Samples Each sample of three cryo-tubes was thawed quickly in a 37�C water bath by shakingthe tubes as the lymphocyte suspension thawed. The cellswere diluted in 30 mL of RPMI 1640 medium (Gibco) in a50-mL centrifuge tube by adding the suspension drop-wiseusing a 1-mL pipette. The diluted cells were centrifuged at250g for 10 minutes, and the pellet from each sample wasresuspended in 25 mL of medium. The lymphocytes werecounted in a hemacytometer and viability was determinedwith trypan blue stain.
Culture Medium The complete medium for the autora-diographic HPRT assay was prepared with RPMI 1640 con-taining 100 units/mL penicillin, 100 �g/mL streptomycin,and 2 mM L-glutamine (all from Gibco, Gaithersburg MD),together with a final concentration of additives consistingof 20% HL-1 medium supplement (Bio-Whittaker, Walkers-ville MD), 2% PHA (reagent grade; Murex, Dartford,England), and 25% autologous plasma.
Incubating Samples for HPRT Variant Selection Methodsfor culturing lymphocytes to determine HPRT VFs wereessentially the same as previously described (Ammenheuseret al 1991, 1997b). After viable cells were counted, the cellsuspension was centrifuged at 250g for 10 minutes and the
cell pellet was resuspended in culture medium. Lympho-cytes (5–6 106) were added to each vented flask (Falcon3108, Lincoln Park NJ) and TG (Sigma, St Louis MO) wasadded to a final concentration of 33.4 �g/mL (2 10�4 M).The final cell density was 1 106 per mL. One labelingindex (LI) flask was prepared without TG but with mediumadjusted to the same pH as the �TG medium. After incu-bation in a humidified 5% CO2 atmosphere for 24 hours at37�C, all cultures were labeled with 25 �Ci of [3H]TdR(ICN, Costa Mesa CA) and incubated for an additional 18hours. Then the cells were harvested and free nuclei werereleased by the addition of 9 mL of chilled 0.1 M citric acidto each flask. Usually, eight to twelve samples were cul-tured at 3-week to 4-week intervals.
Fixing Cells and Preparing Slides The free nuclei fromthe �TG flasks were washed with fixative (methanol:aceticacid, 7:1.5) and resuspended in 1 or 2 tubes in 0.25 mL offixative. The nuclei from the LI flask were harvested sepa-rately using the same procedure. A 20-�L aliquot fromeach tube from the �TG cultures was counted with a par-ticle counter (Coulter, Hialeah FL) and all of the nucleiremaining in the tube were placed on an 18-mm 18-mmcoverslip previously affixed to the end of a microscopeslide. For the nuclei from the LI flask, an aliquot of about0.15 106 cells per slide was spread evenly onto two sep-arate 18-mm 18-mm coverslips affixed to slides. Theslides were stained with aceto-orcein (Gurr BDH, Poole,England), dipped in NTB-2 emulsion (Kodak, RochesterNY), stored for 2 to 3 days in light-tight boxes at 4�C, anddeveloped with D-19 (Kodak).
Scoring Slides and Calculating VFs Coded slides wereread with a Nikon Labophot microscope, and all labeled(variant) cells from the �TG cultures were counted. Forthe LI slide, a random differential count was made of 3000labeled and unlabeled cells to provide an estimate of theproportion of lymphocytes that were able to grow in cul-ture; this proportion of labeled-to-unlabeled cells is referredto as the LI. The VF was calculated by totaling the labeled(variant) cells identified on the slides prepared from the�TG cultures and dividing this total by the LI multipliedby the number of nuclei initially added to the TG slides.The denominator for this calculation is referred to as thenumber of evaluatable cells (ECs).
Duplicate Scoring After the slides prepared from the�TG-selection cultures were scored in Galveston, theywere packed in slide boxes and shipped to Burlington. Theslides were scored again by a slide reader who wasunaware of the results of the scoring in Galveston.

69
Statistical Analysis of Cloning andAutoradiographic Assay Data
For reasons outlined in the earlier section Study Design:Subject Selection, Sample Acquisition and Handling, andStatistical Methods / Data Processing and Statistical Anal-ysis, the data on MFs, VFs, and other relevant parametersfor the cloning and autoradiographic assays were predom-inantly analyzed with nonparametric tests. The Kruskal-Wallis test was used to test for differences among the threeexposure groups. The Bonferroni-adjusted Mann-Whitneytest was applied to make pair-wise comparisons betweenexposure groups (control vs monomer, control vs polymer,and monomer vs polymer). Bivariate relations between dif-ferent biomarkers and between biomarkers and exposurevariables were assessed by computing Spearman correla-tion coefficients to test whether larger values of one vari-able tended to be paired with larger values of the othervariable, regardless of the functional form of the relation.Unless otherwise noted, correlation results are presentedas Spearman correlation coefficients (r) with P values.Finally, multiple regression was used to examine theeffects of exposure, as quantified by average BD exposure(or average BD exposure 70–50 days before blood sam-pling), on various parameters relevant for the HPRTassays, such as MF or VF, after adjusting for age, smokingstatus, CE, LI, or any of several cell viability characteristicsand numbers of clonable or evaluatable cells available forthe HPRT assays. For these parametric analyses, the nat-ural logarithms for BD exposure and MF or VF were used.
MFs and CEs were also analyzed with statistical proce-dures described by Thomas and associates (1999). A novelaspect of these procedures was that the authors took intoconsideration the fact that the number of clonable cells persubject often fluctuates considerably. This can result inmarked intersubject differences in the accuracy of MFs.The methods described account for such differences byapplying weighted linear regression so that one can down-weight observations when the calculated outcome isknown less precisely. Results obtained with the proce-dures of Thomas and associates were in complete agree-ment with those of our conventional statistical analysesand are therefore not reported separately.
Considerable intersubject differences in numbers ofclonable or evaluatable cells were noted not only byThomas and associates (1999) and in our cloning assay butalso in the autoradiographic assay (see the later sectionBiomarkers of Effect: Assays of HPRT Mutations in HumanLymphocytes / Results of the Autoradiographic Assay /Quality of the Lymphocyte Samples). For the autoradio-graphic assays, any assay that had less than 400,000 ECs(the equivalent of clonable cells in the cloning assay) were
excluded from the statistical analysis. For comparativepurposes, some of the statistical procedures describedabove were also applied to a database from which all sam-ples with less than 400,000 clonable cells were excluded.
RESULTS OF THE CLONING ASSAY
MFs
MF information was obtained for 78 (95%) of the 82subjects analyzed. The assay was unsuccessful for foursubjects: one control subject (4%), one monomer produc-tion worker (4.3%), and two polymerization workers(5.8%). Of the 78 subjects analyzed, three in the monomergroup yielded an MF of 0. For each exposure group, Table24 contains information on MF: mean � SD, median withrange, and lower and upper (25% and 75%) quartiles. Thegroup mean MFs for the control, monomer, and polymergroups were 13.01 10�6, 9.24 10�6, and 18.83 10�6,respectively. The same information is presented as a boxplot in Figure 19 and as a scatter plot for each subject inFigure 20.
In Figure 19, note that the polymer group had one sub-ject (number 137) with a relatively high MF value of 83.55 10�6. Five of this subject’s mutant lymphocytes could beanalyzed at the molecular level by means of reverse tran-scriptase–PCR (RT-PCR), or multiplex-PCR, or both. In twomutants, the mutations were identical and involved a dele-tion of bases 51–76 in exon 2. The other three mutationswere: (1) 409 A→G in exon 6, (2) deletion 439–479 plus abase change A→C at 431, and (3) IVS8–3T→G in exon 9(“IVS” is intervening sequence, or “intron”). Thus, itseemed that the high MF in subject 137 was not due to asingle mutational event with subsequent clonal expansionof the mutated cell. For the statistical analysis of MF data,therefore, the outlier data were not corrected for clonality.Excluding the outlier data would have resulted in low-ering the MF mean (� SD) for the polymer group from18.83 (� 17.4) 10�6 to 16.75 (� 13.0) 10�6. In Figure19, however, the outlier value is presented as a separatedot.
Three monomer production workers in the database hadMF values equal to zero (subjects 104, 140, and 178).Because the statistical analysis of MF data was predomi-nantly performed on log-transformed MFs, these subjectswere automatically excluded from the database becausethe log of zero does not exist. In Table 24, however, thethree subjects with MF � 0 were included for calculatingthe mean � SD, median (and range), and quartiles of MFs.After excluding the three subjects with MF � 0, the mean(� SD) MF for the monomer group increased from 9.24(� 6.24) 10�6 to 10.70 (� 5.38) 10�6.
Assays of HPRT Mutations

70
Biomarkers in Czech Workers Exposed to 1,3-Butadiene
Differences in MFs Among the Exposure Groups
Because the distribution of MFs was skewed, the non-parametric Kruskal-Wallis test was used to test for differ-ences among the three exposure groups. The analysis didnot show statistically significant differences (P � 0.13).
So that analyses of MF data from the cloning assay couldbe compared with analyses of VF data collected with theHPRT autoradiographic assay, the above analyses wererepeated excluding 20 subjects with less than 400,000clonable cells (the equivalent to ECs in the autoradiographicassay). After excluding these subjects (3 administrativecontrol, 6 monomer production, and 11 polymerizationworkers), differences in MFs among the three exposuregroups became smaller; mean MFs for control, monomer,
and polymer groups were then 12.43 10�6 (n � 21),10.84 10�6 (n � 16), and 12.77 10�6 (n � 21), respec-tively (see MF for All Subjects, mean � SD, in Table 24 forcomparison values).
Association Between MF and Exposure to BD
Figure 20 is a log-linear scatter plot illustrating the rela-tion between MF and log BD exposure (in mg/m3). Data forsubjects of the three exposure groups are presented withdifferent symbols. Average BD exposure was calculated intwo ways: using all exposure measurements over the entireassessment period and using only those measurementsmade 70 to 50 days before blood sampling. The correla-tions presented below are based on the overall averageexposure, but very similar results were obtained using theexposure interval 70 to 50 days before blood sampling.
The association between MF and overall average BDexposure was assessed by computing Spearman rank cor-relation coefficients (r). The overall association for all threeexposure groups combined was not significant (r � 0.110;P � 0.350). When only results for the monomer andpolymer groups were combined, the association was againnot significant (r � 0.140; P � 0.324). Finally, the correla-tions for the monomer and polymer groups consideredseparately also were not significant. In conclusion, we foundno significant association between MF and BD exposure.
As an alternative statistical approach for the analysis ofthe exposure data, linear regression lines were estimatedfor the association between log-transformed MFs and logBD exposure. This was done for the monomer and polymergroups with and without correction of ln MF for CE. Forboth exposure groups we found no significant associationbetween MF or ln MF and BD exposure.
Effect of Smoking on MFs
After excluding the three monomer production workerswith MF � 0 and the one control subject with unknowncurrent smoking status, the remaining subjects weredivided into subgroups of 34 current smokers and 40 currentnonsmokers. Mean MFs (� SDs) for these subgroups were13.95 (� 7.96) 10�6 for smokers and 15.93 (� 16.09) 10�6
for nonsmokers. Using two-way ANOVA on ln MF, we foundno significant effect of smoking (P � 0.385) and no signifi-cant exposure-group–by–smoking interaction (P � 0.107);this indicates that the effect of smoking in each of the threeexposure groups did not differ significantly. MFs forsmokers and nonsmokers in each of the three exposuregroups are presented in Table 24. MFs correlated withcumulative cigarette consumption computed as the numberof packs of cigarettes smoked per day times the number of
Figure 20. Log-linear scatter plot illustrating the absence of an associa-tion between MF and average BD exposure. � � administrative controlsubjects; � � monomer production workers; � � polymerization workers.
Figure 19. Box plots of HPRT MFs for control, monomer, and polymergroups. The n values have been adjusted to accommodate (a) one monomerproduction worker’s blood not shipped from Prague to Leiden and (b) foursamples lost to unsuccessful cloning: 1 administrative control subject,1 monomer production worker, and 2 polymerization workers. Data for thethree monomer production workers with MF � 0 were included to calcu-late the mean, median, and quartiles. The upper and lower boundaries ofthe boxes represent the 75th and 25th percentiles, respectively. Error barsare the highest and lowest values within 1.5 box-lengths from each percen-tile. The line within each box marks the position of the median value. Onepolymerization worker had an MF of 83.55 10�6, which was outside theerror bars; this value is indicated with a dot above the box plot.
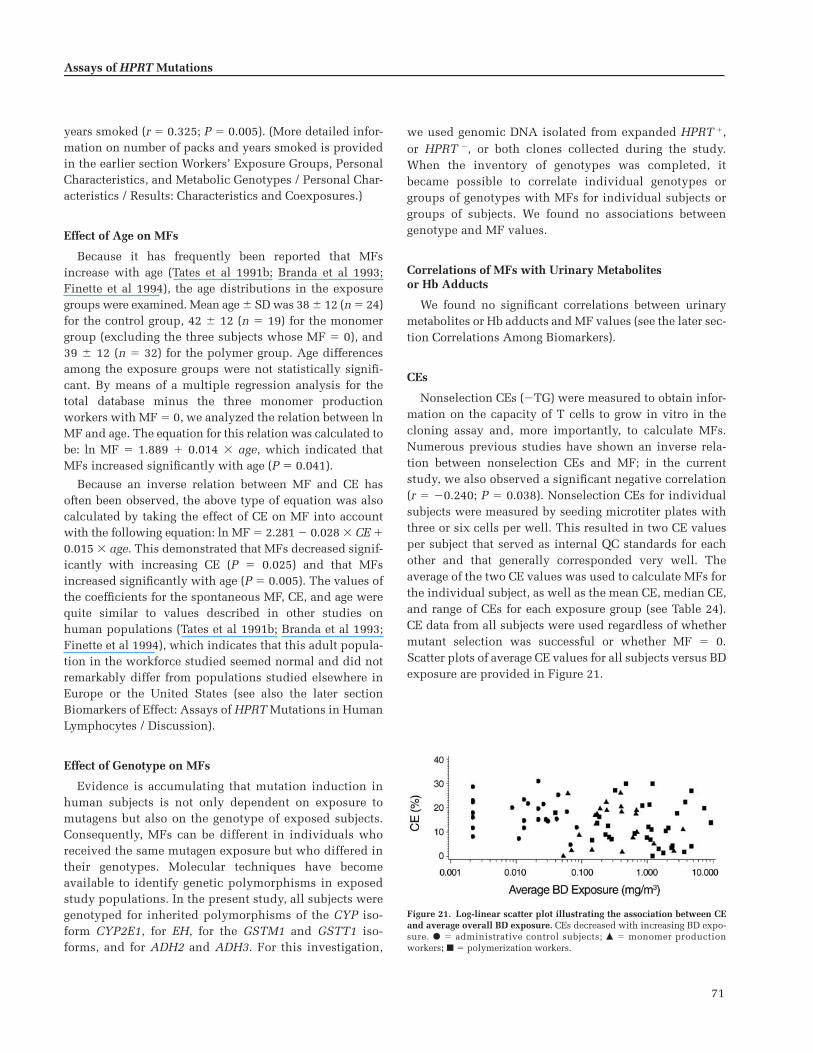
71
years smoked (r � 0.325; P � 0.005). (More detailed infor-mation on number of packs and years smoked is providedin the earlier section Workers’ Exposure Groups, PersonalCharacteristics, and Metabolic Genotypes / Personal Char-acteristics / Results: Characteristics and Coexposures.)
Effect of Age on MFs
Because it has frequently been reported that MFsincrease with age (Tates et al 1991b; Branda et al 1993;Finette et al 1994), the age distributions in the exposuregroups were examined. Mean age � SD was 38 � 12 (n � 24)for the control group, 42 � 12 (n � 19) for the monomergroup (excluding the three subjects whose MF � 0), and39 � 12 (n � 32) for the polymer group. Age differencesamong the exposure groups were not statistically signifi-cant. By means of a multiple regression analysis for thetotal database minus the three monomer productionworkers with MF � 0, we analyzed the relation between lnMF and age. The equation for this relation was calculated tobe: ln MF � 1.889 � 0.014 age, which indicated thatMFs increased significantly with age (P � 0.041).
Because an inverse relation between MF and CE hasoften been observed, the above type of equation was alsocalculated by taking the effect of CE on MF into accountwith the following equation: ln MF � 2.281 � 0.028 CE �0.015 age. This demonstrated that MFs decreased signif-icantly with increasing CE (P � 0.025) and that MFsincreased significantly with age (P � 0.005). The values ofthe coefficients for the spontaneous MF, CE, and age werequite similar to values described in other studies onhuman populations (Tates et al 1991b; Branda et al 1993;Finette et al 1994), which indicates that this adult popula-tion in the workforce studied seemed normal and did notremarkably differ from populations studied elsewhere inEurope or the United States (see also the later sectionBiomarkers of Effect: Assays of HPRT Mutations in HumanLymphocytes / Discussion).
Effect of Genotype on MFs
Evidence is accumulating that mutation induction inhuman subjects is not only dependent on exposure tomutagens but also on the genotype of exposed subjects.Consequently, MFs can be different in individuals whoreceived the same mutagen exposure but who differed intheir genotypes. Molecular techniques have becomeavailable to identify genetic polymorphisms in exposedstudy populations. In the present study, all subjects weregenotyped for inherited polymorphisms of the CYP iso-form CYP2E1, for EH, for the GSTM1 and GSTT1 iso-forms, and for ADH2 and ADH3. For this investigation,
we used genomic DNA isolated from expanded HPRT �,or HPRT �, or both clones collected during the study.When the inventory of genotypes was completed, itbecame possible to correlate individual genotypes orgroups of genotypes with MFs for individual subjects orgroups of subjects. We found no associations betweengenotype and MF values.
Correlations of MFs with Urinary Metabolitesor Hb Adducts
We found no significant correlations between urinarymetabolites or Hb adducts and MF values (see the later sec-tion Correlations Among Biomarkers).
CEs
Nonselection CEs (�TG) were measured to obtain infor-mation on the capacity of T cells to grow in vitro in thecloning assay and, more importantly, to calculate MFs.Numerous previous studies have shown an inverse rela-tion between nonselection CEs and MF; in the currentstudy, we also observed a significant negative correlation(r � �0.240; P � 0.038). Nonselection CEs for individualsubjects were measured by seeding microtiter plates withthree or six cells per well. This resulted in two CE valuesper subject that served as internal QC standards for eachother and that generally corresponded very well. Theaverage of the two CE values was used to calculate MFs forthe individual subject, as well as the mean CE, median CE,and range of CEs for each exposure group (see Table 24).CE data from all subjects were used regardless of whethermutant selection was successful or whether MF � 0.Scatter plots of average CE values for all subjects versus BDexposure are provided in Figure 21.
Assays of HPRT Mutations
Figure 21. Log-linear scatter plot illustrating the association between CEand average overall BD exposure. CEs decreased with increasing BD expo-sure. � � administrative control subjects; � � monomer productionworkers; � � polymerization workers.
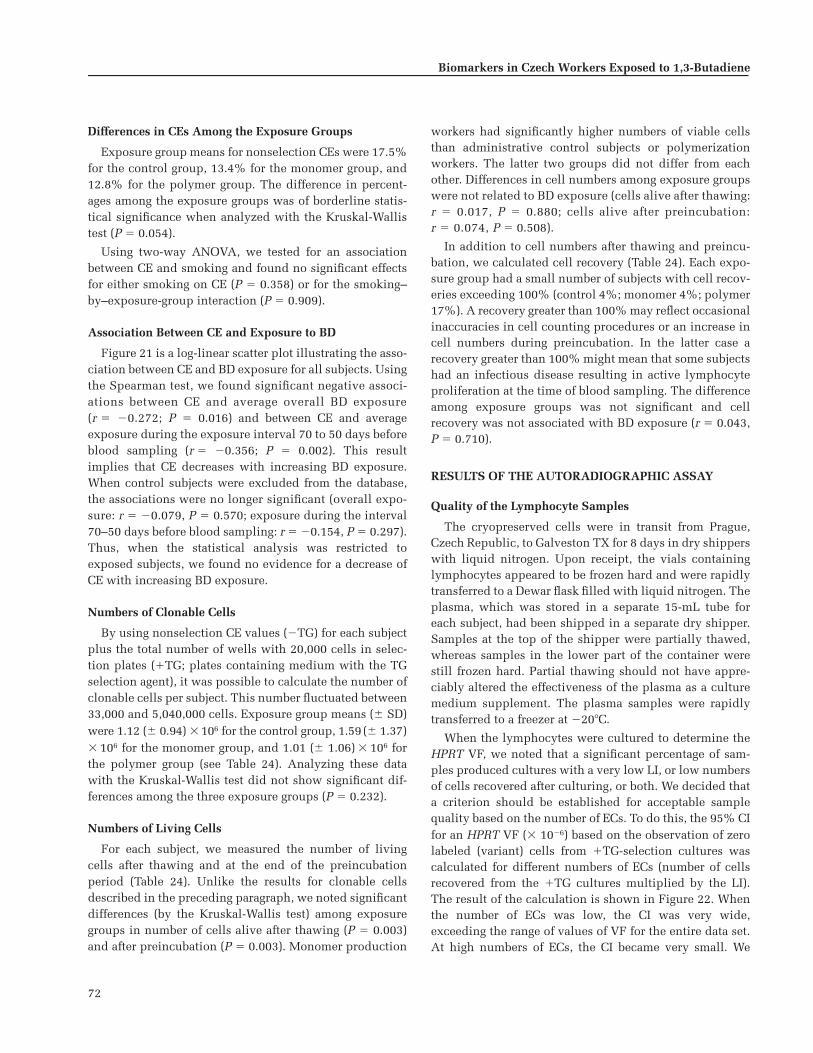
72
Biomarkers in Czech Workers Exposed to 1,3-Butadiene
Differences in CEs Among the Exposure Groups
Exposure group means for nonselection CEs were 17.5%for the control group, 13.4% for the monomer group, and12.8% for the polymer group. The difference in percent-ages among the exposure groups was of borderline statis-tical significance when analyzed with the Kruskal-Wallistest (P � 0.054).
Using two-way ANOVA, we tested for an associationbetween CE and smoking and found no significant effectsfor either smoking on CE (P � 0.358) or for the smoking–by–exposure-group interaction (P � 0.909).
Association Between CE and Exposure to BD
Figure 21 is a log-linear scatter plot illustrating the asso-ciation between CE and BD exposure for all subjects. Usingthe Spearman test, we found significant negative associ-ations between CE and average overall BD exposure(r � �0.272; P � 0.016) and between CE and averageexposure during the exposure interval 70 to 50 days beforeblood sampling (r � �0.356; P � 0.002). This resultimplies that CE decreases with increasing BD exposure.When control subjects were excluded from the database,the associations were no longer significant (overall expo-sure: r � �0.079, P � 0.570; exposure during the interval70–50 days before blood sampling: r � �0.154, P � 0.297).Thus, when the statistical analysis was restricted toexposed subjects, we found no evidence for a decrease ofCE with increasing BD exposure.
Numbers of Clonable Cells
By using nonselection CE values (�TG) for each subjectplus the total number of wells with 20,000 cells in selec-tion plates (�TG; plates containing medium with the TGselection agent), it was possible to calculate the number ofclonable cells per subject. This number fluctuated between33,000 and 5,040,000 cells. Exposure group means (� SD)were 1.12 (� 0.94) 106 for the control group, 1.59 (� 1.37) 106 for the monomer group, and 1.01 (� 1.06) 106 forthe polymer group (see Table 24). Analyzing these datawith the Kruskal-Wallis test did not show significant dif-ferences among the three exposure groups (P � 0.232).
Numbers of Living Cells
For each subject, we measured the number of livingcells after thawing and at the end of the preincubationperiod (Table 24). Unlike the results for clonable cellsdescribed in the preceding paragraph, we noted significantdifferences (by the Kruskal-Wallis test) among exposuregroups in number of cells alive after thawing (P � 0.003)and after preincubation (P � 0.003). Monomer production
workers had significantly higher numbers of viable cellsthan administrative control subjects or polymerizationworkers. The latter two groups did not differ from eachother. Differences in cell numbers among exposure groupswere not related to BD exposure (cells alive after thawing:r � 0.017, P � 0.880; cells alive after preincubation:r � 0.074, P � 0.508).
In addition to cell numbers after thawing and preincu-bation, we calculated cell recovery (Table 24). Each expo-sure group had a small number of subjects with cell recov-eries exceeding 100% (control 4%; monomer 4%; polymer17%). A recovery greater than 100% may reflect occasionalinaccuracies in cell counting procedures or an increase incell numbers during preincubation. In the latter case arecovery greater than 100% might mean that some subjectshad an infectious disease resulting in active lymphocyteproliferation at the time of blood sampling. The differenceamong exposure groups was not significant and cellrecovery was not associated with BD exposure (r � 0.043,P � 0.710).
RESULTS OF THE AUTORADIOGRAPHIC ASSAY
Quality of the Lymphocyte Samples
The cryopreserved cells were in transit from Prague,Czech Republic, to Galveston TX for 8 days in dry shipperswith liquid nitrogen. Upon receipt, the vials containinglymphocytes appeared to be frozen hard and were rapidlytransferred to a Dewar flask filled with liquid nitrogen. Theplasma, which was stored in a separate 15-mL tube foreach subject, had been shipped in a separate dry shipper.Samples at the top of the shipper were partially thawed,whereas samples in the lower part of the container werestill frozen hard. Partial thawing should not have appre-ciably altered the effectiveness of the plasma as a culturemedium supplement. The plasma samples were rapidlytransferred to a freezer at �20�C.
When the lymphocytes were cultured to determine theHPRT VF, we noted that a significant percentage of sam-ples produced cultures with a very low LI, or low numbersof cells recovered after culturing, or both. We decided thata criterion should be established for acceptable samplequality based on the number of ECs. To do this, the 95% CIfor an HPRT VF ( 10�6) based on the observation of zerolabeled (variant) cells from �TG-selection cultures wascalculated for different numbers of ECs (number of cellsrecovered from the �TG cultures multiplied by the LI).The result of the calculation is shown in Figure 22. Whenthe number of ECs was low, the CI was very wide,exceeding the range of values of VF for the entire data set.At high numbers of ECs, the CI became very small. We

73
selected the criterion on the basis of a compromisebetween having an acceptably small CI and retaining anadequate number of samples for analysis. We inspected thecurve in Figure 22, selected different values of ECs, testedeach one as a possible criterion, and determined thenumber of samples that would be available for analysis ifthat value of EC were to be selected as the criterion. On thebasis of these tests, we decided to set the criterion at 0.4 106
ECs. At that criterion value, the upper bound of the CI is anHPRT VF of about 7 10�6, a value in the range of samplesfrom workers in high-exposure areas in our previouslypublished studies of occupational exposure to BD (Ward etal 1994, 1996b, 2001; Ammenheuser et al 2001).
This criterion was applied in compiling a list of thesamples that would be included in the final data setbefore breaking the code. When the code was broken, the
numbers of samples in each of the three exposure groupsturned out to be as shown in Table 25. The percentages ofsatisfactory cultures in the control, monomer, and polymergroups were 79, 71, and 52, respectively (the control groupvalue also excludes one sample due to uncertain currentsmoking status). We also excluded five samples because,when assayed, they produced no labeled (variant) cells(VF � 0; Table 25). Thus the final number of samples thatcould be adequately analyzed was 48 (58% of the samplesreceived). Of the 27 internal QC samples, 25 met the crite-rion of more than 0.4 106 ECs per culture. The mean(� SD) number of ECs for the 25 QC samples was 1.85(� 0.93) 106. The mean number of ECs for all of thePrague samples was 0.94 (� 1.00) 106.
Results for VF by Exposure Group
Of the total of 82 samples received, the results from 48samples were analyzed. The results for the samples byexposure group are summarized in Table 26. The meanHPRT VF for the control group was significantly greaterthan the two groups exposed to BD (P � 0.05).
When broken down by exposure group and smoking, wesaw little effect of smoking on the HPRT VF in the controlgroup, an increased VF in the monomer group (3.84 10�6
for nonsmokers vs 7.21 10�6 for smokers), and a de-creased VF in the polymer group (8.77 10�6 vs 4.48 10�6)(Table 26 and Figure 23). For the nonsmokers, the averageBD exposures in the monomer and polymer groups (Table26) were consistent with the trend of the HPRT VF, but wefound no positive correlation between individual expo-sures and HPRT VF (Figure 24).
Figure 22. Calculated upper bound of the 95% CI (HPRT VF�10�6) for�TG cultures with zero labeled (variant) cells at different numbers of ECs.
Assays of HPRT Mutations
Table 25. Suitability of Samples to be Included in Statistical Analyses of HPRT VF
Control Monomer Polymer TotalInternal
QC Samplesa
Samples received 25 24 33b 82b 27Sample excluded due to uncertain smoking status 24 NAc NA 81 NA
Criterion of 0.4 106 ECsSatisfactory samples (n) 19 17 17 53 25Satisfactory samples (% of total available) 79 71 52 65 93Unsatisfactory samples (n) 5 7 16 28 2Unsatisfactory samples (% of total available) 21 29 48 35 7
Samples eliminated because VF � 0 2 1 2 5 1Total samples available for statistical analyses 17 16 15 48 24
a Samples from subjects in a study being conducted in a Texas SBR plant and from unexposed Texas control subjects.b The sample for one polymerization worker was not shipped from Prague to Galveston for analysis; therefore, for the total subjects, n � 82 rather than 83,
and for the polymer group, n � 33 rather than 34.c NA = not applicable.

74
Biomarkers in Czech Workers Exposed to 1,3-ButadieneTable 26. Summary of Autoradiographic Assay Results for Nonsmokers and Smokers
Parameter Controla Monomer Polymerb
NonsmokersCells alive (106) after thawing
Mean � SD 13.47 � 4.60 21.36 � 15.55 17.72 � 8.74Median (range) 12 (8–28) 16 (3–55) 14.5 (3–38)n (� 44 total) 15a 11 18b
Cells recovered (106) after culture (LI � TG flasks)Mean � SD 4.35 � 2.56 8.75 � 5.33 6.09 � 3.97Median (range) 3.623 (2.366–12.985) 7.284 (1.312–18.951) 5.034 (1.175–18.493) n (� 44 total) 15a 11 18b
ECs (106)Mean � SD 0.565 � 0.200 1.778 � 1.087 1.695 � 1.059Median (range) 0.482 (0.403–0.972) 1.432 (0.593–3.751) 1.298 (0.839–3.866)n (� 23 total)c 9 7 7
LIMean � SD 0.244 � 0.089 0.251 � 0.094 0.274 � 0.077Median (range) 0.240 (0.08–0.362) 0.249 (0.155–0.400) 0.272 (0.159–0.373)n (� 23 total)c 9 7 7
BD exposure (mg/m3)Mean � SD 0.017 � 0.014 0.652 � 1.276 2.501 � 3.394Median (range) 0.015 (0.002–0.042) 0.665 (0.062–3.516) 1.154 (0.040–9.244)n (� 23 total)c 9 7 7
VF (10�6)Mean � SD 11.29 � 8.16 3.84 � 2.87 8.77 � 5.64Median (range) 7.04 (2.48–23.66) 3.70 (0.53–9.33) 5.40 (2.59–19.29)n (� 23 total)c 9 7 7
SmokersCells alive (106) after thawing
Mean � SD 20.67 � 5.57 25.38 � 8.10 16.67 � 7.27Median (range) 20 (13–30) 27 (11–35) 15 (4–28)n (� 37 total) 9a 13 15b
Cells recovered (106) after culture (LI � TG flasks)Mean � SD 6.50 � 2.42 9.00 � 3.46 5.58 � 2.34Median (range) 5.158 (4.001–10.391) 8.963 (2.870–14.642) 5.888 (0.782–10.0)n (� 37 total) 9a 13 15b
ECs (106)Mean � SD 1.353 � 0.893 2.229 � 1.205 0.946 � 0.579Median (range) 0.900 (0.495–3.083) 1.747 (0.685–4.380) 0.770 (0.403–2.22)n (� 25 total)c 8 9 8
LIMean � SD 0.313 � 0.106 0.308 � 126 0.235 � 0.100Median (range) 0.274 (0.187–0.486) 0.336 (0.058–0.475) 0.214 (0.120–0.43)n (� 25 total)c 8 9 8
BD exposure (mg/m3)Mean � SD 0.018 � 0.019 0.654 � 0.570 2.038 � 2.448Median (range) 0.013 (0.002–0.059) 0.411 (0.146–1.861) 1.025 (0.188–7.40)n (� 25 total)c 8 9 8
VF (10�6)Mean � SD 10.32 � 3.69 7.21 � 5.48 4.48 � 2.91Median (range) 10.84 (5.06–16.54) 4.36 (1.46–15.65) 1.025 (1.18–9.64)n (� 25 total)c 8 9 8
All Subjects for Whom VFs Were DeterminedBD exposure (mg/m3)
Mean � SD 0.018 � 0.016 0.53 � 0.903 2.254 � 2.827n (� 48 total)c 17 16 15
VF ( 10�6)Mean � SD 10.75 � 6.11d 5.73 � 4.72 6.48 � 4.77Median 9.71 3.79 5.40n (� 48 total)c 17 16 15
a Data for one administrative control subject were omitted due to unknown smoking status. Therefore, for those analyses involving smokers vs nonsmokers, the total number in the control group was 24 rather than 25.
b The blood sample for one polymerization worker was not shipped from Prague to Galveston for analysis; therefore, for total subjects, n = 82 rather than 83, and for the polymer group, n = 33 rather than 34.
c The total number of samples available for statistical analyses was 48 (smokers plus nonsmokers); see Table 25.d Significantly greater than both exposed groups (P < 0.05) by Kruskal-Wallis test.
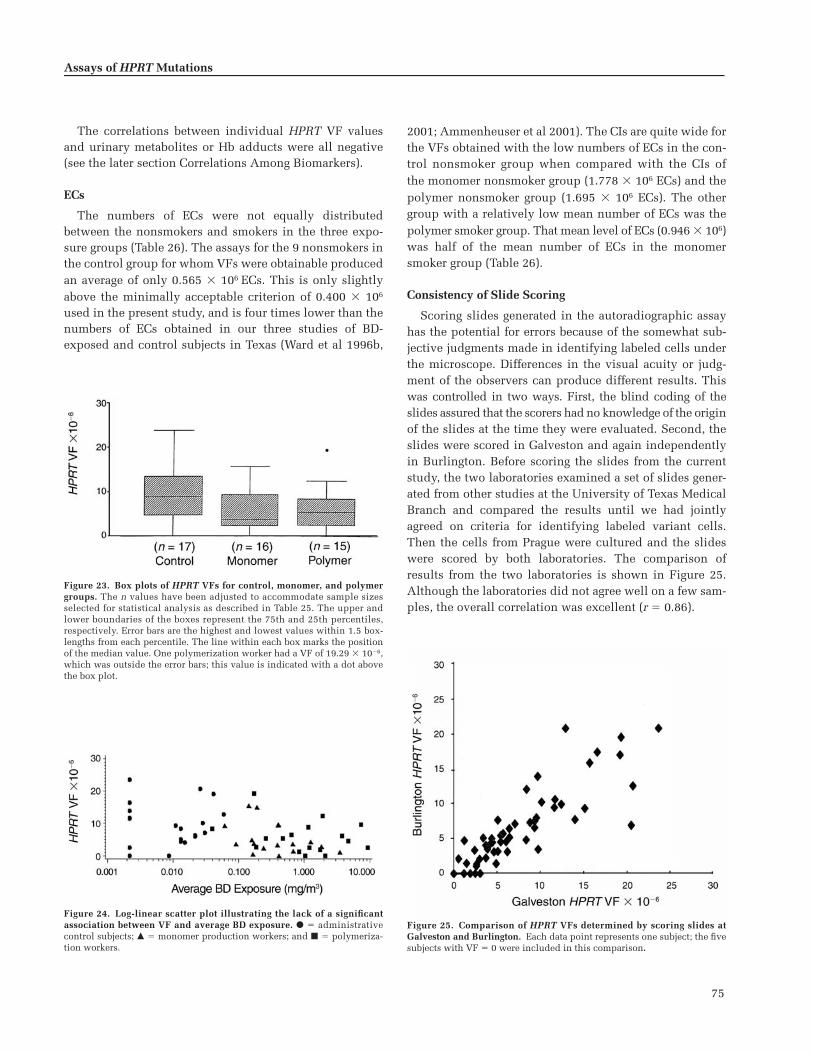
75
The correlations between individual HPRT VF valuesand urinary metabolites or Hb adducts were all negative(see the later section Correlations Among Biomarkers).
ECs
The numbers of ECs were not equally distributedbetween the nonsmokers and smokers in the three expo-sure groups (Table 26). The assays for the 9 nonsmokers inthe control group for whom VFs were obtainable producedan average of only 0.565 106 ECs. This is only slightlyabove the minimally acceptable criterion of 0.400 106
used in the present study, and is four times lower than thenumbers of ECs obtained in our three studies of BD-exposed and control subjects in Texas (Ward et al 1996b,
2001; Ammenheuser et al 2001). The CIs are quite wide forthe VFs obtained with the low numbers of ECs in the con-trol nonsmoker group when compared with the CIs ofthe monomer nonsmoker group (1.778 106 ECs) and thepolymer nonsmoker group (1.695 106 ECs). The othergroup with a relatively low mean number of ECs was thepolymer smoker group. That mean level of ECs (0.946 106)was half of the mean number of ECs in the monomersmoker group (Table 26).
Consistency of Slide Scoring
Scoring slides generated in the autoradiographic assayhas the potential for errors because of the somewhat sub-jective judgments made in identifying labeled cells underthe microscope. Differences in the visual acuity or judg-ment of the observers can produce different results. Thiswas controlled in two ways. First, the blind coding of theslides assured that the scorers had no knowledge of the originof the slides at the time they were evaluated. Second, theslides were scored in Galveston and again independentlyin Burlington. Before scoring the slides from the currentstudy, the two laboratories examined a set of slides gener-ated from other studies at the University of Texas MedicalBranch and compared the results until we had jointlyagreed on criteria for identifying labeled variant cells.Then the cells from Prague were cultured and the slideswere scored by both laboratories. The comparison ofresults from the two laboratories is shown in Figure 25.Although the laboratories did not agree well on a few sam-ples, the overall correlation was excellent (r � 0.86).
Assays of HPRT Mutations
Figure 23. Box plots of HPRT VFs for control, monomer, and polymergroups. The n values have been adjusted to accommodate sample sizesselected for statistical analysis as described in Table 25. The upper andlower boundaries of the boxes represent the 75th and 25th percentiles,respectively. Error bars are the highest and lowest values within 1.5 box-lengths from each percentile. The line within each box marks the positionof the median value. One polymerization worker had a VF of 19.29 10�6,which was outside the error bars; this value is indicated with a dot abovethe box plot.
Figure 24. Log-linear scatter plot illustrating the lack of a significantassociation between VF and average BD exposure. � � administrativecontrol subjects; � � monomer production workers; and � � polymeriza-tion workers.
Figure 25. Comparison of HPRT VFs determined by scoring slides atGalveston and Burlington. Each data point represents one subject; the fivesubjects with VF � 0 were included in this comparison.
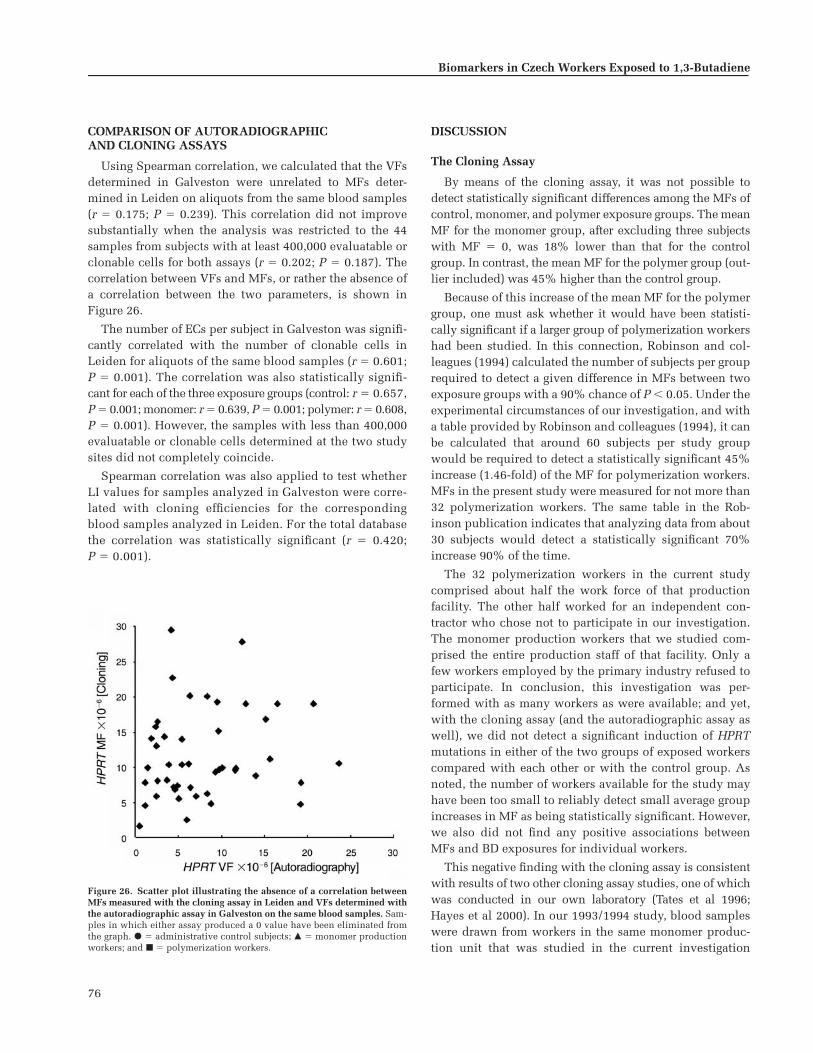
76
Biomarkers in Czech Workers Exposed to 1,3-Butadiene
COMPARISON OF AUTORADIOGRAPHICAND CLONING ASSAYS
Using Spearman correlation, we calculated that the VFsdetermined in Galveston were unrelated to MFs deter-mined in Leiden on aliquots from the same blood samples(r � 0.175; P � 0.239). This correlation did not improvesubstantially when the analysis was restricted to the 44samples from subjects with at least 400,000 evaluatable orclonable cells for both assays (r � 0.202; P � 0.187). Thecorrelation between VFs and MFs, or rather the absence ofa correlation between the two parameters, is shown inFigure 26.
The number of ECs per subject in Galveston was signifi-cantly correlated with the number of clonable cells inLeiden for aliquots of the same blood samples (r � 0.601;P � 0.001). The correlation was also statistically signifi-cant for each of the three exposure groups (control: r � 0.657,P � 0.001; monomer: r � 0.639, P � 0.001; polymer: r � 0.608,P � 0.001). However, the samples with less than 400,000evaluatable or clonable cells determined at the two studysites did not completely coincide.
Spearman correlation was also applied to test whetherLI values for samples analyzed in Galveston were corre-lated with cloning efficiencies for the correspondingblood samples analyzed in Leiden. For the total databasethe correlation was statistically significant (r � 0.420;P � 0.001).
DISCUSSION
The Cloning Assay
By means of the cloning assay, it was not possible todetect statistically significant differences among the MFs ofcontrol, monomer, and polymer exposure groups. The meanMF for the monomer group, after excluding three subjectswith MF � 0, was 18% lower than that for the controlgroup. In contrast, the mean MF for the polymer group (out-lier included) was 45% higher than the control group.
Because of this increase of the mean MF for the polymergroup, one must ask whether it would have been statisti-cally significant if a larger group of polymerization workershad been studied. In this connection, Robinson and col-leagues (1994) calculated the number of subjects per grouprequired to detect a given difference in MFs between twoexposure groups with a 90% chance of P � 0.05. Under theexperimental circumstances of our investigation, and witha table provided by Robinson and colleagues (1994), it canbe calculated that around 60 subjects per study groupwould be required to detect a statistically significant 45%increase (1.46-fold) of the MF for polymerization workers.MFs in the present study were measured for not more than32 polymerization workers. The same table in the Rob-inson publication indicates that analyzing data from about30 subjects would detect a statistically significant 70%increase 90% of the time.
The 32 polymerization workers in the current studycomprised about half the work force of that productionfacility. The other half worked for an independent con-tractor who chose not to participate in our investigation.The monomer production workers that we studied com-prised the entire production staff of that facility. Only afew workers employed by the primary industry refused toparticipate. In conclusion, this investigation was per-formed with as many workers as were available; and yet,with the cloning assay (and the autoradiographic assay aswell), we did not detect a significant induction of HPRTmutations in either of the two groups of exposed workerscompared with each other or with the control group. Asnoted, the number of workers available for the study mayhave been too small to reliably detect small average groupincreases in MF as being statistically significant. However,we also did not find any positive associations betweenMFs and BD exposures for individual workers.
This negative finding with the cloning assay is consistentwith results of two other cloning assay studies, one of whichwas conducted in our own laboratory (Tates et al 1996;Hayes et al 2000). In our 1993/1994 study, blood sampleswere drawn from workers in the same monomer produc-tion unit that was studied in the current investigation
Figure 26. Scatter plot illustrating the absence of a correlation betweenMFs measured with the cloning assay in Leiden and VFs determined withthe autoradiographic assay in Galveston on the same blood samples. Sam-ples in which either assay produced a 0 value have been eliminated fromthe graph. � � administrative control subjects; � � monomer productionworkers; and � � polymerization workers.

77
(Tates et al 1996). In 1994 the mean exposure level was3.89 mg/m3 ([1.76 ppm] range: 0.03–43.69 mg/m3 [0.01–19.77 ppm]). The mean BD level for monomer productionworkers was higher than that measured with much greateraccuracy in the current study (mean: 0.64 mg/m3 [0.29ppm]; range: 0.053–3.516 mg/m3 [0.02–1.59 ppm]) andalso higher than the mean for the polymerization workersin the present study (1.79 mg/m3 [0.81 ppm]; range: 0.04–9.24 mg/m3 [0.02–4.18 ppm]).
It is remarkable that mean MFs for monomer productionworkers in the past and present studies at the samefacility (past: 10.10 [� 10.32] 10�6, n � 24; present:9.24 [� 6.24] 10�6, n � 22) were lower than mean MFsfor the control group (past: 13.93 [� 9.04] 10�6, n � 26;present: 13.01 [� 8.10] 10�6, n � 24). Evidently, theseresults are in good agreement despite the fact that severaldifferences exist between the two studies. First, the controlgroup for the present study consisted of volunteers from alarge pool of male administrative workers outside themonomer production unit, whereas the control group fromthe previous study consisted of male workers from a heatproduction unit of the monomer plant. Second, cloningassays for the past and present studies were performed inthe same laboratory by practically the same technical staff,but the protocols used were different in two aspects: (1)type of lymphocyte growth factor (past: LAK supernatantas the source of IL-2; present: recombinant IL-2); and (2)procedures used for priming/stimulating lymphocytes(past: preincubation for 44 hours in the presence of LAKsupernatant followed by counting of stimulated/primedlymphocytes; present: preincubation for 24 hours withoutIL-2 source followed by counting of live cells regardless ofwhether or not they were stimulated).
The main reason for modifying the cloning assay inthe present study was that we wanted to adapt as muchas possible to the Uniform Operating Protocol, whichhad been developed by a group of European laboratories(Hou et al 1999) with the objective of rigidly standard-izing the cloning assay protocols so that results from dif-ferent laboratories and countries could more reliably becompared and perhaps even pooled. In terms of thevalues for CEs in the absence of TG selection, the Uni-form Operating Protocol was not necessarily better orworse than the protocol we had used previously for otherbiomonitoring studies, including our earlier BD study(Tates et al 1996). In comparing the two studies, wefound little or no difference between mean CEs for thecontrol group in the past study (15.48%, range: 2.7–39.4;see Table 3 in Tates et al 1996) and the control group inthe present study (17.51%, range: 4.8–31.1). For themonomer group, mean CEs for the past and present
studies were, respectively, 19.90% (range 8.2–33.8) and13.43% (range 0.4–26.5).
On the basis of these comparisons between MFs and CEsfor the control and monomer groups in the past andpresent studies, we conclude that the differences in resultsare negligible despite differences in the origin of the con-trol populations and differences in protocols used for thecloning assay.
Apart from the consistency of results between the twoBD studies performed in our laboratories over a time spanof about 5 years, we have several “sentinel findings” in thecurrent study to suggest that the cloning assay was per-forming satisfactorily. First, in agreement with other pub-lished findings (Cole et al 1990; Tates et al 1991b; Branda etal 1993; Finette et al 1994), we found that MFs decreasedsignificantly with increasing CEs, whereas MFs increasedsignificantly with age (for details see the appropriate ear-lier subsections under Biomarkers of Effect: Assays ofHPRT Mutations in Human Lymphocytes / Results of theCloning Assay). The values of the coefficients that wefound for spontaneous MFs, CEs, and age were quite sim-ilar to the ones calculated in other studies on human pop-ulations; this indicates that the current study populationseemed normal (in so far as the cloning assay results areconcerned) and did not remarkably differ from adult pop-ulations studied elsewhere in Europe and the UnitedStates. Second, the present study indicated a positive cor-relation between MFs and cumulative smoking history(see the earlier section Biomarkers of Effect: Assays ofHPRT Mutations in Human Lymphocytes / Results of theCloning Assay). This finding also provides confidence thatthe cloning assay was functioning properly. Finally, duringthe entire cloning assay portion of the study, an internal QCstandard was analyzed concurrently with each set of sixCzech samples. Throughout the study, CEs for the QC stan-dards fluctuated very little, which indicates that thecloning assay was performed consistently even thoughfresh medium was prepared for each set of six Czech sam-ples. Furthermore, not only was the MF for the monomergroup lower than that for the control group, but in the par-allel autoradiographic study, the VF for monomer groupwas also lower than that for the control group.
The absence of statistically significant mutagenic effectsof BD exposure in our past and present Czech study popu-lations is consistent with observations of Hayes andcoworkers (2000) who also used a cloning assay and couldnot demonstrate induction of HPRT mutations in lympho-cytes from BD-exposed workers in China. The investiga-tors of the study in China did not detect a significantincrease in the frequency of glycophorin A mutants inerythrocytes of the same exposed workers when compared
Assays of HPRT Mutations

78
Biomarkers in Czech Workers Exposed to 1,3-Butadiene
with control subjects, nor did they find BD-associatedgenetic effects at the chromosomal level (such as SCEs oraneuploidy). As in our own study, HPRT MFs did not cor-relate with any of the other parameters tested in the study.Median air levels of BD for dimethylformamide and poly-merization process analysts were 2.21 and 7.74 mg/m3 (1.0and 3.5 ppm), respectively. These exposure levels arehigher than the median levels of BD for the monomer andpolymer groups in our present investigation. Ma and asso-ciates (2000) reported that a BD-exposed worker group inan SBR plant in Texas USA had a significantly higher MFthan the nonexposed control group (P � 0.05). Workersevaluated for MF with the cloning assay were exposed toBD at a median level of 1.90 mg/m3 (0.86 ppm). Themedian BD exposure level in that study was somewhathigher than the median level of 0.599 mg/m3 (0.285 ppm)for the polymer group in the current study. The mean CEsof the samples from the Texas SBR workers were also con-siderably higher than those for either of the Czech studies(Texas study: 32.1% for the control group and 28.7% forthe polymer group [Ma et al 2000]; 1994 Czech study:14.0% for the control group and 19.9% for the polymergroup [Tates et al 1996]; current Czech study: 17.5% forthe control group and 12.8% for the polymer group). Wecannot explain the discrepancies among the China study,the two Czech studies, and the Texas study.
As discussed earlier, BD exposure has been found to bemutagenic in mice and rats. Several researchers have inves-tigated the molecular nature of HPRT mutations induced byBD and its metabolites in lymphocytes of treated mice andrats (Cochrane et al 1994b; Recio et al 1998; Meng et al2000). Such studies provide insight into the metabolites,adducts, and DNA lesions that contribute to mutagenesisin the two species. When we carried out our own investi-gations with BD-exposed workers in the Czech Republic, itwas not known a priori whether MFs for monomer produc-tion and polymerization workers would be different fromthose for control subjects and, if not, whether it wouldmake sense to perform an extensive molecular analysis ofmutant clones. In the absence of such prior knowledge, wetherefore decided at the onset of the study to select,expand, and freeze a large number of mutants from occu-pationally exposed workers and control subjects (in total,446 mutant clones and 343 wild-type clones were avail-able for various kinds of molecular analysis). Because wedid not find significant differences in the MFs of the threeexposure groups, we did not expect to find striking differ-ences in the mutational spectra of the three exposure groups.However, as demonstrated by the studies of Hüttner andHolzapfel (1996), the absence of differences in MFs amongexposure groups does not exclude the possibility of
finding differences in mutational spectra between exposedand control subjects. Those authors used multiplex-PCR tomeasure the frequency of large deletions among HPRTmutations isolated from lymphocytes of vinyl chloride–exposed and matched control subjects. MFs for the twogroups were not different; nevertheless, large deletionswere found in 21% of the mutants from vinyl chloride–exposed individuals, whereas only 11% of the mutantsfrom the control subjects carried a large deletion. In thesame study, investigators found a slight, but statisticallysignificant, difference in the frequency of chromosomalaberrations in vinyl chloride–exposed workers (1.47%)versus control subjects (1.07%). Our present study of Czechworkers indicated no difference in the frequency of aberra-tions among the three exposure groups; in one of our ear-lier Czech studies, however, we did find a small but signif-icant difference between frequencies of aberrations in BD-exposed monomer production workers when comparedwith the control subjects, although an earlier study hadfound no such increase (Tates et al 1996).
In view of these results, a small possibility existed thatdifferences in mutational spectra among the three expo-sure groups would be found. That molecular analysis ofmutant cells from the current subjects would be worth-while was also suggested by the results of an investigationof BD-exposed workers in the USA (Ma et al 2000). In thatstudy, the spectra of mutations in the HPRT gene in lym-phocytes from nonsmoking subjects who worked in areasof relatively high exposure to BD (TWA about 3.5 ppm or7.7 mg/m3) were compared with the mutational spectra innonsmoking control subjects. In the BD-exposed subjects,investigators detected a significant increase (P � 0.05) inthe proportion of mutations involving partial gene dele-tions and �1 frameshift mutations. A molecular analysisof mutant cells from the subjects in the current study was,therefore, undertaken. We saw no differences between themutational spectra for control and exposed subjects. Thedetailed results are presented in the later section Bio-markers of Effect: HPRT Mutational Spectra.
The Autoradiographic Assay
Sample Quality The autoradiographic HPRT mutantlymphocyte assay requires a relatively large number oflymphocytes in good condition. The assay is based on thedetection of rare TG-resistant cells in a background ofnormal TG-sensitive cells that do not incorporate [3H]TdR.In individuals who do not smoke and have no other risk fac-tors, typical VFs are in the range of 1 to 4 mutants per mil-lion ECs (Ammenheuser et al 1997b). If the LI were 12%, thenumber of ECs in a 30-mL blood sample after lymphocyte
79
isolation, freezing, thawing, and 42 hours of culture wouldbe about a million cells. At a VF of 2 10�6, a total of onlytwo labeled cells would be present, divided between twoslides. However, the VF would appear to be half of that,only 1 10�6, if only one labeled cell was not detectedwhen the slides were scored. The success of the assay as abiomarker is, therefore, highly dependent on the numberand quality of the cells available.
This was a major challenge in this study. The lymphocytescollected from the study participants were shared amongthree laboratories for the cloning and autoradiographic HPRTassays and for cytogenetic analysis, which limited thesupply available for any one assay. In addition, main-taining the quality of the samples was a concern. The lym-phocytes required cryopreservation, both to preserve themfor shipping and to minimize the detection of phenocopiesin the autoradiographic assay (Albertini et al 1982; Ammen-heuser et al 1988). Shipping over the long distance betweenthe Czech Republic and Texas posed additional risks tosample quality because they were about eight days intransit. Although the lymphocytes appeared to be solidlyfrozen, it became apparent during the assay of the samplesthat many had poor recovery when thawed and assayed, orlow LIs resulted in small numbers of ECs, or both. With alow number of ECs it is likely that no mutant cells wouldbe observed, but that the CI around a value of 0 could belarger than the range of VFs that we had expected on thebasis of previous experience with the assay. For thisreason, we decided to establish a criterion for acceptablesample quality on the basis of the number of ECs beforelearning the origins of the samples.
In terms of ECs, the quality of the samples was lowerthan we have experienced in studies with samples col-lected locally. For example, in a study of 37 workers in anSBR plant in Texas who were evaluated for HPRT VF atabout the same time as this study (Ward et al 2001), theaverage number of ECs was 2.04 106. Some of these lym-phocyte samples and some samples from nonindustrialcontrol subjects (n � 25 total) were assayed concurrentlywith the samples for this study (as internal QC standards),and the average number of ECs was 1.85 106. This wasconsiderably higher than 0.94 106, the average numberof ECs observed for subjects in the present study. The sam-ples that did not meet the criteria for acceptability werenot equally distributed among the three exposure groups(Table 25). Of the samples from the polymerization workers,48% did not meet the criterion; whereas only about 30% ofthe samples from subjects in the monomer group were notacceptable. In the control group, no samples from thesmokers were unacceptable, but 40% of the samples fromthe nonsmokers were unacceptable. We were unable to
identify a reason for the samples from the polymer groupand the control nonsmoker group to be of poorer qualitythan others. We found no discernable pattern of days onwhich the unsatisfactory samples were collected, nor wereBD levels consistently higher or lower in the subjects withunsatisfactory samples.
Relation of HPRT VF to BD Exposure The mean HPRTVFs for the nonsmokers in the monomer and polymergroups compared with each other in what appeared to be aBD dose–related trend. The mean VF for the control group,however, was higher than that for either of the two groupsexposed to BD. Because individual HPRT VFs for monomerproduction and polymerization workers did not correlatewith the individual average BD exposure measurements orwith the concentration of urinary metabolites or Hb adducts,BD exposure levels could not have been the reason for thisdifference between means in nonsmokers. Thus, there isno apparent relation between BD exposure at the currentlevels detected in the Prague workers and the VF in HPRTlymphocytes using the autoradiographic assay (Figure 24).
This result is inconsistent with the earlier studies in ourlaboratory of HPRT mutations in subjects living in Texas.The most obvious differences are in the frequencies ofHPRT variant lymphocytes observed in nonsmokers whenour four studies of Texas BD workers (Ward et al 1994,1996b, 2001; Ammenheuser et al 2001) are compared withthe current study. For example, in our 1992 study ofworkers in a BD monomer plant in Texas (Ward et al1996b), the average VF of the low-exposure nonsmokers(n � 8) was 2.14 10�6; and in our 1998–1999 study ofworkers in a polymerization plant in Texas (Ward et al2001), the VF for low-exposure nonsmokers (n � 13) was3.61 10�6. Furthermore, in a study in the United Statesthat compared the HPRT VFs for smokers and non-smokers (Ammenheuser 1997b), we reported a mean VFof 1.74 10�6 for 42 nonsmokers with no known exposureto mutagenic agents. Even the heavy smokers in that 1997study had a mean VF of only 8.09 10�6, which is lowerthan the VF of 11.29 10�6 for control nonsmokers in thecurrent study. Thus, this unusually high control valuecould have obscured a positive response in the BD expo-sure groups.
It does not appear likely that the unusual resultsobserved with the autoradiographic assay are the result oferrors made in scoring the slides. The repeat scoring of theslides in Burlington was done to control for this possi-bility. The close agreement between the analyses done atGalveston and Burlington indicates that the scoring wasreasonably accurate.
One of the original reasons for selecting BD manufacturing
Assays of HPRT Mutations

80
Biomarkers in Czech Workers Exposed to 1,3-Butadiene
facilities in the Czech Republic for this study was that theworkers were believed to have a relatively high level ofexposure to BD, thus providing a good opportunity toobserve responses in biomarker assays. As it turned out,this was not the case. Table 27 summarizes the exposuresof the workers who were evaluated for HPRT MFs in theprevious studies described in the introductory material tothis section. In all of these studies, a few high values influ-enced the mean values, so the medians should also be con-sidered for comparisons. As shown in Table 27, the meanand median BD exposures in the polymerization unit inthis study are lower than those in the high-exposure areasof the polymerization plant studied in Texas in 1994–1995and again in 1998. The exposures in the Czech monomerproduction area in this study are the lowest of any of thefacilities studied. The one study in which exposuresappeared to be quite high was the study in China, butHayes and coworkers (2000) have indicated that these ele-vated values are largely due to brief and intermittent highexposures. The mean HPRT VF (6.48 10�6) for the Czechpolymer group in this study is similar to the mean high-exposure value (6.5 10�6) in the Texas 1994–1995 study(Ammenheuser et al 2001), and somewhat lower than theaverage for all of the high-exposure workers (10.3 10�6)observed in the 1998 Texas study (Ward et al 2000). Theaverage HPRT VF (5.73 10�6) for the monomer group inthis study was somewhat higher than the average in thelow-exposure areas in the two Texas studies (2.14 10�6
in 1994–1995 and 3.61 10�6 in 1998; data not shown).The BD levels for the Texas low-exposure groups were lessthan 0.55 mg/m3 (0.25 ppm) in 1994–1995 and 0.145 mg/m3
(0.07 ppm) in 1998. The mean HPRT VFs for the monomerand polymer groups in the current study are consistent
with the values in the Texas studies when the BD expo-sures are the basis for comparison among the differentgroups of workers. Despite these comparisons of groupmeans and medians, however, in the current study therange of values for individual monomer production andpolymerization workers were quite large, with maximalindividual mean exposure levels up to 3.5 mg/m3 for themonomer production workers and 9.2 mg/m3 for the poly-merization workers over the entire exposure assessmentperiod. There was no correlation between an individual’sBD exposure and his HPRT VF.
The results of the HPRT autoradiographic assay forvariant lymphocytes, therefore, do not reveal a mutagenicresponse to BD in the current Czech worker population.Both the monomer and polymer groups have mean HPRTVFs that are significantly lower than the control group. Inaddition, the HPRT VFs in the monomer and polymergroups do not correlate with the individual BD exposuresmeasured by either air monitoring or the exposure bio-markers (urinary M2 and M1, and Hb adducts). The expo-sure levels in the monomer group were sufficiently lowthat, on the basis of our earlier experience, the sensitivityof the assay may have been near its limits. In the polymergroup, the mean and median BD exposure levels were alsolower than the levels measured in our studies in Texas.Those studies detected increases in HPRT VF that corre-lated with individual exposures (Ward et al 1996b, 2001;Ammenheuser et al 2001).
The distribution of HPRT VFs in the control nonsmokergroup in this study included three samples with VFs between19 and 24 10�6 and one with a VF of about 14 10�6.These are an order of magnitude higher than the HPRT VFvalues we have seen previously in nonsmoker subjects
Table 27. Comparison of BD Exposures in the Current Study with Earlier BD Biomonitoring Studies
BD Exposure
Mean � SD Median
Study and Group mg/m3 ppm mg/m3 ppm References
Texas 1994–1995: high-exposurepolymer
7.03 � 2.72 3.18 � 1.23 1.15 0.52 Ammenheuseret al 2001
Texas 1998: high-exposure polymer 3.71 � 6.67 1.68 � 3.02 0.92 0.41 Ward et al 2001
Czech Republic 1994: monomer 3.89 1.76 0.53 0.24 Tates et al 1996;rám et al 1998
China 1994 Not available — � 4.42 � 2.00 Hayes et al 2000
Czech Republic 1998: polymer 1.79 � 2.11 0.81 � 0.95 0.60 0.27 The current studyCzech Republic 1998: monomer 0.64 � 0.85 0.29 � 0.38 0.27 0.12 The current study
S

81
who have had no known exposure to mutagenic agents(Ammenheuser et al 1997b, 1998). The VFs of these fourcontrol subjects were also much higher than the mean VFof 1.64 10�6 obtained from concurrent assays of fourunexposed Texas subjects. One of the four control subjectswith a high VF also had a chronic autoimmune condition,a recent infection, and a vaccination a few weeks beforeblood sampling. Another two of these control subjectswith high VFs reported exposures to potentially mutagenicagents other than BD. Of the five remaining subjects in thegroup designated as the control nonsmoker group, twosubjects reported that they smoked cigars or pipes. TheirVFs of 7.04 and 6.02 10�6 are values that are similar tothe average VF previously reported for light cigarettesmokers (� 10/day) (Ammenheuser et al 1997b). The meanVF for the remaining three nonsmokers in the controlgroup was 3.69 10�6, which is close to the VF for themonomer nonsmoker group (3.84 10�6) but lower thanthe VF for the polymer nonsmoker group (8.77 10�6).The mean VF (10.32 10�6) for the eight smokers in thecontrol group in the current study is only slightly higherthan the mean VF previously reported for 18 heavysmokers (8.09 10�6) (Ammenheuser et al 1997b).
In the polymer group, half of the eight smokers were rel-atively light tobacco users (about 11 cigarettes per day).Their average BD exposure of 1 mg/m3 (0.45 ppm) was low,and their mean VF of 2.05 10�6 was also low, even forlight smokers. However, the average number of ECs obtainedin the HPRT assays of these subjects was only 0.636 106,and only one or two labeled (variant) cells were identifiedfor each subject (mean 1.25 variants). This resulted in largeCIs for these VFs (see Figure 22). The mean VF of 4.48 10�6
for all of the eight subjects identified as smokers in thepolymer group in this study is comparable to the mean of5.22 10�6 obtained in light smokers with plasma coti-nine values of less than 90 ng/mL (Ammenheuser et al1997b). (We do have confidence in our assessment ofsmoking behavior in the Czech workers because of theexpected effects seen for HPRT mutations determined bythe cloning assay and the increase in SCEs and HFCs deter-mined by cytogenetic assays [see the later section Biomarkersof Exposure: Cytogenetic Analysis].) It is also notable that,in comparison with our previous studies, the worker groupswith mean HPRT VFs that seemed aberrant (the polymersmoker group and the control nonsmoker group) were thetwo groups of workers that had the lowest number of ECs.The mean ECs of these two groups were 2 to 3 times lowerthan the means for the other four groups, resulting inmuch wider CIs for the VFs of these subjects (see Table26; Figure 22; the earlier section Biomarkers of Effect:Assays of HPRT Mutations in Human Lymphocytes /
Results of the Autoradiographic Assay / Quality of theLymphocyte Samples; and the earlier section Biomarkersof Effect: Assays of HPRT Mutations in Human Lympho-cytes / Discussion / The Autoradiographic Assay / SampleQuality).
Factors That Could Affect the Results of HPRT Assays Itis of obvious value to know what factors may have contrib-uted to the high VF values detected with the autoradio-graphic assay in the control group. Because this study isconsidered transitional in nature, the objectives of thestudy were to determine the suitability of the biomarkerassays as much as they were to evaluate exposures. It isimportant, therefore, to identify factors that can influencethe response of biomarker assays.
Several factors might cause an unusual increase in theHPRT VF. An obvious possibility is concurrent exposuresto mutagens other than the agent that is the focus of thestudy. Administrative workers were selected as the controlpopulation because their exposure to BD and styrene wasestimated to be very low compared with the productionworkers. This was, in fact, confirmed by the exposure assess-ment; but some of these administrative workers could havebeen exposed to other, unknown or unreported, mutagenicagents. This seems highly unlikely, however, because theHPRT cloning assay produced results that would be expectedfor adults who have not been exposed to mutagens.
Another possibility might be the stimulation of T cell rep-lication in some subjects by endogenous factors such asautoimmune disease, infections, or recent immunizations.Such factors might increase the observed frequency ofmutant cells in three ways. First, chronic T cell stimulationcreates a population of proliferating cells that are at greaterrisk for either spontaneous or induced mutation than arequiescent (G0) lymphocytes. Studies of patients with rheu-matoid arthritis have demonstrated a fivefold increase inthe MF in HPRT lymphocytes compared with control sub-jects (Cannons et al 1998). Second, the replication of mutantcells can lead to the formation of a clone of cells derivedfrom a single mutant progenitor. Such sibling clones can bedistinguished from independent mutants by analyzing thespectrum of DNA sequences in T cell receptor genes andthe HPRT gene (Nicklas et al 1986, 1989). Neither of theseseem likely, however, because their effect would be expectedto be at least as pronounced in the cloning assay as in theautoradiographic assay for HPRT mutations. Third, the per-sistence of HPRT variant or mutant lymphocytes is not wellunderstood. In early studies of the mutagenic effects of cyto-toxic drugs and radiation therapy, the HPRT VF rose dra-matically in 14 days and fell to near baseline levels by1 month after exposure (Ammenheuser et al 1988, 1991).
Assays of HPRT Mutations
82
Biomarkers in Czech Workers Exposed to 1,3-Butadiene
The persistence of mutants that are induced by chronic non-cytotoxic exposures is probably longer, but the duration isnot known. If some HPRT mutant lymphocytes persist forperiods as long as 6 to 10 years, as appears to be the casefor Chernobyl (Russia) nuclear power plant workers(Thomas et al 1999), then a more detailed history of pastoccupational exposure and past exposures to other poten-tially mutagenic agents would be needed.
The present study had less than twenty acceptable sam-ples in each exposure group. The presence of a few aberrantvalues could have had a disproportionate effect on theHPRT VF, especially in the control group.
Comparison of the Cloning and Autoradiographic Assays
The measure of HPRT T cell mutations, an importantbiomarker of effect, was assessed by two methods: (1) deter-mining HPRT MF by the cloning assay, and (2) determiningHPRT VF autoradiographically. The results of these twomethods were not correlated with each other. However,neither method showed an effect of BD exposure.
The autoradiographic assay is a short-term assay em-ploying DNA synthesis detected by autoradiography. Itdetects early events in the cell cycle but destroys the cells,which cannot then be used to verify mutational changes.Because of this inability to verify changes, mutant cells areidentified by phenotype and are termed variants. Thenumber of variants in blood is expressed as a VF, which isthe number of variants per million lymphocytes (ECs) inthe assay. VFs are expressed 10�6.
The cloning assay for measuring HPRT mutant T lym-phocytes in blood requires longer-term cell cultures.Mutant cells are recognized as growing colonies, whichprovide material to verify the mutational changes. Mutantcells identified in the cloning assay are termed mutants.The number of mutants in blood is expressed as an MF,which is the number of mutants per million ECs in theassay. MFs also are expressed 10�6.
Although both assays measure the frequencies of PBLswith mutations in the HPRT gene, they may not measurethe same cell populations. Therefore, they may not pro-duce the same numerical result for the same blood sample.A previously conducted direct comparison of VF and MFvalues from the same blood samples also failed to find aone-to-one correlation although, in general, the majority ofvalues that were elevated using one assay were also ele-vated using the other (Albertini et al 1988).
Conclusion
The primary objective of this work was to determinewhether HPRT mutant lymphocytes (identified and assessed
using two common assays, cloning and autoradiography)are useful biomarkers for evaluating low-dose occupa-tional exposure to BD. Both forms of the assay were used todetermine HPRT MFs and VFs in lymphocytes obtainedfrom workers after an extensive assessment of their expo-sure. The BD exposure assessment and the measurementsof Hb adducts and urinary metabolites documented thatadministrative control subjects had the lowest (but mea-surable) BD exposures, workers in the monomer produc-tion unit had been exposed to relatively low levels of BD,and workers in the polymerization unit had been exposedto higher levels of BD. Within the monomer and polymergroups, however, exposure levels spanned large ranges.
Neither form of the HPRT mutant lymphocyte assaydetected a mutagenic effect of exposure in this study. Theresults of the cloning assay were consistent with a previousstudy of workers in the same facility (Tates et al 1996) andwith a study of workers in China (Hayes et al 2000). Theresults of the autoradiographic assay differed from pre-vious studies of workers in the United States in two ways.The control group in this study had unusually high VFscompared with previous studies in Texas, including astudy of BD-exposed workers conducted concurrentlywith this one (Ward et al 2001). Also, although the poly-merization workers as a group had an average HPRT VFthat was somewhat greater than that for the monomer pro-duction workers as a group, we found no correlation forany individual between his VF and his average BD expo-sure. In previous studies (Ward et al 1994, 1996b, 2001;Ammenheuser et al 2001), the autoradiographic assay hasproven to be sensitive and responsive to mean BD expo-sures of about 2 to 7 mg/m3 (1–3 ppm). In the presentstudy, the mean level of BD was only 0.64 mg/m3 in themonomer group and 1.76 mg/m3 in the polymer group(both less than 1 ppm), although individual workers’ meanexposure levels, which were used to identify correlations,spanned a far greater range.
In order to make the HPRT mutant lymphocyte assaysmore effective as biomarker assessment tools, it will benecessary to develop a better understanding of the influ-ences of lifestyle, health, and other exposures on HPRT VFand MF. In addition, the life span of mutant lymphocytesin the peripheral blood must be better characterized inorder to understand the effects of previous exposures tomutagens on HPRT VF and MF. For whatever reason, how-ever, the present study could not demonstrate that BD, atthe exposure levels evaluated, was mutagenic to the exposedworkers.

83
BIOMARKERS OF EFFECT:HPRT MUTATIONAL SPECTRA
Numerous in vitro studies have been performed todetermine the mutational spectra of various chemicalsand other agents. A mutational spectrum is a descriptionof the kinds of mutations produced in a given situation orfollowing a given treatment. Once a spectrum has beendetermined for a particular agent, the signature mutationscan be searched for in animals and humans exposed invivo as confirmation of genetic changes due to exposureto that agent. Signature mutations can confirm exposureeven when the increases in MFs are small. For example,radiation exposure such as radioimmunotherapy causedan increase in HPRT deletions (Nicklas et al 1990),whereas increases in mutations at base pair (bp) 617 wereseen in workers exposed to ethylene oxide (Vrieling et al1992).
Although BD itself is not mutagenic, the BDO andBDO2 derivatives (and BDO-diol to a lesser extent) aremutagenic both in vitro and in vivo in animals (Cochraneand Skopek 1994a; Tates et al 1998; Recio et al 2000;Walker and Meng 2000). Whereas BDO can form cova-lent adducts with DNA at the N7 position of guanine orthe N6 position of adenine, BDO2 can also form intrastrandand interstrand cross links, which means it has the poten-tial to cause strand breaks and deletions (Lawley andBrookes 1967; K Peltonen, personal communication1999).
A number of studies both in vitro and in vivo havebeen performed to determine the spectra of mutationsinduced by BD and its metabolites (summarized in Table28). Most have found increases in A•T→T•A transver-sions for BD in vivo and for BDO or BDO2 in vitro. Somestudies have found increases in G•C→A•T transitions,A•T→G•C transitions, or A•T→C•G transversions aswell. The frequencies of frameshift mutations have beenvariable. BD exposures in vivo (metabolized to BDO2) orBDO2 exposures in vitro appear to increase the frequen-cies of deletion mutations as would be expected for anagent that causes cross links. However, the methodsused to analyze the HPRT mutants could not detect largedeletions.
As presented in the previous section (Biomarkers ofEffect: Assays of HPRT Mutations in Human Lympho-cytes), the BD-exposed workers in the current study (boththe monomer and polymer groups) did not show signifi-cant increases in the frequencies of HPRT mutations. Nev-ertheless, it was important to determine if differences inthe spectra of mutations in the different groups could indi-cate genetic effects from the BD exposure.
METHODS
Expansion of Clones
HPRT mutant isolates from the HPRT cloning assaysreported in the previous section (Biomarkers of Effect:Assays of HPRT Mutations in Human Lymphocytes) weregrown and then frozen for later molecular studies.Mutant clones were randomly selected, meaning that wedid not exclusively select rapidly expanding clones.Among the clones selected, quite a few were very smallfrom the beginning and did not expand substantiallydespite our efforts to provide the best possible growthconditions.
Mutant clones were expanded in the same medium thatwas used to select mutants except that recombinant IL-2was replaced by 10% LAK supernatant (Tates et al 1991b)because, in addition to IL-2, the supernatant containedother growth factors that proved to be better for clonalexpansion than recombinant IL-2 alone. Mutants wereexpanded by transferring the contents of one positive wellto two wells without irradiated feeder cells. When a clonereached a size of approximately 30,000 cells, it was distrib-uted over two wells with irradiated TK6 36X4 lymphoblas-toid feeder cells or, depending on growth characteristics,all 30,000 cells were transferred to one well (2 cm2) of a24-well plate.
Because clones often had widely different growthcharacteristics, the expansion procedure for a particularclone depended largely on its growth. Some clonescould easily be expanded; for others, the expansion wascumbersome or impossible. Expanded clones were usu-ally transferred to four 1.5-mL Eppendorf tubes with 500 �LRPMI 1640 medium and centrifuged at 17,000g for 15 secondsin a fixed-angle Eppendorf centrifuge. The supernatantwas discarded, and the tubes containing the cell pelletwere frozen and stored at �80�C. Approximately 10 to20% of the isolates consisted of not more than 30,000 to50,000 cells, which meant that each tube containedabout 7500 to 12,500 cells; other isolates reached largercell numbers resulting in 30,000 to 50,000 cells pertube.
Up to twelve randomly selected mutants were frozenfrom each subject. Table 29 lists the number of HPRTmutant isolates per subject from the control, monomer,and polymer groups on which analysis was attempted. Formost subjects, we also isolated, expanded, and froze fivewild type clones; these were used, among other things, fordetermining metabolic genotypes (CYP2E1, EH, GSTM1,GSTT1, ADH2, ADH3; also see the section Workers’ Expo-sure Groups, Personal Characteristics, and MetabolicGenotypes / Metabolic Genotypes).
HPRT Mutational Spectra

84
Biomarkers in Czech Workers Exposed to 1,3-Butadiene
Tabl
e 28
.P
revi
ous
HP
RT
an
d l
acI
Mu
tati
on R
esu
lts
Aft
er B
D, B
DO
, or
BD
O2
Exp
osu
rea
BD
BD
O B
DO
2
Mu
tati
onTy
pe
In V
ivo
Mic
eE
xon
3O
nly
b
In V
ivo
Mic
eR
TA
nal
ysis
bIn
Viv
oH
um
ansc
In V
itro
TK
6C
ell
Lin
ed
In V
itro
TK
6C
ell
Lin
ee
In V
itro
lacI
/Rat
2C
ells
e
In V
itro
TK
6C
ell
Lin
ec
In V
itro
TK
6C
ell
Lin
ee
In V
ivo
Mic
eE
xon
3O
nly
b
In V
ivo
Rat
s(C
omp
ared
wit
h B
D)b
Tran
siti
ons
G•C
→Α
•T↓
↓N
CN
CN
D↑
↑ (
non
Cp
G)
ND
↓ ↓
↑↑
↑A
•T→
G•C
NC
↑ ↑
↑N
D↑
↑N
CN
D↓
↑N
C
Tran
sver
sion
sA
•T→
T•A
NC
↓ ↓
↑ ↑
ND
↑ ↑
↑ ↑
ND
↑ ↑
NC
↑A
•T→
C•G
↑ ↑
↑↑
ND
NC
↑ ↑
ND
↓↑
NC
Fra
mes
hif
tsN
C i
n �
1↓
in �
1N
C i
n �
1↑
in �
1↑
↑ in
�1
ND
Not
rep
orte
d↓
in �
1an
d �
1N
DN
ot r
epor
ted
↓ in
�1
↑ in
�1
↓ ↓
in �
1
5� D
elet
ion
s↓
in s
mal
ld
elet
ion
s↑
↑ in
exo
nex
clu
sion
s(m
ay b
ed
elet
ion
s)
↑ in
sm
all
del
etio
ns
NC
↓↓
in
sm
all
del
etio
ns
↑↑
↑↓
in
sm
all
del
etio
ns
↓ in
sm
all
del
etio
ns
3� D
elet
ion
s↓
in s
mal
ld
elet
ion
s↑
↑ in
exo
nex
clu
sion
s(m
ay b
ed
elet
ion
s)
↑ in
sm
all
del
etio
ns
NC
↓ ↓
↓ i
n s
mal
ld
elet
ion
s↑
↓↓
in
sm
all
del
etio
ns
↓ in
sm
all
del
etio
ns
a C
han
ge i
n f
requ
ency
not
ed a
s: ↑
= i
ncr
ease
; ↓ =
dec
reas
e; d
oubl
e ar
row
s eq
ual
lar
ge i
ncr
ease
or
dec
reas
e; N
C =
no
chan
ge; N
D =
not
det
erm
ined
.b
Wal
ker
and
Men
g 20
00.
c M
a et
al
2000
.d C
och
ran
e an
d S
kop
ek 1
994.
e S
teen
et
al 1
997a
,b; R
ecio
et
al 2
000.

85
HPRT Mutational Spectra
Table 29. Summary of HPRT Mutant Isolates fromStudy Subjects
SubjectNumber
HPRTIsolates
PositiveRT-PCRa
Multiplex-PCRb
Administrative Control Subjects (n � 23c)108 9 2 4109 4 1 1114 5 1 2115 12 2 3116 11 5 2118 11 5d 2119 12 1 3120 7 2 2121 11 4 6122 5 2 1123 11 5e 5155 1 1 0156 3 0 2166 4 1 1167 2 0 1168 12 2 7f
169 1 0 1170 3 0 2171 3 0 2f
172 2 1 1182 5 2 2183 4 1 2184 12 2 2
Total 150 40 54 (15 with size change
or loss)Percentage
of isolatesg26.7 36.0
Monomer Production Workers (n � 18c)102 12 2 4103 12 3 7105 12 4 6113 12 4 5124 12 4 3125 12 1 6126 4 0 1127 12 3 5128 6 2 3141 2 0 1142 7 3 1143 10 1 4149 12 0 4150 2 0 0151 4 1 1152 6 5 0157 3 2 1177 2 0 1Total 142 35 53 (20 with
size change or loss)
Percentageof isolatesh
24.7 37.3
(Table continues next column)
Table 29 (Continued). Summary of HPRT Mutant Isolates from Study Subjects
SubjectNumber
HPRTIsolates
PositiveRT-PCRa
Multiplex-PCRb
Polymerization Workers (n � 28c)107 1 0 1111 4 0 1112 1 1 0129 7 3 2130 3 1 1131 12 1 5132 8 0 3f
133 3 0 1134 5 2d 2135 2 0 0137 9 5i 3138 4 1 3139 12 1 7145 8 4j 2j
146 10 3 3154 12 1 5158 7 1 3159 2 2 0160 1 0 0162 5 2i 3164 5 2 2165 2 0 1173 4 0 4174 3 1 0175 1 0 0176 6 1 3179 8 0 2180 4 1 2Total 149 33 59 (10 with
size changeor loss)
Percentageof isolatesk
22.2 39.6
a RT-PCR used for molecular studies of HPRT mRNA.
b Multiple PCRs of genomic DNA used for molecular studies of HPRT DNA.
c For several reasons (described in the text), it proved impossible to expand mutant clones from two administrative control subjects, five monomer production workers, and six polymerization workers. In addition, the monomer group had one less subject because the blood sample was not shipped from Prague to Leiden for analysis.
d Two isolates had the same HPRT mutation by RT-PCR.
e Five isolates had the same HPRT mutation by RT-PCR.
f Two isolates had the same HPRT mutation by multiplex-PCR.
g Of all HPRT mutant isolates from administrative control subjects, 63% [(40 + 54)/150] were analyzed.
h Of all HPRT mutant isolates from monomer production workers, 62%[(35 + 53)/142] were analyzed.
i Three isolates had the same HPRT mutation by RT-PCR.
j Three isolates had the same mutation, two by RT-PCR and one by multiplex-PCR.
k Of all HPRT mutant isolates from polymerization workers, 62%[(33 + 59)/149] were analyzed.

86
Biomarkers in Czech Workers Exposed to 1,3-Butadiene
PCR Amplification and DNA Sequencing
Our usual procedure for synthesizing complementaryDNA (cDNA) from messenger RNA (mRNA) is to resus-pend a dry cell pellet into a lysis buffer. However, the sam-ples in the current study were not completely dry whenquickly frozen, which made lysing the cells for cDNA syn-thesis problematic. To use these cell aliquots, the sampleswere quickly defrosted, the cells centrifuged, the liquidremoved, and the lysis buffer added. During this proce-dure some mRNA (and DNA) may have been lost into thediscarded supernatant; this resulted in failure of the subse-quent RT-PCR or multiplex-PCR of genomic DNA. In addi-tion, some samples contained few cells. For these reasons,some mutant samples could not be analyzed, but the com-plicating factors and sample losses were equally distrib-uted among the exposure groups (see Table 29). In each ofthe three exposure groups, approximately 25% of theHPRT isolates produced a positive RT-PCR and approxi-mately 38% produced a successful multiplex-PCR.
RT-PCR and cDNA sequencing of the HPRT isolates wasbased on the method of Yang and colleagues (1989) withmodifications. To perform the RT step, 18 �L of 5.6 mMMgCl2, 1.1 PerkinElmer Buffer II, 2.78% Nonidet P 40,0.56 mM of each of four dNTPs, 2.78 �M oligo dT (Perkin-Elmer), 1.1 U RNase inhibitor (PerkinElmer), and 2.78 UMuLV (PerkinElmer) were added to the centrifuged cellpellet. This was then maintained at 25�C for 10 minutes, at37�C for 25 minutes, at 99�C for 5 minutes, and then at 4�C.A nested PCR of the room-temperature product then fol-lowed. The first round of PCR consisted of 5 �L of room-temperature product plus 19.875 �L of 1.26 mM MgCl2,1.0 PerkinElmer Buffer II, 0.25 mM of each of fourdNTPs, 0.16 �M primer SJ-A (CGCCC AAAGG GAACTGATAG TCTAT AGGC), and 0.16 �M primer SJ-B (CCTCTGCTCC GCCAC CG). After 5 minutes at 94�C, 0.125 �L ofTaq polymerase (Sigma) was added and the PCR profilewas 94�C for 1 minute, 65�C for 1 minute, and 72�C for2 minutes for 30 cycles, followed by 72�C for 7 minutesand 4�C. For the second round of PCR, 1 �L of first-roundproduct was added to 49 �L of 1.53 mM MgCl2, 1.0 Perkin-Elmer Buffer II, 0.20 mM of each of four dNTPs, 0.13 �Mprimer B (CCTGA GCAGT CAGCC CGCGC), and 0.13 �Mprimer 4b (GCAAA AAGCT CTACT AAGCA GATGGCCACA G). The reaction profile was 94�C for 1 minute, 55�Cfor 1 minute, 72�C for 1 minute for 30 cycles, followed by72�C for 7 minutes and 4�C. The product was run on a 1%agarose gel and the largest band was excised and cleanedwith GENECLEAN (Qbiogene).
The RT-PCR products were sequenced with primer B (anti-sense), which usually produced the sequence of the entireHPRT 657-bp coding region. If the sequence of the entire
coding region was not readable or if a mutation was notfound, then the primer A (sense: CAATA GGACT CCAGATGTTT) was used for sequencing in the opposite direction.
Direct sequencing of PCR products was performed at theVermont Cancer Center DNA Analysis Facility (BurlingtonVT, USA). Briefly, a BigDye terminator cycle sequencingready-reaction kit (Applied Biosystems) was used toamplify the signal for automated sequencing. With this kit,the dyes are attached to the dyedeoxy terminators. Thesequencing premix was diluted 2:1 with 5 sequencingbuffer and 6 �L was used along with �75 ng template DNA,3.2 pmol primer, and brought to a 20-�L volume with water.The reaction mixture underwent one round of 25 cycles at96�C for 30 seconds, a rapid thermal ramp to 50�C and heldfor 15 seconds, and then a rapid thermal ramp to 60�C andheld for 4 minutes. Cycle sequencing extension productswere purified, dried, resuspended in a 5:1 mixture offormamide and ethylenediaminetetraacetic acid (EDTA),loaded on a stretch sequencer (Applied Biosystems 373XL),and analyzed with Sequence Analysis V3.0.
Those mutants that did not result in an RT-PCR productwere then analyzed by multiplex-PCR of genomic DNA.The simultaneous amplification of all nine HPRT exonscan be achieved using eight pairs of oligonucleotides in asingle PCR (Gibbs et al 1990); however, because the DNAmay not have been in perfect condition for the reasonsgiven above, the multiplex mixture was divided into twosets, one consisting of exons 1, 2, 4, and 6 (set 1) and theother containing exons 3, 5, 7/8, and 9 (set 2). The pelletremaining after RT-PCR was lysed using 10 �L 0.05%Tween 20, 0.05% NP40, and 0.1 mg/mL proteinase K, andincubated for 1 hour at 56�C followed by 10 minutes at96�C. A 2-�L portion of the lysis mixture was amplifiedwith primers for either set 1 or set 2 in a total volume of25 �L containing 6.7 mM MgCL2, 16.6 mM ammonium sul-fate [(NH4)2SO4], 5 mM 2-mercaptoethanol, 6.8 �M EDTA,67 mM Tris HCl (pH 8.8 at 25�C), 1.5 mM of each of fourdNTPs, and 10% DMSO. The final primer amounts were10 pmol of each primer for exons 4 and 5; 20 pmol of eachprimer for exons 1, 2, 3, 6, and 9; and 25 pmol of eachprimer for exons 7/8. The reactions were overlaid withmineral oil and heated to 94�C for 5 minutes; 0.4 �L Taqpolymerase (Gibco) was added (hot start) followed by35 cycles of DNA polymerization (68�C for 2 minutes),denaturation (94�C for 30 seconds), and annealing (61�Cfor 50 seconds). The final incubation was 68�C for 7 minutes.Products were run on a 1.4% agarose gel containing ethidiumbromide and photographed on a transilluminator. Theappearance of the exon 7/8 product was variable; therefore,exon 7/8 was not scored in the multiplex analysis. Exonproducts that had shifted from their expected position

87
were cut out and purified by Qiaquick columns (Qiagen) orby GENECLEAN for DNA sequencing. No further analyseswere done on exons that had not shifted.
For mutants that showed loss of one or more exons intheir RT-PCR product, the RT-PCR leftover pellet was alsolysed as above and the genomic DNA was amplified byPCR for the relevant exon or exons, as we had done formultiplex-PCR. This was done to determine if the muta-tion was a deletion or a splice mutation. If the relevantexon or exons were present in genomic DNA, the exonproducts were purified as above and sequenced to deter-mine the mutation.
For some mutants with indeterminate results (eg, pos-sible total deletions), an additional multiplex-PCR was per-formed under the same conditions described above usingexons 1, 4, and 9, and dystrophin as a positive control.
Statistical Analysis
The distributions of different types of mutations in thethree exposure groups were compared by 2 analysis.
RESULTS
Although more than 140 HPRT mutant isolates wereobtained from individuals in each of the three exposuregroups (441 total mutant isolates), information on many ofthose was not obtainable for the technical reasons given inthe earlier section Biomarkers of Effect: HPRT MutationalSpectra / Methods / Expansion of Clones. Analyses byRT-PCR and sequencing were attempted for all isolates,but a cDNA product was amplified and sequenced for only108 (24% of the total).
RT-PCR provides a cDNA to analyze the genetic alter-ation at the mRNA level, which is usually sufficient toinfer the alteration at the DNA level. The exceptions are(1) when no cDNA is produced because of a genomic re-arrangement or promoter mutation or (2) when there areexclusions of one or more exons in the cDNA where anumber of alterations in genomic DNA could be the basisof the change. PCR of the relevant genomic regions in theselatter mutants was then done for sequence analysis todefine the cause of the exclusion. Multiplex-PCR analysiswas used to amplify the genomic DNA of all remainingmutant isolates (333) that had not yielded an RT-PCRproduct; this was successful for 166 of the 333 remainingisolates. However, sequence analyses were done only forthose exonic regions that showed an alteration in size fromwild type. Only 45 of the 166 (27%) mutant isolatesshowed multiplex-PCR products with size changes orlosses. The remaining 121 that showed no changes at this
level of study were almost certainly base-substitutionmutations that were not detected in cDNA because noproduct had been formed. Analyzing all nine exons for thismany isolates (121) was not justifiable. Therefore, theseisolates were included in calculations of the frequencies ofdeletions but not of the frequencies of point mutations(these mutants are listed as “no change” in Table 31).
Table 30 lists the results of the RT-PCR analyses. In thistable, mutant isolates from the same individual thatshowed the same molecular change (eg, the same base sub-stitution at the same position) were considered to be “sib-ling” mutants and were entered only once. Sibling mutantsare simply replicates of the same in vivo mutational eventthat arose by in vivo clonal amplification. By 2 analysis,we found no significant differences in the distributions ofthe kinds of mutations among the control, monomer, andpolymer groups. Specifically, the monomer and polymergroups did not show the signature A•T→T•A transver-sions in a larger percentage than that found in the controlgroup; in fact, the most heavily exposed polymer groupshowed none. Similarly, we found no significant increasesin the percentages of A•T→G•C or G•C→A•T transitionsin either of the exposed groups compared with the controlgroup. The percentages of total transitions in the monomerand polymer groups were greater than the percentages oftotal transversions in the same groups; whereas in the con-trol group, the reverse was seen (total transversions weregreater than total transitions). However, transitions in thecontrol group were lower than we expected on the basis ofour laboratory’s historical control groups and a summaryof the background HPRT mutational spectra in normalindividuals (Curry et al 1999), where transitions and trans-versions were found to be equal.
The monomer group had a greater percentage of frame-shift mutations than did either of the other groups; that is,11% versus 2.9% in the control group and none in thepolymer group. All of the frameshift mutations were �1,which is the loss of a single base pair. The monomer andpolymer groups had higher percentages of deletions (smalland large deletions plus small deletions/insertions) thanthe control group, that is, 25.5% and 24.7% vs 22.4%,respectively. None of these differences among groups,however, was statistically significant.
The results of the multiplex-PCR analyses of genomicDNA for the mutant isolates that did not yield an RT-PCRproduct are given in Table 31. Of the mutant isolates ana-lyzed, 121 yielded multiplex-PCR products with no sizechange compared with wild type and were not analyzedfurther. As stated before, all of these would probably haveshown single base substitutions if they had been sequenced.Assuming this to be true, the monomer group had a higher
HPRT Mutational Spectra

88
Biomarkers in Czech Workers Exposed to 1,3-Butadiene
Table 31. Multiplex-PCR Mutation Analysis Resultsa
Controln (%)
Monomern (%)
Polymern (%)
Clones analyzed 54 53 59
Total independent mutations 52 (100) 53 (100) 58 (100)
Mutation typeTotal-gene deletions (exons 1−9) 3 (5.8)b 5 (9.4) 2 (3.4)b
Large deletions ( 1 exon but � 9 exons) 7 (13.5)b 11 (20.8) 5 (8.6)Small deletions (� 50 bp) 3 (5.8) 4 (7.5) 2 (3.4)No change 39 (75.0) 33 (62.3) 49 (84.5)
a Values in parentheses are percentages of the Total independent mutations (given in the second row of the table).b Pair of sibling mutations; only one is listed for the pair.
Table 30. RT-PCR Mutation Analysis Resultsa
Control Monomer Polymer
n (%)b n (%)c n (%)b n (%)c n (%)b n (%)c
Isolates analyzed 40 35 33
Total independent mutations 35 (100) 35 (100) 28 (100)
Mutation typeTransitionsd 8 (22.9) 11 (31.4) 8 (28.6)
G• C→A• T 4 (50.0)d 7 (63.6) 5 (62.5)A• T→G• C 4 (50.0) 4 (36.4) 3 (37.5)
Transversionsd 14(40.0) 9 (25.7) 7 (25.0)G• C→C• G 6 (42.9) 3 (33.0)e 1 (14.3)G• C→T• A 1 (7.1) 2 (22.2) 2 (28.6)d
A• T→T• A 4 (28.6) 3 (33.0) 0 (0)A• T→C• G 3 (21.4)d 1 (11.1) 4 (57.1)d
Small deletionsf 4 (11.4) 3 (8.6) 4 (14.3)g
Small deletions and insertions 2 (5.7) 1 (2.9) 1 (3.6)Small insertions 0 (0) 0 (0) 1 (3.6)Large deletionsh 2 (5.7) 5 (14.3) 2 (7.1)
Frameshifts 1 (2.9) 4 (11.4) 0 (0)Single-exon or multiple-exon exclusions in
cDNA but no genomic deletion3 (8.6) 1 (2.9) 1 (3.6)
No mutation found 1 (2.9) 1 (2.9) 4 (14.3)
a Exon deletions were confirmed by multiplex-PCR analysis of genomic DNA when necessary to differentiate from exon exclusions due to splicing errors.b Values in parentheses are percentages of the Total independent mutations (given in the second row of the table).c For categories of transitions and transversions, the percentages of Transitions or Transversions are shown in parentheses. The category values are offset to
the right of the main column so they are not added twice into the Total independent mutations.d Sibling mutations; only one is listed for each set.e One mutation was at a CpG site.f Small deletions involve loss of 50 bp or loss of genomic DNA and do not include an entire exon.g Two pairs of sibling mutations; only one is listed for each pair.h Large deletions involve loss of one or more exons due to loss of genomic DNA.

89
percentage of any kind of deletion mutation (20/53 � 38%)than did the control group (13/52 � 25%) or the polymergroup (9/58 � 16%) by this analysis. The most heavilyexposed polymer group had the lowest percentage of dele-tion mutations. None of the differences among groups shownin Table 31 was statistically significant.
The specific base-substitution mutations seen in thisstudy are given in Table 32. Several have not been previ-ously reported; these include: in the control group, the27G→C, 49T→G, 76A→G, and IVS4–1G→A mutations; inthe monomer group, the 624T→C mutation; and in thepolymer group, the 233T→G and 409A→G mutations.Some base-substitution mutations were seen several timesin different individuals:
• 197G→A was seen three times in the monomer groupand once in the polymer group; it is a known HPRT“warm spot,” that is, a site where mutations occursomewhat more frequently than the average.
• The 496A→G mutation was seen once in the mono-mer group and once in the polymer group.
• Mutations at position 602 were seen three times(A→G in a monomer production worker, and A→T ina monomer production worker and in an administra-tive control subject); although mutations have beenpreviously observed at this site, it is not a knownmutational warm spot.
• The 551C→G mutation (in both the control andmonomer groups) is a known mutational warm spot.
• One mutation was seen at position 568 (G→A in onepolymerization worker).
• Five mutations were also seen at position 611 (anA→T in one administrative control subject; and anA→G in one administrative control subject, twomonomer production workers, and one polymeriza-tion worker); position 611 is a warm spot for A→Gmutations.
HPRT Mutational Spectra
Table 32. Point Mutations from RT-PCR Analysis
Mutant Name MutationaExon
AffectedDNA Sequence
Contextb Result in mRNA
Administrative Control Subjects118-3 1A→T 1 gtt ATG GCG No ATG START114-2 27G→C 1 GTC GTG gtg Inclusion of IVS1�1 to IVS1�49155-1 49T→G 2 GGT TAT GAC Tyr17→Asp168-12 76A→G 2 CCT AAT CAT Asn26→Asp184-11 135G→C 3 tgt agG ACT Arg45→Ser
116-8 208G→C 3 AAG GGG GGC Gly70→Arg122-2 236T→C 3 CTG CTG GAT Leu79→Pro119-12 419G→A 6 ACT GGC AAA Gly140→Asp118-8, -9 494T→G 7 CTG GTG AAA Val165→Gly116-3 494T→G 7 CTG GTG AAA Val165→Gly120-4 529G→T 7 CCA GAC Tgt Asp177→Tyr
116-4 533T→C 8 tta gTT GTT Phe178→Ser168-7 551C→G 8 ATT CCA GAC Pro184→Arg115-12 595T→A 8 TAC TTC AGG Phe199→Ile183-2 602A→T 8 AGG GAT TTG Asp201→Val115-11 610C→G 9 tag CAT GTT His204→Asp
172-2 611A→T 9 tag CAT GTT His204→Leu121-7 611A→G 9 tag CAT GTT His204→Arg121-4 IVS3–1 g→c 3 aac tag AAT Loss of exon 4116-9 IVS4�1 g→a 4 AAG gta tgt Loss of exon 4123-1, -2, -4, -7, -10 IVS4–1 g→a 5 ttc tag AAT Loss of exon 5121-8 IVS8�5 g→a 8 gta agt aat Loss of exon 8
(Table continues next page)
a IVS (intervening sequence) � intron; eg, IVS4�1 is intron 4, 1st base from the 5� end (beginning), and IVS3–1 is intron 3, 1st base from the 3� end (end).b Uppercase letters are exon sequences; lowercase letters are intron sequences.
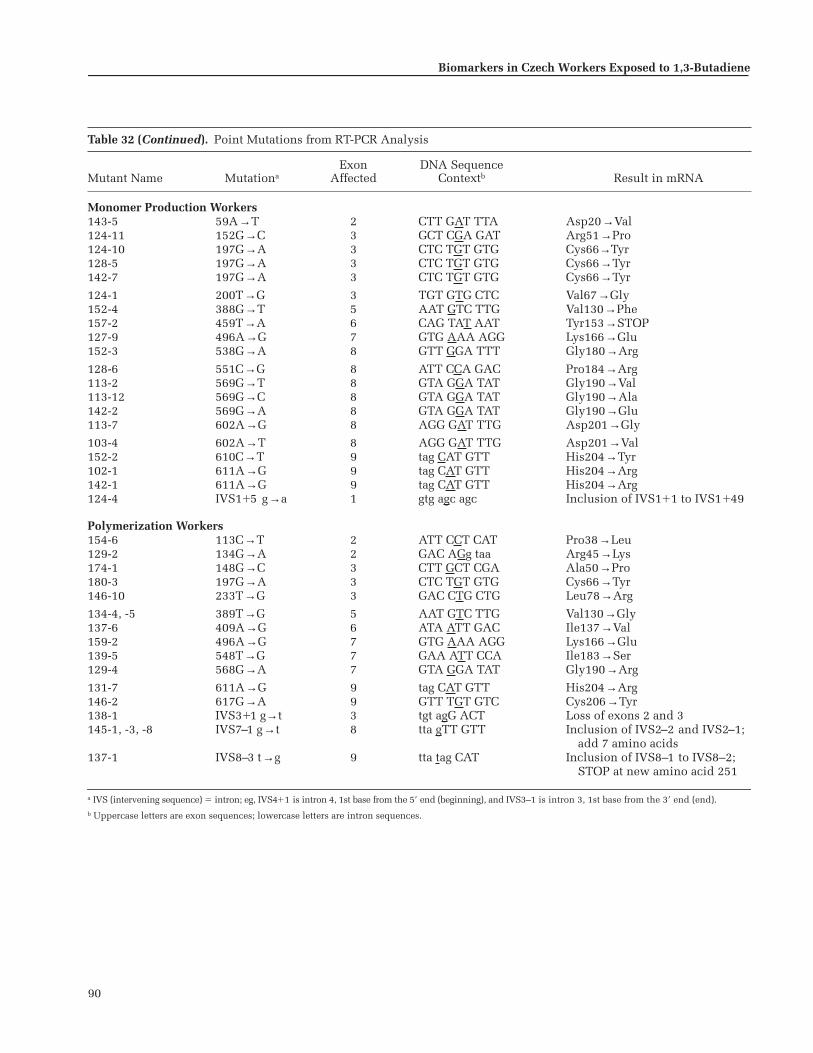
90
Biomarkers in Czech Workers Exposed to 1,3-Butadiene
Table 32 (Continued). Point Mutations from RT-PCR Analysis
Mutant Name MutationaExon
AffectedDNA Sequence
Contextb Result in mRNA
Monomer Production Workers143-5 59A→T 2 CTT GAT TTA Asp20→Val124-11 152G→C 3 GCT CGA GAT Arg51→Pro124-10 197G→A 3 CTC TGT GTG Cys66→Tyr128-5 197G→A 3 CTC TGT GTG Cys66→Tyr142-7 197G→A 3 CTC TGT GTG Cys66→Tyr
124-1 200T→G 3 TGT GTG CTC Val67→Gly152-4 388G→T 5 AAT GTC TTG Val130→Phe157-2 459T→A 6 CAG TAT AAT Tyr153→STOP127-9 496A→G 7 GTG AAA AGG Lys166→Glu152-3 538G→A 8 GTT GGA TTT Gly180→Arg
128-6 551C→G 8 ATT CCA GAC Pro184→Arg113-2 569G→T 8 GTA GGA TAT Gly190→Val113-12 569G→C 8 GTA GGA TAT Gly190→Ala142-2 569G→A 8 GTA GGA TAT Gly190→Glu113-7 602A→G 8 AGG GAT TTG Asp201→Gly
103-4 602A→T 8 AGG GAT TTG Asp201→Val152-2 610C→T 9 tag CAT GTT His204→Tyr102-1 611A→G 9 tag CAT GTT His204→Arg142-1 611A→G 9 tag CAT GTT His204→Arg124-4 IVS1�5 g→a 1 gtg agc agc Inclusion of IVS1�1 to IVS1�49
Polymerization Workers154-6 113C→T 2 ATT CCT CAT Pro38→Leu129-2 134G→A 2 GAC AGg taa Arg45→Lys174-1 148G→C 3 CTT GCT CGA Ala50→Pro180-3 197G→A 3 CTC TGT GTG Cys66→Tyr146-10 233T→G 3 GAC CTG CTG Leu78→Arg
134-4, -5 389T→G 5 AAT GTC TTG Val130→Gly137-6 409A→G 6 ATA ATT GAC Ile137→Val159-2 496A→G 7 GTG AAA AGG Lys166→Glu139-5 548T→G 7 GAA ATT CCA Ile183→Ser129-4 568G→A 7 GTA GGA TAT Gly190→Arg
131-7 611A→G 9 tag CAT GTT His204→Arg146-2 617G→A 9 GTT TGT GTC Cys206→Tyr138-1 IVS3�1 g→t 3 tgt agG ACT Loss of exons 2 and 3145-1, -3, -8 IVS7–1 g→t 8 tta gTT GTT Inclusion of IVS2–2 and IVS2–1;
add 7 amino acids137-1 IVS8–3 t→g 9 tta tag CAT Inclusion of IVS8–1 to IVS8–2;
STOP at new amino acid 251
a IVS (intervening sequence) � intron; eg, IVS4�1 is intron 4, 1st base from the 5� end (beginning), and IVS3–1 is intron 3, 1st base from the 3� end (end).b Uppercase letters are exon sequences; lowercase letters are intron sequences.

91
HPRT Mutational Spectra
Table 33. Frameshift Mutations from RT-PCR Analysis
Mutant Name MutationaExon
AffectedDNA Sequence
Contextb Result in mRNA
Administrative Control Subjects122-4 555 del C 8 CCA GAC AAG TAG at codon 189
Monomer Production Workers152-6 49 del T 2 CCA GGT TAT TAA at codon 41127-3 100 del A 2 TTG GAA AGG TAA at codon 41105-2 597 del C 8 TAC TTC AGG TGA at codon 202113-6 IVS4�1 del g 4 AAG gta tgt Exclusion of exon 4
a IVS (intervening sequence) � intron; eg, IVS4�1 is intron 4, 1st base from the 5� end (beginning), and IVS3–1 is intron 3, 1st base from the 3� end (end).b Uppercase letters are exon sequences; lowercase letters are intron sequences.
• Three mutations were seen at position 569 in themonomer group (G→T, G→A, G→C); mutations havepreviously been observed here, but it is not consid-ered a warm spot.
• Two mutations were seen at position 610 (C→G in anadministrative control subject and C→T in a mono-mer production worker); a number of mutations havepreviously been observed at this site.
• Mutations at sites known as warm spots but seen onlyonce or not at all in this analysis include: 3G→A,143T→G or A, 146T→C or G, 151C→T, 508C→T (aCpG site), 568G→T or C or A, and 617G→A (seen inone polymerization worker).
In terms of sequence context, the G→A mutations in thecontrol group occurred in the sequence context of A(orT)G(or A)GNA (where N designates any base), whereas theG→A mutations in the monomer and polymer groupsarose mostly in the C(or T)TGG(or T)N sequence context.A→T mutations arose mostly in a consensus sequence ofG(or T)G(or T)ATT.
Table 33 shows the five frameshift mutations found inthis study. All were one-base deletions. Two of the fiveframeshifts were not in sequence runs of a single nucle-otide and none were in the common “hot spot” (a site ofvery frequent mutations), that is, the sequence of six Gs inexon 3. Frameshift mutations have been reported at two ofthe sites found in this study (ie, those in exons 4 and 8);however, the previously reported occurrences were �1frameshift rather than the �1 frameshift mutations seenhere.
Table 34 lists all the small deletions, deletion/inser-tions, and insertion mutations observed by either RT-PCRor multiplex-PCR analyses. Small deletions and insertions
are arbitrarily defined by the investigator; here, the termsare used to mean gains or losses of bases in genomic DNAthat are not large enough to include entire exons, eventhough exons may be excluded from cDNA due to changesin splicing caused by the genomic loss or gain. None of themutations we found has been reported previously. In Table34, those mutations with the mutant name shown in bold-face, italic, large type were discovered by multiplex-PCRanalyses of genomic DNA; those in normal type were dis-covered during RT-PCR analyses of cDNA. One point ofinterest is that many of these small deletions/insertionswere ascertained as small gel shifts of multiplex-PCR prod-ucts, which in our experience is an unusual occurrence.Four of the nine mutations in administrative control sub-jects, three of the eight mutations in monomer productionworkers, and four of the six mutations in polymerizationworkers have one or more repeated bases at the break-points (underlined in the DNA Sequence Context columnof Table 34).
Table 35 lists the large deletions seen in this study. Largedeletions are those mutations that show genomic DNAlosses of sufficient size to delete one or more exons.Although more large deletions were seen in the monomergroup than in the other two exposure groups, they werenot of any specific type and the differences in percentagesbetween exposure groups were not significant.
Table 36 lists the undefined mutations. Some show thatone or more exons were excluded in cDNA but noapparent deletions in the genomic PCR product. Othersshowed wild type sequence in the RT-PCR product but nofurther analyses were done. The reasons for the exonexclusion mutations shown here are unknown but may bedue to an inversion or a point mutation (possibly a STOPmutation) in one of the excluded exons.

92
Biomarkers in Czech Workers Exposed to 1,3-Butadiene
Tabl
e 34
.S
mal
l D
elet
ion
s, D
elet
ion
s an
d I
nse
rtio
ns,
an
d I
nse
rtio
ns
from
RT-
PC
R a
nd
Mu
ltip
lex-
PC
R A
nal
yses
Mu
tan
t N
amea
Mu
tati
onE
xon
Aff
ecte
d
DN
A S
equ
ence
Con
text
(Del
eted
) [I
nse
rted
]bR
esu
lt i
n c
DN
Ac
Ad
min
istr
ativ
e C
ontr
ol S
ubj
ects
183-
3D
el 3
7 to
78
2A
GT
GA
T (
GA
T G
AA
... .
.. C
CT
AA
T)
CA
T T
AT
Del
42
bp; l
oss
of 1
4 am
ino
acid
s10
8-4
Del
85
to 1
142
CA
T T
AT
(G
CT
GA
G ..
. ...
AT
T C
CT
) C
AT
GG
AD
el 3
0 bp
; los
s of
10
amin
o ac
ids
108-
1D
el I
VS
1–20
to
IVS
1–4;
ins
aagc
tg2
ttga
aa(c
ag c
ta ..
. ...
ctt
ttt)
[aa
gctg
] ca
g A
TT
Del
17
bp; i
ns
6 bp
; exc
lusi
onof
exo
n 2
108-
7D
el I
VS
1–11
to
IVS
1–30
2gc
tata
t (t
tt c
tt ..
. ...
cag
AT
T)
AG
T G
AT
Exc
lusi
on o
f ex
on 2
118-
1D
el 1
63 t
o 16
53
GT
G A
TG
(A
AG
) G
AG
AT
GD
el 3
bp
; del
Lys
55 c
odon
168-
4D
el I
VS
4–16
to
IVS
5�42
; in
s a
5tt
c at
t (t
ct c
tt ..
. ...
ctt
ttc)
[a]
taa
ctt
Del
76
bp; i
ns
1 bp
11
8-4
Del
IV
S7�
5 t
o IV
S7�
11; i
ns
at7
GA
C T
gt a
a(g
tgaa
tt)
[at]
act
ttt
Del
7 b
p; i
ns
2 bp
; exc
lusi
on o
f ex
on 7
182-
1D
el 5
52 t
o 58
98
AT
T C
C(A
GA
C A
AG
... .
.. A
AT
G)A
A T
AC
TT
CD
el 3
8 bp
; TA
G a
t n
ew c
odon
197
109-
3D
el I
VS
7–20
to
IVS
7–13
8aa
atga
(tg
a at
t at
)g a
tt c
ttD
el 8
bp
; exc
lusi
on o
f ex
on 8
Mon
omer
Pro
du
ctio
n W
ork
ers
105-
3D
el 4
to
141
gtt
AT
G (
GC
G A
CC
CG
C A
G)C
CC
T
Del
11
bp; l
oss
of 3
am
ino
acid
s; T
AG
at n
ew c
odon
715
2-5
Del
69
to 9
62
TT
T T
G(C
AT
A C
CT
... .
.. G
AT
TT
G)
GA
A A
GG
Del
28
bp; l
oss
of 9
am
ino
acid
s; T
AA
at n
ew c
odon
32
105-
12D
el 1
83 t
o 18
53
GG
C C
AT
CA
(C A
T)t
gta
gcc
D
el 3
bp
; del
Ile
62 c
odon
113-
9D
el 2
18 t
o 29
93
GG
C T
AT
A(A
A T
TC
... .
.. T
TT
AT
)C A
GA
CT
GD
el 8
2 bp
; los
s of
27
amin
o ac
ids;
TG
Aat
new
cod
on 7
5
105-
1D
el I
VS
2–39
to
IVS
2–15
43
taa
tgt
(atg
aaa
... .
.. C
GA
G)A
T G
TG
Del
59
bp; u
nkn
own
128-
3D
el 4
02 t
o IV
S5�
295
GT
G G
A(A
gta
agt
... .
.. at
a ac
a)tt
t at
gaD
el 3
0 bp
; un
know
n12
7-6
Del
436
to
469;
in
s G
6C
AG
AC
T (
TT
G C
TT
... .
.. C
CA
AA
G A
)[G
] T
G G
TC
D
el 3
4 bp
; in
s 1
bp; l
oss
of11
am
ino
acid
s10
2-2
Del
458
to
IVS
6�14
; in
s a
6A
GG
CA
G T
A(T
... .
.. ga
c at
t) [
a] t
tg a
caD
el 4
4 bp
; un
know
n
Pol
ymer
izat
ion
Wor
ker
sd
137-
2, -3
, -9
Del
51
to 7
62
CC
A G
GT
TA
(T G
AC
... .
.. A
TA
CC
T A
)AT
CA
TD
el 2
6 bp
; im
med
iate
TA
A a
t cod
on 1
716
2-1,
-2, -
4D
el I
VS
1–1
to I
VS
1–50
2tt
t ca
(g A
TT
AG
T ..
. ...
GG
T T
A)T
GA
C C
TT
Del
24
bp; e
xclu
sion
of
exon
213
0-1
Del
431
to
478;
in
s C
GA
CT
T6
AC
A A
TG
C(A
G A
CT
... .
.. A
AG
G)[
CG
AC
TT
]TC
GC
AD
el 4
8 bp
; Gln
144
→P
ro c
odon
;L
eu14
6→
Ph
e co
don
; los
s of
14 a
min
o ac
ids
164-
4D
el I
VS
6–15
to
IVS
6–2
7tc
a ca
(t t
tt g
ta a
tt a
ac a
)gC
TT
G C
TG
D
el 1
4 bp
; exc
lusi
on o
f ex
on 7
158-
5D
el I
VS
8�5
to I
VS
8�8
8A
AT
gta
a(g
t aa
)t t
gc t
tc
Del
4 b
p; e
xclu
sion
of
exon
814
5-7
IVS
7–1
to I
VS
7�2;
in
s tt
t8
ttta
[ttt
] gT
T G
TT
GG
A
Exc
lusi
on o
f ex
on 8
a M
uta
nt
nam
es i
n b
old
, ita
lic,
lar
ge t
ype,
are
fro
m m
ult
iple
x-P
CR
an
alys
es; t
hos
e in
nor
mal
typ
e ar
e fr
om R
T-P
CR
an
alys
es.
b R
epea
ted
bas
es a
t th
e br
eakp
oin
ts a
re u
nd
erli
ned
. Up
per
case
let
ters
are
exo
n s
equ
ence
s; l
ower
case
let
ters
are
in
tron
seq
uen
ces.
c E
xclu
sion
� l
oss
of i
nd
icat
ed e
xon
fro
m c
DN
A p
rod
uct
; TA
G a
nd
TA
A a
re S
TO
P c
odon
s.d S
ix d
elet
ions
or
dele
tion
s an
d in
sert
ions
wer
e ob
serv
ed fo
r th
e po
lym
eriz
atio
n w
orke
rs. T
wo
of th
ese
incl
uded
rep
lica
te s
ibli
ng m
utan
ts (t
ripl
icat
es),
two
of w
hich
wer
e ch
arac
teri
zed
by R
T-PC
R a
naly
sis
(Tab
le 3
0) a
nd th
e ot
her
sing
le m
utan
t by
mul
tipl
ex-P
CR
ana
lysi
s (T
able
31)
.

93
Table 37 summarizes the results of RT-PCR and multi-plex-PCR analyses combined, both without and with par-tial correction for clonality. Clonality produces multiplemutant isolates showing the same mutational change thatrepresents only a single mutational event. For example,individual 118 (an administrative control subject) showedtwo mutant isolates with the same mutation (494T→G)and individual 123 (also an administrative control subject)showed five mutant isolates with the same mutation,IVS4–1G→A (Table 32). Three individuals from thepolymer group (subjects 145, 137, and 162) each showedthree mutant isolates with the same mutational change;that is, IVS7–1G→T, del 51 to 76, and del IVS1–1 to IVS1–50,respectively (Table 32 for point mutations and Table 34 fordeletions). Several additional mutants were pairs. Table 37shows that the monomer group had a greater proportion oflarge deletions than the other groups, but this differencewas not statistically significant and the rest of the distribu-tion was similar among the groups.
DISCUSSION
We did not find an increase in A•T→T•A transversionsamong the HPRT mutations in BD-exposed workers. Thiswas the specific mutational change observed in a numberof other studies, both in vitro and in vivo (Ma et al 2000;Recio et al 2000). Of particular note, Ma and associates(2000) reported a study of BD-exposed individuals inwhich they found an increase in A•T→T•A transversions
HPRT Mutational Spectra
Table 35. Large Deletions from RT-PCR andMultiplex-PCR Analyses
Mutant Namea Mutation
Administrative Control Subjects171-1, -3 Del exons 1 to 9109-2 Del exons 1 to 9168-10 Del exons 1 to 9115-9 Del exon 1
156-1 Del exon 4121-5 Del exon 5168-5, -8 Del exon 5166-4 Del exon 4b
170-1 Del exons 2 to 9167-2 Del exons 5 to 9108-9 Del exons 6 to 9108-6 Del exon 9
Monomer Production Workers177-3 Del exons 1 to 9105-9 Del exons 1 to 9103-1 Del exons 1 to 9149-4 Del exons 1 to 9
102-6 Del exons 1 to 9124-7 Del exon 1149-8 Del exons 1 to 3, 5 to 9103-11 Del exon 3125-11 Del exon 4
105-10 Del exon 4127-11 Del exon 5113-8 Del exon 6151-4 Del exons 2 to 3
105-8 Del exons 2 to 3102-11 Del exons 2 to 3125-6 Del exons 2 to 5125-1 Del exons 4 to 5
125-10 Del exons 4 to 9105-5 Del exons 4 to 9127-8 Del exons 5 to 9149-2 Del exons 7 to 9
Polymerization Workers132-3, -4 Del exons 1 to 9173-3 Del exons 1 to 9146-2 Del exon 1129-3 Del exon 2164-5 Del exon 4
111-2 Del exon 4154-4 Del exon 4131-9 Del exons 2 to 6176-3 Del exons 4 to 9
a Mutant names in bold, italic, large type are from the multiplex-PCR analyses; those in normal type are from RT-PCR analyses.
b This mutation had a very unusual cDNA. Exon 1 was followed by bases 28 to 46 of exon 2, then intron 6 bases 31685 to 31701, then exons 6 to 9. Apparently, splicing occurred at a cryptic donor site in exon 2 to a cryptic “new” exon 5, which then spliced to exon 6. Multiplex-PCR analysis showed that exons 2, 3, and 5 were present; it is unknown why they were not spliced in correctly.
Table 36. Undefined Mutations
Mutant Name Mutationa
Administrative Control Subjects116-5 Wild type; identified by RT-PCR184-12 Exclusion of exons 2 to 3; wild type, genomic120-7 Exclusion of exons 2 to 8; wild type, genomic182-3 Exclusion of exons 4 to 8; wild type, genomic
Monomer Production Workers103-10 Wild type; identified by RT-PCR157-3 Exclusion of exon 8; wild type, genomic
Polymerization Workers137-8 Wild type; identified by RT-PCR112-1 Wild type; identified by RT-PCR159-1 Wild type; identified by RT-PCR146-9 Wild type; identified by RT-PCR176-6 Exclusion of exons 2 to 6; wild type, genomic
a Wild type indicates no change from normal sequence; exclusion indicates exons excluded from cDNA product.

94
Biomarkers in Czech Workers Exposed to 1,3-Butadiene
compared with the control group (University employees)(16% exposed group vs 8% control group). However,Walker and Meng (2000) found a decrease in HPRTA•T→T•A transversion mutations in mice exposed to BDin vivo. Our study did find a small but nonsignificantincrease in G•C→A•T transition mutations in both themonomer and polymer groups. This increase has beenreported in other BD studies (Recio et al 2000; Walker andMeng 2000), but the study by Ma and associates (2000)found no change in G•C→A•T transitions. A•T→G•Ctransition increases have also been observed in otherstudies (Ma et al 2000; Recio et al 2000).
BDO2 is expected to induce deletion mutations becauseof its ability to form intrastrand and interstrand crosslinks. Although the monomer group in the current studydid have an increased frequency of deletions as has been
shown in other studies (Ma et al 2000; Recio et al 2000;Walker and Meng 2000), we did not observe an increase inthe more highly exposed polymer group. The Ma and asso-ciates (2000) study found an increase of mutant isolateswith total gene deletions (17.5% exposed group vs 9.7%control group) and isolates with multiple exon deletions(13.3% exposed group vs 6.5% control group). In addition,several of the deletion mutations observed in our studyshowed deletion breakpoints at sequences with one ormore repeated bases. Such deletions are hypothesized tooccur spontaneously due to slippage or homologous joining.For example, mutant 158-5 in a polymerization workershows deletion of one gtaa in a gtaagtaa repeat (lowercaseletters indicate intron sequences; uppercase letters indi-cate exon sequences); and mutant 152-5 in a monomer pro-duction worker shows a TTTG repeat both at the 5� break-
Table 37. Summary of RT-PCR and Multiplex-PCR Results
Control Monomer Polymer
Mutation Type n (%)a n (%)b n (%)a n (%)b n (%)a n (%)b
No Correction for Clonal ExpansionTotal isolates and clones analyzed 94 (100) 88 (100) 92 (100)
Point mutations 67 (71.3) 57 (64.8) 67 (72.8)RT-PCR 28 (41.8) 24 (42.1) 18 (26.9)No changes on multiplexc 39 (52.2) 33 (57.9) 49 (73.1)
Small deletions 6 (6.4) 6 (6.8) 8 (8.7)Small deletions and insertions 3 (3.2) 2 (2.3) 1 (1.1)Small insertions 0 (0) 0 (0) 1 (1.1)
Total-gene deletions 4 (4.3) 6 (6.8) 3 (3.3)Large 5� deletions 1 (1.1) 1 (1.1) 1 (1.1)Large 3� deletions 4 (4.3) 4 (4.5) 1 (1.1)Large internal deletions 5 (5.3) 10 (11.4) 5 (5.4)Undefined or no change on RT-PCR 4 (4.3) 2 (2.3) 5 (5.4)
Partial Correction for Clonal ExpansionTotal isolates and clones analyzed 87 (100) 88 (100) 84 (100)
Point mutations 62 (71.3) 57 (64.8) 64 (76.2)RT-PCR 23 (37.0) 24 (42.1) 15 (23.4)No changes on multiplexc 39 (62.9) 33 (57.9) 48 (75.0)
Small deletions 6 (6.9) 6 (6.8) 4 (4.8)Small deletions and insertions 3 (3.4) 2 (2.3) 1 (1.2)Small insertions 0 (0) 0 (0) 1 (1.2)
Total-gene deletions 3 (3.4) 6 (6.8) 2 (2.4)Large 5� deletions 1 (1.1) 1 (1.1) 1 (1.2)Large 3� deletions 4 (4.6) 4 (4.5) 1 (1.2)Large internal deletions 4 (4.6) 10 (11.4) 5 (6.0)Undefined or no change on RT-PCR 4 (4.6) 2 (2.3) 5 (6.0)
a Values in parentheses are percentages of the Total isolates and clones analyzed.b Values in parentheses are percentages of the Point mutations. The category values are offset to the right of the main column so they are not added twice
into the Total isolates and clones analyzed.c Presumed point mutations.
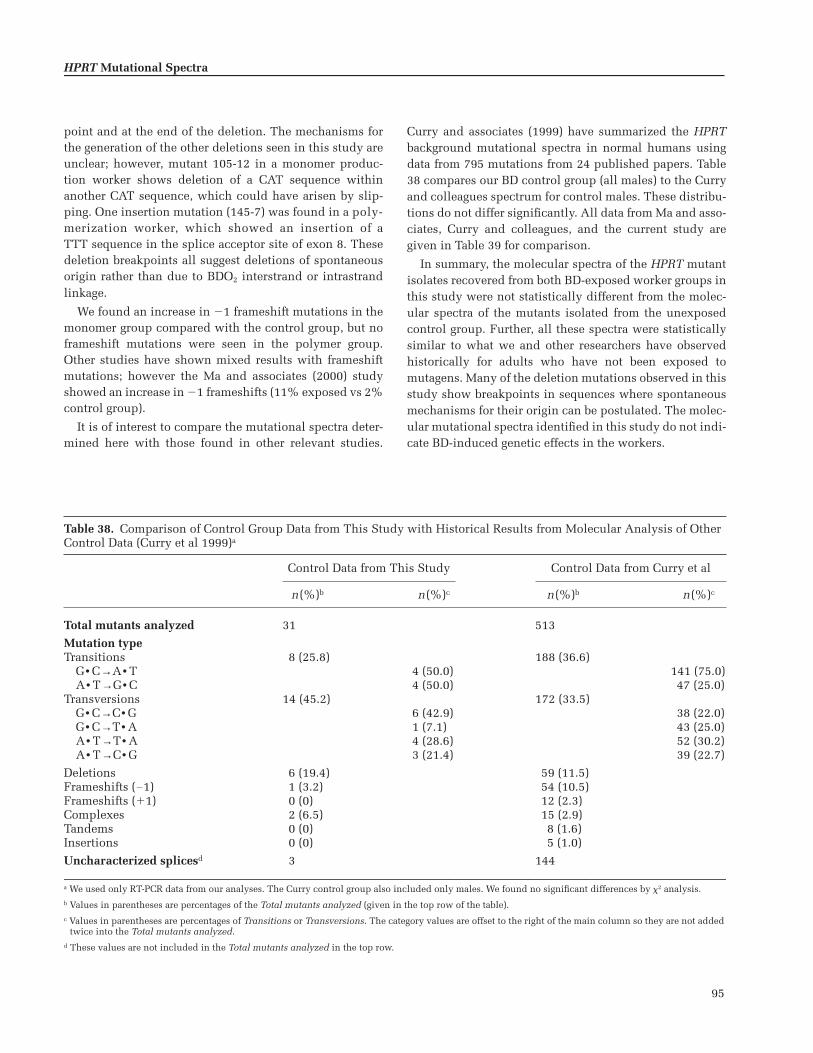
95
point and at the end of the deletion. The mechanisms forthe generation of the other deletions seen in this study areunclear; however, mutant 105-12 in a monomer produc-tion worker shows deletion of a CAT sequence withinanother CAT sequence, which could have arisen by slip-ping. One insertion mutation (145-7) was found in a poly-merization worker, which showed an insertion of aTTT sequence in the splice acceptor site of exon 8. Thesedeletion breakpoints all suggest deletions of spontaneousorigin rather than due to BDO2 interstrand or intrastrandlinkage.
We found an increase in �1 frameshift mutations in themonomer group compared with the control group, but noframeshift mutations were seen in the polymer group.Other studies have shown mixed results with frameshiftmutations; however the Ma and associates (2000) studyshowed an increase in �1 frameshifts (11% exposed vs 2%control group).
It is of interest to compare the mutational spectra deter-mined here with those found in other relevant studies.
Curry and associates (1999) have summarized the HPRTbackground mutational spectra in normal humans usingdata from 795 mutations from 24 published papers. Table38 compares our BD control group (all males) to the Curryand colleagues spectrum for control males. These distribu-tions do not differ significantly. All data from Ma and asso-ciates, Curry and colleagues, and the current study aregiven in Table 39 for comparison.
In summary, the molecular spectra of the HPRT mutantisolates recovered from both BD-exposed worker groups inthis study were not statistically different from the molec-ular spectra of the mutants isolated from the unexposedcontrol group. Further, all these spectra were statisticallysimilar to what we and other researchers have observedhistorically for adults who have not been exposed tomutagens. Many of the deletion mutations observed in thisstudy show breakpoints in sequences where spontaneousmechanisms for their origin can be postulated. The molec-ular mutational spectra identified in this study do not indi-cate BD-induced genetic effects in the workers.
HPRT Mutational Spectra
Table 38. Comparison of Control Group Data from This Study with Historical Results from Molecular Analysis of Other Control Data (Curry et al 1999)a
Control Data from This Study Control Data from Curry et al
n(%)b n(%)c n(%)b n(%)c
Total mutants analyzed 31 513
Mutation typeTransitions 8 (25.8) 188 (36.6)
G• C→A• T 4 (50.0) 141 (75.0)A• T→G• C 4 (50.0) 47 (25.0)
Transversions 14 (45.2) 172 (33.5)G• C→C• G 6 (42.9) 38 (22.0)G• C→T• A 1 (7.1) 43 (25.0)A• T→T• A 4 (28.6) 52 (30.2)A• T→C• G 3 (21.4) 39 (22.7)
Deletions 6 (19.4) 59 (11.5)Frameshifts (�1) 1 (3.2) 54 (10.5)Frameshifts (�1) 0 (0) 12 (2.3)Complexes 2 (6.5) 15 (2.9)Tandems 0 (0) 8 (1.6)Insertions 0 (0) 5 (1.0)
Uncharacterized splicesd 3 144
a We used only RT-PCR data from our analyses. The Curry control group also included only males. We found no significant differences by 2 analysis.b Values in parentheses are percentages of the Total mutants analyzed (given in the top row of the table).c Values in parentheses are percentages of Transitions or Transversions. The category values are offset to the right of the main column so they are not added
twice into the Total mutants analyzed.d These values are not included in the Total mutants analyzed in the top row.

96
Biomarkers in Czech Workers Exposed to 1,3-Butadiene
Tabl
e 39
.H
PR
T M
uta
tion
al S
pec
tra:
Sev
eral
Dat
aset
sa
Ma
et a
l 20
00b
Cu
rry
et a
l 19
99c
Cu
rren
t S
tud
y M
ult
iple
x-P
CR
An
alys
is o
f G
erm
inal
Mu
tati
onsd
,e
Mu
tati
on T
ype
Con
trol
n (
%)
BD
-Exp
osed
n (
%)
Con
trol
n (
%)
Con
trol
n (
%)
Mon
omer
n (
%)
Pol
ymer
n (
%)
Tota
l B
D-E
xpos
edn
(%
)
Lar
ge D
elet
ion
Mu
tati
onsd
Tota
l m
uta
nts
an
alyz
ed21
7 (1
00)
143
(100
)N
ot g
iven
94 (
100)
88 (
100)
92 (
100)
180
(100
)D
elet
ion
sf21
(9.
7)25
(17
.5)
Not
giv
en14
(14
.9)
21 (
23.9
)10
(10
.9)
31 (
17.2
)To
tal-
gen
e(e
xon
s 1–
9)6
(2.8
)3
(2.1
)4
(4.3
)6
(6.8
)3
(3.3
)9
(5.0
)
Mu
ltip
le-e
xon
14 (
6.5)
19 (
13.3
)3
(3.2
)9
(10.
2)2
(2.2
)11
(6.
1)S
ingl
e-ex
on1
(0.5
)3
(2.1
)7
(7.4
)6
(6.8
)5
(5.4
)11
(6.
1)O
ther
196
(90.
3)11
8 (8
2.5)
Not
giv
en80
(85
.1)
67 (
76.1
)82
(89
.1)
149
(82.
8)
cDN
A S
equ
ence
An
alys
is (
RT
-PC
R)e
Tota
l m
uta
nts
an
alyz
ed90
(10
0)85
(10
0)65
7 (1
00)
35 (
100)
35 (
100)
28 (
100)
63 (
100)
Bas
e su
bsti
tuti
ons
76 (
84.4
)g58
(68
.2)h
360
(54.
8)22
(62
.9)
20 (
57.1
)15
(53
.6)
35 (
55.6
)D
elet
ion
s5
(5.5
)8
(9.4
)59
(9.
0)6
(17.
1)8
(22.
9)6
(21.
4)14
(22
.2)
Fra
mes
hif
ts ( �
1)2
(2.2
)9
(10.
5)54
(8.
2)1
(2.9
)4
(11.
4)0
(0)
4 (6
.3)
Fra
mes
hif
ts (
+1)
2 (2
.2)
1 (1
.2)
12 (
1.8)
0 (0
)0
(0)
0 (0
)0
(0)
Oth
er (
com
ple
x an
du
nd
efin
ed)
5 (5
.5)
9 (1
0.5)
172
(26.
2)6
(17.
1)3
(8.6
)7
(25.
0)10
(15
.9)
Sin
gle
Bas
e S
ubs
titu
tion
se
Tota
l m
uta
nts
an
alyz
ed75
(10
0)56
(10
0)36
0 (1
00)
22 (
100)
20 (
100)
15 (
100)
35 (
100)
Tran
siti
ons
G•C
→A
•T32
(42
.7)
21 (
37.5
)14
1 (3
9.1)
4 (1
8.2)
7 (3
5.0)
5 (3
3.3)
12 (
34.3
)A
•T→
G•C
13 (
17.3
)8
(14.
3)47
(13
.1)
4 (1
8.2)
4 (2
0.0)
3 (2
0.0)
7 (2
0.0)
Tran
sver
sion
sG
•C→
C•G
9 (1
2.0)
5 (8
.9)
38 (
10.6
)6
(27.
3)3
(15.
0)1
(6.7
)4
(11.
4)G
•C→
T•A
5 (6
.7)
4 (7
.1)
43 (
11.9
)1
(4.5
)2
(10.
0)2
(13.
3)4
(11.
4)A
•T→
T•A
6 (8
.0)
9 (1
6.1)
52 (
14.4
)4
(18.
2)3
(15.
0)0
(0)
3 (8
.6)
A•T
→C
•G10
(13
.3)
9 (1
6.1)
39 (
10.8
)3
(13.
6)1
(5.0
)4
(26.
7)5
(14.
3)N
um
ber
at G
•Ci
46 (
61.3
)30
(53
.4)
222
(61.
7)11
(50
.0)
12 (
60.0
)8
(53.
3)20
(57
.1)
Nu
mbe
r at
A•T
i29
(38
.7)
26 (
46.4
)13
8 (3
8.3)
11 (
50.0
)8
(40.
0)7
(46.
7)15
(42
.9)
a Un
less
not
ed o
ther
wis
e, a
ll v
alu
es i
n p
aren
thes
es a
re p
erce
nta
ges
of t
he
Tota
l m
uta
nts
an
alyz
ed (
give
n i
n t
he
firs
t ro
w o
f ea
ch s
ecti
on).
Val
ues
off
set
to t
he
righ
t of
th
e m
ain
col
um
n s
hou
ld n
ot b
e ad
ded
tw
ice
into
th
e To
tal
mu
tan
ts a
nal
yzed
.b
Su
bjec
ts w
ere
mal
e w
orke
rs (
wh
o d
o n
ot s
mok
e) i
n a
hig
h-B
D-e
xpos
ure
set
tin
g in
a T
exas
SB
R p
rod
uct
ion
fac
ilit
y. T
he
con
trol
su
bjec
ts w
ere
emp
loye
es o
f th
e U
niv
ersi
ty o
f Te
xas
Med
ical
Bra
nch
mat
ched
by
age
wit
h t
he
exp
osed
su
bjec
ts.
c A
n a
rtic
le s
um
mar
izin
g ba
ckgr
oun
d m
uta
tion
al s
pec
tra
in n
orm
al h
um
ans
usi
ng
dat
a fr
om 7
95 m
uta
tion
s fr
om 2
4 p
ubl
ish
ed p
aper
s.d T
hes
e re
sult
s fr
om t
he
curr
ent
stu
dy
are
also
pre
sen
ted
in
th
e to
p p
orti
on o
f Ta
ble
37.
e T
hes
e re
sult
s fr
om t
he
curr
ent
stu
dy
are
also
pre
sen
ted
in
Tab
le 3
0.f T
he
foll
owin
g th
ree
row
s se
par
ate
the
Del
etio
ns
into
th
ree
cate
gori
es. T
he
valu
es i
n p
aren
thes
es, h
owev
er, a
re p
erce
nta
ges
of t
he
Tota
l m
uta
nts
an
alyz
ed.
g In
clu
des
on
e ta
nd
em m
uta
tion
not
in
clu
ded
in
th
e d
istr
ibu
tion
of
sin
gle
base
su
bsti
tuti
ons
belo
w.
h I
ncl
ud
es t
wo
tan
dem
mu
tati
ons
not
in
clu
ded
in
th
e d
istr
ibu
tion
of
sin
gle
base
su
bsti
tuti
ons
belo
w.
i Th
e va
lues
in
th
ese
two
row
s ar
e of
fset
to
the
righ
t be
cau
se t
oget
her
th
ey s
um
mar
ize
the
two
cate
gori
es T
ran
siti
ons
and
Tra
nsv
ersi
ons,
an
d b
oth
th
e n
um
bers
an
d t
he
per
cen
tage
s ar
e su
bset
s of
th
e To
tal
mu
tan
ts a
nal
yzed
.
97
BIOMARKERS OF EFFECT:CYTOGENETIC ANALYSIS
One indicator of human exposure to mutagens and car-cinogens in occupational and environmental surroundingsis the level or frequency of chromosomal aberrations,which is detected via cytogenetic analysis of PBLs.Increased levels of chromosomal aberrations can also indi-cate increased risks of cancer occurring later, as has beenshown in epidemiologic studies in Scandinavia (Hagmaret al 1998) and Italy (Bonassi 1999). Chromosomal aberra-tions in somatic cells may activate oncogenes or inactivatetumor suppressor genes. Changes in the number and struc-ture of chromosomes also are associated with the transfor-mation of normal cells into tumor cells. The frequency ofchromosomal aberrations may be affected as well by lifestyle factors such as the level of antioxidant vitamins [A, E,and C] in the diet ( rám et al 1983).
SCEs are the reciprocal exchanges of identical sequencesof DNA between two sister chromatids within chromo-somes; they may also reflect the interactions of chemicalswith DNA. The molecular mechanisms responsible forSCEs, their biological significance, and their relation tochromosomal aberrations are not understood, except that,in contrast to chromosomal aberrations, increased frequen-cies of SCEs have not been associated with increased risksof cancer (Hagmar et al 1998; Bonassi et al 1999).
Several in vitro and in vivo studies have investigatedthe effects of BD and its metabolites on cytogenetic end-points in rodents and in humans (Pacherrotti et al 1998;see also the earlier Overview section). BD has been shownto increase the frequencies of SCEs in mouse but not ratbone marrow. Similarly, only mice have shown other cyto-genetic changes following in vivo exposure to BD; never-theless, increased micronucleus frequencies in peripheralblood erythrocytes, splenocytes, or both, and chromo-somal rearrangements (but not aneuploidy, which resultsfrom the loss or gain of whole chromosomes) in bonemarrow have been observed in both mice and rats after invivo exposure to BD metabolites. Of special interest is theeffect of BD on gametes; dominant lethal mutations, heri-table translocations, and sperm-head abnormalities havebeen observed only in mice after exposure to BD (reviewedin IARC 1999). Therefore, chromosome-level changes havefrequently been observed in vivo in mouse somatic or germcells after BD exposure, although such changes have notbeen seen in rats. Exposure to BD metabolites, however,have produced cytogenetic effects in both species (Pacher-rotti et al 1998).
In human cells, direct in vitro applications of the metab-olites BDO and BDO2 have induced SCEs in lymphocytes;
S
in this, BDO2 has been more potent than BDO (Sasiadek etal 1991a). Certain metabolic genotypes in humans influ-ence susceptibility to SCE induction by BD metabolites. Invitro, lymphocytes from individuals with the GSTM1-nullgenotype were more susceptible to SCE induction by BDO,whereas lymphocytes from individuals with the GSTT1-null genotype were more susceptible to SCE induction byBDO2 (Norppa et al 1995, Uuskula et al 1995). The GSTgenotype did not influence SCE induction by BDO-diol(Bernardini et al 1996). Aneuploidy has also been reportedin human lymphocytes in vitro after exposure to eitherBDO or BDO2, with BDO2 again being more potent; in onereport, the aneuploidy appeared to be specific to chromo-somes 12 and X (Xi et al 1997).
Although these in vitro findings clearly demonstratethat BD metabolites are genotoxic to human cells, they donot indicate what may occur in vivo after BD exposurewhen the parent compound must be metabolized into itsgenotoxic intermediates. This can be determined only bydirect studies of humans exposed to BD.
The chromosomal effects of BD have been evaluated instudies of exposed workers, but results have been incon-sistent. Positive results from in vivo studies include anincrease of chromosomal aberrations and SCEs in BD-exposed Czech workers sampled in 1994 ( rám et al 1998)and abnormal DNA repair activities in cells from BD-exposed workers in Texas (Hallberg et al 1997). One study,in which cells from BD-exposed workers in Texas werechallenged in vitro with a clastogenic agent, showedincreased chromosomal breakage compared with cellsfrom control subjects (Au et al 1995). The results of thatstudy might be interpreted as demonstrating chromosome-level damage in vivo that required an external stress toconvert the damage to chromosomal breakage.
The same Czech worker group that had shown increasesin chromosomal aberrations when sampled in 1994 hadalso been examined in 1992 and 1993; at that time, Sorsaand associates (1994) found no evidence of increases inchromosomal aberrations, SCEs, or micronuclei. However,when these same cytogenetic data were reanalyzed withrespect to genotypes, the same investigators found thatBD-exposed workers with the GSTT1-null genotype hadsignificantly higher frequencies of chromosomal aberra-tion than the appropriate control group (Sorsa et al 1996).The GSTM1 genotype conferred no similar susceptibility.A study by Hayes and associates (2000) of Chinese workersexposed to BD analyzed SCEs and aneuploidy and foundno effects at exposure levels comparable to those reportedin other studies (Sorsa et al 1994, 1996).
The current project studied a group of workers from thesame petrochemical company in the Czech Republic that
S
Cytogenetic Analysis

98
Biomarkers in Czech Workers Exposed to 1,3-Butadiene
had been sampled in 1992, 1993, and 1994. The samplesused for the 1992 and 1993 analyses were obtained at thebeginning of October, whereas the samples for the 1994analysis were acquired at the end of November. The timingof samples is important because most workers are on vaca-tion for 3 to 4 weeks in August; thus, samples acquired inOctober may show the effects of this period of nonexposure,whereas samples acquired in November would reflectapproximately 3 full months of exposure. The exposedsubjects for the 1992 study consisted of workers in boththe monomer production and the polymerization units,whereas the 1993 and 1994 samples were collected exclu-sively from workers in the monomer production unit. Thecontrol subjects for all 3 years were power plant workers.
During our analysis of the 1994 samples, we also ana-lyzed the 1993 samples for the occurrence of high fre-quency cells (HFCs). These are recorded as the percentageof cells (lymphocytes} in which a high frequency of SCEsper cell are found. HFCs may sensitively detect chemicalexposure (Carrano and Moore 1982). Multifactorial anal-ysis of all results from the 1992, 1993, and 1994 samplesshowed that chromosomal aberrations and HFCs were thepredominant effects of BD exposure, although these weresignificantly increased only in the 1994 samples. Further-more, no effects were observed in any of the samples whenassessed using the comet or micronucleus assays (Tates etal 1996, rám et al 1998). For these reasons, only chromo-somal aberrations and SCEs were selected for cytogeneticanalysis in the current study.
METHODS
Chromosomal Aberrations Identifiedby the Conventional Method
We set aside fresh, whole-blood samples (5–10 mL persubject) before we fractionated and cryopreserved samplesfor studies in other laboratories. The whole-blood sampleswere coded only with each subject’s three-digit identifica-tion number.
We established cultures within 24 hours after blood wascollected, according to the methods described by Sorsaand associates (1994). Whole-blood lymphocyte cultureswere set up in tissue culture flasks or in penicillin flasks;each flask contained 0.6 mL whole blood and 7.5 mL culti-vation medium (which, for one flask, included 1.06 mLRPMI 1640 [SEVAC, Prague], 1.80 mL BCS [OPAVAC,Opava], 4.24 mL distilled water, 0.10 mL L-glutamine, 0.16mL NaHCO3, and 0.10 mL PHA [HA-15, Murex, UK]). Thecultures for chromosomal aberrations were cultivated at37�C for 48 hours; 2 hours before the end of cultivation,colchicine (Fluka) was added in a final concentration of
S
0.5 �g/mL culture. The cells were then treated with ahypotonic solution of KCl (0.075 M) for 10 minutes andfixed three times with methanol:acetic acid (3:1). The slideswere dried for 24 hours, stained with a 5% solution ofGiemsa-Romanowski, and coded with the subject’s three-digit identification number.
For each subject, 100 metaphases were analyzed at amagnification of 1000 under immersion. We scored fourforms of chromosomal aberrations: breaks and exchanges inchromatids and chromosomes. Aberrant cells were definedas cells bearing chromosomal breaks and exchanges; gaps inchromosomes were not counted as aberrant cells. Thenumber of chromosomal breaks/cell were also counted (achromosomal break was counted as 1, an exchange wascounted as 2 breaks).
Chromosomal Changes Identified by FISH
Stable chromosomal translocations reflect true in vivoevents that result in genetic effects; the frequency withwhich they occur may be significantly affected by the ageof the subject. The FISH method identifies how exposureto a mutagen affects the frequency of stable chromosomaltranslocations. It uses painting probes to label individualchromosomes. (Until now, it has mostly been used to ana-lyze the effects of different types of radiation on chromo-somes.) With the Protocol for Aberration Identification andNomenclature Terminology (PAINT), it is possible to classifyexactly each type of chromosomal rearrangement (Tucker etal 1995):
• Chromosomal aberration. A generic term meaning agross change in chromosomal structure.
• Translocation. The movement of a part of a chromo-some to another chromosome or to a different locationin the same chromosome (a change in the position ofa segment).
• Reciprocal translocation. The exchange of parts be-tween two chromosomes whereby each receives partof the other in place of the part that it lost. (This is aprototypic “stable translocation” in that no geneticmaterial is lost to the cell so it does not die.)
• Insertion. The translocation of a piece of a chromo-some between two breaks; the piece may come fromthe same or another chromosome.
• Conjunction. A connection or link among colors be-tween chromosomes.
Whole blood (1 mL) was added to 10 mL culturemedium RPMI 1640 (SEVAC, Prague) that was supple-mented with 20% fetal BCS, phytohemagglutinin (0.10 mLper total volume [7.5 mL medium � 0.6 mL blood]), andL-glutamine (0.5 mg/mL). To obtain a sufficient number of

99
mitoses, the cultures for analysis by FISH were harvestedafter 48 or 68 hours of incubation; at 1 hour before the endof the incubation, colchicine (Fluka) was added to a finalconcentration of 0.5 �g/mL. Slides were prepared usingthe air-dry method (Verma and Babu 1989) and stored at�20�C.
FISH analysis using commercial whole-chromosomepainting probes in different colors (Biovation, Aberdeen,UK) for chromosomes 1 and 4 was carried out according tothe manufacturer’s chromosome painting protocol. Afterincubating the slides with the probes, slides were mountedin a 4,6-diamidino-2-phenylindole (DAPI) antifade solu-tion and examined using an Olympus BX 60 fluorescencemicroscope equipped with a triple-band pass filter forDAPI and the fluorochrome tracers (fluorescein isothiocy-anate and cyanogen 3) (Rube et al 1998). We analyzed 500metaphases per subject.
All aberrant cells were classified according to PAINT(Tucker et al 1995). The protocol defines translocationsand insertions as follows: A translocation is a rearrangedchromosome with a single centromere and is to be countedas an aberration; the translocated chromosome must exhibitat least two colors. An insertion is the presence of acentricchromosomal material situated within another chromo-some; the material flanking either side of an insertion mustbe of the same color.
Genomic frequencies of stable translocations per 100cells (FG/100) were calculated according to Lucas andassociates (1993) using the equation:
FG/100 � Fgr /2.05 [fr (1 � fr) � fg (1 � fg) � frfg],
where Fgr is the translocation frequency measured by FISHafter two-color painting, and fr and fg are the fractions ofthe genome painted red and green, respectively.
SCEs
Cultures were established within 24 hours after bloodwas collected according to the method described by Sorsaand associates (1994). Whole-blood lymphocyte cultureswere set up in tissue culture flasks or in penicillin flasks.Each culture contained 0.6 mL whole blood, 7.5 mL culti-vation medium (which, for one flask, included 1.06 mLRPMI 1640 [SEVAC], 1.80 mL BCS [OPAVAC], 4.24 mL dis-tilled water, 0.1 mL L-glutamine, 0.16 mL NaHCO3, and0.1 mL PHA [HA-15, Murex, UK]), and 5-bromo-2�-deoxyuri-dine (in a final concentration of 10 �g/mL culture). Thecultures for SCE were cultivated for 68 hours; 2 hoursbefore the end of cultivation, colchicine was added at afinal concentration of 0.5 �g/mL culture. The cells weretreated with a hypotonic solution of KCl (0.075 M) for
s
10 minutes and fixed three times with methanol:aceticacid (3:1). Cells were then added to microscope slides.After several days, slides were placed into Hoechst H33258 working solution, exposed to UV light for 1.5 hours,incubated in a water bath at 60�C for 2 hours, and thenstained with a 5% solution of Giemsa-Romanowski.
For SCE scoring, 50 second-division metaphases persubject were analyzed according to the method of Perryand Wolf (1974). Cells were analyzed at a magnification of1000 under immersion. Results were expressed as thenumber of SCEs/cell. The percentage of HFCs (defined asmore than 12 SCEs per cell) was calculated according toCarrano and Moore (1982).
Statistical Methods
A complete description of all statistical methods isfound in the earlier section Study Design: Subject Selec-tion, Sample Acquisition and Handling, and StatisticalMethods / Data Processing and Statistical Analysis.
RESULTS
Cytogenetic studies included assays for (1) chromosomalaberrations identified by the conventional method (aberrantcells and breaks/cell); (2) chromosomal changes identifiedby FISH (chromosomal aberrations, translocations, recip-rocal translocations, conjunctions, and FG/100); and (3) SCEs(SCEs/cell and percentage of HFCs). Chromosomal aberra-tions and translocations involve gross changes in the geneticmaterial. SCEs measure reciprocal exchanges between sisterchromatids without the apparent loss of genetic material.They are sensitive biomarkers of exposure for many chemi-cals, but do not have a genotoxic consequence. Individualresults for each subject from all three exposure groups arepresented in Table 40 for several cytogenetic endpoints.
Chromosomal Aberrations Identifiedby the Conventional Method
Successful analyses of chromosomal aberrations wereaccomplished for 82 (99%) of the subjects. Only onesample, from a monomer production worker, was lost toanalysis. Table 41 presents the group mean percentage ofaberrant cells and the mean number of breaks/cell for thethree exposure groups. None of these values differed sig-nificantly between pairs of groups. Also shown in Table 41are cumulative results from our laboratory for aberrantcells from normal control individuals in the Czech Republic.Although this value is provided for reference, the grouprepresents normal blood-bank volunteers from throughoutthe nation and may not be strictly comparable to theadministrative control group in the current study.
Cytogenetic Analysis

100
Biomarkers in Czech Workers Exposed to 1,3-Butadiene
Table 40. Individual Data from Cytogenetic Analyses for Each Subject
Exposurea
(mg/m3)SmokingStatusb
Genotypec
AberrantCells (%)
Breaks/Cell
FG/100d
SCEs/CellSubject Age GSTM1 GSTT1 % HFC
Administrative Control Subjects (n � 25)108 66 0.050 (0.009−0.090) NS – � 2 0.02 3.51 4.78 0109 61 0.029 (0.009−0.048) S � � 4 0.05 1.12 7.16 6110 58 0.010 (0.007−0.013) —e – � 4 0.05 5.17 5.04 0114 55 0.083 (0.040−0.125) NS – � 1 0.01 0.81 6.26 0
115 52 0.013 (0.002–0.024) S – – 1 0.01 3.60 6.52 2116f 50 0.023 (0.018−0.029) NS � � 4 0.05 2.55 5.82 4117f 49 0.023 (0.018−0.029) NS � � 1 0.01 2.69 5.84 0118 48 0.015 (0.015−0.015) NS � – 1 0.01 2.62 6.72 4
119 48 0.059 (0.059−0.059) S � � 3 0.03 1.27 5.40 0120 45 0.026 (0.026−0.026) NS � � 0 1.41 5.82 0121 42 0.002 (0.002−0.002) S – � 0 2.23 8.28 22122 42 0.022 (0.022−0.022) S � – 1 0.02 7.20 6.60 0
123 40 0.002 (0.002−0.002) S – � 2 0.03 4.13 7.02 2155 33 0.068 (0.068−0.068) NS � � 2 0.02 3.43 6.94 6156 35 0.002 (0.002−0.002) NS � � 1 0.02 2.26 4.66 0166 33 0.002 (0.002−0.002) S – � 0 9.24 7.50 0
167 32 0.002 (0.002−0.002) NS – – 2 0.02 0.37 6.50 2168 29 0.002 (0.002−0.002) NS � � 1 0.01 0.71 6.78 8169 28 0.031 (0.031−0.031) NS � � 2 0.02 1.38 6.14 0170 28 0.044 (0.044−0.044) NS � � 1 0.01 1.68 7.26 4
171 20 0.042 (0.042−0.042) NS � � 3 0.03 5.26 5.68 0172 26 0.013 (0.013−0.013) NS � � 0 2.67 6.68 4182 24 0.013 (0.013−0.013) S � � 1 0.01 1.76 6.84 2183 21 0.002 (0.002−0.002) NS – – 1 0.01 2.07 6.12 0184 22 0.009 (0.009−0.009) S � � 1 0.02 NAg 5.16 2
Monomer Production Workers (n � 24)102 49 0.062 (0.002–0.257) NS � � 0 9.62 4.94 0103 48 0.398 (0.002–1.252) S � � 2 0.11 1.86 7.48 4104 20 0.093 (0.004−0.332) NS � – 0 0.72 5.18 0105 20 0.674 (0.040−2.803) S – � 3 0.03 0.54 6.86 0
113 54 0.243 (0.002–0.779) S � � 3 0.04 2.67 7.30 12124 52 0.161 (0.002–0.860) NS – � 0 2.55 NA125 47 0.195 (0.002–1.058) S � � 1 0.01 8.29 6.46 2126 47 0.238 (0.013−1.030) S – – NA 4.14 6.70 2
127 52 0.396 (0.018−3.388) NS – – 4 0.04 2.32 NA128 25 0.411 (0.002–2.059) S � � 2 0.03 0.46 NA140 53 0.053 (0.002–0.246) S � � 3 0.04 NA 5.02 0141 53 0.146 (0.002–1.135) S – � 2 0.02 0.89 NA
142 28 0.694 (0.011−3.991) S � � 1 0.01 1.02 NA143 39 0.689 (0.002–2.556) S – � 2 0.03 2.29 6.50 6144 22 1.861 (0.035−5.366) S – � 2 0.02 1.37 6.68 8147 51 0.072 (0.002–0.315) NS – � 1 0.01 4.17 NA
(Table continues next page)
a Mean value with range given in parentheses.b S � smoker, NS � nonsmoker.c � � carries this gene; � � does not carry this gene (null genotype).d Frequency per 100 cells. e This subject did not provide information about smoking status.f Exposure measurements were not obtained for these subjects and they were assigned the mean values for the group. g NA � data from these subjects were not analyzed.

101
Table 40 (Continued). Individual Data from Cytogenetic Analyses for Each Subject
Smoking Statusb
Genotypec
AberrantCells (%)
Breaks/Cell
FG/100d
SCEs/CellSubject Age Exposurea (mg/m3) GSTM1 GSTT1 % HFC
Monomer Production Workers (n � 24) (Continued)149 42 0.174 (0.002–0.838) NS � � 2 0.02 1.37 4.33 0150 31 0.165 (0.002–0.585) NS � – 1 0.01 1.36 7.26 8151 50 1.266 (0.011−2.970) S – � 2 0.02 0.62 5.34 0152 50 3.516 (0.029−19.910) NS � � 0 0.84 5.34 0
157 48 0.416 (0.002–1.956) NS – � 1 0.01 2.73 6.54 0177 21 0.607 (0.029−1.896) S � � 0 0.53 6.20 2178 21 2.530 (0.002–19.532) NS � � 3 0.03 0.87 6.22 2181 52 0.348 (0.002–2.851) NS � � 0 2.77 NA
Polymerization Workers (n � 34)101 51 2.421 (0.002−6.765) S � � 1 0.01 3.98 6.70 6106 25 1.503 (0.037−10.619) NS – – 1 0.01 1.17 5.42 0107 21 1.119 (0.68−4.415) NS � � 0 2.99 4.50 0111 49 0.838 (0.029−3.247) S � � 1 0.01 5.17 NA
112 54 0.641 (0.002–1.762) S � � 3 0.03 3.68 7.04 0129 45 7.408 (0.062−39.030) S – � 4 0.05 2.78 6.86 8130 53 0.188 (0.011−0.689) S � � 1 0.01 2.67 NA131 52 0.470 (0.002–2.317) S – � 3 0.05 3.57 9.02 16132 33 0.326 (0.002–2.317) S – � 1 0.02 0 6.18 2
133 27 1.154 (0.011−4.715) NS � � 2 0.02 1.49 5.22 2134 34 0.286 (0.002–1.177) NS – � 0 3.61 5.76 0135 51 1.045 (0.002–3.155) S � � 2 0.02 4.64 6.88 8136 41 0.657 (0.011−2.893) S – � 1 0.01 3.28 5.72 4
137 58 0.144 (0.002–0.587) NS � � 1 0.01 NA 6.34 2138 46 0.262 (0.002–1.208) NS – � 0 NA 6.56 6139 41 1.076 (0.002–7.341) NS � – 2 0.02 3.14 5.98 2145 42 0.251 (0.020−1.740) NS � � 1.5 0.02 4.31 6.36 2146 25 1.211 (0.031−5.243) S � � 3 0.03 1.83 6.42 6
148 42 0.336 (0.011−0.726) S – � 2 0.03 1.81 6.03 3153 24 1.754 (0.002–9.530) S � � 1 0.01 1.84 8.04 10154 51 1.903 (0.002–6.613) NS � � 2 0.02 2.90 5.52 0158 52 0.232 (0.002–0.801) NS � � 3 0.04 7.67 6.16 0
159 50 0.990 (0.167−4.343) NS – – 1 0.02 4.92 6.54 0160 22 3.650 (0.002–19.362) S – – 1 0.01 NA 6.52 6161 51 1.206 (0.018−2.570) S � � 1 0.01 1.25 7.42 6162 27 2.335 (0.002–18.718) NS � � 3 0.03 0.46 6.16 2
164 21 9.244 (0.029−37.376) NS � � 1 0.01 0.90 7.02 6165 27 0.040 (0.011−0.117) NS � � 2 0.02 4.81 6.98 2173 28 0.173 (0.002–0.405) NS � � 1 0.01 2.09 7.06 2174 37 2.088 (0.002–6.365) NS � � 0 2.53 6.32 2
175 22 4.669 (0.002–19.659) S � � 2 0.03 0 6.16 0176 32 4.733 (0.002–27.562) NS – – 3 0.04 7.87 NA 179 51 3.792 (0.002–28.228) S � � 0 4.59 7.70 6180 50 2.848 (0.110−18.229) NS � � 2 0.02 4.13 6.44 2
a Mean value with range given in parentheses.b S � smoker, NS � nonsmoker.c � � carries this gene; � � does not carry this gene (null genotype).d Frequency per 100 cells. e This subject did not provide information about smoking status.f Exposure measurements were not obtained for these subjects and they were assigned the mean values for the group. g NA � data from these subjects were not analyzed.
Cytogenetic Analysis
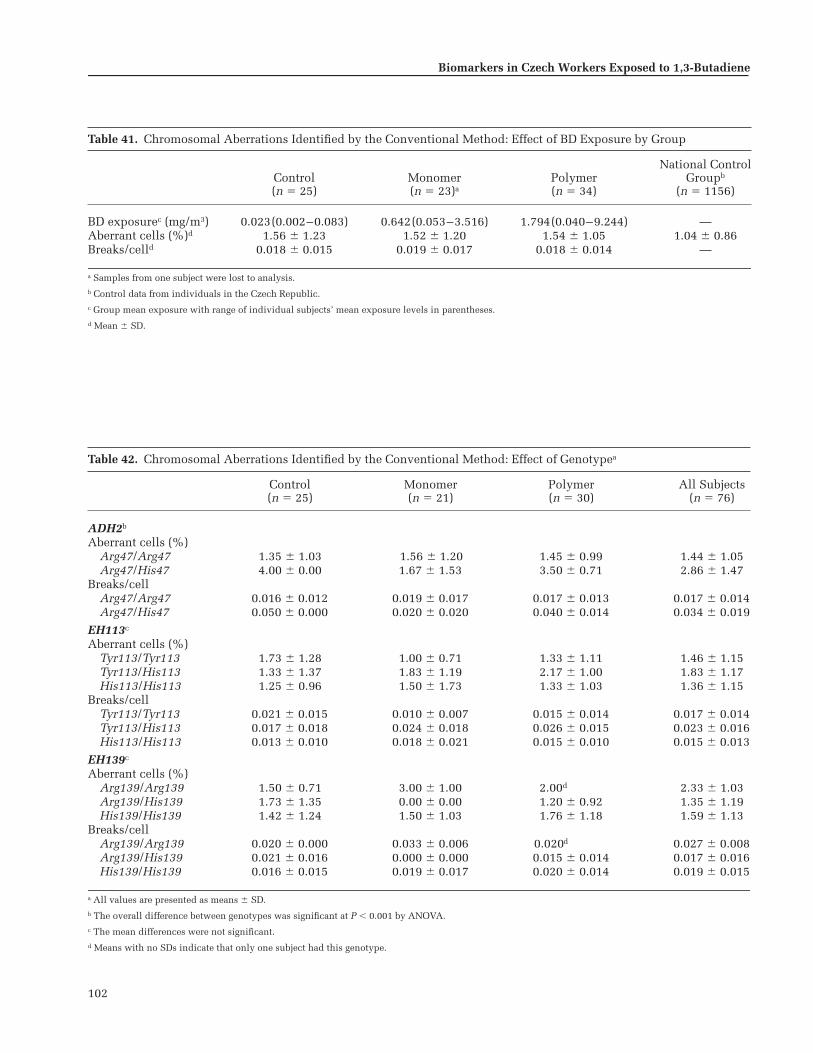
102
Biomarkers in Czech Workers Exposed to 1,3-Butadiene
Table 41. Chromosomal Aberrations Identified by the Conventional Method: Effect of BD Exposure by Group
Control(n � 25)
Monomer(n � 23)a
Polymer(n � 34)
National ControlGroupb
(n � 1156)
BD exposurec (mg/m3) 0.023(0.002–0.083) 0.642(0.053–3.516) 1.794(0.040–9.244) —Aberrant cells (%)d 1.56 � 1.23 1.52 � 1.20 1.54 � 1.05 1.04 � 0.86Breaks/celld 0.018 � 0.015 0.019 � 0.017 0.018 � 0.014 —
a Samples from one subject were lost to analysis.b Control data from individuals in the Czech Republic.c Group mean exposure with range of individual subjects’ mean exposure levels in parentheses.d Mean � SD.
Table 42. Chromosomal Aberrations Identified by the Conventional Method: Effect of Genotypea
Control(n � 25)
Monomer(n � 21)
Polymer(n � 30)
All Subjects(n � 76)
ADH2b
Aberrant cells (%)Arg47/Arg47 1.35 � 1.03 1.56 � 1.20 1.45 � 0.99 1.44 � 1.05Arg47/His47 4.00 � 0.00 1.67 � 1.53 3.50 � 0.71 2.86 � 1.47
Breaks/cellArg47/Arg47 0.016 � 0.012 0.019 � 0.017 0.017 � 0.013 0.017 � 0.014Arg47/His47 0.050 � 0.000 0.020 � 0.020 0.040 � 0.014 0.034 � 0.019
EH113c
Aberrant cells (%)Tyr113/Tyr113 1.73 � 1.28 1.00 � 0.71 1.33 � 1.11 1.46 � 1.15Tyr113/His113 1.33 � 1.37 1.83 � 1.19 2.17 � 1.00 1.83 � 1.17His113/His113 1.25 � 0.96 1.50 � 1.73 1.33 � 1.03 1.36 � 1.15
Breaks/cellTyr113/Tyr113 0.021 � 0.015 0.010 � 0.007 0.015 � 0.014 0.017 � 0.014Tyr113/His113 0.017 � 0.018 0.024 � 0.018 0.026 � 0.015 0.023 � 0.016His113/His113 0.013 � 0.010 0.018 � 0.021 0.015 � 0.010 0.015 � 0.013
EH139c
Aberrant cells (%)Arg139/Arg139 1.50 � 0.71 3.00 � 1.00 2.00d 2.33 � 1.03Arg139/His139 1.73 � 1.35 0.00 � 0.00 1.20 � 0.92 1.35 � 1.19His139/His139 1.42 � 1.24 1.50 � 1.03 1.76 � 1.18 1.59 � 1.13
Breaks/cellArg139/Arg139 0.020 � 0.000 0.033 � 0.006 0.020d 0.027 � 0.008Arg139/His139 0.021 � 0.016 0.000 � 0.000 0.015 � 0.014 0.017 � 0.016His139/His139 0.016 � 0.015 0.019 � 0.017 0.020 � 0.014 0.019 � 0.015
a All values are presented as means � SD.b The overall difference between genotypes was significant at P � 0.001 by ANOVA.c The mean differences were not significant.d Means with no SDs indicate that only one subject had this genotype.

103
Both the percentage of aberrant cells and the breaks/cellwere associated with the metabolic genotypes determinedfor these subjects (Table 42). The most consistent associa-tions were with the ADH2 polymorphisms, which wereassociated with differences in both of these endpoints.Subjects with the Arg47/Arg47 homozygous genotype atthis locus had significantly lower mean values for per-centage of aberrant cells and breaks/cell than did the sub-jects with the Arg47/His47 heterozygous genotype (nosubjects with His47/His47 homozygous genotype wereincluded in the study). Regression analyses, however, pro-vided no evidence that these genotypic differences wererelated to BD exposures.
Although the EH polymorphisms were related to no sta-tistically significant differences in the percentage of aber-rant cells or breaks/cell and to no significant exposure-group–by–genotype interactions (Table 42), regressionanalyses of the cytogenetic endpoints on ln(BD-exposure-level–by–genotype) did reveal some statistically significantassociations. At the EH113 locus, workers with the Tyr113/Tyr113 homozygous genotype had lower slopes for per-centage of aberrant cells and breaks/cell than workers witheither the His113/His113 homozygous or the His113/Tyr113 heterozygous genotype, but the slopes differed
significantly only from those for the His113/Tyr113 geno-type (Figure 27). The Tyr113 allele, which is associatedwith lower production of these cytogenetic changes whenthe individual is homozygous for it, is the allele withhigher activity at the locus.
At the EH139 locus (Figure 28), workers with the Arg139/Arg139 homozygous genotype had a statistically greaterslope for percentage of aberrant cells than did workers witheither the His139/His139 homozygous or the Arg139/His139heterozygous genotype. The lower production of aberrantcells was associated with either homozygosity or heterozy-gosity for the lower-activity allele at the EH139 locus, which,in this case, is the variant His139 allele. Overall, theseresults comparing the EH genotypes are conflicting. The EHgenotypes at the 113 locus associated with the higherenzyme activity showed lower genotoxicity as expected; butthe reverse was seen for the EH genotypes at the 139 locus.
No significant associations were observed between eitherpercentage of aberrant cells or breaks/cell and CYP2E1,ADH3, GSTM1, or GSTT1 genotypes (data not shown). Thelack of association with the GST polymorphisms is in con-trast to other studies (eg, Sorsa et al 1996).
Analyses of the relation between smoking and the per-centage of aberrant cells or breaks/cell showed no effect ofsmoking on the percentage of aberrant cells (Figure 29, toppanel); however, the mean number of breaks/cell was sig-nificantly higher in smokers than nonsmokers (Figure 29,bottom panel), both overall (P � 0.031 by Mann-Whitneytest) and within the monomer group (P � 0.022 by Mann-Whitney test). Neither of these two endpoints was signifi-cantly correlated with average BD exposure, regardless ofwhether the control group was included or excluded fromthe analysis. Regression analyses to adjust for age and current
Cytogenetic Analysis
Figure 27. Percentage of aberrant cells (top) or number of breaks per cell(bottom) vs average BD exposure by EH113 genotypes. � and solid lineindicate Tyr113/Tyr113 genotype; � and short-dashes line indicate Tyr113/His113 genotype; � and long-dashes line indicate His113/His113 genotype.Slope for Tyr113/Tyr113 differs significantly from slope for Tyr113/His113(top: P � 0.040; bottom: P � 0.020).
Figure 28. Percentage of aberrant cells vs average BD exposure by EH139genotypes. � and solid line indicate Arg139/Arg139 genotype; � andshort-dashes line indicate Arg139/His139 genotype; � and long-dashesline indicate His139/His139 genotype. Slope for Arg139/Arg139 differssignificantly from slopes for Arg139/His139 (P � 0.004) and His139/His139(P � 0.029).

104
Biomarkers in Czech Workers Exposed to 1,3-Butadiene
smoking status also revealed no significant relation betweeneither aberrant cells or breaks/cell and average BD exposure.
On the basis of information supplied on the question-naires, we analyzed several small groups of subjects withparticular characteristics (regardless of exposure group),comparing each small group with the remainder of thesubjects. The percentages of aberrant cells and breaks/cellwere both significantly related to
• a history of hepatitis (in 6 subjects),
• a vaccination in the preceding 12 months (in 14 sub-jects), and
• the use of herbicides or pesticides during the preced-ing 3 months (in 13 subjects).
For each of these two endpoints, the values were signif-icantly higher among workers having the characteristicthan workers without the characteristic.
Figure 29. Summary of the data comparing smoking status with SCEs andHFCs. Hatched boxes = subjects who do not currently smoke; gray boxes �subjects who do. The upper and lower boundaries of the boxes represent the75th and 25th percentiles, respectively. Error bars are the highest and lowestvalues within 1.5 box-lengths from each percentile. The line within each boxmarks the position of the median value. The dots are values that are morethan 1.5 box-lengths from the 75th percentile.
In summary, no significant relations could be identifiedbetween group mean chromosomal aberrations deter-mined by the conventional method and BD exposurelevels. Associations with smoking, some genotypes, andseveral questionnaire variables were observed. Some geno-type associations were conflicting. Specifically, regressionanalyses showed that BD exposure was related to the pro-duction of fewer chromosomal aberrations in the EH geno-types with both the higher-activity and lower-activityalleles, depending on the EH locus, but no relation wasfound between BD exposure and aberrations associatedwith the GST genotypes.
Chromosomal Changes Identified by FISH
The chromosomal changes identified by FISH includedchromosomal aberrations, translocations, reciprocaltranslocations, and conjunctions (all reported per 1000metaphases), plus FG/100. Successful analysis by FISH wasaccomplished for 78 (94%) of the subjects: One sample (4%)was lost from an administrative control subject, one (4%)from a monomer production worker, and three (9%) frompolymerization workers. The group means for the frequen-cies of these chromosomal changes are given in Table 43.None of the mean differences between groups were statisti-cally significant for these cytogenetic endpoints.
All group mean values for each chromosomal changedetermined by FISH were significantly lower in the twosubjects with the CYP2E1 C1/C1 homozygous genotypethan in the 70 subjects with the C1/C2 heterozygous geno-type (Table 44). In addition, we noted a significant expo-sure-group–by–genotype interaction between the EH113polymorphisms for FG/100 (P � 0.034). Subjects in thecontrol and polymer groups identified with the Tyr113/His113 heterozygous genotype at this locus showed higherFG/100 than did subjects in the same exposure groups whohad been identified with either homozygous genotype atthis locus; in contrast, subjects in the monomer groupidentified with this heterozygous genotype showed lowerFG/100 than subjects in the same group identified witheither homozygous genotype (Table 45). Very similar inter-actions were also observed for chromosomal aberrations(P � 0.036), translocations (P � 0.034), and conjunctions(P � 0.047), as might be expected because of the high cor-relations among FISH endpoints.
None of the endpoints examined by FISH revealed anydifferences between current smokers and nonsmokers. Allfive FISH endpoints, however, were positively and signifi-cantly correlated with age (data not shown). None of thefive endpoints was significantly correlated with averageBD exposure when all data were included in the analysis.

105
However, when we excluded data from the administrativecontrol subjects, we observed a significant negative corre-lation between average BD exposure and chromosomalaberrations (data not shown; r � �0.286, P � 0.038). Wethen performed regression analyses with each of the FISHendpoints as dependent variables; we used age, currentsmoking, and average BD exposure as independent vari-ables. These analyses showed no significant effect of BDexposure after we adjusted for age and smoking.
On the basis of information supplied on the question-naires, we analyzed the following small groups and ob-tained these results:
• Reciprocal translocations were correlated with cumu-lative cigarette consumption (r � 0.229, P � 0.047),were significantly higher in the group of five workers
who had a history of anemia (P � 0.022), and weresignificantly lower in four workers with a history ofmononucleosis (P � 0.037); none of the other FISHendpoints was significantly related to these variables.
• Chromosomal aberrations (r � �0.272, P � 0.019),translocations (r � �0.236, P � 0.043), and FG/100(r � �0.236, P � 0.043) were inversely correlatedwith hours per day of passive exposure to cigarettesmoke.
• The mean values of FG/100 and translocations (P � 0.029for both) were significantly lower in six workers whoreported exposure to lead in the previous 3 months.
When we compared the control group in this study withcumulative results from healthy blood donors in the CzechRepublic (Rube et al 1998), we found that FG/100 was sig-nificantly higher in the current control group than in thegroup of healthy blood donors. FG/100 is known to be
s
Table 43. Chromosomal Changes Identified by FISHa
Aberration Control Monomer Polymer
All Subjectsb (n � 24) (n � 23) (n � 31)Chromosomal aberrations (‰) 4.63 � 3.27 4.05 � 3.14 5.48 � 3.21Translocations (‰) 7.14 � 5.71 6.29 � 6.32 8.30 � 5.13Reciprocal translocations (‰) 2.10 � 2.47 2.38 � 3.25 2.67 � 1.94Conjunctions (‰) 7.95 � 6.66 6.79 � 6.21 9.36 � 6.65FG/100 2.67 � 2.13 2.35 � 2.36 3.10 � 1.92
Subjects with Possible Clonal Expansion Excluded
(n � 19) (n � 21 ) (n � 28)
FG/100 2.06 � 1.31 1.72 � 1.14 2.73 � 1.51c
a The FISH analyses noted as (‰) are presented per 1000 metaphases. Values are presented as means � SD. b Subjects lost to analysis: 1 administrative control subject, 1 monomer production worker, and 3 polymerization workers.c Significantly different from monomer group at P � 0.05 by Kruskal-Wallis test.
Table 44. Chromosomal Changes Identified by FISH: Effects in the CYP2E1 5� Promoter Region Genotypea
AberrationC1/C1
(n = 70)C1/C2b
(n = 2)
Chromosomal aberrations (‰)
4.68 � 3.20 10.27 � 3.70
Translocations (‰) 7.19 � 5.49 18.41 � 10.40Reciprocal
translocations (‰)2.32 � 2.30 8.57 � 6.10
Conjunctions (‰) 8.01 � 6.45 19.26 � 9.20FG/100 2.68 � 2.05 6.88 � 3.88
a The FISH analyses noted as (‰) are presented per 1000 metaphases. Values are presented as means � SD.
b All values are significantly different from the C1/C1 genotype at P � 0.05 by t test.
Cytogenetic Analysis
Table 45. FG / 100 Identified by FISH: Effects in the EH113 Genotypea,b
Control(n � 24)
Monomer(n � 21)
Polymer(n � 27)
Tyr113/Tyr113 2.50 � 1.43 2.98 � 2.93 2.96 � 1.35Tyr113/His113 4.03 � 3.37 1.58 � 1.12 4.27 � 2.78His113/His113 1.21 � 0.58 4.35 � 4.64 2.76 � 2.14
a Values are shown as means � SD of stable translocations/100 cells.b We noted a significant exposure-group–by–genotype interaction, which
reflects that the Tyr113/His113 genotype had the highest means for the control and polymer groups and the lowest mean for the monomer group.

106
Biomarkers in Czech Workers Exposed to 1,3-Butadiene
correlated with age and it can be influenced by clonalamplification of the cells with translocations. For thesereasons, we reviewed the FISH data for FG/100; of the cellswith a stable translocation, we eliminated those with evi-dence of possible clonal expansion and reanalyzed thedata from all remaining subjects. Table 43 shows theresulting values; the mean difference between the polymerand monomer groups was statistically significant (P � 0.05)in this highly restricted analysis, but the biological signifi-cance of this finding is uncertain because we found no dif-ferences between exposed and control subjects.
SCEs
Assays for SCEs were successfully completed for 73 sub-jects (88%): None (0%) of the assays were unsuccessful forthe administrative control subjects, seven (29%) wereunsuccessful for monomer production workers, and three(9%) were unsuccessful for polymerization workers.
Table 46 shows the group mean results for SCEs and thepercentage of HFCs; none of these values differed signifi-cantly from each other. Furthermore, none of the geno-types determined in this study, including the GST poly-morphisms, showed an effect on SCEs.
Spearman correlation coefficients were computed toassess relations between SCEs or percentage of HFCs andBD exposures and showed no significant correlations.Analyzing the relation between smoking and mean SCEsor percentage of HFCs revealed significantly highervalues for both of these endpoints in smokers comparedwith nonsmokers, both for the entire study group andwithin the polymer group. (See Figure 30 for a visualsummary that compares data for smoking status withSCEs and percentage of HFCs.) No significant interactionwas identified between smoking and exposure group foreither endpoint.
Regression analyses showed no significant effect of BDexposure (using either direct exposure measurements orbiomarkers as surrogate measures of exposure) on SCEs orpercentage of HFCs after adjusting for age and current
smoking status. Furthermore, the effect of smoking onthese two endpoints remained significant after adjustingfor age and BD exposure.
On the basis of information supplied on the question-naires, we analyzed the following small groups andobtained these results:
• SCEs and percentage of HFCs were related to cumula-tive cigarette consumption (r � 0.376, P � 0.001 forSCEs; r � 0.268, P � 0.020 for HFCs).
• The mean percentage of HFCs was significantlyhigher in five subjects with a history of liver disease(P � 0.040 by Mann-Whitney test), and in 14 workerswho reported never having had an x-ray (P � 0.049 byMann-Whitney test).
Table 46. SCEs and HFCs by Groupa
Control (n � 25)
Monomer (n � 17)
Polymer (n � 31)
SCEs/cell 6.32 � 0.87 6.14 � 0.94 6.47 � 0.87HFCs (%) 2.72 � 4.65 2.71 � 3.67 3.57 � 3.67
a Values are shown as means � SD. Subjects lost to analysis: 7 monomer production workers and 3 polymerization workers. We found no significant differences among exposure groups.
Figure 30. Summary of the data comparing smoking status with SCEs andHFCs. Hatched boxes � subjects who do not currently smoke; gray boxes �subjects who do. The upper and lower boundaries of the boxes represent the75th and 25th percentiles, respectively. Error bars are the highest and lowestvalues within 1.5 box-lengths from each percentile. The line within each boxmarks the position of the median value. The dots are values that are morethan 1.5 box-lengths from the 75th percentile.

107
• The mean percentage of HFCs was lower in sixworkers with a history of kidney disease (P � 0.042by Mann-Whitney test).
In summary, although both of the SCE endpoints weresignificantly correlated with smoking, no relation to BDexposure was found.
DISCUSSION AND CONCLUSIONS
The cytogenetic endpoints did not prove to be sensitiveindicators of BD exposure at the levels encountered inthese facilities. Chromosomal aberrations identified by theconventional method, chromosomal changes identified bythe newer FISH techniques, and our analyses of SCEsand HFCs produced similarly negative findings. SCEs andsome of the aberrations we scored were affected by smoking,which indicates that the methods used could detect expo-sures known to affect these endpoints.
Chromosomal aberrations determined by either the con-ventional method or FISH analysis were elevated in thecurrent control group compared with a group of historicalcontrol subjects (Rube et al 1998; P Rössner, personalcommunication of unpublished results, 2000). Data for thehistorical control group were obtained from severalsources in the Czech Republic and may not be strictly com-parable with industry control subjects. Analysis of ques-tionnaire responses in this study did not reveal a reasonfor the elevations among control subjects. However, thevigorous exposure assessment in the current study and theavailability of surrogate measures of exposure (eg, the uri-nary metabolites M2 and M1, and the Hb adducts THBValand HBVal) added certainty that these high values werenot due to BD exposure.
Analysis of cytogenetic changes by genotypes showedsome associations, but none with the GST polymorphismsthat have been previously reported (Norppa et al 1995;Uuskula et al 1995). Furthermore, associations with allelesat the EH113 and EH139 loci showed conflicting results,with both high-activity and low-activity alleles producinglower frequencies of chromosomal aberrations relative toBD exposures. Much larger studies are needed to make def-inite statements regarding these genotype associations, butthe observations here will be valuable additions to thosefrom future studies and provide direction for investiga-tions in transgenic animals.
Previous results of cytogenetic changes observed in theNovember 1994 sampling of similar workers in the samepetrochemical company were not found in the currentstudy. These differences could not be explained bychanges in technology during the years between 1994 and1998 or by a decrease or increase in the BD exposures;
s
comparing the exposures of monomer production workersbetween 1994 and 1998 showed no differences in thelevels of BD. The only difference between the studiesseems to be the sampling period: The 1994 samples werecollected in November, the 1998 samples for the currentstudy were collected in May and June. We might speculatethat the same level of BD may not affect workers in thesame way during the spring season as during the winter.For example, due to a higher temperature in spring, BDcould more rapidly evaporate from the workers’ breathingzones. The only way to investigate this possibility is torepeat blood sampling during the winter.
Cytogenetic Analysis
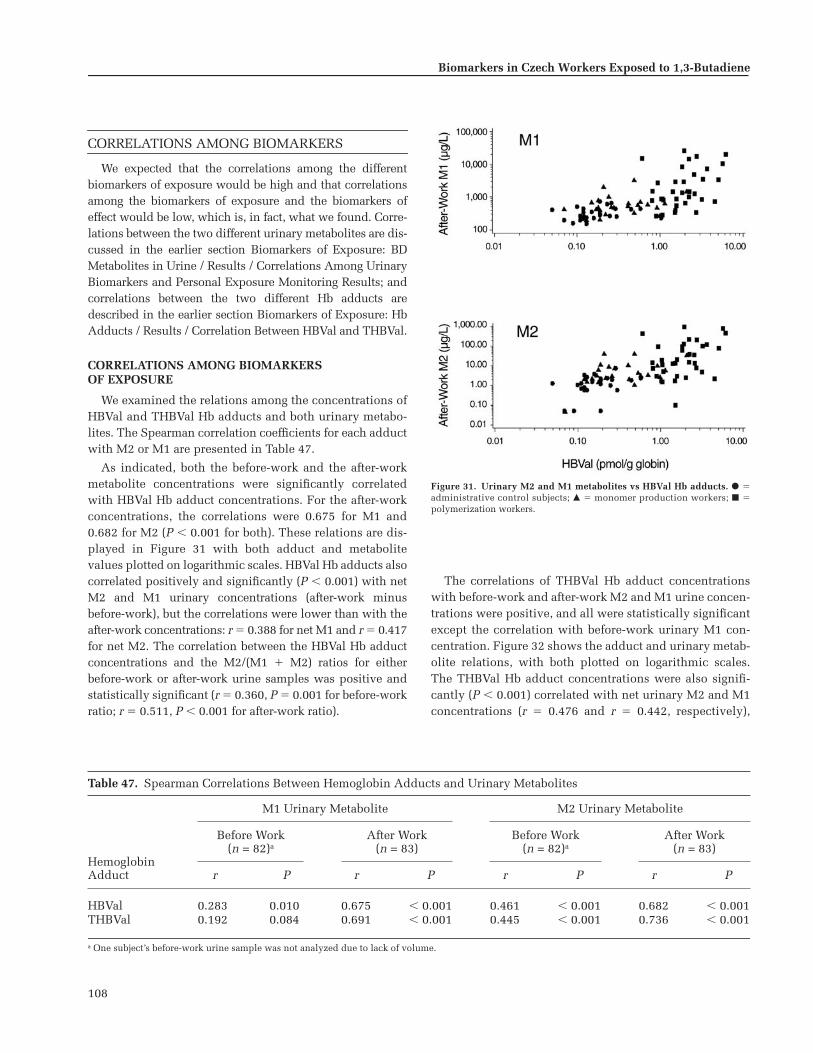
108
Biomarkers in Czech Workers Exposed to 1,3-Butadiene
CORRELATIONS AMONG BIOMARKERS
We expected that the correlations among the differentbiomarkers of exposure would be high and that correlationsamong the biomarkers of exposure and the biomarkers ofeffect would be low, which is, in fact, what we found. Corre-lations between the two different urinary metabolites are dis-cussed in the earlier section Biomarkers of Exposure: BDMetabolites in Urine / Results / Correlations Among UrinaryBiomarkers and Personal Exposure Monitoring Results; andcorrelations between the two different Hb adducts aredescribed in the earlier section Biomarkers of Exposure: HbAdducts / Results / Correlation Between HBVal and THBVal.
CORRELATIONS AMONG BIOMARKERSOF EXPOSURE
We examined the relations among the concentrations ofHBVal and THBVal Hb adducts and both urinary metabo-lites. The Spearman correlation coefficients for each adductwith M2 or M1 are presented in Table 47.
As indicated, both the before-work and the after-workmetabolite concentrations were significantly correlatedwith HBVal Hb adduct concentrations. For the after-workconcentrations, the correlations were 0.675 for M1 and0.682 for M2 (P � 0.001 for both). These relations are dis-played in Figure 31 with both adduct and metabolitevalues plotted on logarithmic scales. HBVal Hb adducts alsocorrelated positively and significantly (P � 0.001) with netM2 and M1 urinary concentrations (after-work minusbefore-work), but the correlations were lower than with theafter-work concentrations: r � 0.388 for net M1 and r � 0.417for net M2. The correlation between the HBVal Hb adductconcentrations and the M2/(M1 � M2) ratios for eitherbefore-work or after-work urine samples was positive andstatistically significant (r � 0.360, P � 0.001 for before-workratio; r � 0.511, P � 0.001 for after-work ratio).
The correlations of THBVal Hb adduct concentrationswith before-work and after-work M2 and M1 urine concen-trations were positive, and all were statistically significantexcept the correlation with before-work urinary M1 con-centration. Figure 32 shows the adduct and urinary metab-olite relations, with both plotted on logarithmic scales.The THBVal Hb adduct concentrations were also signifi-cantly (P � 0.001) correlated with net urinary M2 and M1concentrations (r � 0.476 and r � 0.442, respectively),
Table 47. Spearman Correlations Between Hemoglobin Adducts and Urinary Metabolites
M1 Urinary Metabolite M2 Urinary Metabolite
HemoglobinAdduct
Before Work(n = 82)a
After Work(n = 83)
Before Work(n = 82)a
After Work(n = 83)
r P r P r P r P
HBVal 0.283 0.010 0.675 � 0.001 0.461 � 0.001 0.682 � 0.001THBVal 0.192 0.084 0.691 � 0.001 0.445 � 0.001 0.736 � 0.001
a One subject’s before-work urine sample was not analyzed due to lack of volume.
Figure 31. Urinary M2 and M1 metabolites vs HBVal Hb adducts. � �administrative control subjects; � � monomer production workers; � �polymerization workers.

109
CORRELATIONS AMONG BIOMARKERS OF EXPOSURE AND BIOMARKERS OF EFFECT
HPRT Mutations Assessed by the Cloning Assay(Mutant Frequencies)
Cloning assay results for 75 of the 83 study subjects(90%) were analyzed. For the remaining eight, the assaywas either unsuccessful or yielded an MF of zero. Sampleswere lost to study for one (4%) administrative control sub-ject, five (21%) monomer production workers, and two(6%) polymerization workers. Correlations of HPRT MFvalues with urinary M2 and M1 metabolites and withHBVal and THBVal adduct concentrations were analyzedand no significant correlations were found (Table 48).
HPRT Mutations Assessed by the Autoradiographic Assay (Variant Frequencies)
Although blood samples were obtained from all 83study subjects, successful measurement by autoradio-graphic assay with results suitable for analysis was accom-plished on only 49 subjects (59%) for reasons described inthe earlier section Biomarkers of Effect: Assays of HPRTMutations in Human Lymphocytes / Results of the Auto-radiographic Assay / Quality of Lymphocyte Samples. Anacceptable autoradiographic assay was performed on sam-ples from 18 administrative control subjects, 16 monomerproduction workers, and 15 polymerization workers.
The Spearman correlations between HPRT VF and uri-nary metabolite concentrations are presented in Table 48for all 49 study subjects for whom VFs were determinedand for the 31 exposed subjects. When all 49 subjects were
Figure 32. Urinary M2 and M1 metabolites vs THBVal Hb adducts. � �administrative control subjects; � � monomer production workers; � �polymerization workers.
Table 48. Spearman Correlations Between HPRT Mutant or Variant Frequency and Urinary Metabolitesor Hemoglobin Adducts
HPRT Mutant Frequencya HPRT Variant Frequencyb
Measure ofBD Exposure
All Subjects(n = 75)
ExcludingControls(n = 51)
All Subjects(n = 49)
ExcludingControls(n = 31)
r P r P r P r P
Urinary MetaboliteM1 after work 0.033 0.778 0.067 0.962 �0.435 0.002 �0.343 0.059M2 after work 0.059 0.617 0.058 0.688 �0.394 0.005 �0.346 0.056
Hemoglobin AdductHBVal 0.158 0.175 0.144 0.315 �0.244 0.091 �0.100 0.594THBVal 0.182 0.118 0.235 0.098 �0.303 0.034 �0.029 0.875
a Mutant frequencies were computed only for samples with clonable cells in which MF � 0.b Variant frequencies were computed only for samples containing at least 400,000 evaluatable cells.
although the correlations are lower than those based on theafter-work metabolite concentrations. The Spearman cor-relations between THBVal Hb adduct concentrations andM2/(M1 � M2) ratios were also positive and statisticallysignificant (P � 0.001) for both before-work (r � 0.421) andafter-work (r � 0.576) urine samples.
Correlations Among Biomarkers
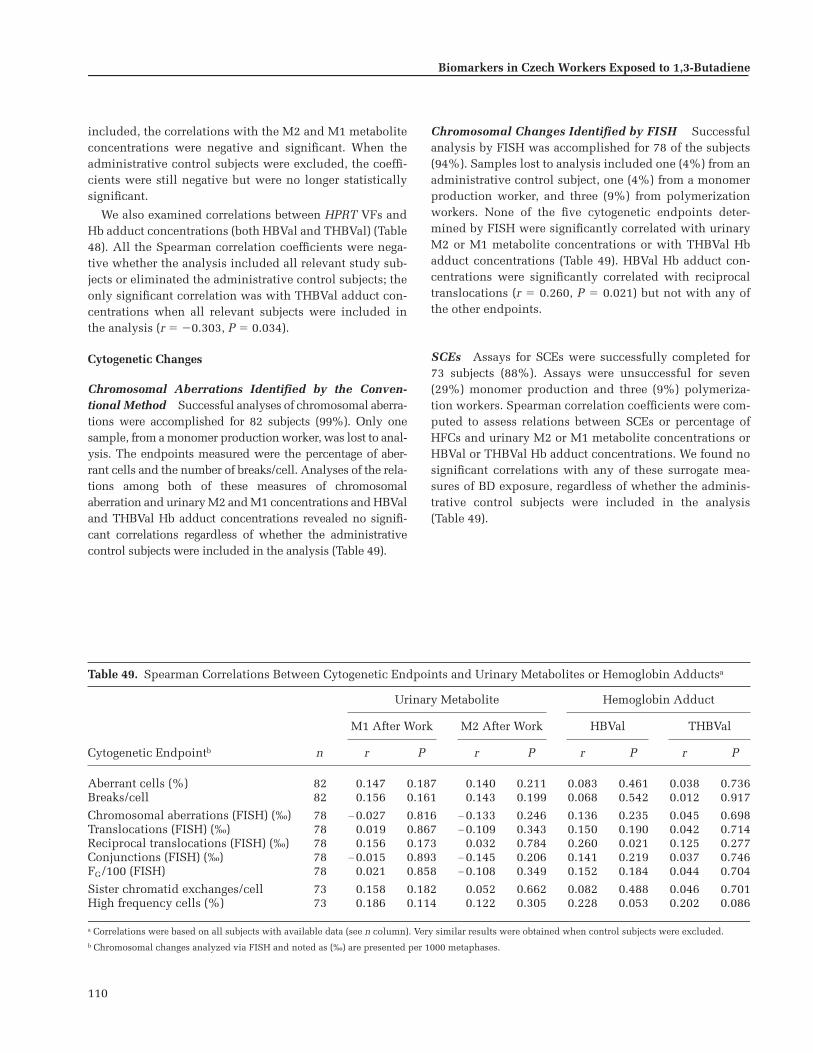
110
Biomarkers in Czech Workers Exposed to 1,3-Butadiene
included, the correlations with the M2 and M1 metaboliteconcentrations were negative and significant. When theadministrative control subjects were excluded, the coeffi-cients were still negative but were no longer statisticallysignificant.
We also examined correlations between HPRT VFs andHb adduct concentrations (both HBVal and THBVal) (Table48). All the Spearman correlation coefficients were nega-tive whether the analysis included all relevant study sub-jects or eliminated the administrative control subjects; theonly significant correlation was with THBVal adduct con-centrations when all relevant subjects were included inthe analysis (r � �0.303, P � 0.034).
Cytogenetic Changes
Chromosomal Aberrations Identified by the Conven-tional Method Successful analyses of chromosomal aberra-tions were accomplished for 82 subjects (99%). Only onesample, from a monomer production worker, was lost to anal-ysis. The endpoints measured were the percentage of aber-rant cells and the number of breaks/cell. Analyses of the rela-tions among both of these measures of chromosomalaberration and urinary M2 and M1 concentrations and HBValand THBVal Hb adduct concentrations revealed no signifi-cant correlations regardless of whether the administrativecontrol subjects were included in the analysis (Table 49).
Chromosomal Changes Identified by FISH Successfulanalysis by FISH was accomplished for 78 of the subjects(94%). Samples lost to analysis included one (4%) from anadministrative control subject, one (4%) from a monomerproduction worker, and three (9%) from polymerizationworkers. None of the five cytogenetic endpoints deter-mined by FISH were significantly correlated with urinaryM2 or M1 metabolite concentrations or with THBVal Hbadduct concentrations (Table 49). HBVal Hb adduct con-centrations were significantly correlated with reciprocaltranslocations (r � 0.260, P � 0.021) but not with any ofthe other endpoints.
SCEs Assays for SCEs were successfully completed for73 subjects (88%). Assays were unsuccessful for seven(29%) monomer production and three (9%) polymeriza-tion workers. Spearman correlation coefficients were com-puted to assess relations between SCEs or percentage ofHFCs and urinary M2 or M1 metabolite concentrations orHBVal or THBVal Hb adduct concentrations. We found nosignificant correlations with any of these surrogate mea-sures of BD exposure, regardless of whether the adminis-trative control subjects were included in the analysis(Table 49).
Table 49. Spearman Correlations Between Cytogenetic Endpoints and Urinary Metabolites or Hemoglobin Adductsa
Urinary Metabolite Hemoglobin Adduct
Cytogenetic Endpointb
M1 After Work M2 After Work HBVal THBVal
n r P r P r P r P
Aberrant cells (%) 82 0.147 0.187 0.140 0.211 0.083 0.461 0.038 0.736Breaks/cell 82 0.156 0.161 0.143 0.199 0.068 0.542 0.012 0.917
Chromosomal aberrations (FISH) (‰) 78 �0.027 0.816 �0.133 0.246 0.136 0.235 0.045 0.698Translocations (FISH) (‰) 78 0.019 0.867 �0.109 0.343 0.150 0.190 0.042 0.714Reciprocal translocations (FISH) (‰) 78 0.156 0.173 0.032 0.784 0.260 0.021 0.125 0.277Conjunctions (FISH) (‰) 78 �0.015 0.893 �0.145 0.206 0.141 0.219 0.037 0.746FG/100 (FISH) 78 0.021 0.858 �0.108 0.349 0.152 0.184 0.044 0.704
Sister chromatid exchanges/cell 73 0.158 0.182 0.052 0.662 0.082 0.488 0.046 0.701High frequency cells (%) 73 0.186 0.114 0.122 0.305 0.228 0.053 0.202 0.086
a Correlations were based on all subjects with available data (see n column). Very similar results were obtained when control subjects were excluded.b Chromosomal changes analyzed via FISH and noted as (‰) are presented per 1000 metaphases.

111
Correlations Among the Biomarkers of Effect:HPRT Mutations and Cytogenetic Endpoints
HPRT mutations were determined by both the autora-diographic and cloning assays. Mutations were not associ-ated with BD exposure regardless of the method used toassess them. Several measures of cytogenetic changes werealso analyzed. As noted earlier, none of the cytogeneticendpoints was significantly associated with BD exposurelevels, whether assessed by direct measurements or surro-gate markers of exposure.
Table 50 shows that the HPRT mutations, expressed asVF or MF, were not significantly correlated with any of thecytogenetic endpoints measured. Thus, not only werethese biomarkers of genetic effects unrelated to BD expo-sures, they were also unrelated to each other.
CONCLUSIONS
All of the biomarkers of exposure that we evaluatedproved to be valid surrogate measures of BD exposure. It isnot surprising, therefore, that these biomarkers (M2 andM1 urinary metabolites and the HBVal and THBVal Hbadducts) were all highly correlated with each other. To thecontrary, none of the biomarkers of effect that we evalu-ated proved to be valid surrogate measures of BD exposure.Thus, the lack of positive correlation between any of thebiomarkers of effect and any of the biomarkers of exposureis consistent with and supports this observation. This isfurther reflected in the lack of correlation between either ofthe two measures of HPRT mutations and any of the sev-eral cytogenetic endpoints evaluated.
Table 50. Spearman Correlations Between Cytogenetic Endpoints and HPRT Mutationsa
Cytogenetic Endpointb
Mutant Frequency viaCloning Assay
Variant Frequency viaAutoradiographic Assay
n r P n r P
Aberrant cells (%) 74 0.045 0.703 49 0.015 0.921Breaks/cell 74 0.066 0.575 49 0.035 0.812
Chromosomal aberrations (FISH) (‰) 71 �0.064 0.596 47 0.251 0.088Translocations (FISH) (‰) 71 �0.071 0.557 47 0.201 0.175Reciprocal translocations (FISH) (‰) 71 0.041 0.732 47 0.077 0.608Conjunctions (FISH) (‰) 71 �0.077 0.524 47 0.179 0.228FG/100 (FISH) 71 �0.068 0.575 47 0.200 0.177
Sister chromatid exchanges/cell 66 �0.004 0.977 42 �0.065 0.685High frequency cells (%) 66 0.031 0.805 42 �0.286 0.067
a Correlations were based on all subjects with available data (see n columns). Very similar results were obtained when control subjects were excluded. b Chromosomal changes analyzed via FISH and noted as (‰) are presented per 1000 metaphases.
Correlations Among Biomarkers

112
Biomarkers in Czech Workers Exposed to 1,3-Butadiene
DISCUSSION AND CONCLUSIONS
This was a transitional epidemiologic study in whichwe evaluated a continuum of biomarkers for their sensi-tivity to detect and quantify BD exposures in the occupa-tional setting.
EXPOSURE ASSESSMENT
The foundation of the study was an extensive exposureassessment phase that was critical for the study to succeed.The scheme was designed to measure each worker’s actualBD exposure as accurately as possible and to allow for day-to-day variations. Over a 60-day interval, each worker’spersonal BD exposure was measured eight to ten times,and his contact with styrene, benzene, and toluene wasdetermined. Workplace area concentrations of all of theseagents were also measured.
An important consideration in designing our exposureassessment scheme was the uncertain patterns of exposureexperienced by the workers. Exposure to BD might bestable and constant over time or it may be episodic or vari-able. The latter possibility raised the problem of appropri-ately timing the exposure measurements to correspond tothe biomarkers being evaluated because each biomarkerhas a characteristic time of expression and duration of per-sistence. Because several biomarkers were being evalu-ated, several expression times and persistence intervalsneeded to be considered. These kinetic factors were builtinto the design of our exposure assessment scheme.
The biomarkers evaluated in the current study areshown in Table 51 with their levels of specificity and prob-able expression and persistence times. The metabolitesmeasured in urine are listed as specific for BD exposure.
However, the relatively high background levels of M1 inthe administrative control subjects in this study raisesquestions about this specificity. It is possible that some ofthe M1 originates from an endogenous source. Similarly,because we assumed that urinary metabolites are excretedwithin hours of exposure, we listed a short persistenceduration in Table 51. As discussed below, however, ourfindings also cast doubt on this assumption.
The biomarkers measured in blood have longer expres-sion times. First, hemoglobin adducts reflect cumulativeexposures over the past four months. They disappear at arate of approximately 1% per day after exposure ceases. Asnoted, although the THBVal hemoglobin adducts reflect invivo concentrations of the BDO-diol metabolite, they toowere frequently detectable at appreciable concentrationsin individuals not exposed to BD. Therefore, they mayhave some exogenous (or even endogenous) source otherthan BD. For this reason, hemoglobin adducts are listed as“somewhat specific” in Table 51. Second, newly inducedHPRT mutations in lymphocytes evolve for weeks tomonths before they reach their full expression and theoptimal time to recover them from blood; they may persistfor months to years. Third, several of the chromosomalchanges measured in this study result from underlyingDNA damage that occurred in vivo (perhaps within hoursto days of a genotoxic exposure) but that can only beassessed as irreversible chromosomal changes by removingthe cells from the body and cultivating them in vitro.Exceptions are the stable translocations, which most likelyarise in vivo and, like the mutations, take weeks to monthsto reach their maximal appearance. Although they begin todecline soon after the exposure, most chromosomalchanges persist for days to months and stable transloca-tions persist for years.
Table 51. Biomarkers Assessed in BD Study
Source BiomarkerTime of
ExpressionDuration ofPersistence Specificity
Urine M2 urinary metabolite Hours Hours VeryUrine M1 urinary metabolite Hours Hours Somewhat
Blood Hemoglobin adducts Cumulative Months SomewhatBlood HPRT mutations via cloning Months Months to years NonspecificBlood HPRT mutations via autoradiography Weeks Months to years Nonspecific
Blood Chromosomal aberrations via the conventional method Hours Days to months NonspecificBlood Chromosomal changes via FISHa Hours Months to years NonspecificBlood Sister chromatid exchanges Hours Days to weeks Nonspecific
a Translocations persist longer than other aberrations.

113
Because of these timing variables, exposure measure-ments were obtained at times relevant to each of thebiomarkers being evaluated. Exposure measurements atan intermediate time (weeks to months) before bloodsample collections were optimal for evaluating hemo-globin adducts, HPRT mutations, and stable chromo-somal translocations; exposure measurements at a shortertime interval (days to weeks) before sample collectionwere optimal for evaluating most of the other chromo-somal changes; and exposure measurements immediately(hours) before urine sample collection were optimal forevaluating the short-lived urinary metabolites. Thus, wespaced exposure measurements semirandomly throughoutthe 60-day exposure assessment period and ensured thatat least one of the measurements was taken early in theperiod.
The average BD exposures of the workers involved inthis study were quite moderate and indicate well-run facil-ities. The group means were within the range of those citedin other studies (Tates et al 1996; Ward et al 1994, 1996b;
rám et al 1998; Hayes et al 2000; Ma et al 2000) andmonomer production workers had, on average, lowerexposures than polymerization workers. Of note is thewide day-to-day variability of individual worker exposurelevels in both exposed groups. It is possible that, eventhough multiple measurements of exposure were madeduring the 60-day period (covering about 12–15% of eachworker’s work time), some “high-exposure” days weremissed, possibly underestimating some workers’ averageexposures. As expected, the administrative control sub-jects had very low-level (near outdoor ambient) BD expo-sures. Although only single measurements were made foreach administrative control subject, the narrow range ofinterindividual levels suggests that intraindividual vari-ability also was small.
The exposure concentrations of styrene, benzene, andtoluene were quite low, although styrene levels were sig-nificantly higher in the polymerization workers. (Althoughwe considered measuring dimethyldithiocarbamate in thisstudy, we didn’t because it had never been used at thesefacilities.) Workplace area measurements of all agents wereconsistent with the workers’ exposures as determinedfrom personal monitoring. The plan to measure peak levelsof BD exposure by mini-photoionization chambers couldnot be accomplished primarily because of equipmentfailure. The loss of this important metric must be consid-ered a deficiency. Despite this, however, the current expo-sure assessment is the most extensive ever achieved in theBD industry and the only one in a transitional epidemio-logic study to take into account the kinetics of individualbiomarkers.
S
STUDY SUBJECTS
Questionnaire and interview responses indicated thatthe exposed and control groups in this study were wellbalanced with regard to age and smoking habits but noteducation; furthermore, the assignment of interviewers toexposure groups may have introduced bias to the informa-tion obtained. Questionnaires revealed some differencesamong exposure groups in terms of diet, health, and medi-cation variables. We found no significant differences amongthe exposure groups studied for any of the metabolic geno-types determined (ie, CYP2E1, GSTM1 and GSTT1, andthe EH and ADH isoforms).
URINARY METABOLITES
The urinary M2 and M1 metabolite concentrationsdetermined in this study correlated well with BD expo-sures, both at the group level and for individual workers.The metabolites were assayed from aliquots of urine sam-ples obtained before and after workshifts on the first ofthree days at the end of the exposure assessment period.Their concentrations were not influenced by smoking.These metabolites proved to be sensitive biomarkers fordetecting BD exposure in humans.
In addition to their value as biomarkers of exposure, theurinary metabolite concentrations determined in thisstudy proved instructive regarding BD metabolism inhumans. The differences between the monomer produc-tion and polymerization workers were 6.1-fold in thisstudy for metabolite concentrations of M2 and 12.7-foldfor concentrations of M1, whereas the difference in BDexposure levels was only 2.7-fold (Table 52). This is con-sistent with threshold effects whereby increasing concen-trations of BD stimulate various metabolic pathways dif-ferently, at least for detoxification. However, there may besimpler explanations for these observations. Both themetabolite and the BD exposure data are highly skewedand the proportionality of the means depends on how theyare distributed. Comparing the medians shows the relativeincreases to be more similar. Also, the urinary metabolitesreflect recent exposures, whereas BD measurements areaverages over a 60-day period. High BD exposures on theday of urine collection could result in high metabolitevalues and, hence, a high mean, whereas the mean BDexposure level is less influenced by single high-exposuremeasurements.
It has been assumed that both the M2 and M1 metabo-lites are short lived, persisting for a matter of hours. Theplan in this study therefore was to measure BD exposuresby personal monitors daily on the last three days of theexposure assessment period and to obtain urine samples
Discussion and Conclusions
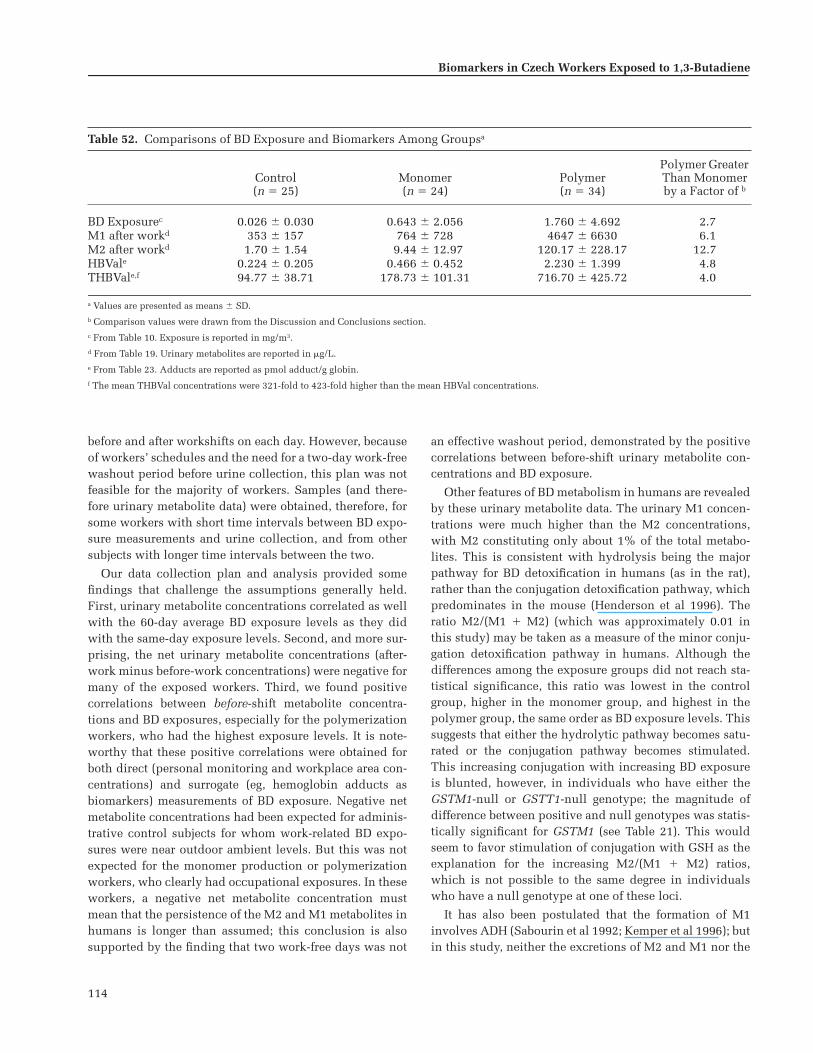
114
Biomarkers in Czech Workers Exposed to 1,3-Butadiene
before and after workshifts on each day. However, becauseof workers’ schedules and the need for a two-day work-freewashout period before urine collection, this plan was notfeasible for the majority of workers. Samples (and there-fore urinary metabolite data) were obtained, therefore, forsome workers with short time intervals between BD expo-sure measurements and urine collection, and from othersubjects with longer time intervals between the two.
Our data collection plan and analysis provided somefindings that challenge the assumptions generally held.First, urinary metabolite concentrations correlated as wellwith the 60-day average BD exposure levels as they didwith the same-day exposure levels. Second, and more sur-prising, the net urinary metabolite concentrations (after-work minus before-work concentrations) were negative formany of the exposed workers. Third, we found positivecorrelations between before-shift metabolite concentra-tions and BD exposures, especially for the polymerizationworkers, who had the highest exposure levels. It is note-worthy that these positive correlations were obtained forboth direct (personal monitoring and workplace area con-centrations) and surrogate (eg, hemoglobin adducts asbiomarkers) measurements of BD exposure. Negative netmetabolite concentrations had been expected for adminis-trative control subjects for whom work-related BD expo-sures were near outdoor ambient levels. But this was notexpected for the monomer production or polymerizationworkers, who clearly had occupational exposures. In theseworkers, a negative net metabolite concentration mustmean that the persistence of the M2 and M1 metabolites inhumans is longer than assumed; this conclusion is alsosupported by the finding that two work-free days was not
an effective washout period, demonstrated by the positivecorrelations between before-shift urinary metabolite con-centrations and BD exposure.
Other features of BD metabolism in humans are revealedby these urinary metabolite data. The urinary M1 concen-trations were much higher than the M2 concentrations,with M2 constituting only about 1% of the total metabo-lites. This is consistent with hydrolysis being the majorpathway for BD detoxification in humans (as in the rat),rather than the conjugation detoxification pathway, whichpredominates in the mouse (Henderson et al 1996). Theratio M2/(M1 � M2) (which was approximately 0.01 inthis study) may be taken as a measure of the minor conju-gation detoxification pathway in humans. Although thedifferences among the exposure groups did not reach sta-tistical significance, this ratio was lowest in the controlgroup, higher in the monomer group, and highest in thepolymer group, the same order as BD exposure levels. Thissuggests that either the hydrolytic pathway becomes satu-rated or the conjugation pathway becomes stimulated.This increasing conjugation with increasing BD exposureis blunted, however, in individuals who have either theGSTM1-null or GSTT1-null genotype; the magnitude ofdifference between positive and null genotypes was statis-tically significant for GSTM1 (see Table 21). This wouldseem to favor stimulation of conjugation with GSH as theexplanation for the increasing M2/(M1 � M2) ratios,which is not possible to the same degree in individualswho have a null genotype at one of these loci.
It has also been postulated that the formation of M1involves ADH (Sabourin et al 1992; Kemper et al 1996); butin this study, neither the excretions of M2 and M1 nor the
Table 52. Comparisons of BD Exposure and Biomarkers Among Groupsa
Control(n � 25)
Monomer(n � 24)
Polymer(n � 34)
Polymer Greater Than Monomerby a Factor of b
BD Exposurec 0.026 � 0.030 0.643 � 2.056 1.760 � 4.692 2.7M1 after workd 353 � 157 764 � 728 4647 � 6630 6.1M2 after workd 1.70 � 1.54 9.44 � 12.97 120.17 � 228.17 12.7HBVale 0.224 � 0.205 0.466 � 0.452 2.230 � 1.399 4.8THBVale,f 94.77 � 38.71 178.73 � 101.31 716.70 � 425.72 4.0
a Values are presented as means � SD.b Comparison values were drawn from the Discussion and Conclusions section.c From Table 10. Exposure is reported in mg/m3.d From Table 19. Urinary metabolites are reported in �g/L.e From Table 23. Adducts are reported as pmol adduct/g globin.f The mean THBVal concentrations were 321-fold to 423-fold higher than the mean HBVal concentrations.

115
ratio M2/(M1 � M2) showed any correlation with ADH geno-types. However, these findings do not exclude a possiblerole for ADH in the formation of M1. For ADH2, which wasone of the ADH polymorphisms we studied, very fewworkers carried the variant allele.
Another unexpected observation in this study was anassociation between subjects with the CYP2E1 D/D geno-type and increased production of the M2 metabolite, asdemonstrated by higher M2/(M1 � M2) ratios relative toBD exposure levels. The significance of this remains to bedefined; comparative studies of transgenic rodents mayhelp to clarify the finding and further elucidate the meta-bolic pathways of BD.
The BD urinary metabolite results illustrate how molec-ular epidemiologic findings in humans can be used, alongwith animal data, for the overall toxicologic evaluation of achemical. From the urinary metabolite data, it might beexpected that even if BDO2 is formed in humans, it is rap-idly hydrolyzed to BDO-diol, or erythritol, or both, or itmay be further metabolized by conjugation with GSH(Boogaard and Bond 1996; Boogaard et al 1996). Therefore,very little BDO2 should be available to react with DNA.Unfortunately, we have no data on the actual excretion ofthe BDO2 metabolite. However, the data on hemoglobinadduct formation in this study is consistent with the inter-pretation derived from the urinary M2 and M1 metaboliteresults.
HEMOGLOBIN ADDUCTS
We evaluated two hemoglobin adducts: The HBValhemoglobin adduct provides a measure of in vivo concen-trations of BDO (the first oxidation product of BD) and theTHBVal hemoglobin adduct measures in vivo concentra-tions of BDO2 and BDO-diol (however, current evidenceabout THB-DNA adducts indicates that BDO-diol is thepredominant contributor to the THBVal hemoglobin adduct[Pérez et al 1997; Koivisto et al 1999]).
The group mean concentrations of both hemoglobinadducts were significantly higher in the monomer groupthan in the control group, and significantly higher in thepolymer group than in either of the other two exposuregroups. This is the order of increasing BD exposures,which indicates that the adduct concentrations clearlyreflect exposure levels. As we found with the urinary M2and M1 metabolite concentrations, the increases in meanhemoglobin adduct concentrations in the exposure groupsdeparted somewhat from linearity: the 2.7-fold differencein BD exposure between the monomer and polymer groupsresulted in a 4.8-fold difference in HBVal concentrationsand a 4.0-fold difference in THBVal concentrations (Table
52). This nonlinear relation is characterized by the expo-nential equation relating workers’ adduct concentrationsto their measured BD exposures, and, as we found withurinary metabolites, is consistent with a threshold effect inmetabolism. These increases in adduct concentrations moreclosely reflect the increases in 60-day average BD exposurelevels than do the increases in urinary metabolite concen-trations. Because hemoglobin adducts reflect cumulativeBD exposures, we expected this on statistical grounds.
The mean THBVal hemoglobin adduct concentrationswere from 368-fold to 600-fold higher than the meanHBVal hemoglobin adduct concentrations; this relationpresumably reflects the predominance of the hydrolyticpathway in humans resulting in a much greater in vivoaccumulation of BDO-diol than BDO. The differencebetween THBVal and HBVal concentrations has also beenobserved for DNA adducts in rodents at low, but not high,BD exposure levels; those observations have been inter-preted as the metabolism of BDO to BDO2 or BD-diolreaching saturation (Koc et al 1999). It is noteworthy thatthe humans in this study were exposed to lower BD levelsthan the rodents studied, but the ratios between the hemo-globin adducts were higher in the humans than in therodents. This is consistent with a report that, at high con-centrations, BD inhibits further oxidation of BDO (Dahland Henderson 2000). Despite the differences in absoluteconcentrations, the HBVal and THBVal hemoglobin adductswere highly correlated with each other in this study.
Both the HBVal and the THBVal adduct concentrationsalso were highly correlated with BD exposures for indi-vidual workers’ average exposures (Spearman coefficientsof 0.676 for HBVal and 0.737 for THBVal). These coeffi-cients are remarkable given that BD exposures were mea-sured over only 12% to 15% of the time for which theadducts showed cumulative internal doses. It well may bethat the correlation coefficients would be even greater ifBD exposure had been measured over the total time andthat the adducts are, in fact, better indicators of exposurethan are the external BD measurements. Nevertheless, inequations that were developed to relate the adducts to BDexposure levels, 72% to 77% of the variability in workers’adduct concentrations could be explained by differences intheir measured BD exposures. These equations should betested in subsequent studies that include even more com-plete exposure measurements with the goal of developing abiological exposure index using hemoglobin adducts.
The current study showed quite high THBVal adductconcentrations in the administrative control subjects whohad virtually no exogenous BD exposures (see Table 23).The concentrations of this adduct in administrative con-trol subjects were also higher in this study than previously
Discussion and Conclusions

116
Biomarkers in Czech Workers Exposed to 1,3-Butadiene
reported for control subjects in China (Hayes et al 2000).The reasons for this are currently unknown; it is possiblethat the THBVal adducts are nonspecific and thus reflectother exogenous exposures or reactions with products ofendogenous metabolism.
Genotypes for CYP2E1, GST, EH, and ADH polymor-phisms were obtained for all workers. Although theCYP2E1, GST, and ADH polymorphisms did not show asso-ciations with hemoglobin adducts, one of the EH polymor-phisms did. Workers with the Arg139/Arg139 homozygousgenotype (the allele with increased activity) had signifi-cantly lower HBVal and THBVal adduct concentrationsrelative to BD exposure levels than did workers with theother two genotypes of this polymorphism. Also, workerswith the His139/Arg139 heterozygous genotype at thislocus actually had higher HBVal and THBVal concentra-tions than either of the other two genotypes. The decreasedconcentration of HBVal adducts derived from BDO mightbe explained by an increase in hydrolysis of BDO inworkers with the Arg139/Arg139 genotype. However, thisdoes not explain the greater HBVal adduct production inworkers with the His139/Arg139 genotype compared withworkers with the His139/His139 genotype.
Furthermore, other observations are not in accord withthis rationale; for example, the increased concentrations ofthe THBVal adducts in workers heterozygous for His139/Arg139 or homozygous for His139/His139 would not sup-port this line of reasoning because THBVal adducts arethought to derive primarily from BDO-diol, production ofwhich is dependent on the hydrolytic pathway (see Figure1). The increased production of THBVal adducts inworkers with the His139/His139 or the His139/Arg139genotype might reflect the small proportion of the THBValadducts derived from BDO2. However, this does not ex-plain why workers heterozygous for His139/Arg139 pro-duced significantly more THBVal adducts than workershomozygous for His139/His139. Although the numbersand distributions of the workers with the different EH139genotypes are far too small to permit definitive assess-ments of these possibilities (especially that only fourworkers were homozygous for Arg139/Arg139), the cur-rent study does provide genotypic data that may be com-bined with findings in other molecular epidemiologicstudies and may suggest further animal studies in rodentsgenetically modified in these metabolic pathways.
The present study has demonstrated that both hemo-globin biomarkers can be used to monitor groups ofworkers exposed to low levels of BD. The excellent corre-lation between industrial hygiene measurements and thesehemoglobin adducts permits researchers to rank individ-uals by exposure and then correlate that ranking with
other nonspecific biomarkers of genetic effects such assomatic mutations and cytogenetic changes. This correla-tion allows researchers to examine exposure-responserelations within an exposed population and eliminate con-founding from problems arising in control groups. Suchranking of exposed individuals was used in the compara-tive genotoxicity studies of the present investigation.
GENOTOXICITY
The remaining biomarkers evaluated for their sensitivityas indicators of BD exposure were all measures of geneticchanges. Conventionally, these have been considered to bebiomarkers of effect (although cytogenetic markers havebeen the gold standards for measuring acute recent expo-sures to ionizing radiation). None of these measures showedpositive responses at the exposure levels encountered inthis study. Because biomarkers that reflect irreversiblegenetic damage are more removed from the external expo-sure than are urinary metabolites or hemoglobin adducts,these results are not unexpected despite the occasionalreports of positive genotoxic responses in BD-exposedworkers (see Table 1).
Neither the cloning nor the autoradiographic assay forHPRT mutations in T lymphocytes showed a BD effect.The autoradiographic assay had produced positive find-ings in previous studies, and the laboratory that performedthe assay in the current study had also conducted the ear-lier studies (Ward et al 1994, 1996b). Conditions of thestudies differed however. First, in the current study, bloodsamples were obtained and the lymphocytes were fraction-ated and cryopreserved in a facility different from the onethat performed the assay. Second, several days elapsedbefore the dry shippers sent from Prague reached the labo-ratory in Galveston for testing. A successful assay was pos-sible for only 49 (60%) of the 82 samples and a dispropor-tionate loss of usable samples occurred in the most heavilyexposed (polymerization) worker group (only 45% of thesamples provided usable information). Third, inspectionof the data revealed that the HPRT variant frequencyvalues for the control group were 8-fold to 10-fold higherthan this laboratory had ever recorded for unexposedhealthy American adults. Because biomarkers of geneticeffects are nonspecific, this elevation in the control groupmean could be due to a variety of factors, although nonewas obvious from analyzing the questionnaire data. Giventhe exposure measurements, the urinary metabolite results,and the hemoglobin adduct concentrations, however, weare certain that BD exposure was not responsible. Further-more, the Spearman correlation coefficients relating variantfrequency values to BD exposure concentrations remainednegative even when the control group was eliminated from

117
the analysis. Results of the autoradiographic assay and thecorrelation coefficients remained negative even if variantfrequency values were compared with BD exposure mea-surements made in the interval 70 to 50 days before bloodcollection, a duration of time that should have beenoptimal for the expression of HPRT mutations. Technicalmisreading of autoradiographic slides could not have con-tributed to these negative results because the researchersreading the slides were blinded as to the subject and expo-sure information in two laboratories with good concor-dance between them. In addition, HPRT variant frequen-cies were unrelated to worker genotypes. Thus the reasonfor negative results in the current study but positive resultsin earlier studies remains unexplained.
HPRT mutations as measured by the cloning assay werealso unrelated to BD exposures. Here, however, the mutantfrequency values for the administrative control subjects,which did not differ from those of exposed workers, werein accord with expectations. These negative findings areconsistent with past studies that failed to find a relationbetween HPRT mutations and BD exposures (Tates et al1996); one of those studies was conducted by the labora-tory that performed the current assays. Certain findings inthe current study, such as a positive age effect and a posi-tive correlation between HPRT mutant frequencies andcumulative smoking history, give confidence that the assayproceeded satisfactorily. BD exposures did appear toreduce the nonselection cloning efficiencies in the cloningassays, which could be a manifestation of cytotoxicity.This is unlikely, however, because an earlier study inChina (Hayes et al 2000) reported an actual increase inlymphocyte blood counts associated with BD exposure.
When HPRT mutations have been compared with otherendpoints as dosimeters for detecting ethylene oxide expo-sure, they were found to be the least sensitive (Tates et al1991a). Cytogenetic changes, such as sister chromatidexchanges and chromosomal aberrations, were more sensi-tive dosimeters than HPRT mutations, even though chro-mosomal aberrations are also a measure of genetic effects.This is probably because the HPRT mutation assays canassess changes in only a small portion of the genome,whereas cytogenetic alterations can be detected throughout,providing a much larger target for recognition.
We also analyzed molecular mutational spectra to ensurethat no BD-induced mutational changes had been misseddue to variability in the quantitative assay. We detected nosignificant differences in mutations between exposed andunexposed subjects; the mutational spectrum for the unex-posed administrative control subjects was not statisticallydifferent from the spectra for the two BD exposure groups.Furthermore, the molecular spectrum observed across all
subjects in the present study did not differ significantlyfrom spectra derived from historical datasets for humansnot exposed to mutagens. Although we did observe somenovel mutations (see the earlier section Biomarkers ofEffect: HPRT Mutational Spectra) thus adding to thesedatasets, our analyses of the HPRT mutational spectra pro-vided no support for the hypothesis that BD inducesgenetic mutations.
Finally, HPRT mutant frequencies were unrelated to themetabolic genotypes we had identified.
Considerations of sample size suggest that the numberof workers evaluated in the current study would have a90% probability of detecting a 70% increase in HPRTmutations in the exposed workers compared with unex-posed control workers (Robinson et al 1994). Therefore,the power of this study to detect an effect on HPRT muta-tions was acceptable.
Despite the knowledge that chromosomal changes havegreater sensitivity than genetic mutations for detectingother chemical exposures, none of the cytogenetic end-points evaluated in this study showed a BD effect. Sisterchromatid exchanges are usually sensitive indicators ofchemical exposures, but we found no BD-related responsesin this study. Chromosomal aberrations, whether assessedby the conventional method or by FISH techniques, weresimilarly negative. Sister chromatid exchanges were affectedby smoking, as were some of the aberrations that werescored, which indicates that the methods were capable ofdetecting exposures known to affect these endpoints.
Unlike HPRT mutations, metabolic genotypes didappear to influence cytogenetic responses. Both the per-centage of aberrant cells and the number of breaks/celldetermined by the conventional method showed associ-ations with metabolic genotypes. The most consistentrelations were with the ADH2 polymorphisms, whichwere associated with differences in both endpoints.Subjects with the Arg47/Arg47 genotype at this locushad significantly lower mean values for the percentageof aberrant cells and breaks/cell than did the subjectswith the Arg47/His47 genotype (see Table 42; no sub-jects homozygous for His47/His47 were identified).Regression analyses, however, provided no evidencethat these genotypic differences were related to BDexposures.
Although we found no statistically significant genotypicdifferences in percentage of aberrant cells or breaks/cellamong the EH polymorphisms and no significant geno-type–by–exposure-group interactions (see Table 42),regression analyses of the cytogenetic endpoints on ln[BD-exposure-level–by–genotype] did reveal some statisticallysignificant associations. At the EH113 locus, workers
Discussion and Conclusions

118
Biomarkers in Czech Workers Exposed to 1,3-Butadiene
homozygous for Tyr113/Tyr113 had lower slopes than theworkers with either the His113/His113 or the Tyr113/His113 genotype for percentage of aberrant cells andbreaks/cell; but those slope differences were statisticallysignificant only between the workers with Tyr113/Tyr113and those with Tyr113/His113 genotypes (see Figure 27).Tyr113 is the allele with higher activity at this locus andwould be expected to be associated with less genotoxicitydue to greater detoxification. However, the lowest EHenzyme activity should be in the workers homozygous forHis113/His113. Although these individuals did showmore genetic effects than workers homozygous for Tyr113/Tyr113, the differences were not significant.
At the EH139 locus, however, workers with the Arg139/Arg139 genotype had a significantly greater slope for per-centage of aberrant cells than did the workers with eitherthe His139/His139 or the Arg139/His139 genotype (seeFigure 26). The lower production of aberrant cells wasassociated with either homozygosity or heterozygosity forthe lower-activity allele at the EH139 locus, which, in thiscase, is the variant His139 allele. Overall, these resultscomparing the EH genotypes are conflicting. The EH geno-types at the 113 locus associated with the higher enzymeactivity showed lower genotoxicity as expected; but thereverse was seen for the 139 locus.
No significant associations were observed betweeneither the percentage of aberrant cells or breaks/cell andCYP2E1, ADH3, GSTM1, or GSTT1 genotypes in this study.The lack of association with the GST polymorphisms is incontrast to other studies described in the earlier Overviewsection.
All exposure group mean chromosomal changes deter-mined by FISH (ie, chromosomal aberrations, transloca-tions, reciprocal translocations, conjunctions, and FG/100)were significantly lower in the two subjects with theCYP2E1 C1/C1 genotype than in the workers with the C1/C2genotype (see Table 44). In addition, we found a signifi-cant exposure-group–by–genotype interaction betweenthe EH113 polymorphisms for chromosomal aberrations(P � 0.036), translocations (P � 0.034), conjunctions(P � 0.047), and FG/100 (P � 0.034). The administrativecontrol subjects and the polymerization workers with theTyr113/His113 heterozygous genotype showed higher fre-quencies of these chromosomal changes than the workerswith either of the homozygous genotypes in their respec-tive exposure groups, whereas monomer productionworkers with the Tyr113/His113 heterozygous genotypeshowed lower frequencies than workers with thehomozygous genotypes in their exposure group (see Table45). The biological significance, if any, of these associa-tions is unknown. We identified no other associations
among other genotypes and chromosomal changes deter-mined by FISH analyses.
Finally, neither sister chromatid exchanges norhigh-frequency cells showed a relation with metabolicgenotypes.
Similar to HPRT mutations detected by autoradiog-raphy, at least one earlier study of BD-exposed workershad shown an increased frequency of chromosomalaberrations as determined by the conventional method( rám et al 1998). Another reported an increased fre-quency of these events, but only in exposed workers ofthe GSTT1-null genotype (Sorsa et al 1996). Both earlierstudies included workers from the same facilities thatwe studied. Another similarity between the currentcytogenetic and autoradiographic HPRT results is thatvalues for the control group were higher than expectedfor both. Chromosomal aberrations, determined byeither the conventional method or FISH analysis, wereelevated in the current unexposed control group com-pared with historical control data. However, the magni-tude of this difference was not great, and the historicalcontrol data were obtained from several sources andmay not be strictly comparable to industry control sub-jects. As for the HPRT mutations, analysis of question-naire responses in this study did not reveal a reason forthe elevations among administrative control subjects;again, however, we can be certain that BD exposure wasnot the cause.
Although the cytogenetic findings in this study must beconsidered negative for a BD effect, we cannot exclude thepossibility that the associations with EH genotypes mayindicate a sensitive human population. This is an impor-tant caveat because of the strong relation between BDO2,chromosomal changes, and carcinogenicity in the rodentsystems. Further studies are required to investigate thisobservation that may be relevant for making human cancerrisk assessments.
CONCLUSION
With 83 workers, this study had at least an 80% chanceof detecting correlations of 0.30 or greater among bio-markers and levels of exposure or between two biomarkers.This was sufficient statistical power for the objectives ofthe study because biomarkers with lower correlationswould not be sensitive indicators of exposure. As noted,the study had adequate power to detect an increase inHPRT mutations (70% or higher) or in cytogenetic changes,but not to test for smaller increases in these biomarkers.However, the clear lack of response in either biomarkerargues that, at these exposure levels, BD does not produce
S

119
detectable genetic effects in the worker population as awhole. This observation must be reconciled with the fewearlier studies that did indicate genotoxicity, but it is inaccord with several previous negative studies. The expo-sure assessment in the current study was the most exten-sive ever accomplished in the BD industry, and some ofthe discordance in genotoxicity results may relate to this.We must emphasize that the laboratories that reported pos-itive genotoxicity in earlier studies are the ones that per-formed the current assays, although on different popula-tions for HPRT.
Even though the conflict between positive and nega-tive results remains, the current study adds to theweight of evidence against genotoxicity for the popula-tion as a whole at the low exposure levels encounteredin the modern BD industry. It does not offer new evi-dence for upgrading the classification of BD to a knownhuman carcinogen (Class 1; IARC 1999) nor does it sup-port the EPA’s recent classification of BD as a knownhuman carcinogen by inhalation (EPA 2002). This studyhas amply demonstrated the power of using biomarkersof exposure together with biomarkers of genetic effectsto interpret the biomarkers of genetic effects. Studies ofworkers exposed to higher levels of BD would be neededto clarify the question of genetic change, which is theimportant qualitative nontumor endpoint for makinghuman cancer risk assessments for a putative carcino-genic agent with a known genotoxic mode of action inanimals.
This investigation, therefore, was a successful transi-tional epidemiologic study that evaluated a continuum ofbiomarkers for their sensitivity in detecting and measuringBD exposures in occupationally exposed humans. The uri-nary M2 and M1 metabolites proved to be sensitive indica-tors of exposure, but the HBVal and THBVal hemoglobinadducts were even more so. The adducts performed sowell in this regard that serious consideration should begiven to using them as surrogate measures of exposure andan effort should be made to develop them for specifying abiological exposure index for humans. Neither the urinarymetabolite nor the hemoglobin adduct concentrationswere affected by smoking. Metabolic genotypes, however,did influence BD metabolism as indicated. The biomarkersthat detect genetic effects such as somatic mutations andchromosomal changes did not prove to be sensitive indica-tors of BD exposure in the overall population at the levelsencountered in these facilities. Data such as these can nowbe considered in the context of the toxicology of BD, spe-cifically for evaluating the physiologically based pharma-cokinetic models developed in animals as to their rele-vance for humans.
ACKNOWLEDGMENTS
The investigators are indebted to the workers in thefacilities in the Czech Republic for their willing participa-tion as subjects in this study and to the company’s manage-ment for allowing us to work with them.
Dr Ad Tates, who was responsible for the HPRT cloningassays in Leiden, is grateful for the active and stimulatinginterest of his colleague AT Natarajan.
The automated DNA sequencing was performed in theVT Cancer Center DNA Analysis Facility and was sup-ported in part by grant P30CA22435 from the NationalCancer Institute. The views expressed in this Investigators’Report are those of the authors and do not necessarily rep-resent the views of the NCI.
Many other technical staff members not mentioned herealso made valuable contributions to the work.
Finally, the investigative team acknowledges the gra-cious and continuing support of Ingeborg Gobel. Her tech-nical skills and competent oversight of all administrativematters made a complex project workable. Her cheerfulpersonality factored large in keeping a diverse group ofinvestigators working smoothly together. Ingeborg’s con-tact with the project persisted to the end; her aid in pre-paring the Final Report was invaluable.
REFERENCES
Adler ID, Anderson D. 1994. Dominant lethal effects afterinhalation exposure to 1,3-butadiene. Mutat Res 309:295–297.
Adler ID, Cao J, Filser JG, Gassner P, Kessler W, Kliesch U,Neuhäuser-Klaus A, Nüsse M. 1994. Mutagenicity of 1,3-butadiene inhalation in somatic and germinal cells ofmice. Mutat Res 309:307–314.
Adler ID, Cochrane J, Osterman-Golkar S, Skopek TR,Sorsa M, Vogel E. 1995a. 1,3-Butadiene working groupreport. Mutat Res 330:101–114.
Adler ID, Filser JG, Gassner P, Kessler W, Schöneich J,Schriever-Schwemmer G. 1995b. Heritable translocationsinduced by exposure of male mice to 1,3-butadiene. MutatRes 347:121–127.
Adler ID, Filser J, Gonda H, Schriever-Schwemmer G.1998. Dose response study for 1,3-butadiene-induceddominant lethal mutations and heritable translocations ingerm cells of male mice. Mutat Res 397:85–92.
Adler ID, Kliesch U, Peltonen K. 1997. In vitro and in vivomutagenicity of the butadiene metabolites butadiene
Discussion and Conclusions

120
Biomarkers in Czech Workers Exposed to 1,3-Butadiene
diolepoxide, butadiene monoepoxide and diepoxybutane.Mutagenesis 12(5):339–345.
Adler ID, Kliesch U, Tiveron C, Pacchierotti F. 1995c. Clas-togenicity of 1,2,3,4-diepoxybutane in bone marrow cellsand male germ cells of mice. Mutagenesis 10:535–541.
Albertini RJ. 1985. Somatic gene mutations in vivo as indi-cated by the 6-thioguanine-resistant T-lymphocytes inhuman blood. Mutat Res 150:411–422.
Albertini RJ. 1998. The use and interpretation of bio-markers of environmental genotoxicity in humans. Bio-therapy 11:155–167.
Albertini RJ, Castle KL, Borcherding WR. 1982. T-cellcloning to detect the mutant 6-thioguanine-resistant lym-phocytes present in human peripheral blood. Proc NatlAcad Sci USA 79:6617–6621.
Albertini RJ, rám RJ, Vacek PM, Lynch J, Wright M,Nicklas JA, Boogaard PJ, Henderson RF, Swenberg JA,Tates AD, Ward JB Jr. 2001. Biomarkers for assessing occu-pational exposures to 1,3-butadiene. Chem Biol Interact135–136:429–453.
Albertini RJ, Sullivan LS, Berman JK, Greene CJ, StewartJA, Silveira JM, O’Neill JP. 1988. Mutagenicity monitoringin humans by autoradiographic assay for mutant T-lym-phocytes. Mutat Res 204:481–492.
Albrecht OE, Filser JG, Neumann H-D. 1993. Biologicalmonitoring of 1,3-butadiene: Species differences in hae-moglobin binding in rat and mouse. In: Butadiene and Sty-rene: Assessment of Health Hazards (Sorsa M, Peltonen K,Vanino H, Hemminki K, eds), pp 135–142. IARC ScientificPublications Vol 127. IARC, Lyon, France.
Ali-Osman F, Akande O, Antoun G, Mao J-X, BuolamwiniJ. 1997. Molecular cloning, characterization, and expres-sion in Escherichia coli of full-length cDNAs of threehuman glutathione S-transferase Pi gene variants: Evi-dence for differential catalytic activity of the encoded pro-teins. J Biol Chem 272:10004–10012.
Ammenheuser MM, Au WW, Whorton EB Jr, Belli JA,Ward JB Jr. 1991. Comparison of HPRT variant frequenciesand chromosome aberration frequencies in lymphocytesfrom radiotherapy and chemotherapy patients: A prospec-tive study. Environ Mol Mutagen 18:126–135.
Ammenheuser MM, Bechtold WE, Abdel-Rahman SZ,Rosenblatt JI, Hastings-Smith DA, Ward JB Jr. 2001. Assess-ment of 1,3-butadiene exposure in polymer productionworkers using HPRT mutation in lymphocytes as a bio-marker. Environ Health Perspect 109(12):1249–1255.
S
Ammenheuser MM, Berenson AB, Babiak AE, SingletonCR, Whorton EB Jr. 1998. Frequencies of HPRT mutantlymphocytes in marijuana-smoking mothers and theirnewborns. Mutat Res 403:55–64.
Ammenheuser MM, Berenson AB, Singleton CR, HastingsDA, Whorton EB Jr. 1997a. Frequencies of HPRT mutantlymphocytes in marijuana smokers and multi-drug users(abstract). 7th International Conference on EnvironmentalMutagens. Mutat Res 379(Suppl 1):158.
Ammenheuser MM, Hastings DA, Whorton EB Jr, Ward JBJr. 1997b. Frequencies of HPRT mutant lymphocytes insmokers, non-smokers, and former smokers. Environ MolMutagen 30:131–138.
Ammenheuser MM, Ward JB Jr, Whorton EB Jr, Killian JM,Legator MS. 1988. Elevated frequencies of 6-thioguanine-resistant lymphocytes in multiple sclerosis patientstreated with cyclophosphamide: A prospective study.Mutat Res 204:509–520.
Anderson D, Dobrzynska MM, Jackson LL, Yu TW, Brink-worth MH. 1997. Somatic and germ cell effects in rats andmice after treatment with 1,3-butadiene and its metabo-lites, 1,2-epoxybutene and 1,2,3,4-diepoxybutane. MutatRes 391(3):161–174.
Anderson D, Edwards AJ, Brinkworth MH, Hughes JA.1996. Male-mediated F1 effects in mice exposed to 1,3-butadiene. Toxicology 113(1–3):120–127.
Anderson D, Hughes JA, Edwards AJ, Brinkworth MH.1998. A comparison of male-mediated effects in rats andmice exposed to 1,3-butadiene. Mutat Res 397:77–84.
Arce GT, Vincent DR, Cunningham MJ, Choy WN, SarrifAM. 1990. In vitro and in vivo genotoxicity of 1,3-buta-diene. Environ Health Perspect 86:75–78.
Au WW, Bechtold WE, Whorton EB Jr, Legator MS. 1995.Chromosome aberrations and response to gamma-ray chal-lenge in lymphocytes of workers exposed to 1,3-butadiene.Mutat Res 334:125–130.
Autio K, Renzi L, Catalan J, Albrecht OE, Sorsa M.1994. Induction of micronuclei in peripheral blood andbone marrow erythrocytes of rats and mice exposed to1,3-butadiene by inhalation. Mutat Res 309(2):315–320.
Bechtold WE, Strunk MR, Chang IY, Ward JB, HendersonRF. 1994. Species differences in urinary butadienemetabolites: Comparisons of metabolite ratios betweenmice, rats and humans. Toxicol Appl Pharmacol 127:44–49.

121
Benhamou S, Reinikainen M, Bouchardy C, Dayer P, Hir-vonen A. 1998. Association between lung cancer andmicrosomal epoxide hydrolase genotypes. Cancer Res58:5291–5293.
Bernardini S, Pelin K, Peltonen K, Jarventaus H, HirvonenA, Neagu C, Sorsa M, Norppa H. 1996. Induction of sisterchromatid exchange by 3,4-epoxybutane-1,2-diol in cul-tured human lymphocytes of different GSTT1 and GSTM1genotypes. Mutat Res 361:121–127.
Bianchi A, Boyle B, Harrison P, Lawrie P, LeLendu T,Rocchi P, Taalman R, Wieder W. 1996. A Review of Analyt-ical Methods and Their Significance to Subsequent Expo-sure Data Evaluation for 1,3-Butadiene. Analytical WorkingGroup of the European Chemical Manufacturers Associ-ation and International Institute of Synthetic RubberProducers. International Institute of Synthetic Rubber Pro-ducers, Houston TX.
Blair IA, Tomoyki O, Kambouris S, Chaudhary AK. 2000.Part IV: Molecular dosimetry of 1,3-butadiene. In: 1,3-Butadiene: Cancer, Mutations, and Adducts, pp 151–189.Research Report 92. Health Effects Institute, CambridgeMA.
Board P, Coggan M, Johnston P, Ross V, Suzuki T, Webb G.1990. Genetic heterogeneity of the human glutathionetransferases: A complex of gene families. Pharmacol Ther48:357–369.
Bolt HM, Jelitto B. 1996. Biological formation of the 1,3-butadiene DNA-adducts 7-N-(2-hydroxy-3-buten-1-yl)gua-nine and 7-N-(1-hydroxy-3-buten-2-yl)guanine and 7-N-(2,3,4-trihydroxy-butyl)guanine. Toxicology 113:328–330.
Bonassi S. 1999. Combining environmental exposure andgenetic effect measurements in health outcome assess-ment. Mutat Res 428:177–185.
Bonassi S, Fontana V, Ceppi M, Borale R, Biggeri A. 1999.Analysis of correlated data in human biomonitoringstudies. The case of high sister chromatid exchange fre-quency cells. Mutat Res 438:13–21.
Bond JA, Dahl AR, Henderson RF, Dutcher JS, MauderlyJL, Birnbaum LS. 1986. Species differences in the disposi-tion of inhaled butadiene. Toxicol Appl Pharmacol 84:617–627.
Boogaard PJ, Bond JA. 1996. The role of hydrolysis in thedetoxification of 1,2:3,4-diepoxybutane in human liverand lung in vitro. Toxicol Appl Pharmacol 141:617–627.
Boogaard PJ, de Kloe KP, Richardson KA, Peters MMCG,van Elburg PA, Watson WP, van Sittert NJ. 1998. DNA
adduct profiles differ after 1,3-butadiene or 1,2-epoxy-3-butene and between rats and mice (abstract). Toxicol Sci42:S83.
Boogaard PJ, de Kloe KP, van Sittert NJ. 2000. N7-(1-hydroxymethyl)-2,3-dihydroxypropyl)guanine is the majoradduct after exposure to 1,3-butadiene but not 1,2-epoxy-3-butene (abstract). Toxicol Sci 54:S229.
Boogaard PJ, de Kloe KP, Watson WP, Kolk MH, van SittertNJ. 2003. DNA adducts in rats and mice following expo-sure to [4-14C]-1,2-epoxy-3-butene and to [2,3-14C]-1,3-butadiene. Unpublished results.
Boogaard PJ, Sumner SCJ, Bond JA. 1996. Glutathione con-jugation of 1,2:3,4-diepoxybutane in human liver andmouse liver and lung in vitro. Toxicol Appl Pharmacol136:307–316.
Boogaard PJ, van Sittert NJ. 1995. Biological monitoring ofoccupational exposure to benzene: A comparison betweenS-phenylmercapturic acid, trans,trans-muconic acid, andphenol. Occup Environ Med 52:611–620.
Boogaard PJ, van Sittert NJ. 1996. Suitability of S-phe-nylmercapturic acid and trans,trans-muconic acid asbiomarkers for exposure to low levels of benzene. EnvironHealth Perspect 104(Suppl 6):1151–1157.
Boogaard PJ, van Sittert NJ, de Kloe KP. 2001. A novel DNAadduct, originating from 1,2-epoxy-3,4-butanediol, is themajor DNA adduct after exposure to [2,3-14C]-1,3-buta-diene, but not after exposure to [4-14C]-1,2-epoxy-3-butene.Chem Biol Interact 135–136:687–693.
Bosron WF, Li T-K, Vallee BL. 1980. New molecular formsof human liver alcohol dehydrogenase: Isolation and char-acterization of ADH (Indianapolis). Proc Natl Acad SciUSA 77:5784–5788.
Bouchardy C, Hirvonen A, Coutelle C, Ward PJ, Dayer P,Benhamou S. 2000. Role of alcohol dehydrogenase 3 andcytochrome P-4502E1 genotypes in susceptibility to can-cers of the upper aerodigestive tract. Int J Cancer 87(5):734–740.
Branda RF, Sullivan LM, O’Neill JP, Falta MT, Nicklas JA,Hirsch B, Vacek PM, Albertini RJ. 1993. Measurement ofHPRT mutant frequencies in T-lymphocytes from healthyhuman populations. Mutat Res 285:267–279.
British Standards Institution. 1996. Workplace atmo-spheres: Diffusive samplers for the determination of gasesand vapours: Requirements and test methods, EuropeanStandard BS EN 838. British Standards Institution,London, UK.
RJ Albertini et al

122
Biomarkers in Czech Workers Exposed to 1,3-Butadiene
Brown RH, Charlton J, Saunders KJ. 1981. The develop-ment of an improved diffusive sampler. Am Ind Hyg AssocJ 42:865–869.
Brunnemann KD, Kagan MR, Cox JE, Hoffmann D. 1990.Analysis of 1,3-butadiene and other selected gas-phasecomponents in cigarette mainstream and sidestream smokeby gas chromatography-mass selective detection. Carcino-genesis 11:1863–1868.
Butkiewicz D, Cole KJ, Phillips DH, Harris CC, Chorazy M.1999. GSTM1, GSTP1, CYP1A1 and CYP2D6 polymor-phisms in lung cancer patients from an environmentallypolluted region of Poland: Correlation with lung DNAadduct levels. Eur J Cancer Prev 8(4):315–323.
California Air Resources Board. 1991. Proposed Identifica-tion of 1,3-Butadiene as a Toxic Air Contaminant. Office ofEnvironmental Health Hazard Assessment, SacramentoCA.
Cannons JL, Karsh J, Birnboim HC, Goldstein R. 1998.HPRT-mutant T cells in the cells in the peripheral bloodand synovial tissue of patients with rheumatoid arthritis.Arthritis Rheum 41(10):1772–1782.
Carrano AV, Moore DH. 1982. The rational methodologyfor quantifying sister-chromatid exchange in humans. In:New Horizons in Genetic Toxicology (Hendle JA ed), pp267–304. Academic Press, Orlando FL.
Charrier J, Maugard CM, Le Mevel B, Bignon YJ. 1999.Allelotype influence at glutathione S-transferase M1 locuson breast cancer susceptibility. Br J Cancer 79(2):346–353.
Cheng L, Sturgis EM, Eicher SA, Char D, Spitz MR, Wei Q.1999. Glutathione-S-transferase polymorphisms and riskof squamous-cell carcinoma of the head and neck. Int JCancer 84(3):220–224.
Citti L, Gervasi G, Turchi G, Bellucci G, Bianchini R. 1984.The reaction of 3,4-epoxy-1-butene and deoxyguanosineand DNA in vitro: Synthesis and characterization of themain adducts. Carcinogenesis 5:47–52.
Cochrane JE, Skopek TR. 1993. Mutagenicity of 1,3-buta-diene and its epoxide metabolites in human TK6 cells andin splenic T cells isolated from exposed B6C3F1 mice. In:Butadiene and Styrene: Assessment of Health Hazards(Sorsa M, Peltonen K, Vainio H, Hemminki K, eds), pp195–204. IARC Scientific Publications Vol 127. Interna-tional Agency for Research on Cancer, Lyon France.
Cochrane JE, Skopek TR. 1994a. Mutagenicity of butadieneand its epoxide metabolites: I. Mutagenic potential of 1,2-epoxybutene, 1,2,3,4-diepoxybutane and 3,4-epoxy-1,2-
butanediol in cultured human lymphoblasts. Carcinogen-esis 15:713–717.
Cochrane JE, Skopek TR. 1994b. Mutagenicity of butadieneand its epoxide metabolites: II. Mutational spectra of buta-diene, 1,2-epoxybutene and 1,2,3,4-diepoxybutane at thehprt locus in splenic T cells from exposed B6C3F1 mice.Carcinogenesis 15:719–723.
Committee on Biological Markers of the National ResearchCouncil. 1987. Biological markers in environmental healthresearch. Environ Health Perspect 74:3–9.
Conover WJ. 1999. Practical Nonparametric Statistics, 3rded. John Wiley & Sons, New York NY.
Cowles SR, Tsai SP, Snyder PJ, Ross CE. 1994. Mortality,morbidity, and hematological results from a cohort of longterm workers involved in 1,3-butadiene monomer produc-tion. Occup Environ Med 51:323–329.
Cox PC. 1985. Back-up data report on MDHS butadienepumped sorbent tube method. Report HSE/IR/L/AO/85/11. Health and Safety Executive, London, UK.
Cox PC, Saunders KJ, Fields B. 1987. Back-up data reporton MDHS butadiene diffusive tube method. Report HSE/IR/L/CH/87/2. Health and Safety Executive, London, UK.
Csanády GA, Guengerich FP, Bond JA. 1992. Comparisonof the biotransformation of 1,3-butadiene and its metabo-lite, butadiene monoepoxide, by hepatic and pulmonarytissues from humans rats and mice. Carcinogenesis 13:1143–1153.
Csanády GA, Kreuzer PE, Baur C, Filser JG. 1996. A physio-logical toxicokinetic model for 1,3-butadiene in rodents andman: Blood concentrations of 1,3-butadiene, its metaboli-cally formed epoxides, and of haemoglobin adducts: Rele-vance of glutathione depletion. Toxicology 113:300–305.
Curran JE, Weinstein SR, Griffiths LR. 2000. Polymor-phisms of glutathione S–transferase genes (GSTM1, GSTP1and GSTT1) and breast cancer susceptibility. Cancer Lett153:113–120.
Curry J, Karnaoukhova L, Guenette GC, Glickman BW. 1999.Influence of sex, smoking and age on human HPRT muta-tion frequencies and spectra. Genetics 152:1065–1077.
Dahl AR, Henderson RF. 2000. Comparative metabolism oflow concentrations of butadiene and its monoepoxide inhuman and monkey hepatic microsomes. Inhalation Tox-icol 12:439–451.
Dahl AR, Sun JD, Birnbaum LS, Bond JA, Griffith WC Jr,Mauderly JL, Muggenburg BA, Saboruin PJ, Henderson RF.
123
1991. Toxicokinetics of inhaled 1,3-butadiene in monkeys:Comparison to toxicokinetics in rats and mice. ToxicolAppl Pharmacol 110:9–19.
Delzell E, Macaluso M, Lally C, Cole P. 1996a. Mortalitystudy of synthetic rubber workers: Additional analyses ofdata on monomer peaks and employment in certain workareas. International Institute of Synthetic Rubber Pro-ducers, Houston TX.
Delzell E, Sathiakumar N, Hovinga M, Macaluso M, JulianJ, Larson R, Cole P, Muir DCF. 1996b. A follow-up study ofsynthetic rubber workers. Toxicology 113:182–189.
Delzell E, Sathiakumar M, Macaluso M, Hovinga M,Larson R, Barone F, Beall C, Cole P, Julian J, Muir DCF.1995. A follow-up study of synthetic rubber workers. Inter-national Institute of Synthetic Rubber Producers, HoustonTX.
deMeester C. 1988. Genotoxic properties of 1,3-butadiene.Mutat Res 195:273–281.
deMeester C, Poncelet F, Roberfroid M, Mercier M. 1980.The mutagenicity of butadiene towards Salmonella typhi-murium. Toxicol Lett 6:125–130.
Department of Health and Human Services (US). 1984.Toxicology and Carcinogenesis Studies of 1,3-Butadiene(CAS 106-99-0) in B6C3F1 Mice (Inhalation Studies). NTPTR 288, NIH Publication 84-2544. US NTP, Research Tri-angle Park NC.
Department of Health and Human Services (US). 1991. AQuantitative Assessment of the Risk of Cancer Associatedwith Exposure to 1,3-Butadiene, Based on a Low DoseInhalation Study in B6C3F1 Mice. Submitted to US OSHAfor Butadiene Docket H-041. US NIOSH, Washington DC.
Department of Health and Human Services (US). 1992.Toxicological Profile for 1,3-Butadiene. US Public HealthService, Research Triangle Park NC.
Department of Health and Human Services (US). 1993a.Toxicology and Carcinogenesis Studies of 1,3-Butadiene(CAS 106-99-0) in B6C3F1 Mice (Inhalation Studies). NTPTR 434. US NTP, Research Triangle Park NC.
Department of Health and Human Services (US). 1993b.Technology Report on the Toxicology and CarcinogenicityStudies of 1,3-Butadiene. NTP TR 433, NIH Publication93-3165. US NTP, Research Triangle Park NC.
Department of Health and Human Services (US). 1994.Method 1024: 1,3-Butadiene. In: Manual of AnalyticalMethods, 4th ed. US NIOSH, Cincinnati OH.
Department of Health and Human Services (US). 2000.Report on Carcinogens (9th ed): Carcinogen Profiles.Revised January 2001. US NTP, Research Triangle Park NC.
de Rooij BM, Boogaard PJ, Commandeur JNM, van SittertNJ, Vermeulen NPE. 1997a. Allylmercapturic acid as uri-nary biomarker of human exposure to allyl chloride.Occup Environ Med 54:653–661.
de Rooij BM, Boogaard PJ, Commandeur JNM, VermeulenNPE. 1997b. �-Chlorohydrin and 3-chloro-2-hydroxy-propylmercapturic acid as biomarkers of occupationalexposure to epichlorohydrin. Environ Toxicol Pharmacol3:175–185.
Divine BJ. 1990. An update on mortality among workers ata 1,3-butadiene facility: Preliminary results. EnvironHealth Perspect 86:119–128.
Divine BJ, Hartman CM. 1996. Mortality update of buta-diene production workers. Toxicology 113:169–181.
Divine BJ, Wendt JK, Hartman CM. 1993. Cancer mortalityamong workers at a butadiene production facility. In: Buta-diene and Styrene: Assessment of Health Hazards (SorsaM, Peltonen K, Vainio H, Hemminki K, eds), pp 345–362.IARC Scientific Publications Vol 127. International Agencyfor Research on Cancer, Lyon, France.
Downs TD, Crane MM, Kim KW. 1987. Mortality amongworkers at a butadiene facility. Am J Ind Med 12:311–329.
Duescher RJ, Elfarra AA. 1992. 1,3-Butadiene oxidation byhuman myeloperoxidase: Role of chloride ion in catalysisof divergent pathways. J Biol Chem 267:19859–19865.
Duescher RJ, Elfarra AA. 1994. Human liver microsomesare efficient catalysts for 1,3-butadiene oxidation: Evi-dence for major roles by cytochrome P450 2A6 and 2E1.Arch Biochem Biophys 311:342–349.
Edenberg HJ, Bosron WF. 1997. Alcohol dehydrogenases.In: Comprehensive Toxicology, Vol 3, Biotransformation(Guengerich FP, ed) pp 119–131. Elsevier Science Pub-lishing Company, New York NY.
Elfarra AA, Sharer JE, Duescher RJ. 1995. Synthesis andcharacterization of N-acetyl-L-cysteine S-conjugates ofbutadiene monoepoxide and their detection and quantita-tion in urine of rats and mice given butadiene monoep-oxide. Chem Res Toxicol 8:68–76.
El-Zein RA, Zwischenberger JB, Abdel-Rahman SZ, SankarAB, Au WW. 1997. Polymorphism of metabolizing genesand lung cancer histology: Prevalence of CYP2E1 in ade-nocarcinoma. Cancer Lett 112:71–78.
RJ Albertini et al

124
Biomarkers in Czech Workers Exposed to 1,3-Butadiene
Environment Canada. 1999. (Last updated 02/27/02).Existing substances evaluation: Assessment report—1,3-buta-diene. In: Canadian Environmental Protection Act (CEPA)Registry. http://www.ec.gc.ca/substances/ese/eng/psap/final/butadiene.cfm. Accessed 02/27/02.
Environmental Protection Agency (US). 1985. Mutage-nicity and Carcinogenicity Assessment of 1,3-Butadiene.EPA/600/8-85/004F. Office of Health and EnvironmentalAssessment, Office of Research and Development, Wash-ington DC.
Environmental Protection Agency (US). 1994. Locatingand Estimating Air Emissions from Sources of 1,3-Buta-diene (draft). Office of Air Quality Planning and Stan-dards, Research Triangle Park NC.
Environmental Protection Agency (US). 1999. IntegratedUrban Air Toxics Strategy. Fed Regist 64(137):38705–38740.
Environmental Protection Agency (US). 2001. Control ofEmissions of Hazardous Air Pollutants from MobileSources; Final Rule. 40 CFR Parts 80 and 86. Fed Regist66(61):17230–17273.
Environmental Protection Agency (US). 2002. HealthAssessment of 1,3-Butadiene. EPA/600/P-98/001F. Officeof Research and Development, National Center for Envi-ronmental Assessment, Washington, DC.
European Centre for Ecotoxicity and Toxicology of Chemi-cals (ECETOC). 1997. 1,3-Butadiene Occupational Expo-sure Limit: Criteria document (2nd ed). CAS 106-99-0,Special Report 12. ECETOC, Brussels, Belgium.
Expert Panel on Air Quality Standards. 1994. A recom-mendation for a UK air quality standard for 1,3-butadiene.Her Majesty’s Stationery Office (HMSO), London, UK.
Fernandez-Salguero P, Hoffman SMG, Cholerton S,Mohrenweiser H, Raunio H, Rautio A, Pelkonen O, HuangJ, Evans WE, Idle JR, Gonzalez FJ. 1995. A genetic poly-morphism in coumarin 7-hydroxylation: Sequence of thehuman CYP2A genes and identification of variant CYP2A6alleles. Am J Hum Genet 57:651–660.
Fields B. 1986. Diffusive sampling onto solid adsorbentsfor the analysis of benzene and 1,3-butadiene in air by gaschromatography in diffusive sampling: An alternativeapproach to workplace air monitoring. In: Proceedings of anInternational Symposium (Berlin A, Brown RH, SaundersKJ, eds), pp 85–88. September 22–26, 1986. CEC Publication10555 EN. Commission for Environmental Cooperation,CEC Secretariat, Montreal, Quebec, Canada.
Finette BA, Sullivan LM, O’Neill JP, Nicklas JA, Vacek PM,Albertini RJ. 1994. Determination of HPRT mutant fre-quencies in T-lymphocytes from a healthy pediatric popu-lation: Statistical comparison between newborn, childrenand adult mutant frequencies, cloning efficiency and age.Mutat Res 308:223–231.
Freudenheim JL, Ambrosone CB, Moysich KB, Vena JE,Graham S, Marshall JR, Muti P, Laughlin R, Nemoto T,Harty LC, Crits GA, Chan AW, Shields PG. 1999. Alcoholdehydrogenase 3 genotype modification of the associationof alcohol consumption with breast cancer risk. CancerCauses Control 10(5):369–377.
Fryer AA, Zhao L, Alldersea J, Pearson WR, Strange RC.1993. Use of site-directed mutagenesis of allele-specificPCR primers to identify the GSTM1 A, GSTM1 B, GSTM1A,B and GSTM1-null polymorphisms at the glutathione S–transferase, GSTM1 locus. Biochem J 295:313–315.
Garte S, Taioli E, Crosti F, Sainati L, Barisone E, Luciani M,Jankovic M, Biondi AG. 2000. Deletion of parental GSTgenes as a possible susceptibility factor in the etiology ofinfant leukemia. Leuk Res 24:971–974.
Gibbs RA, Nguyen PN, Edwards A, Civitello AB, CaskeyCT. 1990. Multiplex DNA deletion detection and exonsequencing of the hypoxanthine phosphoribosyltrans-ferase gene in Lesch-Nyhan families. Genomics 7:235–244.
Goodrow T, Nichols WW, Storer RD, Anderson MW,Maronpot RR. 1994. Activation of H-ras is prevalent in 1,3-butadiene-induced and spontaneously occurring murineHarderian gland tumors. Cancer Res 55:2665–2667.
Goodrow T, Reynolds S, Maronpot R, Anderson M. 1990.Activation of K-ras by codon 13 mutations in C57BL/6C3H F1 mouse tumors induced by exposure to 1,3-buta-diene. Cancer Res 50:4818–4823.
Guengerich FP, Turvy CG. 1991. Comparison of levels ofseveral human microsomal cytochrome P-450 enzymesand epoxide hydrolase in normal and disease states usingimmunochemical analysis of surgical liver samples. JPharmacol Exp Ther 256:1189–1194.
Hagmar L, Bonassi S, Strömberg U, Mikoczy Z, Lando C,Hansteen IL, Montagud AH, Knudsen L, Norppa H, Reuter-wall C, Tinnerberg H, Brogger A, Forni A, Hogstedt B, Lam-bert B, Mitelman F, Nordenson I, Salomaa S, Skerfving S.1998. Cancer predictive value of cytogenetic markers usedin occupational health surveillance programs: A reportfrom an ongoing study by the European Study Group onCytogenetic Biomarkers and Health. Mutat Res 405:171–178.

125
Hallberg LM, Bechtold WE, Grady J, Legator MS, Au WW.1997. Abnormal DNA repair activities in lymphocytes ofworkers exposed to 1,3-butadiene. Mutat Res 383:213–221.
Hamlin WJ, Saunders KJ. 1986. Practical aspects of the dif-fusive sampling of butadiene in diffusive sampling: Analternative approach to workplace air monitoring. In: Pro-ceedings of an International Symposium (Berlin A, BrownRH, Saunders KJ, eds), pp 93–97. September 22–26, 1986.CEC Publication 10555 EN. Commission for Environ-mental Cooperation, CEC Secretariat, Montreal, Quebec,Canada.
Handley KE. 1994. Routes to Labeled 1,3-Butadiene andButadiene Epoxides (dissertation). University of New-castle upon Tyne, Newcastle, UK.
Harries LW, Stubbins MJ, Forman D, Grahame, HowardCW, Wolf CR. 1997. Identification of genetic polymor-phisms at the glutathione S-transferase Pi locus and asso-ciation with susceptibility to bladder, testicular and prostatecancer. Carcinogenesis 18:641–644.
Harrison DJ, Hubbard AL, MacMillan J, Wyllie AH, SmithCA. 1999. Microsomal epoxide hydrolase gene polymor-phism and susceptibility to colon cancer. Br J Cancer79(1):168–171.
Hassett C, Aicher L, Sidhu JS, Omiecinski CJ. 1994.Human microsomal epoxide hydrolase: Genetic polymor-phism and functional expression in vitro of amino acidvariants. Hum Mol Genet 3:421–428.
Hayashi S, Watanabe J, Kawajiri K. 1991. Genetic polymor-phism in the 5�-flanking region changes the transcriptionalregulation of the human cytochrome P450IIE1 gene. J Bio-chem (Tokyo) 110:559–565.
Hayes RB, Zhang L, Yin S, Swenberg JA, Xi L, Wiencke J,Bechthold WE, Yao M, Rothman N, Haas R, O’Neill JP,Wiemels J, Dosemeci M, Li G, Smith MT. 2000. Genotoxicmarkers among butadiene-polymer workers in China. Car-cinogenesis 21:55–62.
Health and Safety Executive. 1983. Methods for the Deter-mination of Hazardous Substances: MDHS 27, Protocol forAssessing the Performance of a Diffusive Sampler. HSE,London, UK.
Health and Safety Executive. 1989. Methods for the Deter-mination of Hazardous Substances: MDHS 63, 1,3-Buta-diene in Air: Laboratory Method Using Molecular SieveDiffusion Samplers, Thermal Desorption and Gas Chroma-tography. HSE, London, UK.
Health and Safety Executive. 1991. Methods for the Deter-mination of Hazardous Substances: MDHS, AnalyticalQuality in Workplace Air Monitoring. HSE, London, UK.
Health and Safety Executive. 1995. Methods for the Deter-mination of Hazardous Substances: MDHS 80, VolatileCompounds in Air: Laboratory Method Using DiffusiveSolid Sorbent Tubes, Thermal Desorption and Gas Chro-matography. HSE, London, UK.
Health Effects Institute. 2000. Preface. In: 1,3-Butadiene:Cancer, Mutations and Adducts, pp 1–10. Research Report92. Health Effects Institute, Cambridge MA.
Henderson RF, Thornton-Manning JR, Bechtold WE, DahlAR. 1996. Metabolism of 1,3-butadiene: Species differ-ences. Toxicology 113:17–22.
Higuchi S, Muramatsu T, Matsushita S, Murayama M,Hayashida M. 1996. Polymorphisms of ethanol-oxidizingenzymes in alcoholics with inactive ALDH2. Hum Genet97:413–434.
Hill AB. 1962. Statistical Methods in Clinical and Preven-tive Medicine. Oxford University Press, New York NY.
Himmelstein MW, Acquavella JF, Recio L, Medinsky MA,Bond JA. 1997. Toxicology of 1,3-butadiene. Crit Rev Tox-icol 27:1–108.
Himmelstein MW, Asgharian B, Bond JA. 1995. High con-centrations of butadiene-epoxides in livers and lungs ofmice compared to rats exposed to 1,3-butadiene. ToxicolAppl Pharmacol 132:281–288.
Hirvonen A, Husgafvel-Pursiainen K, Anttila S, Kar-jalainen A, Vainio H. 1993. The human CYP2E1 gene andlung cancer: DraI and RsaI restriction fragment lengthpolymorphisms in a Finnish study population. Carcino-genesis 14(1):85–88.
Hoet P. 1996. General principles. In: Biological Monitoringof Chemical Exposure in the Workplace, pp 1–19. WorldHealth Organization, Geneva, Switzerland.
Hori H, Kawano T, Endo M, Yuasa Y. 1997. Geneticpolymorphisms of tobacco- and alcohol-related metabo-lizing enzymes and human esophageal squamous cellcarcinoma susceptibility. J Clin Gastroenterol 25(4):568–575.
Hou SM, van Dam FJ, de Zwart FA, Warnock C, MognatoM, Turner J, Podlutskaja N, Podlutsky A, Becker R, BarnettY, Barnett CR, Celotti L, Davies M, Huettner E, Lambert B,Tates AD. 1999. Validation of the human T-lymphocytecloning assay: Ring test report from the EU concerted
RJ Albertini et al
126
Biomarkers in Czech Workers Exposed to 1,3-Butadiene
action on HPRT mutation (EUCAHM). Mutat Res 431:211–221.
Huff JE, Melnick RL, Solleveld HA, Haseman JK, PowersM, Miller RA. 1985. Multiple organ carcinogenicity of 1,3-butadiene in B6C3F1 mice after 60 weeks of inhalationexposure. Science 227:548–549.
Hüttner E, Holzapfel B. 1996. HPRT mutant frequenciesand large deletions by multiplex-PCR in human lympho-cytes of vinyl chloride exposed and non-exposed popula-tions. Toxicol Lett 88:175–183.
International Agency for Research on Cancer. 1992. 1,3-Butadiene. In: Occupational Exposures to Mists andVapours from Strong Inorganic Acids and Other IndustrialChemicals, pp 237–285. IARC Monographs on the Evalua-tion of Carcinogenic Risks to Humans Vol 54. IARC, Lyon,France.
International Agency for Research on Cancer. 1999. Part I.In: Re-Evaluation of Some Organic Chemicals, Hydrazineand Hydrogen Peroxide, pp 109–225. IARC Monographson the Evaluation of Carcinogenic Risks to Humans Vol 71.IARC, Lyon, France.
Irons RD, Cathro, HP, Stillman WS, Steinhagen WH, ShahRS. 1989. Susceptibility to 1,3-butadiene-induced leuke-mogenesis correlates with endogenous ecotropic retroviralbackground in the mouse. Toxicol Appl Pharmacol 101:170–176.
Irons RD, Oshimura M, Barrett JC. 1987. Chromosomeaberrations in mouse bone marrow cells following in vivoexposure to 1,3-butadiene. Carcinogenesis 8:1711–1714.
Irons RD, Pyatt DW. 1998. Dithiocarbamates as potentialconfounders in butadiene epidemiology. Carcinogenesis19(4):539–542.
Jackson MA, Stack HF, Rice JM, Waters MD. 2000. Areview of the genetic and related effects of 1,3-butadiene inrodents and humans. Mutat Res 463:181–213.
Jacobson-Kram D, Rosenthal S. 1995. Molecular and genetictoxicology of 1,3-butadiene. Mutat Res 339:121–130.
Jauhar PP, Henika PR, MacGregor JT, Wehr CM, ShelbyMD, Murphy SA, Margolin BH. 1988. 1,3-Butadiene:Induction of micronucleated erythrocytes in the periph-eral blood of B6C3F1 mice exposed by inhalation for 13weeks. Mutat Res 209:171–176.
Jelitto B, Vangala RR, Laib RJ. 1989. Species differences inDNA damage by butadiene: Role of diepoxybutane. ArchToxicol Suppl 13:246–249.
Jones AR. 1975. The metabolism of 3-chloro-, 3-bromo-and 3-iodopropan-1,2-diol in rats and mice. Xenobiotica5:155–165.
Jourenkova-Mironova N, Voho A, Bouchardy C, WikmanH, Dayer P, Benhamou S, Hirvonen A. 1999. Glutathione S-transferase GSTM1, GSTM3, GSTP1 and GSTT1 genotypesand the risk of smoking-related oral and pharyngeal can-cers. Int J Cancer 81(1):44–48.
Katoh T, Kaneko S, Kohshi K, Munaka M, Kitagawa K,Kunugita N, Idemura K, Kawamoto T. 1999. Genetic poly-morphisms of tobacco- and alcohol-related metabolizingenzymes and oral cavity cancer. Int J Cancer 83(5):606–609.
Kelsey K, Wiencke JK, Ward J, Bechtold W, Fajen J. 1995.Sister-chromatid exchanges, glutathione S-transferasetheta deletion and cytogenetic sensitivity to diepoxybu-tane in lymphocytes from butadiene monomer productionworkers. Mutat Res 335:267–273.
Kemper RA, Elfarra AA, Myers SR. 1996. Metabolism of 3-butene-1,2-diol in B6C3F1 mice. Evidence for involvementof alcohol dehydrogenase and cytochrome P450. DrugMetab Dispos 26:914–920.
Kim JW, Lee CG, Park YG, Kim KS, Kim IK, Sohn YW, MinHK, Lee JM, Namkoong SE. 2000. Combined analysis ofgermline polymorphisms of p53, GSTM1, GSTT1, CYP1A1,and CYP2E1: Relation to the incidence rate of cervical car-cinoma. Cancer 88(9):2082–2091.
Kim RB, O’Shea D, Wilkinson GR. 1994. Relationship inhealthy subjects between CYP2E1 genetic polymor-phisms and the 6-hydroxylation of chlorzoxazone: Aputative measure of CYP2E1 activity. Pharmacogenetics4:162–165.
Kirshenbaum I. 1978. Butadiene. In: Kirk-Othmer Encyclo-pedia of Chemical Technology (Mark HF, Othmer DF,Overberger CG, et al, eds), 3rd ed, Vol 4, pp 313–337. JohnWiley & Sons, New York NY.
Kiss I, Sandor J, Pajkos G, Bogner B, Hegedus G, Ember I.2000. Colorectal cancer risk in relation to genetic poly-morphism of cytochrome P450 1A1, 2E1 and glutathione-S-transferase M1 enzymes. Anticancer Res 20(1B):519–522.
Koc H, Tretyakova NY, Walker VE, Henderson RF, Swen-berg JA. 1999. Molecular dosimetry of N-7 guanine adductformation in mice and rats exposed to 1,3-butadiene.Chem Res Toxicol 12:566–574.

127
RJ Albertini et al
Koivisto P, Adler ID, Pacchierotti F, Peltonen K. 1998a.DNA adducts in mouse testis and lung after inhalationexposure to 1,3-butadiene. Mutat Res 397:3–10.
Koivisto P, Adler ID, Pacchierotti F, Peltonen K. 1998b.Regio- and stereospecific DNA adduct formation in mouselung at N6 and N7 position of adenine and after 1,3-buta-diene inhalation exposure. Biomarkers 3:385–397.
Koivisto P, Adler ID, Sorsa M, Peltonen K. 1996. Inhalationexposure of rats and mice to 1,3-butadiene induces N6-ade-nine adducts of epoxybutene detected by 32P-postlabelingand HPLC. Environ Health Perspect 104(Suppl 3):655–657.
Koivisto P, Kilpeläinen I, Rasanen I, Adler D, PacchierottiF, Peltonen K. 1999. Butadiene diolepoxide- and diepoxi-butane-derived DNA adducts at N7-guanine: A high occur-rence of diolepoxide-derived adducts in mouse lung after1,3-butadiene exposure. Carcinogenesis 20:1253–1259.
Koivisto P, Sorsa M, Pacchierotti F, Peltonen K. 1997. 32P-Postlabeling/HPLC assay reveals an enantioselective adductformation in N7-guanine residues in vivo after 1,3-buta-diene inhalation exposure. Carcinogenesis 18:439–443.
Krause R, Elfarra AA. 1997. Oxidation of butadiene mon-oxide to meso- and (�)-diepoxybutane by cDNA-expressedhuman cytochrome P450s and by mouse, rat, and humanliver microsomes: Evidence for preferential hydration ofmeso-diepoxybutane in rat and liver microsomes. ArchBiochem Biophys 337:176–184.
Kreiling R, Laib RJ, Bolt HM. 1986a. Alkylation of nuclearproteins and DNA after exposure of rats and mice to [1,4-14C]1,3-butadiene. Toxicol Lett 30:131–136.
Kreiling R, Laib RJ, Filser JG, Bolt HM. 1986b. Species dif-ferences in butadiene metabolism between mice and ratsevaluated by inhalation pharmacokinetics. Arch Toxicol58:235–238.
Kumar R, Vodicka P, Koivisto P, Peltonen K, Hemminki K.1996. 32P-postlabeling of diastereomeric 7-alkylguanineadducts of butadiene monoepoxide. Carcinogenesis 17(6):1297–1303.
La DK, Swenberg JA. 1997. Carcinogenic alkylating agents.In: Comprehensive Toxicology (Sipes IG, McQueen CA,Gandolfi AJ, eds), Vol 12, Chemical Carcinogens and Anti-carcinogens, pp 111–140. Elsevier Science Publishing Co,New York NY.
Lähdetie J, Grawé J. 1997. Flow cytometric analysis ofmicronucleus induction in rat bone marrow polychro-matic erythrocytes by 1,2,3,4-diepoxybutane, 3,4-epoxy-1-
butene and 1,2-epoxybutane-3,4-diol. Cytometry 28(3):228–235.
Lähdetie J, Peltonen K, Sjoblom T. 1997. Germ cell mutage-nicity of three metabolites of 1,3-butadiene in the rat.Environ Mol Mutagen 29:230–239.
Lancaster JM, Brownie HA, Bell DA, Futreal A, Marks JR,Berchuck A, Wiseman RW, Taylor JA. 1996. Microsomalepoxide hydrolase polymorphism as a risk factor for ova-rian cancer. Mol Carcinog 17:160–162.
Lawley PD, Brookes P. 1967. Interstrand cross-linking ofDNA by dysfunctional alkylating agents. J Mol Biol25:143–160.
Le Marchand L, Sivaraman L, Pierce L, Seifried A, Lum A,Wilkens LR, Lau AF. 1998. Associations of CYP1A1,GSTM1, and CYP2E1 polymorphisms with lung cancersuggest cell type specificities to tobacco carcinogens.Cancer Res 58(21):4858–4863.
Leuratti C, Jones NJ, Marafante E, Kostiainen R, PeltonenK, Waters R. 1994. DNA damage induced by the environ-mental carcinogen butadiene: Identification of a diepoxybu-tane-adenine adduct and its detection by 32P-postlabeling.Carcinogenesis 15:1903–1910.
Lin D-X, Tang Y-M, Peng Q, Lu S-X, Ambrosone CB, Kad-lubar FF. 1998. Susceptibility to esophageal cancer andgenetic polymorphisms in glutathione S-transferases T1,P1, and M1 and cytochrome P450 2E1. Cancer EpidemiolBiomarkers Prev 7:1013–1018.
Lin P, Wang SL, Wang HJ, Chen KW, Lee HS, Tsai KJ, ChenCY, Lee H. 2000. Association of CYP1A1 and microsomalepoxide hydrolase polymorphisms with lung squamouscell carcinoma. Br J Cancer 82(4):852–857.
Lindsey JK. 1999. Models from Repeated Measurements.Oxford University Press, New York NY.
Lucas D, Menez C, Girre C, Berthou F, Bodenez P, Joannet I,Hispard E, Bardou LG, Menez J-F. 1995. Cytochrome P4502E1 genotype and chlorzoxazone metabolism in healthand alcoholic Caucasian subjects. Pharmacogenetics5:298–304.
Lucas JN, Poggenesee M, Straume T. 1993. Translocationbetween two specific human chromosomes detected bythree-color “chromosome painting.” Cytogenet Cell Genet62:11–12.
Lynch JR. 2000. Theory and rationale of exposure measure-ment. In: Patty’s Industrial Hygiene (Harris RL, ed), 5th ed,Vol 1, pp 211–263. Wiley & Sons, New York NY.
128
Biomarkers in Czech Workers Exposed to 1,3-Butadiene
Ma H, Wood TG, Ammenheuser MA, Rosenblatt JI, Ward JBJr. 2000. Molecular analysis of HPRT mutant lymphocytesfrom 1,3-butadiene exposed workers. Environ Mol Mutagen36:59–71.
Macaluso M, Delzell E, Sanders M, Larson R. 1997. Histor-ical estimation of exposure to butadiene and styreneamong synthetic rubber workers. International Institute ofSynthetic Rubber Producers, Houston TX.
Macaluso M, Larson R, Delzell E, Sathiakumar N, HovingaM, Julian J, Muir D, Cole P. 1996. Leukemia and cumula-tive exposure to butadiene, styrene and benzene amongworkers in the synthetic rubber industry. Toxicology 113:190–202.
Macaluso M, Larson R, Lynch JR, Lipton S, Delzell E. 2000.Historical estimation of exposure to 1,3-butadiene, styreneand dimethyldithiocarbamate among synthetic rubberworkers. International Institute of Synthetic Rubber Pro-ducers, Houston TX.
Malats N, Camus-Radon AM, Nyberg F, Ahrens W, Con-stantinescu V, Mukeria A, Benhamou S, Batura-Gabryel H,Bruske-Hohlfeld I, Simonato L, Menezes A, Lea S, Lang M,Boffetta P. 2000. Lung cancer risk in non-smokers andGSTM1 and GSTT1 genetic polymorphism. Cancer Epide-miol Biomarkers Prev 9(8):827–833.
Matanoski G, Francis M, Correa-Villasenor A, Elliott E,Santos-Burgoa C, Schwartz L. 1993. Cancer epidemiologyamong styrene-butadiene rubber workers. In: Butadieneand Styrene: Assessment of Health Hazards, (Sorsa M, Pel-tonen K, Vainio H, Hemminki K, eds) pp 363–374. IARCScientific Publications Vol 127. International Agency forResearch on Cancer, Lyon, France.
Matanoski GM, Schwartz L, Sperazza J, Tonascia J. 1982.Mortality of workers in the styrene-butadiene polymermanufacturing industry. In: Final Report Prepared underContract to the International Institute of Synthetic RubberProducers. The Johns Hopkins University School ofHygiene and Public Health, Baltimore MD.
Matsuo Y, Yokoyama R, Yokoyama S. 1989. The genes forhuman alcohol dehydrogenases beta-1 and beta-2 differ byonly one nucleotide. Eur J Biochem 183:317–320.
Matthias C, Bockmuhl U, Jahnke V, Jones PW, Hayes JD,Alldersea J, Gilford J, Bailey L, Bath J, Worrall SF, Hand P,Fryer AA, Strange RC. 1998. Polymorphism in cytochromeP450 CYP2D6, CYP1A1 and CYP2E1 and glutathione S-transferase, GSTM1, GSTM3, GSTT1 and susceptibility totobacco-related cancers: Studies in upper aerodigestivetract cancers. Pharmacogenetics 8(2):91–100.
McGlynn KA, Rosvold EA, Lustbader ED, Hu Y, ClapperML, Zhou T, Wild CP, Xia XL, Baffoe-Bonnie A, Ofori-AdjeiD, Chen G, London WT, Shen F, Buetow KH. 1995. Suscep-tibility to hepatocellular carcinoma is associated withgenetic variation in the enzymatic detoxification of afla-toxin B1. Proc Natl Acad Sci USA 92(6):2384–2387.
McGregor D, Brown AG, Cattanach P, Edwards I, McBrideD, Riach C, Shepherd W, Caspary WJ. 1991. Responses ofthe L5178Y mouse lymphoma forward mutation assay: V.Gases and vapors. Environ Mol Mutagen 17:122–129.
Meinhardt TJ, Lemen RA, Crandall MS, Young RJ. 1982.Environmental epidemiologic investigation of the styrene-butadiene rubber industry. Scand J Work Environ Health8:250–259.
Melnick RL, Huff J, Chou BJ, Miller R. 1990. Carcinoge-nicity of 1,3-butadiene in C57BL/6C3H F1 mice at lowexposure concentrations. Cancer Res 50:6592–6599.
Melnick RL, Kohn MC. 1995. Mechanistic data indicatethat 1,3-butadiene is a human carcinogen. Carcinogenesis16:157–163.
Menegon A, Board PG, Blackburn AC, Mellick GD, Le Cou-teur DG. 1998. Parkinson’s disease, pesticides, and glu-tathione transferase polymorphisms. Lancet 352:1344–1346.
Meng Q, Henderson RG, Chen T, Heflich RH, Walker DM,Bauer MJ, Reilly AA, Walker VE. 1999. Mutagenicity of1,3-butadiene at the Hprt locus of T-lymphocytes fol-lowing inhalation exposures of female mice and rats.Mutat Res 429:107–125.
Meng Q, Henderson RF, Reilly AA, Bauer M, Chen T,Heflich RH, Walker VE. 1999a. Mutagenicity of 1,3-buta-diene at the Hprt locus of T-cells following inhalationexposures of female mice and rats. Mutat Res 429:107–125.
Meng Q, Henderson RH, Reilly AA, Bauer M, Walker VE.1999b. Mutagenicity of epoxybutene and diepoxybutane atthe Hprt locus of T-cells following inhalation exposures ofmice and rats. Mutat Res 429:127–140.
Meng Q, Recio L, Reilly AA, Wong B, Bauer M, Walker VE.1998. Comparison of the mutagenic potency of 1,3-buta-diene at the Hprt locus of lymphocytes following inhala-tion exposure of female B6C3F1 mice and F344 rats.Carcinogenesis 19:1019–1027.
Meng Q, Singh N, Heflich RH, Bauer MJ, Walker VE. 2000.Comparison of the mutations at the Hprt exon 3 of T-lym-phocytes from B6C3F1 mice and F344 rats exposed by

129
inhalation to 1,3-butadiene or the racemic mixture of1,2:3,4-diepoxybutane. Mutat Res 464:169–184.
Minnesota Mining and Manufacturing Corp (3M). 1996.Organic Vapor Monitors 3500/3510/3520/3530-ValidationProtocol. 3M Technical Data Bulletin 124. 3M Center, StPaul MN.
Montgomery DC. 1991. Design and Analysis of Experi-ments, 3rd ed. John Wiley & Sons, New York NY.
Morrow NL. 1990. The industrial production and use of1,3-butadiene. Environ Health Perspect 86:7–8.
Mowrer J, Törnqvist M, Jensen S, Ehrenberg L. 1986. Mod-ified Edmand degradation applied to hemoglobin for mon-itoring occupational exposure to alkylating agents. ToxicolEnviron Chem 11:215–257.
Mraz J, Gescher A, Cross H, Shaw AJ, Flek J. 1991. Newfindings in the metabolism of N,N-dimethylformamide:Consequences for evaluation of occupational risk. SciTotal Environ 101:131–134.
Mraz J, Nohova H. 1992. Absorption, metabolism andelimination of N,N-dimethylformamide in humans. IntArch Occup Environ Health 64:85–92.
Muramarsu T, Wang ZC, Fang YR, Hu KB, Yan H, YamadaK, Higuchi S, Harada S, Kono H. 1995. Alcohol and alde-hyde dehydrogenase genotypes and drinking behavior ofChinese living in Shanghai. Hum Genet 96:151–154.
Neagu I, Koivisto P, Neagu C, Kostiainen R, Stenby K, Pel-tonen K. 1995. Butadiene monoxide and deoxyguanosinealkylation products at the N7-position. Carcinogenesis16:1809–1813.
Nicklas JA, Falta MT, Hunter TC, O’Neill JP, Jacobson-Kram D, Williams JR, Albertini RJ. 1990. Molecular anal-ysis of in vivo HPRT mutations in human T-lymphocytes.V. Effects of total body irradiation secondary to radioim-munoglobulin therapy (RIT). Mutagenesis 5:461–468.
Nicklas JA, Hunter TC, O’Neill JP, Albertini RJ. 1989.Molecular analyses of in vivo HPRT mutations in humanlymphocytes: III. Longitudinal study of HPRT gene struc-tural alterations and T-cell clonal origins. Mutat Res 215:147–160.
Nicklas JA, O’Neill JP, Albertini RJ. 1986. Use of T-cellreceptor gene probes to quantify the in vivo HPRT muta-tions in human T-lymphocytes. Mutat Res 173:67–72.
Nieusma JL, Claffey DJ, Maniglier-Poulet C, Imiolczyk T,Ross D, Ruth JA. 1997. Stereochemical aspects of 1,3-buta-
diene metabolism and toxicity in rat and mouse livermicrosomes and freshly isolated rat hepatocytes. ChemRes Toxicol 10:450–456.
Nieusma JL, Claffey DJ, Ruth JA, Ross D. 1998. Stereo-chemical aspects of the conjugation epoxide metabolites ofbutadiene with glutathione in rat liver cytosol and freshlyisolated rat hepatocytes. Toxicol Sci 43:102–109.
Nishimoto IN, Hanaoka T, Sugimura H, Nagura K, Ihara M,Li XJ, Arai T, Hamada GS, Kowalski LP, Tsugane S. 2000.Cytochrome P450 2E1 polymorphism in gastric cancer inBrazil: Case-control studies of Japanese Brazilians andnon-Japanese Brazilians. Cancer Epidemiol BiomarkersPrev 9(7):675–680.
Norppa H, Hirvonen A, Jarventaus H, Uuskula M, Tasa G,Ojajarvi A, Sorsa M. 1995. Role of GSTT1 and GSTM1genotypes in determining individual sensitivity to sisterchromatid exchange induction by diepoxybutane in cul-tured human lymphocytes. Carcinogenesis 16:1261–1264.
Norppa H, Sorsa M. 1993. Genetic toxicology of 1,3-buta-diene and styrene. In: Butadiene and Styrene: Assessmentof Health Hazards (Sorsa M, Peltonen K, Vainio H, Hem-minki K, eds), pp 185–193. IARC Scientific PublicationsVol 127. International Agency for Research on Cancer,Lyon, France.
Occupational Safety and Health Administration (US).1990. Occupational exposure to 1,3-butadiene. Fed Regist55:32737–32757.
Occupational Safety and Health Administration (US).1996. Occupational exposure to 1,3-butadiene: Final rule.Fed Regist 61(214):56745–56795.
Okino ST, Quattrochi LC, Pendurthi UR, McBride OW,Tukey RH. 1987. Characterization of multiple human cyto-chrome P-450 1 cDNAs: The chromosomal localization ofthe gene and evidence for alternate RNA splicing. J BiolChem 262:16079–16079.
O’Neill JP, McGinniss MJ, Berman JK, Sullivan LM,Nicklas JA, Albertini RJ. 1987. Refinement of a T-lympho-cyte cloning assay to quantify the in vivo thioguanine-resistant mutant frequency in humans. Mutagenesis 2:87–94.
Oscarson M, Gullsten H, Rautio A, Bernal ML, Sinues B,Dahl M-L, Stengard JH, Pelkonen O, Raunio H, Ingelman-Sundberg M. 1998. Genotyping of human cytochromeP450 2A6 (CYP2A6), a nicotine C-oxidase. FEBS Lett438:201–205.
RJ Albertini et al

130
Biomarkers in Czech Workers Exposed to 1,3-Butadiene
Oscarson M, McLellan RA, Gullsten H, Yue Q-Y, Lang MA,Bernal ML, Sinues B, Hirvonen A, Raunio H, Pelkonen O,Ingelman-Sundberg M. 1999. Characterisation and PCR-based detection of a CYP2A6 gene deletion found at a highfrequency in a Chinese population. FEBS Lett 448:105–110.
Osier M, Pakstis AJ, Kidd JR, Lee JF, Yin SJ, Ko HC, Eden-berg HJ, Lu RB, Kidd KK. 1999. Linkage disequilibrium atthe ADH2 and ADH3 loci and risk of alcoholism. Am JHum Genet 64:1147–1157.
Osterman-Golkar S, Bond JA. 1996. Biomonitoring of 1,3-butadiene and related compounds. Environ Health Per-spect 104:907–915.
Osterman-Golkar S, Bond JA, Ward JB Jr, Legator MS. 1993.The use of hemoglobin adducts as a tool for biomonitoringbutadiene exposure. In: Butadiene and Styrene: Assess-ment of Health Hazards (Sorsa M, Peltonen K, Vainio H,Hemminki K, eds), pp 127–134. IARC Scientific Publica-tions Vol 127. International Agency for Research onCancer, Lyon, France.
Osterman-Golkar S, Kautiainen A, Bergmark E, HåkanssonK, Määki-Paakkanen J. 1991. Hemoglobin adducts and uri-nary mercapturic acids in rats as biological indicators ofbutadiene exposure. Chem Biol Interact 80:291–302.
Owen PE, Glaister JR, Gaunt IF, Pullinger DH. 1987. Inha-lation toxicity studies with 1,3-butadiene. 3. Two-yeartoxicity/carcinogenicity studies in rats. Am Ind Hyg AssocJ 48:407–413.
Owen WJ, DeRouen TA. 1980. Estimation of the mean forlognormal data containing zeroes and left-censored values,with applications to the measurement of worker exposureto air contaminants. Biometrics 36:707–719.
Pacchierotti F, Adler ID, Anderson D, Brinkworth M,Demopoulos NA, Lähdetie J, Osterman-Golkar S, PeltonenK, Russo A, Tates A, Waters R. 1998. Genetic effects of 1,3-butadiene and associated risk for heritable damage. MutatRes 397(1):93–115.
Park JY, Schantz SP, Stern JC, Kaur T, Lazarus P. 1999.Association between glutathione S-transferase pi geneticpolymorphisms and oral cancer risk. Pharmacogenetics9(4):497–504.
Pemble S, Schroeder KR, Spencer SR, Meyer DJ, HallierE, Bolt HM, Ketterer B, Taylor JB. 1994. Human glu-tathione S-transferase theta (GSTT1): cDNA cloning andthe characterization of a genetic polymorphism. BiochemJ 300:271–176.
Pérez HL, Lähdetie J, Hindsø-Landin H, Kilpeläinen I,Koivisto P, Peltonen K, Osterman-Golkar S. 1997. Haemo-globin adducts of epoxybutanediol from exposure to 1,3-butadiene or butadiene epoxides. Chem Biol Interact105:181–198.
Perry P, Wolf S. 1974. New Giemsa method for differentialstaining of sister chromatids. Nature 251:156–158.
Popp W, Vahrenholz C, Przygoda H, Brauksiepe A, Goch S,Müller G, Schell, C, Norpoth K. 1994. DNA-protein cross-links and sister chromatid exchange frequencies in lym-phocytes and hydroxyethyl mercapturic acid in urine ofethylene oxide-exposed hospital workers. Int Arch OccupEnviron Health 66:325–332.
Ranasinghe A, Christova-Gueorguieva NI, Sangaiah R, KocH, Swenberg JA. 2000. GC/ECNCI/MS analysis of N,N-(2,3-dihydroxybuta-1,4-diyl) valine. In: Proceedings of the 48thASMS Conference on Mass Spectrometry and AppliedTopics. American Society for Mass Spectrometry, Santa FeNM.
Ranasinghe A, Scheller N, Wu KY, Upton PB, SwenbergJA. 1998. Application of gas chromatography/electron cap-ture negative chemical ionization high-resolution massspectrometry for analysis of DNA and protein adducts.Chem Res Toxicol 11:520–526.
Recio L, Meyer K. 1995. Increased frequency of mutationsat A•T base pairs in the bone marrow of B6C3F1 lacI trans-genic mice exposed to 1,3-butadiene. Environ Mol Mutagen26:1–8.
Recio L, Osterman-Golkar S, Csanády GA, Turner MJ,Mhyr B, Moss O, Bond JA. 1992. Determination of mutage-nicity in tissues of transgenic mice following exposure to1,3-butadiene and N-ethyl-N-nitrosourea. Toxicol ApplPharmacol 117:58–64.
Recio L, Pluta LJ, Meyer KG. 1998. The in vivo mutage-nicity and mutational spectrum at the lacI transgene recov-ered from the spleens of B6C3F1 mice following a 4-weekinhalation exposure to 1,3-butadiene. Mutat Res 401(1–2):99–110.
Recio L, Saranko CJ, Steen A-M. 2000. Part II. Roles of twometabolites of 1,3-butadiene in mediating its in vivo geno-toxicity. In: 1,3-Butadiene: Cancer, Mutations, and Adducts,pp 49–87. Research Report 92. Health Effects Institute,Cambridge MA.
Richardson KA, Megens HJJJ, Genuit WJ, Van Velzen GJ,Peters MMCG, van Elburg P, Boogaard PJ, Watson WP, vanSittert NJ. 1998a. The fate of butadiene in experimental
131
animals. IV. Measurement of total and specific haemo-globin adducts. Report CA.98.20328. Shell Research andTechnology Centre, Amsterdam, The Netherlands.
Richardson KA, Megens HJJJ, Van Gaalen FC, PetersMMCG, van Elburg PA, Watson WP, Boogaard PJ, vanSittert NJ. 1998b. Hb adduct profiles differ after 1,3-buta-diene or 1,2-epoxy-3-butene and between rats and mice(abstract). Toxicol Sci 42:364.
Richardson KA, Megens HJJJ, Webb JD, van Sittert NJ.1996. Biological monitoring of butadiene exposure bymeasurement of haemoglobin adducts. Toxicology 113:112–118.
Richardson KA, Peters MMCG, Megens HJJJ, Boogaard PJ,van Elburg PA. 1997. The metabolic fate of butadienemonoepoxide in rats and mice. Report CA.97.20501.Shell Research and Technology Centre, Amsterdam, TheNetherlands.
Richardson KA, Peters MMCG, Megens HJJJ, van ElburgPA, Golding BT, Boogaard PJ, Watson WP, van Sittert NJ.1998c. Identification of novel metabolites of butadienemonoepoxide in rats and mice. Chem Res Toxicol 11:1543–1555.
Richardson KA, Peters MM, Wong BA, Megens RH, vanElburg PA, Booth ED, Boogaard PJ, Bond JA, MedinskyMA, Watson WP, van Sittert NJ. 1999. Quantitative andqualitative differences in the metabolism of 14C-1,3-buta-diene in rats and mice: Relevance to cancer susceptibility.Toxicol Sci 49:186–201.
Ríos-Blanco MN, Faller T, Kessler W, Ranasinghe A, FilserJG, Swenberg JA. 2000. Quantitation of DNA and hemo-globin adducts and apurinic/apyrimidinic sites in tissue ofF344 rats exposed to propylene oxide by inhalation. Car-cinogenesis 21(11):2011–2018.
Robinson DR, Goodall K, Albertini RJ, O’Neill JP, Finette B,Sala-Trepat M, Moustacchi E, Tates AD, Beare DM, GreenMHL, Cole J. 1994. An analysis of in vivo HPRT mutantfrequency in circulating T lymphocytes in the normalhuman population: A comparison of four datasets. MutatRes 313:227–247.
Rollinson S, Roddam P, Kane E, Roman E, Cartwright R,Jack A, Morgan GJ. 2000. Polymorphic variation within theglutathione S-transferase genes and risk of adult leu-kaemia. Carcinogenesis 21(1):43–47.
Rosenthal SL. 1985. The reproductive effects assessmentgroup’s report on the mutagenicity of 1,3-butadiene and itsreactive metabolites. Environ Mutagen 7:933–945.
Rube J, Kucharová S, Vozdová M, Musilová P, Zudova Z.1998. Cytogenetic analysis of peripheral lymphocytes inmedical personnel by mean of FISH. Mutat Res 412:293–298.
Rydberg P, Magnusson AL, Zorcec V, Granath F, TörnqvistM. 1996. Adducts to N-terminal valines in hemoglobinfrom butadiene metabolites. Chem Biol Interact 101:193–205.
Sabourin PJ, Burka LT, Bechtold WE, Dahl AR, Hoover MD,Chang I-Y, Henderson RF. 1992. Species differences in uri-nary butadiene metabolites: Identification of 1,2-dihy-droxy-4-(N-acetylcysteinyl)-butane, a novel metabolite of1,3-butadiene. Carcinogenesis 13:1633–1638.
Salagovic J, Kalina I, Stubna J, Habalova V, Hrivnak M, Val-ansky L, Kohut A, Biros E. 1998. Genetic polymorphism ofglutathione S-transferases M1 and T1 as a risk factor inlung and bladder cancers. Neoplasma 45(5):312–317.
Santos-Burgoa C, Matanoski GM, Zeger S, Schwartz L.1992. Lymphohematopoietic cancer in styrene-butadienepolymerization workers. Am J Epidemiol 136:843–854.
Sasiadek M, Järentaus H, Sorsa M. 1991a. 1,3-Butadieneand its epoxides induce sister-chromatid exchanges inhuman lymphocytes in vitro. Mutat Res 261:117–121.
Sasiadek M, Järentaus H, Sorsa M. 1991b. Sister-chromatidexchanges induced by 1,3-butadiene and its epoxides inCHO cells. Mutat Res 263:47–50.
Seaton MJ, Follansbee MH, Bond JA. 1995. Oxidation of1,2-epoxy-3-butene to 1,2,3,4-diepoxybutane by cDNA-expressed human cytochromes P450 2E1 and 3A4 andhuman, mouse and rat liver microsomes. Carcinogenesis16:2287–2293.
Seidegard J, Pero RW, Markowitz MM, Roush G, MillerDG, Beattie EJ. 1990. Isoenzyme(s) of glutathione trans-ferase (class �) as a marker for the susceptibility tolung cancer: A follow up study. Carcinogenesis 11:33–36.
Selzer RR, Elfarra AA. 1996a. Characterization of N1- andN6-adenosine adducts and N1-inosine adducts formed bythe reaction of butadiene monoxide with adenosine: Evi-dence for the N1-adenosine adducts as major initial prod-ucts. Chem Res Toxicol 9:875–881.
Selzer RR, Elfarra AA. 1996b. Synthesis and biochemicalcharacterization of N1-, and N7-guanosine adducts of buta-diene monoxide. Chem Res Toxicol 9:126–132.
Sernau R, Cavagnaro, Kehn P. 1986. 1,3-butadiene as an S9activation-dependent gaseous positive control substance
s
RJ Albertini et al

132
Biomarkers in Czech Workers Exposed to 1,3-Butadiene
in L5178Y cell mutation assays (abstract 203). EnvironMutagen 8(Suppl):75.
Shelby MD. 1990. Results of NTP-sponsored mouse cyto-genetic studies on 1,3-butadiene isoprene and chloro-prene. Environ Health Perspect 86:71–74.
Shields PG, Ambrosone CB, Graham S, Bowman ED, Har-rington AM, Gillenwater KA, Marshall JR, Vena JE,Laughlin R, Nemoto T, Freudenheim JL. 1996. A cyto-chrome P4502E1 genetic polymorphism and tobaccosmoking in breast cancer. Mol Carcinog 17:144–150.
Singh AK, Singh A, Engelhardt M. 1997. The LognormalDistribution in Environmental Applications. US EPATechnology Support Center document. US EPA, Wash-ington DC.
Sisk SC, Pluta L, Bond JA, Recio L. 1994. Molecular anal-ysis of lacI mutants from bone marrow of B6C3F1 trans-genic mice following inhalation exposure of 1,3-butadiene. Carcinogenesis 15:471–477.
Sorsa M, Autio K, Demopoulos NA, Jarventaus H, RössnerP, rám RJ, Stephanou G, Vlachodimitropoulos D. 1994.Human cytogenetic biomonitoring of occupational expo-sure to 1,3-butadiene. Mutat Res 309:321–326.
Sorsa M, Osterman-Golkar S, Peltonen K, Saarikoski ST,rám R. 1996. Assessment of exposure to butadiene in the
process industry. Toxicology 113:77–83.
rám RJ, Dobiá L, Pastorková A, Rössner P, Janca L. 1983.Effect of ascorbic acid prophylaxis on the frequency ofchromosome abberations in the peripheral lymphocytes ofcoal-tar workers. Mutat Res 120:181–186.
rám RJ, Rössner P, Peltonen K, Podrazilova K, MrackovaG, Demopoulos NA, Stephanou G, Vlachodimitropoulos D,Darroudi F, Tates AD. 1998. Chromosomal aberrations,sister-chromatid exchanges, cells with high frequency ofSCE, micronuclei and comet assay parameters in 1,3-buta-diene-exposed workers. Mutat Res 419(1–3):145–154.
Stanulla M, Schrappe M, Mueller Brechlin A, Zimmer-mann M, Welte K. 2000. Polymorphisms within glu-tathione S-transferase genes (GSTM1, GSTT1, GSTP1) andrisk of relapse in childhood B-cell precursor acute lym-phoblastic leukeia: A case-control study. Blood 95:1222–1228.
Steen A-M, Meyer KG, Recio L. 1997a. Analysis of HPRTmutations occurring in human TK6 lymphoblastoid cellsfollowing exposure to 1,2,3,4-diepoxybutane. Mutagenesis12:61–67.
S
S
S s
S
Steen A-M, Meyer KG, Recio L. 1997b. Characterization ofHPRT mutations following 1,2-epoxy-3-butene exposureof human TK6 cells. Mutagenesis 12:359–364.
Stephanou G, Andrianopoulos C, Vlastos D, DemopoulosNA, Russo A. 1997. Induction of micronuclei and sisterchromatid exchanges in mouse splenocytes after exposureto the butadiene metabolite 3,4-epoxy-1-butene. Mutagen-esis 12:429–429.
Stephanou G, Russo A, Vlastos D, Andrianopoulos C,Demopoulos NA. 1998. Micronucleus induction insomatic cells of mice as evaluated after 1,3-butadiene inha-lation. Mutat Res 397(1):11–20.
Sweeney C, Farrow DC, Schwartz SM, Eaton DL, Check-oway H, Vaughan TL. 2000. Glutathione S-transferase M1,T1, and P1 polymorphisms as risk factors for renal cell car-cinoma: A case-control study. Cancer Epidemiol Bio-markers Prev 9(4):449–454.
Swenberg JA, Christova-Gueorguieva NI, Upton PB, Ranas-inghe A, Scheller N, Wu K-Y, Yen T-W, Hayes R. 2000a.Part V: Hemoglobin adducts as biomarkers of 1,3-buta-diene exposure and metabolism. In: 1,3-Butadiene: Cancer,Mutations, and Adducts, pp 191–210. Research Report 92.Health Effects Institute, Cambridge MA.
Swenberg JA, Ham A, Koc H, Morinello E, Ranasinghe A,Tretyakova N, Upton PB, Wu K. 2000b. DNA adducts:Effects of low exposure to ethylene oxide, vinyl chlorideand butadiene. Mutat Res 464:77–86.
Takeshita T, Yang X, Inoue Y, Sato S, Morimoto K. 2000.Relationship between alcohol drinking, ADH2 and ALDH2genotypes, and risk for hepatocellular carcinoma in Japa-nese. Cancer Lett 149(1–2):69–76.
Tan W, Song N, Wang GQ, Liu Q, Tang HJ, Kadlubar FF, LinDX. 2000. Impact of genetic polymorphisms in cytochromeP450 2E1 and glutathione S-transferase M1, T1, and P1 onsusceptibility to esophageal cancer among high-risk indi-viduals in China. Cancer Epidemiol Biomarkers Prev9(6):551–556.
Tates AD, Grummt T, Tornqvist M, Farmer PB, van Dam FJ,van Mossel H, Schoemaker HM, Osterman-Golkar S, UebelC, Tang YS, Zwinderman AH, Natarajan AT, Ehrenberg L.1991a. Biological and chemical monitoring of occupa-tional exposure to ethylene oxide. Mutat Res 250:483–497.
Tates AD, van Dam FJ, de Zwart FA, Darroudi F, NatarajanAT, Rössner P, Peterková K, Peltonen K, Demopoulos NA,Stephanou G, Vlachodimitripoulos D, rám RJ. 1996. Bio-logical effect monitoring in industrial workers from the
S

133
Czech Republic exposed to low levels of butadiene. Toxi-cology 113:91–99.
Tates AD, van Dam FJ, de Zwart FA, van Teylingen CM,Natarajan AT. 1994. Development of a cloning assay withhigh cloning efficiency to detect induction of 6-thiogua-nine-resistant lymphocytes in spleens of adult micefollowing in vivo inhalation exposure to 1,3-butadiene.Mutat Res 309:299–306.
Tates AD, van Dam FJ, van Mossel H, Schoemaker H,Thijssen JCP, Woldring VM, Zwinderman AH, NatarajanAT. 1991b. Use of the clonal assay for the measurement offrequencies of HPRT mutants in T-lymphocytes from fivecontrol populations. Mutat Res 253:199–213.
Tates AD, van Dam FJ, van Teylingen CMM, de Zwart FA,Zwinderman AG. 1998. Comparison of induction of hprtmutation by 1,3-butadiene and/or its 1,2-epoxybutene and1,2,3,4-diepoxybutane in lymphocytes from spleens ofadult male mice and rats in vivo. Mutat Res 397:21–36.
Thomas CB, Nelson DO, Pleshanov P, Vorobstova I, TurevaL, Jensen R, Jones I. 1999. Elevated frequencies of hypox-anthine phosphoribosyltransferase lymphocyte mutantsare detected in Russian liquidators 6 to 10 years after expo-sure to radiation from the Chernobyl nuclear power plantaccident. Mutat Res 439:105–119.
Thornton-Manning JR, Dahl AR, Bechtold WE, Griffith WCJr, Henderson RF. 1995. Disposition of butadiene mono-epoxide and butadiene diepoxide in various tissues of ratsand mice following a low-level inhalation exposure to 1,3-butadiene. Carcinogenesis 176:1723–1731.
Tice RR, Boucher R, Luke CA, Shelby MD. 1987. Compara-tive cytogenetic analysis of bone marrow damage inducedin male B6C3F1 mice by multiple exposures to gaseous 1,3-butadiene. Environ Mutagen 9:235–250.
To-Figueras J, Gene M, Gomes-Catalan J, Galan MC,Fuentes M, Ramon JM, Rodamilans M, Huguet E, CorbellaJ. 1997. Glutathione S-transferase M1 (GSTM1) and T1(GSTT1) polymorphisms and lung cancer risk amongNorthwestern Mediterraneans. Carcinogenesis 18(8):1529–1533.
Tommasi AM, de Conti S, Dobrzynska MM, Russo A. 1998.Evaluation and characterization of micronuclei in earlyspermatids of mice exposed to 1,3-butadiene. Mutat Res397:45–54.
Törnqvist M, Mowrer J, Jensen S, Ehrenberg L. 1986. Mon-itoring of environmental cancer initiators through hemo-
globin adducts by a modified Edman degradation method.Anal Biochem 154:255–266.
Tretyakova NY, Chiang S-Y, Walker VE, Swenberg JA.1998. Quantitative analysis of 1,3-butadiene-induced DNAadducts in vivo and in vitro using liquid chromatographyelectrospray ionization tandem mass spectrometry. J MassSpectrom 33:363–376.
Tretyakova NY, Lin Y-P, Sangaiah R, Upton PB, SwenbergJA. 1997a. Identification and quantitation of DNA adductsfrom calf-thymus DNA exposed to 3,4-epoxy-1-butene.Carcinogenesis 18:137–147.
Tretyakova NY, Lin Y-P, Upton PB, Sangaiah R, SwenbergJA. 1996. Macromolecular adducts of butadiene. Toxi-cology 113:70–76.
Tretyakova NY, Sangaiah R, Yen T-Y, Swenberg JA. 1997b.Synthesis, characterization, and in vitro quantitation ofN7-guanine adducts of diepoxybutane. Chem Res Toxicol10:779–785.
Tretyakova NY, Sangaiah R, Yen T-Y, Swenberg JA. 1997c.Adenine adducts with diepoxybutane: Isolation and anal-ysis in exposed calf thymus DNA. Chem Res Toxicol10:1171–1179.
Tucker JD, Morgan WF, Awa AA, Bauchinger M, Blakey D,Cornforth MN, Littlefield LG, Natarajan AT, Shasserre C.1995. A proposed system for scoring structural aberrationsdetected by chromosome painting. Cytogenet Cell Genet68:211–221.
Uematsu F, Kikuchi H, Motomiya M, Abe T, Sagami I,Omachi T, Wakui A, Kanamaru R, Watanabe M. 1991.Association between restriction fragment length polymor-phism of the human cytochrome P450IIE1 gene and sus-ceptibility to lung cancer. Jpn J Cancer Res 82:254–256.
Upton PB, Ranasinghe A, Walker VE, Swenberg JA. 2000.Formation of hemoglobin adducts in female rats and micefollowing exposure to butadiene (abstract). Toxicol Sci54:S307.
US Congress. 1991. Compilation of Acts Within the Juris-diction of the Committee on Energy and Commerce. USGovernment Printing Office, Washington DC.
US International Trade Commission. 1990. SyntheticOrganic Chemicals: United States Production and Sales,1989. Publication 2338. Government Printing Office Wash-ington DC.
Uuskula M, Jarventaus H, Hirvonen A, Sorsa M, Norppa H.1995. Influence of GSTM1 genotype on sister chromatid
RJ Albertini et al

134
Biomarkers in Czech Workers Exposed to 1,3-Butadiene
exchange induction by styrene-7,8-oxide and 1,3-epoxy-3-butene in cultured human lymphocytes. Carcinogenesis16:947–950.
Van Duuren BL, Langseth L, Orris L, Teebor G, Nelson N,Kuschner M. 1966. Carcinogenicity of epoxides, lac-tones, and peroxy compounds. IV. Tumor response inepithelial and connective tissue in mice and rats. JNCI37:825–838.
Van Duuren BL, Nelson N, Orris L, Palmes ED, Schmitt FL.1963. Carcinogenicity of epoxides, lactones, and peroxycompounds. JNCI 31:41–55.
Van Duuren B, Orris L, Nelson N. 1965. Carcinogenicity ofepoxides, lactones, and peroxy compounds. Part II. JNCI35:707–717.
van Lieshout EM, Roelofs HM, Dekker S, Mulder CJ,Wobbes T, Jansen JB, Peters WH. 1999. Polymorphicexpression of the glutathione S-transferase P1 gene and itssusceptibility to Barrett’s esophagus and esophageal carci-noma. Cancer Res 59(3):586–589.
van Sittert NJ, Megens HJJJ, Watson WP, Boogaard PJ. 2000.Biomarkers of exposure to 1,3-butadiene as a basis forcancer risk assessment. Toxicol Sci 56:189–202.
van Sittert NJ, Van Vliet EWN. 1994. Monitoring occupa-tional exposure to some industrial chemicals by deter-mining hemoglobin adducts. Clin Chem 40:1472–1475.
van Welie RT, van Duyn P, Brouwer DH, van Hemmen JJ,Brouwer EJ, Vermeulen NPE. 1991. Inhalation exposure to1,3-dichloropropene in the Dutch flower bulb culture. II.Biological monitoring by measurement of urinary excre-tion of two mercapturic acids metabolites. Arch EnvironContam Toxicol 20:6–19.
Verma RS, Babu A. 1989. Human Chromosome: Manual ofBasic Techniques Pergamon Press, New York NY, pp 4–9.
Vesely DL, Levey, GS. 1978. Butadiene diepoxide activa-tion of guanylate cyclase. Enzyme 23(2):140–143.
Viezzer C, Norppa H, Clonfero E, Gabbani G, MastrangeloG, Hirvonen A, Celotti L. 1999. Influence of GSTM1,GSTT1, GSTP1, and EPHX gene polymorphisms in DNAadduct level and HPRT mutant frequency in coke-ovenworkers. Mutat Res 431:259–269.
Vrieling H, Thijssen JCP, Rossi AM, Dam van FJ, NatarajanAT, Tates AD, Zeeland van AA. 1992. Enhanced HPRTmutant frequency but no significant difference in mutationspectrum between a smoking and non-smoking humanpopulation. Carcinogenesis 13:1625–1631.
Walker V, Meng Q. 2000. Part III: In vivo mutation of theendogenous Hprt genes of mice and rats by 1,3-butadieneand its metabolites. In: 1,3-Butadiene: Cancer, Mutations,and Adducts, pp 89–139. Research Report 92. HealthEffects Institute, Cambridge MA.
Ward EM, Fajen JM, Ruder AM, Rinsky RA, Halperin WE,Fessler-Flesch CA. 1995. Mortality study of workers in 1, 3-butadiene production units identified from a chemicalworkers cohort. Environ Health Perspect 103(6): 598–603.
Ward EM, Fajen JM, Ruder AM, Rinsky RA, Halperin WE,Fessler-Flesch CA. 1996a. Mortality study of workersemployed in 1,3-butadiene production units identifiedfrom a large chemical workers cohort. Toxicology 113:157–168.
Ward JB Jr, Abdel-Rahman SZ, Henderson RF, Stock TH,Morandi M, Rosenblatt JI, Ammenheuser MM. 2001.Assessment of butadiene exposure in synthetic rubbermanufacturing workers in Texas using frequencies ofHPRT mutant lymphocytes as a biomarker. Chem BiolInteract 135–136:465–483.
Ward JB Jr, Ammenheuser MM, Bechtold WE, Whorton EBJr, Legator MS. 1994. HPRT mutant lymphocyte frequen-cies in workers at a 1,3-butadiene production plant.Environ Health Perspect 102:79–85.
Ward JB Jr, Ammenheuser MM, Whorton EB Jr, BechtoldWE, Kelsey KT, Legator MS. 1996b. Biological monitoringfor mutagenic effects of occupational exposure to buta-diene. Toxicology 113(3):84–90.
Watanabe J, Hayashi SI, Nakachi K, Imai K, Sudo Y, SekineT, Kawajiri K. 1990. PstI and RsaI RFLPs in completelinkage disequilibrium at the CYP2E gene. Nucleic AcidsRes 18:7194.
Watson MA, Stewart RK, Smith GBJ, Massey TE, Bell DA.1998. Human glutathione S-transferase P1 polymorphisms:Relationship to lung tissue enzyme activity and populationfrequency distribution. Carcinogenesis 19: 275–280.
Weast RC, ed. 1989. CRC Handbook of Chemistry andPhysics, 70th ed. CRC Press, Boca Raton FL, p C–160.
Wiseman RW, Cochran C, Dietrich W, Lander ES,Soderkvist P. 1994. Allelotyping of butadiene-inducedlung and mammary adenocarcinomas of B6C3V1 mice:Frequent losses of heterozygosity in regions homologousto human tumor-suppressor genes. Proc Natl Acad SciUSA 91:3759–3763.
Wolman SR, Sivak A. 1975. Induction of unusual tumorsin vivo by rat fibroblasts treated with diepoxybutane. LabInvest 33:670–677.
135
Wong NA, Rae F, Bathgate A, Smith CAD, Harrison DJ.2000a. Polymorphisms of the gene for microsomal epoxidehydrolase and susceptibility to alcoholic liver disease andhepatocellular carcinoma in a Caucasian population. Tox-icol Lett 115(1):17–22.
Wong NA, Rae F, Simpson KJ, Murray GD, Harrison DJ.2000b. Genetic polymorphisms of cytochrome P4502E1 andsusceptibility to alcoholic liver disease and hepatocellularcarcinoma in a white population: A study and literaturereview, including meta-analysis. Mol Pathol 53(2):88–93.
Woolfenden EA, McClenny WA. 1999. Method TO-17:Determination of volatile organic compounds in ambientair using active sampling onto sorbent tubes. In: Compen-dium of Methods for the Determination of Toxic OrganicCompounds in Ambient Air (2nd ed), pp 17-1–17-49. EPA625/R-96/010b. US Environmental Protection Agency,Office of Research and Development, National Risk Man-agement Research Laboratory, Center for EnvironmentalResearch Information, Cincinnati OH.
Xi L, Zhang L, Wang Y, Smith MT. 1997. Induction of chro-mosome-specific aneuploidy and micronuclei in humanlymphocytes by metabolites of 1,3-butadiene. Carcinogen-esis 18:1687–1693.
Xiao Y, de Stoppelaar JM, Hoebee B, Schriever-Schwemmer G, Adler ID, Tates AD. 1996. Analysis ofmicronuclei induced by 1,3-butadiene and its metabolitesusing fluorescence in situ hybridization. Mutat Res354(1):49–57.
Xiao Y, Tates AD. 1995. Clastogenic effects of 1,3-buta-diene and its metabolites 1,2-epoxybutene and 1,2,3,4-diepoxybutane in splenocytes and germ cells of rats andmice in vivo. Environ Mol Mutagen 26(2):97–108.
Xu Y, Carr LG, Bosron WF, Li T-K, Edenberg HJ. 1988.Genotyping of human alcohol dehydrogenases at theADH2 and ADH3 loci following DNA sequence amplifica-tion. Genomics 2:209–214.
Xu S, Wang Y, Roe B, Pearson WR. 1998. Characterization ofthe human class mu glutathione S-transferase gene clusterand the GSTM1 deletion. J Biol Chem 273:3517–3527.
Yamano S, Tatsuno J, Gonzalez FJ. 1990. The CYP2A3 geneproduct catalyzes coumarin 7-hydroxylation in humanliver microsomes. Biochemistry 29:1322–1329.
Yang J-L, Maher VM, McCormick JJ. 1989. Amplification ofcDNA from the lysate of a small clone of diploid humancells and direct DNA sequencing. Gene 83:347–354.
Yokoyama A, Muramatsu T, Omori T, Yokoyama T, Mat-sushita S, Higuchi S, Maruyama K, Ishii H. 2000. Alcohol
and aldehyde dehydrogenase gene polymorphisms andoropharyngolaryngeal, esophageal and stomach cancers inJapanese alcoholics. Carcinogenesis 22:433–439.
Yu M-W, Gladek-Yarborough A, Chiamprasert S, SantellaRM, Liaw Y-F, Chen C-J. 1995. Cytochrome P450 2E1 andglutathione S-transferase M1 polymorphisms and suscep-tibility to hepatocellular carcinoma. Gastroenterology 109:1266–1273.
Zhao C, Vodicka P, rám RJ, Hemminki, K. 2000. HumanDNA adducts of 1,3-butadiene, an important environ-mental carcinogen. Carcinogenesis 21(1):107–111.
Zhong S, Wyllie AH, Barnes D, Wolf CR, Spurr NK. 1993.Relationship between the GSTM1 genetic polymorphismand susceptibility to bladder, breast and colon cancer. Car-cinogenesis 14:1821–1824.
APPENDIX A. HEI Quality Assurance Report
The conduct of this study was subject to periodic, inde-pendent audits by Arthur D Little, Inc. The auditor’s back-ground includes toxicology, analytical chemistry,environmental health and safety, and occupational healthand safety; he is a Certified Industrial Hygienist. The auditprocedures included in-process monitoring of study activ-ities for conformance to the study protocol and examiningthe records and supporting data. The dates and locationsof each audit visit are listed in Table A.1 with the phase ofthe study examined.
AUDITORS’ SUMMARY COMMENTS
Written reports for each inspection were provided to theDirector of Science at the Health Effects Institute, who wasresponsible for transmitting these findings to the PrincipalInvestigator. These quality assurance audits demonstratedthat this study was conducted by a well-coordinated, expe-rienced team of professionals in accordance with the studyprotocol and standard operating procedures. Exceptionsnoted during the course of the audits were not of a natureto significantly compromise the final report or the datacontained therein. The Investigators’ Final Report appearsto be an accurate representation of the study.
Martin Anderson CIH, CSP
Auditor
S
RJ Albertini et al

136
Biomarkers in Czech Workers Exposed to 1,3-Butadiene
Table A.1 Auditor’s Responsibilities
Date, Site, and Investigator Visited Phase of Study Audited and Audit Tasks
5/18/98
Health and Safety Executive Laboratory, Sheffield, United KingdomNeil Plant
Analysis of air samples
Review Good Laboratory Practices (GLPs); data management and protection; and record keeping
5/20/98
BD monomer production and polymerization facilities, Czech RepublicRadim rám
Study population site location
Review air sample collection procedures; equipmentcalibration procedures; biological sample collection,labeling, and storage procedures; and record keeping
5/21/98
Laboratory for Genetic Ecotoxicolgy, Prague,Czech Republic
Radim rám
SCEs
Review sample receiving and blinding procedures; samplepreparation, storage, and protection procedures; GLPs;and record keeping
11/9/98
Leiden University Medical Center, Leiden, The NetherlandsAd Tatus
HPRT mutations in T lymphocytes
Review GLPs; sample receiving, storage, and protectionprocedures; data storage and backup procedures
11/10/98
Shell International, Amsterdam, The NetherlandsNico van Sittert
BD urinary metabolites
BD-Hb adducts
Review GLPs; sample receiving, storage, and protectionprocedures; data storage and backup procedures
12/8/98
University of North Carolina, Chapel Hill, North CarolinaJames Swenberg
BD-Hb adducts
Review GLPs; sample receiving, storage, and protectionprocedures; data storage and backup procedures
12/9/98
University of Texas Medical Branch, Galveston, TexasJonathan Ward
HPRT mutations in T lymphocytes
Review GLPs; sample receiving, storage, and protectionprocedures; data storage and backup procedures
12/10/98
Shell Westhollow Technical Center, Houston, TexasAlex Evans
BD urinary metabolites
Review GLPs; sample receiving, storage, and protectionprocedures; data storage and backup procedures
12/11/98
Lovelace Respiratory Research Institute, Albuquerque, New MexicoRogene Henderson
BD urinary metabolites
Review GLPs; sample receiving, storage, and protectionprocedures; data storage and backup procedures
12/14/99
University of Vermont, Burlington, VermontRichard Albertini
HPRT gene mutations
Biostatistical analysis of data
Review conformance to the study protocol (ie, recordkeeping, data management and protection, checkingdata for accuracy)
7/19/01
University of Vermont, Burlington, VermontRichard Albertini
Final Report Audit
S
S

137
ABOUT THE PRIMARY AUTHORS
Richard J Albertini received an MD in 1963 and a PhD inmedical genetics in 1972, both from the University of Wis-consin. He is a research professor in the Department ofPathology, an adjunct professor of microbiology andmolecular genetics, and an emeritus professor of medicineat the University of Vermont in Burlington. Dr Albertinicreated the University of Vermont Genetic Toxicology Lab-oratory in 1985 and remains its director. In 2000, hebecame vice president for research at BioMosaics, Inc, abiotechnology company associated with the University ofVermont, with a focus on diseases of the immune systemand cancer. Dr Albertini has been involved in studies ofenvironmental mutagenicity and carcinogenicity for morethan three decades, focusing on the causes and conse-quences of human somatic mutations. He developed theassay used to detect HPRT mutations in humans and hasremained closely associated with research in this area. Heworks broadly in the area of human biomarkers and in theemerging area of molecular epidemiology.
Radim J rám received an MD from the Charles Universityin Prague in 1964, a PhD from the Czechoslovak Academyof Sciences in 1970, and a DSc from the Charles Universityin 1978. Since 1991 he has headed the Laboratory ofGenetic Ecotoxicology, an organization of the RegionalInstitute of Hygiene of Central Bohemia and the Institute ofExperimental Medicine Academy of Sciences, CzechRepublic. He has worked in the field of genetic toxicologyand molecular epidemiology for more than 30 years,studying genotoxicity in mammalian models and humanpopulations. In the 1980s, he developed the network ofgenotoxic laboratories of the Czech Hygienic Service. In1990, he established the International Teplice Program(concerned with the impact of environmental pollution onthe health of human populations), which involves the USEPA and various laboratories in Europe.
Pamela M Vacek is a biostatistician in the Department ofMedical Biostatistics and research assistant professor inthe Pathology Department, University of Vermont Collegeof Medicine in Burlington. She received an MS in biosta-tistics from the University of Vermont in 1976 and a PhDin occupational epidemiology from the University ofLondon in 1994. Dr Vacek’s main research interest iscancer epidemiology focused on quantifying occupationaland environmental exposure to carcinogens, assessing riskfactors for breast cancer, and evaluating the efficacy ofbreast-cancer screening.
S
Jeremiah Lynch received a BS in civil engineering fromRensselaer Polytechnic Institute in 1953 and, later, an MS insanitary engineering from Massachusetts Institute of Tech-nology and an MS in industrial hygiene from Harvard Uni-versity. While working at US NIOSH, he became director ofphysical science and engineering. In 1976, Mr Lynch washired by Exxon Chemical Company as manager of industrialhygiene and later became senior environmental health sci-entist. In 1996 he retired from Exxon and currently workson several research projects and as a lecturer.
Janice A Nicklas received a BS in biology from the Cali-fornia Institute of Technology in 1975 and a PhD ingenetics from Princeton University in 1981. She is aresearch associate professor of medicine at the Universityof Vermont in Burlington and is currently on leave to theVermont State Forensic Laboratory. Her research interestsinclude molecular analysis of somatic mutations and dif-ferences in susceptibility to DNA damage after exposure tocarcinogens and mutagens. Currently, she is developingmethods to quantify human DNA using real-time poly-merase chain reactions. Dr Nicklas is also interested in theeffects of hemochromatosis mutations on DNA repair,DNA damage, and cancer.
Nico J van Sittert received his PhD in biochemistry in1972. He worked in clinical chemistry for two years, andthereafter, for 25 years, in occupational health and toxi-cology for Shell. He was manager of the Biomedical Labo-ratory in Rotterdam (The Netherlands) from 1980 to 1993,and of the Molecular Toxicology Laboratory in Sitting-bourne (UK) and Amsterdam (The Netherlands) from 1994to 2000. He has published extensively in the fields ofindustrial or molecular toxicology. Currently he works asan independent consultant in toxicology.
Peter J Boogaard received an MS in analytical chemistryin 1984, a PharmD in 1985, and a PhD in toxicology in1990 from Leiden University. He has held various seniorpositions with Shell; most recently he joined Shell Inter-national BV in The Hague as senior consultant in humantoxicology at the Department of Health Services. Hisresearch interests have included mercapturic acids andhemoglobin adducts as biomarkers of exposure to indus-trial chemicals; and physiologically based pharmacoki-netic modeling to assess the in vitro toxicology of BD forimproved human risk assessment, (potential) industrialcarcinogens (including inhalation, transdermal, and invitro metabolism and toxicology), and BD biomarkers.
RJ Albertini et al
138
Biomarkers in Czech Workers Exposed to 1,3-Butadiene
Rogene Henderson received a PhD in chemistry from theUniversity of Texas in Austin in 1960. After a six-year stayat the University of Arkansas School of Medicine as aresearch associate, she joined the staff of the LovelaceMedical Foundation. In 1970, she transferred to the Inha-lation Toxicology Research Institute, where she becamesupervisor of the Chemistry and Biochemical ToxicologyGroup. She is currently a senior scientist and deputydirector of the National Environmental Respiratory Centerat the Lovelace Respiratory Research Institute, Albu-querque NM. Her major research interests are in the use ofbronchoalveolar lavage fluid analyses to detect and charac-terize the pulmonary response to inhaled toxins and the useof biomarkers to assess the risk from exposure to xenobiotics.
James A Swenberg received a DVM from the University ofMinnesota in 1966 and a PhD in veterinary pathology fromOhio State University in 1970. He is currently professor ofenvironmental sciences and engineering, pathology, andnutrition in the Schools of Public Health and Medicine atthe University of North Carolina at Chapel Hill anddirector of the curriculum of toxicology. His research inter-ests include understanding critical mechanisms in car-cinogenesis, with emphasis on the role of DNA damageand repair, molecular epidemiology, and improving thescientific basis of risk assessment.
Ad D Tates received a PhD from Leiden University in1971. Until he retired in 2000, he had been a researcher,teacher, and associate professor in the Department of Radi-ation Genetics and Chemical Mutagenesis since that labo-ratory was founded in 1959. His early research focused onstudies of induction and repair of genetic damage from radi-ation and chemicals in germ cells of Drosophila melano-gaster. More recently, his research dealt with (1) inductionof chromosomal damage by chemical and physical agents inmammalian cells in vivo and in vitro, (2) development ofmethods for automated detection of micronuclei in humanlymphocytes exposed to clastogenic agents, (3) biomoni-toring human populations exposed to mutagenic agents bymeans of detecting chromosomal damage and HPRT pointmutations, and (4) development and utilization of tech-niques to detect HPRT mutations in mice, rats, and humans.
Jonathan B Ward Jr received a PhD in microbiology fromCornell University in 1972. He is a professor and directorof the Division of Environmental Toxicology, Departmentof Preventive Medicine and Community Health, at the Uni-versity of Texas Medical Branch at Galveston. Dr Ward is agenetic toxicologist interested in the effects of mutagenicagents in exposed human populations and in mechanisms
of genotoxicity in animal and cell-culture systems. Forseveral years, his research has focused on the mutageniceffects of occupational exposure to BD by using the auto-radiographic and cloning versions of the HPRT mutantlymphocyte assay to study populations of workers and lab-oratory mice. His most recent studies have addressed therole of epoxide hydrolase polymorphisms in human sensi-tivity to butadiene.
Michael Wright received a Graduate Membership qualifica-tion of the Royal Society of Chemistry by examination (equiv-alent to a BS in chemistry), from the University of Salford,England, in 1972. In 1990 he was awarded an MS by the Uni-versity of Surrey, England. He is currently a senior scientist atthe UK Health and Safety Laboratory in Sheffield, where headvises regulatory authorities on the monitoring implicationsof changes in OELs for chemical agents. His research interestsinclude the theory of nonideal diffusive air sampling devicesand the effectiveness of proficiency testing schemes forassessing chemical agents in the workplace.
COLLABORATING INSTITUTIONS
Burlington, Vermont, USA
Genetic Toxicology Laboratory, the Biometry Facility, andthe Department of Medical Biostatistics, University ofVermont
Richard J Albertini, Pamela M Vacek, and Janice A Nicklas
with the assistance of Linda S Sullivan and Ingeborg Gobel
• The central study office: maintained codes andrecords from all participating laboratories; coordi-nated communication among all investigators; pre-pared interim and final reports
• Identified HPRT mutational spectra
• Carried out procedures for genotyping subjects
• Scored autoradiographic slides for HPRT variant fre-quencies for verification
• Conducted data analyses
Prague, the Czech Republic
Laboratory of Genetic Ecotoxicology, Regional Institute ofHygiene of Central Bohemia
Radim J rám
with the assistance of Blanka Binkova, Petra Musilová,Gabriela Rajská, Pavel Rössner, and Jirí Rube
• Assessed exposure levels; gathered subjects’ ques-tionnaires; collected and processed biological sam-ples and distributed them to other laboratories
• Conducted cytogenetic analyses
S
s

139
Amsterdam, The Netherlands
Molecular Toxicology Laboratory, Shell InternationalChemicals, BV
Nico J van Sittert and Peter J Boogaard
with the assistance of Hendricus JJJ Megens, and Alex Evans(at Shell Westhollow Technical Center, Houston Texas, USA)
• Analyzed urinary M2 and M1 metabolites• Conducted HBVal Hb adducts assays
Chapel Hill, North Carolina, USA
Curriculum of Toxicology, University of North Carolina atChapel HillJames A Swenbergwith the assistance of Patricia B Upton and Asoka Ranasinghe
• Conducted THBVal Hb adduct assays
Leiden, The Netherlands
Department of Radiation Genetics and Chemical Mutagen-esis, Leiden UniversityAd D Tateswith the assistance of Frans A de Zwart and Ailko HZwinderman
• Performed HPRT mutation assays with the cloningprotocol
Galveston, Texas, USA
Division of Environmental Toxicology, University of TexasMedical Branch at GalvestonJonathan B Ward Jrwith the assistance of Marinel M Ammenheuser and JudahI Rosenblatt
• Performed HPRT mutation assays with the autoradio-graphic protocol
Rumson, New Jersey, USA
Jeremiah Lynch, Private Consultant
• Designed the exposure assessment scheme• Participated in designing the study protocols for sub-
ject selection, data gathering, and exposure assessment
Sheffield, United Kingdom
United Kingdom Health and Safety LaboratoryMichael Wrightwith the assistance of Neil Plant
• Provided sorbent tubes and analyzed them for per-sonal exposure and workplace area measurements ofBD and VOCs
Albuquerque, New Mexico, USA
National Environmental Respiratory Center, Lovelace Res-piratory Research InstituteRogene F Hendersonwith the assistance of Jennifer R Krone, Dean A Kracko,and Walter B Blackwell
• Conducted urinary metabolite analyses [data notreported]
OTHER PUBLICATIONS RESULTINGFROM THIS RESEARCH
Albertini RJ, rám RJ, Vacek PM, Lynch J, Wright M, NicklasJA, Boogaard PJ, Henderson RF, Swenberg JA, Tates AD,Ward JB Jr. 2001. Biomarkers for assessing occupationalexposures to 1,3-butadiene. Chem Biol Interact 135–136:429–453.
Albertini RJ. 2002. Developing sustainable studies on envi-ronmental health. Mutat Res 480–481:317–331.
Albertini RJ. 2003. Mechanistic insights from biomarkerstudies: Somatic mutations and rodent/human compari-sons following exposure to a potential carcinogen. IARCSci Publ (in press).
Albertini RJ, Clewell H, Himmelstein MW, Morinello E,Olin S, Preston J, Scarano L, Smith M, Swenberg J, Tice R,Travis C. 2003. The use of non-tumor data in cancer riskassessment: Reflections on benzene, butadiene and vinylchloride. ILSI Risk Science Institute, Working Group onthe Use of Non-tumor Data in Cancer Risk Assessment.Regul Toxicol Pharmacol (in press).
ABBREVIATIONS AND OTHER TERMS
ADH alcohol dehydrogenase
ANOVA analysis of variance
BCS bovine calf serum
BD 1,3-butadiene
BD-diol 1,2-dihydroxy-3-butene
BDO 1,2-epoxy-3-butene
BDO2 1,2,3,4-diepoxybutane
BDO-diol 1,2-dihydroxy-3,4-epoxybutane
BDO-G total of N7-(1-[hydroxymethyl]-2-propenyl)-guanine and N7-(2-hydroxy-3-butenyl)guanine; the hydroxybutenyl adducts at N7 of guanine
BEL biological exposure limit
bp base pair
S
RJ Albertini et al

140
Biomarkers in Czech Workers Exposed to 1,3-Butadiene
BrdU 5-bromo-2�-deoxyuridine
cDNA complementary DNA
CARB California Air Resources Board
CE cloning efficiency
CEFIC European Chemical Industry Council
CI confidence interval
CYP cytochrome P450 family of genes
CYP cytochrome P450–related enzymes andproteins
CYP2E1 cytochrome P450 2E1
[d6]-M2 deuterium-labeled isomeric mixture of M2
DAPI 4,6-diamidino-2-phenylindole
DBS iron-supplemented defined BCS
DHHS US Department of Health and HumanServices
DHP-MA N-acetyl-S-(2,3-dihydroxypropyl)-L-cysteine
DMSO dimethylsulfoxide
dNTPs deoxynucleoside triphosphates
ECs evaluatable cells
EDTA ethylenediaminetetraacetic acid
EH epoxide hydrolase
EPA US Environmental Protection Agency
FG/100 genomic frequency of stable chromo-somal translocations per 100 cells
FID flame ionization detector
FISH fluorescence in situ hybridization
GC gas chromatography
GC-ECNCI-HRMS gas chromatography with electron-capture negative chemical ionization and high-resolution mass spectrometry
GC-MS gas chromatography with massspectrometry
GC-MS/MS gas chromatography with tandem mass spectrometry
GC-NCI-MS/MS gas chromatography with negative chemical ionization and tandem mass spectrometry
GC-NECI-MS/MS gas chromatography with negative-electron-capture ionization and tandem mass spectrometry
GLP Good Laboratory Practices
GSH glutathione
GST glutathione S–transferase
GSTM1 glutathione S–transferase M1 genotype
GSTT1 glutathione S–transferase T1 genotype
Hb hemoglobin
HBVal isomeric mixture of N-(1-[hydroxy-methyl]-2-propenyl)valine and N-(2-hydroxy-3-butenyl)valine
HCl hydrochloric acid
HFCs high frequency cells (cells with � 12 SCEs)
HPLC high-performance liquid chromatog-raphy
HPRT hypoxanthine phosphoribosyltrans-ferase gene
HSE Health and Safety Executive
[3H]TdR tritiated thymidine
IARC International Agency for Researchon Cancer
IISRP International Institute for Synthetic Rubber Producers
IL-2 interleukin-2
IVS intervening sequence (or intron)
KCl potassium chloride
LC-MS/MS liquid chromatography with tandem mass spectrometry
LI labeling index
LOD limit of detection
M1 1,2-dihydroxy-4-(N-acetylcysteinyl)-butane
M2 isomeric mixture of 1-hydroxy-2-(N-ace-tylcysteinyl)-3-butene and 2-hydroxy-1-(N-acetylcysteinyl)-3-butene
MDHS Methods for the Determination ofHazardous Substances
MF mutant frequency
MgCl2 magnesium chloride
MNCs mononuclear cells
MRM multiple-reaction monitoring
mRNA messenger RNA
MS mass spectrometry
N-1-THB-A N-1-(2,3,4-trihydroxybutyl)adenine
NaHCO3 sodium bicarbonate
(NH4)2SO4 ammonium sulfate
NIOSH US National Institute of Occupational Safety and Health
NTP US National Toxicology Program

141
OEL occupational exposure limit
OSHA US Occupational Safety and HealthAdministration
PAHs polycyclic aromatic hydrocarbons
PBLs peripheral blood lymphocytes
PBS phosphate-buffered saline
PCR polymerase chain reaction
PFPITC pentafluorophenylisothiocyanate
PFPTH pentafluorophenylthiohydantoin
PTFE polytetrafluoroethylene
PHA phytohemagglutinin
ppb parts per billion
ppm parts per million
QC quality control
r Spearman correlation coefficient
R2 coefficient of determination for multivariate analysis
RBCs red blood cells
RT-PCR reverse transcriptase–PCR
SBR styrene-butadiene rubber
SCEs sister chromatid exchanges
S/N signal-to-noise ratio
Taq Thermus aquaticus
TG 6-thioguanine
�TG medium without the TG selection agent
�TG medium with the TG selection agent
THB-G N7-(2,3,4-trihydroxybutyl)guanine;trihydroxybutyl adducts at N7 of guanine
THBVal N-(2,3,4-trihydroxybutyl)valine
TWA time-weighted average
VF variant frequency
Vmax maximal velocity of enzyme reaction
VOCs volatile organic compounds
WASP Workplace Analysis Scheme forProficiency
ALTERNATE TERMS FOR BUTADIENE ANDITS METABOLITES AND ADDUCTS
BD �,�-butadiene
biethylene
bivinyl
buta-1,3-diene
divinyl
erythrene
pyrrolylene
vinylethylene
trans-butadiene
BDO 3,4-epoxy-1-butene (EB)
butadiene monoepoxide (BMO or BDO)
BDO2 1,2:3,4-diepoxybutane
butadiene diepoxide (BDE)
diepoxybutane (DEB)
BD-diol 3,4-dihydroxy-1-butene
BDO-diol 3,4-epoxy-1,2-butanediol (EBD)
butadiene diol-epoxide
butadiene monoepoxide-diol
HBVal total of 1- and 2-monohydroxy-3-butenylvaline
M1 1,2-dihydroxybutyl mercapturic acid (DHB-MA)
N-acetyl-S-(3,4-dihydroxybutyl)-L-cysteine
M2 1,2-hydroxybutyl mercapturic acid (MHB-MA)
1-(N-acetylcysteinyl)-2-hydroxy-butene
isomeric mixture of the regio- and stereo-isomers (R)/(S)-N-acetyl-S-(1-[hydroxy-methyl]-2-propenyl)-L-cysteine � (R)/(S)-N-acetyl-S-(2-hydroxy-3-butenyl)-L-cysteine
monohydroxy-3-butenyl mercapturic acid (MHB-MA)
total 1- and 2-hydroxy-3-butenyl mercapturic acid (MHB-MA)
RJ Albertini et al

COMMENTARYHealth Review Committee
Health Effects Institute Research Report 116 © 2003 143
INTRODUCTION
1,3-Butadiene (BD)* is a four-carbon gaseous chemicalsynthesized for use in the manufacture of resins, plastics,and synthetic rubber. It is also produced by combustion;BD is present in cigarette smoke and in emissions frommobile and stationary sources.. Although the highest BDexposures of 0.022 to 660 mg/m
3
(0.01 to 299 parts per mil-lion [ppm]**) occur in industrial settings, ambient expo-sures of about 0.0022 to 0.022 mg/m
3
(0.001 to 0.01 ppm)may be of public health concern because BD is carcino-genic in rats and mice (reviewed by Himmelstein et al1997). BD exposure levels and the evidence for BD carci-nogenicity in humans has been reviewed by Melnick andKohn (1995), the European Centre for Ecotoxicity and Tox-icology of Chemicals (1997), Himmelstein and coworkers(1997), and the International Agency for Research onCancer (IARC 1999) (also see the later Scientific Backgroundsection).
In 1994, HEI initiated a research program to address thehealth risks of ambient exposure to toxic air pollutants,including benzene and BD. The overall goal of this pro-gram was to gather information that would reduce uncer-tainties in evaluating the human health risks associatedwith exposure to low levels of toxic air pollutants frommobile sources. As part of this program, HEI has supportedstudies (1) to assess the mutagenic and carcinogenic effectsof BD and its reactive metabolites on cells and in labora-tory animals and (2) to develop biomarkers that couldserve as measures of BD exposure (Health Effects Institute2000). Such biomarkers need to be validated in humanpopulations before they can be considered for use in full-scale epidemiologic studies.
In 1995, HEI issued Request for Qualifications 95-3, “Tran-sitional Epidemiology Studies for Benzene or 1,3-ButadieneBiomarkers,” which sought researchers with access tobenzene-exposed or BD-exposed human populations.Applicants first provided HEI with descriptions and char-
acterizations of the exposed and control populations thatwould be studied and the qualifications of the study team.In January 1996, several investigators with access to BD-exposed populations and several others with access tobenzene-exposed populations were selected to participatein planning workshops with other scientists having exper-tise in biomarker evaluation for BD or benzene. The pur-pose of the workshops was to facilitate collaborationsamong the investigators with expertise in biomarker eval-uation and scientists with access to exposed populations.
In the second stage of the RFQ process, investigatorswith access to exposed populations submitted full appli-cations to HEI. Dr Richard Albertini at the University ofVermont and collaborators submitted a proposal entitled“Biomarker Responses in Butadiene-Exposed Czech Workers:A Transitional Epidemiologic Study.” Dr Radim rám atthe Laboratory of Genetic Ecotoxicology (Regional Insti-tute of Hygiene of Central Bohemia) was a key investigatorwho provided contact with the BD-exposed workers.Albertini and collaborators in the United States, The Neth-erlands, the United Kingdom, and the Czech Republic pro-posed to validate specific biomarkers in the blood andurine from workers occupationally exposed to BD in theCzech Republic. If successful, this validation study wouldallow these biomarkers to serve as surrogate measures ofBD exposure in epidemiologic studies.
Because the samples collected in the Czech Republicwere to be sent to widely scattered laboratories, the inves-tigators wisely proposed a pilot study (Phase I) to test thelogistics of collecting and shipping samples. Phase I wouldalso allow Albertini to further define the project plan,gather information necessary to plan the research phase(Phase II), bring together the coinvestigators and consul-tants to work on study design issues, and prepare standardoperating procedures. The HEI Health Research Com-mittee thought this was an effective and ambitious pro-posal whose major strengths were the scientific team andthe use of an exposed population that had participated inearlier studies (see the Scientific Background section thatfollows). In addition, Albertini provided an excellentrationale for selecting the proposed biomarkers. The Com-mittee viewed the Phase I pilot study as an importantcomponent and recommended that it be extended from theproposed 3 months to 6 months. They also concluded thatAlbertini needed to recruit a coinvestigator with extensiveexperience in the field of exposure assessment, a key com-ponent of the project plan. The Committee then recom-mended funding the proposed study.
S
*A list of abbreviations and other terms appears at the end of the Investiga-tors’ Report.
**For ease of comparison with the Investigators’ Report, all measurementsfor BD are given in mg/m
3
followed by ppm in parentheses regardless ofhow the levels of BD were reported in the published articles being dis-cussed; the conversion factor used was ppm
�
2.21 = mg/m
3
(as specifiedin the Investigator’s Report).
This document has not been reviewed by public or private party institu-tions, including those that support the Health Effects Institute; therefore, itmay not reflect the views of these parties, and no endorsements by themshould be inferred.
144
Commentary
In April 1997, Albertini submitted a revised budget toreflect a lengthened Phase I and added a consultant (MrJeremiah Lynch) with extensive experience in the analysisof industrial exposures to BD. Lynch evaluated the exposureconditions and records at the facilities and concluded that itwould be feasible to conduct a concurrent exposure assess-ment and to evaluate previously documented exposures.
†
SCIENTIFIC BACKGROUND
Epidemiologic studies have suggested that occupationalexposure of workers to BD is associated with an increasedincidence of cancer of the lymphatic system (lymphosar-coma) and of the organs and systems in the body that pro-duce blood cells (leukemia) (Himmelstein et al 1997; USEnvironmental Protection Agency [EPA] 1998; IARC 1999).Increases in these two types of cancer were noted inworkers exposed to BD in two styrene-butadiene rubber(SBR) plants (Meinhardt et al 1982; Matanoski and Schwartz1987; Matanoski et al 1990). More recent and comprehen-sive studies of the same worker group indicated an in-creased risk of leukemia (but not other types of cancers) inworkers with a long duration of employment in the SBRindustry (Delzell et al 1996; Macaluso et al 1996; Sathia-kumar et al 1998). However, the interpretation of thesestudies is somewhat controversial. Even though BD wasthe major chemical to which these workers had been exposedand the statistical analyses controlled for exposure to sty-rene, the subjects had been exposed to several other chem-icals as well. As a result, it was unclear whether the in-creased incidence of cancers was due to BD or the otherchemicals present in the workplace.
In addition, studies of workers in the BD monomerindustry, where occupational exposure is restricted to BD,showed no relation between BD exposure and leukemia(Divine 1990; Divine et al 1993; Divine and Hartman1996). Instead, the studies showed a small increase in thenumber of deaths from two forms of sarcoma (tumors thatusually arise from connective tissue), lymphosarcoma andreticulosarcoma, in workers who began their employmentbefore World War II.
These cohort studies have been difficult to interpret(EPA 1998; IARC 1999) because of (1) the differences in thetypes of cancers reported for the BD monomer and the SBRindustrial groups, (2) possible confounding exposures ofSBR workers to other chemicals, (3) changes in the defini-tion and classification of the lymphohematopoietic can-cers, and (4) uncertainty about the relative importance ofshort-term, high-level exposures versus long-term, low-levelexposures in causing health effects. (HEI has continued toinvestigate these issues; especially, a study by Dr ElizabethDelzell is reanalyzing mortality among North Americansynthetic rubber industry workers, a major occupationalcohort on which the US EPA has based its decisions aboutthe health risks associated with butadiene exposure.)
Government and international agencies have assessedBD’s carcinogenicity in humans. In 1999, IARC concludedthat the evidence available for human carcinogenicity waslimited because it was based on the increased incidence ofleukemias reported in one large study and because two ormore studies of adequate statistical power had not yetreported consistent results. Therefore, IARC retained itsearlier designation of BD as a probable human carcinogen(IARC 1999). The US National Toxicology Program upgradedits designation of BD to known human carcinogen (USDepartment of Health and Human Services 2000). In itshealth risk assessment of BD in 2002, the EPA concludedthat BD is carcinogenic to humans by inhalation (EPA2002). The US National Institute for Occupational Safetyand Health (US Department of Health and Human Services1991) and the US Occupational Safety and Health Admin-istration (1996) concluded that BD is at least potentiallycarcinogenic to humans.
In those situations where epidemiologic data were con-sidered to be limited, quantitative risk assessments of BDexposure have relied on information from animal studiesof BD metabolism or carcinogenicity. However, laboratorystudies of rodents present their own challenges for datainterpretation because, although BD is converted to thesame metabolites in rats and mice, the rate at which thesemetabolites are formed differs between the two species; theresult is that mice are much more sensitive to the carcino-genic effects of BD than rats (Himmelstein et al 1997).Humans also convert BD to the same metabolites found inthese rodents, but because of the differences between ratsand mice, researchers are unsure which rodent speciesshould serve as a model for human BD metabolism and risk.
BD is converted in the body via a complex metabolicpathway; a simplified version is diagrammed in Figure 1 ofthe Investigators’ Report. BD is not itself a direct-actingmutagen or carcinogen. When taken up in the body, pre-dominantly by inhalation, it is converted by enzymes in
†
Dr Albertini’s study,
Biomarker Responses in Butadiene-Exposed CzechWorkers: A Transitional Epidemiologic Study,
began in November 1997. Thedraft Investigators’ Report was received in December 1999. After review by aPanel of the HEI Health Review Committee in February 2000, a revisedreport was received and accepted for publication in February 2001. Duringthe review process, the HEI Health Review Committee and the investigatorshad an opportunity to exchange comments and to clarify issues in both theInvestigators’ Report and the Review Committee’s Commentary.
Total expenditures for this study were $1,154,369. Funding was providedby HEI’s core sponsors (the U.S. Environmental Protection Agency and theautomotive industry) and the American Chemistry Council, the EuropeanChemical Industry Council, and the International Institute of SyntheticRubber Producers.

145
Health Review Committee
many tissues to epoxide metabolites that have the poten-tial to produce harmful effects (referred to as reactivemetabolites). Other enzymatic reactions can detoxify theepoxides to metabolites that are excreted in the urine. BDis oxidized by cytochrome P450–monooxygenase to thereactive monoepoxide intermediate, 1,2-epoxy-3-butene(BDO), which can be further metabolized to another re-active epoxide, 1,2,3,4-diepoxybutane (BDO
2
), or to 1,2-dihydroxy-3-butene (BD-diol). Both of these can in turn bemetabolized to another reactive epoxide, 1,2-dihydroxy-3,4-epoxybutane (BDO-diol). One or more of the BDO,BDO
2
, and BDO-diol metabolites can (1) react with macro-molecules such as DNA or proteins, (2) be detoxified byepoxide hydrolase (EH) or glutathione
S–
transferase (GST)to produce metabolites excreted in the urine, or (3) be con-verted to other metabolites by alternative pathways (notshown in Figure 1).
WHAT IS A TRANSITIONAL EPIDEMIOLOGIC STUDY?
Transitional epidemiologic studies are designed to bridgethe gap between purely laboratory investigations andpurely epidemiologic field studies. A critical componentof any transitional epidemiologic study designed to vali-date a biomarker as a reliable measure of either dose oreffect is an accurate measurement of exposure. The intentof transitional studies is to lay the groundwork for a bio-marker to be used in full-scale epidemiologic studies byassessing (1) its variability within and among subjects, (2)the feasibility of its use in field studies, and (3) any con-founding or effect-modifying factors. Thus, transitionalepidemiologic studies are designed to validate a biomarkerbut are usually not designed to have enough statisticalpower to draw conclusions about health outcomes.
BIOMARKERS AND MOLECULAR EPIDEMIOLOGY
Biomarkers appear at various early stages in the pathwayleading from exposure, to a carcinogenic response, to clin-ical disease. They permit the detection of recent exposuresin humans, facilitate internal dosimetry, and may identifyeffects of exposure that could be relevant to the mecha-nism of a disease process (National Research Council1987). The use of biomarkers can alleviate some of theweaknesses of traditional epidemiologic studies in occu-pational cancer research, such as the need to successfullylink past exposures to more recent disease and the need tostudy large populations because of the low incidence ofspecific cancers. Because biomarkers of exposure andeffect appear relatively frequently in exposed populations,significant increases in biomarker levels can be observedin small populations (Ward et al 1996). Biomarkers can
also serve as a basis for comparisons among species oramong levels of exposures when comparing dose-responserelations. For example, a relevant biomarker along the causalpathway to cancer could be compared in rats and miceexposed to different concentrations of a chemical. If thisbiomarker were also found and validated in occupation-ally exposed individuals, it might help clarify the relationbetween exposure level and cancer risk in humans (Collins1998). In addition, genotypes (individuals’ genetic compo-sitions) could be compared in people with and withoutdifferent types of cancers to see if certain enzymes thataffect carcinogenic processes are present or absent in theirgenetic coding (see the later section Biomarkers Chosen forThis Study / Factors That May Affect Susceptibility).
Molecular epidemiologic approaches involving bio-markers have great potential in several areas of cancerresearch: investigating the etiology of the disease, moni-toring cancer risk in people exposed to occupational orenvironmental carcinogens, studying factors that protectagainst cancer, and assessing intrinsic factors that mightpredispose an individual to cancer (Collins 1998). Somebiomarkers are specific to a certain chemical and some arenot. The biomarkers most commonly employed in molec-ular epidemiologic cancer research include:
• DNA damage in lymphocytes (breaks in DNA, bulkyadducts produced by a chemical binding to DNA bases);
• adducts produced by a
chemical binding to proteinssuch as those found in blood;
• urinary metabolites or products of DNA damageexcreted in urine;
• Micronuclei and chromosomal alterations (includingtranslocations);
• sister chromatid exchanges (SCEs);
• mutations (altered sequence of DNA bases) in reportergenes; and
• differential expression of those enzymes involved inthe metabolism of carcinogens that may affect an indi-vidual’s susceptibility.
BIOMARKERS CHOSEN FOR THIS STUDY
The investigators focused on two classes of biomarkers.
•
Biomarkers of Exposure
: Metabolites of BD releasedin urine (biomarkers of recent exposure); and hemo-globin (Hb) adducts (biomarkers of somewhat longerexposure). (The investigators planned to measure DNAadducts also, but the assay that had been developedfor animal exposures to high levels of BD [Blair et al2000] was not sensitive enough to assess humanexposures to lower occupational levels.)
146
Commentary
•
Biomarkers of Effect
: Frequency of mutations at the
HPRT
gene in T lymphocytes; differences in the
HPRT
mutational spectrum; and, in whole blood lympho-cytes, chromosomal changes such as SCEs, aberra-tions, and translocations.
In addition, the investigators looked at factors that mayaffect susceptibility to carcinogens, such as
genetic polymor-phisms in
GSTM1
,
GSTT1
,
cytochrome P450 2E1
(
CYP2E1
),
EH
, and
alcohol dehydrogenase
(
ADH
).
Biomarkers of Exposure
Urinary Metabolites
The major metabolites of BDOfound in urine are 1,2-dihydroxy-4-(
N
-acetylcysteinyl)-butane, referred to as M1, and an isomeric mixture of1-hydroxy-2-(
N
-acetylcysteinyl)-3-butene and 2-hydroxy-1-(
N
-acetylcysteinyl)-3-butene, referred to as M2. M1is a mercapturic acid formed by hydrolysis of BDO toBD-diol, which is then conjugated with glutathione (GSH).M2 is an isomeric mixture of mercapturic acids formedby direct conjugation of BDO with GSH. Monkeys andhumans produce primarily M1 because of their naturallyhigh levels of EH (the enzyme that catalyzes hydrolysis).In contrast, rats, mice, and hamsters produce more M2because of lower EH levels (Sabourin et al 1992; Bechtoldet al 1994). Legator and coworkers (1993) reported thatworkers exposed to BD (2.2–6.6 mg/m
3
; 1–3 ppm) andunexposed control subjects had only M1 in their urine,although the M1 levels were higher in the BD-exposedworkers. Thus, M1 is a more sensitive measure than M2for monitoring human exposure to BD.
Hb Adducts
Blood concentrations of reactive BD-epoxideintermediates can be measured in laboratory animals afterhigh exposures to BD, but this approach to dosimetry isnot possible in humans exposed to the low levels typicallyfound in BD manufacturing industries. BD reaction prod-ucts bound to blood proteins, such as Hb adducts, can beused to detect and quantify exposure to chemicals that arethemselves reactive or have been transformed in the bodyto reactive intermediates. The analysis of protein adductsis highly sensitive and specific to the chemical (Skipperand Tannenbaum 1990; Osterman-Golkar et al 1996). UnlikeDNA adducts, which can be removed by DNA repair pro-cesses and lost to further analysis, Hb adducts are notremoved and typically accumulate over the lifespan of thered blood cell (120 days on average). Thus, these adductscan be measured after exposure to even low levels of BDand are potentially useful biomarkers of human exposure.Osterman-Golkar and associates (1993) pointed out addi-tional advantages of measuring Hb adducts as markers of
BD exposure: (1) blood samples are easy to obtain andcontain large amounts of Hb; (2) Hb adducts can improveexposure assessments by providing data about exposureover time; and (3) Hb adducts provide a measure of thedose of reactive chemicals in both laboratory animals andhumans, thereby eliminating some of the difficulties inextrapolating from high to low doses across species.
Osterman-Golkar and coworkers (1991) identified BDOadducts in Hb obtained from the blood of rats exposed to553 to 2210 mg/m
3
(250 to 1000 ppm) BD 6 hours a day,5 days a week, for 2 weeks. Adduct levels in blood samplesobtained after 12 days of exposure increased linearly withBD exposure and ranged from 0.5 to 3.0 nmol/g Hb. Theadducts differed in their three-dimensional forms (calleddiastereomers) and in the portion of the BDO moleculethat reacts with valine (called positional isomers); collec-tively, these adducts are termed hydroxybutenyl valine(HBVal) adducts. HBVal adducts were also identified inthe blood of workers that were exposed occupationally toBD (Osterman-Golkar et al 1993, 1996; van Sittert and vanVliet 1994). Pérez and coworkers (1997) identified trihy-droxybutyl valine (THBVal) adducts, which exist as fourdiastereomers (but not as positional isomers), in bloodfrom rats and humans exposed to BD. THBVal can beformed by reaction of BDO
2
or BDO-diol with the
N
-terminalvaline of globin. Although Pérez and colleagues (1997)concluded that the contribution of each pathway wasunknown, their results suggested that BDO-diol is moreactive than BDO
2
in producing THBVal adducts and thatBDO-diol may therefore play a major role in BD-inducedtoxicity. Swenberg and coworkers (2000) identified bothHBVal and THBVal adducts in the blood of rats, mice, andhumans exposed to BD.
Sorsa and coworkers (1996) evaluated the effects of BDexposure on HBVal adduct levels in exposed workers. Ina Portuguese BD manufacturing plant, air samples werecollected over a full workshift by personal monitors inthe workers’ breathing zones; 30% contained more than0.44 mg/m
3
BD (0.2 ppm BD). At monomer and SBR pro-duction facilities in the Czech Republic (the same onesstudied by Albertini and colleagues in the presentresearch), Sorsa and associates found typical BD concen-trations ranging from 0.44 to 4.4 mg/m
3
(0.2 to 2 ppm);10% of the samples exceeded 22 mg/m
3
(10 ppm), and ina few instances, exposures over 1100 mg/m
3
(498 ppm)were recorded. In each facility, higher levels of Hbadducts were detected in the blood of exposed workerscompared with control maintenance workers. Hb adductlevels were higher in the blood of workers exposed in theSBR plant compared with workers in the monomerfacility (Sorsa et al 1996).

147
Health Review Committee
Biomarkers of Effect
HPRT
Mutations
The development of mutations in cellsis a biomarker of effect from exposure to a mutagen.Although the
HPRT
gene is not involved in carcinogenesis,mutations in this gene may indicate that mutations havealso occurred in genes that affect carcinogenesis. For thisreason,
HPRT
is called a reporter gene. An advantage ofstudying
HPRT
mutations is that the assays are simple,straightforward, and require only cells cultured from ablood sample. Two assays were used in the study by Alber-tini and colleagues: the cloning assay, which identifiesmutant cells; and the autoradiographic assay, which iden-tifies variant cells. (These cells are termed variants becausethe autoradiographic method, discussed below, cannotconfirm the genetic change in the mutant cells. However,the ability of variant cells to synthesize DNA under selec-tive culture conditions implies that they have mutated.)These assays are described in the later section TechnicalEvaluation / Methods.
Ward and colleagues (1996) performed two studies(8 months apart) on the effects of BD exposure on smallgroups of workers in a BD monomer plant and a thirdstudy at an SBR plant, both in Texas. In the first monomerplant study, exposures were estimated from a surveyconducted by the company 3 to 9 months before bloodand urine samples were collected; the survey yielded anestimated average of 2.2 mg/m
3
(1 ppm) for all exposedworkers studied. In the second study, exposures were deter-mined from 8-hour air samples collected from workers’ per-sonal breathing zones. The BD levels were 0.66, 0.46,and 0.26 mg/m
3
[0.30, 0.21, and 0.12 ppm], respectively,in areas of high, intermediate, and low exposure. At theSBR plant (the third study), exposures were determined bypassive samplers worn by workers in their breathing zonesduring an 8-hour shift on the same day biological sampleswere collected. (Passive samplers depend on air naturallydiffusing toward the detection matrix, whereas larger,active samplers use a small pump to deliver air.) Half of thebreathing-zone samples exceeded 0.55 mg/m
3
(0.25 ppm) BD,and of these, slightly more than half exceeded 2.2 mg/m
3
(1 ppm). In all three studies, the
HPRT
variant frequencies(VFs) of cells identified by autoradiography were signifi-cantly higher in blood from workers in the highest-exposureareas than from workers in lower-exposure areas or fromunexposed subjects. However, the authors of papers onthese studies suggest caution in interpreting the relationbetween air concentrations of BD and
HPRT
VFs becauseBD exposure levels were measured in different ways andover different time periods in the three studies. In the firsttwo studies of the Texas workers (both at the BD monomerplant), Ward and colleagues (1996) also measured the
concentrations of urinary metabolites (discussed earlier asbiomarkers of exposure). In the first study, the concentra-tion of M1 increased significantly in BD-exposed workerscompared with control subjects and this increase corre-lated with increases in VF (a biomarker of effect). In thesecond study, M1 levels did not increase significantly inexposed workers, probably because the plant had under-gone a modernization program that reduced BD exposure.(M1 levels in workers were not reported for the thirdstudy, which had been conducted at the SBR plant.)
Studies of larger groups of workers in the same TexasSBR plant were conducted a year later by the same labora-tory, also using the autoradiographic assay. Ward and col-leagues (2001) compared
HPRT
VFs and urinary M1metabolites in 37 workers exposed to high (mean 7.03 mg/m
3
[3.18 ppm]) and low (mean below the limit of detection of0.55 mg/m
3
[0.25 ppm]) BD concentrations. Levels of bothbiomarkers were three times higher in the more-exposedworkers than in the less-exposed workers. VFs, M1 levels,and BD exposure concentrations were all correlated. Wardand coworkers (2001) then conducted a follow-up study atthe same SBR plant. Although the highest BD levels towhich workers were exposed (3.71 mg/m
3
[1.68 ppm])were lower than in the earlier study, the
HPRT
VFs werestill threefold higher in the more-exposed group than inthe less-exposed group (mean exposure level below the limitof detection). M1 levels were also still higher in the more-exposed group, albeit to a lesser degree than in the earlierstudy (Ward et al 2001).
After the study described in this Research Report wascompleted, Ward and colleagues (Ammenheuser et al2001) reported another study of workers in the Texas SBRplant: 24 workers exposed to an average level of 3.26 mg/m
3
(1.48 ppm) BD and 25 workers exposed to approximately0.33 mg/m
3
(0.15 ppm) BD; each subject’s exposure wasmeasured during one 8-hour workshift. (For comparison,the current research evaluated 34 SBR [polymerization]workers, although they were not divided into high- andlow-exposure groups.) That Ward study again found thatlymphocyte
HPRT
VFs and urinary M1 levels were three-fold higher in the high-exposure group than in the low-exposure group. BD and styrene levels both were mea-sured by passive samplers. The mean molar ratio of BD tostyrene was 27.92; therefore, BD exposure levels were sub-stantially greater than styrene exposure levels. Further-more, VFs, M1 levels, and BD exposure concentrationswere all correlated. The authors concluded that the corre-lations among BD exposure and the biomarkers of bothexposure (M1) and effect (VFs) suggest that occupationalexposure to BD levels in the range of 2.2 mg/m
3
to 6.6 mg/m
3
(1–3 ppm) may be associated with adverse biologicaleffects.

148
Commentary
In contrast to the elevated
HPRT
VFs reported in all thestudies of Texas workers described above (all of whichused the autoradiographic assay to identify cell variants;Ward et al 1996, 2001; Ammenheuser et al 2001), twostudies that used the cloning assay to identify cells with
HPRT
mutations found no effect of BD on mutant frequen-cies (MFs) in lymphocytes from exposed workers com-pared with those from unexposed workers (Tates et al1996; Hayes et al 1996). In 1993 and 1994, Tates andcoworkers (1996) examined lymphocytes from 19 exposedand 19 unexposed workers in the BD monomer plant in theCzech Republic (the same one studied by Albertini andcolleagues in the current research); workers had beenexposed to a mean BD level of 3.87 mg/m
3
(1.75 ppm). Thelack of BD effect on
HPRT
MFs was shown when 1993 and1994 blood samples were pooled and analyzed and alsowhen 1994 samples were analyzed alone. Hayes andcoworkers (1996) also found no effect of BD on
HPRT
MFsin 41 workers (compared with 38 unexposed workers)exposed to BD at a median level of 4.4 mg/m
3
(2 ppm) in aChinese polymer plant. They suggested that their resultsdiffered from those of Ward and coworkers (1996) because(1) differences in cell culture methods may have led tomeasuring mutant or variant cells in different lymphocytesubpopulations; and (2) the small number of subjects in allthe studies may have affected statistical variability. How-ever, a different study from Ward’s laboratory (Ma et al2000) also used the cloning assay to identify
HPRT
MFs:10 workers at the Texas SBR facility exposed to a medianBD level of 1.90 mg/m
3
(0.86 ppm) had significantly ele-vated MFs compared with results from 11 unexposed con-trol workers.
At this time, the reasons for such contradictory resultsbetween studies evaluating VFs and studies evaluatingMFs in different worker populations are still unexplained.Both the Tates and Ward groups participated in the studyof Czech workers described in this Research Report. Intheir section of the Investigators’ Report (Biomarkers ofEffect: Assays of
HPRT
Mutations in Human Lymphocytes /Discussion), they concluded that “We cannot explain whyit was not possible to demonstrate induction of
HPRT
mutations in lymphocytes from BD-exposed workers inthe Czech Republic [in the present study] and in China,whereas it was possible to detect a significant increase inthe MFs for exposed workers when the cloning assay wasused for BD-exposed workers in Texas.”
Mutational Spectra
The sequence of purine and pyri-midine bases in a gene is altered when a gene undergoesmutation and the pattern of these changes is referred to asthe mutational spectrum. Changes in DNA sequence can
be identified by the type of mutation (eg, point mutations[alterations at a specific base pair within a gene], or inser-tions or deletions of one or more bases), the location of thespecific mutation in the chain of DNA bases, and the fre-quency of the specific mutation. The pattern of these changesis often specific for a given chemical; thus, the mutationalspectrum produced can be considered a fingerprint of expo-sure to that chemical. For example, inhalation of BD causesan increase in point mutations primarily occurring at A•Tbase pairs in mice (Cochrane and Skopek 1994; Sisk et al1994; Recio and Meyer 1995; Recio et al 1996); these in-creases are often concentrated at specific areas of the DNAsequence and are called mutational hotspots.
SCEs and Chromosomal Aberrations
Sister chromatidsare copies of a chromosome produced during its replica-tion cycle. Sister chromatid exchange is the symmetricexchange of DNA segments between the sister chromatidsof a duplicated chromosome (Norppa 1997). The exchangesmost likely reflect a disruption of the normal replicationprocess by the presence of abnormal DNA. Thus, SCEs area sensitive indicator that cells have been exposed to aDNA-damaging agent (Collins 1998). Nevertheless, we donot understand what molecular mechanisms are respon-sible for SCEs, what biological role they have, or how theyrelate to chromosomal aberrations.
Chromosomal aberrations also may occur after cells areexposed to DNA-damaging agents. Such aberrations includebreaks, deletions, translocations (a segment of a chromo-some moves to a different site on the same chromosomeor to a site on another chromosome), and duplications(Collins 1998).
Factors That May Affect Susceptibility
Individuals may differ in their susceptibility to cancerdue to any number of factors (eg, health, nutritional status,environmental exposures, gender); genetic compositionalso may be important (reviewed by Hirvonen 1999). Genesfor some enzymes are polymorphic, meaning the gene canhave several different forms that are commonly found inthe general population; each form, or allele, has a variationin its sequence of bases. Some of the alleles code for enzymeswith altered activity levels. In some instances, the genemay not produce an active enzyme, in which case it iscalled a null allele. Genes that might influence cancer sus-ceptibility include those that encode the enzymes thatmetabolize carcinogens. For example, certain BD metabo-lites have been implicated in BD-induced cancer in ani-mals; modifications in the genes that encode the enzymesinvolved in BD metabolism may alter the enzymes’ activi-ties. Thus, depending on their genetic composition, people

149
Health Review Committee
may to a greater or lesser degree convert BD to the metabo-lites thought to be involved in cancer induction. Knowingwhich alleles an individual carries may help identify theirexpected response to BD exposure. For this reason, sub-jects in the current study were tested for genotypes for sev-eral polymorphic genes (
CYP2E1
,
EH
,
ADH
, and
GST
) todetermine if these might be genetic factors that wouldchange a person’s susceptibility to BD exposure or in someway influence the expression of the biomarkers related toBD exposure.
GENETIC POLYMORPHISMS ANDCYTOGENETIC DAMAGE
Genetic traits that confer increased susceptibility tocytogenetic damage from reactive BD metabolites could beimportant risk factors for cancer in BD-exposed popula-tions (Wiencke et al 1995). Differences in biological effectsthat are influenced by variations in genotype can be evalu-ated by cytogenetic methods that analyze chromosomalaberrations and SCEs. The few studies of genetic polymor-phisms and the frequency of in vivo or in vitro cytogeneticdamage to human cells have been performed almost exclu-sively on peripheral blood lymphocytes; these cells areeasily available and easily cultured by following well-established techniques (Norppa 1997).
Because the GST enzyme has such an important role inmetabolizing reactive epoxides, we focus the discussion hereon the genetic variations of the
GST
gene. Among the whitepopulation, approximately 50% possess the
GSTM1
-nullgenotype and 10% to 20% possess the
GSTT1
-null genotype(Bernardini et al 1996). These genotypes have been studiedin association with several of the reactive BD metabolites.
Some researchers have targeted their studies on threereactive BD metabolites (BDO, BDO-diol, and BDO
2
), activeand null alleles of
GSTT1
and
GSTM1
, and the possible out-comes of SCEs and chromosomal aberrations. First, Uuskülaand colleagues (1995) and Bernardini and coworkers (1998)measured BDO-induced SCEs in cultured human lympho-cytes containing the active and null alleles of
GSTM1
and
GSTT1
; the lymphocytes with either null allele had anincreased level of SCEs compared with the alleles withnormal enzyme activities. Thus, both null alleles have thepotential to increase the genotoxic effects of BDO. Second,in a study with BDO-diol (Bernardini et al 1996), the levelsof human lymphocyte SCEs induced by two concentra-tions of BDO-diol (250 or 500 µM) in culture were dose-dependent, but were independent of the presence orabsence of the
GSTT1
or
GSTM1
genotypes. Therefore, nei-ther the GSTT1 nor the GSTM1 enzyme appeared to beinvolved in the detoxification of BDO-diol. Third, Landiand coworkers (1998) demonstrated that exposure to BDO
2
increased the frequency of SCEs and the number of cellswith chromosomal aberrations in human lymphocyteswith the
GSTT1
-null genotype compared with lympho-cytes with the active
GSTT1
allele; the
GSTM1
genotypedid not affect these endpoints. Thus, in these publishedstudies, BDO-induced SCEs were influenced by both
GSTT1
-null and
GSTM1
-null alleles, BDO-diol–inducedSCEs were influenced by neither, and BDO
2
-induced SCEswere influenced only by the
GSTT1
-null allele.
Lymphocytes from humans not known to have beenexposed to BD or other genotoxins varied in their sensi-tivity to BDO
2
(Wiencke et al 1995). Blood samples weretaken from 72 subjects and the lymphocytes exposed toBDO
2
. Lymphocytes from 12 subjects showed elevatedlevels of SCEs compared with those from the other 60 sub-jects. Of the 12 lymphocyte samples with elevated SCEs,6 individuals carried a deletion in the
GSTT1
gene thatwas not evident in any of the subjects whose lymphocytesdid not respond to BDO
2
. This concordance between thedeletion and high SCE induction was incomplete, however,because half of the individuals whose lymphocytes re-sponded to BDO
2
did not carry the gene deletion. Thus,polymorphism in the
GSTT1
gene may affect a person’sresponse to BDO
2
exposure.
rám and coworkers (1998) studied lymphocytes frommonomer production workers exposed to BD (0.024 to23.0 mg/m3 [0.011 to 10.4 ppm]) in the same facility studiedin the current research. Those lymphocytes showed a sig-nificantly increased percentage of chromosomal aberra-tions, frequency of SCEs, and percentage of cells with ahigh number of SCEs compared with lymphocytes fromunexposed workers. In the same worker population, Sorsaand coworkers (1994) had initially found no changes inchromosomal aberrations or SCEs. However, when thedata were reanalyzed, they found a significantly higher fre-quency of chromosomal aberrations in lymphocytes fromBD-exposed workers who had the GSTT1-null allele com-pared with those from exposed workers who had theGSTT1-active allele. The presence or absence of the GSTM1-active allele had no effect on chromosomal aberrations.
TECHNICAL EVALUATION
STUDY DESIGN
This transitional epidemiologic study was designed toevaluate the sensitivity with which several biomarkersreflected quantified, low-level, occupational exposuresto BD. Overall, the study was well conceived and wellplanned.
S

150
Commentary
The subjects were employed by a single company thatoperates a BD monomer production facility and a polymer-ization facility near Prague, the Czech Republic. The entirestaff (24 men) of the BD monomer production facility andabout half of the work force (34 men) in the BD polymer-ization facility participated in the study. Most of thosewho did not participate were employed by an independentcontractor. Only a few workers directly employed by thefactory declined to participate. The control cohort com-prised 25 male administrative workers employed by thesame company who were selected, first, because they weremales and, second, because they were willing to partici-pate. No attempt was made to randomly select control sub-jects; this could have led to possible selection bias.
The demographic summary in Tables 5 and 6 in theInvestigators’ Report indicates that the three exposuregroups were fairly well balanced in terms of age, length ofemployment by the company, time of residence in the dis-trict, and personal smoking status. For exposure to passivesmoke, however, all monomer production workers reportedsuch exposure and this differed significantly from thenumber of administrative control subjects (72%) and poly-merization workers (74%) who also reported exposure.The participants also differed substantially in severalother factors: (1) the administrative control subjects hadmore years of education; (2) the monomer productionworkers may have been somewhat healthier than theadministrative control subjects and polymerization workersin that they reported a lower rate of infectious illness; and(3) the administrative control subjects had the highestvaccination rate, the least frequent use of antibiotics (of14 medications charted), and more frequent vitamin andvegetable intake.
The study was designed to be largely cross-sectional;biological samples for biomarkers were collected within ashort time frame near or at the end of a 60-day exposureassessment period, during which exposure measurementshad been taken at several intervals. This design accommo-dated the lengthy half-lives of some of the biomarkers andpreserved the biomarkers that would reflect short-termexposure. This approach, although critical for biomarkerdevelopment and validation, has not been followed inmany epidemiologic studies to date. It is a major strengthof this study. The specific timing of the 60-day exposureassessment period was offset by 1 or 2 weeks for differentgroups of workers so that biological fluids would not needto be collected from all workers on the same days. Bloodsamples were obtained on the last day of exposure assess-ment and urine samples were obtained before and afterworkshifts on the last 3 days. The first urine sample wascollected after a 2-day rest period from work, which theinvestigators thought would be sufficient time to eliminate
the BD urinary metabolites before the first before-shifturine sample was collected.
Each worker’s personal exposure to BD was measuredon several occasions by small sampler tubes attached tohis clothes. Other samplers were analyzed for toluene, sty-rene, and benzene. (The exposure protocol and samplersare described in more detail in the Methods sectionbelow.) The Health and Safety Executive Laboratory inSheffield, United Kingdom, was contracted to measurethe BD, toluene, styrene, and benzene levels collected bythe samplers. Personal monitoring was supplemented bymeasuring workplace area concentrations of each com-pound at several locations.
The study was conducted in a blinded fashion: Eachsubject was assigned a coded identification number at thestudy’s onset; this code and others assigned to biologicalsamples were not revealed to any investigator in any labo-ratory until all analyses in that laboratory were complete.Furthermore, an elaborate chain of custody procedure wasfollowed to track all samples through collection, pro-cessing, shipping, and analyzing. After biological sampleswere collected at the workers’ facility, they were trans-ported on ice immediately to rám’s laboratory in Pragueand processed within hours of collection. Each sample orcell fraction was assigned a unique identifier that related itto the sample donor. Samples were then stored at �70˚Cuntil they were shipped to the collaborating laboratories.
BD biomarkers, factors that may affect susceptibility,and exposure monitoring tubes were investigated at thefollowing institutions [bold type indicates the place namesused to identify different laboratories throughout thisReport]:
• Urinary M2 and M1 metabolites and HBVal Hbadducts by Dr Nico van Sittert, Dr Peter Boogaard,and colleagues at the Molecular Toxicology Labora-tory, Shell International Chemicals, BV, Amsterdam,The Netherlands.
• THBVal Hb adducts by Dr James Swenberg and asso-ciates at the Curriculum of Toxicology, University ofNorth Carolina at Chapel Hill, Chapel Hill, NorthCarolina, USA.
• HPRT mutant cells (via the cloning assay) by Dr AdTates and colleagues at the Department of RadiationGenetics and Chemical Mutagenesis, Leiden Univer-sity, Leiden, The Netherlands; HPRT mutational spec-tra by Dr Jan Nicklas and Dr Richard Albertini andassociates at the Genetic Toxicology Laboratory, Uni-versity of Vermont, Burlington, Vermont, USA.
• HPRT variant cells (via the autoradiographic assay)by Dr Jonathan Ward Jr and colleagues at the Divisionof Environmental Toxicology, University of Texas
S

151
Health Review Committee
Medical Branch at Galveston, Galveston, Texas, USA;independent slide review of the autoradiographicassays by Dr Albertini and associates at the BiometryFacility, University of Vermont, Burlington, Vermont,USA.
• GSTM1 and GSTT1 genotypes, SCEs, and chromo-somal aberrations by Dr Radim rám and colleaguesat the Laboratory of Genetic Ecotoxicology, RegionalInstitute of Hygiene of Central Bohemia, Prague,Czech Republic.
• CYP2E1, ADH, and EH genotypes by Dr Albertiniand colleagues at the Genetic Toxicology Laboratory,University of Vermont, Burlington, Vermont, USA;genotype assays at the Vermont Cancer Center DNAAnalysis Facility, Burlington, Vermont, USA.
• Sorbent tubes for personal exposure and workplacearea measurements of BD and volatile organic com-pounds (VOCs) by Michael Wright and associates atthe United Kingdom Health and Safety Laboratory,Sheffield, United Kingdom.
• Data analyses by Dr Albertini, Dr Pamela Vacek, andassociates at the Department of Medical Biostatistics,University of Vermont, Burlington, Vermont, USA.
In most cases, the logistics of sample collection, pro-cessing, and shipping worked well. GSTM1 and GSTT1genotypes and Hb adducts were evaluated in all 83 studyparticipants. In the case of urinary biomarkers, the firstday’s collection of after-work samples was complete; how-ever, a before-work sample from one polymerizationworker could not be included because of insufficientvolume. In addition, some difficulties arose in preparingsamples for some of the HPRT mutation assays: Forexample, although 95% of the samples were analyzed bythe cloning method, only 59% of the samples were ana-lyzed by the autoradiographic assay because the remainingsamples did not have the number of cells needed for reli-able evaluation. The low number of evaluatable cells mayhave been due to the condition of the cells after shipment.In addition, some sorbent tubes used for exposure moni-toring were mislabeled.
The investigators largely met their experimental objec-tives. They were able to evaluate the usefulness of thechosen biomarkers for assessing BD exposures by relatingthe biomarkers to measured exposures. The effortexpended in Phase I of this project paved the way for thesuccessful completion of Phase II. Although the conduct ofthe study deviated somewhat from the proposed plan andsome difficulties arose in preparing some samples, theinvestigative team formulated and implemented a solidstudy design. The integration of a comprehensive exposure
S
assessment with a series of logical biomarker analyses wasunprecedented for such a complex, international study.
METHODS
The methods used in this biomarker study with mul-tiple endpoints were state of the art. Below is a brief over-view of some of the various methods. Greater detail canbe found in the matching sections of the Investigators’Report.
Exposure Assessment
Passive samplers attached to the workers’ clothes during8-hour shifts measured their personal exposures to BD;each measurement was recorded as a TWA for the workshift. Measurements were taken at time intervals that wererelevant to the biomarkers being evaluated. For example,during a 60-day exposure assessment period for eachexposed subject, about six to eight measurements wereirregularly spaced before biological samples were col-lected; this allowed investigators to measure biomarkersthat would develop or persist over weeks or months (HPRTmutations, Hb adducts, chromosomal translocations). Oneach of the last 3 days of the exposure assessment period,personal exposures were again measured to compare withbiomarkers that would reflect recent exposures (urinarymetabolites, SCEs, chromosomal aberrations).
VOCs (benzene, toluene, and styrene) were also mea-sured via passive samplers on one day for some subjectsfrom each exposed group. Seven measurements were madeat irregular intervals designed to cover all shifts of the con-trol subjects. Personal BD and VOC measurements wereobtained on the same day for all except five of the subjectswho wore VOC samplers (two administrative control sub-jects, two monomer production workers, and one polymer-ization worker). The protocol for these VOC measurementswas designed to determine if any coexposures might trackwith BD and confound the interpretation of exposureresults. A more extensive assessment of VOCs was notthought to be warranted because of the cost, the avail-ability of personal monitors, and the fact that VOCs werenot the primary focus of this study.
Active samplers measured workplace area levels of BDand VOCs as 15-minute concentrations at selected loca-tions. These measurements were made primarily to assesswhether the personal monitoring results (recorded asworkshift time-weighted averages [TWAs]) were reason-able determinants of the workers’ exposures. Thus, con-centrations from 15 minutes of sampling (rather than froma full workshift) were deemed sufficient to evaluate work-place levels of the agents of interest.

152
Commentary
Exposure samplers were all analyzed at Sheffield. Thegases collected on the sampler matrix were desorbed byheat, separated by gas chromatography, and quantified.
Biomarkers of Exposure
Urinary Metabolites M2 and M1 were extracted fromurine and then derivatized, first with methanol and thenwith pentafluorobenzoylchloride. The derivatives were sep-arated and quantified by gas chromatography with negative-electron-capture ionization and tandem mass spectrom-etry. Because metabolite levels may be concentrated ordiluted depending on the rate of urine production, theinvestigators normalized their data by expressing them invalues related to units of urinary creatinine.
Hb Adducts: HBVal and THBVal For HBVal, globin wasprepared from red blood cell Hb by the Edman degradationtechnique (details provided in the Investigators’ Report)and reacted with pentafluorophenylisothiocyanate to forma pentafluorophenylthiohydantoin (PFPTH) derivative ofthe N-terminal valine of globin with its BD adducts (amixture of the C1 and C2 positional isomers). This PFPTHderivative was detected by gas chromatography withnegative-ionization tandem mass spectrometry and multiple-reaction monitoring.
For THBVal, globin was isolated from Hb and the N-terminal valine of globin with its trihydroxybutyl adductwas prepared by a modification of the Edman degradationtechnique. THBVal was acetylated and detected by gaschromatography–high-resolution mass spectrometry in theelectron-capture negative-chemical-ionization mode.
Biomarkers of Effect
HPRT Mutants and Variants The product of the HPRTgene is the enzyme hypoxanthine guanine phosphoribosyl-transferase, which metabolizes the purine bases hypo-xanthine and guanine. This enzyme can also metabolize apurine base analog, 6-thioguanine (TG), to an intermediatethat is toxic to normal lymphocytes. Thus, one way to dif-ferentiate normal lymphocytes from those that havemutated at the HPRT locus is to determine whether theycan grow in the presence of TG. Normal blood lympho-cytes, which can produce an active HPRT enzyme, arekilled in cultures to which TG is added. In contrast, lym-phocytes with mutations in the HPRT gene do not producean active HPRT enzyme and therefore divide in the pres-ence of TG.
In the HPRT cloning assay, lymphocytes are cultured for10 to 14 days in plates with 96 small, individual wells in
the presence of TG and then evaluated by light microscopyfor the presence or absence of viable cell colonies; theviable colonies contain mutant cells. MF is calculated bycomparing the fraction of wells with viable cell coloniesversus those without.
The autoradiographic assay does not require cell divi-sion. In this procedure, lymphocytes are incubated in cul-ture medium with TG for 24 hours. Radioactive thymidineis then added. The cells’ uptake of radioactivity serves as ameasure of DNA replication because, when it is taken upby the cells, the radioactivity becomes part of the newlysynthesized DNA. Cell nuclei are then isolated. Nucleiwith radioactive DNA, evident by the darkening of a pho-tographic emulsion, are identified as variant. (Because thecells die during the process of detecting their radioactivity,the assay cannot confirm mutations.)
HPRT Mutational Spectra A total of 441 HPRT mutantcells, isolated with the cloning assay, were allowed to mul-tiply in culture to expand the number of cells and allowisolation of mRNA and DNA. For a variety of technologicalor methodological reasons, the molecular analysis of pointmutations by applying reverse transcriptase–polymerasechain reaction (PCR) techniques could be performed ononly 24% (108) of the 441 isolated mutant clones. Like-wise, multiplex-PCR, used to detect mutations associatedwith large deletions, could be carried out successfully for38% (166) of the 441 isolated mutants. The mutants thatcould be analyzed at the molecular level were equally dis-tributed over the three study groups.
Cytogenetic Changes: SCEs and Chromosomal Aberra-tions The investigators estimated and compared threegroups of cytogenetic endpoints using different assays andprocedures. First, they used conventional chromosomestaining to detect breaks, deletions, and rearrangements.Second, the investigators used a technique called fluores-cence in situ hybridization (FISH), which detects specificchromosomes and chromosomal changes (Trask et al 1993).In the FISH technique, a probe (a sequence of DNA that issynthesized to bind specifically to a complementary strandof chromosomal DNA) is coupled to a fluorescent chemicalto allow the bound probe/DNA complex to be detected byfluorescence microscopy. With this method, the investiga-tors identified chromosomal aberrations, several types oftranslocations, and conjunctions (the latter defined as aconnection or link among colors between chromosomesin the FISH PAINT process). Third, they identified SCEs inlymphocytes that had been cultured in the presence of thethymidine analog 5-bromo-2�-deoxyuridine (BrdU) and thenstained. BrdU is incorporated into newly synthesized DNA.Exchanges between sister chromatids result in a pattern

153
Health Review Committee
of stained and nonstained regions that reflect the exchanges.This process allowed the investigators to determine thenumber of SCEs/cell; cells with a high frequency of SCEs(eg, more than 12) were called high frequency cells (HFCs).
Factors That May Affect Susceptibility:Metabolic Genotypes
Genotyping for GSTM1 and GSTT1 was performed onmononuclear cells from fresh blood samples. Changes inthe base sequences of the genes coding for GSTM1 andGSTT1 were detected by ultraviolet illumination of the geland recorded by photography.
The investigators used DNA isolated from lymphocytesobtained during the HPRT cloning assay to identify ADH2,ADH3, EH, and CYP2E1 genotypes. In general, the investi-gators used methods similar to those described above forGSTM1 and GSTT1.
STATISTICAL ANALYSES
The following text summarizes some of the statisticalapproaches used by Albertini and colleagues. Specificstatistical methods for analyzing subject information,exposures, and each biomarker are described in the Inves-tigators’ Report in the section Study Design: Subject Selec-tion, Sample Acquisition and Handling, and StatisticalMethods / Data Processing and Statistical Analysis.
Multiple exposure measurements for each worker areexpected to show variability. To characterize this vari-ability, the investigators used variance component analysisthat employed a random-effects model with day of exposureand subject as the random effects. Separate analyses wereperformed for monomer production and polymerizationworkers.
Differences among the three exposure groups for all expo-sure metrics and biomarkers were determined by one-wayanalysis of variance (ANOVA), using pairwise multiplecomparisons, and by the nonparametric Kruskal-Wallistest, using Bonferoni-adjusted Mann-Whitney tests forpairwise comparisons.
The investigators assessed bivariate relations among dif-ferent biomarkers and among biomarkers and exposurevariables by using Spearman correlation coefficients to testwhether larger values of one variable tended to be pairedwith larger values of the other variable, regardless of thefunctional form of the relation. They also determinedPearson correlation coefficients to assess the linearity ofthe relations. Regression analysis was used to quantify therelation of urinary metabolites with mean BD exposureand Hb adducts with mean BD exposure, and to evaluateassociations among biomarkers. Multiple regression analyses
were conducted to examine the effects of exposure (asquantified by mean BD exposure, by mean BD exposure 70to 50 days before blood sampling, or by concentration ofHb adducts) on the cytogenetic and HPRT biomarkers afteradjusting for age and smoking status. Exposure group wasincluded in some models to identify group differences thatwere independent of BD exposure. The investigators alsoused multiple regression analyses to examine whethergenotype modified the relations among BD exposure levelsand biomarkers.
RESULTS AND INTERPRETATIONS
Exposure Assessment
The primary goal of the exposure assessment protocolwas to provide a summary measure of the exposure eachmonomer production and polymerization worker receivedover the 60-day exposure assessment period that could becorrelated with the levels of biomarkers of exposure (uri-nary metabolites and hemoglobin adducts). All exposurevalues were recorded as TWAs for data collected throughoutan 8-hour workshift. The mean BD exposure for the controlgroup was 0.026 mg/m3 (0.012 ppm) based on 28 indi-vidual TWAs (range: 0.002 to 0.125 mg/m3 [0.001 to0.057 ppm]); for the monomer group, it was 0.643 mg/m3
(0.291 ppm) based on 217 individual TWAs (range: below0.0018 [the limit of detection] to 20 mg/m3 [0.0008 to9 ppm]); and for the polymer group, it was 1.760 mg/m3
(0.796 ppm) based on 319 individual TWAs (range: 0.002to 39.030 mg/m3 [0.001 to 17.661 ppm]). Most of the vari-ability in measurements for the two exposed groups wasdue to a small number (approximately 10%) of high mea-surements: 90% of the measurements for the monomer pro-duction workers were less than 1.883 mg/m3 (0.852 ppm),and for the polymerization workers they were less than3.985 mg/m3 (1.803 ppm).
Workplace area measurements (from 15-minute pumpedsamples) yielded mean BD concentrations of 0.043 mg/m3
(0.019 ppm) for the administration area (based on 18 sam-ples), 0.316 mg/m3 (0.143 ppm) for the monomer unit(based on 60 samples), and 0.892 mg/m3 (0.375 ppm) forthe polymerization unit (based on 89 samples). All differ-ences between pairs of exposure areas (administration,monomer production unit, polymerization unit) were sta-tistically significant.
ANOVA confirmed that the main source of measure-ment variability was day-to-day variation within subjects.As explained by the investigators, day-to-day variation inBD exposures illustrates the importance of obtainingmultiple measurements of exposure for each worker. Such
154
Commentary
comprehensive exposure assessment was a major strengthof this study.
Mean personal exposures (also TWAs) to benzene for thecontrol, monomer, and polymer groups were 0.030 mg/m3
(0.009 ppm), 0.039 mg/m3 (0.012 ppm), and 0.064 mg/m3
(0.020 ppm), respectively. Mean personal exposures totoluene were 0.295 mg/m3 (0.078 ppm), 0.162 mg/m3,(0.043 ppm), and 0.681 mg/m3 (0.181 ppm), for the sameexposure groups. No differences among exposure groupsfor these two VOCs were statistically significant. Mean per-sonal exposures to styrene for the control, monomer, andpolymer groups were 0.118 mg/m3 (0.027 ppm), 0.147 mg/m3
(0.035 ppm), and 2.121 mg/m3 (0.498 ppm), respectively.As expected because workers in the polymerization pro-cess are exposed to styrene, the mean TWA styrene expo-sure for the polymer group was significantly different fromthe means for both the monomer and control groups; thedifference between the means for the monomer and con-trol groups was not statistically significant. Note that theone-time VOC measurements were taken at different times:late April (control group), mid March (monomer group),and mid-to-late April (polymer group).
Workplace area measurements of benzene, toluene, andstyrene were consistent with those obtained by personalmonitoring but, as with the BD measurements, they werelower. Benzene exposures were moderately correlatedwith BD exposures. Styrene exposures were more highlycorrelated with BD exposures than was benzene. Tolueneexposures were unrelated to BD concentrations.
The investigators considered the mean BD exposures inthis study to be moderate, which in their opinion indicatesa well-run facility. The group means were within the rangeof those reported in other similar studies (Sorsa et al 1994,1996; Au et al 1995; Tates et al 1996; Ward et al 1996;Hayes et al 2000) in which monomer production workerswere, on average, exposed to lower concentrations of BDthan polymerization workers.
Biomarkers of Exposure
Urinary Metabolites Urinary metabolites proved to bevaluable biomarkers of BD exposure.
As noted earlier, the investigators collected urine sam-ples on the last 3 days of each worker’s exposure assessmentperiod. They first analyzed day-1 samples and these resultsare presented in the following text. Day-2 and day-3 sam-ples were stored for later analysis. When they wanted toanalyze day-3 samples, the Amsterdam laboratory hadclosed and analysis at another laboratory was unsuccessful.
The limit of detection for M1 was 5 µg/L and for M2 was0.1 µg/L. The after-work mean M1 concentrations were
353, 764, and 4647 µg/L for the control, monomer, andpolymer groups, respectively. The differences between themonomer and control groups and between the polymergroup and control or monomer groups were statisticallysignificant. Because humans detoxify BD predominantlyby way of the EH pathway (see Figure 1 in the Investiga-tors’ Report), M1 levels were much higher than M2 levels.However, statistically significant differences in after-worksamples of M2 were also evident (1.70, 9.44, and 120.17 µg/Lfor the control, monomer, and polymer groups, respec-tively). The net (after-work minus before-work) M1 levelsshowed similar, statistically significant relations amongthe three groups. Although the monomer and polymergroups both had significantly higher net M2 levels than thecontrol group, the difference between the two exposedgroups was not significant. Each subject’s after-work andnet M2 and M1 levels were highly correlated with hismean exposure over the entire assessment period. Al-though BD exposure levels could not be measured for allworkers on each day of urine collection, after-work urinarymetabolite levels were highly correlated with same-day BDexposure levels measured in subsets of workers from eachexposure group. In addition, net M2 and net M1 levelswere correlated with same-day BD exposures in the sub-sets, although these correlations were lower than the corre-lations between after-work levels and same-day BD. Statis-tical analyses indicated that neither GSTM1 nor GSTT1polymorphisms affected levels of M2 or M1 in any expo-sure group.
As discussed in the earlier section Technical Evaluation /Study Design, the investigators believed that a two-dayrest period from work would allow enough time to suffi-ciently eliminate residual M2 and M1 metabolites from theworkers’ urine. This belief was based on previous findingsthat the half-lives of the mercapturates of many industrialchemicals (eg, allyl chloride, 1,3-dichloropropene, epichlo-rohydrin, ethylene oxide, benzene) in urine are short (vanWelie et al 1991; Boogaard and Van Sittert 1995, 1996; deRooij et al 1997a,b). An unexpected finding was that M2and M1 were present at elevated levels in before-shifturine samples from polymerization workers. Both the M2and M1 levels were higher than those found in samplesfrom both other exposure groups, but only the differencein M2 levels was statistically significant. Thus, the elimi-nation of M2 was incomplete even 48 hours after the mostrecent occupational BD exposure.
The investigators propose that M1 (the major BDmetabolite in human urine) in samples from administra-tive control subjects may have arisen from sources otherthan BD. Ward and coworkers (1994) also reported thatsubjects who did not work with BD excreted M1. However,the exposure assessment data presented above indicate

155
Health Review Committee
that the administrative control subjects experienced lowbut measurable BD exposures and thus cannot be consid-ered completely unexposed. Therefore, M1 derived fromendogenous or exogenous BD or from other sources mayhave made small contributions to the BD-induced M1levels detected in each worker group in this study.
Hb Adducts Hb adducts proved to be even stronger bio-markers of BD exposure than urinary metabolites.
The limit of detection for HBVal in human blood was0.1 pmol/g globin. The mean HBVal adduct concentrationswere 0.224, 0.466, and 2.230 pmol/g globin for the control,monomer, and polymer groups, respectively. All differ-ences between pairs of group means were statistically sig-nificant and the magnitude of differences paralleled thosein the BD exposure levels of the three groups. The pres-ence of Hb adducts in the administrative control subjectsis not completely understood, although adduct levels werehigher in smokers than in nonsmokers in this group andcigarette smoke contains BD. Mean HBVal levels (overallor within each group) were not associated with geneticvariations at any of the susceptibility loci evaluated.
The limit of detection for THBVal in human blood wasapproximately 1 pmol/g globin. The mean THBVal adductconcentrations were 94.77, 178.73, and 716.70 pmol/gglobin for the control, monomer, and polymer groups,respectively. All differences between pairs of group meanswere statistically significant and the THBVal adduct con-centrations paralleled the BD exposure levels of the threegroups. As was the case with HBVal adducts, smokers inthe control group had higher levels of THBVal than non-smokers. Genotype did not significantly affect mean THBVallevels.
Concentrations of HBVal and THBVal in blood werehighly and significantly correlated within each exposuregroup. THBVal levels were 600-fold, 540-fold, and 368-foldhigher than HBVal levels in control, monomer, andpolymer groups, respectively. The difference in levels be-tween the polymer group and each of the other two expo-sure groups was statistically significant. Therefore, bothHBVal and THBVal appear to be useful biomarkers of BDexposure.
In concordance with their conclusions about the appear-ance of the urinary M1 metabolite in the control group, thepresence of relatively high levels of THBVal in the controlgroup suggests that it may arise not only in response to BDexposure but also from other sources. Swenberg andcoworkers (2000) reported that blood samples from volun-teers who do and do not smoke contained detectable levelsof THBVal (40.2 pmol/g globin and 36.3 pmol/g globin,respectively). The detection of THBVal in Hb from smokers
is not surprising. Its presence in nonsmokers suggests thatit may be an endogenous adduct produced from com-pounds other than BD or from other sources of BD. Swen-berg and coworkers (2000) cite their detection of THBValin rodents, calves, dogs, horses, and squirrel monkeys.However, as discussed earlier, the administrative controlsubjects in the current study were exposed to low levels ofBD and thus cannot be considered completely unexposed.Thus, as with the levels of urinary metabolites, endoge-nous sources of BD or other compounds may have supple-mented the adduct levels in each group.
Biomarkers of Effect
In contrast to the positive responses of exposed workers(compared with administrative control subjects) who dem-onstrated an increased production of the biomarkers ofexposure (urinary metabolites and Hb adducts), the studieson biomarkers of effect (reflected in gene mutations, muta-tional spectra, and cytogenetic effects) were uniformlynegative. The small number of subjects available for thestudy and the fact that exposure levels were lower thaninitially expected limited the statistical power for ana-lyzing some mutational endpoints.
HPRT Mutant Cells Assessed via t he Cloning AssayGroup mean MFs were 13.01 � 10�6, 9.24 � 10�6, and18.83 � 10�6 for the control, monomer, and polymergroups, respectively. The differences in MFs between thepairs of exposure groups were not statistically significant,whether analyses were performed with or without an out-lier data point in the polymer group. The fact that the MFfor the control group was higher than that for the monomergroup, although not statistically significant, agreed withthe results of an earlier study of workers in this sameCzech monomer production facility (Tates et al 1996); inthat study, the MFs for the control group and the monomerworkers were 13.93 � 10�6 and 10.10 � 10�6, respectively.The cloning protocol differed slightly between the twostudies but the assays were performed in the same labora-tory and mainly by the same staff. These two data sets arein good agreement even though the control subjects in the1996 study were workers from a heat production unit ofthe monomer plant rather than administrative workers, asin the current study.
In contrast to the differences between the monomerand control groups in the current study (described above),MFs in the polymer group were elevated, although not tostatistical significance, compared with the control group.The investigators note that approximately 60 subjects perexposure group would have been required to demonstratea statistically significant increase of 45% (1.45-fold) in

156
Commentary
polymerization workers compared with control subjects.Because only 34 polymerization workers were availablefor this study, it did not have the statistical power to detectincreases in MF as small as 45%.
To compare these data with the results from the auto-radiographic assay (described later in this section), the MFcalculations were repeated, this time excluding 20 sam-ples with fewer than 400,000 clonable cells (corre-sponding to the lower limit of evaluatable cells used in theautoradiographic assay). The differences between pairs ofgroups decreased (MFs were 12.43 � 10�6, 10.84 � 10�6,and 12.77 � 10�6 for the control, monomer, and polymergroups, respectively) and still lacked statistical signifi-cance. Analysis of all three exposure groups indicated nostatistically significant association between MFs and meanBD exposure, or between MFs and smoking or genotype.The investigators suggest that the number of workers wastoo few to detect small differences in MFs among exposuregroups. The negative findings of the cloning assay are con-sistent with those of Tates and coworkers (1996) and Hayesand colleagues (2000) on Czech and Chinese BD workersbut are in contrast to the results of the cloning assays onTexas workers reported by Ma and coworkers (2000).
HPRT Variant Cells Assessed via the AutoradiographicAssay Mean VFs were 10.75 � 10�6, 5.73 � 10�6, and6.48 � 10�6 for the control, monomer, and polymer groups,respectively. Individual BD exposure levels were not cor-related with individual VFs within any exposure group.The control group’s mean VF was significantly higher thanthe mean VFs for both the monomer and polymer groups.
The administrative control subjects in this study hadunusually high VFs compared with control workers in theTexas studies (Ward et al 1996, 2001; Ammenheuser et al2001) and the current results are inconsistent with theresults in those studies. The investigators discuss possiblereasons for the high VF levels in the administrative controlsubjects in the section Biomarkers of Effect: Assays ofHPRT Mutations in Human Lymphocytes / Discussion /The Autoradiographic Assay / Factors That Could Affectthe Results of HPRT Assays.
The investigators point out that, for the nonsmokers ofthis study’s control group, VFs were more than fivefoldhigher than the mean VF for historical control samples col-lected in the United States (Ammenheuser et al 1997). Infact, the VFs for smokers and nonsmokers in the controlgroup of this study showed little effect of smoking. In themonomer group, nonsmokers had lower VFs than smokers;whereas in the polymer group, nonsmokers had higherVFs than smokers. Measurement of cotinine levels was nota part of the study design; therefore the investigators couldnot verify smoking behaviors reported by the workers.
The investigators state that evaluating autoradiographicslides by light microscopy involves a certain amount ofsubjective judgment among individual researchers identi-fying variant cells. The possibility of introducing an errorby this procedure was controlled for in two ways. First, theslides were coded such that the researchers did not knowto which subject or exposure group the slides belonged.Second, after the slides were evaluated at Galveston, theywere reevaluated at Burlington; the two evaluations yieldedsimilar results.
Mutational Spectra The mutational spectra of controland BD-exposed workers revealed no striking differences.This result was not surprising because BD-exposed workersdid not show an increase in MF. However, it was impor-tant to compare mutational spectra because a smallnumber of changes in DNA that are specific to BD expo-sure could have occurred in the absence of a measurableincrease in MF. Although exposure to BD did not signifi-cantly affect the spectrum of mutations, as compared withcontrol administrative workers, a few novel mutationswere identified. These data will be of interest to investi-gators studying the molecular mechanisms of HPRTmutagenesis.
Cytogenetic Analyses The most important result of thiscomponent of the study was the lack of differencesbetween control and BD-exposed workers in SCEs and inchromosomal aberrations measured by either the conven-tional method or by FISH.
Cytogenetic changes and genetic polymorphisms wereassociated in some ways. For example, statistical analysisshowed a lower frequency of chromosomal aberrationsresulting from BD exposure associated with one of the twoEH genotypes evaluated. In addition, the percentage ofaberrant cells and the number of DNA breaks per cell werelower in cells from workers with one of the two ADH2alleles evaluated. However, statistical analysis indicatedthat these changes were not related to BD exposure.
Given that the mean VF for the control group was higherthan those for both the monomer and polymer groups (andhigher than the Texas control subjects in a study by Wardand colleagues [1996]), it is not surprising that chromo-somal aberrations in the control group would also behigher than historical control subjects as determined bythe conventional method and by FISH techniques (Rubeet al 1998; P Rössner, personal communication of unpub-lished results, 2000). The investigators point out that theirhistorical control values have been obtained from varioussources in the Czech Republic and may not be strictly com-parable to values from industry control workers.
s

157
Health Review Committee
Factors That May Affect Susceptibility
Variations in genotype at polymorphic loci that may affectsusceptibility to BD exposure were unrelated to BD levels inthis study and had little or no quantitative influence (oreffect) on biomarkers of exposure or effect. Some specificgenotypes were associated with quantitative differences indose-response relations of urinary metabolites or Hb adducts,although none indicated a heightened susceptibility to BD.
Correlations Among Biomarkers
Correlations Among the Biomarkers of Exposure Before-work (82 study participants) and after-work (all 83 studyparticipants) urinary M2 and M1 values were positivelyand significantly correlated with HBVal Hb adduct con-centrations. HBVal adduct concentrations also correlatedsignificantly and positively with net (after-work minusbefore-work) urinary M2 and M1 metabolites, but the cor-relations were lower than the correlations between after-work M2 or M1 and HBVal.
As with HBVal, THBVal Hb adduct concentrations werealso positively correlated with before-work and after-workurinary M2 and M1 values and, with the exception of thebefore-work M1 concentration, the correlations were sta-tistically significant. THBVal adducts also were positivelyand significantly correlated with net M2 and M1 concen-trations, but again the correlations were lower than thecorrelations between after-work M2 or M1 and THBVal.
Correlations Among the Biomarkers of Exposure andthe Biomarkers of Effect No positive correlations werereported between any pairs of these two types of bio-markers for any of the exposure groups. Negative and sta-tistically significant correlations were reported betweenHPRT VF levels and increases in each of the urinarymetabolites for all of the exposure groups. Correlationsbetween HPRT VF levels and each of the Hb adducts alsowere negative for each of the exposure groups, but onlythose involving THBVal were statistically significant.No statistically significant correlations were found forany of the exposure groups between (1) HPRT MF levelsand any of the four biomarkers of exposure (M2, M1,HBVal, or THBVal), or (2) between any of the cytogeneticendpoints (determined by the conventional method or byFISH) and any of the biomarkers of exposure.
Correlations Among the Biomarkers of Effect HPRTmutation levels, expressed as either MFs or VFs, did notcorrelate with levels of cytogenetic biomarkers. Therefore,the investigators concluded that the biomarkers of geno-toxic effects, whether mutational or chromosomal changes,were not only unrelated to BD exposure but were alsounrelated to one another.
DISCUSSION OF MUTATION FINDINGS
The primary purpose of this study was to validate bio-markers as possible surrogate measures of actual exposurein a human population. None of the biomarkers was eval-uated as a possible indicator or predictor of health out-comes. A unique feature of the study design is that itbrought together the investigators of earlier major mutationanalyses (Tates [Leiden; Czech BD workers] and Ward[Galveston; Texas BD workers]) to conduct parallel analysesin one population.
The current study did not detect significant differencesin mutation levels among exposure groups. The results ofthe current study (see the earlier section Technical Evalua-tion / Results and Interpretations / Biomarkers of Effect /HPRT Mutant Cells Assessed via the Cloning Assay) bothconfirmed and are at odds with earlier studies of subjectsin this and other workplaces. In the earlier section Scien-tific Background / Biomarkers Chosen for This Study /Biomarkers of Effect / HPRT Mutations, we discuss the unex-plained differences in the MF results obtained by the cloningassay using lymphocytes from workers in both the CzechRepublic and in China (in which both populations showedno increase in MF compared with control workers; Tates etal 1996; Hayes et al 1996) versus lymphocytes fromworkers in Texas (in which MFs were higher than those incontrol subjects; Ma et al 2000).
The results of the current study’s analysis of variantlevels (see the earlier section Technical Evaluation / Resultsand Interpretations / Biomarkers of Effect / HPRT MutantCells Assessed via the Autoradiographic Assay) also differwith those previously reported by researchers in theGalveston laboratory where the autoradiographic assay forVFs was performed. Those studies of Texas workers showedthat workers exposed to higher levels of BD had higher VFsthan workers exposed to lower BD levels and unexposedcontrol subjects (Ward et al 1996, 2001; Ammenheuser etal 2001). A complication of the VF component of the currentstudy, but not of earlier studies by Ward and coworkers’,was the unexpectedly higher levels of VFs in the Czechcontrol group than in the monomer and polymer groups. Incomparison, the Leiden investigators using the cloningassay, also found higher MFs in the Czech control groupthan in monomer group both in this and in an earlier study(Tates et al 1996).
The current study also did not detect differences in chro-mosomal damage. Several other studies of BD-inducedcytogenetic changes have produced inconsistent results.For example, the lack of positive findings from the currentstudy both agree and disagree with the results of other

158
Commentary
studies conducted at the same BD monomer productionfacility: Sorsa and coworkers (1994) found no changes inSCEs in their total study population, but found higherlevels of chromosomal aberrations in a subset of BD-exposed workers lacking the GSTT1 gene. In the same pop-ulation, rám and colleagues (1998) reported increases inchromosomal aberrations and SCEs (including HFCs) inexposed compared with unexposed workers. BD expo-sures did not differ in these two studies. (The findings ofthose two studies are described in the earlier section Sci-entific Background / Genetic Polymorphisms and Cytoge-netic Damage.) Possible reasons for the differing results arediscussed in the Investigators’ Report section Biomarkersof Effect: Cytogenetic Analysis. In a study of BD-exposedChinese workers, Hayes and coworkers (2000) also foundno cytogenetic damage and concluded that their study didnot show BD-induced genotoxic effects. However, theycautioned that their negative results are relevant only forexposures in the range of BD studied (median level forexposed workers was 4.4 mg/m3 [2 ppm]) and that the rel-atively small size of their study population limited theirability to detect modest effects.
In their concluding Discussion, Albertini and colleaguesacknowledge the conflicting results of this and otherstudies on BD-induced changes in levels of biomarkers ofeffect. Nevertheless, they conclude that “the current studyadds to the weight of evidence against genotoxicity for thepopulation as a whole at the low exposure levels encoun-tered in the modern BD industry. It does not offer new evi-dence for upgrading the classification of BD to a knownhuman carcinogen (Class 1; IARC 1999) nor does it supportthe EPA’s recent classification of BD as a known humancarcinogen by inhalation (EPA 2002).” However, thenumber of subjects available and exposures that werelower than initially expected may have limited the statis-tical power for some mutational endpoints.
On the basis of their results of HPRT VFs in anotherstudy (Ammenheuser et al 2001), Ward and colleaguesconcluded that BD exposures between 2.2 mg/m3 and6.6 mg/m3 (1 to 3 ppm) may be associated with adversebiological effects (discussed in the Scientific Backgroundabove). The mean TWA BD exposure for the polymer groupin the current study was 1.76 mg/m3 (0.8 ppm), whichapproaches Ward and coworkers’ lower limit of 2.2 mg/m3
(1 ppm). The individual TWAs of BD exposure for poly-merization workers reached as high as 39.03 mg/m3
(17.66 ppm). Thus, a study with greater statistical powermight have detected elevated levels of HPRT mutations,should they have occurred.
S
SUMMARY
The main objective of this transitional epidemiologicstudy was to determine whether the appearance of a seriesof biomarkers in the blood and urine of workers exposedoccupationally to BD could reliably indicate their level ofexposure. If successful, such biomarkers could be used infull-scale epidemiologic studies.
The investigators studied the appearance of biomarkersof exposure and effects, and analyzed some other factors thatmay affect susceptibility in workers in the Czech Republicexposed occupationally in a BD monomer productionfacility and an adjacent SBR polymerization facility. Admin-istrative workers in the company served as control subjects.
This challenging and comprehensive transitional epide-miologic study had several strengths and advantages.
• An experienced group of core investigators conductedthe study.
• The design benefited from a pilot study that deter-mined the steps needed to provide investigators inother countries with blood and urine samples pre-pared in the Czech Republic.
• The extensive exposure assessment was criticallyimportant in establishing the foundation upon whichthe biomarker measurements were interpreted.
• The investigators selected multiple endpoints forboth biomarkers of exposure and biomarkers of effect.
• Multiple biomarkers of exposure (urinary metabolitesand Hb adducts) were used to reflect different durationsof exposure and were integrated with high-qualityexposure data collected on the same individuals overthe time span appropriate to the biomarkers.
• State-of-the-art analytic methods were used to quan-tify biomarker levels.
As with any study, there were accompanying limitations(some of which were not under the investigators’ control).
• The number of subjects and exposure levels that werelower than initially expected limited the statisticalpower of certain analyses.
• The administrative control subjects apparently werenot completely unexposed because they did experiencemeasurable BD exposures and showed biomarkers ofexposure in their blood and urine.
• Pharmacokinetic modeling of BD metabolism wouldhave led to improved understanding and enhancedthe usefulness of the data collected.
This important study linked BD exposure, measured byconventional sampling techniques, with biological markers

159
Health Review Committee
of that exposure. The investigators identified a set of objec-tives that were clear and achievable. Their study designwas well crafted to effectively achieve their objectives and,in general, their conclusions are well supported by thedata. The Investigators’ Report contains a wealth of infor-mation that will be of great interest and use to researchers.The key findings of the study follow.
• Hb adducts (biomarkers of exposure) were highly cor-related with BD exposure levels measured by passivesamplers and integrated over time. THBVal adducts(from BDO-diol or BDO2) were 300-fold to 400-foldhigher than HBVal adducts (from BDO). Nevertheless,both may prove to be useful markers for exposuremeasurements in the workplace.
• Urinary metabolites (biomarkers of exposure) werealso correlated with BD exposure levels integratedover time. M1 levels were 50-fold to 100-fold higherthan M2 levels, as would be expected given that thehuman metabolic pathway for BD preferentiallyresults in M1. Although these correlations were not asstrong as those for Hb adducts, urinary metabolitesmay also prove to be useful markers of BD exposure.
• Some specific genotypes analyzed for loci that couldaffect susceptibility to carcinogens were associatedwith quantitative differences in dose-response rela-tions of urinary metabolites or Hb adducts, althoughnone indicated a heightened susceptibility to BDexposure.
• Biomarkers of effect (such as HPRT MFs, HPRT VFs,or other endpoints of chromosomal changes) showedno statistically significant increases or correlationswith BD exposure levels.
The finding that both types of biomarkers of exposurereflected BD exposure levels in this study agrees with theresults of Hayes and coworkers (2000). Those investigatorsalso reported that (1) BD-exposed workers in China hadhigher levels of THBVal adducts than control workers andthe adduct levels tended to correlate with BD exposurelevels, and (2) urinary M1 levels were significantly corre-lated with BD exposure levels.
This study did not detect differences in mutation levelsor chromosomal changes, but it was not designed to detectsmall differences. On the basis of these findings, theauthors concluded that “the current study adds to theweight of evidence against genotoxicity for the populationas a whole at the low exposure levels encountered in themodern BD industry. It does not offer new evidence forupgrading the classification of BD to a known human car-cinogen (Class 1; IARC 1999) nor does it support the EPA’srecent classification of BD as a known human carcinogen
by inhalation (EPA 2002).” As discussed earlier, the smallnumber of subjects and the exposure levels that were lowerthan expected may have limited the statistical power forsome mutational and cytogenetic endpoints. Furthermore,none of the biomarkers was evaluated as a possible indi-cator or predictor of health outcomes. Thus, the genotox-icity of BD exposure at low levels remains uncertain.
This study by Albertini and colleagues was a very im-portant and valuable transitional epidemiologic studybecause it established the linkage between exposure toBD, measured by comprehensive conventional samplingtechniques, and several biological markers of that expo-sure. The integration of a comprehensive exposure assess-ment with a series of logical biomarker analyses was anoutstanding feature of this complex, international study.Of the many biomarkers analyzed, biomarkers of exposure(particularly Hb adducts) will likely be valuable in futureepidemiologic studies of the health effects of BD.
ACKNOWLEDGMENTS
The Health Review Committee is grateful to the ad hocreviewers for their help in evaluating the scientific merit ofthe Investigators’ Report; to Dr Debra Kaden for her over-sight of the study; to Dr Bernard Jacobson for his assistancein preparing its Commentary; and to Virgi Hepner, RuthShaw, Jenny Lamont, Francine Marmenout, Carol AMoyer, Quentin Sullivan, and Gabe Weiss for their roles inpublishing this Research Report.
The Health Effects Institute appreciates the scientistswho served on the Special Panel to review the results ofthis important undertaking.
THE SPECIAL PANEL OF THE HEALTH REVIEW COMMITTEE
Thomas Kensler ChairJohns Hopkins UniversityMember, HEI Health Review Committee
Timothy BuckleyJohns Hopkins University
Alan R BuckpittUniversity of California, Davis
Howard L LiberMassachusetts General Hospital (at the time of his Panel involvement)
John PetkauUniversity of British Columbia

160
Commentary
Donald J ReedOregon State UniversityMember, HEI Health Review Committee
Steven TannenbaumMassachusetts Institute of Technology
REFERENCES
Ammenheuser MM, Bechtold WE, Abdel-Rahman SZ,Rosenblatt JI, Hastings-Smith DA, Ward JB Jr. 2001. Assess-ment of 1,3-butadiene exposure in polymer productionworkers using HPRT mutations in lymphocytes as a bio-marker. Environ Health Perspect 109:1249–1255.
Ammenheuser MM, Hastings DA, Whorton EB Jr, Ward JBJr. 1997. Frequencies of HPRT mutant lymphocytes insmokers, non-smokers, and former smokers. Environ MolMutagen 30:131–138.
Au WW, Bechtold WE, Whorton EB Jr, Legator MS. 1995.Chromosome aberrations and response to gamma-ray chal-lenge in lymphocytes of workers exposed to 1,3-butadiene.Mutat Res 334:125–130.
Bechtold WE, Strunk MR, Chang I-Y, Ward JB Jr, HendersonRF. 1994. Species differences in urinary butadiene metabo-lites: Comparisons of metabolite ratios between mice, rats,and humans. Toxicol Appl Pharmacol 127:44–49.
Bernardini S, Hirvonen A, Pelin K, Norppa H. 1998. Induc-tion of sister chromatid exchange by 1,2-epoxy-3-butene incultured human lymphocytes: Influence of GSTT1 geno-type. Carcinogenesis 19:377–380.
Bernardini S, Pelin K, Peltonen K, Järventaus H, HirvonenA, Neagu C, Sorsa M, Norppa H. 1996. Induction of sisterchromatid exchange by 3,4-epoxybutane-1,2-diol in cul-tured human lymphocytes of different GSTT1 and GSTM1genotypes. Mutat Res 361:121–127.
Blair IA, Oe T, Kambouris S, Chaudhary AK. 2000. Part IV,Molecular dosimetry of 1,3-butadiene. In: 1,3-Butadiene:Cancer, Mutations, and Adducts. Research Report 92.Health Effects Institute, Cambridge MA.
Boogaard PJ, van Sittert NJ. 1995. Biological monitoring ofexposure to benzene: A comparison between S-phenyl-mercapturic acid, trans,trans-muconic acid, and phenol.Occup Environ Med 52:611–620.
Boogaard PJ, van Sittert NJ. 1996. Suitability of S-phenylmecapturic acid and trans,trans-muconic acid as bio-markers for exposure to low concentrations of benzene.Environ Health Perspect 104(Suppl 6):1151–1157.
Cochrane JE, Skopek TR. 1994. Mutagenicity of butadieneand its epoxide metabolites: II. Mutational spectra of buta-diene, 1,2-epoxybutene and diepoxybutane at the hprtlocus in splenic T cells from exposed B6C3F1 mice. Car-cinogenesis 15:719–723.
Collins AR. 1998. Molecular epidemiology in cancerresearch. Mol Aspects Med 19:359–432.
Delzell E, Sathiakumar N, Hovinga M, Macaluso M, Julian J,Larson R, Cole P, Muir DCF. 1996. A follow-up study ofsynthetic rubber workers. Toxicology 113:182–189.
Department of Health and Human Services (US). 1991. AQuantitative Assessment of the Risk of Cancer Associatedwith Exposure to 1,3-Butadiene, Based on a Low DoseInhalation Study in B6C3F1 Mice. Submitted to the USOccupational Safety and Health Administration for Buta-diene Docket H-041. National Institute for OccupationalSafety and Health, Washington DC.
Department of Health and Human Services (US). 2000.1,3-Butadiene. In: Ninth Report on Carcinogens. NationalToxicology Program, Research Triangle Park NC.
de Rooij BM, Boogaard PJ, Commandeur JNM, van SittertNJ, Vermeulen NPE. 1997a. Allylmercapturic acid as uri-nary biomarker of human exposure to allyl chloride.Occup Environ Med 54:653–661.
de Rooij BM, Boogaard PJ, Commandeur JNM, VermeulenNPE. 1997b. α-Chlorohydrin and 3-chloro-2-hydroxypro-pylmercapturic acid as biomarkers of occupational expo-sure to epichlorohydrin. Environ Toxicol Pharmacol3:175–185.
Divine BJ. 1990. An update on mortality among workers ata 1,3-butadiene facility: Preliminary results. Environ HealthPerspect 86:119–128.
Divine BJ, Hartman CM. 1996. Mortality update of buta-diene production workers. Toxicology 113:169–181.
Divine BJ, Wendt JK, Hartman CM. 1993. Cancer mortalityamong workers at a butadiene production facility. In: Buta-diene and Styrene: Assessment of Health Hazards (SorsaM, Peltonen K, Vainio H, Hemminiki K, eds), pp 345–362.IARC Scientific Publications 127. International Agency forResearch on Cancer, Lyon, France.
Environmental Protection Agency (US). 2002. Health RiskAssessment of 1,3-Butadiene. EPA/600/P-98/001F. Na-tional Office for Environmental Assessment–WashingtonOffice, Office of Research and Development, US EPA,Washington DC.
161
Health Review Committee
European Centre for Ecotoxicity and Toxicology of Chemi-cals (ECETOC) 1997. 1,3-butadiene OEL Criteria Docu-ment (2nd ed). Special Report 12. ECETOC, Brussels,Belgium.
Hayes RB, Xi L, Bechtold WE, Rothman N, Yao M, Hen-derson R, Zhang L, Smith MT, Zhang D, Wiemels J, Dose-meci M, Yin S, O’Neill JP. 1996. hprt Mutation frequencyamong workers exposed to 1,3-butadiene in China. Toxi-cology 113:100–105.
Hayes RB, Zhang L, Yin S, Swenberg JA, Xi L, Wiencke J,Bechtold WE, Yao M, Rothman N, Haas R, O’Neill JP,Zhang D, Wiemels J, Dosemeci M, Li G, Smith MT. 2000.Genotoxic markers among butadiene polymer workers inChina. Carcinogenesis 21:55–62.
Health Effects Institute. 2000. 1,3-Butadiene: Cancer, Muta-tions, and Adducts, Parts I–V. Research Report 92. HealthEffects Institute, Cambridge MA.
Himmelstein MW, Acquavella JF, Recio L, MedinskyMA, Bond JA. 1997. Toxicology and epidemiology of 1,3-butadiene. Crit Rev Toxicol 27:1–108.
Hirvonen A. 1999. Polymorphisms of xenobiotic-metabo-lizing enzymes and susceptibility to cancer. Environ HealthPerspect 107(Suppl 1):37–47.
International Agency for Research on Cancer. 1999. Re-evaluation of Some Organic Chemicals, Hydrazine andHydrogen Peroxide. IARC Monographs on the Evaluationof Carcinogenic Risks to Humans, Vol 71, Part I, pp 109–225. IARC, Lyon, France.
Landi S, Norppa H, Frenzilli G, Cipollini G, Ponzanelli I,Barale R, Hirvonen A. 1998. Individual sensitivity to cyto-genetic effects of 1,2:3,4-diepoxybutane in cultured humanlymphocytes: Influence of glutathione S-transferase M1,P1 and T1 genotypes. Pharmacogenetics 8:461–471.
Ma H, Wood TG, Ammenheuser MM, Rosenblatt JI, WardJB Jr. 2000. Molecular analysis of hprt mutant lymphocytesfrom 1,3-butadiene-exposed workers. Environ Mol Mutagen36:59–71.
Macaluso M, Larson R, Delzell E, Sathiakumar N, HovingaM, Julian J, Muir D, Cole P. 1996. Leukemia and cumula-tive exposure to butadiene, styrene and benzene amongworkers in the synthetic rubber industry. Toxicology113:190–202.
Matanoski GM, Santos-Burgoa C, Schwartz L. 1990. Mor-tality of a cohort of workers in the styrene-butadienepolymer manufacturing industry (1943–1982). EnvironHealth Perspect 86:107–117.
Matanoski GM, Schwartz L. 1987. Mortality of workers instyrene-butadiene polymer production. J Occup Med 29:675–680.
Meinhardt TJ, Lemen RA, Crandall MS, Young RJ. 1982.Environmental epidemiologic investigation of the styrene-butadiene rubber industry: Mortality patterns with discus-sion of the hematopoietic and lymphatic malignancies.Scand J Work Environ Health 8:250–259.
Melnick RL, Kohn MC. 1995. Mechanistic data indicatethat 1,3-butadiene is a human carcinogen. Carcinogenesis16:157–163.
National Research Council, Committee on BiologicalMarkers. 1987. Biological markers in environmental healthresearch. Environ Health Perspect 74:3–9.
Norppa H. 1997. Cytogenetic markers of susceptibility:Influence of polymorphic carcinogen-metabolizing enzymes.Environ Health Perspect 105(Suppl 4):829–835.
Occupational Safety and Health Administration (US).1996. Occupational exposure to 1,3-butadiene; final rule.Fed Regist 61(214):56745–56795.
Osterman-Golkar S, Bond JA, Ward JB Jr, Legator MS. 1993.Use of haemoglobin adducts for biomonitoring exposure to1,3-butadiene. In: Butadiene and Styrene: Assessment ofHealth Hazards (Sorsa M, Peltonen K, Vainio H, HemminkiK, eds), pp 127–134. IARC Scientific Publications 127.International Agency for Research on Cancer, Lyon, France.
Osterman-Golkar S, Kautiainen A, Bergmark E, HakanssonK, Maki-Paakkanen J. 1991. Hemoglobin adducts and uri-nary mercapturic acids in rats as biological indicators ofbutadiene exposure. Chem Biol Interact 80:291–302.
Osterman-Golkar S, Peltonen K, Anttinen-Klemetti T,Landin HH, Zorcec V, Sorsa M. 1996. Haemoglobinadducts as biomarkers of occupational exposure to 1,3-butadiene. Mutagenesis 11:145–149.
Pérez HL, Lähdetie J, Landin H, Kilpeläinen I, Koivisto P,Peltonen K, Osterman-Golkar S. 1997. Haemoglobinadducts of epoxybutane-diol from exposure to 1,3-butadieneor butadiene epoxides. Chem Biol Interact 105:181–198.
Recio L, Meyer KG. 1995. Increased frequency of muta-tions at A:T basepairs in the bone marrow of B6C3F1 lacItransgenic mice exposed to 1,3-butadiene. Environ MolMutagen 26:1–8.
Recio L, Sisk S, Meyer K, Pluta L, Bond JA. 1996. Mutage-nicity and mutational spectra of 1,3-butadiene in the bonemarrow of B6C3F1 lacI transgenic mice. Toxicology113:106–111.

162
Commentary
Rube J, Kucharová S, Vozdová M, Musilová P, Zudora Z.1998. Cytogenetic analysis of peripheral lymphocytes inmedical personnel by means of FISH. Mutat Res 412:293–298.
Sabourin PJ, Burka LT, Bechtold WE, Dahl AR, Hoover MD,Chang IY, Henderson RF. 1992. Species differences in uri-nary butadiene metabolites: Identification of 1,2-dihydroxy-4-(N-acetylcysteinyl)butane, a novel metabolite of buta-diene. Carcinogenesis 13:1633–1638.
Sathiakumar N, Delzell E, Hovinga M, Macaluso, Julian JA,Larson R, Cole P, Muir DCF. 1998. Mortality from cancerand other causes of death among synthetic rubber workers.Occup Environ Med 55:230–235.
Sisk SC, Pluta L, Bond JA, Recio L. 1994. Molecularanalysis of lacI mutants from bone marrow of B6C3F1transgenic mice following inhalation exposure to 1,3-butadiene. Carcinogenesis 15:471–477.
Skipper PL, Tannenbaum SR. 1990. Protein adducts in themolecular dosimetry of chemical carcinogens. Carcinogen-esis 11:507–518.
Sorsa M, Autio N, Demopoulos NA, Jarvenatus H, RössnerP, rám RJ, Stephanou G, Vlachodimitropoulos D. 1994.Human cytogenetic biomonitoring of occupational expo-sure to 1,3-butadiene. Mutat Res 309:321–326.
Sorsa M, Osterman-Golkar S, Peltonen K, Saarikoski ST,rám R. 1996. Assessment of exposure to butadiene in the
process industry. Toxicology 113:77–83.
rám RJ, Rössner P, Peltonen, K, Podrazilová K, Mra kováG, Demopoulos NA, Stephanou G, Vlachodimitropoulos D,Darroudi F, Tates AD. 1998. Chromosomal aberrations,sister-chromatid exchanges, cells with high frequency ofSCE, micronuclei and comet assay parameters in 1,3-butadiene-exposed workers. Mutat Res 419:145–154.
Swenberg JA, Christova-Gueorguieva NI, Upton PB, Rana-singhe A, Scheller N, Wu K-Y, Yen T-Y, Hayes R. 2000. PartV, Hemoglobin adducts as biomarkers of butadiene expo-sure and metabolism. In: 1,3-Butadiene: Cancer, Muta-tions, and Adducts. Research Report 92. Health EffectsInstitute, Cambridge MA.
Tates AD, van Dam FJ, de Zwart FA, Darroudi F, NatarajanAT, Rössner P, Peterková K, Peltonen K, Demopoulos NA,
s
S
S
S c
Stephanou G, Vlachodimitropoulos D, rám RJ. 1996. Bio-logical effect monitoring in industrial workers from theCzech Republic exposed to low levels of butadiene. Toxi-cology 113:91–99.
Trask BJ, Allen S, Massa H, Fertitta A, Sachs R, van denEngh G, Wu M. 1993. Studies of metaphase and interphasechromosomes using fluorescent in situ hybridization. ColdSpring Harb Symp Quant Biol 58:767–775.
Uusküla M, Järventaus H, Hirvonen A, Sorsa M, Norppa H.1995. Influence of GSTM1 genotype on sister chromatidexchange induction by styrene-7,8-oxide and 1,2-epoxy-3-butene in cultured human lymphocytes. Carcinogenesis16:947–950.
van Sittert NJ, van Vliet EWN. 1994. Monitoring occupa-tional exposure to some industrial chemicals by deter-mining hemoglobin adducts. Clin Chem 40:1472–1475.
van Welie RT, van Duyn P, Brouwer DH, van Hemmen JJ,Brouwer EJ, Vermeulen NPE. 1991. Inhalation exposure to1,3-dichloropropene in the Dutch flower bulb culture: II,Biological monitoring by measurement of urinary excre-tion of two mercapturic acid metabolites. Arch EnvironContam Toxicol 20:6–19.
Ward JB Jr, Abdel-Rahman SZ, Henderson RF, Stock TH,Morandi MT, Rosenblatt JI, Ammenheuser MM. 2001.Assessment of butadiene exposure in synthetic rubbermanufacturing workers in Texas using frequencies ofHPRT mutant lymphocytes as a biomarker. Chem-BiolInteract 135–136:465–483.
Ward JB Jr, Ammenheuser MM, Whorton EB Jr, BechtoldWE, Kelsey KT, Legator MS. 1996. Biological monitoringfor mutagenic effects of occupational exposure to buta-diene. Toxicology 113:84–90.
Ward JB Jr, Ammenheuser MM, Bechtold WE, Whorton EBJr, Legator MS. 1994. hprt Mutant lymphocyte frequenciesin workers at a 1,3-butadiene production plant. EnvironHealth Perspect 102(Suppl 9):79–85.
Wiencke JK, Pemble S, Ketterer B, Kelsey KT. 1995. Genedeletion of glutathione S-transferase theta: Correlation withinduced genetic damage and potential role in endogenousmutagenesis. Cancer Epidemiol Biomarkers Prev 4:253–259.
S

RELATED HEI PUBLICATIONS:
AIR
TOXICS
163
Research Reports
115 Validation and Evaluation of Biomarkers in Workers Exposed to Benzenein China Q Qu 2003
113 Benzene Metabolism in Rodents at Doses Relevant to Human Exposure fromUrban Air KW Turteltaub 2003
108 Case-Cohort Study of Styrene Exposure and Ischemic Heart Disease GM Matanoski 2002103 Characterization and Mechanisms of Chromosomal Alterations Induced
by Benzene in Mice and Humans DA Eastmond 200192 1,3-Butadiene: Cancer, Mutations, and Adducts 2000
Part I
: Carcinogenicity of 1,2,3,4-Diepoxybutane RF Henderson
Part II
: Roles of Two Metabolites of 1,3-Butadiene in Mediating Its in Vivo Genotoxicity L Recio
Part III
: In Vivo Mutation of the Endogenous
hprt
Genes of Mice and Rats by 1,3-Butadiene and Its Metabolites VE Walker
Part IV
: Molecular Dosimetry of 1,3-Butadiene IA Blair
Part V
: Hemoglobin Adducts as Biomarkers of 1,3-Butadiene Exposure and Metabolism JA Swenberg
87 Development of Liquid Chromatography–Electrospray Ionization–Tandem Mass Spectrometry Methods for Determination of UrinaryMetabolites of Benzene in Humans AA Melikian 1999
67 Development of Methods for Measuring Biological Markers ofFormaldehyde Exposure TR Fennell 1994
HEI Communications
6 A Partnership to Examine Emerging Health Effects: EC/HEI Workshop on 1,3-Butadiene 1999
2 Research Priorities for Mobile Air Toxics 1993
HEI Program Summaries
Research on Air Toxics 1999Research on Benzene and 1,3-Butadiene 1995
Report Principal
Number Title Investigator Date*
* Reports published since 1990.Copies of these reports can be obtained from the Health Effects Institute and many are available at
www.healtheffects.org.


H E A L T HE F F E C T SI N S T I T U T E
The Health Effects Institute, established in 1980,
is an independent and unbiased source of
information on the health effects of motor
vehicle emissions. HEI supports research on all
major pollutants, including regulated pollutants
(such as carbon monoxide, ozone, nitrogen
dioxide, and particulate matter) and unregulated
pollutants (such as diesel engine exhaust,
methanol, and aldehydes). To date, HEI has
supported more than 220 projects at institutions
in North America and Europe and has published
over 140 research reports.
Typically, HEI receives half its funds from the
US Environmental Protection Agency and half
from 28 manufacturers and marketers of motor
vehicles and engines in the United States.
Occasionally, funds from other public and private
organizations either support special projects or
provide a portion of the resources for an HEI
study. For the work described in this Research
Report, HEI received additional funds from the
American Chemistry Council, the European
Chemical Industry Council, and the International
Institute of Synthetic Rubber Producers.
Furthermore, HEI gratefully acknowledges fund-
ing to the Vermont Cancer Center Analysis Facility
from the National Cancer Institute, a grant that
supported part of the DNA analyses performed
for this study.
Regardless of funding sources, HEI exercises
complete autonomy in setting its research
priorities and in reaching its conclusions. An
independent Board of Directors governs HEI. The
Institute’s Health Research and Health Review
Committees serve complementary scientific
purposes and draw distinguished scientists as
members. The results of HEI-funded studies are
made available as Research Reports, which
contain both the Investigators’ Report and the
Review Committee’s evaluation of the work’s
scientific quality and regulatory relevance.
Richard F Celeste ChairPresident, Colorado College
Archibald Cox Chair EmeritusCarl M Loeb University Professor (Emeritus), Harvard Law School
Donald Kennedy Vice Chair EmeritusEditor-in-Chief, Science; President (Emeritus) and Bing Professor ofBiological Sciences, Stanford University
Purnell W ChoppinPresident Emeritus, Howard Hughes Medical Institute
Jared L CohonPresident, Carnegie Mellon University
Alice HuangSenior Councilor for External Relations, California Instituteof Technology
Richard B StewartProfessor, New York University School of Law, and Director,New York University Center on Environmental and Land Use Law
Robert M WhitePresident (Emeritus), National Academy of Engineering, and SeniorFellow, University Corporation for Atmospheric Research
Mark J Utell ChairProfessor of Medicine and Environmental Medicine, Universityof Rochester
Melvyn C BranchJoseph Negler Professor of Engineering, Mechanical EngineeringDepartment, University of Colorado
Kenneth L DemerjianProfessor and Director, Atmospheric Sciences Research Center,University at Albany, State University of New York
Peter B FarmerProfessor and Section Head, Medical Research Council Toxicology Unit,University of Leicester
Helmut GreimProfessor, Institute of Toxicology and Environmental Hygiene, TechnicalUniversity of Munich
Rogene HendersonSenior Scientist and Deputy Director, National EnvironmentalRespiratory Center, Lovelace Respiratory Research Institute
Stephen I RennardLarson Professor, Department of Internal Medicine, University ofNebraska Medical Center
Howard RocketteProfessor and Chair, Department of Biostatistics, Graduate School ofPublic Health, University of Pittsburgh
Jonathan M SametProfessor and Chairman, Department of Epidemiology, BloombergSchool of Public Health, Johns Hopkins University
Ira TagerProfessor of Epidemiology, School of Public Health, University ofCalifornia, Berkeley
Clarice R WeinbergChief, Biostatistics Branch, Environmental Diseases and MedicineProgram, National Institute of Environmental Health Services
BOARD OF DIRECTORS
HEALTH RESEARCH COMMITTEE
HEALTH REVIEW COMMITTEE
OFFICERS & STAFFDaniel S Greenbaum PresidentRobert M O’Keefe Vice PresidentJane Warren Director of ScienceSally Edwards Director of PublicationsJacqueline C Rutledge Director of Finance and AdministrationRichard M Cooper Corporate SecretaryCristina I Cann Staff ScientistAaron J Cohen Principal ScientistMaria G Costantini Principal ScientistDebra A Kaden Senior Scientist
Geoffrey H Sunshine Senior ScientistAnnemoon MM van Erp Staff ScientistTerésa Fasulo Science Administration ManagerGail A Hamblett Office and Contracts ManagerMelissa Harke Administrative AssistantL Virgi Hepner Senior Science EditorJenny Lamont Science EditorFrancine Marmenout Senior Executive AssistantTeresina McGuire Accounting AssistantRobert A Shavers Operations Manager
Daniel C Tosteson ChairProfessor of Cell Biology, Dean Emeritus, Harvard Medical School
Ross AndersonProfessor and Head, Department of Public Health Sciences, St George’s Hospital Medical School, London University
John C Bailar IIIProfessor Emeritus, The University of Chicago
John R HoidalProfessor of Medicine and Chief of Pulmonary/Critical Medicine,University of Utah
Thomas W KenslerProfessor, Division of Toxicological Sciences, Department ofEnvironmental Sciences, Johns Hopkins University
Brian LeadererProfessor, Department of Epidemiology and Public Health, Yale University School of Medicine
Thomas A LouisProfessor, Department of Biostatistics, Bloomberg School of PublicHealth, Johns Hopkins University
Edo D PellizzariVice President for Analytical and Chemical Sciences, ResearchTriangle Institute
Nancy ReidProfessor and Chair, Department of Statistics, University of Toronto
William N RomProfessor of Medicine and Environmental Medicine and Chief ofPulmonary and Critical Care Medicine, New York University Medical Center
Sverre VedalProfessor, University of Colorado School of Medicine; Senior Faculty,National Jewish Medical and Research Center

H E A L T HE F F E CTSINSTITUTE
Biomarkers in Czech WorkersExposed to 1,3-Butadiene:A Transitional Epidemiologic StudyRichard J Albertini, Radim J Šrám, Pamela M Vacek,
Jeremiah Lynch, Janice A Nicklas, Nico J van Sittert,
Peter J Boogaard, Rogene F Henderson, James A Swenberg,
Ad D Tates, Jonathan B Ward Jr, Michael Wright, and Others
Number 116June 2003
R E S E A R C H R E P O R T
Charlestown Navy Yard
120 Second Avenue
Boston MA 02129 USA
+1-617-886-9330
www.healtheffects.org
H E A L T HE F F E CTSINSTITUTE
R E S E A R C HR E P O R T
Number 116
June 2003
Includes a Commentary by the Institute’s Health Review Committee
June 2003R
EPORT
116B
iom
arkers in C
zech W
orkers E
xpo
sed to
1,3-Bu
tadien
e


![Rare and interesting Cortinarius species of the Czech Republic. Cortinarius velicopia (Phlegmacium, Cortinariaceae) [in Czech]](https://static.fdokumen.com/doc/165x107/63393c30fec8e2741b0f71d8/rare-and-interesting-cortinarius-species-of-the-czech-republic-cortinarius-velicopia.jpg)