Machine Learning-Based Early Intrusion ... - Research Square

Fluid–rock interactions and the role of late Hercynian aplite
intrusion in the genesis of the Castromil gold deposit,
northern Portugal
J. Vallancea,b,*, M. Cathelineaua, M.C. Boirona, S. Fourcadec,T.J. Shepherdd, J. Nadend
aUMR G2R-CNRS 7566, BP 23, 54501 Vandoeuvre-les-Nancy Cedex, FrancebSection des Sciences de la Terre, Departement de Mineralogie, Rue des Maraıchers 13, CH1205 Geneva, Switzerland
cGeosciences Rennes, Campus de Beaulieu, 35042 Rennes Cedex, FrancedBritish Geological Survey, Nicker Hill, Keyworth, Nottingham NG 12 5 GG, UK
Received 3 December 2001; received in revised form 28 June 2002
Abstract
Castromil (northern Portugal) is one of several important orogenic gold deposits located within the ‘‘Central Iberian’’
geotectonic zone of northwest Iberia. The deposit occurs at the margin of a Variscan, syn- to late-D3 biotite granite, and is
spatially associated with a small tourmaline aplite body that intrudes the granite at its contact with a secondary anticline of
Palaeozoic arenaceous and argillaceous metasediments of the Valongo Belt. Identification of the ore fluids and their pathways,
and the reconstruction of the P–T–X conditions during mineralisation were obtained by combining the geometric
characteristics of veins and microstructures together with a detailed study of the inclusion fluids.
Several stages of fluid percolation following contact metamorphism can be recognised. At each stage, the contact zone,
characterised by intrusive aplites, related faults and fractures, appears to have focused the hydrothermal flow and acted as a
structural conduit for deeper-sourced hydrothermal fluids. The earliest fluid stage (Stage I) is characterised by aqueous-carbonic
fluids dominated by CO2 and CH4 that were probably generated by high-temperature fluid–rock interaction (400–500 jC) withgraphitic schists interbedded with the metasediments. These fluids were responsible for significant alteration (greisenisation) of
the aplite and its host granite, and the formation of silicified, flat lying structures that can be traced along the strike length of the
deposit. At temperatures between 400 and 500 jC, fluid pressure ranges from 230 to 300 MPa, which is equivalent to a depth of
10F 1.5 km. The second stage of mineralisation (Stage II: As-ore stage) is also characterised by aqueous-carbonic fluids and
represents the main phase of quartz–arsenopyrite–pyrite deposition.
The third stage of mineralisation (Stage III: Au-ore stage) was accompanied by intense microfracturing of the preexisting
quartz veins and the preferential deposition of gold along microfractures in the sulphides. The introduction of gold corresponds
to the percolation and mixing of two distinctive aqueous fluids of contrasting salinity at relatively low temperatures (150–275
jC). Based on compositional and temperature data, it is suggested that during the main phase of uplift, shallow waters
penetrated deep into the basement, allowing gold to be leached from potential source rocks (most probably the Palaeozoic
metasediments) and deposited in structural and geochemical traps formed during earlier stages of the hydrothermal system.
0009-2541/02/$ - see front matter D 2002 Elsevier Science B.V. All rights reserved.
PII: S0009 -2541 (02 )00278 -4
* Corresponding author. Section des Sciences de la Terre, Departement de Mineralogie, Rue des Maraıchers 13, CH1205 Geneva,
Switzerland.
E-mail address: [email protected] (J. Vallance).
www.elsevier.com/locate/chemgeo
Chemical Geology 194 (2003) 201–224

The decrease in pressure during the As-ore stage corresponds to a significant tectonic uplift (around 5–6 km), and probably
marks the transition from lithostatic to hydrostatic pressure conditions. Furthermore, if uplift had already been initiated during
aplite emplacement, the prevailing sub-isothermal high-temperature conditions provide an explanation for the presence of
decrepitated aqueous-carbonic inclusions in metamorphic quartz lenses and veins in the surrounding metasediments.
To conclude, localised heat flows linked to late Hercynian magmatism at deeper structural levels appears to be the main
cause of fluid circulation at Castromil. Evidence suggests that contact zones related to faulting along a secondary anticline of the
Valongo Belt controlled both aplite intrusion and subsequent long-lived hydrothermal fluid circulation. The proposed genetic
model differs from orogenic gold deposit models in emphasising the role of late stage aqueous fluids in the development of
economic grade (10–15 g/t) gold ores.
D 2002 Elsevier Science B.V. All rights reserved.
Keywords: Fluid inclusions; Gold mineralisation; P–T conditions; Graphitic schists; Aplite; Portugal
1. Introduction
In northwest Iberia, gold deposits occur both in
granites and Palaeozoic metasedimentary rocks. Good
examples of granite-hosted deposits are Penedono and
Grovelas in Portugal and Corcoesto, Tomino and Pino
in Spain (Barakat, 1995; Cathelineau et al., 1993;
Essarraj, 1992; Gonzales Clavijo et al., 1994). Meta-
sediment-hosted deposits are typified by those of the
Valongo and Vila Pouca de Aguiar areas of Portugal
(Couto, 1993; Doria, 1999; Doria et al., 1999; Noro-
nha and Ramos, 1993) (see Fig. 1).
Most of the deposits show remarkable similarities
in paragenesis and ore fluid compositions (Catheli-
neau et al., 1993; Noronha et al., 2000). However, the
rheology of the host rock plays a key role in the
formation of fluid conduits and on the geometry of
these deposits, especially for the early quartz struc-
tures and their subsequent behaviour during deforma-
tion. Host rocks are also possible source reservoirs for
the elements and fluids. The understanding of the
interactions between successive fluids and the host
rocks is essential to reconstruct (i) the evolution of the
P–T–X conditions, and (ii) the transport and deposi-
tion of elements responsible for ore genesis.
Temporal relationships between magmas and gold
mineralisation are often ambiguous particularly
because no precise radiometric ages are available.
However, the existence of gold mineralisation cross-
cutting a Stephanian C coal basin (Alto do Sobrido,
Valongo district) shows that gold deposition occurs
during the latest stage of the Variscan orogeny. The
role of late magmatism is also of great importance, as
magmas are generally considered as a fertile source for
the ore fluids and metals (Lang and Baker, 2001;
Spycher and Reed, 1989; Simmons and Browne,
2000). For the Portuguese deposits, Neiva and Neiva
(1990) and Neiva (1992) suggested a genetic relation-
ship between hydrothermal fluid activity and late-stage
fractional crystallisation of granites. In contrast, Noro-
nha et al. (2000) advocates that the granites are not the
source of the fluids and act only as a heat engine.
The Castromil gold deposit occurs at the margin of
a syn- to late-D3 biotite granite and is spatially
associated to an hectometric tourmaline-bearing aplite
stock which intrudes the granite near its contact with
the Palaeozoic metasedimentary series (Fig. 2). These
metasediments include graphitic schists. The deposit
provides a good example of a close spatial relation-
ship between granite and Au-mineralisation.
The present study concerned the identification of
the percolating ore fluids, their pathways, and the
reconstruction of the P–T–X evolution during ore
formation, in order to decipher the role of granites in
the formation of the Au-ores. A complete character-
isation of the palaeofluid pathways, at each given
stage, has been obtained by combining the geometric
and chronological characteristics of the veins and
microstructures together with a detailed description
of hydrothermal alteration, ore mineralogy and fluid
chemistry.
2. Geological setting
The northwestern part of Portugal is an important
Variscan metallogenic province, particularly for gold,
which has been mined since Roman and pre-Roman
J. Vallance et al. / Chemical Geology 194 (2003) 201–224202
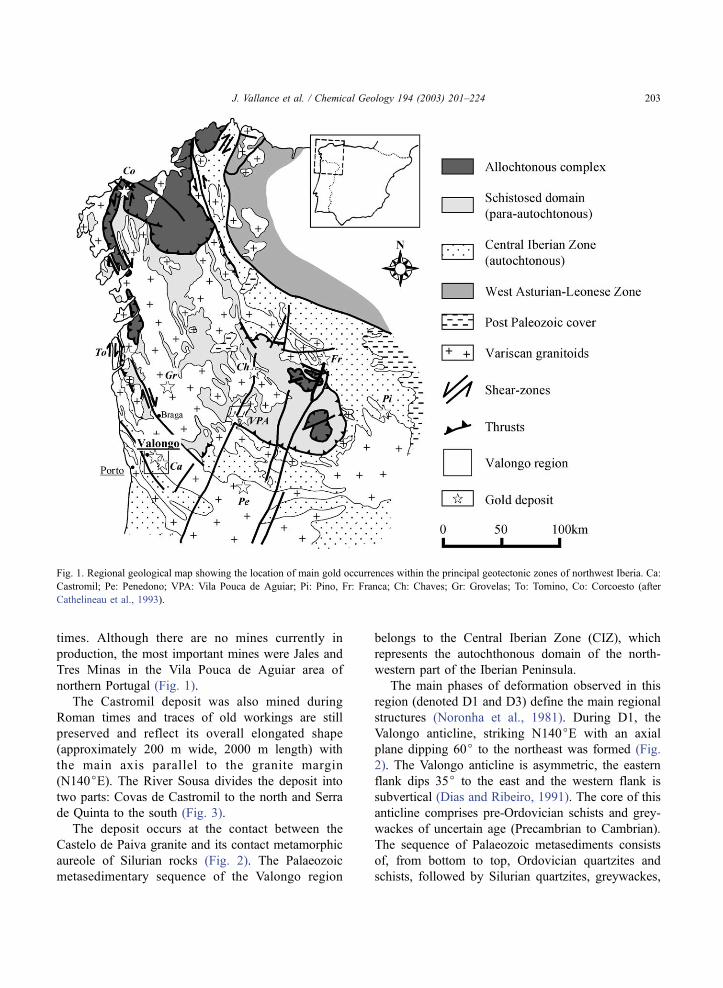
times. Although there are no mines currently in
production, the most important mines were Jales and
Tres Minas in the Vila Pouca de Aguiar area of
northern Portugal (Fig. 1).
The Castromil deposit was also mined during
Roman times and traces of old workings are still
preserved and reflect its overall elongated shape
(approximately 200 m wide, 2000 m length) with
the main axis parallel to the granite margin
(N140jE). The River Sousa divides the deposit into
two parts: Covas de Castromil to the north and Serra
de Quinta to the south (Fig. 3).
The deposit occurs at the contact between the
Castelo de Paiva granite and its contact metamorphic
aureole of Silurian rocks (Fig. 2). The Palaeozoic
metasedimentary sequence of the Valongo region
belongs to the Central Iberian Zone (CIZ), which
represents the autochthonous domain of the north-
western part of the Iberian Peninsula.
The main phases of deformation observed in this
region (denoted D1 and D3) define the main regional
structures (Noronha et al., 1981). During D1, the
Valongo anticline, striking N140jE with an axial
plane dipping 60j to the northeast was formed (Fig.
2). The Valongo anticline is asymmetric, the eastern
flank dips 35j to the east and the western flank is
subvertical (Dias and Ribeiro, 1991). The core of this
anticline comprises pre-Ordovician schists and grey-
wackes of uncertain age (Precambrian to Cambrian).
The sequence of Palaeozoic metasediments consists
of, from bottom to top, Ordovician quartzites and
schists, followed by Silurian quartzites, greywackes,
Fig. 1. Regional geological map showing the location of main gold occurrences within the principal geotectonic zones of northwest Iberia. Ca:
Castromil; Pe: Penedono; VPA: Vila Pouca de Aguiar; Pi: Pino, Fr: Franca; Ch: Chaves; Gr: Grovelas; To: Tomino, Co: Corcoesto (after
Cathelineau et al., 1993).
J. Vallance et al. / Chemical Geology 194 (2003) 201–224 203

lydites, black schists and graphitic schists (Romano
and Diggens, 1973). Devonian arenites and schists,
and Carboniferous rocks (Stephanian B–C coal basin)
outcrop in the western part of the structure. The
Valongo anticline is affected by a D3 brittle ductile
shear zone that strikes parallel to the axial plane.
After D3, the syn- to late-D3 Castelo de Paiva
biotite granite was intruded along the eastern boundary
of the anticline (Fig. 2). Near its contact, the granite
and metasedimentary rocks are crosscut by late aplite
and tourmaline aplite stocks striking N040–050jEand N130–140jE (Fig. 2).
3. Structure and paragenesis
3.1. Structural control
The Castromil gold deposit is separated from the
andalusite schists of the contact aureole (contact
metamorphism of the late D3 granite) to the west by
a late N130jE striking and 70jN dipping fault. The
contact zone can be interpreted as having formed
along the eastern flank of a secondary anticline of
the Valongo Belt. New structural observations made
during this study clearly show that the dip of the
Fig. 2. Geological map of the Valongo area showing the location of Castromil and other gold occurrences (modified from Carta Geologica de
Portugal, Folha 1; Pereira and Ribeiro, 1992).
J. Vallance et al. / Chemical Geology 194 (2003) 201–224204

Fig. 3. Geological map (A) and cross section (B) of Castromil showing the distribution of sample locations referred to in the text.
J. Vallance et al. / Chemical Geology 194 (2003) 201–224 205

schistosity changes from 70j to the west to 70j to eastat about 200 m from the contact zone (Fig. 3).
The fault exhibits early reverse movements. Roof-
pendants of metasedimentary rocks are observed at
the margin of the granite and display similar foliation
and dips to the adjacent schists. To the north, the
granite displays complex inter-fingering relationships
with the metasediments. The aplite is emplaced pri-
marily along the contact zone between the granite and
the metasediments.
Brittle deformation related to fault movement is
responsible for the formation of open structures within
the main fault (stockwork), and on both sides (F 300
m) of the contact in the enclosing granite and meta-
sedimentary rocks. Thus, a specific fracture geometry
is observed in the these formations: low-angle struc-
tures oriented N050–080jE and dipping 30–50j to
the northwest, and associated sets of fractures dipping
50–70j, forming horse tail features.
Maximum hydrothermal alteration is observed
along the main fault (contact zone) in the silicified
breccia and the stockwork zone, which probably
formed in relation with fluid overpressuring. Greise-
nisation is also developed on low-angle structures (a
few tens of meters long, 15–30 cm thick) which
crosscut the intrusive bodies (Fig. 4A). The hydro-
thermal alteration envelope (greisenisation) in the
granitoids defines the maximum extent of the deposit
to the east, whilst the metasediments represents the
western boundary of the ore zone (Fig. 3). Thus,
although subhorizontal quartz–muscovite veins are
locally found in the greywackes, the maximum devel-
opment of alteration is confined to the granitoids.
3.2. Mineralogy
The main zone of hydrothermal mineralisation is
characterised by four main stages.
Fig. 4. Aspects of the mineralisation: (A), typical 20-cm-wide, silicified structure (subvertical outcrop); (B), Q1 quartz stockwork developed in
greisenised aplite; (C), Q3 quartz veinlet crosscutting a Q1 quartz–arsenopyrite (FeAsS)–phengites (Ph) assemblage; (D), gold (Au) in
microfracture sealed by Q3 quartz crosscutting early arsenopyrite (FeAsS).
J. Vallance et al. / Chemical Geology 194 (2003) 201–224206

3.2.1. Stage I: quartz stockwork and related greisens
The stockwork comprises a network of quartz-
filled fractures and microfractures. Quartz (Q1) is
milky and widely developed in the aplite and centi-
metric quartz veins of the silicified structures (Fig.
4B). Plagioclase and K-feldspar in the granite are
replaced by phengites (phengite 1), and the magmatic
quartz grains are partially recrystallised to clear quartz
along their boundaries. Mineralised samples are all
located in the hydrothermally altered zone (eastern
side composed of greisenised granite and aplite),
especially in the main stockwork, but also along the
low-angle structures.
3.2.2. Stage II: As-stage
Re-opening of the preexisting fractures lead to the
re-sealing of the structures and pores by a new
generation of quartz (Q2) in the stockworks and
silicified structures. It is accompanied by pyrite,
arsenopyrite and phengite (phengite 1). Locally, large
quantities of sulphides are developed (more than 1 m
thick bodies of massive pyrite–arsenopyrite without
quartz are locally observed).
3.2.3. Stage III: Au-stage
Gold, in association with bismuth minerals, galena
and minor phengites (phengite 3), is linked to a third
stage of quartz deposition (Q3) that forms millimetric
veinlets crosscutting and/or brecciating all former
structures. Gold is observed as electrum in Q3 frac-
tures (breccia cement) affecting pyrite and arsenopyr-
ite formed during the preceding stage (Fig. 4C and D).
Quartz Q1 represents the main infilling of the frac-
tures. By comparison, quartz Q2 and Q3 are insignif-
icant, implying a reduced supply of silica to the
system.
3.2.4. Stage IV: post-ore stage
Late normal movements, attesting to a late exten-
sional event, reflect the long-lived tectonic activity of
the fault, as shown by the crystallisation of euhedral
quartz combs (geodic quartz Q4) on both sides of the
opened structures. This event appears to be unrelated
to the main hydrothermal system, and can be consid-
ered as a post-ore stage.
In the metasediments, several metamorphic quartz
veins were sampled: (i) 10- to 20-cm-long and 5-cm-
thick quartz lenses concordant with the foliation, and
(ii) 2- to 10-cm-thick (red to purple coloured) quartz
veins that crosscut the foliation. These veins show a
complex history, with reverse and normal movements.
Graphite is present in the metamorphic quartz (Qm),
giving it a greyish aspect under the microscope.
4. Methods
Fluid evolution has been studied by looking at
relationships between fluid inclusions, their host min-
eral, the geometry of the host microstructures and the
location of ore minerals, in quartz veins and in quartz
grains from the host rocks. Geometry of the palae-
ofluid channelways has been investigated through the
characterisation of fluid inclusions with respect to the
deformation chronology, following the procedure of
Boiron et al. (1992).
Sampling along profiles was carried out across the
mineralised zones. For each sample, horizontal and
vertical sections were prepared for macroscopic obser-
vation of the textures. From these, oriented blocks
were then chosen for the preparation of oriented thin
sections and wafers. The geometry and chronology of
fluid migration was investigated by combining macro-
scopic observations of oriented horizontal and vertical
planes and transmitted light microscopy observations
on oriented thin sections. Quantification of the abun-
dance and the geometric characteristics of each
marker were carried out using a systematic and
statistical analysis of the microstructural markers in
horizontal and oriented planes. Systematic measure-
ment of the microfissures was carried out in each
section using an interactive videographic analyzer
adapted to such studies (Nogueira and Noronha,
1995). Results are given in the form of rose diagrams,
which take into account either the cumulative number
or the cumulative length of cracks in a given direction.
Frequencies have been distinguished for each angular
section from 0 to 180j.Typology and petrography of the fluid inclusions
was carried out on orientated wafers from representa-
tive samples of the host rocks and quartz veins. Fluid
inclusions have been related to the different stages of
fluid percolation on the basis of the relative chronol-
ogy of mineral assemblages and microstructures.
Notation of the fluid inclusion types follows nomen-
clature previously published (Boiron et al., 1992),
J. Vallance et al. / Chemical Geology 194 (2003) 201–224 207

which takes into account the nature of the dominant
chemical phases and phase changes observed. It is
based on the total homogenisation Th (L–V to the
vapour noted V, L–V to the liquid noted L) and the
quantity of C–H–O–(N–S) species detectable by
Raman spectroscopy (subscript c, when C–H–O–S
species are the only components and water is not
visible; c-w, when water and homogenisation of
carbonic phase are observable; w-c, when both water,
CO2, CH4 and N2 species are present but are detected
only by clathrate melting and Raman spectroscopy;
and w, when C–H–O– (N–S) species are not
detected by any methods).
Microthermometric characterisation of the fluids
was performed on wafers using a Chaix-Meca heat-
ing–freezing stage (Poty et al., 1976) and a Fluid Inc.
stage. Molar fractions of CO2, CH4, N2 and H2S were
determined in individual fluid inclusions using a
DILOR-LABRAM Raman spectrometer at CREGU,
Nancy. Molar fraction of NaCl, molar volume, bulk
composition and P–T parameters were determined by
combining results from microthermometry and
Raman analysis. Bulk composition and molar volume
were computed from the P–V–T–X properties of
individual inclusions in the C–O–H–S system
(Dubessy, 1984; Dubessy et al., 1989; Thiery et al.,
1994, Bakker, 1997). The P–T properties were mod-
elled using the V–X data and the equation of state
from Bowers and Helgeson (1983) revised by Bakker
(1999) for aqueous-carbonic fluid inclusions. For
aqueous fluids, data from Zhang and Frantz (1987)
for the H2O–NaCl system have been used.
5. Fluid characterisation
5.1. Microthermometry and Raman spectroscopy
5.1.1. The aqueous-carbonic fluids
These occur in all types of quartz, as fluid inclu-
sion planes (FIP) in the host rocks, and as primary
inclusions in quartz Q1 and Q2 (Table 1). They are of
moderate salinity (1–10 wt.% eq. NaCl) but variable
in composition. Minimum trapping temperatures
range from 300 to 400 jC.
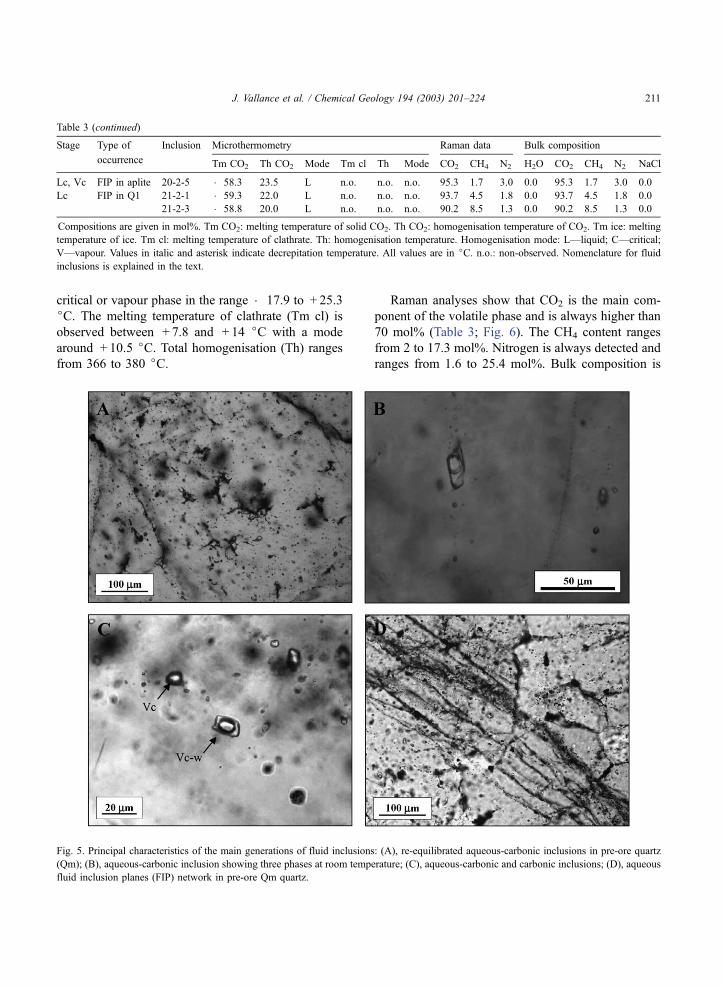
5.1.1.1. Metamorphic quartz lenses. Aqueous-car-
bonic fluid inclusions (Tables 2 and 3) are the
predominant inclusions in the metamorphic quartz
lenses and veins (Qm) veins, and in quartz grains
from the metasediments (greywackes). These fluid
inclusions generally contain graphite inclusions
where the lenses are spatially associated with graph-
itic schists. They show also abundant decrepitation
textures (highly irregular, dendritic textures (Fig.
5A)) that indicate re-equilibration processes (Vityk
and Bodnar, 1995). Decrepitation may also be a
consequence of granite and aplite intrusion since
these inclusions are observed in the contact aureole.
Such fluid inclusions show strong volatile/water
ratio variability; the volatile phase representing
30–100% of the fluid inclusion volume. The melt-
ing temperature of CO2 (Tm CO2) ranges from
� 63.8 to � 58.2 jC with two modes around
� 61.5 and � 58.5 jC. The homogenisation of
the volatile phase (Th CO2) occurs to the liquid,
Table 1
Summary of the relationships between deformation, mineralisation, quartz types and fluid stages at Castromil
Tectonic/deformation/magmatism Quartz-type alteration Ore minerals Fluids
Retrograde
metamorphism
Qm Aqueous-carbonic
fluids
Granite intrusion and contact
metamorphism
Aplite intrusion Greisenisation Aqueous-carbonic
fluids
Stockwork formation Recrystallisation of
magmatic quartz
Phengite 1
Q1–phengite 2 Aqueous-carbonic
Brecciation Q2 FeS2–FeAsS fluids
Q3–phengite 3 Au–PbS–Bi minerals Aqueous fluids
Microfissuration/recrystallisation Q4 Aqueous fluids
J. Vallance et al. / Chemical Geology 194 (2003) 201–224208

Table 2
Summary of fluid inclusion types and associated mineral assemblages from the Castromil deposit with indication of the microthermometric data
Stage Fluid inclusions Microthermometric data
Habitus Type Tm CO2 (jC) Th CO2 (jC) Tm ice (jC) Tm cl (jC) Th (jC)
Quartz veins and lenses (Qm)
in the metasedimentary rocks
Secondary Vc-w, Lc � 63.8/� 58.2
(� 61.5 and � 58.5)
� 17.9/25.3 L,
C or V
7.8/14 (10.5) 366/380
Greisen stage Secondary in host
granite and aplite
L or Vc-w � 63.5/� 57.2
(� 59)
13.5/29 L,
C or V
4.8/9.3 (7) 322/405
(370)
As-ore stage
(arsenopyrite, pyrite)
Secondary in host
granite, primary and
secondary in Q1
primary in Q2
L or Vc-w, Lc, Vc � 68.7/� 57.3
(� 68 and � 58)
1/28 L,
C or V (19)
5/11.4 (9.5) 284/365
(340)
Au-ore stage Secondary in host
granite, primary in Q3
Lw � 8.2/� 0.1 100/300
(210)
Post-ore stage Primary in Q4, secondary
in host granite
Lw � 11.5/� 7.2 175/250
(170)
For each microthermometric parameter, ranges and mode (in parenthesis) are given. Tm CO2: melting temperature of solid CO2. Th CO2: homogenisation temperature of CO2.
Tm ice: melting temperature of ice. Tm cl: melting temperature of clathrate. Th: homogenisation temperature. Homogenisation mode: L—liquid; C—critical; V—vapour;
D—decrepitation. All values are in jC. Nomenclature for fluid inclusions is explained in the text.
J.Valla
nce
etal./Chem
icalGeology194(2003)201–224
209

Table 3
Chemical compositions obtained by Raman microprobe spectrometry of selected fluid inclusions and corresponding microthermometric data,
from the Castromil deposit
Stage Type of Inclusion Microthermometry Raman data Bulk composition
occurrence Tm CO2 Th CO2 Mode Tm cl Th Mode CO2 CH4 N2 H2O CO2 CH4 N2 NaCl
Vc-w Quartz veins 4-1 � 61.9 9.2 L 11.4 350* V 80.7 17.3 2.0 58.1 33.2 6.8 0.8 1.1
and lenses in 4-3 � 61.0 9.4 L 10.7 366 V 80.6 17.2 2.2 58.3 32.9 6.7 0.9 1.2
the meta- 4-5 � 63.8 n.o. n.o. 10.4 350* V 85.9 2.6 11.5 87.4 10.9 0.2 1.1 0.4
sedimentary 39-2 � 58.7 22.9 L 8.6 380* V 96.4 2.0 1.6 14.0 82.8 1.7 1.3 0.2
rocks (Qm) 39-3 � 58.8 22.4 L 9.0 380 V 92.4 5.3 2.3 62.9 33.7 1.8 0.8 0.8
39-16 � 58.2 21.2 L 7.8 380* V 95.0 2.0 3.0 44.2 52.6 1.1 1.6 0.5
Lc 39-5 � 61.4 � 16.9 L n.o. n.o. n.o. 75.6 1 23.4 0.0 75.6 1 23.4 0.0
39-6 � 60.8 � 9 L n.o. n.o. n.o. 73.6 1 25.4 0.0 73.6 1 25.4 0.0
39-19 � 60.6 � 10.4 L n.o. n.o. n.o. 74.2 1 24.8 0.0 74.2 1 24.8 0.0
Greisen stage FIP in granite 25-2 � 58.4 25.0 L 6.4 320* L 95.5 3.0 1.5 82.7 14.6 0.4 0.2 2.1
(Lc-w, Vc-w) 25-3 � 58.3 25.0 L 6.6 320* L 94.8 3.2 2.0 80.8 16.4 0.5 0.3 2.0
25-12 � 58.3 24.5 L 7.1 350 L 94.9 3.3 1.8 81.1 16.4 0.5 0.3 1.8
FIP in 11-2-1 � 57.4 25.5 V 6.8 322 L 95.7 1.8 2.5 89.0 8.7 0.1 0.2 2.0
greisenised 11-2-9 � 58.2 26.2 V 5.3 330* L 98.8 0.6 0.6 84.0 13.2 0.1 0.1 2.6
granite 11-2-8 � 58.3 28.8 V 4.8 382 C 97.6 0.7 1.7 84.5 12.3 0.1 0.2 2.9
FIP in aplite 26-15 � 57.6 24.5 C 7.6 306 L 94.8 1.4 3.8 88.8 9.2 0.1 0.3 1.6
26-18 � 57.2 27.5 L 5.5 400 L 97.4 1.6 1.0 74.5 22.7 0.3 0.2 2.3
26-12 � 57.4 28.0 L 5.5 405 L 97.1 1.6 1.3 75.1 22.0 0.3 0.3 2.3
26-2-2 � 57.8 13.5 L 5.8 305* V 96.7 1.5 1.8 39.0 57.8 0.9 1.1 1.2
26-2-3 � 57.5 27.0 L 7.1 305* V 96.3 1.7 2.0 34.8 62.0 1.1 1.3 0.8
As-ore stage FIP in granite 27-6 � 61.2 3.6 V 5.0 374* L 75.0 21.1 3.9 88.5 6.2 1.1 0.2 4.0
(Lc-w, Vc-w) 27-4-2 � 59.2 12.4 C 9.3 255* L 84.7 11.5 3.8 81.7 14.7 1.7 0.6 1.3
27-2 � 63.5 1.0 V 7.6 300* V 71.9 23.8 4.3 83.9 9.8 2.6 0.5 3.3
27-9 � 60.0 2.6 V 5.5 300* V 73.8 21.7 4.5 70.7 19.9 5.3 1.1 3.0
47-2 � 68.7 n.o. n.o. 10.5 335 V 49.3 42.0 8.7 87.1 6.8 4.4 0.9 0.8
47-3 � 67.7 n.o. n.o. 9.6 336* V 46.1 46.0 7.9 87.6 6.0 4.5 0.8 1.1
47-6 � 66.8 n.o. n.o. 8.8 336* V 40.0 50.0 10.0 89.3 4.3 3.7 0.8 1.9
FIP in aplite 24b-9 � 59.8 16.7 V 8.4 365 L 86.7 7.7 5.6 90.9 7.6 0.4 0.3 0.8
24b-13 � 60.7 9.3 V 9.0 365 L 75.6 15.8 8.6 85.0 10.6 1.8 1.0 1.6
10-1-5 � 59.4 2.9 V 9.4 362 L 76.9 21.7 1.4 94.5 4.7 0.5 0.1 0.2
10-1-1 � 59.7 3.3 V 10.8 331 L 79.5 16.2 4.3 93.8 5.2 0.6 0.2 0.2
20-1-4 � 57.7 17.5 V 9.1 336* L 83.0 12.1 4.9 90.7 7.8 0.8 0.3 0.4
20-1-3 � 60.7 17.5 V 8.1 379 L 85.3 12.4 2.3 89.7 8.0 0.8 0.2 1.3
26-2-1 � 57.5 26.0 V 7.1 305* V 95.8 1.8 2.4 27.6 68.8 1.3 1.7 0.6
20-8 � 58.2 n.o. n.o. 7.3 373 C 90.9 7.0 2.1 83.2 13.8 0.9 0.3 1.9
20-2-3 � 57.7 26.0 V n.o. n.o. n.o. 94.6 4.0 1.4 80.1 17.3 0.6 0.2 1.8
FIP in Q1 21-1-1 � 58.7 18.8 C 9.0 343 L 87.5 11.1 1.4 91.5 7.1 0.6 0.1 0.7
21-1-2 � 58.4 20.0 C 8.6 353 L 88.4 10.5 1.0 91.0 7.3 0.6 0.1 1.0
21-1-3 � 58.6 19.5 C 8.6 357 C 86.8 12.5 0.7 88.3 9.6 1.0 0.1 1.0
21-1-5 � 58.4 19.0 V 9.4 275* L 81.1 18.2 0.7 89.4 9.3 0.8 0.1 0.4
21-1-6 � 59.0 13.0 V 9.6 355 C 83.3 16.0 0.7 90.8 7.7 1.2 0.05 0.25
21-1-8 � 58.2 19.5 C 9.0 345 L 88.4 10.2 1.3 90.9 7.7 0.6 0.1 0.7
32c-3 � 58.2 19.7 V 9.4 312 L 88.2 8.7 3.1 89.3 9.0 0.6 0.2 1.1
32c-7 � 57.8 18.0 V 8.8 321 L 92.2 5.3 2.5 89 9.3 0.4 0.2 1.1
32c-5 � 57.5 18.5 V 9.8 284 L 90.9 7.0 2.1 89.5 9.6 0.6 0.1 0.2
21-4 � 58.5 19.5 V 8.6 360 C 88.3 10.5 1.2 88.8 8.8 0.8 0.1 1.5
21-7 � 59.0 14.7 V 9.4 343 L 84.7 14.1 1.2 88.3 8.9 1.1 0.1 1.6
21-2-4 � 58.4 22.5 L 6.8 345 V 93.1 5.5 1.4 43.7 51.3 3.0 0.7 1.3
21-2-5 � 58.5 22.5 L 6.6 341 V 92.2 6.3 1.4 42.5 51.8 3.5 0.8 1.4
Lc, Vc FIP in aplite 20-2-2 � 57.7 26.0 L n.o. n.o. n.o. 95.7 2.7 1.6 0.0 95.7 2.7 1.6 0.0
20-2-4 � 57.5 26.0 V n.o. n.o. n.o. 95.7 1.6 2.7 0.0 95.7 1.6 2.7 0.0
J. Vallance et al. / Chemical Geology 194 (2003) 201–224210
critical or vapour phase in the range � 17.9 to + 25.3
jC. The melting temperature of clathrate (Tm cl) is
observed between + 7.8 and + 14 jC with a mode
around + 10.5 jC. Total homogenisation (Th) ranges
from 366 to 380 jC.
Raman analyses show that CO2 is the main com-
ponent of the volatile phase and is always higher than
70 mol% (Table 3; Fig. 6). The CH4 content ranges
from 2 to 17.3 mol%. Nitrogen is always detected and
ranges from 1.6 to 25.4 mol%. Bulk composition is
Table 3 (continued)
Stage Type of Inclusion Microthermometry Raman data Bulk composition
occurrence Tm CO2 Th CO2 Mode Tm cl Th Mode CO2 CH4 N2 H2O CO2 CH4 N2 NaCl
Lc, Vc FIP in aplite 20-2-5 � 58.3 23.5 L n.o. n.o. n.o. 95.3 1.7 3.0 0.0 95.3 1.7 3.0 0.0
Lc FIP in Q1 21-2-1 � 59.3 22.0 L n.o. n.o. n.o. 93.7 4.5 1.8 0.0 93.7 4.5 1.8 0.0
21-2-3 � 58.8 20.0 L n.o. n.o. n.o. 90.2 8.5 1.3 0.0 90.2 8.5 1.3 0.0
Compositions are given in mol%. Tm CO2: melting temperature of solid CO2. Th CO2: homogenisation temperature of CO2. Tm ice: melting
temperature of ice. Tm cl: melting temperature of clathrate. Th: homogenisation temperature. Homogenisation mode: L—liquid; C—critical;
V—vapour. Values in italic and asterisk indicate decrepitation temperature. All values are in jC. n.o.: non-observed. Nomenclature for fluid
inclusions is explained in the text.
Fig. 5. Principal characteristics of the main generations of fluid inclusions: (A), re-equilibrated aqueous-carbonic inclusions in pre-ore quartz
(Qm); (B), aqueous-carbonic inclusion showing three phases at room temperature; (C), aqueous-carbonic and carbonic inclusions; (D), aqueous
fluid inclusion planes (FIP) network in pre-ore Qm quartz.
J. Vallance et al. / Chemical Geology 194 (2003) 201–224 211

characterised by a H2O content in the range of 0 to 87
mol%, a CO2 content between 11 and 83 mol%, a
CH4 content of 0.2 to 6.8 mol% and N2 from 0.8 to 25
mol%. NaCl is in the range 0.2 to 1.2 mol%.
5.1.1.2. Greisens. The aqueous-carbonic fluid inclu-
sions (Tables 2 and 3) occur as fluid inclusion planes
(FIP) in the magmatic quartz of the granitoids or as
primary inclusions in quartz Q1 from the greisen
zone. The volatile phase represents 30–60% of the
inclusion volume (Fig. 5B). Tm CO2 ranges from
� 63.5 to � 57.2 jC with a mode around � 59 jC.Th CO2 (to the liquid or vapour phase) is from + 13.5
to + 29 jC, Tm cl is from + 4.8 to + 9.3 jC with a
Fig. 6. Volatile geochemistry of the aqueous-carbonic inclusions. (A) CO2–CH4–N2 ternary plot; (B) CO2 content versus density of the volatile
phase; (C) H2O content versus CO2/CH4 ratio; (D) H2O content versus minimum trapping temperature (Th).
J. Vallance et al. / Chemical Geology 194 (2003) 201–224212

mode at + 7 jC, Th is from 322 to 405 jC, with a
mode around 370 jC.The volatile phase is dominated by CO2 (95 to 99
mol%), with variable amounts of CH4 (0.6–3.3
mol%) and N2 (0.6–3.8 mol%) (Table 3; Fig. 6).
Bulk compositions show a H2O content ranging from
34.8 to 89 mol%, CO2 content from 8.7 to 62 mol%, a
CH4 content of 0.1 to 1.1 mol% and N2 content
ranging from 0.1 to 1.3 mol%. NaCl is in the range
0.8 to 2.9 mol%.
5.1.1.3. As-ore stage. Aqueous-carbonic inclusions
occur as primary fluid inclusions in the Q2 quartz, and
as FIP in the former quartz (Tables 2 and 3). Fluid
inclusions show two, more rarely three, phases at
room temperature (liquid H2O, vapour CO2F liquid
CO2). The volatile phase represents 30 to 100% of
the inclusion volume (Fig. 5C). Tm CO2 ranges from
� 68.7 to � 57.3 jC with two modes around � 68 jCand � 58 jC. Th CO2 (liquid, vapour or critical) is
from + 1 to + 28 jC, Tm cl is from + 5 to + 11.4 jCwith a mode at + 9.5 jC, Th is from 284 to 373 jC,with a mode around 340 jC.
The composition of the volatile phase is highly
variable with CO2 content ranging from 40 to 96
mol%, variable amounts of CH4 (1.5–50 mol%) and
N2 (0.7–10 mol%) (Table 3). Traces of H2S (up to 0.1
mol%) have been detected in some fluid inclusions.
Bulk composition is characterised by a H2O content
ranging from 27.6 to 94.5 mol%, CO2 content
between 4.3 and 68.8 mol%, a CH4 content of 0.4
to 5.3 mol%, and N2 contents ranging from 0.1 to 1.7
mol%. NaCl is in the range 0.2 to 4 mol%.
5.1.2. Bulk chemistry of aqueous-carbonic fluids
The aqueous-carbonic fluids from metamorphic
quartz lenses are heterogeneous populations charac-
terised by a volatile phase dominated by CO2, and
highly variable methane and N2 contents (Fig. 6A and
C) and bulk densities. They result probably from
series of trapping events under different conditions.
The density of the volatile phase is however relatively
high and ranges from 0.5 to 0.8 g�cm� 3, except for
one inclusion which shows a low density of 0.23
g�cm� 3 (Fig. 6B). Some inclusions in Qm, from a
quartz vein crosscutting greywakes, are characterised
by important amounts of N2 (up to 25 mol%) and a
low content of CH4 ( < 3 mol%). On other hand, lower
density aqueous-carbonic inclusions from a quartz
veinlet crosscutting graphitic schists show inclusions
with significant CH4 and N2 contents ranging from 21
to 37 mol% and 2 to 17 mol%, respectively, plus
graphite inclusions. Such gas contents demonstrate
that graphitic lithologies produced significant
amounts of CH4 during thermal events.
The aqueous-carbonic fluids from the greisen
zones are characterised by high CO2 (up to 95
mol%) and CH4 and N2 contents, which are signifi-
cant but lower than in the metasediments. The density
of the volatile phase shows two groups of inclusions
(Fig. 6B): (i) those displaying the highest density
(0.6–0.8 g�cm� 3), which are considered as fluid
inclusions trapped at relatively high pressure, and
(ii) fluids having the lowest density (0.25–0.4
g�cm� 3), which are indicative of a pressure decrease.
The latter show a slight enrichment in CH4 and N2. It
is interesting to note that these two groups of fluids
display important variations in their CO2/CH4 and
CO2/N2 ratios. The highest CO2/CH4 ratios corre-
spond to the greisenised zone where fluid circulation
has been more intense.
The aqueous-carbonic fluids from the As-ore stage
are characterised by high CH4 contents (up to 50%),
although in most cases, CO2 remains the dominant
species. Secondary Vc-w inclusions in quartz from the
granite display a strong enrichment in CH4 (40–50
mol%) and a noticeable N2 content (8–10 mol%).
These fluids show an evolution of the volatile phase
and their content from those with relatively high
values (around 0.70 g�cm� 3) and a high CO2 content
to those which are enriched in CH4 and displaying
low density (0.11 g�cm� 3) (Fig. 6B). Considering the
H2O content and the CO2/CH4 ratio (Fig. 6C), two
end-members can be identified. Fluids without water
show the highest variation in the CO2/CH4 content
(10 to 60). Unmixing process could probably explain
such variations in their composition, without signifi-
cant variation in minimal trapping temperatures.
The significant CH4 content in fluids percolating
the granitoids can be explained by the presence of
graphitic schists roof-pendants such as it has been
observed near the border of the granitic massif. Thus,
the presence of metasediments rich in graphite plays a
major role in the chemistry of the aqueous-carbonic
fluids. Fluids associated with hydrothermal circulation
(As-ore stage) contain higher amounts of water than
J. Vallance et al. / Chemical Geology 194 (2003) 201–224 213

the previous ones. However, this group of fluid dis-
plays noticeable variations in their H2O content and in
their bulk density.
5.2. The aqueous fluids
Aqueous fluid inclusions (Au-ore stage) are
observed in FIP (Fig. 5D) in all types of quartz
except Q4, and as rare primary inclusions in Q3
(Table 1). Melting temperature of ice (Tm ice) is in
the range of � 8.2 to � 0.1 jC. Th (to the liquid
phase) is observed between 100 and 300 jC (Table
2).
Aqueous fluid inclusions related to the post-ore
stage occur as FIP in metamorphic quartz lenses. A
solid remaining present at high temperature (up to
300 jC) is currently observed in these inclusions,
and considering its rhombohedral shape is assumed
to be a carbonate. Thus, these fluids are probably the
last to circulate in the study area. Tm ice ranges
from � 11.5 to � 7.2 jC. Minimal trapping temper-
atures (Th) are in the range 175–250 jC (Table 2).
Primary inclusions in quartz comb Q4 are low-
salinity fluids and characterised by low Th below
200 jC (Fig. 7).
The Th–salinity diagram (Fig. 7) shows that Au-
ore stage aqueous fluids display a large range of
salinity from 0 to 12 wt.% eq. NaCl with fluid salinity
decreasing with decreasing Th. The dilution process is
well defined in FIPs oriented N030–060jE and
N130–140jE, and probably indicates mixing between
two end-members, a saline (10–12 wt.% eq. NaCl)
and a dilute fluid.
6. Geometry of the fluid pathways and
microfracturing
Systematic measurements of FIP direction were
performed on oriented samples in order to reconstruct
the fluid pathways. Three main domains are distin-
guished: the granitic domain to the east, the mineral-
ised zone and the metamorphic host rocks in the
southwestern part of the study area (Fig. 8). FIPs
show three principal directions: N030–060jE,N170–010jE and N130–140jE set (Figs. 8 and 9).
However, their relative abundance varies from domain
to domain. The N030–060jE direction is typical of
the mineralised zone (Figs. 8 and 9). The N170–
010jE direction is well represented in all three
Fig. 7. Homogenisation temperature (Th) versus salinity for the Castromil fluids showing the mixing of saline fluids and cooler dilute fluids
during the ore stage. (FI—fluid inclusion; shaded area corresponds to area of aqueous-carbonic fluids).
J. Vallance et al. / Chemical Geology 194 (2003) 201–224214

domains. The N130–140jE is minor but better devel-
oped in the mineralised zone and the metamorphic
rocks.
The abundance of aqueous-carbonic fluid inclusions
related to the greisen and As-ore stages is important in
the mineralised zone and, to a lesser degree, in the host
metamorphic rocks. In contrast, they are rare in the
granite domain attesting a preferential percolation of
these fluids along the granite boundary.
Petrographic examination of FIP content does not
show, however, any preferential directions for a cer-
tain type of fluid, implying that the same direction of
microfracture was used at several stages of fluid
percolation, The N030–060jE direction, typical of
the mineralised area, corresponds to the orientation
of the silicified structures (Fig. 4A) formed during
the earlier stage (Stage I), showing that the FIP
directions reflect the macroscopic fracture network
at the deposit scale. Macroscopic fractures initiated
during an earlier percolation event could strongly
influence the orientation of the associated FIP.
Consequently, FIP directions do not reflect directly
Fig. 8. Orientation of fluid inclusion planes (FIP) in the metasedimentary rocks, mineralised area and host granite.
J. Vallance et al. / Chemical Geology 194 (2003) 201–224 215
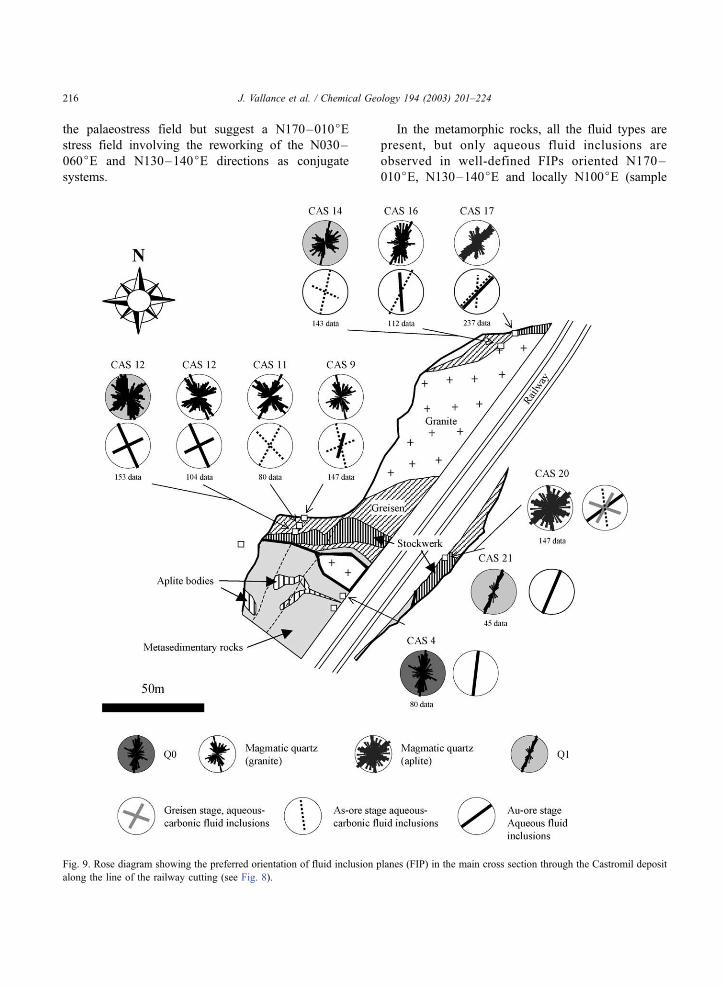
the palaeostress field but suggest a N170–010jEstress field involving the reworking of the N030–
060jE and N130–140jE directions as conjugate
systems.
In the metamorphic rocks, all the fluid types are
present, but only aqueous fluid inclusions are
observed in well-defined FIPs oriented N170–
010jE, N130–140jE and locally N100jE (sample
Fig. 9. Rose diagram showing the preferred orientation of fluid inclusion planes (FIP) in the main cross section through the Castromil deposit
along the line of the railway cutting (see Fig. 8).
J. Vallance et al. / Chemical Geology 194 (2003) 201–224216

Cas 37) (Fig. 8). In the mineralised area, greisen fluids
are observed in the N030–060jE and N130–140jEdirections (Fig. 9). As-ore fluids (Stage II) are present
in N170–010jE, N030–060jE and, to a lesser
degree, in N130–140jE direction. Aqueous fluids
(Au-ore stage) are observed in N170–010jE and
N030–060jE directions. In the granite, the major
direction of fluid percolation is N170–010jE but
locally N030–060jE.
7. P–T reconstruction
Representative isochores were calculated for each
type of fluid by combining results from microther-
mometry and Raman analysis. The derived chrono-
logical reconstruction is shown on a pressure versus
temperature plot (Fig. 10). Maximum estimates to be
considered (Fig. 10) are (i) peak metamorphic con-
ditions (450 jC and 400 MPa; Guedes, 2001), and (ii)
the high temperature– low pressure metamorphism
associated with the emplacement of late to post-
tectonic granites (300–350 MPa and 500–550 jC;Noronha et al., 2000).
7.1. Greisen stage
The highest densities observed are those of the
aqueous-carbonic fluids trapped in FIPs in magmatic
quartz of the aplite. Microthermometric measurements
yield minimal trapping temperature around 400 jCand minimal trapping pressure in the range 210–240
MPa. Considering the isochores and a trapping in the
range 400–500 jC, a pressure of 230–300 MPa is
inferred (i.e. slightly below contact metamorphism
conditions). These high fluid pressures imply a trap-
Fig. 10. Pressure– temperature reconstruction of conditions prevailing during the pre-ore and main stages of mineralisation. P–T reconstruction
is based on representative isochores, petrographic, microthermometric and Raman data. Indicates that the upper boundary for temperatures is
unknown and not constrained by mineral assemblages.
J. Vallance et al. / Chemical Geology 194 (2003) 201–224 217

ping under lithostatic conditions, corresponding to a
depth of around 10F 1.5 km.
7.2. As-ore stage
Fluids displaying the highest pressures (150–220
MPa) for temperatures in the range 400–500 jC are
those containing the lowest water contents. These
fluids, observed in Q1 quartz, probably record litho-
static pressures after the sealing of the fracture system
related to the stockwork formation. Some inclusions
show much lower volatile phase densities and lower
trapping pressures (100–200 MPa) for temperature of
400–500 jC (Fig. 10). These estimates attest to a
pressure decrease during uplift. Therefore, between
Stages I and II, there is a pressure drop of >150 MPa
but a cooling of < 50 jC. Considering the structural
level during the Stage I (10F 1.5 km), the pressure
drop cannot be explained simply by a change from
lithostatic to hydrostatic regime but implies an uplift
of the basement from 10F 1.5 to 4–5.5 km, with a
change from lithostatic to hydrostatic conditions.
Even for this case, the thermal gradients are very high
(70 jC/km) and indicate a very rapid uplift of the
basement and/or the presence of magma intrusions at
shallow levels acting as strong heat engines. The
aplite body may represent an early pre-hydrothermal
witness of this late magmatism.
7.3. Consequence of pressure drop
Unmixing of the aqueous-carbonic fluids in
response to a pressure drop is only partially recorded.
Minimum trapping temperatures for inclusions having
the lowest density are in the range 285–365 jC. Ifone considers the intersection of isochores and corre-
sponding isopleths, the minimum trapping temper-
ature is less than 370 jC for pressures higher than
50 MPa (Fig. 10). During stockwork formation,
certain fluid inclusion associations can be attributed
to unmixing. Thus, in the same quartz (Q1), inclusions
with no visible water (carbonic liquids, Lc) and water-
rich aqueous-carbonic vapours (Vc-w) display similar
volatile composition (inclusion 21-2-1 to 21-2-5,
Table 3). The occurrence of carbonic liquids followed
by carbonic vapours (Vc), apparently free of water,
can be interpreted as the result of unmixing at
decreasing pressure down to 40–50 MPa. The latter
estimates imply a hydrostatic regime at such temper-
atures to be compatible with a realistic geothermal
gradient (hydrostatic gradient, 70 jC/km).
7.4. Fluid mixing during Au-ore stage
Aqueous fluids associated with Q3 quartz and gold
have minimum trapping temperatures in the range
100–270 jC. Pressures could be similar or lower
than those of the preceding stage, in the absence of
a burial event (Fig. 10). Trapping temperatures are
slightly above Th (150–280 jC), thus confirming the
cooling and dilution process described above, and
differ by about 200 jC from the preceding stage
without any apparent change in pressure (i.e. at a
similar depth).
8. Origin of fluids: isotope geochemistry of quartz
The 18O/16O ratios were measured on separated
quartz chips (down to ca. 1.5 mg) extracted from fluid
inclusion wafers. The analytical procedure follows the
conventional fluorination method of Clayton and
Mayeda (1963) and is given, with related uncertain-
ties, in Essarraj et al. (2001).
A summary of the d18O data (with respect to
SMOW) is presented in Table 4. The metamorphic
quartz (samples CAS 37, CAS 22 and CAS 4) shows a
d18O value ranging from 15.3xto 17.1x. Q1, Q2,
Q3 quartzes display similar ranges of d18O values:
14.1–15.1x, 14.45xand 14.2–14.8x, respec-
tively. Late geodic Q4 quartz shows d18O values
ranging from 15.5xto 11.6x.
From the preceding section, we know that the
likely deposition temperatures for the successive
quartz generations are the following: metamorphic
Qm, 475F 25 jC; milky Q1 and Q2, 425F 25 jC;Q3, 225F 25 jC; and comb quartz Q4, 190F 10 or
140F 40 jC depending of the sample. Using the
quartz–H2O fractionation curve of Zheng (1993),
the d18O values of the corresponding hydrothermal
fluids were estimated, with the following results:
(i) The metamorphic quartz was deposited from a
CO2-bearing fluid with a d18O water component
of between 11.6xand 14.6x. These values
fix the composition of the metamorphic fluids in
J. Vallance et al. / Chemical Geology 194 (2003) 201–224218

the Castromil area. The upper end of the range
suggests isotopic equilibration with a crustal
reservoir containing metasediments.
(ii) The milky Q1 and Q2 quartzes crystallised from a
CO2-bearing fluid with a d18O water component
ranging from 9.6xto 11.4x. Likewise, these
values indicate a fluid that has equilibrated with
basement lithologies such as granitoids (e.g.
Kerrich, 1987).
(iii) Interpretation of the Q3 quartz data is less simple.
These values may have been inherited from older
quartz that did not re-equilibrate with fluids
active during gold deposition (Stage III). Mor-
phology and FI data, however, argue to the
contrary. Q3 quartz was mostly neoformed during
this stage. In this context, Q3 quartz was
deposited from an aqueous fluid with a d18Ocomposition of between 3.2xand 5.8x,
which records a significant depletion in d18O.As discussed in Boiron et al. (2002), the
magnitude of such depletion cannot be attributed
to CO2–H2O unmixing, which is neither identi-
fied as a major process in the Castromil example
nor in most other Variscan gold deposits. In
theory, metamorphic fluids that have equilibrated
with the same type of basement at lower temper-
atures could account for these values. Never-
theless, we favour an interpretation calling for the
input of an isotopically lighter fluid in the system,
since the fluid inclusion data document a process
of mixing between relatively saline fluids and a
dilute end-member. The shift towards values of
4.5F 1.5 could be compared to that already
inferred for gold stage fluids in other deposits
from the Hercynian belt (Laurieras, for instance,
Essarraj et al., 2001).
(iv) Late comb quartz Q4. One sample, from a
N170F 20jW joint (CAS 2) in the metamorphic
host rocks, crystallised from dilute aqueous
fluids at a temperature of around 180–200 jCfrom a fluid with a d18O composition of between
� 1.8xand � 0.4x(i.e. with a significant
component of surface-derived waters that had
more or less isotopically exchanged with the
basement). Two other quartz samples from along
the main N115F 55jNE trending fault (comb
quartz with epithermal-like textures devoid of
any inclusions suitable for study) were probably
deposited at low temperature, from a fluid with a
d18O composition of between � 9.5xand
2.5x. This is interpreted as a surface-derived
fluid (‘‘meteoric water’’) that had undergone
only limited interaction with basement litholo-
gies.
9. Model for the deposit formation and conclusion
9.1. Comparison with other deposits in the Valongo
Belt
A comparison with metasediment-hosted gold
deposits in the Valongo area (Ribeiro da Igreja, Alto
do Sobrido and Banjas; Couto, 1993) provides a
further insight into the influence of the host rocks
and P–T conditions in the formation of the gold
deposits. These deposits occur (i) in high-angle frac-
tures distributed subparallel to the axial plane of
Table 4
Summary of O stable isotope data versus SMOW for the different
quartz generation of the Castromil deposit
Quartz
type
Sample
reference
d18Oquartz
(x)
Estimated
crystallisation
temperature
d18O fluid (x)
Qm CAS 37
chip a
16.73 475F 25 jC 13 to 13.7
Qm CAS 37
chip b
17.10 475F 25 jC 13.4 to 14.6
Qm CAS 22 15.65 475F 25 jC 12 to 12.6
Qm CAS 4 15.26 475F 25 jC 11.6 to 12.2
Q1 CAS 30 15.13 425F 25 jC 10.6 to 11.4
Q1 CAS 26 14.08 425F 25 jC 9.6 to 10.5
Q1 CAS 32 14.39 425F 25 jC 9.9 to 10.7
Q2 CAS 33 14.45 425F 25 jC 9.9 to 10.8
Q3 CAS 32c
chip a
14.78 225F 25 jC 3.1 to 5.8
Q3 CAS 32c
chip b
14.82 225F 25 jC 3.2 to 5.8
Q3 CAS 32 d 14.23 225F 25 jC 2.6 to 5.3
Q4 CAS 19 11.23 190F 10 jC � 1.8 to � 0.4
Q4 CAS 2
chip a
14.8 140F 40 jC � 6.3 to 1.8
Q4 CAS 2
chip b
15.54 140F 40 jC � 5.6 to 2.5
Q4 CAS 7 11.58 140F 40 jC � 9.5 to � 1.4
d18O value for fluids are calculated using estimated crystallisation
temperature of quartz from fluid inclusion studies and the quartz–
H2O fractionation curve from Zheng (1993).
J. Vallance et al. / Chemical Geology 194 (2003) 201–224 219

secondary antiforms, and along specific lithologies
(now occurring as clay-rich layers in between quartz-
ite formations) crosscut by these fractures, and (ii)
along subvertical faults, striking N045F 15jE (e.g.
subperpendicular to the main axis of the Valongo
anticline). The occurrence of ores in specific litholo-
gies was interpreted by Combes et al. (1992) as the
result of the remobilisation during deformation and
prograde low-grade regional metamorphism of ‘‘tur-
bidite-hosted’’ gold from saddle reefs systems. This
model is in contradiction with the available P–T data
and structural observations where the gold is seen to
be associated with microstructures that clearly post-
date the deformation and metamorphism. Thus, as at
Castromil, Couto (1993) and Couto et al. (1990) show
that at Ribeiro da Igreja and Montalto, the early ore
fluids, which are high-temperature aqueous-carbonic
fluids, and which predate the introduction of Sb–Au,
also postdate the peak of metamorphism and defor-
mation.
In Sb-rich deposits such as Alto do Sobrido, quartz
containing Sb-sulphosalts, stibnite and gold formed
from low-salinity aqueous fluids with moderate Th
(150–200 jC).
9.2. Metallogenic model for Castromil and Valongo
Belt deposits
The aplites that are emplaced in a N130–150jEdirection at the contact between metasedimentary
series and the granite, and in a N050jE direction,
defined the main zone for the different stages of fluid
percolation (Fig. 11). Aqueous-carbonic fluids
enriched in CH4 by interaction with black schists are
responsible for greisenisation, formation of the silici-
fied structure and subsequent precipitation of quartz
and sulphides (pyrite and arsenopyrite). At this stage
(Stage III), a significant uplift (around 5–6 km)
occurs, accompanied by localised fluid unmixing.
During the latter phase of uplift, a reactivation of
the main fault zone creates intense microfracturing of
the quartz structures and permits the circulation of
aqueous fluids. This important phase of fluid circu-
lation were facilitated by decompression of the sur-
rounding rocks as evidenced by the presence of
aqueous fluids in microfractures outside the main
channel zone. In addition, the rheological contrast
between the quartz veins and the host rocks explains
the preferential formation of gold ores within the early
(Q1 and Q2) quartz structures. The mixing of aqueous
fluids in the highly microfissured quartz structures
leads to the deposition of gold. The abundant associ-
ation of gold and Q3 in late microfractures affecting
arsenopyrite and pyrite shows that electrochemical
interaction between early sulphides and gold com-
plexes acted as an additional process for gold depo-
sition (Moller and Kersten, 1994).
According to Boiron et al., 2003, most of the fluids
associated with gold deposits in western Europe are
waters that have equilibrated at decreasing P and T
within the upper crust. The main driving forces behind
their migration are major discontinuities acting as
drainage zones (Fig. 11), the emplacement of syn-
tectonic and then post-tectonic plutons (aplite stocks
at Castromil for example), uplift and general decom-
pression of the rock units. The final stage is charac-
terised by a progressive dilution of the crustal fluids
by solutions penetrating the basement from the sur-
face. The penetration of waters during the main uplift
stage of the basement may allow gold to be dissolved
and transported from the metamorphic series and/or
pre-concentrations (as it was observed in the Vila
Pouca de Aguiar area, Noronha et al., 2000), and re-
deposited in structural and geochemical traps formed
during earlier stages of quartz deposition.
The deposition of gold at Castromil is similar to
that observed in other deposits in the Valongo region
(Couto, 1993) and in northern Portugal (Noronha et
al., 2000), and is characterised by two main stages:
(i) An early stage with pyrite and arsenopyrite
deposition associated with aqueous-carbonic fluid
resulting from water– rock interactions with
graphite-bearing schists.
(ii) A later stage with gold and bismuth precipitation
in fractures crosscutting earlier sulphides in
response to the mixing of hot (300 jC) and
relatively saline (10–12 wt.% eq. NaCl) aqueous
fluids with a dilute (0.5 wt.% eq. NaCl) and cold
(150 jC) aqueous fluid.
Marked similarities are found between the study
area and other European deposits, previously
described in the literature (French Massif Central,
Galicia, Spain, Portugal and Bohemian massif) with
respect to (i) the timing of gold introduction and the
J. Vallance et al. / Chemical Geology 194 (2003) 201–224220

sequence of mineral assemblages; (ii) the nature of the
fluids and their geochemical features; (iii) the origin
of the two main fluid types: fluids equilibrated with
the host metamorphic rocks and meteoric, the latter
fluid type having undergone rather intense interaction
with the host rocks during their migration through the
microfractured basement (Vallance, 2001; Vallance et
al., 2001).
Fig. 11. Diagramatic representation of the genetic model for the Castromil and Valongo gold deposits. (A) Intrusion of the syn to late biotite
granite controlled by secondary anticlines and contact metamorphism; (B) aplite intrusion along the granite–metasediment contact and
greisenisation; (C) formation of the Q1 stockwork and gold deposition by fluid mixing; (D) general model at the Valongo anticline scale
including data from Couto (1993). 1: black schists; 2: aplite; 3: contact metamorphic aureole; 4: greisen-type alteration; 5: quartz stockwork.
J. Vallance et al. / Chemical Geology 194 (2003) 201–224 221
However, the Castromil deposit shows certain
differences, which are summarised in Fig. 11:
(i) The volumetric importance of aqueous-carbonic
fluids in a well defined zone. This major
percolation event implies strong hydrothermal
alteration, extensive greisenisation and an impor-
tant interaction with the graphitic schists. The
quantitative importance of aqueous-carbonic flu-
ids has not been reported for other gold deposits
in northern Portugal (and especially the meta-
sedimentary hosted gold deposit of the Valongo
anticline). However, the style of alteration style
has much in common with Sn–W deposits.
(ii) The absence of a Sb stage (rare sulphosalts). This
is probably due to the granite being relatively
depleted in Sb compared to the metasedimentary
rocks of the Valongo region (Castro Reis et al.,
1997), or to the complete absence of this late
stage.
(iii) A dramatic decrease in pressure with minimal
change in temperature. The very low pressure
(around or < l50 MPa) at high temperature (370–
400 jC) implies high heat flows which are
thought to be related to the presence of a
magmatic intrusion at shallow depth acting as a
strong heat engine and remobilizing gold from
the metasedimentary rocks. Aplite bodies, which
are spatially associated with the two deposits,
may be a distal expression of this late magma-
tism.
(iv) Gold deposition is linked to the mixing between
two aqueous fluids of relatively contrasted
salinity. This observation is at variance with
conventional mesothermal models where gold is
considered to be deposited from aqueous-car-
bonic fluids (Groves et al., 1998; McCuaig and
Kerrich, 1998; Mikucki, 1998). At Castromil,
aqueous-carbonic fluid circulation is related to an
earlier stage pre-ore stage that formed the main
gold trap (i.e. quartz veins with sulphides, mainly
arsenopyrite and pyrite).
(v) The inferred presence of a granite in the core of
the anticline based on the observation of apatite,
scheelite and wolframite in the earliest quartz
veins (Couto,1993). P–T reconstruction also
supports the presence of a granite at depth (Fig.
11). Indeed, the relatively low pressure and high
temperature (up to 400 jC for 80 MPa) imply a
geothermal gradient of around 60 jC/km, which is
quite common at the exocontact zone of magmatic
intrusions. However, no evidence of magmatic
fluids were found (such as saline brines or Ca-, K-,
Li-rich, high-temperature fluids). The granite
acted therefore solely as an heat engine, enhancing
hydrothermal circulation but not contributing
directly to the metals or fluid fluxes.
Acknowledgements
This work was facilitated by the EC funded
CRAFT Project ‘New technologies for the exploration
of high grade oreshoots’ (contract no. BRST CT98
5397). Dr. Carlos Nascimento (Connary Minerals) is
especially acknowledged for his technical and scien-
tific assistance whilst researching the Castromil
deposit, and for having permitted release of the
present data. The Instituto Geologico e Mineiro (IGM)
is acknowledged for its assistance during field work.
The authors wish thank R. Moritz, S. Hagemann and
F. Noronha for comments that have helped to improve
the manuscript. This work has been completed in
2001–2002 with the help and within the framework
of GDR TRANSMET, especially stable isotope
analyses. [RR]
References
Bakker, R.J., 1997. Clathrates: computer programs to calculate fluid
inclusions V–X properties using clathrate melting temperature.
Comput. Geosci. 23, 1–18.
Bakker, R.J., 1999. Adaptation of the Bowers and Helgeson (1983)
equation of state to the H2O–CO2–CH4–N2–NaCl system.
Chem. Geol. 154, 225–236.
Barakat, A., 1995. Percolations fluides et transferts de metaux: les
gisements d’or intragranitiques d’Europe de l’Ouest. Unpub-
lished PhD thesis, INPL, Nancy. 373 pp.
Boiron, M.C., Essarraj, S., Sellier, E., Cathelineau, M., Lespinasse,
M., Poty, B., 1992. Identification of fluid inclusions in relation
with their host microstructural domains in quartz by cathodolu-
minescence. Geochim. Cosmochim. Acta 56, 175–185.
Boiron, M.C., Cathelineau, M., David, A., Fourcade, S., Vallance,
L., 2003. Mixing of metamorphic and surficial fluids during the
uplift of the Hercynian upper crust: consequences for gold dep-
osition. Chem. Geol. 194, 119–141.
Bowers, T.S., Helgeson, H.C., 1983. Calculation of the thermody-
namic and geochemical consequences of non-ideal mixing in the
J. Vallance et al. / Chemical Geology 194 (2003) 201–224222

system H2O–CO2–NaCl on phase relation in geological sys-
tems: equation of state for H2O–CO2–NaCl fluids at high pres-
sure and temperature. Geochim. Cosmochim. Acta 47, 1247–
1275.
Castro Reis, M.L., Moreira, M.E., Bravo Silva, P., Freire Avila, P.,
Alves Ferreira, M.A., Simoes, M.C., Santos Oliveira, J.M.,
1997. Mineralogical and geochemical features of metasedimen-
tary rocks associated to Au–Sb vein mineralization in Northern
Portugal. Comun. Inst. Geol. Min. 83, 29–46.
Cathelineau, M., Boiron, M.C., Garcia Palomero, F., Urbano, P.,
Florido, P., Pereira, E.S., Noronha, F., Barriga, F., Mateus, A.,
Yardley, B., Banks, D., 1993. Multidisciplinary studies of Au-
vein formation. Application to the Western part of the Hesperian
Massif (Spain, Portugal). Multiannual R&D programme (1990–
1992) on ‘‘Primary raw materials and recycling of non-ferrous
metals’’. C.E.C. 391 pp.
Clayton, R.N., Mayeda, T.K., 1963. The use of bromine pentafluor-
ine in the extraction of oxygen from oxides and silicates for
isotopic analysis. Geochim. Cosmochim. Acta 27, 43–52.
Combes, A., Cassard, D., Couto, H., Damiao, J., Ferraz, P., Urien,
P., 1992. Caracterisation structurale des mineralisations auriferes
de l’Arenigien dans la region de Valongo (Baixo Douro, Portu-
gal). Chron. Rech. Min. 509, 3–15.
Couto, H., 1993. As mineralizac�oes de Sb–Au da regiao Durico-
Beira. Unpublished PhD thesis, Porto. 582 pp.
Couto, H., Roger, G., Moelo, Y., Bril, H., 1990. Le district a anti-
moine-or Durico-Beirao (Portugal): evolution paragenetique et
geochimique, implications metallogeniques. Miner. Depos. 28,
69–81.
Dias, R., Ribeiro, A., 1991. A kinematic approach to the strain
distribution in the Valongo anticline (Variscan Autochton of
Central Iberian Zone). IIIe Congr. Nac. de Geol., Coimbra,
41.
Doria, A., 1999. Evoluc�ao dos fluidos associados a processos min-
eralizantes: aplicac�ao a regiao aurifera de Vila Pouca de Aguiar.
Unpublished thesis, Porto. 345 pp.
Doria, A., Boiron, M.C., Ribeiro, M.A., Noronha, F., 1999. P–T–X
evolution of the fluids in a context of retrograde metamorphism:
the example of VPA Au-district (Northern Portugal). In: Volker
Luders, A.S.-M., Thomas, R. (Eds.), ECROFI XV, European
Current Reasearch on Fluid Inclusions. Terra Nostra, Potsdam,
pp. 86–88.
Dubessy, J., 1984. Simulation des equilibres chimiques dans le
systeme C–O–H. Consequences methodologiques pour les in-
clusions fluides. Bull. Min. 107, 155–168.
Dubessy, J., Poty, B., Ramboz, C., 1989. Advances in C–O–H–
N–S: fluid geochemistry based on micro Raman spectrometric
analysis of fluid inclusions. Eur. J. Mineral. I, 517–534.
Essarraj, S., 1992. Migration des fluides, microfissuration et con-
ditions de depot de l’or dans les veines de quartz auriferes.
Unpublished thesis, I.N.P.L., Nancy. 399 pp.
Essarraj, S., Boiron, M.C., Cathelineau, M., Fourcade, S., 2001.
Multistage deformation of Au-quartz vein: evidence for late
gold introduction from microstructural, isotopic and fluid inclu-
sion studies. Tectonophysics 336, 79–99.
Gonzales Clavijo, E., Ortega, C., Florido, P., Locutura, J., 1994. El
control estructural de las mineralizaciones auriferas en la zona
de Pino, provincia de Zamora, Espana. Bol. Geol. Min. 105 (2),
178–189.
Groves, D.I., Goldfarb, R.J., Gebre-Mariam, M., Hagemann, S.G.,
Robert, F., 1998. Orogenic gold deposits, a proposed classifica-
tion in the context of their crustal distribution and relationship to
other gold deposit types. Ore Geol. Rev. 13, 7–27.
Guedes, A., 2001. Evoluc�ao das condic�oes PVTX dos paleofluidos
em contextos metamorficos do soco Hercinico. Unpublished
PhD thesis, Porto. 173 pp.
Kerrich, R., 1987. The stable isotope geochemistry of Au–Ag vein
deposits in metamorphic rocks. In: Kyser, T.K. (Ed.), Stable
Isotopes Geochemistry of Low Temperature Fluids. Min. Assoc.
Canada, vol. 13, pp. 287–336.
Lang, J.R., Baker, T., 2001. Intrusion-related gold systems: the
present level of understanding. Miner. Depos. 36, 477–489.
McCuaig, T.C., Kerrich, R., 1998. P–T– t–deformation – fluid
characteristics of lode gold deposits: evidence from alteration
systematics. Ore Geol. Rev. 13, 381–453.
Mikucki, E.J., 1998. Hydrothermal transport and depositional pro-
cesses in Archean lode–gold systems: a review. Ore Geol. Rev.
13, 307–321.
Moller, P., Kersten, G., 1994. Electrochemical accumulation of
visible gold on pyrite and arsenopyrite surfaces. Miner. Depos.
29, 404–413.
Neiva, A.M.R., 1992. Geochemistry and evolution of Jales granitic
system, northern Portugal. Chem. Erde 52, 225–241.
Neiva, J.M.C., Neiva, A.M.R., 1990. The gold area of Jales (north-
ern Portugal). Terra Nova 2, 243–254.
Nogueira, P., Noronha, F., 1995. ‘‘Planif’’ a computer program for
the study of fluid inclusion planes. Bol. Soc. Esp. Mineral. 18
(1), 182–186.
Noronha, F., Ramos, J.M.F., 1993. Mineralizac�oes auriferas pri-
marias do Norte de Portugal, algumas reflexoes. Cuad. Lab.
Xeol. Laxe 18, 133–146.
Noronha, F., Ramos, J.M.F., Rebelo, J., Ribeiro, A., Ribeiro, M.L.,
1981. Essai de correlation des phases de deformation hercyni-
ennes dans le NW de la Peninsule Iberique. Leidse Geol.
Meded. 52 (1), 89–91.
Noronha, F., Cathelineau, M., Boiron, M.C., Banks, D.A., Doria,
A., Ribeiro, M.A., Nogeira, P., Guedes, A., 2000. A three stage
fluid flow model for Variscan gold metallogenesis in northern
Portugal. J. Geochem. Explor. 71, 209–224.
Pereira, E., Ribeiro, A., 1992. Carta geologica de Portugal. Noticia
explicativa da folha 1. Servicos Geologicos de Portugal, Lis-
bonne.
Poty, B., Leroy, J., Jachimowicz, L., 1976. Un nouvel appareil pour
la mesure des temperatures sous le microscope: l’installation de
microthermometrie Chaixmeca. Bull. Soc. Fr. Mineral. Cristal-
logr. 99, 182–186.
Romano, M., Diggens, J.N., 1973. The stratigraphy and structure of
Ordovician and associated rocks around Valongo, North Portu-
gal. Comun. Serv. Geol. Port. 7, 23–53.
Simmons, S.F., Browne, P.R.L., 2000. Hydrothermal minerals and
precious metals in the Broadlands–Ohaaki geothermal system:
implications for understanding low-sulfidation epithermal envi-
ronments. Econ. Geol. 95, 971–999.
Spycher, N.F., Reed, M.H., 1989. Evolution of a Broadlands-type
J. Vallance et al. / Chemical Geology 194 (2003) 201–224 223

epithermal ore fluid along alternative P–T paths: implications
for the transport and deposition of base, precious and volatile
metals. Econ. Geol. 84, 328–359.
Thiery, R., Vidal, J., Dubessy, J., 1994. Phase equilibria modelling
applied to fluid inclusions: liquid–vapour equilibria and calcu-
lation of the molar volume in the CO2–CH4–N2 system. Geo-
chim. Cosmochim. Acta 58, 1073–1082.
Vallance, J., 2001. Les paleofluides de la fin de la collision
varisque: evolution pression– temperature–composition et role
metallogenique. Une etude pluridisciplinaire des districts a
Au d’Europe occidentale. Unpublished thesis, Nancy I Univ.
326 pp.
Vallance, J., Cathelineau, M., Marignac, C., Boiron, M.C., Four-
cade, S., Martineau, F., Fabre, C., 2001. Microfracturing and
fluid mixing in granites: W– (Sn) ore deposition at Vaulry
(NW French Massif Central). Tectonophysics 336, 43–61.
Vityk, M.O., Bodnar, R.J., 1995. Textural evolution of synthetic
fluid inclusions in quartz during reequilibration, with applica-
tions to tectonic reconstruction. Contrib. Mineral. Petrol. 121,
309–323.
Zhang, Y.G., Frantz, J.D., 1987. Determination of the homogene-
ization temperatures and densities of supercritical fluids in the
system NaCl–KCl–CaCl2 –H2O using synthetic fluid inclu-
sions. Chem. Geol. 64, 335–350.
Zheng, Y.F., 1993. Calculation of oxygen isotope fractionation in
anhydrous silicate minerals. Geochim. Cosmochim. Acta 56,
1079–1091.
J. Vallance et al. / Chemical Geology 194 (2003) 201–224224
Copyright © 2022 FDOKUMEN