Fluctuations, linear response and heat flux of an aging system
8
arXiv:1112.5244v2 [cond-mat.stat-mech] 2 Mar 2012 epl draft Fluctuations, linear response and heat flux of an aging system J. R. Gomez-Solano 1 (a) , A. Petrosyan 1 and S. Ciliberto 1 1 Laboratoire de Physique, Ecole Normale Sup´ erieure de Lyon, CNRS UMR 5672, 46, All´ ee dItalie, 69364 Lyon CEDEX 07, France PACS 05.40.-a – Fluctuation phenomena, random processes, noise, and Brownian motion Abstract. - We measure the fluctuations of the position of a Brownian particle confined by an optical trap in an aging gelatin droplet after a fast quench. Its linear response to an external perturbation is also measured. We compute the spontaneous heat flux from the particle to the bath due to the nonequilibrium formation of the gel. We show that the mean heat flux is quantitatively related to the violation of the equilibrium fluctuation-dissipation theorem as a measure of the broken detailed balance during the aging process. Introduction. – The study of the statistical prop- erties of fluctuations in out-of-equilibrium systems is a topic of great current interest. For instance, it is im- portant at micro- and nano- scales where fluctuations and off-equilibrium conditions are common. In particu- lar, the fluctuation theorem (FT) [1] and the generaliza- tion of the fluctuation-dissipation theorem (FDT) [2–6] to processes away from thermal equilibrium, are impor- tant theoretical results relevant to describe energy ex- changes. A large number of studies has been devoted to non-equilibrium steady states and transient states in con- tact with a single heat bath. Nowadays, these systems begin to be rather well understood both theoretically and experimentally (see ref. [7] for a short review). On the other hand, non-stationary states slowly relaxing towards thermal equilibrium are important for applications. For example, glassy systems age in time driven by spontaneous heat fluxes to the environment, after being prepared in a metastable configuration [8]. Although several extensions of the FT [9–12] and generalized fluctuation-dissipation re- lations (GFDRs) [2–4,6] have been formulated for relaxing systems, the comparison between theory and experiments still lacks a clear interpretation. In the present letter we study experimentally the fluc- tuations, the linear response and the heat flux of a non- stationary system: an aging gel during the sol-gel transi- tion. The rheological properties and the fluctuations dur- ing this aging dynamics can be characterized by a single relevant degree of freedom of a local probe. Specifically, (a) Current address: 2. Physikalisches Institut, Universit¨at Stuttgart, Pfaffenwaldring 57, 70569, Stuttgart, Germany. we focus, within the context of GFDRs, on the dynam- ics of a micron-sized particle embedded in the aging gel, which acts as a non-equilibrium bath. The particle is the probe, which measures the out-of-equilibrium properties of the gel. Our aim is to show in a transparent way the link between the violation of the equilibrium FDT and the total entropy production in an experiment performed in an aging system. Description of the system. – In the experiment, a silica bead of radius r =1 μm is used as a probe inside a thermoreversible gel (gelatin) slowly relaxing towards its solid-like state (gel), after a very fast quench, from above to below the gelation temperature T gel . Above T gel an aqueous gelatin solution is in a viscous liquid phase (sol), whereas below T gel the formation of a network of cross- linked triple helices leads to an elastic solid-like phase (gel) [13]. This relaxational out-of-equilibrium regime is probed by measuring the Brownian fluctuations and the linear response function of the bead position. Specifically, the gel used in the experiment is an aque- ous gelatin solution (type-B pig skin) at a concentration of 10 wt %, prepared following the usual protocol [14,15]. For this sample T gel = 29 ◦ C. The solution fills a transpar- ent cell kept at constant temperature (T 0 = 26 ± 0.05 ◦ C <T gel ) by a Peltier element. See the sketch of the ex- perimental setup on the left panel of fig. 1(a). Thus, the solution inside the cell is in the solid-like phase. A sil- ica bead, of radius r =1 μm, embedded the gelatin so- lution is placed in the focal position of a tightly focused laser beam (λ = 980 nm) at a power of 20 mW. At this power the laser produces on the particle an elastic force p-1
-
Upload
uni-stuttgart -
Category
Documents
-
view
0 -
download
0
Transcript of Fluctuations, linear response and heat flux of an aging system

arX
iv:1
112.
5244
v2 [
cond
-mat
.sta
t-m
ech]
2 M
ar 2
012
epl draft
Fluctuations, linear response and heat flux of an aging system
J. R. Gomez-Solano1 (a), A. Petrosyan1 and S. Ciliberto1
1 Laboratoire de Physique, Ecole Normale Superieure de Lyon, CNRS UMR 5672, 46, Allee dItalie, 69364 Lyon
CEDEX 07, France
PACS 05.40.-a – Fluctuation phenomena, random processes, noise, and Brownian motion
Abstract. - We measure the fluctuations of the position of a Brownian particle confined byan optical trap in an aging gelatin droplet after a fast quench. Its linear response to an externalperturbation is also measured. We compute the spontaneous heat flux from the particle to the bathdue to the nonequilibrium formation of the gel. We show that the mean heat flux is quantitativelyrelated to the violation of the equilibrium fluctuation-dissipation theorem as a measure of thebroken detailed balance during the aging process.
Introduction. – The study of the statistical prop-erties of fluctuations in out-of-equilibrium systems is atopic of great current interest. For instance, it is im-portant at micro- and nano- scales where fluctuationsand off-equilibrium conditions are common. In particu-lar, the fluctuation theorem (FT) [1] and the generaliza-tion of the fluctuation-dissipation theorem (FDT) [2–6]to processes away from thermal equilibrium, are impor-tant theoretical results relevant to describe energy ex-changes. A large number of studies has been devoted tonon-equilibrium steady states and transient states in con-tact with a single heat bath. Nowadays, these systemsbegin to be rather well understood both theoretically andexperimentally (see ref. [7] for a short review). On theother hand, non-stationary states slowly relaxing towardsthermal equilibrium are important for applications. Forexample, glassy systems age in time driven by spontaneousheat fluxes to the environment, after being prepared in ametastable configuration [8]. Although several extensionsof the FT [9–12] and generalized fluctuation-dissipation re-lations (GFDRs) [2–4,6] have been formulated for relaxingsystems, the comparison between theory and experimentsstill lacks a clear interpretation.
In the present letter we study experimentally the fluc-tuations, the linear response and the heat flux of a non-stationary system: an aging gel during the sol-gel transi-tion. The rheological properties and the fluctuations dur-ing this aging dynamics can be characterized by a singlerelevant degree of freedom of a local probe. Specifically,
(a)Current address: 2. Physikalisches Institut, UniversitatStuttgart, Pfaffenwaldring 57, 70569, Stuttgart, Germany.
we focus, within the context of GFDRs, on the dynam-ics of a micron-sized particle embedded in the aging gel,which acts as a non-equilibrium bath. The particle is theprobe, which measures the out-of-equilibrium propertiesof the gel. Our aim is to show in a transparent way thelink between the violation of the equilibrium FDT andthe total entropy production in an experiment performedin an aging system.
Description of the system. – In the experiment, asilica bead of radius r = 1µm is used as a probe inside athermoreversible gel (gelatin) slowly relaxing towards itssolid-like state (gel), after a very fast quench, from aboveto below the gelation temperature Tgel. Above Tgel anaqueous gelatin solution is in a viscous liquid phase (sol),whereas below Tgel the formation of a network of cross-linked triple helices leads to an elastic solid-like phase (gel)[13]. This relaxational out-of-equilibrium regime is probedby measuring the Brownian fluctuations and the linearresponse function of the bead position.Specifically, the gel used in the experiment is an aque-
ous gelatin solution (type-B pig skin) at a concentrationof 10 wt %, prepared following the usual protocol [14,15].For this sample Tgel = 29◦C. The solution fills a transpar-ent cell kept at constant temperature (T0 = 26 ± 0.05◦C< Tgel) by a Peltier element. See the sketch of the ex-perimental setup on the left panel of fig. 1(a). Thus, thesolution inside the cell is in the solid-like phase. A sil-ica bead, of radius r = 1µm, embedded the gelatin so-lution is placed in the focal position of a tightly focusedlaser beam (λ = 980 nm) at a power of 20 mW. At thispower the laser produces on the particle an elastic force
p-1

J. R. Gomez-Solano et al.
Fig. 1: (a) Sketch of the experimental setup used to melt amicron-sized volume of gel by locally heating the bulk at T0 =38◦C with a focused laser beam. (b) Diagram of the quench ofthe liquid droplet from T0 = 38◦C to T = 27.2◦C in less than1 ms. Lower panel: position fluctuations of a particle opticallytrapped inside the liquid before and after the quench.
of stiffness k = 2.9 pN/µm. Because of light absorption,the temperature of the trapped particle is T = 27.2◦C,which is still smaller than Tgel. Hence, the bead is insidethe solid gel in the beam focus at a distance h = 25µmfrom the cell wall. Starting from this condition, the laserpower is increased to 200 mW and the local temperaturearound the focus rises to 38◦C > Tgel [16]. As a resultthe gel melts and a liquid droplet of radius a = 5µm,is formed around the trapped bead inside the the solidgel bulk, as depicted on the right panel of fig. 1(a). Af-ter 180 s, the laser power is suddenly decreased again to20 mW and the temperature is homogenized by heat dif-fusion into the gel bulk. Since the thermal diffusivity ofwater is κ = 1.4× 10⁻⁷m2 s−1, the heat diffuses in a timea2/κ ∼ 0.2 ms and the droplet is very efficiently quenchedto the final temperature T = 27.2◦C < Tgel. This tem-perature remains constant after the quench due the Peltierelement at T0 = 26 ± 0.05◦C. In addition, we check thatthe trap stiffness k = 2.9 pN/µm remains constant as wellthroughout the gelation process. At T the liquid inside thedroplet completely solidifies in about 1 hour and the parti-cle, trapped in the center of the drop by the focused beam,is a probe of this relaxation dynamics. The quenches arerepeated up to 60 times in order to compute the properensemble averages of the measured quantities [17].
Active microrheology. – Immediately after thequench we record the time evolution of the x position [see
fig. 1(b)] of the trapped particle measured by a positionsensitive detector whose output is sampled at 8 kHz andacquired by a computer. The resolution of the measure-ment of x is better than 1 nm [18,19].Due to the aging process of the gelatin droplet, the time
series of x shown in fig. 1(b) is non-stationary for timet ≥ 0 after the quench. In order to characterize this agingtime evolution in the linear response regime, we performactive microrheology. For this purpose we apply an ex-ternal driving to the trapped bead. This is realized bydisplacing the position x0 of the optical trap, using a pre-cise actuator, which deflects the trapping laser beam. Asinusoidal modulation of x0 results in a time-dependentforce F = kx0 on the bead: F (f, t) = F0 sin(2π f t) isapplied at different driving frequencies 0.2 Hz ≤ f ≤ 5 Hzand fixed amplitude F0 = 87 fN. By measuring in thetime interval [t, t + ∆t] the response R(f, t) of the par-ticle position to F (f, t), we obtain the shear modulusG(f, t) = G′(f, t) − iG′′(f, t) of the droplet at differenttimes t after the quench, where G′ is the storage and G′′
the loss modulus [19] (see also eq.6).Because of the relatively fast aging process due to the
smallness of the droplet, the spectral analysis involved inthe calculation of G′ and G′′ must be carried out over ashort time window [t, t + ∆t] for each aging time t. Inthe following we set ∆t = 15 s1. As the response R(f, t)converges more rapidly than fluctuations, the values of Gare averaged only on 20 quenches for each value of f. Infigs. 2(a) and 2(b) we plot the time evolution of G′ andG′′ measured at f = 5 Hz during the first 20 minutes afterthe quench. We can identify three different regimes:
I. For 0 s ≤ t ≤ 60 s, G′ is completely negligiblewhereas G′′ increases continuously in time by a fac-tor of almost two. In this aging regime, hightlightedin fig. 2(b), the gelatin droplet behaves as a purelyviscous liquid even when the final temperature of thequench is below Tgel.
II. For 60 s ≤ t ≤ 200 s, G′′ continuously increases andG′ starts to increase slowly, as plotted in fig. 2(b).This result shows that the droplet is in a transientregime towards the sol-gel transition where the gelnetwork is not completely formed. Indeed, G′ is stillmuch smaller and it increases slower than G′′.
III. For 200 s ≤ t ≤ 1200 s, both G′ and G′′ reach alogarithmic growth ∼ log t where G′ increases fasterthan G′′. This growth as t increases is similar tothat reported in macroscopic bulk measurements [13,14, 20] but taking place much faster because of thesmallness of the gelatin droplet. Then the system isactually undergoing gelation providing evidence thatthe percolating gel network is already formed.
1This value is large enough to resolve the frequencies of the ap-plied driving and at the same time it is short enough to avoid apronounced time evolution of the nonstationary signal x.
p-2
Fluctuations, linear response and heat flux of an aging system
101
102
103
0
0.5
1
1.5
2
t (s)
G’,
G’’
(Pa
)
G’G’’
I
III
II
(a)
0 20 40 60 80 100 120
0
0.2
0.4
0.6
0.8
t(s)
G’,
G’’
(Pa
)
G’G’’
I
II
(b)
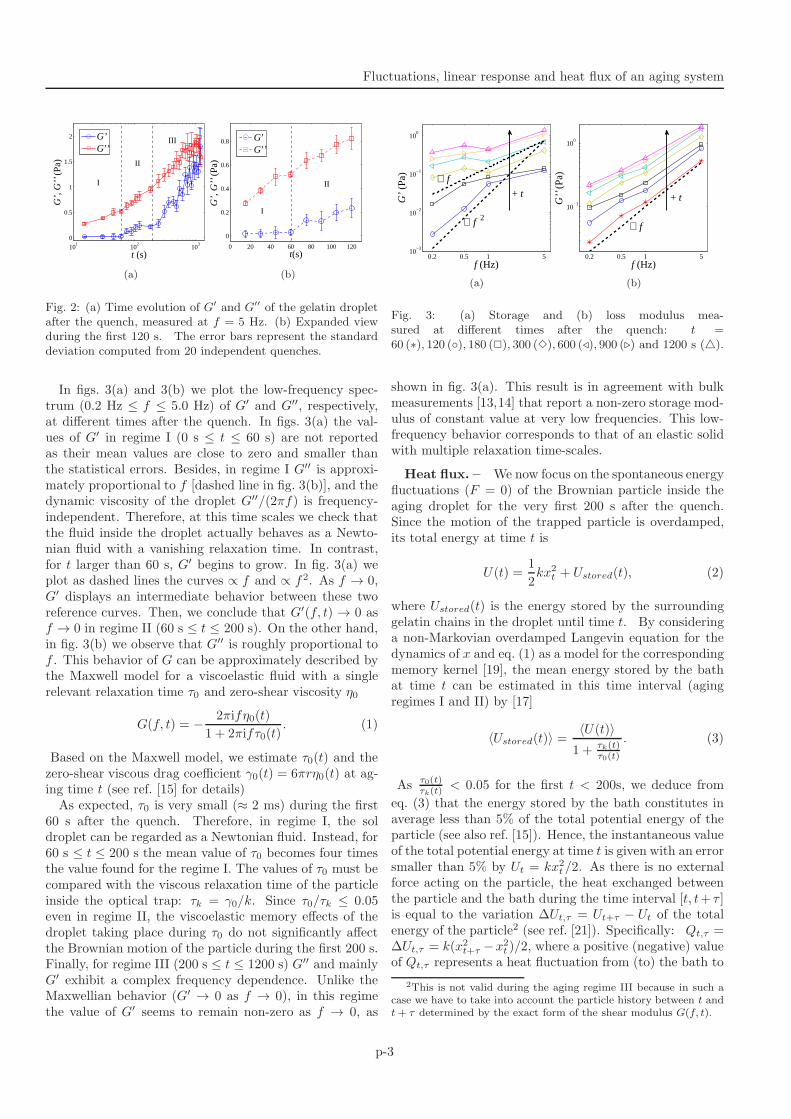
Fig. 2: (a) Time evolution of G′ and G′′ of the gelatin dropletafter the quench, measured at f = 5 Hz. (b) Expanded viewduring the first 120 s. The error bars represent the standarddeviation computed from 20 independent quenches.
In figs. 3(a) and 3(b) we plot the low-frequency spec-trum (0.2 Hz ≤ f ≤ 5.0 Hz) of G′ and G′′, respectively,at different times after the quench. In figs. 3(a) the val-ues of G′ in regime I (0 s ≤ t ≤ 60 s) are not reportedas their mean values are close to zero and smaller thanthe statistical errors. Besides, in regime I G′′ is approxi-mately proportional to f [dashed line in fig. 3(b)], and thedynamic viscosity of the droplet G′′/(2πf) is frequency-independent. Therefore, at this time scales we check thatthe fluid inside the droplet actually behaves as a Newto-nian fluid with a vanishing relaxation time. In contrast,for t larger than 60 s, G′ begins to grow. In fig. 3(a) weplot as dashed lines the curves ∝ f and ∝ f2. As f → 0,G′ displays an intermediate behavior between these tworeference curves. Then, we conclude that G′(f, t) → 0 asf → 0 in regime II (60 s ≤ t ≤ 200 s). On the other hand,in fig. 3(b) we observe that G′′ is roughly proportional tof . This behavior of G can be approximately described bythe Maxwell model for a viscoelastic fluid with a singlerelevant relaxation time τ0 and zero-shear viscosity η0
G(f, t) = −2πifη0(t)
1 + 2πifτ0(t). (1)
Based on the Maxwell model, we estimate τ0(t) and thezero-shear viscous drag coefficient γ0(t) = 6πrη0(t) at ag-ing time t (see ref. [15] for details)As expected, τ0 is very small (≈ 2 ms) during the first
60 s after the quench. Therefore, in regime I, the soldroplet can be regarded as a Newtonian fluid. Instead, for60 s ≤ t ≤ 200 s the mean value of τ0 becomes four timesthe value found for the regime I. The values of τ0 must becompared with the viscous relaxation time of the particleinside the optical trap: τk = γ0/k. Since τ0/τk ≤ 0.05even in regime II, the viscoelastic memory effects of thedroplet taking place during τ0 do not significantly affectthe Brownian motion of the particle during the first 200 s.Finally, for regime III (200 s ≤ t ≤ 1200 s) G′′ and mainlyG′ exhibit a complex frequency dependence. Unlike theMaxwellian behavior (G′ → 0 as f → 0), in this regimethe value of G′ seems to remain non-zero as f → 0, as
0.2 0.5 1 510
−3
10−2
10−1
100
f (Hz)
G’
(Pa)
+ t
∝ f 2
∝ f
(a)
0.2 0.5 1 5
10−1
100
f (Hz)
G’’ (
Pa)
+ t
∝ f
(b)
Fig. 3: (a) Storage and (b) loss modulus mea-sured at different times after the quench: t =60 (∗), 120 (◦), 180 (✷), 300 (✸), 600 (⊳), 900 (⊲) and 1200 s (△).
shown in fig. 3(a). This result is in agreement with bulkmeasurements [13,14] that report a non-zero storage mod-ulus of constant value at very low frequencies. This low-frequency behavior corresponds to that of an elastic solidwith multiple relaxation time-scales.
Heat flux. – We now focus on the spontaneous energyfluctuations (F = 0) of the Brownian particle inside theaging droplet for the very first 200 s after the quench.Since the motion of the trapped particle is overdamped,its total energy at time t is
U(t) =1
2kx2
t + Ustored(t), (2)
where Ustored(t) is the energy stored by the surroundinggelatin chains in the droplet until time t. By consideringa non-Markovian overdamped Langevin equation for thedynamics of x and eq. (1) as a model for the correspondingmemory kernel [19], the mean energy stored by the bathat time t can be estimated in this time interval (agingregimes I and II) by [17]
〈Ustored(t)〉 =〈U(t)〉
1 + τk(t)τ0(t)
. (3)
As τ0(t)τk(t)
< 0.05 for the first t < 200s, we deduce from
eq. (3) that the energy stored by the bath constitutes inaverage less than 5% of the total potential energy of theparticle (see also ref. [15]). Hence, the instantaneous valueof the total potential energy at time t is given with an errorsmaller than 5% by Ut = kx2
t /2. As there is no externalforce acting on the particle, the heat exchanged betweenthe particle and the bath during the time interval [t, t+ τ ]is equal to the variation ∆Ut,τ = Ut+τ − Ut of the totalenergy of the particle2 (see ref. [21]). Specifically: Qt,τ =∆Ut,τ = k(x2
t+τ −x2t )/2, where a positive (negative) value
of Qt,τ represents a heat fluctuation from (to) the bath to
2This is not valid during the aging regime III because in such acase we have to take into account the particle history between t andt + τ determined by the exact form of the shear modulus G(f, t).
p-3

J. R. Gomez-Solano et al.
(from) the bead. Then, the mean heat transferred during[t, t+ τ ] can be written as
〈Qt,τ 〉 =k
2[σx(t+ τ )2 − σx(t)
2], (4)
where σx(t)2 is the ensemble variance of the spontaneous
fluctuations of x at time t. In ref. [15] we show that thefluctuations of x are Gaussian and σ2
x(t) is a monotoni-cally decreasing function of t. This time evolution is plot-ted in fig. 4(a) for the three different aging regimes iden-tified by active microrheology. During the first ≈ 20 s,σx(t)
2 > kBT/k, which can be interpreted as the resultof both thermal and non-thermal stochastic forces on theparticle due to the transient formation of the gel network,as schematized in the inset of fig. 4(a). The dimensionlessheat qt,τ = Qt,τ/(kBT ), computed using eq. (4), is plottedin fig. 4(b). Because of the relaxation of σx(t)
2, we observethe existence of a mean heat flux from the particle to thesurroundings on the time scale τ . The absolute value ofthe mean heat increases as the measurement time τ in-creases and the maximum value |〈qt,τ 〉| ≈ 1 takes placeat t = 0 s. Note that at thermal equilibrium the meanheat would be 〈qt,τ 〉 = 0 for all t and τ . Non-negligiblevalues of the mean heat persist for several seconds afterthe quench. Nevertheless, as t increases, |〈qt,τ 〉| decreasesbecoming experimentally undetectable for t & 20 s. Thenon-vanishing mean heat flux 〈qt,τ 〉 is a signature of thebroken detailed balance of the particle dynamics due tothe assembling gelatin chains. However, as the bath is un-dergoing aging the time scales of the dynamics slow down.Then the rate at which the heat flows from the systemto the environement becomes undetectable by the Brow-nian probe, which results in an apparent equilibrium-likebehavior for t & 20 s. In order to check for possible experi-mental artifacts, we repeated the same quench experimentusing a Newtonian fluid (glycerol 60 wt % in water). Atthis concentration the glycerol solution has the same vis-cosity of the initial sol phase of gelatin (9×10⁻³ Pa s) butwith no sol-gel transition in the same temperature range.For this fluid, the measured mean heat flux is plotted forcomparison in fig. 4. In this case we verify that the parti-cle quickly equilibrates with the bath after the quench sothat 〈qt,τ 〉 = 0 within the experimental accuracy.In ref. [15] we show that the heat fluctuations verify the
FT. In analogy with a system kept in a non-equilibriumsteady state in contact with two reservoirs at unequal tem-peratures [22–29], the quantity
∆St,τ =kBk
[
1
σx(t)2−
1
σx(t+ τ)2
]
Qt,τ , (5)
represents the total entropy produced by the breakdownof the time-reversal symmetry due to the nonstationarityof the bath after the quench. By taking the ensemble av-erage of eq. (5) and using eq. (4), one finds that the meanheat 〈Qt,τ 〉 actually quantifies the mean total entropy pro-
duction between time t and t+τ : 〈∆St,τ 〉 ∝〈Qt,τ 〉
2
σx(t+τ)2σx(t)2.
(a)
100
101
−1
−0.8
−0.6
−0.4
−0.2
0
0.2
t (s)
<q t,τ
>
0 20 40 60 80
0
0.2
0.4
t (s)
LHS
, RH
S
RHSLHS
(b)
Fig. 4: (a) Time evolution of the variance of the particleposition after the quench. The insets depict the possible con-figurations of the bead during the sol-gel transition of the sur-rounding gelatin. (b) Mean value of the normalized heat atdifferent times t after the quench in gelatin, for different valuesof the time lag: τ = 0.25 s (◦), 2.5 s (✷), 10 s (✸), 30 s (▽).The dashed line correspond to the normalized mean heat forthe quench in glycerol at τ = 30 s. Inset: Comparison betweenthe right-hand side (RHS) and left-hand side (LHS) of eq. (11),normalized by 2kBT/k, computed over a time window [t, t+∆t]for ∆t = 15 s.
Generalized fluctuation-dissipation relation. –
We now discuss the relation between entropy produc-tion, spontaneous fluctuations and linear response of thetrapped particle in this out-of-equilibrium aging bath. Itshould be expected that there is a strong connection be-tween the deviations from the equilibrium FDT and theextent of the broken detailed balance, quantified by 〈Qt,τ 〉.If the entropy production takes place at a very slow rate,then the particle in the aging bath should exhibit anequilibrium-like behavior, see the experiments on FDT incolloidal glasses of refs. [19, 30]. On the other hand, ifthe rate is fast enough, then currents are non-negligibleand such deviations should be significant like in the non-equilibrium steady state experiments of refs. [31, 32]. Inthe present case of gelatin, we found that |〈Qt,τ 〉| is com-parable to kBT during the first 20 s after the quench.The rate of this heat flux slows down as the gelatin ages.
p-4

Fluctuations, linear response and heat flux of an aging system
10−1
100
101
10−18
10−16
f (Hz)
PS
D (
m2 / H
z)
PassiveActive
(a)
10−1
100
101
10−18
10−16
f (Hz)
PS
D (
m2 / H
z)
PassiveActive
fc = (2πτ
k)−1
(b)
10−1
100
101
10−18
10−16
f (Hz)
PS
D (
m2 / H
z)
PassiveActive
fc = (2πτ
k)−1
(c)
10−1
100
101
10−16
10−18
f (Hz)
PS
D (
m2 / H
z)
PassiveActive
(d)
Fig. 5: Passive and active spectra computed on the interval[t, t+∆t] at different times t after the quench: (a) [0 s, 15 s],the dotted circle points out the low-frequency deviation fromeq. (8); (b) [30 s, 45 s], the arrow indicates the position of thefrequency fc; (c) [75 s, 90s]; and (d) [1200 s, 1215 s]. Thedotted line corresponds the Lorentzian curve obtained usingeq. (9) (G′ = 0).
Therefore, a significant deviation of the equilibrium FDTis expected to occur for the position of the trapped par-ticle during the aging regime I of the gelatin droplet. Incontrast, in regimes II and III the FDT must be appar-ently satisfied with the temperature T of the thermal bath.Indeed, we show in the following that our experimental re-sults display such a kind of behavior.As we performed active microrheology at a fixed ex-
citation frequency f , it is more convenient to study thefluctuations and linear response in the frequency domain.The Fourier transform R of the linear response functionof x to the perturbative time-dependent force F is relatedto the shear modulus G of the gelatin droplet by
R(f, t) =1
6πrG∗(f, t) + k, (6)
where G∗ is the complex conjugate of G. Then, the imag-inary part of eq. (6) is
Im{R(f, t)} =6πrG′′(f, t)
[k + 6πrG′(f, t)]2 + [6πrG′′(f, t)]2. (7)
At thermal equilibrium, the quantity given in eq. (7) doesnot depend on time and is related to the power spectraldensity 〈|x(f, t)|2〉 of the spontaneous fluctuations of x inthe absence of an external force (F = 0). This relation isprovided by the FDT and reads
〈|x(f, t)|2〉 =2kBT
πfIm{R(f, t)}. (8)
During the non-equilibrium gelation of the gelatin droplet,eq.8 does not necessarily hold because as we have alreadyseen R is a function of both t and f . Thus we studythe relation between the passive spectrum 〈|x(f, t)|2〉 andthe active spectrum 2kBT Im{R(f, t)}/(πf), as a functionof t. For this purpose we compute independently thesequantities over a time interval [t, t+∆t] of length ∆t = 15 sat time t after the quench in the different aging regimes.In fig. 5(a) we plot 〈|x(f, t)|2〉 for t = 0 s, where a strong
mean heat flux takes place (regime I). On the other hand,taking into account the negligible values of τ0 in thisregime, Im{R} can be written as
Im{R(f, t)} =1
2πγ0(t)
f
f2 + fc(t)2, (9)
where fc(t) is related to the viscous relaxation time τk(t) =γ0(t)/k of the trapped particle at time t by:
fc(t) =1
2πτk(t). (10)
In fig. 5(a) we also plot the active spectrum2kBT Im{R}/(πf) computed using eq. (7). This spectrumhas a Lorentzian profile. As expected, an importantdeviation of eq. (8) is observed for frequencies f . 1 Hz.Note that for frequencies f & 1 Hz eq. (8) is verified,indicating that the deviation is actually due to the slowstructural assemblage of the gel3. The spectral curvesof fig. 5(a) provide information on the time scales atwhich this phenomenon perturbs the Brownian probe:& 1 s. The extent of the deviation, i.e. the differencebetween the area below 〈|x(f, t)|2〉 minus the area below2kBT Im{R}/(πf) in fig. 5(a), is
∫ ∞
0
[
〈|x(f, t)|2〉 −2kBT
πfIm{R(f, t)}
]
df =2Qt,∆t
k,
(11)whereQt,∆t can be interpreted as the heat that the systemdissipates in average during the time interval [t, t+∆t] [17].This interpretation is justified because, using eqs. (11), (9)and (4), it can be easily shown [17] that indeed Qt,∆t =
− 1∆t
∫ t+∆t
t〈Qt′,τ 〉dt
′ with τ > 30 s, such that at timet′ + τ the systems has reached equilibrium for all timesafter the quench [see fig.4(a)]. We used the experimentaldata to compute independently the left-hand side (LHS)and the right-hand side (RHS) of eq (11) and we find thatthey are equal within error bars, as shown in the inset offig. 4(b).Thus similarly to the GFDR for non-equilibrium steady
states derived in [34], eq. (11) hightlights the role of heatcurrents (or equivalently the entropy production). In thepresent case, the right-hand side of eq. (11) quantifies theheat excess that must irreversibly flow from the particleto the bath in order for the system to reach equilibrium
3 Similar low-frequency violations of the FDT are found in non-equilibrium active systems, e.g. biological polymer networks [33].
p-5

J. R. Gomez-Solano et al.
at temperature T . Thus, the violation of the FDT (8)can be interpreted as a measure of the heat that mustbe dissipated to reach an equilibrium state. This is inclose analogy to the power dissipated into the medium tokeep a non-equilibrium steady state in the GFDR of ref.[34]. In fig. 5(b) we plot the passive and active spectrain the regime I for the t = 30 s. We check that in thiscase the equilibrium-like eq. (8) is satisfied with the finalequilibrium temperature T = 27.2◦C. This results is ingood agreement with the fact that the mean heat fluxbecomes undetectable by the Brownian particle for t >20 s.
Fig. 5(c) displays the passive power spectrum of x fort = 75 s, (regime II) where G′ starts to increase. Onthe other hand, taking into account that the fluid can becharacterized by a single relaxation time τ0 ≤ 0.05τk, theactive term can be approximated with an error smallerthan 5% by eq. (9). Using this expression with the exper-imental values of γ0 and fc, in fig. 5(c) we plot the activeterm 2kBT Im{R}/(πf). In this case, the agreement be-tween the left- and the right-hand side of eq. (8) is muchbetter than in fig. 5(a). Hence, we verify that the systemis relaxing to an equilibrium-like behavior.
Finally, in fig. 5(d) we plot the passive and active spec-tra for t = 1200 s. In this case the large viscoelasticity ofthe gelatin droplet gives rise to the highly non-Lorentzianshape of both terms. For comparison, we also plot theLorentzian profile (dotted line) that would be obtainedusing equation (9) without taking into account the contri-bution of the storage modulus G′. In the absence of anaccurate model for G in regime III, we only plot the activeterm in the frequency range 0.2 Hz≤ f ≤ 5 Hz at whichthe sinuosoidal external force was applied to the particle.We verify that an equilibrium-like fluctuation-dissipationrelation (8) holds for the particle position x because of thesmallness of the heat fluxes as the gelatin droplet ages.
Conclusion. – We have experimentally measured thefluctuations of the position of a trapped Brownian parti-cle in a non-stationary bath, i.e. an aging gel after avery fast quench. This simple experiment has allowed usto understand several concepts formulated originally fornon-equilibrium steady states that can be naturally ex-tended to non-stationary systems slowly relaxing towardsan equilibrium state. In particular, we provide evidencethat the extent of the violation of the equilibrium FDT isdirectly related to the entropy that must be produced inorder for the system to reach equilibrium. Therefore, asthe system ages, the relation between fluctuations and lin-ear response behaves like in equilibrium. This approach tofluctuation-dissipation, alternative to the concept of effec-tive temperature [2], can be exploited to study small heatfluxes in experiments on more complex aging systems.
∗ ∗ ∗
REFERENCES
[1] Evans D. J. et al., Phys. Rev. Lett., 71 (2401) 1993.Gallavotti G. and Cohen E. G. D., J. Stat. Phys., 80(931) 1995.
[2] Cugliandolo L. F., Kurchan J., and Peliti L., Phys.Rev. E, 55 (3898) 1997.
[3] E. Lippiello, F. Corberi, and M. Zannetti, Phys. Rev.E, 71 (036104) 2005.
[4] M. Baiesi, C. Maes, and B. Wynants, Phys. Rev. Lett.,103 (010602) 2009.
[5] U. Seifert and T. Speck, EPL, 89 (10007) 2010.[6] Verley G., Chetrite R. and Lacoste D., J. Stat.
Mech., (2011) P10025.[7] Ciliberto S., Joubaud S. and Petrosyan A., J. Stat.
Mech., (2010) P12003.[8] Berthier L. and Biroli G., Rev. Mod. Phys., 83 (587)
2011.[9] Crisanti A. and Ritort F., EPL, 66 (253) 2004.[10] Ritort F., J. Phys. Chem. B, 108 (6893) 2004.[11] Zamponi F. et al., J. Stat. Mech., (2005) P09013.[12] R. Chetrite, Phys. Rev. E, 80 (051107) 2009.[13] Djabourov M, Leblond J., and Papon P., J. Phys.
France, 49 (319) 1988. Djabourov M, Leblond J., andPapon P., J. Phys. France, 49 (333) 1988.
[14] Normand V. et al., Macromolecules, 33 (1063) 2000.[15] Gomez-Solano J. R., Petrosyan A., and Ciliberto
S., Phys. Rev. Lett., 106 (200602) 2011.[16] Peterman E. J. G. et al., Biophys. J, 84 (1308) 2003.[17] More details can be found in R.Gomez-Solano, PhD
Thesis-ENSL , http://tel.archives-ouvertes.fr , (2011) andin a longer report R. Gomez-Solano et all in preparation.
[18] Andrieux D. et al., J. Stat. Mech., (2008) P01002.[19] Jop P., Gomez-Solano J. R., Petrosyan A. and
Ciliberto S., J. Stat. Mech., (2009) P04012.[20] Joly-Duhamel C. et al., Langmuir, 18 (7158) 2002.[21] Sekimoto K., Prog. Theor. Phys. Suppl., 130 (17) 1998.
Van Zon R. and Cohen E. G. D., Phys. Rev. Lett., 91(110601) 2003.
[22] Jarzynski C. and Wojcik D. K., Phys. Rev. Lett, 92
(230602) 2004.[23] Lecomte V., Racz Z., and van Wijland F., J. Stat.
Mech., (2005) P02008.[24] Visco P., J. Stat. Mech., (2006) P06006.[25] Bodineau T. and Derrida B., C. R. Physique, 8 (540)
42007.[26] Piscitelli A., Corberi F., and Gonnella G., J. Phys.
A: Math. Theor., 41 (332003) 2008.[27] Saito K. and Dhar A., Phys. Rev. E, 83 (041121) 2011.[28] Kundu A., Sabhapandit S., and Dhar A., J. Stat.
Mech., (2011) P03007.[29] Evans D. , Searles D. J. and Williams S. R., J. Chem.
Phys., 132 (024501) 2010.[30] Jabbari-Farouji S. et al., EPL, 84 (20006) 2008.[31] Gomez-Solano J. R. et al., Phys. Rev. Lett., 103
(040601) 2009.[32] Mehl. J., Blickle V., Seifert U., and Bechinger C.,
Phys. Rev. E, 82 ( 032401) 2010.[33] Mizuno D. et al., Science, 315 (370) 2007.[34] Harada T. and Sasa S.-I., Phys. Rev. Lett., 95 (130602)
2005.
p-6

100
101
102
103
10−8
10−7
10−6
10−5
10−4
10−3
10−2
f [Hz]
Pow
er s
pect
ral d
ensi
ty (
V 2
/ H
z)
T0 = 38°C, P = 10 mW
T0 = 26° C, P = 200 mW

10−1
100
101
10−19
10−18
10−17
10−16
10−15
10−14
f (Hz)
<|x
(f,t)
|2 > (
m2 /
Hz)
<
+ t