Floristic relationships of terra firme forests in the Brazilian Amazon
10
Assessing the relationship between forest types and canopy tree beta diversity in Amazonia Thaise Emilio, Bruce Walker Nelson, Juliana Schietti, Sylvain J.-M. Desmoulie `re, Helder M. V. Espı ´rito Santo and Fla ´via R. C. Costa T. Emilio ([email protected]), B. Walker Nelson, J. Schietti, S. J.-M. Desmoulie `re, H. M. V. Espı ´rito-Santo and F. R. C. Costa, Inst. Nacional de Pesquisas da Amazo ˆnia (INPA), Av. Andre´ Arau ´jo, 2936, 69011-970 P.O. BOX 478, Manaus, Brazil. Planning of conservation priorities has often taken mapped forest types as surrogates for biological complementarity. In the Brazilian Amazon, these exercises have given equal weight to each forest type as if they were all equally distinct. Here, we examine floristic similarity between forest types to assess the reliability of vegetation maps as a surrogate for canopy tree-community composition. We analyzed floristic differences at the genus level between twelve Amazonian forest types using 1184 one-hectare inventories of large trees with three complementary approaches. First, we compared a map of floristic composition, from a uni-dimensional NMDS ordination of the inventories, with a map of coarser-level forest types commonly recognized as distinct by classification systems across Amazonia. Using Mantel and means-difference tests, we next examined the distance-decay of floristic similarity for all paired samples and for the pairs drawn from within and between twelve more finely divided forest types. Finally, we examined the degree of floristic separation of each pair of the twelve forest types using non-parametric analysis of variance. Maps of floristic composition and coarse-level forest types were highly congruent. At the finer level of classification, similarity was only slightly higher when pairs were drawn from the same versus from different forest types. This was true for all geographic distances. Nonetheless, eighty percent of the 66 paired combinations of forest types were significantly different in the unreduced genus-space and nearly half showed little or no overlap in a two-dimensional ordination. Three types were most distinct from all others: white sand, seasonally dry, and bamboo-dominated forests. Here, we show that forest types exhibit variable degrees of separation. For this reason, treating all fine-level forest types as equally distinct results in poor representation of canopy tree beta diversity. We recommend explicitly considering the degree of floristic separation between all forest types as presented here for Amazonian flora as a way to improve the use of this biodiversity surrogate. Information on species abundance and distribution forms the basis for understanding spatial patterns of biodiversity (Brown and Lomolino 1998). Direct field inventory is slow and expensive, particularly in mega-diverse regions (Magnusson et al. 2005, Gardner et al. 2008). Knowledge of abundance and distribution is incomplete, both in terms of spatial coverage and the species groups considered (Ferrier and Watson 1997). Nonetheless, such data are required for conservation planning, environmental change monitoring and environmental impact studies. In the absence of adequate field inventory, surrogates have been used to represent biological composition (Margules et al. 2002). In the Brazilian Amazon, vegetation maps have been employed as surrogates for the beta diversity of both flora and fauna in conservation planning (Capobianco et al. 2001 and references therein, Oliveira and Nelson 2001). Typi- cally, conservation goals are established for habitat classes formed from combinations of ecoregion (Olson et al. 2001), interfluve, vegetation type, and/or soil type. In the most recent official conservation plan (Brasil 2008), a fixed percentage of each terrestrial habitat class was set as a conservation goal, though goals were higher for classes covering B50 000 km 2 . This approach presumes that there is a correlation between the true distribution of species and the surrogate (Ferrier and Watson 1997) and that all terrestrial habitat classes are equally distinct. In those regions where vegetation classification has been based on floristic composition as in Australia (Beard 1975) or Africa (White 1976) vegetation classes should be floristically distinct. In most tropical forests, however, diversity is high and many species’ ranges are poorly circumscribed, so classification systems and vegetation maps based on floristics have not been feasible. Though not explicitly based on composition, one can expect significant floristic differences between the forest types in the Brazilian vegetation classification system devised by Veloso et al. (1991), as composition was not Ecography 33: 738747, 2010 doi: 10.1111/j.1600-0587.2009.06139.x # 2010 The Authors. Journal compilation # 2010 Ecography Subject Editor: Jens-Christian Svenning. Accepted 23 November 2009 738
-
Upload
independent -
Category
Documents
-
view
0 -
download
0
Transcript of Floristic relationships of terra firme forests in the Brazilian Amazon

Assessing the relationship between forest types and canopy tree betadiversity in Amazonia
Thaise Emilio, Bruce Walker Nelson, Juliana Schietti, Sylvain J.-M. Desmouliere,Helder M. V. Espırito Santo and Flavia R. C. Costa
T. Emilio ([email protected]), B. Walker Nelson, J. Schietti, S. J.-M. Desmouliere, H. M. V. Espırito-Santo and F. R. C. Costa, Inst.Nacional de Pesquisas da Amazonia (INPA), Av. Andre Araujo, 2936, 69011-970 � P.O. BOX 478, Manaus, Brazil.
Planning of conservation priorities has often taken mapped forest types as surrogates for biological complementarity. Inthe Brazilian Amazon, these exercises have given equal weight to each forest type as if they were all equally distinct. Here,we examine floristic similarity between forest types to assess the reliability of vegetation maps as a surrogate for canopytree-community composition. We analyzed floristic differences at the genus level between twelve Amazonian forest typesusing 1184 one-hectare inventories of large trees with three complementary approaches. First, we compared a map offloristic composition, from a uni-dimensional NMDS ordination of the inventories, with a map of coarser-level foresttypes commonly recognized as distinct by classification systems across Amazonia. Using Mantel and means-differencetests, we next examined the distance-decay of floristic similarity for all paired samples and for the pairs drawn from withinand between twelve more finely divided forest types. Finally, we examined the degree of floristic separation of each pair ofthe twelve forest types using non-parametric analysis of variance. Maps of floristic composition and coarse-level foresttypes were highly congruent. At the finer level of classification, similarity was only slightly higher when pairs were drawnfrom the same versus from different forest types. This was true for all geographic distances. Nonetheless, eighty percent ofthe 66 paired combinations of forest types were significantly different in the unreduced genus-space and nearly halfshowed little or no overlap in a two-dimensional ordination. Three types were most distinct from all others: white sand,seasonally dry, and bamboo-dominated forests. Here, we show that forest types exhibit variable degrees of separation. Forthis reason, treating all fine-level forest types as equally distinct results in poor representation of canopy tree beta diversity.We recommend explicitly considering the degree of floristic separation between all forest types � as presented here forAmazonian flora � as a way to improve the use of this biodiversity surrogate.
Information on species abundance and distribution formsthe basis for understanding spatial patterns of biodiversity(Brown and Lomolino 1998). Direct field inventory isslow and expensive, particularly in mega-diverse regions(Magnusson et al. 2005, Gardner et al. 2008). Knowledgeof abundance and distribution is incomplete, both in termsof spatial coverage and the species groups considered(Ferrier and Watson 1997). Nonetheless, such data arerequired for conservation planning, environmental changemonitoring and environmental impact studies. In theabsence of adequate field inventory, surrogates have beenused to represent biological composition (Margules et al.2002).
In the Brazilian Amazon, vegetation maps have beenemployed as surrogates for the beta diversity of both floraand fauna in conservation planning (Capobianco et al. 2001and references therein, Oliveira and Nelson 2001). Typi-cally, conservation goals are established for habitat classesformed from combinations of ecoregion (Olson et al.
2001), interfluve, vegetation type, and/or soil type. In themost recent official conservation plan (Brasil 2008), a fixedpercentage of each terrestrial habitat class was set as aconservation goal, though goals were higher for classescovering B50 000 km2. This approach presumes that thereis a correlation between the true distribution of species andthe surrogate (Ferrier and Watson 1997) and that allterrestrial habitat classes are equally distinct. In thoseregions where vegetation classification has been based onfloristic composition � as in Australia (Beard 1975) orAfrica (White 1976) � vegetation classes should befloristically distinct. In most tropical forests, however,diversity is high and many species’ ranges are poorlycircumscribed, so classification systems and vegetationmaps based on floristics have not been feasible.
Though not explicitly based on composition, one canexpect significant floristic differences between the foresttypes in the Brazilian vegetation classification systemdevised by Veloso et al. (1991), as composition was not
Ecography 33: 738�747, 2010
doi: 10.1111/j.1600-0587.2009.06139.x
# 2010 The Authors. Journal compilation # 2010 Ecography
Subject Editor: Jens-Christian Svenning. Accepted 23 November 2009
738
user
Line
-
Line
-
Line
completely ignored. White-sand vegetations were separatedout at the highest level, probably in recognition of their verydistinct flora (Ducke and Black 1953, Pires and Prance1985). The attributes or environmental conditions under-lying other forest types � physiognomy, rainfall, seasonalflooding, altitude and the natural disturbance caused byclimbing bamboos and lianas � are important correlatesof floristic compositional change across the Amazon(Tuomisto et al. 2003, ter Steege et al. 2006, Griscomet al. 2007, Punyasena et al. 2008).
Seasonally dry forests, periodically flooded forests, terra-firme forests on clay soil and forests on white sand (varrillalor campinarana florestada) are among the most frequentlyrecognized forest types in Amazonia (Eva et al. 2004, Fineet al. 2005, Castilho et al. 2006, Tuomisto 2006, Butt et al.2008). However, this is a small number of classes andconsiderable floristic heterogeneity has been observedwithin each type (Clark et al. 1999, Tuomisto et al.2003, Costa et al. 2005). Salovaara et al. (2004) arguedthat forest types based on physiognomy cannot easily besubdivided and have questioned their use as indicators offloristic similarity. It is therefore important to criticallyevaluate the degree of floristic separation between foresttypes in the Amazon.
Standardized floristic inventory data for the BrazilianAmazon region are still insufficient to evaluate the floristicseparation between forest types at species level. A largenumber of widespread inventories are, however, available atthe genus level of resolution. These have recently been usedto reveal basin-wide patterns of floristic variation (ter Steegeet al. 2006), but variation within and between forest typeshas not yet been explored. Genus-level floristic patterns arenot necessarily the same as species-level patterns. Thecongruence between the two will depend on which factorsdrive genus diversification. For example, the genus-levelcould show a floristic pattern different from that of species,if the species within a single genus have evolved to exploitdistinct habitats, as reported by Fine et al. (2005) forBurseraceae. This is akin to the species-pairs described byPrance (1994) within genera of Chrysobalanaceae. Con-versely, if all species in each genus tend to have similarecological responses, genus-level floristic pattern amongsites should be similar to those at the species level (Higginsand Ruokolainen 2004). Though we cannot directly inferfloristic variation at the species level from genus-levelpatterns, exploring genus-level inventories will improveknowledge of floristic patterns in Amazonia.
Here, we examine the ability to predict beta diversity ofcanopy trees at the genus level using twelve forest types ofthe Brazilian Amazon, within which 1184 one-hectareinventories of large trees had been previously conducted.This is accomplished by analyzing 1) the spatial congruencebetween forest types and floristic composition representedby ordination scores; 2) the pattern of decrease in similaritywith increasing geographic distance for sample pairs takenfrom the same and taken from different forest types; and3) the degree of floristic separation between all 66 pairedcombinations of the twelve forest types. Finally, we applycluster analysis to create a new hierarchy of forest typesbased on their floristic similarity.
Methods
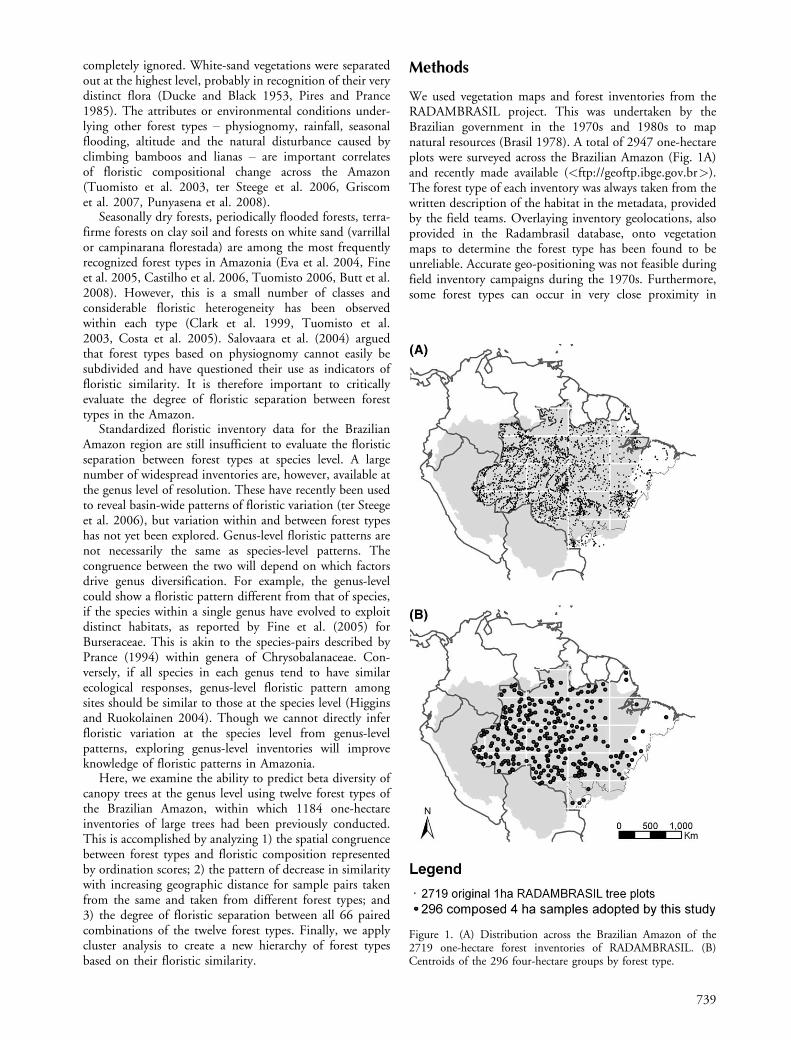
We used vegetation maps and forest inventories from theRADAMBRASIL project. This was undertaken by theBrazilian government in the 1970s and 1980s to mapnatural resources (Brasil 1978). A total of 2947 one-hectareplots were surveyed across the Brazilian Amazon (Fig. 1A)and recently made available (/<ftp://geoftp.ibge.gov.br/>).The forest type of each inventory was always taken from thewritten description of the habitat in the metadata, providedby the field teams. Overlaying inventory geolocations, alsoprovided in the Radambrasil database, onto vegetationmaps to determine the forest type has been found to beunreliable. Accurate geo-positioning was not feasible duringfield inventory campaigns during the 1970s. Furthermore,some forest types can occur in very close proximity in
Figure 1. (A) Distribution across the Brazilian Amazon of the2719 one-hectare forest inventories of RADAMBRASIL. (B)Centroids of the 296 four-hectare groups by forest type.
739

Amazonia, due to their association with different soil typesalong a single catena.
Vegetation classes (forest and non-forest types) wereorganized into a standard hierarchy and nomenclature byVeloso et al. (1991). The project mapped these classes byassociating landscape units recognized on 1:250 000 scale X-band radar images (wall-to-wall coverage obtained in 1971/1972), with vegetation classes detected in air photos. Theinventory plots served as ground-truth for RADAMBRASILto validate and refine the map units. Vegetation maps weredrafted at the same scale as the radar images (Brasil 1978)but published at 1:1 000 000. The working-scale maps arenow available in vector format (IBGE 1998, /<ftp://geoftp.ibge.gov.br/>). Because the vegetation classes are hierarchi-cal, maps of greater or lesser detail can be produced from thevector data. We selected twelve forested types with sufficientinventory plots for floristic comparisons (Table 1). Thetwelve types cover 93% of the originally forested area of theBrazilian Amazon (see Supplementary material Appendix S1for forest type description).
For 2719 inventories, tree names and abundance datawere available. Inventoried plots measured 20�500 m andincluded only large trees, with diameter at breast height(DBH) �31.8 cm. Each one-hectare plot contained only50918 large trees (mean91 SD). To increase eachsample’s size, we used groups of four one-hectare inven-tories. The grouping obeyed three rules: 1) spread the fourinventories across a sample grain of �200 km diameter;2) join inventories only from the same forest type; and 3)use the finest classification level possible while still obtain-ing at least four groups for each forest type. The 296 groupsformed from 1184 inventories that satisfy these criteria areour sample units (Fig. 1B). Each consolidated samplecontains 208956 large trees.
Tree identifications were made by RADAMBRASIL inthe field using common names which were later associatedwith a species. Though the majority of forest inventories inAmazonia are based on common names, there are nodetailed studies of the reliability of such a posterioriassociation with species names over the entire Amazon.For the flora of Acre in the southwest Amazon, Daly et al.(1999) estimated that only 11% of common names (113of �1000 names) were unambiguously associated with asingle genus. For forests of Guyana and Suriname, however,ter Steege et al. (2006, Supplementary material) estimated
that 95% of all tree common names could be correctlyidentified to the genus level.
Given the small size of each sample and the bettercorrespondence between taxon and common name,we chose to work at the genus level. We examined theconsistency of correspondence between genus name andcommon name within the RADAMBRASIL database forthe 272 genera of this study. Ninety-three percent ofcommon names and 88% of all inventoried trees areunambiguously associated with a single genus name.Differences in botanical knowledge of field workers add afurther unknown error. Twenty-five forest engineers did theinventories, aided by nine botanists who identified all trees(Lima 2008). Inventory metadata indicate that each botanistworked in all parts of the region, that engineers and botanistspaired up in different combinations, and thus tree identi-fication techniques were shared. These procedures tend tohomogenize species concepts between botanists and reducespatially clustered artifacts associated with any remainingidiosyncratic knowledge of each botanist. Genus nameswere updated using the Missouri Botanical Garden’sAngiosperm Phylogeny (/<www.mobot.org/MOBOT/research/APweb//>), w3Tropicos database (/<www.tropicos.org//>) and the International Plant Names Index (/<www.ipni.org/index.html/>).
Spatial congruence between forest types and floristiccomposition
As a first step, we used GIS software to consolidate the twelveforest types into four widely recognized coarse-level groups.These groups were white-sand, seasonally dry, open-canopy,and dense-canopy forests. We compared this with a map offloristic composition change across the Brazilian AmazonForest Biome. Floristic composition of each of the 296samples was represented by its ordination score in a single-axis non-metric multi-dimensional scaling (NMDS) usingthe Bray-Curtis similarity index (Legendre and Legendre1998), based on relative abundances. Ordination scores weremapped across the biome by inverse-distance weightedinterpolation. Additional two-dimensional NMDS andDetrended Correspondence Analysis (DCA) ordinationswere performed to compare the amount of floristic variation
Table 1. Twelve Brazilian Amazon forest types compared in this study (adapted from Veloso et al. 1991) and within-type beta diversity (bd)measured as number of half-changes: bd�(log (1�average internal dissimilarity))/log 0.5.
Forest type Symbol Number of 4 ha samples bd
Open canopy, seasonally flooded, dominated by large palms Aap 18 1.57Open canopy, lowland terra firme, dominated by scandent bamboo Abb 8 1.26Open canopy, lowland terra firme, dominated by large palms Abp 30 1.42Open canopy, submontane, dominated by lianas Asc 35 1.75Open canopy, submontane, dominated by large palms Asp 29 1.54Dense canopy, seasonally flooded, many emergent trees Dae 23 1.58Dense canopy, seasonally flooded, few emergents Dau 6 1.84Dense canopy, lowland terra firme, many emergents Dbe 80 1.26Dense canopy, submontane, many emergents Dse 47 1.44Dense canopy, submontane, few emergents Dsu 4 1.52On white sand soils LO 8 1.11Seasonally dry, semi-deciduous Fs 8 1.94
Total 296
740

explained by our ordinations with results of ter Steege et al.(2006).
We next examined the within-type beta diversity of eachof the twelve fine-level forest types. The metric used was thenumber of half changes. This is based on the averagedissimilarity among sample units within a forest type and itis given as:
bd� (log(1�D))=(log(0:5))
where bd is the beta diversity in half-changes and D is theaverage dissimilarity between all samples within the foresttype, using the complement of the Bray-Curtis similarityindex (Legendre and Legendre 1998, McCune and Grace2002). We adopted this measure rather than the amplitudeof ordination scores within each type, because ordinationscores are based on only part of the floristic variance and arestandardized, thus providing no indication of the absolutemagnitude of floristic turnover. bd uses all unreducedvariation and is not relativized.
As within-type beta diversity differed among forest types,we asked if this was a consequence of the geographic extentof a type. We examined linear regressions relating within-type beta diversity to the mean geographic distance betweenall pairs of sample points within a forest type. Threedistance measures were tested: Euclidean, latitudinal, andlongitudinal.
Distance-decay relationships
We next examined the value of the twelve fine-level foresttypes as beta-diversity surrogates (i.e. their value as proxiesor indicators of distinct floristic composition). Severalstatistical approaches were used here to see whether pairsof samples taken from the same forest type were floristicallymore similar than pairs of samples taken from two differentforest types. At this point we were not concerned with theidentity of each forest type, just whether samples were fromthe same or from different forest types. We examined theefficiency of this simple approach � which has beenfollowed in official conservation planning exercises appliedin the Amazon to date (Brasil 2008).
Floristic similarities of all pairs of the 296 samplesirrespective of forest type were obtained using the Bray-Curtis similarity index (Legendre and Legendre 1998) basedon relative abundances. Non-parametric Spearman correla-tions between the floristic and the geographic distancematrices were obtained and significance evaluated byMantel tests (Legendre and Legendre 1998). Two addi-tional graphs of similarity versus distance were produced,one in which both elements of a pair share the same foresttype, the other having elements always drawn from differenttypes. Linear regressions were fit to each of the plots.
If all or most of the twelve forest types were floristicallydistinct from one another, we expected that within-typepairings would show higher floristic similarity than thebetween-type pairs at any given geographic distance. Wemeasured this by randomly selecting two different samplesof the same forest type and comparing the similaritybetween this within-type pair to an expected distributionof floristic similarities generated from all between-typepairs. This was repeated 10 000 times for each of six
separate distance classes at intervals of 500 km. For eachdistance class examined, we asked what percent of the pairsof samples taken from the same forest type had floristicsimilarity values outside (higher than) the expected range ofvalues for pairs taken from different forest types. ‘‘Expectedrange’’ is the range of values occupied by 95% of thebetween-type pairs. We also conducted a simple test of thedifference between the two means of floristic similaritiesand repeated this test for each distance class.
Floristic separation between forest types
In the procedure just described, some pairs of forest typesthat are floristically close or inseparable may be morewidespread and thus contain many more samples thanfloristically distinct forest types. Our last evaluation of thetwelve fine-level forest types as beta diversity surrogates donot took into account the identity of each forest type,examining floristic separation not on a sample pair basis, butrather by type pairs. To determine both the degree(R2 value) and the significance of floristic separation betweenall samples of any two forest types in the unreduced genus-space, we used non-parametric MANOVA (McCune andGrace 2002). All 66 pairs of the twelve forest types werecompared and critical p-values were adjusted by the Holmcorrection for multiple non-independent tests (Wright1992). A symmetric 12�12 matrix of forest types was filledwith the significant values of R2 and with zeros where notsignificant. A UPGMA hierarchical agglomerative clusteranalysis was then derived from the matrix, producing adendrogram showing the degree of floristic separationbetween all forest types and groups of types.
Statistical analyses were performed using the R-environ-ment (R Development Core Team 2008) with threepackages: vegan (Oksanen 2005), cluster (Maechler et al.2005) and spdep (Bivand et al. 2008). Maps and spatialinterpolations were prepared with ArcGis 9.0.
Results
Floristic composition
The 1184 ha of inventory contained 61 546 identified trees�31.8 cm DBH, from 272 genera in 59 angiospermfamilies (Supplementary material Appendix S2). Individualsnot identified to genus were excluded from the floristicanalyses. About half of all trees belonged to 30 generaand five families: Fabaceae, Sapotaceae, Lecythidaceae,Moraceae and Burseraceae. The most abundant generawere Pouteria (6.1%), Eschweilera (4.5%), Licania (3.6%),Tetragastris (2.7%) and Chrysophyllum (2.4%). Fifty-onegenera (18%) were found in over half the 296 samples,while 28 genera (10%) were present in only one or twosamples and were absent from those forest types with a totalsample size B40 ha. The percent of genera shared betweenany pair of the 296 samples ranged from 10 to 80%.Abundance and frequency of genera were positivelycorrelated (Pearson’s r�0.78; pB0.001).
741
user
Line
user
Line
user
Line
user
Line
user
Line
user
Sticky Note
Em cada MANOVA se analisa a distância entre dois conjuntos de objetos. Isto é diferente de analisar a distância euclidiana entre dois pares de objetos.
-
Cross-Out

Spatial congruence between forest types and floristiccomposition
The single-axis NMDS ordination captured 42% of thetotal floristic variation (a two-dimensional ordinationexplained 71% of all variation but the second axis did notshow clear geographic trends). Floristic composition at thegenus level changed gradually from northwest to southeastacross the Amazon forest biome (Fig. 2A, see Supplemen-tary material Appendix S3 for floristic change inside eachforest type). This change was congruent with the geographictrend in dry season intensity (see map 2 in Sombroek 2001)
and with the spatial pattern of four main forest types (Fig.2B). All inventoried white-sand forests were found in theNW, inventoried dry forests in the SE, dense and openforests were sandwiched in between.
Beta diversity across the entire set of 296 samples wasjust 1.63 half changes. Within-type beta diversity for eachof the twelve forest types approached or exceeded this globalvalue (Fig. 2C), ranging from 1.11 to 1.94 half-changes.This is equivalent to a range of 0.54 to 0.73 for the averagedissimilarity between all sample pairs within a forest type.The lowest within-type beta diversity was found in white-sand forests and the highest in the dry forests (Fig. 2C).Surprisingly, the geographic extent of each forest type wasnot related to its beta diversity (R2�0.176, p�0.5). Therewas also no relation between beta diversity of a forest typeand latitudinal extent (R2�0.301, p�0.5) or longitudinalextent (R2�0.044, p�0.5) of that forest type.
Distance-decay relationships
As shown in Fig. 2B, there was an anisotropic NW/SEgeographic trend of floristic composition change across theBrazilian Amazon. It is nonetheless instructive to examinetotal floristic variation as an isotropic phenomenon, sincethe NW/SE trend was detected in only one ordinationaxis. Floristic similarity decreased in a linear fashion withincreasing geographic distance for all sample pairs (Fig. 3A,Spearman’s r��0.341, Mantel pB0.001).
There was a large overlap in the similarity values forbetween-type and within-type sample pairs, within eachgeographic distance class. Within-type pairs were onlyslightly more similar than between-type pairings fordistances classes up to 2000 km (T�9.56, pB2.2 e�16),as is clear from the small separation between the tworegression lines in Fig. 3A. Residuals are very large for alldata, though slightly smaller for the within-type pairings(Fig. 3B). Fewer than 10% of the pairs of sites drawn fromthe same forest type will show a higher floristic similaritythan the broad range of similarity values expected for pairsdrawn from different forest types. Though statisticallysignificant, ecologically there is almost no meaningfuldifference in the floristic similarity for pairs of inventoriestaken from within or between forest types. But does thismean that forest types have little or no value as surrogatesfor beta diversity? The broad-brush analysis presented aboveis susceptible to the highly uneven sampling effort per foresttype (graph in Supplementary material Appendix S4). Thefloristic separation of each combination of forest types isevaluated in the next section.
Floristic relations between forest types
Fifty-four of the 66 pairs of forest types were floristicallydistinct (asterisks, Fig. 4). The significant np-MANOVA R2
values ranged from 0.03 to 0.37. To illustrate these variabledegrees of separation between pairs of forest types, a two-dimensional NMDS ordination of floristic distance of allpairs of the 296 samples was performed and all the samplesfrom selected pairs of forest types were plotted in these twodimensions (Fig. 4). Samples from forest types showing
Figure 2. Comparison between (A) floristic trend of large canopytrees (interpolated scores of the 296 samples in a single-axisNMDS ordination), (B) the distribution of four main forest typesacross the Brazilian Amazon and (C) within-type beta diversity(bd) measured as number of half-changes: bd�(log (1�averageinternal dissimilarity))/log 0.5.
742

greater segregation in two-dimensional ordination space hadhigher R2 values, meaning they were also more segregated inthe unreduced genus-space. The highest R2 value for any pairof forest types may seem small at just 0.37. However, the
ordinations showed complete segregation of the sets ofsamples from different forest types whenever R2 exceeded0.20 and very little overlap when R2 exceeded 0.09. Takingthe latter threshold, about half of the forest-type pairs werehighly distinct in two-dimensional ordination space.
Three forest types were most floristically distinct fromone another and from all others: white-sand forests (LO),seasonal forests (Fs) and open-canopy bamboo-dominatedforests (Abb). The three seasonally flooded forest typescould not be separated from one another, nor could the twoopen submontane forests. Dense-canopy submontane forestwithout emergents (Dsu) was indistinguishable from sevenother forest types, possibly because very few and well-distributed samples were available from this forest type.
The UPGMA cluster tree based on all 66 R2 values (Fig.5A) clearly showed the unique floristic compositions of dryforest, white-sand forest and bamboo-dominated forest.The cluster diagram had a structure different from thehierarchy inherent in the classification system devised byVeloso et al. (1991) and employed by the RADAMBRASILproject (Fig. 5B).
Discussion
Recently, the understanding that deterministic and stochas-tic processes generate gradual decay of floristic similaritywith distance (Condit et al. 2002), has replaced the idea ofdiscrete boundaries between forest types in tropical forests.Forest types have abrupt boundaries, while large-scalefloristic composition changes gradually. Hence, all foresttypes mapped at coarse scales must enclose some amount offloristic variation.
Continental patterns of directional (anisotropic) varia-tion in canopy tree composition were reported for Amazo-nia by ter Steege et al. (2006), but the spatial resolutionadopted by their study did not permit an assessment of therelationship between forest types and composition change.Ter Steege et al. (2006) used a DCA ordination of 27composited samples from RADAMBRASIL for the Brazi-lian Amazon and comparable inventories from the extra-Brazilian Amazon. Each sample was a list of all generapresent within an area of 440�660 km. They exploredsubdividing these 4�6 degree blocks by landscape/foresttype, but the sub-samples of each block were floristicallyclustered, even when a block contained different forest types(H. ter Steege pers. comm.). For this reason, they discardedthe forest type information and used the full 4�6 degreeblocks as sample units. They explained only 25% of allfloristic variation with two DCA axes and attributed thisvariation to geographic trends in soil fertility and climate.To compare with the 296 samples in our study we alsoapplied a DCA, which explained 59% of all variation intwo axes and 27% in a single axis.
The higher amount of structure detected by our study ismost likely attributable to 1) the larger number of rare generain ter Steege’s much larger dataset, which produce morenoise, 2) the smaller grain size of our composited inventorysamples, and 3) the fact that each of our composite samplescame from a single forest type. In the work by ter Steege et al.(2006), a larger part of the floristic variation between the
Figure 3. Floristic similarity between sample pairs, as a function ofgeographic separation of the elements in each pair. (A) all samplepairs; (B) pairs from within same forest type; (C) pairs fromdifferent forest types. Thick solid and thick dashed lines areregressions for the within and between pairings, respectively. F andp values refer to three tests of variance homogeneity, i.e. equality ofslopes of the 1 and 99% quantile regressions in each graph (dottedlines).
743

underlying one-hectare inventories was subsumed into thecomposite species lists and could therefore not be detected aslow-dimensional structure in the variation between samples.Despite the lower percent of floristic variation captured intwo axes by ter Steege et al. (2006), they found two clearspatial trends oriented perpendicular to one another acrossAmazonia. When we performed two-axis NMDS, the firstaxis was very similar with ter Steege’s second DCA axis(rainfall trend), but the second NMDS axis did not show anyobvious spatial pattern. We did not find any correspondencebetween our NMDS axis 2 and ter Steege’s DCA axis 1 (soilfertility trend), probably because this floristic trend is largelydriven by high fertility values in the western extra-BrazilianAmazon.
In our study, ca 40% of the floristic variation at thegenus level is congruent with a NW/SE large-scale spatialpattern. This floristic gradient is congruent with a map offour coarsely defined forest types and with a trend in lengthand intensity of the dry season. Climate affects both foreststructure and composition, but other abiotic drivers ofchange are certainly present. The relative influences ofbiological interactions, random variation, dispersal limita-tion, and environmental determinism on compositionvariation are not yet well understood (Tuomisto et al.2003). It is unlikely that any single factor acts uniformly onfloristic composition change at multiple scales and environ-mental conditions. However, none of the prior assessments
of surrogate value of forest types (all conducted outsideAmazonia; van Jaarsveld et al. 1998, Faith et al. 2004)considered non-uniform floristic change along environ-mental gradients or between different pairs of thematiclandscape classes (e.g. forest types).
The floristic separation between some forest types was notpredictable from the hierarchy inherent in the classificationsystem devised by Veloso et al. (1991). For example, Velosoet al. (1991) distinguished bamboo-dominated forests only atthe fifth level of classification. Flooded versus non-floodedforests were separated only at their fourth hierarchical level.This is inconsistent with both conventional folk taxonomy ofAmazon forest types and the floristic cluster analysis, whereall flooded forest types form a distinct grouping. On theother hand, Veloso’s decision to separate out white-sandvegetation at the first hierarchical level was consistent with itsunique floristic composition. Dry forests were also separatedat a high level by Veloso, and this is consistent with theirfloristic distance from all other forest types.
We did not expect strong separation between all foresttypes at the genus level, since Neotropical angiosperm generatend to occupy a much greater geographic range than dospecies, some genera include many species and some havespecies occupying very different habitats (Prance 1994).Nonetheless most of the 66 Amazon forest type pairs weresignificantly different in their generic composition and abouthalf of them were highly distinct in the two-dimensional
Figure 4. Floristic separation between all sixty-six comparisons of the twelve forest types in unreduced genus-space, using the R2 value ofnon-parametric MANOVAs. The 54 values with asterisk were significant. A two-dimensional NMDS was performed on all 296 samplesand selected pairs of forest types plotted in this ordination space to illustrate different degrees of separation. See Table 1 andSupplementary material Appendix S1 for forest type codes and descriptions.
744

ordination space. We found three forest types to be verydistinct from all others and from one another � white sandforest, dry forest and bamboo-dominated open-canopyforest. Each of these forest types is limited to a differentsub region of Amazonia. (Dry forest occurs at both thenorthern and southern extremes of Amazonia, but allRADAMBRASIL samples are from the southern portion.)Since these forest types are the most geographically restrictedit is possible that some unknown regional attribute could bethe underlying cause of floristic separation.
Geographic distance clearly has ecologically meaningfulinfluence on similarity, causing a drop from 0.6 to 0.4 over�3000 km. However, it is not possible to partition thevariance in similarity for the complete set of sample pairs,separating out the relative contributions of geographicdistance (or region) and forest type. This would requirean experimental design which nature has not provided: allwithin-type pairs available over the full range of geographicdistances and all forest types present in all regions. It ispossible, however, to compare distance-decay rates ofsimilarity within each forest type. For example, lowlanddense forest has a shallow decrease in similarity withgeographic distance, while dry forests exhibit greaterfloristic change over shorter distances (Supplementarymaterial Appendix S5). Furthermore, the average geo-graphic distance between samples does not explain thedifferences in within-type beta diversity. This means thatestablishing conservation goals for combinations of foresttypes and subregions, such as ecoregions or interfluves � asis also commonly done in Amazon conservation planning �
will not be sufficient to incorporate all within-type betadiversity present in each forest type.
As we show in the section on distance-decay ofsimilarity, if one assumes all forest types to be equallydistinct, vegetation maps will provide a distorted andinefficient beta diversity surrogate. This has nonethelessbeen the assumption underlying conservation planningexercises applied in Amazonia. The implication of this inconservation planning is that if we choose any two sitesfrom the same distance class, B10% of the pairs of sitesdrawn from the same forest type will show a higher floristicsimilarity than pairs from different forest types. When allforest types are taken to have equal surrogacy value, thosepairs of types that are floristically very similar, but areabundant in the landscape diminish the influence of trulydistinct forest types (graph in Supplementary materialAppendix S4), giving the impression (Fig. 3) that maps offine-level forest types are poor surrogates for beta diversityin conservation planning. Conversely, because they arerepresented by very few samples in Amazonian forests, thestrongest surrogates give the false impression that all foresttypes have some (small) predictive value. Species-level re-analysis should increase the detectability of differencesbetween forest types, but will not change the fact thatsome forest type pairs are more distinct than others.
Ignoring the degree of floristic separation between foresttypes makes conservation planning less efficient, since agreater land area is needed to attain a given conservationobjective. Woinarski et al. (1996) found conservationsolutions consumed 18% less land for the same objective, ifone takes into account the degree of floristic complemen-tarity between existing and candidate conservation areas.Furthermore, if inefficient procedures are followed, fewerspecies will be adequately protected when conservationobjectives are only partially attained. Following the exampleof ‘‘maximized gain’’ of Woinarski et al. (1996), the degree offloristic separation between all pairs of Amazonian foresttypes, reported here, can be used as an indication of floristiccomplementarity between these forest types. Each candidatefor a new conservation area should be chosen to maximize theincremental gain in floristic diversity. All candidates’ con-tributions to future gain should be scored iteratively aftereach new area is added, so efficiency and diversity are alwaysmaximized, prior to fully attaining conservation goals.
In summary, we find that Amazon forest types enclosedifferent amounts of floristic variation and exhibit differentdegrees of separation from one other. Because they are notfloristically equidistant, we do not recommend establishingequal conservation goals for all forest types in conservationplanning. Complementarity between existing and candidateconservation areas will be more accurately represented, andconservation planning therefore more efficient, if conserva-tion goals for each forest type are derived using the floristicseparation matrix and the UPGMA cluster diagram presentedhere. The way forward for using forest type’s maps as beta-diversity proxies is to employ algorithms that explicitlyconsider the degree of floristic separation between these types.
Acknowledgements � Brazilian Science Funding Agencies CNPq andFAPEAM awarded stipends to TE, JS, HMVES and SJ-MD. TheNational Inst. for Amazon Research (INPA) provided additional
Figure 5. Comparison between (A) the UPGMA cluster diagrambased on floristic separation between all pairs of forest types and(B) the hierarchy inherent in the vegetation classification schemeused by RADAMBRASIL project. Forest types enclosed in boxesin A are not separable based on floristics at genus level. See Table 1for full names of forest types and number of samples, Supple-mentary material Appendix S1 for descriptions.
745

salaries and infra-structure. This study would not have beenpossible without the pioneering field work of RADAMBRASILteams and follow-up organization into a public database bythe Brazilian Inst. for Geography and Statistics (IBGE). We aregrateful to Alice Vieira and others at IBGE for guidance in use ofthe inventory database. Felipe Costa assisted with databasemanipulation, Victor Landeiro with the R package and JulianaOrtega with standardizing the genus names. Reviewers KalleRuokolainen, Hans ter Steege, Nigel Pitman and Jens-ChristianSvenning made valuable contributions toward an improved manu-script. This is a contribution of the Biodiversity Group of theGEOMA modeling network within the Brazilian Ministry ofScience and Technology.
References
Beard, J. S. 1975. The vegetation survey of Western Australia.� Plant Ecol. 30: 179�187.
Bivand, R. et al. 2008. spdep: spatial dependence: weightingschemes, statistics and models. � R package ver. 0.4-29,
/<http://cran.r-project.org//>.Brasil 1978. Projeto RADAMBRASIL. Vol. (1�34). Geologia,
geomorfologia, pedologia, vegetacao e uso potencial da terra.� Depto Nacional de Producao Mineral.
Brasil 2008. Area Prioritarias para a Conservacao, Uso Sustentavele Reparticao de Benefıcios da Biodiversidade Brasileira:Atualizacao � Portaria MMA No 9, de 23 de janeiro de2007. � Ministerio do Meio Ambiente.
Brown, J. H. and Lomolino, M. V. 1998. Biogeography.� Sinauer.
Butt, N. et al. 2008. Floristic and functional affiliations of woodyplants with climate in western Amazonia. � J. Biogeogr. 35:939�950.
Capobianco, J. P. R. et al. 2001. Biodiversidade na Amazoniabrasileira: avaliacao e acoes prioritarias para a conservacao, usosustentavel e reparticao de benefıcios. � Inst. Socioambiental.
Castilho, C. V. et al. 2006. Variation in aboveground tree livebiomass in a central Amazonian forest: effects of soil andtopography. � For. Ecol. Manage. 234: 85�96.
Clark, D. B. et al. 1999. Edaphic factors and the landscape-scale distributions of tropical rain forest trees. � Ecology 80:2662�2675.
Condit, R. et al. 2002. Beta-diversity in tropical forest trees.� Science 295: 666�669.
Costa, F. et al. 2005. Mesoscale distribution patterns ofAmazonian understorey herbs in relation to topography, soiland watersheds. � J. Ecol. 93: 863�878.
Daly, D. C. et al. 1999. Index to common names of plants in Acre.� /<www.nybg.org/bsci/acre/www2/Names.html/>.
Ducke, A. and Black, G. A. 1953. Phytogeographical notes on theBrazilian Amazon. � Anais da Acad. Brasileira de Ciencias 25:1�46.
Eva, H. D. et al. 2004. A land cover map of South America.� Global Change Biol. 10: 731�744.
Faith, D. P. et al. 2004. The ED strategy: how species-levelsurrogates indicate general biodiversity patterns through an‘environmental diversity’ perspective. � J. Biogeogr. 31: 1207�1217.
Ferrier, S. and Watson, G. 1997. An evaluation of the effective-ness of environmental surrogates and modelling techniques inpredicting the distribution of biological diversity. � /<www.deh.gov.au/biodiversity/publications/technical/surrogates//>, accessed1 May 2008.
Fine, P. A. et al. 2005. The contribution of edaphic heterogeneityto the evolution and diversity of Burseraceae trees in thewestern Amazon. � Evolution 59: 1464�1478.
Gardner, T. A. et al. 2008. The cost-effectiveness of biodiversitysurveys in tropical forests. � Ecol. Lett. 11: 139�150.
Griscom, B. W. et al. 2007. Floristics of bamboo-dominatedstands in lowland terra-firme forests of southwestern Amazo-nia. � J. Torrey Bot. Soc. 134: 108�125.
Higgins, M. A. and Ruokolainen, K. 2004. Rapid tropical forestinventory: a comparison of techniques using inventory datafrom western Amazonia. � Conserv. Biol. 18: 799�811.
IBGE 1998. Recursos Naturais e Meio Ambiente: uma visao doBrasil. � Inst. Brasileiro de Geografia e Estatıstica (IBGE).
Legendre, P. and Legendre, L. 1998. Numerical ecology.� Elsevier.
Lima, M. I. C. 2008. Projeto RADAM: Uma Saga Amazonica.� Paka Tatu.
Maechler, M. et al. 2005. Cluster analysis: basics and extensions.� R package, /<http://cran.r-project.org//>.
Magnusson, W. E. et al. 2005. RAPELD: a modification of theGentry method for biodiversity surveys in long-term ecologicalresearch sites. � Biota Neotrop. 5: 1�6.
Margules, C. R. et al. 2002. Representing biodiversity: dataand procedures for identifying priority areas for conservation.� J. Biosci. 27: 309�326.
McCune, B. and Grace, J. B. 2002. Analysis of ecologicalcommunities. � MjM Software Design.
Oksanen, J. 2005. The vegan package. A community ecologypackage. � R package ver. 1.6-7, /<http://cran.r-project.org//>.
Oliveira, A. A. and Nelson, B. W. 2001. Floristic relationshipsof terra firme forests in the Brazilian Amazon. � For. Ecol.Manage. 146: 169�179.
Olson, D. M. et al. 2001. Terrestrial ecoregions of the world: anew map of life on earth. � BioScience 51: 933�938.
Pires, J. M. and Prance, G. T. 1985. The vegetation types of theBrazilian Amazon. � In: Prance, G. T. and Lovejoy, T. E.(eds), Key environments: Amazonia. Pergamon Press, pp.109�145.
Prance, G. T. 1994. A comparison of the efficacy of higher taxaand species numbers in the assessment of biodiversity in theneotropics. � Phil. Trans. R. Soc. B 345: 89�99.
Punyasena, S. W. et al. 2008. The influence of climate on thespatial patterning of Neotropical plant families. � J. Biogeogr.35: 117�130.
R Development Core Team 2008. R: a language and environmentfor statistical computing. � R Foundation for StatisticalComputing, /<www.R-project.org/>.
Salovaara, K. J. et al. 2004. Forest classification in an Amazonianrainforest landscape using pteridophytes as indicator species.� Ecography 27: 689�700.
Sombroek, W. 2001. Spatial and temporal patterns of Amazonrainfall. Consequences for the planning of agricultural oc-cupation and the protection of primary forests. � Ambio 30:388�396.
ter Steege, H. et al. 2006. Continental-scale patterns of canopy treecomposition and function across Amazonia. � Nature 443:444�447.
Tuomisto, H. 2006. Edaphic niche differentiation among Poly-botrya ferns in western Amazonia: implications for coexistenceand speciation. � Ecography 29: 273�284.
Tuomisto, H. et al. 2003. Dispersal, environment, and floristicvariation of western Amazonian forests. � Science 299:241�244.
van Jaarsveld, A. S. et al. 1998. Biodiversity assessment andconservation strategies. � Science 279: 2106.
Veloso, H. P. et al. 1991. Classificacao da vegetacao brasileira,adaptada a um sistema universal. � Ministerio da Economia,Fazenda e Planejamento, Fundacao Inst. Brasileiro de Geo-grafia e Estatıstica, Diretoria de Geociencias, Depto deRecursos Naturais e Estudos Ambientais.
746

White, F. 1976. The vegetation map of Africa: the history of acompleted project. � Boissiera 24b: 659�666.
Woinarski, J. C. Z. et al. 1996. Application of a taxon prioritysystem for conservation planning by selecting areas which are
most distinct from environments already reserved. � Biol.Conserv. 76: 47�159.
Wright, S. P. 1992. Adjusted p-values for simultaneous inference.� Biometrics 48: 1005�1013.
Download the Supplementary material as file E6139 from /
<www.oikos.ekol.lu.se/appendix/>.
747