ethno-floristic study, vegetation structure and nutraceutical ...
Upload
independentCategory
view
3download
0
1 23
Agroforestry SystemsAn International Journal incorporatingAgroforestry Forum ISSN 0167-4366 Agroforest SystDOI 10.1007/s10457-014-9733-2
Floristic diversity of valonia oaksilvopastoral woodlands in Greece
Michael S. Vrahnakis, GeorgeFotiadis, Anastasia Pantera, AndreasPapadopoulos & Vasilios P. Papanastasis

1 23
Your article is protected by copyright and all
rights are held exclusively by Springer Science
+Business Media Dordrecht. This e-offprint
is for personal use only and shall not be self-
archived in electronic repositories. If you wish
to self-archive your article, please use the
accepted manuscript version for posting on
your own website. You may further deposit
the accepted manuscript version in any
repository, provided it is only made publicly
available 12 months after official publication
or later and provided acknowledgement is
given to the original source of publication
and a link is inserted to the published article
on Springer's website. The link must be
accompanied by the following text: "The final
publication is available at link.springer.com”.

Floristic diversity of valonia oak silvopastoral woodlandsin Greece
Michael S. Vrahnakis • George Fotiadis •
Anastasia Pantera • Andreas Papadopoulos •
Vasilios P. Papanastasis
Received: 3 July 2013 / Accepted: 25 July 2014
� Springer Science+Business Media Dordrecht 2014
Abstract Valonia oak (Quercus ithaburensis subsp.
macrolepis (Kotschy) Hedge and Yaltirik), a deciduous
species grown in the xerothermic conditions of the east
Mediterranean zone of Europe, forms woodlands of
open canopy that permits adequate light to reach the
ground thus sustaining an exceptionally rich flora. In
Greece, these woodlands are mainly used for livestock
grazing and considered important silvopastoral systems.
Nowadays, most of them are abandoned and degraded as
a result of inappropriate management. For the effective
evaluation and sustainable management of these wood-
lands and the establishment of reliable monitoring
systems, a detailed analysis of their plant diversity
characteristics across Greece is needed. This paper aims
at determining and comparing floristic diversity mea-
sures as well as at assessing the impact of human
activities on vegetation and floristic diversity of the most
characteristic valonia oak silvopastoral woodlands of
Greece. It was found that the truncated log-normal
model adequately predicts the species abundance data
for eleven out of the twelve woodlands. From the
statistical comparison of the diversity indices Q-statis-
tic, Berger–Parker dominance index and Shannon-
Wiener measure of equitability, three groups of these
woodlands can be distinguished (a) the high-richness
group of Pentalofos, Lesvos, Lakonia and Thesprotia,
(b) the medium-richness group of Kriti Island, Alex-
androupoli, Strofylia and Galaxidi, and (c) the low-
richness group of Kea Island, Amfilohia, Almyros and
Lilaia. However, the Renyi’s diversity ordering diagram
showed that, generally, in low levels of entropy
inconsistency is the rule and no clear pattern of diversity
is extracted reflecting the impact of complex factors.
Among them, those related to management seem to
mostly determine plant diversity of valonia oak silvo-
pastoral woodlands, with abiotic factors having an
occasionally supporting role. Changes of species rich-
ness and evenness due to livestock grazing as well as
acorn and wood harvesting are further discussed.
Keywords Quercus ithaburensis subsp.
macrolepis � Community organization � Monitoring �Diversity ordering � Human activities
Introduction
Numerous threatened woodland ecosystems of Europe
are found in the Mediterranean biodiversity ‘‘hotspot’’
M. S. Vrahnakis
Department of Forestry and Management of Natural
Environment, Technological University of Thessaly,
43100 Karditsa, Greece
G. Fotiadis � A. Pantera (&) � A. Papadopoulos
Department of Forestry and Natural Environment
Management, TEI of Central Greece, 36100 Karpenissi,
Greece
e-mail: [email protected]
V. P. Papanastasis
Faculty of Forestry and Natural Environment, Aristotle
University, 54124 Thessaloniki, Greece
123
Agroforest Syst
DOI 10.1007/s10457-014-9733-2
Author's personal copy

area (sensu Myers et al. 2000), rich in endemic
elements (Di Castri and Mooney 1973; Quezel 1985;
Greuter 1991, 1994; Thompson 1999; Verdu et al.
2003; Quezel and Medail 2003). Among them, the
silvopastoral woodlands of Quercus ithaburensis
Decaisne generate conservation challenges of first
priority (Quezel 1976; Papanastasis 2002; Pantera
2002; Papadopoulos et al. 2002; Dafis and Kakouros
2006). Q. ithaburensis is a deciduous oak tree species,
endemic of east-Mediterranean zone of Europe. It has
two subspecies: a) Q. ithaburensis (Kotschy) Hedge
and Yaltirik subsp. ithaburensis (tabor oak), found
mostly in Anatolia (Turkey) and the Middle East
(western Asia), and b) Q. ithaburensis subsp. macrol-
epis (Kotschy) Hedge and Yaltirik, hereafter referred
as valonia oak, found mostly in South-East Italy,
Albania, Greece, and west Anatolia (Quezel and
Bonin 1980; Quezel and Barbero 1985; Kaplan and
Gutman 1999). Valonia oak is well adapted to the
xerothermic conditions of the east Mediterranean by
developing open canopies that permit adequate light to
reach the ground floor thus favoring the growth of a
rich flora (Papanastasis 2002). According to a recent
classification of European wood pastures (Bergmeier
et al. 2010), valonia oak woodlands together with the
dehesa-type sclerophyllous woodlands of the west
Mediterranean form the habitat type ‘‘Meridional old-
growth wood-pastures’’, which are bioclimatically
determined by air temperature and the distance from
the coast. However, research on the geographical and
ecological characteristics of valonia oak ecosystems is
relatively limited (Dufour-Dror and Ertas 2004) and
has been carried out mainly in Turkey (Inal 1959) and
Greece (Athanasiadis 1986; Pantera 2001; Papadopo-
ulos et al. 2002, 2003; Pantera et al. 2009).
Past human exploitation has resulted to the degra-
dation of valonia oak woodlands. During the seven-
teenth to nineteenth century, valonia oak woodlands
provided significant products sustaining rural econo-
mies in the east Mediterranean (Karschon 1982;
Giannakopoulou 2002). It is estimated that from the
wider area of Xiromero, western Greece, acorn
production of 385 tons was exported to the markets
of central Europe in nineteenth century (Giannako-
poulou 2002). Its wood was used as firewood and
building material as well as in naval industry. Its
tannins-rich acorns were used in pharmacy, tannery
and dyeing industry and as a feed to animals while its
foliage served as animal fodder during winter. The
understorey layer, rich in grasses and forbs of high
quality and quantity, sustained livestock husbandry for
centuries. All these uses indicate that valonia oak
woodlands are an important silvopastoral system,
equivalent to the dehesas and the montados of the west
Mediterranean (Papanastasis 2002).
Over the years, large areas of valonia oak woodlands
have been gradually transformed to arable lands,
grazing lands or urban areas. Solitary old trees or small
thickets are frequently found inside cultivated areas
indicating that valonia oak woodlands were deforested
in the past and reclaimed for agricultural purposes.
Woodland remnants bear signs of unsustainable use
either from livestock husbandry or over-logging. Today,
remnants of pure valonia oak woodlands consisted of
old trees are mainly restricted to the foothills of
mountainous complexes (Pantera et al. 2009). Their
area is estimated to more than 29,500 ha, mostly
extending along the coastal areas of Greece, in the
Aegean islands, and in the island of Crete (Kriti)
(Pantera 2002; Pantera et al. 2009).
According to Bergmeier et al. (2010), wood pastures
such as the ones of valonia oak are of special importance
at the European level since they constitute transitions
between woodlands and grasslands, with exceptional
structural and compositional characteristics not com-
monly found in either of them. The compositional aspect
of biodiversity and especially of the forest-like floristic
elements is of great importance; its consideration is an
important instrument, especially when maintenance and
protection of threatened ecosystems are the main
priorities (Grill and Cleary 2003; Martınez-Morales
2005; Dıaz et al. 2005; Behera et al. 2005). For the
valonia oak silvopastoral woodlands of Greece in
particular, information about floristic diversity is scarce
and restricted to woodlands of western Greece (Papan-
astasis and Gogos 1983; Pantera 2001). The necessity
and importance of a full registration of vegetation
elements of valonia oak silvopastoral woodlands of
Greece are dictated from the characteristic habitats and
biotopes they form. They are mentioned in the technical
handbook of CORINE land cover system (code: 41.791)
and the annexes of the 92/43/EC Regulations (code:
9350). However, Bergmeier et al. (2010) stressed the
need for re-examining and expanding the protection
measures of initiatives to include these systems together
with their traditional management practices.
According to Platis (2002), for the effective eval-
uation and sustainable management of valonia oak
Agroforest Syst
123
Author's personal copy

woodlands and the establishment of reliable monitor-
ing systems, a detailed description of vegetation and
an evaluation of their biodiversity characteristics are
needed. The objectives of this paper were to determine
and compare several floristic diversity measures and
explore the impact of human activities in valonia oak
silvopastoral woodlands.
Study area
In Greece, valonia oak woodlands are mainly found in
the Quercetalia ilicis zone (dominated by evergreen
broadleaved species—maquis or phryganic vegeta-
tion) and partly in the xerothermic limit of the
deciduous broadleaved oak forests zone (Quercetalia
pubescentis) (Dafis 1973; Athanasiadis 1986). Based
on the distribution map produced by Pantera et al.
(2009), twelve well-defined valonia oak woodlands
scattered throughout Greece were selected, namely the
woodlands of Pentalofos (Pent), Alexandroupoli
(Alex), Almyros (Almy), Amfilochia (Amfi), Galaxidi
(Gala), Kea (Kea), Kriti (Krit), Lakonia (Lako),
Lesvos (Lesv), Lilaia (Lila), Strofilia (Stro) and
Thesprotia (Thes) (Fig. 1).
The most common management practice in all
these woodlands is grazing by livestock, mainly sheep
and goats. This activity is applied in a communal way
because woodlands are state-owned areas allowed to
be grazed without specific regulation by local live-
stock owners. As a result, the intensity of grazing is
often unregulated; either too low resulting in the
overgrowth of the understory vegetation or too heavy,
particularly around animal sheds and watering points.
Both practices have a negative impact on tree regen-
eration which appears to be the main problem in all
these woodlands composed of mainly old trees. A
minor practice currently carried out is firewood
collection. However, it has become a major one in
some woodlands over the last few years due to
economic crisis thus threatening their existence due to
Fig. 1 Distribution of well-
defined stands of valonia
oak silvopastoral woodlands
in Greece
Agroforest Syst
123
Author's personal copy

Ta
ble
1S
tru
ctu
ral,
abio
tic
and
man
agem
ent
fact
ors
of
the
twel
ve
val
on
iao
aksi
lvo
pas
tora
lw
oo
dla
nd
s(n
:n
um
ber
of
qu
adra
ts)
Fac
tors
Ale
x
(n=
12
)
Th
es
(n=
28
)
Alm
y
(n=
16
)
Lil
a
(n=
4)
Pen
t
(n=
64
)
Am
fi
(n=
8)
Lak
o
(n=
32
)
Les
v
(n=
32
)
Kea
(n=
20
)
Kri
t
(n=
32
)
Gal
a
(n=
8)
Str
o
(n=
8)
Str
uct
ura
l
Mea
nco
ver
of
tree
s(%
)4
96
06
75
87
75
16
26
16
54
63
57
8
Mea
nco
ver
of
shru
bs
(%)
61
91
05
8.4
16
12
11
69
75
7.5
Mea
nco
ver
of
her
bs
(%)
57
48
80
77
66
58
24
67
74
79
82
51
Mea
nh
eig
ht
of
tree
s(m
)6
.91
21
11
29
.21
16
.85
.66
.68
.91
2
Ab
ioti
c
Alt
itu
de
(m)
20
71
84
97
72
11
80
21
02
25
19
54
46
21
71
50
3
Slo
pe
(%)
24
38
04
52
42
44
42
32
31
23
50
Geo
log
ical
sub
stra
tea
lim
/ne
11
01
11
10
11
10
dep
/ns
00
10
00
00
00
01
vo
lc.
00
00
00
01
00
00
pH
4.8
55
.50
4.6
96
.19
6.1
77
.35
5.7
05
.25
4.4
06
.75
6.9
35
.76
OM
(%)
1.8
07
.60
8.9
04
.14
3.2
07
.31
1.0
23
.93
4.1
48
.63
7.6
03
.26
Bio
clim
ateb
0.5
10
.50
.51
10
.50
.50
0.5
0.5
0.5
Win
terc
10
.51
0.5
0.5
0.5
0.5
0.5
00
0.5
0.5
Man
agem
ent
Aco
rnp
rod
uct
ion
d0
00
01
00
0.5
10
.50
0
Wo
od
pro
du
ctio
ne
11
01
01
10
00
10
Mea
nst
ock
ing
rate
(SE
/ha)
f0
.58
2.4
10
1.9
72
.91
3.0
32
.50
2.0
52
.57
6.0
61
.01
1.1
9
Bu
rnt
area
g1
10
00
10
00
01
0
Pro
tect
ion
stat
ush
00
10
00
00
00
00
.5
aG
eolo
gic
alsu
bst
rata
are:
lim
esto
ne
(lim
/ne)
,d
epo
siti
on
s(d
ep/n
s),
or
vo
lcan
ic(v
olc
.)(E
xis
ten
ce:
1,
Ab
sen
ce:
0)
bB
iocl
imat
eis
char
acte
rize
das
Hu
mid
:1
,S
ub
-hu
mid
:0
.5,
Sem
i-ar
id:
0c
Win
ter
isch
arac
teri
zed
asC
oo
l:1
,T
emp
erat
e:0
.5,
War
m:
0d
Wit
ho
ut
evid
ence
sfo
rac
orn
coll
ecti
on
:0
,A
corn
coll
ecti
on
inth
ep
ast:
0.5
,A
corn
coll
ecti
on
stil
lac
tiv
e:1
eC
lear
ing
s(fi
rew
oo
d):
1,
On
lyb
ran
chcu
ttin
g(i
nth
ep
ast)
:0
fS
hee
peq
uiv
alen
tsre
fer
tosh
eep
or
go
ats
gW
ild
fire
inth
ela
st2
0y
ears
:1
,N
ow
ild
fire
s:0
hA
bso
lute
pro
tect
ion
(co
ntr
oll
edac
cess
for
tou
rist
s):
1,
Pro
tect
ion
(bu
tu
nco
ntr
oll
edac
cess
for
farm
ers,
tou
rist
s,et
c.):
0.5
,N
op
rote
ctio
nst
atu
s:0
Agroforest Syst
123
Author's personal copy

over-logging and necessitating their conservation. In
the meantime, an initiative to re-establish an ancient
practice, i.e. collecting acorns for tannery, has recently
appeared in valonia oak woodlands grown in some
islands.
Materials and methods
Data collection
For each valonia oak woodland, abiotic data were
collected (Table 1). They included mean altitude
and slope measured in situ by a hypsometer;
geological substrate based on the geological map
produced by the Institute of Geological and Mineral
Research of Greece (Bornovas and Rontogianni
1983); water pH and soil organic matter, two
critical parameters for grazed woodlands (Papana-
stasis 1986; Papaioannou 2004) were also mea-
sured, after randomly taking ten surface soil
samples (0–15 cm deep) in each woodland in the
spring of 2005. Bioclimate was based on the
bioclimatic map of Mavrommatis (1980), and
winter severity, critical for valonia oak distribution
(Pantera et al. 2009), was also measured based on
information derived from the Meteorological Ser-
vice of Greece (1999). Other additional information
included management data for acorn and wood
harvesting, grazing activity in terms of stocking
rate expressed in sheep equivalents (SE) per hectare
(after Pratt and Rasmussen 2001), burning condi-
tion and protection status (Table 1). This later
information was derived from the state services in
charge of land management.
The floristic research was conducted in the wood-
lands in mid-spring to early-summer of 2005 and
2006. Preliminary floristic data were collected in 2005
for each woodland and served to define the 2006
sample size. The formula used was the following
(Southwood and Henderson 2000):
n ¼ s=Ex� �2
where, x: mean number of species found inside a 0.25-
m2 metal square quadrat, placed on relatively homog-
enous sites (in terms of physiognomy of the understory
vegetation), s: standard deviation, and E: the prede-
termined standard error as a decimal of the mean (5 %
was judged adequate).
Given the inherent difficulty in defining the exact
number of individuals per plant taxon found in a
sampling unit (mostly associated to asexual plant
propagation), a modified quadrat was used. The four
sides of the original quadrat (0.5 9 0.5 m2) were sub-
divided so that 25 smaller quadrats of 0.01 m2 each
were produced within it. Subsequently, abundance
data were taken as number of presences (i.e. number of
small quadrats where a species was present). This
method, although it restricts the number of presences
of a taxon to a maximum of 25, is quite attractive as it
minimizes labor cost, and hence the total sampling
cost (Wiegert 1962; Cochran 1977; Krebs 1999).
The upper-story vegetation (standing trees/shrubs)
was recorded to determine its structural characteristics
(Table 1) and included crown aerial interception and
vegetation vertical profile in terms of % canopy
coverage for the three strata: trees, shrubs and herbs, as
well as the mean height of tree layer measured by a
hypsometer.
Data analysis
Soil analyses and plant identification were conducted
in the Soil Analysis and Forest Botany Laboratories of
the Department of Forestry and Management of
Natural Environment, Technological University of
Central Greece, Karpenissi. Soil samples were air
dried prior to analysis. Soil pH was measured electro-
metrically in a 1:1 v/v soil–water suspension (Mc Lean
1982) and soil organic matter by the wet oxidation
method (Nelson and Sommers 1982).
Chorological analysis was performed by means of
the chorological spectrum following Oberdorfer’s
system of geographical partition of Europe into major
floristic units (Oberdorfer 1990) in order to estimate
the effect of Mediterranean climate on the physiog-
nomy of vegetation. The classification of floristic
elements into major life forms was based on Raunki-
aer’s (1910) system as modified by Ellenberg (1956).
Classification was based on Garcke (1972), Pignatti
(1982), Davis (1969), Strid (1986) and Oberdorfer
(1990). Nomenclature of taxa follows Dimopoulos
et al. (2013).
In order to arrange the twelve valonia oak wood-
lands along the structural, abiotic gradients and define
the continuity or not of the vegetation units the
Detrended Correspondence Analysis (DCA) was
applied by using the CANOCO software, ver. 4.5
Agroforest Syst
123
Author's personal copy

(ter Braak and Smilauer 2002). She values of each
structural, abiotic and management factor were
entered the DCA. The percentage values of cover
were square-root transformed prior to their analysis,
while the option of down-weighing rare species, i.e.
for species with very low abundance, was not chosen.
Also, for the qualitative variables, numerical scores
were used. Specifically, for the dominant geological
substrate, a score of 1 was assigned in the case of
presence and 0 for absence; for bioclimate, the scores
were 1 for humid (95 \ Q2 \ 150), 0.5 for sub-humid
(50 \ Q2 \ 95), and 0 for semi-arid (25 \ Q2 \ 50),
while for the winter type the scores were 1 for cool
(0 \ m\3 �C), 0.5 for temperate (3 \ m\7 �C) and 0
for warm (7 \ m \ 10 �C), where Q2: pluviothermic
ratio, and m: mean minimum temperature of the
coldest month (Emberger 1971). Finally, scores
assigned for wood harvesting (1: applied, 0: none),
for acorn harvesting (1: applied, 0: none), for wildfire
events in the last 20 years (1: yes, 0: no), and for
protection status (1: yes, 0: no).
Given the enormous literature on floristic diversity
parameters, problems related to a standard and widely
accepted quantification are often met. The diversity
analyses used in this research combined procedures
developed by Southwood (1978), Routledge (1979)
and Krebs (1999).
At first, fitting of a series of statistical distributions
(species abundance models sensu Magurran (2004)) to
the data was explored. Thus, an insight of the
community organization of valonia oak silvopastoral
woodlands was obtained. The distributions used were
the geometric series (Motomura 1932), log series
(Fisher et al. 1943), log normal (truncated) (Preston
1948; Pielou 1975) and broken-stick (MacArthur
1957).
Secondly, an estimation of species richness was
attempted to obtain an overall view of the potential
species number that valonia oak woodland may
sustain. For this purpose, the sample rarefaction
method was applied (Sanders 1968 corrected by
Hulbert 1971 and Simberloff 1972; Heck et al.
1975). The method estimates how the species number
in a selected sample changes with the number of
individuals. It uses the number of individuals in the
selected sample as a measure of effort. To incorporate
the sampling effort and infer about the ranking of
woodlands according to their species richness, the
rarefaction method was applied in five scales, i.e. for
sampling efforts of 100, 500, 1,000, 2,000, and 3,000
quadrats. Two versions of the rarefaction method were
applied: a finite (sampling performed without replace-
ment) and an infinite (sampling performed with
replacement). Also, the standard error of the estimate
was calculated. The method, estimates the expected
number of species in a random sample of n individuals
(E(Sn)) (Krebs 1999):
EðSnÞ ¼XS
i¼1
1�
N � Ni
n
!
N
n
!
2
66664
3
77775
where S: total number of species found, Ni: number of
individuals per species i, N = R Ni, n = value of
sample size chosen for standardization (n B N),
N
n
!
: N!/n! (N - n)!, i.e. number of combinations
of n individuals that can be chosen from a set of
N individuals.
Finally, a numerical profile of a-diversity was
outlined by calculating the: (a) Q-statistic, to obtain an
arithmetic indication of diversity, (b) Shannon-Wiener
measure of equitability (JH), to express the level of
uniformity (or evenness) of distribution of individuals
per species, and (c) the Berger–Parker dominance
index (d), to obtain a measure of the numerical
importance of the most abundant species. Among
several indices tested, the quantification of diversity
was chosen to be made by the parametric Q-statistic,
since it takes into account the distribution of species
abundances but does not actually entail fitting a model
(Kempton and Taylor 1978). Q-statistic is the measure
of the interquartile slope of the cumulative species
abundance curve and provides an indication of the
diversity of the community with no weighing either
towards very abundant or very rare species (Magurran
2004). It is based on the distribution of species
abundances and is given by the formula:
Q ¼
12
nR1 þPR2�1
R1þ1
nr þ 12
nR2
ln R2
R1
� �
where nr = the total number of species with abun-
dance R, R1 and R2 = 25 and 75 % quantiles, nR1 and
nR2 = the number of species in the class where R1 and
Agroforest Syst
123
Author's personal copy

R2 falls, respectively. The Shannon–Wiener measure
of equitability (JH) is given by the formula
JH ¼ H=log Sð Þ, where H is the Shannon–Wiener
measure of a-diversity and S as above. The Berger–
Parker’s index of dominance is given by the formula
d ¼ Nmax=N, where Nmax is the number of individuals
of the most abundant species, and N as above. For the
a-diversity estimates (i.e. Q-statistic, d, and JH) the
confidence limits were calculated with the use of the
percentile bootstrap technique. The 95 % confidence
intervals were the 2.5 and 97.5 percentiles of the
bootstrap distribution of the estimate (Southwood and
Henderson 2000).
After calculating a-diversity estimates (Q, d, JH), a
statistical pair-wise comparison of the estimates for
each valonia oak woodland was undertaken by using
the randomization test proposed by Solow (1993). The
test re-sampled 10,000 times from a distribution of
species abundances produced by a summation of two
samples. Firstly, the difference (delta, d) between
observed indices of diversity from two samples (i.e.
valonia oak woodlands) was calculated. Then, two t-
tests were performed: (a) a two-sided test, where the
null hypothesis that diversities are equal is tested, by
estimating the number of simulated |d| (after 10,000
randomizations) that are greater than the observed |d|,
and thus calculated the estimated probability that
diversities are equal (values lower than 0.05, i.e. a
proportion of 500 over 10,000 randomizations, indi-
cate that diversities are statistically different), and
(b) a one-sided t test, where the null hypothesis that the
diversity of sample 1 is statistically higher than
diversity of sample 2 is tested, by estimating the
number of simulated d (after 10,000 randomizations)
that are greater than the observed d and thus calculated
the estimated probability that diversity of sample 1 is
greater than sample 2; values lower than 0.05 indicate
that diversity of sample 1 is greater than sample 2,
while values over 0.95, i.e. a proportion of 9,550 over
10,000 randomizations, indicate that sample 2 is more
diverse than sample 1.
Finally, to compare the twelve woodlands in terms
of overall diversity and to define their comparability,
the Renyi’s family equation (Renyi 1961, 1970; Hill
1973) was used. By generating a family of diversity
indices, it is possible to define comparable communi-
ties. This becomes useful when non-parametric indi-
ces of diversity are used for diversity ordering
(Tothmeresz 1995). In a plant community composed
of N species, the pi is the proportional abundance
(often measured as number of individuals) of the i-th
species (i = 1, 2, …, N) such that 0 B pi B 1 andPN
i¼1 pi ¼ 1. Hill (1973), considering that standard
diversity indices measure different aspects of the
partition of abundance between species, proposed a
generalized formulation of diversity by defining a
continuum of possible diversity measures. For a
relative abundance vector P = (p1, p2, …, pM), Renyi
(1970) defined a generalized entropy of order a as
Ha ¼ 11�a
lnPN
i¼1 pai , a C 0. While standard diversity
indices supply point descriptions of community
structure, according to the Renyi’s parametric diver-
sity family there is a continuum of possible diversity
measures that differ in their sensitivity to changes of
the relative abundances of dominant and rare species
as a function of the parameter a (Ricotta 2003).
Accordingly, rather than as a single-point summary
statistics, diversity is seen as a scaling process from
community species richness to its dominance concen-
tration that takes place not in the real but in the
topological data space (Podani 1992). By plotting the
Renyi index to a range of values for generalized
entropy of order a, the diversity ordering diagram is
produced that offers insights for the behaviour of
diversity with increasing levels of entropy. In addition,
the diagram helps to define incompatible communities
in terms of diversity. The biological justification for
using the Renyi’s family equation in studying plant
diversity is found in Ricotta (2003).
Diversity analyses were facilitated by the means of
the software program Species Diversity and Richness,
ver. 4.00, �Pisces Conservation Ltd, 2006, designed
by P.A. Henderson and R.M.H. Seaby.
Results
Ecology: vegetation
Table 1 shows the values of the 18 structural, abiotic
and management factors studied. Tree cover ranged
from 35 % (Gala) to 78 % (Stro), shrub cover from
5 % (Lila) to 75 % (Gala) and herb cover from 24 %
(Lako) to 82 % (Gala). Mean tree height ranged from
5.6 m (Lesv) to 12 m (Thes, Lila, and Stro) and
altitude from 3 m (Stro) to 721 m (Lila) a.s.l. In Almy
and Stro, valonia oak forests are found in plain areas,
Agroforest Syst
123
Author's personal copy

while in the other localities in relatively steep areas
with a maximum slope of 45 % in Lila. Limestone is
the dominant geological substrate, while in the plain
areas of Almy and Stro valonia oak forests are found
on alluvial deposits and in Lesv on volcanic substrate.
Soil pH ranged from 4.4 (Kea) to 7.4 (Amfi) and the
organic matter percentage from 1.0 % (Lako) to 8.9 %
(Almy). Bioclimate ranged from semi-arid (Kea) to
humid (Thes, Pent, Amfi), and winters from warm
(Kriti, Kea) to cool (Alex, Almy). For management
factors, finally, acorn harvesting was practised in four,
wood harvesting in six, wildfire occurred in four and
protection is applied to two out of the twelve
woodlands while the stocking rate ranged from zero
to 6.06 SE/ha.
Understory vegetation differentiates into (a) herba-
ceous and shrubby vegetation in the humid areas
(western Greece), and (b) shrubby and phryganic
vegetation in the semi-arid areas; complex vegetation
understory is found in sub-humid areas. Floristically,
Mediterranean elements dominate over sub-Mediter-
ranean and Eurasiatic ones, supporting the character-
ization of valonia oak as a typical Mediterranean
woodland (Fig. 2). Therophytes dominate uniformly
over the other life forms, with a mean presence of
42.49 % for all woodlands, followed by hemicrypto-
phytes (29.56 %) and phanerophytes (13.44 %).
Commonness: consistency
A total of 302 plant taxa were identified. The most
common were Galium aparine (present in 11 wood-
lands), Asphodelus ramosus subsp. ramosus, Sherar-
dia arvensis and Bromus sterilis (in 10 woodlands),
Asparagus acutifolius and Cynosurus echinatus (in 9
woodlands), Geranium purpureum (in 8 woodlands),
Phlomis fruticosa, Torilis arvensis, Ranunculus nea-
politanus and Dactylis glomerata (in 7 woodlands).
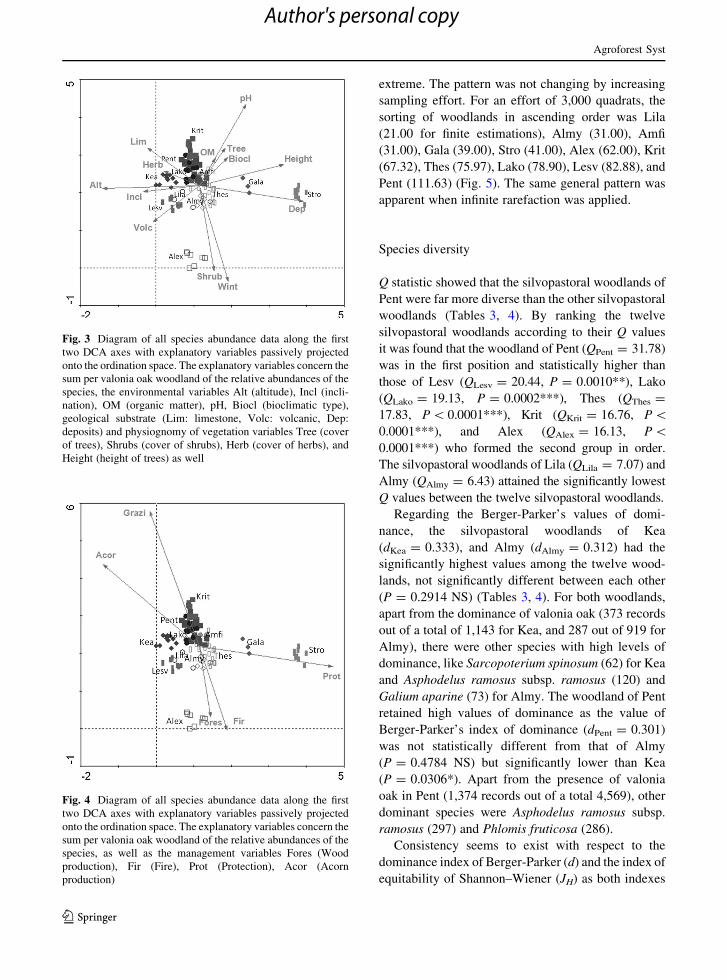
DCA revealed a geographical consistency of the
vegetation in terms of species abundances at least for
the adjacent woodlands of Almy, Thes, Amfi, Pent,
and Lako (Figs. 3, 4). For the two axes, the cumulative
percentage variance of species x environment and
management relations equals to 36.4 %. This pattern
is interrupted for those woodlands found either on
islands (Lesv, Kea, Krit) or remote areas (Alex). The
presence of species with defensive mechanisms and
thus of low selectivity was high and typical in the
understorey vegetation. Such species with long awns
and thistles were Bromus sterilis in 10 woodlands,
Cynosurus echinatus and Asparagus acutifolius in 9
woodlands, and Acanthus spinosus and Euphorbia
acanthothamnos in 7 woodlands. Additionally, some
species of low palatability were Galium aparine in 11
woodlands, Asphodelus ramosus subsp. ramosus in 10
woodlands, Geranium purpureum in 8 woodlands, and
Phlomis fruticosa, E. dendroides and Torilis arvensis
in 7 woodlands.
The ordination of species abundance data along
with the abiotic variables revealed a clear discrimina-
tion of species abundance of Alex due to shrub cover
and cool winter (Fig. 3). Alluvial deposits seem to
affect species abundance of Stro, and volcanic
substrate discriminated species abundance of Lesv.
For Gala, tree height affected species abundance.
When ordination of species abundance along man-
agement gradient was attempted, it revealed that Stro
was highly affected by protection status while wood
harvesting and fires mostly affected the species
abundance of valonia oak woodlands in Alex
(Fig. 4). Grazing seems to have affected species
abundance of Krit, Pent, Lako, while Kea was highly
affected by acorn harvesting.
Species abundance models
Generally, in most cases the truncated log-normal
model adequately fits the species abundance
(Table 2). This is the case for eleven out of the twelve
woodlands, while by using a more relaxed statistical
criterion (i.e. lower level of significance), other
models may fit too (data not shown). For example, in
the case of Stro all four examined models may fit (for
geometric: v(0.05, 5)2 = 54.73 with P = 0.060, for log
series: v(0.05, 5)2 = 9.10, P = 0.105, for truncated log-
normal: v(0.05, 5)2 = 1.28, P = 0.937, and for broken
stick: v(0.05, 5)2 = 7.38, P = 0.194).
Species richness
The poorest woodland in terms of species richness was
Lila (21 plant species encountered), and the woodland
of Pent was the richest (115 plant species). The other
woodlands were found between these two extremes;
the group of Almy (30 species), Amfi (31), Kea (36),
Gala (39), Stro (40), and Alex (62), which was close to
Lila extreme, and the group of Krit (68), Thes (77),
Lako (80), and Lesv (84), which was close to Pent
Agroforest Syst
123
Author's personal copy

Fig. 2 Chorological
spectrum of the floristic
elements of the twelve
valonia oak silvopastoral
woodlands (where Med:
Mediterranean, Smed: Sub-
Mediterranean, Euras:
Eurasiatic, Omed/Osmed:
East Mediterranean/East
Sub-Mediterranean. Rest
includes North, Greek
endemics, Cosmopolitan,
Continental, Balkan
endemics, Alpine, Sub-
Cosmopolitan, Cultivated,
Greek Subendemic, and
Subatlantic/West
Mediterranean)
Agroforest Syst
123
Author's personal copy
extreme. The pattern was not changing by increasing
sampling effort. For an effort of 3,000 quadrats, the
sorting of woodlands in ascending order was Lila
(21.00 for finite estimations), Almy (31.00), Amfi
(31.00), Gala (39.00), Stro (41.00), Alex (62.00), Krit
(67.32), Thes (75.97), Lako (78.90), Lesv (82.88), and
Pent (111.63) (Fig. 5). The same general pattern was
apparent when infinite rarefaction was applied.
Species diversity
Q statistic showed that the silvopastoral woodlands of
Pent were far more diverse than the other silvopastoral
woodlands (Tables 3, 4). By ranking the twelve
silvopastoral woodlands according to their Q values
it was found that the woodland of Pent (QPent = 31.78)
was in the first position and statistically higher than
those of Lesv (QLesv = 20.44, P = 0.0010**), Lako
(QLako = 19.13, P = 0.0002***), Thes (QThes =
17.83, P \ 0.0001***), Krit (QKrit = 16.76, P \0.0001***), and Alex (QAlex = 16.13, P \0.0001***) who formed the second group in order.
The silvopastoral woodlands of Lila (QLila = 7.07) and
Almy (QAlmy = 6.43) attained the significantly lowest
Q values between the twelve silvopastoral woodlands.
Regarding the Berger-Parker’s values of domi-
nance, the silvopastoral woodlands of Kea
(dKea = 0.333), and Almy (dAlmy = 0.312) had the
significantly highest values among the twelve wood-
lands, not significantly different between each other
(P = 0.2914 NS) (Tables 3, 4). For both woodlands,
apart from the dominance of valonia oak (373 records
out of a total of 1,143 for Kea, and 287 out of 919 for
Almy), there were other species with high levels of
dominance, like Sarcopoterium spinosum (62) for Kea
and Asphodelus ramosus subsp. ramosus (120) and
Galium aparine (73) for Almy. The woodland of Pent
retained high values of dominance as the value of
Berger-Parker’s index of dominance (dPent = 0.301)
was not statistically different from that of Almy
(P = 0.4784 NS) but significantly lower than Kea
(P = 0.0306*). Apart from the presence of valonia
oak in Pent (1,374 records out of a total 4,569), other
dominant species were Asphodelus ramosus subsp.
ramosus (297) and Phlomis fruticosa (286).
Consistency seems to exist with respect to the
dominance index of Berger-Parker (d) and the index of
equitability of Shannon–Wiener (JH) as both indexes
Fig. 3 Diagram of all species abundance data along the first
two DCA axes with explanatory variables passively projected
onto the ordination space. The explanatory variables concern the
sum per valonia oak woodland of the relative abundances of the
species, the environmental variables Alt (altitude), Incl (incli-
nation), OM (organic matter), pH, Biocl (bioclimatic type),
geological substrate (Lim: limestone, Volc: volcanic, Dep:
deposits) and physiognomy of vegetation variables Tree (cover
of trees), Shrubs (cover of shrubs), Herb (cover of herbs), and
Height (height of trees) as well
Fig. 4 Diagram of all species abundance data along the first
two DCA axes with explanatory variables passively projected
onto the ordination space. The explanatory variables concern the
sum per valonia oak woodland of the relative abundances of the
species, as well as the management variables Fores (Wood
production), Fir (Fire), Prot (Protection), Acor (Acorn
production)
Agroforest Syst
123
Author's personal copy

were inversely related (Table 3). Indeed woodlands
with high values of JH were associated with low
dominance (d). This implies that woodlands with the
individual plants of each species evenly distributed
into species showed low levels of dominance. For
example, the woodland of Gala was found in the last
position in terms of the dominance index of Berger-
Parker (or in the first when the inverse term 1/d is
considered) with dGala = 0.120, and in the first
position when the index of equitability of Shannon-
Wiener (JHGala = 0.864) was considered. Con-
versely, the woodland of Kea showed relatively
high levels of dominance (dKea = 0.333), sorting
this woodland in the first position in terms of
dominance, and low levels of equitability
(JHKea = 0.737), sorting this woodland in the tenth
position in terms of equitability. Woodlands of Gala
and Lila (JHLila = 0.859) formed a statistical supe-
rior group in terms of equitability, not statistically
different between each other (data not shown), while
the woodland of Pent was found in the last position
in terms of equitability (JHPent = 0.713).
The Renyi’s diversity ordering diagram showed
that generally the low level of entropy inconsistency is
the rule. Indeed, many intersections existed when
scale parameter varied between 0 and 2 (Fig. 6). After
the value of 2, the number of intersections is getting
lower and diversity profiles are more evenly
distributed.
Discussion
From all tested abundance models, i.e. geometric
series, log series, log normal (truncated) and broken-
stick, it was found that the statistical model of log
normal exhibited a better fit to the abundance data for
almost all valonia oak woodlands, with respect to the
niche-based models of geometric series and broken
stick. The geometric series model describes commu-
nities where few species are dominant and situations
with maximal niche preemption (Ferreira and Petrere
2008), while the broken stick emphasizes species
richness and implies that an ecological factor is evenly
shared between species (Higgins and Strauss 2008).
The statistical log series model seems to be the case
when a community is organized on a small number of
abundant species and large species rarity, and better
reflects temporally organized community patterns
(e.g. Kaltsas et al. 2012). The log normal community
assembly supports the assumption for sequential
breaking of empty niche space in community forma-
tion, proposed by Sugihara (1980). Accordingly, each
species entering the community uses niche space
successively and proportionally to its abundance,
while the size of niche space does not affect its
probability to be subdivided. Also, the community
formation is heavily based on an ecological or
evolutionary process (Sugihara 1980) (e.g. succession
in our case). Although the lognormal distribution is
Table 2 Model statistics and Chi square test of significance (v(0.0052
,df)) for geometric, log series, truncated log normal, and broken
stick models fitted to species abundance data obtained from the twelve valonia oak silvopastoral woodlands
Geometric Log series Trunc log normal Broken stick
Alex (df = 6) nf v2 = 4.47, P = 0.484 v2 = 3.29, P = 0.655 nf
Almy (df = 6) nf nf nf nf
Amfi (df = 5) nf nf v2 = 7.08, P = 0.214 nf
Gala (df = 5) v2 = 33.67, P = 0.670 nf v2 = 2.42, P = 0.788 v2 = 7.25, P = 0.203
Kea (df = 5) nf v2 = 11.04, P = 0.087 v2 = 3.29, P = 0.772 v2 = 7.43, P = 0.191
Krit (df = 8) nf v2 = 11.15, P = 0.132 v2 = 2.54, P = 0.924 nf
Lako (df = 8) nf nf v2 = 5.12, P = 0.645 nf
Lesv (df = 8) nf nf v2 = 7.23, P = 0.406 nf
Lila (df = 4) v2 = 27.25, P = 0.128 v2 = 2.79, P = 0.248 v2 = 2.38, P = 0.666 v2 = 2.39, P = 0.495
Pent (df = 7) nf nf v2 = 3.58, P = 0.827 nf
Stro (df = 5) v2 = 54.73, P = 0.060 v2 = 9.10, P = 0.105 v2 = 1.28, P = 0.937 v2 = 7.38, P = 0.194
Thes (df = 8) nf nf v2 = 7.63, P = 0.367 nf
nf non fitted
Agroforest Syst
123
Author's personal copy

often associated with large, undisturbed communities
(so called default distribution), Matossian et al. (2012)
argues that this is rather attributed to the mathematical
properties when large data set are used. They found
that such distribution fits the plant species abundance
data, after 10 years from a severe disturbance (wild
fire) in a Mediterranean forest community of low
elevation zone. Our study, although shorter, seems to
support this idea, since valonia oak woodlands are
found in a successional stage after long lasting human
caused influences.
By statistically comparing the diversity measures of
Q-statistic, Berger-Parker dominance index and Shan-
non–Wiener measure of equitability, calculated for
each woodland, it is evident that there is not a clear and
consistent ranking of the woodlands. This is often the
case when an ordering of diversity is asked; given the
availability of large number of indices and the
emphasis they placed either on species richness or
species abundance and evenness. Also, the response of
each index to impacts of ecological or other factors is
different. According to Kindt et al. (2006), studies
merely based on a single index of diversity to rank
communities obtain erroneous results. In this respect,
the diversity ordering diagrams of Renyi’s shed more
light (Tothmeresz 1995). Nevertheless, the inspection
of temporal and spatial changes of the indices may
serve as basis to depict the impact of management
actions in monitoring programmes.
When inspecting the whole range of the scale
parameter, that reflects a gradient of the system
entropy in the diversity ordering profiles of the valonia
oak woodlands, no clear pattern is obtained, since
several intersections of diversity lines are apparent.
For entropy values over 2, a more clear order of the
diversity lines was established. Such complex
responses of diversity lines may be attributed to the
ecological (abiotic conditions) and management fac-
tors that either lead to communities of high evenness
(e.g. Galaxidi, Lilaia in our case) or to communities
with high species richness (e.g. Pentalofos, Lakonia),
or both (e.g. Alexandroupoli, Lesvos Island).
The results show that plant diversity of valonia oak
silvopastoral woodlands is determined mostly by
management factors, while abiotic conditions play a
supporting role only in some cases. This is not
surprising since management history is a regulating
factor of diversity in such ecosystems (Alados et al.
2004; Caballero et al. 2009). Three groups of valonia
oak silvopastoral woodlands in respect to their species
richness and/or evenness may be distinguished. The
first group includes the woodlands of Pentalofos,
Lesvos, Lakonia and Thesprotia and it is characterized
by high species richness. Although these woodlands
have a relatively high canopy tree cover, the applied
stocking density deemed as moderate (Kyriazopoulos
et al. 2009) seems to be a controlling factor for
retaining high species richness, since it constrains
shrub encroachment. Generally, in Mediterranean
landscapes shrub encroachment is negatively associ-
ated with plant species richness. It is well documented
that as shrub assemblages become thicker total species
richness declines (Merou and Vrahnakis 1999; Alados
et al. 2004; Vrahnakis et al. 2005; Papadimitriou et al.
Fig. 5 Changes of estimated species richness per sampling efforts of 100, 500, 1000, 2000 and 3000 quadrats, after individual-based
finite rarefaction (vertical bars represent standard errors)
Agroforest Syst
123
Author's personal copy

Ta
ble
3E
stim
ates
of
div
ersi
ty(Q
stat
isti
c),
do
min
ance
(Ber
ger
–P
ark
er’s
ind
exd
)an
deq
uit
abil
ity
(Sh
ann
on
–W
ien
ereq
uit
abil
ity
ind
exJ H
,ca
lcu
late
dse
par
atel
yfo
rea
chsa
mp
le
(i.e
.v
alo
nia
oak
wo
od
lan
d))
for
the
twel
ve
wo
od
lan
ds
Ind
ices
Ale
xA
lmy
Am
fiG
ala
Kea
Kri
tL
ako
Les
vL
ila
Pen
tS
tro
Th
es
Qst
atis
tic
(Q)
16
.13
b,c
6.4
3f
9.6
5e
11
.07
d9
.89
e1
6.7
6b
,c1
9.1
3b
20
.44
b7
.07
f3
1.7
8a
13
.82
c1
7.8
3b
Lo
wer
95
%1
2.4
05
.30
7.1
59
.08
7.9
51
4.8
71
7.5
31
8.3
65
.14
27
.65
10
.04
16
.33
Up
per
95
%1
8.7
67
.50
12
.46
14
.37
11
.73
20
.42
22
.88
24
.18
10
.36
35
.11
15
.89
22
.31
Ber
ger
-Par
ker
(d)
0.1
24
f0
.31
2a,
b0
.24
0c,
d0
.12
0f
0.3
33
a0
.25
5c
0.2
36
e,d
0.2
02
e0
.20
2e
0.3
01
b0
.14
6f
0.2
31
e,d
Lo
wer
95
%0
.09
90
.28
30
.20
70
.10
70
.30
60
.23
70
.21
80
.18
60
.16
10
.28
80
.13
00
.21
2
Up
per
95
%0
.15
20
.34
10
.27
30
.14
90
.36
10
.27
30
.25
30
.21
70
.24
40
.31
50
.17
30
.24
9
Eq
uit
abil
ity
(JH
)0
.82
6b
0.7
38
d0
.77
5c
0.8
64
a0
.73
7d
0.7
28
d0
.77
6c
0.8
00
b,c
0.8
59
a0
.71
3e
0.8
22
b0
.78
6c
Lo
wer
95
%0
.81
60
.71
90
.75
80
.84
10
.71
60
.71
80
.76
70
.79
20
.83
50
.70
40
.80
20
.77
9
Up
per
95
%0
.85
60
.76
60
.81
00
.88
10
.76
40
.74
70
.79
30
.81
60
.89
80
.72
60
.84
30
.80
7
Th
eb
oo
tstr
apte
chn
iqu
ew
asu
sed
toca
lcu
late
up
per
and
low
er9
5%
con
fid
ence
lim
its
of
the
esti
mat
es.
Est
imat
esin
the
sam
eli
ne
foll
ow
edb
yth
esa
me
lett
erar
en
ot
stat
isti
call
y
dif
fere
nt
afte
rS
olo
w’s
two
-sid
edt-
test
sw
ith
10
,00
0ra
nd
om
izat
ion
s
Ta
ble
4P
val
ues
for
tte
sta
com
par
ing
esti
mat
eso
fth
eQ
stat
isti
cin
dex
of
div
ersi
ty(Q
)(o
ver
dia
go
nal
)an
dth
eB
erg
er-P
ark
er’s
ind
exo
fd
om
inan
ce(d
)(u
nd
erd
iag
on
al)
amo
ng
twel
ve
val
on
iao
akw
oo
dla
nd
s
Ale
xA
lmy
Am
fiG
ala
Kea
Kri
tL
ako
Les
vL
ila
Pen
tS
tro
Th
es
Ale
x–
0.0
00
80
.02
95
0.0
41
50
.00
70
0.8
23
60
.23
30
0.1
78
70
.00
04
<0
.00
01
0.4
79
70
.53
85
Alm
y<
0.0
00
1–
0.0
35
90
.02
66
0.0
30
10
.00
02
<0
.00
01
0.0
00
20
.66
24
<0
.00
01
<0
.00
01
0.0
00
2
Am
fi<
0.0
00
10
.00
17
–0
.01
69
0.9
14
60
.00
41
0.0
00
90
.00
02
0.4
53
2<
0.0
00
10
.02
59
0.0
14
7
Gal
a0
.78
06
<0
.00
01
<0
.00
01
–0
.01
77
0.0
28
20
.00
70
0.0
09
10
.00
96
<0
.00
01
0.0
12
70
.03
14
Kea
<0
.00
01
0.2
91
40
.00
01
<0
.00
01
–0
.00
32
0.0
01
30
.00
05
0.0
01
9<
0.0
00
10
.03
59
0.0
05
3
Kri
t<
0.0
00
10
.00
04
0.4
06
9<
0.0
00
1<
0.0
00
1–
0.4
17
80
.24
23
0.0
02
3<
0.0
00
10
.32
88
0.7
33
9
Lak
o<
0.0
00
1<
0.0
00
10
.78
73
<0
.00
01
<0
.00
01
0.1
25
1–
0.6
55
90
.00
06
0.0
00
20
.01
46
0.6
37
7
Les
v<
0.0
00
1<
0.0
00
10
.03
24
<0
.00
01
<0
.00
01
0.0
00
10
.40
40
–0
.00
04
0.0
01
00
.01
04
0.4
82
0
Lil
a0
.00
01
<0
.00
01
0.1
18
80
.00
01
<0
.00
01
0.0
28
00
.14
00
0.8
99
9–
<0
.00
01
0.0
32
10
.00
50
Pen
t<
0.0
00
10
.47
84
0.0
00
8<
0.0
00
10
.03
06
0.0
00
1<
0.0
00
1<
0.0
00
1<
0.0
00
1–
<0
.00
01
<0
.00
01
Str
o0
.24
85
<0
.00
01
<0
.00
01
0.1
20
2<
0.0
00
1<
0.0
00
1<
0.0
00
10
.00
04
0.0
02
9<
0.0
00
1–
0.0
32
0
Th
es<
0.0
00
1<
0.0
00
10
.63
63
<0
.00
01
<0
.00
01
0.0
67
40
.69
43
0.0
22
10
.21
70
<0
.00
01
<0
.00
01
–
Pv
alu
esar
eb
ased
on
two
-sid
edt-
test
saf
ter
10
,00
0ra
nd
om
izat
ion
s(S
olo
w1
99
3).
(Pv
alu
esin
dic
atin
gsi
gn
ifica
nt
dif
fere
nce
sar
ew
ritt
enw
ith
bo
ldch
arac
ters
)
Agroforest Syst
123
Author's personal copy

2004) and biodiversity is favoured by adjusting shrub
cover to 15-50 % (Papachristou 1997; Papanastasis
1999; Pearson et al. 2006; Vrahnakis 2008). Equita-
bility seems to be regulated by the long cessation
time of acorn harvesting; long periods of cessation
lead to high levels of equitability (like in Lesvos) and
low periods lead to low equitability levels (like in
Pentalofos). Besides livestock grazing, acorn har-
vesting seems to contribute to the high species
richness as in Pentalofos. For the valonia oak
woodland of Thesprotia, wood harvesting and wild-
fires had the most important role in the increased
species richness. Generally it has been shown that
disturbances due to management activities result in
the creation of open spaces which elevate biodiver-
sity in the ecosystems (Sirami et al. 2010; Perez
Campana and Valenzuela Montesa 2014). The fact
that the high biodiversity is related to the volcanic
substrate in the Lesvos island has been already
underpinned by other authors too (Arianoutsou-
Faraggitaki 1985; Margari et al. 2009).
The second group includes the silvopastoral wood-
lands of Kriti, Alexandroupoli, Strofylia and Galaxidi,
characterized by medium levels of species richness,
which are also determined by management factors. As
far as livestock grazing is concerned, the stocking
rates applied were either light in the latter three or
heavy in the case of island of Kriti. It has been shown
that if livestock grazing is ceased a rapid change in
species composition takes place, followed by stabil-
ization (e.g. Marriott et al. 2009). This stabilization is
reflected by a rather uniform distribution of individual
plants into species (evenness). However, in the case of
Kriti Island, overgrazing resulted in low plant species
evenness and high dominance values. They included
nitrophilous species, like Oxalis pes-caprae, Galium
aparine and Asphodelus ramosus subsp. ramosus.
The last group consists of the silvopastoral wood-
lands of Kea Island, Amfilohia, Lilaia and Almyros
that are characterized by low species richness and low
or medium evenness. These results should be attrib-
uted not only to the relatively high stocking rates
combined with acorn or wood harvesting in the three
former woodlands, but also to the protection from all
these activities in the latter site suggesting that
complete banning of human activities in these eco-
systems does not favour floristic diversity.
Biological diversity is an important property of an
ecosystem determining its overall function (Loreau
et al. 2002). This property is often realised by its
patterns in space and time (Rosenzweig 2005; Dengler
2005). Thus, the determination of patterns of diversity
and its components is an important instrument,
especially when conservation of threatened ecosys-
tems and landscapes are the main priorities (Grill and
Cleary 2003; Martınez-Morales 2005; Dıaz et al.
2005; Behera et al. 2005; Bergmeier et al. 2010). The
exploration of diversity patterns of the valonia oak
silvopastoral woodlands of Greece showed that special
attention must be drawn when conservation measures
are to be designed and implemented. Specific studies
must be carried out in the near future concerning the
restoration of the traditional human activities in the
valonia oak silvopastoral woodlands so that their
overall diversity in terms of species richness and
evenness is increased.
Acknowledgments This research was conducted in the
framework of the research project ‘‘Ecology of Valonia Oak
Forests in Greece’’ (2005–2007), under the ‘‘EPEAEK,
ARCHIMEDES II programme’’ and was co-funded by the
European Social Fund (75 %) and the Greek Government
(25 %).
References
Alados CL, El Aich A, Papanastasis VP, Ozbek H, Navarro T,
Freitas H, Vrahnakis M, Larrosi D, Cabezudo B (2004)
Change in plant spatial patterns and diversity along the
successional gradient of Mediterranean grazing ecosys-
tems. Ecol Model 180:523–535
Fig. 6 Diversity ordering diagram based on Renyi’s index for
twelve valonia oak forests of Greece. The vertical line,
originated from the scale parameter of 2, serves only for
interpretation purposes
Agroforest Syst
123
Author's personal copy

Arianoutsou-Faraggitaki M (1985) Desertification by over-
grazing in Greece: the case of Lesvos island. J Arid
Environ 9(3):237–242
Athanasiadis N (1986) Forest botany. Part II. Forest trees and
shrubs of Greece. Giahoudis-Giapoudis Publishing,
Thessaloniki
Behera MD, Kushwaha SPS, Roy PS (2005) Rapid assessment of
biological richness in a part of Eastern Himalaya: an inte-
grated three-tier approach. For Ecol Manag 207(3):363–384
Bergmeier E, Petermann J, Schroder E (2010) Geobotanical
survey of wood-pasture habitats in Europe: diversity,
threats and conservation. Biodivers Conserv 19:2995–3014
Bornovas I, Rontogianni Th (1983) Geological map of Greece.
Institute of Geological and Mineral Exploration of Greece,
Athens (in Greek)
Caballero R, Fernandez-Gonzalez F, Perez Badia R, Molle G,
Roggero PP, Bagella S, D’Ottavio P, Papanastasis VP,
Fotiadis G, Sidiropoulou A, Ipikoudis I (2009) Grazing
Systems and Biodiversity in Mediterranean areas: spain.
Italy Greece Pastos XXXIX(1):1–154
Cochran WG (1977) Sampling techniques, 3rd edn. Wiley, New
York
Dafis S (1973) Classification of forest vegetation of Greece.
School of Agronomy-Forestry, Aristotle University of
Thessaloniki, Scientific Annals 15(2):75–91
Dafis S, Kakouros P (2006) Guidelines for the rehabilitation of
degraded oak forests. Greek Biotope/Wetland Centre,
Thessaloniki
Davis PH (1969) Flora of Turkey and the East Aegean Islands,
vol 3. Edinburgh University Press, Edinburgh
Dengler J (2005) Zwischen Estland und Portugal—Gem-
einsamkeiten und Unterschiede der Phytodiversitatsmuster
europaischer Trockenrasen. Tuexenia 25:387–405
Di Castri F, Mooney HA (1973) Mediterranean-type ecosys-
tems: origin and structure. Ecological Studies, vol 7.
Springer-Verlag, Berlin
Dıaz IA, Armesto JJ, Reid S, Sieving KE, Willson MF (2005)
Linking forest structure and composition: avian diversity in
successional forests of Chiloe Island, Chile. Biodivers
Conserv 123(1):91–101
Dimopoulos P, Raus T, Bergmeier E, Constantinidis T, Iatrou G,
Kokkini S, Strid A, Tzanoudakis D (2013) Vascular plants
of Greece. An annotated checklist. Botanic Garden and
Botanical Museum Berlin-Dahlem and Hellenic Botanical
Society, Berlin and Athens
Dufour-Dror J-M, Ertas A (2004) Bioclimatic perspectives in
the distribution of Quercus ithaburensis Decne. subspecies
in Turkey and in the Levant. J Biogeogr 31:461–474
Ellenberg H (1956) Aufgaben und methoden der vegetationsk-
unde. In: Walter H (ed) Einfuhrung in die Phytologie, 4/1.
Verlag Ulmer, Stuttgart
Emberger L (1971) Travaux de botanique et d’ ecologie. Mas-
son, Paris
Ferreira FC, Petrere M Jr (2008) Comments about some species
abundance patterns: classic, neutral, and niche partitioning
models. Braz J Biol 68:1003–1012
Fisher RA, Corbet AS, Williams CB (1943) The relation
between the number of species and the number of indi-
viduals in a random sample of an animal population.
J Anim Ecol 12:42–58
Garcke A (1972) Illustrierte flora von Deutschland und an-
grenzender Gebiete. Verlag Paul Parey, Berlin/Hamburg
Giannakopoulou E (2002) Valonia oak forests (17th–19th cen-
tury): economical perspectives. In: Veltsistas Th, Pantera
A, Papadopoulos AM, Tzoganis A, Kapotis G, Fasoulis
Chr (eds) Valonia oak forests: the past, the present, and the
future. Giahoudis Publishing, Thessaloniki, pp 67–96
Greuter W (1991) Botanical diversity, endemism, rarity, and
extinction in the mediterranean area: an analysis based on
the published volumes of med-checklist. Botan Chron
10:63–79
Greuter W (1994) Extinctions in mediterranean areas. Philos Tr
R Soc Lond B 344:41–46
Grill A, Cleary DFR (2003) Diversity patterns in butterfly
communities of the Greek nature reserve Dadia. Biol
Conserv 114:427–436
Heck KLJ, Van Belle G, Simberloff D (1975) Explicit calcu-
lation of the rarefaction diversity measurement and the
determination of sufficient sample size. Ecology
56:1459–1461
Higgins CL, Strauss RE (2008) Modeling stream fish assem-
blages with niche apportionment models: patterns, pro-
cesses, and scale dependence. Trans Am Fish Soc
137:696–706
Hill MO (1973) Diversity and evenness: a unifying notation and
its consequences. Ecology 54:427–431
Hulbert SH (1971) The non-concept of species diversity: a cri-
tique and alternative parameters. Ecology 52:577–586
Inal S (1959) Valonia oak forests, geographical distribution,
economical importance and management. Orman Umumu
Mudurlugu Yayinlari, Sinan Matbaasi, Istanbul. Sira 280.
Series 14:1–307
Kaltsas D, Trichas A, Mylonas M (2012) Temporal organization
patterns of epigean beetle communities (Coleoptera: car-
abidae, Tenebrionidae) in different successional stages of
eastern Mediterranean maquis. J Nat Hist 46:495–515
Kaplan D, Gutman M (1999) Phenology of Quercus ithambur-
ensis with emphasis on the effect of fire. Forest Ecol Manag
115:61–70
Karschon R (1982) In defense of the Turks: a study of the
destruction of Tabor oak forest in the southern plain of
Sharon. Agriculture Research Organisation Publications
1259-E:54-59
Kempton RA, Taylor LR (1978) The Q statistic and the diversity
of floras. Nature 275:252–253
Kindt R, Van Damme P, Simons AJ (2006) Tree diversity in
western Kenya: using profiles to characterise richness and
evenness. Biodivers Conserv 15:1253–1270
Krebs CJ (1999) Ecological methodology, 2nd edn. Addison
Wesley Longman Inc., Menlo Park
Kyriazopoulos AP, Sklanou P, Nastis AS, Papanastasis VP
(2009) Interactions between grazing behaviour and plant
community structure in shrublands and their consequencies
on desertification. Options Medit A 85:91–97
Loreau M, Naeem S, Inchausti P (2002) Biodiversity and eco-
system functioning. Oxford University Press, Oxford
MacArthur RH (1957) On the relative abundance of bird spe-
cies. Proc Natl Acad Sci USA 43:293–295
Magurran AE (2004) Measuring biological diversity. Blackwell
Publishing, Malden
Agroforest Syst
123
Author's personal copy

Margari V, Gibbard PL, Bryant CL, Tzadakis PC (2009) Char-
acter of vegetational and environmental changes in southern
Europe during the last glacial period; evidence from Lesvos
Island, Greece. Quat Sci Rev 28(13–14):1317–1339
Marriott CA, Hood K, Fisher JM, Pakeman RJ (2009) Long-term
impacts of extensive grazing and abandonment on the species
composition, richness, diversity and productivity of agricul-
tural grassland. Agric Ecosyst Environ 134(3–4):190–200
Martınez-Morales MA (2005) Landscape patterns influencing
bird assemblages in a fragmented neotropical cloud forest.
Biol Conserv 121(1):117–126
Matossian AD, Matsinos YG, Konstantinidis P, Moustakas A
(2012) Post-fire succession indices performance in a
Mediterranean ecosystem. Stoch Environ Res Risk Assess.
doi:10.1007/s00477-012-0593-x
Mavromatis G (1980) The bioclimate of Greece. Relationships
between the climate and the natural vegetation. Bioclimatic
maps, Forest Research 1, Forest Research Institute of
Athens, Greece (in Greek)
Mc Lean EO (1982) Soil pH and rime requirement. In: Page AL
(ed) Methods of Soil Analysis, Part 2. Agronomy and Soil
Science Society of America, Madison, pp 199–223
Merou T, Vrahnakis MS (1999) Effects of kermes oak (Quercus
coccifera L.) on understorey plant species diversity and
evenness in a Mediterranean-type shrubland. Grassland Sci
Eur 4:297–302
Meteorological Service of Greece (1999) Climatic data from the
meteorological stations operated by the Hellenic Meteo-
rological Service (Period 1955–1997), volumes A and B,
Athens, Greece
Motomura I (1932) On the statistical treatment of communities.
Zool Mag (Tokyo) 44:379–383
Myers N, Mittelmeier RA, Mittelmeier CG, da Fonseca GAB,
Kent J (2000) Biodiversity hotspots for conservation pri-
orities. Nature 403:853–858
Nelson DW, Sommers LE (1982) Total carbon, organic carbon
and organic matter requirement. In: Page AL (ed) Methods
of soil analysis, Part 2. Agronomy and Soil Science Society
of America, Madison, pp 539–577
Oberdorfer E (1990) Pflanzensoziologische Exkursionsflora.
Ulmer, Stuttgart
Pantera A (2001) Establishment of Quercus ithamburensis
Decaisne ssp. macrolepis (Kotschy) Hedge & Yaltirik) in
competence with understory vegetation in sylvopastoral
systems. Ph.D. Dissertation, Aristotle University of Thes-
saloniki, Thessaloniki, Greece
Pantera A (2002) Present condition of valonia forests in Greece.
In: Veltsistas Th, Pantera A, Papadopoulos AM, Tzoganis
A, Kapotis G, Fasoulis Chr (eds) Valonia oak forests: the
past, the present, and the future. Giahoudis Publishing,
Thessaloniki, Greece, pp 25–37
Pantera A, Papadopoulos A, Fotiadis G, Papanastasis V (2009)
Distribution and phytogeographical analysis of Quercus
ithaburensis ssp. macrolepis in Greece. Ecol Medit
34:73–82
Papachristou TG (1997) Grazing behaviour of goats and sheep
on kermes oak shrublands. Small Ruminant Res 24:85–93
Papadimitriou M, Tsougrakis Y, Ispikoudis I, Papanastasis VP
(2004) Plant functional types in relation to land use chan-
ges in a semi-arid Mediterranean environment. In: 10th
MEDECOS conference, 25 April–1 May, 2004, Rhodes,
Greece (Arianoutsou, M. and Papanastasis V.P., eds).
Millpress, Rotterdam, pp 1–6
Papadopoulos AM, Veltsistas Th, Pantera A (2002) The position
of valonia oak in the Mediterranean ecosystems. In: Velt-
sistas Th, Pantera A, Papadopoulos AM, Tzoganis A,
Kapotis G, Fasoulis Chr (eds) Valonia oak forests: the past,
the present, and the future. Giahoudis Publishing, Thessa-
loniki, pp 13–23
Papadopoulos A, Pantera A, Papanastasis V (2003) Climatic and
bioclimatic factors and their effect on the distribution of
valonia oak (Quercus ithamburensis Decaisne ssp. mac-
rolepis (Kotschy) Hedge & Yalt.) in Greece. In: 11th
Conference of Hellenic Forestry Society on Forest policy,
forests of coppice stands and protection of natural envi-
ronment, 2003 30 Sept–3 Oct; Ancient Olympia, Greece,
pp 133–141
Papaioannou A (2004) Modifications of surface soil character-
istics due to grazing of a maquis ecosystem in Northern
Greece, Eurosoil 2004, Freiburg, Germany, 4–12 Sept
2004
Papanastasis VP (1986) Integrating goats into Mediterranean
forests. Unasylva 38(154):44–52
Papanastasis VP (1999) Grasslands and woody plants in Europe
with special reference to Greece. Grassl Sci Eur 4:15–24
Papanastasis VP (2002) Valonia oak forests as rangeland
resources. In: Veltsistas Th, Pantera A, Papadopoulos AM,
Tzoganis A, Kapotis G, Fasoulis Chr (eds) Valonia oak
forests: the past, the present, and the future. Giahoudis
Publishing, Thessaloniki, pp 49–54
Papanastasis VP, Gogos AM (1983) Contribution in the regis-
tration and appraisal of rangeland resources of low eleva-
tion zone of western Epirus. For Res 2(IV):93–129
Pearson S, Schiess-Buhler C, Hedinger C, Martin M, Volkart G
(2006) Gestione di prati e pascoli secchi. Ufficio federale
dell’ambiente (UFAM), Berna, AGRIDEA, Lindau, Con-
federazione Svizzera
Perez Campana R, Valenzuela Montesa LM (2014) Agro-urban
open space as a component of agricultural multifunction-ality. J Land Use Sci 9(1):82–104
Pielou EC (1975) Ecological diversity. Wiley, New York
Pignatti S (1982) Flora d’ Italia, vol 1. Edagricole, Bologna
Platis P (2002) Valonia oak forests into the framework of Natura
2000 network. In: Veltsistas Th, Pantera A, Papadopoulos
AM, Tzoganis A, Kapotis G, Fasoulis Chr (eds) Valonia
oak forests: the past, the present, and the future. Giahoudis
Publishing, Thessaloniki, pp 100–104
Podani J (1992) Space series analysis: processes reconsidered.
Abstr Bot 16:25–29
Pratt M, Rasmussen GA (2001) Determining your stocking rate.
Range Management Fact Sheet. Utah State University
Cooperative Extension, NR/RM/04
Preston FW (1948) The commonness and rarity of species.
Ecology 29:254–283
Quezel P (1976) Les forets du pourtour mediterraneen. In:
Forets et maquis mediterraneens: ecologie, conservation et
amenagement. UNESCO, Paris. Note technique MAB
2:9–33
Quezel P (1985) Definition of the Mediterranean region and the
origin of its flora. In: Gomez-Campo C (ed) Plant conser-
vation in the Mediterranean area. Dr. W. Junk Publishers,
Dordrecht, pp 9–24
Agroforest Syst
123
Author's personal copy

Quezel P, Barbero M (1985) Carte de la vegetation potentielle
de la region mediterraneenne. In: Feuille No 1: Medi-
terranee orientale. S.N.R.S., Paris
Quezel P, Bonin G (1980) Les forets feuillues du pourtour
mediterraneen. Constitution, ecologie, situation actuelle,
perspectives. Revue For. Fr., XXXII(3):253–268
Quezel P, Medail F (2003) Ecologie et biogeographie des forets
du bassin Mediterraneen. Collection Environment. Else-
vier, Paris
Raunkiaer C (1910) Statistik der lebensformen als grundlage fur
die biologische pflanzengeographie. Bot. Centralbl., Beih.
27(1):171–206
Renyi A (1961) On measures of entropy and information.
Mathematical Statistics and Probability. In: 4th Berkley
symposium, vol 1. University of California Press, Berkley,
pp 547–561
Renyi A (1970) Probability theory. Akademiai Kiado, Budapest
Ricotta C (2003) On parametric evenness measures. J Theor
Biol 222:189–197
Rosenzweig ML (2005) Species diversity in space and time.
Cambridge University Press, Cambridge
Routledge RD (1979) Diversity indices: which ones are
admissible? J Theor Biol 76:503–515
Sanders HL (1968) Marine benthic diversity: a comparative
study. Am Nat 102:243–282
Simberloff DS (1972) Properties of the rarefaction diversity
measurement. Am Nat 106:414–418
Sirami C, Nespoulous A, Cheylan J-P, Marty P, Hvenegaard
GT, Geniez P, Schatz B, Martin J-L (2010) Long-term
anthropogenic and ecological dynamics of a Mediterranean
landscape: impacts on multiple taxa. Landsc Urban Plan
96(4):214–223
Solow AR (1993) A simple test for change in community
structure. J Anim Ecol 62(1):191–193
Southwood TRE (1978) Ecological methods, 2nd edn. Chapman
and Hall, London
Southwood TRE, Henderson PA (2000) Ecological methods,
3rd edn. Blackwell Science Ltd, Oxford
Strid A (1986) Mountain flora of Greece, vol 1. Cambridge
University Press, Cambridge
Sugihara G (1980) Minimal community structure—an explana-
tion of species abundance patterns. Am Nat 116:770–787
ter Braak CJF, Smilauer P (2002) CANOCO Reference manual
and CanoDraw for Windows user’s guide: Software for
Canonical Community Ordination (version 4.5)
Thompson JD (1999) Population differentiation in Mediterra-
nean plants: insights into colonization history and the
evolution and conservation of endemic species. Heredity
82:29–236
Tothmeresz B (1995) Comparison of different methods for
diversity ordering. J Veg Sci 6(2):283–290
Verdu M, Davila P, Garcıa-Fayos P, Flores-Hernandez N, Va-
liente-Banuet A (2003) ‘Convergent’ traits of Mediterra-
nean woody plants belong to pre-Mediterranean lineages.
Biol J Linn Soc 78:415–427
Vrahnakis MS (2008) Floristic diversity and kermes oak cover.
In: Kantas D (ed.) 2nd Panhellenic animal production
conference, Larissa, 30 June–1 July 2008, pp 500–508
Vrahnakis MS, Fotiadis G, Chouvardas D, Mantzanas K, Pa-
panastasis VP (2005) Components of floristic diversity in
kermes oak shrublands. Grassl Sci Eur 10:149–152
Wiegert RG (1962) The selection of an optimum quadrat size for
sampling the standing crop of grasses and forbs. Ecology
43:125–129
Agroforest Syst
123
Author's personal copy
Copyright © 2022 FDOKUMEN