State-and-transition modelling for Adaptive Management of native woodlands

147
Chapter 7
RELATIONSHIPS BETWEEN STONE MARTENS,GENETS AND CORK OAK WOODLANDS INPORTUGAL
Margarida Santos-Reis, Maria João Santos, Sofia Lourenço, João TiagoMarques, Iris Pereira, and Bruno Pinto
Abstract: Although the stone marten (Martes foina) is widely distributed in Europe, little isknown about its ecological and spatial requirements. Using radiotelemetry andfood habits, we investigated the use of cork oak (Quercus suber) woodlands by anunharvested population of stone martens in SW Portugal. We also evaluated spa-tial ecology and food habits of the common genet, (Genetta genetta), and its nicheoverlap with stone martens. Home range size (minimum convex polygon) of mar-tens (n = 5) and genets (n = 7) averaged 2.6 and 3.3 km2, respectively. Variation inhome range area during the year was associated with breeding activities. Toler-ance among stone martens and genets was greater than between conspecifics ofthe same sex. Both stone martens and genets were nocturnal and used riparianvegetation and cultivated fields more than expected. However, genets also usedoak woodland more than expected for foraging and resting. Stone martens andgenets used similar rest sites. The seasonal variation in resource exploitation bystone martens (58 scats) and genets (75 scats) followed the same pattern. How-ever, in summer and autumn, genets ate more crayfish (Procambarus clarkii) andmammals, while stone martens ate more fruits. Despite similarities in habitat uti-lization and food habits, core areas of both species were mutually exclusive, thussuggesting the existence of some present or past interspecific interaction. Thisstudy suggests that, except for resting, stone martens do not depend on cork oaktrees and its products for existence. However, intensive destruction of understorycover and riparian corridors might alter use of cork oak trees by stone martens andtheir interspecific interactions with genets.
1. INTRODUCTION
Research on the genus Martes is greatly biased towards American martens(Martes americana), fishers (Martes pennanti), and pine martens (Martesmartes) (e.g. Buskirk et al. 1994, Proulx et al. 1997, Griffith 2000) in spite of
148 Martens and Fishers (Martes) in Human-altered Environments
the wide distribution of other Martes, such as stone martens (Martes foina)(Proulx et al. 2003). One possible explanation is that stone marten is the singleMartes species that does not behave as a habitat specialist, and is thereforeassumed to be less vulnerable to habitat change. Another contributing factor isthat stone martens are lightly harvested because of their lower pelt quality, andare apparently not endangered by human exploitation. In Portugal, harvestingor hunting stone martens is illegal (Law-Decret nº338/2001).
The current knowledge on European stone martens is scarce, dispersedover time and space, and mostly devoted to distribution and food habits(Clevenger 1994, Genovesi et al. 1996). Few studies have addressed popula-tion ecology (Lodé 1991, Lopez-Martin et al. 1991, Hermann 1994, Genovesiand Boitani 1997, Genovesi et al. 1997, Vadillo et al. 1997), but conclusionsare still insufficient for a comprehensive understanding. Hence, investigatingthe basic characteristics and spatial requirements of natural populations of stonemartens is still needed for successful management.
In Portugal, the stone marten is a common species with a wide distribu-tion, inhabiting forests and human-altered environments. Its distribution islargely allopatric with the pine marten (Martes martes), a rare species with afragmented and more restricted range (Santos-Reis 1983). However, until now,no study has specifically addressed the ecology of stone martens in Portugal.In 1997, we began a long-term project to analyze intraguild relations in a forestcommunity of mesocarnivores. The selected study site was a cork oak (Quercussuber) woodland supporting a rich community of carnivores: red fox (Vulpesvulpes), least weasel (Mustela nivalis), western polecat (Mustela putorius),Eurasian badger (Meles meles), Eurasian otter (Lutra lutra), common genet(Genetta genetta), Egyptian mongoose (Herpestes ichneumon) and stone mar-ten (one of the most abundant mesocarnivores) (Santos-Reis et al. 1999). Corkoak woodlands are the result of a complex process of co-evolution betweennatural ecosystems and humans, involving centuries of land use practices (Diázet al. 1997, Blondel and Aronson 1999). Thirty-three percent of the worldwidecork oak range is found in Portugal and its survival is threatened due to for-estry and agricultural activities (Pinto Correia 1993), reforestation with exoticspecies (e.g., Eucalyptus spp.), diseases associated with changes in edaphicconditions, and destructive management practices (e.g., understory removal).
Here, we investigated spatial ecology, habitat selection, and food use bystone martens in cork oak woodlands. We also evaluated niche overlap be-tween stone martens and the common genet, a sympatric carnivore of similarsize, equal arboreal aptitude, and similar energetic requirements (Livet andRoeder 1987). Our objectives for both species were to: (1) determine the sizeand distribution of home ranges and core areas; (2) quantify patterns of habitat

149Santos-Reis et al.: Stone Martens, Genets and Cork Oak Woodlands
selection; (3) examine temporal and spatial activity patterns, including restingand feeding, and (4) analyze interspecific interactions. Based on the availableliterature on coexistence principles and resources partitioning (e.g., Powell andZielinski 1983, Maddock and Perrin 1993, Dayan and Simberloff 1996), spac-ing strategies of solitary carnivores (e.g., Powell 1979, Sandell 1989), and thebiology and ecology of stone martens and genets (Livet and Roeder 1987,Libois and Waechter 1991, Clevenger 1994), we hypothesized that: (1) homeranges and core areas would differ by sex and/or season, and their overlapwould be minimal among neighboring individuals but maximal among matedpairs; (2) habitat selection would not differ by sex, but would differ by species;(3) intrasexual bonds of mature individuals would be restricted to the matingseason; and (4) activity patterns, rest site selection, and food preference wouldbe species-specific rather than sex-specific.
2. STUDY AREA
This research was conducted near the south-western coast of Portugal in a35 km2 area (38º 05'N - 38º 08'N and 8º 29'W - 8º 38'W), located on the Grândolahills. The study area included the “Herdade da Ribeira Abaixo” (HRA), a 220-ha field station of the Environmental Biology Center (University of Lisbon),and surrounding private lands characterized by small holdings connected bydirt roads. Topography was gently to moderately rolling, with 0–15% slopeand elevations varying from 150 to 270 m above sea level. Climate is Mediter-ranean under Atlantic influence with very dry and hot summers and cold andrainy winters. Mean annual temperature was 15.6 ºC, and mean annual precipi-tation was 500 mm/year, occasionally reaching 800 mm (Correia and Santos-Reis 1999).
The landscape was dominated (70 to 80%) by cork oak woodland, andsome areas had a developed understory of sage-leaved cistus (Cistus salvifolius).Riparian vegetation was composed of black poplar (Populus nigra), commonalder (Alnus glutinosa), willow (Salix atrocinerea), ash (Fraxinus angustifolia),and blackberry (Rubus ulmifolius) thickets. The study area also included a fewpatches of exotic tree species (Eucalyptus globulus and Pinus pinaster), pas-tures, and small cultivated fields (orchards, vegetable-gardens and olive-yards)associated with scattered and mostly abandoned farm houses.
Human population density in the area was low, but anthropogenic influ-ence on the landscape was high due to activities such as cork extraction insummer, livestock raising year round, and hunting (wild rabbits [Oryctolaguscuniculus], partridges [Alectoris rufa] and, more recently, wild boars [Susscrofa]) from August to February. Although trapping for fur and/or predator

150 Martens and Fishers (Martes) in Human-altered Environments
control was illegal in the area, some poaching occurred (Santos-Reis, personalobservation).
3. METHODS
3.1 Capture and Radio-tracking
Livetrapping, radiocollaring, and radio-tracking occurred in 1997 and 1998.We subdivided a 15-km2 sub-area into 1-km2 squares; in each square, we placed≥2 box traps (Tomahawk Live Trap Co., Wisconsin, USA) in sites selectedaccording to cover density and accessibility. To increase trapping success, wealso used soft-catch foot-hold traps (#2 Victor Long-Spring–Woodstream Cor-poration, Lititz, Pennsylvania, USA). We set sardine-baited traps for an aver-age of 10 days/mo (March–August in 1997 and February–July in 1998), andvisited them daily. Animals were immobilized with an intramuscular injectionof 0.1 ml/kg HCl ketamine (Imalgene 1000, Rhône Mérieux, Lyon, France).We assessed weight, sex, condition (i.e., signs of pregnancy, lactation or es-trus) and took body measurements. Relative age was estimated on the basis oftooth development and characteristics. Three age classes were considered: adults(full dentition with teeth showing some degree of wearing), juveniles (full den-tition with teeth still growing and with sharp cusps), and cubs (with 1 or moremilk teeth). Individuals were permanently identified with ear notches, and sev-eral adults were fitted with 35–40 g mortality-sensitive radio-transmitters(Telonics Inc., Mesa, Arizona, USA). We tested for differences in sex-ratiousing a chi-square test.
Animals were located within a 2 km range using a RA-5A omnidirectionalantenna (Telonics) fixed to the top of a 4-wheel-drive vehicle, and linked to aTR2 receiver with a TS1 scanner (Telonics). Accurate locations were obtainedby walking with a hand-held RA-2A “H” antenna (Telonics) and a portableTRX – 1000S receiver (Wildlife Materials, Carbondale, Illinois, USA). Weused ground triangulation only in places where access was difficult. To reduceerror, azimuths were recorded within a 15 min interval, and we consideredtriangulation locations only for values of crossbearings between 60º and 120º.We investigated animal locations with 2 radio-tracking techniques: (1) system-atic point locations, where the daily location was recorded for a period of 15days/mo, and (2) sequential locations (focal runs), were recorded once per monthon a 24 h basis, or within the activity period with at least 1 location/h.

151Santos-Reis et al.: Stone Martens, Genets and Cork Oak Woodlands
3.2 Home Ranges
Homing locations were geo-referenced using a Global Positioning System(Garmin , Model 75, Olathe, Kansas, USA) and triangulation locations wereconverted to UTM coordinates (Universal Transverse Mercator) using programTRACKER (version 1.1—Camponotus AB and Radio Location Systems 1994,Solna, Sweden). We analyzed seasonal (summer: 21 June–20 September andautumn: 21 September–20 December), and breeding patterns (mating: 15 June–14 August; diapause I: 15 August–14 October; and diapause II: 15 October–15December) following Genovesi and Boitani’s (1997) criteria. Genets do nothave delayed implantation and an extended breeding period. On the basis ofAymerich (1982) and our capture results, we identified 2 periods: breeding (15June to 14 August), and non-breeding (15 August to 15 December). Seasonalpatterns are dependent on resource availability, and breeding patterns reflectdifferent social behavior.
Home range, core areas, and overlap computations were performed withTRACKER software using the minimum convex polygon (MCP) (Mohr 1947in White and Garrot 1990), and the adaptive kernel estimator (AK) (Worton1989). To estimate a non-biased sample size, we determined at what point homerange size reached an asymptote (Stickel 1954 in Harris et al. 1990). For homerange calculations, we used 100% of the locations for the MCP (Genovesi andBoitani 1997), and 95% of the locations for the AK using the Epanechnickovadaptative model (Worton 1989). Core areas were defined using the 50% AK(Harris et al. 1990). We used a coefficient of variation of 1.8 and a 130 m gridsize. We tested for autocorrelation using Schoener’s index at the 0.25 signifi-cance level (Schoener 1981 in Swihart and Slade 1985). We tested for differ-ences in home-range sizes using a Mann-Whitney U-test (Siegel and Castellan1988). Data were combined across years when calculating average home rangeareas.
3.3 Habitat Selection
Five habitat types were considered according to land use pattern in thestudy area: cork oak woodland with pasture, cork oak woodland with shrubs,pasture, riparian vegetation, and cultivated fields (olive-yards, orchards, andvegetable-gardens). We used Chi-square goodness of fit test to evaluate whetheruse was distributed proportional to availability within each MCP home range(Sokal and Rohlf 1995). Whenever H
0 was rejected, the degree of selection
was estimated using the D index that ranges from -1 (avoidance) to +1 (selec-tion) (Jacobs 1974).

152 Martens and Fishers (Martes) in Human-altered Environments
3.4 Activity Pattern
Homing and triangulation locations that referred to the onset and offset ofactivity or to the hourly diel intervals were expressed in terms of GreenwichMeridian Time. Values presented for a given hour (e.g., 21 h) represent theactivity observed in the next diel period (e.g., 21:00–21:59).
Circadian time budgets were quantified using the focal runs when the con-tact with the individual was not lost for more than 2 h during the active period(Stahl 1986). Activity pattern was estimated using the percentage of activelocations (Palomares and Delibes 1991a, Ciucci et al. 1997). Tests for differ-ences among individuals were performed using a Kruskal-Wallis (H) test; cor-relations were obtained with Spearman’s coefficient (r
s) (Zar 1984).
3.5 Diurnal Resting Sites
Homing locations allowed us to identify rest sites that were described in1998 on the basis of structure (e.g., tree, bush, pile of cork). Re-use rates (no.locations in rest sites / total no. of rest sites) and intra-sexual and intra-specificpartioning of rest sites (frequency of locations in a given rest site per indi-vidual of different sex or species) were also calculated.
3.6 Food Habits
In 1997, we collected fecal samples monthly from stone martens and gen-ets along 20 km of line transects and from tree branches. Transects were se-lected along dirt roads that crossed the dominant land use type in proportion totheir availability, and with a distance that maximized the number of home rangesthat were intersected by transects. Scats were dried and sieved under water toseparate food remains (e.g., hairs, feathers, insects, seeds). These were identi-fied to the lowest possible taxon for each food category (e.g., species for mam-mals, order for birds, and family for insects), using identification keys (Debrotet al. 1982, Brom 1986), reference collections, or expert determination. Re-mains with low or no nutritive value (e.g., vegetable matter other than fruits orberries) were not included in the analysis because they were considered to beingested incidentally with other food (Libois and Waechter 1991). For eachitem or food category, results were expressed as percent occurrence and per-cent biomass. Biomass was evaluated using published digestibility coefficients(e.g., Palomares and Delibes 1990) or by multiplying the minimum number ofidentified food items by their mean weight.

153Santos-Reis et al.: Stone Martens, Genets and Cork Oak Woodlands
Niche breath was estimated using Levins standardized index (Ludwig andReynolds 1988). For intraspecific comparisons, the obtained value was con-verted to the Shannon diversity index (H’
I) and tested with the Hutcheson t test
(Zar 1984). We used Pianka’s index to calculate niche overlap between sea-sons and species (Ludwig and Reynolds 1988).
According to available literature (e.g., Livet and Roeder 1987, Libois andWaechter 1991), we live-trapped in 3 main habitats (cork oak woodland withpastures, cork oak woodland with shrubs, and riparian vegetation) to examinethe relationship between food habits and the abundance of small mammals, themost common prey for both species. In 1997, we established a trapline of 100Sherman live-traps (H.B. Sherman Traps, Inc., Tallahassee, Florida, USA). Ineach habitat, traps were 10 m equidistant, and baited with a mixture of sardinesin olive oil and oats. Trapping was conducted for 5 consecutive nights perseason. A mark (fur-shaving) was used to identify each captured individual,and their sex and age were recorded before release. We used capture successand trapping effort to assess relative abundance (Pounds 1981).
All statistical tests were performed at the significance level of α = 0.05,unless specified otherwise.
4. RESULTS
4.1 Capture Success
Twenty-four stone martens were captured in 2,614 trapnights (TN). Only 2juveniles were captured; both were males. Sex ratio was not significantly dif-ferent from 1:1 (13 M: 11 F; χ2 = 0.001, P > 0.05). Five adults (3 M, 2 F) wereequipped with radiocollars and were radio-tracked an average of 6 months insummer and autumn. All individuals were monitored until radio failure, exceptfor 1 adult male (Mf
17) that was found dead after 144 days of radio-tracking
(Table 7.1).During the same trapping period, 46 other carnivores were captured, in-
cluding 20 genets. Sex distribution of genets was nearly even (7 F: 8 M; χ2 =0.001, P > 0.05), and most individuals were adults (n = 15). Seven (4 M, 3 F)adult genets were radiocollared and monitored simultaneously with stone mar-tens (Table 7.1). We lost the radio signal of 1 female (Gg
3) after one month of
monitoring. One male (Gg12
) behaved abnormally after release, and was recap-tured for veterinary treatment and removal of the collar. Another genet male(Gg
2) was monitored from April to December 1997, recaptured and re-equipped
in July 1998, but the radio failed soon after release.

154 Martens and Fishers (Martes) in Human-altered Environments
Table 7.1. Number of telemetry fixes, time to independence and associated data for radiocollaredstone martens and genets in a cork oak woodland of the Grândola Hills in southwestern Portugal,1997–1998.
Focal IndependenceIndividualsa Sex Age Tracking period runsb Fixesc (h)d
Mf1
F Adult 05/24/97–10/28/97 4 60 5:30Mf
2M Adult 07/22/97–11/24/97 6 110 5:00
Mf17
M Adult 06/07/98–10/12/98 3 70 5:00Mf
18M Adult 06/09/98–11/15/98 8 170 4:30
Mf19
F Adult 06/11/98–11/15/98 7 170 4:30Gg
1M Adult 04/24/97–12/14/97 8 110 6:30
Gg2
M Juvenile 05/02/97–12/17/97 9 220 6:30Gg
2aM Adult 07/12/98
Gg3
F Adult 05/05/97–05/31/97Gg
12M Adult 05/03/98
Gg15
F Adult 06/02/98–12/01/98 6 180 5:30Gg
16M Adult 06/05/98–11/15/98 7 150 5:00
Gg20
F Adult 07/10/98–11/15/98 8 180 5:00
aMf = Stone marten; Gg = Common genet; a = recapture of radiocollared animal.bNumber of sequential locations (see methods section).cNumber of fixes to attain the asymptote. (Total number of fixes see Table 7.2.)dTime period for the temporal independence of sequential fixes.
4.2 Home Ranges
4.2.1 Stone Martens Home range areas of stone martens averaged 2.6 km2, (100% MCP); esti-
mates were similar (2.5 km2) to those obtained using the 95% AK technique(Table 7.2). The large MCP value of female Mf
19 resulted from an expansion of
its home range following the death of a neighbor Mf17
. Core areas were onaverage one-fifth smaller (0.5 km2) than home-ranges, and were mutually ex-clusive (Fig. 7.1). Each individual (except Mf
1) had $2 core areas; 1 was used
mostly for foraging and the others for diurnal resting.Spatial segregation was suggested between 2 males (Mf
17 and Mf
18), whose
home ranges overlapped only slightly (Fig. 7.2). The degree of overlap of maleswith females ranged from 13% (Mf
2/Mf
1 and Mf
18/Mf
19) to 33% (Mf
17/Mf
19).
Because all monitored individuals were sexually mature, we assumed that Mf17
and Mf19
constituted a mating pair. This assumption was supported by a greaterextent of home-range overlap during the mating season (0.48 km2) than duringthe following diapause (0.14 km2). During the mating period, the overlap in-cluded part of the female’s core area and diurnal rest sites. The home range of

155Santos-Reis et al.: Stone Martens, Genets and Cork Oak Woodlands
Figure 7.1. Home ranges and core areas (95% and 50% adaptive kernel) of stone martens (Mf)in a cork oak woodland of the Grândola Hills in southwestern Portugal (numbers correspond toUTM coordinates).
Table 7.2. Home range size and seasonal variation of stone martens and genets in a cork oakwoodland of the Grândola Hills in southwestern Portugal, 1997–1998.
Home Range Seasonal Home RangesIndi- MCP (km2) Kernel (km2) Spring Summer Autumnviduala Sex 100% nb 95% 50% nb MCP nb MCP nb MCP nb
Mf1 F 1.65 99 2.37 0.42 17 0.99 65 0.35 32Mf2 M 2.48 180 1.80 0.26 28 1.03 101 2.24 79Mf17 M 2.18 134 2.21 0.92 67 2.15 81 0.95 41Mf18 M 3.67 210 3.53 1.00 83 2.20 105 2.01 109Mf19 F 2.87 239 2.58 0.11 91 1.29 113 2.41 124Gg1 M 3.46 283 3.03 0.59 43 0.80 63 1.89 125 3.04 96Gg2 M 1.90 319 2.60 0.39 36 0.86 94 1.39 109 1.38 107Gg15 F 3.69 216 3.49 0.19 87 2.26 89 3.21 102Gg16 M 4.67 184 4.52 0.42 83 4.31 90 3.57 92Gg20 F 2.72 230 3.42 0.09 80 0.85 102 2.56 128
aMf = Stone marten; Gg = Common genetbNumber of fixes.
male Mf18
also overlapped with that of female Mf19
, and both individuals occa-sionally shared a diurnal rest site.
Seasonal variation in average MCP home ranges were not significant, ei-ther between seasons (summer = 1.53 km2, autumn = 1.59 km2) (Table 7.2) orbreeding periods (mating = 1.14 km2, diapause I = 1.03 km2, diapause II = 1.44km2) (Table 7.3).
____________________________ _________________________________________ ________________ ________ __________ _________
156 Martens and Fishers (Martes) in Human-altered Environments
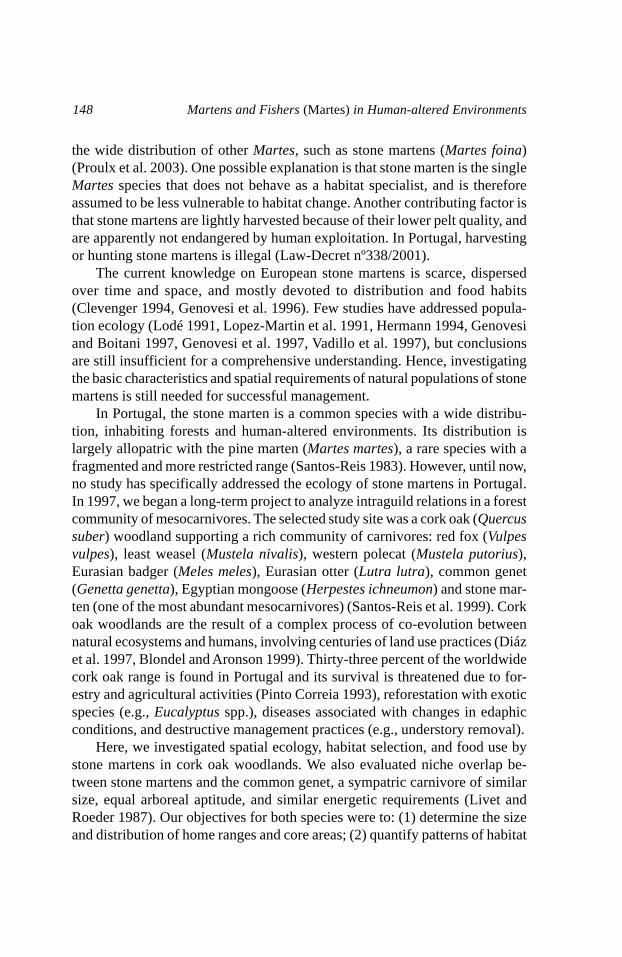
Figure 7.2. Home ranges and core areas (95% and 50% adaptive kernel) of stone martens (Mf)in a cork oak woodland of the Grândola Hills in southwestern Portugal (numbers correspond toUTM coordinates).
4.2.2 GenetsMean home range areas of genets were larger (MCP = 3.29 km2, 95% AK
= 3.41 km2) than for stone martens but core areas of genets averaged only 0.34km2 (Table 7.2). One-third of a male genet’s (Gg
1)
home-range overlapped with
approximately half of another male’s (Gg2)
home range, but no overlap was
observed between females Gg15
and Gg20
. Overlap between the home ranges ofmale Gg
16 and female Gg
15 was high (94% of the female range and 75% of that
of the male), suggesting a mated pair (Fig. 7.3).Average home range areas (MCP) of genets were not significantly differ-
ent between seasons (summer = 2.14 km2, autumn = 2.75 km2) (Table 7.2).However, the average home range during the non-breeding period (2.56 km2)was 56% larger than during the mating season (1.44 km2) (Table 7.3).
Core areas did not overlap among individuals, except for male Gg16
andfemale Gg
15. The male had 4 core areas inside its range, and the female had 5
(Fig. 7.3). The main core areas of both individuals overlapped >50%; the sharedareas were used for both foraging and resting. The male and the female sharedthe same rest site for at least 3 consecutive days, from 17 October to 6 Novem-ber.
Interspecific overlap was extensive among MCP ranges, but core areaswere usually exclusive between species. No statistical differences were ob-served in home range area between species (Z = 1.149, P = 0.251) or amongsexes (Z = 0.213, P = 0.831).

157Santos-Reis et al.: Stone Martens, Genets and Cork Oak Woodlands
Tabl
e 7.
3. H
ome
rang
e va
riat
ion
acco
rdin
g to
bre
edin
g se
ason
of
ston
e m
arte
ns a
nd g
enet
s in
a c
ork
oak
woo
dlan
d of
the
Grâ
ndol
a H
ills
in
sout
hwes
tern
Por
tuga
l, 19
97–1
998.
Ston
e M
arte
n B
reed
ing
Sea
son
Gen
et B
reed
ing
Sea
son
Mat
ing
Dia
paus
e I
Dia
paus
e II
Bre
edin
g S
easo
nN
on-b
reed
ing
Sea
son
Indi
vidu
als
MC
Panb
MC
Panb
MC
Panb
Indi
vidu
als
MC
Panb
MC
Panb
Mf 1
0.30
019
0.71
446
0.34
931
Gg1
1.00
756
3.10
817
4M
f 20.
564
460.
878
552.
239
79G
g21.
220
361.
637
194
Mf 17
2.03
348
1.23
775
Gg1
52.
370
763.
232
70M
f 182.
020
701.
060
881.
347
50G
g16
4.11
861
3.15
063
Mf 19
0.79
558
1.26
182
1.81
786
Gg2
00.
290
321.
654
108
a In
km2 .
b Num
ber
of f
ixes
.____
____
____
____
____
____
____
____
____
____
____
____
___
____
____
____
____
____
____
____
____
____
____
____
____
____
____
___
____
____
____
____
____
____
___
____
____
____
____
____
____
____
____
158 Martens and Fishers (Martes) in Human-altered Environments
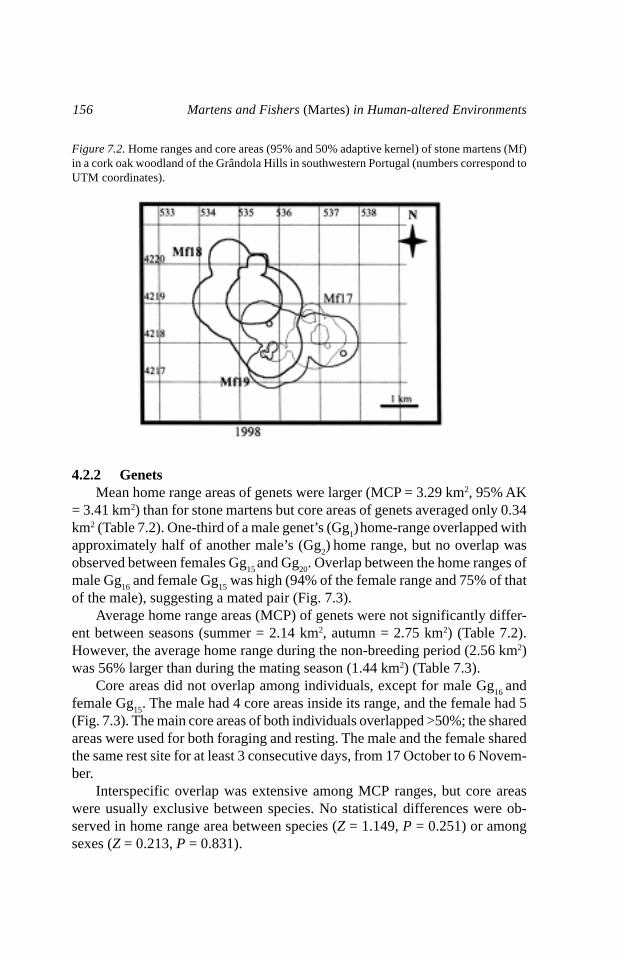
Figure 7.3. Home ranges and core areas (95% and 50% adaptive kernel) of genets (Gg) in acork oak woodland of the Grândola Hills in southwestern Portugal (the arrow indicates a sharedcore area).
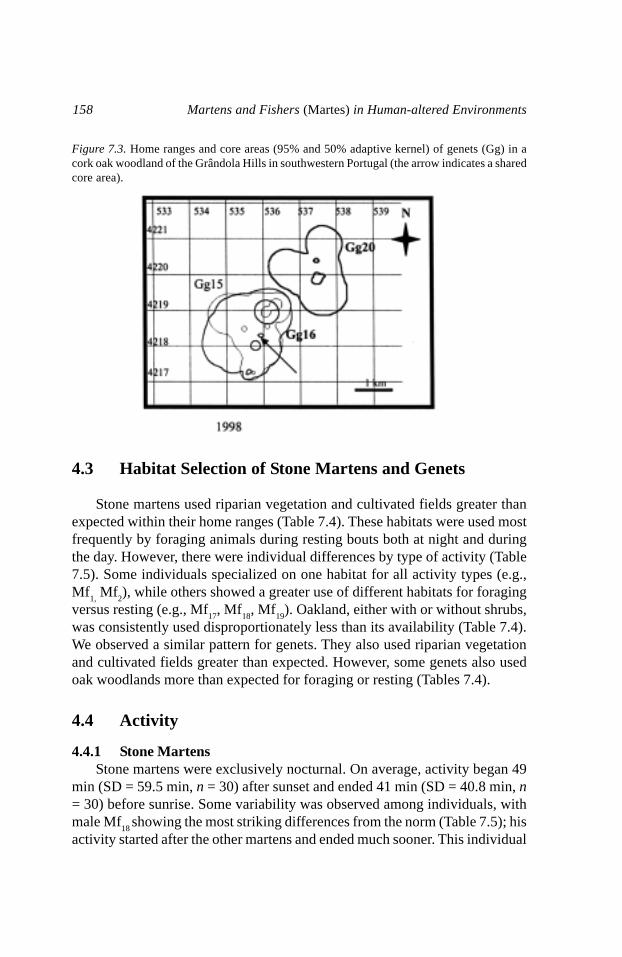
4.3 Habitat Selection of Stone Martens and Genets
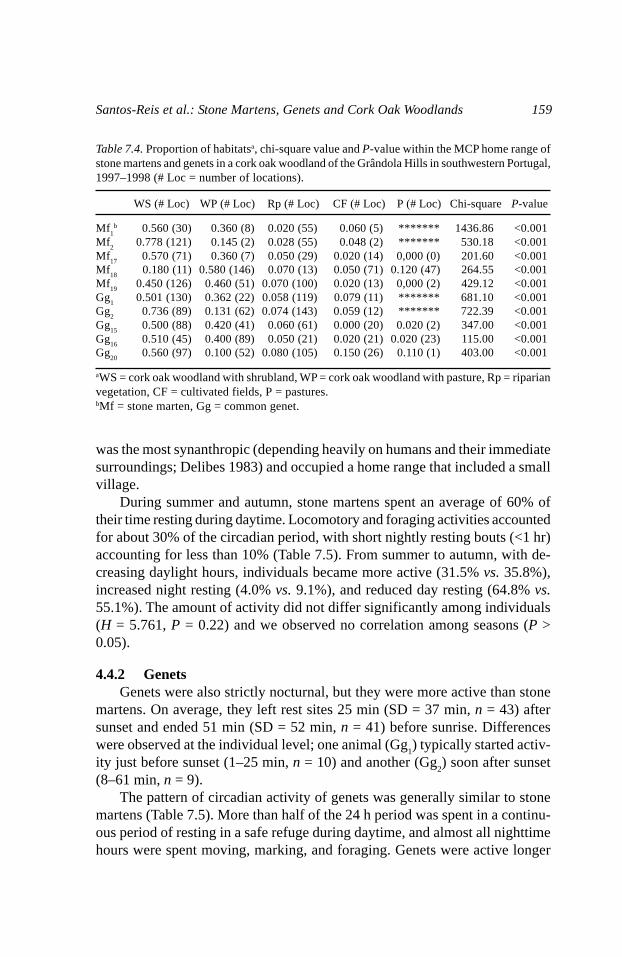
Stone martens used riparian vegetation and cultivated fields greater thanexpected within their home ranges (Table 7.4). These habitats were used mostfrequently by foraging animals during resting bouts both at night and duringthe day. However, there were individual differences by type of activity (Table7.5). Some individuals specialized on one habitat for all activity types (e.g.,Mf
1, Mf
2), while others showed a greater use of different habitats for foraging
versus resting (e.g., Mf17
, Mf18
, Mf19
). Oakland, either with or without shrubs,was consistently used disproportionately less than its availability (Table 7.4).We observed a similar pattern for genets. They also used riparian vegetationand cultivated fields greater than expected. However, some genets also usedoak woodlands more than expected for foraging or resting (Tables 7.4).
4.4 Activity
4.4.1 Stone MartensStone martens were exclusively nocturnal. On average, activity began 49
min (SD = 59.5 min, n = 30) after sunset and ended 41 min (SD = 40.8 min, n= 30) before sunrise. Some variability was observed among individuals, withmale Mf
18 showing the most striking differences from the norm (Table 7.5); his
activity started after the other martens and ended much sooner. This individual
159Santos-Reis et al.: Stone Martens, Genets and Cork Oak Woodlands
Table 7.4. Proportion of habitatsa, chi-square value and P-value within the MCP home range ofstone martens and genets in a cork oak woodland of the Grândola Hills in southwestern Portugal,1997–1998 (# Loc = number of locations).
WS (# Loc) WP (# Loc) Rp (# Loc) CF (# Loc) P (# Loc) Chi-square P-value
Mf1
b 0.560 (30) 0.360 (8) 0.020 (55) 0.060 (5) ******* 1436.86 <0.001Mf
20.778 (121) 0.145 (2) 0.028 (55) 0.048 (2) ******* 530.18 <0.001
Mf17
0.570 (71) 0.360 (7) 0.050 (29) 0.020 (14) 0,000 (0) 201.60 <0.001Mf
180.180 (11) 0.580 (146) 0.070 (13) 0.050 (71) 0.120 (47) 264.55 <0.001
Mf19
0.450 (126) 0.460 (51) 0.070 (100) 0.020 (13) 0,000 (2) 429.12 <0.001Gg
10.501 (130) 0.362 (22) 0.058 (119) 0.079 (11) ******* 681.10 <0.001
Gg2
0.736 (89) 0.131 (62) 0.074 (143) 0.059 (12) ******* 722.39 <0.001Gg
150.500 (88) 0.420 (41) 0.060 (61) 0.000 (20) 0.020 (2) 347.00 <0.001
Gg16
0.510 (45) 0.400 (89) 0.050 (21) 0.020 (21) 0.020 (23) 115.00 <0.001Gg
200.560 (97) 0.100 (52) 0.080 (105) 0.150 (26) 0.110 (1) 403.00 <0.001
aWS = cork oak woodland with shrubland, WP = cork oak woodland with pasture, Rp = riparianvegetation, CF = cultivated fields, P = pastures.bMf = stone marten, Gg = common genet.
was the most synanthropic (depending heavily on humans and their immediatesurroundings; Delibes 1983) and occupied a home range that included a smallvillage.
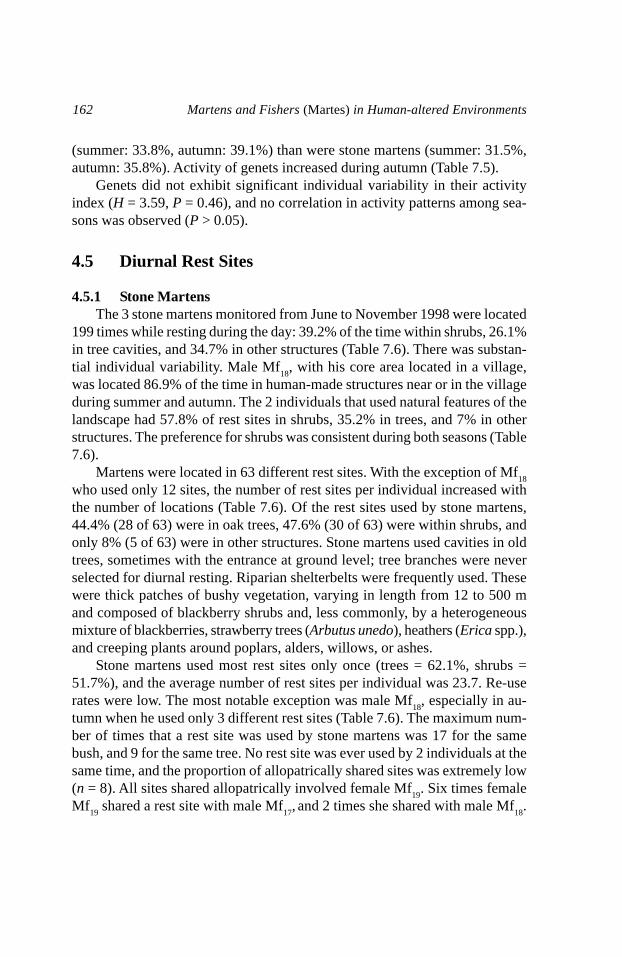
During summer and autumn, stone martens spent an average of 60% oftheir time resting during daytime. Locomotory and foraging activities accountedfor about 30% of the circadian period, with short nightly resting bouts (<1 hr)accounting for less than 10% (Table 7.5). From summer to autumn, with de-creasing daylight hours, individuals became more active (31.5% vs. 35.8%),increased night resting (4.0% vs. 9.1%), and reduced day resting (64.8% vs.55.1%). The amount of activity did not differ significantly among individuals(H = 5.761, P = 0.22) and we observed no correlation among seasons (P >0.05).
4.4.2 GenetsGenets were also strictly nocturnal, but they were more active than stone
martens. On average, they left rest sites 25 min (SD = 37 min, n = 43) aftersunset and ended 51 min (SD = 52 min, n = 41) before sunrise. Differenceswere observed at the individual level; one animal (Gg
1) typically started activ-
ity just before sunset (1–25 min, n = 10) and another (Gg2) soon after sunset
(8–61 min, n = 9).The pattern of circadian activity of genets was generally similar to stone
martens (Table 7.5). More than half of the 24 h period was spent in a continu-ous period of resting in a safe refuge during daytime, and almost all nighttimehours were spent moving, marking, and foraging. Genets were active longer

160 Martens and Fishers (Martes) in Human-altered Environments
Tabl
e 7.
5. C
irca
dian
act
ivit
y pa
tter
n of
sto
ne m
arte
ns a
nd g
enet
s in
a c
ork
oak
woo
dlan
d of
the
Grâ
ndol
a H
ills
in
sout
hwes
tern
Por
tuga
l,19
97–1
998.
Act
ivit
y (%
)N
octu
rnal
inac
tivi
ty (
%)
Diu
rnal
inac
tivi
ty (
%)
Indi
-S
umm
erA
utum
nS
umm
erA
utum
nS
umm
erA
utum
n
vidu
ala
xSD
nbx
SD
nbx
SDnb
xSD
nbx
SDnb
xS
Dnb
Mf 1
25.0
4.9
240
.01
5.0
3.5
28.
01
71.0
8.4
252
.01
Mf 2
32.3
2.2
239
.31.
72
1.4
1.2
23.
51.
92
66.4
3.2
257
.30.
22
Mf 17
36.3
3.2
339
.21
1.4
0.6
36.
31
62.3
3.8
354
.51
Mf 18
27.6
4.1
419
.65.
54
8.1
4.0
418
.56.
14
64.3
4.0
461
.96.
94
Mf 19
36.2
5.1
440
.72.
64
3.9
2.0
49.
43.
14
59.9
4.7
450
.02.
04
Gg 1
39.3
3.9
339
.16.
13
0.0
0.0
34.
66.
23
60.8
4.0
356
.23.
13
Gg 2
34.7
4.2
441
.65.
73
2.1
4.3
42.
23.
93
63.1
0.9
456
.22.
73
Gg 15
29.8
4.7
338
.83.
33
7.6
3.7
310
.13.
33
62.9
1.9
351
.21.
33
Gg 16
31.7
3.4
434
.88.
03
4.9
1.0
47.
64.
93
63.3
3.8
457
.65.
03
Gg 20
33.3
5.5
441
.02.
84
6.0
2.6
47.
62.
54
60.7
5.0
451
.41.
64
a Mf
= s
tone
mar
ten,
Gg
= c
omm
on g
enet
.b N
umbe
r of
foc
al r
uns.
____
____
____
____
____
____
____
____
____
____
____
____
____
____
____
____
____
____
____
____
____
____
____
____
____
____
____
___
____
____
___
____
____
____
___
____
____
___
____
____
____
___
____
____
___

161Santos-Reis et al.: Stone Martens, Genets and Cork Oak Woodlands
Table 7.6. Number of locations (# loc)a, different diurnal resting sites (Nn)b, and re-use rates ofstone martens and genets in a cork oak woodland of the Grândola Hills in southwestern Portugal,1997–1998.
Tree Shrub Other Total Re-useIndividualc # loc (Nn) # loc (Nn) # loc (Nn) # loc (Nn) rate
SummerMf
1715 (10) 19 (12) 5 (1) 39 (23) 1.70
Mf18
7 (5) 4 (4) 25 (1) 36 (10) 3.60Mf
198 (5) 31 (14) 0 (0) 39 (19) 2.05
Mftot
30 (20) 54 (30) 30 (2) 114 (52)Total (%) 26.3(38.5) 47.4(57.7) 26.3(3.8) 100
Gg15
28 (21) 11 (5) 2 (2) 41 (28) 1.46Gg
1634 (20) 3 (3) 0 (0) 37 (23) 1.61
Gg20
9 (2) 22 (5) 0 (0) 31 (7) 4.43Gg
tot71 (43) 36 (13) 2 (2) 109 (58)
Total (%) 65.1 (74.1) 33.0 (22.5) 1.9 (3.4) 100
AutumnMf
1712 (7) 2 (2) 1 (1) 15 (10) 1.50
Mf18
0 (0) 0 (0) 35 (3) 35 (3) 11.60Mf
1910 (6) 22 (8) 3 (1) 35 (15) 2.30
Mftot
22 (13) 24 (10) 39 (5) 85 (28)Total (%) 25.9(46.4) 28.2(35.7) 45.9(17.9) 100
Gg15
7 (7) 28 (8) 1 (1) 36 (16) 2.25Gg
1625 (21) 9 (1) 3 (3) 37 (25) 1.48
Gg20
7 (5) 29 (13) 0 (0) 36 (18) 2.00Gg
tot39 (33) 66 (22) 4 (4) 109 (59)
Total (%) 35.8 (55.9) 60.6 (37.3) 3.6 (6.8) 100
TotalMf
1727 (14) 21 (13) 6 (1) 54 (28) 1.93
Mf18
7 (5) 4 (4) 60 (3) 71 (12) 5.92Mf
1918 (11) 53 (19) 3 (1) 74 (31) 2.39
Mftot
52 (30) 78 (36) 69 (5) 199 (71)Total (%) 26.1(42.3) 39.2(50.7) 34.7(7.0) 100
Gg15
35 (26) 39 (10) 3 (2) 77 (38) 2.03Gg
1659 (37) 12 (3) 3 (3) 74 (43) 1.72
Gg20
16 (7) 51 (16) 0 (0) 67 (23) 2.91Gg
tot110 (71) 102 (29) 6 (5) 218 (104)
Total (%) 50.5 (68.3) 46.8 (27.9) 2.7 (4.8) 100
a# loc = number of locations in a class of rest site.bNn = number of different rest sites within a class.cMf = stone martens, Gg = common genets.NOTE: Because of the intra and inter-specific partitioning of rest sites, the sum of the rest sitesused by each species is slightly higher than those values referred to in the text.
162 Martens and Fishers (Martes) in Human-altered Environments
(summer: 33.8%, autumn: 39.1%) than were stone martens (summer: 31.5%,autumn: 35.8%). Activity of genets increased during autumn (Table 7.5).
Genets did not exhibit significant individual variability in their activityindex (H = 3.59, P = 0.46), and no correlation in activity patterns among sea-sons was observed (P > 0.05).
4.5 Diurnal Rest Sites
4.5.1 Stone MartensThe 3 stone martens monitored from June to November 1998 were located
199 times while resting during the day: 39.2% of the time within shrubs, 26.1%in tree cavities, and 34.7% in other structures (Table 7.6). There was substan-tial individual variability. Male Mf
18, with his core area located in a village,
was located 86.9% of the time in human-made structures near or in the villageduring summer and autumn. The 2 individuals that used natural features of thelandscape had 57.8% of rest sites in shrubs, 35.2% in trees, and 7% in otherstructures. The preference for shrubs was consistent during both seasons (Table7.6).
Martens were located in 63 different rest sites. With the exception of Mf18
who used only 12 sites, the number of rest sites per individual increased withthe number of locations (Table 7.6). Of the rest sites used by stone martens,44.4% (28 of 63) were in oak trees, 47.6% (30 of 63) were within shrubs, andonly 8% (5 of 63) were in other structures. Stone martens used cavities in oldtrees, sometimes with the entrance at ground level; tree branches were neverselected for diurnal resting. Riparian shelterbelts were frequently used. Thesewere thick patches of bushy vegetation, varying in length from 12 to 500 mand composed of blackberry shrubs and, less commonly, by a heterogeneousmixture of blackberries, strawberry trees (Arbutus unedo), heathers (Erica spp.),and creeping plants around poplars, alders, willows, or ashes.
Stone martens used most rest sites only once (trees = 62.1%, shrubs =51.7%), and the average number of rest sites per individual was 23.7. Re-userates were low. The most notable exception was male Mf
18, especially in au-
tumn when he used only 3 different rest sites (Table 7.6). The maximum num-ber of times that a rest site was used by stone martens was 17 for the samebush, and 9 for the same tree. No rest site was ever used by 2 individuals at thesame time, and the proportion of allopatrically shared sites was extremely low(n = 8). All sites shared allopatrically involved female Mf
19. Six times female
Mf19
shared a rest site with male Mf17
, and 2 times she shared with male Mf
18.

163Santos-Reis et al.: Stone Martens, Genets and Cork Oak Woodlands
4.5.2 GenetsThe 3 genets monitored from June to November 1998 were located 218
times while resting during the day. Locations occurred in tree cavities (50.5%),shrubs (46.8%), and in other structures (2.8%) (Table 7.6). In summer, genetsfrequently used trees (65.1%); in autumn, they were commonly found sleepingunder shrubs (61.0%).
Genets used a greater number of rest sites than stone martens. We identi-fied 91 sites, of which 64% were in trees, 31% in shrubs; only 5% were in otherstructures (Table 7.6). Characteristics of selected trees and shrubs were identi-cal to those described for stone martens.
The number of different rest sites increased with a greater number of loca-tions suggesting a time interaction. We estimated an average of 34.7 sites/indi-vidual. Re-use rates of the same sites were lower for genets than for stonemartens (Table 7.6). The majority of sites were only used once by any indi-vidual (trees = 62.1%, shrubs = 46.4%); however, the maximum number oftimes that the same rest site was used by several animals was 15 times for thesame bush and 13 times for the same tree cavity. The highest re-use rate was byfemale Gg
20 during summer, when only 7 nearby rest sites were used ( x dis-
tance = 138 m; SD = 114 m).No pair of individuals was ever found sleeping in the same rest site, but 13
sites (10 trees, 2 shrubs and 1 tree stump) were shared allopatrically betweenmale Gg
16 and female Gg
15. One of the shrubs, the most common rest site of
male Gg16
during autumn, was shared allopatrically 14 times with female Gg15
between 9 October and 15 November, on alternate days. Six of 148 sites (3 treesand 3 shrubs) were shared between the 3 stone martens and female genet Gg
15.
4.6 Food Habits
4.6.1 Stone MartensDiet was described using 58 scats collected from January to November
1997. Insects were the staple food representing 81.8% of prey occurrences.Fruits and berries represented 12.3%, and all other food items (mammals, birdsand other invertebrates) represented #2%. When we converted frequency ofoccurrence to biomass, fruits became the most important (57.9%), followed bymammals (21.6%), and insects (12.8%). Birds increased in importance (4.3%),and other invertebrates continued to represent occasional prey (<2%). Pears(Pyrus sp.) accounted for almost all the fruit intake by stone martens. Thewood mouse (Apodemus sylvaticus) and the Algerian mouse (Mus spretus) werethe most frequent mammals eaten. Insects eaten were mostly beetles and crick-ets; birds were all passerines. Acorns were never detected in scats.

164 Martens and Fishers (Martes) in Human-altered Environments
Based on percent occurrence, insects were the most frequently consumedfood year round, representing 93% of total food items consumed during winterand spring, and decreasing to 72.4% of food items consumed during summerand autumn (Fig. 7.4). Mammals were the second most important prey duringcolder months (4.1%). In warmer months, fruits accounted for 22.6% of theoccurrences. Biomass values for insects declined to 30.6% in winter and springand to 11.3% in summer and autumn. Mammals (33.6% biomass) and birds(34.3% biomass) were major prey items from January to June, but were re-placed by fruits (83.6%) during summer-autumn. Other invertebrates were notprevalent in the diet of stone martens.
4.6.2 GenetsDiet of the common genet was described using 75 scats. Based on percent
occurrence, insects (75.5%) were the most frequent item, followed by fruits(11.1%), mammals (3.7%), other invertebrates (2.6% to 3.4%), and birds (0.8%).On the basis of biomass, insects decreased in importance (11.4%). Three re-sources were of similar importance: mammals (29.9%), fruits (24.6%), andcrayfish (Procambarus clarkii) (22.3%). Birds accounted for 9.3% of the bio-mass, and invertebrates <2%.
Compared to stone martens, genets consumed a greater number of greater-white-toothed-shrews (Crocidura russula), a wider variety of fruits and seeds(figs, Ficus carica; olives, Olea europaea; wine grapes, Vitis vinifera; black-berries, Rubus spp.; pears), and crayfish. Acorns were only detected in 2 genetscats.
The seasonal variation in resource exploitation by genets followed the pat-tern reported for stone martens, and major differences were apparent only inbiomass (Fig. 7.4). In summer and autumn, genets ate more crayfish (29.6%)and mammals (16.7%), while stone martens ate more fruits.
4.7 Trophic Niches
Niche breath values (BMf
= 1.949, BGg
= 2.533) indicated that the diet ofstone martens and genets were not significantly different in diversity (t
H = 8.1,
P > 0.05). Further, niche overlap was almost equal to 1 (winter and spring =0.998, summer and autumn = 0.991) when using percent occurrence of fooditems. These values were likely biased because of the greater number of insectspecies. Although still high, niche breath values were lower when calculatedon the basis of biomass values, and lower in the dry season (winter–spring =0.795, summer–autumn = 0.727).

165Santos-Reis et al.: Stone Martens, Genets and Cork Oak Woodlands
Fig
ure
7.4.
Sea
sona
l var
iati
on o
f the
die
t of s
tone
mar
tens
(Mf)
and
gen
ets
(Gg)
in a
cor
k oa
k w
oodl
and
of th
e G
rând
ola
Hil
lsin
sou
thw
este
rn P
ortu
gal,
1997
–199
8.

166 Martens and Fishers (Martes) in Human-altered Environments
Table 7.7. Small mammal abundance in a cork oak woodland of the Grândola Hills insouthwestern Portugal, 1997–1998.
Species (n / 100 trap-nigths)Apodemus Crocidura
Mus spretus sylvaticus russula Rattus rattusSeason (n = 405) (n = 60) (n = 123) (n = 1)
Spring 3.9 1.6 2.7 0.1Summer 5.5 0.5 1.3 0.0Autumn 8.8 1.3 3.9 0.0Total 6.0 1.1 2.5 0.0
4.8 Small Mammal Abundance
Algerian house mice (Mus spretus) and black rats (Rattus rattus) were themost and the least frequently captured small mammals, respectively (Table7.7). Species abundance varied seasonally and by habitat type (Table 7.8). Ri-parian vegetation showed the highest diversity and abundance of small mam-mals, followed closely by the woodland with shrubs. Pastures under trees stillcontained a significant number of Algerian mice, but the other species wererare (Table 7.8).
Table 7.8. Number of captures of small mammals in three different habitatsa of a cork oakwoodland of the Grândola Hills in southwestern Portugal, 1997–1998.
Species (n 1st captures)Mus spretus Apodemus sylvaticus Crocidura russula Rattus rattus
Season WS WP Rp WS WP Rp WS WP Rp WS WP Rp
Spring 24 12 12 6 0 12 7 1 23 0 0 1Summer 21 8 47 1 2 4 8 0 9 0 0 0Autumn 45 39 28 0 0 15 7 0 39 0 0 0Total 90 59 87 7 2 31 22 1 71 0 0 1
aWS = cork oak woodland with shrubs, WP = cork oak woodland with pasture, Rp = riparianvegetation.
___________________________________________________________
___________________________________________________________________________ __________________ _______________ _____________
5. DISCUSSION
Major findings of our study can be briefly summarized as: (1) variation inhome range area of martens and genets during the year is primarily associatedwith breeding activities; (2) core areas are often mutually exclusive, even forindividuals suspected of forming a pair bond; (3) tolerance among stone mar-

167Santos-Reis et al.: Stone Martens, Genets and Cork Oak Woodlands
tens and genets is higher than between conspecifics of the same sex, but mu-tual avoidance is suggested by the exclusiveness of core areas; and (4) non-oakhabitats are important as a food source and/or refuge for martens and genets onour study site.
Home ranges of genets were larger than for stone martens, as expected dueto their slightly bigger size. Male ranges in both species were slightly largerthan those of females, a fact explained by sexual dimorphism in the body sizeand by the higher energetic requirements of the larger sex (Harestad and Bunnell1979). Home ranges of adult male and female stone martens were larger thanthose reported by Hermann (1994) in rural villages of southwest Germany,where males and females used areas <1 km2. However, when compared to homeranges of animals inhabiting wooded areas (e.g., Skirnisson 1986 in Sandell1989, Genovesi et al 1997), they were of similar size. Sexual dimorphism inhome range size was not significant. Stone martens generally (exception Mf
18)
avoided villages, which can be explained, at least in part, by the availabilityand predictability of food resources in orchards that are so uncommon in for-ested habitats, and by a higher susceptibility to human perturbation.
Spacing patterns of stone martens inhabiting cork oak woodlands wereconsistent with those found in other areas of the species range (Hermann 1994,Genovesi and Boitani 1997, Genovesi et al. 1997) and seem to fit the predic-tions of the intrasexual territoriality model, where individuals maintain territo-ries only with respect to members of the same sex (Powell 1979). The mainte-nance of territories during the mating season was not consistent with Sandell’smodel (1989) for solitary carnivores, where males adopt a roaming strategy;however evidence suggests that access to females plays a role in the spacingpattern of mature males.
On the basis of our limited data, it appears that core areas are not sharedamong individuals, thus supporting the conclusion of Goodenough et al. (1993)that home-range overlap is less likely to occur in areas of maximum activity.This behavior, strongly contrasts with the findings of Genovesi and Boitani(1997), and could be interpreted as a strategy of resource defense. Maher andLott (1995) postulated that coexistence is possible by maintaining exclusiveareas that provide basic resources.
Trophic resources seemed to play an important role in the spatial ecologyof stone martens. The staple food for stone martens in the study area was fruit.Clevenger (1994) reported that in 7 of 14 studies conducted in Europe, wildand cultivated fruits were the primary food item, followed by mammals. Simi-lar results were obtained in 2 other studies conducted in northeastern Spain(Ruiz-Olmo and Palazon 1993) and Italy (Genovesi et al. 1996). On the basisof frequency of occurrence, insects were an important food item in this study,

168 Martens and Fishers (Martes) in Human-altered Environments
as was reported in other Mediterranean habitats in Spain and Italy (Alegre etal. 1991, Clevenger 1994). However, frequency of occurrence may overesti-mate the importance of small food items (Reynolds and Aebischer 1991).
Pears were mostly found in the small orchards dispersed across the studyarea, and they represented more than 90% of fruit occurrences in scats. Culti-vated fields, where pear tree patches are found, were highly used by stonemartens when foraging. Also, most core areas included 1 orchard. High use ofthis limited resource as well as the seasonality of its production suggests thatfruit availability might be a limiting resource influencing the spacing of thepopulation of stone martens.
Insects and fruits were also important foods for genets. This species dif-fered mainly from the stone marten by the consumption of crustaceans duringthe summer and autumn. These represent the American species that was intro-duced to southern Portugal at the end of the 1970s, and has been spreadingnorthwards representing an alternative food resource for many carnivores(Correia 1995), such as mink and otter (e.g., Beja 1996). Predation on cray-fishes by genets was already reported in Spain by Palomares and Delibes (1991b)and by Ruiz-Olmo and López-Martin (1993).
In solitary carnivores such as stone martens, spacing patterns are shapednot only by conspecifics, but also by the interactions with other sympatricspecies with similar ecological requirements. This behavior has been docu-mented for closely related species such as mustelids of the genus Martes andMustela (Powell and Zielinski 1983). Within the guild of carnivores inhabitingthe cork oak woodlands of southern Iberia, in eco-morphological terms, genetsare the species most similar to stone martens and, therefore, are the strongestpotential competitors. Indeed, we found that genets have similar home rangesizes, intraspecific spacing patterns, activity patterns, habitat preferences, restsites, and food resources. However, similar population densities (based on thenumber of captures per trapping effort), major overlap of home ranges, and thepartitioning of rest sites do not suggest that resources were limiting. Whileboth species are arboreal, they shared common resources. Rest sites were nu-merous and readily available, and were not a limiting resource. Genets seemedto prefer trees to shrubs, while stone martens used both equally. In spite of theabove considerations, core areas of both species were mutually exclusive. Thissuggests the existence of spatial partitioning that could be interpreted as a strat-egy to minimize the potential for competition if and when resources mightbecome limiting. However, more data is required to evaluate niche partitioningand potential competition between stone martens and genets.

169Santos-Reis et al.: Stone Martens, Genets and Cork Oak Woodlands
This study suggests that except for resting, stone martens do not strictlydepend on cork oak trees and its products for existence, but are much moredependent on other habitats in close association with oak woodlands.
6. MANAGEMENT IMPLICATIONS
The use of cork oak woodlands by stone martens is strictly influenced bymanagement. The abundance and survival of stone martens clearly depends onother features of the landscape that guarantee food (cultivated fields), security(riparian corridors), and reduced interspecific competition. The apparent equi-librium between stone martens and other carnivores such as genets may beunstable through time. The desertification of rural areas in Portugal will resultin a decrease in the number of cultivated fields, and possibly decreased pro-ductivity in the remainder. Modernization of agriculture, clear-cutting of shrubsto allow access for cork extraction, and extensive destruction of understorycover and riparian corridors, are all negative factors. As a consequence, weexpect an increased use of cork oak trees by stone martens, and possibly greatercompetition with genets and other carnivores. The destruction of riparian veg-etation might also have a negative impact on hydrology, and we predict a de-cline in the availability of crayfish for genets, and an increase in competitionfor other food resources.
Because the stone marten is not a threatened species (SNPRCN 1990) andlacks legal protection, landscapes might not be managed to ensure its survival.However, stone martens should be viewed as one of several wildlife valuesassociated with cork oak woodlands, and its recreational, aesthetical, and eco-logical values should be taken into account in the same way as is the currenteconomic output of this wooded habitat. The new markets for environmentalgoods and services offer good perspectives and may help slow the decline incork oak woodlands in Portugal.
Management for stone marten conservation should consider the impor-tance of a heterogeneous landscape where mature oak trees with understorycover should be maintained together with small patches of fruit trees. Exten-sive clear cutting of shrubs, including stream banks, may result in declines instone marten populations. Also, because dead trees are important resting sites,non-selective clear cutting could be detrimental to the species.
7. ACKNOWLEDGMENTS
Funding was provided by the “Fundação para a Ciência e Tecnologia”(Project PRAXIS XXI/PCNA/C/BIA/105/96). Logistical support was provided

170 Martens and Fishers (Martes) in Human-altered Environments
by the field station of the Centre of Environmental Biology, a research unit ofthe Science Faculty of the Lisbon University. We thank Clara Espírito Santo,Luis Miguel Rosalino, Marina Rodrigues, Mário Mota, and Sónia Domingosfor their field assistance. A preliminary draft of this paper was much improvedby the comments of J. A. Bissonette, S. W. Buskirk and G. Proulx.
8. LITERATURE CITED
Alegre, J., A. Hernández, F. J. Purroy, J. M. Salgado, and B. Fuertes. 1991. Dieta otoño-invernal de la garduña, Martes foina (Erxleben, 1777), en un habitat rural de Leon (España).Ecología 5:265–273.
Aymerich, M. 1982. Contribution à l’étude de la biologie de la genette (Genetta genetta L.) enEspagne. Mammalia 46:389–393.
Beja, P. R. 1996. An analysis of otter Lutra lutra predation on introduced American crayfishProcambarus clarkii in Iberian streams. Journal of Applied Ecology 33:1156–1170.
Blondel, J., and J. Aronson. 1999. Biology and wildlife of the Mediterranean region. OxfordUniversity Press, Oxford, UK.
Brom, T. G. 1996. Microscopic identification of feather-remains after collisions between birdsand aircraft. Bijdragen tot de Dierkunde 56:181–204.
Buskirk, S. W. 1994. Introduction to the genus Martes. Pages 1–10 in S. W. Buskirk, A. S.Harestad, M. G. Raphael, and R. A. Powell, editors. Martens, sables and fishers: biologyand conservation. Cornell University Press, Ithaca, New York, USA.
_____, A. S. Harestad, M. G. Raphael, and R. A. Powell, editors. 1994. Martens, sables andfishers: biology and conservation. Cornell University Press, Ithaca, New York, USA.
Ciucci, P., L. Boitani, F. Francisci, and G. Andreoli. 1997. Home range, activity and movementsof a wolf pack in central Italy. Journal of Zoology 243:803–819.
Clevenger, A. P. 1994. Feeding ecology of Eurasian pine martens and stone martens in Europe.Pages 326–340 in S. W. Buskirk, A. S. Harestad, M. G. Raphael, and R.A. Powell, editors.Martens, sables and fishers: biology and conservation. Cornell University Press, Ithaca,New York, USA.
Correia, A. I., and M. Santos-Reis. 1999. Área de estudo. Pages 5–8 in M. Santos-Reis, and A.I. Correia, editors. Caracterização da flora e fauna do montado da Herdade da RibeiraAbaixo (Grândola, Baixo Alentejo). Centro de Biologia Ambiental, Lisboa, Portugal.
Correia, P. A. 1995. Biologia populacional e interacções tróficas de Procambarus clarkii(Crustacea, Decapoda, Cambaridae) no sistema hidrográfico do rio Tejo (Ribatejo,Portugal). Dissertation, Lisbon University, Portugal.
Dayan, T., and D. Simberloff. 1996. Patterns of size separation in carnivore communities.Pages 243–267 in J. L. Gittleman, editor. Carnivore behavior, ecology and evolution.Volume 2. Cornell University Press, Ithaca, New York, USA.
Debrot, S., G. Fivaz, C. Mermod, and J. M. Weber. 1982. Atlas des poils de mammifèresd’Europe. Institut de Zoologie, Université de Neuchâtel, Neuchâtel, Switzerland.
Delibes, M. 1983. Interspecific competition and the habitat of the stone marten Martes foina(Erxleben 1777) in Europe. Acta Zoologica Fennica 174:229–231.
Díaz, M., P. Campos, and F. Pulido. 1997. The Spanish dehesas: a diversity in land-use andwildlife. Pages 178–209 in D. J. Pain, and M. W. Pienkowski, editors. Farming and birdsin Europe: the common agriculture policy and its implications for bird conservation.Academic Press, London, UK.

171Santos-Reis et al.: Stone Martens, Genets and Cork Oak Woodlands
Genovesi, P., and L. Boitani. 1997. Social ecology of the stone marten in central Italy. Pages110–120 in G. Proulx, H. N. Bryant, and P. M. Woodard, editors. Martes: taxonomy,ecology, techniques and management. Provincial Museum of Alberta, Edmonton, Alberta,Canada.
_____, M. Secchi, and L. Boitani. 1996. Diet of stone martens: an example of ecologicalflexibility. Journal of Zoology 238:545–555.
_____, I. Sinibaldi, and L. Boitani. 1997. Spacing patterns and territoriality of the stone marten.Canadian Journal of Zoology 75:1966–1971.
Goodenough, J., B. Mcguire, and R. Wallace. 1993. Perspectives on animal behavior. JohnWiley & Sons, Inc., New York, USA. 764 pages.
Griffith, H. I. 2000. Mustelids in a modern world. Management and conservation aspects ofsmall carnivore:human interactions. Backhuys Publishers, Leiden, The Netherlands. 342pages.
Harestad, A. S., and F. L. Bunnell. 1979. Home range and body weight— a reevaluation.Ecology 60:389–402.
Harris, S., W. J. Cresswell, P. G. Forde, W. J. Trewhella, T. Woolard, and S. Wray. 1990. Homerange analysis using radio-tracking data—a review of problems and techniques particularlyas applied to the study of mammals. Mammal Review 20:97–123.
Herrmann, M. 1994. Habitat use and spatial organization by the stone marten. Pages 122–136in S. W. Buskirk, A. S. Harestad, M. G. Raphael, and R. A. Powell, editors. Martens,sables and fishers: biology and conservation. Cornell University Press, Ithaca, New York,USA. 484 pages.
Jacobs, J. 1974. Quantitative measurement of food selection. Oecologia 14: 413–417.Libois, R., and A. Waechter. 1991. La fouine (Martes foina Erxleben, 1777). Encyclopédie des
carnivores de France. Société Française pour l’Étude et la Protection des Mammifères10:1–53.
Livet, F., and J-J. Roeder. 1987. La genette (Genetta genetta Linnaeus, 1758). Encyclopédiedes carnivores de France. Société Française pour l’Étude et la Protection des Mammifères16:1–33.
Lodé, T. 1991. Exploitation des milieux et organisation de l’espace chez deux mustelidésEuropéens: la fouine et le putois. Vie et Milieu 41:29–38.
Lopez-Martin, J. M., J. Ruiz-Olmo, and S. Cahill. 1991. Autumn home range and activity of astone marten (Martes foina Erxleben, 1777) in northeastern Spain. Acta Theriologica36:134–138.
Ludwig, J. A., and J. F. Reynolds. 1988. Statistical ecology. A primer on methods and computing.John Wiley & Sons, Inc, New York, USA. 329 pages.
Maddock, A. H., and M. R. Perrin. 1993. Spatial and temporal ecology of an assemblage ofviverrids in Natal, South Africa. Journal of Zoology 229:277–287.
Maher, C., and D. Lott. 1995. Definitions of territoriality used in the study of variation invertebrate spacing systems. Animal Behaviour 49:1581–1597.
Palomares, F., and M. Delibes. 1990. Factores de transformación para el cálculo de la biomasaconsumida por gineta (Genetta genetta) y meloncillo (Herpestes ichneumon) (Carnivora,Mammalia). Miscellánea Zoológica 14:233–236.
_____, and M. Delibes. 1991a. Assessing three methods to estimate daily activity patterns inradio-tracked mongooses. Journal of Wildlife Management 55:698–700.
_____, and M. Delibes. 1991b. Alimentacion del melloncillo Herpestes ichneumon y de lagineta Genetta genetta en la Reserva Biologica de Doñana, S.O. de la Peninsula Iberica.Doñana Acta Vertebrata 18:5–20.
Pinto-Correia, T. 1993. Threatened landscape in Alentejo, Portugal: the montado and otheragro-silvo-pastoral systems. Landscape and Urban Planning 24:43–48.

172 Martens and Fishers (Martes) in Human-altered Environments
Pounds, C. J. 1981. Niche overlap in sympatric populations of stoats (Mustela erminea) andweasels (Mustela nivalis) in north-east Scotland. Dissertation, Aberdeen University, UK.
Powell, R. A. 1979. Mustelid spacing patterns: variations on a theme by Mustela. Zeitschriftfur Tierpsychologie 50:153–165.
_____, and W. J. Zielinski. 1983. Competition and coexistence in mustelid communities. ActaZoologica Fennica 174:223–227.
Proulx, G., K. B. Aubry, J. Birks, S. W. Buskirk, C. Fortin, H. C. Frost, W. B. Krohn, L. Mayo,V. Monakov, D. Payer, M. Saeki, M. Santos-Reis, R. Weir, and W. J. Zielinski. 2004.World distribution and status of the genus Martes. Pages 21–76 in D. J. Harrison, A. K.Fuller, and G. Proulx, editors. Martens and fishers (Martes) in human altered environments:An international perspective. Kluwer Academic Publishers, Boston, Massachusetts, USA.
_____, H. N. Bryant, and P. M. Woodard, editors. 1997. Martes: Taxonomy, ecology, techniquesand management. The Provincial Museum of Alberta, Edmonton.
Reynolds, J. C., and N. J. Aebischer. 1991. Comparison and quantification of carnivore diet byfaecal analysis: a critique, with recommendations, based on a study of the fox Vulpesvulpes. Mammal Review 21:97–122.
Ruiz-Olmo, J., and J. M. López-Martin. 1993. Note on the diet of the common genet (Genettagenetta L.) in the mediterranean riparian habitats of N.E. Spain. Mammalia 57:607–610.
_____, and S. Palazon. 1993. Diet of the stone marten (Martes foina Erxleben, 1777) innortheastern Spain. Doñana Acta Vertebrata 20:59–67.
Sandell, M. 1989. The mating tactics and spacing patterns of solitary carnivores. Pages 164–182 in J. L. Gittleman, editor. Carnivore behaviour, ecology and evolution. Volume 1.Cornell University Press, Ithaca, New York, USA.
Santos-Reis, M. 1983. Status and distribution of the Portuguese mustelids. Acta ZoologicaFennica 174:213–216.
_____, L. M. Rosalino, and M. Rodrigues. 1999. Lagomorfos, carnívoros e artiodáctilos. Pages249–262 in M. Santos-Reis, and A.I. Correia, editors. Caracterização da flora e fauna domontado da Herdade da Ribeira Abaixo (Grândola, Baixo Alentejo). Centro de BiologiaAmbiental, Lisboa, Portugal.
Siegel, S., and N. J. Castellan, Jr. 1988. Nonparametric statistics for the behavioral sciences.Second edition. McGraw-Hill, Inc., New York, USA.
SNPRCN (Serviço Nacional de Parques, Reservas e Conservação da Natureza). 1990. LivroVermelho dos Vertebrados Terrestres de Portugal. Vol. I – Mamíferos, aves, répteis eanfíbios. Ministério do Ambiente e Defesa do Consumidor, Lisboa, Portugal.
Sokal, R., and F. Rohlf. 1995. Biometry: the principles and practice of statistics in biologicalresearch. Third edition. W. H. Freeman and Company, New York, USA. .
Stahl, P. 1986. Le chat forestier d’Europe (Felis silvestris Schreber, 1777). Exploitation desresources et organization spatial. Dissertation, Nancy University, France.
Swihart, R., and N. Slade. 1985. Testing for independence of observations in animal movements.Ecology 66:1176–1184.
Vadillo, J. M., J. Reija, and C. Vilà. 1997. Distribución y selección de habitat de la garduña(Martes foina Erxleben, 1777) en Vizcaya y Sierra Salvada (Burgos). Doñana ActaVertebrata 22:39–49.
White, G. C., and R. A. Garrott. 1990. Analysis of wildlife radio-tracking data. AcademicPress, San Diego, California, USA.
Worton, B. J. 1989. Kernel methods for estimating the utilization distribution in home-rangestudies. Ecology 70:164–168.
Zar, J. H. 1984. Statistical analysis. Second edition. Prentice Hall, New Jersey, USA.
Copyright © 2022 FDOKUMEN