A connection between the Camassa–Holm equations and turbulent flows in channels and pipes
Upload
khangminh22Category
view
1download
0
Article
Income and Ecosystem Service Comparisons ofRefined National and Agroforestry AccountingFrameworks: Application to Holm Oak OpenWoodlands in Andalusia, Spain
Pablo Campos 1,*, Alejandro Álvarez 1, José L. Oviedo 1,2 , Paola Ovando 1,3, Bruno Mesa 1
and Alejandro Caparrós 1
1 Spanish National Research Council (CSIC), Institute of Public Goods and Policies (IPP), C/Albasanz, 26–28,E-28037 Madrid, Spain; [email protected] (A.Á.); [email protected] (J.L.O.);[email protected] (P.O.); [email protected] (B.M.); [email protected] (A.C.)
2 Spanish National Research Council (CSIC), Institute of Marine Sciences of Andalusia (ICMAN),Campus Universitario Río San Pedro s/n, E-11519 Pto. Real-Cádiz, Spain
3 The James Hutton Institute, Social, Economic and Geographical Sciences, Craigiebuckler,Aberdeen AB15 8QH, UK
* Correspondence: [email protected]; Tel.: +34-91-602-2535
Received: 2 December 2019; Accepted: 4 February 2020; Published: 7 February 2020�����������������
Abstract: There is growing consensus regarding the implementation of a new statistical frameworkfor environmental-economic accounting to improve ecosystem related policies. As the standardSystem of National Accounts (SNA) fails to measure the economic contribution of ecosystems to thetotal income of individuals, governments recognize the need to expand the standard SNA through theongoing System of Environmental Economic Accounting (SEEA). Based on the authors’ own data, thisstudy focuses on linking 15 economic activities and 12 ecosystem services for a holm oak (Quercus ilex L.)open woodlands (HOW) ecosystem type in Andalusia, Spain. We emphasize that overcoming thechallenges of multiple use is preferable to measuring single ecosystem products for improving habitatconservation policies. The objectives of this paper are to measure and compare the environmentalassets, ecosystem services, and incomes at basic and social prices by applying a refined version of thestandard System of National Accounts (rSNA) and the authors’ Agroforestry Accounting System(AAS), respectively, to HOW. Considering intermediate products and consumptions of HOW farmerand government activities, we find that the rSNA ecosystem services and environmental incomes atbasic prices are 123.3 €/ha and −28.0 €/ha, respectively, while those of the AAS at social prices are442.2 €/ha and 250.8 €/ha. Given advances in non-market valuation techniques, we show that anexpanded definition of economic activities can be applied to measure the contribution to total incomeof managed natural areas taking into account the multiple uses of the ecosystem type. However,HOW sustainability continues to be a challenging issue that requires ecological threshold indicatorsto be identified, not only because of the economic implications but also because they provide vitalinformation on which to base policy implementation.
Keywords: total income; ecosystem accounting; environmental income; environmental asset; nationalaccounts; private amenity
1. Introduction
Since 2010, national and international government institutions responsible for producing economicstatistics on environmental governance and economic development have been pointing to the need to
Forests 2020, 11, 185; doi:10.3390/f11020185 www.mdpi.com/journal/forests

Forests 2020, 11, 185 2 of 36
incorporate the contribution of nature to the income and capital of nations, although to date, theseconcerns have brought about advances as regards environmental refinement in the application ofthe statistical office standard System of National Accounts (SNA) [1–11]. One of the main challengescomplicating the extension of the System of National Accounts (SNA) to explicitly incorporate theenvironment as an economic production factor is the consistency of the inclusion of values for productswith and without market prices, when extending the SNA to estimate the real contributions of natureto the national product and social total income, as well as to evaluate the depletion and degradationof nature through government policy implementation. Another of the challenges regards the limitsof environmental valuations in situations of ‘critical’ (threshold) amounts of renewable biophysicalenvironmental assets.
In the SNA the net value added (NVASNA) of the economic activities does not include naturalgrowth (NG) in the own-account gross capital formation (GCF) as a final product, and omits theenvironmental work in progress used (WPeu) from the intermediate consumption (IC). These omissionslead to a NVASNA bias associated with the timing of their measurement, which is avoided in this studyby refining the standard System of National Accounts (rSNA), which includes their measurement inthe NVArSNA.
The coordinated response of the governmental statistical offices to the demand for extendingthe indicator of SNA net value added (NVASNA), involves the development of the satellite Systemof Environmental Economic Accounting—Experimental Ecosystem Accounting (SEEA-EEA) [12,13](currently in progress), with the aim of explicitly measuring the contributions of ecosystems servicesand environmental assets to the national product and income [14]. Until now, the guidelines in theSEEA-EEA process have focused on the conceptualization of the economic variables of ecosystemservices and environmental assets, based on the consumer preferences evidenced in the transactionsobserved in formal markets and other simulated transactions (using stated or revealed preferencesmethods). Nevertheless, “the SEEA-EEA ( . . . ) provides the first framing, from a national accountingperspective, for the integration of information on ecosystem services and ecosystem assets. This framingis (...) a general understanding of the logic and motivation for the valuation of ecosystem services.It is recognized, however, that the precise description of the relationships between ecosystem assets,ecosystem services and the associated production, consumption and balance sheet [capital account]information in the standard national accounts [SNA] is subject to ongoing discussion. ( . . . ) a moreprecise and commonly agreed framing is required to support discussion and exchange on this issue” [15](p. 11). This incipient development of the structure of SEEA-EEA accounts linked to the SNA makesit difficult to meet institutional demands for its implementation by national governments. The briefdescription of the sequence of SEE-AEEA and SNA accounts compared in [16] does not permit adetailed discussion on what its future development might be. The most recent draft dealing with thedesign of the SEEA-EEA Model C proposes the ecosystem as an institutional sector composed of publicproducts without registering manufactured costs [16].
With respect to the SEEA-EEA, our Agroforestry Accounting System (AAS) incorporates thegovernment institutional sector, and considers the ecosystem as a production factor and not as aninstitutional sector [17]. The variable that is the backbone of the conceptual design of the AAS is theenvironmental income at social price.
The three methodologies, the SNA, SEEA EEA, and AAS, follow the same principle for valuingthe final products of the economic activities according to the observed transaction price in formal orsimulated markets. The SNA can be applied to any economic and spatial unit, although it is onlycurrently applied by governments at scales larger than corporate scale, usually at regional territorialscale and more generally at a national scale. The SEEA-EEA is a system of accounts which is notcurrently normalized since it is still under development. The novelty of the SEEA-EEA is that its designis expected to be applicable for any given scale, ecosystem type, and ecosystem services of individualproducts from each type of ecosystem. The AAS can be applied to any economic unit, special unit, and

Forests 2020, 11, 185 3 of 36
type of ecosystem. In this study, we have limited the application to the rSNA and our extended AASmethodology integrates rSNA.
This study focuses on the comparison of the results for rSNA and AAS environmental incomesmeasured in the holm oak open woodlands (HOW) of the region of Andalusian-Spain (for detaileddescriptions of institutional, physical and yielding characteristics of Spanish and Andalusian HOW seeSupplementary Materials Text S1, Tables S1 and S2 and [18]). The rSNA net value added (NVArSNA)modified the NVASNA by uncovering natural growth (NG) and environmental work in progressused (WPeu). In the AAS and rSNA methodologies, the changes in the environmental assets areexplicitly incorporated in the environmental income estimates for the economic activities valued in theAndalusian HOW, except forest carbon activity, which is omitted in the rSNA. The HOW economicactivities measured using the AAS and rSNA, produce 12 and 8 environmental incomes respectively.
The AAS and rSNA methodologies were applied to the measurement of environmental incomeat regional scale (Andalucia), measuring that of forests and other forest lands (including naturalgrasslands) at producer price [17], cork oak (Quercus suber L.) open woodlands at social price [19], andthat of holm oak dehesa case studies (farm scale) at social price [20]. This study focuses on a comparisonof the applications of the AAS and rSNA to estimate gross and net value added, ecosystem services,changes in environmental assets, total income, and environmental incomes at basic and social prices inthe Andalusian HOW at regional scale. The individual economic activities valued are those whichare privately-owned by farmers—namely, timber, cork, firewood, nuts, grazing (by game speciesand livestock), conservation forestry, landowner residential services, and private amenities—alongwith those which are publicly-owned by government in the form of collective ownership—namely,fire services, water supply, mushrooms, forest carbon, free-access recreation, landscape conservation,and threatened wild biodiversity preservation (see activities conceptualization in SupplementaryText S2). The residential, conservation forestry and fire service economic activities do not use productsand services from the environmental assets production factors.
The concept of social price refers in this study to the incorporation (with the valuation atproducer prices) of the ordinary own non-commercial intermediate consumption of services: amenityauto-consumption (SSncooa) and donation (SSncood) imputed to the HOW amenity and landscapeactivities. These SSncooa/d come from the non-commercial intermediate product of services generatedby amenity auto-consumption (ISSnca) and donation (ISSncd) associated with the HOW hunting andlivestock activities omitted in this study.
The AAS and rSN,A applied to the HOW, coincide with regard to the estimated physical quantitiesfor the economic activities, except that the rSNA omits the forest carbon activity. They differ in termsof prices of the ordinary final products without market prices (private amenities, public recreationservice, landscape service, and threatened wild biodiversity service), the valuation of the NVArSNA atbasic price and the NVAAAS at social price.
The term environmental income has been employed previously by other authors without measuringthe changes in environmental assets in the context of family-scale subsistence economies as a synonymof resource rent in [21] (p. 53), and also assimilated to the gross value added in the absence ofopportunity costs of self-employed labor and either null or token employment of manufacturedcapital [22] (p. 41). Our concept of environmental income refers to the ‘gifts’ of nature that accrue fromecosystem services and adjusted change in environmental asset, integrated consistently into the estimateof social total income of the HOW accruing from the individual activities valued. The valuation of theordinary environmental net operating margin (NOMeo), conditioned to the priority of remunerationfor labor cost and ordinary manufactured net operating margin, allows the consistent integration of theenvironmental incomes (EI) measured by rSNA (EIrSNA) in the AAS (EIAAS.). As with the total income(TI), the environmental income comprises a residual term of the production account, the NOMeo, andanother residual term of the environmental asset account; namely, the environmental asset revaluation(EAr) for the period. In order to overcome the shortcomings of the official SNA, the measurement

Forests 2020, 11, 185 4 of 36
of these two environmental income components is key when applying the rSNA and extended AASaccounting frameworks.
The measurement of total income (TI) and its factorial distribution follows an order of priority whichconditions the remuneration of the three conventional production factors, namely labor, manufacturedcapital, and environmental asset. The order of priority for remunerations of the production factorsin the first possible transaction of a total product consumption (TPc) of an activity is assumed tobe: ordinary labor cost (LCo) first, ordinary manufactured net operating margin (NOMmo) second,and ordinary environmental net operating margin (NOMeo) third. The residual remuneration ofthe NOMeo of nature-based activities in the last position implies that the values cannot be negative.The government voluntarily renounces the remuneration of the ordinary manufactured net operatingmargin (NOMmoG) of the immobilized manufactured capital in the public activities. From thesepre-conditions it can be deduced that the ecosystem services cannot contain negative values (ES ≥ 0),given the positive values for products of environmental work in progress used (WPeu). Consequently,the rSNA ordinary manufactured net operating margin (NOMmorSNA) of the private amenity activityand public activities can only present values equal to or less than zero. We assume that publicconsumers with free access to recreational services and gathering of wild products do not incurmanufactured costs.
Among the conceptual advances of the AAS with respect to the rSNA is the fact that the valuationof individual products is presented at social price, when they are affected by the ordinary ownnon-commercial intermediate consumption of services of private amenity auto-consumption (SSncooa)and donation (SSncood) by HOW activities which are used as inputs to the private amenity andlandscape services activities. In our HOW, the rSNA application is made possible thanks to theavailability of our own data on full-cycle biological natural growth of the holm oaks and other treespecies associated with the predominant holm oaks at tiles scale. However, our slight modification inthe rSNA does not affect the value of the final products consumption recorded by the SNA, althoughit does affect the durable products accumulated in the production process due to the incorporationof natural growth for the period, and it also affects the net value added for the period due to theincorporation of woody products extracted of timber and firewood (WPeu) in the intermediateconsumption. This study’s two most significant practical innovations are the measurement of thetheoretical concept of capital gain (omitted in the SNA), to be added to the net value added, thusobtaining the social total income in the rSNA and the environmental income estimate linked toecosystem services and adjusted change in environmental net worth (CNWead).
The applied contribution is to compare rSNA and AAS, in order to show that the former does notrecord the totality of the economic value of the activities measured and that it omits others. This is thecase for the forest carbon activity, as the other 14 activities compared are the same, after our refinementof the standard SNA. The results confirm that the rSNA, by conceptual definition, cannot measureecosystem services and environmental assets of the products without market prices. The comparisondemonstrates that the scientific knowledge exists to avoid the failure of the market to measure theeconomic contribution of nature to the total income of the period, and we present the results of ourAAS compared with the rSNA for the same variables and the same type of ecosystem, in this study,the holm oak open woodlands of Andalusia.
The physical sustainability of the HOW is forecasted based on scheduled future natural/inducedregeneration. The biological cycles are as prescribed by forestry legislation on the managementof Quercus genus species in Andalusia and felling of holm oaks is only permitted where there is agovernment authorized land use change. Commercial harvesting rotations are not regulated in the caseof conifers and broadleaf timber producing species (eucalyptus and poplar mainly) and managementplans for these species include stand persistence without land use change, except where unforeseendestruction occurs (e.g., catastrophic forest fires).

Forests 2020, 11, 185 5 of 36
Although the landowners are not obliged to replant the trees, we assume that the scheduled futureconservation silviculture applied will renew the current area (tiles) of woodland in Andalusia whereholm oak woodland predominates [17,23].
The environmental incomes from the total products valued by the AAS at social price representthe scheduled sustainable economic contributions of management by farmers and government of theenvironmental assets of the Andalusian HOW. A valuation of the environmental assets at the closingof the period is assumed to correspond to the forecast regeneration of the trees in the current area overthe complete biological/commercial cycle, along with the absence of any loss of currently threatenedwild biological species. Under these conditions, the ecological sustainability of future management ofthe HOW is integrated into the expected results for the future resource rents.
The AAS and rSNA applications are based on information from land use tiles of the third NationalForest Inventory for Andalusia and the Forest Map of Spain [24], showing a predominance of holmoak open woodlands (HOW). The HOW predominate in 22,281 tiles of the Forest Map of Spain (FMS),which covers an area of 1,408,170 hectares (see Supplementary Text S1, Tables S1 and S2 and [18]).
The physical data on estimated flows and stocks are for the year 2010. We have omitted thehunting and livestock activities from those valued in the holm oak open woodlands (HOW) as regionalscale information was not available. For explanatory purposes we have included the SSncooc/a/d,where c is government compensation, a is private landowner amenity auto-consumption, and d ispublic landowner donation for the omitted hunting and livestock activities, which we assume to havebeen used by the HOW amenity and landscape activities valued.
In this application, we do not take into account the existence of a contractual right/liability of theowner for improving/maintaining the threshold of a given natural asset at the closing of the period.Thus, no loan/debt is generated for the increase/loss of natural assets derived from the economicactivities and hence the net worth of the HOW does not comprise financial assets.
There are both private and public owners of the land, with different economic rationales. We assumethat the economic rationale of the private owners includes auto-consumption of private amenities.It is accepted that the production function of the private amenity and landscape activities usesthe ordinary own intermediate consumption of services (SSoo). They are composed of ordinaryown commercial intermediate consumption of services consumption of services compensation(SSncooc), amenity auto-consumption (SSncooa), and donation (SSncood). The government fire serviceactivity and the private landowner residential and forestry conservation activities supply commercialintermediate product of services (ISSc). The omitted hunting and livestock activities producenon-commercial intermediate products of services compensation (ISSncc), amenity auto-consumption(ISSnca), and donation (ISSncd). The latter is originated from the public landowner activities. In theHOW, these three ISSnc are generated by the hunting and livestock activities.
The government is the owner and manager in representation of the collective public activities. In theHOW, the public activities are those which are regulated and managed by the government, providingfree consumption of the final products to both active and passive consumers. The economic rationaleof the government implies registering ordinary own non-commercial intermediate consumption ofservices compensations (SSncooc) and donations (SSncood) in the public activities that use them, in thisstudy, they are used by the landscape activity. The government is able to accept voluntary negativevalues in recurrent periods for the ordinary manufactured net operating margin (NOMmo) of a publicactivity. The main logic for the conservation of a unique biological variety in danger of extinction,based on the concept of valuing the existence of a unique genetic variety which is not industriallyreproducible, is a governmental precautionary behavior. However, the omission of current consumerpreferences is not complete because democratic governments must consider the tolerable social costof avoiding the nature variety irreversible loss. Nevertheless, there is a general consensus on thediverse rationales for the integrated conservationist management of the HOW among the economicactors, as reflected in the following quote: “From a production perspective, always effected in a waythat focuses on restoring the balance between environment and business [sustainable management]

Forests 2020, 11, 185 6 of 36
(square brackets are not in the original text), allowing a profitability which facilitates reinvestment inthe environment (...), actively organizing the maintenance of the natural scenario in which we carryout our agroforestry activity, with the certainty of achieving the economic return for our labor” [25](p. 10). Although, in principle, all the actors accept this conservationist perspective, controversy arisesamong the owners, the government and the consumers when attempting to put into practice theirperceptions on the concepts of economic profitability and environmental asset conservation. We arefaced with numerous subjective interpretations when attempting to apply sustainable management ofrenewable natural resources in a way that is coherent with ecological and economic sciences.
Section 2 summarizes the AAS and rSNA accounting frameworks applied to holm oak openwoodlands. Section 3 describes and compares the main environmental economic results obtainedfrom the application of the two accounting frameworks to the Andalusia HOW. Section 4 discuss thekey findings and policy implications of applying the extended AAS to overcoming the standard SNAnature hidden contribution to total income in this HOW application. Section 5 concludes with themajor results, findings, and policy challenges.
2. Accounting Frameworks Applied to Holm Oak Open Woodlands
2.1. Total Income Accounting Framework Applied to Holm Oak Open Woodlands
The System of National Accounts (SNA) definitions of products, costs, and capital offer themainstream structure concepts of the production and capital accounts, which allows us to estimatethe net value added and the capital gain that integrate the coherent definition of the total income ofindividual products (see Appendix A on glossary of selected accounting economic variables used inthis HOW study). However, in practice, the SNA applied by nations is limited to the measurement ofa narrow net value added (NVASNA). The SNA measures the total product (TPSNA) without marketprice at production cost, in this case lacking conceptual consistency with the principle of valuation attransaction price, since it impedes the existence of a positive ordinary net operating margin (NOM).
The AAS and rSNA methodologies adapted to this HOW application are briefly described (fordetails see [26–28] and the Supplementary Texts S3 and S4). We conceptualize the accounting registersdeveloped in the HOW applications, which allow us to estimate the net value added (NVA), the capitalgain (CG), the ecosystem services (ES), total income (TI), labor cost (LC), manufactured capital income(CIm), and environmental income (EI). In the below general conceptual description of these variables itis not necessary to make the distinctions of the accounting methodologies and prices (Figure 1).
To date, the notable advances achieved in the techniques for valuing the final products consumptionwithout market price have not been incorporated into the standard System of National Accountsapplied by nations in their estimations of gross domestic product (GDP), which, as we will see, is stillan incomplete measure of the social total income for the period, generated within the territory of thedifferent nations [5,6].
The satellite Economic Accountsfor agriculture (including livestock and hunting activities) andforestry (EAA/EAF) of the SNA explicitly accept the concept of total income even though measuring itis not their purpose: “Income can be defined as the maximum amount which the beneficiaries canconsume over a given period without reducing the volume of their assets. It can also be defined as thetotal of the consumption and change in value of assets held over a given period, all else being equal,as income represents what could have been consumed” (italics in original text) [6] (p. 87).
The measurement of total income is the principle which governs the organization of the recordsfor the whole accounting system of an economic unit, which should abide by the economic principlethat the real capital values at the opening and closing of the period in which the total income producedin the territorial unit is measured remain the same.

Forests 2020, 11, 185 7 of 36
Forests 2020, 11, 185 7 of 38
Figure 1. Total income accounting identities applied in holm oak open woodlands in Andalusia, Spain.
Measuring the total income requires the type of production and capital (balance sheet) accounts described in the AAS methodology (see details in supplementary texts S3 and S4, [17,18]). The production account gives the net value added (NVA) and its distribution among the production factors of labor (LC), manufactured capital operating income(NOMm), and environmental assets operating income (NOMe) (Figure 1). The latter incorporate the investment environmental net operating margin (NOMei), which is natural growth (NG) less carbon activity emission (consumption of environmental fixed asset: CFCe) (1)
NOMei = NG − CFCe (1)
The capital account gives the capital revaluation (Cr). Following specific accounting adjustments applied to avoid double counting of the natural growth (NG) in HOW applications, the Cr allows us to estimate the capital gain (CG) (see Supplementary text S3 and [17,18]). In accordance with the factorial distribution of the NVA, the CG is divided into manufactured capital (CGm) and environmental asset (EAg) of each individual total product (Figure 1). Thus, having estimated at the closing of the period the real values registered and the residual values of the production and capital accounts, we estimate the NVA and the CG, which together give the social total income (TI) of the HOW for the period and its factorial distribution among remunerations for labor cost (LC), manufactured capital income (CIm), and environmental income (EI) (Figure 1).
The procedures for estimating the CGm and the EAg are the same. Here, we describe the EAg as it has more novel aspects of environmental asset account in the period. The environmental asset at the closing of the previous period is taken to be the same as the environmental asset at the opening (EAo) of the current period. Environmental asset entries (EAe) and withdrawals (EAw) occur during the period. Among other EAe, is that of natural growth (NG) for the period valued at environmental price discounted at the closing of the period. As regards the EAw, the work in progress used (WPeu)
Figure 1. Total income accounting identities applied in holm oak open woodlands in Andalusia, Spain.
Measuring the total income requires the type of production and capital (balance sheet)accounts described in the AAS methodology (see details in Supplementary Texts S3 and S4, [17,18]).The production account gives the net value added (NVA) and its distribution among the productionfactors of labor (LC), manufactured capital operating income(NOMm), and environmental assetsoperating income (NOMe) (Figure 1). The latter incorporate the investment environmental netoperating margin (NOMei), which is natural growth (NG) less carbon activity emission (consumptionof environmental fixed asset: CFCe) (1)
NOMei = NG − CFCe (1)
The capital account gives the capital revaluation (Cr). Following specific accounting adjustmentsapplied to avoid double counting of the natural growth (NG) in HOW applications, the Cr allows us toestimate the capital gain (CG) (see Supplementary Text S3 and [17,18]). In accordance with the factorialdistribution of the NVA, the CG is divided into manufactured capital (CGm) and environmental asset(EAg) of each individual total product (Figure 1). Thus, having estimated at the closing of the periodthe real values registered and the residual values of the production and capital accounts, we estimatethe NVA and the CG, which together give the social total income (TI) of the HOW for the period andits factorial distribution among remunerations for labor cost (LC), manufactured capital income (CIm),and environmental income (EI) (Figure 1).
The procedures for estimating the CGm and the EAg are the same. Here, we describe the EAg asit has more novel aspects of environmental asset account in the period. The environmental asset atthe closing of the previous period is taken to be the same as the environmental asset at the opening(EAo) of the current period. Environmental asset entries (EAe) and withdrawals (EAw) occur duringthe period. Among other EAe, is that of natural growth (NG) for the period valued at environmentalprice discounted at the closing of the period. As regards the EAw, the work in progress used (WPeu)

Forests 2020, 11, 185 8 of 36
valued at environmental price (equivalent to environmental intermediate consumption). At the endof the period, the closing environmental asset (EAc) is estimated, discounting the indefinite flow ofresource rents, assuming all else remains constant, except for the expected variations in biologicalproductivity which are modeled in advance [17]. The revaluation of the environmental asset (EAr) isthe residual variable (balancing item) in the capital account. The EAr (2) incorporates the change in theenvironmental asset in the period (CEA) (3)
EAr = CEA + EAw − EAe (2)
CEA = EAc − EAo (3)
The instrumental environmental asset adjustments (EAad) in HOW applications incorporate theexpected opening period natural growth valued (NG/(1+r)) and carbon final product consumption(FPcca/(1+r)) both valued at environmental prices (4). These adjustments avoid the double counting ofNG/(1+r) embedded in natural growth (NG) valued at the period closing and FPcca/(1+r) embeddedin carbon final consumption (FPcca) valued at the period closing.
EAad = NG/(1+r) + FPcca/(1+r) (4)
Figure 1 and the above CEA, EAr, EAg, and EAad accounting identities from the productionand capital accounts provide the elements which correspond to be able to measure the environmentalincome (EI). The EI represents the total contribution of nature (ecosystems) to the total income (TI) ofthe HOW. The EI is the core variable which gives the values of the ecosystem services (ES) and thechanges in the environmental assets for the period (CEA). In the case of some products, these CEA mustbe adjusted to avoid double counting, these CEA adjustments leading to the new variable of adjustedchange in environmental net worth (CNWead) according to WPeu. Once the CNWead has beenmeasured, the EI (5) can be presented in its ecosystem service (ES) (6) and CNWead (7) components.
EI = ES + CNWead (5)
ES = WPeu + NOMeo (6)
CNWead = NOMei + EAg −WPeu (7)
2.2. Prices of Environmental Assets and Products
The environmental timber, cork, and firewood assets at the opening of the period and totalproducts consumption are valued pending their production process stage at their environmental,stumpage, and farm gate prices. The prices of the stocks of timber, cork, and firewood produced arederived from the current value of the physical quantities times their discounted environmental price atthe opening of the period. The products consumption are valued based on the willingness-to-pay ofthe economic agents, depending on the stage they are at prior to their consumption as a final product.
The environmental price of a harvested product corresponds to the unitary resource rent.The harvested stumpage price of a product represents the transaction price before the productis harvested, and the farm gate price is the harvested price at the farm gate.
Commercial intermediate services (ISSc) without market prices are valued at production costs(e.g., conservation forestry and fire services). Commercial intermediate products with formal marketsare valued at their imputed market prices (e.g., grazing and residential service).
Embedded in the value of the total product (TP) at social price are the individual values of its totalproduction costs (TC) and the net operating margin (NOM). The social price is measured in this HOWas the total product at basic price less the ordinary own non-commercial intermediate consumption ofservices amenity auto-consumption (SSncooa) and donation (SSncood). These SSncoa/d, which come

Forests 2020, 11, 185 9 of 36
from the omitted hunting and livestock activities, are valued according to the ordinary manufacturednet operating margin loss (opportunity cost) voluntarily accepted by the farmers.
In this HOW application, the activities valued do not incorporate non-commercial intermediateproduct of services compensation (ISSncc), but they do include ordinary own non-commercialintermediate consumption of services compensation (SSncooc), which is used by the amenity andlandscape activities, and which comes from the ISSncc of the omitted activities of hunting and livestock.Therefore, the basic price in this HOW study is the producer price less SSncooc.
The fact that products are valued at producer, basic, and social prices does not influence theaggregate estimate for the considered HOW activities as a whole (if hunting and livestock activities wereincluded). However, the different types of prices do influence the estimates of ecosystem services andthe gross value added of the farmer and government HOW activities valued, and those of individualactivities where input of SSncooc/a/d is involved.
The revised System of National Accounts (rSNA) applied to the HOW estimates environmentaleconomic variables at both producer and basic prices. In the Agroforestry Accounting System (ASS),ecosystem services and incomes are valued at producer, basic, and social prices. The reason for thisdifference is that the AAS considers the SSncooa/d accruing from the HOW hunting and livestockactivities omitted.
The HOW maps of tile geo-referenced results of total environmental income shows values atproducer price. In this case, the embedded amenity environmental income is overvalued with respectto its social prices due to the omission of the SSncooa.
2.3. Integration of the rSNA in the AAS Applied to Holm Oak Open Woodlands
We are interested in linking the net value added at social prices in the AAS (NVAsp,AAS) withthe respective rSNA at basic prices (NVAbp,rSNA). This linkage is achieved in this HOW applicationthrough the following criteria: (i) subtracting ordinary own non-commercial intermediate consumptionof services from the farmer amenity auto-consumption (SSncooaAAS) and government donation(SSncoodAAS); (ii) adding the difference from the price of the final product of private amenityauto-consumption (∆FPaaAAS) derived from farmers’ willingness-to-pay to the rSNA valued atthe manufactured production cost, the final product of water supply (∆FPwaAAS) derived fromthe revealed (hedonic) environmental market price to the water supply used by the industry andservice sectors valued by the rSNA at manufactured production cost, non-commercial (in this HOWapplication, consumption of public goods and services without market prices are recreational service,landscape conservation service, and existence of the threatened wild biodiversity service) finalproduct consumption of government goods and services (∆FPncG,AAS) valued at revealed marginalconsumer willingness-to-pay to the cost price of the rSNA, carbon final product consumption (FPcaAAS);and (iii) subtracting the carbon consumption from environmental fixed asset (CFCecaAAS) (8)
NVAsp,AAS = NVAbp,rSNA − SSncooaAAS − SSncoodAAS +∆FPaaAAS
+∆FPwaAAS + ∆FPncGAAS + FPcaAAS − CFCecaAAS(8)
Figure 1 and the above equations show that the rSNA and the AAS contain consistentintegrated accounting structures which allow homogeneous comparisons of their ecosystem service,incomes, environmental asset values, as well as any other environmental economic indicator of theecosystem type.
3. Results
The primary data are the authors’ own sources and comes from the RECAMAN project [17].The authors wish to express our willingness to provide the primary data on which the results of thisstudy are based to any readers who request it. In this study, we consider the methods used in theestimation of the values recorded for the Andalusian holm oak woodlands (HOW) in the production

Forests 2020, 11, 185 10 of 36
and capital accounts of the rSNA and AAS methodologies compared to be well known (see detaileddescription in the Supplementary Text S3 and [17]).
3.1. Agroforestry Accounting System Total Income and Capital
The purposes of the production and capital accounts in the AAS methodology are to estimatethe net value added (NVA) and the capital gain (Cg) to be able to obtain the social total income(Figure 1). The net operating margin (NOM) and capital revaluation (Cr) are the production and capitalaccounts balancing items respectively. The NOM is measured by subtracting the labor cost (LC) andconsumption of fixed capital from the total product (TP) (Figure 1, Table 1). The capital gain (Cg) ismeasured by subtracting the capital adjustment (Cad) from the capital revaluation (Cr) according tothe accounting register convention to avoid double counting (Table 2).
It may seem strange that countries do not know the income of their national territories whenthe economic statistic most universally used by governments is that known as the gross domesticproduct (GDP). The GDP is a synonym for the gross value added (GVA) and in fact the income for thenational territory, which in practice is estimated by the government offices for statistics through theSNA, is represented by the net domestic product (NDP), which is synonymous with net value added(NVA). We have devised the AAS production account for the purpose of estimating the NVA andexcluding the capital gain (CG) in the gross capital formation (GCF). The SNA also excludes capitalgain from the GCF, except for that which corresponds to the livestock activity. We need to estimate theCG from the capital account and thus provide a value for the total income of the HOW.
3.1.1. Net Value Added
The ultimate aim guiding the accounting structure of the AAS total production account recordsis the measurement of the net values added (NVA) classified into ordinary (NVAo) and investment(NVAi) of the individual activities, institutional sectors of farmer and government, and whole corkoak woodlands (HOW) activities, along with the factorial distribution among the labor costs (LC),manufactured net operating margin (NOMm), and environmental net operating margin (NOMe)(Table 1, Tables S3 and S4).
Table 1 and Table S3 show the details of the total product (TP) and total cost (TC) records for theindividual activities, which in turn allow us to estimate their respective net operating margins at socialprice (NOMsp) and their factorial distribution among the operating services of manufactured capital(NOMm) and the environmental asset (NOMe). Table S3 shows the separation of the total cost intoordinary total cost (TCo) and total investment cost (TCi). This classification of the costs allows usto distinguish the origin of the NOMe as total products consumption (NOMeo) and net investmentin environmental assets (NOMei). The NOMei is estimated according to the natural growth less theconsumption of environmental fixed capital (CFCe). The manufactured investment is represented byown-account gross fixed capital formation (GFCF) and does not generate manufactured investmentnet operating margin (NOMmi) as it has been valued at production cost. That is, the NOMmi is notapplicable. Figures 2 and 3 show the net added values of the individual, farmer, government, and totalactivities of the HOW separated into labor cost (LC) and net operating margin (NOM).
Forests 2020, 11, 185 11 of 36
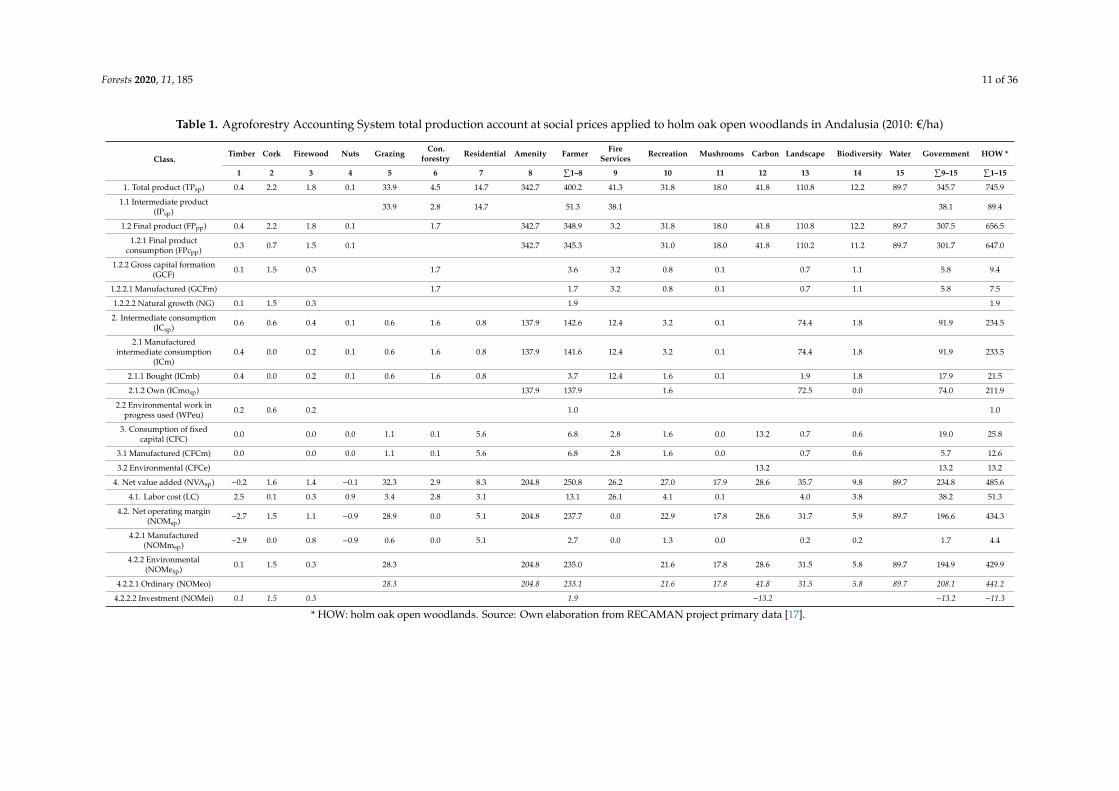
Table 1. Agroforestry Accounting System total production account at social prices applied to holm oak open woodlands in Andalusia (2010: €/ha)
Class.Timber Cork Firewood Nuts Grazing Con.
forestry Residential Amenity Farmer FireServices Recreation Mushrooms Carbon Landscape Biodiversity Water Government HOW *
1 2 3 4 5 6 7 8∑
1–8 9 10 11 12 13 14 15∑
9–15∑
1–15
1. Total product (TPsp) 0.4 2.2 1.8 0.1 33.9 4.5 14.7 342.7 400.2 41.3 31.8 18.0 41.8 110.8 12.2 89.7 345.7 745.9
1.1 Intermediate product(IPsp) 33.9 2.8 14.7 51.3 38.1 38.1 89.4
1.2 Final product (FPpp) 0.4 2.2 1.8 0.1 1.7 342.7 348.9 3.2 31.8 18.0 41.8 110.8 12.2 89.7 307.5 656.5
1.2.1 Final productconsumption (FPcpp) 0.3 0.7 1.5 0.1 342.7 345.3 31.0 18.0 41.8 110.2 11.2 89.7 301.7 647.0
1.2.2 Gross capital formation(GCF) 0.1 1.5 0.3 1.7 3.6 3.2 0.8 0.1 0.7 1.1 5.8 9.4
1.2.2.1 Manufactured (GCFm) 1.7 1.7 3.2 0.8 0.1 0.7 1.1 5.8 7.5
1.2.2.2 Natural growth (NG) 0.1 1.5 0.3 1.9 1.9
2. Intermediate consumption(ICsp) 0.6 0.6 0.4 0.1 0.6 1.6 0.8 137.9 142.6 12.4 3.2 0.1 74.4 1.8 91.9 234.5
2.1 Manufacturedintermediate consumption
(ICm)0.4 0.0 0.2 0.1 0.6 1.6 0.8 137.9 141.6 12.4 3.2 0.1 74.4 1.8 91.9 233.5
2.1.1 Bought (ICmb) 0.4 0.0 0.2 0.1 0.6 1.6 0.8 3.7 12.4 1.6 0.1 1.9 1.8 17.9 21.5
2.1.2 Own (ICmosp) 137.9 137.9 1.6 72.5 0.0 74.0 211.9
2.2 Environmental work inprogress used (WPeu) 0.2 0.6 0.2 1.0 1.0
3. Consumption of fixedcapital (CFC) 0.0 0.0 0.0 1.1 0.1 5.6 6.8 2.8 1.6 0.0 13.2 0.7 0.6 19.0 25.8
3.1 Manufactured (CFCm) 0.0 0.0 0.0 1.1 0.1 5.6 6.8 2.8 1.6 0.0 0.7 0.6 5.7 12.6
3.2 Environmental (CFCe) 13.2 13.2 13.2
4. Net value added (NVAsp) −0.2 1.6 1.4 −0.1 32.3 2.9 8.3 204.8 250.8 26.2 27.0 17.9 28.6 35.7 9.8 89.7 234.8 485.6
4.1. Labor cost (LC) 2.5 0.1 0.3 0.9 3.4 2.8 3.1 13.1 26.1 4.1 0.1 4.0 3.8 38.2 51.3
4.2. Net operating margin(NOMsp) −2.7 1.5 1.1 −0.9 28.9 0.0 5.1 204.8 237.7 0.0 22.9 17.8 28.6 31.7 5.9 89.7 196.6 434.3
4.2.1 Manufactured(NOMmsp) −2.9 0.0 0.8 −0.9 0.6 0.0 5.1 2.7 0.0 1.3 0.0 0.2 0.2 1.7 4.4
4.2.2 Environmental(NOMesp) 0.1 1.5 0.3 28.3 204.8 235.0 21.6 17.8 28.6 31.5 5.8 89.7 194.9 429.9
4.2.2.1 Ordinary (NOMeo) 28.3 204.8 233.1 21.6 17.8 41.8 31.5 5.8 89.7 208.1 441.2
4.2.2.2 Investment (NOMei) 0.1 1.5 0.3 1.9 −13.2 −13.2 −11.3
* HOW: holm oak open woodlands. Source: Own elaboration from RECAMAN project primary data [17].

Forests 2020, 11, 185 12 of 36
Table 2. Agroforestry Accounting System opening capital of holm oak open woodlands in Andalusia (2010: €/ha)
ClassEnvironmental Asset Manufactured Capital Opening Capital
Farmer Government Total Farmer Government Total Farmer Government Total
Timber 10.3 10.3 0.7 0.7 11.1 11.1
Cork 38.1 38.1 1.0 1.0 39.1 39.1
Firewood 210.8 210.8 0.1 0.1 210.9 210.9
Nuts 0.3 0.3 0.0 0.0 0.3 0.3
Grazing 1051.0 1051.0 18.5 18.5 1069.5 1069.5
Grass andbrowse 727.7 727.7 18.5 18.5 746.1 746.1
Acorn 74.0 74.0 74.0 74.0
Game grazing 249.3 249.3 249.3 249.3
Con.forestry 10.0 10.0 10.0 10.0
Residential 455.1 455.1 455.1 455.1
Amenity 3521.6 3521.6 3521.6 3521.6
Fire services 44.6 44.6 44.6 44.6
Recreation 892.9 892.9 40.5 40.5 933.3 933.3
Mushrooms 591.0 591.0 1.2 1.2 592.2 592.2
Carbon 346.5 346.5 346.5 346.5
Landscape 1056.1 1056.1 2.7 2.7 1058.8 1058.8
Biodiversity 198.0 198.0 3.8 3.8 201.8 201.8
Water 1467.9 1467.9 1467.9 1467.9
Total 4832.2 4552.4 9384.6 485.4 92.9 578.2 5317.6 4645.2 9962.8

Forests 2020, 11, 185 13 of 36
Forests 2020, 11, 185 13 of 38
Table 2. Agroforestry Accounting System opening capital of holm oak open woodlands in Andalusia (2010: €/ha)
Class Environmental Asset Manufactured Capital Opening Capital
Farmer Government Total Farmer Government Total Farmer Government Total Timber 10.3 10.3 0.7 0.7 11.1 11.1 Cork 38.1 38.1 1.0 1.0 39.1 39.1 Firewood 210.8 210.8 0.1 0.1 210.9 210.9 Nuts 0.3 0.3 0.0 0.0 0.3 0.3 Grazing 1051.0 1051.0 18.5 18.5 1069.5 1069.5 Grass and browse
727.7 727.7 18.5 18.5 746.1 746.1
Acorn 74.0 74.0 74.0 74.0 Game grazing 249.3 249.3 249.3 249.3 Con.forestry 10.0 10.0 10.0 10.0 Residential 455.1 455.1 455.1 455.1 Amenity 3521.6 3521.6 3521.6 3521.6 Fire services 44.6 44.6 44.6 44.6 Recreation 892.9 892.9 40.5 40.5 933.3 933.3 Mushrooms 591.0 591.0 1.2 1.2 592.2 592.2 Carbon 346.5 346.5 346.5 346.5 Landscape 1056.1 1056.1 2.7 2.7 1058.8 1058.8 Biodiversity 198.0 198.0 3.8 3.8 201.8 201.8 Water 1467.9 1467.9 1467.9 1467.9 Total 4832.2 4552.4 9384.6 485.4 92.9 578.2 5317.6 4645.2 9962.8
Figure 2. Agroforestry Accounting System farmer net value added at social prices of holm oak open woodlands in Andalusia (2010: €/ha).
-50
0
50
100
150
200
250
300
Timber Cork Firewood Nuts Grazing Conservation forestry
Residential Amenity Farmer
2010
: €/h
a
Labour cost (LC) Net operating margin (NOM)
Figure 2. Agroforestry Accounting System farmer net value added at social prices of holm oak openwoodlands in Andalusia (2010: €/ha).Forests 2020, 11, 185 14 of 38
Figure 3. Agroforestry Accounting System total net value added at social prices of holm oak open woodlands in Andalusia (2010: €/ha).
Figures 2 and 3 show the net value added of the individual, farmer, government, and total activities of the HOW separated into labor cost (LC) and net operating margin (NOM). Labor cost only contributes minimally to the total income of the HOW activities valued since the HOW animal activities omitted are those which generate most of the demand for employment.
3.1.2. Capital Gain
Table 2 shows the opening capital for the period of the 15 HOW economic activities valued, separated into manufactured (Cmo) and environmental (EAo). Three of the 15 HOW activities valued do not contribute to the environmental assets. The most important individual environmental assets are the private amenity, stored surface water, grazing, and landscape (Table 2). The Cmo mainly corresponds to the farmer activities and the EAo are divided in similar proportions between farmers and government (Table 3).
0
50
100
150
200
250
300
350
400
450
500
Farmer Fire services Recreation Mushrooms Carbon Landscape Biodiversity Water Government Holm oak open
woodlands
2010
: €/h
a
Labour cost (LC) Net operating margin (NOM)
Figure 3. Agroforestry Accounting System total net value added at social prices of holm oak openwoodlands in Andalusia (2010: €/ha).
Table 3 and Table S3 give the variables for the (WPeu) and the ordinary environmental netoperating margin (NOMeo), which—added together—give the ecosystem service (ES) estimates.Table 3 and Table S4 provide a detailed description of the components which make up the value of aproduct consumption, among which are the ecosystem services. Finally, Table 1 and Table S3 showthe net value added (NVA) which remunerates the labor cost (LC) and the total capital net operatingmargin (NOM).
Figures 2 and 3 show the net value added of the individual, farmer, government, and totalactivities of the HOW separated into labor cost (LC) and net operating margin (NOM). Labor costonly contributes minimally to the total income of the HOW activities valued since the HOW animalactivities omitted are those which generate most of the demand for employment.
Forests 2020, 11, 185 14 of 36
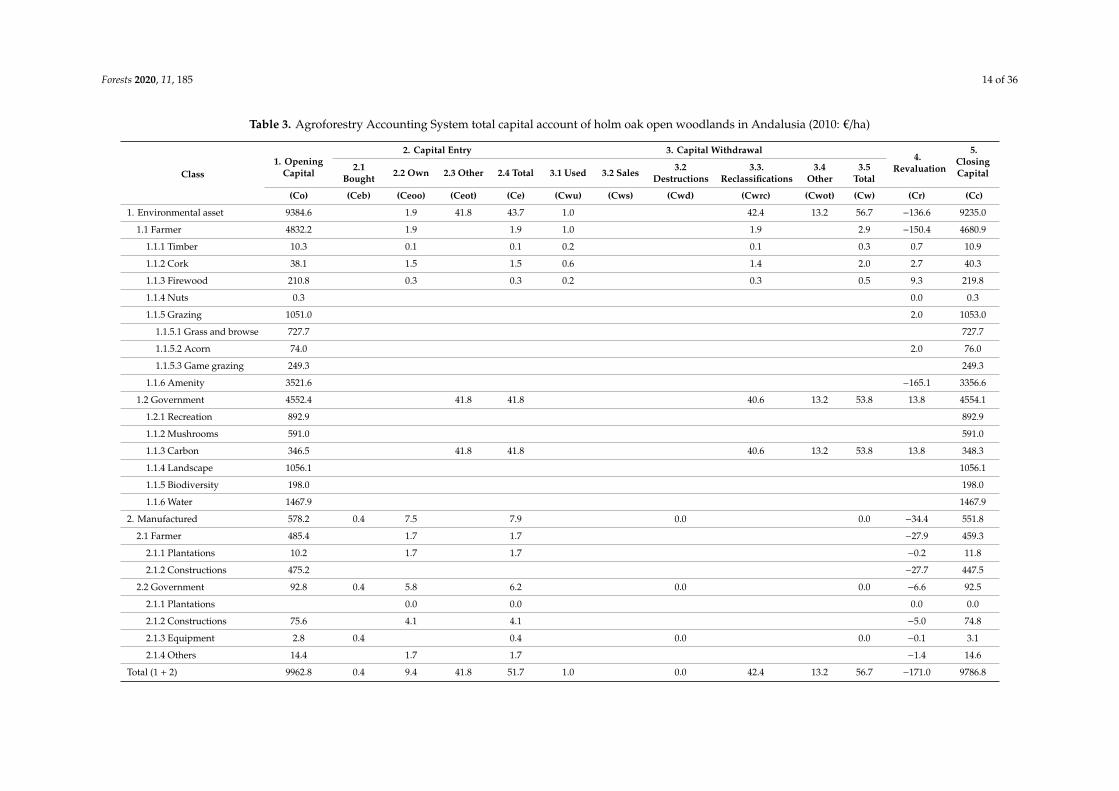
Table 3. Agroforestry Accounting System total capital account of holm oak open woodlands in Andalusia (2010: €/ha)
Class1. Opening
Capital
2. Capital Entry 3. Capital Withdrawal4.
Revaluation
5.ClosingCapital
2.1Bought 2.2 Own 2.3 Other 2.4 Total 3.1 Used 3.2 Sales 3.2
Destructions3.3.
Reclassifications3.4
Other3.5
Total
(Co) (Ceb) (Ceoo) (Ceot) (Ce) (Cwu) (Cws) (Cwd) (Cwrc) (Cwot) (Cw) (Cr) (Cc)
1. Environmental asset 9384.6 1.9 41.8 43.7 1.0 42.4 13.2 56.7 −136.6 9235.0
1.1 Farmer 4832.2 1.9 1.9 1.0 1.9 2.9 −150.4 4680.9
1.1.1 Timber 10.3 0.1 0.1 0.2 0.1 0.3 0.7 10.9
1.1.2 Cork 38.1 1.5 1.5 0.6 1.4 2.0 2.7 40.3
1.1.3 Firewood 210.8 0.3 0.3 0.2 0.3 0.5 9.3 219.8
1.1.4 Nuts 0.3 0.0 0.3
1.1.5 Grazing 1051.0 2.0 1053.0
1.1.5.1 Grass and browse 727.7 727.7
1.1.5.2 Acorn 74.0 2.0 76.0
1.1.5.3 Game grazing 249.3 249.3
1.1.6 Amenity 3521.6 −165.1 3356.6
1.2 Government 4552.4 41.8 41.8 40.6 13.2 53.8 13.8 4554.1
1.2.1 Recreation 892.9 892.9
1.1.2 Mushrooms 591.0 591.0
1.1.3 Carbon 346.5 41.8 41.8 40.6 13.2 53.8 13.8 348.3
1.1.4 Landscape 1056.1 1056.1
1.1.5 Biodiversity 198.0 198.0
1.1.6 Water 1467.9 1467.9
2. Manufactured 578.2 0.4 7.5 7.9 0.0 0.0 −34.4 551.8
2.1 Farmer 485.4 1.7 1.7 −27.9 459.3
2.1.1 Plantations 10.2 1.7 1.7 −0.2 11.8
2.1.2 Constructions 475.2 −27.7 447.5
2.2 Government 92.8 0.4 5.8 6.2 0.0 0.0 −6.6 92.5
2.1.1 Plantations 0.0 0.0 0.0 0.0
2.1.2 Constructions 75.6 4.1 4.1 −5.0 74.8
2.1.3 Equipment 2.8 0.4 0.4 0.0 0.0 −0.1 3.1
2.1.4 Others 14.4 1.7 1.7 −1.4 14.6
Total (1 + 2) 9962.8 0.4 9.4 41.8 51.7 1.0 0.0 42.4 13.2 56.7 −171.0 9786.8

Forests 2020, 11, 185 15 of 36
3.1.2. Capital Gain
Table 2 shows the opening capital for the period of the 15 HOW economic activities valued,separated into manufactured (Cmo) and environmental (EAo). Three of the 15 HOW activities valueddo not contribute to the environmental assets. The most important individual environmental assetsare the private amenity, stored surface water, grazing, and landscape (Table 2). The Cmo mainlycorresponds to the farmer activities and the EAo are divided in similar proportions between farmersand government (Table 3).
The capital account in Table 3, Tables S5 and S6 show the capital revaluation (Cr), distinguishingbetween the revaluation of manufactured capital (Cmr) and environmental assets (EAr). Accordingwith the accounting adjustments (Cad), which avoid double counting due to the ad hoc proceduresused in the measurement of the NG, carbon final consumption, and manufactured fixed capitalconsumption revaluation (CFCmr) we arrive at estimates for the capital gain (GC) and its separationinto manufactured (CGm) and environmental (EAg) as shown in Figure 1 and Figure S1 and Table S7.
The HOW maintain a minimal value of environmental work in progress asset (WPe) (Table 2,Table 3, Table S5, and Table S6) due to the dissipation of the resource rent from firewood and scarcerepresentation of the associated species of timber-yielding conifers and cork oaks respectively. Althoughthe resource rent from grazing is tending to decline, it is still the second environmental asset for farmersin terms of value after the amenity (Tables 2 and 3).
The negative result for the CG of the HOW in the 2010 period is due to the drop in land pricesand the manufactured capital of machinery and buildings not forecast at the opening of the period.The volatility of the land price change in the short term is of little relevance given the long-terminvestment-consumption rationale of the land owners. The variation of annual real accumulative rateof grassland prices of HOW over the period 1994–2010 was more than 3% [29].
The factorial distributions of the total income are consistent with the results of the opening capital,where the environmental assets make up most of the total opening capital and therefore at the closingof the period the environmental income makes up most of the total income of the HOW. In the 2010period the circumstance arose of the manufactured capital income being negative.
3.1.3. Total and Environmental Incomes
We have described above the structured results for the total production (Table S3) and capitalaccounts (Tables 1–3, Tables S5 and S6) of the holm oak open woodlands (HOW), which allow us toreorganize and simplify the data in the instrumental sequence of accounts which show the estimatesof the net values added, ecosystem services, total income, and environmental income. The resultsfor these variables are presented per individual, farmer, government, and total activities in the HOWof Andalusia.
Table 1, Table 3, and Table S7 and Figure 1 and Figure S1 present the simplified sequence ofproduction and capital accounts which allow the estimation of the total income and its factorialdistribution as the sum of the NVA and the GC. It is important to note that the simplified structures ofthe data in Table S7 and Figure S1 are derived from the complete primary data of Tables S3 and S5.
Table S4 shows, in detail, the measurement of the ecosystem services (ES) valued at social pricesbased on separating the estimates for net value added of the total products consumption (TPc) andown-account gross capital formation (GCF) for the period of the individual HOW activities. Only theTPc contains the ecosystem services (ES) embedded in its two possible components of intermediateconsumption of environmental work in progress used (WPeu) and ordinary operating income of theenvironmental asset represented by the ordinary environmental net operating margin (NOMeo).
The production account (Table 1, Table S3, and Table S4) and capital account (Table 2, Table 3,Table S5, and Table S6) allow a simplified sequence of identities of the total income measurements.Figure S1 show the sequence of identities which permit the total income to be estimated as the sum ofthe net value added at social price (NVAsp) and the capital gain (CG).
Forests 2020, 11, 185 16 of 36
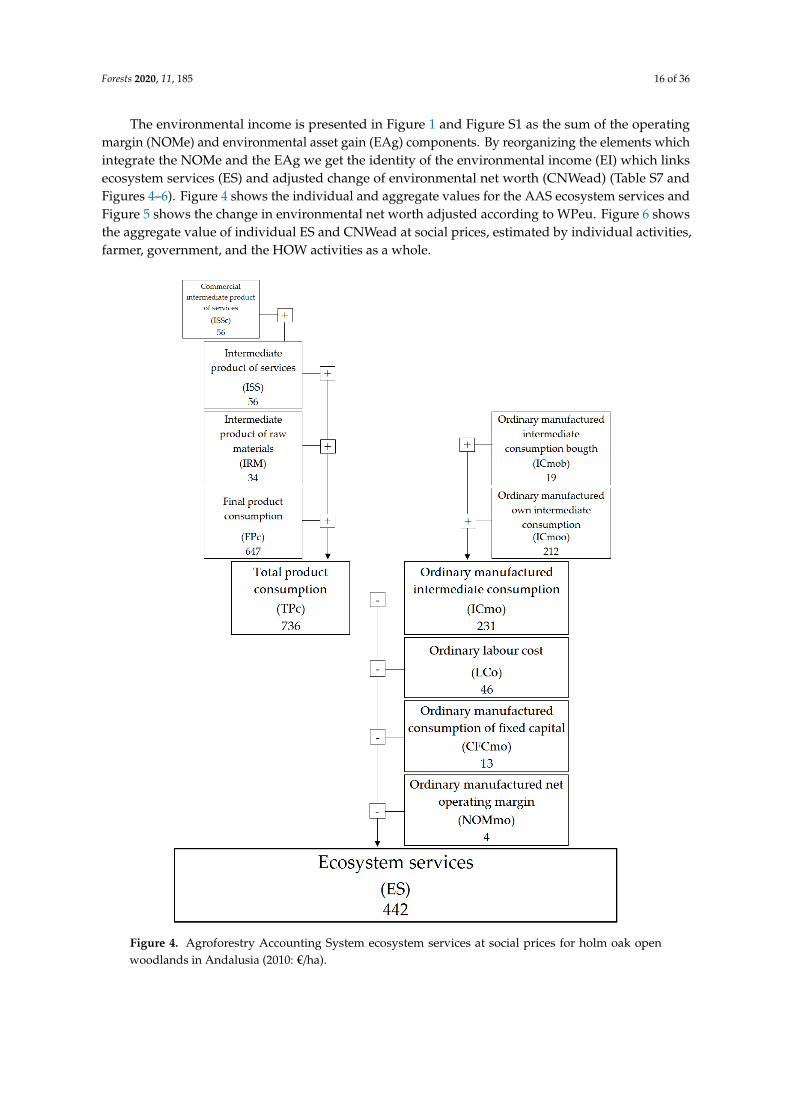
The environmental income is presented in Figure 1 and Figure S1 as the sum of the operatingmargin (NOMe) and environmental asset gain (EAg) components. By reorganizing the elements whichintegrate the NOMe and the EAg we get the identity of the environmental income (EI) which linksecosystem services (ES) and adjusted change of environmental net worth (CNWead) (Table S7 andFigures 4–6). Figure 4 shows the individual and aggregate values for the AAS ecosystem services andFigure 5 shows the change in environmental net worth adjusted according to WPeu. Figure 6 showsthe aggregate value of individual ES and CNWead at social prices, estimated by individual activities,farmer, government, and the HOW activities as a whole.Forests 2020, 11, 185 17 of 38
Figure 4. Agroforestry Accounting System ecosystem services at social prices for holm oak open woodlands in Andalusia (2010: €/ha).
Figure 4. Agroforestry Accounting System ecosystem services at social prices for holm oak openwoodlands in Andalusia (2010: €/ha).

Forests 2020, 11, 185 17 of 36
Forests 2020, 11, 185 18 of 38
Figure 5. Agroforestry Accounting System adjusted change in environmental net worth for holm oak open woodlands in Andalusia (2010: €/ha).
Figure 5. Agroforestry Accounting System adjusted change in environmental net worth for holm oakopen woodlands in Andalusia (2010: €/ha).
The briefly described sequences of accounts are repeated in the application of the rSNA to theholm oak open woodlands of Andalusia (Tables S8, S9, and Table A1 on Appendix B).

Forests 2020, 11, 185 18 of 36Forests 2020, 11, 185 19 of 38
Figure 6. Agroforestry Accounting System ecosystem services change in environmental net worth adjusted according to WPeu and environmental incomes at social prices for holm oak open woodlands in Andalusia (2010: €/ha).
The briefly described sequences of accounts are repeated in the application of the rSNA to the holm oak open woodlands of Andalusia (Tables S8, S9, and A1 on Appendix B).
Figure 6. Agroforestry Accounting System ecosystem services change in environmental net worth adjusted according to WPeu and environmental incomes at socialprices for holm oak open woodlands in Andalusia (2010: €/ha).
Forests 2020, 11, 185 19 of 36
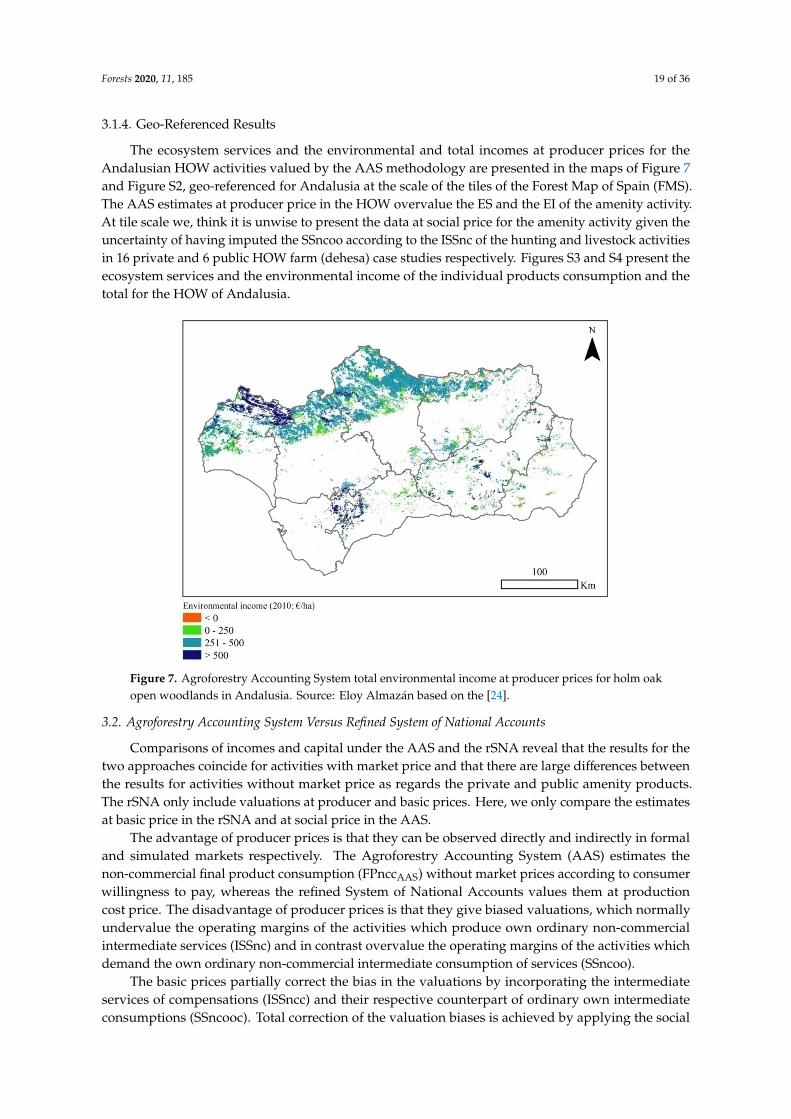
3.1.4. Geo-Referenced Results
The ecosystem services and the environmental and total incomes at producer prices for theAndalusian HOW activities valued by the AAS methodology are presented in the maps of Figure 7and Figure S2, geo-referenced for Andalusia at the scale of the tiles of the Forest Map of Spain (FMS).The AAS estimates at producer price in the HOW overvalue the ES and the EI of the amenity activity.At tile scale we, think it is unwise to present the data at social price for the amenity activity given theuncertainty of having imputed the SSncoo according to the ISSnc of the hunting and livestock activitiesin 16 private and 6 public HOW farm (dehesa) case studies respectively. Figures S3 and S4 present theecosystem services and the environmental income of the individual products consumption and thetotal for the HOW of Andalusia.
Forests 2020, 11, 185 20 of 38
3.1.4. Geo-Referenced Results
The ecosystem services and the environmental and total incomes at producer prices for the Andalusian HOW activities valued by the AAS methodology are presented in the maps of Figures 7 and S2, geo-referenced for Andalusia at the scale of the tiles of the Forest Map of Spain (FMS). The AAS estimates at producer price in the HOW overvalue the ES and the EI of the amenity activity. At tile scale we, think it is unwise to present the data at social price for the amenity activity given the uncertainty of having imputed the SSncoo according to the ISSnc of the hunting and livestock activities in 16 private and 6 public HOW farm (dehesa) case studies respectively. Figures S3 and S4 present the ecosystem services and the environmental income of the individual products consumption and the total for the HOW of Andalusia.
Figure 7. Agroforestry Accounting System total environmental income at producer prices for holm oak open woodlands in Andalusia. Source: Eloy Almazán based on the [24].
3.2. Agroforestry Accounting System Versus Refined System of National Accounts
Comparisons of incomes and capital under the AAS and the rSNA reveal that the results for the two approaches coincide for activities with market price and that there are large differences between the results for activities without market price as regards the private and public amenity products. The rSNA only include valuations at producer and basic prices. Here, we only compare the estimates at basic price in the rSNA and at social price in the AAS.
The advantage of producer prices is that they can be observed directly and indirectly in formal and simulated markets respectively. The Agroforestry Accounting System (AAS) estimates the non-commercial final product consumption (FPnccAAS) without market prices according to consumer willingness to pay, whereas the refined System of National Accounts values them at production cost price. The disadvantage of producer prices is that they give biased valuations, which normally undervalue the operating margins of the activities which produce own ordinary non-commercial intermediate services (ISSnc) and in contrast overvalue the operating margins of the activities which demand the own ordinary non-commercial intermediate consumption of services (SSncoo).
The basic prices partially correct the bias in the valuations by incorporating the intermediate services of compensations (ISSncc) and their respective counterpart of ordinary own intermediate
Figure 7. Agroforestry Accounting System total environmental income at producer prices for holm oakopen woodlands in Andalusia. Source: Eloy Almazán based on the [24].
3.2. Agroforestry Accounting System Versus Refined System of National Accounts
Comparisons of incomes and capital under the AAS and the rSNA reveal that the results for thetwo approaches coincide for activities with market price and that there are large differences betweenthe results for activities without market price as regards the private and public amenity products.The rSNA only include valuations at producer and basic prices. Here, we only compare the estimatesat basic price in the rSNA and at social price in the AAS.
The advantage of producer prices is that they can be observed directly and indirectly in formaland simulated markets respectively. The Agroforestry Accounting System (AAS) estimates thenon-commercial final product consumption (FPnccAAS) without market prices according to consumerwillingness to pay, whereas the refined System of National Accounts values them at productioncost price. The disadvantage of producer prices is that they give biased valuations, which normallyundervalue the operating margins of the activities which produce own ordinary non-commercialintermediate services (ISSnc) and in contrast overvalue the operating margins of the activities whichdemand the own ordinary non-commercial intermediate consumption of services (SSncoo).
The basic prices partially correct the bias in the valuations by incorporating the intermediateservices of compensations (ISSncc) and their respective counterpart of ordinary own intermediateconsumptions (SSncooc). Total correction of the valuation biases is achieved by applying the social

Forests 2020, 11, 185 20 of 36
price. In this study of HOW, we have added the valuations imputed at basic prices and social prices tothe results at producer prices. Due to a lack of representative statistical basic and social price valuations,any conclusions with regard to the results at basic and social prices for the only two individual activitiesaffected—namely, amenity and landscape—should be drawn with caution (see Supplementary Text S4).Furthermore, having estimated the willingness to pay for landscape and threatened biodiversityactivities as a value additional to their total costs, whatever the type of cost, the ecosystem servicesof these activities will not vary when the type of prices changed. It can be observed in Table 4 andTable S10 that the price comparisons within the same accounting methodologies present unitary indices,indicating the absence of variation with type of price applied. Given these results, we lean towardspresenting the results at producer prices in this incomplete study of the HOW activities in Andalusia.However, for illustrative purposes, we comment on some of the variations in the results for ecosystemincomes and services of the amenity activity, the farmer, and the HOW activities as a whole.
The HOW ecosystem services and the gross values added at producer prices and social pricesfor the farmers and the total for the activities vary due to the omission of the livestock and huntingactivities (see Table 4 and Table S10). The variation in ecosystem services (ES), depending on the typeof price applied, is slightly greater for the amenity activity than for the farmer activities as a wholedue to the greater weight of the amenity in the ES and because the rest of the farmer activities are notaffected by the inclusion of the SSncoo.
There are notable variations in the valuations of farmer ES and gross added values which indicatethat, in the presence of auto-consumption of amenities by the owners, the social price more reliablyreflects the individual and aggregate economic valuations derived from the economic rationales ofthe owners.
The estimates of ecosystem services for government activities in this HOW study do not varydepending on the type of price applied, although gross added values for landscape and the aggregatetotal for the government activities do vary.
As regards HOW activities as a whole, comparisons of ES and GVA evaluations reveal substantialovervaluations when estimating at producer prices in comparison to social prices (Table 4 and Table S10).
In the HOW activities valued using the rSNA, the ES and GVA estimates are 28% and 37%respectively of the respective values in the AAS (Table 4 and Table S10).
Figure 8 shows that amenity, carbon, and landscape are the ecosystem services which present thegreatest differences in the comparisons between the rSNA at basic price and the AAS at social price.Figure 9 reveals an important loss in environmental income for the amenity, caused by the fall in theprice of land in 2010. The rest of the activities show almost zero or positive environmental incomes.

Forests 2020, 11, 185 21 of 36
Table 4. Agroforestry Accounting System and refined standard System of National Accounts ecosystem services and gross value-added index comparisons for holmoak open woodlands in Andalusia (2010).
ClassTimber Cork Firewood Nuts Grazing Conserv.
Forestry Residential Amenity Farmer FireServices Recreation Mushrooms Carbon Landscape Biodiversity Water Government
Holm OakOpen
Woodlands
1 2 3 4 5 6 7 8∑
1–8 9 10 11 12 13 14 15∑
9–15∑
1–15
Ecosystem services
ESpp,AAS/ESsp,AAS 1.0 1.0 1.0 0.0 1.0 1.6 1.5 1.0 1.0 1.0 1.0 1.0 1.0 1.0 1.3
ESbp,AAS/ESsp,AAS 1.0 1.0 1.0 0.0 1.0 1.6 1.5 1.0 1.0 1.0 1.0 1.0 1.0 1.0 1.3
ESbp,rSNA/ESsp,AAS 1.0 1.0 1.0 0.0 1.0 n.a 0.1 n.a 1.0 n.a n.a n.a 0.9 0.5 0.3
ESpp,rSNA/ESpb,rSNA 1.0 1.0 1.0 0.0 1.0 n.a 1.0 n.a 1.0 n.a n.a n.a 1.0 1.0 1.0
Gross value added
GVApp,AAS/GVAsp, AAS 1.0 1.0 1.0 1.0 1.0 1.0 1.0 1.6 1.5 1.0 1.0 1.0 1.0 1.9 1.0 1.0 1.1 1.3
GVAbp,AAS /GVAsp,AAS 1.0 1.0 1.0 1.0 1.0 1.0 1.0 1.6 1.5 1.0 1.0 1.0 1.0 1.1 1.0 1.0 1.0 1.2
GVAbp,rSNA/GVAsp,AAS 1.0 1.0 1.0 1.0 1.0 1.0 1.0 0.0 0.2 1.0 0.2 1.0 n.a 0.1 0.4 0.9 0.5 0.4
GVApp,rSNA/GVAbp,rSNA 1.0 1.0 1.0 1.0 1.0 1.0 1.0 0.0 1.0 1.0 1.0 1.0 n.a 1.0 1.0 1.0 1.0 1.0
sp—social prices; bp—basic prices; pp—producer prices. n.a is not applicable in rSNA methodology.

Forests 2020, 11, 185 22 of 36
Forests 2020, 11, 185 23 of 38
Figure 8. AAS and rSNA ecosystem services at social and basic prices comparison for holm oak open woodlands in Andalusia (2010: €/ha).Figure 8. AAS and rSNA ecosystem services at social and basic prices comparison for holm oak open woodlands in Andalusia (2010: €/ha).

Forests 2020, 11, 185 23 of 36
Forests 2020, 11, 185 24 of 38
Figure 9. Comparison of AAS and rSNA environmental income at social and basic prices for holm oak open woodlands in Andalusia (2010: €/ha).Figure 9. Comparison of AAS and rSNA environmental income at social and basic prices for holm oak open woodlands in Andalusia (2010: €/ha).
Forests 2020, 11, 185 24 of 36
4. Discussion
4.1. We Cannot Consume the Ecosystem Services but Rather their Ordinary Final Product
In this study, as regards the economic analysis of ecosystem services we have referred exclusivelyto the renewable products appropriated by farmers and the government. It is accepted that theeconomic production functions can only employ inputs (intermediate consumptions) and cost ofenvironmental asset use (natural) being their physical contribution sufficient for their inclusion [17,30].Capital use cost is defined in this case as the sum of the fixed capital consumption and the normalincome from capital invested in the ordinary final production. Consequently, the economic analysis ofthe ecosystem services goes beyond their economic value and from our perspective, the final productconsumption is at the center of the analysis of the contribution of nature to the value of the naturebased products consumption.
The production functions of an ordinary final product in the SNA ignore the zero price naturalinputs but in contrast, admit the residual values, regardless of sign, for net mixed income and netoperating surplus in a consistent manner. Thus, we can consider that it is consistent with the SNAmethodology to take into account the zero value natural intermediate consumptions so as to make thephysical quantities of the production factors consistent with their final products consumption. The factthat the ecosystem service is an income from the gifted natural resource (environmental asset) meansthat its residual economic value will be greater than or equal to zero (since the farmers and governmentdo not incur manufactured production costs in their appropriation).
The SEEA-EEA implicitly accept that products without manufactured costs can be integrated inthe economic activities since “the production boundary is expanded relative to the SNA reflectingthat the supply of goods and services by ecosystems is considered additional production” [12] (p. 88).Here, in order for the additional products to be valued consistently with respect to those of theSNA, the ecosystem institutional sector must only refer to government public products withoutmanufactured costs.
The AAS maintains the dependency on the nature based ordinary final products, even wherethe resource rent is zero, since people enjoy the consumption of these products without knowingthe remunerations of the production factors which contribute to their market or simulated price.In other words, we cannot consume the ecosystem service of an economic activity, but we can consumethe ordinary final product to which it contributes physically and/or economically. It is inconsistentfrom the perspective of consumption of an ordinary product to conclude that “if no [resource] rent isearned [embedded], the concept of [net] value added will represent no more than that which couldbe earned in alternative employment, and will as such not reflect any dependency on the naturalresource” [22] (p. 41). The zero value of the resource rent does not nullify the ecological dependence,which makes it possible to obtain a manufactured net value added embedded in the value of theproduct consumption, the existence of which is only viable due to the physical consumption of theenvironmental intermediate input supplied by the ecosystem. This would be the case of grazing, if it isconsidered as an environmental input consumed by the HOW game species which, even though it has azero transaction price. This gives rise to the existence of a resource rent for market transactions of gamecaptures which, in the case of the HOW, allows us to match the resource rent for game captures to thevalue of the grazing consumption, and to the net value added due to the absence of manufactured costs.
The supply of stored water with commercial economic use is another example where the resourcerent coincides with the value of the product in the HOW due to the absence of manufactured costs.
In the case of harvesting free access wild products, the net mixed income must be estimated andthe factorial distribution of the net mixed income must be derived from the local markets and themotivation of the picker. In the HOW, the recreational mushroom pickers do not incur intermediateconsumptions or cost for manufactured capital use, and it is assumed that they do not incur opportunitycosts for the time employed on the visit; therefore, the values of the ordinary product, the ecosystemservice, and the net value added coincide.

Forests 2020, 11, 185 25 of 36
In all the examples described, there is a constant in the ecosystem service estimates for anindividual product which consists of starting from the first possible transaction value of the ordinaryproduct. This criterion is followed by the estimates of intermediate consumptions and the capital usecost, and finally the ecosystem service is estimated as a residual value. All types of relationship arepossible among the values of the product, the ecosystem service resource rent and the net value added,but all equivalence must be consistent with the concept of total income. In short, the existence of anecosystem institutional sector is an instrumental construction, the justification for which lies more inpolitical convention than a scientific necessity derived from the production function.
4.2. Ecosystem Service and Income Valuations: Producer versus Social Prices
In this study, the AAS methodology is applied to fifteen economic activities (hunting, livestock, andagriculture activities are omitted) at regional scale in holm oak open woodlands in Andalusia in 2010,with the novelty of comparing producer prices (market and simulated) and social prices. The resultsreveal notable overvaluations at producer prices in comparison to social prices of the net/gross addedvalues of the private amenity and landscape economic activities, as well as of the aggregate farmer,government, and total HOW activities. The ecosystem services and the environmental income of theprivate amenity, along with their aggregate values for farmers and total for the HOW are affected.The results for the ecosystem services and the environmental incomes of the individual activities of thegovernment are not affected by the change in the type of price used in the valuations.
The comparison of the results for the valuations of ecosystem services and incomes at producerprice in the rSNA reveal notable undervaluation compared to the AAS estimates at social price.The differences revealed in the comparisons of environmental assets estimated by the AAS and rSNAare due to the valuation at production cost of the final products consumption without market prices inthe rSNA and at simulated revealed/declared price in the AAS, as well as to the omission of the carbonactivity in the rSNA.
4.3. Lack of Investment in Conservation Forestry in Holm Oak Woodlands
The commercial products of the HOW do not generally provide competitive monetary profitsat producer (market) prices; the justification for the market price of the HOW can only be found inthe auto-consumption of amenities (recreation) by non-industrial owners. In other words, the privatefamily owners pay themselves the monetary opportunity cost of the production of amenity servicesauto-consumed exclusively in their properties, when they incur in voluntarily accepted monetaryopportunity costs. The public administration also recognizes this economic value of the dehesa owner’samenities. Spanish land law establishes that to buy or expropriate a rural property it is possible to payup to a maximum of twice what it would be worth, if only the profits from its commercial exploitationare considered, since the legislators recognize that the other half of its market price corresponds to thebenefit from the non-commercial flow of private amenities of the owner.
It is unusual for owners to invest in order to benefit the consumption of future generations withoutreceiving government compensations, given that competitive profitability results are mainly due to theamenities, and these are not affected in the short and medium term by the current rate of degradationof the HOW taking into account the historical variations in the price of land [29]. It is worth notingthe modest investment in conservation forestry by a group of large private dehesa operations [20].The private owner prefers to invest in land and livestock, which contribute in the short to mediumterm to increasing the available monetary profitability [29,31,32]. Plantations do not provide monetarybenefits for the generation of the owner who undertakes the plantation. The high level of uncertaintyassociated with the generation of future profits from the plantation is the main factor underlying theuncertainty of the gain in net worth in the present for the future yield. However, the future ownerwho harvests the products of the historical plantations will be the beneficiary of the largest ordinaryenvironmental operating margins, as the historical costs of the conservation forestry will have beenamortized. In other words, the conservation of the HOW can be considered a public service, which is

Forests 2020, 11, 185 26 of 36
represented in this study by the landscape activity. In this context, the words of the editor of theinfluential publication ‘Our Common Future’ are of relevance with respect to the need for governmentto have consistent information on sustainable management and contributions of natural resources tothe total income of the HOW when drawing up their policies: “Politics that disregard science andknowledge will not stand the test of time. Indeed, there is no other basis for sound political decisionsthan the best available scientific evidence. This is especially true in the fields of resource managementand environmental protection” [33] (p. 457).
4.4. Does the SEEA-EEA Provide Concepts for Measuring Environmental Income?
From our perspective of the conceptualization of ecosystem accounting, it is necessary to admitthe nature-based government activities, both direct and indirect. It makes little sense that an economicrationale should be admissible in the case of farmer activities but not the government public activitiesaffected in their management and regulations by manufactured costs. The SEEA-EEA criterion whichrefers to the fact that “the production boundary is expanded relative to the SNA reflecting that thesupply of goods and services by ecosystems is considered additional production” [12] (p. 88) isconsistent from the perspective of including an ecosystem institutional sector only for public productsconsumption, without regulations and without government costs. In return, a debatable limitationis incurred; namely, the exclusion of the government sector which, in the case of the HOW, is anecosystem service provider of similar importance to the farmers. Furthermore, it renders unnecessarythe inclusion of a non-human institutional sector which provides free ordinary economic products tohumans, independently of the farmers [16].
Our response to the question that provides the heading to this section is that we cannot knowwhether the SEEA-EEA in their current incipient stage of development will include standard guidelinesfor the nature-based government activities as a whole. If they were not included, the SEEA-EEA wouldnot be able to measure the environmental income of ecosystems of the type valued at a national levelwhich are produced with government manufactured costs.
The debate concerning the conceptual design of ecosystem accounting has so far centered on thevaluations of ecosystem services and their respective environmental assets derived from the pricesof transactions observed in formal or simulated markets based on consumer preferences. Althougha detailed development of the SEEA-EEA accounting structure is not available, the reference of [16](Table 6, p. 33) allows us to outline a provisional interpretation of the concept of extending the economicactivities with respect to the SNA. These authors take into consideration the institutional sector ofcorporations (e.g., timber) and add the ecosystem public services produced without manufacturedcosts (e.g., air filtration). Should we understand, therefore, that the SNA valuation of public goodsand services of nature-based government services is maintained at production cost and therefore thevalue of their ecosystem services is zero. This interpretation does not appear to be coherent, andwe understand from what the authors state in the above cited reference that they are referring to anexample of the application of the SEEA-EEA to two specific products, which cannot be generalized toembrace public products with manufactured production costs. It would also not make sense to presentthe values for products of the corporations and only the ecosystem services for the public productswith and without manufactured production costs.
Since the purpose of the SEEA-EEA is to explicitly specify the valuations of the ecosystem servicesof ordinary individual products and their respective environmental assets, it can be concluded thatthe ultimate aim of the SEEA-EEA is the estimation of the environmental incomes of the individualeconomic activities valued for the ecosystem types of the spatial unit considered.
To date, the SEEA-EEA does not explicitly mention the environmental income of the ecosystems,but gives the measurements separately for the ecosystem services (ES) and the change in environmentalasset (CEA) of the individual product. These two variables added together give the value of theenvironmental income, and depending on the specific accounting conventions of the environmentalproduction and balance accounts, the CEA is adjusted in the case of certain individual products in order

Forests 2020, 11, 185 27 of 36
to give the adjusted change in environmental net worth (CNWead) according to the environmentalwork in progress used (WPeu), as we have shown in Section 2 and Supplementary Text S3. Thus,we arrive at the general expression of the environmental income (EI) as the sum of the ES and theCNWead of the individual product. All the information that we require to measure the environmentalincome is provided by the variables ES and EAg proposed by the authors of SEEA-EEA discussionpapers ([16] Table 6, p.33, [34] Section 4.1, pp. 20–23). Other authors also implicitly estimate theenvironmental income, the value of the environmental assets depending on the discounted benefits(ecosystem services) and the capital gain (change in environmental asset) [35,36].
We can simplify the definition of the concept of environmental income as the value of theecosystem service of a stationary state nature-based activity, given that in this situation the value ofthe CEA/CNWead is zero. Beyond the stationary state of the ecosystem activity, the EI represents themaximum possible consumption of the ES of the individual ecosystem product which we can permitwithout reducing its value at the opening of the period.
It seems strange that no SEEA-EEA applications have so far been produced by other authorswhich include measurements of ecosystem services for one or various ecosystem types and therespective changes in the environmental assets of the products incorporated in a single indicatorsuch as the environmental income of the ecosystems and which is integrated in the standard SNAat national/regional scale. In [18], a simplified AAS application is presented comparing the resultswith our refined version of the SEEA-EEA sequence of accounts proposed by [16] (Table 6, p. 33).The application in [18] is based on the data from the production and balance accounts in this HOWstudy to develop the format of the sequences in [16], the purpose of which is to compare the refinedrSNA, rSEEA-EEA, and simplified sAAS systems.
The AAS and rSNA applications in this study reveal that the measurement of environmentalincomes in the HOW may be derived directly based on the total products that are generated by theactivities valued in the HOW territory of Andalusia by the institutional sectors of the farmers and thegovernment, the latter including the ecosystem sector of the SEEA-EEA.
The consistency of the comparisons of the AAS and rSNA results based on the theoretical concept oftotal income shows that the SNA can be extended with the ultimate aim of estimating the environmentalincome, (i) modifying the inconsistent application of the production cost in the valuation of productswithout market prices, substituting it for the marginal price of the simulated demand of active andpassive consumers; and (ii) extending the measurement of society total income by incorporating thecapital gain in the net value added (operating income).
4.5. Valuing the Ecosystem Service as a Residual Value
In the SEEA-EEA, independent estimates (not linked to the total income accounts) of ecosystemservices and changes in the environmental assets risk incurring bias as regards remunerations of themanufactured incomes generated in the type of ecosystem valued. The fact that the ecosystem serviceis a residual value together with other operating incomes of a consumed product means that priorestimation is necessary of the priority remunerations for manufactured incomes of the individualecosystem product valued. Ecosystem service estimates using non-residual procedures are common,and in these cases the situation may arise where the arbitrarily assigned value of the ecosystem serviceof a consumed product exceeds the value of its net value added, which would be a conceptuallyinconsistent result. For example, [37] estimate that if family-scale shepherds in Iteimia (Tunisia) withfree access to grazing attributed themselves a remuneration for their self-employed work equal to81% of that received by a local forestry worker. This implies that the ecosystem service of grazingwould be dissipated. If the shepherds in Itemia were willing to work as employees, earning 60% of thecurrent earnings of forest workers, the ecosystem service of grazing would be 0.07 €/UF o 36.95 €/ha.Other authors estimate the grazing resource rent as the energy substitute of the market price of barley,which would mean paying the self-employed wage rate at 38% of the forestry employee wage rate of0.37 €/h at the time of the Iteimia study.
Forests 2020, 11, 185 28 of 36
4.6. Policy Implications
In a world where the property rights over global goods and damages tend to be regulated,the divide as regards free public goods is diminishing. In other words, the economic accounts forglobal society should incorporate public products and costs appropriated directly or indirectly bythe government, without market price, and produced within the national territory in the period,valuing them at simulated marginal prices derived from the active and passive consumer demandglobally. However, the government institutions specialized in the regulations of the System ofNational Accounts (SNA) oppose the extension of the economic activities and the substitution ofvaluations of public and private products without market price at production cost for the simulatedmarginal value according to consumer demand. This situation has ultimately led to the publicdebate which has given rise to the satellite proposal in the process of the System of EnvironmentalEconomic Accounting-Experimental Ecosystem Accounting (SEEA-EEA) [12,13]. This subsidiarityof the SEEA-EEA with respect to the SNA can be avoided by extending the SNA with the ultimategoal of measuring the total income. The economic accounts of the global society make the existenceof a satellite SEEA-EEA unnecessary as the former directly provides consistent measurements of theenvironmental income of the ecosystem types which exist in the national territory and the planet as awhole. In the absence of global compensations among governments for appropriated environmentalproducts and assets of the ecosystems, the design and application of environmental accounts forecosystem types, such as the HOW studied here, can be applied at national scale and multinationalregional scales as the European Union.
Public consumers demand that farmers and governments maintain/improve the offer of publicgoods and services. This demand will continue increasing, although we will continue to see a processof internalization through the market for public goods and services in which the rights of economicuse will change to a private property regime. In this double process of growth of government andmarket supply of nature-based products, there are technical and institutional factors which determinethe local division of economic activities between corporations and government. The government willcontinue to take exclusive responsibility in cases where consumer exclusion is highly costly or whereconsumer exclusion is impossible due to the nature of the product; hence, such products will continueto be consumed freely by citizens [38]. In these circumstances, the government—in representation ofthe public consumers—compensates the owners for the unwanted loss of profit involved in meetingthe demands of the public consumers, previously agreed with the government.
The payment of compensation should be linked to the existence of sustainable managementpractices with regard to renewable natural resources. Continual management which is often necessaryfor grazing land in the Mediterranean (scrub control, pruning, periodical sowing, etc.) is one of thenecessary conditions for the conservation of the HOW cultural landscape. From this perspective,should payment be extended to owners where loss of profit occurs through any cultural practicefavoring the many nature-based products such as game species, firewood from thinning/pruning,apiculture products, and free-access products such as wild mushrooms and asparagus? Governmentcompensations with the ultimate goal of HOW conservation should be based on the concept of culturallandscape, for example, as defined by the [39], and payment to the owner should be legitimized havingpreviously determined the consumers’ willingness to pay a tax for the services of cultural landscapeconservation to a degree assumed bio-physically sustainable in the long term.
The government could use the landscape tax to finance the loss of profit not accepted by theowners of the land and livestock for HOW activities which produce intermediate services used asinputs in the production of additional public service provision. Thus, the thinning/pruning undertakenas part of landscape management should be compensated given the public benefits associated withcultural landscape conservation. Honey production should also be compensated for the intermediateservices which it produces in the landscape, but only for the loss of profit not accepted by the hiveowner. Compensation could be paid to owners where wild mushroom and asparagus picking takes

Forests 2020, 11, 185 29 of 36
place, on the condition that a plan agreed with the government is put in place which is proved toencourage future production for commercial or recreational picking.
According to the local institutional agreements reached, the owners may receive compensationwithout having to make additional investment for allowing mushroom/asparagus pickers access to thefarm, although in such cases there would be no loss of commercial profit to the owner but there couldbe a loss of private amenity service for the non-industrial owner.
An illustrative example of the complexity involved in implementing agreed compensationpolicies is that of the exclusion from compensations of most of the areas of woody grazing in Spain.Compensations under the Common Agricultural Policy (CAP) of the European Union continue to sufferfrom its philosophy based around livestock and crops, without conditioning these compensations tothe sustainability of the management practices employed for renewable natural resources on the farms.This commercial principle in the CAP of dealing with the final agricultural and livestock productsresults in the intermediate outputs of managed wild grazing (fruit, leaves, and twigs) being ignored,as is the case of holm oak open woodland (HOW), where the fruit (acorns) and leaves/twigs fromregeneration, pruning, etc. are consumed by game species, cattle, and other wild animals. This situationof ‘commodity tragedy’ under the CAP means that silvopastoral landscape grazing does not form partof the CAP, except indirectly through compensations for extensive husbandry. Grazing is also invisiblein the net value added estimated in the government economic accounts for agriculture and forestry [6].
In a recent report analyzing the limitations of CAP direct payments for areas of woody pasture, theauthors consider that the current guidelines of the CAP, which under certain circumstances recognizethe right of HOW to compensation for livestock grazing, present limitations which should be mitigatedby generalizing the compensations paid for woody grazing. The justification for this recommendationis that such a policy would clearly have favorable social, economic, and environmental effects [40].
The design of the CAP still does not explicitly include the payment of compensations fornon-commercial intermediate products of the HOW which contribute to public goods and servicesconsumed freely by European citizens. It would seem that the compensations under the CAP whichindirectly affect the production of grazing in the HOW do not fulfill the criteria of equity and mitigationof the ‘free rider’ behavior of the active and passive consumers of HOW public products, while atthe same time the standard of living of owners and employees is negatively impacted. The paradoxof this decline in the commercial products of their farms is that it is taking place at the same timeas the public products derived from the economic activities in the HOW are increasingly valued bypublic consumers.
5. Conclusions
The first conclusion which can be drawn from the results given in this article is that the valuationsof ecosystem services and gross values added vary in those activities affected by the change in the typeof valuation from producer prices to social price. The second conclusion is that the omission of thevaluations of corporation activities producing non-commercial intermediate services (ISSnc) used byactivities which are valued as own non-commercial intermediate consumption (SSncoo) also leads tovariations in the aggregate values added of the farmer and government activities.
A general policy conclusion is that the challenge to be addressed by the government, in thename of current society and especially of future generations, is to overcome the current limitationsin the functioning of market forces which make the investment by non-industrial private ownersprofitable, mainly through auto-consumption of amenities, without long term investment in woodlandregeneration taking place, along with the policy of government compensations for extensive husbandryset apart from the public environmental income in silvopastoral landscapes, so that the aforementionedfuture generations are able to inherit the cultural and biological environmental assets of the HOW ingood condition. Therefore, it is the government that must take care of landscape conservation withthe purpose of avoiding the deterioration and/or complete disappearance of the natural and culturalvariety of the HOW in all its different aspects, whether biophysical, anthropological, built historical

Forests 2020, 11, 185 30 of 36
patrimony, and testimonial uses of traditional skills which are attributed as being bearers of heritagevalues recognized by global society. In this case, the reference to ‘global society’ goes beyond Spanishsociety and should include at least the European Union member countries.
For this task, it is necessary to make available the best scientific knowledge for decision makingto governments, consumers, and landowners. A methodology such as the Agroforestry AccountingSystem can contribute to informing governments on the ultimate goal of implementing policieswith greater efficiency and equity in terms of preserving threatened nature and associated humanculture without failing to meet the needs of current generations or deteriorating the non-reproducibleenvironmental assets of our planet.
Supplementary Materials: The following are available online at http://www.mdpi.com/1999-4907/11/2/185/s1,Text S1: Background to holm oak open woodlands in West and South-West Spain, Text S2: Economic activitiesreconsidered, Text S3: Accounting methods applied to holm oak open woodlands in Andalusia, Text S4: Imputedown non-commercial intermediate consumption of services of holm oak open woodlands in Andalusia, TableS1: Tiles with predominant holm oak open woodlands in Andalusia, Table S2: Tiles with predominant holm oakopen woodlands sizes characteristic in Andalusia, Table S3: Agroforestry Accounting System total productionaccount at social prices for holm oak open woodlands in Andalusia (2010: €/ha), Table S4: Agroforestry AccountingSystem ordinary and investment production accounts at social prices for holm oak open woodlands in Andalusia(2010: €/ha), Table S5: Agroforestry Accounting System capital account for holm oak open woodlands in Andalusia(2010: €/ha), Table S6: Agroforestry Accounting System produced and expected work in progress balance accountfor holm oak open woodland in Andalusia (2010: €/ha), Table S7: Agroforestry Accounting System simplifiedaccounts sequence of total income at social prices for holm oak open woodlands in Andalusia (2010: €/ha), Table S8:Refined System of National Accounts ordinary and investment production accounts at basic prices applied to holmoak open woodlands in Andalusia (2010: €/ha), Table S9: Refined System of National Accounts simplified accountssequence of total income at basic prices for holm oak open woodlands in Andalusia (2010: €/ha), Table S10:Agroforestry Accounting System and refined System of Nationals Accounts measurements at producer, basicand social prices of ecosystems services and incomes for holm oak open woodlands in Andalusia (2010: €/ha),Figure S1: Agroforestry Accounting System simplified accounts sequence of total income factorial distributionat social prices for holm oak open woodlands in Andalusia-(2010: €/ha), Figure S2: Agroforestry AccountingSystem total income at producer prices for holm oak open woodlands in Andalusia (2010: €/ha), Figure S3: Map ofAgroforestry Accounting System ecosystem services at producer prices by products and total for holm oak openwoodlands in Andalusia, Figure S4: Agroforestry Accounting System environmental income at producer pricesper activity and total for holm oak open woodlands in Andalusia.
Author Contributions: Conceptualization, P.C.; Data curation, P.C., A.Á., and B.M.; Formal analysis, P.C.,A.Á., and B.M.; Funding acquisition, P.C.; Methodology, P.C.; Project administration, P.C.; Supervision, P.C.;Visualization, P.C. and A.Á.; Writing—original draft, P.C.; Writing—review and editing, P.C., A.Á., J.L.O., P.O.,B.M., and A.C. All authors have read and agreed to the published version of the manuscript.
Funding: This study was funded by Agency for Water and Environment of the Regional Government of Andalusia,Contract NET 165602; Spanish National Research Council (CSIC), grant number ref. 201810E036; and EuropeanUnion, call H2020-SC5-2018-1 (grant no. 817527).
Acknowledgments: The authors thank the Agency for Water and Environment of the Regional Governmentof Andalusia for the financial and field work support for the REnta y CApital de los Montes de ANdalucía(RECAMAN) project (Contract NET 165602), the Valoraciones de servicios y activos de AMenidades privadasde fincas SILvopastorales (VAMSIL) project of CSIC (ref. 201810E036) and the Mapping and Assessment forIntegrated ecosystem Accounting (MAIA) project of EU call H2020-SC5-2018-1 (grant no. 817527). We acknowledgethe contributions of Eloy Almazán and Begoña Álvarez-Farizo and other colleagues in the framework of theRECAMAN project to the methods and results presented in this study. We thank Daniel Jordan for helping us toreview the English writing and the two reviewers for suggesting substantial improvements of the original versionof this study.
Conflicts of Interest: The authors declare no conflict of interest.
Appendix A
Glossary of selected ecosystem accounting acronyms, concepts and definitions applied to theholm oak open woodlands in Andalusia, Spain.
CEA. Change in environmental asset: Difference between closing less opening environmentalassets in the accounting period.
CFC. Consumption of fixed capital: Depreciation of the total opening capital embedded in totalproduct in the accounting period.

Forests 2020, 11, 185 31 of 36
CFCe. Consumption of environmental fixed capital (asset): Carbon environmental asset emissionembedded in investment of environmental net operating margin valued at market price in theaccounting period.
CFCm. Manufactured consumption of fixed capital: Depreciation of the manufactured fixedcapital embedded in total product valued at replacement cost in the accounting period.
CG. Capital gain: Capital revaluation adjusted according specific convention to avoid doublecounting for the production account registers of carbon sequestration, woody product natural growthand consumption of manufactured fixed capital in the accounting period.
CGm. Manufactured capital gain: Manufactured fixed capital revaluation less manufacturedfixed capital adjustments to avoid double counting according to consumption of manufactured fixedcapital and the change in replacement prices of the manufactured fixed capital consumption in theaccounting period.
CIm. Manufactured capital income: Remuneration received by the farmer for the services of themanufactured capital used in the accounting period.
CNWe. Change in environmental net worth: Depicts the difference between the environmentalown-account gross capital formation and consumption of environmental fixed capital, adding theenvironmental asset gain.
CNWead. Adjusted change in environmental net worth: Adjustment to avoid double countingof the environmental work in progress used to show the ecosystem service as a component of theenvironmental income in the accounting period.
Cr. Capital revaluation: Change in values of the closing and withdrawals of environmental assetsdue to discounting effects and unanticipated price variation in the accounting period.
EAad. Environmental assets adjustments: Instrumental environmental asset gain adjustmentsto avoid double counting of opening natural growth and carbon sequestration embedded in theirsclosing accumulated values in the accounting period.
EAg. Environmental asset gain: Expected (discount effect) and unexpected (extraordinarydestructions) environmental asset revaluation (EAr) and accounting instrumental adjustment (EAad)at the closing of current period.
EAr. Environmental asset revaluation: Revaluation of the discounted expected future indefiniteecosystem services extractions and change in asset prices at the closing of the accounting period whichwere unanticipated at the opening.
EI. Environmental income: Economic contributions of nature in the accounting period embeddedin current and future total product consumption. In ecosystem accounting terminology, environmentalincome is the environmental net operating margin plus environmental asset gain. This accountingidentity of environmental income is equivalent to the ecosystem service plus (environmental work inprogress used-adjusted) change in environmental net worth in the current period.
ES. Ecosystem services: The economic ‘gift’ contribution of nature embedded in the total productconsumption in the accounting period. This definition is equivalent to the resource rent concept.
FPc. Final product consumption: Goods and services produced that are not accumulated asproduction factors of future total product consumption in the accounting period in the ecosystem type.
GVA. Gross value added: Operating gross income derived from the production factor services ofhuman labor and capital user cost embedded in the total product in the accounting period. Operatingincome is also known as gross domestic product when referred to an economic sector, a region or a nation.
IC. Intermediate consumption: Raw materials (including environmental work in progress used) andservices contributing as input (working capital) to generate the total product during the accounting period.
ICm. Manufactured intermediate consumption: Manufactured raw materials, services andworking capital used during the accounting period to obtain the total product.
IRM. Intermediate product of raw materials: Goods (tangible items) produced in a spatial unitand/or ecosystem type and used as own working capital (re-employed) in the same period to produceanother good or service in the same ecosystem type and/or spatial unit.

Forests 2020, 11, 185 32 of 36
ISS. Intermediate product of services: Services (intangible items) produced in an ecosystem typeand or spatial unit and used as own working capital (re-employed) in the same period to produceanother good or service in the same ecosystem type and/or spatial unit.
ISSc. Commercial intermediate product of services: Intermediate product of services producedby manufactured commercial activities valued at market prices or production cost.
ISSncc. Non-commercial intermediate product of services: Intermediate product of servicesproduced without market prices, valued in accordance with government compensation for farmerwillingness to accept hunting and livestock ordinary monetary losses (as opportunity cost) in anecosystem type and/or spatial unit during the current period and re-employed in the same period toproduce another good or service in the same ecosystem type and/or spatial unit.
LC. Labor cost: Employee compensation for labor in the accounting period for the tasks derivedfrom the economic activities, under the responsibility of the famer or the government activities fundedby public expenditures.
NG. Natural growth: Accumulation of environmental work in progress during the current periodvalued at discounted environmental price (resource rent price) times physical growth (yield) expectedto be extracted in future periods.
NOM. Net operating margin: Capital operating income embedded in total products in theaccounting period.
NOMe. Environmental net operating margin: Environmental asset operating income embeddedin total products in the accounting period.
NOMei. Investment environmental net operating margin: Environmental asset operating incomeembedded in the net natural growth measured as the natural growth less carbon emission in theaccounting period.
NOMeo. Ordinary environmental net operating margin: Environmental asset operating incomeembedded in total product consumption in the accounting period.
NOMm. Manufactured net operating margin: Manufactured capital operating income embeddedin total product consumption in the accounting period.
NOMmo. Ordinary manufactured net operating margin: Manufactured capital operating incomeembedded in total product consumption in the accounting period.
NVA. Net valued added: Operating net income derived from the production factors services ofhuman labor and capital embedded in the total product in the accounting period. Operating income isalso known as net domestic product when referred to an economic sector, a region or a nation.
SSncoo. Ordinary own non-commercial intermediate consumption of services: Private amenityactivity intermediate consumption of services as amenity auto- consumption (SSncooa) and landscapeactivity intermediate consumption of services as compensation (SSncooc) and donation (SSncood)embedded in the total product consumption in the accounting period.
TI. Total income: Maximum possible total product consumption in the ecosystem type and/orspatial unit in the accounting period that leads to the closing total capital being the same as it was atthe opening, in real terms, all else being unchanged.
TP. Total product: Goods and services produced by the economic activities in the ecosystemtype and or spatial unit valued at observed or simulated transaction prices in the accounting period.Total product contains the intermediate product and the final product.
TPc. Total product consumption: Good or service produced in an ecosystem type and or spatialunit and destined for direct or indirect consumption by people in the accounting period, valued atobserved and/or transaction prices. Total product consumption contains the intermediate product andthe final product consumption.
WPeu. Environmental work in progress used: Woody unfinished environmental goods inventoriedat the opening of the accounting period, which are environmental asset withdrawals used asenvironmental intermediate consumption embedded in the generation of total product consumptionin the accounting period.

Forests 2020, 11, 185 33 of 36
Appendix B
Table A1. Refined System of National Accounts total production account at basic prices applied to holm oak open woodlands in Andalusia (2010: €/ha).
ClassTimber Cork Firewood Nuts Grazing Con.
Forestry Residential Amenity Farmer FireServices Recreation Mushrooms Carbon Landscape Biodiversity Water Government HOW *
1 2 3 4 5 6 7 8∑
1–8 9 10 11 12 13 14 15∑
9–15∑
1–15
1. Total product (TPbp) 0.4 2.2 1.8 0.1 33.9 4.5 14.7 14.7 72.2 41.3 8.9 18.0 n.a 77.0 6.3 76.2 227.8 300.0
1.1 Intermediate product (IPbp) 33.9 2.8 14.7 51.3 38.1 n.a 38.1 89.4
1.2 Final product (FPpp) 0.4 2.2 1.8 0.1 1.7 14.7 20.9 3.2 8.9 18.0 n.a 77.0 6.3 76.2 189.7 210.5
1.2.1 Final product consumption(FPcpp) 0.3 0.7 1.5 0.1 14.7 17.2 8.1 18.0 n.a 76.4 5.2 76.2 189.3 201.1
1.2.2 Gross capital formation (GCF) 0.1 1.5 0.3 1.7 3.6 3.2 0.8 0.1 n.a 0.7 1.1 5.8 9.4
1.2.2.1 Manufactured (GCFm) 1.7 1.7 3.2 0.8 0.1 n.a 0.7 1.1 5.8 7.5
1.2.2.2 Natural growth (NG) 0.1 1.5 0.3 1.9 n.a 1.9
2. Intermediate consumption (ICbp) 0.6 0.6 0.4 0.1 0.6 1.6 0.8 14.7 19.3 12.4 3.2 0.1 n.a 72.3 1.8 89.8 109.1
2.1 Manufactured intermediateconsumption (ICm) 0.4 0.0 0.2 0.1 0.6 1.6 0.8 14.7 18.3 12.4 3.2 0.1 n.a 72.3 1.8 89.8 108.1
2.1.1 Bought (ICmb) 0.4 0.0 0.2 0.1 0.6 1.6 0.8 3.7 12.4 1.6 0.1 n.a 1.9 1.8 17.9 21.5
2.1.2 Own (ICmobp) 14.7 14.7 1.6 n.a 70.4 0.0 71.9 86.6
2.2 Environmental work in progressused (WPeu) 0.2 0.6 0.2 1.0 n.a 1.0
3. Consumption of fixed capital (CFC) 0.0 0.0 0.0 1.1 0.1 5.6 6.8 2.8 1.6 0.0 n.a 0.7 0.6 5.7 12.6
3.1 Manufactured (CFCm) 0.0 0.0 0.0 1.1 0.1 5.6 6.8 2.8 1.6 0.0 n.a 0.7 0.6 5.7 12.6
3.2 Environmental (CFCe) n.a
4. Net value added (NVAbp)(TPbp-ICbp-CFC) −0.2 1.6 1.4 −0.1 32.3 2.9 8.3 46.0 26.2 4.1 17.9 n.a 4.0 3.8 76.2 132.3 178.3
4.1. Labor cost (LC) 2.5 0.1 0.3 0.9 3.4 2.8 3.1 13.1 26.1 4.1 0.1 n.a 4.0 3.8 38.2 51.3
4.2. Net operating margin (NOMbp) −2.7 1.5 1.1 −0.9 28.9 0.0 5.1 32.9 0.0 0.0 17.8 n.a 0.0 0.0 76.2 94.1 127.0
4.2.1 Manufactured (NOMmbp) −2.9 0.0 0.8 −0.9 0.6 0.0 5.1 2.7 0.0 n.a n.a n.a n.a n.a 0.1 2.8
4.2.2 Environmental (NOMebp) 0.1 1.5 0.3 28.3 n.a 30.2 n.a 17.8 n.a n.a n.a 76.2 94.0 124.2
4.2.2.1 Ordinary (NOMeo) 28.3 28.3 17.8 n.a 76.2 94.4 122.3
4.2.2.2 Investment (NOMei) 0.1 1.5 0.3 1.9 n.a 1.9
* HOW is holm oak open woodlands. n.a is not applicable in refined System of National Accounts (rSNA) methodology. Source: Own elaboration from primary data of RECAMANproject [17].

Forests 2020, 11, 185 34 of 36
References
1. European Commission. Our Life Insurance, Our Natural Capital: An EU Biodiversity Strategy to 2020; Committeeon the Environment, Public Health and Food Safety: Brussels, Belgium, 2011; p. 17. Available online:http://eur-lex.europa.eu/legal-content/EN/TXT/PDF/?uri=CELEX:52011DC0244&from=EN (accessed on23 January 2018).
2. European Commission. Report on Phase 1 of the Knowledge Innovation Project on an Integrated System ofNatural Capital and Ecosystem Services Accounting in the EU (KIP-INCA Phase 1 Report); European Commission,European Environment Agency: Copenhagen, Denmark, 2016; p. 106. Available online: http://ec.europa.eu/
environment/nature/capital_accounting/pdf/KIP_INCA_final_report_phase-1.pdf (accessed on 11 July 2019).3. Edens, B.; Hein, L. Towards a consistent approach for ecosystem accounting. Ecol. Econ. 2013, 90, 41–52.
[CrossRef]4. EFTEC. Developing UK Natural Capital Accounts: Woodland Ecosystem Accounts; Economics for the Environment
Consultancy Ltd., Department for Environment, Food and Rural Affairs (Defra): London, UK, 2015; p. 97.Available online: http://sciencesearch.defra.gov.uk/Default.aspx?Menu=Menu&Module=More&Location=
None&Completed=0&ProjectID=18909 (accessed on 14 September 2017).5. European Commission; International Monetary Fund; Organization for Economic Co-operation and
Development; United Nations; World Bank. System of National Accounts 2008 (SNA 2008); EuropeanCommunities, International Monetary Fund, Organisation for Economic Co-operation and Development,United Nations, World Bank: New York, NY, USA, 2009; p. 722. Available online: http://unstats.un.org/unsd/
nationalaccount/docs/SNA2008.pdf (accessed on 27 September 2017).6. European Communities. Manual on the Economic Accounts for Agriculture and Forestry EEA/EAF 97 (Rev. 1.1);
EC, EUROSTAT: Luxembourg, Luxembourg, 2000; p. 172. Available online: http://ec.europa.eu/eurostat/documents/3859598/5854389/KS-27-00-782-EN.PDF/e79eb663-b744-46c1-b41e-0902be421beb (accessed on14 September 2017).
7. FAO. System of Environmental-Economic Accounting for Agriculture, Forestry and Fisheries; Statistics, Food andAgriculture Organization of the United Nations: New York, NY, USA, 2017; p. 138. Available online:http://www.fao.org/economic/ess/environment/methodology/en/ (accessed on 14 May 2019).
8. Masiero, M.; Pettenella, D.; Boscolo, M.; Barua, S.K.; Animon, I.; Matta, J.R. Valuing Forest Ecosystem Services:A Training Manual for Planners and Project Developers; Forestry Working Paper 11; Licence: CC BY-NC-SA 3.0IGO; FAO: Rome, Italy, 2019; p. 216.
9. Obst, C.; Hein, L.; Edens, B. National Accounting and the Valuation of Ecosystem, Assets and Their Services.Environ. Resour. Econ. 2016, 64, 1–23. [CrossRef]
10. Senado. Informe de la Ponencia de Estudio Sobre la Protección del Ecosistema de la Dehesa; Boletín Oficial de lasCortes Generales: Madrid, Spain, 2010; p. 27. Available online: http://www.senado.es/legis9/publicaciones/pdf/senado/bocg/I0553.PDF (accessed on 25 October 2019).
11. United Nations. The Future We Want: Outcome Document Adopted at Rio + 20; United Nations: Rio de Janeiro,Brazil, 2012; p. 49. Available online: http://www.un.org/disabilities/documents/rio20_outcome_document_complete.pdf (accessed on 2 October 2018).
12. United Nations. Technical Recommendations in Support of the System of Environmental-Economic Accounting2012–Experimental Ecosystem Accounting; United Nations: New York, NY, USA, 2017; Availableonline: https://seea.un.org/sites/seea.un.org/files/technical_recommendations_in_support_of_the_seea_eea_final_white_cover.pdf (accessed on 17 December 2018).
13. United Nations, European Commission, Food and Agriculture Organization of the United Nations,Organization for Economic Co-operation and Development, World Bank Group. System of EnvironmentalEconomic Accounting 2012—Experimental Ecosystem Accounting [SEEA-EEA]; United Nations: New York, NY,USA, 2014; p. 198. Available online: http://ec.europa.eu/eurostat/documents/3859598/6925551/KS-05-14-103-EN-N.pdf (accessed on 14 September 2017).
14. Hein, L.; Bagstad, K.J.; Obst, C.; Edens, B.; Schenau, S.; Castillo, G.; Soulard, F.; Brown, C.; Driver, A.;Bordt, M.; et al. Global progress in natural capital accounting. Science 2020, 367, 514–515. [CrossRef][PubMed]

Forests 2020, 11, 185 35 of 36
15. Atkinson, G.; Obst, C. Prices for Ecosystem Accounting; World Bank, Wealth Accounting and Valuation ofEcosystem Services: Washington, DC, USA, 2017; p. 38. Available online: https://www.wavespartnership.org/sites/waves/files/kc/Prices%20for%20ecosystem%20accounting.pdf (accessed on 2 October 2018).
16. Van de Ven, P.; Obst, C.; Edens, B. Discussion Paper 5.3: Accounting Treatments When Integrating EcosystemAccounts in the SNA; SEEA EEA Revision. Version Date: 22 November 2019. Expert Consultation. WorkingGroup 5: Valuation and Accounting Treatments; Department of Economic and Social Affairs StatisticsDivision/United Nations: New York, NY, USA, 2019; p. 19. Available online: https://seea.un.org/sites/seea.un.org/files/documents/EEA/dp5.3_accounting_treatments_22nov2019.pdf (accessed on 20 January 2020).
17. Campos, P.; Caparrós, A.; Oviedo, J.L.; Ovando, P.; Álvarez-Farizo, B.; Díaz-Balteiro, L.; Carranza, J.;Beguería, S.; Díaz, M.; Herruzo, A.C.; et al. Bridging the gap between national and ecosystem accountingapplication in Andalusian forests, Spain. Ecol. Econ. 2019, 157, 218–236. [CrossRef]
18. Campos, P.; Oviedo, J.L.; Ovando, P.; Álvarez, A.; Mesa, B.; Caparrós, A. Agroforestry Accounting System forMeasuring Environmental Incomes at Social Prices: Application to Holm Oak Open Woodlands in Andalusia-Spain;Instituto de Políticas y Bienes Públicos (IPP) CSIC: Madrid, Spain, 2019; p. 117. Available online: https://ipp.csic.es/sites/default/files/content/workpaper/2019/2019_06_ippwp_campos.pdf (accessed on 20 January 2020).
19. Campos, P.; Caparrós, A.; Oviedo, J.L.; Ovando, P.; Álvarez, A.; Mesa, B. Measuring Environmental Incomes:System of National Accounts and Agroforestry Accounting System Applied to Cork Oak Open Woodlands inAndalusia, Spain; Instituto de Políticas y Bienes Públicos (IPP) CSIC: Madrid, Spain, 2019; p. 74. Availableonline: http://ipp.csic.es/sites/default/files/content/workpaper/2019/2019_04_ippwp_campos.pdf (accessedon 1 October 2019).
20. Campos, P.; Álvarez, A.; Mesa, B.; Oviedo, J.L.; Ovando, P.; Caparrós, A. Uncovering the Hidden EcosystemServices Embedded in Environmental Incomes: Testing Experimental Extended Accounts in Dehesas of Holm OakWoodlands, Andalusia-Spain; Instituto de Políticas y Bienes Públicos (IPP) CSIC: Madrid, Spain, 2019; p. 91.Available online: http://ipp.csic.es/sites/default/files/content/workpaper/2019/2019_03_IPPwp_Campos.pdf(accessed on 1 October 2019).
21. Cavendish, W. Quantitative methods for estimating the economic value of resource use to rural households.In Uncovering the Hidden Harvest-Valuation Methods for Woodland & Forest Resources; Cambell, B.M.,Luckert, M.K., Eds.; Earthscan: London, UK, 2002; pp. 17–65.
22. Sjaastad, E.; Angelsen, A.; Vedeld, P.; Bojö, J. What is environmental income? Ecol. Econ. 2005, 55, 37–46.[CrossRef]
23. Montero, G.; Pasalodos-Tato, M.; López-Senespleda, E.; Ruiz-Peinado, R.; Bravo-Oviedo, A.; Madrigal, G.;Onrubia, R. Modelos de selvicultura y producción de madera, frutos y fijación de carbono de los sistemasforestales de Andalucía. In Economía y selviculturas de los montes de Andalucía; Campos, P., Díaz-Balteiro, L.,Eds.; Memorias Científicas de RECAMAN; Memoria 1.2; Editorial CSIC: Madrid, Spain, 2015; Volume 1,pp. 153–396. Available online: http://libros.csic.es/product_info.php?products_id=987 (accessed on 27April 2018).
24. DGCN. Mapa Forestal de España 1:50.000. Ministerio de Medio Ambiente, Dirección General de Conservaciónde la Naturaleza: Madrid, Spain, 2008. Available online: https://www.miteco.gob.es/es/biodiversidad/
servicios/banco-datos-naturaleza/informacion-disponible/mfe50.aspx (accessed on 11 July 2019).25. García, J.L.; Prólogo, I. Esperanza en la dehesa. In Manual para la Gestión Sostenible de las Dehesas Andaluzas;
Alejano, R., Domingo, J.M., Fernández, M., Eds.; Foro para la defensa y conservación de la dehesa “Encinal”,Universidad de Huelva: Huelva, Spain, 2011; pp. 9–10.
26. Campos, P.; Ovando, P.; Mesa, B.; Oviedo, J.L. Environmental income of livestock grazing on privatelyowned silvopastoral farms in Andalusia, Spain. J. Land. Degrad. Dev. 2016, 29, 250–261. [CrossRef]
27. Caparrós, A.; Oviedo, J.L.; Álvarez, A.; Campos, P. Simulated Exchange Values and Ecosystem Accounting:Theory and Application to Recreation. Ecol. Econ. 2017, 139, 140–149. [CrossRef]
28. Caparrós, A.; Campos, P.; Montero, G. An operative framework for total Hicksian income measurement:Application to a multiple use forest. Environ. Resour. Econ. 2003, 26, 173–198. [CrossRef]
29. Ovando, P.; Campos, P.; Oviedo, J.L.; Caparrós, A. Ecosystem accounting for measuring total income inprivate and public agroforestry farms. For. Policy Econ. 2016, 71, 43–51. [CrossRef]
30. Campos, P.; Oviedo, J.L.; Álvarez, A.; Mesa, B.; Caparrós, A. The role of non-commercial intermediate servicesin the valuations of ecosystem services: Application to cork oak farms in Andalusia, Spain. Ecosyst. Serv.2019, 39. [CrossRef]

Forests 2020, 11, 185 36 of 36
31. Oviedo, J.L.; Huntsinger, L.; Campos, P. Contribution of Amenities to Landowner Income: Case of Spanishand Californian Hardwood Rangelands. Ecol. Manag. 2017, 70, 518–528. [CrossRef]
32. Ovando, P.; Campos, P.; Mesa, B.; Álvarez, A.; Fernández, C.; Oviedo, J.L.; Caparrós, A.; Álvarez-Farizo, B.Renta y capital de estudios de caso de fincas agroforestales de Andalucía. In Renta Total y Capital de las FincasAgroforestales de Andalucía; Campos, P., Ovando, P., Eds.; Memorias científicas de RECAMAN; Memoria 4.2;Editorial CSIC: Madrid, Spain, 2015; Volume 4, pp. 156–445. Available online: http://libros.csic.es/product_info.php?products_id=990 (accessed on 27 April 2018).
33. Brundtland, G.H. Editorial: The Scientific Underpinning of Policy. Science 1997, 277, 457. [CrossRef]34. Fenichel, E.P.; Obst, C. A Framework for the Valuation of Ecosystem Assets (Draft). Working Group 5: Valuation and
Accounting Treatments; Discussion Paper 5.2; Department of Economic and Social Affairs, Statistics Divisionof United Nations: New York, NY, USA, 2019; p. 35. Available online: https://seea.un.org/sites/seea.un.org/
files/documents/EEA/discussion_paper_5.2_valuation_ecosystem_assets_for_erg_aug_2019.pdf (accessed on6 February 2020).
35. Fenichel, E.P.; Abbott, J.K.; Bayham, J.; Boone, W.; Haacker, E.M.K.; Pfeiffer, L. Measuring the value ofgroundwater and other forms of natural capital. Proc. Natl. Acad. Sci. USA 2016, 113, 2382–2387. [CrossRef]
36. Narita, D.; Lemenih, M.; Shimoda, Y.; Ayana, A.N. Economic accounting of ethiopian forests: A naturalcapital approach. For. Policy Econ. 2018, 97, 189–200. [CrossRef]
37. Campos, P.; Daly, H.; Oviedo, J.L.; Ovando, P.; Chebil, A. Accounting for single and aggregated forestincomes: Application to public cork oak forests of Jerez in Spain and Iteimia in Tunisia. Ecol. Econ. 2008, 65,76–86. [CrossRef]
38. Mäler, K.; Aniyar, S.; Jansson, Å. Accounting for ecosystem services as a way to understand the requirementsfor sustainable development. Proc. Natl. Acad. Sci. USA 2008, 105, 9501–9506. [CrossRef] [PubMed]
39. Council of Europe. European Landscape Convention; European Treaty Series: Florence, Italy, 2000; p. 4. Availableonline: http://www.convenzioneeuropeapaesaggio.beniculturali.it/uploads/Council%20of%20Europe%20-%20European%20Landscape%20Convention.pdf (accessed on 27 September 2017).
40. Ruiz, J.; Beaufoy, G.; Jiménez, R.; Majadas, J.; Sánchez, P.; Mantecas, C.; Lanchas, C.; Busqué, J.; Ferrer, V.;San Vicente, J.; et al. Informe Sobre la Elegibilidad para pagos Directos de la PAC de los Pastos Leñosos Españoles.Plataforma por la Ganadería Extensiva y el Pastoralismo; Fundación Entretantos: Valladolid, Spain, 2015;p. 225. Available online: http://www.ganaderiaextensiva.org/InformeElegibilidadPastos.pdf (accessed on 31October 2019).
© 2020 by the authors. Licensee MDPI, Basel, Switzerland. This article is an open accessarticle distributed under the terms and conditions of the Creative Commons Attribution(CC BY) license (http://creativecommons.org/licenses/by/4.0/).
Copyright © 2022 FDOKUMEN