Policies and Governance Structures in Woodlands of ... - CIFOR
452
Editors Godwin Kowero, Bruce M. Campbell, Ussif Rashid Sumaila Policies and Governance Structures in Woodlands of Southern Africa
-
Upload
khangminh22 -
Category
Documents
-
view
0 -
download
0
Transcript of Policies and Governance Structures in Woodlands of ... - CIFOR

Editors
Godwin Kowero, Bruce M. Campbell, Ussif Rashid Sumaila
Policies and Governance Structures
in Woodlands of Southern Africa
Southern Africa is essentially a woodland region. The woodlands are home to some of
the largest herds of wildlife in the world, support a vast livestock industry, play a
pivotal role in the hydrological functioning of the region, support the livelihoods of
millions of people through agriculture, forest products and other services. However,
there is scanty scientific information to guide their development and management.
Given the numerous end uses and many stakeholders, it is not possible to rely
exclusively on conventional forestry approaches and tools to manage the woodlands.
This book highlights different facets of local community governance of woodlands.
The outcomes for people and forest are often dependent on local institutional
arrangements (rules, regulations, organisational dynamics). The book explores the
role of local institutional arrangements in woodland management, in community-based
approaches and in conflict resolution.
It documents approaches and tools to reconcile the demands of the three key
stakeholders on the woodlands (the local communities, government and private sector)
in the framework of the three prominent rural development goals of food security,
increased rural incomes and biodiversity or forest conservation. It also highlights
tradeoffs between the goals and between five potential woodland management options
by: (i) local communities, as a result of devolution of authority and management from
central government, (ii) government but with a strict biodiversity conservation focus,
(iii) government with access given to local communities for basic needs, (iv)
government with a combined conservation focus and limited local community access
for basic needs, and (v) perpetuating the present situation of open access.
PO
LIC
IES AN
D G
OVERN
AN
CE STRU
CTU
RES
I N W
OO
DLA
ND
S O
F SO
UT
HER
N A
FR
I CA
Edit
ors
Godw
in K
ow
ero, B
ruce M
. Cam
pbell,
Ussif R
ashid
Sum
aila
Policies and Governance
Structures in Woodlands
of Southern Africa

Policies and GovernanceStructures in Woodlandsof Southern Africa
Editors
Godwin KoweroBruce M. CampbellUssif Rashid Sumaila

© 2003 by CIFORAll rights reserved. Published in 2003Printed by SMK Grafika Desa Putera, IndonesiaCover photo by Godwin Kowero
ISBN 979-3361-22-0
National Library of Indonesia Cataloging –in-Publication Data
Policies and Governance Structures in Woodlands of Southern Africa/Godwin Kowero, Bruce M. Campbell, Ussif Rashid Sumailap. cm.ISBN 979-3361-22-0
1. Forest Policy 2. Governance 3. Southern Africa 4. Rural Development5. Community Involvement 6. Structural Adjustment 7. Woodlands 8. Forest Management
Published byCenter for International Forestry ResearchMailing address: P.O. Box 6596 JKPWB, Jakarta 10065, IndonesiaOffice address: Jl. CIFOR, Situ Gede, Sindang Barang,Bogor Barat 16680, IndonesiaTel.: +62 (251) 622622; Fax: +62 (251) 622100E-mail: [email protected] site: http://www.cifor.cgiar.org

Contents
Contributors vii
Acknowledgements x
Foreword xi
CHAPTER ONEThe challenge to natural forest management in Sub-Saharan Africa ruraldevelopment: Experiences from the miombo woodlands of Southern AfricaGodwin Kowero
1
PART I. INSTITUTIONAL ARRANGEMENTS FORMANAGING WOODLANDS
CHAPTER TWOOverviewBruce M. Campbell, Sheona Shackleton and Eva Wollenberg 9
CHAPTER THREEMaking community-based forest management work: A case study ofDuru-Haitemba village forest reserve, Babati, TanzaniaGeorge C. Kajembe, Gerald C. Monela and Zebedayo S.K. Mvena 16
CHAPTER FOURLocal organisations and natural resource management in the face ofeconomic hardships: A case study from ZimbabweBilly B. Mukamuri, Bruce M. Campbell and Godwin Kowero 28
CHAPTER FIVEInstitutional arrangements governing natural resource management ofthe miombo woodlandDennis Kayambazinthu, Frank Matose, George Kajembe andNontonkozo Nemarundwe 45

iv
CHAPTER SIXConflicts over the miombo woodlands: The case of Blantyre, Lilongwe andKasungu, in MalawiCharles M. Masangano, Dennis Kayambazinthu and Lusayo Mwabumba 65
PART II. THE INFLUENCE OF MAJOR SECTORAL POLICIES ONFORESTRY
CHAPTER SEVENOverviewGodwin Kowero 80
CHAPTER EIGHTEvolution of land policies and legislation in Malawi and Zimbabwe:Implications for forestry developmentCharles Mataya, Peter Gondo and Godwin Kowero 92
CHAPTER NINELand policies in Mozambique and Tanzania: Implications for forestrydevelopmentIsilda Nhantumbo, Gerald C. Monela and Godwin Kowero 113
CHAPTER TENAgricultural policies and forestry development in Malawi, Mozambique,Tanzania and Zimbabwe: Complementarities and conflictsGilead Mlay, Florens Turuka, Godwin Kowero and Richard Kachule 138
CHAPTER ELEVENForest policies in Malawi, Mozambique, Tanzania and ZimbabweGodwin Kowero, Abdallah R.S. Kaoneka, Isilda Nhantumbo, Peter Gondoand Charles B.L. Jumbe 165
CHAPTER TWELVEPolicies and gender relationships and roles in the miombo woodlandregion of Southern AfricaMargaret Chitiga and Nontokozo Nemarundwe 187
PART III. RECONCILING DEMANDS ON WOODLANDS:A MODELING APPROACH
CHAPTER THIRTEENOverviewGodwin Kowero 212

v
Modelling multi-stakeholder interests inthe Southern African woodlands
CHAPTER FOURTEENA system dynamics model for management of miombo woodlandsUssif R. Sumaila, Arild Angelsen and Godwin Kowero 218
CHAPTER FIFTEENManual for users of MIOMBOSIM: A simulation model for the managementof miombo woodlandsGodwin Kowero and Ussif R. Sumaila 239
CHAPTER SIXTEENA goal programming model for planning management of miombowoodlandsIsilda Nhantumbo and Godwin Kowero 257
Planning woodland management withweighted goal programming
CHAPTER SEVENTEENA goal programming model for planning management of miombowoodlands: A case study of Chivi and Gokwe communal areas, ZimbabweEmmanual Guveya and Crispen Sukume 277
CHAPTER EIGHTEENManagement of miombo woodlands in Malawi: An application ofgoal programmingHarwick Tchale, Richard Kachule and Charles Mataya 307
CHAPTER NINETEENLinear and goal programming models for analysis of policy impacts onlivelihoods in miombo woodlands of MozambiqueIsilda Nhantumbo, Gilead Mlay and Godwin Kowero 334
System dynamics approach to woodland management
CHAPTER TWENTYPolicy impact on woodland resource management, use andconservation in Mozambique: A case study of selected sites in Dondo,Nhamatanda, Gondola and Manica districtsGilead Mlay, Mario Falcao, Isilda Nhantumbo and Godwin Kowero 358

vi
CHAPTER TWENTY-ONEA system dynamics model for management of miombo woodlands intwo communal areas of ZimbabweCrispen Sukume and Emmanuel Guveya 401
CHAPTER TWENTY-TWOManagement of miombo woodlands in Malawi: An application ofsystem dynamics modellingRichard Kachule, Hardwick Tchale and Charles Mataya 423

vii
Contributors
Arild AngelsenDepartment of Economics and SocialSciencesAgricultural University of NorwayP.O. Box 5033, 1432 AasNorwayEmail: [email protected]
Bruce M. CampbellCenter for International Forestry Research(CIFOR)P.O. Box 6596 JKPWBJakarta 10065IndonesiaEmail: [email protected]
Margaret ChitigaDepartment of EconomicsFaculty of Economics and ManagementSciencesUniversity of PretoriaPretoria 0002South AfricaEmail: [email protected]
Mario FalcaoDepartamento de Engenharia FlorestalFaculdade de AgronomiaUniversidade Eduardo MondlaneC.P. 257MaputoMozambiqueEmail: [email protected]
Peter GondoSouthern Alliance For Indigenous Resources(SAFIRE),P.O. Box BE 398,Belvedere, Harare,Zimbabwe.Email: [email protected]
Emmanual GuveyaDepartment of Agricultural Economics &ExtensionUniversity of ZimbabweP.O. Box MP 167Mount Pleasant, HarareZimbabweEmail: [email protected]
Charles B.L. JumbeAgricultural Policy Research UnitBunda College of Agriculture,University of Malawic/o Department of Economics & SocialSciencesAgricultural University of NorwayP.O. Box 5033, 1432 AasNorwayEmail: [email protected]
Richard KachuleAgricultural Policy Research Unit (APRU)University of MalawiBunda College of AgricultureP.O. Box 219LilongweMalawiEmail: [email protected]

viii
George C.KajembeFaculty of Forestry & Nature ConservationSokoine University of AgricultureP.O. Box 3013MorogoroTanzaniaEmail: [email protected]
Abdallah R.S. Kaoneka (late)Faculty of Forestry & Nature ConservationSokoine University of AgricultureP.O. Box 3013MorogoroTanzania
Dennis KayambazinthuForestry Research Institute of Malawi(FRIM),P.O. Box 270,Zomba,MalawiEmail: [email protected]
Godwin KoweroCIFOR Regional Office for Eastern &Southern Africa73 Harare DriveMt PleasantHarareZimbabweEmail: [email protected]
Charles M. MasanganoRural Development DepartmentBunda College of AgricultureUniversity of MalawiP.O. Box 219LilongweMalawiEmail: [email protected]
Charles MatayaAgricultural Policy Research Unit (APRU)University of MalawiBunda College of AgricultureP.O. Box 219LilongweMalawi
Frank MatoseCIFOR Regional Office for Eastern &Southern Africa73 Harare DriveMt Pleasant, HarareZimbabweEmail: [email protected]
Gilead MlayFaculdade de AgronomiaUniversidade Eduardo MondlaneC.P. 257, MaputoMozambiqueEmail: [email protected]
Gerald C. MonelaFaculty of Forestry & Nature ConservationSokoine University of AgricultureP.O. Box 3013, MorogoroTanzaniaEmail: [email protected]
Billy B. MukamuriCentre for Applied Social SciencesUniversity of ZimbabweP.O. Box MP 167Mount Pleasant, HarareZimbabweEmail: [email protected]
Zebedayo S.K. MvenaDepartment of Agricultural Education &ExtensionSokoine University of Agriculture,P.O. Box 3002,Morogoro,TanzaniaEmail: [email protected]
Nontokozo NemarundweInstitute of Environmental StudiesUniversity of ZimbabweP.O. Box MP 167Mount Pleasant, HarareZimbabweEmail: [email protected]

ix
Lusayo MwabumbaMzuzu UniversityPrivate Bag 201LuwingaMzuzu 2, MalawiEmail: [email protected]
Isilda NhantumboIUCN – Mozambique OfficeRua F. Melo e CastroNo. 23MaputoMozambiqueEmail: [email protected]
Sheona ShackletonEnvironmental Science ProgrammeDepartment of Environmental ScienceRhodes UniversityGrahamstown, 6140South AfricaEmail: [email protected]
Crispen SukumeDepartment of Agricultural Economics &ExtensionUniversity of ZimbabweP.O. Box MP 167Mount PleasantHarareZimbabwe.Email: [email protected]
Ussif R. SumailaFisheries Economics Research Unit,Fisheries Centre,University of British Columbia,6660 NW Marine DriveVancouver,CanadaEmail: [email protected]
Hardwick TchaleDepartment of Economics and TechnicalChangeCentre for Development ResearchUniversity of BonnWalter-Flex-Str.3, 53113,Bonn, GermanyE-mail: [email protected]
Eva WollenbergCenter for International Forestry Research(CIFOR)P.O. Box 6596 JKPWB,Jakarta 10065IndonesiaEmail: [email protected]

x
Acknowledgements
We would like to thank numerous persons who were contacted either as individuals orwithin their official capacity during the course of the research that culminated intothis book. The households living around the various forest reserves deserve specialappreciation because without their co-operation in field surveys, the research onwhich the models are based would not have been possible. Funding for the study wasprovided by a grant from the European Union Actions in Favour of the Tropical Forestsin Developing Countries (B7-6201) to CIFOR for a research project “Management of theMiombo Woodlands” implemented in Malawi, Mozambique, Tanzania, Zambia andZimbabwe in 1998-2002. The opinions expressed in this paper are the sole responsibilityof the authors and do not necessarily reflect those of the European Union and CIFOR.We are grateful to Sally Wellesley for editorial support, Gideon Suharyanto, CyprianusJaya Napiun and Eko Prianto for cover design and layout and Feby Litamahuputty forsecretarial assistance.

xi
Foreword
For many decades Southern African governments invested heavily in expanding theirforest estates through plantations of exotic tree species, building a wood processingindustry for both plantation and natural forest roundwood, providing the supportinginfrastructure for this through training, research, management and administration.Research and training at all levels was dominated by plantation forestry. The focus inmanagement was trees or forests, their industry and markets. This focus diminishedattention of forestry institutions to non-industrial forestry, with the exception of managingwater catchment forests.
This state of affairs was disturbed by the awareness campaigns for an impendingfuelwood crisis in Africa in the 1960s and 70s. This shifted the attention of forestersfrom industrial forestry to local communities. We saw increased investments in improvedcharcoal and cooking stoves as well as in local community initiatives in tree plantingknown by such names as village forestry, local community forests, village woodlots, andurban fuelwood plantations. However, no significant progress was made in getting ruralcommunities to adopt more efficient fuelwood stoves. Worse still many of the treeplanting initiatives at both the local community and central government levels failed.Gradually the focus returned to industrial roundwood production, processing and trade.
In the recent past, international initiatives related to increased democracy, propertyrights and good governance alongside economic reforms to revamp ailing economies inmost of Sub-Sahara African countries have seen another shift in forestry towards localcommunities. This time the focus is on devolving, from central government, themanagement of the natural forests to the local communities and that of the plantationforests to the private sector. The aim is to decrease central government involvementin primary forest production, wood processing and trade. However, central governmentremains the custodian of national forestry policy and legislation.
The incorporation of local communities in managing natural forests is very challenging.Firstly, we do not have sufficient information to guide management of these resourcesto meet not only the myriad of the needs of these communities, but also those of othernational stakeholders and the international community. Secondly, the natural forestshave to be managed and used in the overall context of rural development. The implicationis that whereas in government the focus was geared towards forestry sector goals, atthe rural community level an approach that integrates forestry with other rural livelihoodoptions is essential. The local communities are primarily engaged in agriculture andlivestock husbandry. The forests supply key basic needs such as those related to energy,habitat construction, pasture for domestic animals and wild foods. There are othersources of livelihood including off-farm employment and small businesses. The challenge

xii
facing rural development planners is that of planning natural forest management in thecontext of all these livelihood options.
Thirdly, the countries in the region have been implementing economic reformsknown as structural adjustment programmes (SAPs) and largely backed by foreignfinancial institutions. These reforms started to be implemented in Malawi, Tanzania,Mozambique and Zimbabwe in respectively 1980, 1986, 1987 and 1991. These reformsare ongoing but in the form of Poverty Reduction Strategy Programmes (PRSPs). Thelatter aims to correct shortcomings of the SAPs, specifically in the provision of socialservices and ensuring community involvement in the development process. The PRSPsthen define the environment for natural forest management.
The above three observations dictate a shift in both thinking and conduct offorestry business. More attention has to be given to the management of the moreabundant forest resources in our countries—the natural forests, and not the plantations—and in the context of integrated rural development. This is a serious challenge sinceforests in this region have not been managed this way.
This book is very timely because there is increasing desire by central governmentsto devolve ownership and management of natural forests to local communities as wellas to use these resources as one of the measures to alleviate rural poverty. The book isa compilation of results of research that attempts to shed light on these issues, specificallyproviding information and tools that have potential to guide planning and sustainablemanagement of the vast woodlands in Southern Africa. By first taking stock of the waythe communities are ‘managing’ this resource, the problems they are facing, and otherrelevant issues, the book provides insights on what we can build on. Further, the bookprovides us with a good account on how the forestry sector has evolved and how it canevolve in the present socio-economic environment. This provides us with potentiallyuseful scenarios for planning as well as alternative forest management options.
However, as one of the initial efforts in this direction, the book opens up challengesto scientists and practitioners to repackage some of the information for immediateuse as well as to do more to bridge the gaps identified by this research.
Enos Shumba Arlito CucoManager DirectorForestry Commission Directorate of Forestry and WildlifeZimbabwe Mozambique
Said Iddi Kenneth NyasuluDirector DirectorForestry and Beekeeping Division Forest DepartmentTanzania Malawi

1.The challenge to natural forestmanagement in Sub-Saharan Africa ruraldevelopment: Experiences from themiombo woodlands of Southern Africa
G. Kowero
1. A BRIEF OVERVIEW OF NATURAL FOREST ESTATE ANDMANAGEMENT IN SUB-SAHARAN AFRICA
Forest resources have significantly contributed to the economic development of manydeveloped countries, like Finland, that are richly endowed with them. One wouldtherefore expect the vast forest resources in many Sub-Sahara African (SSA) countriesto present opportunities to further economic development on the sub-continent.According to FAO (2001) Africa has about 650 million hectares of forests (almost all ofit located in the tropics) or 0.85 hectares per capita (very close to the world average).This represents about 17% of the world forest resources. About one percent of theforest estate is plantation forest. These forests are distributed as follows: CentralAfrica (56.5%), Southern Africa (30.0%), East Africa (23.0%), Africa- Small Islands(20.1%), West Africa (11.6%) and North Africa (1.0%). The net change in forest area isthe highest in the world, estimated at -0.78% annually or a loss of 5.3 million hectaresper year.
However, as noted by FAO (2001), most of the natural forest estate is not underany known management plan. National level information on the forest area coveredby a formal nationally approved management plan continues to be scanty on the sub-continent. While undertaking the “Global Forest Resources Assessment 2000”, FAO(2001) reports that only 3 out of 16 countries in West Africa could supply suchinformation. Virtually none of the countries in Central, East and Southern Africa suppliedfull information; several had partial information. However, many countries havemanagement plans for some of their natural forest reserves and wildlife managementareas. The picture is that of large unmanaged tracts of natural forest resource in SSAthat we do not know much about, but which support the bulk of the SSA human and

2 THE CHALLENGE TO NATURAL FOREST MANAGEMENT IN SUB-SAHARAN AFRICA RURAL DEVELOPMENT
animal population as well as economic growth. In other words, SSA continues to face adaunting challenge of how to manage and conserve about a quarter of its land areathat is wooded or forested in the face of increasing demands for land for agricultureand livestock production, infrastructure development and specific demands on theseforest resources for energy, construction material and other livelihood needs.
More than 70% of the population in Africa lives in rural areas and depend verymuch on these resources. The urban population is directly and indirectly linked tothese resources in terms of water and hydroelectricity supplies, fuelwood, food,medicines, construction timber and furniture. Of the 28 countries in the world inwhich forestry contributes at least 10% towards the national gross domestic product,18 are in Africa (Kowero et al. 2001). Sub-Saharan Africa has 47 countries, 46 classifiedas developing, of which nineteen feature among the 25 poorest countries in the world.Only the Republic of South Africa is industrial (TAC Secretariat 2001). Of the 626 millioninhabitants of SSA, 61% depend on agriculture and 34% are undernourished (FAO 2000a).In the period 1977-97 agricultural production grew at an average of 2.7% per year whileannual population growth in the last three decades has been at between 2.4 and 2.9 %(FAO 2000b). Population growth has in most cases outpaced growth in agriculturalproduction. This has increased hunger, poverty and environmental degradation. Theincreasing human population pressure has led to overexploitation of the forests forboth commercial and household products, and excising the forests for cropland. Further,increasing livestock pressure has led to overgrazing in forests, woodlands and grasslands.The human and animal population pressure continues to drain nutrients from forest soils,exacerbate soil erosion, accelerate water run-off, and increase siltation of rivers anddams, among many other adverse effects. Apart from human and animal populationgrowth, other factors that contribute to the deforestation of African forests includefires, urbanization, mining, road infrastructure, droughts, floods, settlements formigrating people, and conflicts. Commercial timber logging generally leads to forestdegradation when it is selective, but its supporting infrastructure often leads todeforestation. There is growing and undeniable evidence of the negative impact ofnatural forest degradation on the livelihoods of the rural poor and the environment atlarge.
The forests are therefore an integral part of the economic, social, cultural andspiritual life of many Africans. This realization has ushered in new approaches andchallenges to economic development with forest resources being an integral part ofrural development. However, the links between sustainable use of natural forestresources and poverty reduction are not always well understood among developmentprofessionals and policy makers. While forest conditions affect opportunities fornational development, the development process shapes what these forest conditionsare, and what they will become. The use, development, and conditions of forests arefundamental consequences of the wider configuration of national policy and economicdevelopment. National development is constantly creating incentives and capacitiesto exploit and enhance forest resources. Economic growth and social conditions tendto shift the location and composition of forest resources. Understanding how nationalpolicies affect forests provides the basis for achieving desired types of forest conditions,including the aggregate contributions they provide, and the required trade-off withother national objectives.
Another development in SSA is the increasing shift away from the centralised andstate-driven forest and woodland management of the colonial and post-independence

3G. Kowero
periods towards decentralised, and mainly community-based regimes. This move ispart of the very much externally driven democratization process on the sub-continentthat, among other things, encourages peoples’ participation in decision-making. Wesee more involvement of local communities and private sector in natural forest issues,although on the ground SSA has a long way to go in getting these two stakeholders tomanage a significant part of its natural forests. Forestry is gradually shifting from apractice with trees or forests at the center to a people-centered practice. This hastherefore introduced a new challenge to the conventional way of managing forests,with the trees and industry at the center.
2. THE MIOMBO WOODLANDS OF SOUTHERN AFRICAThis book is based on research on the miombo woodlands of Southern Africa thatevaluated local community participation in natural forest management as well as howmacroeconomic policies and sectoral government policies have shaped forestry andtheir potential for guiding forestry interventions in rural development. The lessonslearnt from the miombo woodlands could be of use in guiding the management ofother natural forests. Miombo woodland is one of the most extensive dry forestvegetation types in Africa occurring in seven countries in eastern, central and southernAfrica; namely Angola, Malawi, Mozambique, Tanzania, Zaire, Zambia and Zimbabwe(White 1983). They occupy an area of about 2.7 million square kilometres, almost equalto the combined land area of Mozambique, Malawi, Zimbabwe, Tanzania and Zambia.Miombo woodland is dominated by the legume family Caesalpiniaceae with the mostimportant tree species being those of Brachystegia, either alone or with Julbernardia,and Isoberlinia (Celander 1983; Lind & Morrison 1974 ; White 1983). The miombo sensustricto is therefore dominated by tree species in the sub-family Caesalpinoidea of theLeguminosea family.
In a recent treatise commissioned by The World Wide Fund for Nature (WWF)(WWF-SARPO, 2001), the miombo has been defined as an ecoregion complex (seeFigs. 1 and 2) dominated by the miombo sensu stricto and related dry woodlands,namely the Baikiae and Colophospermum woodlands which are slightly less dense butfunction similarly in an ecological sense to the miombo sensu stricto. Interestinglyenough, the two genera Baikiea and Colophospermum are also in the sub-familyCeasalpinoidea. Taken together, the ecoregion is home to the largest remaining ‘herdsof large mammals valuable for tourism’, protects the catchments of Southern Africa’sgreat rivers, and play a significant role in the hydrological functioning of the regionand by extension a major component of the life support system to the 120 millionpeople of Southern Africa of which some 70 million interact with and influence themiombo ecoregion. Its grass and herb dominated under-story is the bedrock of thelivestock industry and its nutrient cycling function has underpinned traditional shiftingcultivation agriculture which has been rendered ecologically unsustainable in a numberof places within the ecoregion, by population pressure, lack of land for shiftingcultivation and therefore much shorter fallow periods than before.
The potential for these woodlands in socio-economic development of the miomboeco-region has scarcely been exploited and yet the woodlands are rapidly being lostthrough:
• agriculture expansion, the leading cause for deforestation,• overgrazing that reduces the quality of the woodlands,

4 THE CHALLENGE TO NATURAL FOREST MANAGEMENT IN SUB-SAHARAN AFRICA RURAL DEVELOPMENT
Figure 1. Miombo Ecoregion Boundaries
Source: WWF-SARPO (2001)

5G. Kowero
Figure 2. Miombo Ecoregion Vegetation Types
Source: WWF-SARPO (2001)

6 THE CHALLENGE TO NATURAL FOREST MANAGEMENT IN SUB-SAHARAN AFRICA RURAL DEVELOPMENT
• fuelwood collection that impairs the quality of the woodlands and has resultedinto massive deforestation especially in areas where charcoal production isprevalent,
• over-exploitation of important tree and animal species and• uncontrolled burning that is increasingly becoming a feature of the woodlands.
All these combine to rapidly diminish the quantity and quality of the woodlands.
The critical factors that shape socio-economic developments based on thewoodlands include:
• poor soils that limit nutrient availability,• low and erratic rainfall,• low value woodland products,• inadequate knowledge on the functioning of the woodland,• increasing human and animal populations,• declining agricultural potential,• high incidences of HIV/AIDS, malaria and other diseases in the ecoregion, and• increasing poverty.
The implication of these features is that even if the woodlands were to give wayto agriculture, as they might eventually do, crop production shall be constrained byinadequate and unreliable rains, as well as inadequate agricultural inputs to the poorsoils due to extensive poverty. The low value of woodland products could constrainwoodland conservation. The high incidences of HIV/AIDS and related pandemics holdpotential to drastically alter the demography of the region, reduce agriculturalproduction and increase poverty. Since human interventions in the woodlands aregender specific, changes in the demographics of the region might impact on thewoodlands in ways that mirror the roles of men, women and children in these resources.
All these factors present tremendous challenges to rural development that couldlift the rural communities in the miombo ecoregion out of poverty.
3. ORGANISATION OF THE BOOKThe first part of the book presents papers that summarise experiences with communitybased management of woodlands, and provides case studies of different facets oflocal governance related to woodlands. It considers how institutional arrangementschange, the factors influencing change, the factors that lead to successful managementof natural resources and conflict issues. Local community involvement in forestmanagement has not been part of mainstream forestry - it is an important departurein terms of natural forest management, away from the allowable cut goal in management(largely targeted at the industry) to a goal that seeks to satisfy a myriad demands on ofneeds on these resources by many stakeholders.
The second and third parts of the book deal with the policy environment in whichforestry business is conducted. This environment has changed substantially over theyears. Most SSA countries have, in the framework of Tropical Forests Action Plans(TFAP), National Forests Action Plans (NFAP), Natioanl Environmental Action Plans(NEAP), Forestry Master Plans, National Forest Plans (NFPs) etc., revised their forestpolicies and/or forest laws and regulatory instruments that guide forestry development.

7G. Kowero
Further, due to declining economic development nearly all SSA countries embarked oneconomic reforms aimed at turning their economies around. These started in the1980s as Structural Adjustment Programmes (SAPs), which have now been reformulatedas Poverty Reduction Strategy Papers (PRSPs). The latter take into account societywide issues that SAPs neglected and therefore contributed to the failure of thesepolicies in terms of containing deforestation and poverty, among others.
The second part of the book provides a review of key land based sectoral policies,namely, land, agriculture and forestry, their evolution and how this shaped developmentsin forestry. This also explores gender relationships and roles in use of woodlands, andinvestigates how policies guiding economic development have differential impacts onmen and women at the local level. The third part of the book takes this a step furtherby examining the potential impacts, on rural livelihoods and forest condition, of selectedpolicy instruments in the sectoral policies as well as in the macroeconomic policies(i.e., in the PRSPs). This is done through modeling. The aim of both parts two andthree of the book is to facilitate natural forest planning by provide tools for bothnatural forest planning and management.
We are comfortable with planning and managing forest plantations. There arestandard texts, guidelines, and experiences that have guided this practice for decadesin southern Africa. We have fewer problems with planning and managing industrialnatural forests guided by the allowable cut principle. The forest industry has since thecolonial times thrived on valuable hardwoods from the natural forests. The cuttingcycle has guided management where these resources were and continue to be harvestedlegally. However, we have serious problems with managing natural forests for non-industrial purposes and with local communities as the main client.
The woodlands, unlike industrial plantations and forests, have numerous localusers. Their demands and behaviour are quite different from that of industry. Whilethe industry might demand a certain volume of wood per day or week, communitieshave varying demands on the woodlands and some are not on a daily basis like firewood,but are seasonal, like wild fruits. Also their dependence on the woodlands is partialwhile some industries depend fully on the resources for their survival. Further, manyrural communities are agricultural, with both crops and livestock that take most oftheir labour and other resources.
This book provides insights on the compatibility, at the household level, ofagriculture, livestock husbandry and woodland exploitation, the main householdactivities in the ecoregion. This way the book provides guidance on how to reconcilethe demands of the three key stakeholders on the woodlands (the local communities,government and private sector) and guided by the three prominent rural developmentgoals of food security, increased rural incomes and biodiversity or forest conservation.This way the book provides information and tools that could be used in planning ruraldevelopment, by for example identifying the tradeoffs between the three goals andthe potential implications of serious health problems like HIV/AIDS and malaria thatconstrain rural labour supply and impair agricultural production and other undertakings.
Further, the increased involvement of local communities in natural forest ownershipand management has apparently been more at the rhetoric level and less on how thiscan be done and in a scientific way. Each of the stakeholders could manage the resourcealone taking into account its area of comparative advantage, for example thegovernment managing water catchment forests. Alternatively the stakeholders canmanage the resources jointly. Stakeholders might wish to give more priority in

8 THE CHALLENGE TO NATURAL FOREST MANAGEMENT IN SUB-SAHARAN AFRICA RURAL DEVELOPMENT
management to some goals in management, like biodiversity conservation. In othercases the forests might have to continue as open access resources. All this createsscope for different forest management options. The book provides information onhow to select the most appropriate woodland management regime and this is illustratedby case studies that have employed a system dynamics approach to the problem. Inthis way the book sheds light on the suitability or desirability of decentralization ordevolution of ownership and management of the woodlands from central governmentto rural communities and private sector. It does so by highlighting the potentialimplications of each management regime on employment creation, woodland areaconverted to cropland, proportion of woodland that is eventually managed on asustainable basis, and benefits to each stakeholder from the woodlands, agriculture andlivestock production, and off-farm employment, among others.
As a whole the book is written for various audiences. Those interested in localinstitutions and governance issues can be contented with Part I, while those interestedin policy analysis will find Part II and Part III more appealing. Academicians andresearchers shall find the models exciting, while policy makers shall find the summariesfor Part I, II and III and the text in general useful. The lay reader will find most of thetext easy to follow.
REFERENCESCelander, N. 1983 Miombo woodlands in Africa - distribution, ecology and patterns of
land use. International Rural Development Centre, Swedish University of AgriculturalSciences. Working Paper 16. 54p.
Food and Agriculture Organization of the United Nations (FAO) 2000a The state of foodinsecurity in the world. FAO, Rome.
Food and Agriculture Organization of the United Nations (FAO), 2000b Agriculture: Towards2015/30. Technical Interim Report. FAO, Rome.
Food and Agriculture Organization of the United Nations (FAO) 2001 Gobal forest resourcesassessment 2000, Main Report. FAO Forestry Paper No. 140. FAO, Rome. 479p.
Kowero, G.S, Spillsbury, M.J. and Chipeta, M.E. 2001 Research for sustainable forestrydevelopment: Challenges for Sub-Saharan Africa. CIFOR FOSA Paper. FAO, Rome.
Lind, E.M. and Morrison, M.E.S. 1974 East African vegetation. Longman Group Limited,London. p. 59–101.
TAC Secretariat 2001 Contributions made by the CGIAR and its partners to agriculturaldevelopment in Sub-Saharan Africa. A report from TAC’s Standing Panel on ImpactAssessment (SPIA). TAC Secretariat, Food and Agriculture Organization of the UnitedNations, May 2001. 33p plus annexes.
White, F. 1983 The vegetation of Africa. UNESCO, Paris. 356p plus maps.WWF-SARPO 2001 Conserving the miombo ecoregion. Reconnaissance Summary. WWF-
Southern Africa Regional Programme Office, Harare, Zimbabwe. 24p.

2.Overview1: Institutional arrangementsfor managing woodlands
B.M. Campbell, S. Shackleton and E. Wollenberg
1. HOW IS DEVOLUTION FARING?This section touches on how natural forest resources are being managed at the localcommunity level, in what is popularly known as community based natural resourcesmanagement (CBNRM). Case studies were made on CBRM projects in Malawi, Tanzaniaand Zimbabwe, with additional material derived from another five countries. Thereare undoubtedly some notable successes in CBNRM. Emerging results from Babati inTanzania, suggest that the shift of control from central government to local communitieshas seen a turn around in the resource base, from degraded and overused woodland toregenerating woodland with a set of rules governing use (Chapter 3).2 CBNRM inTanzania builds on the rather unique and favourable local situation in that decentralizedgovernment allows the village to own property in its own right as a corporate entity.For Malawi, success in the regulation of uses and users is not universally associatedwith any particular type of property rights regime.3 Communal property, private propertyand government property have all been associated both with success and failure – asimple one-to-one relationship between property regimes and outcomes is not apparent.
Despite the successes, we suggest that there is a fair degree of misplaced optimismabout common property resource (CPR) systems.4 In investigating common propertyissues for woodlands in communal areas in Zimbabwe, where people rely heavily onwoodland resources, we are struck by the numerous case studies showing a breakdownof local institutions for CPR management (Chapter 4), and the lack of any emergingalternative institutions for such management. Weak or weakening local institutions isa theme running throughout the research papers. There are a number of contributingfactors to this phenomenon, including the lack of an enabling policy environment,household strategies of poor people with few alternatives but to exploit woodlandsunsustainably, marked and increasing differentiation of households within communities

10 OVERVIEW : INSTITUTIONAL ARRANGEMENTS FOR MANAGING WOODLANDS
which places pressures on CPR institutions, lack of legitimate local institutions, andvarious features of the resources. There is not much evidence to suggest that movingthe locus of governance closer to the people means that resource management ismore cost-effective. Communities will need similar levels of inputs to those requiredby other stakeholders in order to effectively manage natural resources, and there willbe considerable transaction costs.
We argue that the formal rule-based systems which form the cornerstones ofproposed CPR systems are far removed from the current institutional systems, whichare based on a complex of norm-based controls, the formulation and enforcement ofwhich are steeped in subtle and elaborate processes. For example, resource useboundaries for local management remain a thorny question – while the literatureespouses clear boundaries and clear user groups, in reality this is often impossible toachieve. We suggest that advocacy of CPR and CBNRM systems has to be temperedwith critical analysis.
2. DEVOLUTION AND THE ROLE OF CENTRAL STATEDevolution involves the transfer of authority over natural resource decision-makingand benefits from central state to local actors. The state, however, has a number ofimportant roles (e.g. including protecting wider ‘public goods’ {watersheds, biodiversity,carbon sinks and other ecological services}, facilitating and regulating private activity,mediating conflict). We recognise these roles but question whether in practice a balancehas been achieved between local and ‘wider’ interests and objectives in implementation.Too often the notion of conservation as a ‘public interest’ area or the need to achievenational economic development goals have been manipulated to serve the interests ofNR departments and to legitimise their actions, usually to the detriment of locallivelihood systems and the real choices available to people. Overall, the case studiesshowed that, despite rhetoric to the contrary, central authorities continued to drivethe NRM agenda.
3. HAS DEVOLUTION WORKED FOR LOCAL PEOPLE?In many cases, local people’s views were that devolution policies had yielded onlylimited benefit for them. However, in addition to the material benefits, devolutionalso indirectly provided other benefits. Local people previously considered poachers,criminals and squatters were now seen as legitimate resource users in a number ofsites. Donors, NGOs, government service providers and, in some countries, the privatesector consequently took more notice of these users and provided assistance to themincluding technical, managerial and community capacity building, small enterprisedevelopment (e.g. bee keeping in Malawi, tourism ventures in Namibia). Devolutionopened channels for rural dwellers to communicate their priorities to governmentdecision-makers and in some places improved community-government relations(although in many sites suspicion continued to exist).
Can sustainable forest management succeed without linking it to improvement inagricultural productivity and to the constraints and opportunities offered by the widereconomy? This is a thorny issue – as researchers and development practitioners interestedin forests we may be moving in a limited direction – forest-based activities are only asmall part of a wide livelihood portfolio.

11B.M. Campbell, S. Shackleton and E. Wollenberg
4. THE ORGANISATIONAL FOUNDATIONS OF DEVOLUTIONThe types of organisations that exercised ‘local’ authority (through devolution) andthe direction and degree of their accountability had a strong influence on whether theoutcomes of devolution policies were favourable for local people or not.5 Oneorganisational model that proved favourable was that involving corporate, legalorganisations composed of all rights holders/residents, e.g. Trusts (Botswana),Conservancies (Namibia), Communal Property Associations (Makuleke, South Africa),Villages (Tanzania), and Range Management Associations (Lesotho). Since thefoundation and legitimacy of these organisations were derived from the communityitself, interference by the state was less pervasive (than in other arrangements), butthe state still retained ultimate authority and continued to make decisions with negativeimpacts on local interests.
5. HOW HAVE DIFFERENT ACTORS INFLUENCED OUTCOMES?At many study sites, parallel hierarchies of traditional leadership, local governmentand line department-sponsored committees existed. Often these had unclear oroverlapping jurisdictions and mandates in NRM that led to institutional conflict andstruggles for power (Chapter 5). In other cases, the influence of government and localelites over joint committees was strong and community representation and inputseverely diluted. NGOs, donors and the private sector further shaped outcomes byallying themselves with particular local groups or government officials. The“communities” in “community-based natural resource management” seldom exist inany simplistic sense. Internal differentiation in resource endowment within communitiesis the rule; thus it is necessary from the outset to use tools to identify the variousgroupings within communities. There are also numerous overlaps in membership ofinterest groups, often with conflicting and competing interests. Considerable effortneeds to be made to understand the institutional context of CBNRM schemes, ascontext is likely to determine the success or failure of particular schemes.
5.1 National policy makersThe degree of policy support for CBNRM varies widely amongst southern Africancountries. In addition, within a country some policies may be supportive of local controlwhile others may not (e.g. compare the wildlife and forestry policies in Zimbabwe).For effective CBNRM, it is believed that most rights should be devolved to the lowestlevel.
5.2 Traditional leadersIn almost all the sites, traditional authorities continued to play a role in NRM withvarying degrees of legitimacy and control. In some countries, chiefs asserteddisproportionate power as chairpersons of sub-district NRM structures and divertedsome CBNRM benefits to building their own power base. On the other hand, theexclusion of traditional leaders from committees in other sites was counter productiveresulting in conflict and delays, until these leaders were co-opted onto the committees(Chapter 5). In several cases, traditional leaders were provided an ex-officio or non-executive role (e.g. as patrons) on committees (e.g. Namibia). In others, such as

12 OVERVIEW : INSTITUTIONAL ARRANGEMENTS FOR MANAGING WOODLANDS
Malawi, the NRM committees reported to traditional leaders who remained external tothe committee. Another model was to leave communities to decide whether or not toelect hereditary leaders onto local committees. Where traditional leadership was strongand legitimate it had positive impacts in promoting local people’s priorities. Where itwas weak or biased towards certain ethnic groupings, lineage leaders had little supportor role in new NRM structures.
While local traditional structures have been important in regulating resource usein many countries, the fabric of rural society is undergoing rapid change, much ofwhich is impinging negatively on traditional structures (Chapter 4). The rapid changeshave also seen a rise in individualism and reduced community-related activities(reciprocity, communal work parties). There is a history of empowerment anddisempowerment of these institutions. Despite their weakening role, they generallyremain as a crucial component of CBNRM.
5.3 Local governmentLike traditional leaders, local government had a mixed role in promoting positiveoutcomes for local people from devolved NRM. Some cases showed that local councilsoften served as a source of competition with users for control of resources and revenues(e.g. CAMPFIRE in Zimbabwe), and challenged institutional arrangements devised bycommunities, compromising local priorities. On the other hand, where district or localcouncils had little involvement in devolved NRM, community-based organisations cameto operate in isolation of broader district level planning processes often to their detriment(e.g. Botswana). In these cases, to ensure local and district political support of NRMcommittees and the integration of CBNRM into regional and district development plans,it is necessary that community-based organisations mesh within local governmentstructures and development processes.
5.4 Non-governmental organizations (NGOs)NGOs played an important facilitatory and capacity building role in many of the cases,helping to bridge divergent views between local people and government agenciesand manage conflict within or among communities (Chapter 5).6 In some countriesgovernment departments used NGOs as project implementers. NGOs generallydisplayed greater commitment to empowering communities than state agenciesand worked better to integrate the development needs of local people with NRMconcerns. The influence of NGOs was not, however, always positive for local people.NGOs sometimes sided with the state or created dependency rather thanempowerment. Moreover, as local people’s representatives and gatekeepers tothe world, NGOs sometimes pushed communities into decisions they may have notnecessarily taken.
5.5 DonorsFunding from donor agencies was critical in financing the development and facilitationof devolution. Donors often attached conditions to their funding, forcing governmentsto review their policies and practices to favour local needs. In most countries, donors,together with NGOs, were instrumental in driving the agenda towards greater local

13B.M. Campbell, S. Shackleton and E. Wollenberg
control. In some places an unhealthy reliance on these external funds was created,resulting in the collapse of initiatives when funders withdrew.
5.6 Private sectorThe private sector played a key role in income generation in some devolution initiatives.Private operators provided capital, expertise and market access. There were, however,many examples where local people benefited little from private sector involvement,particularly where the state continued to capture revenues or make decisions regardingprivate sector involvement. Another class of entrepreneurs included those who usedlocal NRs but paid no resource rents (e.g. woodcarvers, firewood, charcoal and medicinalplant traders, and traditional healers). These powerful actors tended to ignore localregulations and controls, undermining the authority of community institutions andappropriating the resource base at the expense of local community members. Suchentrepreneurs posed one of the greatest threats to local NRM in Malawi, where majorconflicts existed between outside entrepreneurs and local people (Chapter 5). Thegovernment attempted to assist the community to control this illegal use throughroadblocks, fines and seizure of products, but with little effect.
5.7 Within-community interests and power relationsIn cases where significant authority was devolved, local politics and power relationsoften intervened to prevent more democratic control. At most sites problems occurredbecause of local elites seizing control. In some locations, checks and balances were inplace to ensure committee accountability to the community at large. For example, inMalawi a mechanism exists to remove committee members with whom the communityis unhappy.
6. LOCAL CAPACITY: THE KEY TO MAKING DEVOLUTION MORERESPONSIVE TO LOCAL INTERESTS?
The degree of organisation amongst poor resource users and their knowledge of theirrights was a critical factor influencing devolution outcomes. Where local people werewell organized and had alliances with NGOs or other influential groups, they managedto secure greater control and benefits. In this context, to have capacity building includeways of improving representation, accountability and transparency is important.Assistance should allow for diverse constitutional forms to exist providing certaindemocratic standards are met. Promoting pluralistic processes that involve and protectdisadvantaged groups will be especially important. Issues of day-to-day managementcan then be left to users, once democratic decision-making is assured.
7. HOW CAN THE STATE PLAY A MORE POSITIVE ROLE AND MOVEDEVOLUTION FORWARD?
As the cases show, devolution policies have often had disappointing impacts on locallivelihoods and the ‘space’ that communities enjoy to make their own managementdecisions. Though the explanations for failures varied from country to country, oneconsistent pattern was that state officials and local people had different expectations

14 OVERVIEW : INSTITUTIONAL ARRANGEMENTS FOR MANAGING WOODLANDS
of what devolution was supposed to achieve and how. The state’s use of contractualagreements, regulations and organisations accountable to it as instruments ofdevolution allowed officials to impose their own constructs and modes of action onvillagers at the cost of local self-determination. In its extreme, devolution has beenabused by governments to cheaply extend control where it was previously absent, andto shift the locus of state control from NRM and production to the extraction ofrevenues.
8. CONCLUSIONS• Most devolved NRM reflects some continuation of central government control
and management over natural resources rather than a genuine shift in authorityto local people.
• The ways in which local people realise the benefits of devolution differ widelyand negative trade-offs, most felt by the poor, are common.
• States, communities and other stakeholders have different visions of devolutionand its mode of implementation. A shared framework, more accountable to locallivelihood needs and people’s rights to self-determination, is required. Redefiningissues of wider ‘public interest’ forms part of this process.
• Organisational models that devolve authority directly to disadvantaged resourceusers are more embracing of local interests and priorities than those that allocatecontrol to higher levels of social organisation.
• More powerful actors in communities tend to manipulate devolution outcomes tosuit themselves. Checks and balances need to be in place to ensure that benefitsand decision-making do not become controlled by elites.
• Strong local organisational capacity and political capital enhance outcomes forlocal people by enabling them to mobilize resources and negotiate for betterbenefits. NGOs, donors, federations and other external actors have a key role inmoving devolution policy and practice towards local interests.
• Different measures will be needed in different contexts. Most fundamentally,governments need to enable a situation where resource users have the rightsand power to bring about a fair division of control, responsibility and benefitsbetween government and themselves.
• There is much commercialisation of resources and the successful institutionalmodels are generally those where the resource has high value. The subsistence,sacred etc values of resources are equally important in the miombo woodlands –how does one move forward in terms of the management of low value resources?
Successful cases are generally those that are somehow embedded withingovernment structures – the cases where the management largely occurs outside theinfluence of the state can be very vulnerable to outside pressures. However, a balanceneeds to be achieved, because in state-facilitated cases there are many exampleswhere NRM becomes top-down or is usurped by the elite.

15B.M. Campbell, S. Shackleton and E. Wollenberg
ENDNOTES1. Much of this summary is drawn from the overview by Shackleton, S., Campbell, B., Wollenberg,
E. and Edmunds, D. 2002. Devolution and community-based natural resource management: creatingspace for local people to participate and benefit? ODI Natural Resource Perspectives 76. http://www.odi.org.uk/nrp/76.pdf
2. Kajembe, G.C. and Monela, G.C. 2000. Tanzania case study: Empowering communities tomanage natural resources: Where does the new power lie? A case study of Duru-Haitemba, Babati,Tanzania. In: Shackleton, S. and Campbell, B. Empowering communities to manage natural resources:Case studies from Southern Africa. Volume 2. CSIR Report ENV-P-C-2000-025, South Africa & WWF(Southern Africa). pp. 153-168. – see Http://www.cifor.cgiar.org/publications/pdf_files/Books/Empowering.pdf
3. Mwabumba, L., Masangano, C. and Kayambazinthu, D. 2002. Making community basedmanagement work: Case studies from Malawi.
4. Campbell, B.M., De Jong, W., Luckert, M., Mandondo, A., Matose, F., Nemarundwe, N., &Sithole, B. 2001 Challenges to proponents of CPR systems – despairing voices from the social forestsof Zimbabwe. World Development 29: 589-600.
5. Campbell, B.M. & Shackleton, S. 2001. The organizational structures for community-basednatural resource management in Southern Africa. African Studies Quarterly 5, no.3: [online] URL:http://web.africa.ufl.edu/asq/v5/v5i3a6.htm
6. See cases in Shackleton, S. and Campbell, B.M. 2000. Empowering communities to managenatural resources: Case studies from Southern Africa. Volume 2. CSIR Report ENV-P-C-2000-025,South Africa & WWF (Southern Africa). 195 pp. Http://www.cifor.cgiar.org/publications/pdf_files/Books/Empowering.pdf

3.Making community-based forestmanagement work: A case study ofDuru-Haitemba village forest reserve,Babati, Tanzania
G.C. Kajembe, G.C. Monela, G.C. and Z.S.K. Mvena
ABSTRACTTanzania, like most other developing countries in Africa, has in recent years beenfighting a losing battle in trying to protect vast areas of woodlands and natural forestsscattered around the country. Consequently, forest resources in the country havebeen subjected to increasing pressure of exploitation. The government capacity toprotect forests and woodlands has progressively declined with reduction in budgetsand retrenchment of workers, making forests and woodlands even more vulnerableand open to degradation than before. A question emerged in recent years as to whetherthe main model of natural resource management, involving protection by policing, isthe appropriate way forward. These and other developments have led to a paradigmshift regarding natural resource management, where local communities living adjacentto woodlands and forests are required to protect and manage those resources. Onemodel that has emerged and gained ground is Community Based Forest Management(CBFM) through which local communities are ultimately empowered to manage naturalresources. The guiding principle is that local communities have the right to controland manage natural resources on their land. This builds on the rather unique andfavorable situation in Tanzania where decentralized government allows the village toown property in its own right as a corporate entity. Thus communities in Duru-Haitembaadopted CBFM as a result of local discontent regarding the way the 9000 ha forestsremaining in Duru-Hatemba was being managed by the government. This forestrepresents the only remaining tract of non-reserved dry miombo forest of anysignificance in an otherwise well settled and cultivated Babati District.
The Tanzania government had a long standing idea to gazette the area. Beforethat, the District Council had put the area under the District Soil and Water

17G.C. Kajembe, G.C. Monela and Z.S.K. Mvena
Conservation Bylaw, which meant that any use of the woodland had to be withconsent of district officials; a situation which led to restricted local use of theforest. This made local communities lose confidence in their own districtadministration. Through this discontent, an entirely different process emerged whichallowed local communities in Duru-Haitemba to conserve and manage the woodlandsadjacent to them. This is the basis of the present situation where eight villages aremanaging the woodland resources. The forest, which was in a state of acute decline,now has boundaries that are intact, and incursion is limited; flora and fauna arerecovering; and the forest is managed and protected effectively at minimum cost.The key factor that has led to the observed success is community participation, inwhich there has been a marked degree of power sharing to the extent thatcommunities have taken full responsibility and control of the resource. Furthermore,the government, as former manager, has become a technical advisor and watchdog.Ultimately, villages now legally own the forest reserve. Thus there is a clear definitionof woodland resource boundaries, village bylaws valid in a court of law have beenestablished, and there is security of tenure and sense of ownership. Empowermenthas resulted in full control, access and use rights for the community and obviousbenefits have been reaped by local people. A similar model could be adopted inother areas facing related problems.
Key words:Local community, sustainable forest management, empowerment,devolution, rules
1. INTRODUCTIONIn most developing countries, substantial efforts have been directed towards puttingnatural resources under sustainable use and management. Unfortunately, this aim hasbeen difficult to achieve through conventional approaches to natural resourcemanagement. Consequently, an entirely new paradigm emerged in recent years termedCommunity Based Forest Management (CBFM) where the ultimate goal is to improveforest management, to provide empowerment of local people and to contribute torural development. Through this, forest management is expected to evolve out of themany difficulties that have often embraced the protection and management of forestresources in most developing countries like Tanzania.
Different actors in Community Based Forest Management have portrayed differentperspectives, motives and interests which have led to varying construction of themeaning of CBFM. According to (Jeanrenaud 1997), arguments regarding CBFM can bedrawn from several disciplines and regional experiences, such as biology, conservation,anthropology, ethnobotany, indigenous knowledge and human rights. The debate isdynamic and actors have tended to be eclectic in their rationale, hence weaving variousarguments in sometimes ambiguous and problematic ways.
Some arguments focus on CBFM as a means to resolving the injustices of protectedforest areas where local people were excluded from the land they had traditionallyoccupied and depended on for their livelihood. Generally, protection of forests throughgazettement has several negative impacts. Communities occupying lands adjacent toprotected forests frequently bear substantial costs as a result of loss of access whilereceiving few benefits in return. People in these communities have been noted to bepoor, they lack political influence and they receive few government services (Mvenaand Kajembe 1997). Also a large part of costs concerning the protection of biological

18 MAKING COMMUNITY-BASED FOREST MANAGEMENT WORK
diversity are borne by those least able to pay for them, even though the benefits areincreasingly being recognized as global (Wells 1992).
In Tanzania, the central tenet of forest management has inevitably come to focuson protection with a key actor being a forester who is expected to protect the forest.However, expecting that low paid forest guards, mostly recruited from rural areas, toeffectively protect the forest resource from fellow villagers in need of forest productsfor basic subsistence is unrealistic (Kajembe and Malimbwi 1996). Furthermore, in thewake of declining budgets and retrenchment of workers, the capacity of governmentto protect forests based on this model has progressively declined (Wily 1995). Moreimportantly, foresters in recent years have begun to question whether or not the“policing model” of forest management is the right way forward. These and otherdevelopments have led into a paradigm shift where the only viable alternative toforest protection is to make the local people living adjacent to forests, the guardiansof the forest resource.
Due to this paradigm shift, most foresters have realized that solutions to problemsof forest management lie in the very section of society which has traditionally beenregarded as the “problem”: the local people who use forest resources. More effective,cheaper and lasting approaches are essential to sustainably managing the forestresources.
Under the right conditions, such as an appropriate legal framework, rightmotivation, bottom up interventions and clear definitions of property and tenurialrights, the local people have much potential to become the strongest and most costeffective guardians of forest resources. In the process, the government policing functionhas to cease, in order to allow officials a chance to serve as technical advisors orfacilitators. It is fortunate that the government of Tanzania and many other governmentshave started to change their overall outlook. The purpose of this paper is to highlightwhat has made CBFM at Duru-Haitemba Forest Reserve a success.
2. PROFILE OF DURU-HAITEMBA VILLAGE FOREST RESERVEThe Duru-Haitemba forest is typical dry miombo woodlands located within the Riftvalley, about 20 km South of Babati township. The woodlands, with an area of 9,000ha or about 90 km2, represent the only remaining tract of non-reserved forest of anysignificance in an otherwise well settled and cultivated Babati District. They consist ofa series of small woodland patches named after the adjacent villages.
The woodlands occur along a series of related high ridges of up to 1850 metresabove sea level. The ridges undulate, and the peaks along them give an impression ofbeing distinct hills. About 145 species of trees and shrubs including climbers andcreepers have been identified in the Duru-Haitemba woodlands. The dominant speciesinclude: Brachystegia microphylla, Brachystegia spiciformis, Julbernardia globiflora,Albizia versicolor, Brachystegia boehmii, Combretum collinum, Acacia nigrescens andTamarindus indica. There are eight registered villages adjacent to Duru-Haitemba forest(Table 1). All the villages were included in the present study.

19G.C. Kajembe, G.C. Monela and Z.S.K. Mvena
3. CBFM INITIATIVES IN DURU-HAITEMBA VILLAGE FORESTRESERVE
3.1 Establishment of local control and rulesAs one of the few remaining tracts of miombo woodlands in Babati District, Duru-Haitemba forests had been targeted for gazettement into government forest reservein 1990/91. In 1992 the Swedish-funded Regional Forestry Programme facilitatedimplementation of an inventory, survey and boundary demarcation process as aprerequisite for formal gazettement. However, the programme faced local discontent.Indeed the process and the attempt to withdraw the forest from public domain intothe hands of government by gazettement was the catalyst to find a more acceptable,workable regime of management (Wily 1995). After a long process of dialogue, thedecision was made to abandon gazettement in favour of assisting each of the eightvillages to take full rights and responsibility for conservation of the forest. Today, anumber of young men, serving as village forest guards are patrolling the forests againstbreach of the conservation rules each village has developed.
The rules for the forests include the following: First, there are rules banningvarious activities. Banned activities include:- Charcoal making; setting fire to theforests or grasses; felling any reserved tree species such as Pterocarpus angolensis;ring barking of trees for making beehives; house construction within the forest andfarming and grazing within the forests. Second, certain activities may only be donewith a permit from the village forest committee. These include entering the prohibitedzone for any purpose other than passing through; cutting and collecting poles, rafters orwithies for house construction; collection of stones for building; collection of herbs,roots or other plant parts for the purpose of producing and selling medicine; felling ofunprotected species for the purpose of producing domestic tools or utensils such as hoe
Table 1. Socio-economic characteristics of the study villages in Duru-Haitemba
* Entitled village area includes the forest.** The population is for the year 2000.Source: Field data and Wily 1996.
1 Gidas 5 694 3445 4250 21 875 2.6 4 12
2 Bubu 4 355 2430 4690 49 2300 8.8 3 14
3 Ayasanda 5 326 2931 1660 30 500 1.4 5 10
4 Endanachan 4 445 2503 2130 21 400 1.1 3 4
5 Riroda 9 705 4506 4610 38 1800 1.8 8 34
6 Endagwe 6 501 3112 4300 28 1220 2.6 6 12
7 Duru 5 308 2816 3720 35 1500 2.7 5 15
8 Hoshan 3 402 3520 2290 17 400 1.2 3 6
All villages 41 3726 25253 27450 32 8995 2.4 37 108
No Village No of No of Population Entitled* % of Village Forest No of No ofsub- house- ** village village forest area sub- villagevillages holds area area still reserve per villages forest
(ha) forested (ha) house- with guardshold forest

20 MAKING COMMUNITY-BASED FOREST MANAGEMENT WORK
and axe handles, pestles and mortars; and felling and pit sawing of trees for communityservice such as making school desks. Third, there are rules for freely permitted activities.These include:- collecting dry wood for fuelwood; cutting of sticks for making toothbrushes; collecting wild fruits and vegetables; collecting leaves or other plant parts forhome medicine, provided the collection does not lead to mortality of the plant; seasonalgrazing; collecting grinding stones; inspecting beehives; and entering the forest forrecreational purposes.
These conservation rules were formally approved by the full Babati District Council(BDC) in mid 1995 under the District Authorities Act as village bylaws, thus formallyrecognizing the role of each village as the sole authority over the use and managementof its Village Forest Reserve. This allowed the village to levy fines upon offenders.Each village is the legal authority and manager of that part of Duru-Haitemba forestwhich is adjacent to its own settled village area (Wily 1996).
3.2 Background to the success of CBFM at Duru-HaitembaCBFM initiatives at Duru-Haitemba represent an exciting development within the forestrysector in Tanzania and have also served as inspiration for communities both within andbeyond Tanzania. The CBFM initiatives at Duru-Haitemba are an example of devolutionand democratisation, the desire being to give the local people a say in the governance oftheir natural resources. CBFM in Duru-Haitemba was prompted by local pressures.
Development experience has clearly indicated that centralized solutions toenvironment and development have not worked (Agrawal et al. 1999). Blueprintdevelopment strategies in the shape of standard technical solutions have beenineffective in meeting the needs of the poor, marginalized and less powerful groups.CBFM initiatives in Duru-Haitemba have shown that approaches that take people’saspirations more seriously can enjoy local success.
The observed success of CBFM in Duru-Haitemba can be attributed to the followingfactors: clearly defined boundaries; congruence between rules and local conditions;good collective choice arrangements; elaborate conflict resolution mechanisms; clearlydefined resource property rights; the rights of villagers to devise their own institutionsthat are not challenged by external government authorities; and villagers’ ability todevelop a common pool resource institution where the benefits to be gained fromcollective action are greater than the opportunity costs.
3.2.1 Clearly defined boundariesThe study showed that all the villages in Duru-Haitemba have secure boundaries whichgive the villagers powers to take action against anybody who violates their rules.Duru-Haitemba forest had never been gazetted Forest Reserve. However, by the 1980sit was fully intended to be gazetted as forest reserve. To this end it had been surveyedand demarcated and all but the publication of Reservation document was complete.Thus beacons were on the ground. In most cases, boundaries had been marked bynatural landmarks such as hills and rivers. In a few villages, boundaries were demarcatedartificially. Since the Duru-Haitemba Forest is standing as the only remaining meaningfulforest in a heavily depleted land, it has easily identifiable boundaries. Coupled withregular patrols by the village guards and application of strict village by-laws, the peoplein Duru-Haitemba uphold the boundary system.

21G.C. Kajembe, G.C. Monela and Z.S.K. Mvena
Boundaries for common pool resources (CPRs) need to be clearly defined for thebenefit of owners and to facilitate collective action. Owners of a CPR will have theirconfidence and security of tenure enhanced if limits of their jurisdiction are clearlydefined. In this way they are not afraid to invest in the CPR due to the fear that theirinvestment can be expropriated by others. Where security of tenure is not secure,outsiders can deplete the resource because they have nothing to lose (Ostrom 1996;Kajembe and Kessy 1999).
3.2.2 Congruence between rules and local conditionsVillage governments in Duru-Haitemba have worked out rules that clearly defineappropriation and provision and these rules have facilitated improvement in protectionand management of the village forest reserve. The establishment of these rules is inaccordance with the Village and Ujamaa villages Act of 1975 that gives powers tovillages in Tanzania to make rules in the form of bylaws recognized in a court of law(Kihiyo and Kajembe 2000). Before rules were instituted, the village governmentorganized an inventory of the forest reserve to assess and take stock of the resource.Thereafter rules were put in place to control exploitation. One main principle appliedthrough these rules is that the volumes being harvested annually must not exceed themean annual increment realized in the forest.
3.2.3 Collective choice arrangementsAll eight villages around Duru-Haitemba Forest Reserve maintain strong and effectiveForest Committees which are responsible for rule enforcement. The composition of VillageForest Committees has steadily shifted from village leaders to ordinary villagers representingtheir sub-villages. Most decisions concerning the forest are made through, or with theguidance of these committees. This is democratization at the local level which has arisenfrom a growing need for accountability as practical management gets underway (Wily1996). The CBFM approach in most of the eight villages is to adopt a management strategybased upon geographical and political divisions in the village such that, each registeredsub-village looks after that part of the forest to which it is adjacent. Also each villagemanages a part of the forest which had traditionally fallen within its village boundaries.To that effect, demarcation of the village areas has been undertaken, often with disputesresolved by arbitration. The forest has also been zoned in its entirety into sustainable usezones, grazing zones and protection zones all indicating precisely where cattle could begrazed, which areas could not be used at all by the villages, and which areas would beavailable for sustainable use (Wily 1996). With the exception of grazing, villagers use onlythe forest of their own village, which indeed is often the area of the forest that fallswithin their own sub-village.
The village is the obvious active manager of the local forest; it is engaged inpreventing activities that have been declared illegal, issuing a limited number ofpermits for sustainable uses, patrolling and rehabilitating the degraded forest parts.It is crucial therefore that the villages have legal backing to support administrativedecisions on collective choice arrangements through which leaders and ordinary villagershave decided to discontinue any uses which are considered damaging. Thus charcoalburning, tree felling and even grazing in some parts of the forest have been banned.Other forest uses are controlled through strict conservation and protection regimes in

22 MAKING COMMUNITY-BASED FOREST MANAGEMENT WORK
order to ensure that individuals follow the rules. Enforcement by village forest guards ispractised.
These village forest guards protect the forest against both non-villagers and offendersfrom within the village. These are duly selected by each sub-village and operate on apatrolling and reporting regime. Offenders who violate operational rules are subjectedto graduated sanctions; the levels depending on the seriousness and context of theoffence (Ostrom 1996). Offences such as encroachment for agriculture or settlementestablishment, pit sawing, charcoal making and a range of destructive activities carryheavy punishment in the form of a heavy fine or confiscation of valuable property.Lesser destructive activities such as unauthorised firewood collection carry lighterpunishment. Marrow and Hull (1996) also state that graduated sanctions are common inlong enduring common pool resource institutions to allow flexibility in the system.Based on this it is prudent to treat with leniency a person who is normally a rule abiderbut due to dire need has committed an offence. The contrary applies to a frequentoffender who has shown little allegiance to the rule structure of the institution. Theplanning and implementation of most of these forest-related activities in each of theeight villages is through Village Forest Committees.
These committees comprise men and women, with gender representation differingbetween villages (Table 2). The presence of village forest committees and patrolmenhas led to a significant reduction in the number of offences in each village. Thenumber of patrols conducted at sub-village level ranges from one to four per week.Most of the offences at Duru-Haitemba relate to grazing and encroachment forexpansion of farmlands. Respondents also indicated improvement in the relationsbetween forestry staff in the district and local communities as a result of paradigmshift where foresters have changed from policemen to facilitators or technical advisors.
CBFM has improved group cohesion and provided a platform for other developmentactivities in the villages. It has also promoted local capacity by forging new socialrelationships and redefining old ones. Forest management by consent has proved tobe effective and can serve as a model for other parts of Babati District and the country
Source: Field data.
No Village Total number Male Femaleof members
1 Gidas 13 11 2
2 Bubu 9 6 3
3 Ayasanda 9 6 3
4 Endanachan 16 14 2
5 Riroda 12 8 4
6 Endagwe 8 5 3
7 Duru 8 8 0
8 Hoshan 9 6 3
Total 84 64 20
Table 2. Membership in village forest committees in Duru-Haitemba villages

23G.C. Kajembe, G.C. Monela and Z.S.K. Mvena
at large. Indeed, policing the forest reserve by consent was observed in all the eightvillages, where it has created better enforcement of rules. An example of managementby consent was noted through the system of fines that does not spare both patrolmenand ordinary villagers. Patrol teams are exempted from other village communal activitiessuch as local road maintenance and building local schools. However, failure to participateeffectively in patrolling the forest, subjects the patrol staff to a fine just like anyother villager who fails to participate in other development activities.
3.2.4 Conflict Resolution MechanismsIt was observed that, at the village level, local conflicts are resolved throughreconciliation committees. These are recognized by the formal village bylaw and areconstituted at the village level through involvement of village elders who are perceivedas the wise persons in the community. The village chairpersons serve as heads tothese committees. In the event that traditional laws fall short in addressing certainconflicts, formal by-laws are applied. These bylaws must be approved by the Ministerresponsible for Local Governments before they can be operational as per TanzaniaLocal Government Act of 1982 (URT 1982). The resolution of conflicts in the villagesetting is in accordance with the principle that proprietors and their leaders musthave rapid access to low cost local areas to solve conflicts among the proprietors orbetween proprietors and leaders (Ostrom 1996). In the study area the main conflictswere associated with competition for land use between farmland, grazing land andforest land. This involved villagers alone or with outsiders.
3.2.5 Resources users are clearly defined and are able to sustain legalclaims as owners of the resource
Entitlement, the process of a community securing statutory ownership over their localland area, is a fundamental development policy within Tanzania (Wily 1996). The studyfound that all the eight villages in the vicinity of Duru-Haitemba had applied for ownershipof their land that includes the traditional woodland areas. Title deeds have since beengranted and therefore both through statutory local government regulation and throughstatutory entitlement, the eight villages of Duru-Haitemba are legal owners and managersof the Duru-Haitemba Forest Reserve. This has been made possible by the uniqueadvantage Tanzania has over several other developing countries, in that villages inTanzania possess the capacity to be registered as the grassroots’ local level of governmentwithin the decentralized system. Consequently they exist as legal corporate entitieswith ability to sue and be sued and to own business and property as a local community(Wily 1996). Furthermore, a village in Tanzania is usually an integrated socio-spatialunit, with a defined group of households using land and resources only within a bounded,local area. The village has a formally recognized government that is a well-establishedmechanism of self-management and is a workable size for responsive and accountabledecision making in the society.
Therefore villagers in Duru-Haitemba recognize themselves as a bounded localarea, have clearly defined property rights over the resource and can exercise legalclaims over the resource. Therefore they feel secure in their resource ownership andcan protect their land from outsiders. In consequence they have been able to sustainlong term objectives on the resource by investment through their labour and deferment

24 MAKING COMMUNITY-BASED FOREST MANAGEMENT WORK
of current consumption in favour of long-term benefits by banning some consumptiveuses. This is in accordance with Morrow and Hull (1996), who state that having legaltitle to the land is obviously a prerequisite for the villagers to define the boundaries oftheir forests as well as their legal rights to defend those forests. Also, security of tenureis necessary for development and survival of CPR institutions because proprietors haveno incentive to invest in an institution to manage their resources if they believe thoseresources could be invaded by outsiders. If a CPR can be destroyed by the action ofothers, no matter what local proprietors do, even those who have constrained theirharvesting from a CPR for many years will begin to heavily discount future returns(Ostrom 1996).
3.2.6 The right of proprietors to devise their own institutions is notchallenged by external government authorities
Discontent began when the SIDA-funded Regional Forestry Programme introduced effortsto work with villages in and around the forest to encourage them to support gazettementand management of the then proposed forest reserve (Wily 1996). It was clear from theoutset that the local people did not support the withdrawal of their forests into thehands of the government. Consequently they adopted a deliberate move to exploit theforests as fast as possible before its gazettement, such that by 1994 the forest washeavily degraded and encroached in many places.
Government tried to guarantee villagers some use rights but the local response didnot suggest that gazettement would lead to effective conservation of the forest. Exploitingthis potentially explosive situation, and with informal local support from the Babati DistrictCouncil and the local Forest Officer, a consultant working for the SIDA–funded RegionalForestry Programme, started exploring if and how local communities could engage inconservation and management of the forests around them. No one envisaged that villagerswould be enthusiastic and government officials were skeptical. The initial positive responsefrom the local people convinced the government of suspending gazettement, pendingassessment of whether villagers would cooperate and halt degradation of the forest.Eventually it was informally agreed that villagers could proceed, taking the responsibilityof managing and conserving the forest.
Consequently the villagers became the ‘de facto’ controllers and managers of theDuru- Haitemba Forest Reserve. Based on these tentative and informal arrangements,the villagers launched a highly dynamic process of reviewing each and every aspectthe forest management to determine just what was required to restore the forest andto keep it intact for future use. Simple but effective management plans were drawnup by each village, including “rules” for using the forest. Even forest uses that wereconsidered indispensable before now became perceived as damaging and hence werecompletely banned. Village assemblies were convened in which all villagers debatedand refined the plans. It was also agreed by the eight villages that the managementstrategy was to be based on geographical and political divisions in the village suchthat each registered sub-village was to look after that part of the forest to which itwas adjacent. Demarcation of these areas was undertaken, sometimes with disputes.The forest was also zoned into use zones, defining core protected areas, and areas forcontrolled use.
Since then each village has maintained village forest guards to protect the forestfrom non-villagers and offenders from within the village. Today, encroachment, pit

25G.C. Kajembe, G.C. Monela and Z.S.K. Mvena
sawing, charcoal burning and a range of less destructive activities have largely ceasedand the main role of village forest guards is essentially preventing the forest beingused by non-villager’s cattle from adjacent villages. In order to run things smoothly,each village maintains a Village Forest Committee. It has motivated most villagers toparticipate in forest conservation and management. The membership to suchcommittees has steadily shifted from village leaders to ordinary villagers, indicating ahigh level of democratization at the local level. The active involvement of all villagersin managing forests in the eight villages eventually led to the need for legal backingon the administrative rules.
Thus there was a need to review the management plan and rules and changethem into village bylaws. In mid-1995, these plans and rules were formally approvedby the full Babati District Council under the District Authorities Act. Today each villageis officially the legal authority and manager of that part of the Duru-Haitemba ForestReserve that is adjacent to its own settled village.
To a large extent, CBFM in Duru-Haitemba was initiated following local discontent.However, external players played a crucial role to kick-start, guide and facilitate theempowerment process. Imposition of rules by government officials was not possible,giving the community level of empowerment.
3.2.7 Clear asset structureFor a long time, villagers in the eight villages around Duru-Haitemba have dependedon the forest for some basic subsistence needs. Due to this dependence and thebenefits they reap, there are in close ties with the forest which they perceive astheir asset. However, before the inception of the current CBFM, there was nomeaningful asset structure to elicit community participation. Therefore, only verypartial forms of local participation existed. The partial forms of communityinvolvement included permitting local people some use rights to meet some basicneeds, sharing revenue earned by the government or involving local people in somepractical management activities. These measures did not guarantee sustainableconservation and management of the forest resources in the area because thefundamental matter that forms the core of the problem was not addressed. Thisrelates to resource ownership and not participation. This situation calls for the needto clearly define the resource manager and the user in order to mitigate conflictbetween state and local community and reduce divergence in perception of rights. Italso calls for the need to integrate the vested interests of forest users into responsibleconservation by the users.
Thus the introduction of CBFM at Duru-Haitemba Forest Reserve addressed theissue of control and authority on the forest resource and also facilitated restructuringof these to provide the most fundamental of incentives for full and proper responsibilityto conserve the forest. Therefore, the local people were empowered and motivated tomake decisions and to take responsibility of these decisions as main guardians of theforest resource. It is this restructuring which re-defined the asset structure such thatownership of the forest was now in the hands of the local people and through thistransformation the government itself secured a new relationship with the very peopleit earlier considered to be a threat to forest conservation.
This clearly demonstrates that a group of proprietors can develop a CPR institutionif they are confident that the CPR is either theirs or they can exercise clear control

26 MAKING COMMUNITY-BASED FOREST MANAGEMENT WORK
over it. But the benefits to be gained from collective action must be greater than theopportunity cost of organizing it (Marrow and Hull 1996). External agents can promotethis process by reducing costs and increase the benefits of self-organization. Withless control or clear benefits, the proprietors of the resource have less incentive toinvest in communal management regimes (Ostrom 1992).
4. CONCLUSIONThis study leads to the conclusion that it is the devolution, democratization,empowerment and sense of ownership that have induced the local communitiessurrounding the Duru-Haitemba Forest Reserve to invest their labour and time forsustainable conservation and management activities. This is the basis of the presentsituation where the villagers are managing the woodland resources such that a degradedforest has changed into one with boundaries that are intact, incursion is limited, floraand fauna are recovering and the forest is managed and protected effectively atminimum cost. The basis for the observed success is community participation and amarked degree of power sharing, to the extent that communities have taken fullresponsibility and control of the resource. Furthermore the government, as formermanager, has become a technical advisor, facilitator and watchdog. Ultimately villagersactually now legally own the forest reserve. Thus there is clear definition of woodlandresource boundaries, establishment of village bylaws, security of tenure and sense ofownership. A similar model could be adopted in other areas facing similar conditions.
To a large extent the CBFM approach in Duru-Haitemba represents a fundamentalshift in forest management and conservation approaches and is a movement towardsa more democratic civil society. It has potential to enhance the process of shiftingfrom centralized to decentralized forest management; from unilateral, top-downdecision making to a participatory, bottom-up decision making process; and fromexternally imposed rules to self-induced regulatory rules.
The study recommends minimal arbitrary intervention by the external agents inlocal management and tenure systems, while relocating responsibility and accountabilityof forest and other natural resources to individuals, user groups and local communitieswho best understand them and are better placed to manage and conserve themsustainably. More specifically, the role of CBFM need to be recognized; governmentshould play the role of facilitator or technical advisor. Local people should be empoweredto control resources around them through clear legally recognized rules.
REFERENCESAgrawal, A., Britt, C. and Kanel, K. 1999 Decentralization in Nepal. A comparative
analysis. A report on the Participatory District Developing Program. A publicationof the International Centre for Self Governance. Institute for Contemporary Studies,Oakland, California.
Jeanrenaud, S. 1997 Perspective in people in oriented conservation. Aborviate.WWF\IUCN, Gland, Switzerland.
Kajembe, G.C. and Malimbwi, R.E. 1996 The forest agent at the interface: Reflectionson his role in forest plantation management in Tanzania. In: Chamshama, S.A.O.and Iddi, S. (eds.) Management of forest plantations in Tanzania. Record No. 63,118–124. Faculty of Forestry, Sokoine University of Agriculture, Morogoro, Tanzania.

27G.C. Kajembe, G.C. Monela and Z.S.K. Mvena
Kajembe G.C. and Kessy, J.F. 1999 Joint forest management at Urumwa Forest Reserve,Tanzania: A process in the making. Paper presented at a Seminar and Workshop onGovernance, Property Rights and Rules on Woodland and Wildlife Management inSouthern Africa, Harare, Zimbabwe, November 23–24, 1999.
Kihiyo, V.B.M.S. and Kajembe, G.C. 2000 The Tanzania Ujamaa policy: Its impact oncommunity based forest management. In: Gombya - Ssembajjwe and Banana, A.Y.(eds.) Community-based forest resource management in East Africa. MakerereUniversity, Kampala, Uganda, p 34 - 45.
Mvena, Z.S.K. and Kajembe, G.C. 1997 The study on community based forest managementfor Makete. Final report submitted to HIMA–Makete. Forconsult, Faculty of Forestry,Sokoine University of Agriculture, Morogoro, Tanzania.
Marrow, C.E. and Hull, R.W. 1996 Donor initiated common pool resource institutions:The case of the Yanesha Forestry Cooperative. World Development Vol. 24 No. 10:1641–1657.
Ostrom, E. 1992 The rudiments of a theory of the origins, survival, and performance ofcommon-property institutions. In: Bromley, D. (ed.) Making the commons work:Theory, practice and policy. Institution for Contemporary Studies, San Francisco.
Ostrom, E. 1996 Governing the commons: The evolution of institutions for collectiveaction. Cambridge University Press, Cambridge.
United Republic of Tanzania (URT) 1982 The Local Authorities Act (District and UrbanAuthorities). Government Printer, Dar es Salaam, Tanzania.
Wells, M. 1992 Biodiversity conservation. Affluence and poverty. Mismatched Costs andBenefits and Efforts to Remedy them. Ambio vol. 21 No. 3: 237–243.
Wily, L.A. 1995 Collaborative forest management (villagers and government): The Caseof Mgori Forests, Tanzania. Orgut Consulting AB and Forest Action Network, Nairobi,Kenya. 31p.
Wily, L.A. 1996 Community based natural forest management. The case of Duru-Haitembaand Mgori Forests in Tanzania. World Bank/UNEP Africa Forestry Policy Forum,Nairobi, Kenya. 19p.

4.Local organisations and natural resourcemanagement in the face of economichardships: A case study from Zimbabwe
B.B. Mukamuri, B.M. Campbell and G. Kowero
ABSTRACTIn this study, participatory rural appraisal tools were employed in three smallholderfarming areas of Zimbabwe to investigate perceptions about organisations, and thefactors driving organisational change. In 1991 Zimbabwe embarked on the EconomicStructural Adjustment Programme (ESAP) that encompassed wide-ranging economicreforms. Local people in the study areas linked many of the current hardships to ESAPand to the drought of 1991/92. The economic hardships were seen as the reason forthe collapse of community endeavours and the increasing move away from the extendedfamily. The reform measures have also negatively impacted on the state organisationsoperating in the rural areas, including those related to agriculture and natural resourcemanagement. Traditional institutions have eroded, but it is suggested that they stillremain the focus for management of natural resources.
Key words: Institutions, organizations, woodland management, local values,economic reforms.
1. INTRODUCTIONInstitutions can be defined broadly as ‘regulatory systems of formal rules, regulations,informal agreements, norms of behaviour and organisations’ (Harriss 1982). To understandnatural resource use, a key entry point for enquiry is institutional analysis, as is indicatedby the burgeoning of the literature on this topic in the 1990s (e.g. North 1990; Ostrom,1990; Murphree, 1994; Richards, 1997; Arnold, 1998). Seidman (1992) argues thatgovernance structures or organisations are critical to the study of natural resources asthey define the context within which management is effected. The recognition that

29B.B. Mukamuri, B.M. Campbell and G. Kowero
institutions change, develop or evolve, and that such change affects the performanceof society, is pervasive in the literature (e.g. Eggertsson 1990; North, 1990; Ostrom,1990; Peluso, 1993; Angelsen, 1997). Given the promise of devolving rights andresponsibilities for natural resources to local people (e.g. Chambers 1983; Christoffersonet al., 1998; Western and Wright, 1994), an understanding of local institutions and howthey change is pivotal to our ability to facilitate local empowerment.
In this case study we describe local organisations, including the arms of centralgovernment operating at the local level, in three sites in rural Zimbabwe. The focus inthis study was on those organisations that play a role in the management of naturalresources, in general, and woodlands, in particular. The effectiveness of thoseorganisations in the 1990s was assessed, as perceived by rural communities. Thefactors influencing the current state were then elicited. In the context of rural areasin Zimbabwe, our hypothesis was that the economic reform policies of the 1990s haveprecipitated negative institutional change. Some of the possible driving forces ofsuch change include increased unemployment (thereby reducing remittances to ruralhouseholds), reduced government expenditure on social services and increased costof living (Chipika and Kowero 2000, Oni, 1997; World Bank, 1996). We end the paper bylooking at the potential of local organisations to manage natural resources.
The Government of Zimbabwe, assisted by the World Bank and the InternationalMonetary Fund, introduced an economic structural adjustment programme (ESAP) in1991. The emphasis of ESAP was on decontrolling the economy, reducing governmentdeficits and creating incentives for the manufacturing sector. All these measures wereexpected to increase economic growth and alleviate unemployment (World Bank 1996;Oni 1997; Chipika and Kowero 2000). The economic reforms have had mixed results onthe economy. For example, reforms have had negative impacts on those organisationsthat have traditionally relied on central government funding, as exemplified by theeducation and health sectors. The reduction, and in some cases, complete removal ofsubsidies, have led to increased costs of food, agricultural inputs and transportation,amongst others, a situation compounded by the devaluation of the Zimbabwean currency.The 1990s have also been marked by rising unemployment.
Economic reform policies which have been implemented in Africa have notnecessarily improved the well-being of the local people, organisations and sustainablemanagement of natural resources (Redclift 1984; Timberlake 1985; Anderson and Grove1987; Reed 1993). Many studies have focused on the economic impacts of the reformmeasures on various aspects of livelihoods, but less attention has been directed towardsassessing the effect of the reforms on organisations associated with natural resourcemanagement.
2. STUDY AREASThe work was conducted in three communal areas in Zimbabwe, communal areas beingthe areas where the majority of smallholder farmers are concentrated. The study areasare Chivake Ward in Mangwende, Ward 18 (Tawanda Village) in Chivi and MapirimiraWard in Hurungwe. The Hurungwe and Mangwende communal areas, with mean annualrainfall over 800 mm, are suited to intensive agricultural production, though, to achievegood crop yields, high inputs of fertiliser are required for the sandy granite-derivedsoils. Chivi has low agricultural potential because of low (650 mm) and variable rainfall,and is ideally suited to ranching and irrigated agriculture. The soils are also largely sandy

30 LOCAL ORGANISATIONS AND NATURAL RESOURCE MANAGEMENT IN THE FACE OF ECONOMIC HARDSHIPS
and of low fertility. The three sites differ in their proximity to Harare, the capital city ofZimbabwe. Mangwende is 80 km to the northeast of Harare, Hurungwe is 350 km to thenorthwest, and Chivi is 360 km to the south. Harare represents a source of employmentand of inputs for farming, and a large market for agricultural produce.
The miombo woodland is the natural vegetation in these three communal areas.This woodland type is found throughout south central Africa (Campbell et al. 1996). Inmost communal areas in Zimbabwe, much woodland has been cleared for cropproduction, and the remaining woodlands are largely restricted to the grazing areasand to the more inaccessible and rocky areas, where crop production is not possible.
3. METHODSOur research utilised participatory rural appraisal (PRA) techniques to elicit perceptionsabout effectiveness of organisations, changes in this effectiveness and drivers ofsuch change. PRA groups based on age and gender were formed so as to limit thedomination of certain groups during the group work.
We derived a measure of effectiveness of organisations in a ranking exercise,where the villagers ranked the organisations working in their areas according to theirperceived contribution of the organisations to livelihoods, the mobility and presenceof the organisations in the areas and the extent to which the organisations wereinvolved in natural resource management. The scores were on a scale of 0 to 10. Anorganisation scoring zero is one whose presence is not felt in the area and is alsodoing minimal work in promoting natural resource management, while that scoring 10has a strong presence and is doing work on natural resource management that isgreatly appreciated by the local communities. Interviews were also conducted withrepresentatives of all the relevant organisations.
4. THE ORGANISATIONS PRESENT AT THE LOCAL LEVEL
4.1 Agriculturally-oriented organisationsAgriculture is a central activity of most rural households in Zimbabwe. In addition, landclearance for agriculture is one of the prime determinants of woodland cover (Campbellet al. 1993), while livestock are central to the farming system and graze in the woodlands(Scoones and Wilson 1988). Cattle are important for draft power, cash, manure and othersocial goods. Thus, it was necessary to give attention to the Department of Agricultural,Technical and Extension Services (AGRITEX) and the Department of Veterinary Services,both state organisations in the Ministry of Lands and Agriculture. Of the parastatal institutions(owned by the state but with some degree of autonomy) the important ones for agricultureare the Agriculture and Finance Corporation and the Grain Marketing Board. In addition,there is the Zimbabwe Farmers Union, a non-governmental organisation (NGO).
AGRITEX has a mandate, in communal areas, to provide extension services to allfarmers (Moyo et al. 1991). It has an extension worker in all the wards visited duringthe research activities. Each extension worker works with 800-1000 households.
The Department of Veterinary Services is tasked with undertaking livestock census,dipping and treating livestock, and mounting awareness campaigns for livestockdiseases. At the local level, provincial and district officers, as well as a number ofdipping attendants and their assistants, represent this organisation.

31B.B. Mukamuri, B.M. Campbell and G. Kowero
The Agricultural Finance Corporation provides credit to commercial and communalfarmers. The Grain Marketing Board enjoyed a monopoly to handle, grade, transport,store and dispose of all maize up until 1991, when grain marketing was liberalised, asrequired by the ESAP policy. Numerous private crop buyers are now operating in all thestudy areas.
The Zimbabwe Farmers Union is a federation of market-oriented farmers incommunal and resettlement areas. It has been involved in negotiating for land toresettle thousands of families, and for rights of squatters to live and graze theircattle on privately owned farmland. In recent years, the Union has been advocatingthe establishment of private tenure in communal areas. It also negotiates officialgrain-prices on behalf of smallholder farmers. The Zimbabwe Farmers Union has supportfrom the government because of its national and political character.
4.2 Environmentally-orientated organisationsTwo organisations are identified as having a focus on the environment, the NaturalResources Board (NRB) and the Forestry Commission, both under the Ministry of Mines,Environment and Tourism. The Natural Resources Board oversees conservation of thecountry’s natural resources. Its mandate includes trees, soil erosion control, siltation,waterways, rivers, and dambos. The Board’s approach to resource management hasoften conflicted with local needs and knowledge (Mukamuri 1995; Sithole and Bradley,1995). In the areas studied, the Board is represented by officials based at the districtoffices.
The Forestry Commission is a parastatal organisation responsible for the nation’sindigenous and exotic forests. In terms of extension, the Commission has been relyingheavily on trained foresters. It often only has a single officer covering an entiredistrict.
4.3 Community development organisationsThere are a number of organisations that have broad community developmentmandates: the District Development Fund (DDF), Village Community Workers and VillageDevelopment Committees (VIDCOs). The District Development Fund is a localgovernment organisation, responsible for rural infrastructure development, includingdistrict roads, dams and boreholes. The main funding for this organisation comes fromthe central government. Prior to 1990, the District Development Fund had beensupporting forestry-related activities like tree planting. During the mid-1980s, it waspraised for the well-maintained and fast expanding rural road network.
Village Community Workers fall under the Ministry of Community Development andSocial Affairs. All villages in the three study areas had one Village Community Worker.Their duties include extension on primary health care, hygiene, and family planning,and organising rural women to form co-operatives and self-help groups.
Rural District Councils, under the Ministry of Local Government and RuralDevelopment, administer all communal areas in Zimbabwe. At present there is a majorprogramme to devolve power to these Councils. A number of wards make up a district,and the wards are subdivided into villages. The Village Development Committee (VIDCO)is the lowest development-planning unit in the district (Mukamuri 1995). In the 1980s,the Zimbabwe government introduced the concept of the VIDCO as the link between

32 LOCAL ORGANISATIONS AND NATURAL RESOURCE MANAGEMENT IN THE FACE OF ECONOMIC HARDSHIPS
government and local people. Representation on the VIDCO has been based on ademocratic voting system. However, the structure has suffered from a prolongedlegitimacy crisis, primarily because of the confusion between VIDCOs and politicalparty structures. In addition, there have been conflicts between VIDCOs and traditionalorganisations. Ethnic divisions among households within the villages have compoundedthis crisis, with immigrants generally supporting the VIDCOs while ‘locals’ supportedthe traditional structures. Consequently, VIDCOs have failed to operate in many partsof the country.
4.4 Traditional institutionsThe traditional institutions identified in the study areas are families and households,kraalheads (the lowest level of leadership within the traditional system) and chiefs. Inaddition there are traditional peasant groupings for community work, locally known asnhimbe.
Prior to modernisation and urbanisation, households largely depended on thebroader extended family and the society at large for social protection and support forlife-sustaining activities. Modernisation introduced and raised the significance of wagelabour and this made peasants take up urban employment as a source of income.Remittances became part of the urban and rural sector’s mutual existence. Remittancesplayed key social roles, particularly in the education of family members as well asfacilitating the accumulation of the vital livestock capital and facilitating investmentsin farming (Bourdillon 1985; Scoones and Wilson 1988). Individuals, households, familiesand clans lived in harmony with each other, as well as with the spirits and the environmentat large.
In terms of natural resource management in rural Zimbabwe, traditional chiefsand kraalheads have for the past two decades been greatly marginalised. This hascaused disharmony among traditionalists and ‘modernists’, as well as causingdifficulties for local level resource management and development (Mukamuri 1989). Atpresent, the government is planning to revert to some elements of the traditionalstructure, but that too may have problems, as the VIDCOs have become entrenchedwithin some sections of the rural communities. This is particularly the case withimmigrants that do not align themselves with the traditional structures and see theVIDCOs as a means for them to guide development.
Traditional chiefs played significant roles in keeping communities together.Their mandate included: protecting the communities from negative outsideinfluences, ensuring that productivity and fertility of the land was maintained, co-ordinating rain-making ceremonies, and guarding and maintaining territorial sacredplaces and shrines, thereby ensuring harmony between ancestral spirits andterritorial cult centres. Contrary to popular belief, the chiefs were not alwaysdictatorial. They worked through a chain of deputies that included headmen andkraalheads. The headman often controlled a clan or lineage, with different clansmaking up a tribe. The kraalhead controlled what could be called an extendedfamily or a village, comprising closely-related people. People from other areasthat were not necessarily related to the ruling lineage also lived within the villages.However, outsiders were obliged to respect and pay allegiance to the institutionalarrangements in the village.

33B.B. Mukamuri, B.M. Campbell and G. Kowero
4.5 Religious organisationsWe categorised religious organisations into two main types: independent churches(like Zionists and Born Again Christians) and formal churches (like the Roman Catholic,Salvation Army and Methodist Churches). There were at least a dozen independentchurches in the three study areas and seven formal churches.
The independent churches have dominated the African religious landscape fromthe early part of the twentieth century. Like their traditional religious counterparts,independent churches have developed, waxed and waned, and incorporated new beliefsand practices. They are charismatic and largely centralised in terms of leadership.Their focus is largely based on their perception of social, economic and material needs.
5. EFFECTIVENESS OF THE ORGANISATIONSOf the organisations ranked for their effectiveness in the PRA exercise, the ZimbabweFarmers Union, the Department of Veterinary Services and the Natural Resources Boardwere consistently ranked low (Table 1). At the other extreme, the organisationsreceiving high ratings were the District Development Fund, the Village DevelopmentCommittees (VIDCOs) and the traditional organisations. The other organisations weregenerally rated low, often only being rated high by one gender group in one study area.
The low scores were mostly a result of the lack of presence of the organisations inthe areas, which leads to ineffectiveness in carrying out their mandates. This appliedto AGRITEX, the Natural Resources Board, Veterinary Services and Forestry Commission.Respondents decried the lack of co-ordination amongst government organisations.
The farmers argued that Veterinary Services was doing absolutely nothing to controllivestock deaths, particularly those of cattle. In Mangwende and Chivi, farmerscomplained that they were being asked to pay cash for livestock treatment, and thatthe dipping tax for cattle has been increased. The Department of Veterinary Serviceslacks the resources to monitor all parts of the study areas, because of reduced budgetsfor transport and insufficient allowances for its staff.
Farmers claim that the Zimbabwe Farmers Union does not have local representationand that their money is being paid to an organisation which ‘does nothing’ to facilitateaccess to land and credit. The role that the Union plays in the national land policydebate is not apparent to the farmers in the communal areas.
Farmers in Mangwende complained about the lack of presence of the NaturalResources Board in the area, while those in Hurungwe complained that staff of theBoard were hardly seen despite the depletion of woodlands in the area. In Chivi, thelow scores given the Board were related to the ban by the Board on riverine andwetland cultivation. Such areas have been traditional farming areas for mosthouseholds, with rice and vegetables grown on wetlands for centuries (Wilson 1990).The ban on wetland cultivation has been disparately enforced in different parts of thecountry.
In interviews with key staff of the Natural Resources Board, lack of transport,insufficient allowances and reduced funding for audio-visual services were cited asreasons for their reduced effectiveness. Field staff largely depend on transport providedby well wishers, friends and other government departments. Many parts of the studyareas go without visits for long periods of time, and cases of environmental destructionreceive inadequate investigation. Morale is very low among the Board staff operatingat the district level.

34 LOCAL ORGANISATIONS AND NATURAL RESOURCE MANAGEMENT IN THE FACE OF ECONOMIC HARDSHIPS
AGRITEX generally scored very few points among most of the communities thatwere interviewed. Reasons given for this included the following.
• In recent years, the Extension Services appears to have abandoned its wideoutreach mandate and opted for a group approach. The narrow group focus hasearned AGRITEX animosity among large sections of the farmers who participatedin the PRA activities.
• AGRITEX extension staff made very few visits to the majority of farmers.• AGRITEX focused only on ‘small groups of organised and rich farmers’.• Farmers alleged that they are being forced to join group gardens rather than
maintain individual gardens. The former are believed by the Extension Servicesand the Natural Resources Board to be environmentally friendly, to facilitate thedissemination of extension advice and visits, and to be more convenient tomonitor and control. Local women complained that group gardens lack privacyand cause difficult pest control problems. The poor often find it difficult tomake the necessary contributions for membership, fencing and pesticides.
Interviews with AGRITEX extension agents highlighted a big drop in the level ofmileage allocated to the officers, from about 1000 km/month in 1985 to about 200 km/month in 1996, due to reduced budgets. In the mid-eighties, all extension agentswere provided with motorcycles on a hire-purchase scheme and this greatly facilitatedtransport, even to remote villages. However, during the 1990s no motorcycles weremade available to newly-recruited extension agents, making them rely on bicyclesthat confine them to areas close to their homes.
AGRITEX has recently adopted a ‘participatory extension approach’. The methodviews farmers as being informed and capable of making rational decisions aboutenvironmental and agricultural issues (Chambers 1983). However, participatory extensionappears to have been adopted for different reasons. Extension agents saw the role for‘participatory development’ as allowing the reduction of extension visits to individualfarmers and the concentrating of efforts on groups of farmers. This implicitly abandonsor marginalises farmers who are not willing or capable of joining organised farminggroups. Reduced public funding for agriculture and conservation extension was mentionedas key reasons for the adoption of participatory extension methods. Very few extensionagents and their officers who were interviewed believed in empowering farmers. Themajority of the agents did not believe that farmers were capable of self-development.
The reasons advanced by farmers for the low ranking of the Grain Marketing Boardincluded the following.
• The Board no longer provides guaranteed transport for crops from the farmgate.
• The Board does not buy the grain soon after harvesting.• There is corruption within the Board, in terms of grading the crops it receives.• There are serious delays in payments.• There are now many other participants involved in grain marketing, some of
whom out-compete the Board.
It would appear that the agriculturally-oriented organisations (AGRITEX, theDepartment of Veterinary Services and the Zimbabwe Farmers Union) and theenvironmentally-oriented organisations (the Forestry Commission and Natural ResourcesBoard) are either very thin on the ground or completely not visible to the local

35B.B. Mukamuri, B.M. Campbell and G. Kowero
communities. The Village Community Workers were ranked very low on environmentalissues (Table 1).
Table 1. Effectiveness of organisations as indicated by local people’s ranking of theorganisations in PRA exercises*
Mangwende Chivi HurungweOrganisations Type Male Female Male Female Male Female
1. Agriculturally-related
AGRITEX State 0 9 2 2 0 2Veterinary Services State 0 0 0 0 - 0Agricultural Finance Parastatal 0 0 - - 9 0
CorporationGrain Marketing Board Parastatal 2 4 2 1 0 0Zimbabwe Farmers Union NGO - 0 0 0 0 0
2. Environmentally-related
Natural Resources Board State 1 0 0 0 0 0Forestry Commission Parastatal 2 8 0 0 - 0
3. Community Development
District Development Fund State 7 0 10 - 8 4Village Community Workers State 3 - - - 3 -
VIDCO State 7 6 5 6 1 0
4. Traditional
Chief 9 10 - 8 - 7
Kraalheads1 10 8 8 7 - 5
5. Religious
Independent 10 10 9 8 7 8
Mainstream 7 10 10 6 10 9
* The values are average values, each for male and female groups, where 0 indicates highly ineffective and 10 indicates highly effective.1 Leaders of clans (the lowest level within the traditional system).
If the Village Community Workers were given more training in social andenvironmental issues, they would probably be more effective, given their closeassociation with villagers. Unfortunately, they are very poorly paid, and this reducesmorale.
Overall, community development and traditional organisations appear to be morepopular with the local communities than the sectoral government organisations. Thehigh opinions of the District Development Fund were related to their widespread activityin infrastructure development.
VIDCOs appear to be highly regarded by the communities in two of the three studyareas (Table 1). However, the VIDCOs do not appear to have been much involved with

36 LOCAL ORGANISATIONS AND NATURAL RESOURCE MANAGEMENT IN THE FACE OF ECONOMIC HARDSHIPS
environmental concerns. Furthermore, there does not appear to be a good linkagebetween these organisations and the various government officers in the areas.
The traditional leadership was generally ranked high, but some problems wereraised during discussions. The slightly lower ranking in Hurungwe was because peoplewere not happy with the kraalhead, whom they accused of ‘selling grazing areas.’ InChivi and Zvishavane, the local chiefs were reported to be monopolising key resourcesat the disadvantage of immigrant groups (Mukamuri 1989). The interviews conductedseemed to suggest that, in the past, chiefs, headmen and kraalheads maintained andenforced social and environmental rules and that those who violated the regulationswere tried and reprimanded. The dominating fear was that if society would breakdown, then the ancestral spirits would be angered and would retaliate by punishingindividuals and the whole community. The ancestral punishment would come in theform of diseases, pestilence, poor harvests and drought. Local people still have respectfor traditional structures, which are viewed as the link with the spirits of the land, andthe traditional structures are probably the most important of all organisations inmaintaining some degree of control over resource use. The nostalgic view thattraditional leaders are guardians of land and local interests is, however, not alwaysapplicable, as can be seen in the examples whereby the leaders use the resources fortheir own gains.
Both independent and formal churches were ranked high, for their contribution tosocial aspects of rural life. However, it was noted that the churches did not covermany issues related to natural resources. This differs from other areas of Zimbabwe,where, for instance, the Lutheran and Catholic churches have made notablecontributions to environmental issues. The capacity of the churches to assist localcommunities is largely dependent on the financial resources the particular churcheshave, most of which are derived from the communities themselves. Given the socio-economic hardships local communities are presently experiencing, churches have begunprioritising on the aspects and nature of assistance they can render.
6. DIFFERENCES IN PERCEPTIONS BETWEEN MEN AND WOMENABOUT ORGANISATIONS
For a number of organisations, men and women’s rankings and perceptions differedsubstantially due to their different experiences with these organisations or due totheir different roles in the household. For example, in Mangwende, women ratedAGRITEX and Forestry Commission very highly, in contrast to men. The high scoreAGRITEX obtained is linked to the extension advice women obtain for marketgardening, an activity which is a major source of income and livelihoods in the area.Women are less likely to get formal employment and they engage in market gardeningin order to raise cash. The high score for the Forestry Commission is linked with thegum plantations which the Commission is actively involved in establishing. Womenin the study area regard gum trees as a major source of firewood and fencingmaterials.
Some women alleged that there was a gender bias in the allocation of loans,consequently ranking the Agricultural Finance Corporation low. This was particularlynoticeable in Hurungwe where women gave a score of zero to the Corporation whilemen gave it a score of nine. The explanation was that most of the loans provided bythe Corporation have been directed to activities which males dominate, such as cotton,

37B.B. Mukamuri, B.M. Campbell and G. Kowero
maize and sunflower production, whereas women’s agricultural activities, likegardening and groundnut production, have not been priorities for the Corporation.
In all sites women seemed to rank the activities carried out by the DistrictDevelopment Fund lowly (scores varying from 0 to 4) while men ranked the sameorganisation highly (scores ranging from 7 to 10). Men apparently give high value togood roads, which enable them to transport their agricultural products easily to themarkets. Women found the organisation lacking because it did not do enough withrespect to borehole provision for safe drinking water and watering vegetables.
The Village Community Workers were ranked low by men’s groups in all the studyareas because of their role in distributing contraceptive pills that are seen, by men,as being associated with promiscuity among women. It appears that the actual role ofthe Village Community Workers was not well understood.
7. INSTITUTIONAL CHANGE AND THE FACTORS DRIVING CHANGEThere have been definite changes in the organisations since the 1980s, and many ofthe local norms and informal rules have come under pressure. Many of these changesare believed by local people to have been brought on by the ESAP policies and the veryserious drought in 1991/92.
From discussions with the staff of the agricultural organisations on the ground, itwas noted that most state organisations have scaled down their activities since themid 1980s, but this was more dramatic during the period of economic reform policiesin the 1990s. These reforms have reduced government expenditure, in addition toencouraging privatisation (e.g. of grain marketing). Consequently, the centralgovernment and parastatal agricultural organisations have a very weak presence inthe study areas and a lower image on the ground in the 1990s as compared to the1980s. Some of the changes that have occurred as a result of budgetary cuts or reducedsubsidies include late payment of farmers by the Grain Marketing Board, less farmgate collections of marketed products by the Grain Marketing Board, reduced loansavailable to communal farmers from the Agricultural Finance Corporation, reducedvisits by AGRITEX staff to farmers and more group-based extension (under the guiseof the ‘participatory extension approach’). In general, the most affected componentsof the work of governmental and parastatal organisations are those related tointeraction with local people, e.g. foot patrols, farmer visits and promotion ofenvironmental awareness. Most of the extension and field agents who were interviewedhighlighted increased use of informal means of transport. Extension staff increasinglyschedule their meetings as part of meetings organised by other organisations. Undersuch circumstances extension work is becoming extremely difficult to plan and executeand the quality of work is drastically affected.
While government organisations have been collapsing, independent and formalchurches have gained considerable prominence in the lives of the local people. Churchesand traditional institutions have the advantage of a large and wide following, as opposedto the poorly-funded government organisations. Most of the churches were highlyappreciated with respect to their social programmes, but the farmers rated them low intheir contribution to environmental issues. In general, the churches introduce conceptswhich often are in contrast with those concepts embraced by traditional institutions, aserious situation for resource management as the traditional organisations often play apositive role in this regard. For instance, in their negative attitudes towards the belief

38 LOCAL ORGANISATIONS AND NATURAL RESOURCE MANAGEMENT IN THE FACE OF ECONOMIC HARDSHIPS
in spirits and the spirit world, churches undercut traditional conservation systems forspecific trees and woodlands (see also Mandondo 1997). In Chivi, an NGO, the ZimbabweInstitute for Religious Research and Ecological Conservation (ZIRRCON), has incorporatedtraditional religious beliefs into an environment-religious management strategy ormovement. At present ZIRRCON is running an impressive project whose extensionprogramme on natural resource management is directed towards independent churches,traditional leaderships and other religious groups. If the ZIRRCON strategy succeeds,then it is important to evaluate how religious organisations can be mobilised to contributeto natural resource management.
All the informants in the study areas seemed to recognise the decline of thelarger extended families and highlighted the nucleation of households. People havebecome increasingly concerned with producing and consuming within the nuclearhouseholds. Cultural values concerning the relationship between parents and newlymarried couples were also reported to be causing conflict, particularly in the 1990s.For example, in the past, daughters’ in-law that were recently married could share thesame kitchen with the husband’s parents until they could sustain themselves.Informants mentioned that this practice had dramatically decreased because of theharsh economic conditions. Newly-established couples were given their ‘kitchens’ (i.e.made self-reliant) within a few months of marriage.
Old women believed that the emerging tensions within local communities andextended families were largely centred on scarce financial and food resources, whichin turn are consequences related to the drought and ESAP. The picture these informantspainted is that the extended African family, as well as close family ties, are graduallycrumbling because of socio-economic pressures.
Respondents reported that differentiation amongst households was promoted byESAP; many believed ESAP was ‘for the rich to get richer’. Differentiation is particularlymarked between those households that have cattle and farm implements and thosethat do not have these resources.
Clusters of households or the entire village used to form the basic labour orsafety nets for households. Reciprocal work parties were often organised around clustersor families. Both rich and poor households participated in each other’s labour parties.Money or goods did not form the basis for the labour or work parties; rather it wasmutual help that was significant. Increased wage labour, greater socio-economicdifferentiation and heightened social disharmony have contributed to decline inreciprocal work parties in the study sites. It was reported that both rich and poorfarmers were no longer prepared to work together if there were no direct materialbenefits. Most informants said that they started noticing the decline in reciprocalwork parties around the turn of the decade. Extra labour for weeding is now largelyorganised through hired labour instead of being freely available through work parties.In Chivi, specific forms of reciprocal work parties remain during winnowing, but thisis largely in areas where people still grow millet and ‘if the farmer in question is lucky,socially respected or powerful.’
Community conservation work had been institutionalised in many localcommunities. However, like the reciprocal work parties, community-based conservationwork was reported to have seriously declined in all study areas. The apparent reasonis that rural people nowadays expect to be paid for whatever work they do. Interviewsrevealed that, during the past decades, local people used to do conservation workwithout direct payment. For example, between 1969 and 1973, people in Hurungwe

39B.B. Mukamuri, B.M. Campbell and G. Kowero
did conservation work that included damming a gully and planting trees in villagewoodlots. However, they now prefer to plant trees in individual home plots. Theinformants mentioned that, as a village, they no longer had time to do any conservationwork. Other members of the community in Hurungwe also said that they were nolonger interested in doing things whose benefits they were not sure of getting. It wasalso apparent that the style of local leadership also discouraged many people in jointconservation work.
In recent years, traditional regulations that seek to protect sacred trees andwoodlands have been negatively affected by the difficult economic conditions. Thedecline in respect towards traditional regulations is largely due to the emergence ofnew livelihood strategies to cope with economic problems. For example, in someareas unemployment is causing many youths to turn to wood carving for tourists as asurvival strategy. In the process the youths violate traditional rules by felling sacredtrees. Sale of fruits from the natural forests was traditionally unacceptable. Interviewscarried out in Mangwende indicated that, starting in 1993, local people noted theemergence of marketing of Uapaca kirkiana fruits. In nearby, Mutoko District, localswere marketing a cake and syrup derived from Parinari curatellifolia. In Hurungwe,discussion groups mentioned an increase in the marketing of Syzygium cordatum fruit.Children and women were identified as the key actors in the trade. In Chivi, localwomen were engaged in the marketing of an alcoholic product from Sclerocarya birrea.Some households were also reported to be exchanging the product for labour in theface of traditional rules that forbid the use of alcohol in any exchange relationship.Traditional rules and regulations with respect to woodlands appear to be under pressurefrom many angles, mostly as a result of the commercialisation of the resources.
In Mangwende and Hurungwe, most retrenched workers resorted to cultivatingland formerly set aside for grazing, as well as farming in riverine areas. Groupdiscussions highlighted that most of the people coming from towns do not have anychoice but to cultivate any open piece of land they can get. In the study areas, thereis a lot of sympathy for the returning retrenched workers and other unemployedpeople. The common expression was that ‘We can do nothing about the unlawfulpractices because the people doing it are our children and we would not want themto starve’. In Chivi, young families had not encroached on grazing land, but thenewly married men said they would do so if the government did nothing to solve theacute land shortage. Some of the land pressure is linked to lack of employmentopportunities. In all study areas, unemployed school leavers, whose option for aliving is mainly based on the local woodland resource, were experiencing severe landshortage. Many of them became engaged in activities such as gardening, brickmoulding, sale of building poles and building mud huts, all of which require clearanceof land and/or the use of the woodland.
Economic hardships, land shortage and unemployment have rendered the traditionalleadership with no choice but to turn a blind eye to some unacceptable and non-sustainable land-use practices. Some village elders were of the view that if they donot allow the young families to open any piece of land available, then they would havethe burden of feeding them.
Land grabbing and unlawful expansion is not only affecting the traditional leadersin the study areas. Councillors and VIDCOs are even more powerless because they fearthat if they interfere they might lose votes during elections. The traditional leaderswould appear to be in a better position to control or reduce the unlawful practices,

40 LOCAL ORGANISATIONS AND NATURAL RESOURCE MANAGEMENT IN THE FACE OF ECONOMIC HARDSHIPS
given their popularity with and more knowledge of the communities. However, itwould appear that traditional leaders put the immediate needs of their people first,rather than the conservation of natural resources.
Some consideration was also given to the increasing prominence in the society ofAIDS. Many respondents reported increased deaths due to AIDS-related diseases.Illnesses and death are calling for more resources to be diverted towards health andfuneral costs, as well as increasing pressures on an already stressed rural health sector.We believe that increases in illnesses and deaths are changing social relationshipswithin communities and households. Traditions with respect to death and the attendanceof funerals are also changing.
8. CONCLUSIONSLittle and Brokensha (1987) identify four factors that are likely to affect the nature oflocal resource management: (i) shifts in the formal locus of decision making; (ii)wealth distribution; (iii) market linkages, and (iv) demographic pressure. Theirframework is highly applicable to the situation in our study areas, but we interpret‘demographic pressure’ more broadly as ‘resource scarcity’ which could be due toreasons other than demographic pressure (e.g. increased commercialisation of resourcesand past land alienation policies).
Little and Brokensha’s (1987) first point concerns the shift in the locus of power.Because of shifts in power between traditional structures and the new state-sponsoredorganisations (e.g. VIDCOs at the lowest level), considerable ambiguities have arisenover who has control of the commons. There has, however, been a positive shift in thelocus of power, from the central government to more local arms of government.However, this has come at a time when the fiscal resources of the state are highlyconstrained, thus debilitating the functions of the state.
The second point of Little and Brokensha (1987) relates to differentiation. Wherecommunities are highly differentiated, the visions about resource use between poorand rich may not be compatible, creating problems for local organisations and localinstitutional development (Uphoff, 1986; Hobley and Shah, 1996). Differentiation withincommunities appears to be increasing, apparently as a result of the recent changes inmacro-economic policies. This has probably had impacts on community institutions,such as reciprocal work arrangements and community work parties.
Little and Brokensha’s (1987) third point concerns market linkages. The emergenceof market values for common property resources often leads to problems of over-exploitation, brought about either by the arrival of outsiders (with different values)to exploit the resource or the need by the very poor to exploit the resource for cash(see also McElwee 1994; Richards 1997). With the decline in the national economy,people are becoming more money sensitive and more orientated towards materialbenefits. Many households appear to have shifted their attention to woodland resourcesto raise cash, and thereby have gone against traditional institutions limiting suchmarketing of resources. At the family level the extended family concept and closefamily ties are also eroding fast, and children are being made self-reliant at an earlierage than in the past. While commercialisation pressures have sometimes promotedpositive responses from communities or user groups, or have had minimal impacts onlocal controls (McElwee 1994; Richards 1997; Agrawal and Yadama 1997), such patternshave not been recorded in our study areas.

41B.B. Mukamuri, B.M. Campbell and G. Kowero
The fourth point relates to resource shortages. Such shortages create tensions andconflict that local organisations may not be able to resolve. In the study areas, this isseen in terms of land allocation and in-migration, and the use of woodland products forcash income. There are many studies that show similar patterns, though it is alsopossible that resource shortages stimulate the resurgence of local control (Agrawal andYadama 1997). In Zimbabwe, resurgence has largely not occurred, though some RuralDistrict Councils have implemented by-laws, the efficacy of which has not beeninvestigated.
Overall, the findings of this study do not reject the hypothesis that the economicreform measures have initiated negative institutional change at the local level. However,this study must be seen as exploratory, given the perennial problems betweengovernments and local people, problems that may be colouring the views expressed bythe local people. We suggest that the economic decline has diluted traditional valueswithin the local communities, values that are important for natural resourcemanagement. Furthermore, the reforms have eroded the efficiency of publicorganisations by constraining the availability of financial and other resources to them.These organisations have scaled down their operations and/or devised coping measureswhich compromise natural resource management. Many authors see the state andother external agents as important facilitators of local initiatives, by providing supportand legitimacy to local institutions (Davis and Wall 1994; Hobley and Shah, 1996; Agrawaland Yadama 1997; Bebbington 1997). From this perspective, the reduced state presenceat the local level is negative, though, in the southern African context, the state hasmore often not supported community initiatives (Murombedzi 1991; Matose and Wily1996).
There is a multiplicity of organisations operating at the local level, many of whichhave some connection to natural resource management. This has been demonstratedelsewhere in Zimbabwe, and in other countries (Mbizvo and Mohammed 1992;Murombedzi 1991; Sithole 1995; Mandondo 1997; Bebbington 1997; Brown and Rosendo1998). In this maze of organisations, in their interconnections and in their changingeffectiveness, where is the hub for resource management initiatives? While there istalk of devolution of power to local governments, and there is much talk of participatorydevelopment, the capacity of government to facilitate the functioning and effectivenessof local organisations is extremely limited, given the budgetary constraints. The potentialfor an effective involvement of government organisations in joint woodland managementactivities with the local communities is presently very low. If the government wantspartnership with local communities in managing these resources, then it will have tochannel more resources to its organisations as well as improving co-ordination amongststate organisations on the ground. Furthermore, choice of organisations for partnershipwith local communities has to take into account the divergent expectations on thoseorganisations from women and men.
For almost all organisations investigated, excluding the churches, the 1990s wereseen as an era of reduced effectiveness. Traditional institutions are still well-respectedby the people, but with the upsurge in individualism and the rising power of religiousorganisations, the traditional institutions are likely to experience reduced legitimacy.The richness of the stated local controls for woodland management is not in doubt(e.g. Mandondo 1997). Many of the woodland resources are common pool resourcesgoverned largely by informal rules and norms falling within the traditional ambient. Itis less clear as to how effective the local controls are, and as to how the controls are

42 LOCAL ORGANISATIONS AND NATURAL RESOURCE MANAGEMENT IN THE FACE OF ECONOMIC HARDSHIPS
changing. The changes in local controls that we recorded do not, generally, forebodewell for natural resource management.
The hub for development still appears to be the traditional institutions, and thenetworks linking to them, despite the problems identified above. While traditionalinstitutions are eroding fast, the evidence is that they remain strong relative to otherinstitutions, especially considering that they received almost no state support in thepost-independence era (Matose and Wily 1996). Traditional institutions still have thebest potential for mobilisation for natural resource management. This is evident fromthe values they espouse, record on past activities, and the esteem with which theinstitutions and their leaders are held.
REFERENCESAnderson, D. and Grove, R. 1987 Conservation in Africa: People, policies and practice.
Cambridge University Press, Cambridge.Angelsen, A. 1997 The evolution of private property rights in traditional agriculture:
Theories and a study from Indonesia. Chr. Michelson Institute Working Paper 1997:6. Chr. Michelson Institute, Bergen.
Agrawal, A. and Yadama, G.N. 1997 How do local institutions mediate market andpopulation pressures on resources? Forest Panchayats in Kumaon, India. Developmentand Change 28: 435–65.
Arnold, M. 1998 Managing forests as common property. FAO Forestry Paper 136: 1–64.Bebbington, A. 1997 Social capital and rural intensification: Local organisations and
islands of sustainability in the rural Andes. The Geographical Journal 163: 189–97.Bourdillon, M. 1985 The Shona peoples: An ethnography of the contemporary Shona,
with special reference to their religion. Mambo Press, Gweru.Brown, K. and Rosendo, S. 1998 The institutional architecture of extractive reserves in
Rondonia, Brazil. CSERGE Working paper GEC98-15. Centre for Applied and EconomicResearch on the Global Environment, Norwich.
Campbell, B.M., Frost, P. and Byron, N. 1996 Miombo woodlands and their use: Overviewand key issues. In: Campbell, B. (ed.) The Miombo in Transition: Woodlands andWelfare in Africa, 1–10. Center for International Forestry Research, Bogor, Indonesia.
Campbell, B.M., Grundy, I. and Matose, F. 1993 Tree and woodland resources - thetechnical practices of small-scale farmers. In: Bradley, P.N. and McNamara, K.(eds.) Living with Trees: Policies for Forestry Management in Zimbabwe, 29–62.World Bank Technical Paper 210. World Bank, Washington.
Chambers, R. 1983 Rural Development: Putting the First Last. Longman, London.Chipika, J.T. and Kowero, G. 2000 Deforestation of woodlands in communal areas of
Zimbabwe: Is it due to agricultural policies? Agriculture, Ecosytems and Environment79(2000): 175–185.
Christofferson, N., Campbell, B. and du Toit, R. (eds.) 1998 Communities and sustainableuse: Pan African perspectives. IUCN World Conservation Union, Regional Office forSouthern Africa, Harare.
Davis, S.H. and Wali, A. 1994 Indigenous land tenure and tropical forest management inLatin America. Ambio 23: 485–90.
Eggertsson, T. 1990 Economic behaviour and institutions. Cambridge University Press,Cambridge.

43B.B. Mukamuri, B.M. Campbell and G. Kowero
Harriss, J. (ed.) 1982. Rural development: Theories of peasant economy and agrarianchange. Hutchinson University Library for Africa, London.
Hobley, M. and Shah, K. 1996 What makes a local organisation robust? Evidence fromIndia and Nepal. Natural Resource Perspectives 11: 1–6.
Little, P.D. and Brokensha, D.W. 1987 Local institutions, tenure and resource managementin East Africa. In: Anderson, D. and Grove, R. (eds.) Conservation in Africa: People,policies and practices. Cambridge University Press, Cambridge.
Mandondo, A. 1997 Trees and spaces as emotion and norm laden components of localecosystems in Nyamaropa communal land, Nyanga District, Zimbabwe. Agricultureand Human Values 14: 353–72.
Matose, F. and Wily, L. 1996 Institutional arrangements governing the use and managementof miombo woodlands. In: Campbell, B.M. (ed.) The Miombo in Transition:Woodlands and Welfare in Africa, 195–219. Center for International ForestryResearch, Bogor, Indonesia.
Mbizvo, C. and Mohamed, J. 1992 The institutional and legal framework for naturalresources management. SEI Working Paper. Stockholm Environment Institute,Stockholm.
McElwee, P. 1994 Common property and commercialisation: Developing appropriatetools for analysis. MSc thesis, Oxford Forestry Institute, University of Oxford.
Moyo, S, Robinson, P., Katerere, Y., Stevenson, S. and Gumbo, D. 1991 Zimbabwe’senvironmental dilemma: Balancing resource inequalities. Natprint, Harare.
Mukamuri, B. 1989 Rural conservation strategies in south central Zimbabwe: An attemptto describe Karanga thought patterns, perceptions and environmental control. In:Grove, R. (ed.) Conservation and Rural People in Zimbabwe, 139–149. CambridgeAfrican Monographs and Baobab Press, Cambridge.
Mukamuri, B.B. 1995 Making sense of social forestry. Acta Universatis Tamperensis. Ser. A438. University of Tampere, Tampere.
Murombedzi, J. 1991 Decentralising common property resources management: A casestudy of the Nyaminyami District Council of Zimbabwe’s Wildlife ManagementProgramme. Dryland Network Issues Paper 30. International Institute for Environmentand Development, London.
Murphree, M.W. 1994 The role of institutions in community-based conservation. In:Western, D. and Wright, R. (eds.) Natural connections. Perspectives in community-based conservation, 360–372. Island Press, Washington, DC.
North, D. 1990 Institutions, institutional change and economic performance. CambridgeUniversity Press, Cambridge.
Oni, S.A. 1997 Impact of the economic structural adjustment programme on the communalareas of Zimbabwe. Friedrich Ebert Foundation and Zimbabwe Farmers Union,Harare.
Ostrom, E. 1990 Governing the commons. Cambridge University Press, Cambridge.Peluso, N.L. 1993 The impact of social and environmental change on forest management.
FAO Community Forestry Case Study Series 8: 1–81.Redclift, M. 1984 Development and environmental crisis: Red or green alternatives?
Methuen, London.Richards, M. 1997 Common property resource institutions and forest management in
Latin America. Development and Change 28: 95–117.Reed, D. 1993 Structural adjustment and the environment. London: Earthscan.

44 LOCAL ORGANISATIONS AND NATURAL RESOURCE MANAGEMENT IN THE FACE OF ECONOMIC HARDSHIPS
Scoones, I. and Wilson, K.B. 1988 Households, lineage groups and ecological dynamics:Issues for livestock research and development in Zimbabwe’s communal lands. In:Cousins, B. (ed.) People, land and livestock. Proceedings of the Workshop on theSocio-economic Dimensions of Livestock Production in the Communal Areas ofZimbabwe, 17–22. Centre for Applied Social Sciences, Harare.
Seidman, R.B. 1992 State, law and agricultural institutions: A theoretical framework. In:Seidman, A., Mwanza, K., Simelane, N. and Weiner, D. (eds.) Transforming SouthernAfrican agriculture, 19–30. Africa World Press, Trenton, New Jersey.
Sithole, B. 1995 Rethinking sustainable land management in southern Africa: The role ofinstitutions. In: Ganry, F. and Campbell, B.M. (ed.) Sustainable land management inAfrican semi-arid and sub-humid regions, 329–344. Proceedings of the SCOPEworkshop, Dakar, Senegal. CIRAD, Montpellier.
Sithole, B. and Bradley, P. 1995 Institutional conflicts over the management of naturalresources in Zimbabwe. SEI Working Paper. Stockholm Environment Institute,Stockholm.
Timberlake, L. 1985 Africa in Crisis: The causes, the cures of environmental bankruptcy.Earthscan, London.
Uphoff, N.T. 1986 Local institutional development: An analytical sourcebook with cases.Kumarian Press, West Hartford.
Western, D. and Wright, R. (eds.) 1994 Natural connections. Perspectives in community-based conservation. Island Press, Washington, DC.
Wilson K. B. 1990 Ecological dynamics and human welfare: A case study of population,health and human welfare in southern Zimbabwe. PhD thesis. University of London,London.
World Bank 1996 Understanding poverty and human resources in Zimbabwe. HumanDevelopment Group, Eastern and Southern African Department, World Bank,Washington DC.

5.Institutional arrangements governingnatural resource management of themiombo woodland
Dennis Kayambazinthu, Frank Matose, George Kajembe andNontokozo Nemarundwe
ABSTRACTThis study investigated the institutional arrangements governing the management ofmiombo woodlands by exploring factors resulting in institutional change and howinstitutions respond to change in the miombo woodland. It has demonstrated theexistence of a multiplicity of institutions ranging from national to local and fromformal to informal; each varying according to the particular socio-cultural and traditionalcontext. Understanding institutions in the region and the processes involved in theirorigins, evolution and dynamics is observed as much more important than analysingand interpreting them according to the “design principles” approach under commonproperty resource (CPR) systems. A historical analysis has also revealed that institutionshave to some extent been affected by changing state and administrative frameworks,from colonial to post-colonial periods. While recognising, for various reasons, thegeneral weaknesses of some institutions to effectively govern natural resources, thisstudy also identified critical factors that make some institutions in the region stableand enduring. The analysis has shown that institutions that are better integrated interms of traditional, socio-cultural traits and incentives, and are given moral and politicallegitimacy at the local level are more stable and enduring than those that are less so. Inour study, these refer to institutions concerning traditional leaderships, different typesof clans or households, and sacred areas. Recent developments of devolution andlegislation to enable community-based resource management have been based on therecognition of the potential of these local institutions while at the same time callinginto question the efficacy of state institutions to manage on their own without communityinstitutions. As the region continues to recognise the legitimacy of traditional systemswith their related structures and rules, these critical factors are important in shaping or

46 INSTITUTIONAL ARRANGEMENTS
harnessing local institutions. This is of particular importance as policy makers try todevelop institutional frameworks that integrate and accommodate formal legislation,e.g., the Forest Act, within the local by-laws for governing natural resource managementof the miombo woodlands.
Key words: Community based management, change, devolution, institutionalframework, degradation.
1. INTRODUCTIONFrom the earliest human communities people throughout the world have had to decidewho can use what resources when, where, and how. Such norms, rules and regulationsthat so govern behaviour are broadly defined as institutions. Under common propertyliterature, these are taken as regulatory systems of formal laws, informal conventionsand norms of behaviour, mainly designed to coordinate individual and collective actionsfor controlling and managing the resources (Harris 1982; Morris and Adelman 1988; North1990; Bromley 1999; Cleaver 1999). This view of institutions has largely been developedby neo-structural institutionalists and economists, and the common property schoolagainst the backdrop of Hardin’s (1968) ‘tragedy of the commons’. Hardin’s thesis isthat resources held in common are subject to some degradation. The common propertyschool has ever since tried to demonstrate that the tragedy of the commons cannotexist under common pool resources (CPR) where communities have regulatory systemsto check against individual interests (Ostrom 1986; Bromley and Cernea 1989; Runge1990). The aim of this paper is to analyse these ‘regulatory systems’ hereafter calledinstitutional arrangements governing natural resource management of the miombowoodlands, in Malawi, Tanzania and Zimbabwe, by specifically examining institutionalchange and factors driving it.
Institutional analysis often requires that a distinction be drawn between institutionsand organisations, mainly due to the difficulty of separating rules and regulationsfrom the organisations that affect them. However, the analysis by Uphoff (1986) doesnot appear to separate institutions and organisations, mainly because of what theauthor terms as a close mileage between the two. Hence, Uphoff (1986) considers“institutions, whether organisations or not, as complexes of norms and behavioursthat persist over time by serving collectively valued purposes”. Thus, some kinds ofinstitutions have an organisational form with roles and structures to implement socialactions, whereas others exist as pervasive influences on behaviour. Mukamuri (2000)considers institutions and organisations as synonymous. The distinction betweeninstitutions and organisations is, however, summarised by Harriss (1982) and North(1990) by defining organisations as the key players, formed by groups of individuals,or the groups of actors bound together by a common purpose to achieve objectives.In this paper this distinction has been adopted in order to investigate what are therules and organisations governing the management of miombo woodlands and howthese have changed and responded to change over time.
People in all communities manipulate their institutions and that these evolvewith time as political, social, economic, ecological and cultural needs and environmentchange and as communities come into conflict or contact with others. The institutionalchange that arises generates, in turn, a change in people’s behaviour towardmanagement of natural resources, often with either a positive or negative impact onthe resource base. This theory implies that, depending on the impact generated,

47Dennis Kayambazinthu, Frank Matose, George Kajembe and Nontokozo Nemarundwe
there is a continued reworking process of the institutional arrangements to either liberateor constrain human behaviour towards management of natural resources (Bromley 1999)(Figure 1). However, among the socio-political commentators on transition of Africaninstitutions are those who believe that traditional institutions are static and resistant tochange or modernity (Kajembe and Kessy 2000). Yet others, through a historical analysisof institutional change, have observed change and are trying to monitor the directionof the change or transition (Mukamuri et al. 1999). Either way and in an effort toexamine institutional arrangements influencing the management of miombo woodlands,this paper further explores the critical set of factors that lead to enduring or changingwoodland management institutions.
Figure 1. A conceptual framework showing changes in institutional arrangementstowards community-based natural resource management (CBNRM) andcontrol.
CharacteristicsResulting outcomes influencing behaviour♦ Positive or Negative ♦ Rules
Resource Management & ♦ ResourceSocial Well-being ♦ Political, Social, Economic &
Cultural Needs
2. BACKGROUND INFORMATION: HOW INSTITUTIONAL CHANGESAFFECT PEOPLE’S INTERACTION WITH THE ENVIRONMENT
One of the challenges facing policy-makers, local authorities, practitioners and groupsworking in natural resource management in the miombo region is to understand howinstitutions, and changes in institutions, affect people’s interaction with theirenvironment since these have consequences for the resource and people’s well-being.Institutional factors are arguably the most important factors determining the successor failure of community-based natural resource management. The current drive,towards devolution of the control and management of resources to communities, may

48 INSTITUTIONAL ARRANGEMENTS
not be enough if all that states are doing is to empower communities by changingpolicies and not try to understand how to strengthen local institutions. The understandingof institutions would afford the best opportunity to begin working with localcommunities and to generate policies that aim at promoting and supporting theappropriate governance structures and rule systems for resource management. Atpresent, national policy support in the region is varied with some countries (e.g.,Tanzania and Malawi in forestry and Zimbabwe in wildlife and water) having changedand created supportive legislations for community-based resource management. Inother cases, such as forestry policies in Zimbabwe, there has been less support, althoughsome experimentation with ‘resource sharing’ in the State Forests is being pursued(Campbell and Matose 2000). With the widely varying degrees of policy support and inthe diversity of resources and communities, with complex and dynamic institutions thatexist in the region, considerable effort is needed to draw parallels, disparities andcommon themes.
Bardhan (1989) recognises the fact that any socio-economic structure, consisting ofproperty relations, corresponds to the level of development of the productive forces.The central force driving any change is therefore the force of production. UsingMarxist theory, Bardham (1989) states that changes in the forces of production overtime produces some tension between existing structure of property rights and theproductive potential of the economy, and it is through class struggle that this tensionis resolved in history, with the emergence of new institutions. This is said to havegiven way to neo-classical thinking on property rights and transaction costs, whichtrace changes in economic history to changes in the institutional rules. Further, it hasalso given way to the imperfect information theory of institutions which provides aframework for analysing institutions as substitutes for missing markets, in anenvironment of expensive risks, incomplete markets, information symmetry, and moralhazard. North (1981), however, brings out the theory of ideology and the state as alsocentral to the institutional change. In this regard, social ideology may well induceindividuals to behave in a way contrary to their own interests. Here the state, inpropagation of ideology and socialisation process, as in defining and enforcing propertyrights, plays an authoritative role. North thus states the fact that the state, forreasons of maintaining its support structures, may even prolong socially inefficientproperty rights (Berthelot 1998).
Other important processes that may bring about institutional change are to dowith collective action and free-rider actions that limit or enable groups of people toact together (Berthelot 1998). Ashton and Philpin (1985) look at the importance ofspecific historical processes of class capacity for resistance and struggle in directingchange. In their analysis of neo-classical economic history, Ashton and Philpin,emphasise the fact that relative price changes fuel the main motivating force forinstitutional changes in history (primarily by inducing the development of propertyrights to the benefit of the owners of the expensive factor of production). In particulardemographic changes altering the relative price of labour to land provide the incentivefor redefinition of property rights on land and a rearrangement of labour relations. Butaccording to Brenner’s (1976) analysis of contrasting experiences of different parts ofEurope on the transition from feudalism, it is known that changes in demography,market conditions and relative prices are not sufficient to explain the contrasts. Hence,changes in relative prices may at most, change the costs and benefits of collectiveaction on the part of the different classes (creating new opportunities for political

49Dennis Kayambazinthu, Frank Matose, George Kajembe and Nontokozo Nemarundwe
entrepreneurs). However, such changes cannot predetermine the balance of class forcesor the outcome of social conflicts that may result in given institutional change.
From a wide range of literature that focuses on institutions, two general approachesto institutional analysis are often described. One is the rational co-operation approachof reducing transaction costs among individuals with self-interest driven by newinstitutionalism (Ostrom 1990; North 1990). The common property theory encompassesthis approach (Bromley 1992; McCay and Acheson 1987) by largely focusing on the set ofvariables that enhance the likelihood of users organising themselves to avoid the socialcosts associated with open-access (McKean 1998; Ostrom 1992). But as Campbell et al.(2001) observe, such ‘literature and similar literature on community-based natural resourcemanagement (CBNRM) (especially that reaching the practitioners) is largely optimisticin outlook’ for the miombo region. They go on to argue that such optimism stems fromthe simplification that somehow “it is possible for CPR appropriators to design, operate,monitor and enforce their own institutional arrangements” (Ostrom 1994). Also that“local communities can create and sustain institutions to manage their collectively ownedresources quite successfully, often in the face of adverse pressures from the state,demographic changes and market forces” (Agarwal and Yadama 1997).
The other approach to institutional analysis places emphasis on the moral codes,traditions and value systems and draws from the Durkheimian tradition that anindividual is largely a social being who is guided by the social norms (Scott 1976, 1985;Uphoff 1986). Hence, individuals make collective choices that favour some interestsover others and some outcomes over others by using mental models. One’s culture,knowledge, values and norms play a big role in the interpretation of one’s environmentand, may therefore vary according to different societies and environments. Studiesfrom some parts of the miombo region indicate that institutions that are currently inplace, are largely built on controls derived from traditions, culture and norms (Mandondo2000). These controls are constantly contested, changeable and individually interpretedand, therefore, the analysis by the “design principles” approach is much more concernedwith social engineering than with trying to have an in-depth understanding of theprocesses involved in the evolution and dynamics of institutions (Campbell et al. 2001).Faced with such social and cultural complexities of communities and natural resourcesfound in the miombo region, we adopt this view in analysing the types of institutions,how they are formulated, structured and changed over time.
3. INSTITUTIONS, THEIR EVOLUTION AND FACTORS DRIVINGCHANGE
The analysis of institutions and their evolution in this study is based on case studiesdone on communal and state-owned areas, in Malawi, Tanzania and Zimbabwe (Kajembeand Kessy 1999; Kajembe et al. 1999; Kayambazinthu et al. 2000; Mukamuri 2000; Campbellet al. 2001; Nemarundwe et al. 2001). It also draws from various sets of literaturegenerated in other parts of the miombo region (Shackleton and Campbell 2001). Themiombo invariably represent woodlands dominated by various Brachystegia, Julbernadiaand Isoberlinia species and other associated species. The woodlands are largely usedas grazing areas and as sources of wood and non-wood forest products, apart fromproviding cultural, social and other forest services.

50 INSTITUTIONAL ARRANGEMENTS
3.1 Types of InstitutionsInstitutions governing land and resource management in the region can be broadlyidentified as ranging from national to local and from informal to formal, operatingeither independently or alongside each other (Table 1). The national legislation andguiding policies set the broader institutional framework, within which lower levelgovernment institutions, e.g., at district level, operate. At this lower level, theydefine governance structures, variously termed as local, community or village, toimplement national legislation. A wide range of institutions and their supportingstructures may fall within the state institutional framework or operate outside it astraditional institutions (Shackleton and Campbell 2001). The traditional institutions,which may fall within or outside of the state statutes, are the oldest and, dependingon each case, may lie dormant, reformulate, reconstitute or may disappear completelyover time (Mukamuri et al. 1999; Shackleton and Campbell 2001). Overall, the operatingtraditional institutional framework, as diverse as it is, is such that it does not wholly oreasily fit into the CPR management systems. As suggested by Campbell et al. (2001),what is critical in understanding institutions in the region is to have an in-depth analysisof the processes involved in their evolution and dynamics.
In spite of the social and cultural complexities of communities and natural resourcesfound in the miombo region, some key and parallel institutional features emerge from thecase studies. At the local level, traditional chiefs are the encapsulation of all institutions,formal and informal, in the management of natural resources. All the case studies showthat the traditional chief is at the centre of all user-group rules, sacred controls and civiccontrols in the area of jurisdiction. Several examples from the region show local institutionsas potentially powerful, stable, valued and generate recurring patterns of behaviour inregulating forest resources. The local “Dgashiga” institution, in Bariadi, Tanzania, hassince pre-colonial times been known to be very successful in communication and articulationof indigenous knowledge, attitudes and practices and in regulating access to naturalresources within the community (Johannson and Mlenge 1993). Though largely ignoredduring the colonial and post-colonial period, Kajembe and Kessy (1999) state that therewas little change in attitude towards this local institution. They also provide anotherexample of a village or inter-village assembly, “Ngitili”, (protectorate) with by-laws operatingat the communal and private, household levels that have not changed over time andremain effective at the local level. These institutions date back to the 1940s arising outof the need to regulate pasture grazing, largely due to overstocking, with by-laws andassociated penal codes as well as sanctions (“Masumule”) instituted to effect resourceconservation. A similarly effective and enduring local institution, “Lyabujije”, meaning“forbidden”, operate at the local level in a village and between villages with clear rulesand by-laws for regulating and managing pasture and woodland resources.
The strength of tradition in both “Ngitili” and “Lyabujije” lies in a village eldercalled “ntale wa banamhala”, who together with other elders form a ten-cell leadershipto establish by-laws and associated penalties. The “ntale wa banamhala” remainsincumbent for life unless some serious misconduct is committed by the elder whichmay warrant dismissal. Such types of institutions are common in many parts of theregion with by-laws clearly understood and accepted by the community, stipulatingwhat to do and what not to do. This may also refer to specific tree species andindividual trees that are associated with some village taboos or traditional rules, aswell as protected woodlands commonly mentioned as sacred because of their history,traditional rules and taboos associated with them.

51Dennis Kayambazinthu, Frank Matose, George Kajembe and Nontokozo Nemarundwe
Table 1. Types of institutions governing resource management of miombo woodlandsin Malawi, Tanzania and Zimbabwe over time
InstitutionsHistorical Period Malawi Tanzania Zimbabwe Type
of Rules
Pre-colonial• Local By-laws, customs, norms, taboos (Traditional chiefs Informal
and councillors, clanheads, kraalheads,“Ngitili”, “Lyabujije”, “Dagashiga”, Religious)
• User Group Resource use rules, regulations; Constitutions Informal,(Craft associations) Formal
• Sacred Controls Tree/woodland protection rules, customs, Informaltaboos(traditional authorities)
• Pragmatic or norm- Civic rules, norms, regulations(NGOs) Informalbased/User specific
Colonial
• National Legal framework, Acts, Constitution (state agents Informalor parastatals: FD, FC, DNPW, DCs, etc.)
• Local By-laws, customs, norms, taboos (local government Informal,administrative structures: RDCs, RMCs, VIDCOs, FormalWADCOs, VFCs; traditional authority: chiefs andcouncillors, headmen, clanheads, kraalheads,traditional healers, “Ngitili”, “Lyabujije”,“Dagashiga”, “Sabukus”, Religious, etc.)
• User Group Resource use rules; Constitutions (Craft associations, Informal,Garden Committees, etc.) Formal
• Sacred Controls Tree/woodland protection rules, customs,taboos(traditional authorities) Informal
• Pragmatic or norm- Civic rules, norms, regulations Informalbased/User specific
Post-Independence
• National Legal framework, Acts, Constitution (state agents Informalor parastatals: FD, FC, DNPW, DCs, District Assemblies,etc.)
• Local By-laws, customs, norms, taboos (local government Informal,administrative structures: RDCs, RMCs, VIDCOs, FormalWADCOs, VFCs, VNRMCs, CAMPFIRE, ZINATHA,NGOs; traditional authority: traditional chiefs andcouncillors, headmen, clanheads, kraalheads,traditional healers, “Ngitili”, “Lyabujije”, “Dagashiga”,“Sabukus”, Religious, etc.)
• User Group Resource use rules; Constitutions (Craft Informal,associations, Binga Craft Centre, Garden FormalCommittees, etc.)
• Sacred Controls Tree/woodland protection rules, customs, Informaltaboos(traditional authority)
• Pragmatic or norm- Civic rules, norms, regulations (NGOs) Informalbased/User specific

52 INSTITUTIONAL ARRANGEMENTS
VFCs – Village Forestry Committees; VNRMCs – Village Natural Resource ManagementCommittees; CAMPFIRE – Communal Areas Management Programme for IndigenousResources; VIDCOs – Village Development Committees; WADCOs – Ward DevelopmentCommittees; RMCs – Rural Management Committees; NGOs – Non-governmentalOrganisations; FD – Forestry Department; DNPW – Department of National Parks andWildlife; DCs – District Councils; RDCs – Rural District Councils, ZINATHA - ZimbabweNational Traditional Healers Association.
However, there are also numerous examples from the region that show lack ofcontinuity in effective (i.e., accepted, respected, adhered to and working) localinstitutions. These have, in one way or another, been undermined by several factors.In all the three case study countries, such institutions have been undermined at variousstages of the colonial and post-colonial periods. With the influx of new institutionscreated within these periods, some functions and responsibilities of the traditionalleadership, central in an African setting for effecting institutions, were either takenup by the new institutions or found to be irrelevant and therefore ignored. There istherefore considerable evidence that traditional leaders, apart from the case of sacredburial sites, are increasingly becoming weak and losing their legitimacy among thepeople in all the case study areas. In spite of the vacuum that this creates there is atthe same time no alternative or forthcoming institution to replace them.
All the case studies and related literature point to the fact that sacred controls,in the management of sacred woodlands, clearly define woodland boundaries, andthe rules on who has rights of access, use and at what times. These include graveyardsand other woodlands of strong ritual significance. Here forests are protected fortraditional purposes such as worshipping and sacrifice offering. Ordinarily, onlydead wood can be collected from such areas and no cutting is allowed. Cutting ofcertain trees, the type of tree concerned varying between different areas, is strictlytaboo. This includes, in some areas, certain fig trees, associated with rainfall aswell as rain ghosts (especially for worshipping, sacrifice offering and rituals). Suchrules are strictly embedded in the traditional spiritual, cultural, and local economicaland ecological environment. Graduated sanctions are imposed by the elite, and thereis little recourse to methods of conflict resolution if such conflicts arise. Morally andtraditionally, such institutions are well accepted and respected by members of thecommunity; who, in turn, are accepted and granted all traditional needs as forms ofincentives. These institutions have hardly changed over time and not been affectedby the colonial and pre-colonial era. They are therefore regarded as more enduringthan other institutions in the region. It would appear then that reworking and invokingthe CPR theory and design principles to explain the enduring nature of sacredwoodlands would be rather inappropriate. Of necessity, sacred woodlands may betreated in relation to their spatial, temporal, economic, religious and politicalcontexts. Elements of these contexts include the resource status, the power dynamicswithin the community; the commercialisation of some of the resources located insacred woodlands, and the broader economic and climatic changes (Mukamuri et al.1999).
However, the degree to which such institutions would be more enduring than inother sacred woodlands would differ depending on a number of factors. For example,where there are heterogeneous communities, mainly due to immigration from otherethnic groups, the survival of the sacred woodlands is less than in homogenouscommunities. In another example, when a trading class develops within a community,

53Dennis Kayambazinthu, Frank Matose, George Kajembe and Nontokozo Nemarundwe
the possibility arises that the traders seek out the resource irrespective of its politico-religious roles, and may therefore seek to compromise some of the sacred institutions.
The nature of institutions governing resource management by kraalheads(Zimbabwe) or clanheads (Malawi & Tanzania) in the region, though different from thesacred woodland institutions, generate similar attributes where these seem to be infull control of their resources. Some of these attributes include self-policing andenforcement, acceptance, respect, combined with fear for the resource, as it belongsto given families as private property. Throughout the region, the clanheads orkraalheads are traditionally empowered and therefore given legal authority to try casesconcerning resource management and other cases such as witchcraft, adultery andtheft. This only reinforces the strength and enduring nature of their institutions inthe management of their natural resources. However, the national will at the legislativelevel has played an important role in influencing to what extent such legal authoritycan be exercised by such institutions. In Zimbabwe, the kraalheads did not have legalauthority during the post-colonial period up until 1999 when the Traditional Leaders’Act was enacted. Even after then, implementation on the ground shows that, in someareas, the national will has yet to be fully realised to reinforce and strengthen theseinstitutions.
The influx of alien religions to the region has also brought about changes in thelocal institutions. In the case of Zimbabwe, for example, the decline in traditionalvalues and customs, i.e., respect for lion spirits (mhondoro), has been regarded asone of the major reasons why local values have become ineffective (Mukamuri 2000).“Mhondoro”, was believed and known to safeguard ancestral rules and societal valuesthrough which people’s lives were viewed as an integral part of the environment.However, these traditional rules have been interpreted and changed to suit new needs,as they have been affected by both Christian religion and strong inclination towardsmodernity. For example, Christians do not want to participate in traditional rain-making ceremonies known as chipwa. Even some of the kraalheads were known to bemembers of Ethiopian Orthodox and Methodist churches recently introduced toZimbabwe.
The region shares a common legal framework in the establishment by governmentsof state institutions for the implementation of local level community developments.Such institutions—WADCOS, VIDCOs (Zimbabwe), VNRMCs, VFCs (Malawi), and VFCs(Tanzania)—have not only divided loyalties, between the committees and traditionalleaders but they have also been politically marginalised. In some communities, forexample in Zimbabwe and Malawi, people have tended to elect traditional leaders intothese committees as a strategy of avoiding conflict and confused loyalties rather thanbecause of their suitability as committee members. Although in some cases thecommittees have tended to weaken the traditional institutions, in general suchcommittees are less powerful than the traditional leaders over the management ofindigenous resources. Their institutions are therefore always having to adapt to theexisting local institutions for effective application. To this end, both traditional andmodern institutions, have been observed to work side by side, e.g., a number ofinstitutions working in Mukarakate, Zimbabwe and Chimaliro in Malawi. This also indicatesthat the imposition of such structures and institutions on the people by a state of suchstructures and institutions for its political and hegemonic ambitions (Makumbe 1996) hasled to the demise of many such institutions in the region.

54 INSTITUTIONAL ARRANGEMENTS
The nature of the rule systems and organisations at the formal, national level hasbeen the most dynamic for the region, with rule systems changing according to who isin power, right from the colonial to the post-colonial period. Accordingly, this hasresulted in varying degrees of institutional change and arrangements for resourcemanagement, either enabling or inhibiting. All case studies show that this has, however,largely brought about negative impacts on local, traditional institutions and on thenatural resource. A number of these formal, government institutions are referred toin Table 1. While recognising the nature of these government institutions and howthey have evolved, it has become necessary in the region to strengthen existingtraditional institutions and encourage the formation of new ones. This is, however,stemming from a few successful cases, such as the ones referred to above, whichhave encouraged effective resource management of miombo woodlands in the region.
Most of the user group institutions as well as norm-based civil institutions may beformal and informal but largely informal. They are based on working rules that achievethe purposes for which the groups have been established. The rules may be with regardto how individual committees should operate, how and when to use particular resources,and a range of other rules. In most cases these institutions are established by externalagencies, for example, non-governmental organisations. In some cases, they areestablished by village committees, internally or externally sponsored, for controllingresource management. In general these institutions are temporal and change as situationsand goals change and may be influenced by existing legal frameworks in each country.Though these can be replicated under similar circumstances, they have to be changedand modified to suit particular institutional arrangements governing resourcemanagement in other areas. Most important, particularly for the externally sponsoredagencies in resource management, such institutions must be legitimised, compatibleand in harmony with local institutions. While some examples illustrate this scenario,e.g., institutions established by the externally sponsored Hifadhi Ardhi Shinyanga (HASHI)in Tanzania, VNRMCs in Malawi and WADCOS or VIDCOs in Zimbabwe, for resourcemanagement, others have completely failed to fit into the local setting and thereforenot contributed much to governing resource management.
4. EVOLUTION OF INSTITUTIONS AND FACTORS DRIVING CHANGEAlthough there is wide diversity in the way traditional institutions have operated inthe region, mainly due to historical, cultural and socio-political factors, there arecommonalities that can be drawn from each country’s experiences (Murphree 1993;Matose and Wily 1996). These include the fact that local communities, having a longhistory of association with forests and high degree of dependence on them, are assumedto have accumulated capabilities that enabled them to manage forests sustainably,particularly in the pre-colonial era. Cases from around the region (Matakala 1986;Makuku 1993; Campbell and Byron 1996; Madzudzo 1997) as well as from various parts ofthe world (Shiva 1988; Makela 1999) attest to this. Another commonality is the coloniallegacy of state-created institutional structures that centralised control, regulation andmanagement of woodlands away from traditional structures, resulting in various degreesof weakening and transformation of the latter. The socio-political transformation atindependence did not bring much institutional change as the traditional institutionalorganisations, e.g., traditional authorities, became absorbed in the administrative,socio-political system of the state.

55Dennis Kayambazinthu, Frank Matose, George Kajembe and Nontokozo Nemarundwe
One of the earlier and most prominent initial factors that resulted in institutionalchange in the region was the intrusion of the colonial government into the existingtraditional institutional structures. By introducing state structures to facilitate itsown development and administrative agenda, the colonial government directly andindirectly undermined the traditional institutional organisations that had hitherto beeneffective in the management of woodlands. Traditional institutional constructs, givingclear rights of tenure by chiefs to their subjects, henceforth became part of the state’sresponsibility. This marked the beginning of the weakening and loss of authority oftraditional organisations in the miombo region (Matose and Wily 1996). The colonialstate agencies that were created to control, regulate and manage woodland resources,particularly through establishment of forest reserves as ‘no go’ zones to localcommunities, ensured that woodland resource management and land tenure wascompletely under state control, except for sacred groves and graveyards.
The literature on institutions in the region dating back to the pre-colonial period(e.g., More and Vaughan 1994; Richards 1940, 1950) show the key social and politicalinstitution of tribes as being centred on chieftainship (whether Paramount chief orany other tribal or clan leader among the Ngoni of Malawi, the Bemba of Zambia, theLomwe of Mozambique, the Shona of Zimbabwe or the Sukuma of Tanzania). In thissystem, the subjects believed in the chief as having both political as well as religiousor spiritual powers. This belief was the source of cohesion and adherence to governinginstitutions even as such powers got transferred from one generation to the other,including the legal rules of succession. However, in cases where there were constantwars such systems could not be maintained. For example, Ranger (1993), in giving ahistorical account of how communal tenure evolved from pre-colonial days onwards,points out that the Shona chieftainships, under constant factional wars in the nineteenthcentury could not provide security of natural resource tenure. In Ranger’s view, therewere few signs of ‘traditions’ of communal tenure transferred from the pre-colonialperiod to the early colonial Rhodesia (now Zimbabwe).
The coming in of Europeans in the region, whether as missionaries, traders and/or settlers in the late 1800s changed some of these institutions. The Europeansperceived for example, schisms, tribal practices and rituals, and general way of lifeamong African tribes and clans, however organised and institutionalised, as uncivilisedand backward. They therefore introduced Christian values and the state system. Therole of traditional institutions was de-emphasized but the traditional chiefs and clanleaders were maintained with their role redefined as that of custodians of state system.All these dynamics contributed to the weakening of the traditional institutions and thegroup cohesion, which used to exist before.
The colonial period saw the establishment of legislative controls on woodland usein the region. These included the Native Reserve Forest Produce Act (1928), NaturalResources Act (1942) and the Forest Act (1948) in Zimbabwe; the District Administration(Native) Ordinance (1926) (for the Communal Forest Scheme) and the Forestry Ordinance(1931) in Malawi and, Forest Ordinance (1957) in Tanzania (Kajembe and Kessy 1999;Kayambazinthu 2000; Kajembe et al. 1999; Mukamuri 2000; Campbell et al. 2001;Nemarundwe et al. 2001). These Acts and Ordinances increased the state control overwoodland resources, especially in the communal lands. Alongside these Acts andOrdinances, the colonial period also marked the beginning of major changes in woodlandmanagement in the region. This was through the introduction of state institutionsand structures that were tasked with enforcement of rules and regulations and

56 INSTITUTIONAL ARRANGEMENTS
management of forest resources were tasked with enforcement of regulations andmanagement of forest resources. These included the Forestry Departments (FD),District Councils (DCs) and Village Forest Committees (VFCs) in Malawi and Tanzania;Department of National Parks and Wildlife (DNPW), Forestry Commission (FC), RuralDistrict Councils (RDCs), Village Development Committees (VIDCOs) and WardDevelopment Committees (WADCOs) in Zimbabwe. These essentially aimed to facilitatethe penetration and entrenchment of administrative structures in the control andmanagement of natural resources by the colonial government and undermined the localpeople’s initiatives and capacity for woodland management. This colonial legacy has,in some cases, left local communities with little rights over the resources they purportedlyown, and with the hangover that everything should come from the top to the community(Mphepo 1998, Kajembe and Kessy 1999).
The coming of the post-colonial governments at independence further consolidatedstate powers and institutions in resource management as local communities were‘cultured’ into a system of only receiving instructions from the top. In both colonial andpost-colonial era, local communities were perceived as a destructive force and no attemptswere therefore made to consider them in the management of miombo woodlands. Thuswhile independence marked the end of the colonial state in Tanzania in 1961 and, usheredin a new government in Zimbabwe in 1980 and in Malawi in 1964, there was little changein the attitude towards traditional institutions. In fact, local natural resource managementinstitutions were further weakened as powers were shifted even further from thetraditional authorities to the state under the District Councils Act (1980) and CommunalAreas Act (1982) in Zimbabwe. Two other legislative instruments which contributed tochanges in the institutional setting in Zimbabwe included the 1982 Prime Minister’sDirective on Decentralisation and the Rural District Councils Act (1988). The DistrictCouncils Act removed the power to allocate land from traditional chiefs and headmen toDistrict Councils, while the 1982 Prime Minister’s Directive on decentralisation resultedin the establishment of local institutions known as the Village Development Committees(VIDCOs) and Ward Development Committees (WADCOs). The latter formed a parallelinstitution to the traditional authority in place at village level, creating friction betweendemocratically elected leaders and the traditional leaders at community level, and furtherstripped chiefs and headmen of their land allocation powers (Mutizwa-Mangiza 1990).The government has now restored authority to the chiefs through enactment of theChiefs and Traditional Leaders Act (1998). However, the existence of two legislationssupporting two parallel power structures at the local level, without clarifying anddistinguishing the various roles and responsibilities, creates potential problems ofallegiance and legitimacy at the local level (Nemarundwe et al. 2001). Malawi hasexperienced similar institutional shifts with the creation of the Chiefs Act (1964) andthe creation of Village Natural Resources Committees (VNRMCs) under the Forestry Act(1997) (Kayambazinthu 2000). For Tanzania, new institutions were imposed at the locallevel, from 1967, in line with the socialist ideology, modelled along Marxist-Leninistprinciples. In all these cases, the organisational structure was designed to represent abottom-up approach to development, but was in essence a conduit for channelingpropaganda and development ideas from the state to the local level. These governmentorganisations and institutions have, however, failed in the region largely as a result oflack of local legitimacy, institutional overlap with the persisting traditional structures,and different interpretation by individuals and groups to suit their own ends (Kajembeand Kessy 1999).

57Dennis Kayambazinthu, Frank Matose, George Kajembe and Nontokozo Nemarundwe
One common institutional change that developed in the region from the mid-1980s was the introduction of the Structural Adjustment Programmes (SAPs), whichwere characterised by the emergence of commercialisation of forest products(Kajembe and Kessy 1999). SAPs have had a major impact on poverty among therural poor especially as a result of removal of subsidies on major farm inputs, andmarket liberalisation. These have resulted in a big rise in input prices and henceaffecting farmers’ capability to access them and accordingly their capacity toproduce (Carr 1998, Blackie 1998). The low productivity has resulted in increasedpoverty in rural communities. As a survival strategy some villagers have resortedto trade in forest products such as firewood and charcoal, thereby weakening theexisting local institutions. As Mukamur.i et al (1999) argue, when a trading classdevelops within a community a possibility arises that the traders seek out theresource irrespective of its politico-religious roles, and this inevitably leads tobreakdown of existing institutions. This has invariably posed new challenges toboth government institutions as well as any remaining traditional institutionsresponsible for managing resources in the miombo woodlands. In areas with mixedsocial groups or tribes, what the forests and the forest products mean to theindigenous population is not necessarily the same to immigrants. For example,the indigenous Nyamwezi ethnic group of Tanzania, who live around the UrumwaForest Reserve, see the forest in terms of timber, charcoal, firewood for tobaccocuring or as a source of local medicine. At the same time, the Sukuma ethnic groupwho are immigrants to the area and pastoralists see the reserve as potential areafor grazing (Kajembe and Kessy 1999). Such demands, under SAP and commercialisation,has led to the flouting, and subsequent weakening, of existing local institutions forthe sustainable management of the resources. This particularly applies in the forestmanagement cases in Malawi and Zimbabwe, where powerful entrepreneurs tend toignore local regulations and controls, undermining the authority of communityinstitutions. In general, this has also created highly stratified and differentiatedcommunities with multiple interests, e.g., various resource user groups such as theCraft Associations and Garden Committees, and other pragmatic, norm-based anduser specific groups (Table 1). This poses a particular challenge in that such situationscreate varying incentives and disincentives for respecting or accepting the localinstitutions and influences people’s participation in community-based natural resourcemanagement (Shackleton and Campbell 2001).
Throughout the region, national and international non-governmental organisationshave basically mushroomed in the later part of the post-colonial era. These, togetherwith the old and well-established religious organisations, have had some impact onthe management of miombo woodlands. As the early missionaries came into theregion, during the pre-colonial as well as the post-colonial period, they acquired a lotof land from the local people and established their own institutions for governingresource management. The local communities did not have land nor resource userights. Rights to forest products such as collection of dead twigs for firewood, fruits,caterpillars, mushrooms and honey varied from site to site but generally requiringpermission. Donor agencies, forming another institutional set up, have had someinfluence on the general management of forests in the region. Their influence hasbasically been in terms of provision of financial resources and in some cases theyhave promoted certain policies which have a major impact on the sustainability ofmiombo woodlands. One example of such policies is the support given to the SAP.

58 INSTITUTIONAL ARRANGEMENTS
5. INSTITUTIONAL CHARACTERISTICSUsing common institutional attributes, frequently referred to in the case studies andliterature, a set of factors begin to emerge as critical in determining the resilience orsusceptibility of institutions to change (Table 2). The likelihood of an institution tochange or not to change is, in this case, qualitatively measured by the degree to whichit can be characterised by these attributes; the higher the attributes the less likely forthe institution to change. On the basis of this analysis, the first three categories ofinstitutions are summed up (in the last column) as inherently having a low tendency tochange. These include various institutions established at the local level by traditionalleaderships, village institutions by village elders and clanheads or kraalheads, andthose governing resource management of sacred areas. In all they appear to havebetter integrated traditional, socio-cultural traits and incentives that give them moraland political legitimacy than the externally sponsored and initiated institutions. Theseare also known to promote self-policing or enforcement of the institutions and socialcohesion, necessary for implementation of rule systems.
Incentives do, of course, take many different forms and come from many differentsources that it is difficult to figure out the multiple and diverse incentives that are atwork in a community. For most of the externally initiated institutions, money seemsto be the main incentive, e.g., an afforestation project which may pay people to planttrees. The traditional institutions, however, may be driven by fear, for example. Thiscould be fear of the ancestors who may cause people to protect a sacred forest. Inthis case the community may have strong animistic beliefs and universally fear certainforest spirits that inhabit the region. Some families and some farmers hang amuletsto the spirits in the trees to protect them as one would not dare approach a tree thatmight be inhabited by such a spirit. Another characteristic of the community, namelyits shared religious beliefs, adds incentives that protect the rights of the owner. Insome communities, for example, there is a powerful spirit of unity which generatespressure to conform to established norms. Group pressure may play a big role ingetting people to engage in an activity or persuading them to protect a sacred grove.The community’s ability to manage resources is its social cohesion and willingness toset and strive for common goals. In this case the community is able to establishcommon goals, establish strategies for accomplishing those goals, and then worktogether to follow the strategy that has been proposed. This is largely determined byhistory of the community (i.e., population and settlement history and conflict history)and its relations with others, its present social structure, its cultural values, and theway it governs itself. The population history reflects the ancestral origins of thecommunity, whether descended from a common or single ancestor or family. Theseverity of the sanction is a factor in determining how much a rule affects behaviour.For example, a rule that when violated can result in one’s expulsion from a communitycreates different incentives from one that results in nothing more than a token fine.
Unlike the national and externally influenced institutions of user groups and othernorm based, specific user groups outlined in Table 1, the traditional institutions aremore enduring and stable because of their strong foundation and deep-rooted, specificsocial stratification and structural organisations. Traditional societies, irrespectiveof their degree of centralisation or social fragmentation, use kinship or leadership as amoral framework of binding force and unity, which expresses itself in moral concepts oraxioms. The moral order is therefore meant to be robustly collective with ensuredchecks and balances enabling group interests to be preserved and to guide local

59Dennis Kayambazinthu, Frank Matose, George Kajembe and Nontokozo Nemarundwe
government and politics, decision-making, and even religion. Everyone participates, isheard, and accepts his or her responsibilities to the group and to one another (Dia1994; Kajembe and Kessy 2000). These attributes are key to institutional stability. Lesseffective and failed traditional institutions, mainly influenced by external forcesthroughout the colonial and post-colonial period, are a clear departure from the moraland political legitimacy of the ancestral, and strongly centralised, systems of Africaninstitutions.
Table 2. Institutional attributes as critical factors in determining change
Institutional attributes
Socio- Moral/ Religious Incentives Self- Promoteculturally political influence policing/ social
accepted/ support/ enforcement cohesionrespected legitimacy
of Traditional V. High V. High High V. High V. High High Lowchiefs andcouncillors
of clanheads, V. High V. High High High V. High V. High Lowkraalheads,“Ngitili”,“Lyabujije”,“Dagashiga”
of Sacred Tree/ V. High V. High V. High V. High V. High V. High Lowwoodlandprotectionrules, customs,taboos
of externally High High Low Moderate Moderate High to Moderateinstituted VFCs, to High ModerateReligious, VNRMCs,CAMPFIRE, VIDCOs,WARDCOs, ZINATHA,NGOs etc
of Craft High High Low High Moderate Low Moderateassociations,Binga CraftCentre, GardenCommittees, etc
of FD, DNPW, Moderate High Low Moderate High Low ModerateDCs, RDCs, etc
of Civic rules, V. High V. High Low Moderate High High Moderatenorms, regulations
VFCs – Village Forestry Committees; VNRMCs – Village Natural Resource Management Committees;CAMPFIRE – Communal Areas Management Programme for Indigenous Resources; VIDCOs – VillageDevelopment Committees; WADCOs – Ward Development Committees; NGOs – Non-governmentalOrganisations; FD – Forestry Department; DNPW – Department of National Parks and Wildlife; DCs.-District Councils; RDCs – Rural District Councils, ZINATHA - Zimbabwe National Traditional HealersAssociation.
Institution Tendencyto change

60 INSTITUTIONAL ARRANGEMENTS
By the same reasoning, the lack of indigenous, traditional foundation and relatedpolitical and moral legitimacy in national institutions, with origins from the colonialperiod and emphasis on control and centralised power, has tended to serve the laws ofthe countries of the region and not the indigenous population. As a result, these havenot been given as much socio-cultural acceptance and respect, nor promoted socialcohesion as well as the traditional institutions. These institutions, as well as thosegoverning resource management by user groups and elected committees, have thetendency to change as their membership or conditions change.
6. DISCUSSION AND CONCLUSIONThis study has demonstrated the existence in the mombo woodland region of amultiplicity of institutions ranging from national to local and from formal to informal;each varying according to the particular socio-cultural and traditional context. In thisrespect, understanding institutions in the region and the processes involved in theirorigins, evolution and dynamics is observed as much more important than analysingand interpreting them according to the “design principles” approach under CPR systems.Through a historical analysis it has also been revealed that all these institutions havealso been affected by changing state and administrative frameworks, from colonial topost-colonial periods. From this analysis, it is clear that some traditional institutionshave been largely weakened and considerably changed, from their inherentconstitutional character, which saw them as the product of ancestral, ritual and spiritualpower before colonial times (Dia 1992). As has been asserted elsewhere (Agarwal andYadama 1997; Agarwal and Gibson 1998; Campbell et al. 2001), institutional analysis inthe region should take account of spatial contexts, temporal contexts, including history,the micro-politics of resource use and transaction costs, and the actual condition of thecommons.
The extent to which traditional institutions in the region have been affected inthe past have made them to become more or less hybrid systems of institutions inwhich tradition and modernity co-exist. Recent developments of devolution andlegislation to enable community-based resource management, however, come withthe recognition of the potential of local institutions while at the same time callinginto question the efficacy of state institutions to manage on their own withoutcommunity institutions (Mandondo 2000). While recognising, for various reasons, thegeneral weaknesses of some institutions to effectively govern natural resources, thisstudy attempted to identify critical factors that make institutions in the region stableand enduring. The analysis has shown that institutions that have better integratedtraditional, socio-cultural traits and incentives, and are given moral and politicallegitimacy at the local level are more stable and enduring than those that are less so.In our study, these refer to institutions concerning traditional leaderships, differenttypes of clans or households, and sacred areas. As the region continues to recognisethe legitimacy of traditional systems with their related structures and rules, thesecritical factors are important in shaping or harnessing local institutions. This is ofparticular importance as policy makers try to develop institutional frameworks thatintegrate and accommodate formal legislation, e.g., the Forest Act, within the localby-laws or to make provisions for the establishment of by-laws. The potential isthere for existing traditional institutions to operate in harmony with externallysponsored institutions which is an indicator of the potential compatibility between

61Dennis Kayambazinthu, Frank Matose, George Kajembe and Nontokozo Nemarundwe
the two types of institutions (Kajembe and Kessy 2000). In recognition of internaldifferentiation of resource endowment with communities and overlaps of interestgroups, often with conflicting and competing interests, governments must, however,reserve or retain the right to intervene in cases of conflicts at the local level, wheresuch a higher level governance systems are required to provide protection tomarginilsed groups and provide a forum for conflict resolution.
REFERENCESAgarwal, A., and Yadama, G. N. 1997 How do local institutions mediate market and
population pressures on resources? Forest Panchayats in Kumaon, India. Developmentand Change 28: 435–465.
Bardhan, P. 1989 Alternative approaches to the theory of institutions in economicdevelopment. In: Bardhan, P. (ed.) The Economic Theory of Agrarian Institutions.Oxford University Press, New York.
Berthelot, Y. 1997 The role of institutions in economic development. In: Szekely, I.P.and Sabot, R. (eds.) Development Strategy and Management of the Market Economy,Vol. 2, 213–230. Clarendon Press, Oxford.
Brenner, R. 1976 Agrarian class structure and economic development in pre-industrialEurope. Past and Present 70: 30–75.
Bromley, D. (ed.) 1992 Making the commons work: theory, practice and policy. Institutefor Contemporary Studies Press, San Francisco.
Bromley, D.W. 1999 Economic dimensions of community-based conservation. In: Bromley,D.W. (ed.) Sustainable Development: Environmental Resources in DevelopingCountries, 163–179. Edward Elgar, Cheltenham.
Bromley, D.W. and Cernia, M.M. 1989 The Management of common property naturalresources: Some conceptual and operational fallacies. World Bank Discussion Papers57.
Campbell, B. M. and Byron, N. 1996 Miombo woodlands and rural livelihoods: Optionsand opportunities. In: Campbell, B. (ed.) The Miombo in Transition: Woodlandsand Welfare in Africa, 221–230. Center for International Forestry Research, Bogor.
Campbell, B. M. and Matose, F. (with Kayambazinthu, D. and Kajembe, G.) 2000 Institutionsand natural resources in the miombo region. Policy brief. Center for InternationalForestry Research, Bogor.
Campbell, B. M., Mandondo, A., Nemarundwe, N., Sithole, B., De Jong, W., Luckert, M.and Matose, F. 2001 Challenges to proponents of common property resource systems:Despairing voices from the social forest of Zimbabwe. World Development 29 (4):589–600.
Cleaver, F. 1999 Moral ecological rationality, institutions and the management of commonproperty resources. Paper presented at the African Environments Conference.Oxford, 5–7 July, 1999.
Dia, M. 1994 Indigenous management practices: Lessons for Africa’s management in the‘90s. In: Serageldin, I. and Taboroff, J. (eds.) Culture and Development in Africa.Proceedings of an International Conference held at The World Bank, Washington

62 INSTITUTIONAL ARRANGEMENTS
DC, April 2–3, 1992. Environmentally Sustainable Development Proceedings. SeriesNo. 1. The International Bank, Washington, DC.
Johannson, L. and Mlenge, W. 1993 Empowering customary community institution tomanage natural resources in Tanzania. A case study from Bariadi District. People,Trees and Forests Newsletter 22: 36–42.
Hardin, G. 1968 The tragedy of the commons. Science 162:1243–1248
Harris, J. (ed.) 1982 Rural development: Theories of peasant economy and agrarianchange. Hutchison University Library for Africa, London.
Hayami, Y. and Ruttan, V.W. 1985 Agricultural development. An international perspective.John Hopkins University Press, Baltimore and London.
Kajembe, G. C. and Kessy, J. F. 1999 Evaluation of forestry extension services in Mwanzaand Tabora regions. Consultancy report to the Ministry of Natural Resources andTourism. Forconsult, Faculty of Forestry and Nature Conservation, Sokoine Universityof Agriculture, Morogoro, Tanzania.
Kajembe, G. C. and Kessy, J. F. 2000 Joint forest management in the Urumwa ForestReserve, Tabora, Tanzania: A process in the making. In: Virtanen, P. and Nummelin,M. (eds.) Forests, chiefs and peasants in Africa: Local management of naturalresources in Tanzania, Zimbabwe and Mozambique. Silva Carelica 34: 141–158.
Kajembe, G. C., Mvena, Z. S. K. and Monela, G. C. 1999 The role of community basedinstitutions in mediating relationship between miombo woodlands and localcommunities. Sokoine University of Agriculture, Morogoro, Tanzania.
Kayambazinthu, D. 2000 Empowering rural communities to manage natural resources:Where does the power lie? The Case of Malawi. In: Shackleton, S.E. and Campbell,B. (eds.) Empowering Communities to Manage Natural Resources: Case studiesfrom southern Africa. SADC Wildlife Sector Natural Resource ManagementProgramme, Lilongwe, Malawi and in association with CSIR. CSIR Report No. ENV-P-C-2000-025. CSIR, Pretoria and WWF (Southern Africa), Harare.
Kayambazinthu, D., Mwabumba, L. and Masangano, C. M. 2000 Institutional change andfactors driving change in the miombo region: Case studies in Malawi. Paperpresented at the workshop on policies, governance and harvesting of miombowoodlands. Arusha International Conference Centre, Tanzania, 7–14 October, 2000.
Madzudzo, E. 1997 Communal tenure, motivational dynamics and sustainable wildlifemanagement in Zimbabwe. Zambezia 24: 147–158.
Makela, M. 1999 Community-based environmental protection and natural resourcemanagement. DIDC, Helsinki.
Makumbe, J. M. 1996 Participatory development: The case of Zimbabwe. Univeristy ofZimbabwe, Harare.
Makuku, S. J. 1993 All this for a bug! Community approaches to common propertyresources management in Bikita, Zimbabwe. Forest, Trees and People Newsletter22: 18–23.
Mandondo, A. In press. The concept of territoriality: local natural resources managementand its implications on livelihoods in Nyamaropa Communal Land, Zimbabwe.Agriculture and Human Values.

63Dennis Kayambazinthu, Frank Matose, George Kajembe and Nontokozo Nemarundwe
Matakala, P.W. 1986 Problems of forest extension work in the Zambia teak forest. In:G.D. Piearce (ed.) The Zambezi Teak Forests. Proceedings of the First InternationalConference on the Teak Forests of Southern Africa, 416–26. Forest Department ofZambia, Ndola.
Matose, F. and Wily, L. 1996 Institutional arrangements governing the use and managementof miombo woodlands. In: B.M. Campbell (ed.) The Miombo in Transition: Woodlandsand Welfare in Africa, 195–219. Center for International Forestry Research, Bogor,Indonesia.
McCay, B.J. and Acheson, J.M. (eds.) 1987 Human ecology of the commons. In: McCay,B.J. and J.M. Acheson (eds.) The Question of the Commons: The culture andecology of communal resources, 1–34. University of Arizona, Tucson, USA.
McKean, M. A. 1998 Common property: what is it, what is it good for, and what makes itwork? In: C. Gibson, M. McKean, and E. Ostrom (eds.) Forest resources andinstitutions. Forests, Trees and People Program Working Paper 3. FAO, Rome.
Morris, C.T. and Adelman, I. 1988 Comparative patterns of economic development,1850–1914. John Hopkins University Press, Baltimore.
Mphepo, M.M.A. 1998 Report on case study on participatory development. University ofMalawi, Bunda College of Agriculture, Lilongwe, Malawi.
Mukamuri, B.B., Matose, F. and Campbell, B. M. 1999 Rural institutions: Contextualisingcommunity-based management of natural resources in Zimbabwe. Institute ofEnvironmental Studies, University of Zimbabwe and Forestry Commission, Harare.
Mukamuri, B.B. 2000 Local institutions and management of indigenous woodland resourcesin Zimbabwe. Silva Carelica 34: 15–33.
Murphree, M. 1993 Communities as resource management institutions. Gatekeeper Series36. International Institute for Environment and Development, London, p1–35.
Nemarundwe, N., Mamimine, P. and Matose, F. 2001 Institutions for community basedwoodland resource management: Case studies from Zimbabwe. University ofZimbabwe, Harare.
North, D.C. 1981 Structure and Change in Economic History. Norton, New York andLondon.
North, D.C. 1990 Institutions, Institutional Change and Economic Performance. CambridgeUniversity Press, Cambridge.
Ostrom, E. 1986 An agenda for the study of institutions. Public Choice 48: 3–25.
Ostrom, E. 1990 Governing the commons: The evolution of institutions for collectiveaction. Cambridge University Press, Cambridge, MA.
Ostrom, E. 1992 The rudiments of a theory of the origins, survival and performance ofcommon property institutions. In: D. Bromley (ed.) Making the commons work,293–318. International Centre for Self Governance, San Francisco.
Ostrom, E. 1994 Neither market nor state: governance of common-pool resources in thetwenty-first century. IFPRI Lecture Series. International Food Policy ResearchInstitute, Washington, DC.
Runge, C.F. 1990 Common property resources in a global context. Department ofAgricultural and Applied Economics Staff Paper, 9–27. University of Minnesota,Minneapolis.

64 INSTITUTIONAL ARRANGEMENTS
Scott, J.C. 1976 The moral economy of the peasant: Subsistence and rebellion in SoutheastAsia. Yale University Press, New Haven.
Shiva, V. 1988 Staying alive: Women, ecology and survival in India. Kali for Women.New Delhi.
Shackleton, S. E. and Campbell, B. M. et al. 2001 Devolution in Natural ResourcesManagement: Institutional arrangements and power shifts. A synthesis of case studiesfrom southern Africa. USAID SADC NRM Project No. 690-0251.12, WWF – SARPO,EU/CIFOR & Common Property STEP Project, CSIR Report.
Uphoff, N. 1986 Local institutional development: An analytical source book with cases.Kumarian Press, Hartford.

6.Conflicts over the miombo woodlands:The case of Blantyre, Lilongwe andKasungu, in Malawi
C.M. Masangano, D. Kayambazinthu and L. Mwabumba
ABSTRACTMalawi is currently promoting a policy of communal management of miombo woodlands.This is occurring at a time when the country has changed its political system tomultiparty democracy and is decentralizing government and promoting communityinvolvement in development efforts. There is, however, need to understand the factorslikely to lead to success or failure of community participation in management of miombowoodlands.
Miombo woodlands contribute numerous resources to the livelihoods of ruralhouseholds. Harvesting of miombo resources has most often led to conflicts amongvarious parties. This paper discusses the major sources of conflict among communitiesliving close to forests. It also discusses the approaches used to resolving and managingconflicts. The study revealed that conflicts centred on a range of land and forestissues. Land conflicts usually resulted when two parties both claimed rights ofinheritance, or when one party failed to respect garden boundaries and encroached onthe gardens of the other people. Land conflicts also occurred when there was failureto return borrowed land in the agreed period as well as when one’s animals grazed inother people’s gardens. Conflicts surrounding forest resources occurred when anindividual was found harvesting resources such as poles and firewood from otherpeople’s gardens or from communal forests without permission. Conflicts also occurredwhen community members were caught harvesting resources from reserved woodlands.
The communities had some institutional structures which could be used for conflictresolution and management. Generally, conflict resolution started with the two partiesdiscussing the issue. If they failed to resolve their conflict, they referred the matterto the village headman. The village headman discussed the issue with the two partiesin the presence of other village elders. Conflicts not resolved at this level were referred

66 CONFLICTS OVER THE MIOMBO WOODLANDS
to the chief or group village headman where there was a similar process of discussion.These institutional mechanisms were, however, not very strong in resolving conflictssurrounding resources from forest reserves, because such forests were under statecontrol and the state structures tended to be more powerful than local structures.Conflict resolution in these cases had to involve state structures. Any effort to promotelocal participation in the management of miombo woodlands must look intomechanisms for empowering local institutional structures.
Key words: Conflicts, woodlands, local institutions, management committees.
1. INTRODUCTIONMalawi is currently experiencing serious problems of natural resource degradation.Estimates show that the total national forest cover in Malawi is being depleted at 3.5percent a year. The major causes of forest degradation are land clearing for agriculture,and tree felling for fuelwood and charcoal for domestic energy use and sale, fuelwoodfor tobacco curing and fuelwood for other uses such as brick making. Attempts bygovernment to control deforestation of the natural woodlands have usually resulted inconflicts with communities. One serious type of conflicts is illustrated by NamatunuForest where, with the advent of multiparty democracy in the early 1990s, local peoplewent into the forest to harvest trees for fuelwood, charcoal, poles and even timber,without regard to Government rules. Attempts by Forest Department staff to controlthe situation were met with hostile resistance by local people.
Mwabumba et al (1999) categorized miombo woodlands in Malawi into two types:government protected woodlands which are on public land and village woodlands oncustomary land. The protected woodlands were, until the early 1990s, managed strictlyby the government through its Department of Forestry and Department of NationalParks and Wildlife. Staff of the Department of Forestry regulated the collection andutilization of forest products, and members of local communities were not allowed tocollect these products unless they had a permit. Coote et al (1993) reported that thesewoodlands cover an area of about 1 million hectares.
On the other hand miombo woodlands on customary land consist of more than2000 small areas of woodland covering a total area of 2.7 million hectares (ForestryDepartment 1985). These small woodlands are usually designated as village forest areasunder the control of village headmen1. Community members living in areas close tothese woodlands are normally allowed access to these areas to collect specified resourcessuch as firewood and non-timber forest products like thatch grass, fruits, mushroomsand caterpillars. Cutting of trees is normally not allowed.
In an effort to promote good management of the government reserved miombowoodlands and in light of the democratization process, Malawi is pursuing a policy ofcommunity involvement in the management of such woodlands. Communities arebeing encouraged to participate in the management and utilization of forest resources.This is being done with the understanding that, in the past, communities co-existedwith the forests which provided them with various livelihood benefits. They maintainedcertain cultural values and beliefs which ensured that the forests were not mismanaged.
This paper provides findings relating to the major sources of conflicts and theapproaches used in conflict resolution and management among communities in themiombo woodlands. The existence of conflict resolution mechanisms is a precursor tosuccessful community management. Robinson (1980) described conflict as a behavior

67 C.M. Masangano, D. Kayambazinthu and L. Mwabumba
threat by one party at the territory of another party. Territory in this respect refers toa wider psychological dimension based on personal values and beliefs on individualprivileges (Robinson and Clifford 1977). Group or individual behavior in conflict situationsthreatens the other party by trying to attain its goals or achieve its interests withenough behavioral intensity to limit the goal attainment of the other party.
One implication that can be drawn from this definition is that conflicts mostoften occur when resources are limited and people’s needs and wants exceed theavailability of resources. This causes behavior where by one party tries to block theother party from accessing the resources. One way by which parties, especially thosein a position of power, try to block access to resources is through the types of policiesthey put in place. Policies represent the type of goals and values and in turn definethe types of rights, interests and privileges that a society has.
The main objectives of the study were:• To identify and document major sources of conflicts in the management and use of
miombo woodlands and other resources in the vicinity of the woodlands.• To identify and document the approaches used in conflict resolution among local
communities.• To draw lessons from this study for promoting more sustainable community
management and usage of miombo woodlands.
2. METHODOLOGYThe study was conducted in four sites within three districts. The sites were Mdeka andMangwero in Blantyre District, Dzalanyama in Lilongwe District and Chimaliro in KasunguDistrict. The study sites were identified by the researchers through a process ofconsultations with various stakeholders, including staff of the Forestry Department.Reconnaissance surveys were conducted to improve understanding of the sites chosen.This was followed by a series of focus group discussions of local communities in thestudy sites (Table 1).
Table 1. Villages/communities which were consulted during focus group discussions
District Site Names of villages/communities consulted
Blantyre M’deka ChilipaM’mangeni
Mangwero JamaliLilongwe Dzalanyama Gowela
KapingizaKasungu Chimaliro Block 1 (Boni Chakuchanya)
Block 2 (Boni Chakuchanya)Block 3 (Boni Chakuchanya)
These focus group discussions were conducted with various groups of people ineach village. The groups consisted of a mixture of people (men, women and youth) aswell as leaders in various categories, like chiefs and village natural resourcesmanagement committees (VNRMC). Key informant interviews were also conducted as

68 CONFLICTS OVER THE MIOMBO WOODLANDS
a way of triangulation and to get additional information where possible. The keyinformant interviews were conducted with various individuals including:
(a) Village headmen(b) Men(c) Women(d) Other local leaders such as members of parliament(e) Non governmental organizations working in forestry and natural resource
management in the areas of the study(f) Staff of the Forestry Department and(g) Staff of other relevant government departments such as Agriculture and
IrrigationDirect observations were also used in local court sessions in order to observe the
process of conflict resolution, but these were few since local court sessions were rareduring the period of the study. An attempt to review court records from formal courtsfailed as permission for such could not be obtained.
3. BACKGROUND TO THE STUDY SITESM’deka and Mangwero were the two sites where the study was conducted in BlantyreDistrict in Southern Malawi. They are in the North Western part of the District alongthe main Blantyre-Lilongwe road. The area experiences a continuous rainy seasonwhich starts in November and ends in March. Annual rainfall varies from less than 700to 800mm with mean annual temperatures varying from 20 to 23oC. The area wascomposed of mostly Yao people and they follow the matrilineal system of marriage.There were 1850 households in the three villages involved in the study in this area,(NSO 1987). Nearly half the population was less than 15 years old and the averagepopulation density was 200 persons /km2. Communal management of natural forests inboth Mdeka and Mangwero was implemented through village natural resourcesmanagement committees (VNRMCs) which worked hand in hand with staff of the ForestDepartment in ensuring sustainable management and utilization of the forests. Bothsites experienced major deforestation of their indigenous forests in the past 20 years.The main forces which influenced this deforestation were:
• The opening of a main road which created markets for wood products such asfirewood and charcoal. The focus group discussions revealed that the area haslow agricultural potential because it generally received low rainfall which wasoften poorly distributed. Secondly the cost of agricultural inputs such as fertilizersand chemicals were very high and most of the farmers could not access them.These problems frequently resulted in low agricultural production and often peoplecould not produce enough for their subsistence needs. On the other hand, peoplein the area did not have reliable alternative economic activities. The openingof the road opened market opportunities for forest products such as firewoodand charcoal and to many people, this provided a good economic alternative.This led to the degradation of the woodlands.
• Change of government from one party rule to multiparty democracy was anotherfactor which influenced the rate of deforestation in the area. To most communitymembers, democracy came to mean deregulation of state control. People wentinto the forests to get firewood, charcoal and other products without permissionand this led to complete deforestation of state reserved forests. Namatunu Forest

69 C.M. Masangano, D. Kayambazinthu and L. Mwabumba
which was about 10 kilometers away from Mangwero is an example of thisdeforestation.
Each of the villages which participated in the focus group discussions in Mdekaarea, had a VNRMC involved in re-afforesting Chilipa hill. They were engaged inplanting indigenous trees, protecting the trees from bush fires, controlled grazingsystems amongst other things. Their efforts were supported with funding by theMalawi Social Action Fund (MASAF). There were a number of non governmentalorganizations working in forest management in the area including World VisionInternational and Nkhomano Centre for Development.
Mangwero is a hill in Jamali village. This hill was fully covered by a forest, whichwas established and protected by people in the village. The village had a VNRMCwhose duty was to oversee the protection of the forest from bush fires, tree cutting,and pole and firewood collection, amongst other activities. There were no NGOsoperating in this area. The VNRMCs played a major role of mobilizing the communitiesto participate in forest activities in both Mdeka and Mangwero. They reported to theirvillage headmen.
Dzalanyama Forest is about 60 km to the south of Lilongwe City in LilongweDistrict. It lies along the boundary between Malawi and Mozambique covering parts ofDedza, Lilongwe and Nchinji Districts. The forest was composed of two parts thatincluded a government plantation and reserved natural woodland. The plantationforest surrounded the natural woodlands providing a wide boundary between localcommunities and the natural woodlands. The forest served as a water catchmentarea for Lilongwe City while the Ministry of Agriculture and Irrigation also used it as acattle ranch. Dzalanyama area received annual rainfall ranging from 800 to 1600 mmand mean annual temperatures ranged from 17.5 to 20 oC. The topography consists ofmoderately sloping plains and hills with shallow stony lithosols.
The communities around the forest were predominantly composed of the Chewatribe and followed the matrilineal system of marriage. Results of this study showedthat most of these local communities had co-existed with the forest from before thetime of colonization in the mid 1800s. Members of the community had been collectingforest products such as fruits, mushrooms, caterpillars, grass and firewood. At thetime of the study the communities were organized into village natural resourcescommittees, which were assisting in the management of the forest. These VNRMCsassisted both the village headmen and forestry staff in promoting the establishmentof both individual as well as communal woodlots in their villages. The VNRMCs alsoassisted the village headmen and forestry staff by organizing people in their villagesto participate in fighting bush fires and patrolling the forest. They also assisted insettling disputes on issues relating to the forest.
Chimaliro Forest is a miombo woodland 60km north of Kasungu Town in CentralMalawi. It forms the northern boundary of Lilongwe-Kasungu plain. The forest coversabout 160km2, lying along the Malawi/Zambia boarder. Part of the forest is in Zambiaand the management approaches of the forest vary in the two countries.Kayambazinthu, et al (2000) has provided more details about the forest. The annualrainfall in Chimaliro hills ranges from 800 to 1600mm with mean annual temperaturesranging from 22 to 24oC. The topography consists of moderately sloping plains and hillswith shallow stony lithosols.
The communities around the forest speak Tumbuka and follow a patrilineal marriagesystem. Their major economic activity is farming and their main crops include maize,

70 CONFLICTS OVER THE MIOMBO WOODLANDS
tobacco and groundnuts. Population density in the area is lower than most parts ofMalawi with an average of 74 people per km2 (NSO 1987). Chimaliro is a governmentreserved forest under the management of the Forestry Department. Communityinvolvement in natural resource management is, however, done under a co-managementarrangement where communities around the forest have organized themselves intoco-management blocks. There are three co-management blocks, each comprisingthree of the nine villages, of group village headman Boni Chakuchanya. These co-management blocks had block committees, which worked hand in hand with staff ofthe Forestry Department in the management of Chimaliro Forest. The block committeesassisted the village headmen and forestry staff by organizing people in theircommunities to participate in forestry activities such as fighting bush fires, patrollingthe forest and clearing fire breaks. The committees also assisted the village headmenand forestry staff in settling disputes on issues relating to the forest. In addition tothe blocks, each of the nine villages had their own village forest areas (VFAs) whichhad natural woodlots and in some cases planted exotic woodlots as well. These villageforest areas were managed by village natural resources management committees(VNRMCs).
4. TYPES OF CONFLICTSThis study revealed that communities living in the study sites experienced numerousconflicts surrounding natural resources. The major sources of conflicts were thosecentred on land and forest resources.
4.1 Land conflictsLand conflicts revolved around a number of areas, including land ownership andinheritance, boundaries, grazing animals in other people’s gardens, failure to returnborrowed land and land titling efforts. Cases where two or more people felt that theyhad a right to inheritance and ownership of one piece of land frequently caused conflicts.These conflicts most often occurred among people who were closely related and theyusually pointed at one common ancestor from whom each claimed to be a descendent.
Two types of boundaries that were sources of conflicts were garden boundariesand village boundaries. In both cases, the conflicts started with one party accusingthe other for not respecting the boundaries and therefore encroaching into the otherparty’s land. Conflicts on garden boundaries usually involved members of the samevillage while those of village boundaries occurred between neighboring villages. Oneexample of conflicts on village boundaries occurred in Dzalanyama where a villageneighboring Kapingiza village established a village woodlot on a parcel of land that layalong the village boundary. It was claimed that trees were planted on land that belongedto Kapingiza village.
Another form of conflict that was common in the sites involved grazing livestockin other people’s gardens and damaging crops. These conflicts were becoming morecommon as pressure on land was increasing with the rapid population growth. Peoplewere being forced to open grazing lands for cultivation and this was forcing livestockfarmers to graze their animals in non traditional grazing lands such as land very closeto cropped areas. Grazing in these types of land is risky as animals can easily go intothe gardens and damage crops.

71 C.M. Masangano, D. Kayambazinthu and L. Mwabumba
Another source of conflicts cited involved people who borrowed other people’s landfor cultivation for an agreed period of time but did not want to return it to the owner atthe end of the agreed period. This caused conflicts when the owner tried to claim theland back. The other issue, which the respondents in Dzalanyama recalled to have beena major source of conflicts in the 1970s, was the Government’s efforts to register land.Gowela and Kapingiza villages are in an area where the Lilongwe Land DevelopmentProgramme (LLDP) was implemented through the Ministry of Agriculture from the late1960s to the early 1980s. One of the Lilongwe Land Development Programme objectiveswas to undertake land registration. This was done in order to improve land informationsystems and increase productivity by ensuring more secure rights of land ownership. Itwas assumed that farmers would increase their capital and labour investment. It wasalso assumed that land registration would promote high value crop production, an examplebeing tobacco. Implementation of the land registration programme implied that theland tenure system would change from customary to some form of freehold. The parcelsof land were being registered in the name of the person cultivating it. People of LilongweDistrict are mostly of the Chewa tribe, following a matrilineal marriage system wherethe man follows and settles at the wife’s home. This means that the man cultivates onland belonging to the wife’s kin. By registering the land in the name of the personcultivating it, the land was being registered in the names of people who only came tomarry in the community and were not, by custom, legitimate owners of the land. Thishas been a major cause for numerous conflicts. Key informant interviews with staff ofthe Ministry of Agriculture and Irrigation revealed that these conflicts had continued upto the time of the study. In fact, with the expansion of Lilongwe City, most members ofthe community living close to the city have found it easy to sell their land to other peoplewho are interested in developing it into suburbs. Conflicts have also been experiencedin such transactions. These conflicts have usually occurred when the title holder of theland sells it without consulting other members who felt that they had legitimate claim ofownership to the land. In some cases the one trying to buy the land has ended up losinghis or her money in such conflicts.
Literature shows that another type of land conflict commonly experienced in Malawihas been occurring between government and local communities regarding land gazettedfor protected natural woodlands, national parks and wild life reserves. A number offorest reserves, national parks and wild life reserves were unilaterally declared publicland for purposes of protecting the resources on them. This was done without makingadequate consultations with the local communities who for a long time regarded thesepieces of land as theirs. They were using pieces of such land for their subsistenceneeds. This alienation of land occurred during the colonial and one-party era. Withpopulations increasing, there is much pressure on customary land and local communitiesare demanding that these alienated pieces of land be returned. The communities havereacted in several ways. In some cases they have encroached the forest reserves, andat other times, they have formally approached government to release some land forcultivation. One example of such a case is Matandwe Forest Reserve in Nsanje District,where Government has degazetted part of the forest and given it back to the community.
4.2 Conflicts around forest resourcesThe study revealed numerous conflicts around forest resources. Some of the conflictswere general to all the sites but others were specific to particular sites. These conflicts

72 CONFLICTS OVER THE MIOMBO WOODLANDS
took a number of forms including conflicts between individual members of the communitywhich occurred as a result of cutting or collecting wood resources from other people’sgardens, conflicts which developed as a result of cutting or collecting resources fromcommunal woodlands without permission and conflicts which developed around forestresources from plantations and reserved natural woodlands
Most of the conflicts can be better understood in the context of power relationsas well as rights to resources, which determined rights of access to the resources.Those people who had more power tended to have more access to the resources thanothers. Rights of access on the other hand tended to vary with the type of resource.There were those who had rights to land and all the forest resources on that land whileothers would have rights of access to some of the resources but not others. Forexample, while as the owner of land would have the right to cut down trees on his landother members of the community would only have rights to collect certain parts of thetree for such purposes as herbal medicines and natural fruit. Conflicts resulted whensomebody who was considered not to have rights to certain resources was caughtcollecting such resources.
4.3 Conflicts around private and communal forest resourcesWhile trees growing in people’s gardens were considered as private property, somepeople considered such trees, especially indigenous ones, as open access and enteredsuch gardens to cut and collect poles, firewood, handles for tools, etc. This was a majorsource of conflict. These types of conflicts occurred most frequently between the landlessor those people who had very little land and those who had relatively more land. Privatewoodlands were only maintained by those people who had adequate land. Those who didnot have adequate land could not afford to spare land for natural woodlots.
Another common source of conflicts was collecting and cutting wood resourcesfrom communal woodlands. These types of conflicts were more common in Mangwero,Dzalanyama and Chimaliro. These sites had substantial amounts of communal woodresources. Mangwero for example, is a hill with a fully established natural woodlandmaintained by the villagers from Jamaali Village. Many conflicts occurred betweenthe villagers and members of the VNRMC. The members of the village felt that sincethey had participated in the management of the forest, they were free to collectresources such as firewood and poles from the forest any time they needed them. TheVNRMC members who were charged with the duty to oversee the usage of resourcesfrom the forest restricted villagers from entering the forest. Members of the villagedisliked the VNRMC as a result.
These communal woodlands were, however, maintained for several purposes.Some were maintained as village woodlots, meant to provide various forest resourcessuch as poles, fuelwood and thatch grass for the whole village. The forests weretherefore governed by a set of rules mutually agreed upon by the whole village. Inmost cases, these rules specified procedures for harvesting and sharing resources.Conflicts normally occurred when some individual members breached such rules. Forexample, if an individual was caught cutting trees for poles or for making hand toolsor collecting firewood without permission from the village headman, he was consideredto have breached the rules and was subject to some penalties.
Graveyards were another type of communal woodlands, which existed in thevillages. Graveyards were considered to be sacred places where extraction of resources

73 C.M. Masangano, D. Kayambazinthu and L. Mwabumba
was considered as desecration and attracted various forms of punishment. Theresponsibility to monitor the usage of the resources in graveyards was loosely assumedby everyone in the village, since all members had the moral responsibility to reportany illegal activities in the graveyard to the village headman or to other village elders(Masangano et al. 1999). Harvesting of resources such as cutting trees or collectingfirewood from graveyards was only allowed during funerals and such resources wereonly to be used for the funeral. There were generally fewer cases of conflicts on treesfrom graveyards. The study revealed that generally people respected graveyards andthat anybody found cutting trees or collecting firewood from the graveyards was givenvery punitive punishments. Such punishments ranged from loss of credibility, beingignored and being ostracized to some cases of being evicted from the village. Membersof the community were essentially left on their own to devise rules governing themanagement of the graveyards and outsiders, including government, did not interfere.
Some of the graveyards were also used as places for conducting initiation activitiesfor gule wankulu. All the secrets relating to the nyau cult were maintained in suchgraveyards. Harvesting of woodland resources from such graveyards was strictlyprohibited and offenders, especially those not initiated, were heavily punished. Insome cases punishments would result in death.
While outside interference on sacred woodlands was strictly not allowed, literatureshows that there have been isolated incidents, especially in the colonial era, wheregovernment interfered in the name of development. Such violations ended up creatingenormous conflicts with the communities. There are on the other hand, some mythsrelating to the magical resilience of these sites, and the fear associated with suchmyths have in most cases kept the woodlands undisturbed.
Some trees are left in the village to serve certain purposes. Some were left toprovide shade in meeting places such as local courts (bwalo la milandu) and the groundsfor traditional dances (bwalo la gule wankulu). Such trees were not supposed to becut and people caught cutting them were subject to various forms of penalties. Thefocus group discussions revealed that there were some cases where individuals werecaught either cutting branches of such trees or collecting firewood from them and thiscaused some conflicts.
4.4 Conflicts around forest resources from the plantation forest andreserved woodland
Forest resources from the government plantation forest as well as those from thereserved natural woodlands were a source of frequent conflicts. These conflicts havechanged over time and can therefore be looked at in four time periods: the pre-colonial period, the colonial period, the one party era and the present period.
Management of natural woodlands in the pre-colonial period was basically in thehands of local communities. It seems that the local communities tended to maintainstrong values regarding cutting down of trees and collection of natural resources fromthe woodlands. Coote et al (1993) studied local communities in the post-colonial era,and isolated some of the values which existed from the past. They observed thatcommunity members from Chemba village revered certain trees to the extent thatthey could not cut them nor do any harm to them. They gave an example where in oneparticular case people believed that when one villager set fire and burnt a certain treeto ashes, he developed swellings on his body that were similar to the swellings the tree

74 CONFLICTS OVER THE MIOMBO WOODLANDS
had. Members of the Chemba village believed that this person’s death was a result ofwhat he did. Other literature indicates that the chieftainship was the main politicalinstitution and chiefs were believed to have both political and religious power. Thepolitical and religious power that the chief had was a source of cohesion in the socialsystem. Enforcement of the chief’s orders was either through the territorial chiefs,councillors and clan leaders. There is not much recorded on conflicts experienced inthis period
The coming of the European missionaries and settlers changed the institutionalset up of local communities. The Europeans and settlers regarded the local institutionsas uncivilized and backward. They therefore introduced Christian values and a centralstate system of government. The role of traditional institutions was de-emphasisedbut the traditional chiefs and clan leaders were maintained with their role redefinedas that of custodians of the state system. This weakened the powers of traditionalinstitutions in favor of the state institutions such as the police, judicial system as wellas government ministries and departments. The coming of the post-colonialgovernment did not change the situation; instead it further consolidated power to thegovernment under the one-party system of government. Management of resourcesstrictly followed a top-down approach and local communities were cultured into a systemof simply receiving instructions from the top. Traditional institutions were mouldedinto a form of local government.
This is the time when most woodlands were unilaterally declared reserved forestsand national parks. Management and use of resources from forest were strictly undergovernment control. Local communities were not allowed access to forest resources.This was despite the fact that these forests provided many resources important to thesurvival of the communities. This caused many conflicts as members of the localcommunities were very often caught either cutting poles or collecting firewood andmaking charcoal in the forests. Those caught were either fined or the resources wereconfiscated from them; in some cases they had their tools confiscated. Staff of theForest Department were even mounting road blocks to control the movement of charcoalfrom forests to the market. This action resulted in major conflicts not only with thecharcoal makers, but also the transporter-traders. These conflicts became more overtat the time when the multiparty democracy was being introduced. This political changegave opportunity for people to express their views. This was coupled with the conceptionof democracy as a complete deregulation of government institutions. Experiences atNamatunu Forest Reserve provide a good case whereby abundant natural forest resourcescovering hundreds of hectares were cleared within days. Efforts by staff of the ForestDepartment to control the situation were violently challenged by the local people. In onecase, it was reported that a staff member of the Forest Department was actually tied toa tree by a group of women who were caught collecting firewood from the forest.
Although efforts to promote communal management started towards the end ofthe one-party system of government, government started putting more effort to itwhen the multiparty system of democracy was introduced. With democracy, peoplewere generally being encouraged to participate in various development programmesincluding management of reserved forest resources. Local communities were beingencouraged to organize themselves into VNRMCs. These VNRMCs were workingtogether with local leaders and forestry staff in the management of the forests.They also took a leading role in promoting the establishment of individual andcommunal village forests. These VNRMCs were very often found in conflict situations

75 C.M. Masangano, D. Kayambazinthu and L. Mwabumba
with individual members of the community who were caught harvesting and collectingforest resources from the plantation forest and the reserved natural woodlands withoutpermission. The study revealed that conflicts occurred between different groups ofpeople such as conflicts between local communities and staff of the ForestDepartment, and conflicts between communities living close to the forests and thosefrom distance places from the forest. The resources which, frequently caused theseconflicts, included poles, firewood and charcoal, and sometimes wood for tools.Similar conflicts occurred when these individuals were caught by staff from theForestry Department. Most of the entrances into the forest were guarded and nobodywas allowed to go into the forest without a permit, but individuals used illegal entrypoints to the forest.
Sometimes conflicts developed between community leaders or the community asa whole and staff from the Department of Forestry. These conflicts usually developedbecause the local communities felt that they were not getting enough benefits for theefforts they put in the management of the plantation forest and reserved naturalwoodlands. The local communities were required to assist in policing the forest,making sure that individuals did not go into the forest to harvest or collect resourceswithout permission. The communities were also required to assist in fighting bushfires in the forest. The community leaders were required to assist in settling disputes,which occurred when community members were caught in the forest. In return forthis, the local communities were permitted to collect some resources such as grass,mushrooms and caterpillars. They were also allowed to collect a specified amount offirewood and poles at designated times. Outside the specified amounts, the communitymembers were required to pay before they could collect firewood and poles. Asmembers of communities living close to the forest, they were given a discount tocollect these resources. However, the local communities expressed dissatisfactionwhen they compared these benefits with the efforts they put into the management ofthe forest. They argued, for example, that if a member of the local community washurt when fighting bush fires, there was no insurance or medical scheme to take careof such a situation. They also argued that, while they fought the bush fires togetherwith staff from the Forestry Department, they were not paid anything for their effortswhile Forestry staff received a salary. They also argued that they expected to be givenpreferential treatment when it came to employment of labourers to work in the forest,but this was not happening.
In Dzalanyama, conflicts developed between communities living close to the forestand those from distant places. The communities living close to the forest were allowedto collect or harvest certain resources free or at discounted rates. This gave them amarket advantage in that they could sell these resources at a higher price to peoplewho were not living close to the forest. However, those people from distance placesdid not recognize the legitimacy of giving preferential treatment to those communitiesaround the forest and tried to enter the forest through illegal entry points or byconvincing forest guards that they were members of the communities close to theforest. This caused many conflicts when they were caught. Similar conflicts occurredin Chimaliro Forest between block members and non-block members. Non-blockmembers did not recognize the legitimacy of giving preferential treatment to theblock members.
On a gender perspective, women tended to be more concerned with forestresources which were required for domestic purposes while men needed the forest

76 CONFLICTS OVER THE MIOMBO WOODLANDS
resources for commercial purposes. In most cases, women went into the forest tocollect firewood, mushrooms, caterpillars and thatch grass for domestic purposes.Men on the other hand were more interested with resources they could sell for cashsuch as firewood, charcoal and wood for hand tools. The male-favoured resourcescaused conflicts because their harvesting had a major impact on sustainability.Charcoal making, for example, involves cutting live trees and often causes bushfires. Despite the fact that the resources collected by women had less impact on theforests, women tended to experience more conflicts with forest staff. This wasbecause they needed to collect firewood often for domestic purposes. Failure tocollect the firewood meant that they would be unable to prepare food requiringlengthy cooking.
5. CONFLICT RESOLUTION AND MANAGEMENTConflict resolution and management in Malawi can best be understood in the contextof the four political eras previously described. Management of natural resourcesin the pre-colonial period was basically in the hands of the local communities.Literature on Malawi as well as other neighboring countries shows that localcommunities in the pre-colonial era had institutional structures which assisted inthe sustainable management of natural resources. Moore and Vaughan (1994)have provided a good historical description of the Bemba people of Northern Zambia.The key social and political institution of this tribe was the chieftainship. Thechieftainship centred on the paramount chief (Chitimukulu) who was believed byhis subjects to have religious powers. The belief in his religious as well as politicalpowers was a source of social cohesion throughout his chieftainship. Similarinstitutional arrangements existed among the Ngoni of Central and Northern Malawi,Nkhonde of Karonga. Enforcement of the chief’s orders was through a system ofterritorial and other lower chiefs. Below the paramount chief were the territorialchiefs who ruled on behalf of the paramount chief. The paramount chief hadpowers to remove and replace the territorial chief if he felt it necessary, on groundsof poor leadership.
Similar cases have been recorded in the Shire Highlands localities of SouthernMalawi. People of the Nyanja and Lomwe tribes used to live in clans/villages composedof clan members (members of close kin). Clan leaders used to have a team of villagecouncillors who used to assist the clan leader on issues such as presiding over cases ortrials between clan members. The clan leaders were under tribal chiefs who led thewhole tribe living in an area. The chief had councillors who assisted him during trials.Enforcement of the chiefs order was through the councillors and the clan leaders. Thiswas also true for the Chewa and Tonga people who settled along the shores of LakeMalawi.
As discussed above, this institutional set up changed with the coming of theEuropean missionaries and settlers. They weakened the power of local institutions infavour of the state institutions. The situation worsened with the introduction of theone party system of government.
The role of local institutions as well as local governments is now being recognized.Active participation of the local communities is being emphasized now. In additionthere is now a decentralization policy in place and the Department of Forestry ispromoting communal involvement in the management of forest resources. It should

77 C.M. Masangano, D. Kayambazinthu and L. Mwabumba
be noted however that the local institutions are still in a weakened state and it willtake sometime before they can effectively manage the natural resources, as well asthe associated conflicts.
Conflict resolution in the different study sites was similar. Conflict resolutiongenerally started with the complainant approaching the defendant. The case wasreferred to the village headman if the two parties failed to resolve their conflict. Thevillage headman brought the two parties in conflict together in the presence of otherelders people to discuss the issue at a local court (bwalo la milandu). If the source ofconflict was land, or garden boundaries, then the discussions were held at the site ofgarden. If the defendant was indeed found guilty he or she was either issued a warningby the village headman or asked to pay a fine, which was usually in the form of moneyor livestock such as chickens or goats. The fine was usually in two parts; one part tocompensate the one who was offended and the other part was paid to the villageheadman as court charges. Conflicts that failed to be resolved at village headman’slevel were referred to the group village headman or the chief at a traditional authoritylevel. Criminal cases such as those where conflicts resulted in a fight causing injuryor those which, involved theft of peoples’ property were directly referred to the policeand were resolved in magistrate courts.
Conflicts around communal forest resources such as village woodlots, graveyardsand trees in local courts and grounds for traditional dances were resolved slightlydifferently from others. Offenders in these types of conflicts were brought to thevillage headman who in consultation with the village natural resources committees(VNRMCs) decided on a fine for the offender. Unlike in other cases, the fine here waspaid only to the village headman as court charges or to be used for village developmentactivities. Cutting trees or collecting firewood from graveyards was considered amore serious offence than others, because graveyards were considered to be restingplaces for the spirits of ancestors and were not to be disturbed. As such, nobody wassupposed to enter a graveyard alone. Anybody found in a graveyard was consideredto be a magician or a witch and was usually ostracized by the rest of the villagers.Anybody cutting trees or collecting firewood in a graveyard suffered much heavierpunishments. Apart from being ostracized, the offenders were asked to pay muchheavier fines and the money realized from such fines was used to purchase utensilsand tools to be used for funerals. Offenders who failed to pay such fines, as well asrepeat offenders, were either evicted from the village or not allowed to bury theirclose relatives in graveyards in the village. The offenders themselves were also notallowed to be buried in the village. The only time people were allowed to cut treesor collect firewood from a graveyard was when a funeral occurred in the village andthe firewood or tree was only to be used for the funeral activities.
Conflicts around forest resources from the plantation forest or reserved naturalwoodlands were resolved in a different manner. Offenders caught illegally harvestingor collecting resources from the plantation or reserved natural woodlands were takento the Department of Forestry offices where forestry staff together with local leaders,including village headmen and representatives of the VNRMCs or block committeesreviewed the case. Punishments varied depending on the type of offence. Small finesin monetary terms were imposed to those caught collecting firewood. Those caughtharvesting resources that involved cutting trees had stiffer punishment, such as theconfiscation of tools.

78 CONFLICTS OVER THE MIOMBO WOODLANDS
6. DISCUSSION AND CONCLUSIONSIn summary this study has revealed that forest resources are a source of many conflictsin the areas studied. These conflicts occurred among different groups of peopledepending on the type of resource. Some conflicts occurred between individualmembers of the communities. Other types of conflict occurred as a result of individualswho were caught harvesting resources from communal forests without permission,while others occurred as a result of resource poaching from the plantation and reservednatural woodlands.
Malawi is going through some major political changes as a result of the introductionof a multiparty system of government. The Malawian society is now opening up andpeople are more proactive. People should be and are demanding to be allowed toparticipate more actively in the development process. They should be allowed toparticipate in decision-making, implementation as well as in benefit-sharing. Thisdevelopment is occurring at a time that the country is experiencing major reductionsin levels of public resources. This means that government cannot run most of itsdevelopment programmes without the active involvement of local people. One waythat government is responding to this is by promoting the process of decentralization.Currently the country has a decentralization policy, with an act of parliament alreadypassed. As such local communities have to be organized into structures that canadequately represent them in various development activities. The promotion of VNRMCsis one way of promoting local participation in the management and utilization ofnatural resources. One problem, however, is that this is a new institutional structure.One has to ask whether the introduction of the new structures is not going to create anew set of conflicts or create confusion among institutional structures. One needs tonote that the decentralization policy is also promoting another set of institutionalstructures: village development committees, area development committees and districtassemblies. We recommend that the institutional structures be streamlined, with anintroduction of sub-committees so that conflicts and confusions are minimized.
Local communities need to be empowered with clearly defined rules on rights toresources and the boundaries of those resources if local participation in the managementof natural resources is to be sustainable. The role and authority of the local communitiesneeds to be clearly established. The case of Mangwero provides a lesson where villagemembers disliked the VNRMCs. VNRMCs need to have clearly defined roles andresponsibilities.
There should also be congruence between the rules that assign rights and therules that assign costs. Local communities should not be expected to invest theirenergies to the management of natural woodlands if they don’t receive adequatebenefits. The case in Dzalanyama where the local communities felt that their effortsin fighting bush fires and patrolling the forest were not being adequately compensatedprovides a good example. Government policies need to be reviewed in the interest ofpromoting more community involvement in the management of the resources.
ENDNOTES1. A village headman looked after a village, which usually comprised of a grouping of households
made up of people belonging to the same clan or kinship, and were, therefore closely relatedpeople. Several villages in one area were grouped together and looked after by a group villageheadman. A chief on the other hand, looked after an area with several group village headmen. Thechief normally reported to the district commissioner of the particular district.

79 C.M. Masangano, D. Kayambazinthu and L. Mwabumba
REFERENCESCoote, H. C., Luhanga, J. M. and Lowore, J. D. 1993 Community use and management
of indigenous forests in Malawi: The case of Chemba Village Forest Area. FRIMReport No 93006, Forest Research Institute of Malawi, Zomba.
Kayambazinthu, D., Mwabumba, L. and Masangano, C. 2000 Institutional change andfactors driving change in the miombo region: Case studies in Malawi. A paperpresented at the workshop on policies governance and harvesting miombowoodlands at Arusha International Conference Centre, Tanzania, 7-14 October 2000.
Masangano, C. M., Kayambazinthu, D. and Mwabumba, L. 1999 Management of miombowoodlands: The case of Malawi. A review on institutional arrangements governingthe management of miombo woodlands. Forest Research Institute of Malawi, Zomba,Malawi.
Moore, H. L. and Vaughan, M. 1994 Cutting down trees: Gender, nutrition and agriculturalchange in the Northern Province of Zambia, 1890-1990. Social History of Africa.James Currey, London.
Mwabumba, L., Masangano, C. M. and Kayambazinthu, D. 1999 Communal managementand utilisation of miombo woodlands in Malawi: Results of a participatory ruralappraisal in Blantyre, Lilongwe and Kasungu Districts. Forest Research Institute ofMalawi, Zomba, Malawi.
Robinson J. W. 1980 The conflict approach. In: Christenson, J.A. and Robinson, J.W.(eds.) Community development in America, 73-95. Iowa State University Press,Ames, USA.
Robinson J. W. and Clifford R. A. 1977 Conflict management in community groups.University of Illinois Coop. Ext. Service, Urbana, USA.

7.An overview1: The influence ofmajor policies on forestry
G. Kowero
1. AGRICULTURAL POLICIES AND LEGISLATION AND FORESTRYDEVELOPMENT IN SOUTHERN AFRICA
Agriculture is critically dependent on environmental resources such as land, water,forest, and air. However, the use of these resources can affect, directly or indirectly,other natural resources through dynamic and complex interrelationships existing inthe natural systems. This implies that wrong use of land, water, and forest in theproduction of crops and livestock can have far-reaching effects on environmentalintegrity. To avoid any adverse consequences, agricultural sector policies must fit inthe overall environmental policy. This is critical in guiding proper and balanced use ofnatural resources and in defining sectoral responsibilities for environmentalmanagement. Agricultural policies, besides being internally consistent, must providefor a mechanism to link the sector with other sectors in protecting and enhancingenvironment.
In the pre-colonial period agricultural production was based on traditional technologywith shifting cultivation or fallow systems as the means to maintain labour productivityand to regenerate soil fertility. Low population density in most areas permitted longperiods of fallow, which contributed not only to soil fertility regeneration but also allowedforest regeneration. Although shifting cultivation was one of the major agriculturalproduction practices, this was not carried out indiscriminately. Some areas were reservedfor other functions such as water catchment protection, livestock grazing as well asreligious rituals and ceremonies. Traditions and/or customs prevailing at that time inthe clan or tribe governed the ownership of the means of production and assets, i.e.land, labour, livestock and the few farm implements. Thus, the problems related to orarising from the “haves and have-nots” never arose in most societies. Production and

81G. Kowero
distribution systems were organized such that whatever was being produced or gatheredwas geared first to family needs, second to the clan, third to the tribe and only finally tointer- and intra-tribe trade. Thus, local resources were mobilized and utilized to producecommodities or products that were needed locally by the community.
There is little evidence to show that during the era most close to the colonialperiod crop production strained land/forest resources in most areas. The exceptionwould be areas with high population densities and easy access by international traders.However, there is evidence to show that growing land scarcity in some areasnecessitated movement of people to other parts to open land for agriculture. Lowpopulation densities in most areas, existence of customary rules governing the use ofnatural resources and local knowledge about the environment explain the limiteddegradation of land and forest resources during this period.
The colonial period saw the creation of a dual agriculture-led economy characterisedby peasant/smallholder and commercial sectors. The commercial sector, referred to asthe estate sector in some countries like Malawi, had access to the most productive landwhile the smallholder sector was mainly relegated to marginal lands. There was massiveforest clearing in both sectors for crop production and supporting infrastructure followingthe strategies employed in agricultural production that favoured the commercial sector.The low prices of agricultural products to smallholders as well as restricted access tomarkets, credit and extension services did not promote an increase in marketed surplus.On the contrary, non-farm activities and off farm employment were promoted as alternativesources of income, thereby reducing the labour available for crop production and possiblyconstraining deforestation. However, some of these activities were conducted in theforests, which resulted in deforestation and forest quality deterioration. Further, withlow incomes investments in agriculture were negligible, leading to land exhaustion andneed for ‘new’ land which was excised from forested areas.
Post-independence governments in Southern Africa have not managed to changethis asymmetry in agricultural development. We continue to have on the one hand poorsmallholder farmers on small, shrinking plots of land with limited capacity to makemeaningful responses to economic production incentives as these would require themto make minimal investments in agriculture (e.g. buying fertilizers, pesticides, andother inputs), or to expand agricultural land so as to take advantage of economies ofscale. On the other hand we continue to have relatively rich estate/commercial farmerswith big farms, which are rarely fully cultivated. These farmers can respond to economicpolicies by expanding the area under crops and making investments to improveproductivity. This imbalance has contributed to increased rural poverty and createdincentives for rural communities to encroach on any land available in order to increaseagricultural production. Increasing poverty is promoting a drastic surge in informalbusinesses, which largely involve forest products like firewood, charcoal, woodcarvings,and non-timber products. The sustained supply of such products cannot be ascertained,let alone the extent of deforestation or degradation of the forest estate.
Increasing privatisation and individualism and the onset of property rights implythat the smallholder farmers will continue to be confined to small plots for theiragricultural and forestry related needs. Increasing populations on the shrinking croplandcombined with increasing poverty will rapidly deplete these areas of their forestresources as local communities expand cropland.
The development process, either at individual or government level, requiresresources. Governments as well as individuals still continue to rely mainly on agriculture

82 AN OVERVIEW: THE INFLUENCE OF MAJOR POLICIES ON FORESTRY
for this. Like in the colonial period, post-independence governments continued to giveemphasis to export crops with cropland expansion very significant in this period, andaccompanied by increased rates of deforestation.
Many countries continued for many years after independence without acomprehensive agricultural policy. The agricultural sector was guided by a number ofpolicy statements and strategies which were part of larger programmes known byvarious names like rural development plans, integrated rural development programmes,five year development plans, etc. Otherwise they were part of major politicalpronouncements, like the development strategy for Mozambique that was formulatedin the third FRELIMO party congress of 1977. This was the period preceding economicreforms or pre-economic structural adjustment programme period (pre-ESAP period).During this period the main agricultural strategy mostly remained the one inherited atindependence, with the estate farmers largely producing for both domestic and exportmarkets, while smallholder farmers produced mainly for subsistence and the domesticmarket. The latter saw increased production through agricultural extensification, whilethe estate sector realized good productivity growth through agricultural intensification.Further, governments continued with the institutional, technological, and pricingdifferentials between estate/commercial farmers, state monopolies, and cooperativeson one hand, and smallholder farmers on the other. This discouraged the latter frommaking any meaningful investments in agriculture, encouraging peasants to continueto mine the land and the few forests and trees left.
The ESAP period is characterised by rapid erosion of some of the pre-ESAPagriculture related policies and legislation. These included a gradual to completeelimination of subsidies on agricultural inputs; the increasing role of the private sectorin agricultural production, distribution of inputs, and marketing of agricultural output;and the increasing role of market forces in the pricing of agricultural inputs and outputs.
The implications of the individual ESAP policies on agriculture and eventually onforest cover in this region have not been sufficiently studied and therefore needfurther scrutiny. However, the potential of these policies to increase land underagricultural crops in this region has been demonstrated in various studies. Expansionof cropped area and livestock grazing remain the major sources of deforestation anddegradation of forests and woodlands. Further, apart from forests under governmentcontrol, forests and trees are more abundant in estate/commercial farms as comparedto smallholder farms. The estate/commercial farms face deforestation while smallholderfarms are candidates for agroforestry.
2. LAND POLICIES AND LEGISLATION AND FORESTRYDEVELOPMENT IN SOUTHERN AFRICA
During the pre-colonial era forest and woodland resources were governed by customaryrules and regulations that limited access to some areas such as sacred groves andgraveyards, and controlled tree cutting through a series of taboos. Traditional leaderswere responsible for exercising control over how land and associated resources wereutilised in areas under their occupation. The traditional leaders were responsible forfar much less land area compared with the land areas under present day centralgovernments. Also at that time there were fewer stakeholders and with less demandson the forest estate. Their demands were mainly in terms of fruits, firewood andfodder for livestock, and simple building materials like poles and thatch grass. Forests

83G. Kowero
were also used for spiritual purposes. These demands shaped the objectives foradministering the forest estate. The means or instruments employed for achievingdesired objectives constituted management prescriptions on protecting and conservingtrees and forests as well as on harvesting products from the same. Shifting cultivationwas a characteristic feature of agricultural production. Due to the small human andanimal populations characteristic of this era, land pressure was in many areas low andwas not a threat to forest and woodland resources.
The colonial era policies are largely responsible for the present day land tenuresystems. The major settlement thrust during this period was geared towards agricultureand therefore the land use patterns were influenced by the distribution of fertile landand segregation between settlers and indigenous people. The major effect of thealienation of land and other natural resources was the loss of control and ownership oftraditional land rights. This translated into an erosion of traditional institutional capacityto manage natural resources, including forests. At the same time the colonialadministration lacked the capacity to monitor, control and manage natural resourcesin publicly as well as in communally owned areas. This led to encroachment anddestruction of forests in these areas, especially in native reserves where populationpressure was high. Extensive destruction of forest and woodland resources also occurreddue to the establishment and expansion of plantation agriculture and plantation forestry.However, large tracts of forest and woodland resources were protected during this erafollowing the establishment of national parks and forest reserves. The exclusion policiesunder which these were managed were contested by displaced communities and thoseliving adjacent to them, and both groups claimed the right of use by virtue of proximityand historical connections.
The post-independence era was characterised by attempts to redress the landimbalances inherited from the colonial era through land redistribution and resettlementprogrammes. This resulted in clearance of forests and woodlands for agriculture andsettlement purposes. There were also very significant changes in the institutionsgiven the responsibility to manage natural resources, including forests, with theresponsibility for communally owned resources reverting to customary institutions(rural district councils in the case of Zimbabwe) or locally based elected structures.Despite these changes the land tenure categories inherited at independence, as well asthe management regimes, were largely unchanged.
In addition, the following are noteworthy of this period:(i) The restoration of traditional authority in land administration and local institutional
capacity building this period were noted to have the potential for improved managementand utilisation of natural resources including forests. Studies on community-basedmanagement of natural resources in Tanzania, Malawi and Zimbabwe have demonstratedthe efficacy of a change in institutional structure in the productivity of wildlife andfisheries, for example, the Duru-Haitemba community-based forestry programme,CAMPFIRE, and Lake Chilwa Fishery, respectively.
(ii) The importance of boundaries for community land, their potential problems,the need for strong institutions, and sharing benefits from natural resources havebeen addressed in present land policies. However, for the latter it is necessary toestablish a more detailed and perhaps procedural legal instrument to guide the sharingof benefits (for all involved stakeholders) generated out of common property regimes.In particular, the enforcement of such an instrument in order to guarantee that communitiesaccrue such benefits is paramount for their engagement in the sustainable use of natural

84 AN OVERVIEW: THE INFLUENCE OF MAJOR POLICIES ON FORESTRY
resources. Such communities have, up to the present, not gained any significant andlegally recognized returns from forest resources, except direct consumption of forestproducts.
(iii) One avenue for increasing access to land was observed to be through thecreation of and improvements in land markets. This element is an integral part ofthe proposed land policies. Attaching value improves efficiency in resource allocationsince scarcity determines the extent of resource utilization. Since there is a directlink between land and forests, logic would dictate that pricing of the former woulddirectly affect the value of the latter and therefore the level of utilization, andhence incomes from such products, if the costs could be directly transferred to theconsumer. The development of land markets through land policy reform wouldprobably be indeterminate to national forest cover, in that estate farmers holdingunused land under forests or woodlands will most likely give up such land to thestate, increasing the proportion of protected forests. However, should the statereallocate such land to the landless, then the area under forests or woodlands willdecrease.
(iv) Low investment on customary lands has often been associated with high levelsof insecurity due to the absence of property rights to the individuals occupying them. Itis also argued that the tight social structure and traditional norms in rural areas confergroup security to members who possess use rights to customary land. To what extentthe latter promotes investment is not certain. However, elements of the proposedpolicy reforms purport to secure individual as well as group security of customary land,thereby enabling these communities to use land as collateral for investment funds.Assuming that group security is likely to prevail in the new land policies, it follows thatthere is likely to be no change in tree tenure.
(v) Some of the proposed changes in land policy in Zimbabwe are likely to involveredistribution of about eleven million ha of land from the large-scale commercial farmers.Based on previous experience, the implication of this is that large areas of woodlandswill be cleared for agriculture. Thus, some measures to mitigate the hazards of wantondestruction of vegetation need to be put in place.
(vi) Improvement in forest cover will be contingent on effective inter-sectoralharmonization and coordination of programs and activities dealing with common issuesin natural resources management, such as increasing demands for energy, agriculturalland and construction materials. Harmonization and coordination will require a reviewof sectoral policies, identifying areas of common interest and mapping out jointstrategies. This can succeed if rural development actors adopt a consultative andholistic approach on the ground and not only at the development planning level, as islargely the case at present.
(vii) By and large the new resource tenure legal frameworks in the regionestablish the basis for ensuring access to the resources for all stakeholders, therebyenhancing common property regimes and sustainable use and management of naturalforest resources. However, the challenge to the governments as well as to relevantnon-governmental organisations is to devise ways to move towards a more stablesystem of secure property rights based on land tenure and market allocation,grounded in law, upheld by the courts of law, and observant of people’s needs andpreferences.

85G. Kowero
3. SECTORAL FOREST POLICIES AND LEGISLATION AND THEIRINFLUENCE ON FORESTRY DEVELOPMENT IN SOUTHERN AFRICA
In the pre-colonial era, there was an unwritten sense of direction in some forestrymatters of relevance to the local communities. In addition there were intentions/objectives, regulations, knowledge and other means to guide related tree and forestactivities, as well as recognised and respected authority over the resources. Therewas a parallel role with present day forestry management, in that forest reservationwas practised on the basis of very localised interests which the communities subscribedto, while present day gazettement of forests takes on broader national and globalconsiderations which local communities might not be aware of. Also there wererestraints and guidelines on managing and harvesting tree and forest products muchas we find today in forestry.
The colonial era brought many changes in the lives of local people and in theadministration and management of natural resources. The broad colonial policy declared‘unoccupied’ lands as state property, and this marked the beginnings of ‘nationalisation’of property by the state. This period marked the beginning of the disruption of commonproperty regimes. Apart from present day imbalances in access to land in some of thesecountries, the colonial administrations were largely responsible for shaping present dayforest resources and their guiding policies and management practices. One of the mostsignificant developments during this era was the introduction of the concept of a‘state’ or ‘nation’, and formal national policies and legislation. Forestry matters beganto be examined and governed in the context of district, province and nation; alienconcepts. The colonial administration imposed restrictions on access to trees and forestresources, by gazzetting these as state property, and introduced administrative toolsfor the national forest estate. The colonial governments were preoccupied withgazettement, and harvesting commercially important natural forests mainly for export.The major players in forestry were governments and the private sector; there wasminimal involvement of local communities, with the notable exception of Malawi,where ‘village forest areas’ were initiated. However, environmental concerns weregiven attention in light of noted adverse effects of deforestation, albeit with differingemphasis across countries. Forest administration was given little weight, despite theextensive coverage of the forests in the region, being initially placed under agriculturaldepartments or as small departments/sections under the ministries responsible foragriculture. The absence of a clear vision in some countries, and commitment in virtuallyall countries, on how the sector should have developed resulted in haphazard oruncoordinated development of the sector, which continued even after these countriesbecame independent.
The independence period is characterized by two economic regimes, the pre-economic reform period (also known as the pre-economic structural adjustment, orpre-ESAP, period) and the economic reform or ESAP period. The pre-ESAP periodbrought major changes as national governments tried to bring immediate positive changesin the lives of their people. In some cases this resulted in political ambitions overridingeconomic logic, political policies replacing sectoral policies, and sectoral policies fromother sectors having preference over forestry sector policies in their own domain. Theresults were varying levels of encroachment into forest areas as well as constrainedgrowth of the sector. Further, forestry policies were not revised immediately afterpolitical independence to take into account peacetime socio-economic orientations bythe national governments. This was partly due to the fact that the economies of these
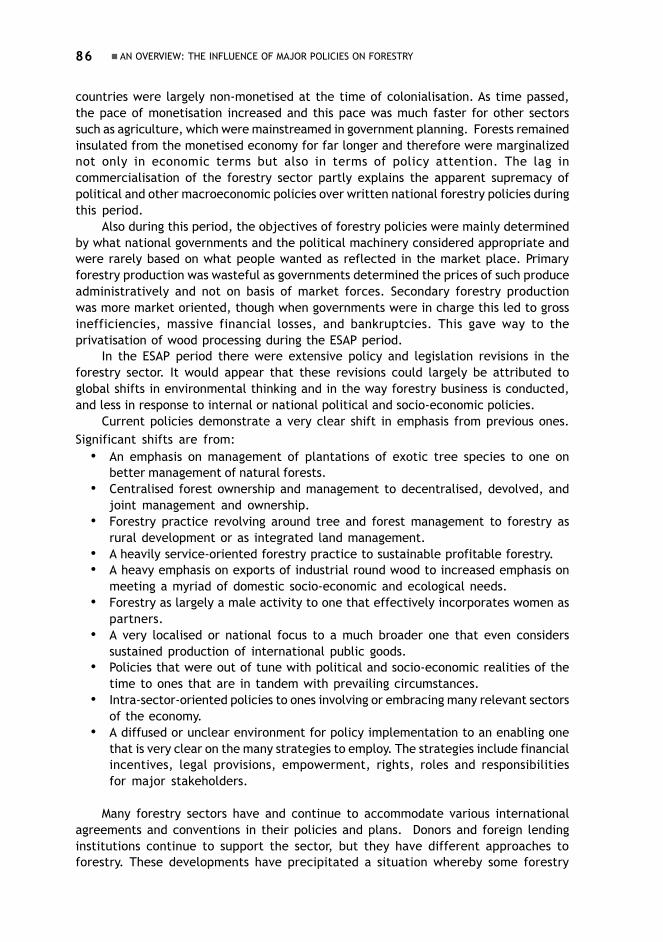
86 AN OVERVIEW: THE INFLUENCE OF MAJOR POLICIES ON FORESTRY
countries were largely non-monetised at the time of colonialisation. As time passed,the pace of monetisation increased and this pace was much faster for other sectorssuch as agriculture, which were mainstreamed in government planning. Forests remainedinsulated from the monetised economy for far longer and therefore were marginalizednot only in economic terms but also in terms of policy attention. The lag incommercialisation of the forestry sector partly explains the apparent supremacy ofpolitical and other macroeconomic policies over written national forestry policies duringthis period.
Also during this period, the objectives of forestry policies were mainly determinedby what national governments and the political machinery considered appropriate andwere rarely based on what people wanted as reflected in the market place. Primaryforestry production was wasteful as governments determined the prices of such produceadministratively and not on basis of market forces. Secondary forestry productionwas more market oriented, though when governments were in charge this led to grossinefficiencies, massive financial losses, and bankruptcies. This gave way to theprivatisation of wood processing during the ESAP period.
In the ESAP period there were extensive policy and legislation revisions in theforestry sector. It would appear that these revisions could largely be attributed toglobal shifts in environmental thinking and in the way forestry business is conducted,and less in response to internal or national political and socio-economic policies.
Current policies demonstrate a very clear shift in emphasis from previous ones.Significant shifts are from:
• An emphasis on management of plantations of exotic tree species to one onbetter management of natural forests.
• Centralised forest ownership and management to decentralised, devolved, andjoint management and ownership.
• Forestry practice revolving around tree and forest management to forestry asrural development or as integrated land management.
• A heavily service-oriented forestry practice to sustainable profitable forestry.• A heavy emphasis on exports of industrial round wood to increased emphasis on
meeting a myriad of domestic socio-economic and ecological needs.• Forestry as largely a male activity to one that effectively incorporates women as
partners.• A very localised or national focus to a much broader one that even considers
sustained production of international public goods.• Policies that were out of tune with political and socio-economic realities of the
time to ones that are in tandem with prevailing circumstances.• Intra-sector-oriented policies to ones involving or embracing many relevant sectors
of the economy.• A diffused or unclear environment for policy implementation to an enabling one
that is very clear on the many strategies to employ. The strategies include financialincentives, legal provisions, empowerment, rights, roles and responsibilitiesfor major stakeholders.
Many forestry sectors have and continue to accommodate various internationalagreements and conventions in their policies and plans. Donors and foreign lendinginstitutions continue to support the sector, but they have different approaches toforestry. These developments have precipitated a situation whereby some forestry

87G. Kowero
departments/services have been caught in a loop of continued planning to suit thesedemands. The consequences include strain on both human and other resources forimplementing forestry plans, the confusion these demands continue to create in thesector, and the loss of a long-term planning horizon in forestry.
4. ECONOMIC REFORMS HAVE BEEN ROUNDLY BLAMED FORACCELERATING DEFORESTATION AND WORSENING POVERTY.HOW HAVE THESE FEATURED IN THE MIOMBO REGION?2
We have used the experiences of Malawi, Mozambique, Tanzania and Zimbabwe toexamine the likely consequences of ongoing macroeconomic policies on the economicdevelopment of these countries, and assess the implications for forestry development.Macroeconomic policies affect the main variables that make forest conversion, woodprocessing and trade attractive. We find that economic performance has marginallyimproved under ESAP macroeconomic policies compared to pre-ESAP macroeconomicpolicies. The four countries have done quite well in economic growth terms, growingat an average of 3.9% per annum over the SAP period. This is higher than economicgrowth in the pre-ESAP period. Comparatively, this growth performance surpasses theaverage for sub-Saharan Africa, Southern Africa and low-income countries.
4.1 On deforestationWe hypothesise that macroeconomic policies have mainly two effects on forestrydevelopment. First, by affecting the distribution of income and poverty, macroeconomicpolicies impact on the forestry sector because of poorly distributed national income(and rising poverty) that forces individuals to denude forests. As wild plant and animalresources provide a “green social security” which people fall back on during thesehard times, this has a major negative impact on forestry development. The process isnot driven by an increase in economic growth, but is rather a consequence of skewedincome distribution changes and rising poverty from a given macroeconomic policy.We might call this ‘intensive deforestation’3.
Second, increased growth as a result of macroeconomic policies can dominatethe process. This is a more ‘extensive’ form of deforestation. Extensive deforestationis in many cases closely associated with the macroeconomic and sectoral impacts thatare growth inducing while intensive decline is linked to social impacts, through changingincome distributions and poverty levels. Although in practice the actual movement ina forest mining economy will be a mix of the two, there will be different balancesbetween them. Distinguishing between these two kinds of deforestation is useful,because the potential sources of growth in the two and thus the appropriate policyemphases are different.
In the ESAP period, the impact of macroeconomic policies on forest developmentalso appears mixed, and difficult to disentangle. With the exception of Zimbabwe,there appears to have been some economic growth in the ESAP period, which suggeststhat they could have promoted the extensive form of deforestation in the other threecountries. However, with state forest parastatals on sale and industrial activity low asproperty changed hands, the overall economic stagnation in Zimbabwe would suggest areduced extensive form of deforestation. In all four countries there was a dramaticincrease in exports during the ESAP period. Most of the growth came from exports that

88 AN OVERVIEW: THE INFLUENCE OF MAJOR POLICIES ON FORESTRY
are low-technology primary products (e.g. wood, cotton lint, tobacco, coffee andminerals). This raises the possibility of forest losses due to agriculture, mining andlogging. The latter is especially true of Mozambique, which has become increasinglyreliant on timber for export earnings while increased mining activities were recordedin Tanzania and Zimbabwe during the period. All these processes, unless forest protectionpolicies are put in place, have potential to increase extensive degradation of forests.
Fiscal and monetary policies affect the underlying demand and supply conditions,with knock-on effects on the forestry industry. One of the main components of thepost-ESAP macroeconomic policies included reduction in public expenditures through,inter alia, retrenchment of public-sector employees. Indirectly, worker retrenchmentsmight occur in the private sector following reform, which raises internationalcompetition. In the ESAP period, stabilization policy has been characterised by austerity.In the short run at least, this has induced contraction of the domestic economy. This haspotential for reducing the extensive decay process in forests. Where stabilization hasbeen achieved, inflation has also come down, most probably reducing intensive decayprocesses in forests. With most Poverty Reduction Strategy Programs (PRSPs) emphasisingpoverty reduction, poverty may well fall, so that the resulting intensive decay processin forests might ameliorate the extensive decay process emanating from increasedgrowth. In any case, it will be necessary to monitor and control the effects emanatingfrom the extensive processes on forests of PSRP implementation.
The sequencing of economic reforms and environmental protection measures is anissue that has not received attention when structuring and implementing economicreforms. In principle, since environmental protection is concerned with longer runissues, there is no real need to delay them; the presumption would be that simultaneityis appropriate. If environmental activities are legislated but, because of the short-runeconomic consequences, are not implemented or enforced, then the credibility ofeconomic reforms suffers.
4.2 On industryThe high interest rates of the ESAP period are likely to have discouraged spending andinvestment. However, forestry investment actually increased in Zimbabwe, much of itbeing long-term capital investment. This was despite the increase in real interest rates,which on its own should have reduced investments, including those for conservation.Overall, however, the consequence of high interest rates for the four countries was adecrease in credit availability and consequently economy-wide fixed capital investment.The overall level of capital investment in the four countries has yet to return to its pre-1990 levels. It has grown marginally, and certainly has been below GDP growth.
In industry, trade liberalisation is likely to (i) favour the export sector and labourintensive industries, (ii) increase foreign direct investment, and (iii) lead to the closureof less efficient industries. The impact of the switch to the export sector on forestrydepends on whether industry is a major forestry products exporter, whether it usesforestry products intensively as its inputs and whether it has the potential to absorb alarge pool of labourers. Trade policies that reduce protection of domestic manufacturingtend to speed up the process of deforestation as a result of the de-industrialisation ofdomestic manufacturing that ensues. The closure of inefficient industry raises the riskof unemployment and recession and therefore increased poverty, with negativeconsequences for forestry.

89G. Kowero
4.3 On tradeMajor channels through which economic policies impact on forestry include large-scalecommercial trade, for example in timber, woodcrafts and non-timber forest products.Southern Africa has widespread markets for such products. Seasonal markets existfor indigenous fruits, caterpillars, honey etc. Other commonly sold woodland-derivedproducts include benches, chairs, stools, hoe handles, axe handles, mats, baskets,thatching grass, bricks (they require fuelwood for preparation), mice, termites andtraditional medicines. This is a widespread means of earning income in many householdsin the region.
According to Braedt and Standa-Gunda (2000)4, marketing of woodland-derivedproducts has outstripped the importance of agricultural activities as an income sourcefor some households in the craft industry along the major tourist routes of Zimbabwe.Using woodcraft markets as one of the indicators for growth in the informal forestrysub-sector, we note from Braedt and Standa-Gunda (2000) that growth of the woodcraftsmarket was modest between 1980 and 1989 (the pre-ESAP period). In their study of 111craft markets in existence in 1997 on nine routes they surveyed, only four of themexisted before independence (1980) and 16 emerged in the 1980-1989 period. Of these111 craft markets, 97% were established during the ESAP period. They note that one ofthe reasons for this has been the steady rise in tourism since the late 1980s and thebeginning of the 1990s. They also noted a remarkable increase in the export of woodcraftsfrom Tanzania in the ESAP period.
With respect to trade in industrial timber, we note that in Zimbabwe exports offorestry products rose following trade liberalization, while in Tanzania between 1992and 2000 there was very little change in industrial wood production, despite the incentivesoffered by macroeconomic reforms. This was a period when the industry was changinghands from government parastatals to the private sector, in line with the ESAPrequirement to increase private sector involvement in production and trade and to
Furniture from reeds in Malawi (Photo: G. Kowero)

90 AN OVERVIEW: THE INFLUENCE OF MAJOR POLICIES ON FORESTRY
reduce the central government’s role. On the other hand, industrial wood productionshowed a steady decline over the period, except for a 1995 peak in Malawi. In Zimbabwe,the ESAP policies that initially had the greatest impact on industry and trade weretrade liberalisation and domestic deregulation. These came at a time when world timbermarkets were strengthening and therefore provided the timber industry with the capacityto grow, develop a wide range of products and adopt an export focus. However, interms of improving employees’ real incomes of lower level employees’ were eroded byhigh inflation to the extent that they were better off at the start of ESAP than duringthe ESAP period and even in the post-ESAP era. In the post-ESAP era the forest industryhas been characterised by uncertainty of tenure for its plantations due to recent changesin land laws, high inflation that erodes profitability, local market shrinkage due to theprevailing stressed economy, loss of investor confidence and unrealistic exchange ratesthat make exporting unattractive. All these combine to form a very hostile environmentfor the industry.
5. POLICIES AND GENDER RELATIONSHIPS AND ROLES INWOODLANDS IN SOUTHERN AFRICA
Men and women have different perspectives on woodland resource use and managementissues. There is division of labour, responsibility and control over these along genderlines. In many rural areas women are mainly involved in non-cash agriculture and inensuring primary human development. Men are more involved in cash cropping andnon-agricultural activities, in addition to indulging in matters of personal pleasure.
Throughout the colonial, post-independence and economic reform periods of thecountries in southern Africa, policies have in general pushed women to rely more onforests than men because of shrinking cropland per capita and the fact that women, ingeneral, do not own land. Most of the policies do not have a gender bias, but insteadtreat men and women equally despite their different capacities to respond to suchpolicies. A deliberate effort should be made to favour women in such policies becausewomen are more directly linked to sustainable development as compared to men.Women would suffer more than men if the natural resources were to be damaged.They are likely to value these resources more than men.
The negative effects of economic policies in rural areas, especially economicstructural adjustment policies, which place heavy emphasis on market forces, arebeing felt disproportionately by rural people. In general, structural adjustment, evenin countries where it has been applauded as having had some positive effects, such asin Ghana, left out some important groups: those producing non-tradables and those whoare net buyers of agricultural commodities. These are usually the very poor, the majorityof whom are women. The weak links between the rural poor and the general economyalso constrain poor farmers (the majority of whom are women) from participating fullyin the monetised economy. Women are therefore ill equipped to benefit from agriculturalproduction incentives and other economy wide policies. They have, in general, lesscapacity than men in terms of acquiring new technology, less time and land to devoteto income generating agriculture and less command over some of the most importantresources such as family land and capital. Since men often control most of the householdincome, women thus have less capacity and incentive to respond to economic signals.Women are, in general, risk averse and do not immediately venture into new projects

91G. Kowero
and thus tend to be left out. Therefore, rural development policies need to increasetheir focus on women with a view to facilitating their capacity to respond.
Women are also constrained from effectively deciding on issues of access to naturalresources because in many societies women’s ideas are either not forthcoming or,when available, are valued lightly or completely ignored, and their initiatives do notcarry as much weight as those of men. Current thinking in natural resource managementis towards giving communities the responsibility to decide on how to manage theirnatural resources, including forests and woodlands. Women are the majority of thepoor in these communities; therefore their active participation in these endeavoursshould be facilitated.
ENDNOTES1. This text is based on chapters 8 to 12.2. Mabugu, R. and Kowero, G. 2002 Macroeconomic policies and forestry in Zimbabwe. Draft
Working Paper, CIFOR, Harare.Mabugu, R., Kowero, G. and Mlay, G. 2002 Macroeconomic policies and forestry development
in Tanzania, Malawi, Mozambiqueand Zimbabwe. Draft Working Paper, CIFOR, Harare.3. Bhalla, A., Chitiga, M., Davies, R. and Mabugu, R. 2002 Globalisation and sustainable human
development: Progress and challenges for Zimbabwe. UNCTAD/UNDP Occasional Paper. Geneva,2000.
4. Braedt, O. and Standa Gunda, W. 2000 Woodcraft markets in Zimbabwe. International TreeCrops Journal 10 (4): 367-384.

8.Evolution of land policies andlegislation in Malawi and Zimbabwe:Implications for forestry development
C. Mataya, P. Gondo and G. Kowero
ABSTRACTThis paper sheds some light on the effects of the colonial and post-colonial land policiesand legislations on the management and utilisation of natural woodlands in Malawi andZimbabwe. The two countries share similar patterns of land ownership structure;customary or tribal trust land designated by colonial governments for settlement andcultivation by indigenous population; private land mostly alienated from local communitiesfor commercial farming and ranching, initially by white settlers and later officiallysanctioned by post-colonial governments; and public land appropriated by governmentfor the purpose of establishing national parks and forest reserves. The first two formsof land tenure, private and public land, not only reduced the size of land available toindigenous communities for agricultural and non-agricultural activities, but alsocompromised the roles and power of traditional authorities in controlling and managingnatural resources, including miombo woodlands.
With rising populations and demand for food in both countries, conflicts arose overaccess to land and natural resources between the heavily endowed and landlesscommunities, as evidenced by increasing incidences of encroachment. Bush fires havehad devastating effects on indigenous forest cover and some tree species. An increasein population pressure, poverty and failure by governments to urgently provide effectivepolicy guidelines on land management and administration regarding the utilisation offorests and natural resources, appear to be the major factors which have contributedto rapid deforestation and land degradation.
Political pressure resulting from increasing levels of landlessness, unemployment,poverty and food insecurity convinced the two governments to begin seriously addressingthe land problem in the 1990s, as evidenced by the appointment of land policy reform

93C. Mataya, P. Gondo and G. Kowero
commissions. The major observation in this paper is that the new land policies resultingfrom the nation-wide consultations of the land commissions cannot become effectivein arresting deforestation and land degradation unless the problem of poverty is adequatelyaddressed. Dependency on subsistence agriculture, common to both countries, as themain source of livelihood, exerts tremendous pressure on land resources and contributesto deforestation. Development of alternative sources of livelihood especially non-agricultural activities, would not only reduce this pressure but would also diversify theeconomic base, thereby improving household incomes and food security. Since themajority of both rural and urban communities depend on wood as their main source ofenergy, for land policies to contribute effectively to conservation of forests and naturalresources, it is crucial that existing forestry and energy policies be reviewed andimplemented.
Key words: Land policy, legislation, forest resources, traditional authorities,customary law, and public land.
1. INTRODUCTIONLand underpins the economic, social and political lives of the majority of the people ofMalawi and Zimbabwe because of their strong dependence on agriculture and naturalresources. Land is a fundamental resource in that it provides many things for supportinglife. Its capacity to do so depends very much on its quality, adequacy, and the mannerwith which it is used, among others. In the southern African region land degradation hasbeen an issue for many decades and a lot has been said and written about this. Further,land degradation is often cited as being due to poverty, unfair land allocation, anddisruption of traditional land management systems. However, there is realization thatpolicies and legislation influence the way people use land. The question is then whatpolicies should be adopted and how they should be implemented in order to promotebetter land use practices as well as contain land related problems like deforestation.
This paper seeks to highlight policies and legislation that, over time, haveinfluenced the manner in which land has been used and continues to be used in ruralMalawi and Zimbabwe. These are neighbouring countries that shared the same colonialmaster, Britain, and later followed a capitalistic approach (though Zimbabwe initiallystarted with a socialist policy) to economic development immediately afterindependence. These two common attributes have influenced their treatment togetherin this paper on the assumption that there could be similarities in the way land policyand practices have evolved in these two countries. The paper is based on an evaluationof past and present major land policies, legislation, and traditions in these countries,recognising very well that there are other factors like wars which have influencedaccess to land and other land related issues. While it is not possible to trace theevolution of all major land uses the paper is restricted to how forestry condition andpractice in these two countries have evolved under the reviewed land policies andlegislation. The hypothesis in this paper is that land policies and legislation havecreated conditions that have considerably shaped the development of the forestcondition in these two countries. This of course does not ignore the influence ofmacro-economic policies on peoples’ livelihoods and their corresponding responses,which often impact on forest resources.
In Malawi about 42.6% of the total land area is considered to be under forest cover(Nyasulu 1997). This comprises national parks and wildlife reserves, forest reserves,

94 EVOLUTION OF LAND POLICIES AND LEGISLATION IN MALAWI AND ZIMBABWE
protected hillsides, and natural woodland on customary land (GoM 1996). Thecorresponding proportion for Zimbabwe is estimated at 51% (Nyasulu 1997). The ratesof deforestation are estimated at 61,000 ha per year for Zimbabwe and 53,000 ha peryear for Malawi (ibid.). The exact rate of deforestation or extent of natural forestcover in many countries in sub-Saharan Africa are unknown; there are conflicting estimateson the natural forest area as well as rates of deforestation.
The paper is organised as follows. Sections 2, 3, 4, and 5 review the situationduring the pre-colonial, colonial, post-independence, and present periods respectively.Section 6 presents a summary of major observations.
2. PRE-COLONIAL PERIOD EXPERIENCESIn the pre-colonial period, traditional leaders had authority over land and other naturalresources in systems that were based on clan or tribal groupings (Chenje and Johnson1994). Control and utilisation of land was determined by conquest or abandonment.According to Ranger (1993), chiefs controlled and distributed land to their people aslong as they remained powerful. Land was free and belonged to a social group claimingdescent from a common ancestor. The traditional leader or his representative allocatedland and settled disputes. However, ownership was not vested in the chief or hissubordinate, the chiefs were merely guardians or trustees (Phiri 1991). There were noland markets; access to land was guaranteed by individuals’ allegiance to the chief orclan head. Once land had been granted, family members could inherit use rights. InMalawi, inheritance was governed by marital status along both matrilenial and patrilenialsystems whilst in Zimbabwe it was along patrilenial lines only.
Tribes and other ethnic groups had different cultures and socio-economic demandsthat over time led to the development of land use patterns. The geographical distributionof ethnic groups in Malawi was a result of tribal wars amongst the Ngoni, Chewa andYao tribes. In Zimbabwe, the Ndebele tribesmen settled in the southwest and westernparts of the country following their conquest of the Shona tribes originally resident inthese areas. Under the traditional system, land areas were divided into different usecategories governed by different rules and regulations. Some areas (such as residentialareas) were under individual control and could be inherited by members of the familyor clan for several generations, whilst others were communally owned. In some casesdifferent rules applied to the same piece of land at different times of the year or todifferent resources within the area. A typical example is agricultural land where controlby the individual prevailed when there were crops in the fields but communal accesswas accepted after harvests.
With regard to forest resources, these were governed by similar customary rulesand regulations that limited access to some areas such as sacred groves and grave yardsand controlled tree cutting through a series of taboos (Matose 1992, Misana et al. 1996).Traditional leaders were responsible for exercising control over how land and associatedresources were utilised in areas under their occupation (Abrahams 1967). Due to thesmall population characteristic of this era, demands on land were mostly for agricultureand grazing, and as such did not pose a great threat to natural resources status, includingforests, except in areas with high population densities. Evidence from some countriesin southern Africa suggests that the land use systems in this period were sustainable(Kaoneka et al. 1999). For example, shifting cultivation and nomadic livestock rotationsystems were practised. The long fallow periods allowed the land to recover fully

95C. Mataya, P. Gondo and G. Kowero
before the next rotation, whereas low livestock densities were not a threat to grazinglands. This ensured sustainable productivity of land.
3. COLONIAL PERIOD
3.1 Land policies and lawsThe process of colonisation in the region was varied. In Malawi the process was throughthe introduction of Christianity that was later followed by British settlers. As moreBritish missionaries, planters and traders came into the country, the need to providefor their protection increased. This and a combination of other factors led to theproclamation of the British Protectorate in 1891.
In Zimbabwe, colonisation was predominantly through conquest of the major tribes(Shona and Ndebele) in 1896 by the British. The conquest was followed by declarationof all land as crown land and subsequent demarcation into native reserves and white(European) settlement land. The first native reserves were created by the British colonialpowers as early as 1894. By 1911 native reserves comprised 8.5 million ha of largelymarginal land. About 60% of the estimated 700 000 native population lived in thesereserves and since the population was still low, degradation was not yet a problem(Whitlow 1988).
The major settlement thrust was largely geared towards agriculture and thereforethe land use patterns in both Malawi and Zimbabwe were influenced by the distributionof agriculturally fertile land as well as segregation between the settlers and the indigenouspeople. Although formal land policies were non-existent, there were a series of actsgoverning the distribution, management and administration of land. For example inZimbabwe, under the Land Apportionment Act of 1930, most of the fertile land wasreserved for European settlers whilst the indigenous people were forced into AfricanReserves (Moyo 1995), though the settler land area declined slightly by 1953 (Table 1).This Act further marginalized the indigenous people by making tenancy illegal andreducing the supply of land to Africans by depriving them of the right to buy farmsoutside the African Purchase Areas. After World War II, the increased attractiveness ofcolonial agriculture led to the eviction of more Africans from land designated for settlers,resulting in a dramatic increase in both human and livestock population in the nativereserves, which led increased rates of natural resource degradation. By 1950, 30% ofthe African population was already landless (Moyo 1995).
Whilst the overcrowded African reserves were being severely deforested, theland occupied by white settlers reverted to forests, as only 4% of the 14.9 million hawas under cultivation (Riddell 1979). Between 1930 and 1975 there were further landtenure changes when the state resettled more than 12,000 families from the overcrowdeddry southern provinces to the northern and northwestern provinces after the northwardmovement of the tsetse-fly belt.
The Native Land Husbandry Act, characterised by intensive conservation measures(contour ridges, drain strips, rotational grazing and livestock de-stocking), was introducedin 1951. The Act also favoured individual tenure and sedentary agriculture that resultedin land being divided into small parcels arising from the demarcation into residential,grazing and individual arable plots. Imposed restrictions on land use rights led to feelingsof tenure insecurity and resistance to land management programmes. The natives providedstiff resistance towards this Act as the pressure for even bare subsistence production

96 EVOLUTION OF LAND POLICIES AND LEGISLATION IN MALAWI AND ZIMBABWE
grew on the limited land (Cliffe 1986). The Act was eventually abandoned in the mid-1960s. However by 1966, some 49% of grazing land in the Tribal Trust Lands was describedas bare to very overgrazed (i.e. 6.24 million ha out of 12.64 million ha) (Cleghorn1966). The Land Tenure Act of 1969 was introduced under mounting pressure from thenatives and the war of liberation. The 1969 land distribution is roughly the one that wasinherited at independence in 1980.
In Malawi, alienation of land by settlers was initially effected through granting ofconcessions by chiefs to missionaries and European settlers. These were later convertedto certificates of claim after the declaration of the Protectorate in 1893 under theprovision of the Africa Order in Council of 1893 that resolved competing claims toAfrican territories by European countries including Britain, Germany and Portugal. Throughthe use of certificates of claim, up to 1,499,464.8 ha of land were disposed of toprivate persons by 1894, of which 1,092,652.2 ha were owned by one company, theBritish South African Company. The protectorate, through subsequent clauses of theBritish Central Africa Order (1902 and 1907), established a system of control of land bythe British administration. Under the provisions of these new clauses an additional56,479.4 ha were granted as freehold and 49,977.3 ha as government leases.
The Nyasaland Protectorate (African Trust Land) Orders in Council were enactedbetween 1936 and 1949. They declared some lands as native trust, i.e., for nativesettlement. The present day land tenure system originates from the enactment by thelocal legislature of the Nyasaland Protectorate (African Trust Land) Order in Council1950.
The enactment, which in 1951 became the Land Ordinance (currently the Land Act)defined for the first time three categories of land, namely public land, native trust land(now known as customary land) and land granted to any other interests by grant or lease(private land). Public land included all lands and interests in land acquired by, or onbehalf of His Majesty, land in townships not in private ownership, land in forest reserves,lands and mines in the custody and bearing the signature of the Director of Surveys andthe Survey Department and land declared as public land. Thus all the lands of theprotectorate excluding public lands, lands under lease or grant and under certificate ofclaim were declared African Trust Land. However, powers to dispose of African Trust
Table 1. Historical land distribution in Zimbabwe
Group 1931 (million ha) 1953 (million ha)
European area 19.67 (51%) 18.96 (49.2)
African Reserves 8.64 (22.3%) 8.34 (21.7)
African Purchase Areas 2.98 (8%) 2.26 (5.9)
Special Native Areas _ _ 1.65 (4.3)
Unassigned land 7.12 (18%) 5.68 (14.7)
Wankie Game Reserve _ _ 1.19 (3.1)
Forest area 0.24 (0.6%) 0.39 (1%)
Undetermined 0.03 (0.1%) 0.02 (0.1%)
Total 38.68 (100%) 38.51 (100%)
Source: Chipika et al. (1998) citing Government of Zimbabwe (1982).

97C. Mataya, P. Gondo and G. Kowero
Land or convert it into any tenure category were still vested in the Secretary of State.As observed by Msisha (1999), this implied that although the land was intended for thebenefit of the natives, they had no legal right to protect their supposed interests inthat land. At independence 87 % of the land was customary, 2% private and 11% waspublic land (ibid.).
3.2 Implications for forestry
a) Loss of ownership rights and erosion of traditional authorityGenerally the effect of alienation of land by colonialists in both Malawi and Zimbabwewas loss of control and ownership of traditional land rights. In addition the loss ofcontrol translated into erosion of traditional institutional capacity to manage naturalresources, including forests. At the same time the colonial administration lacked capacityto monitor, control and manage natural resources in these areas. This administrativevacuum promoted encroachment and destruction of forests by bush fires. In the case ofZimbabwe, the role of traditional leadership in managinge resources was continuouslydisturbed through a series of administrative policy reversals and eventually weakened.For example, in the 1930s traditional leaders were allowed to control and manageresources in the native reserves, whilst these powers were taken away in 1951 withthe introduction of the National Land Husbandry Act in 1951. The powers were returnedagain in 1969 under the Land Tenure Act, following stiff resistance to the National LandHusbandry Act. Unfortunately the latter move was viewed with suspicion as the war ofliberation was escalating.
b) Increase of pressure on limited land areaThe confinement of indigenous people to relatively small and marginal lands (reserves)resulted in overcrowding and destruction of forest cover. For example, by the end ofthe 1920s there was evidence of degradation in the native areas as farmers increasedland under cultivation in order to cope with taxes and falling grain prices. Livestocknumbers were also increasing compounding the degradation problem.
c) Introduction of plantation agriculture and forestryDestruction of indigenous forests and other natural resources, especially in Malawi, canalso be attributed to the establishment and expansion of large scale agriculture, especiallytea and tobacco, which demanded substantial amounts of wood as fuel and constructionmaterial. The weaknesses in the lease covenants facilitated over-exploitation of forestand other natural resources. However, in Zimbabwe, land on settler (large-scalecommercial farms) farms was generally under-utilised, with less than 4% of the totalland area cultivated. Over 30% of the forest cover in Zimbabwe is found in these areas(Forestry Commission 1997). In addition, the land laws facilitated the establishment ofexotic plantations for industrial purposes mainly of pines, Mlanje cedar, eucalyptus andother tree species. This was associated with the clearance of natural forests.
With respect to public land (state land, national parks and forest reserves), all rightsto forest produce were vested in the state or lessee. This was, however, contested bylocal communities living adjacent to these areas who claimed the right to use the land byvirtue of proximity and historical connections. This resulted in conflicts between thestate and local communities and was one of the primary triggers of the liberation struggles.

98 EVOLUTION OF LAND POLICIES AND LEGISLATION IN MALAWI AND ZIMBABWE
d) Emergence of land marketsAlthough market transactions were provided for on leased and freehold land, this didnot apply to land in native reserves or Tribal Trust Lands where access was based on userrights. The lack of market value could have encouraged over-exploitation of forestresources, in that the land and the forest resources it supported were viewed as of lowor no value, and in many cases was freely available.
In both countries the indigenous people were not allowed to purchase land fromthe freehold large-scale commercial farms. However, in order to accommodate increaseddemand for land by indigenous farmers in Zimbabwe, this restriction was eased throughthe creation of the African Purchase Areas. In Malawi, if natives wished to hold land, adistinction was made between land for agriculture and land for residential purposes.Through the Land Commission of 1920 recommendations were made that natives couldhold land at the same rent as Europeans but were exempt from survey and registrationfees. They could also be allowed to have smallholdings for their houses as a way ofachieving transition from a communal system to individual land ownership (Msisha 1999).
4. POST INDEPENDENCE LAND POLICIESDue to constitutional constraints, the first years of the post independence era in bothMalawi and Zimbabwe were characterised by minor attempts to redress the landimbalances inherited from the colonial era. In Zimbabwe the Lancaster House agreementprevented compulsory acquisition of land from the commercial farming sector for tenyears (1980-1990). These limitations together with costly land acquisition and a stronglobby against this by the settlers or their descendants, as well as the slow process ofmodifying legislation, combined to slow down the process of land redistribution.
4.1 Land policies and legislation in MalawiAt independence in 1964, the Malawi Government inherited the institutional and legalframework of land management and administration with minor modifications of theLand Ordinance passed in 1951. The land tenure categories are as summarized Table 2from information in the preceding section.
Statutory reforms to the Land Act of 1965 that took place in 1967 led to thecreation of three statutes, the Land Act, the Registered Land Act and the CustomaryLand Act. The Land Act merely redefined the three categories of land holding namely,public, private and customary. One of the provisions of the act stipulated the authority
Table 2. Land tenure categories in Malawi in 1964 and 1997
Tenure category Percent of total Percent of totalland area in 1964 land area in 1997*
Customary 87 66
Public 11 19
Private 2 12
Urban - 3*Source: Presidential Commission on Land Policy Reform (1998).

99C. Mataya, P. Gondo and G. Kowero
of the minister of the new government over the management and administration ofcustomary land, some of which included making and executing grants, leases, or otherdispositions of public or customary law for various purposes. For example, the ministerwas empowered to grant leases on customary land for estates for a period not exceeding99 years. Although the act also declared all customary land to be the lawful and undoubtedproperty of the people of Malawi, vested in perpetuity in the president, the declarationdid not confer legal ownership and title to the land in question.
The Registered Land Act was created with the aim of simplifying the system ofrecording land holdings and methods of carrying out land transactions, i.e., charges,transfers, etc, and thus circumventing the problems of long and complex process requiredpreviously by the Deeds Act. This act also provided a basis for the development andimplementation of the Customary Land Development Act which was an attempt toconfer titles to individuals or groups on customary land and was partly motivated by acommon view of many development agencies at that time, that customary tenurerelations were an impediment to rapid agricultural development. This developmentwas, in part, fuelled by the expansion of burley and flue-cured tobacco and other cropsas were defined in the Special Crops Act.
A thorough examination of the process through which the Registered Land Act wasimplemented shows that it was the major mechanism through which large tracts ofcustomary land were alienated for the purpose of expanding estate agriculture, especiallytobacco and sugar. In fact the acquisition of land for the purpose of establishing large-scale farms translated into permanent loss of that land to society, since at the expiry ofthe lease agreement the land never reverted to the customary sector but became publicland. The act was also the major avenue through which government acquired large areasof customary land for the purpose of establishing development projects under whichrights of cultivation and the crops to be cultivated were controlled by Government itself,e.g., the Kasungu Flue Cured Tobacco Authority (KFCTA). For example, it is estimated that64,000 ha of leasehold surrendered under the 1965 Land Act reverted to public landbetween 1964 and 1980 and were lost forever from the customary sub-sector sincesmallholders did not hold cultivation rights to public land. In addition, land alienated fromthe customary sector is estimated to have increased by 110,000 ha (46%) and customaryland (family titled land in the Lilongwe Land Development Program, LLDP) is estimated tohave declined by 640,000 ha (8%) (Phiri 1991) during the same period.
The Customary Land Development Act 1967 empowered the Minister to declaredesignated customary areas eligible for division into individual or group titles under theRegistered Land Act. In support of this exercise, a Local Lands Board charged with theresponsibility of authorising any transactions involving such lands, including selling, leasing,partitioning, subdivision or any other disposition, was instituted through the LocalLands Board Act 1967. Title registration implied cessation of traditional authority overthe demarcated customary land. The latter saw the birth of the ‘Ndunda1’ system,which was enacted into law in the form of the Customary Land (Development) Act andthe Registered Land Act 1967. Lilongwe West was under a Land Development Projectthat was designated as a pilot project area for land registration and titling. However,contrary to expectations, none of the benefits predicted by the policy planners, such asgreater security of ownership, negotiability of title, a robust land market and improvedagricultural productivity, have materialised under the Ndunda system.
The Adjudication of Title Act 1967 was passed to reduce the cost and simplify theprocess of land registration. In relation to the Deeds Registration system, the act was

100 EVOLUTION OF LAND POLICIES AND LEGISLATION IN MALAWI AND ZIMBABWE
Table 3. Customary land lost between 1983 and 1990 (hectares)
Year Public land Freehold land Leasehold land Customaryland lost
1983 1,640,594 52,058 296,811 13,057
1984 1,639,931 52,065 301,555 13,057
1985 1,641,607 52,016 308,413 8,484
1986 1,641,993 52,016 327,603 19,577
1987 1,654,953 53,903 341,601 28,843
1988 1,655,113 53,903 351,209 9,768
1989 1,655,961 53,903 355,492 4,032
1990 1,654,903 53,901 363,067 7,615
Source: Department of Lands and Valuation (various reports).
deemed user-friendly as it permitted dealings in land even by lay persons (Msisha 1999).Although the act is equivalent to the Customary Land Development Act, it applies mainlyto private land. This Act empowers the Minister to declare an area as an adjudicationarea, a process that allows demarcation and recording officers to undertake verificationof all interests in land in the affected before registration is effected.
Agricultural leases have, in the post-independent era, carved an important niche inthe economic development of Malawi. This is the mechanism that made the dramaticexpansion of burley and flue cured tobacco possible between 1967 and 1994. Agriculturalleases were expected to fulfil not only the development conditions for which the grant ismade, but also to ensure that the land, the subject of the grant, is sustainably managed.
Since independence, a considerable proportion of customary land has been convertedto leasehold for agricultural purposes. Table 3 provides some statistics from the Lands andValuation Department on 104,434 ha of customary land lost between 1983 and 1990 to otherland use sectors. The trend from 1964 to 1997 can also be discerned from Table 2.
Government policy began to change from the mid 1980s when the pace of creatingnew agricultural leases began to slacken. The Control of Land Order issued in 1989 partiallyformalised the directive that no more leasehold estates be opened. This directive,however, did not apply to customary land occupiers who wished to convert their landinto leaseholds. The Order was amended in 1996 to prohibit the conversion of customaryland to leaseholds except in very special cases.
As observed by the Presidential Commission of Inquiry on Land Policy Reform (Msisha1999) with regard to leasehold title:
• Indiscriminate conversion of customary land into leasehold estates has contributedto artificial pressure on land and the resources upon it in many areas of the country.
• Most communities were ignorant of the fact that conversion of customary landinto leaseholds would result in permanent loss of such land to estates.
• Many communities believe that the introduction of the leasehold tenure has beenresponsible for severe erosion of cultural values and solidarity and, in particular,of community rules for sustainable management of land and other resources.

101C. Mataya, P. Gondo and G. Kowero
• The fact that agricultural leases are of varying periods, ranging from 7 to 99years, suggests that there is some confusion as regards agricultural leaseholddevelopment policy.
• Many of the development conditions contained in leases of all categories areoften ignored by lessees since there is in sufficient machinery for theirimplementation and enforcement.
• Informal and unregulated leasehold arrangements, especially under the guise ofcustomary law, have become an important part of rural life.
Many land conflicts can be resolved or managed through comprehensive land policydevelopment that addresses, among other things, existing settlement patterns,improvement in production technologies and the design of new laws and legislation.
4.2 Land policies and legislation in ZimbabweIn Zimbabwe the immediate priority at independence was land redistribution to addressthe inequalities of the colonial era (Zinyama et al. 1990, Moyo 1995). Sustainabledevelopment within the densely populated communal areas was considered impossiblewithout a reduction in population densities. Government policy was therefore aimed atachieving quantitative and qualitative redistribution of land. The specific policyobjectives included the development of rural areas through acceptable and fairdistribution of land guided by a land reform programme; rapid reduction of povertythrough increased land productivity; and achievement of food self sufficiency (Republicof Zimbabwe 1981). This was imperative as, at independence, Zimbabwe inheritedfour major land tenure regimes, namely, Commercial Farm Lands, Communal Lands,Resettlement Areas and State Lands. Commercial Farm Lands constitute 36.2% of thecountry’s total land area in the form of mainly large-scale commercial farms (LSCF) thataverage 3000 ha (Table 4).
Table 4. Land tenure types in Zimbabwe
Category Total area Proportion of total Proportion of(million ha) area (%) arable land (%)
Non-agricultural
State forests 0.9 2.3 _
Urban and other 0.2 0.6 _
Sub total 5.8 15.0 _
Agricultural
Large-scale commercial farms (LSCF) 12.7 32.5 38.3
Small-scale commercial farms (SSCF) 1.4 3.7 4.3
Communal areas 16.4 42.0 49.5
Resettlement areas 2.6 6.8 8.0
Sub total 33.1 85.0 100.0
Total 38.9 100.0 100.0
Source: Moyo et al. (1993) citing Whitlow (1988)

102 EVOLUTION OF LAND POLICIES AND LEGISLATION IN MALAWI AND ZIMBABWE
There are also 10 600 small-scale commercial farms (SSCF) owned by Africans onfreehold tenure. About 4000 LSCF are owned by whites, while 450 LSCF are owned byAfricans. LSCF occupy 66% of the best land in natural regions I–III, whilst communal landsoccupy 41.8% of the total land area, of which 75% is in the worst natural regions (IV andV) (Table 4). Land in Zimbabwe is classified into five natural or agro-ecological regionswhich are based on soil type, rainfall and other climatic factors with natural region 1being the most productive and natural region V being the most marginal and leastproductive.
Table 5. Distribution of Natural Regions by land category (%)
Land category Natural 1 Natural 2 Natural 3 Natural 4 Natural 5Region Region Region Region Region
State 1.1 0.0 0.2 0.2 0.4
Communal 20.2 23.7 42.4 63.0 52.9
Large-scale communal farms 73.7 66.4 37.0 28.4 44.8
Small-scale communal farms 1.2 4.2 8.2 4.2 1.1
Model A resettlement* 1.2 5.2 11.9 4.2 0.8
Model B resettlement* 2.6 0.5 0.3 0.0 0.0
Total 100.0 100.0 100.0 100.0 100.0
*Model A resettlement is a category whereby individual peasant holdings are created by subdivision whereasin Model B category the allocation is made to communal farming cooperatives.
Source: Moyo et al. (1993) citing Hosier (1988)
In communal areas (formerly Tribal Trust Lands) the community, represented by thechief, owns the land but allocates heritable rights to households to cultivate land andpermits them to graze their livestock on unallocated grazing lands and natural woodlandsthat are communally managed (Fortman and Bruce 1993). However, communal landcannot be bought or sold. The Rural District Councils Act of 1981 set up elected councilsas the key institutions for rural local governments. This was followed by the CommunalLand Act of 1982 that vested ownership of communal land in the President and assignedadministrative control to district councils rather than traditional leaders. This Acteffectively gave the power to allocate and administer land to District Councils. It notedthat existing land rights would be preserved but new permits to occupy land would begranted by District Councils. They would grant permits for residential and agriculturaluse, while taking into account customary law, and grant land only to those who had thecustomary right to it. Thus the Act regulated access to land according to customary lawrelating to allocation, occupation and use, but did not restate the customary laws.These had been transferred to the Customary Law and Primary Courts under the customaryLaw and Primary courts Act of 1981. This resulted in conflict between traditional leadersand district councils over control of land and other natural resources. In fact in mostareas chiefs continued allocating land.
Under the Communal Land Act, a district council could pass by-laws relating to itsduties and functions. The Act also has model conservation by-laws that provide for thepreparation of land use plans for all land within a council area. Such plans may regulate

103C. Mataya, P. Gondo and G. Kowero
land holdings and use of pasture and arable land. These changes are very similar toattempts by the colonial government to assume control of land administration fromtraditional authorities under the Native Land Husbandry Act of 1951, except that localcommunities were now expected, through various committees, to take part in land useplanning. The district councils are considered to be too far removed from therequirements of farmers with respect to land and trees to be able to make informeddecisions on the use and allocation of land (Cliffe 1986). Whilst chiefs are councilmembers, some local communities resolve conflicts between traditional leadership andthe council by electing traditional leaders to positions of councillors or ward and villagedevelopment committee chairpersons. This has resulted in confusion as to under whatauthority they continued to allocate land.
At independence the inherited dual, unequal and hierarchical system of land tenurethat was also racially divided was reinforced by declaring land in LSCFs as freehold andentrenching the tenure structure in the constitution. State control over freehold landremains minimal. These lands have essentially been self and market regulated. Thus therelationship between the state and freehold and leased lands is governed by civil lawsand is weighted in favour of the landowners. This is in contrast to communal landswhere the relationship with the state is dominated by the granting of powers to statefunctionaries and criminalisation of non-compliance.
The initial plan was to resettle 162 000 families by 1985. However, by 1989, only52300 families had been resettled on 2.6 million ha of land. Only 22% of the resettlementareas were in natural regions I and II. Several reasons were advanced for the slow paceof the resettlement programme. These included limited availability of land due to highcosts of land and constitutional constraints during the first decade that prohibited landexpropriation. Some flexibility was introduced under the Land Acquisition Act of 1985,which gave the government the right of first refusal in respect of sales of commercialfarms, but land could only be acquired on a willing-seller willing-buyer basis. Inefficientimplementation strategies were also cited. By 1990 the pattern of land distribution andland use still represented the situation during the colonial era (Moyo 1995 and Chipika1998). The resettlement programme, with a predominantly state-dominated permittenure system, enabled only 60 000 families to gain access to more land, mostly of poorquality. Resettlement areas occupy 8% of the country’s land, whilst state lands in theform of National Parks and forest areas occupy 15% of the total land area (Moyo 1995).The area under resettlement (as well as that under LSCFs) has continued to change sincethe introduction of the ‘fast track’ resettlement programme that was introduced by theGovernment of Zimbabwe in 2000. This programme has yet to be completed. Under theLand Acquisition Act, the requirements for land distribution were clearly articulated. Itwas envisaged that a total of 11 million ha would be acquired and the farmerscompensated.
The designation of land for resettlement purposes, however, sparked controversyboth within and outside Zimbabwe as it has been interpreted as land grabbing in somequarters. The critics of this approach argued that this will undermine the agriculturalsector and also expressed fear that the farmers whose land has been designated wouldnot be adequately compensated by government. They further pointed that the firstpost-independence government did not provided adequate resources for infrastructuredevelopment to support productive use of the resettlement areas.
The ESAP period has also been characterised by increased illegal settlement onboth commercial farms and state lands (reserved forest areas and National Parks) and

104 EVOLUTION OF LAND POLICIES AND LEGISLATION IN MALAWI AND ZIMBABWE
heightened conflicts over resources between communal areas and adjacent resettlement,commercial and state lands. This is partly due to growing resource scarcity and populationpressure in communal areas following redundancies and growing unemployment partlydue to the economic reform programmes.
4.3 Implications for forestryThis section attempts to describe the likely implications of the policies and legislationon forestry. These insights shall later be useful in discerning useful observations fromthese historical developments as well as conclusions that are less descriptive.
Malawi and Zimbabwe share a number of factors that have contributed todeforestation on different forms of landholding systems in this era. Appropriation ofland by white settlers for the purpose of agricultural production and the state for theestablishment of public amenities such as national parks and forest reserves physicallyreduced the size of the land available for agricultural and non-agricultural use by therural communities, as well as access to the natural resources found on them. Whileclearing of indigenous woodlands for estate agricultural production inevitably resultedin deforestation of indigenous trees in both Malawi and Zimbabwe, the extent ofdeforestation between the two countries differs, being probably less in Zimbabwe.
(a) Leasehold and freehold landsAs opposed to Zimbabwe, leasehold and freehold lands appropriated for plantations inMalawi hardly have any indigenous trees. Some analysts argue that the notion thatowners of such freehold lands have absolute immunity against government interventionin matters of land use is a major factor behind the destruction of indigenous forests.This also encourages freeholders to explain away the existence of unutilised or under-utilised land in terms of their freedom to decide how best to use such land.
Destruction of indigenous trees on leasehold lands in Malawi is also associated withfailure by the relevant ministry to enforce the lease covenants, especially one requiringthe lessee to plant trees on at least 10% of the total land. This is further complicated bythe fact that land issues affect both the agricultural and the forestry sectors, and poorco-ordination of policies and strategies between the two has created uncertainty onthe administration of agricultural land, and especially enforcement of lease covenantswith respect to afforestation.
Although land appropriation is politically unpopular and was more excessive inZimbabwe than in Malawi, barriers to access to resources on white-owned freehold orleasehold land have to some extent contributed towards the conservation of bio-diversity.Barriers to access to gazzetted forests, natural parks and reserves in Malawi and Zimbabwehave also partly contributed to the conservation of indigenous woodlands. However,there is a case for examining the effects of redistributing idle estate land, wherenatural vegetation, and especially indigenous woodlands, exists. The fact that growinghigh value crops such as burley tobacco required one to have title to land in the form ofleasehold or freehold reduced demand for natural wood (outside the leaseholds andfreeholds) used for tobacco curing and processing structures, and consequently contributedto the conservation of natural woodlands. The relaxation of this policy, especially inMalawi (Special Crops Act) in 1994, in which smallholder farmers were permitted togrow burley tobacco without requiring land ownership certificates, did exactly theopposite, i.e., increased demand for natural wood and accelerated deforestation.

105C. Mataya, P. Gondo and G. Kowero
Although deterrents against illegal occupation and use of leased, freehold and publicland in the form of national parks and game reserves exist, these types of lands areoften deliberate targets of encroachment by land hungry small scale operators.Encroachment and destruction of natural vegetation by wild-fire on public lands aredifficult to control due to lack of capacity in enforcing rules and regulations governingland resources. Generally, due to laxity in enforcing regulations, the extent of loss ofbio-diversity resulting from encroachment and wild-fire on public lands is likely toexceed that on freehold and leasehold lands. Local communities surrounding these landsargue that estates, in general, have far too much land for their needs, and that a goodamount of this is not being put to productive use. The fact that the creation of theseparks involved the displacement of entire villages, some of which were forced tosettle into valleys of uncultivable gradients, is particularly a source of grievances insome communities. Communities in some of these areas complain that the governmentis more interested in protection of wild animals than in human welfare.
Claims made by displaced communities are not totally out of context. For example,the Presidential Land Reform Commission in Malawi observed that there are cases ofleasehold grants that were made without verification as to the suitability of the demisedpremises for the purpose for which they were sought. The Commission further observedthat many leasehold landowners sometimes embark on developments that are notapproved under their terms of grant. Despite such developments, it should be notedthat there is no law or practice in Malawi that would prevent the state, represented bythe government, from enacting laws that create an environment for sustainablemanagement of land tenure of all categories including freeholds.
(b) Public landsLack of property rights and the prevalence of open access to land have also being citedby many development economists as potential causes of mismanagement of naturalresources, including forests. This line of thought draws its support from proponents ofmarket liberalization, which advocates the use of market forces of supply and demandas a mechanism for efficient utilization of natural resources, including land. The absenceof a pricing mechanism, it is argued, contributes to unsustainable consumption andeventually the extinction of resources (the tragedy of the commons). Individual rightto ownership of land is expected to encourage the owner to invest in the land in such amanner that productivity would improve. The experience in Malawi does not appear tofully support this line of argument. A modified land registration in which right of ownershipto land was conferred on a pilot basis to groups of individuals belonging to the samekinship did not improve investment in land and productivity (CLUS 1999). In fact, thisexperiment led to the development of informal land markets and loss of ownership tospeculative buyers and urban dwellers for housing and agricultural production purposes.In some cases, the little forest cover available on these lands was lost due to increaseddependence on natural wood as the main source of energy by both rural and urban low-income communities. Increased cultivation of burley tobacco after repealing the SpecialCrops Act in 1994 has also contributed to rapid deforestation on these lands.
The prevalence of open access facilitated the establishment of plantation forestryand estate agriculture. The early establishment of plantation areas was based ongazzettement of areas with suitable climatic conditions, (e.g. in the Eastern Highlands ofZimbabwe) as forest areas during the colonial era. This took place in areas where thenatural forests were perceived to have low industrial potential and value at the time.

106 EVOLUTION OF LAND POLICIES AND LEGISLATION IN MALAWI AND ZIMBABWE
The establishment of industrial plantations replaced the natural forests with exotic treespecies such as tropical pines and eucalyptus species that are grown as monocultures. Theforestry industry in both countries is now almost entirely based on plantations. Accordingto the Timber Producers Federation (2001), Zimbabwe has 119,130 ha under commercialforest plantations while the equivalent area for Malawi stands at 110,000 ha (Nyasulu1997). Malawi’s total land area is about 30% that of Zimbabwe.
In the late 1980s and early 1990s, the prospects for growth in the demand for shortfibre pulp resulted in the increased establishment of eucalyptus plantations in manyareas where the species could be grown successfully. The land policies are generallysilent on the designation and conversion of natural forestland into forest plantations.This has seen the conversion of some prime agricultural areas into eucalyptus plantationsas a means for increasing land values in Zimbabwean commercial farms that were likelyto be designated for resettlement.
Fuelwood plantations were given prominence during the early 1980s when collectionof firewood was considered to be a major cause of forest degradation. Whilst thesewere promoted by governments, donors and the World Bank, they have generally failedto address the fuelwood problem largely due to the unsuitability of the plantationspecies as fuelwood. In Zimbabwe the eucalyptus species used have found value asconstruction timber.
(c) Customary landIn communally owned land under customary management the impact on forests has beenmixed. Customary land users are sometimes believed to be poor managers of land. Themain reasons, apart from the paucity of good land and presence of high populationdensities in some areas, is their basic resource and technological poverty, the breakdownof community resource management systems, and the general marginalisation (as amatter of national policy) of the smallholder agriculture sector.
In areas where traditional systems were intact and values remained strong, customaryforest resource management systems have been the basis for forest management. Inthese areas communally managed forest resources have continued to this day. Today theyprovide examples of community managed forests. In areas that experienced large influxesof immigrants, such as resettlement areas, traditional values and resource managementsystems have crumbled, resulting in an open access system and depletion of forestresources.
Appropriation of indigenous land, whether for commercial or public amenitiessuch as national parks and forest reserves, reduced the geographical jurisdiction andpowers of the traditional authorities and also alienated their traditional roles ofguarding against wanton destruction of natural woodlands. Natural forests wereprotected from destruction because they served several important purposes. Apartfrom being a source of firewood, construction materials, herbs and medicines, naturalforests were and still are important sources of food such as wild fruit and vegetables,honey, insects and meat. Natural woodlands also provided space for burying the deadand served as focal points for performing rituals and making special offerings to theancestral spirits. Some tree species were considered so sacred that cutting themwould provoke wrath from traditional authorities and the community. In recognitionof the significant contribution traditional authorities played in natural resourceconservation and also considering the lack of government capacity to enforce forestconservation, community-based natural resources management regimes have been

107C. Mataya, P. Gondo and G. Kowero
introduced in both Malawi and Zimbabwe (e.g., the Communal Area ManagementProgramme For Indigenous Resources - CAMPFIRE). The new management regimesempower rural communities not only to manage these resources, but also ensure thatpart of the income generated from tourism and the sale of forest products includinggame contributes to improvement in social welfare through construction of schoolsand other amenities.
The disappearance of natural woodlands in marginal areas where the ruralcommunities were forced to settle after land had been alienated from them is associatedwith increasing demand for food, energy and construction materials created by a rapidincrease in population. In densely populated rural areas of Malawi, trees along watershedsand sloping areas including hills and mountains have been destroyed for the purpose ofgrowing food crops. With little or no effort made to construct soil and water conservationstructures, most of these lands are being degraded by gully erosion.
(d) Other factorsThe implementation of the land reform and resettlement programme in Zimbabwelargely resulted in the clearance of forests and woodlands for agricultural purposesduring the occupation period. As pointed out earlier, only a small percentage of settler-owned land was under cultivation, thus these areas were perceived to be under-utilisedand were cleared to accommodate the new settlers. The land use plans in resettlementareas recognised the need to maintain forests and woodlands for grazing and otherpurposes. These were planned for and set aside. However, since these plans were on afarm basis they generally resulted in fragmentation of the forests. In resettlement areasadjacent to communal areas poorly endowed with forests, conflict has arisen overaccess to the forest resources.
The commercialisation of non-timber forest products has led to the depletion offorest resources, especially in areas where commercialisation of firewood and charcoalis possible. Production of woodcarvings has led to serious forest degradation as preferredspecies have been depleted. In some areas, commercialisation has resulted in access toforest resources being determined by village boundaries. For example, in Chipingedistrict in Zimbabwe, people from outside one village are no longer allowed to harvestpalm leaves for crafts from another village without paying for the resource. Whilst thishas helped curb over-exploitation of the resources, it has disrupted age-old copingstrategies based on utilisation of resources in different areas at different times of theyear and shared between villages. This has also disrupted traditional managementinstitutions, as new institutions for managing the commercialised resources as well asnew user rights have to be created or defined.
Rapid disappearance of natural forests is equally blamed on the lack ofcomprehensive policy in the energy sector. Although efforts have been made by nationalgovernments to develop alternative sources of energy for use by different sectors ofthe economy, very little progress has been made. Rising cost of petroleum productscoupled with heavy taxation have continued to force poor urban and rural communitiesto depend on natural wood as their main source of energy, thus exerting more pressureon the limited natural forest reserves.
Dependence on land and land resources by the majority of the population is acoping mechanism against hunger, malnutrition and dire poverty. Unless alternativelivelihood mechanisms are developed, it is unlikely that any new land policies willbring a lasting solution to landlessness, poverty and natural resource degradation.

108 EVOLUTION OF LAND POLICIES AND LEGISLATION IN MALAWI AND ZIMBABWE
5. CURRENT SITUATION (2002)In both Malawi and Zimbabwe land bureaucracies have proliferated, jurisdictional conflictsintensified, and land users have been left to wonder as to what government policy reallyis. This has been recognised as a challenge to rational land development planning andmanagement. Land policy development has, therefore, become an important item in thenational development agenda of the two countries. In recent times, sectoral policieshave been designed and approved for implementation by the government. These relateto agriculture, forestry, irrigation, environment, housing, and local government. An attemptto formulate a national land use management policy in each country has also been made.A quick review of these policies indicates that without a basic or referential policyframework on land, the physical framework on which all these sectoral activities operate,it is not possible to mobilise an internally coherent and coordinated scheme for theimplementation and supervision of plans designed on the basis of the discrete sectorrequirements.
The process of land reform in both countries was initiated through the appointmentof a land reform commission, first in Zimbabwe in 1994 and later in Malawi in 1996. Theprimary objective of the commissions’ work was to develop and recommend the mainprinciples of a new policy that would foster economic efficiency, environmentalsustainability and social equity.
The commissions adopted a consultative policy development process that was aimedat involving all stakeholders. Oral hearings and consultations involving civil servants,politicians, civil organisations, NGOs, community leaders and selected members of thecommunity were held at various locations in both countries. The commissions also receivedwritten submissions from special interest groups including women’s groups and farmersunions. These submissions were supplemented with commissioned technical papers fromselected experts. The commissions then wrote reports that will guide governments inland reforms.
With respect to Malawi the commission found that the main problems are associatedwith land scarcity, land management and land auditing (Msisha et al. 1999). They reviewedthese problem areas in detail and their recommendations will form a basis for thegovernment to review and develop a new land policy in Malawi. The commissionrecommended that the new policy should be fully integrated into the country’s overalldevelopment policy, taking into account the Rio Declaration and Agenda 21 and theconventions arising from the Earth Summit negotiations.
With respect to Zimbabwe the Commission of Inquiry into Appropriate Land TenureSystems (Land Tenure Commission 1994) recommended five land tenure categories, theprovision of long land lease periods, introduction of a land tax based on farm size andpotential productivity and that widows inherit and retain the land rights of their spouses.
The Commission therefore focussed on forms of land tenure and did not considerland distribution per se. The recommendations of the Commission have generally beenwell received. Some NGOs have noted that the proposals provide a framework conduciveto improved decentralised woodland management. However, Government action hasbeen slow despite endorsement of the recommendations by Cabinet.
Whilst there is general consensus amongst the key stakeholders that land redistributionis necessary, the current programme has been criticised for not having a recognisablepolicy framework or implementation plan (Moyo 1995, Nhira et al. 1999). There are noclear plans for the development and sustainable use of woodland resources in theresettlement plans, hence the criticism that the programme is environmentally insensitive.

109C. Mataya, P. Gondo and G. Kowero
Based on the experience from the early post-independence years, it is anticipated thatthere will be widespread deforestation in resettled areas unless there are deliberatemeasures to plan and clearly define institutional roles in resettlement areas. Such measuresshould recognise the role of woodlands in the agricultural production system and thereforeplan for their incorporation in the land use of each resettlement area.
Although land redistribution in general received support from the donor conferenceheld in 1998, the need for a clearly defined land redistribution programme in Zimbabwewas noted to be a prerequisite for donor support.
6. SOME OBSERVATIONS AND CONCLUSIONS
6.1 Pre-colonial periodDuring the pre-colonial era forest and woodland resources were governed by customaryrules and regulations that limited access to some areas such as sacred groves andgraveyards, and controlled tree cutting through a series of taboos. Traditional leaderswere responsible for exercising control over how land and associated resources wereutilised in areas under their occupation. Shifting cultivation was a characteristic featureof agricultural production. Due to the small human and animal populations characteristicof this era, land pressure was low and was not a threat to forest and woodland resources.
6.2 Colonial periodThe colonial era policies are largely responsible for the present day land tenure systems.The major settlement thrust during this period was geared towards agriculture, andtherefore the land use patterns were influenced by the distribution of fertile land andsegregation between settlers and indigenous people. The major effect of the alienationof land and other natural resources was the loss of control and ownership of traditionalland rights. This translated into an erosion of traditional institutional capacity to managenatural resources including forests. At the same time the colonial administration lackedthe capacity to monitor, control and manage natural resources in publicly as well as incommunally owned areas. This led to encroachment and destruction of forests in theseareas, especially in native reserves where population pressure was high. Extensivedestruction of forest and woodland resources also occurred due to the establishmentand expansion of plantation agriculture and plantation forestry. However, large tracts offorest and woodland resources were protected during this era following the establishmentof national parks and forest reserves. The exclusion policies under which these weremanaged were contested by displaced communities and those living adjacent to themand both groups claimed the right of use by virtue of proximity and historical connections.
6.3 Post –independence up to 2002The post independence era was characterised by attempts to redress the land imbalancesinherited from the colonial era through land redistribution and resettlement programmes.This resulted in clearance of forests and woodlands for agriculture and settlementpurposes. There were also very significant changes in the institutions given theresponsibility to manage natural resources, including forests with the responsibility forcommunally owned resources reverting to customary institutions (rural development

110 EVOLUTION OF LAND POLICIES AND LEGISLATION IN MALAWI AND ZIMBABWE
councils in the case of Zimbabwe) or locally based elected structures. Despite thesechanges the land tenure categories inherited at independence, as well as the managementregimes, were largely unchanged.
In addition, the following are noteworthy of this period:• Restoration of traditional authority in land administration and building local institutional
capacity has the potential to improve management and utilisation of natural resourcesincluding forests. Studies on community-based management of natural resources inboth Malawi and Zimbabwe have demonstrated the efficacy of a change in institutionalstructure in the productivity wildlife and fisheries for example CAMPFIRE and LakeChilwa Fishery, respectively.
• One avenue for increasing access to land is through creation and improvements inland markets. In both Malawi and Zimbabwe, this element is an integral part of theproposed land policies. Attaching value improves efficiency in resource allocationsince scarcity determines the extent of resource utilization. Since there is a directlink between land and forests, pricing of the former would directly affect the valueof the latter and therefore the level of utilization, and hence incomes from suchproducts, if the costs could be directly transferred to the consumer. The developmentof land markets through land policy reform would probably be indeterminate to theforest sector, in that estate farmers holding unused land under forests or woodlandswill most likely give up such land to the state, increasing the proportion of protectedforests. However, should the state reallocate such land to the landless, then the areaunder forests or woodlands will decrease.
• Low investment in customary land has often been associated with high levels ofinsecurity due to the absence of property rights to individuals occupying them. Onthe contrary, it is argued that the tight social structure and traditional norms in therural areas confer group security to members who possess use rights to customaryland. To what extent the latter promotes investment is not certain. However, elementsof the proposed policy reforms in both Malawi and Zimbabwe purport to secureindividual as well as group security of customary land, thereby enabling thesecommunities to use land as collateral for investment funds. Assuming that groupsecurity is likely to prevail in the new land policies, it follows that there is likely tobe no change in tree tenure.
• Some of the proposed changes in land policy in Zimbabwe are likely to involve theredistribution of 11 million ha of land from the large-scale commercial farmers.Based on previous experience, the implication of this is that large areas of forestswill be cleared for cultivation. Thus, some measures to mitigate the hazards ofwanton destruction of vegetation need to be put in place.
• Improvement in forest cover will be contingent on effective inter-sectoralharmonization and coordination of programs and activities dealing with commonissues in natural resources management, such as increasing demand for energy,agricultural land and construction materials. Harmonization and coordination willrequire a review of sectoral policies, identifying areas of common interest andmapping out joint strategies. This can succeed if rural development actors adopt aconsultative and holistic approach on the ground and not only at the developmentplanning level, as is largely the case at present.

111C. Mataya, P. Gondo and G. Kowero
ENDNOTES1. Land registered under the head of the family or clan, who in turn has the responsibility of allocating
land to his kin.
REFERENCESAbrahams, R. 1967 The political organisation of Unyamwezi. Cambridge University Press,
Cambridge.Chenje, M. and Johnson, P. 1994 Learning from history. In: State of the environment in
Southern Africa. A report by the Southern African Research and DocumentationCentre, 21-38. Harare.
Chipika, J. T. 1998 The impact of some macro-economic policies and other interventionson household strategies in the miombo region: The case of Zimbabwe. UnpublishedIES Report No. 12. Harare. 91p.
Cleghorn, N.B. 1996 Report on the conditions of grazing in Tribal Trust Lands. RhodesiaAgriculture Journal 63.
Cliffe, L. 1986 Policy options for agrarian reform: A technical appraisal. FAO, Harare.Customary Land Utilisation Study (CLUS) 1999 Special land tenure study: The Ndunda
Land Registration Component, Lillongwe Land Development Program.Forestry Commission 1997 Vegetation resources information system: Project report.
Research and Development Division, Forestry Commission, Harare.Fortman, L. and Bruce, J. 1993 Tenure and gender issues in Forestry. In: Bradley, P.N.
and McNamara, K. (eds.) Living with trees: Policies for forestry management inZimbabwe. World Bank, Washington DC.
Government of Malawi (GoM) 1996 National Forest Policy of Malawi. Ministry of NaturalResources, Malawi. 70p.
Kaoneka, A.R.S., Monela, G.C., Kajembe, G.C. and Turuka, F.M. 1999 A review of thenational forest policy of Tanzania. Draft paper. 35p.
Land Tenure Commission 1994 Report of the Commission of Inquiry into AppropriateAgricultural Land Tenure Systems. Government of Zimbabwe, Harare.
Matose, F. 1992 Villagers as woodland managers. In: Pierce, G.D. and Shaw, P. (eds.)Forestry research in Zimbabwe. Forestry Commission, Harare.
Misana, S., Mung’ong’o, C. and Mukamuri, B. 1996 Miombo woodlands in the widercontext: Macro-economic and intersectoral influences. In: Campbell, B.M. (ed.)The miombo in transition: Woodlands and welfare in Africa, 73-99. Bogor, Indonesia.
Moyo, S. 1995 The land question in Zimbabwe. Sapes Trust, Harare.Moyo, S., O’Keefe, P. and Sill, M. 1993 The Southern African environment. Profiles of
the SADC countries. Earthscan Publications Ltd., London. 354p.Msisha, M. R. et al. 1999 Land Law in Malawi. The Presidential Commission of Inquiry on
Land Policy Reform Volume III. Final report submitted to His Excellency the Presidentof the Republic of Malawi.
Nyasulu, K. M. 1997 EU/SADC Forestry sector cooperation strategy. Regional forestryproposals. Presented at the Second Regional Workshop, Curepipe, Mauritius, October6-7, 1997. 27p plus Annexes.
Phiri, C.D. 1991 Agricultural policy in Malawi, 1971-1987. Ph.D. Dissertation, CambridgeUniversity.
Presidential Commission on Land Policy Reform 1998 Public land utilization study. Ministryof Lands, Housing and Physical Planning, Lilongwe.

112 EVOLUTION OF LAND POLICIES AND LEGISLATION IN MALAWI AND ZIMBABWE
Ranger, T. 1993 The Communal Areas of Zimbabwe. In: Basset, T.J. and Crummey, D.E.(eds.) Land in African Agrarian Systems. University of Wisconsin Press, USA.
Riddell, J.C. 1979 Land tenure issues in the Rhodesia/Zimbabwe transition. In: Moran,E.F. (ed.) Changing agricultural systems in Africa. Studies in Third World Societies.Department of Anthropology, College of William and Mary, Virginia, USA.
Timber Producers Federation 2001 Zimbabwe timber industry statistics for year ended31 March 2001. Timber Producers Federation, Mutare.
Whitlow, J.R. 1988 Land degradation in Zimbabwe: a geographic study. Natural ResourcesBoard, Harare.
Zinyama, L.M., Campbell, D.J. and Matiza, T. 1990 Land policy and access to land inZimbabwe: The Dewure Resettlement Scheme. Geoforum 21: 359-370.

9.Land policies in Mozambique and Tanzania:Implications for forestry development
I. Nhantumbo, G. Monela and G. Kowero
ABSTRACTThis paper traces the evolution of land policies in Tanzania and Mozambique in bothpre- and post-independence periods, and implications for forestry development. Inthe pre-colonial period, the structure of land tenure in both countries was based oncommon and open access regimes, which were regulated by traditional law and culture.There were no land markets, and since land was perceived to be abundant shiftingcultivation was practiced. This encouraged gradual clearance of forests and landdegradation.
In the colonial period, traditional tenure systems were drastically altered, withunoccupied land or undeveloped land transferred into state ownership. Prime agriculturalland was converted to freehold, mostly to settlers, creating a landlord-squatterrelationship. This period was characterized by heavy exploitation of commercial timbers,clearing of forests to give way to cultivation of cash crops, and the indigenous populationwas forced to marginal land. This was the beginning of major land-related problems inthe region.
Post-independence governments first substituted territorial systems (thatregulated community access and control of natural resources) with radical title to landheld by the sovereign. This led to a three-tier land tenure structure: state, communal,and individual ownership. In both countries the main feature was state ownership ofall land, with governments maintaining the authority to grant rights of use and occupancyto different segments of society. However, much of the land in rural areas remainedunder customary land tenure. These complicated tenure arrangements gave rise toconflicts between local people (the “de facto” owners) and the state, which has “dejure” property rights. Existing land legislation and relevant institutions in land tenurewere inadequate to deal with dynamic changes in land matters.

114 LAND POLICIES IN MOZAMBIQUE AND TANZANIA
Both countries have since shifted from central to market economies as a result ofeconomic reforms. Some of the objectives of the current land policies are to ensurerights of citizens over land and other natural resources, create an enabling environmentfor economic development, and encourage investments in natural resources. The paperdiscusses the current provisions of the land law in Mozambique and Tanzania andcontrasts them in attempt to highlight the strong and weak provisions of both andhow these impact on the use of forestry resources.
Key words: Land policy, land legislation, land tenure, forestry development,stakeholders, participation.
1. BACKGROUND: THE LAND TENURE FRAMEWORKSouthern African countries have been undertaking extensive resources tenure reformswith different degrees of achievement especially in terms of approved legalinstruments. The major drive of the policy change appears to be the recognition bygovernments of their limited capacity and inefficient resource management system.Decentralization, empowerment of the local communities and strengthening of theirinstitutions for better management of natural resources are recognized as crucial tosustainable use of such resources and improvement of livelihoods of the communities.
As a result several countries in the region have adopted community based naturalresources management programs. Examples include Community Based ForestManagement (CBFM) at Mgori and Duru-Haitemba in Tanzania, the Tchuma Tchatu andmany more such initiatives in Mozambique, the Communal Areas ManagementProgramme for Indigenous Resources (CAMPFIRE) in Zimbabwe, and conservancies inNamibia. The general feature of these initiatives is the assumption that commonproperty regimes backed by rights to resources and some degree of local control overdecision-making will result in a shift from an open access situation to one with resourcesin communal setting. In this case, group tenure would prevail, hence no individualwould have defined and full rights. Further and no one would be excluded.
However, as noted by Nhantumbo (2000a) the reluctance of the nationalgovernments to give a full bundle of rights is noticeable. For example, in the case ofCAMPFIRE the government not only sets quotas for harvests but also controls most ofthe benefits from resource use through the District Councils, the main managinginstitution at local level. Until recently (1999) land debates in Namibia includedcommunities’ claim for group tenure over the resources in the conservancies hencefacilitating resource sharing by all the community members. The communities applyfor registration as a conservancy in order to receive conditional use rights over wildresources, particularly wildlife. Nevertheless, the land continues to be owned by thestate. Botswana represents a different model of tenure compared to other SADCcountries, in that only a small percentage (6-7%) of the land is under a freeholdownership, while government land is 23% and community/tribal land is 70% of total(ibid.).
This paper gives an account of major developments in the evolution of land policiesin Tanzania and Mozambique and their implications on forestry development in thesetwo countries. The paper does not deal with details in legal and government documentson land but only those that are relevant to forestry development. Land use policies aresome of a myriad of policies that influence forestry development. These policies playedand continue to play a major role in shaping the extent and condition of forest resources.

115 I. Nhantumbo, G. Monela and G. Kowero
The comparison between the two countries is important due to the fact that bothhave adopted similar policies especially regarding central planning, collective productionand living systems, economic reforms (popularly known as structural adjustmentprogrammes), that among other things facilitated the liberalization of markets aswell as increased the role of the private sector in the economy. Currently, both aredeveloping legislation aimed to promote involvement of various stakeholders in naturalresources management with a view to grant them access to resources for theirconsumption as well as enabling them to derive more benefits from the resources intheir vicinity.
The major assumption in this paper is that the present land policies and legislationshaping access and management of this resource are key determinants of forest useand sustainability. Consequently, the need for greater understanding of the landownership and use context is paramount to understanding the potential for ensuringsustainable forest management. Such requirement is important for all stakeholders,be they community or private entities.
The paper starts with an account on pre-independence developments, followed bythose in the post-independence period. The present land policies are then evaluatedin terms of their potential for forestry advancement, and this is followed by a brief onthe policy formulation process. A few general remarks and conclusions are given atthe end.
2. PRINCIPAL MILESTONES IN ACCESS TO NATURAL FORESTRESOURCES
2.1 The pre-colonial and colonial periodsThere are important milestones that have characterized access to natural forestresources in Africa, spanning different historic regimes. For Mozambique and Tanzaniathese are summarized in Table 1.
Table 1 shows that in the pre-colonial period in both countries access was eitherregulated by traditional law or unregulated in which case open access regimes prevailed.Ethnic groups had chiefs and headmen, who controlled and allocated land to membersof the group. The individual as a member of a family, clan or tribe acquired rights ofuse in the arable land managed and used by that community.
Despite the wide prevalence of common or open access regimes, there was aclear individual (‘private’) ownership or control of land plots used for agriculture byindividual households. Labor allocation to clear forestland gave value to land andprovided tenure rights to those who cleared land and their heirs. Therefore, anyonewith energy to clear forests could acquire private property rights on the land on whichthey stood (World Bank 1992, Fortman 1984). On the other hand, the equivalent of freeaccess was practiced for livestock grazing and harvesting wood and non-wood forestproducts (MLHUD 1995; World Bank 1992; MAP 1997).
The social differentiations during the pre-colonial period promoted conflicts overuse of resources, and led to tribal and clan wars. However, autochthonous land usesystems, which prevailed during this period provided for flexible rules that reflectedboth the local conditions and adaptation to change.
During the colonial period, the traditional institutions were changed to suit theinterests of the settlers (Table 1). These changes had serious implications on various

116 LAND POLICIES IN MOZAMBIQUE AND TANZANIA
stakeholders with respect to rights of access, control and ownership of land and naturalforest resources. The notion of land belonging to the state was introduced and reinforcedwith regulations, while simultaneously the settlers made treaties with local chiefs whowere persuaded to accept gifts in form of manufactured commodities such as clothesand beads as well as spices in exchange for land (MLHUD 1995; Carvalho 1988). Immediatelyafter acquiring the land, the colonialists introduced heavy exploitation of commercialtimbers such as mahogany and also cleared forests to give way to cultivation of cashcrops like coffee, tea, tobacco, cotton, coconut, sisal and cashew.
In Tanzania an Act of 1923 placed rights over land under the British governor. Thiswas to be held, used, or disposed of as rights of occupancy1 for the benefit of theindigenous people of Tanganyika (MLHUD 1995).
In Mozambique the legal provisions devised by the Portuguese Government (Table1) defined three categories of land use. First, the state protected areas (nationalparks, forest and game reserves); second, the production forests, which suppliedtimber for export mainly to the mining industry in South Africa; and third, the freeaccess areas where the development of plantation agriculture and other land usestook place (Nhantumbo and Soto 1999).
Generally, land tenure in these two countries reflected the interests of colonialiststo get land, and thus it was a justification of force and not rights or justice. Like inthe pre-colonial period, land markets did not exist in this period because undercustomary tenure, individuals were not allowed to transfer their land rights by selling(World Bank 1992). However, in Tanzania foreigners who then held more than half amillion hectares of land could buy and sell it at will (ibid.).
During this period land allocation to indigenous people continued to be theresponsibility of traditional chiefs. Therefore, the dichotomy of private agriculturalland and common property forest and grazing land was still preponderant. Also the roleof chiefs and family/clan headsman to allocate land continued to prevail in areasoccupied by the indigenous communities.
The colonial governments maintained the traditional power basis as regards landallocation in order to sustain political stability in the territories. Also, they broughtthe notion of common access regime to all resources that could not apparently beallocated to an individual user. Furthermore, community boundaries were drawn,legislation created to regulate access and land user rights, and in certain cases all thisled to land disputes, largely based on rights of access, control and ownership of landand natural forest resources (Bassett 1993).
2.2 Post-independence developments up to 1995According to Okoth-Ogendo (1996), one of the main colonial legacies is the substitutionof territorial systems (which regulated communities access and control of naturalresources) with radical title to land that was held by the state. The state had powerto allot rights of tenure to individuals, collectivities/groups and other agents. As aresult, a three-tier land tenure structure was introduced and still prevails, viz., stateor public ownership, communal ownership and the individual proprietorship. Thissituation is in fact what nearly all African countries inherited at independence, includingTanzania and Mozambique. However, for Mozambique one of the major differences isthat the Portuguese government did not create tribal or communal areas (Negrão 1998).

117 I. Nhantumbo, G. Monela and G. Kowero
Historic Period
Pre-historic
Colonial
Country
Mozambique
Tanzania
Mozambique(15th century commer-cial exchanges, buteffective from 18th
century)Portuguese
Until 1930’s
1960’s
Tanzania(19th century –Germany)(20th century –British)
1895
1923
Main features/milestones
Common and open access to landTraditional/customary lawNo land marketsLow population densityLow human population density
Same
• Traditional tenure altered
• Unoccupied or underdeveloped land becomesState’s Land
• State adjudicates land use rights (Münker, 1996)
• Prime agricultural land becomes freehold(settlers)=> Landlord-squatter relationshipinitiated
• reaties made by settlers with local chiefs(Carvalho, 1988)
• Chieftaincies replaced by ‘Regulados’, under di-rect control by the Portuguese
• Colonial presence strong in the South and ‘Prazos’(concessions to foreigners) dominate the northof Mozambique
• ‘Colonatos’ (white settlements) in fertile land
• Cheap labor settled around colonatos (MAP 1997)a
• The Land Law No 2001, 1944 and Protection of
Soil, forest and Wildlife, Decree No 4040, 1955
• Traditional tenure altered
• Unoccupied or underdeveloped land becomesState’s Land
• State adjudicates land use rights (Münker, 1996)
• Prime agricultural land becomes freehold(settlers)=> Landlord-squatter relationship
• Treaties made by settlers with local chiefs(MLHUD, 1995)
• Tanganyika Crown Land vested in Germany Em-pire (Wiley, 1998)
• Land Tenure Ordinance No 3 => all land is PublicLand, Rights of Occupancy introduced.
Table 1. Timeline of important historic events in Mozambique and Tanzania
a One such case is the Limpopo Irrigation Scheme established in 1954 as a settlement of whites. Further,the so-called assimilados, black Mozambicans, who by virtue of education had adopted the Portugueselanguage and culture, also acquired (on probationary basis) 2 ha each of relatively inferior land(Bowen, 1993).

118 LAND POLICIES IN MOZAMBIQUE AND TANZANIA
Another legacy of colonization is that the land tenure system was accompanied byregulated agricultural production with use of state subsidies and other governmentinterventions. This meant that tenure and production decision-making were separated(Okoth-Ogendo 1996). This was particularly so in countries where cash crops (coffee,tea, cotton, sisal, etc.) were promoted. However, in Mozambique the colonial strategywas slightly different, in that local people were allocated marginal land close to largecompanies in order to supply these companies with cheap labour.
As Mozambique and Tanzania gained the independence, both adopted a socialistideology (Table 2). The rationale was to ensure social justice, hence provision of equalopportunities for people and equitable distribution of resources by correcting the inequityin access to resources. However, state ownership of land was maintained and the motivewas that the independence struggle aimed at giving the land back to the people, therefore,the state was the guardian and had power to decide on the conditions of its use.
In the case of Mozambique such provision is stated in the Constitution. This wasthe major thrust for nationalization of land in 1977. Article 8 No.2 of the MozambiqueLand Use Law of 1987 states that users are required to have a state license for usingtheir rights, the exception to this rule being the household sector, and this protectedthe family-farm sector. However, according to Nhantumbo (1997), the absence of atitle or certificate for the household sector is one of the main shortfalls of this landlaw. The reason being that lack of certified rights made small-scale farmers the mostvulnerable to displacement by large scale or commercial farmers, especially after theabolition of large-state farms in 1983. Further, the land law does not deter privateinvestors from preventing local communities that want to use the land despite thefact that these investors (mainly companies) underutilize or do not use the land, asdemonstrated by LOMACO, a multinational company engaged in cash crop farming(Nhantumbo 2000b).
The establishment of communal villages in both countries was meant to makepeople work together for what was understood to be a common goal. Therefore, thevillages served as centres for economic development mainly through agriculture. Thegovernments of Tanzania and Mozambique assumed that people would willingly relocatethemselves to newly designed village areas. However, this was not the case. Oneschool of thought is that people have strong cultural attachment to their land of originbearing the tombs of their ancestors. As Kahama et al. (1986) states in Tanzaniavillagisation became compulsory and coercive in 1973. However, this phase wasaccompanied by a decentralisation policy aimed to bring the decision-making closer tothe people, showing a theoretical will from the central government to encourage popularparticipation in decision-making processes. In practice, however, most decisionsfollowed a top down approach as directives from higher authorities were issued (ibid.).
Concentration of people into the villages be them Ujamaa or Communal villagesas they were known, respectively, in Tanzania and Mozambique meant abandonmentof traditional agricultural and residence areas. This resulted into clearing forest areasfor the new settlements and for their agricultural production. According to Kjell et al.(1988), the semiarid Tanzania suffered environmental degradation as a result ofdeforestation and soil erosion. The Ujamaa policy lacked the necessary incentives toincrease production and investment while the forced movement of farmers madethem reluctant to work efficiently. Farmers’ locally adaptive agricultural knowledgeaccumulated during hundreds of years in old villages was rendered far less relevant.

119 I. Nhantumbo, G. Monela and G. Kowero
Table 2. Sequence of important milestones
Main features
• Socialist ideology• Centrally planned economy• Land and natural resources on the surface and under the soil
including water belong to the statea
• Land was nationalized• Land had to be allocated permanently and free of charge to
large-scale state farms and co-operativesb
• Socialist ideology• Centrally planned economy• Freehold Titles Conversion and Government Lease Act No. 55
• Arusha Declaration => socialist aspiring state with a socialistmode of production
� major means of production and exchangeshould be controlled publicly/communally
� State as the custodian of peasant rights� Nationalization of industries, financial
institutions and large estates� Ujamaa villages are established
• Establishment of subsidized (equipment and inputs) for large-scale state farms
• ‘People farms or machambas do povo ’ in communal villagesc
• The Ministry of Agriculture recognizes inefficiencies of statefarms as depicted by decline in the level of production
• Fourth FRELIMOd Congress => reforms (Bowen, 1993, MAP, 1997):
• decentralization,• adoption of market-oriented• small-scale projects thus replacing
centrally planned large-scale farming andcapital-intensive development projects
• allocation of the scarce inputs to relativelyefficient sectors irrespective of thembeing state enterprises, cooperatives,private or peasant farmers
• Change on policy and role of family-farm and private sectors
• Ujamaa policy enforced• Government Leaseholds, Conversion of Rights of Occupancy
Act, No. 44 => greater control of freehold land by government
Country
Mozambique(1975)
1977
Tanzania(1961)1963
1967
Mozambique1975-
1981
1983
1984
Tanzania1969
Historic Period
IndependenceNationalizationof land
Independence(Analysis of theland access andproductionsystem and itsefficiency) =>abolition ofstate farms
a. Article 8 of the Mozambican Constitution and Land Law No. 6/79b. Land Law and the Land Use Legislation of 1987 (RPM, 1987)c. Villagers joined to cultivate a common plot with inputs and equipment obtained through the state supportd. FRELIMO is Frente de Libertação de Moçambique, the present ruling political party.

120 LAND POLICIES IN MOZAMBIQUE AND TANZANIA
On the other hand, the planning of the villages was not done properly since somefarmers were moved from fertile to less fertile areas on the pretext that the latterwere closer to social and market infrastructures such as clinics, schools and roads.This arrangement was also coupled with government price control of agricultural produce,at times to the disadvantage of farmers.
The Act No 44 of 1969 (Table 2) compelled landowners to pay land rent togovernment and empowered the President of Tanzania to revoke any right of occupancywhenever it was considered appropriate. This move was aimed at avoiding the rightsof exclusion in perpetuity held by the freeholders. The government came to acknowledgethat because the owners could freely decide on the most appropriate way to use land,this led to indiscriminate clearing of forests and under/non utilization of land.Furthermore, the owners could sublease portions of their land. The improper use ofland was exacerbated by lack of land development conditions or an approved land useplan by the government.
In another move aimed at containing customary land tenure system, the traditionalfunctions of chiefs, that included land allocation, were rendered obsolete by The AfricanChiefs Ordinance (Repeal) Act. No. 13 of 1963 that officially abolished chieftaincy inTanzania. In the case of Mozambique the traditional authority was suppressedimmediately after independence as it was conceived to be against people’s interests.For example, the chiefs were used by the colonial government to ensure theimplementation of its policies, some of which involved into activities such as arrestingof offenders, recruitment of people for military service, selling of people as slavesand tax collection from subjects.
In conclusion, during the first years after independence both Tanzania andMozambique adopted socialist policies and nationalized land. Collective organizationin production systems was enforced, and was viewed as an efficient equity mechanismfor distribution of resources and wealth. To both governments ‘state ownership’meant ‘people’s tenure rights’. For example, the government of Mozambique defineditself in the constitution as a guardian of resources, which belong to all people. Thenotion of ‘people’s rights’ was the basis for creation of the ‘People’s or Peasants’farms’ in which a group of people cultivated jointly the land and shared the benefits.This did not provide security in land tenure for the users, nor as collective or asindividual entities with specific needs to meet. It however promoted open access(particularly in forests and woodlands) and mismanagement of public lands. Forestclearing by the community was all that was needed to ensure access to the land foragriculture and for grazing. On the other hand, a lease agreement was necessary forthe private entities.
Some argue that the notion of ‘people’s tenure rights’ is being reintroducedthrough the concept of communal land embedded in the new legislation governing landaccess. For example, in Mozambique a community is defined as a group of familieswithin the locality, the smallest administrative unit. Therefore, smaller units can bedefined by the community itself, delimit, demarcate in consultation with the neighboursand apply for a Land User Rights’ Certificate. However, the new instrument is moreprogressive in that a legal instrument can be issued (up on request by the communityrepresentatives) in order to define the entity holding the recognized land rights. Hence,it can be inferred that having secure user rights, the community can engage in someform of natural resource management in the belief that secure tenure rights provideincentive for long term investment on land.

121 I. Nhantumbo, G. Monela and G. Kowero
2.3 Land policy from pre-colonial to post-independence era:implications for land management and forestry development
Apparently during the pre-colonial period the resources were abundant due to lowpopulation pressure. Therefore, despite the practice of shifting cultivation, the systemwas deemed sustainable. In addition, local institutions were in place and had strongallocation powers, which may also have contributed to what appeared to be a sustainableresources use system.
The acquisition of land by colonial settlers that forced indigenous people to marginalland was the beginning of land-related problems in the region. Growing human and livestockpopulations caused overcrowding in smallholding areas leading to forest and landdegradation, mainly because of clearing forests for subsistence agriculture, habitationand grazing. In an attempt to contain this trend colonial governments adopted policiesthat introduced compulsory conservation work and group resettlements and constrainedlivestock movement and development. These measures were common in the southernAfrican region and people resented them. For example, by the 1950s most people abandonedsettlements in Nyasaland (now Malawi) and destroyed contour ridges and terraces inSukuma-land in Tanzania (Bassett 1993).
As mentioned earlier (Section 2.1) income generation was the major thrust of colonialgovernments. To this end, large tracts of natural forests were cleared for estate cashcrops and industrial forest plantations. There was no requirement to compensate displacedpeople since the law did not protect them. The sovereign (i.e. the colonial power) hadall rights over land, and this facilitated easy access to land for various ends. Further, theproductive natural forests were subjected to intensive selective harvesting of high valuecommercial species. The logs were exported and processed elsewhere with virtually nosignificant returns or benefits to the people of these two countries. Since industrialharvesting was concentrated in few species this gradually led to their complete depletionin some areas. Adverse consequences of overexploitation and use of inappropriate harvestingpractices were noted and regulation for wise use of natural forest resources started earlyin the twentieth century, first in Mozambique and later in Tanzania.
Overall, the main feature of the land tenure system in both countries during thisperiod remained state ownership. The governments controlled all land, and maintainedauthority to grant rights of use and occupancy to different sections of society includingvillages, individuals, companies, parastatal organisations and various investors. Formalland markets were non-existent (NCSSD 1995; RPM 1979). However, much of the land inrural areas remained “owned” under customary land tenure conditions where landadministration was initially controlled by local chiefs and later on by village governments.However, the state could revoke customary ownership rights. This resulted in complicatedtenure arrangements and conflicts between local people who were de facto owners(some consider it “private” ownership) and the state, which had de jure property rights.
Conflicts between customary law and statutory titles have been observed in bothcountries, for example in those areas that were affected by valorisation in Tanzaniaunder the Valorisation Act of 1975 (Tale 1991). In these areas some of the newly establishedvillages collapsed forcing farmers to sometimes opt to return to their old villages wherethey had owned land customarily. At times they found the state had already allocatedtheir land, especially to large-scale farmers. In either case there was extensive clearingof forests by both smallholder and large-scale farmers to create land for agriculture,habitation, supporting infrastructure, and other activities. The 16-year old civil warin Mozambique also displaced villagers from their land and constrained their return to

122 LAND POLICIES IN MOZAMBIQUE AND TANZANIA
former settlements. To a large extent this encouraged deforestation for similar usesas in Tanzania, and other short-term income generation activities (Saket 1994).
The existing land legislation and the supporting institutional framework for landtenure were inadequate to deal with dynamic changes, which were emerging as earlyas the mid-1980s. The changes included a shift from centrally-planned to a market-oriented economy, privatisation thrust, increased urbanisation, democratisation, andgrowth of population densities in many localities, rapid dwindling and deterioration ofnatural resources, and increased poverty (NCSSD 1995). Compounding the situationwere lack of incentives for efficient use of resources, scarce investments for landimprovement and development, and inadequate mechanisms for resolving land conflicts.The traditional machinery for dispute settlement or administering land rights andjustice was virtually broken down because:
• There was overlapping jurisdiction between various bodies including organs andmembers of the executive and the ruling party in resolving disputes.
• Disputes lasted for a long time without final, conclusive and certain resolution.Organs of justice were remote and inaccessible both physically and socially.
• People showed great dissatisfaction with the decisions of judicial organs,considering them unjust and unfair.
• Government organs, including courts, were accused of nepotism, corruptionand bias.
Generally, people accused the so-called machinery of justice of inefficiency,illegitimacy and injustice.
As regards women’s access to land, the Tanzanian post-independent governmentlargely adopted a pluralistic legal system that ignored women’s land rights. Only in1971 the Law of Marriage Act protected spouse rights in the matrimonial home(Rwebangira 1999).
Both Tanzania and Mozambique’s political-economic history since independencehas had a number of environmental, institutional and economic consequences. Thenotable ones are:
• The orientation to socialism and poor economic performance that left the countriesincapable of handling conservation and development initiatives. For example, theGovernment of Mozambique embarked on large-scale industrial plantations in late70’s and later attempted to involve the rural communities in tree plantations. Thisdid not contain deforestation. Participation in the plantations program was negligibledue to lack of secure land tenure as an incentive to long-term investment, andbenefit-sharing mechanisms were not clear. This example demonstrates the separationof tree and land ownership rights. The same can be said about Tanzania when in thesecond half of the 1960s it embarked on a village/community forestry initiativewithout much success.
• The attempt by the two governments to change land policy and law did not affectthe boundaries of the state-protected areas defined during the colonial period.The national game parks, forests and game reserves remained unchanged, irrespectiveof whether local communities were earlier forcibly removed from these areas. Inthe case of Tanzania, new protected areas were also gazetted.
• Despite the fact that coercive collective production was enforced, collective-choice did not exist as the users/stakeholders had no say in devising operational

123 I. Nhantumbo, G. Monela and G. Kowero
rules and lacked minimum recognition of rights to organize outside what was definedthrough constitutional rules. This was a disincentive to increased agriculturalproduction and productivity. The forests continued to be major sources of incomeand other resources to rural households.
3. CURRENT LAND AND FOREST RESOURCES TENURE POLICIES
3.1 Common property regime: the main feature of the current resourcestenure polices
The objectives of land policies in Mozambique and Tanzania appear to address three mainissues. First, to ensure the rights of the countries’ citizens over land and other naturalresources, and especially creating an enabling environment for development and growthof the household or family-farm sector. Second, to encourage investments into land fromthe commercial sector, and thirdly to promote sustainable and equitable use of the naturalresources.
Towards the middle and late 1980’s serious internal analysis of the results of thesocialist policies and planning process were undertaken by the governments of Mozambiqueand Tanzania. This reflection was responsible for the policy changes especially withrespect to resources access and economic planning approach (Table 2). The flowchart inFigure 1 illustrates the factors and results of such change. It shows the theoreticalassumptions in which the current polices are based and potential practical implications onthe local institutions and sustainability of resources use.
Despite being progressive the current land law, still maintains the state as the ownerof land and other resources. Hence, there is no indication that governments are ready tototally relinquish ownership of land and some natural resources. While some might arguethat such undertaking would enable long-term investment, the risk of building a populationof landless cannot be overlooked.
Bruce (1999) identifies various ‘sources of vulnerability’ in the legal frameworks thatcreate opportunities for common property regimes. These include lack of legal provisionsin the national laws of both organizational form and clear property rights, the claim bythe state as a sole owner of the resources as indicated in the previous paragraph, andpoor integration or conflicting statutory and customary laws.
The establishment of common property regimes requires a number of principles,which are not a blueprint but a guide (Ostrom 1998) (See Box 1).
While application of these principles lies mainly at the community level, legalinstruments have to be in place to address the issues of boundaries and communityorganization as they are central for the application of any of the other principles. TheMozambique law defines community as a group of families and individuals living withinthe boundaries of a locality, and that they share resources and have a common interest intheir management (AR1 1997, AR2 1997). Therefore, through provision for delimitationof community land for which a formal certificate for land use rights can be issued, thecreation of local representative entity to hold the rights on behalf of the communityensures that the principles can be observed. In fact, the entity created is an importantplatform, on the basis of which the community can obtain tangible gains through accessto resources.
Continuing with the common property regime debate, an important issue is the factthat environmental degradation has been attributed in most cases to market failure.

124 LAND POLICIES IN MOZAMBIQUE AND TANZANIA
• Clear definition of boundaries• Consonance between appropriation and provision rules with local conditions,
i.e., defining the quantity and quality of products as well as appropriateperiod of harvesting
• Collective choice arrangements entail the design of rules to regulate thedaily use of resources and this constitutes an instrument for self-enforcement
• Monitoring for effective restriction of appropriation activities• Graduated sanctions to ensure internal enforcement• Conflict resolution mechanisms to resolve any internal and external disputes• Minimal recognition of rights to organize enables the community to devise its
own institutions• Nested enterprises allow the design of rules appropriate for different levels
Figure 1. Factors driving the policy change and results
Box 1. Principles of common property
• Shift from centrally planned to market economy, hence theStructural Adjustment Programmes (economic reforms)
• Increasing land conflicts between the state and/or privatesector on one hand and the rural communities, on theother.
• Negative experiences with the displacement of people dueto the civil war in Mozambique and implementation ofvillagization policies in both countries.
• Traditional ownership systems that vary considerablyacross each country and are in line with the social andcultural structure of the communities
Mozambique
Land policy reform debate gainedmomentum early 1990’s with significantinvolvement of the civil society and claimof stronger rights for rural communities.The signed ceasefire agreement in 1992 toend the civil war, gave more impetus tothe policy reform process. Currently thecountry has in place four main legalinstruments on land policy: the policy (1995),the law (1997), the Regulation (1997), thetechnical appendix (1999).
Tanzania
Land policy debate concluded in 1995when the Parliament approved thecurrent land policy.The land bill was approved by Parliamentas Land Act, in 1999, and Village LandAct, 1999 (commonly referred to as theLand Acts, 1999).
Attempted return to socialism or adoption of commonproperty regime based on positive law to ensurecommitment of users in sustainable management of theirresources?
Factors ofchange

125 I. Nhantumbo, G. Monela and G. Kowero
However, perhaps an interesting issue in this era of emphasis on devolution of resourcesto communities is whether these are really efficient resource users or not. McCay andJentoft (1998) who apart from considering common property a social construct arguethat environmental degradation can also be a result of ‘community failure’ rather than‘market failure’. They attribute this to the fact that communities are not alwaysadequately integrated, homogenous, and cooperative in addition to lack of equitabledistribution of the resources. Shortfalls in communities may also be due to lack ofknowledge, disorganization, social stratification, conflicts of interest and even inter-ethnic rivalry. This is an important aspect to reflect on. The establishment of naturalresources management councils or land councils as provided by the Mozambique lawaims at creating such local structures which will effectively devise the norms for resourcesuse as well as monitor compliance. It should be noted, however, that in some cases thecommunities do not identify themselves with the created structures, as those areovertaken by entities that already hold power (economic, political or otherwise). As aresult the decision-making does not in reality lie with the bulk of the community butwith only a few individuals.
Consequently, understanding the local politics and power relations is essential sincethey can for example influence the two levels of decision-making regarding tenure: theoperational and the collective-choice. According to Forster (1999) communities, have a defacto authority as regards the daily use of the resources (withdrawal rights) through theexercise of their traditional rights. The users set the rules for access, use and managementof the resource. This entails participation of the users (the councils referred to previously)in decision-making concerning their rules, taboos and other beliefs known to have contributedto rational utilization of resources. However, in both Tanzania and Mozambique, such rulesare limited to few tree species and patches of forest perceived to offer direct benefits(fruit trees, sacred forests, etc) for the communities. The rest of the forest resources areeffectively unregulated, therefore the challenge facing the councils is to devise and enforcerules to ensure sustainable use of a range of natural resources, wood or non-wood.
Article 3 of the current land law in Mozambique (AR2 1997, MAP 1999), reinforcesthe notion that the land still belongs to the state as provided for in the Constitution of1975, and as revised in 1990. However, the law recognizes the rights obtained throughcustomary land ownership rules as well as the methods and principles of traditional landmanagement, as reflected in Articles 12.a and 29 in the Land Regulation. The currentpolicy also provides for land utilization without paying rent by the state and its institutions,farmers associations, the household sector, and other users (Article 29). Such provisionis essential for ensuring that rural and other population strata with less income availablecan also have access to land. However, in effect there is a land market in Mozambique,the price of a plot of land for housing with 450 m2, for instance, can cost as much as USD1944 in Maputo. Of course such price will decrease or increase depending on its location,and closeness to Maputo and other cities. Land markets do also exist in the rural areasas local people sell land in exchange of immediate cash.
The present land policy in Tanzania identifies four central tenets of the current landtenure system as:
• Land is publicly owned and vested in the President as a trustee on behalf of allcitizens (i.e. radical title).
• Speculation in land is controlled.• Right of occupancy, whether statutory or deemed, is the main form of tenure.• Land rights are based on use and occupation, i.e., security of tenure is dependent
on use.

126 LAND POLICIES IN MOZAMBIQUE AND TANZANIA
Based on these provisions, the main feature in the present land tenure system inTanzania is that the government controls and owns all land and in turn grants rights ofuse and occupancy to different stakeholders. Also much of the land in rural areas isstill under customary land tenure that is officially recognized. However, the government,as the landowner, has powers to revoke customary land rights. This is a source ofconflicts between different stakeholders and it continues to prevail even after thepresent land policy and Act came into force. Insecurity of tenure and conflicts havepromoted open access to forests and woodlands, as well as facilitating urban squattingand mismanagement of public lands.
3.2 Opportunities for local communities in forestryForestry and wildlife tenure is important because of the potential socio-economicopportunities in these resources and the many restrictions faced by local users inaccessing the resources. In addressing these issues the two countries through theirforest policy documents, define four main objectives (CM 997, MNRT 1998).
• The economic objective has the private sector as the major player and the aimis to provide incentives for maximization of returns through promotion of localprocessing in order to add value to the forestry products.
• The social objective acclaims that local communities should benefit from existingresources in the surrounding areas through Community Based Natural ResourcesManagement (CBNRM).
• The ecological objective has the state as the main actor. Its role is managementof state protected areas in partnership with other stakeholders.
• The institutional objective, which comprise the reform and capacity building ofthe National Directorate of Forestry and Wildlife (Mozambique) and Division ofForestry and Beekeeping (Tanzania) including their establishments at provincialand district level.
The social objective also aims at giving more power for decision-making andcontrol over natural resources to the local communities. This forestry policy objectiveis supported by the land law in Mozambique in terms of provision for delimitation ofcommunity land (AR1 1997). This land policy provision allows the communities tonegotiate with other partners possessing land or other resources as their share injoint business. In this case the forestry and land policies complement one another,and further the land policy creates a good environment for operationalising the socialforestry policy objective.
The operationalisation of these four objectives depends on engagement of themain actors such as the state, local communities and the private sector. The emphasisin the southern African region in land, forestry, and wildlife policies is devolution ofrights and benefits to local communities on one hand, and co-management on the other.Much as the recognition of the concept of group (community) ownership is a milestoneon the way towards group cohesion, institutionalization of the governance for collectiveaction, and sustainability of resources use (Knox and Meinzen-Dick 1999), there ishowever a general trend in government macroeconomic policy to assume that privateownership of property as leading to efficient resources use. This is especially truegiven the current emphasis on privatization policy, which is one of the strategies foreconomic reforms these countries are implementing. Arnold (1998) cautions that

127 I. Nhantumbo, G. Monela and G. Kowero
individual ownership can also lead to overuse and degradation especially in lowproductivity areas which are characteristic of many common property areas in themiombo woodlands of eastern and southern Africa. Knox and Meinzen-Dick (1999) addthat private property rights are a necessary but not sufficient condition for adoptionof technologies. With respect to community based natural resources managementpractices, such technologies could be associated with issues such as design ofmanagement plans, identification of alternative income generating activities, businessmanagement, and monitoring.
Rihoy (1998) considers two important opportunities for community involvementin the sustainable management of natural resources. One is the recognition ofcustomary tenure systems in the land law (as is presently the case in the two countries),and the other consists of provision for establishment of wildlife management areas,managed by local community with direct benefits to them. There is a move in bothcountries towards involvement of local communities in wildlife management. It isargued that efficient enforcement lies at the level of the local communinty that hasresponsibility over land and other resources (ibid.).
In both countries forestry and land tenure policies have been revised to be in linewith the changing socio-economic environment. Apparently, there are no conflicts ofprinciple. While it might appear that policies and legislation favor community basedforestry in Mozambique and Tanzania, there are a few flaws that need attention:
• While the land policies and laws in both countries recognize the right of occupancy,the forestry and wildlife policies and supporting legislation require possessionof at least a simple license from the government for use of the resources withinthe community boundaries, or possession of a government concession forcommercial purposes. There is no provision in the current legislation for a fullbundle of rights.
• Another common problem of the two policies revolves around definition of thecommunity boundaries (delimitation) and the procedures for acquisition of titleby communities.
Delimitation involves creation of boundaries and design of rules for exclusion ofothers. The definition of community boundaries is a fundamental question, as itconstitutes the basic principles for successful common property regimes (Ostrom 1998;Forster 1999). The rights of exclusion or negotiation of use cannot be enforced withoutclear boundaries. Areas with existing or potential conflicts, requests by the communitiesand areas proposed for development have been given priority for delimitation inMozambique. Nevertheless, areas with CBNRM projects also are being targeted fordelimitation with support from rural development projects. The process is expensive.The lack of awareness by the communities holds potential to reduce the probability ofmany communities securing their land rights before such rights on the same land aretaken by the private sector and other entities. Therefore, the basis for establishingcommon property management arrangements, for creating partnership and communitydevelopment are weakened further.
Arnold (1998) identifies four advantages of managing resources, especially forests,as common property regimes. These include:
• Indivisibility or need to take an ecosystem approach to management;• Uncertainty in location of productive areas, which would be the case of the
multiple use areas where the variation in productivity is considerable.

128 LAND POLICIES IN MOZAMBIQUE AND TANZANIA
• Internalization of externalities increasing efficiency in production minimizingdestructive use.
• Administrative efficiency resulting from the fact that managing individual andindependent parcels is relatively more expensive than when the group createsand enforces the rules over use of the resources.
The latter advantage is the one the governments of Mozambique and Tanzaniacapitalize on. The enforcement role that is expected from the community in itsinvolvement in the resources is stated clearly in the Mozambican forestry and wildlifepolicy of 1997 (AR2 1997) and in Article 33 of the land law (AR1 1997). The latterprovides for the delegation of powers for management of the resources from thestate to the communities. Therefore, decentralization is recognized as having animportant role in facilitating implementation of this policy. Again, both land and forestrylaws recognize the need to create local institutions such as management committeesor councils to represent the community. Despite the few shortcomings, both forestryand land policies together with supporting legislation give considerable weight to acommunity based approach to managing natural forest resources. This thrust is alsoin line with relevant theoretical principles on community-based endeavours.
3.3 Imbalances in development opportunities: communities vs.private sector and state
The current land policy and legal framework provides for land access by the ruralpopulation and other relatively disadvantaged sectors of society. It has been previouslystated that the settlement of the poor was mainly in marginal land. This was a deliberatemove/policy to force the population to supply labor for the commercial agriculturalsector. The communal/ujamaa villages brought another type of concentration of thepopulation, again breaking the existing social and cultural networks. As a consequenceof these changes it is interesting to look at the quality of land that the community isentitled to and can administer as a consequence of these changes. This is the only wayto establish whether we are dealing with false or real devolution of resources tocommunities. Experience from some Latin American countries indicates that landreform meant allocation of marginal/fragile land to peasants. This resulted into veryhigh environmental costs such as erosion, deforestation and diminution of bio-diversity(Foster 1999). This land administration pattern is similar to that prevailing inMozambique and other countries in eastern and southern Africa as illustrated in theFigure 1. On one hand, there are few private/commercial farmers owning large andhigh productivity areas for cash crops, while on the other hand, there are smallholderfarmers (who constitute the bulk of the population) confined to marginal land(characterized by low fertility, scarce water supplies, etc.,) (Nhantumbo 2000c).
It is only fair to ask whether restructuring and relocation of the communitieswould be a solution, or else ensure that in the process of delimitation, productiveareas are also part of the community land. However, lack of capital (human, monetaryand physical) would limit the economic exploitation of such resources by communities.Despite that, perhaps this would indeed create opportunity for establishing favorablepartnerships with the private sector such that provides a fair share to the de factomanagers of the resources.

129 I. Nhantumbo, G. Monela and G. Kowero
Figure 1. Rural community in the periphery in terms of access to resources andbenefits attained (Nhantumbo 2000c)
The rural communities have very limited access to the productive forests andstate protected areas (Figure 1). They have to compete with other uses such asagriculture (shifting cultivation), pasture, development projects for access to theresources in the multiple use areas (Nhantumbo and Soto 1999). The productive andstate protected areas have an abundance of industrially non-important tree species,mainly used for firewood and charcoal, products that have high demand in the urbanareas. Two actors are involved as suppliers. The community is the main producer,supplying to traders who in turn supply the final markets in urban areas. The supply bycommunities is deemed illegal, while the intermediaries/brokers or traders (or privatesectors) have rights certified through a license issued by the forestry authorities.
In Mozambique the land law emphasizes partnership between the variousstakeholders be it in the productive or multiple use area. This creates an enablingenvironment for establishment of fair contracts between the private sector andcommunities in the exploitation of the productive areas (forest and agriculture). Further,investment on capacity building at community level (training, technology, credit, etc)is necessary to provide encouragement for their involvement in the economic exploitationof natural resources.

130 LAND POLICIES IN MOZAMBIQUE AND TANZANIA
3.4 Institutional arrangements, gender and equity issues
(a) Mechanisms for self-organisationOstrom (1998) states that appropriators can put up monitoring mechanisms to controltheir own activities. One of the requirements for this is existence of strong localinstitutions to regulate use of common pool forest resources. These include authorizationand securing use, setting and enforcing rules, and monitoring. Strengthening localinstitutions in order to secure property rights and collective action increases the chancesof community adoption of new technologies for natural resources management (NRM)(Knox and Meizen-Dick, 1999). Arnold (1998) quotes Sarin (1993) in defining the guidingprinciples for joint forest management in India as:
• The group has to be an autonomous and viable social unit organization. Being asmaller and homogenous group is advantageous but not essential;
• Existence of norms and procedures that are clear and flexible to adapt to changes,accountability and conflict resolution mechanisms.
These principles appear to be applicable for community based natural resourcesmanagement and the management committees. Further, self-organization of the groupand its empowerment to exercise exclusive rights constitute other requisites of commonproperty regimes (ibid.).
The principal difference between the two countries lies in the definition ofcommunity. In the case of Mozambique the community can encompass all families withina locality (the smallest administrative unit) or smaller if that definition of boundariessuites the local community. On the contrary, in Tanzania, the community is a village(Table 3). However, the most significant common feature is that both countries createthe necessary institutions to regulate the resources use and management.
Table 3. Institutions of NRM in Mozambique and Tanzania
Country InstitutionsMozambique • Land council comprised of representatives of
the community (3 to 9) – Land Law• Participatory natural resources management
committee (NRMC) including the communityrepresentatives, the private sector,associations and local government authorities –Forestry and Wildlife Law
Tanzania Natural resource management or environmentalcommittee at village level (smallest administrative unit)
The communities differ in area and number of inhabitants. This will influence thetype of institutions and the way they relate to the rest of the group. Literature suggeststhat smaller groups managing resources under common property regime seem to workbetter (Bruce, 1999; Rihoy et al. 1999; Knox and Meinzen-Dick 1999). This seems tocontradict some of Sarin’s observations regarding the group sizes. The reasons givenfor smaller groups managing resources better include: the tendency to have sharedvalues; may gain substantial benefits and ensure equity in distribution; have lower

131 I. Nhantumbo, G. Monela and G. Kowero
costs of intra-group enforcement, extra group exclusion, decision-making andcoordination.
In the case of Mozambique there are two major concerns regarding the createdstructures. One relates to the lack of clarity on whether the land councils also hold amandate for managing other resources such as forests, wildlife, and water. This raisesthe possibility of duplication of fictitious institutions undermining the aim of the policiesthat is to identify a community representative. The other concern relates to the factthat the NRMC apart from perhaps including the local elite as defined by the stratawithin the community, can also include stakeholders with clear economic and politicalpower (e.g., the private sector and local government). The latter may determine thedecision made by this institution, thus carrying the decisions as usual, which means thestatus quo at the community (powerlessness) is likely to be maintained. If this happens,it will certainly affect the access of resources by the powerless and poor. The immediateconsequence will be further deterioration of livelihood support opportunities, henceperpetuation of poverty.
In the short period over which village-based forest management has taken root inTanzania, villagers claim that there has been a sharp reduction in resource abuse arisingfrom illegal pit-sawing, forest clearing for farming and charcoal production, and ringbarking for production of grain storage containers (locally known as vilindo). Further,they have noted a significant decline in the sale of forest products in the local markets.The experience of Duru-Hitemba village in Tanzania illustrates how important it is forthe rules of each village to be embedded in village by-laws, and approved by therelevant district council. Such approval not only formally recognizes the right of thevillage to manage and control the forest area in question, but also provides the legalbasis upon which it may contain resource abuse by, for example, levying fines. Withoutsuch a framework an offender is able to claim immunity. The legal framework alsoprovides a basis for the village to retain or expend funds arising from all village resources,including agriculture and livestock. The by-laws are approved and respected by localand central governments. They therefore guide the communities to legally organizethemselves for natural resources management.
(b) Gender considerationsRegarding gender, the Mozambique land law is explicit in terms of rights to acquire andhold user rights by people of both sexes. For instance, the land law states that allnational entities, individual or collectively, men or women, and communities haveright to use land. Article 13:5 of the same law reinforces that by stating that men andwomen can apply for individual titles within the area delimitated as community land.Further, men and women can give testimony on rights to use the land by a thirdperson, and members of both sexes can inherit land. In Tanzania, land can be ownedthrough state leasehold, private right of occupancy, customary tenure, and collectiveor village ownership. Under traditional tenure ownership of land is through inheritanceor customary rules among tribes, clans or kinships. Since women were traditionallynot allowed to own land in some clans, land laws discriminated against them. The1995 Land Policy as well as the 1998 Land Act and Village Land Act have rectified this.
Gender consideration with respect to access to resources is essential consideringthe different roles played by men, women, and children. For example, food securityand household fuel supplies in the southern African region continue to be the concern orresponsibility of women. In addition, women and children also collect other non-timber

132 LAND POLICIES IN MOZAMBIQUE AND TANZANIA
forest products for household consumption. The role played by women in the householdeconomy in the rural areas is significant. Hence representation of women in the village/community ‘management committees’ is also important to provide a fora for this socialgroup to share its experiences, challenges and solutions to various problems related toresources management. Nevertheless, the implementation of land policy and law willrequire a thorough study in addition to better understanding the traditional forms of landinheritance, participation in decision making, and awareness raising at the local communitylevel. Okoth-Ogendo (1996) citing the case of Kenya, argues that some rights acquired bythe communities through land reforms take a long time for social and cultural legitimacy.This is likely to be the case in the enforcement of rights of women that in many cases arelikely to go against established traditional practices. There is therefore potential resistancein local communities to adoption of pro-women changes in laws and regulations. Further,the land law in Mozambique recognizes the customary law and emphasizes the dualsystem, hence enabling discrimination at the local community level.
(c) Equity considerationsEquity in access to resources and distribution of benefits is an issue of social justice.Adoption of common property regimes is argued to be partly influenced by the abilityto define boundaries and institutions. However, it is ultimately influenced by the benefitsthe community perceives to obtain from such resources. In Mozambique the forestryand wildlife social objective aims at providing benefits to local communities. How thiswill be achieved and how the benefits will be shared equitably by members of thecommunity remains unclear. Tchuma Tchatu, a community based wildlife managementprogram jointly managed by a safari/tour operator and local community, is the onlyexample with a government decree issued specifically to define the distribution ofresources. In Tanzania, 20% of the benefits arising from wildlife management are ploughedback to the relevant communities. Good examples of this are villages near Lake ManyaraNational Park. Despite this, there is need to clearly establish the impact of such benefitson the well being of the beneficiaries.
Bruce (1999) indicates that Niger issued a decree requiring that managementplans guide use of forest resources and that benefits from exploitation of such resourcesgo to the village community. In Guinea the legislation goes further stating that notonly the benefits from harvesting forest products should go to the concerned community,but all benefits ‘after deduction of costs of forest administration’. It is important torecognize the cost aspect in the legislation because communities incur costs, either inkind or cash and these are often ignored. In addition, the communities also tend toask for benefits and demand that other entities such as government and others shouldbear the cost. However, Knox and Meinzen-Dick (1999) caution that collective actiondoes not necessarily lead to equity. Further, they consider common property regimesas accommodating multiple users beyond the household level and spreading benefitsmore evenly than individual private property.
One of the gaps in the legal frameworks of Mozambique and Tanzania is theabsence of a requirement for the community to design a constitution which spells outclearly, among others, the creation of the institutions and their substitution, norms formanagement of resources, benefit distribution, etc. Some other countries in SouthernAfrica have made progress in this direction. Examples can be gleaned from a‘Practitioner’s Guide’ developed in Botswana and a ‘Guide to Creation of Conservancies’from Namibia (Nhantumbo 2000c).

133 I. Nhantumbo, G. Monela and G. Kowero
4. POLICY FORMULATION PROCESS: STAKEHOLDERS’PARTICIPATION
The formulation of Tanzania’s land policy was guided internally by the governmentministry responsible for lands and in consultation with foreign-funded organizationsand consultants. Public participation in the process was limited to what was referred toas “rapid appraisals” made by consultants, in which case the consultants were theappraisers and the people were appraised. The ministry organized several workshops,but only carefully selected participants from vocal stakeholders were invited. Overall,there was no genuine popular participation in the process, which was seeminglymanipulative in character (Shivji 1996).
In Mozambique land policy formulation started in 1992 as a result of increasingland conflicts between refugees and locals, and between these two groups and theprivate investors, especially following the end of the civil war. The then prevailingland law, despite stating that land belonged to all Mozambicans, failed to protect therights of the smallholders. Further, changes in economic policies and politicalenvironment precipitated conditions for reforms in both sectoral and extra-sectoralpolicies. Case studies were carried out in pilot zones of the agricultural sector toanalyze land use and management issues in the family-farm, private, and state sectors.Particular emphasis was placed on participation at district and community levels. Thesestudies were enriched by public debate in regional seminars and the outcomes providedthe basis for policy formulation. According to the national land program under theAgricultural Sector Investment Program (PROAGRI), regional involvement was ensuredthrough participation of representatives of all provinces. Gender in land ownership isan important aspect and women were represented as permanent members of the‘Resource Group’ (MAP 1997). In addition, there was also active participation of EduardoMondlane University, the only university in the country at that time. The government ofMozambique therefore worked with academia, donors and civil society in general tobuild the current resource tenure legal framework. The formulation process of thepresent land policy was perhaps, the most participatory policy formulation exerciseinvolving the widest range of stakeholders that was ever undertaken in Mozambique(Nhantumbo 2000b).
5. SOME OBSERVATIONSFrom the discussions in this paper, the following observations are made:
5.1 On the present land policies(a) Both Tanzania and Mozambique were colonised and after their independence theyfollowed centrally planned economic policies. Therefore their land policies and lawsreflected communal systems that failed to address the expectations of the people anddisrupted their existing resources tenure rights leading to degradation of land and naturalresources. In addition, such policies did not prove to address the priority issues thatthe government had hoped to tackle.
(b) The land laws of Mozambique and Tanzania strive to provide a platform forinvestment at local level, hence enticing the much-needed development by creatingprovision for local land ownership or use rights. However, there are still some shortfallsrelated to the strength of local institutions, the capacity to address gender issues,

134 LAND POLICIES IN MOZAMBIQUE AND TANZANIA
equity in access and distribution of costs and benefits. Furthermore, it is clear thathaving land by itself does not lead to having secure rights over other resources (forwhich a special permission for use is also required).
(c) The land policies and laws of Tanzania and Mozambique, despite beingprogressive, are not yet sufficiently encompassing to address all the burning issues forthe various stakeholders in both countries. For example, the present land policy ofTanzania does not seem to adequately address and resolve the question of radical titleon land. In some cases it gives contradictory statements even on very sensitivematters to society. For example, the law states that land can be owned by stakeholdersbut it again vests its control in the executive arm of the government (i.e. the presidentthrough the land commissioner who can overrule any claim on land). In Tanzaniagender equity in access to land and benefits from management of natural resourcesshould be adequately addressed in both the policies and practice. However, in theMozambique land policy explicitly recognises the rights of both men and women.
(d) The current land policy in Tanzania provides for the centralisation of decisionalpowers in the government domain with respect to allocating and reallocating land.This challenges the basis of private rights on land, especially for individuals. Further,as this represents a top-down approach in the introduction of government initiatives,it has the potential to deny local communities the opportunity to devise their ownways to suit evolving situations. It also has potential to compromise the essence oflocal knowledge and relevance of new practice.
(e) The present land policy in Tanzania emphasises the role of the government onthe administration of land as well as action over rights of occupancy. This is opposed toa market-led policy for economic development in which the market allocates resources.
5.2 On impact on access, ownership and management of naturalforest resources
(a) The current Tanzanian land policy preserves the ambiguity between open accessand common property. For example, it is not clear which agency is responsible formanagement of public land.
(b) The current land policies in both countries attempt to correct past mistakes inlight of the new economic environment: an open market economy. Nevertheless, theprocess of devolving rights over land and natural forest resources, particularly to thecommunity has yet to yield meaningful results. In the case of Mozambique, there arecomplexities or rather lack of clarity on the procedures for acquiring the rights, andespecially as regards concessions or licenses for the rural communities. Tanzania, onthe other hand, is confronted with lack of full consideration of basic issues such asrights of women and adequate recognition of the customary laws. In addition, one ofthe most critical outcomes of the weaknesses in the land policy of Tanzania is thecontinued maintenance of a mosaic of many ordinances and Acts on land, which lackboth comprehensiveness and coherence. This has potential for more conflicts andconfusion among land users.
(c) The importance of boundaries for community land, their potential problems,the need for strong institutions, and sharing benefits from natural resources have beenaddressed in present land policies. However, for the latter it is necessary to establish amore detailed and perhaps procedural legal instrument to guide the sharing of benefits(for all involved stakeholders) generated out of common property regimes. In particular,

135 I. Nhantumbo, G. Monela and G. Kowero
the enforcement of such instrument in order to guarantee that communities accruesuch benefits is paramount for their engagement in sustainable use of natural resources.Such communities have up to the present not gained any significant and legally recognizedreturns from forest resources, except direct consumption of forest products.
(d) By and large the new resource tenure legal frameworks in both countriesestablish the basis for ensuring access to the resources for all stakeholders, therebyenhancing common property regimes and sustainable use and management of naturalforest resources. However, the challenge to the governments of the two countries aswell as to relevant non-governmental organisations is to devise ways to move towardsa more stable system of secure property rights based on land tenure and marketallocation, grounded in law, upheld by the courts of law, and observant of people’sneeds and preferences.
6. GENERAL RECOMMENDATIONS(a) The present Land Policy of Tanzania should address the issue of radical title on landand develop provisions in the law to address gender issues.
(b) The Communities (villagers) should be given the opportunity to devise theirown arrangements on administration of the land to fit their evolving situations. Thiswill provide venues for recognition of essence of local knowledge and relevance of newpractice.
(c) There is need to ensure clear boundaries for the resources in order to ensureidentification of responsibilities in its management.
(d) There is a need to establish a legal mechanism for benefit sharing as a result ofinvolvement of various stakeholders, particularly the local community in the managementof natural forest resources.
ENDNOTES1. In 1928 the British redefined “the Right of Occupancy” to include the title of a native
community lawfully using or occupying land in accordance with customary law. This was an attemptto protect native rights and provided for clearing forestland for subsistence farming. However,compulsory acquisition of native lands by the colonial government for the benefit of immigrants
was left unchanged
REFERENCESArnold, J.E.M. 1998 Managing forests as common property. FAO Forestry Paper 136. FAO,
Rome.Assembleia da República (AR1) 1997 Lei de Terras. BR I:40. PORM, Maputo.Assembleia da República (AR2) 1997 Lei de Florestas e Fauna Bravia. Maputo.Bassett, T.J. 1993 Introduction: The land acquisition and agricultural transformation in
Sub-Saharan Africa. In: Bassett, T.J. and Crummey, D.E. (eds.) Land in Africanagrarian systems. University of Wisconsin Press, USA.
Bowen, M.L. 1993 Socialist transitions: Policy reform and peasant producers inMozambique. In: Bassett, T.J. and Crummey, D.E. (eds.) Land in African agrariansystems. University of Wisconsin Press, USA.
Bruce, J.W. 1999 Legal basis for management of forest resources as common property.FAO Community Forestry Note 14. FAO, Rome.

136 LAND POLICIES IN MOZAMBIQUE AND TANZANIA
Carvalho, S. 1998 História de Moçambique, Vol. 1. UEM, Maputo.Conselho de Ministros (CM) 1997 Política e estratégia de desenvolvimento de florestas e
fauna bravia. BR I:14. PORM, Maputo.Forster, N. 1999 Back to basics: Can tenure foster ecologically sustainable resource
management? Workshop on Land in Latin America. CEDLA/CERES/WUR, Amsterdam.Kjell, J.H, Kjaerby, F., Meena R. and Vuorela, U. 1988 Tanzania: Country study and
Norwegian Aid review. Centre for Development Studies, University of Bergen.Ministério da Agricultura e Pescas (MAP) 1997 PROAGRI: Componente de terras. MAP,
Maputo.Ministério da Agricultura e Pescas (MAP) 1999 Anexo técnico ao regulamento da Lei de
Terras. MAP, Maputo.Ministry of Natural Resources and Tourism (MNRT) 1998 National Forest Policy. MNRT,
Government Printer, Dar es Salaam, Tanzania. 59p.McCay, B.J. and Jentoft, S. 1998 Market or community failure? Critical perspectives on
common property research. Human Organization 57: 1.Ministry of Lands, Housing and Urban Development (MLHUD) 1995 National Land Policy.
The United Republic of Tanzania. Dar es Salaam, Tanzania.Munkner, H. 1996 Land rights in Africa: Collective use rights in private property. Agriculture
and Rural Development 3: 10–14.National Conservation Strategy for Sustainable Development (NCSSD) 1995 Tanzania
National Conservation Strategy for Sustainable Development. Revised proposal bythe National Environmental Management Council. Dar es Salaam, Tanzania.
Nhantumbo, I. 1997 Multiobjective rural land use planning: Potential for social forestryin Maputo, Mozambique. PhD thesis, University of Edinburgh.
Nhantumbo, I. 2000a Posse da terra e maneio comunitario dos recursos naturais: estudocomparativo da politica, legislação e metodologias no Botswana, Moçambique,Namíbia, Zimbabwe. Doumento de Trabalho, DNFFB/FAO/Holand.
Nhantumbo, I. 2000b National Land Policy. Natural resource policy framework inMozambique. Draft Report. Maputo.
Nhantumbo, I. 2000c The new resource tenure framework in Mozambique: Does it reallygive tenancy to the rural communities? Paper presented at the 8th Biennialconference of the International Association for the Study of Common Property.Indiana, USA, 31 May–3 June 2000.
Nhantumbo, I. and Soto, S. 1999 Review of land, forestry and wildlife policies. DraftReport. Eduardo Mondlane University, Maputo, Mozambique.
Okoth-Ogendo, H. W. 1996 Land tenure and resource management: a comment.Agriculture and Rural Development 3: 15-17.
Ostrom, E. 1998 Institutional analysis design principles and threats to sustainablecommunity governance and management of the commons. In: Law and governanceof renewable resources: Studies from Northern Europe and Africa. ICS Press, Oakland.
Republica Popular de Mocambique (RPM) 1987 Legislção do uso e aproveitamento daterra. INM, Maputo.
Republica Popular de Mocambique (RPM) 1979 Legislação sobre aproveitamento e usoda terra 6/79. INM, Maputo.
Rwebangira, M.K. 1999 Gender and land legislation in Tanzania: With particular referenceto the land bills of 1998. Paper presented at the Workshop organised by FTPP atSokoine University of Agriculture. Morogoro, Tanzania,(19–20 February 1999.

137 I. Nhantumbo, G. Monela and G. Kowero
Rihoy, E. 1998 Natural resources tenure in Southern Africa: Exploring the options andopportunities. Proceedings of the Workshop on land Resources Tenure andDecentralization. SADC NRMP, Johannesburg.
Rihoy, E., Jones, B., Anstey, S. and ‘Tsas, M. 1999 Tenure in transformation: A stakeholder’sguide in Southern Africa community based natural resources management. SADCNRMP. ART.
Saket, M. 1994 Report on the updating of the exploratory national forest inventory. FAO,Maputo.
UNDP 1996 Development co-operation: Mozambique 1994–1995 Report. UNDP, Maputo.Wiley, E. 1988 The political economy of African land tenure. PhD thesis No. 2. University
of East Anglia, Norwich.World Bank 1992 Empowering villages to manage their natural resources: Rural land
policy in Tanzania. A World Bank White Cover Paper. Southern Africa Department,Agriculture Operations Division.
ANNEX 1 LIST OF ABBREVIATIONSAR : Assembleia da República (Parliament)CAMPFIRE : Communal Areas Management Programme for Indigenous ResourcesCBNRM : Community Based Natural Resources ManagementCBFM : Community Based Forest ManagementCM : Conselho de Ministros (Ministers’ Council)FRELIMO : Frente de Libertação de MoçambiqueMAP : Ministério da Agricultura e PescasPROAGRI : Agricultural Sector Investment ProgrammeRPM : Republica Popular de Mocambique now Republica de MoçambiqueSADC : Southern African Development Community

10.Agricultural policies and forestrydevelopment in Malawi, Mozambique,Tanzania and Zimbabwe:Complementarities and conflicts
G. Mlay , F. Turuka, G. Kowero and R. Kachule
ABSTRACTThis paper presents a review of agricultural policies deemed relevant to the managementof natural forest resources in Malawi, Mozambique, Tanzania and Zimbabwe. Thecompetition between agriculture and forests for land and the role of man in influencingthe balance between the two requires an articulation of sectoral, extra sectoral andmacroeconomic policies in order to minimise undesirable policy effects.
The paper presents a brief review of evidence from studies carried out in differentparts of the world on the influence of agricultural policies on deforestation. This isfollowed by a review of agricultural development in the pre-independence and post-independence periods in Malawi, Mozambique, Tanzania and Zimbabwe, payingparticular attention to agricultural policies that shaped and continue to influence thesector and their consequent effects on forest development.
Key words: Deforestation, shifting cultivation, land tenure, commercial/estateagriculture, economic reforms, smallholder farmer.
1. INTRODUCTIONWhile forest conditions affect opportunities for national development, the developmentprocess shapes what these forest conditions are, and what they will become. The use,development, and conditions of forests are fundamental consequences of the widerconfiguration of national policy and economic development. National development isconstantly creating incentives and capacities to exploit and enhance forest resources.Economic growth and social conditions tend to shift the location and composition offorest resources. Understanding how national policies affect forests provides the basis

139G. Mlay , F. Turuka, G. Kowero and R. Kachule
for achieving desired types of forest conditions, including the aggregate contributionsthey provide, and the required trade-off with other national objectives.
Arguably, policy failure outside the forest sector may be even more important(World Bank 1996). Government policies relating to trade, land, relative prices, taxation,expenditure and subsidies provide incentives (positive or negative) in other sectorsthat often have detrimental consequences for forest resource use and conservation.This is particularly true to agriculture, the principal source of forest depletion anddegradation, and the mainstay of future economic growth and poverty alleviation,especially in Sub-Sahara Africa.
The adoption of an inter-sectoral approach to address forest management issueshas been partly due to the inability of traditional forestry strategies to containdeforestation and forest degradation, and the fact that the root causes of forestdegradation and depletion are often found outside the forestry sector (de Montalembert1992).
Agriculture is critically dependent on environmental resources such as land, water,forest, and air. However, the use of these resources can affect directly or indirectly,other natural resources, through dynamic and complex interrelationships existing in thenatural systems. This implies that wrong use of land, water, and forest in the productionof crops and livestock can have far-reaching effects on environmental integrity. Toavoid any adverse consequences, agricultural sector policies must fit in the overallenvironmental policy. This is critical in guiding proper and balanced use of natural resourcesand in defining sectoral responsibilities for environmental management. Agriculturalpolicies, besides being internally consistent, must provide for a mechanism to link thesector with other sectors in protecting and enhancing environment.
This paper examines the evolution of agricultural policies and their influence onforestry development in Malawi, Mozambique, Tanzania and Zimbabwe. This shallprovide a cross country comparison of influences of these policies and identify trendsthat are of regional nature from those specific to individual countries. The paper doesnot always develop quantitatively the causal linkages between the policies and forestcondition but combines a qualitative assessment of the situation prevailing in thesecountries with results from quantitative studies on such phenomenon from othercountries. This is due to the scarcity of quantitative studies in these countries on thissubject.
As a proportion of total land area, forest cover in these countries is estimated at43%, 71%, 47% and 51% respectively (Nyasulu 1997). In all these countries forests are themain land users followed by agriculture. These two sectors compete for land and otherresources and at times with disastrous effects on the environment. Further agricultureand agricultural processing form the backbone of the economies of these countries.The hypothesis is that deforestation and environmental degradation is partly a result ofprevious agricultural sector policies, which had no built-in incentives to safeguard landand natural forest resources. These disincentives are related to land size, ownershipand use.
The paper is organized as follows: The second section gives a brief overview onhow policies directed at the agricultural sector have influenced forestry development.The third section examines the evolution of agricultural policies in the pre independenceperiod in these four countries. The fourth section extends the analysis to the postindependence period. The final section summarises the main implications on forestrydevelopment in these countries.

140 AGRICULTURAL POLICIES AND FORESTRY DEVELOPMENT
2. AGRICULTURAL POLICIES AND FORESTRY: AN OVERVIEWAlthough the potential for agricultural production is far greater now than in Malthus’stime, the environmental impacts of farming systems raise concerns on long-termsustainability. The challenges vary greatly from one system to another. The agriculturalsector, which is composed of both the livestock and crop components, hinges on theexploitation of land resource (soil and vegetation). In this context, it has direct andindirect influences on the indigenous forest resources in terms of their exploitation andconservation. The direct effects result from the competition for land between forestsand agriculture while the indirect effects result from the exploitation of the forestresources either for subsistence purposes (food, energy, building material) and/or forincome. Wanton deforestation and land degradation are a reflection of unsustainableland use emanating from poor agricultural and poverty related policies in most Sub-Saharan African countries. Many studies have demonstrated the potential effects ofagricultural policies on the forest condition. Unfortunately, there are only few suchstudies in the four countries that explicitly show the link between agriculture andforest condition when compared to similar literature for other parts of the world.Thus, it is important for these southern African countries to glean at experiences fromother countries in order to understand the potential implications of some of theagricultural policies they adopt. However, caution should be exercised because in somecases the magnitude and direction of some agricultural policy variables still remaininconclusive as shall be demonstrated in the evaluation of individual policy effectsbelow. This section provides a very condensed account of this. Kaimowitz and Angelsen(1998) provide a good account of tropical deforestation while Angelsen and Kaimowitz(2001) provide a detailed account on influence of agricultural technology on the forestcondition. However, only a few policy impacts are highlighted because of their relevancein these four countries, and especially at present when these countries are implementingeconomic and institutional reforms, referred to as Structural Adjustment Programmes(SAPs). The SAPs employ most of these policies.
(i) Prices of agricultural products and inputsThe effects of input prices on forest degradation are mixed. Fertilizer price increaseswere reported to have had practically no short-term effect on land use (Ruben et al.1994; Monela 1995). However, Monela (1995) suggests that they increase deforestationin the long run. Holden (1993, 1997) and Nghiep (1986) found that higher fertilizerprices lead farmers to change from sedentary farming to shifting cultivation and toclearing more forest land. Increases in prices of pesticides, seeds and hand tools,together with high interest rates were found to reduce forest clearing (Ruben et al.1994; Monela 1995; Ozorio de Almeida and Campairi 1995).
Reduction of subsidies on inputs has shown mixed results on expansion of croplandarea. Removal of fertilizer subsidies had little effect on cropped areas in Tanzania, inareas where fertilizer use was low (Aune et al. 1996). On the other hand, Mwanawimaand Sankhayan (1996) report that eliminating fertilizer subsides contributed todeforestation in Zambia. In Mexico, Barbier and Burgess (1996) argue that reducedfertilizer subsides and elimination of price support for maize has direct negativeeffect on maize profitability, leading to area reduction. On the other hand, the shiftingof labour from maize to competing crops leads to area expansion. The net effect ofsuch policy measures on deforestation is therefore indeterminate.
Agricultural product prices have been found to lead to expansion of cropped areas

141G. Mlay , F. Turuka, G. Kowero and R. Kachule
(Angelsen et al. 1999; Barbier and Burgess, 1996; Deininger and Minten, 1996). Agriculturalprices behave more like exogenous variables when export products are involved and thecountrys’ total exports of those products are too small to affect world prices. Whenagricultural prices are exogenous, policies taxing agriculture will reduce deforestationwhile subsidized agriculture will increase deforestation. High agricultural produce pricesreduce the period of time that farmers leave their land fallow, thus reducing the areas ofsecondary forests (Jones and O’Neill 1992, 1993). The effect will be stronger whenagricultural supply is price elastic.
Subsiding public rural road construction, protectionism, high guaranteed prices andeliminating trade and marketing policies that act against agricultural production will increasedeforestation. Reduction of agricultural crop export taxes generates similar effects ascurrency devaluation (Thiele and Wiebelt 1994). Fiscal subsidies have also been found tostimulate deforestation (Andersen 1996; Barber and Burgess 1966; Pfaff 1997).
Taxes (Ad Valorem and export taxes) and tariff on agricultural activities causingdeforestation protect forest cover. This is due to their negative effects on profitabilityemanating from low prices (after tax), biding up of rural wages, or raising the costs ofagricultural inputs (Jones, O’Neill 1993d, 1994).
Credit availability promotes deforestation by allowing farmers to expand croppedareas or pastures (Monela 1995 in Tanzania; Ozorio de Almeida, Campari 1995 in Brazil;Deininger, Minten 1997 in Mexico). On the other hand, indigenous households in Boliviaand Honduras have been found to clear less forest after they had received credit (Godoyet al. 1996, 1997). This reduction is attributed to reduced dependence on forest-basedactivities to smooth consumption and income or to increased involvement in off-farmemployment to repay loans, leaving less time to work on farms.
Devaluation promotes deforestation through its incentive effects on the expansionof tradable agricultural products (von Amsberg 1994). Aune et al. (1996) found that realdevaluation prompted agricultural land expansion in Tanzania, both through increasingoutput prices and by having land substituting agricultural inputs in response to inputprice increase. Similar results have been reported in Zambia (Mwanawima and Sankhayan1996). Trade liberalization generally tends to increase deforestation (Lopez 1993; Malerand Munasinghe 1996).
(ii) Agricultural technologyTechnologies that increase farm yields have also been shown to have mixed effects onforest resources. If a technology increases marginal productivity of land, it can stimulatedeforestation (Katila 1995). On the other hand, it may lead to land being substituted bylabour or capital, which in effect reduces deforestation. Angelsen et al. (1999) claimthat when technical assistance was provided, cropped area expanded rapidly in regionswith high fertilizer use in Tanzania. However, Deininger and Minten (1996) indicatethat the reverse was the case in Mexico. Increased farm productivity has beenassociated with less total forest clearing in Brazilian Amazon (Jones et al. 1995). Thiscould partly be due to the fact that farmers who successfully avoided soil degradationhad more productive land and thus had no need to compensate for lost productivity ondegraded lands by clearing forests. Godoy et al. (1997) report that indigenous farmerswith higher rice yields in Honduras clear less forest each year. This contrasts with theobservation by Foster et al. (1997) that agricultural productivity growth at the villagelevel had a high positive correlation with deforestation. According to Southgate (1994),deforestation is higher in places with technologically stagnant agricultural sector.

142 AGRICULTURAL POLICIES AND FORESTRY DEVELOPMENT
(iii) Roads and market accessIt is argued that landholders are most likely to convert forest to agricultural use in areaswith good access to markets and favourable conditions for farming. Forest conversionfor smallholder agriculture requires different levels of market access and types of soiland climatic conditions in comparison to large-scale mechanised farming (Chomnitz andGray 1996). Roads induce greater forest clearing in areas with good soils and favorableclimatic conditions. Chomnitz and Gray (1996) show that the probability of an areabeing used for agriculture (rather than natural vegetation) on high quality land next tothe road was 50%. Godoy et al. (1997) found that households in villages far from urbanmarkets clear less primary forest, but they hypothesize that such villages have moresecondary forest available for clearing. Liu et al. (1993) and Mamingi et al. (1996) haveshown that forest clearing declines rapidly beyond distances of two or three kilometresfrom a road, although in some case forest clearing is associated with longer distances.According to Mertens and Lambin (1997), deforestation drops off dramatically beyond10 km from the nearest town. Locations closer to urban markets (in travelling time) aremore likely to have less remaining forests (Chomnitz and Gray 1996).
(iv) Stability of political and social institutionsThere is no consensus on the effect of political stability or political system ondeforestation. Deacon (1994) claims that in politically stable countries deforestationis less compared to politically unstable countries. Didia (1997) argues that democraticcounties suffer less from deforestation while Shafik (1994) notes that the same istrue for authoritarian regimes. Deforestation is also said to be higher in places withmore unequal land tenure regimes (Rock 1996).
3. PRE-INDEPENDENCE DEVELOPMENTSThe present structure of agriculture in the four countries is closely linked to past events,stretching from pre-colonial time. The transformation of a hitherto purely subsistenceagriculture to semi-commercial and commercial agriculture continues to change theform of the relationship between peasants and their natural resources. This sectiontraces such events and lessons from the pre-colonial and colonial periods.
3.1 Pre-colonial periodThe period considered in this section is that very close to the colonial period in the1800s due to scanty information on deforestation in the distant past. Historically,removal of forest cover has been closely linked to population growth, until when it waspossible to establish the population-agricultural land connection. This formed the basisof forest transition, occurring in Europe in the early 19th century. Thus, there is a long-term trend of deforestation and forest degradation determined primarily by populationgrowth, but also (and increasingly) shaped by other factors such as economic growth,trade, technologies, ecological factors, and policies. The risk is that if these underlyingfactors and long-term trends are not acknowledged, one might blame only the morerecent policies for deforestation while it is known that there are underlying causes ofdeforestation linked to the pre-colonial period. For example, historical records (e.g.,pollen analysis, archaeological studies) have shown that deforestation and landdegradation did occur in pre-colonial time (Siiriäinen 2000). Environmental manipulation

143G. Mlay , F. Turuka, G. Kowero and R. Kachule
started with the Neolithic modes of production (agriculture), a revolution completedmore or less 1500 years ago in Sub-Sahara Africa. Regional deforestation occurred longago in various parts of Africa. The earliest large scale forest retreat started about 2000years ago, when Bantu speaking farmers occupied large parts of Eastern and SouthernAfrica. A second wave took place about one thousand years later, coinciding with highcharcoal demand for iron production. Production became intensive in many denselypopulated areas, with large clusters of settlements taking hold during the 13th and 14th
centuries. Exhaustion of soils in these areas, combined with high population growth,resulted in less productive land being cleared and put into use, something which resultedin practices such as the chitemene in Zambia. Misana et al. (1996) report that changesin the miombo woodlands have taken place in phases starting with the pre-colonial longdistance caravan trade characteristic of the 1700s and 1800s followed by some pre-colonial era tribal migrations such as that of the Ngoni, the rinderpest epidemic, theintroduction of the plough and the market economy.
In the pre-colonial period agricultural production was based on traditional technologywith shifting cultivation or fallow systems as the means to maintain labour productivityand to regenerate soil fertility (Abrahamsson and Nilsson 1994). Low population density inmost areas permitted long periods of fallow, which contributed not only to soil fertilityregeneration but also allowed forest regeneration. Although shifting cultivation was oneof the major agricultural production practices, this was not carried out indiscriminately.Some areas were reserved for other functions such as water catchment protection,livestock grazing as well as religious rituals and ceremonies (Kjekshus 1977).
Traditions and/or customs prevailing at that time in the clan or tribe governedthe ownership of the means of production and assets, i.e. land, labour, livestock andthe little farm implements. Thus, the problems related to or arising from the “havesand have-nots” never arose in most societies. It is also true that feudal societiesdeveloped in certain groups, such as the Nyarubanja systems in Bukoba, Tanganyika(Mbilinyi et al. 1974). However, no part of the family or clan was left to suffer becauseof scarcity of land, labour, lack of tools or implements.1
Production and distribution systems were organized such that whatever was beingproduced or gathered was geared first to family needs, second to the clan, third to thetribe and only finally to the inter- and intra-tribe trade. Thus, local resources weremobilized and utilized to produce commodities or products that were needed locally bythe community, contrary to the so- called modern agricultural sector which was insome cases geared almost wholly to the export sector (Mbilinyi et al. 1974; Negrão1995). There is no evidence however, to suggest that land use for agriculture and theassociated production technologies led to unsustainable exploitation of forest resources.Kjekshus (1977) concluded that…. “The pre-colonial economies developed within anecological control situation – a relationship between man and his environment whichhad grown out of centuries of civilised work of clearing the ground, introducing managedvegetation, and controlling the fauna”.
With increasing population pressure and shortening fallow periods, people evolvedagricultural practices that addressed the land degradation processes through, forexample, crop-rotation, inter-cropping as well as multiple-cropping (Kjekshus 1996). InTanzania, it is now known that by 1500 AD there were stable and permanent societies inKilimanjaro, West Lake (Kagera) and the Southern Highland areas (Omari 1976, Illife1971). The same is true in the case of Zambezi delta in Mozambique where localcommunities were planting perennial crops such as coconuts and bananas (Negrão 1995).

144 AGRICULTURAL POLICIES AND FORESTRY DEVELOPMENT
Indigenous knowledge was used to maintain soil fertility and conserve water foragriculture as well as livestock. People managed to establish agricultural land suitabilityusing simple indicators (plants as well as soil colour) (Trapnell 1937). For example, soilswere given names on the basis of their property and, more important, their suitabilityfor crop production. An example is Mbuga (vertisols) soils in Sukumaland farming systemsof Tanzania that indicate dark heavy soils found in the valley bottoms (Budelman et al.1995). In some cases indicator plants were used to assess the suitability of land for cropproduction, which also aided the decision on whether to clear the land or not. Cultivationtechniques also evolved to address soil erosion problems and water management. The“matengo pits”2 in Southern Highlands of Tanzania and majaluba3 (in Sukumaland) areexamples of the strategies that were evolved to maximize the utilisation of water foragricultural production.
Food crops dominated agricultural production during the pre-colonial period. Thesewere meant to cater for household food requirements, social obligations, and for localtrading.
The geographical location of Mozambique and Tanzania on the coast brought thecoastal local communities in contact with the external world as early as the fifteenthcentury. These contacts were in the form of trade in ivory, wax and later slaves (Newitt1997) The slave trade disrupted the settlement patterns as communities were forcedto abandon their settlements to seek refuge in areas of poor access and low agriculturalpotential (Negrao 1995). In the case of Tanganyika (Tanzania mainland), it has beenreported that slave trade flourished because slave labor was important for cloveplantations in Zanzibar. There were constant caravans either of slaves or labourersfrom mainland to Zanzibar. Illife (1971) and Baumann (1891) claim that the Zanzibarslave plantation economy could not have survived if people from the mainland did notproduce enough food for the Zanzibar market. This introduced cash economy to themainland people and the practice continued up to the time of German’s rule.4 Withthe abolition of slave trade, oilseeds and copra became important products traded bylocal communities in exchange for cloth, beads and alcohol (Negrão 1995; Newitt 1997).These trade contacts provided a new dimension to the relationship between the peasantsand the natural resources, as it involved the exploitation of natural resources forcommercial purposes. However, lack of or inadequate infrastructure to the hinterlandmight have restricted such trade to only few accessible areas.
There is little evidence to show that during the era most close to the colonialperiod crop production strained land/forest resources in most areas. The exceptionwould be areas with high population densities and easy access by international traders.However, there is evidence to show that growing land scarcity in highland areas ofKilimanjaro, Meru and Pare Mountains of Tanzania necessitated movement of peopleto other parts to open land for agriculture. Omari (1976) notes that the people inthese areas began to cultivate and settle on the slopes of mountains.
To sum up, low population densities in most areas, existence of customary rulesgoverning the use of natural resources and local knowledge about the environmentexplain the limited degradation of land and forest resources during this period. Inthose cases where trade contacts existed with the external world, lack of infrastructurelimited the extent of exploitation of forest resources for commercial purposes.

145G. Mlay , F. Turuka, G. Kowero and R. Kachule
3.2 Colonial periodThe partitioning of Africa during the Berlin Conference of 1885 legalized the colonialcontrol of African natural resources. This saw the ‘nationalization’ of land and othernatural resources like forests and wildlife belonging to various communities into stateland, forest and game reserves. This disrupted the way local communities lived andrelated to their natural resources. Further, the colonial administration created a dualagricultural-led economy characterised by peasant/smallholder and commercial sectors.The commercial sector, referred to as estate sector in some countries like Malawi,had access to the most productive land while the smallholder sector was mainly relegatedto marginal lands. There was massive forest clearing in both sectors for crop productionand supporting infrastructure.
3.2.1 Confinement of peasant farmers and build up of environmental pressureThere were various developments in the peasant and commercial sectors, whichcontributed to forest conservation and degradation. In the peasant sector there weremoves that reduced and restricted peasant farmers to fixed land areas, irrespectiveof their increasing human and animal populations. Further, there was deliberatesegregation in the provision of agricultural services, with the commercial sector andexport crops receiving more attention. There is also evidence of restricting certaincrops to estate/commercial agriculture, to the disadvantage of smallholders. Theseand other events are evaluated in this section as well as their bearing on forest sectordevelopment.
In Zimbabwe peasant farmers were confined into communal and resettlementareas. The Land Apportionment Act of 1930 facilitated the alienation of land amongthe races. Increasing population pressure in the communal areas resulted intolandlessness, and by 1978 half of the African population was landless, up from 30% inthe late 1950s (Moyo et al. 1995). These African farmers occupied less than 50% of thearable land in the country at independence in 1980. The reserves constituted about 90%of the communal areas (in which 2/3 of the population lived), and are located in poorecological zones for agricultural production (Chenje et al. 1998). In the communal areasthe farms averaged 5 hectares per household, which was the minimum size for subsistencefarming. According to Chipika (1998), in the peasant sector (communal farm sector)land increased by about 21% between 1961/62 and 1981/82 (and has not increasedappreciably since then), while the number of households and cultivated area increasedby 144% and 204% respectively. Further, grazing area remained relatively unchanged,while the population of cattle and goats increased by 78% and 67% respectively, duringthe same period (ibid.).
In Mozambique, the initial colonial administration was effected through settlerswho were given large land concessions (prazos5 ) for which Portugal retained the mineralrights. From the second half of the seventeenth century to late eighteenth century,these concessions were not used for agricultural production but acted as a source oflabour for ivory and slave trade. The families occupying land in the concession areaswere required to pay tax (in kind -produce and labour) and sell their surplus produce tothe prazo owners (Newitt 1997). Although customary land tenure system at the villagelevel within the prazos was not affected, the peasants had effectively lost the right overthe land through the requirement to pay tax for its use (Negrão 1995). In 1891, a distinctionwas made between land already conceded and lands under the jurisdiction of the state.Within the land under the jurisdiction of the state, the natives had a right to a title of

146 AGRICULTURAL POLICIES AND FORESTRY DEVELOPMENT
holding for the land they occupied, and the title could only be exchanged among thenatives on the basis of customary laws. Commercial agriculture was only initiated inearly 1870 when the Mozambique opium cultivation and trading company was established(ibid.). Coconuts and sugar cane were the first crops produced on large scale. In 1901,legislation was passed allowing the natives to have access to 1 hectare of land per hutwithin the area conceded to the settlers. In 1909 the land title of holding by natives wasrepealed and a category of land reserves for natives was created. Within the reserves,land occupation was flexible, but without a right for a title of holding.
The coming to power of Salazaar in 1928 marked the end of the prazo system andPortugal assumed direct political control of the entire territory of Mozambique. Onlycompanies or settlers who were productive and undertook genuine investment wereretained (Newitt 1997). The economic policy of Portugal required its colonies to beproducers of raw materials for its industry, and Mozambique assumed a central role insupplying raw cotton to Portuguese textile industry. Cotton became a compulsory cropand villages were assigned quotas that they had to meet (Newitt 1997).
Although the introduction of commercial agriculture did not per se create landlessfamilies, the rural communities were forced to occupy marginal lands with limitedirrigation possibilities and with poor market access (Negrao 1995; Newitt 1997).
Further, the success of the labour intensive commercial agriculture required aguaranteed supply of cheap labour. Forced labour (chibalo) for agriculture was mainlyin the central and northern provinces. The southern provinces became labour reservesfor South African mines (Abrahamsson and Nilsson 1994). Forced labour for agriculturewas one form of tax payment introduced by the colonial government (Negrao 1995).This meant that families had less labour time to allocate for subsistence production.Although the forced labour laws and forced cultivation of cotton and rice were abolishedin 1961, their effects are even felt today. Cotton crop for example is still consideredas a slave crop.
The Portuguese policy meant that in the peasant sector cultivation could no longerbe carried out with the same flexibility since land access was restricted. At the same,time male labour for land clearing was less available and the absence of completeproperty rights reduced the range of incentives for land improvement. In addition,use of land, as security to access credit was not possible. The actual effects of thesechanges on the forest resources have not been documented.
In Malawi a similar pattern emerged, with the colonial policy promoting landalienation to European settlers. Many people subsequently moved on to European estatesthereby losing all their original rights. African land rights were left in great ambiguity,which made their position insecure and created difficulties for the future (Phiri 1991).Estate owners were allowed to charge rent to all Africans on the estate. The estateowners preferred tenants who worked in lieu of cash rent. Paying “rent” for land thatAfricans believed was theirs but “bought” for so little by Europeans led to conflictsbetween tenants and settlers (Minde et al. 1997).
Effectively development of agriculture was at two levels, viz. estate andsmallholder. This then put in place an asymmetry in agriculture development whichremained up to the present time, and which formed the basis for allocating governmentattention and resources for developing the sector. The government decreed by lawthat certain cash crops be exclusively for estate or smallholder farmers. Further, thecustomary land tenure system discouraged the development of the rural credit marketfor individual smallholder farmers because the land could not be held as collateral for

147G. Mlay , F. Turuka, G. Kowero and R. Kachule
loans. This was because customary land was communally owned and the chief, inconsultation with community elders, allocated it to individuals.
As the number of settlers increased, the pressure on land became greater, becausesettlers acquired land mainly from fairly high densely populated areas. The displacedAfricans were confined to small and marginal lands and on the settler estates astenants. Due to land conflicts, the land given to settlers was gradually returned toAfricans, and by independence in 1964, most of the land had been returned to traditionalcustomary control. In 1948 the land under European freehold amounted to 490,000hectares, about 4.1 % of the total land area of Malawi. This percentage was reduced to3.7 by 1954 and less than 2% by 1964. Therefore, at independence in 1964 about 87%of the land in Malawi was under customary ownership (Kachule et al. 1999). The 1962“African Private Estates Bill” and the 1964 “Malawi Land Bill” suggested that futureland policies would centre on customary law (Minde et al. 1997). However, considerabledamage had already been done on the environment and especially on estates orplantation agriculture, which necessitated clearing of large forest areas, as well as onmarginal lands, which supported high African populations.
Tanzania faced settler (albeit to a smaller extent as compared to the othercountries) and plantation agriculture on one hand, and a cash crop oriented peasantagriculture on the other. Prime agricultural land was allocated freehold, mostly toGerman settlers on the slopes of Mount Kilimanjaro, Mount Meru and UsambaraMountains with the assistance of collaborative chiefs (MLHUD 1995; Hyden 1980).Sisal and cotton plantations were established in coastal areas. Although land clearingwas part and parcel of plantation agriculture for crops like sisal, coffee, and sugarcane,the establishment of flue-cured tobacco and tea had significant implications for forestresources as these crops required wood for crop curing in addition to land for theircultivation. In order to ensure that agricultural production was in line with colonialobjectives, long-term land leases were given to estate producers. Most land in Tanzaniais covered by miombo woodlands, which are potential areas for livestock keeping.However, due to presence of tsetse flies, the strategy to eradicate tsetse flies led tomassive clearing of trees to pave the way for livestock husbandry (Kjekshus 1977).
Hyden (1980) argues that the German colonization of Tanganyika not only put anend to the prosperity of the indigenous pre-colonial economies but also gave rise to anumber of diseases and natural catastrophes. Further, the German colonial policieswrecked the fragile balance between man and nature on which the pre-colonialeconomies rested. Colonization disrupted the man controlled ecological systems thatsupported pre-colonial economies. For example, evidence suggests that the GermanGovernment by then could not generate enough revenue outside the peasant sectorgiven the growing revenue demands by the state (Hyden 1980). The Governor of thethen German East Africa (Tanganyika) forced Africans in 1901 to grow cotton as arevenue generating measure despite the fact that the crop had shown dismalperformance in northern parts of Mwanza and Musoma (Magoti 1984). Thus, taxationof the African population in Tanganyika (introduced in 1897 as a hut tax) was furtherreinforced to ensure compliance. People became employees on plantations or directlyinvolved with growing cash crops to ensure that tax was paid. Efforts to promoteagricultural production were accompanied by extensive opening up of forested landfor plantation agriculture and supporting infrastructure. The Germans were not verysuccessful in agricultural production and by the time World War I began only sisalshowed uninterrupted growth.

148 AGRICULTURAL POLICIES AND FORESTRY DEVELOPMENT
The British Government showed little interest in expanding large-scale agriculturepartly due to failure of settler agriculture in Uganda in 1920s (Mamdani 1976). Land alienationcontinued but remained small in terms of the area. By 1958 the estate or plantation sectorcovered approximately 1.0 million hectares with only one-third of this area actually usedunder plantation or other farming (Ruthenberg 1964). Most of the estate or plantationowners were British or Greek although there were also some Indians and Pakistanis. Theplantation sector again depended on hired labour, often recruited far away to ensure thatfamily demands would not interfere with their work. Labour recruitment was done bycompulsion, as there was no shortage of land that would have forced peasants to seekemployment in plantations.
British policy of indirect rule tried to expand peasant agriculture. Ordinances werethe major instruments used to achieve agricultural development under peasant agriculture.The coercive approach was passively resisted by peasants6 leading to low agriculturalproductivity (Ruthenberg 1964).7 By mid-1950s the British shifted to persistent persuasionapproach towards peasant agricultural development. By that time, however, the effectsof the earlier policies to improve peasant agriculture had already changed the politicalsituation in favour of the nationalist movement for independence.
In all these four countries emphasis on agricultural production by settler/estatefarmers was the motive for withdrawing good land from natives and confining theminto marginal lands and/or smaller productive land units. The spatial arrangement ofsmallholder and commercial farmers was legally put into place. The scene was then setfor the smallholder African farmers to eke a living from ‘confined’, small, and mostlylow productivity land units, given their fast increasing human and animal populations,and many other demands. A tremendous pressure on land and other natural resourceswas created leading to environmental problems that the colonial governmentsunsuccessfully tried to contain. A few examples highlight this.
In Malawi, the importance of agriculture to the economy of the country as well asto the livelihoods of the people was recognized and an attempt was made to developthe sector (Minde et al. 1997). Lack of resources hampered development of the sectorat a time when 95% of agricultural land was under Africans whose population wasdoubling every twenty-five years. This created problems in that shifting cultivationwas increasingly becoming limited due to scarcity of land. This gradually led to soilexhaustion with declining productivity accompanied with increasing maize monocropping. Crop rotation scarcely existed for maize with only a few inter-planted legumes.
By the end of the World War II, Tanganyika (now mainland Tanzania) already haddeveloped and underdeveloped areas. During this time the so-called developed areaswere already facing land problems due to erosion and low productivity on one hand andpopulation pressure on the other. To address these problems, the British colonialgovernment introduced cultivation measures that would improve land husbandry andproductivity8 (Omari 1976). Although different schemes were initiated not only didthey end in disastrous failure but also resulted in opening up of forest resources.
In Zimbabwe, overstocking and overgrazing is attributed mainly to little marginalland reserved for natives in 1920s and further concentration of natives in those areasthrough legislation in the 1950s and 1960s. However, by the end of the 1920s therewas evidence of degradation in the native areas as the farmers increased land undercultivation in order to cope with taxes and falling grain prices. Livestock numberswere also increasing compounding the degradation problem. During the same periodland held by settlers increased from 20% to 50% of the total land area. Livestock

149G. Mlay , F. Turuka, G. Kowero and R. Kachule
management and conservation attempts under a 1951 Native Land Husbandry Act,including de-stocking attempts met with stiff native resistance (Chipika 1998). Further,the concentration of people in reserves shortened the fallow periods, moving fromwoodland fallow to bush land and finally to grassland fallow. This led to not only decreasedsoil productivity but also to increased labour demands (ibid.). Ironically whilst theZimbabwean African reserves were getting overcrowded and severely deforested anddegraded, by 1973 only 4% of the land allocated to the settlers was under cultivationwith most of the land reverting to woodland (Riddell 1979).
3.2.2 Strategies in agricultural production and their effects on forest conditionHaving secured land for settler farmers the colonial authorities organized other inputsand services for agricultural production in favour of settler farmers. The inputsmanipulated were labour and other production incentives like crop prices, extensionand marketing services.
(i) Marketing and pricingIn Mozambique, the peasant farmers were deliberately discriminated in two ways,viz., through controlled prices for which the Portuguese settlers were paid higherprices than the peasant farmers, and through controlled low wages to guarantee cheaplabour supply to the plantation agriculture (Branco 1994). In Zimbabwe, Nhira et al.(1998) report that for the same crops, prices were deliberately made low for peasantsand higher for commercial farmers. Such a system indirectly encouraged peasants tosell their labour to commercial farms, mines, and urban centres and to other sectors.
Different policies in marketing of agricultural produce from the estate andsmallholder sector influenced Malawi’s agricultural production in diverse ways. Cropsgrown by the estate sector were sold on the export market. These were marketed byprivate agents or in private auctions to foreign buyers. On the other hand, smallholderfarmers had access to two types of markets. The first were local markets whereproduce was sold on small scale at whatever price the buyer could offer; and thesecond were markets administered by the colonial government such as the TobaccoNative Board and the Maize Control Board. The asymmetric marketing arrangementsarose in the early 1920s under the influence of the estate owners. The estate farmersproduced for the better-priced export markets.
(ii) LabourIn Mozambique forced labour (chibalo) for agriculture was mainly in the central andnorthern provinces. Forced labour for agriculture was one form of tax paymentintroduced by the colonial government (Negrao 1995). This meant that families hadless labour time to allocate for subsistence production. Further, in order to guaranteean adequate supply of raw cotton to the Portuguese textile industry, cotton was madea compulsory crop in 1921. Rice cultivation was made compulsory in 1941 to feed theurban population. In Malawi, Africans on estate farms paid rent in form of their labourto the estate-owners. This in essence was one form of exploiting the Africans.Furthermore, the Africans, who at that time were commonly known as the “Natives”were disgustingly employed under a wage agreement only to be paid in kind, thus insome case the natives would simply be given cigarettes or tobacco as their payment.This was known as the “Thangata system”. The involvement of the local communitiesin this manner reduced labour available for smallholder production.

150 AGRICULTURAL POLICIES AND FORESTRY DEVELOPMENT
In Tanganyika, any portion of the territory, which was not the locus of large-scalecapitalist investment or whose people did not generate local products for cash saleautomatically, became a labour reserve (manamba). By 1903 the German colonialGovernment required local leaders (akidas and jumbes) in the southern coastal districtsto establish cotton plots worked by communal labour.
(iii) Credit and extension servicesThe availability of credit, extension and marketing services was almost non-existent tosmallhoders. For example Chipika (1998) report that only 2% of smallholder farmers hadaccess to these facilities when Zimbabwe became independent in 1980. The implicationsincluded perpetuations of old farming practices and low crop productivity in the peasantsector. In Zimbabwe, commercial farmers who had access to these facilities evolvedmodern farming methods and saw farm yields rising to about four times those obtainedfrom similar crops and on similar acreage in communal farms (ibid.).
Peasants in Tanzania had no access to credit partly due to lack of meaningfulcollateral and they could not borrow from private traders since under the Credit toNatives (Restriction) Ordinance of 1923 no debt was legally enforceable against anAfrican other than one holding a license (Msambichaka, Mabele 1977). However, non-Africans could borrow from commercial banks existing at that time. Land Bank wasestablished in 1947 to provide credit to non-Africans. In 1957 the minimum bank loanwas raised from £10,000 to £15,000 (IBRD 1961), which was very much out of reach ofindigenous smallholder farmers. Thus, along with coercing people to work on foreignowned export oriented plantations, the colonial government ensured that settlersreceived credit to expand agricultural production. Given the limited resources topeasants, their response to this economic opportunity was phenomenal (Msambichaka,Mabele 1977).9 Credit programmes for peasants were initiated later but geared towardsproducing export crops. Thus, if availability of credit was associated with expansionof export crop production then the impact on forested lands was much more severe inareas where export crop production potential was high. Overall, credit programmesduring the colonial period were pre-occupied with export crops.
In Mozambique, an attempt to create agricultural credit facility for the nativeswas only made in 1940 when the indigenous credit fund was established. This fundwas to be accessed by the natives considered to have attained a certain level ofcivilisation. The first meeting of the fund was only held in 1958 and no credit wasconceded (Negrão 1995).
(iv) Traditional vs. government institutionsNo serious efforts were devoted to harmonizing traditional institutions in agriculturewith government institutions, and at least exploiting the complimentarity of the two.For example, when it came to livestock development policies, governments’ emphasiswas on beef and dairy products, while the peasants emphasis was on manure, milk,draught power, prestige (in numbers), cultural and social needs. It was not suprisingthat destocking policies failed in Zimbabwe (Chipika 1998)). Governments did notinvest much in pasture improvement and animal husbandry in the peasant sector.Livestock production by this sector, and especially by nomadic tribes, is mainly carriedout in woodlands.
Effects on forestry resources of the agricultural policies, practices, and associatedlegislation adopted during the colonial period are summarized in Box 1. The colonialperiod has been reviewed in greater detail than the other periods because this is the

151G. Mlay , F. Turuka, G. Kowero and R. Kachule
period where many of the post-independence structures in land use, and agriculture inparticular were laid. The post-independence governments continued for a long time tooperate with such structures and even today agriculture is still a smallholder-estate farmeraffair. It is also during this period that considerable deforestation took place to give wayto agriculture. For example in 1963 FAO estimates indicate that communal areas of Zimbabwehad 60% of their area under woodlands, while by 1978 (two years before independence in1980), this area had been reduced to 30% (Bradely and Dewees 1993).
It is therefore important to understand what factors shaped or continue to shapeevents in agriculture and the eventual impact on forestry. A lot of what is happening todayhas its roots in the past. “An object is as far behind the mirror as it is in front” (Anon.)
Box 1. Some effects of colonial agricultural policies, practices, and associatedlegislation on forestry resources
1. Commercial/estate farmers drew land from forests because of extensive nature of plan-tation/estate agriculture.
2. The lack of complete property rights on the land could have been a disincentive to theadoption of land conservation measures.
3. The low prices of agricultural products to smallholders as well as restricted access tomarkets, credit and extension services did not promote an increase in marketed surplus.To the contrary non-farm activities and off farm employment was promoted as alternativesources of income, thereby reducing labour available for crop production and possiblyconstraining deforestation. However, some of these activities were conducted in theforests, resulting into deforestation and forest quality deterioration. Further, with lowincomes, investments in agriculture were negligible, leading to land exhaustion and needfor ‘new’ land which was excised from forested areas.
4. The forced labour and migratory labour meant that family agriculture was essentially leftto women. The reduced availability of men labour for land clearing meant overuse of landwithout fertility recovery with consequent yield decline and land degradation, and thereforeneed for ‘new’ land mainly from forested areas. However, reduced availability of malelabour could have constrained opening up of new agricultural land, thereby reducing thepace of deforestation.
5. Geographical differentiation of economic activities resulted into imbalanced growth ordevelopment in each of these countries, with some areas more adversely affected byenvironmental problems than others. For example, in Mozambique the southern provincesbecame a supply of migrant labour to South Africa, while the central provinces weredominated by plantation agriculture. The northern provinces saw little colonial economicdevelopment.
6. Although the distortion policy measures satisfied the short-term interests of the colonialgovernments, they left serious structural problems, which were eventually inherited bynational governments at independence. These included weaknesses in land tenure andlegislation, unequal regional development pattern, controlled pricing and marketing ofagricultural products, and lack of skilled manpower. Many of these imbalances have yet tobe addressed fully in the individual countries, and yet they are the final determinants ofsuccess in sustained natural resource use and management in these countries.
7. The colonial governments did not put into place policies and strategies to internalise thenegative externalities arising from land use policies and practices in agriculture.
8. In this period the framework was established for almost all-environmental problems thesecountries faced and continue to experience. Effectively the colonial administration laidthe foundation on whether or not forestry and natural resource in general, could bemanaged and used sustainably.

152 AGRICULTURAL POLICIES AND FORESTRY DEVELOPMENT
4. POST-INDEPENDENCE DEVELOPMENTSIn this period some of the agricultural structures built up during the colonial periodremained intact to the present day. The pattern of agricultural production continuedto be polarized: smallholder and estate/cooperative/commercial farmers. Changes inagricultural production were realized through relocation of people and using economicincentives.
The post-independence period is characterised by two distinct economic regimesin all these countries. The early post-independence period witnessed good economicgrowth in each of these countries, although this was short lived in Mozambique as thecountry was plunged into civil war. The countries experimented with economic andpolitical policies to speed up economic development. This period was characterisedby economies that were centrally planned, with state ownership and/or control ofmost means of production and distribution. The role of market forces in allocatingresources was very much constrained. With the exception of Malawi, the othercountries had socialist oriented policies, ranging from a Marxist-Lenin governmentin Mozambique to home-grown brand of socialism in Tanzania called ‘Ujamaa’. Theseexperiments, combined with unfavourable regional and global events like the oilcrisis of the early 1970s, eventually stifled economic growth, and forced thegovernments to adopt economic reforms backed by international financialinstitutions, commonly known as structural adjustment programmes (SAPs). Theystarted to be implemented in Malawi, Tanzania, Mozambique and Zimbabwe inrespectively 1980, 1986, 1987 and 1991. These reforms are on going. SAPs placeemphasis on a number of things including increased private sector involvement inthe national economy, trade liberalisation, reduction in budget deficit through fiscalretrenchment and domestic credit contraction, and substantial currency devaluation.These policies demanded major re-orientations in the environment in which economicactivities are operated. The countries gradually shifted from the pre-SAP centrallyplanned economies to decentralised economies that were increasingly becomingmarket oriented.
4.1 Pre-SAP PeriodDuring this period many of the colonial policies and practices remained in place (Box2). However, there were some significant changes in policies and strategies for ruraldevelopment, which affected the sector and eventually forest cover. A notable onewas the increased state intervention in production, processing, marketing and pricing.This saw the emergence of parastatal organisations to implement these state functions.There was a deliberate effort by governments to increase agricultural production.This was notable in Zimbabwe, up to mid-1980s when agriculture flourished. The landarea under maize, sorghum, soya bean groundnuts, cotton, sunflower and burley tobaccoin communal and resettlement areas expanded by about 12.3% in this period (Chipikaand Kowero 2000). In Tanzania the production of staples, namely maize, paddy andwheat between 1975/76-1976/77 and 1984/85-1985/86 increased by respectively 38%,48%, and 18% (Bagachwa et al. 1995). The extent to which increased crop productiondrew land from forests and grazing land is not known.
Another feature of the period was the continued concentration of smallholders toconfined land areas although the objectives and patterns for such concentration changed.In Tanzania, the ‘ujamaa’ policy introduced a villagisation programme that saw massive

153G. Mlay , F. Turuka, G. Kowero and R. Kachule
movement of people into communal villages. The same was true for Mozambique withthe creation of communal villages. Cooperative production in these villages was seenas the viable means of transforming the peasant sector into a modern sector(Abrahamsson and Nilsson 1994; Branco 1994).
In Zimbabwe, movement of people into the communal and resettlement areascontinued. In Malawi, due to growth of the estate sub-sector, smallholders lost theircustomary lands and remained on limited land. In the late 1960s and early 1970s thethrust in Malawi was for politicians, top civil servants, and the government parastatal,Agricultural Development and Marketing Corporation (ADMARC) to go into estate farmingand supported with credit from state owned banks (Kachule et al. 1999).
This reversed the colonial policy, which transferred the estates to customary land.Estate farming therefore necessitated clearing customary land under forests, andeffectively started to mount land pressure on the smallholder farmers whose customaryland was taken away. The war in Mozambique created concentrations of refugees inconfined and secure areas within the country as well as in neighbouring countries. Theextent of forest cover clearing to give way to habitation, farms and other infrastructureassociated with these massive movements of people in the region has never beenassessed.
Box 2. Some notable pre-SAP period policies and practices
1. Continued ownership of land by state, only changing hands from colonial governments tonational governments. In Tanzania and Mozambique, the private commercial farms werenationalised and transformed into state farms, and communal villages were established asa basis for the transformation of the smallholder sector.
2. Absence of a comprehensive agricultural policy in each of the countries for practically allthis period. The sector was driven by a number of policy statements and strategies whichwere part of larger programmes known by various names like rural development plans,integrated rural development programmes, five year development plans, etc. Otherwisethey were part of major political pronouncements, like the development strategy forMozambique that was formulated in the third FRELIMO party congress of 1977 (FRELIMO,1977). The sector continued with a top-down approach to its development.
3. Government intervention in pricing and marketing (through price controls and state runmarketing institutions) had negative effects on agricultural production in Mozambiqueand Tanzania.
4. Estate and smallholder agriculture continued to characterise the sector, with increasedsupport from governments going to the former.
5. The main agricultural strategy mostly remained unchanged, with the estate farmers largelyproducing for both domestic and export markets, while smallhoders produced mainly forsubsistence and domestic market. The latter saw increased production through agricul-tural extensification while the estate sector realized good productivity growth throughagricultural intensification.
6. Continued institutional, technological, and pricing differentials between estate sub- sec-tor, state monopolies, and cooperatives on one hand, and smallholders on the other. Thisdiscouraged the latter from making any meaningful investments in agriculture, encourag-ing peasants to continue to mine the land and the few forests and trees left.

154 AGRICULTURAL POLICIES AND FORESTRY DEVELOPMENT
One notable aspect is that during the colonial time people were confined tospecific areas, and this trend was entrenched during the independence era. A lot offorest clearing was done in both periods, largely because of this. It is most likelythat massive deforestation took place in these countries before the onset of theeconomic reforms. For example, Bradley and Dewees (1993) and Dewees (1994)report that woodland cover in the communal areas of Zimbabwe had been reduced to30% by 1978.
This fixity of smallholders and with very little room to manoeuvre in terms of landaccessibility not only increased clearing of forests and indigenous trees on farms butalso degraded their land because they invested very little in improving land andagriculture. It is within such a confined environment that smallholders continue to liveand are expected to respond to various policies, macro-economic and otherwise, toimprove their agriculture while simultaneously conserving natural resources. And thisis the framework on which the SAPs have to operate successfully.
4.2 The SAP PeriodThis period stretches from when individual countries started to implement the economicreforms to present time (2002). These reforms have intermittently been in force in allthese countries, albeit at different degrees of enforcement. They were introduced inTanzania in 1986/87 (after a brief spell in 1985/86 with home grown reforms), Malawiin 1980, Mozambique in 1987 and Zimbabwe in 1991.
The SAPs employ most of the policies discussed in section 2. The implication of theSAPs on agricultural land expansion varies. The SAPs targeted increasing export cropsthrough price and market liberalisation and currency devaluation. There was less emphasisgiven to production of food crops. Changes in area allocated to different crops in thedifferent countries are presented in Table 1. In all the four countries there was amixture of a decline or modest increase in the production of the staples. As regardsproduction of cash crops which were essentially for export, the performance was muchbetter in all countries implying that the farmers’ response to the SAP policies waspositive for these crops.
In Mozambique, it is estimated that the annual growth rate in agriculturalproduction between 1992 and 1997 was 6.3% while marketed surplus through formalmarkets grew at the annual rate of 34% (MAP 1998). Within the smallholder sub sector,significant changes have taken place in land allocation with large increases in areasfor tobacco and sunflower. The period selected (1994-2000) coincides with social andpolitical stability in the country. However, due to earlier effects of the war croplandarea declined dramatically.
In Malawi, the thrust for estate agriculture increased, with land under estatesincreasing from 759,400 hectares (6.4% of total land area) between 1980 and 1989to 1,148,000 hectares (9.6% of total land area) between 1990 and 1993 (Kachule et al.1999). This represented the best land and was taken from customary land, involvingclearing of large areas under indigenous forests. Further, the government promoted a‘project approach’ to smallholder farming, in that it launched four Integrated RuralDevelopment Programmes (IRDP) after independence, the failure of which was followedby a National Rural Development Programme (NRDP) which divided the country intoeight Agricultural Development Divisions (ADDs). The failure of both IRDPs and NRDP

155G. Mlay , F. Turuka, G. Kowero and R. Kachule
meant that the government was unable to increase smallhoder farm productivity.Further, the government was unwilling to raise prices paid to smallholders for exportcrops and could not solve the problem of peak labour demand for smallholders duringcropping seasons. Low agricultural productivity and producer prices combined withdecline in average farm size led to decline in real incomes for rural families. Ascoping measures, rural families resorted to massive deforestation of indigenous forestsas sources of income through sale of firewood, charcoal, timber and other forestproducts (ibid.).
Table 1. Percentage change in land area for different crops
Tanzania (1986/87 – Malawib Zimbabwe Mozambique
1991/2)a 1989-1992 (1991-1995)c 1994-2000d
Cash Crops - -
Coffee 4.8 -4.13 - -
Tea 53.2 1.25 - -
Tobacco 7 33.89 55.42 536.0
Cotton 16.2 18.08 -0.09 3.1
Staple Crops 1986/87 – 1993/94 1989-1992 1991-1995 1994-2000
Maize 2.8 7.11 30.56 227.0
Paddy 1.2 -40.19 - -38.3
Cassava 0.8 -13.85 - -19.0
Sorghum - -7.81 19.81 -31.4
Soya beans - 92.46 -66.67 -
Ground nuts - -116.6 -21.05 78.5
Sunflower - 51.02 -5.71 660.2
a Msambichaka and Naho 1995.b Smallholder hectarage between 1989 and 1992. Source: Famine Early Warning System (FEWS) Malawi.c Chipika and Kowero 2000.d Computed from Instituto Nacional de Estatística 2001, Ministerio da MAP 1994. The data onlyrepresent the household sub-sector.
This period is characterised by rapid erosion of some previous agricultural relatedpolicies and legislation. These included a gradual to complete elimination of subsidieson agricultural inputs; increasing role of private sector in agricultural production,distribution of inputs, and marketing of agricultural output; and increasing role of themarketing forces in pricing of agricultural inputs and outputs. This paper does not intendto review in detail the effects on forestry of SAP policies on agricultural production.However, the noted agricultural land expansion (which could be attributed to thesepolicies), if allowed to continue could have disastrous effects on the remaining publicwoodlands and those forests not under effective government control in these countries.
The same could be true of the resettlement and commercial farms of Zimbabwebecause these areas have significant woodland cover and response to these policiescould result into clearing of woodlands. For example, in a study undertaken in Tanzania

156 AGRICULTURAL POLICIES AND FORESTRY DEVELOPMENT
by Monela et al. (2000), about 45%, 44%, and 32% of farm land was acquired by clearingpublic woodlands and from open public land in intermediate, remote, and peri-urbansites respectively. In Malawi, opening up of gardens in natural forests constituted 21% offarmers’ explanation on environmental degradation (Minde et al. 2000). This shows thatsome of the remaining natural forests are still accessible, albeit illegally, to farmers.
The implications of the individual SAP policies on agriculture and eventually onforest cover in this region have not been sufficiently studied and therefore needfurther scrutiny. However, the potential of these policies to increase land underagricultural crops in this region has been demonstrated in various studies includingBagachwa et al. (1995), Chipika and Kowero (2000), Minde et al. (1997), and Reed(1996). Expansion of cropped area and livestock grazing remain the major sources ofdeforestation and degradation of miombo woodlands.
5. OVERALL IMPLICATIONS FOR FORESTRY DEVELOPMENT
5.1 Pre-colonial periodThere was very limited degradation of land and forest resources during this time, dueto low human and domestic animal populations. Customary rules and indigenousknowledge guided the use of natural forest resources.
5.2 Colonial period• Boundaries were put between some natural forest resources and agricultural
land thereby restricting shifting cultivation. The boundaries or restrictions werein form of rights of access to natural forest resources. In order to contain
Apparently the road constrains expanding this maize farm into the woodlands, but for how long?(Photo: G. Kowero)

157G. Mlay , F. Turuka, G. Kowero and R. Kachule
restrictions on shifting cultivation fallow periods were initially reduced andlater eliminated in some areas, given the pressure on land. The confinement ofpoor people to small and declining land parcels coupled with their inability toimprove farming using better inputs gradually led to land degradation anddemand for ‘new’ land.
• Agriculture was divided into smallholder and estate/plantation, and this firmlylaid the basis for government attention and resource allocation to the two sub-sectors as well as defining the symmetry for agricultural development to thepresent day. The estate agriculture was comprised of few technically andfinancially strong players, yet it commanded more attention and incentivesthan the smallholder sub-sector, which had poor and ill-equipped farmers. Theserelative positions of the players were to later become decisive in the capacityof either of the players to make meaningful responses to economic policiesrelevant to the sector. However, both sub-sectors cleared large tracts of landfor agriculture.
• The colonial governments had to raise money for managing the new states theycreated. This was done in form of taxes, which introduced an additional burdenon both smallholder and estate farmers to increase acreage in order to pay fortaxes. Also modernization of living standards led to increased demands on thepeople thereby demanding more income, and since this came largely fromagriculture, then additional land for production must have been drawn fromforested areas. To meet the state’s foreign currency requirements, estate/plantation crops, intended mainly for export, were introduced. These resultedinto massive clearance of forests for land to grow the crops, provide supportinginfrastructure, and in some cases like tobacco forests were cleared for firewoodto treat the crops. Thus the introduction of the ‘nation’ state and improvementof living standards was very costly and came with significant additional demandson forested land.
• There were many disruptions in the way local people used to do things. Theseincluded introduction of new crops, confinement to marginal lands, introductionof large scale commercial agriculture which absorbed cheap rural labour, tensionsdue to loss of land to estate sub-sector, and inequalities in terms of incentivesfor smallholder and estate farmer for same crops. The rural communities couldnot evolve ways of dealing with all these changes and to their advantage. Manyof these changes led to disruption of the ecological systems that were controlledby the local communities.
5.3 Post-independence period (up to 2002)• Post-independence governments did not redress the imbalances between
smallholder and estate farmers. Smallholder farmers, in most of these countries,continue to operate on land, which is shrinking in relation to human and animalpopulation growth. Further, these farmers have limited or at times do nothave capacity to invest in agriculture. On the other hand estate farmers haveland in excess, can access credit, and therefore can invest in improvingagriculture. Yet the same macroeconomic policies, and in particular those underSAPs, are applied to both sub-sectors to improve agriculture. The failure ofsmallholder farmers to respond to economic reform policies to improve their

158 AGRICULTURAL POLICIES AND FORESTRY DEVELOPMENT
way of living has given rise to a drastic surge in informal businesses, whichlargely involve forest products like firewood, charcoal, wood carvings, andnon-timber products. The sustained supply of such products cannot be ascertainedlet alone the extent of deforestation of the forest estate.
• Also post-independence governments introduced measures, which were viewedcorrect, but had serious implications on forests. The movement of people intocollective villages in Tanzania and Mozambique, the resettlement of people inresettlement and communal areas in Zimbabwe, the rapid expansion of estateagriculture in Malawi necessitated clearance of massive forest areas foragriculture and supporting infrastructure.
• There was little consideration given to forests in agricultural policies and plans.There were and continue to be plans to expand agriculture and livestockdevelopment, but these plans do not indicate which land such expansion shouldtake place. The forests and grasslands would appear to be the logical areas.
• The development process, either at individual or government level, requiredresources. Governments as well as individuals continued to rely mainly onagriculture for this. Like in the colonial period, post-independence governmentscontinued to give emphasis to export crops, and in addition set up their ownstructures of production, parastatal organizations. Agricultural cropland expansionhas been significant in this period, and has been accompanied by increasedrates of deforestation. Apart from forests under government control, forestsand trees are more abundant in estate/commercial farms as compared tosmallholder farms. The latter is now a candidate for agroforestry.
6. CONCLUSIONa) There is asymmetry in agricultural development, which is rooted in the history
of these countries, and post-independence governments have not managed tochange it. On one side are poor smallholder farmers on fixed small plots withlimited capacity to make meaningful responses to economic productionincentives as these require them to make minimal investments in agriculture(e.g. buying of fertilizers, pesticides, and other inputs), or to expand agriculturalland so as to take advantage of economies of scale. On the other side arerelatively rich estate/commercial farmers with big farms, which are rarelyfully cultivated. These can respond to economic policies by expanding areaunder crops and making investments to improve productivity.
b) The success to contain deforestation will very much depend on how governmentseliminate the factors, which create the wide gap between smallholder farmersand estate/commercial farmers in some of these countries. Smallholder farmershave very little room to manouvre in terms of responding to macro-economicincentives to reduce their dependency on natural forest resources. In fact suchdependency, and especially for income, has increased markedly in some ofthese countries during the SAP period.
c) Increasing privatization and individualism and the onset of property rights implythat smallholders will continue to be confined to their small plots for theiragricultural and forestry related needs. Increasing populations on such fixedland combined with increasing poverty will rapidly deplete these areas oftheir forest resources in order to make way for agricultural land. On the other

159G. Mlay , F. Turuka, G. Kowero and R. Kachule
hand there will be more forest resources on the estate/commercial farms.d) Deforestation is gradually becoming an issue for estate/commercial farms and
less so of smallholder farms where there are few trees left. The latter arebetter candidates for agroforestry.
e) It is not only the demand for basic forest products like firewood and buildingpoles, which have contributed to massive deforestation. The process ofmodernization, which includes the establishment of the nation state and itsstructures demand financial means of support that have indirectly createdpressure on forest resources. The cash requirements of governments have partlybeen met through taxes, which have compelled people to open more land forcash crops or surplus production of staples for sale. Also the government desirefor foreign currency has led to the cultivation of crops for export which werehitherto not grown by local people, e.g. sisal, cotton, tea, coffee. Theircultivation has drawn considerable land from the forests. Even plantation forestsof exotic species have replaced indigenous forests.
ENDNOTES1. The major economic activities in the traditional societies were simple in present day context.
They included farming (growing of food crops, cereals, root crops, etc.); livestock rearing (mixedfarming and ranching in the form of nomadism; hunting and fishing; and gathering (wild-food crops,vegetables, fruits, honey, etc.). In order to carry out the above activities, some kind of supportiveservices, especially industries, had to be provided for. For example, farmers needed farm implementsand tools (e.g. axes, hoes); fishermen required fish-nets, fish traps, fishing rods, hooks and lines;hunters needed spears, bows and arrows, snares, knives, etc.; while gatherers needed containersof various makes, designs and colours. In addition to these items, a lot more items were needed inthe household cooking and eating utensils, items for storing foodstuffs and medicines. In short,there was some kind of an industrial manufacturing sector quite distinct from the farm and gatheringactivities.
2. Pits that are dug on steep slopes to control runoff water.3. These are bunds constructed around rice fields.4. By 1899, about 69% of the value of the mainland’s exports was shipped to Zanzibar and about
66% of its imports came from the mainland (Illife 1971). Baumann (1891) reports that…”The Waziguaproduce considerably more grain than they need for their own consumption. As a result they exportgrain in very considerable quantities to Sadani and Pangani (both are along the coast)”
5. Prazos are land concessions that were held under the Roman law. The peasants living in theprazos were required to pay an annual tax (mussaco) in kind (payable in grain, cotton cloth (muchira),ivory or gold dust) to the prazo owner. The prazo owners derived their profit from the tax, labourand monopoly commerce in the areas under their jurisdiction. The prazos were technically feudalcorporations.
6. Meru land case and revolt by the Lugurus.7. Pratt (1976) reports that as a result of colonial policy of agricultural development through
coercion some 75,000 persons were convicted before native courts in 1946 alone.8. Terrace farming was introduced to prevent soil erosion and improve soil fertility to the over-
cultivated land. Under this policy several schemes were initiated including the Mlalo Scheme thatrestricted cattle grazing on flat lands and ridged or terraced all cultivated hill slopes. The Uluguruscheme was started in 1949 with a similar objective. The Mbulu scheme aimed at reducing cattleherds (de-stocking) among the Iraq tribesmen by a third in order to arrest land degradation inmarginal areas, while at the same time resettling them in other areas. The Sukumaland schemeimplemented from 1947 aimed at redistributing human as well as livestock populations fromoverpopulated to less populated areas. The multi-million pounds ground-nut scheme in Kongwa,

160 AGRICULTURAL POLICIES AND FORESTRY DEVELOPMENT
Urambo and Nachingwea started from 1946 aimed at supplying oil to the export market; testingmodern agricultural technology developed in England after World War II; provide employment to ex-soldiers and local people.
9. For example coffee exports from Bukoba increased from 1,138 tons in 1918 to 10,881 tons in1935. In Kilimanjaro, coffee produced by smallholders increased from 32 tons in 1923 to 2,141 tonsin 1939. Cotton production, introduced in the Lake Victoria Zone by the Germans, increased from3,714 bales of lint in 1913 to an average of 34,681 bales between 1935 and 1939 (Iliffe 1971).
REFERENCESAbrahamsson, A. and Nilsson, A. 1994 Moçambique in transição: Um estudo de
desenvolvimento durante o período 1974–1992. Maputo: CEGRAFAndersen, L.E. 1996 The causes of deforestation in Brazilian Amazon. Journal of
Environment and Development 5: 309–328Angelsen, A. 1999 Agricultural expansion and deforestation: Modeling the impact of
population, market forces and property rights. Journal of Development Economics58: 158–218.
Angelsen, A. and Kaimowitz, D. 2001 Agricultural technologies and tropical deforestation.CIFOR and CABI Publishing. 422p.
Angelsen, A., Shitindi, E.F.K. and Aarrestad, J. 1999 Why do farmers expand their landinto forests? Theories and evidence from Tanzania. Environment and DevelopmentEconomics 4: 313–331.
Aune, J.B., Glomsrod, S., Iversen, V., and Wiig, H. 1996 Structural adjustment and landdegradation: A CGE analysis for Tanzania. In: Structural adjustment policies andenvironmental degradation in Tanzania, Zambia, and Ethiopia. Preliminary SeminarReport. Agricultural University of Norway, Aas.
Bagachwa, M.S.D., Shechambo, F.C., Sosovele, H., Kulindwa, K. A., Naho, A.A. andCromwell, C.E. 1995 Structural adjustment and sustainable development in Tanzania.Dar es Salaam University Press. 210p.
Barbier, E.J. and Burgess, J.C. 1996 Economic analysis of deforestation in Mexico.Environment and Development Economics 1: 203–239.
Baumann, O. 1891 Usambara und Nachbargebiete. Berlin.Bradely, P. and Dewees, P. 1993 Indigenous woodlands, agricultural production and
household economy in the communal areas. In: Bradely, P.N. and MacNamara, K.(eds.) Living with trees: Policies for forestry management in Zimbabwe. WorldBank Technical Paper No. 210. World Bank, Washington, p. 63–137.
Budelman, A., Mizambwa, F.C.S., Stroud, A. and Kileo, R.O. 1995 The application of thenutrient flow analysis in land use diagnostics: The case of North Sukumaland, LakeZone, Tanzania. Paper to the IIED/FARM – Africa Workshop. Soddo, Ethiopia, 26November–2 December.
Chenje, M., Sola, L. and Paleczny, D. (eds.) 1998 The state of Zimbabwe’s environment1998. Ministry of Mines, Environment and Tourism, Government of the Republic ofZimbabwe, Harare. 509p.
Chipika, J.T. 1998 The impact of some macro-economic policies and other interventionson household strategies in the miombo region: The case of Zimbabwe. UnpublishedIES Report No. 12. Harare. 91p.
Chipika, J.T. and Kowero, G. 2000 Deforestation of woodlands in communal areas ofZimbabwe: Is it due to agricultural policies? Agriculture, Ecosystem and Environment79: 175–185.

161G. Mlay , F. Turuka, G. Kowero and R. Kachule
Chomnitz, K. M. and Gray, D. A. 1996 Roads, land, markets and deforestation: A Spatialmodel of land use in Belize. World Bank Economic Review 10: 487–512.
Deacon, R. T. 1994 Deforestation and the rule of the law in cross-section of countries.Land Economics 70: 414–30.
Deininger, K. and Minten, B. 1996 Poverty, policies, and deforestation: The case ofMexico. Research project on social and environmental consequences of growthoriented policies. Policy Research Department Working Paper No. 5. World Bank,Washington, DC.
Deininger, K. and Minten, B. 1997 Determinants of forest cover and economics ofprotection: An application to Mexico. World Bank, Washington, DC.
De Montalembert, M.R. 1992 Intersectoral policy linkages affecting the forestry sector.In: Gregerson, H., Oram, P. and Spears, J. (eds.) Priorities for forestry andagroforestry policy research. IFPRI, Washington, DC.
Dewees, P.A. 1994 Social and economic aspects of miombo woodland management inSouthern Africa: Options and opportunities for research. Occasional Paper No. 2.CIFOR, Bogor. 28p.
Didia, D. O., 1997 Democracy, political instability, and tropical deforestation. GlobalEnvironmental Change 7: 63–76.
Foster, A. D., Rosenzweig, M. R., Behrman, J. R. 1997 Population growth, incomegrowth, and deforestation: Management of village common land in India. BrownUniversity, Rhode Island and University of Pennsylvania, Philadelphia. Mimeo.
FRELIMO 1997 Directivas Económicas e Sociais. Maputo: Frelimo.Godoy, R., Franks, J.R., Wilkie, D., Alvarado, M., Gray-Molina, G. Roca, R., Escobar, J.
and Cardenas, M. 1996 The effects of economic development on neotropicaldeforestation: Household and village evidence from Amerindians in Bolivia.Discussion Paper No. 540. Harvard Institute for International Development,Cambridge, Massachusetts.
Godoy, R et al. 1997 Household determinants of deforestation by Amerindians in Honduras.World Development 25: 977–987
Holden, S. T. 1993 Peasant household modeling: Farming systems evolution andsustainability in Northern Zambia. Agricultural Economics 9: 241–267.
Holden, S. 1997 Adjustment policies, peasant household resource allocation anddeforestation in northern Zambia: An overview and some policy implications.Forum for Development Studies 1: 117–134.
Hyden, G. 1980 Beyond Ujamaa in Tanzania: Underdevelopment and an uncapturedpeasantry. University of California Press, Berkeley.
Illife, J. 1971. Agricultural change in modern Tanganyika. East African Publishing House,Nairobi.
Instituto Nacional de Estatística 2001 Censo Agro-Pecuário 1999–2000. Instituto Nacionalde Estatística, Maputo.
International Bank for Reconstruction and Development (IBRD) 1961 The economicdevelopment of Tanganyika: A report of a mission organised by the IBRD at therequest of Government of Tanganyika and United Kingdom. Baltimore, Maryland,USA.
Jones, D.W. and O’Neill, R.V. 1992 Land use patterns with modern and traditional methodsof maintaining soil fertility. Oak Ridge National Laboratories, Oak Ridge, Tennessee.Mimeo.

162 AGRICULTURAL POLICIES AND FORESTRY DEVELOPMENT
Jones, D.W. and O’Neill, R.V. 1993 Rural land use, urban unemployment, and deforestation:The influence of development policies with a non-tradable good. Resources andEnergy Economics 15: 353–70.
Jones, D.W. and O’Neill, R.V. 1994 Development policies, rural land use, and tropicaldeforestation. Regional Science and Urban Economics 24: 753–71.
Jones, D.W. and O’Neill, R.V. 1995 Development policies, urban unemployment, anddeforestation: The role of infrastructure and tax policy in a two-sector model.Journal of Regional Science 35: 135–53.
Kachule, R. N., Jumbe, C.B. L. and Mataya, C.S. 1999 The impact of sectoral policies onthe management of miombo woodlands in Malawi. Working Draft, Bunda Collegeof Agriculture, Lilongwe. 56p.
Kaimowitz, D. and Angelsen, A. 1998 Economic models of tropical deforestation: AReview. CIFOR, Bogor, Indonesia.
Katila, M. 1996 Modeling deforestation in Thailand. Paper presented at IUFRO WorldCongress, Tampere, Finland.
Kjekshus, H. 1977 Ecological control and economic development in East African History.Heinemann Educational Books. University of California, Berkeley.
Kjekshus, H. 1996 Ecological control and economic development in East African History:The case of Tanganyika 1850–1950. James Currey.
Liu, D.S., Iverson, L.R. and Brown, S. 1993 Rates and patterns of deforestation in thePhilippines: Applications of Geographical Information System Analysis. Forest Ecologyand Management 57: 1–16.
Lopez, R. 1993 Economy-wide policies, agricultural productivity, and environmentalfactors: The case of Ghana. Workshop on Economy-wide Policies and theEnvironment, World Bank, Washington, DC.
Magoti, C. K. 1984 Peasant participation and rural productivity in Tanzania: The case ofmara cotton producers 1955–1977. Institut fuer Afrika-Kunde. Verlag StiftungDeutsches Uebersee-Institut, Hamburg.
Maler, K.-G. and Munasinghe, M. 1996 Macroeconomic policies, second-best theory, andthe environment. Environment and Development Economics 1: 149–63.
Mamdani, M. 1976. Politics and class formation in Uganda. New York. London: MonthlyReview Press 339p
Mamingi, N., Chomnitz, K. M., Gray, D. A. and Lambin, E. 1996 Spatial pattern ofdeforestation in Cameroon and Zaire. Working Paper No. 8. Research project onsocial and environmental consequences of growth-oriented policies. Policy ResearchDepartment, World Bank, Washington, DC.
Mbilinyi, S., Mabele, R. and Kyomo, M. L. 1974 Economic struggle of TANU Government.In: Ruhumbika, G. (ed.) Towards Ujamaa: Twenty years TANU leadership, 56–108.East African Literature Bureau, Nairobi.
Mertens, B. and Lambin, E. F. 1997 Spatial modeling of deforestation in South Cameroon:Spatial disaggregation of diverse deforestation processes. Applied Geography 17:143–168.
Minde, I., Kachule, R. and Luhanga, J. 1997 Macroeconomic and sectoral policies andtheir influence on the livelihood strategies of households in the miombo woodlands:The case of Malawi. Report. University of Malawi, Lilongwe.
Minde, I., Ngugi, D., Luhanga, J. and Kowero, G. 2001 Agricultural land expansion anddeforestation in Malawi. Forests, Trees and Livelihoods 11: 167–182.

163G. Mlay , F. Turuka, G. Kowero and R. Kachule
Ministério da Agricultura e Pescas (MAP) 1994 Estatísticas Agrárias. Departamento deEstatística, Ministério da Agricultura e Pescas, Maputo.
Ministério da Agricultura e Pescas (MAP) 1998 Programa Nacional de DesenvolvimentoAgrário (PROAGRI). Ministério da Agricultura e Pescas, Maputo.
Ministry of Lands, Housing and Urban Development (MLHUD) 1995 National land policy.MLHUD, Dar es Salaam.
Misana, S., Mung’ong’o, C. and Mukamuri, B. 1996 Miombo woodlands in the widercontext: Macro-economic and inter-sectoral influences. In: Campbell, B. (ed.) Themiombo in transition: Woodlands and welfare in Africa, 73–99. CIFOR, Bogor.
Monela, G. C. 1995 Tropical rainforest deforestation, biodiversity benefits, and sustainableland use: Analysis of economic and ecological aspects related to the Nguru Mountains,Tanzania. PhD Dissertation, Agricultural University of Norway, Aas.
Monela, G. C., Kajembe, G. C., Kaoneka, A.R.S. and Kowero, G. 2000 Household livelihoodstrategies in the miombo woodlands of Tanzania: Emerging trends. Tanzania Journalof Forestry and Nature Conservation 73: 17–33.
Moyo, S., O’Keefe, P. and Sill, M. 1993 The Southern African environment. Profiles ofthe SADC countries. Earthscan Publications Ltd., London. 354p.
Msambichaka, L. A. and Mabele, R. B. 1977 Agricultural credit and the development ofujamaa villages. In: Kim, K. S., Mabele, R. B. and Schultheis, J. (eds.) Papers onpolitical economy of Tanzania, 207–215. Heinemann Educational Books, Nairobi,Kenya.
Msambichaka, L.A. and Naho, A. 1995 Agricultural sector performance under SAP inTanzania. In: Msambichaka, L.A., Kilindo, A.A.L. and Mjema, G.D. (eds.) Beyondstructural adjustment programmes in Tanzania: Successes, failures, and newprospects, 29–68. Economic Research Bureau, University of Dar es Salaam.
Mwanawina, I. and Sankhayan, P.L. 1996 A computable general equilibrium model tomeasure the effects of structural adjustment programmes on ecology anddevelopment in Zambia. In: Structural adjustment policies and environmentaldegradation in Tanzania, Zambia, and Ethiopia. Preliminary Seminar Report.Agricultural University of Norway, Aas.
Negrao, J. 1995 One hundred years of African rural family economy: The Zambezi deltain retrospective analysis. Department of Economic History, School of Economicsand Management, University of Lund, Sweden.
Newitt, N. 1997 A History of Mozambique. Hurts & Company, London.Nghiep, L. T. 1986 The Land rotation in Northern Brazil: Conditions for its continuation
and transition to the sedentary cultivation system. IDCJ Working Paper Series No.34. International Development Centre of Japan.
Nhira, C., Baker, S., Gondo, P., Mangono, J.J. and Marunda, C. 1998 Contesting inequalityin access to forests. Policy that works for forests and people. Series No.5:Zimbabwe. Centre for Applied Social Sciences and Forestry Commission, Harare,and International Institute for Environment and Development, London. 130p.
Nyasulu, K. M. 1997 EU/SADC Forestry sector cooperation strategy. Regional forestryproposals. Presented at the Second Regional Workshop. Curepipe, Mauritius, 6–7October. 27p. plus Annexes.
Omari, C. K. 1976 Strategy for rural development: Tanzania experience. East AfricanLiterature Bureau, Nairobi.
Ozorio de Almeida, A. L. and Campari, J. S. 1995 Sustainable settlement in the BrazilianAmazonian. Oxford University Press, Oxford.

164 AGRICULTURAL POLICIES AND FORESTRY DEVELOPMENT
Pfaff, A. S. 1997 What drives deforestation in the Brazilian Amazon: Evidence fromsatellite and socio-economic data. Policy Research Department, Working PaperNo. 1772. World Bank, Washington, DC.
Phiri, C. D. 1991 Agricultural policy in Malawi, 1971–1987 Ph.D. Dissertation, Universityof Cambridge.
Pratt, C. 1976 The critical phase in Tanzania 1945–1968. Cambridge University Press.Reed, D. 1996 Structural adjustment, the environment, and sustainable development.
Earthscan Publications Ltd., London. 386p.Riddell, J.C. 1979 Land tenure issues in the Rhodesia/Zimbabwe transition. In: Moran,
E.F. (ed.) Changing agricultural systems in Africa. Studies in third World Societies,Department of Anthropology. College of William and Mary, Virginia, USA.
Rock, M.T. 1996 The stork, the plow, rural social structure and tropical deforestation inpoor countries. Ecological Economics 18: 113–31.
Ruben, R., Kruseman, G. and Hengsdijk, H. 1994 Farm household modeling for estimatingthe effectiveness of price instruments on sustainable land uses in the Atlantic Zoneof Costa Rica. DLV Report No. 4. Wageningen Agricultural University, The Netherlands.
Ruthenberg, H. 1964 Agricultural development in Tanganyika. IFO-Institut fuerWirtschaftsforschung. Springer-Verlag, Muenchen.
Shafik, N. 1994 Economic development and environmental quality: An econometricanalysis. Oxford Economic Papers 46: 757–73.
Siiriäinen, A. 2000 Socio-cultural history of deforestation in Africa. In: Palo, M. andVanhanen, H. (eds.) World forests from deforestation to transition. Kluwer. AcademicPublishers, Dordrecht.
Southgate, D. 1994 Tropical deforestation and agricultural development in Latin America.In: Brown, K. and Pearce, D. (eds.) The causes of tropical deforestation, theeconomic and statistical analysis of factors giving rise to the loss of tropical forests,134–44. University College of London Press, London.
Thiele, R. and Wiebelt, M. 1994 Policies to reduce tropical deforestation and degradation:A computable general equilibrium analysis for Cameroon. Quarterly Journal ofInternational Agriculture 33: 162–78.
Trapnell, G. G. 1937 Ecological methods in the study of native Agriculture in NorthernRhodesia. Royal Botanical Gardens Bulletin of Miscellaneous Information No. 1,Kew.
von Amsberg, J. 1994 Economic parameters of deforestation. Policy Research WorkingPaper No.1350. World Bank, Washington, DC.
World Bank 1996 Toward environmentally sustainable development in sub-Saharan Africa:A World Bank agenda.

11.Forest policies in Malawi, Mozambique,Tanzania and Zimbabwe1
G. Kowero, A.S. Kaoneka, I. Nhantumbo,P. Gondo and C.B.L. Jumbe
ABSTRACTMany countries in eastern and southern Africa have lost significant natural forest resources.Initially the pace was gradual, but it has accelerated very much in the recent past.Some of the efforts made to contain the situation include revising past policies toimprove forestry development and conservation. This paper traces the evolution ofsuch policies together with corresponding implementation mechanisms in Malawi,Mozambique, Tanzania and Zimbabwe. Although broad policy statements on involvinglocal communities in forestry have existed in some countries for several decades,adequate resources have not been committed for their effective operationalisation.Generally, the forestry sector in southern Africa has lagged behind other sectors inrevising its policies to adequately reflect political and socio-economic changes. Politicaland socio-economic policies appear to have taken precedence over forest sector policies,with far reaching consequences for the sector. However, current forest policies aremore comprehensive in terms of stakeholders considered and issues addressed.
Key words: Policies; legislation; communities; forestry; Southern Africa.
1. INTRODUCTIONForestry policy is “concerned with the manner in which forests and tree resourcesshould be managed to serve the needs of people and meet society ’s demand for thegoods and services that forests and forestry can provide, as well as with regard forthe non-material values that trees and forests represent ”(FAO 1993). Viewed thisway, a forestry policy is essentially a statement of objectives of forestry practice andincludes guidance on how these are to be operationalised. In this paper, legislation isconsidered as one of the means for operationalising policies. The objectives in the

166 FOREST POLICIES IN MALAWI, MOZAMBIQUE, TANZANIA AND ZIMBABWE
policy are a reflection of the demands of stakeholders on forest resources. Since suchdemands evolve with time, national forestry policies have also evolved in order toprovide guidance on how to meet the changing needs of their societies, as well asreflect regional and global concerns.
Forestry policies have evolved from simple unwritten intentions and statementsthat catered for a very small number of society ’s requirements to today ’s comprehensiveand broad ranging expressions of multiple-stakeholder expectations on forest resources.For example, Goumandakoye (1996) notes that the initial forest policy of Kenya in theearly 1900s was aimed at providing firewood to the Kenya-Uganda railway. Similarly,from 1930 to 1960 forestry practices in many Sahelian countries were aimed primarilyat protecting land where groundnuts, a major export crop, were grown.
Given the increasing awareness of the roles trees and forests play in the lives ofpeople, there has been a growing interest since the 1980s to examine whether existingnational forestry policies provide sufficient guidance towards sustainably meetingforest-related needs.
This paper briefly examines the evolution of forestry policy objectives in Malawi,Mozambique, Tanzania, and Zimbabwe. In each of these countries, 20 to 50% of thetotal land area is under forests, with woodlands as the main form of forest cover. Theauthors recognise that the forestry policy-making process has evolved over time, andin many of these countries, the process has moved away from the top to bottom approachin which policies were dictated to the people by their governments, to a more consultativeapproach. This in itself has brought into play many stakeholders with varying demandson forestry. The process has also shifted the domain of forestry from the hands ofcentral governments to encompassing many stakeholders, the principal ones being localcommunities, the private sector, and the international community.
The paper seeks to highlight factors that have shaped and continue to shapeforest policy objectives and therefore the forest condition in the four countries, aswell as the changing focus in forest management. The hypothesis is that in some ofthese countries, there is weak government commitment to forestry and long delays inrevising the sector’s objectives. Therefore, policies responding to broader politicaland socio-economic orientations have taken precedence over forestry policies in shapingthe way the forest condition has evolved. There is scope for generalising the findingsto the other countries in the region with similar forest cover, colonial history, as wellas post-independence socio-economic regimes.
The paper is organised as follows: Sections 2,3and 4 review pre-colonial, colonial,and post-independence forestry. Section 5 presents a summary of major conclusions.
2. PRE-COLONIAL FORESTRYThe pre-colonial period was characterised by the absence of written records by thelocal populace on their utilisation and management of forest resources. What is knowntoday about how people and forest resources interacted is based mainly on oral historyrecorded after this period, and on the records of early foreign explorers to the region.
Evidence available in some of these countries suggests that the land use systemsin this period were sustainable (Kaoneka et al. 1999). For example, shifting cultivationand nomadic livestock rotation systems were practised. The long fallow period al-lowed the land to recover fully before the next rotation, whereas low livestock densitiesminimized over-grazing. This ensured sustainable productivity of land. However, there

167G. Kowero, A.S. Kaoneka, I. Nhantumbo, P. Gondo and C.B.L. Jumbe
were areas where people settled or lived in clusters for several reasons, and this couldhave resulted in deforestation and forest degradation due to dependence on limitedland. For example, the Shona people of Zimbabwe are reported by Misana et al. (1996)to have settled around hill fortresses that were easy to defend against invaders. Theyfarmed and grazed cattle in lower lying areas.
Forest resource management and utilization were regulated through customarylaws. The authority on forest resources was vested in traditional leaders like chiefs,who were responsible for law enforcement and other management decisions. Theseleaders were effectively the custodians of the unwritten policies. This has been thetradition in many parts of Africa.
The traditional leaders were responsible for much less extensive land areas thanthose controlled by central governments today. Moreover, at that time there were fewerstakeholders with fewer demands on the forest estate. Their demands were mainly interms of fruits, firewood and fodder for livestock, and simple building materials like polesand thatch grass. Forests were also used for spiritual purposes. These demands shapedthe objectives for administering the forest estate. The means or instruments employedfor achieving the desired objectives constituted management prescriptions on protectingand conserving trees and forests as well as on harvesting products from them.
2.1 Protection and conservation of trees and forestsThere are many examples of how traditional authorities protected, conserved, andregulated the harvesting of trees and forests. For example, in Tanzania, chiefs likeKimweri of the Shambaa tribe declared some forests as traditional forest reserves tobe used for rituals and cultural ceremonies. The Sukuma people of Tanzania establishedtraditional forest reserves called Ngitili in order to protect medicinal plants and fodderduring the dry period. In Zimbabwe sacred forests or sacred groves were set asidewith tree cutting and access to such areas forbidden (du Toit et al. 1984). Also Gumbo(1998), cited in Chenje et al. (1998), reports that a number of tree species wereprotected in the Wedza Mountain area of Zimbabwe for their medicinal values, whileothers were left alone because people believed that cutting them would bring thembad luck. In Mozambique, communities in Serra-Choa are reported to have totallyprotected some forests for religious purposes (Virtanen 1999). These measurescorrespond to present-day gazetting of forests for specific purposes.
In some communities taboos were invoked in order to maintain control over suchresources. For example, Mukamuri (1987) and Matose (1992) report that in Zimbabwethese taboos were based on the notion that the resources belonged to the past, presentand future communities/generations. This effectively linked the forests to ancestralspirits, and also introduced the concept of intergenerational ownership of naturalforest resources. In Mozambique, Virtanen (1999) reports that Serra-Choa is “repletewith traditions about powerful ancestral spirits which protect natural resources andespecially the sacred places in the form of mhondoro (ancestral spirits) lions or snakes”.
2.2 Harvesting and use of trees and forest productsIn many communities there were specific regulations to guide harvesting of forestproduce. Chimedza (1991) and Grundy (1990) report rules such as those regulatingspacing between trees to cut, and others prohibiting the cutting of fruit and sacred

168 FOREST POLICIES IN MALAWI, MOZAMBIQUE, TANZANIA AND ZIMBABWE
trees in Zimbabwe. Matose (1992) reports a number of rules including those restrictingfuelwood collection to dry wood only, collection of bark restricted to one side of thetree only, and no collection of bark and medicines from trees that had previously beenharvested. These restrictions guided the way the trees and forests developed aftersuch interventions, and the communities formulated them with a desire to see theforest develop the way they wanted. In Mozambique, Virtanen (1999) reports thatcutting of trees was regulated, as was the seasonal burning of grassland and bush.The latter was done under the supervision of local elders. There is considerable evidencethat indigenous knowledge was capable of regulating resource management andutilization (Kaoneka et al. 1999). These taboos and rules could parallel modern forestlegislation.
The following were present in the local communities to varying degrees:• Intentions or objectives that guided protection and management of trees and
forests;• Recognised and respected authority over the resources;• Knowledge and means that guided activities on trees and forests in ways which
changed their structure, therefore being within the realm of forest management;• Parallel role to present-day forestry management, in that forest reservation was
practised on the basis of very localised interests which the communitiessubscribed to, while present day gazetting of forests takes on broader nationaland global considerations which local communities might not be aware of. Therewere also restraints and guidelines on managing and harvesting tree and forestproducts, much as we find today in forestry.
In essence, there was an unwritten sense of direction in some forestry matters ofrelevance to the local communities. In addition, there were regulations and othermeans to guide the related activities. During this period there were few demands onforests, the human populations were very low, the forest resources were abundant inmany communities, and the communities had many other important priorities likefood and security. These factors might explain the manner in which forestry businesswas conducted, which was in many cases less elaborate as compared, for example,with the way communities designed their security and defense strategies. However,there were some cases where the communities designed elaborate forest conservation,harvesting, and utilisation measures.
3. COLONIAL PERIOD
Colonial governments´position on land and other natural resourcesThe four countries under review do not share the same colonial experience. Mozambiquewas under the Portuguese for some 476 years. Tanzania changed hands from Germanto British rule at the end of World War II, during which period the country was knownas Tanganyika, with Zanzibar as an independent state. Malawi was a British colony,then known as Nyasaland. Zimbabwe and Zambia were also British colonies, known asSouthern Rhodesia and Northern Rhodesia respectively.
One characteristic of all these colonial powers was how they acquired land fordifferent purposes and functions. Natural forests were cleared for agriculture,settlement, and other infrastructure. In almost all southern African countries, the

169G. Kowero, A.S. Kaoneka, I. Nhantumbo, P. Gondo and C.B.L. Jumbe
forests are actually woodlands with limited commercial production potential. Therefore,they had little likelihood of being on the same plane as agriculture and other financiallyprominent sectors in terms of official attention. The colonial administrations introducedrestrictions on local people’s access to forests and land.
In Mozambique, commercial agriculture was only initiated in early 1870 when theMozambique opium cultivation and trading company was established (Negrao 1995).Commercial agriculture evolved in two forms; viz. large-scale plantations by companies,and small-scale commercial farms by Portuguese settlers. Commercial agricultureintroduced drastic changes with respect to land access and use by the peasants. In1891,legislation was passed allowing the local people to have access to 1 hectare ofland per household within the area conceded to the settlers. In 1909 the holding ofland title by natives was repealed and a category of land reserves for Africans wascreated. Within the reserves, land occupation was flexible, but without the right toland titles (ibid.).
In Zimbabwe, the first land reserves for Africans were created by the Britishcolonial power as early as 1894.By 1911, the reserves comprised 8.5million hectaresof largely marginal land. About 60% of the estimated 700 000 indigenous populationlived in these reserves, and since the population was still fairly small, degradationwas not yet a problem (Whitlow 1988). By the end of the 1920s,however, as the farmersincreased land under cultivation in order to cope with taxes and falling grain prices,the reserved areas began to show evidence of degradation. Livestock numbers werealso increasing, compounding the degradation problem. During the same period, landheld by settlers increased from 20%to 50%of the total land area.
In Malawi, the general thrust of colonial land law was to appropriate all land inMalawi to the British sovereign; entrust the administration of such land to the sovereign’s local representatives (first the commissioner and later, the governor); and laterfacilitate access by the settler community on the basis of private title. Since Africanshad no title to land under colonial law, the only issue of concern was how to regulateoccupation rights among them. The domain of customary law was severely curtailed.African land rights were left in great ambiguity – something that made their positioninsecure and created difficulties in the future (Phiri 1991).
In Tanzania, the German administration passed in 1895 the Imperial Decreeregarding the creation, acquisition and conveyance of land, in which all Tanganyikawas declared as Crown Land vested in the German Empire. This decree facilitated thealienation of land from tribal areas and the establishment of plantations. Under Britishrule, the enactment of the Land Tenure Ordinance Number 3 of 1923 (commonly referredto as Land Ordinance Chapter 113) declared all land in Tanganyika as public land andintroduced the concept of rights of occupancy. According to this Act, rights over orinland were placed under the control of the British governor and were to be held, usedor disposed of as rights of occupancy for the benefit of the indigenous people ofTanganyika (MLHUD 1995).
The colonial era therefore brought with it many changes in the lives of localpeople. The broad colonial policy declared “unoccupied ” lands as state property. Thisperiod marked the beginning of disruption of common property regimes. Apart frompresent-day imbalances in access to land in some of these countries, the colonialadministration was largely responsible for shaping present day forest resources andtheir guiding policies and management practices. As noted by Gondo et al. (1999), themost significant development during this era was the introduction of the concept of a

170 FOREST POLICIES IN MALAWI, MOZAMBIQUE, TANZANIA AND ZIMBABWE
“state ” or “nation ”, and formal national policies and legislation. Forestry mattersthat had always been in the domain of local leaders were now being examined andeven governed in the context of a district, province and nation. Some of the majorfeatures of the colonial period forestry are discussed below.
(a) Centralised forestry administrationThe colonial administration imposed restrictions on access to trees and forest resourcesand introduced administrative tools for the national forest estate. However, recognitionwas given to local or traditional structures of administration in forest areas outsidegovernment control.
One form of controlling access was the gazetting of forests. Natural forests weregazetted as colonial government property, effectively putting these resources out ofthe reach of the local people.
Another measure was the creation of centralised administration of the nationalforest estate. Centralised administration evolved gradually and in different forms,and was shaped by the needs of the colonial authority. A number of tools, referred toas legislation in this paper, were put into place. These featured in different countriesas decrees, regulations, acts, ordinances, rules, laws, etc. The legislation was toguide selected forest activities and the functioning of forestry administration units.In some countries this was done without any formal forestry policy to guide nationalforestry development. These administrative units initially had a shallow focus and avery narrow range of activities. A few examples illustrate this.
In Malawi, a precursor to the current forestry department was a scientificdepartment that was established in Zomba in 1891,with a focus on planting mlanjecedar (Widdringtonia whytei) on Zomba Mountain as well as conducting someexperimental work in the area. In 1910 this department became the Department ofAgriculture. The first forest ordinance came into effect in 1911,with the Director ofAgriculture as the overall forest authority (Kachule et al. 1999). Since then, Malawi hada number of forest ordinances, which guided forestry development. The 1926 forestordinance is outstanding in that it transferred authority over forestry to the ChiefForest Officer. It also provided for the creation of village or community forests, knownas village forest areas, and put them under the control of village headmen (ibid.). Thismarked the beginnings of central government encouraged community forestry; in otherwords, the first effective decentralisation of forestry resources management to localcommunities in the southern African region. Malawi did not have any formal forestpolicy until it became independent in 1964.
In Tanzania the Germans established a forestry department in 1889.The firstforest ordinance was enacted in 1895 and provided for the creation of forest reserves.The German policies and rules were applicable to the whole of East Africa. The GermanKulturpioner (settlers) cleared forests for plantations and farmland and indiscriminatelycut trees for household purposes (Raumolin 1990). The British restructured the forestdepartment in 1921,giving more emphasis to timber production. The British introducedthe first forest policy in 1953 and a corresponding forest ordinance in 1957.Theseremained in force many years after Tanzania became independent.
There was no formal forest policy in Zimbabwe that guided the development ofthe sector during the colonial period. Forestry development was largely shaped byvarious regulations that guided the distribution of land among whites and blacks. Itwas also influenced by the administration of and pressure on land in the two communities’

171G. Kowero, A.S. Kaoneka, I. Nhantumbo, P. Gondo and C.B.L. Jumbe
areas. A forest department was established in 1920 in the ministry responsible for agriculture.At that time emphasis was on gazetting of natural forest with important commercial treespecies, mainly in the western areas of Zimbabwe, and their eventual controlledexploitation. However, in the African reserves forestry was relegated to a minor role inthe development process, and was also inadequately funded (Banks 1981). Between the1930s and 1950,following the enactment of the Land Apportionment Act of 1930 and thetranslocation of some people to make way for the European settlers, traditional institutionswere generally accepted and recognized by the state and the people as the naturalresources managers in the reserves (Moyo 1995).
However, from 1951,when the Native Land Husbandry Act (NLHA) was enacted,to 1969, the natural resources management and control functions of traditional leaderswere transferred to central government agencies. In 1954 the Forestry Commissionwas established under the Forest Act of 1948. The Commission assumed control offorest resources management. Following stiff resistance by the indigenous people,the NLHA was scrapped and replaced by the Land Tenure Act of 1969.This act onceagain returned the natural resources management and control functions to chiefs andother traditional leaders. Unfortunately this was at the time the war for independencewas intensifying, which led to the traditional leaders being discredited as allies of thecolonialists (Nhira et al. 1998). This, coupled with a rapidly expanding population andconstant displacement by war, led to encroachment into woodlands as a result of theinstitutional vacuum created in most communal areas.
In Mozambique there was no formal forestry policy during the colonial period.However, number of decrees and forest regulations guided forestry business, including:
• The Land Law, law number 2001,May 16,1944.• Protection of Soil, Forest and Wildlife, decree number 40040, January 20,1955.• Forest Regulation Act, decree number 44531,August 21,1962.• Reinforcement of Forest Regulation Act, legislative diploma number
2642,September 20,1965 (Nhantumbo and Soto 1999).
Despite the fact that emphasis was given to harvesting of forests for the generationof foreign currency, there was also concern over conservation and ecological aspectsof the resources. This led to gazetting of animal parks, game and forest reserves andhunting areas. In fact the present protected areas were all identified and declared assuch during the colonial era. In these areas the ecological and economic objectiveswere combined, in certain cases with the involvement of the private sector. While thecolonial government allowed free access to these resources by the rural communitieswhen harvesting for their own consumption, it denied them opportunities to generatemonetary benefits (ibid.).
In all these countries the centralized forestry administration was initiallypreoccupied with the gazetting of commercially important natural forests and theirexploitation. Environmental concerns were given attention, albeit with differentemphases across countries. Apart from Malawi, which gave practical support to localcommunity participation in forestry, the authorities in the other countries acknowledgedthe role of such communities and their leaders, but did not provide incentives fortheir wider participation in forestry.
Much as forests constituted the major land cover in each of these countries, theadministration and management of such resources was not given much priority bycolonial governments. Forest administration was initially placed under agricultural

172 FOREST POLICIES IN MALAWI, MOZAMBIQUE, TANZANIA AND ZIMBABWE
departments. Even when forest departments were created, they were placed underministries responsible for agriculture. In this way forestry departments wereovershadowed by departments that commanded more government attention andresources although they were minor land users.
Further, forestry was largely guided by legislation on the conduct of business inthe forests. Such legislation did not guide the development of the forests and thesector as a whole. The absence of a clear vision in some countries, and commitmentin virtually all countries, on how forestry should have developed resulted in haphazardor uncoordinated development of the sector, which continued even after these countriesbecame independent.
(b) Policies and guiding legislationIn the absence of a formal national forestry policy in practically all these countries,guidance on national perspectives on forestry matters was derived from existinglegislation and writings of the forestry departments. Emphasis on many issues differedacross the countries, especially in terms of implementation, and this can be illustratedthrough the following common focal areas in forestry, viz. production, protection/conservation, and shared responsibility for the resources by major stakeholders.
ProductionUnder production, consideration is given to harvesting natural forests for commercialpurposes, and the development and use of industrial forest plantations. In these fourcountries the early period of colonial rule was guided by economic objectives, givingmuch emphasis to harvesting the natural forests for commercial purposes. For example,in Mozambique, the Portuguese government encouraged selective exploitation of certainvaluable indigenous tree species through long-term concessions or short-term licenses forexport as processed wood and logs, with the latter being dominant (Nhantumbo andSoto1999). In Zimbabwe, Tanzania and Malawi a similar pattern emerged, with emphasison selective harvesting in protected or gazetted forests.
Ecological and society-wide concerns were in some cases neglected, but theadministrations were generally responsive to them when problems emerged. Raumolin(1990) notes that in Tanzania the Germans granted concessions for massive logharvesting for the European market, using destructive logging methods. In Mozambique,the Portuguese government issued a number of legal decrees and forest regulations in1944.This was a result of strong pressure from forest professionals, but also due to agrowing awareness of the adverse effects of forest destruction in the country. Thesedecrees and regulations normalised to a certain extent the utilisation of natural forestsand wildlife (Nhantumbo and Soto1999). In Zimbabwe, the concept of multiple uses offorests was introduced in managing reserved natural forests. Further, some permanentsample plots were established as early as 1935 to monitor the impact of fire andharvesting intensities as well as to yield information on forest productivity and standchanges (Forestry Commission 1997).
In all the four countries, this period marked the beginning of selective and non-sustainable harvesting of the natural forests, the introduction of industrial woodprocessing, and industrial plantations. The fact that corrective measures were effectedlater in the period as forest or environmental damage became clear is testimony tothe fact that harvesting methods were destructive.

173G. Kowero, A.S. Kaoneka, I. Nhantumbo, P. Gondo and C.B.L. Jumbe
Protection/ConservationThere was no formal policy on protecting or conserving the forest estate in practicallyany of these countries. Only legislation addressed this issue. For example, in 1965 thePortuguese government in Mozambique issued a forest regulation that provided for acategory of forests called conservation areas. These included national game parks,integrated national reserves, forest reserves, and other protected and fragile forestformations like dune or hill forests, watershed systems or water resources, and forestsfor military defense purposes (Nhantumbo and Soto 1999). The 1953 forest policy ofTanzania also provided for the protection of forest resources.
In Zimbabwe, there was a call for controlled exploitation of natural forests andsetting up of managed forest reserves as early as in 1910 (Judge 1993). The Forest Act of1948 targeted the protection of catchment areas and maintenance of vegetation coverin ecologically fragile areas. In Malawi the Forest Ordinances of 1911,1926,1936,1942and 1947 had provisions for the protection or conservation of natural forest resources.Initially, the primary objective of forest management in Malawi was to protect theecology through catchment area conservation. However, soon after World War II, the1942forest ordinance was revised to meet both ecological and economic objectives. Thisnecessitated the institutional reorganisation of the forestry sector into specialiseddepartments in the late 1950s (Kachule et al. 1999).
These regulations were largely applicable to the forest estate under governmentadministration. For example, in Tanzania the law effectively applied to about 30% of theforests that were gazetted as reserves, with the remaining 70% essentially under openaccess and without legal protection (Kowero 1990; Monela and Ole-Meiludie 1997). InMozambique, about 40% of the forest cover was classified by the 1965 forest regulationas “alienated forest areas” in which forests could be cleared after authorisation(Nhantumbo and Soto 1999). These areas were largely woodlands and were mainly openaccess areas, despite the authorization for-use clause in government documents.
To compound this was the unavailability of sufficient human resources, even forthe government forest reserves. Raumolin (1990) notes that German East Africa wastwice as large as Germany but had only five higher forest officers and fourteen middle-range officers, making the implementation of the forest conservation acts of 1908 and1909 ineffective. Nhira et al. (1998) note that forestry extension in Zimbabwe relied onthe goodwill of agricultural extension officers and their administrators, largely becauseforestry was very much under-funded. Further, Banks (1981) notes that forestry in Africanreserves was relegated to a minor role in the development process and was alsoinadequately funded. In Malawi there were very few trained forestry officers. For example,in 1950 there were 3 professional officers, 8 European foresters and 41 African rangers(Hailey 1956).
Much as there were efforts to protect or conserve considerable areas of forestsduring the colonial period, lack of resources for their effective management continuedto subject the forests to encroachment by increasing populations. Legislation in placewas mainly enforceable on gazetted forest reserves, leaving vast forest areas unprotectedand under open access. Further, the gazetting of forest reserves for conservation orprotective purposes denied local communities access to these resources. In fact, insome cases people were expelled from such protected areas, and this has in some casesbeen a source of conflicts with governments up to the present time. The gazettingeffectively disrupted resource tenure, in the sense that common property became stateor government property and therefore no longer accessible to local people.

174 FOREST POLICIES IN MALAWI, MOZAMBIQUE, TANZANIA AND ZIMBABWE
Shared Responsibility for Natural Forest ManagementThe extent to which the colonial governments involved other stakeholders in forestrydiffered from country to country. However, from the very early years of colonial rulethe major players in formal forestry in all the countries were the government and theprivate sector. The latter obtained concessions and licenses from the government toharvest, process, and export forest produce. The active involvement of local communitieswas in most cases encouraged only minimally, and it varied very much from country tocountry, as the following examples illustrate.
In Tanzania the forest policy of 1953 demanded that all sectors of the economyfrom the individual villager to the central government should collectively shoulder theresponsibility of preserving, developing, managing and rationally using forest re-sources. Apart from participating in fighting wildfires in the forest, there is no evidencethat the local communities received significant government encouragement in thedevelopment and management of natural forest resources.
In Zimbabwe the 1948 Forest Act, which is still in place today, provided for voluntaryself-regulation of forest resources in settler (European) areas, whereas forests incommunal areas (where the majority of the people lived and continue to live) werecontrolled and their use regulated. Such regulation offered different capacities forpeople to participate in forestry. The Land Apportionment Act of 1930 and the LandTenure Act of 1969 had natural resources management and control functions underchiefs and other traditional leaders (Gondo et al. 1999). However, it is doubtful thatthe government provided significant assistance, due to scarcity of forest extensionstaff, funding, and low priority accorded to forest resources in the socio-economicdevelopment of native areas.
In Malawi the 1926 forest ordinance provided for the establishment and protectionof village or community forests known as village forest areas. These were under thecontrol of village headmen. This effort received considerable government sup-portand by 1946,while the government forest reserves stood at 6866 km2, the villageforests covered 1054 km2, nearly the same as the area under government forestplantations (1099 km2). Further, training for management of village forest areas wasinitiated in 1926 (Kachule et al. 1999).
In Mozambique, the colonial government allowed free access to the resources bythe rural communities without payment of any royalties when the harvested producewas for their own consumption. However, the same government denied the generationof monetary benefits for the communities living within and around these naturalresources (Nhantumbo and Soto 1999).
It would appear that it was only in Malawi that the colonial government madeserious efforts to actively encourage natural forest management by local communities.In Tanzania and Zimbabwe legislation and policies related to the involvement of localcommunities in the governance of natural forest resources existed, but they remainedlargely on paper and without significant government support.
4. POST-INDEPENDENCE PERIODThis period saw the emergence of differences in both political and economic orientationsof these countries. Initially Tanzania, Mozambique and Zimbabwe had socialist policies,with Mozambique leaning more to Marxism. Tanzania had a homegrown policy called‘ujamaa’, which largely revolved around the way village life was conducted. Malawi

175G. Kowero, A.S. Kaoneka, I. Nhantumbo, P. Gondo and C.B.L. Jumbe
adopted a more capitalistic approach. These political leanings notwithstanding, all thefour countries had strongly centralised governments, with different degrees of privatesector involvement in production. Private sector growth was stifled in both Tanzaniaand Mozambique through nationalization policies. At independence Zimbabwe inheriteda more developed private sector. Having seen the failures of naionalisation in Tanzaniaand Mozambique, Zimbabwe left its private sector intact. These political and economicorientations largely influenced the development of the countries ’ forestry sectors.
It took considerable time for some of these countries to adjust their forest policiesand accompanying legislation to cater for post-independence needs. Tanzania continuedto operate with the 1953 policy and a 1958 Forest Ordinance (albeit with somemodifications) until 1998 when a new forest policy was adopted. Mozambique adoptedits first forest policy in 1998.Malawi put into place a new forest policy in 1964,twoyears after it became independent. Efforts to put into place a new forest policy inZimbabwe have been going on for a long time, and a draft forestry policy of 1990exists, but it has yet to get cabinet endorsement. According to Gwaze and Phiri (undateddraft) the Zimbabwean government is guided in forestry policy matters by the ForestAct of 1948 that was amended in 1982.
Apparently many other African countries also operated with colonial forestry policiesfor many years after independence. For example, Akapelwa (1996) reports that Zambiacontinued with a 1960 forest policy until 1991,and further that the 1991 policy wasformulated as a set of instructions to the Zambian forestry department. The policy didnot encourage significant participation of the private sector, local communities orNGOs in forestry. Bayoumi (1996) reports that Sudan operated with the colonial policyof 1943 up to 1986,although the country became independent in 1956.However, Namibiamoved fast: at independence in 1990 it did not have a forest policy, but had onedeveloped by1992 (Siyambango 1996). Likewise, Kenya produced its first post-independence forest policy in1968, five years after attaining independence (Kojwang1996).
The post-independence period in most Sub-Saharan African countries ischaracterised by two main economic regimes. There is a period when these countriescame under intense pressure from international financial institutions like the WorldBank and the International Monetary Fund to make significant economic reforms thataffected many aspects of life and economic activity. This period is referred to as thestructural adjustment programme (SAP) period. Prior to this period the economies ofthese countries operated differently.
4.1 Pre-Structural Adjustment PeriodThis period was initially characterised by economies that were centrally planned,with state ownership and/or control of most means of production and distribution.The role of market forces in allocating resources was very constrained. With theexception of Malawi, the countries had socialist oriented policies. Much as colonialforest policies and regulations remained in force for many post-independence years,macroeconomic and political policies gradually shaped events in forestry. For example,in Mozambique the ruling political party in 1977,1983 and 1987 issued importantstatements that virtually constituted the forest policy goals for the country. Thenationalisation of wood processing industries in Zambia between 1968 and 1990,inMozambique in 1977,and in Tanzania in the late 1960s to early 1970s were due to

176 FOREST POLICIES IN MALAWI, MOZAMBIQUE, TANZANIA AND ZIMBABWE
political policies not foreseen in the forestry policies and directives of these countries.Yet these events had very decisive impacts on the development of forestry in thesecountries. For example, some of these actions scared away private investment inforestry, constrained the growth of employment opportunities in the sector, andcurtailed the availability of government funding to the sector as governments wereshoring up loss-making parastatal organisations. Further, political policies, whichencouraged massive movement of people into communal villages in Tanzania, intosettlement and communal areas in Zimbabwe, and into refugee camps in Mozambiqueand Malawi precipitated varying degrees of deforestation and forest degradation inthese countries. In Mozambique the government abolished customary authority afterindependence (Virtanen 1999). This might have reduced the role of traditional orlocal structures in regulating natural forest management and use.
Even in Malawi, where a forestry policy was put into place in 1964 (afterindependence), Sakanda (1996) notes that it did not provide guidance on the directionof the sector in that it did not define the pressing issues in the forestry sector andstrategies to address them. In fact there was a deliberate effort by the Malawigovernment to expand estate agriculture to the detriment of the forest cover.
The early years of independence brought major changes as national governmentstried to bring immediate positive changes in the lives of their people. In some casesthis resulted in political ambitions overriding economic logic, political policies replacingsectoral policies, and sectoral policies from other sectors having preference overforestry sector policies in their own domain. The results were varying levels ofencroachment into forest areas as well as constrained growth of the sector. Further,forestry policies were not revised immediately after political independence to takeinto account the peace-time socio-economic orientations of the national governments.This was partly due to the fact that the economies of these countries were largely non-monetised at the time of colonisation. As time passed the pace of monetisationincreased, and this pace was much faster for other sectors, such as agriculture, whichwere mainstreamed in government planning. Forests remained insulated from themonetised economy for far longer and therefore were marginalised not only in economicterms, but also in terms of policy attention. The lag in commercialisation of theforestry sector partly explains the apparent supremacy of political and othermacroeconomic policies over written national forestry policies.
Also, during this period the objectives of forestry policies were mainly determinedby what national governments and the political machinery considered appropriate,and were rarely based on what people wanted as reflected in the market place. Primaryforestry production was wasteful as governments determined prices of such produceadministratively and not on the basis of market forces. Secondary forestry productionwas more market oriented, although when governments were in charge, this led togross inefficiencies, massive financial losses and bankruptcies. This gave way toprivatisation of wood processing during the SAP period.
4.2 Structural adjustment periodThis period witnessed major changes both on the political and economic fronts. Theimplementation of economic reforms, mostly known as structural adjustmentprogrammes (SAPs) and backed by foreign financial institutions, started in Malawi,Tanzania, Mozambique and Zimbabwe in 1980,1986,1987and 1991 respectively. These

177G. Kowero, A.S. Kaoneka, I. Nhantumbo, P. Gondo and C.B.L. Jumbe
reforms place emphasis on a number of things, including increasing private sectorinvolvement in the national economy, trade liberalisation, and reduction in fiscal deficit.
These policies demanded major re-orientations in the environment in whicheconomic activities operated. The countries gradually shifted from the pre-SAP centrallyplanned economies to decentralized economies that were increasingly becoming marketoriented.
On the political front, this period also witnessed significant achievements indemocratisation in these countries, with increased emphasis on people ’s participationin decision-making. This process has precipitated, in some countries, significantdiversion of resources necessary for economic development into servicing the politicalmachinery serving the democratisation process.
In Malawi, it is reported that multi-party political systems contributed significantlyto massive deforestation in some areas. Firstly, in their political campaigns, somepoliticians promised land from the protected forest areas if voted into power. Whenpeople voted for pluralistic government, most of the protected forests were heavilyencroached. Secondly, the “freedoms ” granted by the pluralistic system of governmenteffectively silenced some forestry legislation, e.g. one that provided for strict controlover the use of products from customary land. Firewood and charcoal obtained fromsuch land are now sold openly without fear, a practice that was previously illegal(Jumbe et al. 1999).
The SAPs and democratisation have far-reaching consequences for forestry. Forexample, the SAPs discourage government monopoly on forestry and promote privatesector development in forestry, including taking over some government responsibilities.They are also blamed for reduced government spending on the sector. Democratisationencourages local people to effectively participate in decisions over these resources,including their ownership and management. These and other things implicit in suchpolitical and economic orientations demanded profound changes in the forestry policiesand legislation inherited from the colonial period and the pre-SAP era. However, thesecountries continued for along time to operate in the SAP period with pre-SAP forestrypolicies and legislation. Tanzania initiated some amendments to the policy documentin1986, but it was not until 1998 that a new policy emerged. Malawi had a revisedpolicy in 1996 and a revised forestry act in 1997.The revision process in Mozambiquetook six years, yielding the first national forestry policy in 1997.Zimbabwe still continuesto operate on the basis of an amended1948 Forest Act. A 1990 draft forest policy hasyet to obtain cabinet approval.
The revision of the forestry policies and legislation appears to be not so much aresult of the political and SAP policies; rather it seems to reflect developments inforestry worldwide. A number of planning frameworks emerged even before some ofthese countries started implementing SAPs and when pressure for democracy was notso intense. Such frameworks arose from various demands on the sector, including theimplementation of international agreements and conventions related to forestry, suchas UNCED, Agenda 21,Chapter 11 and Forest Principles, Convention on BiologicalDiversity, Convention on Climate Change, Convention to Combat Desertification, andConvention on International Trade in Endangered Species of wild fauna and flora (CITES).Moreover, some environmental groups exerted pressure on governments to changethe manner with which forestry business was conducted. Pressure to abandon loggingin some mountainous areas of Tanzania is one such example.

178 FOREST POLICIES IN MALAWI, MOZAMBIQUE, TANZANIA AND ZIMBABWE
The planning frameworks that evolved in the region included National ForestryAction Plans, Forest Master Plans, Forest Sector Policy Reviews, and several others.These created conditions for revising national forestry policies and legislation or puttingthese into place where they did not exist before. The national forestry sectors thereforeresponded primarily to these international forestry orientations and less so to SAPsand democratisation pressures. The fact that the two sets of forces or influenceswere in place at the same time made it possible for the sector to make provisions foraccommodating both the political requirements of democratisation and the economicdemands of the SAPs.
This was in addition to accommodating other requirements implicit in a numberof international agreements and conventions, and those of multiple local stakeholders.This process created, within the four countries, a state of confusion characterized byconflicting sector policies and poor coordination (Gondo 1999). Further, the continuingemergence of new issues that evolve into international agreements and conventionshas precipitated a continued state of planning within the forestry sector that seeks toaccommodate new and emerging trends in forestry and related sectors. This hasconsiderably strained national institutional capacities and financial resources, as wellas undermined long term planning. The latter is of serious concern for primary forestryproduction.
The major features of the present forestry policies that emerged from this processare discussed below.
4.2.1 Decentralisation and tenurial arrangements for managing forestresources
Even before the above forces acted on forestry, several central governments werealready on the path of decentralising the administration of forest resources throughdelegation of authority and responsibilities to local governments. The local governmentshad their own policies and priorities, which at times conflicted with central government
Loading Brachystegia logs on lorry for the mines in Zambia (Photo: G.Kowero)

179G. Kowero, A.S. Kaoneka, I. Nhantumbo, P. Gondo and C.B.L. Jumbe
policies on forestry. Further, the administrative structures for central and local governmentforestry were in some countries in different ministries and without effectivecoordination. This decentralisation was largely a reorganisation of forestry administrationwithin the government machinery, and it rarely extended to involving stakeholdersoutside government.
However, present day forestry policies give considerable emphasis to thedecentralisation of forest ownership and management to sectors outside government.The process is now being pushed forward to effectively involve local communities andthe private sector. The policies include strategy statements, of varying clarity andemphasis across countries, on how governments intend to actively promote this. Afew examples are given below as illustration. The forestry policy of Malawi emphasises,among other things, the need for:
• “Establishing appropriate incentives that will promote community basedconservation and a sustainable utilization of the forestry resources as a meansof alleviating poverty, including on-farm trees and fostering the growing of treesby all sections of the community to achieve sustainable efficiency of wood andforest derived products;
• Establishing a framework for community ownership and management of customaryland forest resources on the basis of management plans agreed with government,and provides for community participation in co-management of forest reserves” (GoM 1996).
The corresponding statement from the forest policy of Tanzania with respect toinvolving the private sector and local communities in managing central and localgovernment forest resources states:” To enable participation of all stakeholders inforest management and conservation, joint management agreements, with appropriateuser rights and benefits will be established. The agreements will be between thecentral government, specialised executive agencies, private sector or localgovernments, as appropriate in each case, and organised local communities or otherorganisations of people living adjacent to the forest ” (URT 1998). The policy thereforeprovides for establishment, ownership and management of central and local governmentforest reserves, forests on public lands (non-reserved forestland), and private andcommunity forests. On community forestry the policy states: “Farmers will be entitledto have owner rights of indigenous species including reserved species and not onlyplanted exotic ones. Village forest reserves will be managed by the village governmentsor other entities designated by village governments for this purpose, such as NGOs,user groups, associations,…” (ibid.).
In Mozambique the participation of rural communities in integrated managementof natural forests and fire is seen as an important social policy objective. It representsa departure from an earlier emphasis on participatory reforestation and afforestationprogrammes. In Zimbabwe, a policy review in 1991 made a number of recommendationson community managed forests, some of which encourage sustainable managementand utilisation of indigenous woodlands by local communities (McNamara 1993).
In all these countries there are directives giving ownership, authority andmanagement of natural forest resources and trees to local communities. However, itis only in Malawi that such a practice received much support during the colonial period,died later, and emerged again recently. Governments are also clearly encouragingpartnerships with other stakeholders in natural forest management. In the reviewed

180 FOREST POLICIES IN MALAWI, MOZAMBIQUE, TANZANIA AND ZIMBABWE
policies the roles and responsibilities of the main stakeholders in policy implementationare very clear. The main stakeholders identified include government, local communities,the private sector, NGOs, and the international community. The main formalstakeholders during the colonial era were government and the private sector. Thepresent forestry policies are therefore more inclusive of both national and internationalinterests.
However, in all these countries central governments and local communities willcontinue, for the foreseeable future, to be the main stakeholders in forestry.Governments shall continue to be custodians of forestry policy; consequently, they willbe interested in seeing how the whole sector develops. Further, governments, NGOs,and the international community shall continue to safeguard the sustained availabilityof public goods and services from the sector. The profit-oriented private sector isunlikely to invest in these areas in the near future. The concern of the private sectorshould be how to conduct its operation so that the availability of these public goodsand services is not jeopardised. However, the major areas for private sectorparticipation will continue to be in plantation forestry, industrial wood processing, andtrade in forest products. Private sector and local community investment in researchand training will continue to be minimal, leaving these areas largely in the domain ofgovernments and the international community. NGOs and governments will continueto feature strongly in extension. Therefore, each of these stakeholders has a particularniche in forestry. The challenge is how to coordinate all these efforts for maximumimpact.
4.2.2 Enabling environment for policy implementationThe policies contain statements on how an enabling environment for implementationshould be realised. Some of the considerations include enactment of laws/regulationswhere necessary, provision of extension, financial and information incentives,partnership in management and conferring of ownership and other rights on trees andforests.
The bulk of the strategies to be employed aim to “encourage ” and “promote ”certain practices and initiatives. However, compared to past policies many present-day strategies are much more specific on how to go about promoting and encouraging.For example, the Tanzanian forest policy states:
• “An enabling environment for private sector involvement in forestry will becreated. This involves clear ownership and tenure rights, information on forestresources and raw material, financial incentives and credit facilities, improvedaccess to markets and marketing of products as well as effective training andextension.
• The legal framework for promotion of private and community-based ownershipof forests and trees will be established ” (URT 1998).
The Malawi forest policy has the following example strategies:• “Establish a Fund to support local community forestry activities.• Prepare and regularly update management plans for all timber plantations and
key fuelwood/pole plantations, outline management plans for key forest reservesand model plans for representative Village Forest Areas (VFAs).
• Ensure that the VNRMCs (Village Natural Resources Management Committees)are entrusted with the responsibility to collect funds from sale of produce fromcustomary land ” (GoM 1996).
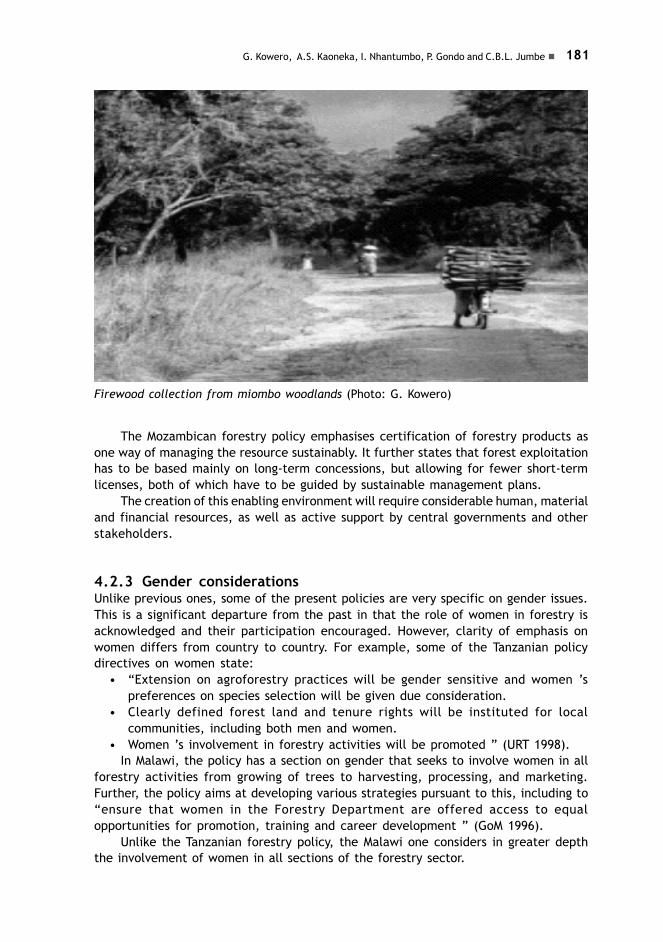
181G. Kowero, A.S. Kaoneka, I. Nhantumbo, P. Gondo and C.B.L. Jumbe
The Mozambican forestry policy emphasises certification of forestry products asone way of managing the resource sustainably. It further states that forest exploitationhas to be based mainly on long-term concessions, but allowing for fewer short-termlicenses, both of which have to be guided by sustainable management plans.
The creation of this enabling environment will require considerable human, materialand financial resources, as well as active support by central governments and otherstakeholders.
4.2.3 Gender considerationsUnlike previous ones, some of the present policies are very specific on gender issues.This is a significant departure from the past in that the role of women in forestry isacknowledged and their participation encouraged. However, clarity of emphasis onwomen differs from country to country. For example, some of the Tanzanian policydirectives on women state:
• “Extension on agroforestry practices will be gender sensitive and women ’spreferences on species selection will be given due consideration.
• Clearly defined forest land and tenure rights will be instituted for localcommunities, including both men and women.
• Women ’s involvement in forestry activities will be promoted ” (URT 1998).In Malawi, the policy has a section on gender that seeks to involve women in all
forestry activities from growing of trees to harvesting, processing, and marketing.Further, the policy aims at developing various strategies pursuant to this, including to“ensure that women in the Forestry Department are offered access to equalopportunities for promotion, training and career development ” (GoM 1996).
Unlike the Tanzanian forestry policy, the Malawi one considers in greater depththe involvement of women in all sections of the forestry sector.
Firewood collection from miombo woodlands (Photo: G. Kowero)

182 FOREST POLICIES IN MALAWI, MOZAMBIQUE, TANZANIA AND ZIMBABWE
4.2.4 Regional and global concernsNational governments honour various bilateral and international agreements andconventions to which they are signatories. Although no specific mention is made ofmany of these conventions and agreements in the policy objectives and strategies,the thrust of the policies largely conforms to the requirements of these agreements.An example is the Tanzanian forest policy statement that “Internal trade and exportsof forest produce, excluding those regulated by international agreements of whichTanzania is a party, will be promoted ” (URT 1998).
According to Gondo (1999), the focus of these conventions and internationalagreements is on new and additional financial resources, technology transfer, loss ofbiological diversity, poverty alleviation, and provision of frameworks for internationalcooperation. The countries in the southern African region have had varied experienceswith these conventions and agreements. There have been poor in-country consultationson the conventions. Further, the countries have small delegations to and inconsistentrepresentation in international dialogues on the conventions. As a result, the regionhas exerted little influence on the outcomes of these dialogues. Also, the implementationof the conventions requires significant human and financial resources, largely be-yond the means of these countries. Some conventions, whilst recognising thesovereignty of states, violate this principle on the grounds of global significance andweight given to consumer countries (ibid.).
Despite these shortcomings, the countries in the region have made notable progressin implementing these conventions and international agreements. For example, theConvention on Biological Diversity (CBD) can be credited with the development of bestpractices and the dissemination of lessons for dealing with the global problem of alienspecies that threaten biological diversity in Kenya, Malawi and South Africa.Furthermore, important projects in the region are being implemented under theumbrella of CBD, including the Lake Malawi/Nyasa Biodiversity Conservation and theSADC Regional Biodiversity Programme. The Convention on International Trade inEndangered Species (CITES) can be credited with the development of strong institutionsfor implementing its mandate, improving legislation and enforcement mechanisms onsome aspects of the convention, promoting strong institutional linkages between lawenforcement and management institutions, and improving cooperation betweencountries with common resources. The International Tropical Timber Agreement (ITTA)is not subscribed to by many countries in the region, but it has benefited the region interms of assistance in developing criteria, indicators and other guidelines for sustainableforest management, as well as through technical support and capacity building (Gondo1999).
4.2.5 Emerging/new areas and issuesCurrent policies address new or emerging areas like eco-tourism, environmental impactassessment, transparency in forestry dealings, and criteria and indicators for sustainableforest management. They also give more emphasis to areas previously treated lightly,such as forestry extension, agroforestry, research and training, inter-sectoral linkages,and broader financing mechanisms for the sector. With respect to the latter, for example,some strategies outlined in the Malawi forest policy aim to:
• “Reduce dependence on government budget by maximising use of existinginternational arrangements that provide financial support to national forestryactivities of global significance.

183G. Kowero, A.S. Kaoneka, I. Nhantumbo, P. Gondo and C.B.L. Jumbe
• Facilitate the institution of arrangements that enable revenues from economicforest-dependent activities outside forestry, such as water supply andhydroelectric power generation to be used to enhance the protective and in-direct economic functions of forests ” (GoM 1996).
With respect to ecotourism, the Tanzanian forest policy sates “… Private sectorand community involvement in developing eco-tourism products and services such aslodges, trails and guided tours, will be promoted. Linkages and co-operation withother sectors involved in wildlife based tourism development will be promoted.Establishment of an appropriate legal framework to regulate ecotourism in forestareas will be developed in the context of the tourism and other appropriate legislation” (URT 1998).
There are many other examples illustrating the shift in focus and emphasis ofcurrent policies, together with the clarity of policy objectives and correspondingstrategies on many issues that never featured in or were treated lightly by previouspolicies. In this manner the current policies not only cater fora significantly greaternumber of stakeholders, but also take on many new issues that in the past did notconstitute the portfolio of the forestry sector.
5. CONCLUSIONSIn both the lusophone and the anglophone countries discussed in this paper, the followinggeneralities emerge:
(i)There have always been intentions or objectives for managing and using forestresources in many local communities, as well as recognised and respected authorityand means for operationalising such intentions.
(ii) The forestry sector has, in many cases, lagged behind other sectors in revisingits policies and legislation to respond to many socio-economic and politicaldevelopments. Policies driving such developments have for quite some time takenprecedence over forestry policies with far-reaching consequences on forestry. This isin agreement with the initial hypothesis.
(iii) Recent policy revisions appear to be largely attributed to global shifts inenvironmental thinking and in the way forestry business is conducted, and less so inresponse to internal or national political and socio-economic policies. Again this partlyalludes to the initial hypothesis.
(iv) Current policies demonstrate a very clear shift in emphasis from previousones.
Significant shifts are from:• emphasis on management of plantations of exotic tree species to one on better
management of natural forests;• centralised forest ownership and management to decentralised, devolved and
joint management and ownership;• forestry practice revolving around tree and forest management to forestry as
rural development or as integrated land management;• a heavily service-oriented forestry practice to sustainable profitable forestry;• heavy emphasis on exports of industrial roundwood to increased emphasis on
meeting a myriad of domestic socio-economic and ecological needs;

184 FOREST POLICIES IN MALAWI, MOZAMBIQUE, TANZANIA AND ZIMBABWE
• forestry as largely a male activity to one that effectively incorporates women aspartners;
• a very localised or national focus to a much broader one that even considerssustained production of international public goods;
• policies that were out of tune with political and socio-economic realities of thetime to ones that are in tandem with prevailing circumstances;
• intra-sector oriented policies to ones involving or embracing many relevant sectorsof the economy;
• a diffused or unclear environment for policy implementation to an enabling onethat is very clear on many strategies to employ. The strategies include financialincentives, legal provisions, empowerment, rights, roles and responsibilitiesfor major stakeholders.
(v) Many forestry sectors have and continue to accommodate various internationalagreements and conventions in their policies and plans. Donors and foreign lendinginstitutions continue to support the sector, but they have different approaches to forestry.These developments have precipitated a situation whereby some forestry departments/services have been caught in a loop of continued planning to suit these demands. Theconsequences include a strain on both human and other resources necessary forimplementing the forestry plans, continued confusion in the sector brought about bythese demands, and the loss of a long-term planning horizon in forestry.
The successful implementation of these conventions and other internationalagreements alongside national forestry plans requires that the following be addressed:
• harmonisation of relevant policies and legislation;• development of an institutional framework with clearly defined responsibilities,
procedures and accountability;• development of clear mechanisms for consultation and stakeholder participation;• development and mobilisation of qualified human resources;• development and mobilisation of financial resources;• establishment of systems for information generation and dissemination.
ENDNOTES 1. This paper also appears as: Kowero, G., A.R.S. Kaoneka, I. Nhantumbo, P. Gondo, C.B.L.Jumbe. 2001. Forest policies in Malawi, Mozambique, Tanzania and Zimbabwe. In: M. Palo, J. Uusivuoriand G. Mery (Eds.) World Forests, Markets and Policies. World Forests Volume III, Kluwer AcademicPublishers, Dordrecht/London/Boston. pp. 311-326. It is reproduced with kind permission of KluwerAcademic Publishers.
REFERENCESAkapelwa, J.S. 1996 National report on the forestry policy of Zambia. In FAO: Forestry
policies of selected countries in Africa. FAO Forestry Paper 132. Food and AgricultureOrganisation of the United Nations, Rome.Pp.527–546.
Banks, P.F. 1981 The planting of woodlots for the fuelwood requirements of Tribal TrustLand populations in Zimbabwe: a review of past and future development. SouthAfrican Forestry Journal 117:13–15.
Bayoumi, A.A.M.S. 1996 Sudan national report on forestry policy. In FAO: Forestry policiesof selected countries in Africa FAO Forestry Paper 132.Food and Agriculture Organisationof the United Nations, Rome. Pp.465–481.

185G. Kowero, A.S. Kaoneka, I. Nhantumbo, P. Gondo and C.B.L. Jumbe
Chimedza, R. 1991 Energy consumption patterns for low-income rural households. ProjectWorking Document, ES-MAP, World Bank, Washington, D.C.
Chenje, M., Sola, L. and Paleczny, D. (eds.) 1998 The state of Zimbabwe’s environment1998. Government of the Republic of Zimbabwe, Ministry of Mines, Environmentand Tourism, Harare. 509p.
du Toit, R.F., Campbell, B.M., Haney, R.A. and Dore, D. 1984 Wood usage and tree plantingin Zimbabwe’s communal lands. Forestry Commission of Zimbabwe and the WorldBank, Harare.
Food and Agriculture Organisation of the United Nations (FAO) 1993 Editorial: Forest policyand legislation. Unasylva 175: 2.
Forestry Commission 1997 Vegetation resources information system: Project Report,Forestry Commission of Zimbabwe, Research and Development Division, Harare.
Gondo, P.C. 1999 A review of experiences with international conventions affecting forestryin Eastern and Southern Africa. A paper presented at the Eastern and Southern AfricaRegional Workshop of the Canada Costa Rica Initiative on International Arrangementsand Mechanisms, 6–10 September 1999, Mutare, Zimbabwe.
Gondo, P.C., Chipika, J. and Mabugu, M. 1999 Sectoral and extra-sectoral policies andtheir impact on management and utilisation of miombo woodlands in Zimbabwe.Draft report for policy modelling workshop held in 18–22 January, Mutare, Zimbabwe.
Government of Malawi (GoM) 1996 National forest policy of Malawi. Ministry of NaturalResources, Government of Malawi, Lilongwe. 70p.
Goumandakoye, M. 1996 Summary of national reports on African forest policy. In: Foodand Agriculture Organisation of the United Nations (FAO). Forestry policies of selectedcountries in Africa, 43–58. FAO Forestry Paper 132. FAO, Rome.
Grundy, I. 1990 The potential for management of the indigenous woodland in communalfarming areas of Zimbabwe, with reference to regeneration of Brachystegiaspiciformis and Julbernadia globiflora. MSc. Thesis, University of Zimbabwe, Harare.
Gwaze, D.P. and Phiri, C. Undated. Revision of the national forestry policy. ForestryCommission of Zimbabwe, Harare, p. 3.
Hailey, L. 1957 An Africa survey. A study of problems in Africa South of Sahara. OxfordUniversity Press.
Judge, J.G. 1993 Early forest management in Zimbabwe. In: Pierce, G.D. and Gumbo,D.J. (eds.) The ecology and management of indigenous forests in Southern Africa:Proceedings of an International Symposium. Forestry Commission of Zimbabwe,Harare.
Jumbe, C.B.L., Kachule, R.N.and Mataya, C.S. 1999 The impact of sectoral, intersectoraland macroeconomic policies on the management and utilisation of miombo woodlandsin Malawi: Case studies of M’deka, Dzalanyama and Chimaliro miombo woodlands inBlantyre, Lilongwe and Kasungu Districts: A report on the focus group discussion withcommunities and village leaders. Agricultural Policy Research Unit, University ofMalawi, Lilongwe.
Kachule, R.N., Jumbe, C.B.L. and Mataya, C.S. 1999 The impact of sectoral policies onthe management of miombo woodlands in Malawi. Draft Report. Agricultural PolicyResearch Unit, University of Malawi, Lilongwe.
Kaoneka, A.R.S., Monela G.C., Kajembe, G.C. and Turuka, F.M. 1999 A review of thenational forest policy of Tanzania. Draft paper. 35p.
Kojwang, H.O. 1996 National report on the forestry policy of Kenya. In: Food and AgricultureOrganisation of the United Nations (FAO): Forestry Policies of Selected Countries inAfrica, 303–319. FAO Forestry Paper 132. FAO, Rome.

186 FOREST POLICIES IN MALAWI, MOZAMBIQUE, TANZANIA AND ZIMBABWE
Kowero, G.S. 1990 Management and utilisation of forest estates in Tanzania: Some policyissues. Journal of World Forest Resource Management 5: 15–27.
Matose, F. 1992 Villagers as woodland managers. In: Pierce, G.D. and Shaw, P. (eds.)Forestry research in Zimbabwe. Forestry Commission of Zimbabwe, Harare.
McNamara, K. 1993 Key policy issues. In: Bradley, P.N. and McNamara, K. (eds.) Livingwith trees: Policies for forestry management in Zimbabwe. The World Bank,Washington, DC, p.1–9.
Misana, S., Mung’ong’o, C. and Mukamuri, B. 1996 Miombo woodlands in the wider context:Macro-economic and intersectoral influences. In: B.M.Campbell (ed.), The miomboin transition: Woodlands and welfare in Africa CIFOR, Bogor. Pp.73 –99.
Ministry of Lands, Housing and Urban Development (MLHUD) 1995 National land policy.Ministry of Lands, Housing and Urban Development, Dar es Salaam.
Monela, G.C. and Ole-Meiludie, R.E.L. 1997 Review of forest policies in SADC region.Consultancy report. Sokoine University of Agriculture, Department of ForestEconomics, Morogoro.
Moyo, S. 1995 The land question in Zimbabwe. Sapes Trust, Harare.Mukamuri, B. 1987 Karanga religion and environmental management. BA Thesis, University
of Zimbabwe, Harare.Negrao, J. 1995 One hundred years of African rural family economy: The Zambezi delta in
retrospective analysis. Department of Economic History, School of Economics andManagement, University of Lund, Lund.
Nhantumbo, I. and Soto, S. 1999 Review of land, forestry and wildlife policies. DraftReport. Eduardo Mondlane University, Maputo, Mozambique.
Nhira, C., Baker, S., Gondo, P., Mangono, J.J. and Marunda, C. 1998 Contesting inequalityin access to forests. Policy that Works for Forests and People. Series No. 5. ZimbabweCentre for Applied Social Sciences and Forestry Commission, Harare and InternationalInstitute for Environment and Development, London. 130p.
Phiri, C.D. 1991 Agricultural policy in Malawi, 1971–1987. Ph.D. Dissertation, CambridgeUniversity.
Raumolin, J. 1990 The problem of forest-based development as illustrated by thedevelopment discussion, 1850–1918. Research reports 4/1990. Department of SocialPolicy, University of Helsinki, Helsinki. 206p.
Sakanda, G.P. 1996 National report on the forestry policy in Malawi. In: Food and AgricultureOrganisation of the United Nations (FAO). Forestry policies of selected countries inAfrica, 321–342. FAO Forestry Paper 132. FAO, Rome.
Siyambango, B.S. 1996 National report on the forestry policy of the Republic of Namibia.In: Food and Agriculture Organisation of the United Nations (FAO). Forestry Policiesof Selected Countries in Africa, 402–425. FAO Forestry Paper 132. FAO, Rome.
United Republic of Tanzania (URT) 1998 National forest policy. Ministry of Natural Resourcesand Tourism, United Republic of Tanzania, Dar es Salaam. 59p.
Virtanen, P. 1999 Community in context: Chiefs and councils in Mozambique. Paper toSeminar and Workshop on Governance, Property Rights and Rules for Woodland andWildlife Management in Southern Africa. Harare, Zimbabwe, 23–24 November 1999.
Whitlow, J.R. 1988 Land Degradation in Zimbabwe: A Geographic Study. Natural ResourcesBoard, Harare.

12.Policies and gender relationships androles in the miombo woodland regionof Southern Africa
M. Chitiga and N. Nemarundwe
ABSTRACTGovernment policies may have indirect or direct effects on the environment as well ason various natural resource users. These effects may be different for men and womengiven that these two gender groups are essentially involved in different activities andare found in different proportions in the rural areas where the majority of the populationdepend on miombo woodlands for their livelihoods. This paper uses Malawi, Mozambique,Tanzania and Zimbabwe as case studies to bring out the linkages that exist betweenpolicies and gender in the management of miombo woodlands. The analysis of thepaper brings to light that some policies have differential impact on men and womenand that because women, as opposed to men, are ill-equipped to benefit from mostpolicies, they tend to be left out of the benefits from policies. This may mean thatwomen increase their reliance on forests as a way to augment their incomes. This mayresult in the mismanagement of forests. The paper further notes that women areconstrained from effectively making decisions on issues of access to and control overnatural resources. This is mainly because of the way women are viewed by society andbecause of the low positions they occupy in different institutions. This treatment ofwomen means that they may not fully participate in NRM programmes whose aim is todecentralize control and management of natural resources to rural communities. As aresult, failure to consider this gender difference may mean that miombo woodlandstogether with other natural resources may continue to be mismanaged.
Key words: gender, policies, miombo woodlands, decentralisation and institutions.

188 POLICIES AND GENDER RELATIONSHIPS AND ROLES IN THE MIOMBO WOODLAND REGION
1. INTRODUCTIONMany government policies do not incorporate any environmental objectives whendesigned but at implementation they may have unintended direct and /or indirecteffects on the environment. Such effects may have different impacts on differentpeople depending on, among other things, their gender. The 1995 World Summit ondevelopment called for the provision to women of equal access to productive resourcesin addition to strengthening their capacities to control resources in their own right.This call was made partly due to the realization that the roles of policies and institutionsin determining people’s choices and lives may have significant differences betweenmen and women. In relation to forestry management, policy and institutions affectpeople differently, for example according to how the following questions are answered:
• Do different groups value resources differently?• What are the roles and responsibilities of the different groups regarding forest
management?• Who controls access to resources and who makes decisions about them?• Who benefits from each activity or enterprise and who bears any associated
costs?• How do relationships and roles influence the decision making of the group regarding
resources?
If the reactions of males and females are different, we can expect that the answersto the questions above depend on, among other things, gender.
Since the colonial period there has been a wide range of policies and programmesthat have been implemented and which have affected households and their use offorest products. It may be misleading to evaluate the impact of policies on a country’speople under the assumption that they are gender neutral.
The last two decades have witnessed a “paradigm shift” in conservation and naturalresource management (NRM) away from costly state-centered control towards approachesin which local people play a much more active role (Shackleton et al. 2001; Kajembeet al. 2001). Coinciding with the mainstreaming of participatory approaches indevelopment theory and practice, there has been a policy shift to advocate that localresource users and their organizations play a much more active role in the protectionand management of land and other natural resources (Shackleton and Campbell 2001).Concomitant and complementary to this was the recognition that state control has beenlargely unsuccessful, costly and financially unsustainable requiring a new decentralizedapproach to local level resource management. These reforms purportedly aim to increaseresource user participation in NRM decisions and benefits through the transfer ofmanagement authority to local level organizations. Studies that have been done to testthe degree of the power shift and decision making to the communities (for example,Goebel 1998; Meinzen-Dick and Zwarteveen 2001, Nabane 1997) show that such powerand decision making has generally shifted to men and rarely to women.
The women and environment literature highlights that women have stronger linkswith the environment than men, yet, despite their strong links, women do not controlland and related natural resources such as forests (Shiva 1988). Allocation, occupationand use of communal lands is generally done through government selected bodies suchas Rural District Councils in Zimbabwe, which grant occupation according to customarylaw where an adult married man is allocated land for use by him and his family. Thus,women only have access to land and related natural resources through their spouses or

189M. Chitiga and N.Nemarundwe
male relatives (Chipika et al. 1998). Even for Malawi where some areas have matrilinealsystems, Kachule et al. (1999) report that, overall, women have limited access to andcontrol over productive assets and social services. Cromwell (1992) reports that female-headed households in Malawi are clustered on the smallest holdings of land and theytend to be the ones who cannot meet their food needs. This is despite the fact thatthey have a central role to play in various sectors of the economy including agriculture.Thus women are alienated from controlling land and other natural resources becausetheir access is secondary while that of men is primary, with only a few exceptions. Thismay have an impact on the way men and women manage natural resources in communalareas.
In Africa more has been written on women and agriculture than on women andforestry. However, of late, the contribution of women and men as distinct social groupsin the forestry sector is increasingly being recognized (Nyoni 1989). The role of womenhas received special attention because more women than men collect and use a varietyof forest products (Fortmann and Bruce 1993; Fortmann and Nabane 1992). Women aremore heavily involved and dependent on woodland products than men. Fortmann andBruce (1993) observe that there is often a clear division of the use of trees and treeproducts according to gender. Fortmann and Nabane (1992) argue that women have themajor (often, sole) responsibility for providing the household with tree products suchas fuelwood, fodder and food. As a result, both they and their households suffer whenthey lose access to the trees that provide these products. Therefore failure to considergender is especially distorting in Africa where women and men in the same householdmay use natural resources in separate production systems and with different strategies.
This paper looks at four southern African countries, namely, Malawi, Mozambique,Tanzania, and Zimbabwe to explore whether there are any gender1 related impacts ofpolicies and programmes related to forestry. It examines three kinds of policies andprogrammes namely,
• Macro-economic policies,• Sectoral policies and• Decentralisation policies.
The subject matter of this paper is quite complex. Not only is there no consensusbut there is also little and scattered knowledge on the impacts of policies on theenvironment including forests in the southern African region. There is also little knownabout the differences or similarities in the impacts of policies and institutions onmanagement of miombo woodland along gender lines. Thus, it is important to emphasizethat the paper aims to examine the potential linkages that exist and to highlight therelevance of gender considerations in forest management.
The rest of the paper is arranged as follows: section two gives a brief backgroundof the study countries. This section discusses the role and situation of women as opposedto that of men in addition to a brief economic background of the countries. In sectionthree the paper discusses possible impacts of macroeconomic and sectoral policies ongender in the management of miombo woodlands. In section four the discussion is onthe impact of decentralisation policies and programmes on gender and how this mightaffect the management of woodlands. Section five summarizes the main ideas raisedin the paper.

190 POLICIES AND GENDER RELATIONSHIPS AND ROLES IN THE MIOMBO WOODLAND REGION
Table1. Miombo ecoregion proportion and population in the countries under study (1997)
Country Ecoregion as percent Ecoregion population asof total country area percent of country population
Malawi 75 51.7
Mozambique 80 47.8
Tanzania 48 30.6
Zimbabwe 90 57.5
Source: Byers (2001).
2. BACKGROUND TO THE STUDY COUNTRIES
2.1 The roles of males and females in rural householdsIn Malawi, Mozambique, Tanzania and Zimbabwe, the majority of the population livesin rural areas. Women make up a larger proportion of the rural population and rural poorthan men. In Malawi 52% of the population are women, 93% of whom are in rural areas.Sixty-five percent of Zimbabweans live in communal areas, and of these, 85% arewomen. More than half the population of Mozambique is made up of women (51.4%)and 80% of these live in rural areas. In Tanzania 68% of the population lives in ruralareas, of which more than half are women (Byers 2001). In all four countries, there isempirical evidence that men and women in rural areas are essentially engaged in differentactivities and have different responsibilities. For instance, in Malawi, males are usuallypreoccupied with non-farm activities such as fishing, trading, casual work and ownbusinesses as well as socializing. Women are concerned with taking care of the familyand house including fuelwood gathering (Carr 1991). Women in Zimbabwe contributeabout 70% of the agricultural labor force yet they very rarely control land for agriculture.This has caused women to be left out in programmes that may benefit the agriculturalsector as well as the environment (Carr 1991). In Tanzania, Monela et al (2000), reportthat although men and women work together on the fields, women have an extra loadof crops that men are not involved in. As a result, women are more involved in agriculturethan men.
2.2 Overview of the countriesThe four countries selected for the study are host to the miombo woodlands, on whichthe majority of the rural population depends. The miombo and other woodlandsecoregion extends2 for approximately 3.6 million km2 (Byers 2001). This ecoregionextends from the Angolan escarpment in the west to the coastal woodlands and theforests of Mozambique and Tanzania in the east. To the west and southwest it is boundedby Kalahari Acacia woodlands in Namibia and Botswana and to the south by Highveldgrassland and mixed Acacia Woodlands in South Africa. The northern boundary is themoist evergreen forest of the Congo Basin and the dry Acacia Commiphora bushland ofTanzania on the northeast (Byers 2001). Miombo woodlands are the most extensivewoodlands in the countries of the study as shown in Table 1. Furthermore, for all thecountries except Tanzania, where the ecoregion coverage is substantially lower than inthe other three countries, the population living in the ecoregion is close to half thetotal national population. Most of the woodlands, as can be expected, are found in therural areas where the majority of women live.

191M. Chitiga and N.Nemarundwe
Campbell (1996) estimated that in 1990, 40 million people lived in areas coveredby or previously covered by miombo woodlands and that another 15 million urbandwellers relied on miombo wood or charcoal as a source of energy. The woodlandsprovide a range of products from medicines to food to building materials to fuel andagricultural support. They are used for other physical needs as well as for spiritualpurposes. They also contribute to the quality and quantity of the water in these areasand to the global climate. Thus, the miombo woodlands are central to people’s livesmaking their sustainable management and use of paramount importance. It is in such acontext that it is important to understand the differential gender impacts, if any, ofpolicies and programmes, on the management of these woodlands.
The study countries, with the exception of Zimbabwe, are generally ranked withinthe very poor category of countries within the region as shown by the high humanpoverty indices in Table 2. These statistics have changed substantially in some of thesecountries in the recent past. For example, Mozambique has exhibited much highereconomic growth rates, Tanzania has reduced its inflation rate from 34% in the mid1990s to about 5% per year, the inflation rate in Zimbabwe has grown to about 116% inearly 2002 while the parallel exchange rate for the local currency to US dollar is aboutsix times the official rate. Malawi has also experienced a tremendous erosion of itslocal currency.
Table 2. Gross Domestic Product (GDP), per capita incomes and human poverty index
Country Average Annual Per Capita Human Poverty indexGDP growth rate % US$, 1997 %Value, 19971988-1997
Malawi 3.5 169 47.7
Mozambique 4.2 126 48.5
Tanzania 2.8 160 39.8
Zimbabwe 2.5 705 25.2
Source: UNDP/ UNEP/ World Bank/ WRI, 2000, UNDP/SADC/SAPES, 1998.
Since the poor are more reliant on natural resources than the rich in rural areas(Bradley and Dewees 1993), this may imply that reliance on natural resources is mostlikely significant in these countries. Furthermore, as pointed out earlier, most of therural population consists of women and we may expect that there are likely to be morefemales relying directly on woodland resources than males. Also in many countries andin Zimbabwe in particular, as reported by Tichagwa (1998), the proportion of womenfalling in the low-income category is greater than that of men.
The countries are characterized by dependency on production of a small range ofprimary commodities. In most cases each country has traditionally been dependent onthe export of a single commodity, i.e., tobacco for Zimbabwe and Malawi, coffee forTanzania and fish & shrimps for Mozambique. The industrial and agricultural sectors stillbear the characteristics of the colonial era as post-independence policies have largelyfailed to reconstruct and transform these economies (UNDP/SADC/SAPES, 1998).Agriculture contributes on average 34% of Southern Africa’s gross domestic product,employs 80% of the total labor force, the majority of whom are women, and accountsfor about 26% of the raw materials to industry (SADC 1996). Cash cropping in the

192 POLICIES AND GENDER RELATIONSHIPS AND ROLES IN THE MIOMBO WOODLAND REGION
Southern African region accounts for at least 60% of export earnings (Byers 2001). Hence,agriculture promotes growth in its own right and in the manufacturing sector. Theimportance of agriculture, which is inversely related to the survival of natural forests,suggests that it is important to further investigate the sustainable management of thesenatural resources in these four countries.
3. POLICY IMPACTS
3.1 Macroeconomic policies
3.1.1 Colonial periodThe main policy thrust of the colonial governments was in favor of minority whitesettlers. Economic policies contributed to overvaluation of national currencies on foreignexchange markets. In addition, tariffs and quotas on trade that protected some favoureddomestic sectors were put in place. Other policies of the time resulted in encouragingor forcing African males to seek urban employment. As a result, most women were leftto look after the rural home and to take care of agriculture in their rural areas (Tichagwa1998). Women were therefore more likely to be in touch with natural resources thanmen. Most of the policies had no deliberate recognition of the welfare of this group offarmers.
3.1.2 Post- colonial periodAt independence, most countries inherited social, political and economic inequalitiesbetween the white settlers and the local people due to colonial policies. The new nativegovernments sought to redress these as well as to promote economic growth. Thus, mostpost independence macro policies implied growth with equity3 , for example through theNational Development Plans of Zimbabwe, the 1978 National Rural Development Programme(NRDP) of Malawi and the 1967 Arusha Declaration of Tanzania. Governments borrowedheavily both locally and abroad in order to not only repair the damage to infrastructurecaused by wars or conflict in the colonial periods but to also cater for the large group ofpoor Africans at independence. Most prices were either state controlled or managed,including interest rates and currency exchange rates. Basic goods, and basic social serviceswere heavily subsidized. Governments were forced to increase public sector employmentin order to accommodate the increasing numbers of school leavers (Duncan and Howell1992). Policy making was thus highly centralised, (Bagachwa et al. 1995). These needs,which implied increased government spending, were a main feature of the internal policyweakness of these countries.
Countries faced many problems for several years after these expansionist policieswere implemented. These included huge balance of trade deficits and debt burdens, highinterest rates, high inflation and high unemployment, all of which combined to increasepoverty (UNDP/UNEP/World Bank/WRI, 2000). For instance, in the early eighties, 60% ofTanzanians lived below the poverty line and the majority of those lived in rural areas(Bagachwa et al. 1995). As poverty increased, we can expect that the rural poor, themajority of whom are women, would have been forced to rely excessively on forestresources. Bagachwa et al. (1995) report that for Tanzania during this pre economicreform period, the natural resource base was coming under threat because of continuedclearing for agriculture and an alarmingly increasing demand for firewood. Countries

193M. Chitiga and N.Nemarundwe
were then forced to make a complete turnaround in policy orientation by structurallyadjusting their economies.
3.1.3 Reform periodThe policies pursued in post independence, ostensibly to redress the imbalances of thecolonial periods landed most of these countries in macroeconomic crises. As a result therewas intense pressure from international financial institutions for economic reforms, awayfrom centrally planned economies towards more market-oriented nations. Much has beenwritten about the impact of countrywide reform policies on the environment and on society.Most of these studies note that a primary problem is to establish the nature of the linksbetween the economy and the way it responds to structural adjustment, and the specificmicro-economy in which rural people operate. In this paper, the same problem is notedtogether with an additional one of generalizing over several countries. However, thereappear to be some fairly well established stylized aims, instruments to employ and resultsof macroeconomic policies of adjustment in these countries. All these hold potential forinfluencing the use and condition of natural forest resources, as well as affecting men andwomen differently and possibly reshaping their roles.
The broad aims of structural adjustment policies (SAPs) are:• To bring about equilibrium or manageable deficits in the fiscal budget and the
balance of payments,• To reallocate domestic resources to the more productive sectors,• To reduce the role of the state in commercial and productive activities and• To promote the private sector and the role of market forces (Duncan and Howell
1992).
The range of instruments normally used to achieve these goals is:• Liberalization of foreign trade, with tariffs generally replacing quantitative
restrictions on imports and with attempts to provide incentives for exports, viafor example, devaluations,
• Monetary restraint, implying also increasing interest rates,• Lowering or removal of subsidies,• Reducing reliance on administered prices, including also foreign currency,• The reform of public enterprises and• Privatization of some state-owned enterprises (Duncan and Howell 1992).
As governments restructured their budgets in order to reduce budget deficits,they were forced to reduce expenditure. The reduction in government expenditurehas meant reductions in the resources available for the provision of economic andsocial infrastructure. Reductions occurred in many spheres such as in health andeducation, in production sectors like agriculture and in production factors like labour.This had adverse effects on the poor and in particular their children. Chisanga (1990)reports that in many African countries, women and children, especially girl children,carried a disproportionate share of the costs in cuts in government spending oneducation. Chisvo and Munro (1994) also arrive at a similar conclusion for Zimbabwe.Girls are withdrawn from schools in order to use the scarce resources on the boychild. These authors further argue that female illiteracy rates are likely to increasedue to cuts in government expenditure, limiting women’s potential to earn formal

194 POLICIES AND GENDER RELATIONSHIPS AND ROLES IN THE MIOMBO WOODLAND REGION
sector wages and forcing them to be more reliant on the land and other naturalresources than men. Also since women and children are intensive users of healthservices they tend to suffer more than men as health fees increase (Chisanga 1990).As mentioned earlier, women are more preoccupied with child rearing than men, andtherefore these adverse effects on children would also be mainly borne by women.Such policies could be expected to have led women into exploring ways to increasetheir income sources, with one potential avenue being increased reliance on forestswhere available (through, for example, extending area for agriculture, and sellingfirewood) and other natural resources.
In order to reduce expenditure, some governments were forced to retrench civilservants, and this led to reduced incomes and remittances to rural areas, thereby adverselyaffecting rural people dependent on remittances. Evidence exists that female-headedhouseholds, compared to those headed by males, are more reliant on remittances as asource of income in rural areas (World Bank 1996). Upon loss of this source women areexpected to look for alternative sources of income (Chisanga 1990), and these are likelyto include further use of natural resources. In addition, the retrenchments haveencouraged significant urban to rural migration and encroachment on natural forestresources by these new and poor farmers. The retrenchments have also led to a boominginformal sector and wood products are some of the most important of informal sectorgoods. Most directly affected were those previously employed in the formal sectors, themajority of whom were men. The fiscal policies thus had the potential to lead to conditionsthat might have caused overexploitation of natural resources, by both men and women,especially in rural areas where the majority of the poor are found.
The policy of currency devaluation is meant to raise the price of imports and increaseconsumption of locally produced goods at the expense of imported items. Devaluation isalso meant to promote exports. The effects of these are to correct the trade imbalance.However, in the countries that have to import goods needed in the production process,such as the ones in this study, devaluation had the overall impact of raising virtually allprices in the economy (see, for example, Chipika et al. 1998). Rising inflation began toerode the rising nominal producer prices leading to falling real producer prices even inthe face of devaluations (Bagachwa et al. 1995). Since women are in general dependenton fixed housekeeping allowances from their husbands, they suffered most in the face ofrising prices. They found themselves trying to raise extra income through other activities(Chisanga 1990). Such activities include harvesting and trade in forest products. Bradleyand Dewees (1993) report that surveys carried out in parts of Zimbabwe showed thatone primary advantage of wood-related income generation activities is that they can beused to reduce risk in times of income scarcity, thus serving as safety nets.
The liberalization of prices and trade meant moving away from controls and regulationto a more market oriented approach. Together with the tight monetary policy implementedduring adjustment, one impact of these liberalization policies was to increase interestrates, thereby benefiting savers and disadvantaging borrowers. Rural poor people are notsavers and thus did not benefit from rising interest rates. Poor women in rural areas havevery limited access to credit and this increase in the cost of borrowing made the situationworse (Chisanga 1990), even if borrowing was from the formal financial sector. Withoutcredit, women could not fully take advantage of the market’s encouragement to growexport crops and thus enhance their incomes. Yet, in the face of increasing hardships,the need to enhance incomes is greatest. Most probably women increased their relianceon the “free” natural resources under such circumstances.

195M. Chitiga and N.Nemarundwe
It thus seems that throughout the history of these countries, the very poorestwere seldom the target of macro policies that operated mainly in the framework offree markets, in which the poor have little capacity to participate. The rural poortherefore rarely benefited from the SAPs and often suffered from the unintended effectsof these policies. Since this is the group in which most women are found we can inferthat women have generally been left to rely on several extra means, mainly naturalresource based, to enhance their incomes. It is likely that such uncontrolled exploitationcould lead to rapid degradation/deforestation in addition to other negativeenvironmental problems.
3.2 Sectoral policies and political influences
3.2.1 Colonial periodMajor disturbances in lifestyles and management of resources occurred during the colonialperiod. Land was appropriated by settlers for purposes of agricultural production. Thestate also appropriated land for establishment of public amenities such as national parksand forest reserves. These two measures physically reduced the amount of land availablefor agricultural and non-agricultural use by the rural communities, as well as access tonatural resources found in them. Overcrowding in the native reserves began as humanand animal populations increased on confined lands that were largely of low fertility.This period marked the beginning of disruption of common property regimes. Lack ofproperty rights and the prevalence of open access to land have also been cited aspotential causes of mismanagement of natural resources, including forests (Sparr 1994).Campbell et al. (1993) report that much of the deforestation in Zimbabwe took placeduring this period because of new settlement and colonial land use policies, amongother reasons.
The movement of people into small and confined areas to give way for large scaleagriculture by the settlers led to agriculture being divided into smallholder and large-scale or estate plantations. This division has largely persisted to this day in most of thecountries under study. This division also influenced the way sectoral policies wereformulated and thus, there was a well-defined symmetry for policies in these twosectors. The large-scale agricultural sector was favored in terms of policies for research,marketing, credit availability, infrastructure development, macroeconomic policies topromote trade, pricing, etc. Land policies allowed large-scale farmers to own or haverights to land, water and forests but not the small-scale farmers. The small-scale sectorwas largely ignored, and yet, it was the sector in which the majority and the poorestlived and in which the potential for natural resource degradation was greatest becauseof overcrowding in the communal areas following land expropriation by the colonialgovernment. The result could have been further pressure on forests and their productsespecially from those who could not secure formal employment, that is, mainly women.
Some sectoral policies for forestry protection were put in place during these periods.Boundaries were put between local communities and natural forest resources therebyrestricting shifting cultivation (Kowero et al. 2001). There was a set of rules, laws,regulations, acts and ordinances that were to set the direction of the use of resources.Legislation on protected forests was limited to government forest reserves leavingmost of the forest areas as public lands (open access). Policies on environmental resourceswere not intended to be operative in communal areas of Zimbabwe because these

196 POLICIES AND GENDER RELATIONSHIPS AND ROLES IN THE MIOMBO WOODLAND REGION
Table 3. Agricultural cropland in the study countries
Country Total Hectares (000) Hectares per 1000 people1987 1997 1987 1997
Malawi 1 610 1 710 199 170
Mozambique 3 090 3 180 225 172
Tanzania 3 501 4 000 151 127
Zimbabwe 2 814 3 210 313 286
Source: UNDP/UNEP/World Bank/WRI 2000.
areas were meant to be a reserve for cheap labor (Katerere et al. 1993). Thus, therewas no policy concern for protecting and preventing damage to the forests in the ruralareas. The large-scale forced movement of populations also weakened and in somecases removed indigenous management mechanisms and cut many links between peopleand their land. As a result of lack of clear management laws, these forests were easilyand freely available to the rural poor. Since firewood was the major product for ruraldwellers and culturally women collect firewood, women and children interacted withthese resources more than men. In addition to firewood collection, women and childrenalso collected wild vegetables, fruit, mushrooms, fibre, leaf litter for manure andelderly women also participated in performing traditional rituals such as rainmakingceremonies. Men had relatively limited interactions with these resources. Their forest-related activities included principally employment in industrial forestry where it existed,collecting honey, hunting wild game, and performing various rituals.
3.2.2 Post colonial periodAt independence, the countries under study pursued different sectoral policies guidedby different political philosophies. Mozambique leaned towards Marxist policies, Tanzaniahad a homegrown Ujamaa policy, and Malawi was more on a capitalistic path. Zimbabwepracticed socialism in some spheres such as in price controls and land reform policiesbut practiced capitalism in others such as in leaving the private sector intact. In practice,conservation policies were directed towards large-scale and commercial sectors, andmost countries maintained the land policies of the colonial period. The governmentsdid not redress the issue of land redistribution to any significant measure and as such,the structure in the colonial periods was maintained. By and large, the amount of landunder cropping has remained stable over the eighties and nineties with the exceptionof Tanzania and Zimbabwe as shown in Table 3. The land on which rural people wereoperating continued to shrink and get eroded as population increased. This also impliedincreased pressure on forestlands in order to expand cropland and this is supported byevidence from Malawi and Tanzania. In Malawi the total area of rain fed crops andfallow increased from 37% of total land area in 1983-84 to 49.2 % of total land area in1988-90 (Eschweiler 1993). In Tanzania, area under tobacco cultivation increased byover 50% between 1985-86 and 1990-91 (Byers 2001). Besides large-scale commercialtobacco farming, smallholder farmers increasingly took up tobacco farming.
Because of the imbalances inherited from the colonial era, governments embarkedon agricultural policies to put communal farmers on an equal footing with the large-

197M. Chitiga and N.Nemarundwe
scale commercial farmers. The agricultural policies were on increasing access to credit,marketing facilities, research and extension. Poor farmers could not have access tocredit because they had no collateral and women found themselves in worse positionsthan men as they had no land rights or enough other assets in their names. Thus,policies to improve the marketing and credit conditions for the small-scale farmerswere more beneficial to men than women. Also, since most rural people, especiallywomen, are risk averse and want to satisfy food needs before selling (Ellis 1999), thepolicies pursued to encourage commercial agriculture, would have effectively affectedonly a small percentage of the relatively well off rural population, most of whom wouldbe men. The rest of the poor would be expected to continue to rely on or ‘overuse’other natural resources for income.
These policies, in general, promoted cash crop production, which was mainly thedomain of men. Women found that the land for food production was sometimes reducedin order to increase cash crop acreage. Since they did not own land and were not fullyinvolved in decisions over family land use, women may have found it difficult to controlthe acreage for food production. Further, most of the proceeds from cash crops weremanaged and controlled by men even in cases where women had also contributed theirlabor. This left women with few options to enhance their food and income sources, oneof the major ones being more reliance on forests and forest products. Also, womenfound that they had to do more work, as they were often required to work in their ownfields as well as their husband’s cash crop fields.
Such economic and political policies as nationalization of wood industry in Tanzaniaand Mozambique, and massive movement of people into communal villages in Tanzania,settlement and communal areas in Zimbabwe, refugee camps in Mozambique and Malawihad profound impacts on forests. For example, these processes resulted in massiveclearing of forests and loss, or reduced role, of traditional structures of managing theseforests (Kowero et al. 2001). How the effects were distributed between men andwomen remains unclear. Regarding land allocation, the policies of resettlement inZimbabwe mainly helped male-headed households, while female-headed householdswere given low preference. These resettlements, which could have contributed toincreased agricultural possibilities for the poor families, also resulted in increased forest/woodland clearing for agriculture and habitation (Katerere et al. 1993).
3.2.3 Developments in the agricultural sectorThis section focuses mainly on policies in the agricultural sector because of its closelinks with the rural people. The main policies discussed are those implemented duringthe reform periods. One of the main aims of liberalization policies is to bring about ashift from economically low value commodities to high value commodities by raisingthe relative price of the latter. Producers of goods viewed as having low economicvalue and food consumed locally have benefited less from the favorable agriculturalterms of trade. In the rural setting, women are concerned mainly with production ofgoods for household consumption while it is the men who are involved in the productionof goods for commercial purposes. Much of the work that women do is not economicallyvalued, for example, cleaning homes, child-minding, fetching water and firewood.They therefore do not directly benefit from policies, as the policies do not promotewhat are viewed as non-economic activities. As argued by JCGP (1991), in most Africansettings, women farming on their own have been less able to go into export productionthan have males. Hence, men gain more than women from trade liberalization policies

198 POLICIES AND GENDER RELATIONSHIPS AND ROLES IN THE MIOMBO WOODLAND REGION
of this nature. Cromwell (1992) reports that most rural households maintain separateincome streams and most women have no access to their husbands’ income. Thus,where the advantages of policies were disproportionately in favor of men, womenwould not have received much financial benefit.
With respect to marketing of produce, other bottlenecks such as lack of transportreduce the participation of the poor, the majority of whom are women, who end upselling to informal traders (middle men) who pay them below market rates. Binswanger(1989) also found that agricultural outputs are more responsive to non-price factors,such as irrigation, capital, technology, extension services and credit markets than toprice incentives. If the policy promoted increased use of land by men we may expectthat women became more marginalized because they often have restricted access toland.
Devaluation led to unequal distribution of land in the agricultural sector in twoways. First, distribution of land went in favor of large-scale/estate farmers. In Malawi,estate expansion in response to devaluation pushed the already marginalized small-scale farmers, further increasing their exploitation of forestlands4 (Cromwell 1992).Thus, because of the extreme land inequalities the policy of encouraging agriculturalexports had negative effects on the environment through the actions of poor farmers.Second, it increased acreage of male dominated cash crops such as maize and reducedthat for female cash crops such as groundnuts (Due and Gladwin 1991). In the Kageraregion of Tanzania, land previously used by women for food production was put undertea, in response to devaluation, thereby depriving women of land for food productionand income from production surpluses (Chisanga 1990). As a result, women were leftto extend their agricultural efforts into the marginal lands, thus exploiting forestsmore than men. Tichagwa (1998) reports that women in Zimbabwe had to turn to theinformal sector for livelihood support with the introduction of the structural adjustmentprogramme.
Cuts in government expenditure would have counteracted any favorable relativeprice effects enjoyed by producers of commercial goods in poor rural areas. In Tanzania,farmers’ access to fertilizers was limited by the huge increase in prices when an 80%subsidy removal was effected (Reed 1996). There is also evidence in Malawi of reducedfertilizer use because of increased prices (Cromwell 1992). Daikosavvas (1989) foundthat a 10% increase in government expenditure increases production in agriculture by3% on average in Sub-Saharan Africa. Thus, government cuts in agricultural subsidies andother expenditure during adjustment may negate the incentives provided by othermeasures such as devaluation and price and trade liberalization (Ahmed and Lipton1997). Where this happens, those without collateral for credit for fertilizer purchase,mainly women, are at a disadvantage and may be forced to explore other livelihoodsupport options like informal businesses, reliance on natural forest resources, gardening,etc.
In general, structural adjustment, even in countries where it has been applauded ashaving had some positive effects, such as in Ghana, left out some important groups,those producing non-tradables and those who are net buyers of agricultural commodities.These are usually the very poor, the majority of whom are women. The weak linksbetween the rural poor and the general economy also constrain poor farmers inparticipating fully in the monetised economy. Lastly, the potential benefits of SAPswere not captured because of lack of resources such as inputs, extension, research andcredit service.

199M. Chitiga and N.Nemarundwe
4. DECENTRALISATION POLICIESThis section explores changing roles of women within communities and how they may besidelined or play a crucial role in local institutional arrangements within the framework ofdecentralisation of natural resource management. Colonial natural resource managementpolicies resulted in over-centralisation because they were designed in the context ofconquest and subjugation (Mandondo 2000). Much of the colonial legislation was inheritedpiecemeal by most post-colonial governments, including the four countries covered bythis study. Amendments to the colonial legislation in Southern African countries have notdemocratised the various legal instruments (ibid.). However, state control over the useand management of natural resources such as woodlands has been largely ineffectivebecause the state lacks the resources and capacity to enforce such controls. This haspartly led to the enactment of decentralisation policies to facilitate the participation oflocal communities in resource management. This has in turn coincided with the generalshift in the development paradigm from top-down to the adoption of bottom-up,participatory approaches.
Decentralisation describes the process by which bundles of entrustments, includingregulatory and executive powers, responsibility and authority in decision-making,institutional infrastructure and administrative capacity, are variously transferred to localgroupings such as local governments and/or communities (Mandondo 2000; Agrawal &Ostrom 1999; Ostrom 1990). The literature on decentralisation has concentrated on definingwhat should be decentralised to local communities, often treating communities ashomogenous entities (Murphree 1991; Murombedzi 1991; Mandondo 2000; Mamdani 1996and Ribot 1999). Few studies have examined the heterogeneity of communities and howresource management decentralisation has affected the different community groups, suchas women (Shackleton and Campbell 2001; Shackleton et al. 2001; Meinzen-Dick andZwarteveen 2001; Sithole and Kozanayi 2001; Fortmann & Bruce 1993; Nabane 1997). Thesestudies have shown that decentralisation of resource management to local communities,with multiple and often competing interests and actors, go beyond the mere targeting ofappropriate ‘communities’. Communities are highly differentiated along several axes thatinclude gender (Mvududu 1993; Fortmann and Nabane 1992; Goebel 1998).
This section examines the impact of decentralisation policies and initiatives on variouscommunity groups differentiated by gender, drawing on experiences in the managementof miombo woodlands in Tanzania, Malawi, Mozambique and Zimbabwe. We focus onthree themes, namely, participatory forest management, conflicts and local levelorganisations in natural resource management in the context of decentralisation of resourcemanagement. The literature on decentralization of resource management has often treatedcommunities as homogenous groups, with common objectives as in the case of the “unitarymodels” of the household in economic literature (Meinzen-Dick and Zwarteveen 2001).The assumption in this literature is that all members of the household have commonobjectives and that there is pooling of all household resources. On the contrary, genderanalysis literature abounds in examples of how systematic, socially constructed patternsof differences between and among women and men affect the distribution and use ofresources, as well as decision making processes, within households (Hart 1995). Agarwal(1997) argues that leaving decision making analysis at the household level is incompletebecause it does not take into account the effects of the community on gender relations inthe household or vice versa. Thus it is important to take into consideration decision-making processes both at household and community levels in participatory forestmanagement.

200 POLICIES AND GENDER RELATIONSHIPS AND ROLES IN THE MIOMBO WOODLAND REGION
4.1 Participatory forest managementThere has been a paradigm shift in conservation and natural resource management fromstate centered control towards participatory resource management. Such approacheshave been referred to in many ways such as Community Based Natural ResourceManagement (CBNRM), co-management, collaborative management, participatorymanagement, etc. In the context of southern Africa, participatory forest resourcemanagement falls under the broad umbrella of CBNRM.
Shackleton and Campbell (2001) investigate the extent to which the move to CBNRMin eight countries in the Southern African region was accompanied by shifts in authority,decision-making and power. In the majority of cases studies described the communitiesparticipating in CBNRM initiatives were stratified and differentiated along the lines ofage, gender, livelihood strategies, ethnicity, political affiliations, education, wealth,interest and/or allegiance to traditional versus modern structures. In many of these studiesreference was made to a community “elite” who consistently attempted to seize anyincrease in authority or benefits resulting from devolution. They often took over leadershipof self-initiated forest management committees from poorer forest users. These “elites”are described as the strong, educated and articulate individuals who have the potentialto develop relations with the state apparatus or private operators (Shackleton and Campbell2001). These “elites” tend to dominate local level resource management structures. Theirrelations with the state apparatus and private operators enable them to control decision-making processes and the flow of benefits. Literature on gender and development hasoften shown that women, in particular from the female-headed households, tend to fallunder the poorest groups in the community (Fortmann and Nabane 1992; Feldstein andJiggins 1994) and these are often excluded from holding leadership positions. Because ofhistorical reasons, women have been less educated and less confident to take overleadership positions (Karl 1995). Shackleton and Campbell (2001) argue that this is acommon phenomenon where communities are required to elect representatives to acommittee. While it is clear that the strong, educated and articulate are the ones whodevelop links with the state apparatus and private operator, it is not clear how closenessto the chiefs and traditional leaders is acquired. One is left to ask whether it is kinship,wealth, or any other characteristic. It is not clear also whether women can attain the“elite” status and if not, what the impediments are.
In Zimbabwe, participatory forest management has been piloted under the ResourceSharing scheme facilitated by the Forestry Commission. Findings from the MafungabusiResource Sharing programme, a pilot study site, highlights the gendered access toforest resources such as thatch grass harvesting (Matose et al. 2001). Before theestablishment of the resource-sharing scheme in Mafungabusi, collecting thatch wasmostly a woman’s activity. The collection and selling of thatch grass has, however,become an important alternative source of income for many households. This has resultedin men’s taking an interest in the collection and selling of thatch grass. While previouslymen’s involvement in thatch grass was in assisting with its transportation, a growingtrend is that men are taking over the harvesting and selling of thatch. As permits forthis activity were traditionally issued to women, this new development has led totensions within the Resource Management Committee (RMC) membership. This illustratesthe gender effects of the commercialization of a common property resource. Thetendency is for men to take over the resource, often with the aid of local resourcemanagement structures whose composition is predominantly male. The paper by Matoseet al. (2001) is a welcome addition to existing literature on the gendered effects of the

201M. Chitiga and N.Nemarundwe
commercialization of common property resources, with a particular focus on forestresources. There is therefore need to examine in-depth the role of women and men inresource management where there is commercialisation of woodland products.
The emphasis of CBNRM has often been on resources such as wildlife, livestock andtimber at the expense of the less valuable but vital resources used on a daily basis bywomen in the home. Men are more actively involved in resources such as wildlife andtimber than women because these are high value resources. For instance, in Malawi itwas found that the role of women in forest management is generally restricted tocertain activities and forest products such as thatch and fuel wood (Mwabumba et al.2001). Despite this marginalisation, women in the two study sites in Malawi indicatedthat they wanted the same opportunities as men. The women believe that the onlyway to ensure a fair share of the benefits from forest resources is for them to have anequal say and influence in decision-making concerning forest management and utilization(ibid).
In the Fish River area of South Africa, cited in Shackleton and Campbell (2001),gender discrimination has been found to impede effective CBNRM. Women are generallyexcluded from decision making around NRM. They also do not have access to meaningfulpositions in local NRM structures, despite the fact that women are the primary resourceusers and the most knowledgeable about resource availability and condition. As a result,decisions focus on livestock and range management at the expense of other importantresources. In many Southern African countries women are often excluded from decisionson NRM, as they are not included in the local management structures. As a result, thewomen’s interests are often not taken into account even though they are the primaryresource users and very knowledgeable about the resources in their environment.
One way to ensure the participation of women in CBNRM is to formulate policiestargeting women (Nkomeshya 1998; Wonani 1998; Fortmann and Nabane 1992). Suchpolicies should specify the membership and composition of local NRM structures, althoughcare should be taken to ensure that the women’s membership in these structures is notmere token representation. It is worth noting that there are, however, some countriessuch as Mozambique, in which devolution policies have addressed equity issues andmade inroads to enhancing participation of marginalised groups such as women in decision-making.
According to Mwabumba et al. (2001), effective community management of naturalresources depends on coordinated actions of resource users. Organisations for CBNRM atthe local level should be strong, legitimate, adaptable and efficient. From their analysisof “successful and unsuccessful case studies,” they found that the ingredients for successin CBNRM occur when local level organisations are democratically elected or agreedupon, and have decision making powers; when there are local enforcement andmonitoring systems, local level traditional knowledge and rules are adhered to, andoperated in an environment with little political interference (p. 8). Issues such asrights, election to local resource management structures, enforcement and monitoringof rules, the use of traditional rules and political influence are not gender neutral.Women are often not represented in these management and enforcement structures.
The case of villages around Duru-Haitemba Forest Reserve in Tanzania has beencited as a success story in the attempt to devolve the management of natural resourcesto the local communities (Kajembe et al. 2001; Wily and Haule 1995). They state thatall the eight villages around Duru-Haitemba forest maintain “strong and effective ForestCommittees”. These are responsible for the enforcement of rules. One of the indicators

202 POLICIES AND GENDER RELATIONSHIPS AND ROLES IN THE MIOMBO WOODLAND REGION
of success is that the composition of these committees has steadily shifted fromvillage leaders to ordinary villagers representing their sub-villages. Most decisionsconcerning the forest are made through or with the guidance of these committees.The protection of the forest from offenders (both outsiders and from within the villages)is the responsibility of village forest guards. While forest committees are comprisedof both men and women, village forest guards are “young men who patrol the forestagainst breach of conservation rules each village has developed and adopted” (p.6).This arrangement may be a cause for potential conflict between the young men andthe women who rely more on forest resources than men and therefore may be morelikely to be offenders. Although men are more likely to commit offences that attractheavy punishment than women, women are more likely to be frequent offenders dueto their roles as collectors of firewood.
Along with other countries in the Southern Africa sub-region, Malawi is also pursuinga policy of local community involvement in forestry management (Masangano et al.2001). In their study, in Mdeka and Mangwero in Blantyre District, Dzalanyama in LilongweDistrict and Chimaliro in Kasungu District, Masangano et al (2001) found that thecommunities in these areas are being encouraged to participate in the management andutilization of miombo woodlands. Communal management of natural resources in bothMdeka and Mangwero was implemented through village natural resources managementcommittees (VNRMCs). These committees work hand in hand with staff of the ForestDepartment. It was found that communities living around the study sites experienced alot of conflicts around natural resources, most of which can be understood in the contextof power relations as well as rights to resources which determined rights of access toresources. The authors note that those people who had more power tended to havemore access to the resources than others. The rights of access varied with the type ofresource. There were people who had rights of access to land and all the forest resourceson that land while others would have rights of access to some of the resources but notothers. For example, while the owner of land would have the right to cut down treeson his land other members of the community would only have rights to collect certainparts of the tree for such purposes as herbal medicines and natural fruit. Given thatwomen often do not own land, their access to forest products may be restricted bysuch definition of access rights based on land holdings.
4.2 Conflict over resources in participatory forest managementStudies that have been undertaken on conflicts and their resolution in woodlandmanagement have identified five types of conflicts. These are ethnic, institutional,intergenerational, contested boundaries and conflict resulting from problems of co-management (Mamimine et al. 2001; Masangano et al 2001; Mvena et al. 2001). Mamimineet al. (2001), highlight that ethnic conflict is caused by attempts at excluding thoseregarded as immigrants by the “original” inhabitants of the areas where the resourceoccurs. For instance, in Mafungabusi Forest Reserve area of Zimbabwe, ethnic conflictexists between the “original” Shangwe and the immigrant Ndebele and Shona. In Romwe,ethnic conflict was between “original” Shona and the immigrant Ndebele. Institutionalconflict is often a result of the discord between traditional institutions and “new,”government institutions like Village Development Committees (VIDCOs) and WardDevelopment Committees (WADCOs). Boundaries demarcating forest reserves andcommunal areas and those between villages are often contested.

203M. Chitiga and N.Nemarundwe
Mamimine et al. (2001), study also found that there was often conflict overdifferent land uses such as grazing and cropping. Intergenerational conflict pitted theyounger and older generations against each other. The younger generation who stillwant land for ploughing tended to convert grazing land to arable land. The youth weremore dependent on the forest for resources such as wood for carving because theyhad no land for ploughing while the elders had livestock and therefore were moreinterested in reserving forests for grazing. Younger people were also more likely to beaccused of cutting down trees for poles to build houses. Citing the case of MafungabusiResource Management Committees, Mamimine et al. (2001) argue that such structureslack full participation in the management of forests. While Mamimine et al´ s paper(ibid) examines various actors in the different conflict situations, and differentiatesthem by ethnicity, length of residency, and age, the nature of the relationship betweenwomen and men is not addressed. It is important to understand such gender relationsas they may be influenced by and sometimes influence the nature of conflict overresources.
Conflict and conflict resolution is also the focus of Mvena et al.’s (2001) study. Thestudy was carried out in three sites in Handeni, Mufundi and Babati Districts of Tanzania.The authors identified various actors in conflict involving natural resources namely, theregulators, the commercial sector and local communities. The regulators includegovernment, represented by the Ministry of Natural Resources and Tourism as the keyplayer as well as non-governmental organizations such as DANIDA and SIDA. Suchorganisations are often male dominated. The commercial sector is made up of all thosewho exploit the natural resources for business purposes, who are also predominantlymale. Local communities are those at the local level who benefit directly from theforests.
Conflict at the local level is complex and involves numerous sub-divisions. It existsbetween individuals and groups within the same village and between villages, mainlyover boundaries. There are conflicts between the wealthy livestock keepers and thepoor over grazing. Within the villages there is also conflict over the control andmanagement of clan land and sacred areas. The authors conclude that many types ofconflict arise from unclear policies, lack of transparency on the part of the regulatorsand other beneficiaries and lack of design principles for CBNRM. It is further arguedthat conflicts in natural resource management depict, inter alia, an intergenerationaldimension. There has been a shift in the value system based on the age difference. Theyoung generation view natural resources differently from the older generation. Theyounger generation may not respect the ritual forests for a number of reasons, such assheer rebellion, conversion to Christianity or Islam and the temptation to make extraincome. The study differentiates groups involved in conflict, along the lines of wealth,class and age. While gender analysis goes beyond the female-male divide, this is notadequately considered in the paper. There is need to have a greater understanding ofgender issues, as gender influences resource management in general. While many ofthese studies do not specifically deal with gender, they address many other differencesbetween community groups that are of similar importance as gender differences.
4.3 Local level organisations in forestry managementLocal organisations or institutions play a central role in the management of natural resourcesand the institutions shape the processes of endowment and entitlement. These institutions

204 POLICIES AND GENDER RELATIONSHIPS AND ROLES IN THE MIOMBO WOODLAND REGION
are a complex set of norms and behaviors that persist over time by serving valuedpurposes while institutional arrangements are the rules and regulations governing accessto resources (Uphoff 1986; Ostrom 1990). Institutions consist of cognitive and normativestructures and activities that provide stability and meaning to social behavior. Theseinstitutions are transported by various carriers including culture and social structure,and they operate at multiple levels of jurisdiction (Scott 1995). Within the context ofdecentralisation of natural resource management, local level organisations are oftenentrusted with management responsibility as well as a key role in benefit distribution.
A major assumption in the literature on decentralisation is that there is anorganisation or structure at the local level, to which resource management authoritycan be devolved. The form and nature of these structures are rarely analysed, especiallyfrom a gender perspective. Recent studies have found that there are a number oforganisations at the community level that impact upon the management of forestryresources (Mandondo 2000; Fisher 1992). These include state institutions and theirdepartments or implementing agents, local government institutions, non-governmentalorganizations (NGOs), as well as community based organizations (CBOs). At the villagelevel, a distinction is often made between “traditional” and “modern” organisations.The traditional ones are those structures whose legitimacy is based on a shared valuesystem, collective cohesiveness, shared history and legitimacy derived from kinshipand descent. Their legitimacy is embedded in the social and cultural life of ruralcommunities. Some of the modern organisations are steeped in Western traditions,while others were created during the post-colonial period as part of the drive towardssocialism.
Men often dominate representation in local resource governance institutions andorganizations although women make up the bulk of the rural population and provide morelabor than men in development programmes (Meinzen-Dick and Zwarteveen 2001). In astudy of two villages in Mwenezi District in Zimbabwe, Mudenge (2001) found that menconstituted the bulk of the registered members in orchard projects. Women, however,provided the bulk of the labor in these projects. The study found that men occupy thepositions that are vested with decision-making powers whilst women occupy positionslike secretaries. Given a secretary’s role as note taker, the woman in that position maybe restricted in her participation in discussion, as she would be concentrating ondocumenting the deliberations. Facilitators of CBNRM have sometimes set a quota forelecting women into committees. This is a good starting point in empowering women toparticipate in decision making if it is done properly. Otherwise, women are given positionsto fulfill project requirements without really influencing decision-making processes.
A comprehensive study on gender issues in forestry management was carried out inMhondoro district in Zimbabwe by Fortmann and Nabane (1992). The study found that inboth study sites, Nyamweda and Chamatamba, all resource use monitors were men. Thishas implications for the enforcement of rules for the management of the woodlands. Thelack of women monitors in woodlands means that women’s needs are less likely to beconsidered in the establishment and enforcement of rules (p. 34). They further found thatwomen were often excluded from decision-making structures. Similar findings are reportedby Goebel (1998) based on her study undertaken in the resettlement schemes in Wedzadistrict in Zimbabwe. Although Goebel’s study had little focus on gender in forestmanagement institutions, she highlighted the fact that women are less involved in decision-making regarding access to woodland areas and products found in the various resourceareas.

205M. Chitiga and N.Nemarundwe
The role of women in the forest resource sector often reflects a deeply entrencheddichotomy between the so-called “male domain” of cash cropping and “female domain”of food crop production (Wonani 1998). Even in forestry extension in the villages, mendominate the membership. Women’s role in decision-making is often limited and this isattributed to tradition and culture (Karl 1995). There are few cases of women in leadershippositions from local to national levels: For instance, female chiefs or headmen, membersof parliament and district councilors are rare in most Southern African countries, includingthe study countries. This problem is not peculiar to the study countries as most countriesin sub-Saharan Africa experience low participation of women in decision-making structures.To address this anomaly, affirmative action has been taken by some government departmentsand public organizations. There is more prominence of women in Mozambique both atthe local and agency levels. For instance, at one time the head of the Forestry andWildlife Department in Mozambique as well as the Head of the Forest Department atEduardo Mondlane University were women. Presently the Head of the Centre for ForestryResearch is a woman. Similarly, in Lesotho there is increasing recognition for women inCBNRM. Women do not just represent their husbands who are often away at work inSouth African mines.
Hierarchies, even those at the household level are usually male headed. However,this is not to say that the hierarchies cannot be gender sensitive. In the forestry sector,staffing is male dominated. This is a historical factor because the forestry sector wasand still is seen as a male field, yet implementation of, for example, nursery projectswere done predominantly by women. The more senior the posts, the fewer the numbersof female personnel employed in them. Females tend to be concentrated among ‘supportstaff’ as secretaries and clerks. The limited number of women in leadership positionsmay imply that women have a limited influence on the management and policy-makingprocesses in the forestry sector. But recent studies show that women and men mayinfluence decision-making in many different ways (Nemarundwe 2001; Sithole and Kozanayi2001).
While the majority of the literature accessed for this study points to the fact thatwomen, compared to men, are often less involved with forest resource managementorganizations at a formal level, recent studies suggest the need to investigate strategiesthat women use to ensure their views are taken on board (Cleaver 1998; Meinzen-Dick etal. 2001; Nemarundwe 2001 and Sithole and Kozanayi 2001). These studies highlight bothformal and informal strategies that women may adopt where they feel their views arenot considered. More studies with a focus on such strategies may shed light on the actualrole of women in resource management structures and propose mechanisms through whichsuch strategies may be used as a starting point towards empowering women to be moreconfident to participate in formal decision-making arenas. The forthcoming collection ongender and diversity in forest management that will document the various lessons learnedwithin the Adaptive Collaborative Management (ACM) framework will contributesignificantly towards filling this gap (Colfer [Ed.] forthcoming).
Nemarundwe (2001) finds that decision-making arenas are not always public or formal.Often women’s involvement in decision-making is measured through the number of femalemembers in various resource management structures or through their participation indiscussions during community meetings. Results from Nemarundwe’s (2001) study in ChiviDistrict, southern Zimbabwe, show that informal platforms for decision-making exist andthey are very influential. These are predominantly used by women to influence organisationsgoverning access to woodland resources. For instance, the majority of women in the

206 POLICIES AND GENDER RELATIONSHIPS AND ROLES IN THE MIOMBO WOODLAND REGION
Romwe area in Chivi District, southern Zimbabwe, do not speak out at public meetings,with a few exceptions (like the community mobiliser and the vice-chairwoman of onegarden project). Women largely use informal means to control powerful male figures inthe community. An example is the alleged love affairs that a powerful and most respectedkraal-head in the area has with some women in the community, which sometimes constrainshis power to make certain decisions. Nemarundwe’s study highlights that impromptuconclusions should not be drawn on the role of women outside the public arena withoutin-depth analysis.
Similarly, Sithole and Kozanayi (2001) find that women may use informal means toinfluence decision-making processes, as they are not represented in the resourcemanagement committees (RMCs). Following, Sithole and Kozanayi (ibid) argue thatalthough women may be excluded from formal channels of authority in the community,they are nonetheless political actors and they exercise modes of political action involvingexpression of power such as manipulating kin relationships, gossip, threats of witchcraft,and withholding sexual services from men. Sithole and Kozanayi (ibid) highlight a case ofa wife to one kraal head in the adaptive collaborative management project in Gokwedistrict, who uses her position as the kraal head’s wife to influence decision-makingprocesses relating to the ACM programme. Studies that document intra-household decisionmaking processes relating to forest management could not be easily accessed during thereview that generated information for our paper. A more detailed analysis is needed togenerate in-depth understanding of intra-household decision-making processes incommunity-based forest management. It is also worth noting that differences betweenand amongst female and male-headed households regarding their role in community-based woodland management institutions and organizations need to be considered.
5. SUMMARY AND CONCLUSIONThe paper tries to bring out the linkages that exist between policies and gender and themanagement of woodlands. The subject matter is complex due to a lack of substantialresearch in this area. However there are some insights on how males and females viewand value forests and their management. The analysis in this paper brings to light thefact that men and women have different perspectives on resource use and managementissues. Furthermore, division of labor, responsibility and control over resources is alonggender lines. Women are less likely to benefit from family income than men. In communalareas, the role of women is in agriculture and in ensuring primary human development.Men are more involved in other non-agricultural activities and place importance onmatters concerning personal pleasures. Women are thus more directly linked to sustainabledevelopment as compared to men. Women are hurt more if there is damage to naturalresources and they are likely to value these more than men.
The paper has also highlighted that throughout the colonial, post independenceand reform periods, policies have in general pushed women to rely more on foreststhan men because of shrinking cropland per capita. Most of the policies do not have agender bias, but instead treat men and women equally despite their different capacitiesto respond to such policies. It is suggested here that most policies that are related toforestry should favor women and encourage them to conserve forests by, for example,enabling them to own land in their own right and enabling them to be resettled in theirown right. This is because when there is mismanagement of environmental resources,

207M. Chitiga and N.Nemarundwe
women are likely to suffer more than men, as they work harder and longer to sustainthe family needs.
The negative effects of economic policies in rural areas, especially economicstructural adjustment policies, which place heavy emphasis on market forces, are beingfelt disproportionately by rural people. Women are ill equipped to benefit from agriculturalproduction incentives and other economy-wide policies. They have in general, less capacitythan men in terms of acquiring new technology, less time and land to devote to incomegenerating agriculture and less command over some of the most important resources suchas family land and capital. Since men often control most of the household income, womenthus have less incentive to respond to economic signals. Women are in general risk averseand do not immediately venture into new projects and thus tend to be left out. Therefore,rural development policies need to be directly focused on women and further, policymakers should facilitate women’s positive responses to them.
From this review, it is clear that in many countries in sub-Saharan Africa, womenare constrained from effectively deciding on issues of access to natural resources. Thisis because in many societies, women’s ideas are not valued and their initiatives do notcarry as much weight as those of men. This is a critical issue as current thinking in NRMis towards giving communities the responsibility to decide on how to manage localresources. Women make up the majority of the poor in these communities.
As observed by Fortmann and Nabane (1992) many studies on access to and controlover natural resources have focused on undifferentiated users, generally households withoutregard to gender or to class. Many approaches tend to ignore the multi-dimensionaldifferentiation among the poor or rural people themselves based on economic, gender,age and ethnic identities. This is a serious omission as gender issues in forestry can beeffectively addressed if attention to such issues is paid at the highest levels of decision-making and policy making. Gender issues are particularly important in Africa where thereare frequently high proportions of female household heads (Fortmann and Bruce 1993).There is therefore a need for women to exercise more control over the resources theyuse in order for them to realize their full potential as development agents (Nyoni 1989).Ignoring the roles of women as resource users will lead to the failure of conservationprogrammes to address the needs of those very individuals who are key to the sustainableuse of the environment (USAID 1996).
ENDNOTES1. In this paper, gender refers to socially and culturally constructed roles and responsibilities
and relations between and among women, men, boys, and girls in a given community. Gender isrelated to how we are perceived, and how we think and act as women, men or children, because ofthe way society is organised rather than because of our biological differences. Gender relationsinfluence access to and control over resources such as woodlands by various groups.
2. This figure varies according to different authors. Campbell (1996) has a figure of 2.7 millionkm2 for miombo woodlands.
3. The speed of this socialist outlook differed for different countries, for example for Zimbabweit came immediately after independence but for Tanzania and Malawi it came several years afterindependence. For these two countries, the policies pursued just after independence wereessentially similar to the pre-independence ones of relying on the promotion of foreign efforts inthe country and not the indigenous population.
4. It must be pointed out though, that much of the pre-SAP expansion of Estate agriculture inMalawi was due to deliberate government policy to promote this sector.

208 POLICIES AND GENDER RELATIONSHIPS AND ROLES IN THE MIOMBO WOODLAND REGION
REFERENCESAgarwal, B. 1997 Bargaining and gender relations: Within and beyond the household.
FCND Discussion Paper No. 27. IFPRI, Washington D.C.Agrawal, A. and Ostrom, E. 1999 Collective action, property rights and devolution of
forest and protected area management. Paper to the workshop on devolution ofnatural resource management. Puerto Azul, Philippines, 21–25 June, 1999.
Ahmed I.I. and Lipton, M. 1997 Impact of structural adjustment on sustainable rurallivelihoods: A review of the literature. IDS Working Paper 62. IDS, UK.
Bagachwa, S.D., Sechambo, F.C., Sosovele, A., Kulindwa, K.A., Naho, A.A. and Cromwell,E. 1995 Structural adjustment and sustainable development in Tanzania. Dar esSalaam University Press, Tanzania.
Bagachwa, M.S.D. and Limbu, F. (eds.) 1995 Policy reform and the environment inTanzania. Dar es Salaam University Press, Tanzania.
Binswanger, H. 1989 The policy response of agriculture. In: Proceedings of the WorldBank Annual Conference on Development Economics. World Bank, Washington DC.
Bradley, P. N. and Dewees, P. 1993 Indigenous woodlands, agricultural production andhousehold economy in the communal areas. In: Bradley, P.N. and McNamara, K.(eds). Living with trees: Policies for forestry management in Zimbabwe, 63–138.World Bank Technical Paper No. 210. Washington DC.
Byers, B. (ed.) 2001 Miombo ecoregion: Reconnaissance synthesis report draft review.WWF, SARPO, Harare, Zimbabwe.
Campbell B. (ed.) 1996 The Miombo in transition: Woodlands and welfare in Africa.Center for International Forestry Research, Bogor, Indonesia.
Campbell B., I.Grundy and Matose, F. 1993 Tree woodland resources-the technicalpractices of small-scale farmers. In: P.N. Bradley and K. McNamara (eds.) Livingwith trees: Policies for forestry management in Zimbabwe, 29–62. World BankTechnical Paper No. 210. Washington DC.
Carr, M. (ed). 1991 Women and food security: The experience of the SADC countries.I.T. Publications, London.
Chipika, J.T., Chitiga, M. and Gondo, P. 1998 The Impact of some macroeconomic,sectoral and extra-sectoral policies and other interventions on household strategiesin the miombo woodland region: The case of Zimbabwe. Center for InternationalForestry Research, Harare.
Chisanga, P. 1990 The social cost of structural adjustment: Some evidence from Africa.WID Structural Adjustment Paper 3a.
Chisvo, M. and Munro, L. 1994 A review of the social dimensions of adjustment inZimbabwe 1990–94. UNICEF, Harare.
Cleaver, F. 1998 Incentives and informal institutions: Gender and the management ofwater. Agriculture and Human Values 15: 347–360.
Colfer, C. (ed.) (forthcoming) The equitable forest. Center for International ForestryResearch, Bogor, Indonesia:.
Cromwell E. 1992 Malawi. In: Duncan, A. and Howell, J. (eds.) Structural adjustmentand the African farmer. Overseas Development Institute, Portsmouth.
Daikosavvas, D. 1989 Government expenditure on agriculture and agricultural performancein developing countries. Discussion Paper No 3. University of Bradford, UK.
Due, J. and Gladwin, C. 1991 Impacts of structural adjustment programmes on Africanwomen farmers and female-headed households. American Journal of AgriculturalEconomics, Ithaca and London.

209M. Chitiga and N.Nemarundwe
Duncan, A. and Howell, J. 1992 Structural adjustment and the African farmer. OverseasDevelopment Institute, Portsmouth.
Ellis, S. 1999 The mask of anarchy: The destruction of Liberia and the religious dimensionof an African civil war. New York University Press, New York.
Eschweiler, J.A. 1993 Malawi: Land use issues. Working paper prepared for the WorldBank Forest Sector Review, Malawi.
Feldstein, H.S. and Jiggins, J. 1994 Tools for the field: Methodologies handbook forgender analysis in agriculture. Kumarian Press, Connecticut.
Fisher, R.J. 1992 Local organisations in community forestry. In: Veer, C. and Chamberlain,J. (eds.) Forestry Extension in Asia. FAO, Bangkok.
Fortmann, L. and Nabane, N. 1992 The fruits of their labour: Gender, property and treesin Mhondoro District. CASS Publications Paper Series - NRM: 6/1992/
Fortmann, L. and Bruce, J.W. 1993 Tenure and gender issues in forest policy. In: Bradley,P.N. and McNamara, K. (eds.) Living with trees: Policies for forestry managementin Zimbabwe, 199–210. World Bank Technical Paper No. 210. Washington DC.
Goebel, A.F. 1998. Process, perception and power: Notes from ‘participatory’ researchin a Zimbabwean resettlement area. Development and Change 29: 277–305.
Hart, G. 1995 Gender and household dynamics: Recent theories and their Implications.In: M.G. Quibria (ed.) Critical issues in Asian Development: Theories, experiencesand policies. Oxford University Press, Oxford.
Joint Consultative Group on Policy (JCGP) 1991 Women and structural adjustment:Operational implications for member organizations of the joint consultative groupon policy. Issue paper for JCGP WID sub groups. JCGP, New York.
Kajembe, G.C., Monela, G.C., and Mvena, Z.S.K. 2001 Making community based forestmanagement work: A case study of Duru-Haitemba village forest reserve, Babati,Tanzania. Draft paper. Center for International Forestry Research, Harare.
Karl, M. 1995 Women and empowerment: Participation and decision making. Zed BooksLtd., London.
Katerere Y., S. Moyo and Mujakachi, L. 1993 The national context: Land, agriculture andstructural adjustment, and the Forestry Commission. In: Bradley, P.N. and McNamara,K. (eds.) Living with trees: Policies for forestry management in Zimbabwe, 11–27.World Bank Technical Paper No. 210. Washington DC.
Kowero, G. 2000 Report on a Workshop on policies, governance and harvesting inmiombo woodlands. Unpublished Report. Center for International Forestry Research,Harare.
Kowero, G., A.R.S. Kaoneka, I.Nhantumbo, P.Gondo, C.B.L. Jumbe. 2001. Forest policiesin Malawi, Mozambique, Tanzania and Zimbabwe. In: M. Palo, J. Uusivuori and G.Mery (Eds.) World Forests, Markets and Policies. World Forests Volume III, KluwerAcademic Publishers, Dordrecht/London/Boston. pp. 311-326
Mamdani, M. 1996 Citizen and subject: Contemporary Africa and the legacy of latecolonialism. Princeton University Press, Princeton.
Mamimine, P.W., Nemarundwe, N. and Matose, F. 2001 Conflict and conflict resolutionin the management of miombo woodlands: Three case studies of miombo woodlandsin Zimbabwe. Draft paper. Center for International Forestry Research, Harare.
Mandondo, A. 2000 Situating Zimbabwe’s natural resource governance systems in history.CIFOR Occasional Paper No. 32. Center for International Forestry Research, Bogor.

210 POLICIES AND GENDER RELATIONSHIPS AND ROLES IN THE MIOMBO WOODLAND REGION
Masangano, C.M., D, Kayambazinthu, and Mwabumba, L. 2001 Conflicts over naturalresources in the miombo woodlands in Malawi: The case of Blantyre, Lilongwe andKasungu. Draft paper. Center for International Forestry Research, Harare.
Matose, F., P.W., Mamimine, and Nemarundwe, N. 2001 Making community-basedmanagement work: What prospects for Zimbabwe? Draft paper. Center forInternational Forestry Research, Harare.
Meinzen–Dick, R.S. and Zwarteveen, M. 2001 Gender dimensions of community resourcemanagement: A case of water users’ associations in South Asia. In: Agarwal, A. andGibson, C. C. (eds.) Communities and the environment: Ethnicity, gender and thestate in community-based conservation, 63–88.
Mudenge, N.N. 2001 The role of communication power shifts: A synthesis of case studiesfrom southern African social forestry: The case of Mwenezi. Unpublished M.Sc.Thesis, Department of Sociology, University of Zimbabwe.
Murombedzi, J.C. 1991 Decentralising common property resource management: A casestudy of Nyaminyami District Council in Zimbabwe. CASS, University of Zimbabwe,Harare.
Murphree, M.W. 1991 Communities as institutions for resource management. CASS,University of Zimbabwe, Harare.
Mvena, Z.S.K., Monela, G.C., Kajembe, G.C. and Ngaga, Y.M. 2001 Conflict and conflictresolution in the use of Miombo woodlands: A case study of selected areas inTanzania. Draft paper. Center for International Forestry Research, Harare.
Mvududu, S.C. 1993 Gender, environment and sustainable development: Zimbabwe case.Zimbabwe Women’s Resource Centre and Network, Discussion Paper No. 8. Harare.
Mwabumba, L. Masangano, C., and Kayambazinthu, D. 2001 Making community basedmanagement work: Case studies from Malawi. Draft paper. Center for InternationalForestry Research, Harare.
Monela, G.C., Kajembe, G.C., Kaoneka, A.R.S. and Kowero, G. 2000 Household livelihoodstrategies in the miombo woodlands of Tanzania. Journal of Forestry and NatureConservation 73: 17–33.
Munasinghe, M. 1996 Structural adjustment policies and the environment. CambridgeUniversity Press, London.
Nemarundwe, N. Forthcoming. Formal and informal decision-making platforms: Women’srole in natural resource management institutions in Southern Zimbabwe. IES/CIFOR,Harare/Bogor.
Nkomeshya, A.K. 1998 Gender considerations in forestry: Some cases from Zambia. In:Proceedings of the Regional Conference on Gender Issues in CBNRM, 67–80. Harare.
Ostrom, E. 1990 Governing the commons: Evolution of institutions for collective action.Cambridge University Press, New York.
Reed, D. 1996 Structural adjustment, the environment and sustainable development.Earthscan Publications Ltd, London.
Ribot, J.C. 1999 Decentralisation, participation and accountability in Sahelian forestry:Legal instruments of political administrative control. Africa 69: 23–65.
South African Development Community (SADC) 1996 Food agriculture and naturalresources. SADC Secretariat, Gaborone.
Scott, W.R. 1995 Institutions and Organisations. Sage Publications, London.Shackleton, S. and Campbell, B. 2001 Devolution in natural resource management:
Institutional arrangements. CIFOR, Bogor.

211M. Chitiga and N.Nemarundwe
Shackleton, S., Campbell, B., Edmunds, D. and Wollenberg, E. 2001 Devolution andcommunity -based natural resource management: Creating space for local peopleto participate and benefit? CIFOR, Bogor.
Shiva, V. 1988 Staying Alive: Women, ecology and survival in India. Kali for Women.New Delhi.
Sithole, B. and Kozanayi, W. 2001 Uncovering shrouded identities! Institutionalconsiderations and differentiation in an adaptive co-management project inZimbabwe. Center for International Forestry Research, Harare.
Sparr, P. 1994 Mortgaging women’s lives: Feminist critique of structural adjustment. ZedBooks Ltd, London & New Jersey.
Tichagwa, W. 1998 Beyond inequalities: Women in Zimbabwe. Zimbabwe WomenResources Centre and Network, and Southern African Research and DocumentationCentre, Harare.
Uphoff, N. 1986 Local institutional development: An analytical source book with cases.Kumarian Press, Hartford.
United Nations Development Programme/South African Development Community/SouthernAfrica Political & Economic Series Trust (UNDP/SADC/SAPES) 1998 Regional humandevelopment report (1998). SAPES Trust, Harare.
United Nations Development Programme/United Nations Environment Programme/WorldBank/World Resources Institute (UNDP/UNEP/World Bank/WRI) 2000 World resources2000–2001: People and ecosystems, the fraying web of life. World Bank and WorldResource Institute, Washington, DC. (www.wri.org/wr2000).
Wily, L. and Haule, H. 1995 Good news from Tanzania. Village forest reserve in themaking: the story of Duru-Haitemba. Forest, Trees and People ProgrammeNewsletter No. 29. Uppsala.
Wonani, C. 1998 Gender and community-based natural resource management: The caseof the forestry sector in Zambia. Nabane, N. (ed.) Proceedings of the RegionalConference on Gender Issues in CBNRM, 55–65. Harare.
World Bank 1996 Poverty in Zimbabwe, current issues and issues for the future. Draft.World Bank.

13.An overview1: Reconciling demands onwoodlands through modelling
G. Kowero
1. CHOICE OF MODELING APPROACHESA modeling approach was employed to reconcile the demands of various stakeholderson the woodland resources in ways that safeguard incomes and food security to localcommunities as well as sustaining the woodlands. The aim was to model problems andnot systems like general household behaviour or woodland management systems. Thecandidate models adopted were arrived at in two workshops in 1998 and 1999 basedon the following criteria:
• suitability for policy analysis,• capacity to model real agent’s behaviour,• availability of data,• capacity to handle various stakeholders and their various and conflicting goals,• availability of research capacity and skills within the group,• possibility for including some ecological considerations in the model, and• potential for development of models that share some of the data.
The models were considered with respect to policies driving change in ruraldevelopment and specifically forestry at the household level. These included policieson:
• Financial sector reform (credit and interest rates)• Prices of inputs and outputs, especially for agricultural production.• Non-farm income, especially that arising from sale of forest products and labour.• Infrastructure development, including market development and roads.• Direct limitations on harvest quantity and/or age class of woodlands and pricing
of primary forest produce

213G. Kowero
• Decentralization/devolution of power to local authorities.• Population growth.
Other considerations that influenced choice of models included:• Presence of farmers with varying degrees of resource endowments and economic
behaviour.• Presence of farmers mainly engaged in agriculture, and some with livestock.
Others have off-farm activities.• Availability of woodland resource of varying quality and products.• Availability of small scale commercial activities in all rural communities.• Presence of unequal accessibility to woodlands (in some cases strict restrictions
on government forest reserves allowed minimal access or completely deniedaccess).
• Awareness of role and effectiveness of government in managing woodlandresources.
• Local community woodland resource management strategies and initiativesexisting in some areas.
• Experiences with joint management of forest resources.• Awareness on loss of biodiversity and need for environmental conservation.• Movement of forest produce from rural localities to markets, mainly in urban
areas.• Lack of a system that integrates the efforts of all stakeholders or directs such
efforts towards desired goals.
Given this background weighted goal programming and system dynamics wereselected as the most appropriate modeling approaches for local community interactionswith the woodlands. The key highlights from this work are summarized in the followingsections.
2. IS COMMUNITY-BASED MANAGEMENT THE BEST FORSOUTHERN AFRICAN WOODLANDS?
There is a lot of emphasis (and rhetoric) to devolve the management of woodlands andother forest types in Southern Africa and elsewhere in the world to local communities.This is rooted in the belief is that this is the best thing to do because local communitieshave lived with these resources for time immemorial and presumably have the bestskills and knowledge to manage the resources. But this is mainly a qualitative assessment.
This section presents results of research undertaken in Malawi, Mozambique,Tanzania and Zimbabwe that examines this quantitatively and demonstrates how usecould be made of a system dynamic model, MIOMBOSIM, in planning and evaluatingwoodland management. The model was used to evaluate the outcome of three sets ofmanagement options, namely, communities managing the woodlands on their own in acooperative manner (cooperative model), communities and other stakeholders havingfree access to the woodlands and with no stakeholder in charge, i.e. an open accesssituation (uncooperative model), and the government (central, local or villagegovernment) being in control (command model). The latter (command model) hadthree management options depending on goals emphasised in management. On onehand we had emphasis on conservation or biodiversity protection (environment

214 AN OVERVIEW1: RECONCILING DEMANDS ON WOODLANDS THROUGH MODELLING
concern), while on the other extreme we had society allowed to extract what theyneeded, but within limits set by the managing authority (social concern). This providedfor the possibility of the public to satisfy their social demands for woodland products.The third option was a combination of social considerations tempered with conservationof the woodlands (environmental concern + social concern). This involved puttingweights on the parameters that represented both environmental and social concerns.Thus, in total five management scenarios were evaluated using MIOMBOSIM, theevaluation criteria including total benefits that would accrue to all stakeholders (aswell as to individual stakeholder groups), potential for employment creation, area ofwoodland converted to agriculture, standing volume of miombo on a sustainable basis.A number of sensitivity analyses were performed to test the sensitivity of some chosenvariables as well as effects of some macroeconomic and sectoral policies.
Apart from supplying firewood to the rural people the next most important thingthe communities looked for in the woodlands was income. The MIOMBOSIM resultsindicate, for all countries, that the cooperative management option, whereby thecommunities manage the woodlands jointly would not be the best management approachto employ if income generation to rural households were the criterion guidingmanagement. Involvement of government in management but with guided access tothese resources by local communities (i.e. command with social concerns management)would appear to be the best approach to pursue such an objective. This appears tocontradict the belief that if these resources were devolved to local communities, thenthey would be better managed and therefore be more beneficial to the communities –an important finding for policy makers. Apparently this is also true of Joint ForestManagement (JFM) in India2 The present situation on the ground in the study countriesis that mimicked by the ‘uncooperative model’ (open access), while policy drive in allthe four countries is to move largely towards the ‘cooperative’ regime; though with alimited role for government (command regime). However, from the study results thebest two management regimes advocated are the command with social concernsfollowed by the cooperative management approach.
In addition, the results show that there is no management regime capable ofsatisfying all goals (i.e. increased rural incomes, food security and environmental/biodiversity conservation); that is some trade-off between goals is necessary.
Rural unemployment is a serious problem in all the four countries, various policiesare being implemented with one of the objectives being to increase employment.However, the model results indicate that the employment potential offered by allmanagement regimes is fairly small. The implication is that the forestry sector appearsto have a fairly small potential to alleviate rural unemployment.
The four countries, as well as others in the region, are signatories to importantinternational agreements, protocols and conventions related to forestry. One suchconvention is on biodiversity conservation. The model results demonstrate thatintroducing biodiversity concerns in a resource abundant area (such as Gokwe, inZimbabwe) could reduce deforestation at a lower cost in terms of loss in benefits fromthe woodlands as compared to a resource poor area (such as Chivi in Zimbabwe).
The specific model results are presented in Chapters 20 to 22 and should beinterpreted carefully because the impact of any management regime and/or policyintervention on the welfare of stakeholders and on the forest resource will depend onthe amount of natural resource endowment and the initial economic conditions on theground. While the general direction of policy or institutional change can be predicted,the actual impact will depend on the initial conditions, which are site specific.

215G. Kowero
3. ARE HOUSEHOLD DEMANDS FOR FOOD SECURITY AND BETTERHOUSEHOLD INCOMES IRRECONCILABLE WITH BIODIVERSITY/ENVIRONMENTAL CONSERVATION?
This question was addressed through modeling the linkages between these threeimportant rural development goals in the countries of study, i.e. Malawi, Mozambique,Tanzania and Zimbabwe. A weighted goal programming model, MIOMBOGP, wasemployed to reconcile the goals of various stakeholders as they relate to improvinghousehold incomes, food security, and environmental protection or conservation.These were the three main goals identified and ranked by households in the studysites. They are also the key rural development goals in each of the countries. Themodel demonstrated how rural development planners can help households satisfythese goals using the principal resources they have, viz. their own labour, woodlandresources and agricultural investments. Some of these issues were also evaluatedusing MIOMBOSIM.
In Zimbabwe the results indicated that households owning draft animals havehigher incomes, are more food-self-sufficient, allocate more land to agricultural cropsthan non-draft owning households. It was also possible to demonstrate the tradeoffsin meeting the three goals. For example the results from Tanzanian sites indicate thatthe food security goal was satisfied in all sites. However, with respect to the incomegoal, it was only satisfied in Iringa, while there were negative deviations from thisgoal of about 13%, 10% and 7% in Babati, Handeni and Mufindi respectively. Thesedeviations represent the tradeoff the households have to make in terms of incomesforgone or not realized by satisfying their food security concerns.
Overall extra sectoral policies intended to promote agriculture were observed tohave mixed effects on forest development. For example, for draft-owning and non-draft owning households in Zimbabwe it is unlikely that moderate increases in theinput and output prices of agricultural crops or moderate improvement in crop yieldwould encourage encroachment on the remaining few woodlands for agricultural land.A similar observation was made on Malawian, Mozambican and Tanzanian households.The reason is that with a moderate input price or crop yield increase, by say 25%,households contain this by re-aligning the area allocated to crops and not by expandingcropland area. However, this changes, for example when we have significant yield oroutput price increases, say by 75%, there is a significant shift of land from the lowpriced crops, and where this is not possible then encroachment on woodlands foradditional land is likely. The households would definitely try to earn more throughhigher yields (from improved seed for example) or output prices.
It was also observed through the MIOMBOSIM for Zimbabwe that a significantincrease in agricultural input prices could lead to a decrease in woodland area on bothsites (Chivi and Gokwe) in the long run. However, the change in steady-state proportionof remaining woodland would appear to be indeterminate tending to support thehypothesis that there are two opposing impacts caused by input price increases, namely,decrease in deforestation due to decline in profitability, and increase in deforestationdue to substitution of land for cash inputs. Also an increase in agricultural productprices has the potential to increase deforestation with the magnitude of woodlandloss more in the forest resource abundant Gokwe area compared to a resource poorChivi area. Similar trends were observed in Malawi, but with relatively insignificantchanges to the area of woodland remaining at the end of the simulation period, i.e.the sustainable woodland area.

216 AN OVERVIEW1: RECONCILING DEMANDS ON WOODLANDS THROUGH MODELLING
It was noted in Zimbabwe that a decrease in income required to meet subsistenceneeds could lead to mixed impacts on deforestation under both community profitmaximisation and maximisation subject to environmental concern constraints. Thougha reduction in the requirement for agriculture to meet basic needs might lead to lessencroachment on forests, the labour released from existing agricultural land couldpromote non-agricultural forms of woodland use that exert pressure on the environment.
In general sectoral policies in the form of fees charged on various forest productsmanifest their impact on the forest resource mainly through commercial sector activitiesin the form of a reduction of harvesting activities, when there is no compensation inthe form of an increase in sales price. In the case of the household sector, short-termcompensation would be achieved through land clearing for agriculture. The reducedemployment resulting from reduced private sector activities could have negativeramification to rural development, if complementary policies are not put into place tocreate alternative employment opportunities. However, it was noted that a policy thataims at controlling harvest of firewood through pricing would only have noticeableeffects if firewood prices were increased substantially. We see for example that inMalawi, the response to firewood prices starts only when prices are increased by morethat 50%. This could most probably be due to the fact that labour for harvesting andtransporting the product on the head or with bicycles to distant markets could be alimiting factor for households to take advantage of the high prices. Further, fuelwoodprices are fairly low, and modest increases in prices might not trigger a significantreallocation of labour from crop production to fuelwood harvesting and selling.
Further, policies leading to employment creation outside agriculture and forestactivities appear to have insignificant impact on forest conservation when wages arelow.
For both the MIOMBOSIM and MIOMBOGP:• The results in most cases conformed to theory or logic. That is, it was possible
to resort to theory (socio-economic or biophysical) to justify or understand theresults.
• The two models were robust in that they provided a richness of informationfrom each of the countries and they also provided considerable diversity in theway each country used the same generic model to suit its specific local conditions,as well as in terms of how individuals or groups of scientists manipulated themodels according to their own skills.
• The results gave important scenarios that hold potential for improving planningthe livelihoods of local communities that depend directly on the woodlands, aswell as for improving management of the woodlands.
• There is need to emphasize that the models fail to capture some benefits offorests such as those related to biodiversity and those arising from non-marketedgoods and services.
4. CAN WE USE THE MODELS TO ANTICIPATE THE EFFECTS OFHIV/AIDS AND OTHER DISEASES ON RURAL LIVELIHOODS ANDTHE FOREST CONDITION?
One interesting output of the MIOMBOGP model relates to potential influences onhousehold food security, income and the woodland condition resulting from constrainingavailability of labour, either in its totality and/or by gender. Many things can constrain

217G. Kowero
labour availability including emigration of a family member, say to urban areas toseek employment. However, in many rural areas the message received during datacollection was one of frequent deaths, some most probably due to HIV/AIDS infections.It was possible to demonstrate using MIOMBOGP the implications of total loss ofhousehold adult(s) or partial loss of their labour due to illness or attending the sickand funerals.
For example in Malawi if male labour is completely absent in the household due todeath or emigration, the results indicate the potential for more firewood to be collectedand sold, to maintain level of household income that results from loss in tobaccoproduction, an activity that is male dominated. However in Zimbabwe the resultsimply that loss of male labour or its very limited availability results in less clearing ofthe woodlands because opening up of farms is a male dominated activity and firewoodtrade is not as pronounced as in Malawi.
This in no way claims that the model analysed the implications of AIDS becausewe did not collect data on the deaths and neither did we have clinical evidence of thecauses of the deaths. We only performed a sensitivity analysis based on certainassumptions on the extent of labour availability at the household level, and HIV/AIDSinfluences this availability.
ENDNOTES1. This text is based on chapters 14 to 22.2. S.J. Kumar 2002. Does “Participation” in Common Pool Resources Management Help the
Poor? A Social Cost-benefit Analysis of Joint Forest Management in Jharkhand, India. WorldDevelopment, 30(5): 763-782.

14.A system dynamics model formanagement of miombo woodlands1
U.R. Sumaila, A. Angelsen and G. Kowero
ABSTRACTThe miombo woodlands of eastern, central and southern Africa are some of the mostextensive dry forests in Africa. They supply a myriad of products and services for localpopulations, governments and the private sector, the main stakeholders. Planning themanagement and use of the woodlands by many and diverse stakeholders who oftenhave conflicting interests in the woodlands continues to be a great challenge to nationalgovernments and other interested parties.
This paper presents a system dynamic model, MIOMBOSIM, which has potentialfor facilitating planning developments in the woodlands in ways which reconcile theaspirations of the three major stakeholders. The model holds potential for analysingvarious policy implications on people and the woodlands, as well as the desirability ofvarious partnership arrangements for managing and using the woodland resources.
Key words: System dynamics model, miombo woodlands, stakeholders,management.
1. INTRODUCTIONMiombo woodland is one of the most extensive dry forest vegetation types in Africaoccurring in seven countries in eastern, central and southern Africa; namely Angola,Malawi, Mozambique, Tanzania, Democratic Republic of Congo, Zambia and Zimbabwe(White, 1983). They occupy an area of about 2.7 million square kilometres, almostequal to the combined land area of Mozambique, Malawi, Zimbabwe, Tanzania and Zambia.
The miombo ecosystem forms an integral part of rural communities living inthem or in their proximity by providing them with virtually all their energy requirements

219U.R. Sumaila, A. Angelsen and G. Kowero
in terms of fuelwood. The woodlands also provide building materials like poles andgrass for thatching, medicines, wild meat and other types of food and fruits, fodderfor livestock and wild game, and many other timber and non timber products.
The woodlands offer a number of opportunities to various stakeholders. Nationalgovernments are interested in them in terms of their capacity to support wildlife thatis important for tourism, a major foreign currency earner. Governments also considersociety wide interests which the private sector and local communities might not givehigh priority. These include conservation of woodlands important for water suppliesand control of soil erosion.
The private sector (firms and individuals) is interested in the woodlands forcommercial products, which may be extracted from them. The communities borderingthese woodlands are interested in them for a number of reasons, including their clearingfor agriculture, their use for livestock grazing, and as a source of a number of productsfor local consumption and trade.
In each country there are general policies guiding socio-economic development,which affect these three stakeholders in complex ways. Other policies attempt totarget the government as an institution, are specific to the private sector, or targetthe rural communities. Each of these three entities responds to the policies in theirown different ways.
The objective of this paper is to analyse the interaction between these threestakeholders: How do local communities and the private/commercial sectors respondto sectoral and macroeconomic policies? Given the reactions of these two agents topolicy initiatives, is it possible for the country to achieve its stated goals with respectto miombo woodland use? The fulfilment of some of these goals may create unduedemands on the woodland resources. It is these demands and the extent to whichthey manifest themselves in the woodlands that the current paper addresses. Inparticular, the paper focuses on how to meet these demands in a sustainable manner.
There are several approaches that can be used to reconcile the demands of thesethree sectors on the woodland resources. This paper presents a systems based modelfor miombo woodlands, MIOMBOSIM (miombo simulation), to serve as a tool for theanalysis of the sustainable use of these important natural resources, given the prevailingsocio-economic environment in the region. The paper is organised as follows. Thenext section presents some background information, and especially the context inwhich woodlands are managed. Section 3 presents the conceptual model and gives adescription of its interpretation for purposes of empirical application. Particularattention is given to the modelling of the household sector. In Section 4 datarequirements for the empirical implementation of the model are identified.
2. BACKGROUND
2.1 CIFOR researchIn 1996-98, CIFOR in collaboration with institutions from Malawi, Tanzania andZimbabwe implemented an exploratory study in these countries with the broad objectiveof evaluating the potential for improving the livelihoods of miombo woodland dependantcommunities. This exploratory project took into account the impact of some of themacro-economic policies implemented by the respective national governments in theirefforts to promote economic development. The study confirmed varying dependency

220 A SYSTEM DYNAMICS MODEL FOR MANAGEMENT OF MIOMBO WOODLANDS
of these communities on the woodlands for their incomes, with the woodlandscontributing up to 70% of household incomes in some study sites in Tanzania (Monelaet al. 2000) and as little as 10% in some sites in Zimbabwe (Campbell et al. 2000).Further, the study through regression analysis, confirmed the expansion of agriculturalcropland (Chipika and Kowero 2000; Minde et al. 2001), though not always conclusivelyinto the woodlands and/or grazing fields.
Macroeconomic policies such as the liberalization of trade, and the elimination ofgovernment subsidies to agriculture, were arguably responsible for these outcomes.Also market and policy failures lead to the under-valuation of natural forest resources.The basis for governments to jointly manage the natural forests with the localcommunities was challenged in both Zimbabwe (Mukamuri et al. 2001) and Malawi(Luhanga et al. 2001). The study also raised a number of potential research questions.In addition, the study did not constitute a strong basis for understanding the policyimpacts and their pathways. Neither did it facilitate generating scenarios useful fordeveloping plans to guide sustainable management and use of these woodlandresources.
With financial support from the European Commission, CIFOR embarked on afour-year research initiative in 1998, which sought to carry this work further andspecifically address the issue of multiple stakeholders in sustainable management ofthese woodlands. This was considered to be crucial because governments in the regioncontinued to implement macro-economic reforms, which affect the stakeholdersdifferently, with the consequence that their reactions with regards to their use of thewoodlands are unclear. The emphasis has been on understanding the pathways of thepolicies. Such information is useful in generating alternative scenarios useful formanaging and using the woodland resources sustainably. Some of the candidate policyoriented hypotheses proposed for evaluating and generating such scenarios include:
• Economic reform policies, especially those that improve credit availability tosmallholder farmers and agricultural input and output prices, serve as incentivesfor increased agricultural land expansion into woodland areas.
• Higher incomes and the increased demand for food that accompanies populationgrowth boost the demand for agricultural production as well as trade in forestproducts, and this has the potential to degrade the woodlands.
On the other hand, governments in the region are very weak in managing naturalforest resources. With economic reforms central government resources are becomingincreasingly limited, to the point where the central government is unable to effectivelymanage large tracts of land in their countries. However the emphasis on liberalizationof the economies of these countries and promotion of democracy has led to increasingparticipation of local communities and other entities in decision making, even innatural forest resource ownership and management.
2.2 New perspectives in forest managementAccording to Matose and Wily (1996), there is a clear move away from the centralisedand state-driven forest and woodland management of the colonial and post-independence periods towards decentralised, and mainly community-based regimes.This shift has prompted governments and non-government agencies to realign theirown functions away from direct management functions towards supporting technical

221U.R. Sumaila, A. Angelsen and G. Kowero
and advisory roles. The local communities, who are actually the main user groups, areincreasingly becoming partners in natural forest management. In some cases theymanage the forests on their own.
However, local management and control of natural forest resources is constrainedby the weakened state of local institutions and the presence or even absence of policiesand legislation that are either not enabling to local management and control or elseabsent altogether. Further, the rural communities are undergoing rapid social, economicand political change, due to economic development and modernisation. The questionis whether local management of these resources will survive and persist, in the faceof modernisation pressures and other socio-economic developments. Thisnotwithstanding, the said changes have increased the number of stakeholders in naturalforest resources, with the government (central and local), private sector, and localcommunities as the major stakeholders in this region.
Besides providing a methodology for analysing the effect of various economicpolicies, the paper also presents a framework for evaluating different partnershiparrangements for managing the woodlands and especially those involving localcommunities, private/commercial sector and the government/state. The methodologycan be employed to demonstrate impacts on long-term resource use and income fordifferent user groups. For example, it can be used to answer questions about what, forthe different groups, will be the gains of some form of joint forest management(cooperative) compared to a situation of unregulated resource competition (non-cooperative) among the groups.
3. THE CONCEPTUAL MODELA model is developed with two user groups (that is, commercial and household users)of miombo woodland resources who are under the control of a regulator (Figure 1).The regulator can be a central/local/village government, or any other authority. Threedifferent versions of the model are presented and are based on some assumptions onthe relationship between the user groups and the regulator. In what is denoted as thecommand model, the regulator can dictate the behaviour of the two sectors directly.In the cooperative model the users reach an agreement on how best to jointly use themiombo resources. On the other hand, in the non-cooperative model each of thedifferent user groups aims to maximize its own private benefits without any regard tothe implications of their actions on the other groups (see Sumaila 1999 and the reference
Figure 1. The main agents in the model
Regulator
Householdsector
Commercialsector

222 A SYSTEM DYNAMICS MODEL FOR MANAGEMENT OF MIOMBO WOODLANDS
therein).2 It should be noted that in the cooperative and non-cooperative versions ofthe model, the regulator could influence the use of miombo resources indirectly bychanging the parameters that affect the decisions taken by the commercial andhousehold users.
3.1 Modelling woodland resourcesThe miombo woodland resource is defined in terms of the land area on which themiombo is standing or the average volume of miombo on the land. Analytically andcomputationally, it does not really matter which of this is considered in the model.This is especially because for simulation purposes this quantity is normalised to one.At the start of the analysis, part of the woodland is cleared for agricultural productionwhile the rest remains forested. This is the initial condition, and conforms to realityin the region (Minde et al. 2000; Chipika and Kowero 2000). As described in detaillater, the area maintained as miombo woodland can change from year to year due toconversion to agricultural use. Hence, in each year in the time horizon of the model,the amount of land under agricultural production is the sum of the land already undercultivation plus the new land converted from miombo woodland to agricultural usethat year. One of the important outputs from this modelling exercise is therefore theamount of woodland resources cleared for agriculture in each year.
3.2 Modelling household usersIt is assumed that household users are involved in three economic sectors, that is,miombo products (firewood, charcoal and poles), agriculture, and off-miombo/off-farm. Modelling agricultural household behaviour is complicated by the fact that farmersare not fully integrated in the market and/or that markets do not function perfectly.This implies that market prices and wages cannot be used as the only guide for economicbehaviour. The opportunity cost of labour will be determined within the households byvariables such as the degree of poverty, assets held, labour force participation level,etc. The market assumptions form the basis for the distinction between non-separableand separable models. In a separable model the production decisions are solved first,and then the consumption decisions. In a non-separable model they must be solvedsimultaneously. In the separable model, all prices (including wages) are assumed to beconstant, and given by the market (perfect market assumption). Households’ productiondecisions can be studied as a profit maximising problem. Market prices and technologydetermine the behaviour. Variables such as population size and poverty level are assumedto have no direct effect on resource use.
A more realistic, but also more complex, non-separable household model takes thesefactors into account, as it determines the shadow price or opportunity cost of labourwithin the model. The standard formulation of a non-separable model is to assume thathouseholds maximize utility, which increases consumption and leisure time. The householdsbalance the drudgery or disutility of work against the utility of consumption, and reach a“subjective equilibrium”. Further, they must allocate their labour time to different activitiesin the most optimal way (marginal return to labour is the same for all activities). This isoften referred to as the Chayanovian model (see Angelsen 1999). In this article, the focuswill be on a representative household, whose objective is to maximize utility (U (.)), afunction of income (I) and leisure (T =Lmax
-L);

223U.R. Sumaila, A. Angelsen and G. Kowero
(1)
This specification of the utility function, which draws on Angelsen (1999), includesboth a subsistence level of consumption (Imin) and a limit on labour input (Lmax). In theabove equation, L is total labour used by the household in the activities they undertake,I is the gross income to households, α and β are parameters of the utility function.
Total differentiation of the utility function in (1) yields the shadow wage rate, z:3
(2)
where v is a parameter. In the current model, the household is assumed to allocatelabour such that the marginal productivity of labour or marginal return to labour –MRL - is the same across all activities and equal to the shadow wage rate. Forinstance, the marginal return to labour employed in agriculture (La) should equalthat to labour employed in harvesting wood products (Lm):
(3)
Figure 2. Main structure of the household component of the model
Utility (net benefits)
LabourIncome
Off-farm/off-miombo
Agriculture Miombo
3.2.1 Adding-up equationsThe gross household income comes from the net sale of miombo woodland products(I
m), agricultural produce (I
a), and off-miombo/off-farm activities (I
of), that is,
Ih = Im + Ia + Iof (4)
Total labour is found by simply adding the time devoted to the three main activitiesthe household is involved in.

224 A SYSTEM DYNAMICS MODEL FOR MANAGEMENT OF MIOMBO WOODLANDS
Lh = Im + (Ia + Ln) + Iof (5)
Within the agricultural work, a distinction is made between labour for cultivation(La) and labour for clearing new land (Ln) (i.e., converting miombo woodland intoagricultural land).
3.2.2 Agricultural activitiesFarmers are assumed to apply only two inputs, that is, labour and fertilizer, in additionto land. But since use is made of yield functions (and outputs and inputs are on ahectares basis), land becomes an implicit input in the model. Labour per ha (l) isassumed to be constant, whereas fertilizer (f) is a variable input. For computationalsimplicity (and as a fair approximation) use is made of an additive production function.Output per ha or yield (x) is then given by;
(6)
a, b, c, d are parameters to be estimated from household survey data.The farmers decide how much fertilizer to apply per ha in such a way that the
income, ignoring labour costs for the time being, is maximized;
(7)
The condition for optimal fertilizer use is then;
(8)
This formulation makes this part of the model recursive and easier to compute.First, fertilizer use in each period is determined by the exogenous agricultural outputprice (pa) and fertilizer price (pf) ratio, plus the parameters. The next step is to putthis into the production function to determine the yield.
Net agricultural income is then defined as;
(9)
Total labour employed in the agricultural sector is similarly expressed as;
(10)
Ha is the total agricultural area, given by the sum of their initial agricultural landarea (Hi) and new land converted from miombo to agriculture (Hn). A key decision forthe households is whether or not to expand their land area, and if they do, by howmany hectares. The starting point is to compare the net benefit that accrues to themper ha of miombo used for wood products (Bm), and that which accrues to them fromthe conversion of the woodland resources for agricultural production (Ba).
Current benefits from one ha of agricultural land are defined as;
(11)

225U.R. Sumaila, A. Angelsen and G. Kowero
For new agricultural land we must also subtract the clearing costs per ha, zl.These should be convex in land cleared (e.g., as they move further away to convertmiombo to cropping land), and a possible function would be;
(12)
where lc is the labour required for clearing per ha, g and τ are parameters, and Hn
denotes new land cleared. The key is that the labour inputs should be convex in area,HC, and therefore be raised to a number greater than one (τ > 1; set to 1.5 in Equation13).
Total labour for clearing new land is then given by;
(13)
Note that the calculation of labour for clearing becomes a bit more complex asthe labour requirements per ha increase.
Thus, if the benefits from miombo are greater than those from agriculture onnew land;
(14)
for all positive values of Hn, then there will be no conversion of miombo to agriculture.If this is not the case, then agriculture will be expanded up to the point where:
(15)
The situation can be illustrated graphically in a box-diagram as in Figure 3. Thelength of the box represents total land area. Agricultural land is measured from theleft y-axis to the right, while miombo land is measured from the right y-axis and tothe left.
Figure 3. Farmer choice of agricultural land expansion
X2X1
marginal net benefits fromagriculture (Ba)
marginal net benefits from miombo(Bm)
Ba - clearing costs (zlc)

226 A SYSTEM DYNAMICS MODEL FOR MANAGEMENT OF MIOMBO WOODLANDS
The initial amount of land under agricultural cultivation is depicted at point X1.Net marginal benefit from agriculture (B
a) is denoted by the thick line. This line is
discontinuous at point X1 as the net benefits from agricultural production on landbeyond this point has to include the clearing costs (zlc). As the figure is drawn, it willbe beneficial to the farmer to clear some new land, up to point X2 where the (Ba – zlc)is equal to the marginal net benefits of the remaining miombo land (Bm). Thus, in thissituation there will be some deforestation.
3.2.3 Miombo activitiesFarm households are assumed to collect three different products from miombowoodlands: poles, fuelwood and timber. The gross income from this activity is givenby;
(16)
where Hm is the quantity of miombo harvested for use as poles, fuelwood andtimber, pave is the average weighted price received for the three different wood products.The portion of Hm that is used as poles, fuelwood or timber is determine by multiplyingH
m by the corresponding relative prices.
Harvest (or miombo use) is a function of both the labour used in the miombosector (Lm) and volume of standing miombo (N). Using a Cobb-Douglas function weget;
(17)
where (0,1) parameters of the harvest function, and qh is the harvestefficiency coefficient for the household sector. This is a fraction depicting the rate orportion of N that can be harvested or used in a given period if all the labour availableto household were to be used for this activity.
3.2.4 Off-farm/off-miombo activitiesWe introduce a fixed off-farm and off-miombo employment (LOF) and a given marketwage rate (w), such that total off-farm/off-miombo income is;
(18)
Since both the wage rate and off-farm labour are fixed, these variables can beused to study the effects of more economy-wide changes in the economy (e.g., higheconomic growth or recession), which usually affect both the wage rate and employmentopportunities.
In summary, the total net benefits to household users, Bh, of miombo is given by
(19)
where Bh = Ba + Bm

227U.R. Sumaila, A. Angelsen and G. Kowero
3.3 Commercial usersCommercial users are assumed to decide on how much miombo to harvest in eachyear in order to maximize their discounted economic benefits. This means they faceonly one economic sector, namely, the miombo products sector. Modelling commercialusers behaviour is a lot simpler than modelling household user behaviour because theyare involved in only one activity, that is, harvesting miombo woodland. In addition,the wage rate for commercial users (k) is exogenously fixed. In a similar fashion tothe household users, we define the harvest function of commercial users as;
(20)
where Lc is the labour used by commercial users, and qc is the harvest efficiencycoefficient for the commercial sector. Note that the total labour available to bothhousehold and commercial sectors, L
t, is then L
c + L
h.
Net income (benefits) for the commercial users is then;
(21)
3.4 Miombo woodland dynamicsThe ecology of miombo is represented by the following equations
(22)
Nt = sNt-1 + Rt __ Hc,t
__ Hh,t; No given (23)
(23’)
Equation (22) captures any natural regeneration that takes place, with Kt denotingthe volume in a given year. Equation (23’) describes the growth over time of themiombo. The parameters ε, φ and γ are ecological, they can be used to vary the qualityof the miombo stand (see Frost 1996).
3.5 Institutional aspects of the modelIn all countries with miombo woodlands it is assumed that a body (a stakeholder)regulates the use of this resource. This body may be a government authority, acommunity-based management entity or a sole owner of the resource. This body isassumed to be concerned with maximizing overall benefits from the use of the resourcethrough time. Elements of the overall benefit function may include direct economicbenefits; social benefits, e.g., the need to preserve settlement patterns in rural areas;and environmental benefits not traded in the market, e.g. benefits derived frombiodiversity. The challenge facing the regulator is to determine the quantity of thewoodlands to be used by the households and the commercial sectors in each year inorder to maximize the management objectives.
The problem can be conceived in the following way. Let the net private benefitsto the commercial and household users (from the use of the woodland resources) beBc, and Bh, respectively, as defined in equations (19) and (21). Social benefits are

228 A SYSTEM DYNAMICS MODEL FOR MANAGEMENT OF MIOMBO WOODLANDS
denoted Bs, while Be represents environmental benefits. Social benefits may depend insome way on the amount of woodland resources used by one of the groups, say householdusers, for social, cultural or other reasons. Environmental benefits will depend positivelyon the amount of standing miombo (N- Hc – Hh) or negatively on the total woodlandharvested (H
c + H
h), where N is the total volume (or even biomass) of miombo woodland
resources at a given time.Formally, we have,
(24)
where
It should be noted that θ c and θ h are the weights put on the harvests of the commercialand household users due to social concerns. These express the social preferences ofsociety. These parameters can take values of 0 or 1. They take a value of 0 if societydoes not have any social preference for the harvest of a given participant, and a valueof 1 if otherwise. Later we introduce an environmental parameter, θ , to reflect theextent to which society-wide environmental concerns are incorporated into the decisionmaking process (see Lopez and Altobello 1994).
3.5.1 Decision making by household and commercial usersBefore going into detailed discussions of the different game theoretic models in thispaper, it is proper to give an overview description of how decisions by household andcommercial users are made in the model. At the start of the game or simulation, webegin with the volume (or even land area) of miombo woodland (Nt). As illustrated inFigure 4, part of Nt is cleared for agricultural cultivation (Na), while the remaining, Nm,is retained under miombo. The models that are developed are therefore concernedwith the further use and allocation of Nm among household and commercial users.
Commercial users decide how much of Nm to harvest (Hc) in order to maximizetheir discounted benefits (profits). This is done in a single step. In the case of thehouseholds, however, their decision-making is made in three stages. First, they decidehow much of Nm to retain under miombo for their use (Hh) so as to maximize theirutility over time. In the second stage, household users decide how much of Hh to clearand put the land into agricultural production (Ha), and how much to retain as woodland(Hm) for supply of their forest products (see Figure 4). Again, this decision is madewith a view to maximizing their utility. Finally, household users decide how much of Hm
to use as fuelwood (Hfw), poles (Hpo) and timber (Htim). The allocation of resources toall of these activities depends on the relative prices or utilities received from each ofthem by the households. To elaborate more on this important aspect of the MIOMBOSIM

229U.R. Sumaila, A. Angelsen and G. Kowero
model, let the price for agricultural produce be given by pa and that for fuelwood,poles and timber be pfw, ppo, and ptim, respectively. If the optimal amount/quantity ofmiombo resources for household use from Equation (25) is Hh
*, then the portion of thisquantity forgone in preference to agricultural cultivation is given by
(25)
The quantity of miombo exploited for wood products, Hwd, is then given by thedifference between Hh
* and Ha. Finally, the portions of Ha that go to fuelwood (andsimilarly for poles and timber), is given by
(26)
In any given year, each of the above H quantities can be computed, and the totalamount of land under agricultural cultivation determined by adding Na to Ha. The totalarea under agricultural production is determined using relevant conversion factors.
Figure 4. Steps in decision making by the household and commercial sectors
Total miombo land (Nt)
Agric land (Na)
Household use (Hh)
Miombo (Nm)
Comm. Use (Hc)
Agric cultivation (Ha) Wood harvest (Hm)
Fuelwood (Hfw) Poles (Hpo) Timber (Htim)
3.5.2 The command modelThe command model mimics the approach employed by many government forestrydepartments in the eastern and southern African region in the planning, managementand use of their natural forest resources. Usually governments consider forest benefitsto households (Bh), the private/commercial sector (Bc), the society as a whole (Bs), aswell as national and international public goods like environmental benefits (Be). The

230 A SYSTEM DYNAMICS MODEL FOR MANAGEMENT OF MIOMBO WOODLANDS
model developed in this paper shows potential for use as a planning tool in governmentforestry departments. It is hence assumed in the model that the “commander” seeksto maximize total net benefits Bt through the choice of the amount of labour to beused by the commercial sector and the households in each year in the time horizon ofthe model, t=1.T, where T is the last (terminal) period:
(27)
subject to the ecological and household labour constraints described earlier.In the above equation,
ρ is the discount factor and r is the discount rate. It is important to note that theamount of miombo resources to be used for both agricultural cultivation and supply ofwood products is determined from Equation (27). The division of these into the variousactivities carried out by the household users is already described in section 3.5.1.
3.5.3 The cooperative modelAs mentioned earlier there are moves towards participatory management of the naturalforestry resources. The command model can be modified so as to incorporate theinvolvement of the stakeholders in the management of the resource in a cooperativesetting. For instance, if we consider a situation in which there is joint management ofnatural forest resources between the households (local communities) and the privatesector, a cooperative management objective can be presented as follows:
(28)
subject to the constraint in Equation (27).In the cooperative setting the households and the private sector put weights α and
(1-α ) respectively on their individual benefits (which is a measure of their preferences)so as to maximize their combined benefits from exploiting the woodland resource (seeMunro 1979). The private benefits are likely to differ from the social planner’s benefitsas represented in the command model. For instance, private stakeholders may not caremuch about social, cultural or environmental benefits from the woodlands, and even ifthey do, it is likely to be in a manner different from that of a social planner.
3.5.4 The non-cooperative modelThere are situations in which local communities (households) or the private sectorown and manage natural forest resources on their own and without taking the interestof other stakeholders into account. Under such situations, we have a non-cooperative

231U.R. Sumaila, A. Angelsen and G. Kowero
model. The management problem facing household users can be defined as follows:
(29)
subject to the stock constraint in Equation (27).Similarly, the non-cooperative management problem facing the private sector
can be stated as follows.
(30)
subject to the stock constraint in Equation (27).
3.6 Solving the modelsTo solve the above general models, appropriate Lagrangian functions have todeveloped. The command model is used to illustrate how this is done. In this case theLagrangian is given by:
(31)
The first order conditions for optimisation are:
(32)
(33)

232 A SYSTEM DYNAMICS MODEL FOR MANAGEMENT OF MIOMBO WOODLANDS
(34)
(35)
In the above system of equations, λ and ξ are defined as the Lagrangian multipliersor the shadow price of miombo and household labour, respectively. Equation (32) statesthat in any given period the net present value of the marginal harvest by commercialusers plus the discounted net marginal social benefit from the exploitation of the resourceby this group minus the net marginal stock effect of their exploitation activities on theenvironment, must equal the shadow price of the miombo resource. A similar interpretationstems from equation (33), with respect to the harvesting activities of the householdusers. When combined the two equations demonstrate that the optimal allocation ofharvest to the two groups of users must be such that the marginal net benefit to thecommercial users must equal that to the household users. Solving these equations for theunknown variables yields the optimal harvest to each user and the optimal stock levels ineach period. Once these are determined the remaining task of the regulator is to ensure,by some means, that the user’s harvest precisely the optimal quantities determined bythe model.
3.7 Simulating the modelThe numerical approach presented in Flåm (1993) and applied in Sumaila (1995), thesystem dynamics simulation package Powersim, and data collected during fieldworkcan be combined to help us provide quantitative answers to a number of questions,including but not limited to the following:
• How much (i) harvest, (ii) benefits and (iii) employment will different woodlandmanagement options translate into for the commercial and household sectors?
• How much woodland is lost under different management regimes, governmentand macroeconomic policies?
• How does the harvesting technology used by the stakeholders affect the benefitsthey derive from using the woodlands?
• How sustainable are the harvest levels that will emerge from various governmentregulatory policies?
• How do prices of inputs and outputs (in agriculture and forestry) impact onproduction volume and methods, employment potential, and structure of theindustry?
• How does off-miombo and/or off-farm income change the various outcomes ofthe model?
• How does change in subsistence income to household users impact on the outcomesof the model?

233U.R. Sumaila, A. Angelsen and G. Kowero
ENDNOTES1. Also available as: Sumaila, U.R., A. Angelsen and G. Kowero. 2001. A system dynamics model
for management of miombo woodlands. In: Modelling methods for policy analysis in miombowoodlands.
Occasional Paper No. 35, CIFOR, Bogor. pp.17-30.2. By developing both the cooperative and non-cooperative models, it is possible to demonstrate
whether decentralization of forest management could lead to the emergence of a cooperativemanagement regime.
3. This is alternatively called the marginal rate of substitution between labour and consumption(income), the virtual price of labour, the opportunity costs of labour, or the subjective wage rate.
REFERENCESAngelsen, A. 1999 Agricultural expansion and deforestation: Modelling the impact of
population, market forces and property rights. Journal of Development Economics58: 185-218.
Campbell, B.M., Mukamuri, B.B. and Kowero, G.S. 2000 Exploring rural livelihoods,woodland use and management in the communal areas of Zimbabwe. In: Temu,A.B., Lund, G., Malimbwi, R.E., Kowero, G.S., Klein, K., Malende, Y. and Kone, I.(eds.) Off-forest tree resources of Africa. Proceedings of a workshop held atArusha, Tanzania, 1999, 119-137. The African Academy of Sciences.
Chipika, J.T. and Kowero, G. 2000. Deforestation of woodlands in communal areas ofZimbabwe: Is it due to agricultural policies? Agriculture, Ecosystems and Environ-ment 79: 175-185.
Clarke, J., Cavendis, W., Coote, C. 1996 Rural households and miombo woodlands:Use, value and management. In: Campbell, B. (ed.): The miombo in transition:Woodlands and welfare in Africa, 101 – 135. Centre for International Forestry Re-search (CIFOR), Bogor, Indonesia.
Flåm, S.D. 1993 Path to constrained Nash equilibria. Applied Mathematics and Optimisation27: 275-289.
Frost, P. 1996 The ecology of miombo woodlands. In: Campbell, B. (ed.): The miomboin transition: Woodlands and welfare in Africa, 11–57. Centre for InternationalForestry Research (CIFOR), Bogor, Indonesia.
Lopez, S. and Altobello 1994 Amenity benefits and the optimal allocation of land. LandEconomics 70: 53-62.
Luhanga, J., Mwabumba, L., Minde, I. and Kowero, G. 1999 Some views from ruralcommunities in Malawi on use and management of miombo woodlands. Unpub-lished draft.
Matose, F. and Wily, L. 1996 Institutional arrangements governing the use and manage-ment of woodlands. In: Campbell, B. (ed.) The miombo in transition: Woodlandsand welfare in Africa. Centre for International Forestry Research (CIFOR), Bogor,Indonesia. 266p.
Minde, I., Kowero, G., Ngugi, D., and Luhanga, J. 2001 Agricultural land expansion anddeforestation in Malawi. Forests, Trees and Livelihoods 11: 167-182.
Monela, G.C., Kajembe, G.C., Kaoneka, A.R.S. and Kowero, G. 2000 Household liveli-hood strategies in the miombo woodlands of Tanzania. Tanzania Journal of For-estry and Nature Conservation 73: 17-33.

234 A SYSTEM DYNAMICS MODEL FOR MANAGEMENT OF MIOMBO WOODLANDS
Mukamuri, B.B., Campbell, B.M. and Kowero, G. 2003 Local organisations and naturalresource management in the face of economic hardships: a case study from Zim-babwe. (In this book).
Munro, G. 1979 The optimal management of transboundary renewable resources. Cana-dian Journal of Economics 12: 355-376.
Sumaila, U.R. 1999 A review of game theoretic models of fishing. Marine Policy 23: 1-10.
Sumaila, U.R. 1997 Co-operative and non-co-operative exploitation of the Arcto-Nor-wegian cod stock in the Barents Sea. Environmental and Resource Economics 10:147-165.
Sumaila, U.R. 1995 Irreversible capital investment in a two-stage bimatrix fishery gamemodel. Marine Resource Economics 10: 263 - 283.
White, F. 1983 The vegetation of Africa. UNESCO, Paris. 356p + maps.

235U.R. Sumaila, A. Angelsen and G. Kowero
APPENDIX 1. LIST OF VARIABLES AND PARAMETERS FORMIOMBOSIM
Model parameter
A parameter in production functionA superscripts agricultural sectorB parameter in production functionB BenefitsC parameter in production function, subscript commercial sectorD parameter in production function (yield effect of fertilizer)E effort in commercial sectorF fertilizer (per ha)G parameter in labour for clearing functionH subscript household sectorH hectare of landI IncomeK costs of effort in commercial sectorL labour per ha in agriculture
Model variables
L LabourM subscript miombo sectorN subscript new (cleared) land)N stock of miombo resourcesOf subscript off-farm sector (OF)
Model functionsP PriceQ efficiency parameter in harvest functionS survival rate in miombo growth functionT leisure for household (Lmax – L)U utility for householdV parameter in utility functionW market wage rate for householdX agricultural yield
Subscripts and superscripts
Y miombo harvestZ shadow wage rate for householdα parameter in utility functionβ parameter in utility functionµ parameter in harvest functionψ parameter in harvest functionθ weights in social benefit functionρ discount factorτ parameter in labour for clearing functionε parameter in miombo growth functionφ parameter in miombo growth functionγ parameter in miombo growth function

236 A SYSTEM DYNAMICS MODEL FOR MANAGEMENT OF MIOMBO WOODLANDS
APPENDIX 2. THE SOLUTION PROCEDURE (See Sumaila 1997)
(1)
(2)
(3)
switch2
(4)
(5)
The above adjustment equations can be manipulated to capture:The command model: when θ , and either θ
c or θ
h are not zero. It should be noted
that there is room for flexibility in the command model in the sense that one can give

237U.R. Sumaila, A. Angelsen and G. Kowero
varying emphasis to social and environment values by selecting different values for theθ s.
The command model reduces to a cooperative model if all the θ s are set equal tozero.
The command model collapses to a non-cooperative model if in addition to all theθ s being zero, the marginal stock effect on benefits of each stakeholder is not internalisedby the users. That is, when the first term in the stock adjustment Equation (27) is setequal to zero.

238 A SYSTEM DYNAMICS MODEL FOR MANAGEMENT OF MIOMBO WOODLANDS
APPENDIX 3. SCIENTISTS WHO PARTICIPATED IN DEVELOPINGTHE MODELS
Country and institution Area of specialization
A. Malawi
University of MalawiDr. Charles Mataya Agricultural economicsMr. Charles Jumbe EconomicsMr. Richard Kachule Agricultural economicsMr. Hardwick Tchale Agricultural economics
B. Mozambique
1. Eduardo Mondlane UniversityDr. Isilda Nhantumbo (now with IUCN) Natural resource managementDr. Gilead Mlay Agricultural economicsMr. Mario Falcao Forest economics
2. Forestry Research CentreMr. Jose Soares Forestry
C. Tanzania
Sokoine University of AgricultureDr. Gerald Monela Forest economics and managementDr. Abdallah Kaoneka (late) Forest economics and managementDr. Yonika Ngaga Forest economicsDr. George Kajembe Anthropology and social forestryDr. Zebedayo Mvena Rural sociologyDr. Florens Turuka Agricultural economics
D. ZimbabweUniversity of ZimbabweDr. Ramos Mabugu EconomicsDr. Chris Sukume Agricultural economics
Southern Alliance For Indigenous Resources (SAFIRE)Mr. Peter Gondo Forestry
E. CanadaUniversity of British Columbia
Dr. Ussif Rashid Sumaila (also with CMI, Bergen, Norway) Environmental and NaturalResource Economics and Management
F: NorwayAgricultural University of NorwayDr. Arild Angelsen (also with CIFOR) Economics
G. CIFORDr. Godwin Kowero Forest economics and managementProf. Bruce Campbell Ecologist

15.Manual for users of MIOMBOSIM:A simulation model for the managementof miombo woodlands
G. Kowero and U.R. Sumaila
1. INTRODUCTION
What is Miombosim?Miombo woodland is one of the most extensive dry forest vegetation types in Africaoccurring in seven countries in eastern, central and southern Africa; namely Angola,Malawi, Mozambique, Tanzania, Democratic Republic of Congo, Zambia and Zimbabwe.The woodlands occupy an area of about 2.7 million square kilometres, almost equal tothe combined land area of Mozambique, Malawi, Zimbabwe, Tanzania and Zambia.
The miombo ecosystem forms an integral part of rural communities living inthem or in their proximity by providing them with virtually all their energy requirementsin terms of fuelwood. The woodlands also provide building materials like poles andgrass for thatching, medicines, wild meat and other types of food and fruits, fodderfor livestock and wild game, and many timber and non-timber products. The woodlandsoffer a number of opportunities to various stakeholders. In each country there arepolicies guiding socio-economic development that affect the stakeholders and theirenvironment in complex ways.
Miombosim is a system dynamics model that can be used to reconcile the demandsof these stakeholders on the woodland resources in a sustainable manner. It uses asimulation software package, commonly known as Powersim, to simulate a gametheoretic computational model for the management of miombo woodland resources.We first described in the model the different elements that characterize the interactionsof the stakeholders (or players in game theory language) with the woodlands as adynamic system. Mimbosim is therefore a platform on which we can evaluate theimplications of different policies. This allows decision makers to understand the policy

240 MANUAL FOR USERS OF MIOMBOSIM
implication for further refinement (if necessary) before recommending theirimplementation.
What are the goals of Miombosim?A main goal of Miombosim is to provide researchers, resource managers, governmentdepartments and non-governmental organizations a tool for policy exploration regardingthe use and management of miombo woodland resources. Miombosim therefore helpsall these stakeholders to understand the complex relationships that characterize themanagement and use of miombo woodlands, and this can be enhanced by experimentingwith different policy options or through sensitivity analysis on values of chosenparameters.
What is expected from runs of Miombosim?Each Miombosim run will represent different policy initiatives under different scenariosfor the management and use of the miombo woodland resources. The user specifiesthe policy options to experiment with and the Miombosim runs facilitate the selectionof the most favourable policy option.
2. USER ENVIRONMENTPowersim application window displays menus and provides the workspace for anysimulation run of Miombosim. The Powersim application window is based on the sameprinciples as any typical Windows application such as Excel, hence, knowledge of howto use other Windows based applications will be of great benefit to Miombosim users.
This manual is not intended to give the basics of Powersim; rather, it is intendedto guide users on how to make use of a model (Miombosim) developed using Powersim.The assumption is that policy makers and other users will already have the problemformulated for this simulator and their interest is to use this as a basis for creatingscenarios on different policy options and even testing the sensitivity of the values ofvarious parameters. This therefore expands their scope for planning and decision-making as well as grounding such decisions in science.
For further details on this simulator and on the casual loop diagramming inPowersim see http://www.powersimsolutions.com/default.asp
Powersim menubar
The menu bar is located below the title bar at the top of the application windowand contains all the Powersim commands. To view all the commands in a menu, do oneof the following:
• Click the menu name• Press Alt + N, where N is the underlined letter in the menu name. For example,
press Alt + F to open the File menu.

241G. Kowero and U.R. Sumaila
Powersim commandbar
The commandbar is located below the menubar, and contains a set of buttons forperforming the most frequently used commands in Powersim, for example, Open;Save, and Copy files; Run and Stop.
Powersim workspaceThe workspace is where you view casual loop and flow diagram models and adjustmodel parameters using input presentations. This is the area that will be of interestto policy makers and other interested parties. It is in the workspace that scenariogeneration for different policies as well as sensitivity analyses are made. This can bedone by modifying the casual loops and the model parameters in the equations usinginformation supplied by stakeholders like policy makers.
Powersim statusbar
The statusbar is usually displayed at the bottom of the Powersim application window.It contains different kinds of status information, for example, context-sentitive menuhelp and the current simulation time.
3. MENU COMMANDSThis section provides you with a detailed description of all commands and optionsfound in Powersim menus. Note that some of these are also available as buttons in thecommandbar.
File menuYou use this menu to open, save and print documents or quit Powersim workspace. Touse a document, you must first open and display it on your screen. You can thenperform simulation runs.
Overview of File menu commands• Open – Opens an existing document• Close – Closes all windows of the active document• Save – Saves changes made to the active document• Save As – Saves and names the active file• Page setup – defines page setup for the current document• Print – prints the active window according to the parameters you specify• Print Setup – identifies the printer you want to use and sets options for it• Properties – Displays properties of the active documents• Exit – Quits Powersim, prompts to save any unsaved documents

242 MANUAL FOR USERS OF MIOMBOSIM
Edit menuYou use this menu to copy areas from your document, view the scaling of parameters,and searching for variables and parameters in a diagram.
Overview of Edit menu commands• Copy – Copies the selected area and places it on a clipboard• Scale – Displays the minimum and maximum scaling settings for variables• Find – Searches for a variable or parameter in the active diagram
View menuUse this menu to show or hide the commandbar and statusbar and to shrink or enlargethe diagram.
Overview of View menu commands• Commandbar – Toggles the commandbar on/off• Statusbar – Toggles the statusbar on/off• Zoom – Enlarges or reduces the contents of the active diagram window
Simulate menuUse this menu to start, stop or pause a simulation, and to inspect/specify run andsimulation parameters, including time step and integration methods.
Overview of Simulate menu commands• Run – Start a simulation• Pause – Toggles pause on/off• Stop – Stops a simulation• Clear Results – Clears stored simulation results• Run Setup – Defines run parameters• Simulation Setup – Defines simulation parameters (start, stop, time step, etc.)
Tool menuYou use this menu to build your model in Powersim language
Overview of tool menu commands• Level – symbol used to represent a stock• Auxiliary – symbol representing an auxiliary function• Constant - symbol used to represent a parameter• Flow-with-rate – used to represent a flow into or out of a stock• Link – used to link variables and parameters in the model• Erase – used to erase/delete a symbol• Camera – used to make a photocopy of a symbol• Number – used to report a number (a parameter) in the model• Time table – used to report results from a simulation in table form• Time graph - employed to report results in graphical form• Scatter gragh – illustrates results form simulations using scatter diagrams• Array graph – used to report results of array variables (see Figure 2).

243G. Kowero and U.R. Sumaila
Window menuYou use this menu to rearrange windows or activate specified windows
Overview of Window menu commands• Cascade – Arranges windows in an overlapping pattern• Tiles – Arranges windows side by side so that all windows are visible• Arrange Icons – Arranges icons in rows• Close All – Closes all Powersim windows• <list of windows> - Lists open windows
Help menuUse this menu to get help on using Powersim
Overview of Help menu commands• Contents – Displays the contents screen of Help• Getting Started – Displays the Getting Started screen of Help• Current Document - Opens the Help file associated with the current document• About Powersim – Displays version number, copyright notice, and license
information.
4. RUNNING MIOMBOSIMThis section contains step-by-step instructions on how to perform an experimentalsimulation session using Powersim. By following the instructions below, you will learnhow to open and simulate a ready-made Miombosim model. However, for this we haveto first familiarize ourselves with key symbols used in Powersim.
Symbols and building blocks for MiombosimThe aim of this section is to familiarize the user with key Powersim symbols andbuilding blocks, which are used to develop Miombosim. Figure 1 shows a simple examplethat demonstrates how the symbols are put together in a model.
Level: Represented as a square, it is a variable type, which accumulates changes,for example, the volume of miombo in a stand or the number of people who cutmiombo trees at any given time. It can be increased or decreased by what we call‘flows’, as defined below (see next definition). See Appendix 1 for an example.
Flow-with-rate: Represented as a circle with an arrow sitting on top of the circle,it influences levels by adding the net flow of new stock, for example, new miombogrowth, into levels. The flow is controlled by the connected rate variables, normally anauxiliary variable which defines how the stock of miombo changes (see below). Examplesof these are given in Appendix 1.
Auxiliary: Represented as a circle, it is a variable type or function, which containscalculations based on other variables and parameters. It is usually a ‘help’ functionthat is used to define parts of a larger equation in the model. A function that describesmiombo growth can be expressed using an auxiliary function, which can then be fedinto the calculation of a flow function.
Constant: Represented as a diamond, it is a variable, which contains fixed valuesthat are used in calculations of other variables or flows. Examples of constants are

244 MANUAL FOR USERS OF MIOMBOSIM
Figure 1. The main Powersim symbols as used in a simple Miombosim model
prices in a constant price model or natural mortality rate of miombo woodland (seeAppendix 1 for an example). Constants hold the parameters of the model
Cloud: Represented as a cloud, it is an undefined source or outlet for a flow to, orfrom a level. It denotes that we are at a model’s outer limits. A cloud delimits themodel; it represents the end of a model, as it were. For example, to define a flow of‘new’ miombo biomass (due to growth) into the existing biomass, we show a flow byan arrow leaving a cloud and pointing into the Level. Cloud symbol expresses the factthat the growth comes from ‘something’ exogenous to the model.
Figure 1 and Appendix 1 display the structure of an example of Miombosim indiagram and equation formats, respectively. The diagram demonstrates how the abovesymbols are put together to build Miombosim, while the equations define the variablesand parameters of the model mathematically. A brief description of various elementsof the model are given in the Appendix 1.

245G. Kowero and U.R. Sumaila
Opening Miombosim• From the File menu of Powersim choose Open or click Open in the Commandbar.• From the Open dialog box select the model you want to open from the File Name
listbox and select OK.
Data input and model runsChoosing Start- and-Stop Time:
• An important aspect of the modeling of a problem is the choice of a time horizonfor your model. The default start- and-stop times for Miombosim are 0 and 100,respectively. The time horizon may be simply units of computational time as inMiombosim, or some period of time (weeks, months, years, etc). In Miombosim,the actual computational time horizon assumed depends on how quickly themodel converges to the equilibrium solution.
• Click Run in the commandbar to start a simulation run based on the originalparameter values of the model.
• You may pause and resume a simulation whenever you like by clicking the Pausebutton.
• Let the simulation run until it has reached its stop time, or stop it manually byclicking the stop button. Note that you cannot resume a simulation after youhave stopped it. You will then have to start a new simulation run.
• As the simulation runs, you will see that the current simulation time is indicatedin the statusbar.
Policy analysis using MiombosimSimulating Miombosim means to have Powersim compute the results over time basedon the assumptions used to construct the model.
To simulate the impacts that different causes of actions might have on the resultsof Miombosim, we can make parameter adjustments before a simulation run. Forexample, we are interested in understanding the implication (s) of a move taken by agovernment of a country through a policy that leads to a 10% increase in the price ofpoles from miombo woodlands. This change needs to be incorporated into Miombsim,and the model re-run to determine the effect of this change on the predicted outcomesof the model. To do this physically, open the base case diagram of the model, find theprice of poles parameter (see Appendix 1) and by double clicking it you will get to theinterface where you can make changes to the price. Make the change and close theinterface. Then run model.
After opening the relevant Miombosim model and performing a base run, followthe following steps to generate another policy scenario or to perform a sensitivityanalysis:
From the Window menu, choose the parameter to be tested, for example price ofpoles because of policy changes or the growth rate of standing volume of miombo tocheck how sensitive the predicted results of the model are to any of these parameters,and hence, the consequences of policy changes that lead to such changes to theparameters
• Note base case value of the parameter(s) to be tested.• Change the value of this parameter as the situation dictates, for example, if it
is price of poles or fuelwood, it can be increased or decreased by say 10%

246 MANUAL FOR USERS OF MIOMBOSIM
depending on the anticipated market condition, price controls or governmentpolicies.
• Start a new simulation.
Compare results from new simulation with those of base case simulation to identifythe effect of the parameter adjustment. For example, the base results of a simulationrun of a Miombosim model for one forest reserve, showed, among other things, thata 30% decrease in post harvest losses of agricultural produce could lead to a decreasein the benefits to the household sector from the use of miombo wood resources bybetween 3 and 6%, while the overall benefits to them would increase by about 30%.This is because the households would derive most of their benefits from agriculturalproduce, so the impact of the decrease in post harvest loss would be felt fully.
5. PRESENTING SIMULATION OUTPUTOutputs and information from a simulation may be presented by any of the methodslisted in Table 1.
Table 1. Outputs and information from a simulation
Name Method
Auto Reports Number, animation or graph
Array Graph Presents an array of numbers in a 2-dimensional graph
Number Presents values as numbers
Scatter Graph Presents two variables in a 2-dimensional graph
Time Graph Presents values as 2-dimensional line graphs and/or areas
Time Table Presents values as tables of numbers
Auto reportsAuto reports are presentations of simulation results automatically displayed within ornext to variable symbols in a diagram. Powersim offers 3 possible auto reports. Itshould be noted that the user does not have to do anything to initiate the auto reports:
Animation auto report:Levels are animated as vertical hollow bars that capture changes in the simulatedvalue of the variable represented by the level.
Auxiliaries and constants are animated as gauges, i.e., as needles with theircenter at the bottom of the variable symbol.
Number auto report:The variables value is presented as a number, outside the variable symbol, at the sideopposite of the variable name

247G. Kowero and U.R. Sumaila
Graph auto report:The graph is drawn as a simple line graph inside the level rectangle. The line colorfollows the symbol color.
To see examples of each of the above simply start a simulation and watch thesymbols representing the various variables in the model.
Array graphThe array graph is an input/output presentation that displays an array variable or aseries of scalar variables as a line graph or bar, optionally filled with a color. Figure 2gives an example of an array graph. The graph shows the time paths of different yearclasses of miombo biomass. To construct array graphs do the following:
• Click the tool menu• Select ‘Array gragh’• Click any where in the diagram view, and an empty graph will appear• Double click inside this graph and an interface will appear.• Choose the array variable(s) to be graphed• Close platform and run model
Figure 2. Array graph of the variable miombo-biomass
NumberA number presentation displays the current value of a certain variable as a real number.An example is provided in Figure 3. To construct this, do the following:
• Click the tool menu• Select ‘Number’• Click any where in the diagram view, and an empty ‘Number’ box will appear• Double click inside this box and an interface will appear.• Choose the variable to be reported• Close platform and run model

248 MANUAL FOR USERS OF MIOMBOSIM
Figure 3. Number boxes showing the price and revenue from a simulation
Scatter graphA scatter graph displays the relationship between two variables in a 2-dimensional
graph by using one variable as the X-coordinate and the other as Y-coordinate. Figure4 is an example of a scatter graph. To construct this, do the following:
• Click the tool menu• Select ‘Scatter graph’• Click any where in the diagram view, and an empty graph will appear• Double click inside this graph and an interface will appear.• Choose the variable(s) to be reported• Close platform and run model
Figure 4. Scatter graph illustrates the possible path of biomass and harvest levels
Time graphA time graph displays a graphical overview of one or more variables’ developmentover time. It has Time as the variable along the x-axis, and one or more dependentvariables along the y-axis. Figure 5 is an example of a scatter graph. To constructthis, do the following:
• Click the tool menu• Select ‘Time graph’• Click any where in the diagram view, and an empty graph will appear• Double click inside this graph and an interface will appear.

249G. Kowero and U.R. Sumaila
• Choose the variable(s) to be reported• Close platform and run model
Figure 5. Time graph illustrates the possible time path of the current level of labourand new jobs over time
Time tableA time table presents the time paths of certain variables in columns and rows. Anexample of a time table is given in Figure 6. To construct this, do the following:
• Click the tool menu• Select ‘Time table’• Click any where in the diagram view, and an empty table will appear• Double click inside this table and an interface will appear.• Choose the variable(s) to be reported• Close platform and run model
Figure 6. Time table reports the miombo biomass and the growth in biomass over time

250 MANUAL FOR USERS OF MIOMBOSIM
FURTHER READINGByrknes, A. and Cover, J. 1996 Quick Tours in Powersim 2.5. Powersim Press, 99p.Byrknes, A. 1996 Run-Time User’s Guide and Reference Manual. Powersim Press, 57p.Byrknes, A. and Cover, J. 1996 Quick Tours in Powersim 2.5. Powersim Press, 99p.Anon. 1996 Powersim 2.5 User Manual, 225p.Sumaila, U.R., Angelsen, A. and Kowero, G. 2001 A system dynamics model for
management of miombo woodlands. In: Modelling methods for policy analysis inmiombo woodlands. Occasional Paper No. 35, CIFOR, Bogor. pp.17-30.
APPENDIX 1:SAMPLE MIOMBOSIM MODEL IN POWERSIM EQUATIONINTERFACE
The following are equations in a typical Miombosim model. The first column presentsmodel variables (levels, flows, auxiliaries, and constants) by their dimensions (whethera scalar, vector or matrix); the initial value (init) if variable is a level; and documentation(Doc) explaining the variables. For instance, in the case of the variable ‘labour’ thedimension or ‘dim’ is a vector consisting of ‘player’ and ‘period’. Like all levels,labour has to be given an initial or ‘init’ value to start of the simulation, this isdefined as ‘0.1’ in the example below – in theory this could be any number but inpractice it should be a reasonable guesstimate of the model solution to speed up thesimulation. Flow into the variable, labour, is defined next. The second column definesthe variables, for instance, the ‘flow into labour’ is defined by the time step (dt)multiplied by the rate at which labour changes in a time step (Rate_labour).dim labour = (p=player, t=period)init labour = 0.1flow labour = +dt*Rate_labourdoc labour = Effort level: initializeddim Mu = (t=period)init Mu = 1flow Mu = +dt*RMudoc Mu = Multiplier constraint for labour: initializeddim Multiplier = (t=period)init Multiplier = 1flow Multiplier = +dt*RMultiplierdoc Multiplier = Multiplier constraint for WLRs: initializeddim WLR = (t=period)init WLR = 1/(1+0.02)^INDEX (t)flow WLR = +dt*Rate_WLRdoc WLR = Miombo woodland resourcesdim Rate_labour = (p=player, t=period)aux Rate_labour = IF ((labour (p, t) + R_labour (p,t)/
(2*TIME+1))<0,0,R_labour (p,t)/(2*TIME+1))doc Rate_labour = Rate of labour equationdim Rate_WLR = (t=period)aux Rate_WLR = IF ((WLR (t) + R_WLR(t)/(2*TIME+1))<0,0,R_WLR(t)/
(2*TIME+1))doc Rate_WLR = Rate of stock equationdim RMu = (t=period)

251G. Kowero and U.R. Sumaila
aux RMu = -Switch3(t)*S3fn(t)doc RMu = Rate of effort multiplierdim RMultiplier = (t=period)aux RMultiplier = -Switch1 (t)*S1fn(t)doc RMultiplier = Rate of stock multiplieraux Ave_agric = SUM (t=1..LAST (period);H_agric(t))/LAST(period)doc Ave_agric = Proportion of miombo lost by converting land to
agricultural (agric.) productionaux Ave_area_of_standing_miombo = Ave_WLR*Forest_Areaaux Ave_commercial = SUM (t=1..LAST (period); WLR_use (1,t))/
LAST(period)doc Ave_commercial = Proportion of miombo harvested by the commercial
sectoraux Ave_converted_agric_land = Ave_agric*Forest_Areaaux Ave_fwd = SUM(t=1..LAST(period);H_fwd(t))/LAST(period)doc Ave_fwd = Proportion of miombo used for fuelwoodaux Ave_hsehld = SUM (t=1..LAST(period); WLR_use(2,t))/LAST(period)doc Ave_hsehld = Proportion of miombo used by households (fuel, poles
and fraction lost by converting land to agric production)dim Ave_labour = (p=player)aux Ave_labour = SUM (t=1..LAST(period); labour(p,t))/LAST(period)doc Ave_labour = Average labour employed by the households and the
commercial sector.aux Ave_pole = SUM (t=1..LAST(period); H_poles(t))/LAST(period)doc Ave_pole = Average fraction of miombo used for poles by householdsaux Ave_vol_miombo_used_by_commer =
Ave_commercial*Forest_Area*Volumeaux Ave_vol_miombo_used_by_hh = Ave_hsehld*Forest_Area*Volumeaux Ave_vol_miombo_used_for_fwd = Ave_fwd*Forest_Area*Volumeaux Ave_vol_miombo_used_for_poles = Ave_pole*Forest_Area*Volumeaux Ave_WLR = SUM (t=1..LAST(period); WLR(t))/LAST(period)doc Ave_WLR = Proportion of standing miombo after some is converted to
agric and other uses (residual miombo)dim Benefit = (p=player, t=period)aux Benefit =
Discount_factor(1)^INDEX(t)*(price_com*WLR_use(1,t)*Forest_Area*Volume- cost_H*labour(1,t))|p=1;Discount_factor(2)^INDEX(t)*(price_hld*WLR_use(2,t)*Forest_Area*Volume- cost_fn(t)*labour(2,t))
doc Benefit = Benefit function for users; 1=commercial; 2=householddim Converted_land = (t=period)aux Converted_land = H_agric(t)*Forest_Areadim Converted_land_t1 = (t=period)aux Converted_land_t1 =
Converted_land(t+1)|t<LAST(t);Converted_land(LAST(t))dim cost_fn = (t=period)aux cost_fn = v*Disposable_income^0.5/Leisure^0.5doc cost_fn = shadow price of labor for households

252 MANUAL FOR USERS OF MIOMBOSIM
dim Cum_land_under_agric_cultivation = (t=period)aux Cum_land_under_agric_cultivation =
Converted_land+Tot_existing_land_under_agricdim Disposable_income = (t=period)aux Disposable_income = Income_from_agric_on_converted_miombo_land
+ Income_from_sale_of_wood_from_converted_land +Income_from_wood_products + Net_income_from_existing_agric_land+ Off_income - subs_income
doc Disposable_income = Auxiliary to household cost functiondim Exisitng_agric_lab = (t=period)aux Exisitng_agric_lab = 0.1*Tot_existing_land_under_agric/
Init_existing_agric_landdoc Exisitng_agric_lab = Fraction of total labour in the household used for
current agricultural production (that is, this labour is not available forexpanding agriculture into miombo)
aux G_benefit = Tot_Benefit(1)+Tot_Benefit(2)doc G_benefit = Sum of benefitsdim H_agric = (t=period)aux H_agric = Price_agric*WLR_use(2,t)/(Price_agric+price_Wprod)doc H_agric = Fraction of miombo used for agricultural purposes in the
household.dim H_fwd = (t=period)aux H_fwd = price_fwd*H_Wprod/(price_fwd+price_pole)doc H_fwd = Fraction of miombo resources used as fuelwooddim H_poles = (t=period)aux H_poles = price_pole*H_Wprod/(price_fwd+price_pole)doc H_poles = Fraction of miombo used as polesdim H_Wprod = (t=period)aux H_Wprod = price_Wprod*WLR_use(2,t)/(Price_agric+price_Wprod)doc H_Wprod = Total fraction of miombo used for wood products (poles,
fuelwood).dim Income_from_agric_on_converted_miombo_land = (t=period)aux Income_from_agric_on_converted_miombo_land =
H_agric*Forest_Area*Rev_per_ha_of_Agric_landdim Income_from_sale_of_wood_from_converted_land = (t=period)aux Income_from_sale_of_wood_from_converted_land =
0.17*H_agric*Forest_Area*Volume*price_fwd +0.83*H_agric*Forest_Area*Volume*price_pole
dim Income_from_wood_products = (t=period)aux Income_from_wood_products = price_fwd*H_fwd*Forest_Area*Volume
+ price_pole*H_poles*Forest_Area*Volumedim labour_in_man_days = (p=player, t=period)aux labour_in_man_days = labour(2,t)*Total_man_day_in_communitydim Leisure = (t=period)aux Leisure = max_labour(t) - labour(2,t) - off_miombo_labour -
Exisitng_agric_labdoc Leisure = Auxiliary function to the household cost function (maximum
labour in household less the labour used in converting miombo into

253G. Kowero and U.R. Sumaila
agriculture less labour employed by household to produce poles andfuelwood less off miombo labour less labour employed in currentagricultural production)
dim M_cost = (p=player, t=period)aux M_cost = (0.5*0.8*v*price_hld*eff_para(2)*Disposable_income(t)^-
0.5*Leisure(t)^-0.5*WLR(t)^0.6*Volume*labour(2,t)^-0.2 +v*0.5*Disposable_income(t)^0.5*Leisure(t)^-0.5)/Leisure(t)
doc M_cost = Marginal cost of household labourdim MultT1 = (t=period)aux MultT1 = Multiplier(t+1)|t<LAST(t); Multiplier(LAST(t))doc MultT1 = End period mulitplier adjustmentdim Net_income_from_existing_agric_land = (t=period)aux Net_income_from_existing_agric_land =
Tot_existing_land_under_agric*(Rev_per_ha_of_Agric_land -purchased_inputs*Volume)
aux Off_income = off_wage*off_miombo_labourdoc Off_income = Off-miombo income to household usersaux Price_agric = price_per_cum_equiv_from_agric - Conv_cost -
purchased_inputsdoc Price_agric = Net income from agric from use of a unit of woodland
resources adjusted for cost of purchased inputs and conversionaux price_hld = (Price_agric + price_Wprod)/2doc price_hld = Average income to household users from both agricultural
produce and wood productsaux price_Wprod = (price_fwd+price_pole)/2doc price_Wprod = Average price to household users from timber, poles
and fuelwoodaux purchased_inputs = fertilizer_cost+seed_costdoc purchased_inputs = Cost per unit of inputs in terms of cu.m. miombo
equivalentdim R_labour = (p=player, t=period)
auxR_labour = preference*Discount_factor(1)^INDEX(t)*(0.8*eff_para(1)*price_com*Forest_Area*WLR(t)^0.6*Volume*labour(1,t)^-0.2 -cost_H) + 0.8*theta(1)*eff_para(1)*WLR(t)^0.6*labour(1,t)^-0.2 -beta*eff_para(1)*WLR(t)^0.6*labour(1,t)^-0.2 -0.8*Multiplier(t)*Switch1(t)*eff_para(1)*price_com*WLR(t)^0.6*labour(1,t)^-0.2 |p=1; (1 -preference)*Discount_factor(2)^INDEX(t)*(0.8*eff_para(2)*price_hld*Forest_Area*WLR(t)^0.6*Volume*labour(2,t)^-0.2 - cost_fn(t) -labour(2,t)*M_cost(2,t)) +0.8*theta(2)*eff_para(2)*WLR(t)^0.6*labour(2,t)^-0.2 -beta*eff_para(2)*WLR(t)^0.6*labour(2,t)^-0.2 -0.8*Multiplier(t)*Switch1(t)*eff_para(2)*price_hld*WLR(t)^0.6*labour(2,t)^-0.2 - Mu(t)*Switch3(t)
doc R_labour = Auxiliary to rate of labour equationdim R_WLR = (t=period)

254 MANUAL FOR USERS OF MIOMBOSIM
aux R_WLR =Discount_factor(1)*Volume*(0.6*price_com*eff_para(1)*labour(1,t)^0.8*WLR(t)^-0.4) +Discount_factor(2)*(0.6*price_hld*eff_para(2)*labour(2,t)^0.8*WLR(t)^-0.4) + ((theta(1) - beta)*eff_para(1)*labour(1,t)^0.8 + (theta(2) -beta)*eff_para(2)*labour(2,t)^0.8)*0.6*WLR(t)^-0.4 +survival*MultT1(t)* Switch2(t) - Multiplier(t)*Switch1(t)*(1+0.6*WLR(t)^-0.4*(eff_para(1)*labour(1,t)^0.8 +eff_para(2)*labour(2,t)^0.8))
doc R_WLR = Auxiliary to rate of biomass equationdim Regeneration = (t=period)aux Regeneration = 0.03*WLRdoc Regeneration = 3% constant annual regeneration assumeddim S_WLRuse = (t=period)aux S_WLRuse = WLR_use(1,t)+WLR_use(2,t)doc S_WLRuse = Proportion of miombo used by both the household and the
commercial sectors annuallydim S1fn = (t=period)aux S1fn = survival*WLR(t-1) + Regeneration(t) - WLR(t) - S_WLRuse(t) |
t>1; survival*WLR0 + Regeneration(t) - WLR(1) - S_WLRuse(1)doc S1fn = Auxiliary to switch function1dim S2fn = (t=period)aux S2fn = survival*WLR(t) + Regeneration(t) - WLR(t+1) -S_WLRuse(t+1)
| t < LAST(t); WLR0 + Regeneration(t)doc S2fn = Auxiliary to switch function2dim S3fn = (t=period)aux S3fn = max_labour-labour(2,t)-off_miombo_labourdoc S3fn = Auxiliary to switch function3dim Switch1 = (t=period)aux Switch1 = IF(S1fn(t) <0,1,0)doc Switch1 = Switch function1 to enforce constraintdim Switch2 = (t=period)aux Switch2 = IF(S2fn(t) <0,1,0)doc Switch2 = Switch function2 to enforce constraintdim Switch3 = (t=period)aux Switch3 = IF(S3fn(t) <0,1,0)doc Switch3 = Switch function3 to enforce constraintdim Tot_Benefit = (p=player)aux Tot_Benefit = SUM(t=1..LAST(period); Benefit(p,t))/1000doc Tot_Benefit = Total benefit to each user over time horizon of modeldim Tot_existing_land_under_agric = (t=period)aux Tot_existing_land_under_agric =
Init_existing_agric_land|t=1;Converted_land_t1+Init_existing_agric_landdim WLR_use = (p=player, t=period)aux WLR_use = eff_para(p)*WLR(t)^0.6*labour(p,t)^0.8doc WLR_use = Proportion of miombo used by either the household or the
commercial sectors annuallyconst beta = 1

255G. Kowero and U.R. Sumaila
doc beta = Environmental concern parameter, takes values of 0 or 1. Zeroif you care about the environment and 1 if you do not.
const Conv_cost = 0doc Conv_cost = Conversion cost per cu.m. of miombo, which can easily
be converted to per ha (it is the opportunity cost of labour becauselabour is the sole input, otherwise it includes cost of other inputs).
const cost_H = 4.18doc cost_H = Cost of inputs including labour used by commercial sectordim Discount_factor = (p=player)const Discount_factor = [0,0.893]doc Discount_factor = Discount factordim eff_para = (p=player)const eff_para = [0,0.103]doc eff_para = Labour efficency parameter: This implies commercial
sector will need 11.06 years, at full capacity utilization, to harvest allmiombo woodlands in the area. The household will need the sametime because they employ people from the same pool.
const fertilizer_cost = 0.52doc fertilizer_cost = Cost of fertilizerconst Forest_Area = 44508doc Forest_Area = Forested area at the beginning of the analysisconst Init_existing_agric_land = 15844doc Init_existing_agric_land = Existing agric land at start of analysisdim max_labour = (t=period)const max_labour = 1doc max_labour = Maximum annual labour available to household users:
normalizedconst off_miombo_labour = 0.1doc off_miombo_labour = Labour employed by household users on off-
miombo activitiesconst off_wage = 2001120doc off_wage = Off miombo wageconst preference = 0const price_com = 6.04doc price_com = price per cu. m. of miombo used for charcoal by the
commercial sectorconst price_fwd = 2.4doc price_fwd = Price per cu.m. of miombo used as firewood by the
household. Impose royalty fee of 25% of price of firewood.const price_per_cum_equiv_from_agric = 5.05doc price_per_cum_equiv_from_agric = Value of agricultural products
obtained when land which that supports a cubic metre of miombo(firewood or poles or timber or a combination of these) is put undercrops (Opportunity cost of agricultural production in terms of woodlost)
const price_pole = 2.40doc price_pole = Price per cu.m. of miombo used as polesconst Rev_per_ha_of_Agric_land = 252.61

256 MANUAL FOR USERS OF MIOMBOSIM
doc Rev_per_ha_of_Agric_land = Revenue from a hectare of land used foragricultural production.
const seed_cost = 0.28doc seed_cost = Cost of seedingconst subs_income = 1909800doc subs_income = Subsistence income for the communityconst survival = 0.95doc survival = Survival rate for miombo woodlanddim theta = (p=player)const theta = [0,0]doc theta = Social concern parameters: Takes values of 0 or 1. They are
zeros when no social concerns are taken into account and are Iotherwise.
const Total_labour in person days_in_community = 4562558doc Total_labour in person days_in_community = Total person days in
community per year available for miombo woodland activities.const v = 0.5doc v = parameter to labour cost function of householdsconst Volume = 50doc Volume = Standing volume of wood per hectareconst WLR0 = 1doc WLR0 = Initial volume of miombo for the site

16.A goal programming model for planningmanagement of miombo woodlands1
I. Nhantumbo and G. Kowero
ABSTRACTThis paper presents a methodology employed in reconciling demands of households,private sector, and government on miombo woodlands of Southern Africa.
A Weighted Goal Programming approach is presented for planning management anduse of the woodlands as well as a framework for policy analysis. The approach is basedon essentially two models, viz., household and private sector models, which are linkedinto a miombo woodlands model (MIOMBOGP). The MIOMBOGP provides a frameworkfor evaluating the impact, on these two sectors and the woodlands, of some governmentmacro-economic policies as well as some forestry and agricultural sector policies.
Key words: Weighted goal programming, miombo woodlands, household sector,private sector, and Southern Africa.
1. INTRODUCTIONMiombo woodland is an African woodland dominated by species of Brachystegia, eitherin pure stands or in association with those of Julbernadia and/or Isoberlinia (Lind andMorrison 1974; White 1983). It occurs in seven eastern, central and southern Africancountries namely Angola, Democratic Republic of Congo, Malawi, Mozambique,Tanzania, Zambia, and Zimbabwe (White 1983). These woodlands are the major forestformations in this region. They occupy an area of about 2.7million km2 and supportover 40 million people. The people live in the vicinity of the woodlands, while somereside in woodlands that are in public domain. They rarely live in the woodlands setaside as government forest reserves, but do encroach on them for several demands.

258 A GOAL PROGRAMMING MODEL FOR PLANNING MANAGEMENT OF MIOMBO WOODLANDS
Where the woodlands occur outside forest reserves, their clearing for agriculture hastaken place over the years.
Dewees (1994) report that what is known about these woodlands is very muchlimited to their ecological and silvicultural characteristics. Further, most of thewoodlands have been very heavily disturbed given the high local value they have tothe inhabitants of this region. The woodlands offer a number of opportunities tovarious stakeholders, being people and/or institutions.
The national governments are interested in them in terms of revenues realizedfrom licences and concessions issued to organizations and individuals harvesting forestproduce, as well as their potential for tourism. In some cases the governments areinterested in conservation of woodlands important for water supplies.
The private sector (institutions and individuals) is interested in extractingcommercial products from the woodlands.
The communities bordering these woodlands are interested in them for a numberof reasons. The woodlands are cleared to give way to agriculture. They are used asdomestic animal grazing areas. They offer a number of timber and non-timber productsfor local consumption and trade.
In each country there are many policies guiding socio-economic development.Some of the policies target the government as an institution, or are specific to theprivate sector or target the rural communities. Each of these three entities has waysthrough which it can respond to the policies.
The objective of this paper is to present a methodology for planning woodlandmanagement and use, as well as for evaluating how the three principal woodlandstakeholders respond to some macroeconomic and sectoral policies in ways that satisfythe achievement of their goals. The satisfaction of some of these goals makes demandson the woodland resources. It is these demands and the extent to which they manifestin the woodlands that the paper seeks to address, and especially their sustainablesatisfaction.
There are several approaches for evaluating the impact/effect of the trade-offbetween the demands of these three sectors on the woodland resources. A weightedgoal programming model is proposed as one of the approaches which can be employedto reconcile the objectives of the State, the household, and private sectors as theyrelate to the miombo woodland resources in this region.
This paper shall not present the basics of goal programming. Such informationand examples of relevant applications can be found in, but not limited to, Romero(1991), Romero and Rehman (1989), Rehman and Romero (1993), Norton and Schiefer(1980), Nhantumbo (1997), Mendoza and Sprouse (1989) Hazell and Norton (1986),Day (1963) McCarl (1992), and Yoon and Hwang(1995).
The goal programming (GP) approach, of the acronym MIOMBOGP, is used side byside with a system dynamic approach (MIOMBOSIM) to model these sectors in chosensites in Malawi, Mozambique, Tanzania and Zimbabwe as part of a CIFOR researchproject funded by the European Commission and implemented in these four SouthernAfrican Development Community (SADC) countries. These two approaches are intendedto operationalise one of the objectives of this research project, which is to evaluatehow some selected macroeconomic and sectoral policies are impacting on localcommunities and the industry dependent on these woodlands. Also evaluated is howthe policy responses by these two sectors are impacting on the woodland resourcemanagement, use and conservation.

259I. Nhantumbo and G. Kowero
The paper is organized as follows. Section 2 gives a brief overview of the problemenvironment. Section 3 presents the methodology for modelling the household sector,while Section 4 presents the same for the private sector. For each sector the mostimportant activities are described, followed by a general mathematical formulation ofthe MIOMBOGP model. In Section 5 the two sectoral models are linked together toreflect the role these sectors play as producers and intermediaries in marketing forestproducts extracted from these woodlands. Section 6 demonstrates how sectoralgovernment policies are incorporated into the MIOMBOGP model. Section 7 presentslimitations of this modelling approach.
2. PROBLEM ENVIRONMENTIn the miombo woodland region planners and policy makers are faced with the challengeof maintaining land under woodland cover (Dewees 1994). This is because of thepressure for agricultural land arising from growing populations in these countries.Further, there is also pressure for increasing livestock population, not only in terms ofspace but also demands for fodder. The future of these woodlands would depend verymuch on how the demands of various sectors are reconciled in any specific location.
Planning for the welfare of the local communities depending on the woodlandswould demand consideration of decisions and responses to policies at various levelsas illustrated by Figure 1.
The inter-relationships between macro-economic policies, food, agriculture, naturalresources (woodlands) and people in these developing countries are extremely complex.Yet, understanding of the inter-relationships is paramount in influencing the process,pace, magnitude and direction of development necessary for enhancing people’s welfare.There are strong linkages between macro-economic policies (such as monetary, fiscal,exchange rate, trade and employment) and sectoral policies (such as land, agriculture,forestry, population and the environment). The macro policies influence the varioussectors of the economy, including households through the following tools andinstruments: market reforms, tariffs, subsidies, and taxes and transfers (Minde et al.1997).
The markets (meso-level) from which these sectors and household obtain theirinputs and sell their surpluses are in turn influenced by the macro-economic factorsmainly through product and factor markets (capital, labour and land). Households(micro-level) absorb the overall effects of the macro and meso-level interactions andthis in turn influences their decisions on employment, output, income sources andfood consumption. Apart from their welfare being influenced directly by the outcomeof these interactions, positive or negative effects result in the natural resource baseand the environment of which they are a part. Positive effects may include increasedemployment in the short or long term, increased income from better product prices orfactor prices. Negative effects may include increased deforestation, soil erosion leadingto reduction in income and environmental degradation in the long term (ibid.).
Exogenous factors, mainly of institutional and political nature, also impact on thehouseholds causing further (secondary) impacts on the environment. The Mozambicanwar and the resulting refugee influx into Malawi is one example of exogenous factorsthat led to considerable depletion of forest land in Malawi (ibid.).
Unfortunately macro-economic policies and strategies as well as sectoral policiesand strategies for forestry, livestock, agriculture development are often drawn

260 A GOAL PROGRAMMING MODEL FOR PLANNING MANAGEMENT OF MIOMBO WOODLANDS
Figure 1. Macro-meso-micro linkages in the miombo woodlands
ECONOMIC POLICIES
SectoralPolicies
ExchangeRates
MonetaryPolicies
FiscalPolicies
TradePolicies
Factor/Capital Markets
Exogenous ExogenousEnvironmental and Institutional
Political Factor Factors
People/ForestInternational
Households
MACRO
MESO
MICRO

261I. Nhantumbo and G. Kowero
independent of one another and by different government departments and ministries,giving a piecemeal approach to planning.
A number of policies related to both financial and goods markets, as well as otherfactors have potential to influence human-woodland resource interactions. Theapproach presented in this paper is expected to highlight the effects of macroeconomicpolicies affecting prices of agricultural inputs and outputs, off-farm incomes, subsidiesand credit. These are some of the key macroeconomic policies driving changes inrural areas in the region. Kaimowitz and Angelsen (1998) provide an excellent reviewon the impact of different policies on forest condition, and more specifically ondeforestation. The impact of some agricultural and forestry sectoral policies is alsoexpected to be demonstrated by this approach. The incorporation of differentstakeholder partnerships and their impact on managing and using the woodlandresources shall also be demonstrated.
The next two sections demonstrate how the weighted goal programming model(MIOMBOGP) is developed for some sites in the miombo woodland region. The researchsites are located in Malawi, Mozambique, Tanzania, and Zimbabwe. Some of theassumptions made are therefore specific to those sites. Participatory Rural Appraisals(PRAs) provided the basic information on woodland condition, household economy,and demands by various sectors on the woodlands.
3. MODELLING TYPICAL HOUSEHOLD POLICY RESPONSESThe household sector is modelled in terms of major activities undertaken in order tomeet daily needs and demands such activities put on family labour, land and woodlandresources. The sector is comprised of mainly subsistence farmers whose primarygoals are self-sufficiency in food (food security) and financial income for basics suchas food, health, and education. Though local communities are aware of environmentalvalues, these are largely secondary because the pressing needs are food security andincome for meeting basic requirements.
3.1 Activities carried out by the typical householdThere are three basic activities undertaken by most households in the miombo region.These are agricultural crop production, livestock rearing and collection of firewoodfor domestic use and sale. Each of these activities is further examined in greaterdetail. There are many other smaller activities, which can also be incorporated intothe model, but these three will serve to illustrate how household activities can bemodelled. The less important ones can be added onto the model as need arises.
3.1.1 Agricultural crop production activitiesMany rural communities are involved in a number of agricultural activities for cashand subsistence. However, for simplicity only three crops are used in this paper toillustrate how crop production can be taken up in a model of this nature. The crops aremaize, beans and peanuts. The activities associated with these three crops can becategorised as Production, Selling, Buying, Consumption, and Storage. These activitiesare spread over two climatic seasons prevailing in most of the countries namely, dryand wet seasons.

262 A GOAL PROGRAMMING MODEL FOR PLANNING MANAGEMENT OF MIOMBO WOODLANDS
For crop production, information for developing the model will be needed on thefollowing:
• Cost of inputs such as seeds and fertilizers, so that the cost of production can bedetermined.
• Prices for sold and bought agricultural produce. It may be reasonable to assume thatthe bulk of crop harvesting takes place at the beginning of the dry season makingselling prices in this season lower than in the wet season. Further, buying at themarket place in either season may be assumed to be at a higher price (because ofthe profit margin of middlemen) than the price farmers receive. Buying is anactivity that allows the households to purchase food to supplement production.
• Consumption activities should incorporate demand for calories per individual memberof the family and nutrient composition per crop.
• Storage allows transference of food from one season to the other. An estimate ofindividual crop storage losses has to be known.
• Land area demanded per crop.• Labour demanded per crop and as supplied by each family member, as well as hired
labour.• Quantity of production per crop.
Decisions have to be made on the following and supplemented by assumptionsand observations from household studies in the region:
• Size of the household and its composition.• Supply of family labour for agricultural activities.• Supply of labour for other activities.
3.1.2 Livestock activitiesThere are a number of livestock types kept by the local communities, but the mainones considered are cattle, goats and sheep. Chicken and pigs are also found in somecommunities. Livestock is modelled using cattle as an example.
The main activities associated with cattle are rearing/grazing, reproduction,and selling. For these activities the following information will be needed:
(a) Cattle rearing:• Demand for pasture in tons of dry matter (DM) per animal unit. The assumption
is that households already have the animals.• Pasture supply (according to the type of vegetation in the locality of the
household). This is to be estimated in terms of tons of DM that are available forgrazing.
• Labour available for grazing.
(b) Selling of cattle:• Selling price per animal.
(c) Reproduction:• Number of animals per household• Rates of reproduction
This helps to gauge the growth of the animal stock.

263I. Nhantumbo and G. Kowero
3.1.3 Wood related activitiesThe main woodland related activities of households in the region are collection offirewood and poles, as well as their selling. Processing of round wood into charcoal andselling charcoal are activities that can also be incorporated into the models developedfor Tanzania, Malawi, and Mozambique. A basic assumption is that harvesting of thenatural forest for firewood is free of charge. However, a scenario whereby the farmersmight in future be required to pay a fee to the government for harvesting governmentforest reserves can be examined, as well as the impact of various levels of such fees.Another assumption is that the natural forest supplies wood for household consumptionand sale.
For analysis of activities related to firewood and poles information shall be neededon:
• The quantity of the standing stock (volume of miombo per hectare) on which thehousehold depends for these supplies.
• The annual increment/growth of the stock. One could introduce a constraint onamount of wood harvested not to exceed annual stock growth. This might alreadybe a requirement of the forest sector policy.
• The quantity and price of firewood and poles sold per household. This is thegross income per household from this activity. One can assume a uniform pricethroughout the year or differentiate it into seasons since access to the forestsduring the wet season is difficult therefore constraining supplies and raising theprice. The latter has been noted in Mozambique, i.e. higher prices of charcoal inthe wet season.
• In the case of charcoal production, the data required should include the relevantconversion factors (from round wood to charcoal) for the alternative technologiesof making charcoal. These are essentially efficiency parameters that will allowevaluation of the suitability of these technologies and their long-term impact onthe woodlands.
3.1.4 Other activitiesThere are various domestic activities in any household. The labour distribution forsuch activities per member of the household (women, children and men) has to beestablished. Other relevant activities include the collection of non-timber productsfrom the woodlands. In addition to data on their labour requirements, information willalso be needed on the quantities harvested, prices (if sold), and use categories (e.g.by household, sold to markets or middlemen, etc).
Many of the activities in this category are what we may call off-farm activities.Apart from domestic and non-timber collection activities, relevant activities couldinclude brewing beer, pottery, and small businesses. All these activities have to beidentified, their labour demands estimated, their outputs known and quantified, andassociated expense and income data collected.
Dietary demandsThese communities are assumed to consume food that satisfies a minimum set ofdietary requirements. The proportions of different foods (maize, beans, peanuts,etc.) that largely reflect the eating habits in these communities have to be established.This is important for establishing whether or not the typical household is self-sufficient

264 A GOAL PROGRAMMING MODEL FOR PLANNING MANAGEMENT OF MIOMBO WOODLANDS
in food. This parameter is very relevant since giving more rights to communities formanagement of the natural resources aims at reduction of poverty, and food securityis one of the parameters or indicators that can gauge its achievement.
3.2 The general household sector modelThe modelling approach that is proposed in this paper is to be constructed forrepresentative households in different sites in Malawi, Mozambique, Tanzania, andZimbabwe. There are two ways of going about this: identifying an average or a typicalhousehold in each of the sites and building the model around it. An average farm maynot be found in the field. However, it is possible to identify a typical household fromfield data. This is advantageous in that frequency analysis using median and modecan allow us to gauge the principal combination of activities in the region. Further usecan be made of a typical household in cross-checking the data input as well as gaugingthe outcome of the model.
The mathematical expression of the MIOMBOGP model is presented as follows:
(a) Objective functionThe objective in the weighted goal programming context is to minimise the sum ofdeviations, both positive and negative, from the target levels set by the decision-maker. In this case the decision-maker is the household, the private investor, and thegovernment. The principle of WGP is simultaneous minimisation of the sum of weighteddeviations, and is given as:
kMin ∑ (α ini + β ipi) (1)
i=1
The weights (α i and β i) are associated to goals and with deviations (ni, pi). Thismeans that the decision maker (household, private investor or government) has toset a target associated with the objective and express whether he/she would allow anegative or positive deviation from the goal (objective + target).
On the other hand the expression for a linear programming (LP) objective functionis maximisation of the total gross margin and is given as:
n
Max ∑ gjxj (1’) j=1
where gj = gross margin per unit of the activity, for example from cropping and livestockactivities, and harvesting wood products; and
xj is the level of activity Xj,
(b) Constraints
(i) Land availabilityLand allocation to various crops should not exceed the total land available to all householdsin a specific location.
n
∑ Xi <= ß (2)i=1

265I. Nhantumbo and G. Kowero
Xi is the amount of land area allocated to crop i (i = 1,2,3 – representing, initially, thethree crops, respectively maize, beans, and peanuts. The area allocated to the cropsshould not exceed the size of the land, ß, for the average or typical household. However,other constraints on land can be introduced to ensure fair representation of landallocation to different crops grown in household.
(ii) Demand for various cropsThe demand for each crop (positive sign in the equation) for selling, storage, andconsumption, should be less or equal to the quantity of that crop produced per ha inaddition to supplements made through purchased food when deficits occur (negativesign in the equation 3).
Let:Si represents the quantity of crop i sold,Ai represents the quantity of crop i stored,Bi represents the quantity of crop i bought,C
i represents the quantity of crop i consumed
Total crop production in a specific area is given by Σ yiX
i , where yi is the yield per
unit area of crop i. (X = 1 ha.) Total demand for each crop is then given as:
n n n n n
- ∑ yiXij + ∑ Sij + ∑ Aij - ∑ Bi j + ∑ Cij <= 0, (3) i=1 i=1 i=1 i=1 i=1
Production Selling Storage Buying Consumption
where j represents the two seasons, viz. j = 1, 2, for respectively dry and wet seasons.The prime use of production in the study areas is for consumption. Therefore it is
assumed that selling activities take place after the satisfaction of family consumptionand that the household stores food from one season to the other. Given that losses(a) occur in crop storage (A) the following equation is relevant for the wet season:
n n n n
∑ aAij - ∑ Bij + ∑ Cij + ∑ Sij <= 0 (4) i=1 j=1 j=1 j=1
(iii) Labour demandThe total labour demand for each of the crops, Σ SL
ik, is the labour demanded by crop
i and supplied by source k, where: k = 1 represents male labour k = 2 represents female labour, k = 3 represents child labour.
Let LA represent labour demand for livestock activities; LN, labour demand fornon-farm/off-farm activities; and LD labour demand for domestic activities. The totallabour demand for crops, livestock, off-farm and domestic activities should not exceedthat available in the household (Σ SL
k); and is given as follows:
n n n n n
∑ Lik + Σ LAk + Σ LNk + Σ LDk – Σ Lk<= 0 (5) k=1
(iv) Tie constraintsThe family labour is tied to the size, gender, and age of the household members. For

266 A GOAL PROGRAMMING MODEL FOR PLANNING MANAGEMENT OF MIOMBO WOODLANDS
example, in the equation below it is assumed that the size of the family is 5, comprisingof one adult male, one adult female and three children. All or some of the children canbe assumed to be old enough to perform activities such as cattle rearing and domesticchores.
Σ Lk = 5 (6)
(v) Dietary constraintsThe demand for food for household consumption in equation (3) is in kilograms. Thisis linked to the energy constraints through supply of Kilocalories (Kcal.) and grams ofprotein by each crop to family members. The supply should at least satisfy demand perseason, which in turn depends on household size and composition as determined byEquation 5.
Energy supply (E) per crop to the household
n
- ∑ Ei + Σ Ekj <= 0 (7) k=1
The supply of energy from all crops (Σ Ei) should satisfy the energy requirements byhousehold members (Σ Ek), where k = 1, 2, 3.
Protein supply (P) per crop to the household
n
-∑ Pj+ Σ Pkj <= 0 (8) j=1
(vi) Livestock constraints
Livestock grazingThe demand for feed for cattle (g tons of dry matter per head) should at least besatisfied by the amount of available pasture (p tons dry matter per ha) in a specifiedgrazing area.
gC – pF <= 0 (9)
where:C = cattle stock numbers.F = land area for natural production of feed for cattle.
To take into consideration the carrying capacity of the grazing land we can set thelimit on land area available or let the model calculate the grazing area necessary tosatisfy the herd size of the typical household. Therefore, F can have lower and upperbounds to limit the land available or accessible for grazing by the household. In bothcases the model output will indicate whether there is overgrazing or not, and thisdepends on the number of families keeping or owning cattle and other livestock.
Cattle herd sizeThe size of the cattle herd should at least equal to f.

267I. Nhantumbo and G. Kowero
C >= f (10)
where:f = average herd size for a typical household
Cattle reproduction or growth of animal stockThe calving per year should supply the herd. The total herd size is therefore the sumof new borns (cvCf) and existing stock (C); and the relationship between the twodepends on the calving rate, denoted as cv net of mortality.
-cvCf + C >= 0 (11)
where Cf is the number of female animals of reproduction age
Sale of animalsThe number of animals sold, SC, should not exceed the number of the animals calved.This is assuming that the household would like to maintain a minimum stock size.
-cvCf + SC <= 0 (12)
where SC =sale of animals
(vii) Forest products constraints
Harvesting wood for energyThe standing forest stock should at least satisfy the demand for household fuelwoodconsumption and for sale.
-SS + FwC + WdCh + SFw <= 0 (13)
whereSS = Standing stock (volume of miombo per hectare)FwC = firewood consumptionSFw = sale of firewoodWd = quantity of wood required to produce charcoal (Ch)
and:-WdCh + SCh <=0 (14)
whereSCh = selling of charcoal
This indicates the transference of the production to the market, in that charcoal soldcannot exceed that produced. We can also include upper and lower limits for Ch sincethere is limited capacity in terms of labour undertaking this activity in the household ineach season. The limits will eliminate unrealistic allocation of labour to produce charcoalonly in the season with higher selling price (e.g. wet season in Mozambique).
FwC is determined by the size of the household and estimates of consumption inthe Southern Africa indicate that in average a person consumes 1 to 2 m3/year.

268 A GOAL PROGRAMMING MODEL FOR PLANNING MANAGEMENT OF MIOMBO WOODLANDS
Sustainable firewood harvestingThe amount of firewood sold, if the harvesting is to be sustainable, should not exceedthe annual growth in the stock. If the annual growth is denoted as s, then thisrelationship can be given as:
SFw + SCh <= sSS (15)
This can be introduced as a goal of the regulator, which in these countries is thegovernment. The assumption here is that harvesting for household consumption doesnot endanger sustainable firewood supplies.
Firewood salesAlternatively the amount of harvested wood for sale will be limited by the capacity ofthe household in terms of labour. Therefore the amount sold will be tied to a maximumnumber of firewood sales, Qmax, in order to ensure that sufficient quantities are soldgiven the labour available for this.
SFw + SCh <= Qmax. (16)
Other constraints, accounting or ‘tie’ constraints, can be introduced in order toguarantee that the solution is logical and better reflects the household situation.
The complexity of the model can be increased depending on the number of activitieshouseholds undertake and structure of the households. Any restrictions from the governmentwill be incorporated later after linking the farm and private sector models.
(c) GoalsFor realism various goals guiding household behaviour and activities have to beincorporated. This is because planning household activities based on the assumptionthat they are driven by profit maximisation distorts reality in households’ decision-making environment in the miombo region. Most households produce food and evenencroach on the forest for income generation in order to meet their basic need,i.e., food security. In a broader sense food security is achieved through productionor access to the market, i.e., having a purchasing capacity/power. This seems tosuggest that the rural household plan (or combination of activities) in the miombowoodland has at least two goals. In the model, the goals are represented as equalities.Earning of cash income is one of the household goals in these countries. This thenmakes the sum of the gross margins of all activities (cropping, livestock, forestharvesting, etc) contribute to the target level set by the decision-maker, in thiscase the head of the household. This can alternatively be derived by running thehousehold model as a simple linear programming (LP) model. Generally the decision-makers’ aim would be to minimise the negative deviation from the set target.Therefore the income goal, I, with gross margins per activity and for all activities(Xj), could be expressed as:
n
∑ giXj + ni – pi = I (17)i=1
The other common household goal is to ensure food security or meet minimum

269I. Nhantumbo and G. Kowero
nutritional requirements. Such requirements will be defined in terms of total N Kcal ofenergy required by each family. Therefore the food nutritional goal, (N ), can be expressedas:
Σ Ek + n
i – p
i = N (18)
The achievement of these goals in the WGP model is subject to:
fi (x) + ni – pi = bi
where,f
I (x) is the general function of the goal as already demonstrated by Equations (17) and (18).
x∈ G,
G is the feasible set
x≥ 0, n≥ 0, p ≥ 0
The expected output from the model with these two goals is the opportunity costof satisfying one goal instead of the other, i.e., giving greater weight (or higherpriority) to one goal rather than the other. This means that when the income goal isgiven greater weight, the household can sell most of the produce in order to maximiseincome realised, even if in some cases this might result into minimising consumptionfrom their own production. Alternatively, the household could harvest large areas offorest for firewood and poles for sale, while ensuring that there is food produced andany food deficits are met through purchases using such income. All this should ensurethat the minimum energy requirements are met.
Two problems might arise while solving this problem. One is associated with thefact that the coefficients might be distributed over a very wide range. This can becontained by dividing them into the constraint coefficients. The other problem isrelated to the fact that the simultaneous minimisation of the deviation in the WGPmay result into the model mixing goals that are expressed in different units. Thismeans that the solution might be difficult to interpret. To overcome this it is necessaryto adopt a normalisation procedure, like the use of percentages. This means that allgoal constraints have to be expressed in form of percentages.
4. MODELING TYPICAL PRIVATE SECTOR RESPONSES
4.1 An overview of the sectorThe private sector in most of the rural areas functions like an intermediary betweenproducers and markets for agricultural and forestry products. The producers, thehousehold sector in this analysis, generally lack means and capacity for taking theproducts to the final consumer. The simple functions of the private sector are thencollection of produce from farmers, transporting, storage, and selling them to retailersand rarely to final consumers. The volume of business is a function of many things,including the number of trips that the private sector entity makes between the farmers/households and the market place.

270 A GOAL PROGRAMMING MODEL FOR PLANNING MANAGEMENT OF MIOMBO WOODLANDS
In this modelling exercise we start with a scenario in which the profit margin perunit of product, like a bag of charcoal, made by the private sector is lower than theprofit margin of the household (producer). This is based on the fact that the latter doesnot incur high costs apart from employment of family labour. For example householdsdo not pay harvesting fees and transaction costs. However, the private sector has ahigher total profit due to the number of sales units and trips they are able to makewithin a specific period, e.g. a month, as compared with the household sector.Furthermore, the transport capacity in each trip surpasses the production capacity of ahousehold.
There are two types of private sector entities for miombo woodland products. Thefirst category comprises of people and firms exploiting wood products such as fuelwood,poles, and construction timber. This category has strong links with the household sector.The latter actually carries out all operations that make such products available. Thesecond group is comprised of either transporters of logs to supply the industry or theindustries themselves with licenses for harvesting, transporting, and processing logs.This group generally has a diffuse association with the household sector since it can hirelabour from urban and other rural areas to perform all the activities required to get theproducts into the industry and to the final consumer. For the sake of simplicity themodeling is done with the first type of private sector entity in mind.
One general characteristic of these private sector entities is that their maincapital is old transport equipment like lorries, tractors and trailers. Bicycles arecommonly used in Malawi, around Lilongwe, and in Manica province in Mozambique.This has in most cases facilitated payment for amortization. The transport costs arehigh due to the frequent breakdowns and there is therefore need to compensate forthe high maintenance costs.
Another common characteristic is that the private sector is in most caseswholesalers, supplying retailers in the urban or other markets. They are essentiallyintermediaries in the energy and construction material commercialization channel.
4.2 The MIOMBOGP model
4.2.1 Context and major assumptionsSome of the assumptions, requirements and the context in which the private sectoroperates include:
• The private sector buys and sells firewood, charcoal and poles. This varies fromone country to another. However, buying and selling are the two main activitiesincluded in the model.
• The private sector has licenses that limit the amount each of them can buy fromrural markets to supply urban markets.
• The license fees are volumetric (i.e. defined per m3) and are different for firewoodand poles.
• The transportation cost should be known.• Apart from the license fees and the transportation costs, the private entities
may incur other costs. For example, they might have to pay a commercializationfee, which goes to the local council (municipality) at the urban market. Againthis varies from country to country.

271I. Nhantumbo and G. Kowero
• The other major cost is labour. For a typical lorry or tractor operation labourcould comprise of three people, a driver and two assistants. These load andunload the trucks and tractor-trailers. Nevertheless, there might be cases wheresome other people are hired for unloading at the market place.
• The number of trips made and capacity of trucks or other transport facility usedmust be known.
• The salaries or wages of the driver and assistants must be known.• There are many buyers or retailers in the urban markets and few suppliers
(represented by lorry drivers) hence the market structure can be described asoligopoly. On the other hand, at the production site, there are many producers(households) and few buyers (represented by lorry drivers) or oligopsony.
4.2.2 Mathematical presentation of the model
(a) The objective functionThe LP objective function for the private sector is:
n
Max ∑ gixi (1) i=1
where gi is the gross margin of each of the products (firewood, charcoal and poles:I=1,2,3), (i.e., revenue obtained from the sales after deducting the costs) and xi is thelevel of each activity, in this case selling of each of the products. In other words thiscan be stated as:
n n n
- ∑ PpiPri -∑ Tri Pri + ∑ Wsi Pri - Mc= 0 (2) i=1 i=1 i=1
n
∑ Pri (-Ppi –Tri + Wsi) - Mc = 0 (2’)i=1
where:Pri = quantity of product i (i = 1, 2, 3)Ppi = producer price of the ith product in rural marketsTri = transportation cost of the ith product to the marketWsi = wholesale of the ith product in urban marketsMc = Maintenance cost per trip
Additional costs and fees specific to individual countries, like commercializationfees in Mozambique, can be incorporated in the wholesale price, hence reducing thesales price.
In the case of goal programming, the objective function is expressed as:
n
Min ∑ (α ini + β ipi) (1’) i=1
This represents the minimisation of deviations from target levels, assuming thatthe private sector also has other goals, apart from profit maximisation. We can run

272 A GOAL PROGRAMMING MODEL FOR PLANNING MANAGEMENT OF MIOMBO WOODLANDS
the model as a classic LP assuming one main objective that drives the activity of theprivate sector. Alternatively we can assume that apart from maximising profit, it isimportant for the private entity to minimise risk of the business, especially that arisingfrom frequent truck breakdowns, and therefore a desire to minimize truck maintenancecosts.
(b) ConstraintsThe major constraints of the private sector model include:
(i) Licensed amountThe quantity transported of each of the ith product with a truck of capacity ai, shouldnot exceed the quantity AQ stated in the licence.
n
∑ NtiTci i <= AQ (3)i=1
whereNti is the number of trips middlemen make in transporting forest product iTcI is the lorry/truck capacity for transporting product i
(ii) The supply of ith wood product should be less or equal to the amount delivered to ordemanded by retailers at the market.
n n
-∑ Pri + ∑ Wsi <=0 (4) i=1 I=1
c) Transportation capacityThe quantity of the ith product transported, Pr, will be equal to the truck transportcapacity, Tc, for each of the products. Measurements of capacity could be in bags orm3.
Pri = Tci (5)
d) Labour demandThe availability of drivers’ labour and that of his assistants is expressed as Σ L
ij,
where j=1 denotes drivers’ labour and j=2 denotes drivers’ assistants labour.
Truck driver assistants labour
n
∑ Li2 <= LTa (6)i=1
where,li is the truck driver assistants’ labour allocation for loading and unloading the truckswith product i and expressed in man-hours/tripLTa is the total labour available in a month or year.

273I. Nhantumbo and G. Kowero
Driver’s labour
n
∑ Li1 <= LTd (7)i=1
li is the driver’s labour allocation to ferrying producti
LTd is the total labour available in a month or year.
Details on each of the activities in the above constraints will vary during the dryand wet seasons because the costs Ppi, Tri, and Mc are different for each of theseasons.
(c) GoalThe objective function of the LP model complemented with the deviations from theset target can be expressed as:
n
∑ gixi + ni - pi = $ (8)i=1
Since we assume that the private sector’s prime objective will be maximisationof profit, then the target $ can be derived from the LP. In this case ni, or the negativedeviation from the goal would have to be minimised.
Mc + ni - pi = b (9)
The implication is that the maintenance cost has to be kept as low as possible,and that is set at the target level b. The decision maker’s interest is to minimise thepositive deviations from the target level. This means that in order to maximize profit,the targeted maintenance costs should be kept as low as possible.
5. LINKING HOUSEHOLD AND PRIVATE SECTOR MODELSAs mentioned earlier, there are two players in the exploitation and commercializationof the wood products from the miombo woodlands, the households and the privatesector (middlemen).
Selling activities (for wood products) were defined for the household model.However, these were not differentiated into the three products included in the privatesector model. But it is known or assumed that all the supply to the intermediaries (theprivate sector) comes from these rural households. It is at the buying points where wewould then know what the households are selling. Therefore, a simple accounting ortie constraint should be able to link the two sectors.
Such a constraint states that the supply by the rural household should at least beequal to the quantity demanded by intermediaries or private sector in thecommercialization channel. When the first part of the equation is higher than thesecond one, the producer takes longer to exhaust his/her stocks.
n n
- ∑ Wsi + ∑ Pri <= 0 (10) i=1 i=1

274 A GOAL PROGRAMMING MODEL FOR PLANNING MANAGEMENT OF MIOMBO WOODLANDS
As far as the goals are concerned there can be several of them and the MIOMBOGPmodel offers the possibility of evaluating how each of the goals of the actors is affectedby changes in their prioritization.
6. INCORPORATION OF GOVERNMENT SECTORAL POLICIESThis section deals with potential for using MIOMBOGP model to evaluate the impact ofsectoral policies. Four example policy scenarios will highlight this.
In the household model we introduced a constraint stating that for sustainableuse and management of the resource, the amount harvested for sale should not exceedthe allowable cut. This restriction has potential to significantly influence the producers’output (household) as well as the supply to the intermediaries (household-privatesector trade) and ultimately to the retailers and urban consumers. However, it is inthe government’s interest to ensure that the present and the future generations benefitfrom these natural resources.
The constraint for this intention can be expressed as:
Wsi <= AAC (11)
Harvesting of miombo woodland stock for sale should be in quantities less than orequal to the annual allowable cut (AAC). The basic assumption is that harvesting forhousehold consumption is currently at sustainable levels. Otherwise we can add suchconsumption to the left-hand side of this equation.
This constraint has to be tied to the buying constraint by the private sector.A second sectoral policy worth exploring could be the introduction by government
of license fees for producers (the rural households in our case) when they harvestforest produce from government forests for sale because in some countries harvestingfor household consumption is free. Under such situation the unit profit realized by thehousehold will have to shrink by the unit charge in fees. For instance, in the case offirewood or charcoal, the price will be reduced by a factor, ff. In the objective functionreproduced below, Ppi will have to be reduced by this amount.
n n n
- ∑ (Ppi – ff) Pri - ∑ Tri Pri + ∑ Wsi Pri - Mc= 0 (12) i=1 i=1 i=1
A third policy scenario is the introduction of a penalty to the private sector as wellas to the household sector for harvesting any amount above that stated in the license.
This also works through the objective function as an added cost, Fe, which thenlowers the net revenues (Ws
i -F).
n n n
- ∑ PpiPri -∑ Tri Pri + ∑ (Wsi -Fe)Pri - Mc = 0 (13) i=1 i=1 i=1
The fines are imposed when the harvesting exceeds that allowed in the licencewhen the condition below prevails (c.f. equation 13):
n
∑ NtiTci >= AQ (14) i=1

275I. Nhantumbo and G. Kowero
A fourth example relates to national governments’ concern on improving thewelfare of rural people. As a measure to contain this concern national governmentsmight allow for bigger landholdings for the farmers in order to ensure food securityand cash incomes. Therefore, where land is available or can be made available throughdegazettment of forest reserves or resettlement of people in new adjacent areas, theland constraint can be relaxed to the appropriate size of the land.
n
∑ XI >= e (15)i=1
From equation (2) in the household model, we can see that the limitation nowbecomes one of >= e. In reality the size of farmed land depends on family labour andcapital.
If this is enforced and all other conditions are favourable then households willhave the potential for surplus agricultural produce, which can in turn be sold.Nevertheless, it has to be noted that despite the good intentions of governments, inpractice additional land might come from clearing forests or from grazing land. Thiscould then conflict directly with the sustainable use of resource objective.
Linking the two models with the market involves aggregation of the householdsin the miombo woodlands as well as determination of the aggregate number ofintermediaries (size of private sector) and then linking production and the market. Tolink to the final consumers it is necessary to estimate the total demand in the urbanmarket, i.e., number of households still using firewood for cooking or poles forconstruction.
This means that the production activities in the household part of the model wouldhave to be summed up in terms of surplus from the production activities undertaken bythe household. The quantity sold wholesale by the private sector would then be asummation of the quantities sold by each player in this sector. In the market place thesum of these wholesale quantities would have to be to be linked to consumer demands.
7. MAJOR LIMITATIONS OF THE MIOMBOGP MODELLING APPROACHApart from limitations that are implicit in the basic structure of the functions in themodel, the following are some other potential limitations:
• Scarcity of and/or unreliability of data to estimate the coefficients can significantlydistort the household organisation and consequently the model results.
• Inability of the decision-makers like farmers and middlemen to list and state ina consistent manner priorities or weights they attach to each target level.
• Making an appropriate choice of the number of variables and constraints capableof producing meaningful results, as well as interpretation that reflects the decisionmakers’ space, i.e., interests, activities, and goals.
ENDNOTES1. Also available as: Nhantumbo, I. and Kowero, G. 2001 A goal-programming model for planning
management of miombo woodlands. In: Modelling methods for policy analysis in miombo wood-lands. Occasional Paper No. 35, CIFOR, Bogor. pp.5-15.

276 A GOAL PROGRAMMING MODEL FOR PLANNING MANAGEMENT OF MIOMBO WOODLANDS
REFERENCESDay, R. H. 1963 On aggregating linear programming models of production. Journal of
Farm Economics 45: 767-813.Dewees, P.A. 1994 Social and economic aspects of miombo woodland management in
Southern Africa: Options and opportunities for research. Occasional Paper No. 2.CIFOR. Bogor. 28p.
Hazell, P.B.R. and Norton, R.D.1986 Mathematical programming for economic analysis inagriculture. Macmillan Publishing Company, New York.
Kaimowitz, D. and Angelsen, A. 1998 Economic models of tropical deforestation: Areview. CIFOR, Bogor. 139p.
Lind, E.M. and Morrison, M.E.S. 1974 East African vegetation. Longman Group Limited,London, p59-101.
McCarl, B.A. 1992 Mathematical programming for resource appraisal under multipleobjectives. EPAT/NUCIA Working paper no. 6.
Mendoza, G.A. and Sprouse, W. 1989 Forest planning and decision making under fuzzyenvironments: An overview and illustration. Forest Science 35: 481-502.
Minde, I., Kachule, R. and Luhanga, J. 1997 Macroeconomic and sectoral policies andtheir Influence on the livelihood strategies of households in the miombo woodlands:The case of Malawi. Report. University of Malawi, Lilongwe.
Nhantumbo, I. 1997 Multiobjective rural land use planning: potential for social forestryin Maputo, Mozambique. Ph.D. Thesis, University of Edinburgh. 286p.
Norton, R.D. and Schiefer, G.W. 1980 Agricultural sector models: A review. EuropeanReview Agriculture Economics, 229-264.
Rehman, T. and Romero, C. 1993 The application of the MCDM paradigm to the managementof agricultural systems: Some basic considerations. Agricultural Systems 41: 239-255.
Romero, C. 1991 Handbook of critical issues in goal programming. Pergamon, Oxford.Romero, C. and Rehman, T. 1989 Multiple criteria analysis for agricultural decisions.
Developments in Agricultural Economics Vol. 5.White, F. 1983 The vegetation of Africa. UNESCO, Paris. 356p + maps.Yoon, K.P. and Hwang, C. 1995 Multiple attribute decision making: An introduction. Sage
Publications, London.

17.A goal programming model for planningmanagement of miombo woodlands:A case study of Chivi and Gokwecommunal areas, Zimbabwe
E. Guveya and C. Sukume
ABSTRACTThis paper reports results on the use of a goal-programming model to the managementof woodlands in two communities in communal areas of Zimbabwe – one abundant andthe other less abundant in woodlands resources. The relatively well-endowed communityborders the Mafungautsi Forest Reserve in Gokwe. The less endowed site was Mutangiin Chivi area. The objective of the modelling exercise was to simulate the effects ofchanges in agricultural policies and demographic changes in farming households onhow local households use woodlands under an open access regime and under institutionalconstraints imposing sustainability concerns.
The findings presented in the paper point to the following basic conclusions: a)households in communal areas are highly differentiated with regards to ability tosatisfying family sustenance goals; b) relatively poor households depend on woodlandsfor a significant part of their income needs but richer families are more efficient inharvesting woodlands; c) increase in agricultural product prices as well as an increasein yields tend to increase woodlands harvesting among the better off and reducewoodland harvests among the poorer households; d) increase in input costs tends toincrease reliance on woodlands especially among the poorer households; and e) loss ofan adult member of a household increases the degree of poverty especially among therelatively poor with the greatest impacts being realised with loss of female membersof households.
Key words: Woodlands, weighted goal programming, communal area, Zimbabwe

278 A GOAL PROGRAMMING MODEL FOR PLANNING MANAGEMENT OF MIOMBO WOODLANDS
1. INTRODUCTIONIndigenous forests and woodlands in Zimbabwe provide a wide range of goods and servicesthat include edible fruits, medicines, honey, poles and fuelwood. About 80% of thepopulation of Zimbabwe depends on woodfuel for their cooking, heating and lightingrequirements. There is concern however at the rate of deforestation of the indigenouswoodlands in Zimbabwe. Deforestation has led to various environmental problems suchas siltation of rivers and dams, soil erosion, flooding, general land degradation andfuelwood shortages. In addition, an estimated 80 000 ha (FAO, 1988) of woodland inZimbabwe are cleared annually to give way to other land-uses including agriculture anddomestic animal grazing which though profitable, have negative externalities.
The need for proper management and conservation of woodlands is an area ofhigh priority. In Zimbabwe there are many policies guiding socio-economicdevelopment. Some of the policies target the public sectors while other affect privatesector operations. Each of these sectors has ways through which it can respond to thepolicies. The view of this study is that some current policies lead to inappropriatedeforestation, since the people who clear forests and woodlands do not have to payfor the negative externalities associated with their actions, both at the local or nationallevels. Regardless of the decisions made by woodland users, policy makers should atleast be aware of the potential impact of their policies on forest and woodland cover.In rural areas the policies that have potential to impact most on the behaviour of ruralhouseholds are mainly those associated with agricultural crop production and trade,since the majority of rural people are involved in agriculture. The objective of thispaper is therefore to assess how the communal area households of Zimbabwe mightrespond to agricultural input and output pricing policies and to household labour supplyand how this impacts on the use of woodlands.
The study uses a weighted goal programming modeling approach to address thisobjective. In particular, we follow a specification of the goal programming applicationto woodlands management developed by Nhantumbo and Kowero (2001). The nextsection provides a description of two communities of Gokwe and Chivi that were thebasis of the study. It is followed by a detailed model description along the lines of theweighted goal programming model developed by Nhatumbo and Kowero (2001). Section4 presents the data used to run the model while section 5 presents and discussessimulation results of the potential impacts of different policy scenarios on the householdsin these two communities and their woodland resources. The last section gives asummary of major conclusions from the study.
2. DESCRIPTION OF STUDY SITESThe study sites are Chivi and Gokwe districts of Zimbabwe. The two districts werepurposely selected as they have differing agricultural potential, and settlement history.In Chivi district, Mutangi, a dam catchment area 80 km from Masvingo town and 19km from the Chivi business centre, was selected. Chivi communal area, the majorpart of Chivi district, covers 3534 km2 and has been settled since the mid 19th century.The 1992 census shows a total population for Chivi district of 157 428, with a growthrate of 1.98% and a population density of 44.5 people per square km. Mutangi isestimated to have population density of close to 58 persons per km2 (Campbell et al.2001).

279E. Guveya and C. Sukume
Chivi is a poor area agro-ecologically with a long-term mean annual rainfall of 545mm (1913-2001). In addition, the amount, intensity and distribution of the rainfallwithin a season are highly variable, and inter-annual variation is large (Campbell et al.2001). Droughts are recurrent in the area with that of 1991/92 being the worst onrecord, when only 83 mm of rain fell in some parts of the district. This is compoundedby very poor soils within the region.
The dominant vegetation in Mutangi is the woodland that forms an enclave ofapproximately 360 square kilometres surrounded and shared by about five villages(Campbell et al. 2001). The top three dominant tree species found in the area areColophospermum mopane, Terminalia sericea and Acacia tortilis. Forest productslike honey, mushrooms, and medicinal plants also occur in the woodlands. There isvery little wild game except for small animals like rabbits that can be found in someparts of the woodland. The woodland is mainly utilised as a grazing area for livestock,source of firewood, construction poles and occasionally as a source of fruits andother non-timber products (NTFPs). Due to high population pressure, the demandfor arable land, firewood and construction timber the woodlands are being clearedfast.
In the Gokwe study area, villages within a radius of about 30 km from the westernedges of the Mafungautsi state forest were selected. The study site is about 50 kmfrom the Gokwe business centre. These communities have settled in the area for lessthan 70 years. The families are relatively sparsely distributed.
The mean annual rainfall for the area is around 819 mm. The Mafungautsi StateForest is entirely situated on the Mafungautsi plateau, one of the most northerlyextensions of the Kalahari sands in Zimbabwe (Vermeulen 1997). The soils are dystrophicwith poor water holding capacity.
Most areas in this survey site are still covered by woodlands. Furthermore thecommunities have access to the Mafungautsi State Forest, which is a governmentprotected forest covering an area of 82 659 hectares (Vermeulen 1997). Villages locatednear the boundaries can access a total area of about 600 square kilometres of the forestto graze their livestock, collect dead wood and NTFPs like mushrooms, thatch andbroom grass. However, the communities are not allowed to cut down trees, collecthoney or hunt for game. Fishing is only allowed if it is done using fishing rods as use offishing nets is prohibited.
The forest is very dense with a lot of tall and old trees. The dominant tree speciesis Terminalia sericea, while important timber trees like Baikiea plurijuga andPterocarpus angolensis are also abundant. Wild game especially warthogs and antelopesstill occur in large numbers in the forest.
Data was collected in a series of random sample surveys and participatory ruralappraisals (PRA) in the period 1999 to 2000 in the two sites. A descriptive summary ofthe survey is reported in Siziba and Mutamba (2002). For the purposes of this study,the households in each study area are distinguished into draft owning and non-draftowning households. The rationale for this distinction being that the two types ofhouseholds’ utilization of woodland is hypothesized to be different. Households withdraft animals tend to be larger and efficiency of collection of woodlands products andfarming operations tend to be higher due to a higher degree of mechanisation in theprocesses.

280 A GOAL PROGRAMMING MODEL FOR PLANNING MANAGEMENT OF MIOMBO WOODLANDS
3. MODEL SPECIFICATION AND DATA
3.1 Objective functionWe model a household that allocates labour and other productive resources to agriculture,household chores and woodlands harvesting activities so as to minimize simultaneouslythe weighted sum of deviations from two goals – food security and income targets. Thisoptimization problem is considered under two regimes, namely a regime where utilizationof forest resources are restricted to be within sustainable levels and under a regimewhere this restriction is relaxed, i.e. an open access situation. How the sustainabilityrequirement is modeled is discussed under woodland use constraints.
From surveys in both Gokwe and Chivi more households ranked the achievement offood security above income maximization in their decision-making. In the two-goalmodel considered in this study, giving equal weight to positive and negative deviationsfrom goals, the weighted goal programming (WPG) objective function can be specifiedas,
Min {(w1n1+w1p1)+(w2n2+w2p2)} (1)
where wi is the weight associated with the goal i, and ni and pi are negative andpositive deviations in the achievements of goal i; and i = 1, 2.
Ranking of goals by households is translated into weights using the transformation:
(2)
ri is the ranking of goal i.
Using the above transformation, the food security goal (goal 1) has a weight of0.67 while that for income (goal 2) is 0.33.
Household food security goalGiven this background, the household food security goal can be expressed as:
emz CsMz + egn CsGn + esg CsSorg + emk CsMk + ebf CsBf +n1 – p1 = E (3)where,
emz
, egn
, esg, e
mk, and e
bf are per unit calorie content for maize, groundnuts, sorghum,
milk and beef, respectively,
CsMz, CsGn, CsSorg, CsMk, and CsBf are respectively units of maize, groundnuts,sorghum, milk and beef consumed by the household in a year, and E is the recommendedminimum household calorie requirement per year.
The food security goal is to strive to get enough food to satisfy yearly requirementsfor energy. According to University of Minnesota (2002) the average minimum daily kilocalorie requirements are 2944 for a man, 2180 for a woman and a child’s daily requirementare 2048. For a household the requirements for men (HHcM), women, (HHcW) and children(HHcChn) in a year would equal the target (E) calorie intake, and this is expressed as:

281E. Guveya and C. Sukume
E = 365(2944 HHcM + 2180 HHcW + 2048 HHcChn). (4)
The per unit energy content of different food commodities are given in Table 1.
Table 1. Energy contents of different food types
Food type Energy content [kilo calories/kg]
Maize 3450
Groundnuts 5700
Sorghum 3450
Milk 660
Meat 2350
Source: USDA 2002.
Household income goalThe income goal for the household is the residual income. The residual income isgross household income after taking into account costs of inputs, hired in labour,money spent on buying extra food (maize, groundnuts, sorghum, milk and beef). Theresidual or target income (I) was obtained from maximizing a linear programmingmodel of the representative household in each site. The income goal is then statedas:
CrR + LvR + Wg + DftR + FwR – CrCst – DftCst – LabCst – FdCst + n2 - p2 = I (5)
We define the components of this function as follows:
(a) Revenue from sale of cropsIn the above equation CrRv is crop revenue computed from the product of crop priceand the quantity of maize sold in wet and dry season (SgMzW, SgMzD), groundnuts inthe wet and dry seasons (SgGnW, SgGnD), sorghum (SgSorgD, SgSorgW), cotton (SgCtn)and sunflower (SgSun). That is
CrR = Pmz (SgMzD + SgMzW) + Pgn (SgGnD + SgGnW) + PctSgCtn(6)
+ PsuSgSun + Psg(SgSorgD + SgSorgW)
where Pmz, Pgn, Pct, Psu and Psg are farm gate prices of maize, groundnuts, cotton,sunflower sorghum in both wet and dry seasons.1
(b) Revenue from livestockSimilarly, LvR is revenue from sale of livestock and livestock products. Thus LvR isthe sum of products of unit price and the units of goats sold (GtSg), cattle sold (CaSg),donkeys sold (DkSg) during the year, and milk sold during wet and dry seasons (SgMkW,SgMkD),
LrR = PgtGtSg + PcaCaSg + Pdk DkSg + Pmk (SgMkD + SgMkW), (7)

282 A GOAL PROGRAMMING MODEL FOR PLANNING MANAGEMENT OF MIOMBO WOODLANDS
where Pgt, Pca, Pdk, and Pmk are prices of goats, cattle, donkeys and milk, respectively.For households with neither cattle nor donkeys, selling of cattle, donkeys and milk isrestricted to zero to contain possible unrealistic computational solutions wherehouseholds can buy and sell these within a year, situations which were not encounteredin the Gokwe and Chivi households.
(c) Revenue and expenditure related to labour and draft powerThe income, Wg, the household gets from hiring out labour is the product of labour(HrOutLab) days hired out and the wage rate (w),
Wg = w HrOutLab. (8)
In the case where a household hires in labour, it incurs payments (LabCst) equalto the product of labour days hired in (HrInLab) and the wage rate (w),
LabCst = w HrInLab. (9)
Similarly, the household can either hire out draft power to generate revenue (DftR)or hire in draft services and incur expenditures (DftCst). In either case the revenuegenerated or the payment incurred is the product of draft-days hired in (HrOxIn, ifoxen, and HrDonkIn, if donkeys) or out (HrOxOut, if oxen, and HrDonkOut, if donkeys)and the rate/price for hiring draft animals (r
ox, if cattle and r
dk, if donkeys). As is
explained later in this section, differentiation between oxen draft and donkey is dueto the differences in rates/prices as well as efficiency of draft services. Thus
DrftR = rox HrOxOut + rdk HrDonkOut (10)
DrftC = rox HrOxIn + rdk HrDonkIn. (11)
(d) Revenue from woodland productsEven though institutional constraints exist limiting the shipment of timber and fuelwood from communal areas to areas outside, sale of poles and fuel wood goes on betweenhouseholds within the areas in the form of contract cutting and carting. Prices of woodproducts sold in these ways are not well defined in form of amount paid per volume ofwood. One way of going around this problem is to express the value of the sales interms of value of time spent gathering and carting wood for payment. Using thisapproach, revenue from wood harvesting for sale (FwR) is the product of the wage rate(w) and the time devoted to collecting wood for sale (ClFwSLab). That is,
FwR = w ClFwSLab (12)
(e) Household expenditure on farming and foodThe major farm household expenditure item is on crop production (Crest). It is thesum of production expenditure (cost) on each hectare and area cropped to maize(GrMz), cotton (GrCtn), groundnuts (GrGn), sunflower (GrSunf) and sorghum (GrSorg),
CrCst = cmz GrMz +cct GrCtn +cgn GrGn +csu GrSunf + csg GrSorg (13)

283E. Guveya and C. Sukume
where cmz, cct, cgn, csu and csg are per hectare expenditure on materials inputs to theproduction of maize, cotton, groundnuts, sunflower and sorghum, respectively.
The other major expenditure item was on food, (FdCost), which was the sum ofthe products of ‘buying prices of the food items’ and their respective quantities. Themajor goods bought by households in dry and wet seasons are maize (BgMzD, BgMzW),groundnuts (BgGnD, BgGnW), sorghum (BgSrgD, BgSorgW), beef (BgBfD, BgBfW) andmilk (BgMkW, BgMkD) to supplement own production. Expenditure on food is thus
FdCst = Pb,mz (BgMzD + BgMzW) + Pb,gn (BgGnD + BgGnW) (14)+ Pb,sg (BgSrgD+BgSorgW) + Pb,bf (BgBfD + BgBfW)+ Pb,mk (BgMkW + BgMkD)
where Pb,mz, Pb,gn Pb,sg, Pb,bf and Pb,mk are buying prices of maize, groundnuts, sorghum,beef and milk, respectively.
The goals are expressed in monetary values (for income) and in kilo-calories (forfood security). To facilitate ease of interpretation of the results each goal is normalizedso that the target is 100 percent by multiplying both sides of the goal equation by 100and dividing by the nominal value of the target.
Coefficients utilized in the models for Gokwe and Chivi study areas are summarizedin Table 2.
It is important to note that goals will differ between farmers of varying resourceendowments and in varying agro-ecological environment. In the above model, targetenergy requirements differ between households in the different areas due to differencesin size and composition of the households. Income goals differ in that these are theproduct of maximization of residual farm income after taking into account foodconsumption needs. Differences in feasible cropping mixes between farmers in diiferentareas and with different resource endowments imply that attainable incomes will alsodiffer.
3.2 Model constraintsThe weighted goal-programming problem is optimized subject to constraints on:
• Land availability,• Availability of ready cash to finance inputs and services,• Draft power availability,• Supply and utilisation of food crops,• Labour availability,• Minimum dietary requirements,• Maximum livestock production potential, and• Forest products availability/supply.
3.2.1 Land constraintsLand allocated to growing maize, cotton, groundnuts, sunflower and/or sorghum shouldnot exceed the average area, AT, available to the representative household in a site.Thus
AT - GrMz - GrGn - GrCtn - GrSunf - GrSorg ≥≥≥≥≥ 0 (15)

284 A GOAL PROGRAMMING MODEL FOR PLANNING MANAGEMENT OF MIOMBO WOODLANDS
Table 2. Parameters in the goal functions
Category Coefficient Gokwe ChiviDraft No-draft Draft No-draft
Target E (‘000 kcal) 6701 4845 5920 4879
I (US$) 998 135 870 128
Selling prices Pmz (US$/kg) 0.13 0.09 0.09 0.07
Pgn (US$/kg) 0.28 0.24 1.22 0.30
Pct (US$/kg) 0.45 0.42 0.34 0.37
Psu (US$/kg) - 0.09 0.10 0.08
Psg (US$/kg) - - 0.08 0.04
Pgt (US$/goat) 13.16 13.16 13.16 13.16
Pca (US$/beast) 105.00 105.00 105.00 105
Pdk (US$/beast) 53.00 53.00 53.00 53.00
Pmk (US$/litre) 0.52 52 0.65 0.65
Buying prices Pb,mz (US$/kg) 0.14 0.10 0.10 0.09
Pb,gn (US$/kg) 0.31 0.26 1.34 0.33
Pb,bf (US$/kg) 2.00 2.00 2.00 2.00
Pb,mk (US$/litre) 0.52 0.52 0.65 0.65
Pb,sg (US$/kg) - - 0.09 0.09
Wage w (US$/day)a 0.44 0.44 0.44 0.44
Costs of production cmz (US$/kg) 15.39 16.29 24.60 15.03
cct (US$/kg) 35.31 47.26 43.13 37.24
cgn (US$/kg) 25.00 25.00 15.50 21.31
csu (US$/kg) - 4.50 5.42 4.23
csg (US$/kg) - - 1.84 2.47
Draft hiring rates rox (US$/day) 4.21 4.21 4.21 4.21
rdk (US$/day) 3.95 3.95 3.95 3.95
Source: Field Survey Data: 1999-2000; a stipulated wage for farm labourer (Commercial Farmers Union,pers. Comm.).
Average land holdings for sampled households were 2.31 and 1.92 hectaresrespectively for draft and non-draft animal owning households in Chivi. Correspondingfigures for Gokwe were 5.11 and 3.6 hectares for draft and non-draft animal owninghouseholds, respectively.
3.2.2 Cash constraintsAvailability of income to finance inputs and services at the inception and during thecrop-growing season is a major constraint to most farmers in rural Zimbabwe. Highinterest rates following removal of credit subsidies brought about by economic reformshave exacerbated the liquidity constraint. To reflect this problem we include in the

285E. Guveya and C. Sukume
model a constraint requiring that households must have, as a minimum, the cash Cfor producing all crops as well as other requirements including hiring in labour or draftservices. This budget constraint can be expressed as:
- cmz GrMz - cct GrCtn - cgn GrGn - csu GrSunf - csg GrSorg - 0.44*HrInLab + C ≥ 0 (16)
Per-hectare costs of production for the four representative households modeledare given in Table 2.
3.2.3 Draft animal hireA significant proportion of households in both Chivi and Gokwe do not have enoughnumber of cattle or donkeys to perform farm operations such as ploughing, mechanicalplanting, cultivating and transporting. Only 41% of households in Chivi and 47% in Gokwehave enough cattle for use as draft (Mutamba and Siziba 2002). Those without have tohire draft from those with animals especially for the critical task of ploughing. Given apair of oxen or donkeys can plough 1 hectare of land over 4.5 days (Guveya 1995) and thatthe critical period in the planting season when draft is required is only two months, thereonly about 44 days available for hiring out draft animals for those households with animals.Thus the number of days that draft hiring out can be offered by a household with draft(HrOxOut in the case of oxen, or HrDkOut for donkeys) should be 44 days less the time thehousehold needs the draft to prepare its own fields.
44 – 4.5(GrMz + GrGn + GrCtn + GrSunf + GrSorg) – (HrOxOut + HrDonkOut) ≥ 0. (17)
Households without draft animals will need to hire in enough draft services (HrOxIn/HrDkIn) to plough all their fields,
HrOxIn + HrDonkIn = 4.5(GrMz + GrGn + GrCtn + GrSunf + GrSorg). (18)This means that there is virtually minimal farm preparation using hand hoe.
3.2.4 Crop production and utilizationThe two cash crops grown in the project sites – sunflower and cotton – are sold soonafter harvesting at the beginning of the dry season. In both areas farmers may sellsome of their produce, store some for consumption during the wet season, or buysome food crops to supplement own production (Mutamba and Siziba 2002). How muchis consumed, sold and stored during the dry season should not exceed what is harvestedand bought by the household in the season. Similarly, during the wet season how muchis consumed and sold should not exceed the amounts bought during the season and howmuch was stored taking into account storage losses. Storage losses for sorghum andmaize were assumed to amount to 4 percent while those for groundnuts were assumednot to exceed 2 percent. If YIELDMz, YIELDGn, YIELDCtn, YIELDSunf and YIELDSg are yields of maize, groundnuts,cotton, sunflower and sorghum, respectively, and StMzD, StGnD and StSorgD arerespective quantities maize, groundnuts and sorghum carried over (stored) into thewet season, the following relationships capture the constraints implied by the above:

286 A GOAL PROGRAMMING MODEL FOR PLANNING MANAGEMENT OF MIOMBO WOODLANDS
MaizeYIELDMz GrMz - SgMzD - StMzD + BgMzD - CsMzD ≥ 0 (19)
0.96 StMzD - SgMzW + BgMzW - CsMzW ≥ 0 (20)
SorghumYIELDSg GrSorg - SgSorgD - StSorgD + BgSorgD - CsSorgD ≥ 0 (21)
0.96 StSorgD - SgSorgW + BgSorgW - CsSorgW ≥ 0 (22)
GroundnutsYIELDGn GrGn - SgGnD - StGnD - CsGnD ≥ 0 (23)
0.98 StGnD - SgGnW - CsGnW ≥ 0 (24)
CottonYIELDCtn GrCtn - SgCtn = 0 (25)
SunflowerYIELDSunf GrSunf - SgSunf = 0 (26)
In both Chivi and Gokwe sites, households with draft animals tended to be selfsufficient in maize production and no household was observed buying maize in the dryseason for the purposes of selling during the wet season. To add realism in the householdmodel further restrictions were added to take into account these two observations.
Table 3. summaries the average yields of the different crops in the two studysites and the draft and non-draft animal owning representative households.
Table 3. Crop yields (kg/ha) by survey site
Gokwe ChiviDraft Non-draft Draft Non-draft
Maize 911 754 1413 916
Cotton 834 689 1512 546
Groundnut 535 446 604 491
Sorghum - - 1053 722
Sunflower 667 384 875 834
Source: Field Data, 1999-2000.
3.2.5 Labour constraintsMembers of the household – men, women and children - in the communities studiedcontribute to activities undertaken with different degrees of specialization. Activitiesundertaken on the farm that demand labour include crop production, livestock tending,paid farm work at other households within the community, harvesting fuel wood andtimber for domestic use and for sale, working with hired draft animals, as well as domesticchores around the homestead such as fetching water, laundry, cooking, cleaning andtaking care of infants. For each class of household members (men, women or children),

287E. Guveya and C. Sukume
labour input into all activities must not exceed maximum labour available from the membersin the class plus any labour hired in to supplement the class’ labour. That is
TotLabi – CropLi – LiveLi – HireOutLi – WoodlandsLi – DomLi ≥ 0 (27)
where j=1,2,3 for men women and children respectively.Total labour (TotLab) consists of labour from the gender class/category of household
members (number of days in a year available to each category of household member(D) multiplied by the number of members in that labour category, Li,) and hired labourdays allocated to supplement requirements by gender/class (i.e. the fraction, η , ofhired labour allocated for the gender class or category) multiplied by total labour hiredby the household (HrInLab)). That is
TotLabi = D Li + η (HrInLab) (28)
Labour input by a household class into crop production (CropL) is defined as
CropLi = (Lmz,i GrMz +Lgn,iGrGn + Lctn,i GrCtn + Lsunf,iGrSunf + Lsorg,iGrSorg ) (29)
where Lmz,i
, Lgn, i
, Lctn,i
, Lsunf,i
and Lsorg,i
are labour input per hectare and by a householdgender category in the production of maize, groundnuts, cotton, sunflower and sorghum,respectively.
Labour input by a household gender category in livestock related activities (LiveLi)consists of labour required to tend animals and labour use in working with hired outdraft animals. Working with hired draft animals is generally considered a preserve ofmen in the household and so the following constraint applies to men only
LiveLi = Llv(0.8 Ca + 0.04 Gt +0.6 Dk) + λ (HrOxOut + HrDonkOut) (30)
where: Ca, Gt and Dk are numbers of cattle, goats and donkeys owned by the households.Llv is the household male labour input per livestock unit into livestock operations.
λ is an indicator variable taking on a value 1 if a household works with hired draftanimals and zero otherwise.
In addition, households may supplement incomes through selling of labour(HrOutLab) to other households’ farming operations. In the communities studied adultmembers –men and women - of the household mostly do this. In the model we assumeequal sharing of this activity between men and women in the household and excludechildren. Children are excluded since they go to school and their little labour is availableduring school holidays and largely not hired out. Thus the proportion of male andfemale labour to total hired out labour, HireOutL, available in the household can berepresented as
HireOutL= φ HrOutLab (31)
where φ takes on a value of 0.5 for men, 0.5 for women and zero for children.In the communities studied households harvest woodlands for firewood and non-
timber forest products mainly for domestic use with very little for sale directly (Mutambaand Siziba 2002). However, firewood collection and use statistics mask activities

288 A GOAL PROGRAMMING MODEL FOR PLANNING MANAGEMENT OF MIOMBO WOODLANDS
related to harvesting of firewood for brick making and beer brewing, activities thatgenerate incomes for some households and this is therefore an indirect way of sellingfirewood. The total labour supplied to woodlands harvesting (WoodlandsLi) by a householdgender class (i) is modelled as
WoodlandsLi = (Lnt,i NtFp + Lfw,i ClFw + γ i ClFwSLab) (32)
where Lnt,i
and Lfw,i
are respectively labour inputs into collection of non-timber forestryproducts and fuel wood for home consumption by gender class i, and γ i is the proportionof household labour used for collection of fuel wood for sale (ClFwSLab). NtFp andClFw are indicator variables taking on a value 1.
Lastly, each gender class’ contribution to domestic activities (DomLi) is specified as:
DomLi = Ldom,iDomA (33)
where Ldom,i is the number of days of the year gender class i is involved in domesticchores. DomA is a scaling constant, taking on a value 1/8 to indicate that a memberof a household only works one hour in an eight-hour day on such activities.
On total labour time available, the overriding assumption is that adults work for260 days in a year while each child provides labour during the 95 days of the year theyare on school holidays and week ends. Also all labour inputs of children are in adultequivalent assuming children labour input is 50 % of adult labour. Each child can onlymake available 47.75 labour days to the household labour pool. Table 4 summarisesthe labour constraints parameters used in the four models analysed in this study
3.2.6 Dietary constraintsThe types of foods households consume greatly affect their food production and purchasingdecisions. Thick porridge of maize and/or sorghum (locally known as sadza) forms thebase of most meals consumed by households in Gokwe and Chivi and is the main source ofenergy. The meals are complemented by relish consisting mostly of boiled or partiallyfried vegetables (from gardens or forests) in vegetable oil or peanut butter. Dependingon affluence and opportunity households also consume meat (bush meat, chicken, goat,or beef), fresh and dried fish, butter, milk and pulses (beans and pigeon peas). Littleresearch has been done on the nutritional composition of these meals. Discussion withfood scientists at the University of Zimbabwe’s Food Science Department in 1999 indicatethat almost all of the energy requirements of households in communal areas of Zimbabwecome from consumption of maize, groundnuts, milk products, meat and sorghum withmaize contributing a minimum of 50 percent of the energy. These food commodities arealso estimated to contribute at least half of the protein intake of households with the restcoming from vegetables as well as other foods.
Household energy demand in the dry season (EnDD) and in the wet season (EnDW)are equivalent to the sums of half yearly energy requirements for the men (HHcM),women (HHcW), and children (HHcChn) in the household, based on recommendeddaily intake. Thus
EnDD = EnDW = 0.5 (365) (2944 HHcM + 2180 HHcW + 2048 HHcChn)/1000 (34)
where EnDD and EnDW are measured in thousands of kilocalories.

289E. Guveya and C. Sukume
Table 4. Values of parameters in labour constraints
Parameter Gokwe ChiviDraft Non-draft Draft Non-draft
LI Men (HHcM) 2 1 2 1Women (HHcW) 2 1 1 2Children (HHcChn) 4 4 4 3
D Men 260 260 260 260Women 260 260 260 260Children 47.75 47.75 47.75 47.75
η Men 0.4 0.4 0.4 0.4Women 0.4 0.4 0.4 0.4Children 0.2 0.2 0.2 0.2
Lmz Men 20.81 23.44 23.4 24.83Women 20 23.44 35.28 37.59Children 19.4 11 41.23 41.45
Lgn Men 23 37 27 33.1Women 77.78 37 48.23 61.24Children 20 17 62.57 64.33
Lctn Men 151.79 142 107.38 162Women 149.25 142 117.81 149Children 67.82 65 112.25 111.5
Lsunf Men 16 16 13.57 11Women 16 16 18.14 18.14Children 14.34 7 25.57 25.57
Lsorg Men 23.4 33.9Women 35.3 43.33Children 41.23 50
Llv Men 3.89 12 3.65 22.1Women 2.57 18.5 1.97 18.2Children 0.02 0 1.64 2.9
λ Men 1 1 1 1Women 0 0 0 0Children 0 0 0 0
φ Men 0.5 0.5 0.5 0.5Women 0.5 0.5 0.5 0.5Children 0 0 0 0
Lnt Men 59.3 58.1 87.4 99.1Women 27.3 16.7 10.1 7.1Children 22.3 23.5 40.2 26.2
Lfw Men 8.4 6.7 6 5.1Women 22.9 39.5 43.6 35.6Children 15.3 11.6 22.3 16.7
γ Men 0.5 0.5 0.5 0.5Women 0.2 0.2 0.2 0.2Children 0.3 0.3 0.3 0.3
Ldom Men 5.7 1.9 12.8 11.1Women 95.7 97.5 320.6 238.8Children 94.1 93.5 190.4 138.2

290 A GOAL PROGRAMMING MODEL FOR PLANNING MANAGEMENT OF MIOMBO WOODLANDS
Energy supply on the other hand is the sum of contribution of the amounts consumedby the household from produced and purchased foodstuff. Contributions of each majorenergy source (maize, sorghum, groundnuts, milk and meat) are given in Table 1. Thusthe relationships for household energy supplied in the dry and wet seasons are,respectively,
EnSD = (3450 CsMzD + 5700 CsGnD + 2350 CsBfD+ 660 CsMkD+ 3450CsSorgD)/1000 (35)
EnSW = (3450 CsMzW + 5700 CsGnW + 2350 CsBfW+ 660 CsMkW+ 3450 CsSorgW)/1000 (36)
where EnSD and EnSW are measured in thousands of kilocalories.If the identified major crops supply all the energy required by the household, then
the supply and demand constraint requires that demand should be less than or equal toenergy supplied. That is,
EnSD ≥ EnDD (37)EnSW ≥ EnDW (38)
That a minimum 50 percent of energy comes from food grains (maize and sorghum)implies that in the two seasons,
3.45(CsMzD + CsSorgD) ≥ 0.5 EnDD (39)and3.45(CsMzW + CsSorgW) ≥ 0.5 EnDW (40)
Given that recommended average daily intake of protein are 0.057 kilogramsfor men, 0.048 kilograms for women and 0.051 kilograms for children (University ofMinnesota 2002), household demands for protein in dry (ProtDD) and wet (ProtDW)seasons are,
ProtDD = ProtDW = 0.5 (365) ( 0.057 HHcM + 0.048 HHcW + 0.051 HHcChn) (41)
Similarly, given that maize supplies 0.1 kilograms, sorghum 0.1 kilograms,groundnuts 0.25 kilograms, meat 0.180 kilograms per kilogram of food taken whilemilk supplies 0.035 kilograms per litre consumed (USDA 2002), the protein supplied bythe major food products in the two seasons, ProtSD (dry) and ProtSW (wet) are:
ProtSD = 0.100 (CsMzD +CsSorgD) + 0.250 CsGnD + 0.180 CsBfD+ 0.035 CsMkD (42)
ProtSW = 0.100 (CsMzW +CsSorgW) + 0.250 CsGnW + 0.180 CsBfW+ 0.035 CsMkW (43)
Thus, if the major foods provide for a minimum of roughly 55 percent of proteinrequired by the household, the protein supply and demand constraint in the two seasonsbecomes:

291E. Guveya and C. Sukume
ProtSD ≥ 0.55 ProtDD (44)ProtSW ≥ 0.55 ProtDW (45)
In an effort to reflect the consumption habits in study areas constraints requiringa minimum consumption of 0.5 kilogram of meat per household per week as well asmaximum groundnut consumption limitation per half a year were imposed on the models.
CsBFD ≥ 0 (46)CsBFW ≥ 0 (47)30 ≥ CsGnD (48)30 ≥ CsGnW (49)
3.2.7 Livestock grazing constraintsFeed for livestock in study areas is provided by pastures in the agricultural areas(fallow land and non-arable land between fields), accessible forest areas as well asstover from harvested fields during the dry season. Since fallow land is only availablein seasons in which farmers plough less than their total agricultural land, the availabilityof this land is transitory. The guaranteed or minimum grazing land available is theforest portion the households have access to, while the maximum grazing land is thecombined area of this forest portion and the average fallow land when it is available.
Natural pastures in communal areas of Zimbabwe are estimated to yield 1800kilograms of dry matter (DM) per hectare per year (Guveya 1995). Stover from grainproduction on the other hand is estimated to yield about 423 kilograms DM per hectareannually. An animal weighing 500 kilograms (i.e. 1 livestock unit) requires about 8 kgDM per day or 2.92 tonnes per livestock unit (LU) per year (Guveya 1995). Livestockunit equivalents of cattle, goats and donkeys, the major classes of animals kept instudy areas, are respectively, 0.8, 0.04 and 0.6 LUs.
Based on the above information, feed supply (FeedS) from stover and naturalgrassland (Graz) is
FeedS = 0.253 (GrMz + GrSorg) + 1.8 Graz (50)
where FeedS is measured in tonnes of DM.Feed demand for each animal type/class is equivalent to feed requirement per
livestock unit multiplied by the livestock unit equivalence of the animal and theproduct multiplied by the number of animals in the class. Thus, total feed demandbecomes:
FeedD = 2.92 (0.8) Ca + 2.92 (0.04) Gt + 2.92 (0.6) Dk (51)
where Ca, Gt and Dk are respectively the number of cattle, goats and donkeys ownedby the household at the start of the year.
Supply and demand constraints for feed require that feed demanded is less than orequal to available feed,
FeedS ≥ FeedD (52)

292 A GOAL PROGRAMMING MODEL FOR PLANNING MANAGEMENT OF MIOMBO WOODLANDS
3.2.8 Livestock production and utilization constraintsApart from draft services, livestock provides a number of benefits including incomefrom their sale, capital gains from reproduction, income from sale of milk as well asdirect consumption benefits. Capital gains due to reproduction will depend on thenumber of females in the herd as well as the calving/kidding rate net of mortality. Datacollected in the study areas did not include this information. For the purposes of themodeling exercise we resorted to national estimates for the communal sector reportedin Guveya (1995). Calving/kidding rates net of mortality are estimated to be 45% forcattle and donkeys and 120% in the case of goats. Percent of females in national herdare estimated to be 56% for cattle, 67% donkeys and 75% goats.
Given these statistics end of year stocks of livestock can be specified as
Cattle: Caf = 0.45 (0.56) Ca + Ca (53)
Goats: Gtf = 1.2 (0.75) Gt + Gt (54)
Donkeys: Dkf = 0.45(0.67)Dk + Dk (55)
where Ca, Gt and Dk are beginning stocks of cattle, goats and donkeys.and Caf, Gtf and Dkf are end of year stocks for the respective animals.
To maintain a stable herd size, we assume that livestock sold cannot exceedlivestock born. Thus,
0.45 (0.56) Ca - CaSg ≥ 0 (56)1.2 (0.75) Gt - GtSg ≥ 0 (57)0.45 (0.67) Dk - DkSg ≥ 0 (58)
where CaSg, GtSg and DkSg are numbers of cattle, goats and donkeys sold, respectively.Most of the households with draft animals milked cows for household consumption
and sale even though the yields were quite modest. In Mutangi, Chivi district, householdsgot an average of 253 litres per year while in Mafungautsi, Gokwe district, they gotabout 294 litres per year (Mutamba and Siziba 2002). Given that average cattle holdingsby households with draft animals in Chivi and Gokwe study areas were 6 and 8,respectively, the proportion of cows in the herd and the assumed calving percentagelead to milk yield per milking cow of 167 and 144 litres in Chivi and Gokwe, respectively.Availability of better forage in the wet season implies that most of this yield will beobtained during the wet season. It is estimated that dry season production is half ofthat during the wet season. Thus in Chivi a milking cow is estimated to yield about 56litres in the dry season compared to 111 litres during the wet season. In Gokwe amilking cow produces 48 litres in the dry season and 96 litres during the wet season.
The seasonal milk production constraints are then:
MyieldD (0.45) (0.56) Ca - PrMkD ≥ 0 (59)MyieldW (0.45) (0.56) Ca - PrMkW ≥ 0 (60)
where MyieldD and MyieldW are milk yield during dry and wet seasons, and PrMkD andPrMkW are household milk production during dry and wet seasons, respectively.
Milk produced is either consumed or sold. How much is consumed and/or sold ina season is assumed not to exceed the volume of milk produced. That is,

293E. Guveya and C. Sukume
PrMkD - CsMkD – SgMkD ≥ 0 (61)PrMkW - CsMkW - SgMkW ≥ 0 (62)
where CsMkD and CsMkW are litres of milk consumed during the dry and wet seasons,and SgMkD and SgMkW are litres sold during the dry and wet seasons, respectively.
Since no household milking cows were reported the purchase of milk to supplementown production and that consumed by the household was limited to be at most equalto the amount produced. That is
PrMkD - CsMkD ≥ 0 (63)PrMkD - CsMkD ≥ 0 (64)
3.2.9 Household fuelwood consumption and sales constraintsIn addition to labour allocated to domestic and farming related activities, householdsdevote labour time to collection of fuelwood and poles for household use as well as forsale. Across the two sites, average per capita consumption of fuelwood was 1.56 cubicmetres. Assuming a woodland stocking of 50 cubic metres per hectare, the area ofwoodlands harvested to satisfy household needs for fuelwood and poles (StkMioH)should at least be equal to household needs divided by woodland stocking. That is
StkMioH ≥ 1.56 (HHcM +HHcW+ HHcChn)/50 (65)
Very little of direct marketing of woodland products was observed in the twostudy sites. The insignificant commercial harvesting was for use as inputs into otherincome generating activities, such as beer brewing and brick curing. In this study weassume that the value of the harvested firewood and poles is equal to the opportunitycost of labour utilised to harvest these products. How much is collected for incomegeneration is then equal to how much the household can allocate to harvesting for sale(ClFwSLab) multiplied by how much the household can harvest per unit of labour input.How much a household can collect per labour-day – a form of firewood and polescollecting efficiency measure (EfCoef) – is estimated by dividing domestic needs ofthese products by the time the household devotes to collecting them. That is,
3
EfCoef = [1.56*(HHcM +HHcW+ HHcChn)]/( Σ Lfw,i
) (66)j=1
where Σ i Lfw,i is the sum of labour allocated to collecting firewood and poles by men,women and children in the household for domestic use. Area of forest used to satisfyharvests for income generation (StMioS) is therefore:
StMioS ≥ EfCoef ClFwSLab (67)
Total area, Areamio, of woodland harvested by the household is thus
Areamio = StkMioH + StMioS (68)
Government conservation regulation enforced through chiefs and village heads in thestudy areas is that no harvest for poles and firewood from communal areas should be

294 A GOAL PROGRAMMING MODEL FOR PLANNING MANAGEMENT OF MIOMBO WOODLANDS
for sale outside the areas of origin. This is an imperfect way of ensuring that woodlandharvest is as close as possible to biological sustainable harvest, if we assume that harvestingfor household consumption does not degrade the woodlands significantly. To try to mimicthis policy we introduce into the model a constraint limiting the amount harvested by afamily to be less than its share of regeneration of the woodland stock in the community.The communities in Gokwe and Chivi can access 60,000 hectares and 5670 hectares ofwoodlands respectively. A 3 percent regeneration rate for woodland is assumed in thetwo sites. Given that the number of households in Gokwe and Chivi are 4558, and 453families, respectively, the per household maximum biologically sustainable harvests(Miomax) are estimated at 0.40 and 0.38 hectares in Gokwe and Chivi, respectively. Thewoodland biological sustainability requirement can be specified thus,
Miomax ≥ StkMioH + StMioS (69)
4. RESULTS AND DISCUSSIONThe model allows us to answer a number of questions about the likely effects ofchanges in the socio-economic environment in which the Gokwe and Chivi communitiesunder study reside. Specifically, we scrutinise the likely impacts on levels ofachievement of a weighted household goal combining food security and income, resultingfrom woodlands use, crop mix, labour utilised in woodlands related activities relativeto agriculture, among others, under the following scenarios:
• Current price and cost structure with no sustainability restrictions,• Current price and cost structure with sustainability restrictions,• Changes in all agricultural commodity prices,• Changes in agricultural productivity,• Changes in agricultural input prices, and• Restrictions on household labour availability, e.g. through death or institution of
laws preventing use of child labour in production.
4.1 Baseline resultsTables 5 and 6 present the base case results from the model simulation runs. With theexception of non-draft owners in Gokwe, all other representative households wereshown to potentially achieve fully their food security and income goals as well asharvest timber within sustainable harvest levels identified in section 3.2.9. In thosehouseholds that harvested woodlands unsustainably, simulations showed forcingsustainable harvesting entails more than proportionate loss in achievement of incomegoals. For non-draft owning households in Gokwe, a 32 percent reduction (0.71 to0.40 hectares) in harvest forced by sustainability restrictions led to an increase inincome deficit of 61 percent compared to baseline predictions.
The baseline results seem to support the view that natural resource degradation tendsto occur in areas with abundant resources. Baseline simulation results clearly show higherlevels of woodland use in Gokwe compared to Chivi, a resource poor community. Draftowning households in Gokwe harvest 0.25 hectares compared to 0.22 hectares harvestedby their counterparts in Chivi, while non-draft owning households in Gokwe harvest 0.71hectares compared to 0.20 in Chivi. In addition, as expected draft owning households tendto crop more land compared to non-draft owning households in both project sites.

295E. Guveya and C. Sukume
Table 5. Baseline results of simulations in Chivi
Chivi—Draft owners Chivi—Non-draft ownersNo-Enva Envb Change No-Env Env Change
Food security goal N1 0 0 0 0 0 0
P1 0 0 0 0 0 0
Income goal N2 0 0 0 0 0 0
P2 0 0 0 0 0 0
Labour allocation to woodlands (%) 59.37 59.37 0 61.13 61.13 0
Labour allocation for woodlands for sale (%) 0 0 0 3.73 3.73 0
Area of woodlands harvested (ha) 0.22 0.22 0 0.20 0.20 0
Area under food crops (ha) 2.15 2.15 0 0.83 0.83 0
Area under cash crops (ha) 0.00 0.00 0 1.09 1.09 0
Total cropped land (ha) 2.15 2.15 0 1.92 1.92 0
Dual price of agricultural land 0 0 0 0 0 0
a No-Env implies that no environmental restrictions like in an open access situation.b Env implies that environmental restrictions are enforced.
Table 6. Baseline results of simulations in Gokwe
Draft owners Non-draft owners
No-Env Env Change No-Env Env Change
Food security goal N1 0 0 0 0.00 0.00 0.00
P1 0 0 0 0.02 0.02 0.00
Income goal N2 0 0 0 1.55 62.70 61.15
P2 0 0 0 0.00 0.00 0.00
Labour allocation to woodlands (%) 46.6 46.6 0 219.9 122.0 -97.9
Labour allocation for woodlands for sale (%) 0 0 0 162 64 98
Area of woodlands harvested (ha) 0.25 0.25 0 0.71 0.40 -0.32
Area under food crops (ha) 2.16 2.16 0 0.95 0.95 0.00
Area under cash crops (ha) 0.77 0.77 0 0.42 0.42 0.00
Total cropped land (ha) 2.93 2.93 0 1.37 1.37 0.00
Dual price of agricultural land 0 0 0 0.00 0.00 0.00
4.2 Effects of an increase in output pricesTo assess the impact of a general increase in output prices that could be brought about byfor instance improvement in road infrastructure, setting up of marketing infrastructurecloser to the community, devaluation of an overvalued exchange rate or removal ofexplicit government taxes on outputs, we simulated the Gokwe and Chivi models withoutput prices set at 25 % more than the current prices. Tables 7 and 8 report the changesfrom base model results obtained for the two study sites. As expected, simulation results

296 A GOAL PROGRAMMING MODEL FOR PLANNING MANAGEMENT OF MIOMBO WOODLANDS
indicate that a general output price increase has potential to improve the attainment ofincome and nutrition goals. Draft owners in Chivi and Gokwe and non-draft owners inChivi fully satisfied both goals under the with- and the without environmental concernsscenarios. Gokwe non-draft owners under unrestricted forest access manage to fully achieveboth goals. Even with a sustainability constraint (Env), Gokwe non-draft owning householdsimprove achievement of the income goal by about 16 percent.
Table 7. A 25% output price increase of simulations in Chivi
Chivi—Draft owners Chivi—Non-draft owners
No-Env Change Env Change No-Env Change Env Change
Food security goal N1 0 0 0 0 0 0 0 0
P1 0 0 0 0 0 0 0 0
Income goal N2 0 0 0 0 0 0 0 0
P2 0 0 0 0 0 0 0 0
Labour allocation to
woodlands (%) 59.4 0 59.4 0 57.4 -3.73 57.4 -3.73
Area of woodlands harvested (ha) 0.22 0 0.22 0 0.19 -0.01 0.19 -0.01
Area under food crops (ha) 2.02 -0.13 2.02 -0.13 0.86 0.02 0.86 0.02
Area under cash crops (ha) 0.00 0 0.00 0 1.07 -0.02 1.07 -0.02
Total cropped land (ha) 2.02 -0.13 2.02 -0.13 1.92 -2.1E-07 1.92 -2.1E-07
Dual price of agricultural land 0 0 0 0 0 0 0 0
Why not cultivate more cash crops when prices increase and additional land isavailable? A close look at the model results points to two major constraints to increasingcash crop production. The first is the high labour and cash input requirement of themajor cash crop, cotton, which makes the liquidity constraint binding. The second isthe draft power constraint in a situation of limited draft leasing.
Table 8. A 25% output price increase of simulations in Gokwe
Gokwe—Draft owners Gokwe—Non-draft owners
No-Env Change Env Change No-Env Change Env Change
Food security goal N1 0 0 0 0 0.00 0.00 0.00 0.00
P1 0 0 0 0 0.02 0.00 0.02 0.00
Income goal N2 0 0 0 0 0.00 -1.55 47.12 -15.58
P2 0 0 0 0 0.00 0.00 0.00 0.00
Labour allocation to woodlands (%) 46.57 0 46.57 0 235.6 15.8 122.0 0.00
Area of woodlands harvested (ha) 0.25 0 0.25 0 0.76 0.05 0.40 0.00
Area under food crops (ha) 2.09 -0.06 2.09 -0.06 1.10 0.15 0.95 0.00
Area under cash crops (ha) 0.79 0.02 0.79 0.02 0.34 -0.08 0.42 0.00
Total cropped land (ha) 2.88 -0.04 2.88 -0.04 1.44 0.07 1.37 0.00
Dual price of agricultural land 0 0 0 0 0 0 0 0.00

297E. Guveya and C. Sukume
A priori, we would expect a general increase in output prices to make returns tolabour in agriculture to rise relative to returns from woodlands activities leading tomore land and labour being demanded for agriculture and reduced reliance on woodlands,at least in the short-run. Using data from 19 Tanzanian regions Angelsen et al. (1999)observed significant increases in cropped area with increases in agricultural outputprices. A study by Deininger and Minten (1999) using satellite imagery informationfrom Mexico found a significant and positive relationship between forest areaconverted to agriculture and agricultural output price increases. Similar results werefound in two separate studies on deforestation in Thailand by Cropper et al. (1997)and Panayotou and Sungsuwan (1994). However, in Zimbabwe, a study by Chipika andKowero (2000) found a weak positive relationship between agricultural land expansionand crop output price increases.
Results from simulations in the two sites and for the two household type modelsprovide evidence both supporting and refuting the above observations. The resultsshow a decrease in woodlands area harvested with increase in output prices. Draftowners in Chivi and Gokwe show no change in labour use in woodlands from baselinewhile non-draft owners in Chivi and Gokwe register decreases in both labour use inwoodlands and total area of woodlands harvested. Further, in all areas with the exceptionof the no-draft owners in Gokwe that predicted no change, a general decrease in totalarea cropped under both with and without sustainability concerns were predicted. Theseresults tend to suggest that improvement in output prices over a situation where bothfood security and income goals are met would reduce the need to over-achieve thesegoals through expansion in either agriculture or woodland harvesting with householdspreferring to enjoy more leisure. In households where agriculture is currently failing tosatisfy income requirements and woodlands are already making a significant contributionto household income, the 25 percent improvement in selling prices of commoditieswould lessen dependency on forests. In the case of non-draft owners in Gokwe, however,the improvement would not be large enough to wipe out the deficit in achievement ofthe income goal, thereby making reduction in agriculture in favour of more leisure anunaffordable luxury.
4.3 Effect of an increase in agricultural productivityIn general, we would expect the changes in crop productivity to have an indeterminatedirection of impact on woodland use. This indeterminacy on the impact of productivityon deforestation is borne out in empirical research. On one hand, an increase inproductivity that does not have an appreciable impact on commodity prices and labourdemand could lead to an increase in agricultural profitability and hence promoting ashift from harvesting of woodlands towards agriculture. On the other hand, yieldimprovements may trigger declines in prices affecting agricultural profitabilitypromoting harvesting of forests (Kaimowitz and Angelsen 1998). Studies by Deiningerand Minten (1996) and Panayoutou and Sungsuwan (1994) showed that increase inagricultural yield was associated with a reduction in deforestation while studies byAngelsen et al. (1996) and Katila (1995) reported an increase in deforestation withproductivity improvement. Yet studies by Barbier and Burgess (1996) and Chakraborty(1994) showed no significant effect of yield changes on deforestation.
To assess the impact of general increase in agricultural productivity, we simulatedthe Gokwe and Chivi models with yields increased by 25 %. Crop yields increases could

298 A GOAL PROGRAMMING MODEL FOR PLANNING MANAGEMENT OF MIOMBO WOODLANDS
Table 10. A 25% yield increase simulations Gokwe
Gokwe– Draft owners Gokwe – Non-draft owners
No-Env Change Env Change No-Env Change Env Change
Food security goal N1 0 0 0 0 0.00 0.00 0.00 0.00
P1 0 0 0 0 0.02 0.00 0.02 0.00
Income goal N2 0 0 0 0 0.00 -1.55 0.00 -1.55
P2 0 0 0 0 0.00 0.00 0.00 0.00
Labour allocation to 46.57 0 46.57 0 252.1 32.2 122.0 -97.9woodlands (%)
Area of woodlands harvested (ha) 0.25 0 0.25 0 0.82 0.10 0.40 -0.32
Area under food crops (ha) 1.68 -0.48 1.68 -0.48 1.19 0.24 1.03 0.08
Area under cash crops (ha) 0.91 0.14 0.91 0.14 0.20 -0.22 0.38 -0.04
Total cropped land (ha) 2.59 -0.34 2.59 -0.34 1.39 0.02 1.41 0.04
Dual price of agricultural land 0 0 0 00 0 0 0 0
be due to use of improved seed, fertilizers and pesticides. Table 9 and 10 report thechanges from base model results obtained for the two study sites. As expected, yieldimprovements promoted achievement of both food security and income goals. In allareas under both ‘with’ and ‘without’ environmental concern scenarios, there is fullachievement of the nutrition and income target levels.
Table 9. A 25% yield increase simulations in Chivi
Chivi – Draft owners Chivi – Non-draft owners
No-Env Change Env Change No-Env Change Env Change
Food security goal N1 0 0 0 0 0 0 0 0
P1 0 0 0 0 0 0 0 0
Income goal N2 0 0 0 0 0 0 0 0
P2 0 0 0 0 0 0 0 0
Labour allocation to 132.19 72.82 101.94 42.67 57.4 -3.73 57.4 -3.73woodlands (%)
Area of woodlands harvested (ha) 0.49 0.27 0.38 0.16 0.19 -0.01 0.19 -0.01
Area under food crops (ha)1.67 -0.48 1.67 -0.48 1.29 0.46 1.29 0.46
Area under cash crops (ha) 0.00 0 0.00 0 0.00 -1.09 0.00 -1.09
Total cropped land (ha) 1.67 -0.48 1.67 -0.48 1.29 -0.63 1.29 -0.63
Dual price of agricultural land 0 0 0.00 0 0 0 0 0
On woodlands use, simulation results seem to support the indeterminacyhypothesis. Draft owning households in Chivi were predicted to increase the labourallocated to harvesting woodlands while their counterparts in Gokwe were predictedto have no change in woodlands related activities under the with- and without

299E. Guveya and C. Sukume
environmental concern management regimes. On the other hand, non-draft owninghouseholds in Chivi projected a reduction while those in Gokwe projected an increasein labour allocated to woodlands harvesting under the without environmental concernscenarios. Evoking sustainability (i.e. enforcing the environmental constraint) wouldlead to a reduction in labour for harvesting woodlands with crop yield increase inhouseholds without draft animals.
As the case with output price increases, and possibly for the same reason, cropyield increases would induce declines in total area cropped with the exception of non-draft owners in Gokwe. This tends to suggest that household decision-making is largelyguided by the principle of satisfaction of minimum requirements rather than maximizingsurplus. To test whether this result is due to the structure of the model we ran themodel without the requirement of minimising positive income deviation. The resultsfor both categories in Gokwe showed insignificant sensitivity to this modification.
4.4 Effect of an increase in input pricesIncreasing the prices of inputs is likely to lead to two opposing effects (Kaimowitz andAngelsen (1998). On one hand, an increase in crop input prices will lead to a decreasein agricultural profitability and could promote the harvesting of woodlands for sale tocompensate for loss in crop income. On the other hand, subsistence farmers following a“safety-first” food production strategy could substitute cash inputs with land if inputprices were increased, and this could lead to an increase in agricultural labour relativeto that for harvesting woodland. The net effect would most probably be indeterminate.In a number of CGE modelling efforts that looked at the impact of lowering agriculturalsubsidies – which is the same as increasing input prices – this indeterminacy seems to besupported. A study by Mwanawina and Sankayan (1996) in Zambia estimated that anincrease in input prices tends to increase the area under agriculture, while a similarstudy in Tanzania showed no effect due to input price increases. A study by Coxheadand Chively (1995) in the Philippines estimated a reduction in deforestation due toinput price increases.
Another dimension that may affect how responsive a community’s woodlands useis to input price increases are the initial levels of cash inputs and the cropping patterns.Communities that use a lot of cash inputs and are involved in cash crop productionsuch as cotton (that tend to demand more cash inputs such as fertilisers, seed andagrochemicals) would tend to exhibit more inelastic response to changes in pricescompared to communities that traditionally use little bought inputs. Thus we wouldexpect the response to be more muted in Gokwe where cotton growing is a majorenterprise compared to Chivi which is relatively more subsistence oriented.
To assess the impact of general increase in cash input prices we simulated theGokwe and Chivi models with cash input prices increased by 25 %. Tables 11 and 12report the changes from base model results obtained for the two study sites.
For the relatively well-off draft owning households in both sites, an input priceincrease would not affect the achievement of both food security and income goals.For non-draft owning households however there would be a reduction in ability tomeet goals. In Chivi they would underachieve the nutrition goal by 1.5% while inGokwe they would underachieve the income goal by 14 percent (or by 75% ifenvironmental sustainability is enforced).

300 A GOAL PROGRAMMING MODEL FOR PLANNING MANAGEMENT OF MIOMBO WOODLANDS
Table 11. A 25% input price increase simulations for Chivi
Chivi—Draft owners Chivi—Non-draft owners
No-Env Change Env Change No-Env Change Env Change
Food security goal N1 0 0 0 0 1.53 1.53 1.53 1.53
P1 0 0 0 0 0 0 0 0
Income goal N2 0 0 0 0 0 0 0 0
P2 0 0 0 0 0 0 0 0
Labour allocation towoodlands (%) 59.37 0 59.37 0 61.75 0.62 61.75 0.62
Area of woodlands harvested (ha) 0.22 0 0.22 0 0.20 0.00 0.20 0.00
Area under food crops (ha) 1.89 -0.26 1.89 -0.26 0.81 -0.03 0.81 -0.03
Area under cash crops (ha) 0.00 0 0.00 0 1.11 0.03 1.11 0.03
Total cropped land (ha) 1.89 -0.26 1.89 -0.26 1.92 1.5E-07 1.92 1.5E-07
Dual price of agricultural land 0 0 0 0 0.03 0.03 0.03 0.03
Table 12. A 25% input price increase simulations for Gokwe
Gokwe—Draft owners Gokwe—Non-draft owners
No-Env Change Env Change No-Env Change Env Change
Food security goal N1 0 0 0 0 0.00 0.00 0.00 0.00
P1 0 0 0 0 0.02 0.00 0.02 0.00
Income goal N2 0 0 0 0 15.48 13.93 77.00 75.45
P2 0 0 0 0 0.00 0.00 0.00 0.00
Labour allocation to 154.7 108.2 73.7 27.1 219.9 0.0 122.0 -97.9woodlands (%)
Area of woodlands harvested (ha) 0.83 0.58 0.40 0.15 0.71 0.00 0.40 -0.32
Area under food crops (ha)3.65 1.5 4.64 2.55 0.95 0.00 0.95 0.00
Area under cash crops (ha) 0.00 -0.77 0.00 -0.79 0.42 0.00 0.42 0.00
Total cropped land 3.65 0.73 4.64 1.76 1.37 0.00 1.37 0.00
Dual price of agricultural land 0 0 0 0 0 0 0 0
Response to the reduced economic prospects due to higher agricultural input costdiffers in all areas. In Chivi, draft owning households would respond through a shift inthe composition of their food crop mix towards higher value, and high labour demandingcrops such as groundnut and reducing maize without increasing harvesting of woodlandsand actually reducing total area cropped. However, draft owning households in Gokwe,probably due to ease of obtaining woodland products in Gokwe, would respond to highagricultural costs by harvesting poles and firewood. The non-draft owning householdsin Chivi suffering reduced food security would respond with an increase in harvestingwoodland products and an increase in area under production emphasising cash crops.The increase could be higher as the positive dual price of land suggests. Very limitedoptions seemed to be available for non-draft owning households in Gokwe. The alreadyhigh labour allocation to woodlands resource harvesting (220 days) leaves little scope

301E. Guveya and C. Sukume
Table 13. Simulation of effects of loss of household member in Chivi
Chivi—Draft owners Chivi—Non-draft owners(loss of child labour) (loss of a woman)
No-Env Change Env Change No-Env Change Env Change
Food security goal N1 0 0 0 0 74.36 74.36 74.36 74.36
P1 0 0 0 0 0 0 0 0
Income goal N2 0 0 0 0 306.1 306.1 306.1 306.1
P2 0 0 0 0 0 0 0 0
Labour allocation towoodlands (%) 86.93 0.00 86.93 0.00 57.4 -3.73 57.4 -3.73
Area of woodlands harvested (ha) 0.27 0.00 0.27 0.00 0.16 -0.04 0.16 -0.04
Area under food crops (ha) 2.07 0.16 2.07 0.16 1.23 0.40 1.23 0.40
Area under cash crops (ha) 0.00 0.00 0.00 0.00 0.00 -1.09 0.00 -1.09
Total cropped land (ha) 2.07 0.16 2.07 0.16 1.23 -0.70 1.23 -0.70
Dual price of agricultural land 0 0 0 0 0 0 0 0
for cropland expansion under the without environmental sustainability constraint.Unsustainable baseline harvest levels would imply that the household could not expandforest related employment to counter poor agricultural returns under the sustainabilityconstraint scenarios. Further, input buying related liquidity constraints could force farmersto reduce plantings.
4.5 Impact of loss of some household membersThe HIV/AIDS epidemic has reached unprecedented levels in Zimbabwe. In 1999 anestimated 1.5 million people were living with AIDS representing an adult prevalencerate of 25.1 percent and leading to 160,000 AIDS related deaths (UNAIDS 2000). Accordingto a recent FAO/UNAIDS (2001) study, agricultural output of small farmers in some partsof Zimbabwe may have fallen by as much as 50 percent in the past five years, mainlybecause of AIDS. The study attributed to AIDS over 50 percent of deaths - 78 percent ofwhich were men - in the areas studied (UNAIDS 2001).
The problems of HIV/AIDS in farming communities begin as soon as the first adult inthe household becomes sick. Those suffering need the help of their kin, so the familyloses not only the labour of the sick but also of other relatives. The situation worsens ifother household members get the disease. The family budget is squeezed to pay formedical bills and, ultimately, funeral costs thereby reducing money available to buyseeds and other inputs, and forcing the sale of livestock and other assets. Further, onewould expect labour shortages due to HIV/AIDS to cause a range of farm changes,including a reduction in land under cultivation, a decline in crop yields and a shift fromcash crops to subsistence crops. Labour shortages may also lead to shifts towards mucheasier coping strategies for the household such as harvesting woodlands for sale.
To gain insight into the likely impact of AIDS and other common diseases likemalaria, on the household’s welfare we model situations where a household loses anadult (woman/man) or a child. Tables 13 and 14 report the potential impacts in thetwo study sites.

302 A GOAL PROGRAMMING MODEL FOR PLANNING MANAGEMENT OF MIOMBO WOODLANDS
Losses of child labour through the death of a child, or alternatively throughenactment of laws preventing employment of child labour, was modelled for draftowning households in Chivi and non-draft owning households in Gokwe. For Chividraft owning households, loss of a child did not prevent satisfaction of both foodsecurity and income goals. Simulations also show that there was no effect on areaof woodlands harvested. However, since loss of a child means demand of woodlandproducts for domestic use goes down, it implies harvest of timber for sale goes up.Simulations for Gokwe non-draft owning households however showed dramatic impactsof loss of a child. Simulations show a worsening failure to achieve both food security(15 percent) and income (10 percent) goals. Labour allocated to woodlands harvestingdrops by 97 labour days while total land cropped also drops. Results also show a shiftin production towards cotton (cash crop) production, a labour intensive activity,explaining why there was a drop in cropped area accompanied by an increase in landunder crops.
Loss of one woman’s labour in a household was modelled for Chivi non-draftowning households (Table 13). Simulation results show dramatic impacts on thehousehold. The household fails to attain food security goal by 74 percent and bymore than 100 percent the income goal. The household significantly reduces areacultivated and even stops growing cash crops altogether shifting efforts towardfood production. Despite these impacts, simulations show surprising little reductionin labour used on woodland harvesting with only 4 days reduction in woodlandharvesting labour. However, there was noted a slight decrease in area of woodlandharvested, while the opposite was observed in Gokwe when there was a loss of adultmale labour (Table 14).
Table 14. Impact of loss of household member in Gokwe
Gokwe—Draft owners Gokwe—Non-draft owners(loss of a man) (loss of child labour)
No-Env Change Env Change No-Env Change Env Change
Food security goal N1 0 0 0 0 15.41 15.41 15.41 15.41
P1 0 0 0 0 0.00 -0.02 0.00 -0.02
Income goal N2 0 0 0 0 11.48 9.93 11.48 9.93
P2 0 0 0 0 0.00 0.00 0.00 0.00
Labour allocation to 74.78 28.21 73.69 27.13 122.50 -97.40 122.50 -97.40woodlands (%)
Area of woodlands harvested (ha) 0.40 0.15 0.40 0.15 0.33 -0.38 0.33 -0.38
Area under food crops (ha) 4.79 2.63 4.79 2.69 0.81 -0.14 0.81 -0.14
Area under cash crops (ha) 0.00 -0.77 0.00 -0.79 0.49 0.08 0.49 0.08
Total cropped land (ha) 4.79 1.86 4.79 1.91 1.30 -0.07 1.30 -0.07
Dual price of agricultural land 0 0 0 0 0 0 0 0
All in all the results indicate substantial increase in poverty due to diseases likeHIV/AIDS that can constrain availability of labour. The total absence of adult femalelabour in the household due to such diseases has potential to adversely affect both

303E. Guveya and C. Sukume
income and food security by mainly to disrupting agricultural productivity, and couldincrease woodland harvesting for sale as this would remain an important income sourcefor households during this predicament.
5. MAIN FINDINGS AND CONCLUSIONSThis paper modeled woodland use in four representative households: draft animalowning households and non-draft animal owning households in a woodland abundantarea and a woodland poor area. The results indicate that woodland use tends to behigher in wood abundant areas compared to the resource poor areas and that woodlandresources are important sources of household income for the poor in resource abundantregions compared to households in the resource poor areas.
The study also simulated the likely impacts of agricultural incentives and effectsof absence of labour from productive members, for example due to death from diseasessuch as HIV/AIDS and malaria. The results indicate varied woodland use responsedepending on household characteristics. Basically three household types emerge thatare likely to influence household response to policy or situation change stimuli:
• Type I households are those fully satisfying both food security and income goalsfrom current agricultural activities with woodlands resources only used fordomestic requirements. In this category falls draft animal owning households inGokwe and Chivi.
• Type II households are those fully satisfying both food security and income goalsfrom current agricultural activities with some supplementary income comingfrom harvesting woodlands over and above domestic requirements. However,woodland resource harvest is still within sustainable levels. In this category arenon-draft animal owning households in Chivi.
• Type III households are those currently failing to satisfy either of their foodsecurity or income goals from current agricultural activities even withsupplementary income coming from harvesting woodlands over and abovedomestic requirements and beyond sustainable levels. This category describesnon-draft animal owning households in Gokwe.
The characteristics of the households described above are found to be closelylinked to how households respond to external shocks. In the event of drastic reductionsin agricultural incentives (e.g. reduction in yield or increase in input prices) Type Ihouseholds have some room to restructure agricultural activities to satisfy goals beforeturning to harvesting woodlands for income. Type II households have less opportunitiescompared to Type I households to restructure agriculture to counter adverse conditions.However, because they are currently harvesting within sustainable levels, they haveroom to increase harvests from the forests to increase incomes and be better able toachieve goals. Type III households however are in a difficult situation. Because theyare unable to satisfy goals from agriculture and from devoting maximum possiblelabour to harvesting woodlands, these households are likely to respond to adverseagricultural incentives by turning even more to woodland harvesting in an open accesssituation. However, under strict environmental sustainability enforcement, and becauseType III households exceed sustainable harvest under free access baseline condition,they cannot respond to adverse agriculture activities by resorting to woodlandharvesting.

304 A GOAL PROGRAMMING MODEL FOR PLANNING MANAGEMENT OF MIOMBO WOODLANDS
Better agricultural incentives (from say an increase in agricultural product prices)should allow Type I and II households to satisfy goals with less agricultural land freeing uplabour to either boost woodland harvesting or improvement in leisure. Type III households,because they are not satisfying goals in the baseline and due to improvement in relativereturns to agriculture, are predicted to respond to improvement in agricultural incentivesby allocating more land and labour to agriculture and less to woodland harvesting.
Loss of household members were shown to make the relatively poorer non-draftanimal owning households poorer while draft owning households could absorb the losseswithout losing their standards of living. Poorer households, already depending onwoodland resources to a significant level tend to reduce labour allocated to woodlandsand increase land under food crops in the event of loss of household members. Thericher households could increase dependence on woodland resources in the event of aloss in a household member. The results also indicate a strong gender bias in effectsof household member loss. The loss of a woman member induces debilitating declineinto abject poverty compared to other gender classes highlighting the central roleswomen play in the household production process.
The above conclusions demonstrate the strong effect on woodland use ofagricultural policies, HIV/AIDS related diseases, and institutional arrangementsprotecting forests. As Zimbabwe proceeds with its second - and much expanded -phase of the land reform and redistribution exercise, it is important that issues ofprotection of the woodlands are not ignored. Of particular concern is the lack ofconsideration for development of local level institutions governing the use of forestresources in the current land redistribution exercise. The model presented here providesa tool for potential use in crafting new policies and institutions governing woodlandresource use in the newly settled areas.
ENDNOTES1. Even though prices are held constant across seasons due to government price controls,
separating wet and dry season takes care of possibilities of storage losses, labour limitationsduring wet season as well as differences in milk productivity across season, etc.
REFERENCESAngelsen, A., Shitindi, E. F.K. and Aarrestad, J. 1999 Why do farmers expand their land
into forests. Theories and evidence from Tanzania. Environment and DevelopmentEconomics 4: 313-331.
Aune, J. B., Glomsrod, S., Iversen, V. and Wiig, H. 1996 Structural adjustment and landdegradation: a CGE analysis for Tanzania. In: Structural adjustment policies andthe environment in Tanzania, Zambia, and Ethiopia. Preliminary Seminar Report.Agricultural University of Norway.
Barbier, E. J. and Burgess, J.C. 1996 Economic analysis of deforestation in Mexico.Environment and Development Economics 1: 203-39.
Campbell, B., Grundy, I. and Matose, F. 1993 Trees and woodlands resources – Technicalpractices of small-scale farmers. In: Bradley, P.N, and K. McNamara (eds.) Livingwith trees: Policies for forestry management in Zimbabwe. World Bank TechnicalPaper No. 210. Washington DC, p29-62.
Campbell, B.M., Jeffrey, S., Kozanayi, W., Luckert, M., Mutamba, M. and Zindi, C. 2002

305E. Guveya and C. Sukume
Household Livelihoods in Semi-arid Regions: Options and Constraints. Centerfor International Forestry Research, Bogor.
Central Statistical Office (CSO). 1992 Zimbabwe National Census Report. GovernmentPrinters, Government of Zimbabwe, Harare.
Chakraborty, M. 1994 An analysis of the causes of deforestation in India. In: Brown, K.and Pearce, D. (eds.) The causes of tropical deforestation: Economic and statisticalanalysis of factors giving rise to the loss of tropical forests, 226-39. UniversityCollege Press, London.
Chipika, J.T. and Kowero, G. 2000 Deforestation of woodlands in communal areas ofZimbabwe: is it due to agricultural policies? Agriculture, Ecosytems and Environment79: 175-185.
Coxhead, I. and Shively, G. 1995 Measuring the environmental impacts of economicchange: the case of land degradation in Philippine agriculture. University ofWisconsin, Agricultural Economics Staff Paper Series No. 384. University ofWisconsin, Madison.
Cropper, M., Griffiths, C. and Mani, M. 1997 Roads, population pressures, and deforestationin Thailand, 1976-89. Policy Research Working Paper 1726. World Bank, Washington,DC.
Deininger, K. and Minten, B. 1996 Poverty, policies, and deforestation: the Case ofMexico. Research project on social and environmental consequences of growthoriented policies. Working Paper No. 5. Policy Research Department. World Bank,Washington, DC.
Kaimowitz, D. and Angelsen, A. 1998 Economic models of tropical deforestation: Areview. Centre for International Forestry Research, Bogor, Indonesia.
Katila, M. 1995 Modelling deforestation in Thailand. Paper to the IUFRO World Congress,Tampere, Finland.
Mwanawina, I. and Sankayan, P.L. 1996 A computable general equilibrium model tomeasure the effects of structural adjustment programmes on ecology anddevelopment in Zambia. In: Structural adjustment policies and the environment inTanzania, Zambia, and Ethiopia. Preliminary Seminar Report. Agricultural Universityof Norway.
Mutamba, M. and Siziba, S. 2002 Household livelihood strategies in two woodland sitesof different agricultural potential in Zimbabwe. Mimeo.
Nhantumbo, I. and Kowero, G. 2001 A goal programming model for planning managementof miombo woodlands. In: Modelling methods for policy analysis in miombowoodlands, 5-15. Occasional Paper No. 35. CIFOR, Bogor.
Panayotou, T. and Sungsuwan, S. 1994 An econometric analysis of the causes of tropicaldeforestation: the case of Northeast Thailand. In: Brown, K. and Pearce, D. (eds.)The causes of tropical deforestation: Economic and statistical analysis of factorsgiving rise to the loss of tropical forests, 226-39. University College Press, London.
Joint United Nations Programme on HIV/AIDS (UNAIDS) 2000 Report on the Global HIV/AIDS Epidemic – June 2000. UNAIDS, Geneva.
Joint United Nations Programme on HIV/AIDS (UNAIDS) 2001 Sustainable agricultural/rural development and vulnerability to the AIDS epidemic. A Joint FAO/UNAIDSStudy Report. UNAIDS, Geneva.
University of Minnesota 2002 Nutritive value of foods and diet calculator. Food ScienceDepartment, University of Minnesota, www.ardilla.umn.edu/nutritiontools/rda/.
United States Department of Agriculture (USDA) 2002 Nutrient database for standard

306 A GOAL PROGRAMMING MODEL FOR PLANNING MANAGEMENT OF MIOMBO WOODLANDS
reference, Release 15(2002). USDA, Washington DC. www.nal.usda.gov/fnic/cgi-bin/nut_search.pl
Vermeulen, S. 1997 Sharing of state owned resources with local residents: The case ofwood in Mafungautsi State Forest in Gokwe communal areas. Institute ofEnvironmental Studies Working Paper 4. Institute of Environmental Studies,University of Zimbabwe, Harare.

18.Management of miombo woodlandsin Malawi: An application ofgoal programming
H. Tchale, R. Kachule and C. Mataya
ABSTRACTMiombo is a local name for African woodlands prevalent in seven eastern and southernAfrican countries, namely Angola, Democratic Republic of Congo, Malawi, Tanzania,Mozambique, Zimbabwe and Zambia. The woodlands are surrounded by subsistencefarmers who largely depend on them for their livelihood. Unfortunately, there is noguarantee that the utilization of the resources from the miombo woodlands issustainable in the long-run, mainly due to the absence of effective control andmanagement of these vast resources.
In an effort to come up with a methodology for planning woodland management anduse, a model called MIOMBOGP based on the weighted goal programming (WGP) methodis employed. This methodology is used to evaluate how the various principal woodlandstakeholders respond to some macro-economic and sectoral policies in ways that satisfythe achievement of their goals. We identify households, the private sector andgovernments as the main stakeholders in the woodlands, who often have interests thatconflict with each other. This has potential to reduce the sub-optimization of the benefitsthey derive from the woodlands as well as adversely affecting the woodland condition.
Using this model on the data collected from the communities surroundingDzalanyama, Chimaliro and Mdeka forest reserves, the results imply that use of themiombo woodland resources is mainly influenced by prices of agricultural commodities,technological changes in agriculture, labour supply changes and prices of firewood andother energy sources. Thus when planning to change any of these variables, there is aneed to quantify the impact on the woodland resources because any pressure onagriculture holds potential to negatively affect woodland resource condition as well asthe benefits that flow from them.
Key words: Goal programming, miombo woodlands, Malawi

308 MANAGEMENT OF MIOMBO WOODLANDS IN MALAWI
1. INTRODUCTIONMiombo woodland characterise most of the African woodlands which are mainlydominated by species of Brachystegia, either in pure stands or in association withthose of Julbernadia and/or Isoberlinia (Lind &Morrison 1974; White 1983). Thesewoodlands are most prevalent in seven eastern, central and southern African countriesnamely Angola, Democratic Republic of Congo, Malawi, Mozambique, Tanzania, Zambia,and Zimbabwe (White 1983). They occupy an area of about 2.7million km2 and supportover 40 million people. The people live in the vicinity of the woodlands, while somereside in woodlands that are in public domain. They rarely live in the woodlands setaside as government forest reserves, but do encroach on them for several demands.Where the woodlands occur outside forest reserves, their clearing for agriculture hastaken place over the years.
These woodlands are surrounded mostly by subsistence farmers who largely dependon them for their livelihood in the form of energy sources, poles for the construction ofdwellings, thatch, food in the form of fruits, fungi, indigenous vegetables, insects andgrazing ground for livestock. Given this extensive dependence on these resources, thereis need to ensure that the resources are managed and used sustainably because the veryexistence of the communities depends on them. Apart from the communities, there arealso other stakeholders like the private sector, the government and the internationalcommunity that have commercial and conservation interests in the woodlands.
All the countries with miombo woodlands are implementing economic reformsthat seek to restructure their ailing economies. The policies and strategies employedaffect all the miombo woodland stakeholders differently and in ways that are not clearbut with potential effects on woodland based rural livelihoods and the forest condition.
The objective of this paper is to present a methodology for planning woodlandmanagement and use, by evaluating how the various principal woodland stakeholdersrespond to some key macroeconomic and sectoral policies in ways that satisfy theachievement of their goals. The satisfaction of some of these goals exerts pressureon the woodland resources. It is this pressure and the extent to which it manifestsitself in the woodlands that the paper seeks to address, and especially the sustainablesatisfaction of the needs of the key stakeholders.
This paper presents the results derived from a weighted goal programming model(MIOMBOGP) based on data collected from communities living around three forestreserves in Malawi namely Chimaliro in Kasungu district, Dzalanyama in Lilongwe districtand Michiru in Blantyre district.
The paper is arranged as follows: it starts with a description of the study sites,presentation of the goal programming model adapted for Malawi, the baseline results,the discussion of results from the sensitivity/alternative scenarios analysis, and finallyconclusions and recommendations. The basic goal programming model is presented inNhantumbo and Kowero (2001) and Annex1 presents the data used in building themodels for the three study sites while Annex 2 presents the variable definitions andunits of measurement.
2. DESCRIPTION OF THE STUDY SITESThe research was conducted in three different sites namely, Chimaliro and Dzalanyamain the central region of the country and Mdeka in the South of the country (Figure 1).This section describes the characteristics of these sites.

309H. Tchale, R. Kachule and C. Mataya
Figure 1. Map of Malawi showing the survey districts and the forest
reserve sites

310 MANAGEMENT OF MIOMBO WOODLANDS IN MALAWI
2.1 ChimaliroChimaliro is a gazetted forest reserve with tree species of Brachystegia and Jubernardiaas the predominant woodlands. The reserve is wholly indigenous, i.e. there is noplantation of exotic species. The reserve was declared a protected area in 1926 withan initial area of 98 square kilometres. All villages in the vicinity of the reserve wereclosed except one which acted as a caretaker. The people of this village were allowedto cultivate specific areas within the reserve. At the time the reserve was declared aprotected area, there were plenty of indigenous trees on the customary land such thatthere was no need or motivation for the villagers to go to the reserve for wood andother forest supplies/products. In 1945, the Forest Department prohibited cultivationin the reserve since the agricultural practices were considered detrimental to thewoodlands. In 1952, the government began to employ people to manage the forest. Atthat time, encroachment on the forest reserve had already started. The boundary ofthe reserve was then changed to its present position. Currently the reserve stretchesover an area of 160 km2 from the north east Zambian boarder (Lowore et al. 1995).
Food crops grown in the area include maize, groundnuts and beans, with tobaccoas the major cash crop. However, maize and groundnuts surpluses are also sold forcash. Livestock form another source of income through sales of milk, eggs, chickensand occasionally the stock itself. Minor sources of income include local beer brewing,moulding of bricks and sale of firewood. The traditional form of agriculture practisedwas shifting cultivation which involved clearing some of the miombo woodlands. Theminimum fallow period could be as long as 15 years. This allowed rejuvenation of soilfertility and re-growth of some tree species. Increasing land pressure due to populationgrowth has led to a sedentary form of agriculture with continuous cultivation on thesame piece of land that eroded soil fertility. Due to increasing importance of thetobacco crop and also due to the liberalization of tobacco production by allowingsmallholder farmers to also grow it, there has been a considerable conversion of theforest to cropland by estate and smallholder farmers.
All along, management and control of the reserve has been under the ForestDepartment. Communities surrounding the reserve were never allowed access intothe forest reserve for any forest products. However, beginning from the late 1990s,the concept of co-management was introduced along certain stretches of the reserve.Communities are now allowed access to the forest for non-timber products such aswild fruits, honey, grass and caterpillars. The estate sector is occasionally allowedaccess for poles and fuel wood.
2.2 DzalanyamaDzalanyama forest is gazetted as a protected forest reserve and it is designated aspublic land under the Land Act of Malawi. The reserve lies on the Dzalanyama rangestretching over a distance of 65 km. It covers a total area of 98,909 ha and runsthrough three districts; Dedza to the south covering 35,600 ha (bordering Mozambique);Lilongwe to the center covering 61,909 ha (about 40 km to the west and south west ofLilongwe city) and Mchinji to the north covering 1,400 ha (bordering Mozambique &Zambia).
The indigenous component of the reserve covers 45,420 ha and the remaining53,489 ha is a plantation with Pinus and Eucalyptus as the dominant species. Ultimate

311H. Tchale, R. Kachule and C. Mataya
management and control of the forest and its resources lies with the Department ofForestry. Management focus has been on protection against fire, over-exploitationand encroachment. Firewood, poles and timber are legally obtained by licenses (forthe plantation only). Prior to 1987/88, the commercial sector was allowed to salvagedead wood from the indigenous forest for sale in the city of Lilongwe. Due to abuse,this privilege was removed because it was discovered that when dead wood was gettingscarce, people started felling live trees for eventual use as firewood. Illegal procurementof forest products especially fire wood by the commercial sector occurs around theboarder of the reserve.
The indigenous part of the forest reserve is composed of tree species of Julbernadiaand Brychystegia with the dominant species being Julbernadia paniculata, Uapacakirkiana, Uapaca sensabarica, Parinari curatellifolia and Brachystegia spiciformis.Dense grass growth dominates throughout the reserve with Hyparrhenia, Andropogon,Themeda, and Digitaria being the most common grass types.
By 1921, most of the reserve was cleared for agricultural purposes and this led toserious deforestation. Tobacco is the main cash crop in the area with maize as themajor food crop. Since the reserve was constituted, it has been under the managementand control of the Forest Department and management of the reserve has primarilyaimed at protecting the reserve to conserve water and soil. Generally, managementof the reserve has been carried out on a minimal budget for implementation of theForest Department’s fire policy, protection against overexploitation and encroachment.From the late 1990s, the Forest Department embarked on a co-management approachwhereby communities in the vicinity of the reserve are encouraged to participate inmanagement of the reserve. In turn, the communities are allowed access to theindigenous forest to collect dead wood, thatch grass, and other non- timber forestproducts.
2.3 MdekaThe Mdeka site lies near the Michiru forest reserve and is about 30 km south ofBlantyre city, a major commercial city in Malawi. The area is neither gazetted asprotected area nor designated as public land (i.e. open access). Despite the fact thatrules and regulations regarding management of the indigenous forest are there fromthe Forest Department, virtually no elements of management by the local communitiesexist in this area. The indigenous forest is largely under customary tenure systemwhereby the local leaders are the custodians of the land and resources available on theland. Construction of a major bitumised road which passes through Mdeka andconnecting the cities of Blantyre and Lilongwe has encouraged overexploitation of theindigenous woodland by the communities living within the forest area. The communitieslargely cut wood for sale as fuelwood and for purposes of producing charcoal. Thebitumised road has eased transport between Mdeka and Blantyre city thereby increasingtrafficking of wood and charcoal into the city. Furthermore, growth of the constructionindustry in the city of Blantyre has also contributed to degradation of the naturalforest in this area because people harvest wood from this area for purposes of curingbricks.

312 MANAGEMENT OF MIOMBO WOODLANDS IN MALAWI
3. THE MODELLING APPROACH
3.1 Description of the typical householdThe model is based on analysing the decision making process of a typical householdusing data1 derived from a broader and detailed field survey that was conducted in thethree-study sites. The sites were selected in consultation with the Department of Forestryand the Forestry Research Institute of Malawi (FRIM) who have good knowledge of theforest reserves and related issues around these sites.
The typical household was defined by taking a mean of the sample which compriseda total of 300 households (100 households from each study site). Simple random samplingwas used in identifying the households. The sampling frame was developed togetherwith forest assistants and agricultural field assistants from each study site. The samplingdesign also provided for at least 30 female-headed households based on the understandingthat 30 percent of the rural households in Malawi are female headed.
Subsistence agriculture predominates the activities of the households in all thesites. As shown in Table 1, the main cash crop is tobacco and the predominant croppingsystem is inter-cropping of maize with beans and groundnuts. However other minorcrops such as cassava and sweet potatoes are also planted as sole crops, especiallywhen planted as a second crop soon after harvest.
Table 1. Crops commonly grown in the study sites (%)
Crop Mdeka Chimaliro Dzalanyama
Maize 92.1 77.3 83.3
Sweet potato 6.0 9.0 15.9
Cassava 22.8 - 14.5
Beans/pulses 12.6 9.1 16.5
Groundnuts 17.2 20.3 19.0
Tobacco 8.3 45.1 30.8
The key household activities were food production and consumption including thecollection, consumption and selling of forest products such as firewood and fruits.Each of these activities uses the labour available to the household. The core of thehousehold’s decision making is based on best allocation of the labour in ways that willensure the satisfaction of its production and consumption goals.
3.2 Key descriptive statisticsThe following information characterise the typical household on whom the goalprogramming model is based.

313H. Tchale, R. Kachule and C. Mataya
Table 2. Key descriptive statistics for typical households
Variable Dzalanyama Michiru/Mdeka Chimaliro
Land coefficients (hectares)Maize 0.91 0.35 0.72Tobacco 0.53 0.20 0.53Average land holding size per household 1.44 0.55 1.25
Yield coefficients (kg/hectare)Maize (intercrop) 1277.14 695.60 1569.44Beans (intercrop) 168.06 100.00 197.14Groundnuts (intercrop) 366.08 318.88 529.66Tobacco (monocrop) 666.04 643.40 1250.00
Total mandays/year (agric. season) 112.5 112.5 112.5
Total mandays/year (other activities) 200.5 200.5 200.5
Family size (3 working adults and 2 children) 5 5 5
Livestock ownershipCattle 3 1 3Goats 4 2 7
Firewood demand (m3/season/household) 4.39 2.80 5.48Consumption (wet season) 3.29 3.72 3.62Consumption (wet season) Selling (dry season) 4.35 5.40 2.94Selling (wet season) 3.30 6.44 2.83
Dietary requirements (%)Maize 70 70 70Beans 20 20 20Groundnuts 5 5 5Others 5 5 5
Income target (USD per household) 538.00 284.10 364.90
Note: The dry and wet seasons in Malawi are on average, 7 and 5 months long, respectively. The agriculturalseason is assumed to be approximately 3 months.
3.3 The basic goal programming model2
The objective in the weighted goal programming (WGP) model is to minimise the sumof deviations, both positive and negative, from the target levels set by the decision-maker. In this case the decision-maker is the household. The objective function ofthe WGP is the simultaneous minimisation of the sum of weighted deviations, and isgiven as:
kMin ∑ (α ini + β ipi) (1) i=1
The weights (α i and β i) are associated with the goals of food security, householdincome and environment conservation and positive (pi) and negative (ni) deviationsfrom the goals. This means that the household has to set targets it wishes to attainwith respect to the goals. Sections 3.4.1 to 3.4.3 explore this further.

314 MANAGEMENT OF MIOMBO WOODLANDS IN MALAWI
ConstraintsAs with any other programming model, the attainment of the goals is subject to anumber of constraints. In this particular model, the constraints are on arable land,labour, dietary requirements, requirements for livestock grazing and the demands forforest products for both food and domestic energy needs.
Land constraint3
The total land holding (ß) has to satisfy the demand for arable land by a household forthe various crops denoted by Xi.
n
∑ Xi <= ß (2)i=1
Total demand (by season j) for each crop is used to satisfy the selling (Sij), storage(Aij) and consumption (Cij) needs, where j=1, 2 represent dry and wet seasonsrespectively. This total demand is met through production (Xij) and buying (Bij).
n n n n n
- ∑ yiXij + ∑ Sij + ∑ Aij - ∑ Bi j + ∑ Cij <= 0 (3) i=1 i=1 i=1 i=1 i=1
Production Selling Storage Buying Consumption
Labour constraintThe total labour demand for crops (Li), livestock (LA), off-farm (LN) and domestic(LD) activities should not exceed that available in the household (Σ Lk); and isgiven as follows:
n n n n n
∑ Lik + Σ LAk + Σ LNk + Σ LDk – Σ Lk<= 0 (4)k=1
Tie constraints (labour)
Σ Lk = 5. This is based on the assumption of an average household size of 5,
with k=1,2,3 for adult male, adult female and children respectively.
Dietary constraintsEnergy supply (E) per crop to the household
n
- ∑ Ei + Σ Ekj <= 0 (5) k=1
where Ei denotes energy supply sources and Ekj denotes energy demands.The calorific figures that have been used in the model are based on the dietary
recommendations for healthy living of males, females and children (Latham 1979).Protein supply (P) per crop to the household
n
-∑ Pj+ Σ P
kj <= 0 (6)
j=1
where Pi denotes protein supply sources and Pkj denotes protein demands.

315H. Tchale, R. Kachule and C. Mataya
Livestock grazingThe demand for feed for cattle (g tons of dry matter per head) should at least besatisfied by the amount of available pasture (p tons dry matter per ha) in a specifiedgrazing area.
gC – pF <= 0 (7)
where:C = cattle stock numbers.F = land area for natural production of feed for cattle.
Forest products constraintsThe standing forest stock (SS) should at least satisfy the demand for householdconsumption (WdCh - charcoal and FwC- firewood) and for firewood sale (SFw).
-SS + FwC + WdCh + SFw <= 0 (8)
3.4 The MIOMBOGP for MalawiIn modelling the interaction of the communities and the miombo woodlands in thecase of Malawi, the following observations were taken into account. First, the State,household and the private sector have stake in the miombo woodlands. Second, thehousehold’s goal is to maximize food security or to minimize the occurrence of foodinsecurity. Third, the private sector’s goal is to maximize income from sale of woodlandproducts or to minimize the lack of it. Fourth, the goal of the state is to ensure thatthe woodlands are managed and used in ways that give maximum benefits to thehouseholds and the private sector while ensuring that the environment is notcompromised. Fifth, the interaction of these sectors determine the extent to whicheach one of them satisfies its own goals given that they all depend on the resource.
It was observed from the ranking done by the households that a typical householdwould aim at maximising food security as a priority goal. The other goals of securingincome and environmental conservation were ranked second and third respectively.
(a) The household food security goal The food security goal for the typical household assumes a crop mix comprising maize,beans and groundnuts. In terms of the goal programming model, the household aimsto minimize the negative deviations from the minimum amount of energy, measuredin kilocalories, required for an active and healthy life for all household members.Although maize is the main staple for most of Malawi, the other crops are used, someas relish or sold to get money with which to buy relish. At smallholder level, which isthe sector typical of most households in Malawi, these crops are key and they take upover 80% of the cropland.
(b) The income goalMost rural households derive income from a combination of subsistence activities includingselling of crops, livestock and labour to other farms. They also harvest and sell forestproducts, mostly firewood and poles, charcoal and other non-timber forest productssuch as mushroom and fruits. The objective of the household is to maximize the

316 MANAGEMENT OF MIOMBO WOODLANDS IN MALAWI
Table 3. Baseline Results: Attainment of goals
Objective value Sites
Mdeka Chimaliro Dzalanyama
Food security goal (n1) 0.00 0.00 0.00
Income goal (n2) 0.00 0.00 0.00
Environment /Fuelwood target (p3) 96.84 99.70 99.04
LP target income (US$/year) 284.10 364.90 538.00
income realized from these sources. In this analysis, the target income level wascalculated using a linear programming model developed for each site.
(c) The environmental protection goalFrom field data, the typical household in Malawi places little weight on environmentalconservation. This is manifested in the way they encroach on the woodlands foragriculture and other sources of livelihood. Ensuring the attainment of this goal islargely the responsibility of the government through appropriate policies. In this analysis,the environmental goal is evaluated in terms of the amount of firewood that is extractedannually and used for household domestic use and for sale. It is therefore essentially afuelwood goal. Harvesting the woodlands for fuelwood is the main household demandon these resources. The extent to which fuelwood becomes sustainably availablewould reflect the attainment of this goal. If fuelwood supplies are not sustainable,then degradation of the woodlands is inevitable leading to the total disappearance ofthe woodlands in the long-run. The best measure of the extent of environmentaldegradation would have been woodland depletion or deforestation. However, absenceof data on how this has been going on precludes its adoption.
The model syntax and the variable definitions and units of measurement appear inAnnex 2.
4. BASELINE RESULTS AND DISCUSSIONTables 3-9 present the results from the base runs. The results highlight the attainmentof household goals, crop and livestock production, food consumption, sale of foodproduction as well as consumption and sale and forest products.
4.1 Attainment of household goalsThe results in Table 3 show that the food security and income goals are fully satisfiedsince the negative and positive deviations from them are zero. However in all thethree sites the environmental goal is not fully satisfied. In all the communities underthe study, the priority goal is food security, followed by income. The fuelwood goalwas modeled as the amount of firewood that the household needs for householdconsumption in both the wet and dry seasons. As the results indicate, this goal is notattainable in all the three sites. This implies that if firewood runs out then the woodlandswould have been fully depleted, an environmentally unacceptable outcome.

317H. Tchale, R. Kachule and C. Mataya
Given the resources and constraints available in a typical household in the threesites, a linear LP model was run to determine the level of disposable optimal incomethat can be achieved per year. The results in Table 3 indicate highest income inDzalanyama and lowest income in M’deka. This reflects the differences in the level ofincome earning opportunities among the sites. For example tobacco and legumeproduction in Dzalanyama and Chimaliro is considerably higher than in M’deka. Theseresults actually do reflect the existing disparities in terms of income distribution inMalawi. Various research studies including the more recent Integrated Household Surveyhave indicated low household incomes on average among households in the Southernregion compared to the other two administrative regions.
4.2 Crop and livestock productionIn terms of crop production, less than half as much land is allocated to maize, groundnutsand bean intercrop in M’deka compared to Dzalanyama and Chimaliro (Table 4). Thisreflects the differences in the land holding sizes as households in M’deka have onaverage the lowest land holding compared to those in Dzalanyama and Chimaliro.
Although the land allocated to tobacco production is not very different across thethree sites, there are significant differences in productivity as a result of thedifferences in inputs applied. It was observed from a questionnaire survey for thisstudy that input application was much lower in M’deka compared to Dzalanyama andChimaliro. This could possibly be the result of the differences in current and potentialincome earnings (Table 2).
Table 4. Baseline Results: Crop production (ha)
Activity Mdeka Chimaliro Dzalanyama
Maize, groundnuts and bean intercrop 0.35 0.76 0.94
Tobacco 0.09 0.20 0.27
Total cropland 0.44 0.85 1.21
Total landholding 0.55 1.25 1.44
4.3 Food consumptionThe consumption levels for maize, groundnuts and beans are as shown in Table 5 forboth dry and wet seasons. These are optimal consumption levels given the resourcesand constraints that characterise the typical household in the three sites. The resultsindicate that in the dry season, maize consumption level is much lower in M’dekacompared to Chimaliro and Dzalanyama. In fact, given an average household size of 5people, most households in M’deka hardly meet the consumption requirement.
The wet season consumption levels are not very different across sites as thesereflect the buying and not the actual own-farm production. For groundnuts and beansthe consumption levels are slightly lower in M’deka. It was noted that these consumptionlevels are mostly normalized through buying from the local markets as production levelsfor these crops are typically lower compared to the other two sites (Table 6).

318 MANAGEMENT OF MIOMBO WOODLANDS IN MALAWI
4.4 Trade in food products (buying, selling and storage)Tobacco is the dominant traded crop (Table 6) with quantities sold lowest in M’deka andsimilar in the other two sites. Given that pan-territorial selling prices were used in themodel, the differences in the levels of crop sold cold only reflect the differences in theproduction levels. Tobacco production is dominant in the central region. The resultsfrom a questionnaire survey for this study indicate that almost all households interviewedin Dzalanyama and Chimaliro grew tobacco either on their own farms or through someform of contract or out-grower scheme with other farmers or estates. For M’deka(located in the non-tobacco zone in the southern region) less than 20% of the householdsgrew the crop.
As can be seen in Table 7, storage activity is zero for almost all crops4, exceptmaize in the dry season in M’deka, while small quantities of other crops (maize, groundnutsand beans) are actually stored in the dry season by households in Dzalanyama andChimaliro. As a result, most of the buying (Table 8) done in M’deka is to replenish foodstocks in wet season that result from low production that leaves nothing, or insignificantamounts for storage during the dry season.
All the households meet their demand for livestock products from the market(Table 8) since most of them have very few livestock (goats and cattle). Even theconsumption levels are far lower than the recommended consumption levels especiallydue to the lower budget shares allocated to these commodities.
Livestock rearing is limited to an average of 2 cattle and 4 goats per household inDzalanyama and one cattle and two goats for households in M’deka. Households inChimaliro have on average 3 cattle and 7 goats. These low stocking levels are
Table 6. Crop sales (kg/household)
Food commodity Mdeka Chimaliro DzalanyamaDry Wet Dry Wet Dry Wet
Tobacco 128.68 0.00 181.96 0.00 181.96 0.00
Maize 0.00 0.00 0.00 0.00 0.00 0.00
Groundnuts 0.00 0.00 254.25 0.00 191.08 0.00
Beans 0.00 0.00 0.00 0.00 0.00 0.00
Table 5. Baseline Results: Food consumption (kg/household)
Food commodity Mdeka Chimaliro Dzalanyama
Dry Wet Dry Wet Dry Wet
Maize 432.79 360.67 717.36 363.07 717.36 363.07
Groundnuts 67.52 0.00 75.00 75.00 100.00 75.00
Beans 98.56 91.16 100.00 75.00 100.00 75.00
Beef 7.00 5.00 14.00 5.00 18.02 15.00
Goat meat 16.52 9.05 17.57 9.30 36.00 15.05

319H. Tchale, R. Kachule and C. Mataya
Table 7. Food storage (kg/household)
Food commodity Mdeka Chimaliro DzalanyamaDry Wet Dry Wet Dry Wet
Maize 95.60 0.00 472.80 0.00 477.22 0.00
Groundnuts 0.00 0.00 72.41 0.00 76.34 0.00
Beans 0.00 0.00 49.50 0.00 57.20 0.00
characteristic of most households in Malawi where livestock levels are generally low,except for some few districts in the Northern region. However, we have used standardor average animal unit values that might not always be consistent with the averages inthe specific study sites. The consumption of beef and goat meat has been calculatedbased on the breeding, calving and kidding rates of the Malawi stock5.
4.5 Consumption and trade in forest productsThe results on firewood consumption and selling (Table 9) indicate lower consumptionquantities in M’deka compared to the other sites. However, the quantities sold aresubstantially higher in M’deka reflecting increased firewood sales. This could stemfrom the increased demand for firewood and charcoal in M’deka to supply the city ofBlantyre. Also the woodlands in M’deka have for a long time been under free access asthere was no regulation from the government. This could probably explain why thesite is more depleted in terms of wood resources as compared to Dzalanyama andChimaliro which are gazetted forest reserves regulated heavily by the government.For Dzalanyama6 and Chimaliro, the potential for depletion of the woodland resourcesis also high as a result of the escalating demand in the nearby Lilongwe city and Kasungutowns, respectively.
Table 9. Firewood consumption and sales (m3/household)
Activity Mdeka Chimaliro DzalanyamaDry Wet Dry Wet Dry Wet
Consumption 2.80 3.72 5.48 3.62 4.39 3.29Selling 5.40 0.80 0.00 1.20 0.00 0.18
Table 8. Food purchases (kg/household)
Food commodity Mdeka Chimaliro DzalanyamaDry Wet Dry Wet Dry Wet
Maize 0.00 284.93 0.00 0.00 0.00 0.00
Groundnuts 0.00 229.90 0.00 0.00 0.00 0.00
Beans 63.56 95.36 0.00 39.55 0.00 34.75
Beef 7.00 5.00 14.00 5.00 18.02 15.00
Goat meat 16.52 9.05 17.57 9.03 36.00 15.05

320 MANAGEMENT OF MIOMBO WOODLANDS IN MALAWI
The selling of firewood by individual households features relatively low inDzalanyama and Chimaliro. Firewood collection and selling is quite low in these areasi.e. on average about 4 to 6 cubic meters of wood are used for household energy needsper household per year. Between 1 and 2 cubic meters of wood are also extracted andsold to other households in the semi-urban areas per household per year. The woodused in the dry season, whether for household consumption or sale, is consistentlylower than that used in the wet season in all the sites7.
In general the results based on the slack8/surplus and the shadow prices9 indicatethat to a large extent, most of the constraints have been satisfied. The results are alsoconsistent with the ranges of the coefficients on the right hand side of the constraintequations presented in Annex 1.
It may not be the case however that Malawi, in general, has excess capacity inresources to satisfy all the constraints in the model. Malawi is already at the edge interms of resource endowment. The national average land holding size is 0.8 hectaresand over 55% of the households have less than 1 hectare of land. Labour is also aconstraint particularly for most crops other than maize and tobacco. However, otherstudies also argue that labour is not a constraint given that most people are willing tosell their labour even at wage rates far below the market rate (Zeller et al. 1996).
The argument that labour could be in surplus may be plausible given that agricultureis seasonal. Therefore, any slack labour has potential for employment in other off-season activities that could not be identified in the model like grazing, gardening,social work and even leisure.
5. SENSITIVITY ANALYSIS/POLICY EXPERIMENTSA number of sensitivity analyses have been performed in order to find out the potentialimpact of both the endogenous and exogenous shocks as a result of policy changeswithin and outside the forestry sector. This is done to demonstrate the capacity ofMIOMBOGP in creating alternative development scenarios based on changes in selectedpolicy levers or instruments. In this way, the MIOMBOGP could be used as a planningtool by decision makers in demonstrating the potential impact of various decisionsand policies and selecting the strategy that produces the most favourable outcome. Itmust be pointed out that the outcomes of the sensitivity analysis are dependent onthe underlying assumptions in constructing the MIOMBOGP and the quality of the dataused in generating the baseline results on which the analysis is based.
These analyses have been made in the context of the policy environment in Malawi.The country has been implementing economic reforms as a result of the adoption ofthe Structural Adjustment Program (SAP)10 since the early 1980s. Due to the inter-linkage between the agricultural and forestry sectors, most of the policy reforms thathave been implemented in the agricultural sector could have impacted the forestrysector. Also the policies that have been implemented in the forestry sector could havehad some impact on the agricultural sector. As such most of the sensitivity analysisrevolve around the agricultural or forestry policies.
The selected sensitivity analyses performed are presented in Table 10. Of particularimportance within the forest sector, is gauging or evaluating the potential impact onthe sector arising from fluctuations in the price of agricultural commodities for exampledue to weather or policies that influence crop production and markets. Also of interestto the forest sector is the potential impact on the sector due to changes in agricultural

321H. Tchale, R. Kachule and C. Mataya
crop yields that could result from policies that influence agricultural technologies likeuse of improved seeds, pesticides and fertilizers or even mechanisation.
We also examined the potential impact of changes in household labour. Apartfrom land, labour is the only other resource the communities have, and in abundance.We note that household labour is mobile, with the youth emigrating from rural tourban areas in search of employment. Further, strict observation of labour laws wouldconstrain availability of child labour, which is common in rural areas. Also diseaseslike HIV/AIDS and malaria constrain availability of labour (and other resources) bydiverting healthy members of the household to attending the sick and funerals, as wellas by making less or none of the labour of those affected by these diseases because ofassociated morbidity and eventual death.
Table 10. Description of the sensitivity analyses
Simulation No. Scenario Changes made to basic model
1 Increase in prices of major inputs 25% and 75% increase in seed and fertilizerand crop output prices; output price
2 Increase/decrease in yield of 25% and 75% increase / decrease in yieldmajor crops of maize and tobacco
3 Changes in household labour supply i) M, F, C labour and ability to hireii) M, F, C labour and inability to hireiii) FHH, no male labouriv) No female labourv) No child labour
4 Increase/decrease in 50% increase/decrease in price ofprice of firewood firewood
Note: M= male; F= female; C= child; FHH= female headed household.
With respect to forest sector policies consideration was also given to policiesthat aim at arresting or curbing deforestation, for example through increases in pricesof woodland products.
5.1 Potential impact of changes in crop input and output prices
(a) Changes in crop input pricesWhen crop input prices are increased by 25%, there is a less than 25% contraction incropland hectarage, especially for tobacco, while for crops like maize, groundnuts andbeans, the levels of production do not seem to respond to the increase in input prices.Being the main food security crops, this should not be very surprising since the householdsprimarily devote their resources to the production of food crops and would thereforecut down on the production of non-food crops such as tobacco, when faced withescalating input prices. The model response would imply that food crops are fairlyinelastic to changes in input prices most probably due to the risk-averse behaviour ofsmallholder farmers in the study sites and perhaps Malawi in general.
On the other hand, when crop input prices are reduced by 25%, there is acorresponding increase in production levels of all crops, especially for tobacco. However,as in the previous case the firewood consumption levels remain the same in all sites.

322 MANAGEMENT OF MIOMBO WOODLANDS IN MALAWI
(b) Changes in crop output pricesWhen the selling price of maize and tobacco is increased by 25%, there is a correspondingmarginal increase in consumption requirements especially for maize in the wet season.While it would be expected that an increase in price would reduce the demand for thatcommodity, it should be noted that at community level the extent to which this couldconform depends on whether the people are net food buyers or sellers. Where communitiesare net food buyers, an increase in the farm-gate prices would mean an increase in themarket prices for the same and this could reduce their demand for the same commodities.However, in the case of net food sellers, an increase in prices of cash crops and foodcommodities would act as an incentive for them to increase production and thereforeincome. This could increase their share of consumption since they have additional incomefor more food purchases. This scenario would apply to Dzalanyama which lies within thecountry’s food basket.
The impact of an increase in the output prices was also reflected in the amount of cropthat people were willing to sell. It was noted that when the selling price for all the cropswas increased by 25%, the sales of maize, beans and groundnuts were realized while in thebase run they were virtually zero. Higher output prices could provide an incentive to sell.
5.2 Potential impact of changes in the yield of major crops
(a) Potential impacts due to increase in yield
(i) On croplandThe land allocated to the various crops increased with a yield increase by 25%. Asshown in the Table 11a, compared to the base the land allocated to maize, groundnuts,bean intercrop and tobacco increases consistently in all sites.
Table 11a. Impact of a 25% yield increase on maize and tobacco production
Site Base(ha) PRMZGN(ha) % change Base(ha) PRTOB(ha) % change
Dzalanyama 0.91 0.96 5.3 0.27 0.29 7.4
Chimaliro 0.76 0.84 10.5 0.2 0.25 25.0
Mdeka 0.35 0.42 20.0 0.09 0.13 44.4
However, households in Mdeka are more constrained with land (Table 2), theirresponse to yield improvement in terms of cropland expansion is very modest evenwhen yield increases were set at 75% (Table 11b). However, households in the othertwo sites put more land under crops with increased yields.
Table 11b. Impact of a 75% yield increase on maize and tobacco production
Site Base(ha) PRMZGN(ha) % change Base(ha) PRTOB(ha) % change
Dzalanyama 0.91 0.98 7.7 0.27 0.31 14.8
Chimaliro 0.76 0.87 14.5 0.2 0.28 40.0
Mdeka 0.35 0.44 25.7 0.09 0.14 55.6

323H. Tchale, R. Kachule and C. Mataya
With yield increases as low as 25% all land in Mdeka is put under crops while asmall portion remains for Dzalanyama and Chimaliro, even with a 75% crop yieldimprovement. In all sites farmers do not cut down on the area under food crops, butallow a faster growth of the area under cash crops (tobacco in this case) so as toincrease incomes. Rural incomes are low and most of the households live below thepoverty line, so any incentive to increase their income would be welcome.
It would therefore appear that households in Mdeka would probably encroach onmore land (or the woodlands), if it were available, to take advantage of crop yieldincreases, while those in Dzalanyama and Chimaliro do not appear to have exhaustedtheir arable land and therefore do not pose immediate pressure on the surroundingwoodlands.
(ii) On firewood demandA 75% increase in yield of maize and tobacco could result into a relatively high responsein terms of the decline in firewood extracted in both dry (D) and wet (W) seasons fromthe woodlands in all areas (Table 12).
Table 12. Impact of 75% increase in yield on firewood demand
Site Base CSFWD % change Base CSFWW % change(m3 per (m3 per (m3 per (m3 per
household) household) household) household)
Dzalanyama 4.39 3.95 -10.0 3.29 3.04 -7.6
Chimaliro 5.48 4.45 -18.8 3.62 3.14 -13.3
Mdeka 2.8 1.95 -30.4 3.72 3.15 -15.3
However, proportionate declines are high for Mdeka and Chimaliro compared toDzalanyama. The former two sites are more constrained by land and forest resourcesthan Dzalanyama and would logically be more sensitive and responsive to policies thattarget these two natural resources. In fact the quantities of firewood demanded forsale would still remain high in Michiru even with a substantial increase in crop yield.This means that while there are indications that increases in agricultural yields havepotential to relieve the pressure on the woodlands, for woodland rich areas likeDzalanyama the effect is unlikely to be great because households have the woodlandsin relative abundance making the benefit from increased crop yield unlikely to changetheir firewood collection habits especially when markets for such products are smalland firewood collection is mainly for household consumption.
(b) Potential impact of a decline in crop yield
(i) On croplandA decrease in crop yield has potential to reduce the area put under crops (Table 13).The decrease in crop yield could be due to drought, low output prices and/or use ofinadequate inputs like fertilizers.

324 MANAGEMENT OF MIOMBO WOODLANDS IN MALAWI
Table13. Impact of 25% decrease in yield on production of maize and tobacco
Site Base(ha) PRMZGN(ha) % change Base(ha) PRTOB(ha) % change
Dzalanyama 0.91 0.84 -7.7 0.27 0.23 -14.8
Chimaliro 0.76 0.65 -14.5 0.2 0.18 -10.0
Mdeka 0.35 0.27 -22.9 0.09 0.04 -55.6
From Table 13 we see that the response to modest decline in crop yields is strongerin Mdeka and Chimaliro, areas more constrained by land than Dzalanyama. However,for Mdeka and Dzalanyama the reduction in cropland is relatively higher for tobacco,the cash crop, than for the food crops.
A 75% decrease in yield has a correspondingly substantial impact on the areaallocated to the two crops. In all areas there is a substantial shift (up to 40%) of landto maize, since the decrease in land planted with tobacco is more than that of maize.As a food security precaution, risk-averse farmers would want to increase the amountof land under maize in order to offset the decline in yield.
(ii) On firewood salesThe loss of income from reduced crop area appears to be compensated by relativelyhigher increases in firewood sales and especially from Mdeka and Dzalanyama thatmade relatively big cuts on cash cropland (Table 14). These trends are even morepronounced when crop yields decline by 75%.
Table 14. Impact of 25% decrease in yield on firewood sales.
Base SGFWD % change Base SGFWW % change(m3 per (m3 per (m3 per (m3 per
household) household) household) household)
Dzalanyama 0 1.2 - 0.18 0.52 188.9
Chimaliro 0 1.43 - 1.2 1.80 50.0
Mdeka 0.8 1.1 37.5 0.8 1.40 75.0
Firewood is one main sources of income for the households living close to theforest reserves, therefore changes in the yield of the key agricultural crops wouldinfluence the amount of firewood that could be extracted for sale. This is because inthe absence of adequate income from agricultural production, households would mostprobably resort to forest income for their needs. It would appear that the impactwould be more pronounced in the wet (W) season as compared to the dry (D) seasonwhen the crops would still be in the field and probably with insignificant or no cropstorages from the dry season.

325H. Tchale, R. Kachule and C. Mataya
5.3 Potential impact of changes in household labour supply
(a) On crop production and tradeRural households have two main resources, land and their own labour. The latter isincreasingly constrained by education as children go to school (making child labourless available), the youth emigrate to urban areas in search of jobs, and diseases likemalaria and HIV/AIDS. Such diseases constrain labour availability through sicknessand/or death, and for the healthy through attending the sick and funerals. They alsoaffect the allocation of household resources. All this potentially impact on the attainmentof household goals.
For example, when there is no adult male labour in the household and it is notpossible to hire such labour the results indicate a substantial cut in the production oftobacco while the production of the food crops increases moderately (Table 15).Women provide most of the labour for growing tobacco, however they mainly do thatwith the male counterparts. Tobacco marketing is an activity that is mainly in thedomain of men and when adult male labour is absent in the household sales declinesignificantly in all sites (Table 16).
However lack of adult female labour in the household and with no possibility ofhiring such labour not only affects production for tobacco, but also that of all the foodcrops. Mkandawire et al. (1990) and Diagne et al. (1995) report that women contributeover 70% of the labour in agricultural production in Malawi making female labourcritical in agriculture.
Table 15. Impact of lack of adult male labour on crop production
Site Base(ha) PRMZGN(ha) % change Base(ha) PRTOB(ha) % change
Dzalanyama 0.91 1.04 14.3 0.27 0.14 -48.1
Chimaliro 0.76 0.85 11.8 0.20 0.12 -40.0
Mdeka 0.35 0.38 8.6 0.09 0.04 -55.6
Further, as shown in Tables 15 and 16, absence of adult male labour makes thefamily to increase production of food crops in all three sites. Trade in food crops alsoincreases, except in Mdeka.
We experimented with making 30%, 50% and 70% of male and female adult labouravailable, a constraint that could be due to sicknesses, attending the sick, funerals,and/or occasional migration to the urban areas. In the case of crop production thetobacco area was reduced slightly (by less than 10%) when only 30% adult male labourwas made available. However the reduction was substantial (by over 30%) when only30% of adult female labour was made available. The reduction in crop productionincreased with decreased labour availability, but was more affected by constraint onadult female labour availability. This reinforces the observation by Mkandawire et al.(1990) that most of the rural farming is done by women.
However, the implications of labour constraints on attaining household goals andimproving household welfare in general are very serious because the HIV/AIDS scourge

326 MANAGEMENT OF MIOMBO WOODLANDS IN MALAWI
tends to reduce female labour supply more than that of males because women appearto be more infected than men and that women are the traditional caretakers of thesick.
(b) On firewood consumption and saleChanges in either adult male or female labour supply do not appear to significantlyaffect consumption of firewood in both wet and dry seasons (Table 17). This is mostlydue to the way firewood is used in the household, the same quantity is used forcooking meals when the full family is there or one or two members are missing.Further, children also participate extensively in firewood collection, cushioning thefamily from firewood shortages in case the mother is sick or absent. Therefore whenthere are fluctuations in the supply of household labour members of the householdsadjust their activities in ways that minimize adverse impact on firewood collection.
Table 17. Impact of lack of adult male labour on crop sales
Site Base(kg) SGTOB(kg) % change Base(kg) SGBND(kg) % change
Dzalanyama 181.96 39.54 -78.3 52.2 63.20 21.1
Chimaliro 185.89 45.67 -75.4 49.5 56.70 14.5
Mdeka 125.68 25.43 -79.8 0 0.00 0.0
However, when adult household labour is absent, the results indicate an increasein the amount of firewood that is extracted and sold. This is probably because absenceof an adult male reduces household incomes and this compels the other members ofthe household to collect more firewood for sale in order to compensate for the incomeloss that arises primarily from reduced tobacco production and sale. This was noted tobe more pronounced in the wet season with sales potentially increasing by 50%, 17%and 13% in Mdeka, Dzalanyama and Chimaliro respectively. Also households couldincrease production and sale of food crops.
When there is completely no adult labour in the household an infeasible solutionis obtained. This is an indication of the total collapse of the activities of the householdas defined in this model. When adult household labour availability is constrained to30%, 50% and 70% due to reasons explained earlier, the results indicate a slight reductionon firewood collected for consumption if only 30% of the adult female labour weremade available. A reduction in firewood sales begun if the adult male labour available
Table 16. Impact of lack of male labour on firewood collection
Site Base CSFWD % change Base CSFWW % change(m3 per (m3 per (m3 per (m3 per
household) household) household) household)
Dzalanyama 4.39 4.41 0.5 3.29 3.31 0.6
Chimaliro 5.48 5.49 0.2 3.62 3.64 0.6
Mdeka 2.8 3.2 14.3 3.72 3.78 1.6

327H. Tchale, R. Kachule and C. Mataya
dropped to below 70%. This could be attributed to the fact that firewood collection fordomestic use is dominated by females while collection for sale is mainly done bymales.
5.4 Potential impact of changes in price of firewood
(a) On firewood demand/consumptionIt is often argued that one way for containing deforestation is to increase prices offorest products. In government-controlled forests, like the forest reserves in thesethree study sites, the prices can be regulated administratively as a way to implement asectoral policy or strategy of this nature. This strategy was tested and the results (Table18) indicate that there is a potential increase in the demand for firewood for salewhen there is an increase in its price.
Table 18. Impact of change in the price of firewood on its demand
Site Base CSFWD % change Base CSFWW % change(m3 per (m3 per (m3 per (m3 per
household) household) household) household)
Dzalanyama 0.0 1.4 - 0.18 0.48 166.7
Chimaliro 0.0 1.6 - 1.20 1.56 30.0
Mdeka 0.8 1.5 87.5 0.80 1.7 112.5
The result was expected because in open access forests the price signals anincentive for people to extract more firewood for the market. However, the responseto price increase only starts when the increase is at least 50% of the prevailing price.This indicates that firewood demand and the requirement for land for forestry is lessresponsive to the changes in the prices of firewood. Actually when firewood priceincreases, the households that used to buy the commodity from others resort to owncollection from the forests.
(b) On cropland areaFor Dzalanyama and Chimaliro, increasing the price of firewood by 50% has potentialto marginally reduce cropland area, as farmers decide to engage most of their labour inthe more lucrative business of collection and selling firewood (Table 18). The impactappears to be high for Mdeka, where most households have traditionally relied onfirewood sales for their livelihood.
Table 18. A 50% increase in firewood price: changes in cropland
Site Base(ha) PRMZGN(ha) % change Base(ha) PRTOB(ha) % change
Dzalanyama 0.91 0.9 -1.1 0.27 0.26 -3.7
Chimaliro 0.76 0.76 0.0 0.2 0.19 -5.0
Mdeka 0.35 0.32 -8.6 0.09 0.06 -33.3

328 MANAGEMENT OF MIOMBO WOODLANDS IN MALAWI
On the other hand a 50% reduction in the price of firewood could slightly increasethe scale of production, especially tobacco (Table 19). Again, this could be attributedto shifts in labour away from firewood collection and trade to tobacco production.
Table 19. A 50% decrease in firewood price: changes in cropland
Site Base(ha) PRMZGN(ha) % change Base(ha) PRTOB(ha) % change
Dzalanyama 0.91 0.91 0.0 0.27 0.28 3.7
Chimaliro 0.76 0.76 0.0 0.2 0.22 10.0
Mdeka 0.35 0.36 2.9 0.09 0.09 0.0
It should be noted that the magnitude of the changes would strongly depend on therelative prices in the agricultural sector. Thus, these results would only be plausible ifwe assume no change in agricultural input and output prices. Most households in thesesites depend on both agricultural and woodland products not as substitutes but mainlyas complementary products. There is a narrow range in which they can be substitutes,and this is especially in relation to excess that is marketed. Consequently the demandfor firewood for sale is less responsive to some agricultural and forestry policies. Thetype and extent of the response would largely depend on whether a community is a netbuyer or seller of firewood as well as the relative prices of the different products.
6. CONCLUSIONS AND POLICY RECOMMENDATIONSThe impact of the agricultural policy scenarios expressed through changes in outputand input prices and technological improvements are manifested in increases in foodconsumption and selling requirements. Given that food security is the primary goal, itis unlikely that there could be any marked response in terms of required consumptionlevels. However, as shown in the sensitivity analyses, there is a marked impact onthe levels of requirements for selling as a result of an increase in the output pricesand yield improvements. The increase in production is reflected in the surpluscommodities especially, maize and groundnuts which increase the storage requirementsthereby necessitating the need to sell the surplus.
Increases in agricultural output through yield improvements could have substantialimpact on crop production levels when the yield increases are in excess of 50%.
Firewood consumption and selling requirements increase as a result of theincrease in firewood prices, more especially when the price increases are over 50%.This can only be the case in communities where people are net firewood sellers. Alsoit largely depends on the relative increase in the prices of firewood compared toagricultural prices. Otherwise communities that are net buyers of firewood wouldrespond negatively to increases in prices of firewood. From the study, it wouldappear that the demand elasticity of the communities to firewood prices is veryinelastic, implying that a marked response can only be triggered with very highincreases in firewood prices.
The increase in output prices and yield improvements have potential to reducecropland and therefore alleviate pressure on the woodlands. In so far as there is noincrease in agricultural land requirements, which could trigger encroachment into forests,

329H. Tchale, R. Kachule and C. Mataya
the results seem to support the hypothesis that incentives in agriculture, be theyprice or technology related, tend to reduce the likelihood of deforestation by shiftingthe pressure and dependence away from the forests to the more lucrative agriculturalproduction.
These findings serve to highlight the type of policy responses that need to becritically examined in the light of their impact on the resources. The results from thisresearch indicate that the main factors that seem to impact on resource use decisionsinclude: prices of agricultural commodities, technological changes in agriculture, laboursupply changes and prices of firewood and other energy sources.
Given the ever-existing conflict and complimentarity between agriculture andforestry in supporting human existence, the harmonization of these policies requiressound scientific knowledge. This modeling exercise has the potential of providingsuch knowledge which is very important in decisions management, use and conservationof the resources.
There are still a number of fundamental policies that need to be critically examinedfurther. For example, there is need to assess the impact of the increases in the pricesof alternative energy sources. In Malawi, the notable case would be the impact of therapidly increasing prices of paraffin and electricity, considering that these are themajor alternative sources of energy in the rural and urban sector, respectively. Theimpact of some forestry policies that encourage the development of alternative andmore efficient energy technologies are examples of typical instruments whose impactsneed to be examined as well.
Despite its potential robustness given the availability and reliability of the data,the MIOMBOGP has only one major weaknesses in that as a static model, it does notaccount for the dynamism that characterize resources use in the ideal world. However,it might be possible to project the values of the various variables into the future andrun the model to correspond to those future points thus allowing for a possibility oftracing the changes in the variables of interest over time.
ENDNOTES1. Both a household survey and a Participatory Rural Appraisal (PRA) exercise were undertaken
in each of the sites namely Dzalanyama and Chimaliro in the central region and Mdeka in theSouthern region. The PRAs provided some socio-economic description of the three sites and aseparate PRA report was compiled.
2. Detailed description of the basics of the goal programming model including examples ofrelevant applications can be found in, but not limited to, Nhantumbo and Kowero (2001), Romero(1991), Romero and Rehman (1989), Rehman and Romero (1993), Mendoza and Sprouse (1989) Hazelland Norton (1986), Day (1963), McCarl (1992) and Yoon and Hwang (1995).
3. In terms of the constraint equations in the Malawi models, the actual data on the constraintsis presented in Annex 1 ( 1A - 1D).
4. In reality farmers harvest and sell, and seldom store large enough quantities for long periodsof time. They then buy the same products in small quantities from local markets on a regular basisespecially during the post harvest season. It is therefore possible to have storages of small orinsignificant quantities on a weekly or monthly basis and not for the whole season.
5. The assumed calving rate net of mortality for cattle is 45%, kidding rate for goats net ofmortality is 300%, breeding rate for cows and goats are 40% and 75% respectively. A cattle unit isestimated at 450kg live-weight while that for goats is estimated at 50 kg live-weight.
6. It should be noted that while the forests are still relatively thick in Dzalanyama, mostly dueto the fact that these areas are protected areas, the rate at which people are harvesting woodfor various uses is quite high. In the long run, these areas could be degraded as is the case with

330 MANAGEMENT OF MIOMBO WOODLANDS IN MALAWI
Mdeka. This could among other factors be exacerbated by increased resettlement of people in thisarea and expansion of agricultural estates that surround these areas. The increasing demand forwood resources in the urban areas, as result of the increase in the prices of conventional energyproviding petroleum products, could trigger increased exploitation of the resource by both longterm residents and new settlers. This is an area that needs to be given adequate attention bygovernment, in view of balancing the community needs for energy and household income and theneed to conserve the forests.
7. It is logical that firewood demand should be higher in the wet season because of theincreasing uses compared to the dry season. In most areas, firewood is also used for heatingduring the lower temperatures experienced in the wet season. Another reason could be thatthe efficiency of wood is higher in the dry than wet season due to the high humidity levels in thewood during the wet season.
8. Slack variable refers to a variable that accounts for any unused, or idle amounts of a resource(Forgionne 1981).
9. Shadow price refers to the change in the objective value that results from a marginal (one-unit) change in the amount of a constraint (i.e. the value on the right hand side).
10. The Malawi government with financial and technical support from the World Bank and theInternational Monetary Fund (IMF) embarked on SAPs in 1981 in order to address both domesticand external economic imbalances. Following the economic crises that Malawi experienced inthe late 1970s resulting from external shocks such as rising interest rates and fuel prices, droughts,regional political instability and deteriorating terms of trade, the government resorted to adoptingthe SAPs whose primary objectives included: (i) economic stabilization (ii) accelerating agriculturalgrowth, (iii) diversifying the export base, (iv) increasing the efficiency of import substitutingenterprises and parastatals, and (v) improving the mobilization and management of public resources.
The major goal of the SAPs were to provide incentives for stimulating production of tradablegoods, for rationalizing government tax base and expenditure and for strengthening key sectorsand institutions. So far more than seven Structural Adjustment Loan facilities have been adopted.i.e. SAL I (1981); SAL II (1984); SAL III (1986); ITPAC (1988); ASAC (1990); ASAP (1991); etc.
REFERENCESForgionne, G.A. 1981 Quantitative decision making. Wadsworth Publishing Company,
Belmont, California.Hazell, P.B.R. and Norton, R.D. 1986 Mathematical programming for economic analysis
in agriculture. Macmillan Publishing Company, New York.Kaimowitz, D. and Angelsen, A. 1996 Economic models of tropical deforestation: A
review. CIFOR, Bogor. 139p.Latham, M.C. 1979 Human nutrition in the developing world. FAO Food and Nutrition
Series.Lind, E.M. and Morrison, M.E.S. 1974 East African vegetation. Longman Group Limited,
London, p.59-101.McCarl, B.A. 1992 Mathematical programming for resource appraisal under multiple
objectives. EPAT/NUCIA Working paper no. 6.Mendoza, G.A. and Sprouse, W. 1989 Forest planning and decision making under fuzzy
environments: an overview and illustration. Forest Science 35: 481-502.Minde, I., Kachule, R. Luhanga, J. 1997 Macroeconomic and sectoral policies and their
Influence on the livelihood strategies of households in the miombo woodlands:the case of Malawi. Report. University of Malawi. Lilongwe.
Nhantumbo, I. and Kowero, G. 2001 A goal-programming model for planning managementof miombo woodlands. In: Modelling methods for policy analysis in miombowoodlands. Occasional Paper No. 35, CIFOR, Bogor. pp.5-15.

331H. Tchale, R. Kachule and C. Mataya
Rehman, T. and Romero, C. 1993 The application of the MCDM paradigm to themanagement of agricultural systems: some basic considerations. AgriculturalSystems 41: 239-255.
Romero, C.1991 Handbook of critical issues in goal programming. Pergamon, Oxford.Romero, C. and Rehman, T. 1989 Multiple criteria analysis for agricultural decisions.
Developments in Agricultural Economics 5.White, F. 1983 The vegetation of Africa. UNESCO, Paris. 356p.Yoon, K.P. and Hwang, C. 1995 Multiple attribute decision-making: an introduction. Sage
Publications, London.

332 MANAGEMENT OF MIOMBO WOODLANDS IN MALAWI
ANNEX 1. TABLES OF SOME DATA FOR BUILDING THE MALAWI MODEL
1a. Average land holding (ha) by site
Crop Dzalanyama Chimaliro Mdeka
Maize, beans, groundnuts intercrop 0.91 0.72 0.35
Tobacco 0.53 0.53 0.20
Average land holding 1.44 1.25 0.55
1b. Land distribution by site (%)
Land area (ha) Dzalanyama Chimaliro Mdeka
< 0.5 13.9 8.0 32.00.5 – 1.0 31.8 37.0 38.0>1.0 – 2.0 36.1 35.0 19.0
> 2.0 18.2 20.0 11.0
1c. Total man-days per site per season.
Category Mdeka Dzalanyama Chimaliro
Adult males 1983.00 1872.00 1003.00Adult females 356.00 744.00 459.00Children 42.00 86.00 103.00Total 2381.00 2702 1565
1d. Average number of livestock kept by household
Mdeka Chimaliro Dzalanyama
Cattle 1.1 3.2 3.6Goats 2.5 6.6 3.9Chicken 15.7 8.5 9.8Pigs - 7.7 4.6Ducks 6.3 4.1 3.6Pigeons 5.1 9.1 6.0

333H. Tchale, R. Kachule and C. Mataya
ANNEX 2. VARIABLE DEFINITIONS AND UNITS OF MEASUREMENT
The definitions, activities and units of measurement of the variables that are presentedin this report:
Variable Unit of measurement Definition/Activity
PRMZBNGN Kg per hectare Production of maize, beans and groundnuts in an
intercrop
CSMZD Kilograms Consumption of maize in the dry season
CSMZW Kilograms Consumption of maize in the wet season
MZSD Kilograms per hectare Maize seed rate
CSBND Kilograms Consumption of beans in the dry season
BGBNW Kilograms Buying of beans in the wet season
BNSD Kilograms per hectare Bean seed rate
STGND Kilograms Storage of groundnuts in the dry season
CSGND Kilograms Consumption of groundnuts in the dry season
CSGNW Kilograms Consumption of groundnuts in the wet season
BGGNW Kilograms Buying of groundnuts in the wet season
GNSD Kilograms per hectare Groundnut seed rate
CSFWD Cubic meters Consumption of firewood in the dry season
CSFWW Cubic meters Consumption of firewood in the wet season
SGFWD Cubic meters Selling of firewood in the dry season
SGFWW Cubic meters Selling of firewood in the wet season
CSMSHW Kilograms Consumption of mushroom in the wet season
CASG Number of herds Selling of cattle
GTSG Number of herds Selling of goats
GRAZ Hectares Grazing area for livestock
CSBFD Kilograms Consumption of beef in the dry season
BGBFD Kilograms Buying of beef in the dry season
CSBFW Kilograms Consumption of beef in the wet season
CSGTD Kilograms Consumption of goat meat in the dry season
BGGTD Kilograms Buying of goat meat in the dry season
CSGTW Kilograms Consumption of goat meat in the wet season
BGGTW Kilograms Buying of goat meat in the wet season
FORES Hectares Forest area per household

19.
Linear and goal programming models foranalysis of policy impacts on livelihoodsin miombo woodlands of Mozambique
I. Nhantumbo, G. Mlay and G. Kowero
ABSTRACTAn analysis of potential impacts of selected sectoral and extra sectoral policies onmiombo woodlands was conducted in the Mozambican districts of Dondo, Nhamatandaand Gondola-Manica. A Weighted Goal Programming model was developed that tookinto consideration household goals in the context of a set of activities and resourcesconstraints on land, labour, food production, access to forest resources and others.Policy experiments were carried out through sensitivity analysis.
Results indicated that harvesting forest products was the main off-farm sourceof income and employment for the household. The non-availability of adult male orfemale labour in the household, due to sicknesses like those from HIV/AIDS, emigrationor other reasons is catastrophic to the household. This also emphasizes the need toconsider the HIV/AIDS pandemic in all rural socio-economic plans.
Further, moderate decrease in crop yield seriously constrained the achievementof household goals, indicating that these households could be very vulnerable to factorsthat reduce crop yield like drought, floods, pests and high prices of agricultural inputs;and with adverse consequences on conservation of the woodlands. Therefore, thesolutions to problems such as deforestation do not rest within the forestry sectoralone; rather, an integrated rural development planning holds more promise.
Key words: Policy impact, linear programming, goal programming, miombowoodlands, rural development, Mozambique.
1. INTRODUCTIONMiombo woodland is one of the most extensive dry forest vegetation types in Africa,occurring in seven countries in eastern, central and southern Africa; namely Angola,Malawi, Mozambique, Tanzania, Democratic Republic of Congo, Zambia and Zimbabwe

335I. Nhantumbo, G. Mlay and G. Kowero
(White 1983). The woodlands are dominated by the legume family Caesalpiniaceaewith the most important tree species being those of Brachystygia sp., either alone orin association with Julbernardia sp., and Isoberlinia sp. (Celander 1983; Lind andMorrison, 1974; White 1983).
Although no proper surveys have been carried out to determine the number ofpeople who depend on the miombo woodlands, estimates as high as 100 million peoplehave been made while others put direct and indirect support at 40 and 15 millionrespectively, in the rural and urban areas (Campbell, et al. 1996). Sustainable use ofmiombo woodlands can offer a long-term perspective for the direct and indirect users.However, current unsustainable agricultural practices such as use of fire for land clearing,inadequate fallow systems, overgrazing, and intensive harvesting of wood for firewoodand construction material threaten the increasingly scarce resources. These activitiesare rapidly diminishing the environmental significance and ecological diversity of themiombo ecosystem. The economic consequences are obvious as the miombo woodlandsare a source of food security, employment and income from the sale of wood and non-wood forest products.
In Mozambique there are three forest categories: protected, productive and multipleuse areas. Most of the miombo woodlands fall under the latter category. In the firsttwo categories, the primary managers are respectively the state and the private sector.On the other hand, in the multiple use areas, there is competition over resourcebetween the communities that depend on this resource for their livelihood and a largenumber of small scale private sector operators that have simple licenses for harvestingwood products. Furthermore, there is high competition for different land uses such asrelatively large-scale agriculture for cotton, sunflower, and cashew, as well as industrialroundwood harvesting.
The communities are the main producers of cash crops as well as being largelyresponsible for harvesting wood and non-wood products. However, they are lessadvantaged in terms of gains from these activities due to their low bargaining powerwith middlemen and final users of these products.
The relative importance of the miombo woodlands attracts many stakeholders.The government raises revenues from those harvesting products, besides its interestin conserving the woodlands. The private sector is interested in the woodlands forcommercial products that they extract. Communities living inside and bordering thewoodlands are interested in deriving their livelihoods. The woodlands are importantto them as they provide self-employment as well as being sources of income, goodsand services.
In Mozambique there exist resource-use conflicts among the different land usesand users of the miombo woodlands. Land use policies and practices have failed withrespect to sustainable use and management of the woodlands. If these conflicts arenot addressed immediately, they are likely to escalate, and in turn accelerateencroachment and degradation of the woodlands. The consequence of this will be foodinsecurity, environmental instability, and deterioration of the livelihood opportunitiesof miombo inhabitants.
The study reported in this paper was a modest attempt to contribute to the on-going debate on sustainable economic development of rural communities in developingcountries, basing its case on the compatibility of environmental concerns with farmers’preferences in selected villages in the districts of Dondo, Nhamatanda, Gondola andManica in Mozambique.

336 LINEAR AND GOAL PROGRAMMING MODELS
The study was undertaken from 1998 to 2002 and makes use of Weighted GoalProgramming (WGP). A modeling framework was constructed where both technicaland socio-economic goals were incorporated in order to deal with food security, forestproduct supplies and household incomes within an integrated land use context. In thisway, the study analysed the compatibility of demands by various stakeholders on thewoodlands with household goals on one hand and rural development goals on the other.
The paper is organized as follows: section 2 presents the background to theanalytical tools; section 3 presents the main characteristics of the study sites and thetypical household used for the analysis of the various policy scenarios; section 4analyzes the main features of the analytical tool used in this study; section 5summarizes the main WGP results including the impact on the household of a set ofpolicy experiments. Finally, section 6 highlights the main findings and recommendations.
2. MULTIPLE CRITERIA DECISION MAKING TOOLSOne of the challenges in managing miombo woodlands is the sustainability of thevarious interventions both at the policy level and at land use sphere influenced bydaily decisions made by the users. The decision environment appears to be mainlyinfluenced by socio-economic factors and less so by environmental concerns or evenefficiency in natural resource use.
The natural resources value is determined mostly by labour invested for theirextraction. Royalties paid to the government still undervalue the resources and thiscontributes to making the selling price of various forest products very low. Therefore,it would be useful to develop analytical tools which can help explain the potentialimpacts of short-term goals vis-à-vis sustainable development.
Hermanides and Nijkamp (1998) present three building blocks for measuring andjudging sustainability: indicators, normative reference values, and impact assessmentmethodology. These authors define indicators as numerical representations of observedand measurable phenomena. The normative reference values or critical threshold valuesare defined on the basis of the concept of “Environmental Utilization Space”, i.e., thesafe maximum and minimum levels that the ecosystem can absorb without beingdamaged. Examples of the normative reference values are enforcement of the allowablecut when harvesting wood products, and the frequency of fires which have positiveimpact on the generation of the ecosystem and its growth. Finally, impact assessmentis done through ad hoc or structured methods. The latter includes quantitativetechniques such as econometric or statistical models that seek to establish in amethodical form the effects of policy measures on pertinent policy variables. This isdone by providing an objective set of criteria for analyzing the impact of policy on thefarm household organization as well as on the miombo ecosystem. This is the approachpursued in this paper.
As explained earlier, the primary land uses, users of miombo woodlands, andconflicts of goals and priorities are endogenous to the decision environment. Thereare several approaches to reconcile conflicting demands on resources. Multicriteriadecision analysis seeks compromise solutions for the various goals, hence it haspotential application in the context of the miombo woodlands problem.
As indicated in Nhantumbo et al. (1997), Rehman and Romero (1993) define GoalProgramming (GP) as one of the Multiple Criteria Decision Making (MCDM) tools thatis based on the geometric definition of ‘best’ that is regarded as a model which

337I. Nhantumbo, G. Mlay and G. Kowero
operationalizes the Simonian approach of ‘satisfaction’ to the fulfillment of the decisionmakers’ objectives. GP has two variants: Lexicographic Goal Programming (LGP) whichis based on pre-emptive ordering of goals and priorities by the decision maker, andWeighted Goal Programming (WGP), based on a simultaneous consideration of goalsand minimization of the sum of weighted undesired deviations from the targets. Thesequential consideration of goals in lexicographic goal programming provides a highprobability of the last goals becoming redundant. In this paper, WGP was chosen sothat the goals of the different stakeholders could be considered jointly, thus avoidinggiving preference to one goal to the detriment of the other.
However, WGP requires a large amount of data from the decision makers, and inthis case mainly the households. Such data is used for determining the objectives,targets, weights, and priorities, in addition to estimating the technical coefficientsof the decision variables. This is a particularly important limitation in developingcountries where planning in subsistence farming is made difficult by lack of farmrecords and where lack of co-ordination between agriculture and forestry is likely toreduce the reliability of information provided by the decision makers. However, Rehmanand Romero (1993) argue that WGP can be applied under such situations becausesensitivity analysis can be used to generate information and reduce the amount ofdata needed from the decision maker. In fact, the method has been applied inMozambique looking at impact of social forestry in a regional model (Nhantumbo et al.2001).
The WGP model serves as a tool for enhancing planning by providing for thepossibility to evaluate various options or scenarios through sensitivity analysis ofvariables of choice. This is the main thrust of developing these models in the threedistricts of central Mozambique: to provide alternative means for rural developmentplanning.
3. SOCIO-ECONOMIC CHARACTERISTICS OF THE STUDY SITESThe study sites include the two central provinces of Manica and Sofala selected due totheir richness in both the miombo woodlands, and the productive forests and protectedareas. In addition, both are along the development corridor (Beira) creatingopportunities for development as well as threats since the market for forest products(especially in the towns of Beira and Chimoio) is likely to increase. Further, Beira townis the second largest market for wood for energy and light construction. Manica is asupplier to this market even though at a relatively small scale. Chimoio however, justlike any other town in Mozambique, consumes large amounts of firewood. This resultsfrom the low purchasing power of alternative sources of energy such as gas andelectricity.
The major difference between the two provinces lies in the type of transportationmeans employed. In Manica there is predominance of use of bicycles. In Sofala, on theother hand, middlemen in the market channel use lorries, and appear to benefit moreas demonstrated by a survey done during the study.
3.1 Nature of the households used in the modeling exerciseThe household characteristics provide the context under which the results presentedin the next section should be understood and discussed.

338 LINEAR AND GOAL PROGRAMMING MODELS
Table 1. Characteristics of the household
Size of family No. of years Years of DependencyMale Female in the area education ratio
Dondo 3 3 6.3 2.8 0.17
Nhamatanda 3 4 5.6 2.1 0.2
Gondola-Manica 3 3 12.3 3.4 0.22
Table 1 indicates that all the three sites have approximately the same size offamily and almost a gender balance, except Nhamatanda. There are more children inthe household, and this increases the dependency rate as the very young do not engagein agriculture, and if they do, their contribution would be relatively small. Much asDondo and Gondola-Manica have the same household size, the latter had a highernumber of dependants. The population is relatively young and the elderly do not appearas a significant dependant group in the household.
Another important feature of the households is their relative stability in the area,and this is illustrated by the number of years that they have stayed in the study sites.The inhabitants of Manica have been in the area even before the end of the country’scivil war in 1992. On the other hand, those of Dondo and Nhamatanda could haveexperienced the severe effects of the civil war as reflected in their fairly recentresettlement in these two areas.
The scarcity of forest resources in Nhamatanda could also be an indication thatthis area might have been the main source of fuelwood and construction material forBeira town, even though the population in this area was very mobile. In fact, thepeople who temporarily resettled largely engaged themselves in harvesting the forestas a ready source of income because agriculture was not always the best strategyduring the war. This was because they risked being expelled by soldiers from the areabefore the crops matured. The soldiers later harvested the crops.
As is the case in practically all rural communities in Mozambique, the adult literacyrate in the study sites was observed to be very low. This could potentially influenceopportunities for the socio-economic development of the households.
3.2 Land acquisitionOpen access to land still dominates the mode of land acquisition in all study sites.Despite the fact that traditional leadership and local government structures are informedon the intention of opening new land, or harvesting the forest, there was no indicationthat this is an institutionalized practice. Clearing the forest, inheriting or evenpurchasing land are the main forms of acquiring land for agriculture and residence.Purchasing land is an interesting feature since the Mozambican Land Law of 1997does not recognize the existence of land markets, however reality on the groundseems to indicate the contrary. The Land Law opens an opportunity for communityland delimitation and the issuing of a land use certificate. However, it was notedduring the field surveys that the inhabitants in all sites had failed to take advantageof getting certificates for their land, largely because rural communities have partiallyor completely not been educated on this legislation. This is compounded by the absence

339I. Nhantumbo, G. Mlay and G. Kowero
of external facilitators who could assist those who are aware of the legislation to gothrough the required procedures for acquiring land titles.
3.3 Economic activitiesAgriculture, sale of forest products, and some livestock rearing were observed as themain activities undertaken in the three sites. Charcoal was the main forest productthat provided employment and income to the households. As far as agriculture isconcerned, all sites produce maize and sorghum. However, rice production was onlyobserved in Dondo, while Gondola-Manica was the only study area that produced beans.The absence of beans in the other two study sites raises concerns on the sufficiency ofprotein foods in the households. The cropping systems include mono-cropping (maizeor rice) and mixed cropping.
3.4 The household goalsMultiobjective programming is based on the analysis of tradeoffs amongst differentgoals (objective plus the target) set by the decision maker, in this case the household.The interviewees in the three sites articulated the household objectives and priorities(Table 2).
Table 2. Household goals (percentage of households interviewed)
Goal Study site PriorityDondo Nhamatanda Gondola-Manica
Food security 83 73 77 First
Higher income 70 71 67 Second
Environmental protection 73 93 81 Third
However, the targets had to be derived by the researchers. For example, the foodsecurity target was derived using the standard FAO nutrition requirements for people ofdifferent gender and age. This, together with the size and composition of the household,determined the minimum household nutritional requirements. The income target wasdetermined through linear programming (LP), which allows the analysis of the farmorganization and resource constraints to derive the maximum return. Finally, theenvironmental protection target can be interpreted in various ways, but taking intoaccount that the main environmental concern in the area is due to forest exploitation.First, one could set the exploitation of the forest at allowable cut level. The secondoption would be to enforce the payment of fees or royalties to achieve some desirablelevel of harvest. The royalty approach was employed because it was easier to get data.In order to use the allowable cut approach one would require data on the inventory of theforest and growth rate of the various tree species, information that was not available.
In all sites, the household activities and farm organization are managed in waysthat seek first to satisfy the family food requirements through allocation of resources(land and labor) to crop production. This is what one would expect from any ruralhousehold in Mozambique and elsewhere in Southern Africa.

340 LINEAR AND GOAL PROGRAMMING MODELS
The bigger the experience with forest resource scarcity, the more sensitive peopletend to be towards conservation of the environment as a goal. The decreasing numberof households stating this as a goal illustrated such behavior; being highest forNhamatanda, less for Gondola-Manica and least in Dondo.
4. MAIN FEATURES OF THE MODELA generalized weighted goal programming methodology of relevance to the miombowoodlands has been developed by Nhantumbo and Kowero (2001) and the modeldescribed in this paper is developed along the same lines. Therefore this section willnot dwell on the details of the definition and mathematical expression of constraints,activities, and goals. However, the matrix in Table 3 illustrates the general structure ofthe model, while Annex 1 presents details on one of the models employed in this study.The other models were structured in a similar way.
Table 3. Planning matrix
Agricultural activities Forestry Labor Sign RHSP S B C S activities M F Ch
P S
Objective Minimize positive and negative deviations from the weighted goals
Land d ≥ X ha
Labor d s s s <= 0
Cropproduction s d s d d <= 0
Forestry s d d d d <= 0
Consumption s d d d <= 0
Food Normalized Normalized = 100security goal supply demand
Income goal Normalized supply and demand = 100
P=Production, S=Selling, B=Buying, C=Consumption, M=men, F=women, Ch= children, d=demand, s=supply,RHS=Right hand side.
It is important to highlight some of the decision variables, constraints, and theobjective function. As mentioned earlier the household activities revolve aroundagriculture, forest products, and livestock. However, the latter was excluded from themodel since there were no large numbers of livestock, such as goats and cattle, thatcould take significant labour away from other activities for grazing and that wouldalso produce significant quantities of milk and meat for consumption or sale for cash.Therefore, the model included only activities revolving around agriculture and forestproducts. The decision variables for each included production, consumption, selling,buying (to supplement deficits), storing food produce from one season to the other,and labor allocation for the different activities.
The main constraints included land for the different crops and cropping systems.The yield for each crop was reconciled with the decision variables for selling andbuying. The allocation of produced food (in kilograms) was tied to the energy and

341I. Nhantumbo, G. Mlay and G. Kowero
protein supply by each of the crop types and the total demand for the same from thehousehold. Another dimension was that the dietary mix as defined by the eating habitswas included in the model so that not only the more nutritious products could beconsumed but also the habits defined by the culture and level of wellbeing could alsobe reflected. Labor demand for each activity was limited by the maximum labouravailable and capacity for hiring it. The constraints were based on a simple principle;that is, the resource demand should not exceed the supply.
The models were run as LP and GP. In the first case, the problem aimed atmaximizing the total gross margins according to the set of activities undertaken andresource constraints. This was a single maximization problem. However, as statedearlier the objective of the study was to evaluate options or opportunities for satisfyingthe different household goals taking into account the different priorities accorded tothem (Table 2). Hence the use of WGP was an imperative. Nevertheless, the twomethods were complementary in this exercise with LP employed to determine theminimum target for the income goal.
5. MODEL RESULTS
5.1 Linear programming resultsBased on the data collected in 1999/2000, the maximum income that the householdwas likely to earn is shown in the Table 4.
Table 4. Income for the typical household (US$/year)
Site Gross margin Disposable income per capita
Dondo 264 44Nhamatanda 243 40
Gondola-Manica 143 27
It is evident that the level of poverty in the study sites is very high consideringthat the target household incomes are lower than the average per capita GDP ofUS$280 for Mozambique. The household disposable incomes are even more distressing,despite the fact that they are net of food requirements since some constraints arebuilt into the model to ensure that the household gives priority to its consumptionbefore selling any food. Even though the per capita income is a distorted measure ofdistribution of wealth in the country, the reality shows that people in some parts of thecountry live far below the poverty line. Mozambique has 70% of its people in absolutepoverty and the two provinces included in this study are among the poorest areas. Thestudy results demonstrate the severity of poverty in the study sites. This underlinesthe need to correct the imbalances in resources/wealth distribution not only in thestudy sites but also throughout the country.
The disposable income when compared with the total land available for agriculturein the three sites (Table 5) on one hand, and the opportunity for harvesting forestresources on the other, would indicate that the forest is a potentially important sourceof cash for the rural family. Therefore, any restrictions in form of enforcement ofallowable cut or introduction of fees is likely to take the households to lower levels of

342 LINEAR AND GOAL PROGRAMMING MODELS
income than the current. This would be contrary to the government policy of povertyreduction. However, the tradeoff in the medium and long term is that the economicbasis for the household could be lost as a result of depletion of the natural forestresources. This is the dilemma that the policy maker will have to face in devisingmeasures to sustain the natural forest resources while at the same time alleviatingrural poverty using the same resources.
In addition, the results indicate that in Gondola-Manica the preference was forintercropping, which is good in terms of replenishment of the soil fertility throughleguminous crops. However, it could in fact be responsible for the relatively lowproduction of each of the crops compared to monocropping, making the produce primarilyfor consumption with little or no marketable surplus.
Table 5. Land allocation (ha) in the LP model
Crop Study siteDondo Nhamatanda Gondola-Manica
Maize 0.78 0.9 -
Rice 0.64 - -
Maize & sorghum 0.58 1.7 1.64
Maize & beans - - 0.89
Total agricultural cropland 2 2.6 3.5
Forest area harvested 1.71 0.89 0.61
The model provides the shadow prices of key resources such as land and labour(Table 6). It is apparent from the high shadow prices that land is a limited or scarceresource in Dondo and Nhamatanda. The typical household would increase the totalgross margin if it expanded the current land for agriculture marginally, i.e., by ahectare. However, this would clearly not be the best option for Gondola-Manica whereagricultural intensification would perhaps be a better option for improving productivityand eventually the well being of the household.
The analysis of labor demonstrates that this is also a critical production factor,especially in Gondola-Manica where US$545 could be gained if an extra adult labor(one manday) could be brought into the household at a price of US$2 (i.e. the shadowprice of labour in this site).
Table 6. Shadow price of land and labor (US$)
Site Land (ha) Labour (mandays) Rise in householdincome by oneadditional adult
Dondo 102 1.11 288
Nhamatanda 93 0.83 168
Gondola-Manica 0 2 545

343I. Nhantumbo, G. Mlay and G. Kowero
While land could be limiting in Dondo and Nhamatanda, labor availability would bedecisive in Gondola-Manica.
The level of sales shows further evidence of the relevance of the woodlands as asource of income particularly through making and selling charcoal, with as much as12.5 tones sold per household in Dondo in a year (Table 7). Gondola-Manica householdsappear to trade more in agricultural produce than those in Dondo and Nhamatanda,though the total sales revenue were meager due to the low prices of these products.Meeting food requirements was the most important objective of production. Table7 also indicates the level of consumption necessary to meet the FAO nutritionalstandards.
Table 7. Crop utilization (kg/season)
Site Crops Selling Buying Consumption StorageDry Wet Dry Wet Dry Wet Dry to
wet
Dondo Maize 0 98 0 0 472 470 698
Rice 0 0 0 0 151 151 186
Sorghum 92 0 0 0 38 38 57
Charcoal 2500 10 000
Nhamatanda Maize 132 0 0 692 648 653 0
Sorghum 0 0 0 0 142 138 178
Charcoal 2250 4750 - - - - -
Gondola- Manica Maize 619 0 0 0 500 505 634
Sorghum 92 0 0 0 158 154 193
Beans 0 48 0 0 26 25 78
Charcoal 1500 2000
These results demonstrate what would be the main farm organization if thehousehold were to pursue an income maximization objective. However, as statedearlier, the households are rarely driven by only one objective; they seek a compromisesolution between various goals. The following section presents the results of a weightedgoal programming model that harmonized the attainment of the three goals on thesethree sites.
5.2 Weighted Goal Programming results
5.2.1 Base run resultsThe Weighted Goal Programming model is based on information from the decisionmaker on the objectives, targets, and priorities to allow calculation of different weightsand coefficients. These are then used to evaluate the farm organization and especiallyhow the goals could be satisfied given the farm constraints and a range of activities.
Table 8. shows the comparative results of the three sites.

344 LINEAR AND GOAL PROGRAMMING MODELS
Table 8. Achievement of goals
Sites N1 P1 N2 P2
Dondo 0 10.6 0 0
Nhamatanda 0 2.3 0.2 0
Manica-Gondola 0 3.15 0 0
NB: N1 and P1 are negative and positive deviations from the food security goal while N2 and P2 arethe respective deviations from the income goal.
While the income goal is exactly satisfied in both Dondo and Gondola-Manica (N2
and P2 are both zero), in Nhamatanda this is slightly underachieved. In all the threesites there is an overachievement of the food security goal. This means that thehouseholds strive to satisfy the minimum food requirements with their production,even though income for other needs is limited. However, there is also some indicationthat not always the households take such precaution preferring to sell the produceduring the harvesting (dry) season and purchase food in the wet season. This producerbehavior is responsible for seasonal famine. Besides the need for immediate cash, itwas observed that poor storage in the study sites contributes to that farmer’s decision.
Table 9 shows that in looking for a compromise solution between the goals of thetypical household, there is a change in allocation of land to different crops comparedto the maximization situation in Table 5.
Table 9. Land allocation (ha) in the goal programming model
Crop Study site
Dondo Nhamatanda Gondola-Manica
Maize 1.3 0.9 -
Rice 0.34 - -
Maize & sorghum 0.36 1.7 1.64
Maize & beans - - 0.89
Total agricultural cropland 2 2.6 3.5
Forest area harvested 2.2 0.93 0.61
In addition, as far as utilization of crops is concerned the consumption does notvary significantly, except in the case of Nhamatanda where less maize is consumed inthe wet season (result of higher level of sales in the dry season), hence the need forcompensation with sorghum. This apparent stability of the solution results from thefact that restrictions on the energy and protein requirements have been incorporatedin the two models.
With respect to use of forest resources the Dondo households will harvest twoand three times the forest area that will be harvested by households in Nhamatandaand Gondola-Manica respectively. This will result in the production, in Dondo, of twoand four times more charcoal as will be produced in Nhamatanda and Manica respectively

345I. Nhantumbo, G. Mlay and G. Kowero
(table 10). Like in the LP solution, households in Dondo will remain more forestdependent as compared to those in the other two sites.
5.2.2 Policy experiments/sensitivity analysisSensitivity analysis enables one to develop scenarios to guide policy analysis and choice.The analysis illustrates how much the current farm organization may be positively ornegatively affected by policies and other external factors to the typical household. Weevaluated the potential impacts of macroeconomic and sectoral policies in the followingareas that appeared to be relevant to the study areas: labour availability, technologicalchange in agriculture, trade in agricultural products, and forest royalties. This choicewas based on literature, questionnaire interviews, reconnaissance surveys andparticipatory rural appraisal (PRA).
The objective of creating scenarios through sensitivity analysis is to provide thedecision maker with information and a range of options to guide policy implementationby gauging potential effects on the household and its forest resources. The yardstickfor analysis of the effectiveness of government policy would in this case be the povertyreduction through improvement of household incomes, food security and sustainablesupply of forest products.
(a) Labour availabilityHealth related problems, especially those associated with malaria and HIV/AIDS, affectlabour supply for various activities, generally constraining the ability of the family toexplore a wide range of economic opportunities for generation of household incomeand subsequent improvement of the living standard. Labour supply could be affectedby sickness, attending the sick, death, and attending funerals. The latter is especiallyimportant for the rest of the community who have to show solidarity with the family ofthe diseased, in fact farming is not done for two to three days according to the localcustoms. This implies that the frequency of death will severely affect the economy ofthe household and that of the community as a whole.
In addition, strict labour laws on child labour can affect labour supply. Neverthelessthese are not enforced in Mozambique and particularly in the study sites where childreneither go to school after undertaking some farming tasks or even drop out of school to
Table 10. Crop utilization (kg/season) for the goal programming model
Site Crops Selling Buying Consumption Storage Dry Wet Dry Wet Dry Wet Dry to wet
Dondo Maize 0 0 0 0 472 469 589Rice 0 0 128 0 151 151 157Sorghum 25 0 0 0 38 38 52Charcoal 2500 10 000
Nhamatanda Maize 948 0 0 692 648 574 728Sorghum 0 0 0 0 142 220 279Charcoal 2250 4750 - - - - -
Gondola-Manica Maize 633 0 0 12 500 505 619Sorghum 92 0 0 0 158 154 193Beans 0 48 0 0 26 25 78
Charcoal 1500 2000

346 LINEAR AND GOAL PROGRAMMING MODELS
help with farming. Emigration of the rural youth to urban centers in search of jobs alsoreduces household labour. Further, immigration into the household of relatives retrenchedfrom jobs in urban areas increases household labour.
In Dondo the results indicate that when there was no adult male labour in thehousehold the solution was infeasible, unless there was a possibility of hiring malelabour. As Table 11 shows there are negative deviations in both food security andincome goals. In the latter case the shortage of cash is more dramatic if the femalelabour is absent as it affects the crop production. Forest for charcoal and this couldcause even greater deforestation that, depending on amount of labour hired, couldlead to charcoal production over an area of 12 ha per annum for the typical household.Not all trees in a given area are used for producing charcoal, hence the possibility ofmaking a choice over such an extented area, if there are no restrictions on forestaccess.
When the household had no adult female labour, even when some could besubstituted for by the available child labour, the result was a complete disruption ofthe household production system. This means that the household has to hire adultfemale labour, or the man should change his activities and allocate more labour intofood production or increase income from harvesting and sale of forest products inorder to purchase food to maintain the food security of the household. Further, land isallocated only for pure maize and intercropping of maize and sorghum in respectively0.24 and 0.22 ha which is far less use of the land available. This is the situation whena female adult is absent, probably due to death. On the contrary, when there is noadult male in the family the land cultivated is slightly higher, being respectively 0.78and 0.21. In both cases, the solution is infeasible and rice is not cultivated possiblybecause labour for the crop is not available given that rice cultivation is labourintensive.
Table 11. Achievement of goals given changes in labour supply (Dondo)
Labour scenarios N1 P1 N2 P2
No adult male and no hiring 10 0 91 0
No adult female and no hiring 10 0 185 0
The change in labour availability also changes dietary habits (Table 12). For example,when an adult female is absent in the family, there is less consumption of maize, andrice then becomes an important source of energy. In total the typical family wouldacquire (purchase) 800 kg of rice per year for consumption.
The situation in Nhamatanda and Manica-Gondola was also dramatic since therewas insufficient surplus adult female labour to undertake the male activities when themodel was run without adult male labour. When the model was run without adult femalelabour the results indicated that there was no surplus male labour to carry out adultfemale activities.
The implication of these two scenarios is that labour substitution within thehouseholds in these sites appear to be difficult especially in extreme situations whena household looses an adult male or female. Even when substitution was possiblethrough labour hired into the household, it appeared not to be allocated primarily tomaize production (the staple food) thus creating an infeasible solution.

347I. Nhantumbo, G. Mlay and G. Kowero
The main finding is that absence of an adult member of the family (either man orwoman) adversely affects the ability of the household to meet its food requirementsand satisfy its income goal. This also results into putting less land under crops, andtherefore there will be less pressure on the forests if this loss cannot be compensatedfor through labour hiring into the household.
(b) Technological changes and natural disastersTechnological changes in agriculture can increase crop yields (through improved seed,efficiency in use of labour, etc.) and reduce crop losses through improved harvestingmethods and better crop storage facilities. Increase in crop production and productivityis one of the government strategies for national socio-economic developmenthighlighted in both the poverty reduction strategy programme (PRSP) and the AgriculturalSector Investment Program (PROAGRI). However, observations in the field indicatethat there are no viable extension services to supply subsidized inputs such as improvedseed, fertilizers and even equipment. Therefore, the changes assumed here are basedon the household’s own efforts to improve production.
Also, in relation to crop production we evaluated the effect of natural calamities,especially their potential impact on household welfare. Data was collected just aftera drought and the interviewees reported low yields as a result; however during thatsame year (2000) the reverse happened – excessive rains and massive floods. Sucheffects are simulated through estimated decreases in crop production.
Improvements in crop yields simulated at 25% or 50% would appear to have littleimpact on the level of deviation from the goals. This was due to the fact that there was aninternal land reallocation that maintained the base solution (Table 13). However, whenthere was a modest decrease in yields by 25%, the impact was significant with the negativedeviation of income (N2) ranging from 37% for Nhamatanda to an infeasible solution inGondola-Manica. This could be explained by the fact that the farm performance was lowerin Gondola-Manica making household livelihood strategies more sensitive or vulnerable(table 10).
Table 12. Crop utilization (kg/season) (Dondo)
Crops Selling Buying Consumption Storage
Dry Wet Dry Wet Dry Wet dry to wet
Base Maize 0 - 0 0 472 47 5890
Rice 0 0 12 0 151 15 1578 1
Sorghum 25 0 0 0 38 38 52
No man Maize 0 0 0 0 427 35 443and no 8hiring Rice 0 0 23 0 115 11 116
1 5Sorghum 0 0 0 0 29 39 38
No woman Maize 0 0 0 0 175 17 216and no 5hiring Rice 0 0 80 0 462 33 338
0 5Sorghum 0 0 0 0 31 31 41

348 LINEAR AND GOAL PROGRAMMING MODELS
However, as compared with the base results in Table 9, cropland in Dondo declinedslightly from 2 to 1.9 and 1.59 hectares with crop productivity increase. The implicationis that productivity increase can reduce cropland area and therefore deforestation inthe area. However, it has been observed that increased crop productivity hasindeterminate effects on forest resources. For example, Katila (1995) argues thatmarginal productivity of land can encourage deforestation while Jones and O’Neill(1995) reported that increased farm productivity was associated with less forest clearingin the Brazilian Amazon. Also Godoy et al. (1997) report that in Honduras indigenousfarmers with higher rice yields cleared less forest each year. In the case of Dondo, theforest area to be cleared when crop productivity was increased by 25% remainedunchanged. However, when crop yield was increased by 50% cropland area declinedwhile forest area to be cleared increased. The implication is that since these aresubsistence farmers, they will get their food from less cropland but will increase forestharvesting for household income because prices of forest products are relatively betterthan those from agricultural crops. So a crop yield increase that occurs in areas withlow crop output prices might not reduce deforestation, especially when the prices offorest products are relatively better.
Table 13. Land allocation (ha) due to yield increase in Dondo
Crop Yield increase (%)
25% 50%
Maize 1.22 1.07
Rice 0.34 0.34
Maize & sorghum 0.43 0.18
Maize & beans - -
Total agricultural cropland 1.9 1. 59
Forest area harvested 2.2 5.22
In addition, field observations indicated a precarious storage system where cropsare lost due to a variety of plagues. When crop storage loss was estimated at 5%there was no significant change in the base solution, however when crop losses wereincreased by 15% a moderate reduction in household income, ranging from 5 to 6%,was observed.
The results demonstrate that extension services that result into increases in cropyields and reduction in crop storage losses would be beneficial to the local communities.However, this assumes that these communities have the means to purchase seedsand other inputs. PROAGRI program contemplates both research on the appropriatetechnologies and extension services that will facilitate the achievement of theseaspirations.
(c) Trade in agricultural productsTrade in agricultural products was evaluated. However, the conduct and outcome oftrade depend on a number of factors ranging from the quality of the produce toavailability of adequate road infrastructure and transportation means to local anddistant markets. Access to distant markets was minimal in the three sites.

349I. Nhantumbo, G. Mlay and G. Kowero
Crop price increases were expected to augment the positive deviation of theincome goal (P2). This was not the case as shown in Table 14. We have used resultsfrom Dondo to illustrate this.
Table 14. Achievement of goals with output price increases in Dondo
Sites Price increase N1 P1 N2 P2
Dondo 25% 0 0 10.6 0
50% 10 0 10.6 0
Land allocation to crops responds marginally to the change in the prices as shownin Table 15. Also the forest area to be harvested remains relatively unchanged.
Table 15. Land allocations (ha) with price increase in Dondo
Crop Price increase
25% 50%
Maize 0.92 0.9
Rice 0.34 0.34
Maize & sorghum 0.28 0.3
Maize & beans - -
Total agricultural cropland 1.54 1. 54
Forest area harvested 2.4 2.41
However, with an output price increase of 25 and 50% there was no change inconsumption patterns in all the three sites. Table 16 illustrates the situation for Dondo.Crop prices were observed to be very low and minimally affected sales volumes.
Table 16. Crop utilization (kg/season) in Dondo
Crops Selling Buying Consumption StorageDry Wet Dry Wet Dry Wet Dry to wet
Base Maize 0 0 0 0 472 470 589Rice 0 0 128 0 151 151 157Sorghum 25 0 0 0 38 38 52
25% yield Maize 0 0 0 0 472 470 579increase Rice 0 0 148 0 151 151 178
Sorghum 0 0 0 0 38 38 50
50% yield Maize 0 0 0 0 472 470 579increase Rice 0 0 127 0 151 151 156
Sorghum 6.9 0 0 0 38 38 51
The implication is that with increase in output prices where market infrastructureis poor, as is the case in these sites, food and income needs will be met from lesscropland (Table 15). The small marketable surplus does not appreciably change tradedvolumes in the small local markets. Further, it is common practice that the family will

350 LINEAR AND GOAL PROGRAMMING MODELS
consume the crops that have lower output prices and sell the rest. Such action could affectthe satisfaction of dietary requirements and consequently the food security. In addition,this also implies that increasing the price alone for the basic products might not be asufficient policy measure to improve the household livelihood, but introduction of othercash crops will be required to diminish the risk of malnutrition due to dietary imbalances.
(d) Forest feesOne of the ways the Government of Mozambique could arrest deforestation is to makeforest products expensive. Introducing and enforcing fees on roundwood used formaking charcoal can do this. However, it is also interesting to evaluate a situation inwhich fees on forest products are imposed with the possibility of agricultural landexpansion offsetting the loss in benefits/income from forest harvesting.
(i) Imposition of forest fees for producersThe current fees for harvesting wood for charcoal are very small, only US$ 0.192 percubic meter. This compares unfavourably with what it takes to raise the forest tomaturity. An upward revision of such fees is therefore desirable, but can the ruralhouseholds afford to pay such fees? We use the results from Dondo (Table 17) toillustrate the answer.
Table 17. Effect of forest fees in the household goals in Dondo
Fees N1 P1 N2 P2
Enforcement* 0 10.6 5.2 0
Increase 10% 0 10.6 5.8 0
Increase 50% 0 10.6 5.9 0
Increase 100% 0 10.6 11 0
*Currently the producer (typical household) does not pay any royalties for harvesting forest products, ifsuch situation was changed, that is the household pays current fees, then the impact on the goals is shownin the first row.
The results demonstrate that the introduction of fees will have a negative effecton the farm income by reducing it by 5.2, 3.3 and 0.14% for respectively Dondo,Nhamatanda and Gondola Manica. The negative effect is higher in Dondo (Table 17)where the household economy relies significantly on sale of forest products. Suchdependency decreases progressively as we move to Gondola–Manica where the foresthas already been depleted, making the households rely more on agriculture and otheractivities. Assuming that the fee undervalues the forest resources, its doubling canpenalize households in Dondo and Gondola-Manica by reducing by as much as 11% and0.41% of their incomes respectively.
Another remarkable finding is that despite the proposed increase in fees, themodel indicated that households would not be deterred from continuing to harvest thesame volume as before. There was also no change in agricultural land allocationpatterns. This result is indicative of the few livelihood support options available tohouseholds in these areas. Men are supposed to be employed in income generatingactivities while women usually engage in production of food for consumption and otherreproductive obligations.

351I. Nhantumbo, G. Mlay and G. Kowero
(ii) Imposition of forest fees and relaxation of constraint on landIn Nhamatanda and Gondola-Manica labour has been demonstrated as the decisivefactor for expanding farm area. With additional labour supply in these two sites croplandarea will expand, for example, through shifting cultivation where this is possible, orexpansion of the household agricultural land in the same areas (if fallow land isavailable). When the model was simulated with an imposition of fees on forest products,but with a relaxation of the land constraint, the results for Dondo indicated that moreland would be allocated to rice production to compensate for loss in forest basedrevenues. The driver of such behaviour is the high price of rice relative to that ofother agricultural and forest products. Nevertheless, further field surveys are requiredto establish the availability of land suitable for rice production; otherwise, this solutionwill be unrealistic.
6. CONCLUDING REMARKS
6.1 On methodological issues(a) The data used to develop the model varied significantly in terms of its accuracydepending on the level of literacy of the respondent and also on accuracy in measuringsome parameters like crop yields and labour allocation. Even the selling and buyingprices varied.
(b) It was clear from the early stage of sampling that it would be difficult toobtain objective and quantified data for elicitation of targets for the goals stated bythe decision makers. Therefore, the approach was to use available technical informationto translate the concept of food security into a measurable target, such as the minimumcalorific requirement, and use LP model to establish the maximum income that thehousehold could derive from its activities given the resource constraints. Theenvironmental goal was difficult to formulate so a proxy was used. The imposition offorest fees was viewed as one way to regulate harvesting, and through such regulationone could implicitly influence deforestation as well as protect the environment. However,the results indicated that this was not an effective way of regulating woodland harvesting.This means that effective control of deforestation would have to include measuresother than those prescribed by the forest policy alone. A better proxy could have beenthe allowable cut but this pre-supposes the availability of inventory data and informationon the growth of all the tree species, both of which were not available.
6.2 On results(a) The use and management of forest resources cannot be seen in isolation of the restof economic opportunities in the household such as agriculture, fishing, brewing beer,livestock rearing, and others. These contributions were also investigated and the resultsindicated that agriculture and forest harvesting are the main sources of livelihoods forthe communities in the three sites.
(b) Harvesting forest products was observed to be the most profitable off-farmactivity. Imposition of fees on forest products that households harvested, expansion ofagricultural land, and increase in crop output prices cannot, in isolation, change thecurrent pattern of the household economy in the three sites. Provision of extensionservices and inputs for improved agricultural production will complement efforts in

352 LINEAR AND GOAL PROGRAMMING MODELS
regulating harvesting of the forest and materialize in a significant impact on householdlivelihoods and the forest condition. This underlines the relevance of an integrateddevelopment approach for rural areas.
(c) The challenge of diseases like malaria and HIV-AIDS on household economywere demonstrated and the results were dramatic. In short any socio-economic policiesthat do not address this issue are likely to fail because scarcity of labour will hampertheir implementation.
(d) The current model gives a static snap shot of the policy impact on the household.In other words, the model is not dynamic. Despite this limitation the potentialities ofthe model have been illustrated and it is up to decision and policy makers to decidewhether this is a useful planning instrument. A dynamic model could be constructedthrough recursive or multiperiod programming in which the results for one year wouldfeed into the following year. This would be possible if forest planning was well organizedand data collection were available. There is need for a more systematic collection ofinformation to establish trends for a dynamic model. Otherwise, the current frameworkcan be used to simulate the impact of few crucial policies on an annual basis, hencegiving a short-term indication of the likely outcomes and allow for incorporation ofnew strategies. Since central government planning is done during the middle of theyear (under PROAGRI), it is therefore possible to experiment with this approach. Thiswill strengthen the current practice in which the national agricultural programme,PROAGRI, is implemented by provincial administrations that have to draw plans forsubsequent years without first analyzing the likely impact or performance in the precedingyears. This makes planning a partial/incomplete exercise.
(e) The discussions emanating from the demonstration of the models and theirresults to various fora confirmed that the model results concurred with what otherpeople, i.e. the audience, considered the likely behaviour in the study sites. However,some wanted to see an extension of the model to include non-timber forest products(NTFPs) since these products play an important role in both food security and householdincomes. The researchers observed in the field that data for this component could notbe fully obtained through a spot survey, but there was need for continuous observationduring the different seasons to gauge objectively (and quantify) the role of NTFPs inthe household economy. Despite the efforts made by researchers to collect data onNTFPs, the information collected was insufficient and of poor quality and therefore notincluded in the current model.
(f) The model can be scaled up by extending it to the provincial administrativelevel, making it a regional or provincial model that incorporates the various activitiesin each of forest types or agro-ecological zones and link the supply from each of thezones to the main consumer market. This has been tested in Maputo province ofMozambique (Nhantumbo et al. 2001) as a more comprehensive planning instrument andat a higher level.
(g) Finally, GIS techniques can provide more illustrative results that are simple tounderstand and interpret by both the decision maker at farm level and the policymaker. This will bring in another dimension of programming which is fundamental, theinteraction with the main actors or interested parties. This would be particularly usefulif planning were at provincial or regional level.

353I. Nhantumbo, G. Mlay and G. Kowero
REFERENCESCampbell, B., Frost, P. and Byron, N. 1996. Miombo woodlands and their use: overview
and key issues. In: B. Campbell (ed.) The miombo in transition: Woodlands andwelfare in Africa. CIFOR, Bogor.
Celander N. 1983 Miombo woodlands in Africa - distribution, ecology and patterns ofland use. Working Paper 16. International Rural Development Centre, SwedishUniversity of Agricultural Sciences. 54p.
Godoy, R. et al. 1997 Household determinants of deforestation by Amerindians inHonduras. World Development 25: 977-987.
Hermanides, G. and Nijkamp, P. 1998. Multicriteria evaluation of sustainable agriculturalland use: a case study of Lesvos. In: Beinat, E. and Nijkamp, P. (eds.) Multicriteriaanalysis for land use management. Kluwer Academic Publishers, London.
Jones, D.W. and O’Neill, R.V. 1995 Development policies, urban unemploy-ment, anddeforestation: the role of infrastructure and tax policy in a two-sector model.Journal of Regional Science 35: 135-53.
Katila, M. 1995 Modeling deforestation in Thailand. Paper to IUFRO World Congress,Tampere, Finland.
Lind, E.M. and Morrison, M.E.S. 1974 East African vegetation. Longman Group Limited,London. pp. 59-101.
Nhantumbo, I., Dent, J.B., Kowero, G.S. and Oglethorpe. D.R. 1997 Regional model forrural land use planning: an application of Goal Programming. Unpublished draftpaper.
Nhantumbo I., Dent, J.B. and Kowero, G. 2001 Goal Programming: application in themanagement of the miombo woodland in Mozambique. European Journal ofOperations Research 133: 310-322.
Nhantumbo, I. and Kowero, G. 2001 A goal programming model for planning managementof miombo woodlands. In: Modelling methods for policy analysis in miombowoodlands, 5-15. Occasional Paper No. 35. CIFOR, Bogor.
Rehman, T. and Romero, C. 1993 The application of the MCDM paradigm to the managementof agricultural systems: Some basic considerations. Agricultural Systems 41: 239-255.
White, F. 1983 The vegetation of Africa. UNESCO, Paris. 356p + maps.

354 LINEAR AND GOAL PROGRAMMING MODELS
ANNEX 1. A WEIGHTED GOAL PROGRAMMING MODEL FOR ONE OFTHE SITES
LINGO software was used.! The Objective function is to maximise the total gross margin in a Linear
Programming Model,;!In the Goal Programming, however, the farmers look for a compromise solution
between food security and income generation, the respective weights are 0.67 and0.33 and are normalized;
!The objective of the farmers is to simultaneously minimize negative deviationsfrom the food security and income goals;
[Objective] Min= 0.016*n1 + 0.121*n2;
!Land Constraints;!GrRc is the amount of land allocated to rice;!GrMz is the amount of land allocated to maize:!GrMzSgh is the amount of land allocated to growing a mixed (inter) crop of maize andsorghum;
[LandT]GrRc + GrMz + GrMzSgh <= 2;[LandRc]GrRc <= 0.34;[LandMz]GrMz >= 0.78;[LandMzSgh]GrMzSgh <= 0.88;
!Production and utilization;!The coefficients correspond to the current yield per ha;!SgMzD, SgMzW, SgRcD, SgRcW, SgSghD, SgSghW represent the quantity of crops(Maize, Sorghum and rice) sold respectively in the dry (D) and wet (W) seasons;!BgMzD, BgMzW, BgRcD, BgRcW, BgSghD, BgSghW represent buying of maize andsorghum to supplement the internal production, this represents the household deficit;!MzCsD, MzCsW, RcCsD, RcCsW, SghCsD, SghCsW are variables representingconsumption of maize, rice and sorghum during the dry and wet seasons;!StMzD, StRcD, StSghD are variables showing the transfer of stored produce from thedry season to the wet season, the assumption being that the harvesting takes place atthe begining of the dry season. The coefficient reflects the losses that occur duringthe storage due to insects, rats, etc.;!MzSd, RcSd, SghSd are variables representing the quantity of seed stored from theharvest;
[MzPrUse]-901*GrMz - 800*GrMzSgh + SgMzD + StMzD - BgMzD + MzCsD <= 0;[MzUseW]-0.85*StMzD + SgMzW - BgMzW + MzCsW + MzSd <= 0;[RcPrUse]-531*GrRc + SgRcD + StRcD - BgRcD + RcCsD <= 0;[RcUseW]-0.99*StRcD + SgRcW - BgRcW + RcCsW + RcSd <= 0;[SghPrUse]-320*GrMzSgh + SgSghD + StSghD - BgSghD + SghCsD <= 0;[SghUseW]-0.85*StSghD + SgSghW - BgSghW + SghCsW + SghSd <=0;

355I. Nhantumbo, G. Mlay and G. Kowero
[AccMzD]SgMzD >= BgMzD;[AccMzW]SgMzW >= BgMzW;![AccRcD]SgRcD >= BgRcD;![AccRcW]SgRcW >= BgRcW;[AccSghD]SgSghD >= BgSghD;[AccSghW]SgSghW >= BgSghW;
!Labour demand for the household;!The household members include men-M, women-W, Children in a working age includingboth boys-Cbw and girls- Cgw and other children - C;!The coefficients represent the labour allocation for the different activities - cropping(labour contributed per ha by the different members of the household), charcoalproduction in the dry and wet season (ChPrD and CHPrW), harvesting of firewood andpoles for household consumption (FwCs, PlCs respectively), Domestic activities - DoA;
[Malabour]42*GrMz + 42*GrRc + 46*GrMzSgh + 45*ChPrD + 45*ChPrW + PlCs - 312*M -HrMl - 66*W<= 0;[WomLabour]33*GrMz + 40*GrRc + 51*GrMzSgh + 90*DoA + 2*ChPrD + 2*ChPrW +1.5*FwCs - 187.5*W <= 0;[Boylabour]14*GrMz + 1.5*FwCs - 104*Cbw <= 0;[Girlabour]15*GrMz + 90*DoA + 1.5*FwCs - 117*Cgw <= 0;[AccDomA]DoA=1;
!Size of the household;!Variables for household composition: M for men, W for women, CbW for children(boys) and CgW for children girls both in working age while C denotes both girls andboys before they reach the age of helping their parents;
[NoMan]M = 1;[NoWoman]W = 1;[Noboyswg]Cbw = 1;[Nogirlswg]Cgw=1;[Nochildren]C=2;
!Utilization of forest products for energy and construction;!For - is a variable representing the quantity of forest harvested to produce charcoalfor commercial purposes, firewood and poles for consumption;!ChPrD and ChPrW are the number of kilns of charcoal produced in the dry and wetseasons;!SgChD and SgChW sales of charcoal in the dry and wet seasons;!FwCs and PlCs represent the amount of firewood and poles that the typical householdconsumes per day;
[ChPr]-47*For + 15*ChPrD + 15*ChPrW + FwCs + PlCs <= 0;[ChUseD]-ChPrD + SgChD <=0;[ChUseW]-ChPrW + SgChW <=0;[NoKilnsD]ChPrD >=1;[NoKilnsW]ChPrW >=1;

356 LINEAR AND GOAL PROGRAMMING MODELS
[FwCons] FwCs >=5;[PolesCons]PlCs >=0.6;
!Energy requirement;!MzCsD, MzCsW, RcCsD, RcCsW, SghCsD, SghCsW represent the quantity of differentcrops consumed by the household and by season, according to the calories and proteinprovided by each kg of crop and according to the household minimum requirementsper year as established by FAO;[EnergyD]-3.450*MzCsD - 3.350*RcCsD - 3.350*SghCsD + 538.752*M + 428.22*W +475.8*Cbw + 385.764*Cgw + 217.221*C <= 0;[EnergyW]-3.450*MzCsW - 3.350*RcCsW - 3.350*SghCsW + 535.808*M + 425.88*W +473.2*Cbw + 383.656*Cgw + 216.34*C <= 0;[ProteinD]-100*MzCsD - 70*RcCsD - 95*SghCsD + 10.431*M + 10.431*W + 13.542*CbW+ 12.078*Cgw + 3.66*C <=0;[ProteinW]-100*MzCsD - 70*RcCsD - 95*SghCsD + 10.371*M + 10.374*W + 13.468*CbW+ 12.012*Cgw + 3.64*C <=0;
!Diet balance;!The diet balance illustrates the fact that the crops included in the model are consumedat different proportions, this avoids the possibility of obtaining unrealistic consumptionof only crops that have the highest energy and protein levels. Eating habits are thereforefactored into the model;
[MzBalD]-3.450*MzCsD + 0.33*(538.752*M + 428.22*W + 475.8*CbW + 385.764*Cgw +217.221*C)<=0;[MzBalW]-3.450*MzCsW + 0.33*(535.808*M + 425.88*W + 473.2*CbW + 383.656*Cgw+ 216.34*C)<=0;[RcBalD]-3.35*RcCsD + 0.224*(538.752*M + 428.22*W + 475.8*CbW + 385.764*Cgw +217.221*C)<=0;[RcBalW]-3.350*RcCsW + 0.224*(535.808*M + 425.88*W + 473.2*CbW + 383.656*Cgw+ 216.34*C)<=0;[SghBalD]-3.35*SghCsD + 0.056*(538.752*M + 428.22*W + 475.8*CbW + 385.764*CgW+ 216.34*C)<=0;[SghBalW]-3.350*SghCsW + 0.056*(535.808*M + 425.88*W + 473.2*CbW + 383.656*CgW+216.34*C)<=0;
!Demand for seed;!MzSd, RcSd and SghSd are quantities of seed of maize, rice and sorghum, respectively,necessary for the cultivated land;[SdMz]19*GrMz + 18.7*GrMzSgh - MzSd = 0;[SdRc]12*GrRc - RcSd = 0;[SdSgh]18.7*GrMzSgh - SghSd =0;
![Food security]3.450*MzCsD + 3.450*MzCsW + 3.350*RcCsD + 3.350*RcCsW +3.350*SghCsD + 3.35*SghCsW + n1 - p1 = 4 080.335;!Definition of the food security goal, the RHS shows the absolute target in terms ofenergy required per year;

357I. Nhantumbo, G. Mlay and G. Kowero
![Income] Max = 0.12*SgMzD + 0.16*SgMzW + 0.243*SgRcD + 0.25*SgRcW + 0.16*SgSghD+ 0.18*SgSghW - 0.13*BgMzD - 0.17*BgMzW - 0.29*BgRcD - 0.293*BgRcW - 0.18*BgSghD- 0.19*BgSghW + 44*SgChD + 47.5*SgChW + n2 - p2 =271.74;!The income goal has been defined using the information in the expression above,which has been used when the program was run as LP which maximizes the grossmargin. This was also important for defining the income target whose deviation isminimised in the goal programming. The coefficients are prices of selling and buying ofthe different household products;!Food security goal normalized using percentage normalization;!n1 and p1 are negative and positive deviations from the food security goal;[FSecurity]0.0845*MzCsD + 0.0845*MzCsW + 0.0821*RcCsD + 0.0821*RcCsW +0.0821*SghCsD + 0.0821*SghCsW + n1 - p1 = 100;
!Percentage normalization of the income goal;!n2 and p2 are negative and positive deviations from the income goal;[Income]0.0442*SgMzD + 0.059*SgMzW + 0.0894*SgRcD + 0.0919*SgRcW +0.059*SgSghD + 0.0662*SgSghW - 0.0478*BgMzD - 0.0626*BgMzW - 0.1067*BgRcD -0.108*BgRcW - 0.0662*BgSghD - 0.0699*BgSghW - 0.367*HrMl + 16.19*SgChD +17.48*SgChW + n2

20.Policy impact on woodland resourcemanagement, use and conservation inMozambique: A case study of selected sitesin Dondo, Nhamatanda, Gondola andManica districts
G. Mlay, M. Falcao, I. Nhantumbo and G. Kowero
ABSTRACTForest resources play an important role in the economy of Mozambique. They are asignificant source of livelihood and food security for rural people. The high rate ofdeforestation, estimated at 4.2% per year, coupled with land degradation, has beendemanding a re-evaluation of the institutions and policies which guide the exploitationand conservation of forest resources. Management arrangements and policies thatwill meet the needs of stakeholders and at the same time guarantee a sustainable useof the forest resources are complex to devise.
A case study of three sites in the provinces of Manica and Sofala was carried outto analyse (a) the impact of alternative management regimes on the incomes of miombowoodlands users and on woodlands conservation, and (b) the impact of sectoral andextrasectoral policies on incomes for miombo users and woodland conservation underdifferent management regimes. A system dynamics model, MIOMBOSIM, based ongame theory and implemented in Powersim, was used for the study.
The results show that regulated management regimes incorporating social concernsor incorporating social and environmental concerns are potentially more beneficial tothe household sector than the open access situation. The open access situation is themost beneficial management option for the private sector. Extrasectoral policiesintended to promote agriculture have mixed effects on forest development. Modestagricultural price and productivity increases would increase agricultural productionthrough area expansion. Reduction in land clearing for agriculture is only achievedwhen extrasectoral policies lead to large productivity increases in agriculture.
Key words: Sectoral and extra sectoral policies, management regimes, stakeholders,benefits, system dynamics, Mozambique.

359G. Mlay, M. Falcao, I. Nhantumbo and G. Kowero
1. INTRODUCTIONMozambique has been implementing economic reforms in the context of structuraladjustment programs since 1987. The pace of reforms accelerated after the signingof a peace agreement between RENAMO (an opposition movement in the country’spost-independence civil war that later became a political party) and the governmentin 1992, followed by multiparty elections in 1994. The reforms have included currencydevaluation with subsequent liberalization of the exchange rate, markets, prices andtrade. Other measures include increased privatisation, fiscal retrenchment anddomestic credit contraction. The implementation of these policies hinges mainly onthe dominant role of market forces in guiding economic activities, with government’srole directed at creating enabling conditions (infrastructure and market development,regulations and laws to protect property rights and enforcement of contracts, fiscalincentives, public investment in research, etc.).
Although the economic reforms have led to impressive macroeconomic performanceas exemplified by a real GDP average annual growth rate of about 8% between 1996and 1999, an annual growth rate of agricultural production of about 14%, and a reductionof annual inflation from 70.2% in 1994 to 6.2% in 1999, Mozambique continues to beone of the poorest countries in the world. According to a report on poverty assessmentin Mozambique about 71.2% of the rural population and 62% of the urban populationare below the poverty line (Ministry of Planning and Finance et al. 1998). Given that70.4% of the population lives in rural areas poverty is essentially a rural problem.
The impressive performance of the agricultural sector has come about mainlyfrom area expansion and not from an increase in productivity. The average yields ofthe main food crops (maize, rice, cassava, and beans) are about half those of sub-Saharan Africa. According to the results of the national household survey carried in1996/97 by the National Institute of Statistics, only about 20% of the rural householdsused purchased seeds, none used fertilizer and only 18% of the households had accessto technical assistance in the community. These statistics indicate that the presentgrowth performance of agriculture cannot be sustained (since it is based on miningthe land/soil) without the use of high productivity technologies that are environmentallyfriendly.
The Government of Mozambique recognizes that rapid broad based economicgrowth is necessary to reduce poverty. In this connection, agriculture (which supportsthe majority of the population) has to play a key role, with emphasis on use of moreproductive technologies that are environmentally friendly. The high incidence of poverty,and agricultural production characterized by low input use and extensive land use are,two characteristics that favour deforestation and land degradation. As pointed out byVosti and Witcover (1996), poor households have a short time horizon in which naturalresource mining may be the only alternative to meet the short term goals of food andlivelihood security. In Mozambique, it is estimated that 4.2% of forest cover is lostannually, the principal causes being conversion of forest land to agriculture, tree fellingfor energy (charcoal and fire-wood) and construction material. Inadequate agriculturalpractices based on slash and burn methods, and exploitation of non-wood productsusing uncontrolled fires, often lead to the destruction of large tracts of forests.
In order to contain the adverse effects of economic development on theenvironment, the macroeconomic policy reforms have been accompanied by reform orformulation of sectoral policies and instruments to match economy wide policies. The

360 POLICY IMPACT ON WOODLAND RESOURCE MANAGEMENT, USE AND CONSERVATION IN MOZAMBIQUE
key policy documents relevant to forest management include the agricultural policyand strategy for implementation (Ministério da Agricultura e Pescas 1995), the landlaw of 1997 (AR1 1997), the trade policy and strategy (Governo de Moçambique 1999),forest and wildlife policy of 1997 (AR2 1997), food security and nutrition strategy(Governo de Moçambique 1998), the national agricultural development program(Governo de Moçambique 1998), and the action plan for the reduction of absolutepoverty (Governo de Moçambique 2001).
While land continues to be publicly owned the land, law recognises land use rightsunder customary law, and has provision for right of occupancy (through title deeds) atcommunity level. The drawing of benefits is guaranteed by the land law, which providesa legal framework of right of occupancy of land at community level. The current forestand wild life policy also provides for a greater role for local community participation innatural resource management. According to Kant and Nautiyal (1993), a cross sectionstudy of 28 countries in Africa, Asia and Latin America showed that the main cause ofdeforestation in these areas is not over exploiting for supply to industry, but theinability of forest owners (often the state) to exclude various user groups from theresource which in theory is under a well defined property regime, leading to resourceexploitation in an open access context. The high cost of monitoring coupled with lowbudgets means that in practice, monitoring and enforcement of government regulationsis lax and hence ineffective. The recent interest in promoting community based forestmanagement arrangements is seen as a more promising management alternative tothe centralised arrangement.
Although broad policy statements and instruments for the implementation ofcommunity based forest management policies are in place in Mozambique, empiricalsupport either to predict their impact or to fine-tune them to reflect the localenvironment is lacking. This is particularly important given the conflicting objectivesof the different actors involved and the trade offs imputed by the extrasectoral policieswhich impact on the forest sector. The forest and wildlife policy provides for privatesector logging under concession arrangements, while the land law allows for thecommunities to enter into partnership arrangements with the private sector in theexploration of land under community management. These policy provisions createopportunities for cooperation between the private sector and communities in managingthe forest. What incentives will promote cooperation and at what level? How will thecooperation impact on community and private sector income and on the woodlandresources? These are but a few of the many unknowns.
This paper presents results from a study carried out in Mozambique in the districtsof Nhamatanda and Dondo in Sofala province, and those of Gondola and Manica inManica province. The study was undertaken with the general objective of analysingthe impact of selected policies on the incomes of users of miombo woodlands and onthe conservation status of the woodlands. The miombo woodland is the most extensiveforest formation in Mozambique and is characterised by tree species of Brachystegiaand Julbernadia.
Specifically, the study evaluated the potential impact of five alternative miombowoodland management regimes on incomes of miombo users and on woodlands conditionas well as the likely impact of some sectoral and extrasectoral policies on incomes ofmiombo users and woodlands conservation under the same management regimes. Inthis way the study sought to predict the impact of the broad government policies on

361G. Mlay, M. Falcao, I. Nhantumbo and G. Kowero
local communities and their environment thus providing an opportunity to fine-tunethese policies for maximum impact.
The rest of the paper is organized as follows: section 2 presents a brief review ofmodelling experiences in forest management, section 3 presents the methodology,while the main results are discussed in section 4. Section 5 presents the summary andmain implications of the results on the welfare of rural communities and the forestcondition.
2. A BRIEF OVERVIEW OF MODELLING IN FOREST MANAGEMENTThe review focuses on the modelling procedures used to study forest developmentproblems; less emphasis is given to the underlying causes of these problems. Thesehave been reviewed in many studies, including those reported by Mlay et al. (2003),Kaimowitz and Angelsen (1998), and Angelsen and Kaimowitz (2001).
Deforestation has serious negative effects on land degradation, climate andbiodiversity. In the recent past there has been a rapid growth of studies at micro,meso and macro levels to try to understand and quantify the impact of the underlyingcauses of deforestation with a view to improving policy formulation and implementation.Kaimowitz and Angelsen (1998) present a rich review of economic models of tropicaldeforestation, covering studies conducted at micro (household and firm), meso(regional) and macro (national and cross country) levels. Further, Angelsen andKaimowitz (2001) present a good account on agricultural technologies and tropicaldeforestation.
The micro level modelling has used household models of two types namely: openeconomy type models which treat all prices as being exogenous, and Chayonavianmodels assuming some markets are imperfect or incomplete or absent, leading toinseparability of production and consumption decisions. The empirical implementationof the conceptual models has taken the form of regression analysis, mathematicalprogramming and simulation. These models have been used to study the impact ondeforestation of input and output prices, risk, wage rates, off-farm employment landtenure and transport costs.
Regional or meso level models are either spatial or non spatial. The spatial modelsbased on geo-referenced variables can predict where deforestation can occur. Themajority of these models use multivariate logit or probit analyses. The non-spatialmodels are based on regression analysis, and can be used to study the effects ofagricultural prices, population growth, transport costs, income and credit ondeforestation.
The macro level models are of the general equilibrium type, and their popularityhas been promoted for the following reasons (Kaimowitz and Angelsen (1998): theymake some prices endogenous, they explore how some underlying variables help todetermine decision parameters thus providing an important link to macroeconomicvariables and policy instruments, and finally they include the interaction betweendifferent sectors and markets. The analytical implementation has mainly been byComputable General Equilibrium Models (GCE). The GCE models have been used tostudy the impact on deforestation of devaluation, trade liberalisation, export taxes,subsidies to industry, public expenditure, subsidies to agriculture, land taxes andtechnology (in agriculture and forestry). Trade and commodity models linking production,

362 POLICY IMPACT ON WOODLAND RESOURCE MANAGEMENT, USE AND CONSERVATION IN MOZAMBIQUE
consumption and trade have been used to study the impact of currency devaluation,population growth, export taxes, wage rates and fertilizer prices on deforestation(Kaimowitz and Angelsen 1998, Pandey and Wheeler 2001).
The choice of modelling approach depends on the research questions and resourceavailability for implementation. While the models reviewed above address forestdevelopment issues at micro, meso and macro levels, they don’t provide answers tomanagement issues where potential conflicts exist between stakeholders. Models basedon game theory seem promising. White (2000) provides a detailed review of game-theoretic analysis of common property resources. With the exception of fisheries (seeSumaila 1999), the empirical application of game theoretic models for other renewableresources has been limited. McCarthy (2000) presents a single period theoretical modelto analyse the effects of production risk on the use of common pool rangelands. Thecomparative statistic results show that: (a) under a cooperative regime herders arebetter off in terms of welfare and production as production risk decreases. Stock levelsincrease as production risk decreases; (b) although under a non-cooperative regimestock levels increase with a decrease in production risk, profit may actually decline; and(c) total stock levels are higher under non-cooperation than under cooperation. Accordingto McCarthy (2000), groups undertake cooperation to the extent that the benefits fromcooperation outweigh the costs of making and enforcing agreements. As such, memberswill weigh the costs and benefits when choosing the level of cooperation.
Unsustainable exploitation of natural forest, land and other resources under openaccess, stemming from ineffective regulatory instruments (because of high costs ofenforcement and conflict between national level objectives on one hand and localneeds and objectives on the other) has seen a growing interest in promoting theparticipation of local communities in joint management programmes. Examples inthe region include CAMPFIRE (Community Areas Management Program for IndigenousResources) in Zimbabwe, largely involving local communities in wildlife ranching; theADMADE programme (Administrative Management Design for Game Management Areas)of Zambia, another wildlife management initiative with local communities (Forests,Trees and People Newsletter 1991); and Village Natural Resource ManagementCommittees in the Malawi. Other initiatives include Trusts, Conservancies, andAssociations as found in Botswana, Namibia, and some villages in Tanzania (e.g.Duru-Haitemba). According to Kant and Nautiyal (1993), joint forest managementprogrammes will only be successful if they include the rights and obligations of bothpartners, and if the sharing of benefits is perceived to be fair.
Kant and Nautiyal (1993), using a bilateral monopoly gaming approach, show thenecessary community share of annual benefits from forest resources to maintaincommunity interest in cooperation with a forest owner in joint forest management.This model is, however, limited in that it does not take into account other employmentopportunities opened to local communities (agriculture, off-farm employment).Cardenas et al. (2000) examined the effects of external institutions, like rules andregulations imposed from outside the community, on behaviour under an experimentalsetting. The subjects for the experiment were drawn from rural households whodepended heavily on local forests for wood products, and the exploitation of theseproducts affects other aspects of their livelihood adversely (water quality and fishpopulation). The experiment involved the allocation of a given endowment of timebetween collection of firewood from the forest and providing labour to an unrelatedmarket. They found that when subjects do not face external restrictions and cannot

363G. Mlay, M. Falcao, I. Nhantumbo and G. Kowero
communicate with each other (non-cooperation), their decisions tended to be neitherNash-based strategies1 nor efficient choices, but somewhere between these extremes.In the absence of regulations, but with communication (cooperation), the subjectsmade more efficient choices. With external regulations subjects made choices closerto their pure Nash strategies. Consequently, average individual payoffs were lowerthan in the absence of regulation, and much lower than the payoffs of those subjectswho were simply allowed to communicate with each other (cooperation), despite thefact that the regulatory institutions were designed to induce more efficient choices.Their results show that local environmental policies that are moderately enforced areineffective, and can do more harm than good in comparison to allowing individualscollectively to confront local environmental dilemma without intervention. The reasonfor the poor performance of external control is that it crowded out group-regardingbehaviour in favour of greater self-interest.
3. METHODOLOGY
3.1 The modelA system dynamics model, MIOMBOSIM, which is based on game theory, is used in thispaper. The conceptual model adapted here is presented in detail in Sumaila et.al. (2001).Three groups of stakeholders are identified, namely the government, the private(commercial) sector and the local community. The government’s interest in miombowoodlands is based on maximizing society-wide benefits that include environmentalprotection (biodiversity conservation, protection of catchment areas, mitigation of landdegradation and climatic changes), direct economic benefits and social benefits (e.g.preservation of settlement patterns in rural areas). The community’s interest in miombowoodlands is based on the benefits that can be derived from wood and non-wood productsharvested for consumption and sale, while the private sector’s interest is based on theincome derived from woodland harvesting, processing and sale activities. Under theexisting Mozambican legislation, the land belongs to the state (owner) and thecommunities and the private sector enjoy user rights as per regulations mandated bythe government. Partial enforcement of these regulations has resulted in the woodlandsbeing under open access and therefore overexploited. This has potential for conflictsamong the stakeholders due to their divergent objectives. While the private sectorcarries out selective logging, the household harvesting activities are non-selective,leading to destruction of valuable timber species. In addition, harvesting underconcession2 denies communities legal access to these areas. In the absence ofenforcement capacity, these areas will continue to be exploited by communities as ifunder open access, and this could lead to losses of valuable timber species that havebeen legally allocated to the concession owner. These conflicts provide a basis forconsidering cooperation between the private sector and the local communities. A summaryof the model that depicts this behaviour is presented in Annex 1. However, the logicleading to the development of the model is described in Figure 1.
3.2 Decision making by household and commercial sectorsThe decision rules following the game theoretic games are summarised in Figure 1. It isassumed that at any time, t, there is a fixed woodland area (Nt) available to the

364 POLICY IMPACT ON WOODLAND RESOURCE MANAGEMENT, USE AND CONSERVATION IN MOZAMBIQUE
communities from which the land area Na is put under agriculture and Nm is the remainingarea under miombo woodlands. The household and commercial sectors have to decideon how to use the land area Nm hectares that are under miombo woodlands. Thecommercial sector’s decision is a one step process involving the determination of areaH
c to harvest annually in order to maximize the sum of discounted net benefits. For the
household sector, the decision making is a three-stage process. The criterion at eachstage is to maximize utility over time. In the first stage a decision is made on how muchof the area presently under miombo they should use (Hh) in order to maximize theirutility over time. In the second stage a decision is made on how much of the miomboarea to be used by households should be cleared for agriculture (Ha) and how muchshould be used for harvesting miombo wood products (H
m). For the area to be harvested
of miombo wood products, the third stage involves its allocation between poles, Hpo,and fuelwood, Hfw, the two main products from the woodlands.
Total miombo land in Hectares (Nt)
Miombo woodlands (Nm)Initial Agricultural land (Na)
CommercialUse (Hc)
Householduse (Hh)
Wood productsharvest (Hm)
Area converted foragriculture (Ha)
Poles (Hpo)Fuel wood (Hfw)
Figure 1. Steps in decision making by the household and commercial sectors
The allocation process is driven by relative prices as shown in equations 1, 2 and 3.
(1)

365G. Mlay, M. Falcao, I. Nhantumbo and G. Kowero
(2)
(3)
Where: Hh* = miombo woodland area to be exploited by the household sectorHa= area to be converted to agricultureHm= miombo woodland area to be exploited for wood products (Hm=Hh*-Ha)Hfw = miombo woodland area to be exploited for fuelwoodHpo = miombo woodland area to be exploited for polesPa= revenue per hectare of agricultural productsPfw = price per hectare equivalent of fuelwoodPpo= price per hectare equivalent of poles
3.3 The game theoretic modelsThree principal game theoretic models were employed, namely a command model, acooperative model and a non-cooperative model. In all models, the maximization of theobjective function was over labour since this is the main variable factor in miombo harvestingactivities. Each model is briefly described. For definition of symbols see Annex 1.
a) Command modelThis model relates to a ‘regulator’ such as a central or local government, in thatownership and decisions are centralised. In this model, society-wide net benefits aremaximized through the choice of the amount of labour to be used by the private andthe household sectors in each year over the planning horizon of the model. The harvestingtechnologies used by both sectors are labour intensive and therefore the amount oflabour to be used defines the volume of wood products to be harvested by each sector.
(4)
where: Lt = total labour available to both household and private sectors at time t.Lm,t = Labour used for harvesting miombo wood products at time t.La,t = Labour used in agriculture at time t.Ln,t = Labour used in converting miombo woodland to agriculture at time t.L
of, t = Labour used for off-miombo, off agriculture activities at time t.
s = Natural regeneration rate of the woodlands
Depending on the values assigned to parameters c , h, different scenarios ofthe command model can be examined. In this paper we look at three scenarios,

366 POLICY IMPACT ON WOODLAND RESOURCE MANAGEMENT, USE AND CONSERVATION IN MOZAMBIQUE
namely the scenario in which the regulator (government) is concerned with bothsocial and environmental benefits but favouring or giving more weight to thehousehold sector (
c=0,
h = 1 and =1) (scenario 1), the scenario in which only
environmental benefits are considered ( c=0, h =0 and =1) (scenario 2), and thescenario that considers only social benefits but favouring the household sector ( c =0,
aaah=1 and =0) (scenario 3).
These three scenarios represent the range of management options that centraland local governments normally employ to manage the natural woodland resources.The first scenario corresponds to an advocated option in natural forest conservationthat allows limited or controlled exploitation, like in water catchment forest areasthat border villages. The second scenario represents a strict biodiversity conservationthrust as usually found in protected areas for important biodiversity, like heritagesites. The third scenario is largely found in most woodlands in the region that aretechnically under government control, but due to inadequate resources for theirmanagement they have almost become open access woodlands.
b) Cooperative modelIn some situations some households indulge in commercialisation of the woodlandproducts. Under such a situation, these households could form a ‘commercial sector’,while those that use the woodland products for own consumption would constitute the‘household sector’. This way one could map and monitor the development of commercialactivities at the household level.
In this model it is assumed that the household and commercial sectors have anincentive to cooperate through joint maximization of their discounted net benefits.
The value assigned to the parameter α will reflect the relative weight given totheir individual benefits under cooperative management. When α is assigned a value of1, full weight is given to the commercial sector’s benefits and a value of 0 correspondsto full weight being given to the household sector’s benefits. The value of α betweenthe two extremes will permit both sectors to participate in miombo activities, thusthe parameter is a measure of their preferences.
c) Non-cooperative modelIn this model it is assumed that the two stakeholders (commercial and house holdsectors) operate in the woodlands independently without taking into account the interestof other stakeholders. This model mimics the open access situation, currently thedominant arrangement under which miombo woodlands are being exploited in manyparts of Mozambique.
subject to:

367G. Mlay, M. Falcao, I. Nhantumbo and G. Kowero
The constrained maximization problem of each stakeholder is as:
(i). Household sector
(ii). Commercial Sector
Simulation of the models is based on the numerical approach similar to thatapplied in Sumaila (1995) using system dynamics simulation package Powersim.
3.4 Questions to be addressedOn the basis of the participatory rural appraisal (PRA) and survey results from thestudy sites the following were identified as the main problems that could be solvedwith appropriate policy instruments.
a) Inadequate agricultural practices involving use of uncontrolled fires in land clearingand exploitation of non-wood products (honey and wild game).
b) Low or non-use of improved inputs (fertilizers and improved seeds) the result ofwhich is area expansion to increase production or shifting cultivation to maintainreasonable yields.
c) High post-harvest losses of agricultural crops.d) Incomplete or absent markets for agricultural inputs and products, as a result of
poor rural infrastructure.e) Limited or lack of alternative employment opportunities.f) Various fees/prices for exploitation of forest products do not reflect their economic
values. Cuco (1994) noted that stumpage/royalty fees range from US $1.20 perm3 for second-class species to US $3.60 per m3 for precious species.
g) Incomplete property rights on land, with consequent absence of internalisationof the externalities that arise from the exploitation of forest resources. Theineffective enforcement of existing regulation favours the utilization of woodlandresources as if under open access conditions.
In addressing the above problems, simulation experiments under the five specifiedalternative management options were made within the context of the following
368 POLICY IMPACT ON WOODLAND RESOURCE MANAGEMENT, USE AND CONSERVATION IN MOZAMBIQUE
categories of policy instruments (more details in section 4.2):a) Policy instruments to create rural markets and improve incentives of market
participants: mainly through agricultural input and output prices. For example,we employed a 25% and a 75% increase in agricultural output prices.
b) Policy instruments to promote the use of improved technologies in agriculturaland charcoal production: largely through reducing post-harvest losses andincreasing crop yields. We experimented with a 25% and a 75% increase in cropyields.
c) Sectoral policies aimed at forest or biodiversity conservation: mainly throughfees or royalty charges on the forest products exploited. We experimented witha 30% increase in various fees charged for exploiting forest products for sale.
Table 1. Baseline data
Item Units Study siteNhamatanda Dondo Gondola-
Manica
Average farm size ha 2.0 2.6 3.5
Discount factor (ρ ) [0.909;0.89] [0.909;0.89] [0.909;0.89]
Household labour efficiencyparameter (qh) [0.1;0.05] [0.1;0.083] [0.1;0.03]
Forest area for community (Nt) ha 12 000 14 500 25 000
Existing agricultural land (Na) ha 4997.2 1890.2 8355
Conversion cost miombo $ per m3 0 0 0
Wage rate (w) $ per year 303.72 303.72 303.72
Average price of standingmiombo (Pave) $/m3 19.30 15.40 11.55
Price of fuel wood (Pfw) $/m3 3.17 3.06 3.3
Price of poles (Ppo) $/m3 5.2 5 5.4
Purchased inputs 0 0 0
Regeneration (s) 0.012 0.012 0.012
Revenue from agriculture (Pa) $/ha 206.03 253.66 134.5
Subsistence income (Ih) $ 1 095 156 734 561 1 099 930
Survival rate (s) 0.92 0.92 0.92
Social concern parameter (θ ) 0 or 1 0 or 1 0 or 1
Total potential labour per household mandays 1273 986 1565
Total labour in the community mandays 2 446 706 716 822 3 735 655
Parameter to labour cost function (v) 0.5 0.5 0.5
Standing volume of wood (Kt) m3/ha 38 47 40
Number of habitants per site 13 454 4 362 14 322
Harvesting cost by commercial sector $/m3 9.75 7.8 5.85
Efficiency parameter for labourfor commercial harvesting (qc) - 0.05 0.083 0.3
Potential area for commercial harvesting ha 8 935 1 234 7 282

369G. Mlay, M. Falcao, I. Nhantumbo and G. Kowero
3.5 Data usedThe data used to run the base models are presented in Table 1. The data were obtainedfrom a field survey conducted in 2000 and supplemented with data from secondarysources.
4. RESULTS AND DISCUSSION
4.1 Basic simulation resultsThe basic results are presented under three categories of management regimes, namely:
a) A scenario in which a central or local government (regulator) determines the annualharvesting levels by household and commercial/private sectors in order to maximizesociety-wide benefits, which include the direct economic benefits, social benefitsand environmental benefits (Command model).
b) A scenario in which the household and commercial/private sectors decide, oftheir own free will, to cooperate on the harvesting levels for each sector in orderto maximise their joint net benefits (Cooperative model).
c) A scenario in which the household and commercial/private sectors actindependently, each setting its level of harvesting to maximize own benefits (Non-cooperative model).
4.1.1 Effect of private sector participation (commercialisation) on householdbenefits
The relative weight assigned to each sector in the cooperative game is reflected bythe preference parameter whose value varies from 0 (giving all weight to the householdsector) to 1 (giving entire weight to the commercial/private sector). Figures 2 to 4present the results. These results are compared with those obtained from the non-cooperative model. The top curve (Total household benefits) represents the combinedbenefits from woodlands and agriculture.
The joint discounted net benefits from woodland products are highest when theprivate sector or commercialisation is given maximum preference and they are leastwhen total weight is given to the household sector. Given that, in practice, thesebenefits are not redistributed between the participating sectors, these extreme levelsof existence are not practical and therefore define the outermost limits for bothsectors; that is, in practice, the private sector and households coexist between thesetwo extremes. It is therefore the responsibility of the decision maker to decide on theappropriate weight to give to each sector and taking into account the monetary benefits,employment creation and eventual forest condition, among others.
In the Dondo site, which is more endowed with miombo woodlands than the othertwo sites, there is a clear declining trend of household sector discounted net benefitsfrom woodland products and a rising trend of commercial sector discounted net benefitsfrom woodland products as the level of private sector participation or commercialisationincreases. The rate of decline slows down when the preference level is between 0.4and 0.7. The household sector net benefits from combined agriculture and forest activities(the top curve) are also sensitive to changes in preference parameters, showing thatforest activities contribute a pronounced share to households’ total benefits.
The household sector’s net befits from the combined forest and agriculture activitiesare insensitive to changes in preference parameters in the case of the Nhamatanda

370 POLICY IMPACT ON WOODLAND RESOURCE MANAGEMENT, USE AND CONSERVATION IN MOZAMBIQUE
Figure 3. Effect of variation of preference parameter on the stakeholders’ net benefitsin Nhamatanda
Figure 2. Effect of variation of preference parameter on the stakeholders’ net benefitsin Dondo

371G. Mlay, M. Falcao, I. Nhantumbo and G. Kowero
Figure 4. Effect of variation of preference parameter on the stakeholders’ net benefitsinGondola-Manica
and Gondola-Manica sites, as can be seen from the top curves in Figures 3 and 4. Thisis because these two sites have few forest resources and the products derived fromthem make a small contribution to total household net benefits. In these two sites,using income from the woodlands as a strategy (incentive) to households to conservethe forests would most probably be less effective as compared to Dondo. Thereforeanother strategy has to be devised.
4.1.2. The impact of management regimes on the well-being of stakeholdersand on woodland resources
This section will first present the results on comparative analysis of the five managementregimes with particular emphasis on their impact on the well-being of stakeholdersand on the forest resources. We analyse how alternative management regimes influencethe benefits accruing to the stakeholders and how these translate to volume of woodproducts harvested, labour employment opportunities for miombo activities and thestate of forest resources. Given that currently the miombo woodland resources areprincipally exploited under open access, the non-cooperative model will be used as areference point in comparing the management alternatives.
4.1.2.1 Impact on stakeholders’ net benefitsThe effects of management regime on discounted total benefits from miombo activitiesvary in terms of quantity and distribution between the two sectors (Table 2). Thedifference in discounted net benefits between the two sectors reflects the differencein harvesting efficiency and market values of the products harvested.

372 POLICY IMPACT ON WOODLAND RESOURCE MANAGEMENT, USE AND CONSERVATION IN MOZAMBIQUE
(a) The commercial sectorFor the three study sites, the highest discounted net benefits to the commercial sectorwould be consistently obtained under the non-cooperative management regime, i.e.under an open access situation. Since the non-cooperative regime is the most beneficialto the commercial/private sector, the sector would not welcome governmentintervention or cooperation with government or local communities unless the intangiblebenefits and the penalties for non-compliance exceed the additional benefits emanatingfrom cooperation. The cooperative regime would be the second best option, followedby the command regime incorporating social concerns. Therefore if the aim is topromote private sector involvement in woodland management and use, then the openaccess (non-cooperative regime) situation or the status quo would be the mostappropriate approach to the private sector.
Table 2. Effect of management regime on discounted benefits from sale of woodlandproducts (‘000 US $)a
Study site Management regime Sector AllCommercial Household
Dondo Command with social 3578.95 (3) 410.33 (1) 3989.28 (3)
Command with 3227.31 (4) 21.45 (5) 3248.76 (4)
environment
Command with social 2877.04 (5) 272.77 (2) 3149.81 (5)
& environment
Cooperative 4206.65 (2) 228.65 (3) 4435.30 (2)
Non-cooperative 5752.07 (1) 87.59 (4) 5839.66 (1)
Nhamatanda Command with social 3069.08 (3) 180.53 (1) 3249.61 (3)
Command with 2471.97 (4) 0.18 (5) 2472.15 (4)
environment
Command with social 2267.12 (5) 113.93 (2) 2381.05 (5)
& environment
Cooperative 3440.88 (2) 84.12 (3) 3525.00 (2)
Non-cooperative 4543.65 (1) 44.99 (4) 4588.64 (1)
Gondola-Manica Command with social 5409.64 (3) 90.35 (1) 5499.99 (3)
Command with 4035.49 (5) 24.86 (4) 4060.35 (5)
environment
Command with social 4041.64 (4) 44.83 (3) 4086.47 (4)
& environment
Cooperative 5506.10 (2) 61.54 (2) 5567.64 (2)
Non-cooperative 6871.26 (1) 20.90 (5) 6892.16 (1)
a Fugures in parentheses are the rankings of the management regime in terms of benefits derivedby stakeholders

373G. Mlay, M. Falcao, I. Nhantumbo and G. Kowero
(b) The household sectorThe management regime that would lead to the highest discounted net benefits fromwoodland products to the household sector would be the command regime incorporatingsocial concerns. The benefits accruing to the household sector under this regime wouldbe more than 300% higher than those that would be obtained under the non-cooperativeregime or open access situation for the three sites. In the case of Dondo and Nhamatanda,the regulated regime incorporating social and environmental benefits would be thesecond best option, followed by the cooperative regime. For the Gondola-Manica site,the cooperative regime would be the second best alternative followed by the regulatedregime incorporating environmental benefits. The regulated option for environmentalreasons would be least beneficial to the household sector in Dondo and Nhamatandaand it would be second least beneficial in Gondola-Manica. The non-cooperativearrangement would be least attractive for communities in Gondola-Manica. Theconclusion is that if decision makers or rural planners put more weight on rural householdwelfare, then the command regimes (social and social + environmental concerns) appearto be the most appropriate management regimes for the woodlands, followed by thecooperative regime. The open access situation or status quo (non-cooperative regime)would appear to be very disadvantageous to local communities.
(c) The combined household and commercial sectorsFor both the household and commercial sectors, if the objective is to maximizediscounted net benefits from miombo wood products without considering theirdistribution between the two sectors, then the non-cooperative arrangement or statusquo would be most attractive in all three sites, followed by the cooperative and thencommand with social concerns regimes. The command management incorporating socialand environmental benefits would provide the least potential discounted net benefitsfrom miombo wood products in Dondo and Nhamatanda, while the command arrangementincorporating environmental benefits would be the least attractive management optionin Gondola-Manica.
However, since the bulk of the benefits flow into the commercial sector, thecombined total benefits for the two sectors follow the trend of the commercial sectorbenefits (Table 2). Decision makers would be advised, to the extent possible, to makesite-specific decisions on the management regimes. For example, it would appearthat in Nhamatanda and Gondola-Manica, where few forests remain, giving householdsmore weight than the commercial sector in forestry would be reasonable. This wouldthen lead to the recommendation of the command regime incorporating social concernsas being more appropriate. In Dondo, where forest resources abound, private/commercial sector initiatives alongside household welfare concerns could be promotedor given more weight than in Nhamatanda and Gondola-Manica. Under such a situationthe cooperative regime or command regime with social concerns would appear to bemore relevant. In both situations neither sector would realise the potential maximumbenefits dictated by the best management option, the non-cooperative regime or thestatus quo; one sector loses while the other gains, depending on the weight we attachto either of the two sectors.
(d) Combined agricultural and woodland benefitsIn terms of total household benefits (from miombo products and agriculture) the commandregime incorporating social concerns would be the best for all the three sites (Table 3).

374 POLICY IMPACT ON WOODLAND RESOURCE MANAGEMENT, USE AND CONSERVATION IN MOZAMBIQUE
In the case of Gondola-Manica, there was a switch in ranking between the commandarrangement incorporating environmental concerns and the non-cooperative arrangementwith the latter occupying the last position and the former occupying the fourth position.The Dondo site, which is more endowed with forest resources, has the highest netbenefits per capita while the Nhamatanda site, which has suffered most fromdeforestation, has the least net benefits per capita.
Table 3. Effect of management alternatives on household sector total benefits andannual total benefits per capitaa
Study site Management regime Total benefits in Annual per US $ ‘000 capita net
benefits US $
Dondo Command with social 13100.20 (1) 60.07 (1)Command with environment 12024.80 (5) 55.13 (5)Command with social &environment 12621.50 (2) 57.87 (2)Cooperative 12604.20 (3) 57.79 (3)Non-cooperative 12273.60 (4) 56.28 (4)
Nhamatanda Command with social 26193.50 (1) 38.94 (1)Command with environment 25739.70 (5) 38.26 (5)Command with social & environment 26004.80 (2) 38.66 (2)Cooperative 25975.30 (3) 38.61 (3)Non-cooperative 25879.30 (4) 38.47 (4)
Gondola-Manica Command with social 28298.20 (1) 39.52 (1)Command with environment 28136.30 (5) 39.29 (5)Command with social & environment 28167.00 (3) 39.33 (3)Cooperative 28231.90 (2) 39.42 (2)Non-cooperative 28148.50 (4) 39.31 (4)
a Fugures in parentheses are rankings of the management regime in terms of benefits derived bystakeholders.
The average volume harvested annually and potential for labour employment thatwould lead to maximum discounted benefits under each management arrangementexhibit trends corresponding to those of benefits derived from these products.
These results seem to suggest that the two regulated (command) managementarrangements that emphasise social and social plus environmental concerns (followedby the cooperative management regime) are potentially beneficial to local communitiesand the private sector. The failure by governments to guarantee a flow of such benefits(in the form of investment in economic and social infrastructure) to communities leavingin the proximities of forest resources has contributed to the poor performance ofcentral or local government regulated management regimes. Therefore,decentralization of forest resource management to local levels with in built mechanismsfor benefit sharing between the regulator (central or local government) and thecommunities has the potential to improve the welfare of the communities and thecondition of woodlands. Some central or local government influence is still possibleand desirable. This can be done through forestry extension agents who can raise andsustain in the local communities the awareness of the social and environmental valuesof the woodlands, thus facilitating their consideration in woodland management regimesthat the communities might eventually evolve.

375G. Mlay, M. Falcao, I. Nhantumbo and G. Kowero
The other alternative is a partnership arrangement between the commercial sectorand local communities (cooperative) in managing and harnessing forest resources inareas in the proximity to these communities. The current land law and forest and wild-life management policy provide a legal basis for putting such arrangements into practice.
4.1.2.2 Impact of different management regimes on forest resourcesIncomplete property rights, poor agricultural practices and policy failure in internalisingthe externalities arising from the exploitation of forest resources have contributed tohigh rates of deforestation and land degradation. The weak institutional capacity toenforce existing legislation on use of forest resources has led to their utilization underopen access. Table 4 presents a summary of the impact of different management regimeson the relative area of standing miombo and relative forest area converted to agricultureusing the non-cooperative management regime (status quo) as a reference. At thesteady state, the standing forest area at the end of the simulation period (relative tothat of the non-cooperative management regime) would be highest under the commandregime incorporating environmental concerns, followed by the command regimeincorporating social and environment benefits, cooperative regime, command regimeincorporating social benefits and lastly the non-cooperative regime. This trend is observedin all sites.
In all sites, the deforestation would be highest under open access (i.e. non-cooperative situation). At the end of simulation period only about 20% of the initialarea will remain forested in the Dondo site (which is currently the most forested of thethree sites), 26% in the Nhamatanda site and 25% in the Gondola-Manica site. As
Table 4. Relative area (in %) of standing miombo and that converted to agriculturea
Site Management regimes Relative area of Relative areastanding miombo converted to
agriculture
Dondo Command with social concern 141.19 (4) 385.06 (1)
Command with environment 193.85 (1) 10.02 (5)
Command with social & environment 175.03 (2) 221.06 (2)
Cooperative 151.10 (3) 202.74 (3)
Non-cooperative 100.00 (5) 100.00 (4)
Nhamatanda Command with social 147.70 (4) 318.79 (1)
Command with environment 175.90 (1) 0.28 (5)
Command with social & environment 174.16 (2) 187.92 (2)
Cooperative 148.87 (3) 159.42 (3)
Non-cooperative 100.00 (5) 100.00 (4)
Gondola-Manica Command with social 167.37 (4) 335.02 (1)
Command with environment. 201.81 (1) 52.37 (5)
Command with social & environment 195.32 (2) 82.95 (4)
Cooperative 168.34 (3) 225.23 (2)
Non-cooperative 100.00 (5) 100.00 (3)
a The non-cooperative arrangement is used as a base for comparison and the figures in parenthesisare rankings of the management regimes

376 POLICY IMPACT ON WOODLAND RESOURCE MANAGEMENT, USE AND CONSERVATION IN MOZAMBIQUE
expected, the regulated (command) system incorporating only environmental concernswould lead to least deforestation in all three sites, but it is the option least attractiveto the household and commercial sectors in terms of incomes/benefits.
In terms of benefits for both commercial and household sectors, the commandregimes incorporating social and environmental plus social concerns appearedfavourable, and they would also appear to be a reasonable choice when considerationis given to the relative area of standing miombo in the long term. However, with theexception of the command regime with environmental concerns, the other two variantsof the command regime (social and social + environment) would appear to be associatedwith relatively more area under woodlands converted to agriculture. But this is theprice or trade-off for improving overall household benefits.
4.1.2.3 Implications of alternative management regimesThe alternatives analysed for managing miombo woodland resources reflect either on-going practices or practices in the early stages of being introduced. The experience ofcentrally regulated regimes has not been effective in redressing deforestation andland degradation. Although governments have the obligation to defend society-wideinterests in natural resource conservation and use, experience shows that the policiesadopted and instruments used for their implementation have been ineffective. Thefact that social benefits implied by central government are not felt at grass-rootslevel gives an incentive for non-compliance, which in turn is facilitated by lack ofinstitutional and financial capacity for enforcement.
The fact that the regulated (command) management regimes (central or localgovernment) that take into account social needs or both social and environmental needsare potentially more beneficial to the household sector than when forests are exploitedas in open access, suggests that if these benefits were to flow to the local communities,non-compliance could be minimized. This can be guaranteed under decentralizedmanagement with local community participation but with clear definition of the benefitsharing arrangement. The cooperative arrangement that already has a legal support forproperty rights protection needs to be promoted. Though this was ranked as secondbest, it would appear to be the best management regime for all sites because it hasbetter potential than the command management regimes to allow for all the benefits toremain with the principal stakeholders the local communities and private sector.
4.2 Policy impact on stakeholders’ benefits, wood products harvestedand on the miombo woodlands under alternative managementregimes
In this section we analyse the potential impact of sectoral and extrasectoral policieson the benefits of stakeholders’ utilisation of woodland resources and the consequentimpact on the resource. The extrasectoral policies considered here are those thatinfluence agricultural performance, because of its central role in the livelihood andfood security of rural communities, and because that agricultural activities are one ofthe main causes of deforestation. The sectoral policies considered here are thoserelated to different types of fees charged for exploiting forest resources.
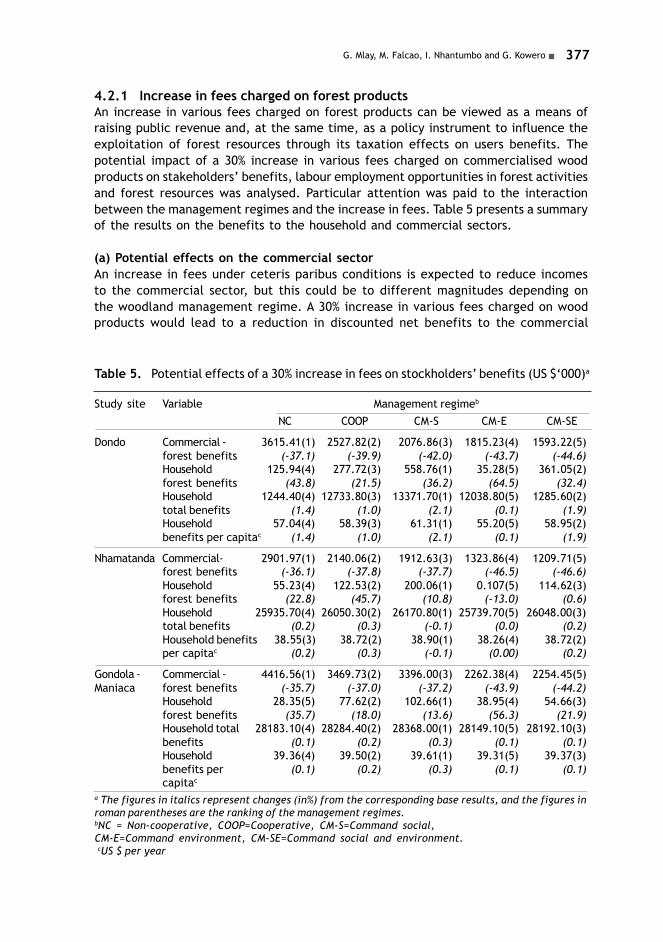
377G. Mlay, M. Falcao, I. Nhantumbo and G. Kowero
4.2.1 Increase in fees charged on forest productsAn increase in various fees charged on forest products can be viewed as a means ofraising public revenue and, at the same time, as a policy instrument to influence theexploitation of forest resources through its taxation effects on users benefits. Thepotential impact of a 30% increase in various fees charged on commercialised woodproducts on stakeholders’ benefits, labour employment opportunities in forest activitiesand forest resources was analysed. Particular attention was paid to the interactionbetween the management regimes and the increase in fees. Table 5 presents a summaryof the results on the benefits to the household and commercial sectors.
(a) Potential effects on the commercial sectorAn increase in fees under ceteris paribus conditions is expected to reduce incomesto the commercial sector, but this could be to different magnitudes depending onthe woodland management regime. A 30% increase in various fees charged on woodproducts would lead to a reduction in discounted net benefits to the commercial
Table 5. Potential effects of a 30% increase in fees on stockholders’ benefits (US $‘000)a
Study site Variable Management regimeb
NC COOP CM-S CM-E CM-SE
Dondo Commercial - 3615.41(1) 2527.82(2) 2076.86(3) 1815.23(4) 1593.22(5)forest benefits (-37.1) (-39.9) (-42.0) (-43.7) (-44.6)Household 125.94(4) 277.72(3) 558.76(1) 35.28(5) 361.05(2)forest benefits (43.8) (21.5) (36.2) (64.5) (32.4)Household 1244.40(4) 12733.80(3) 13371.70(1) 12038.80(5) 1285.60(2)total benefits (1.4) (1.0) (2.1) (0.1) (1.9)Household 57.04(4) 58.39(3) 61.31(1) 55.20(5) 58.95(2)benefits per capitac (1.4) (1.0) (2.1) (0.1) (1.9)
Nhamatanda Commercial- 2901.97(1) 2140.06(2) 1912.63(3) 1323.86(4) 1209.71(5)forest benefits (-36.1) (-37.8) (-37.7) (-46.5) (-46.6)Household 55.23(4) 122.53(2) 200.06(1) 0.107(5) 114.62(3)forest benefits (22.8) (45.7) (10.8) (-13.0) (0.6)Household 25935.70(4) 26050.30(2) 26170.80(1) 25739.70(5) 26048.00(3)total benefits (0.2) (0.3) (-0.1) (0.0) (0.2)Household benefits 38.55(3) 38.72(2) 38.90(1) 38.26(4) 38.72(2)per capitac (0.2) (0.3) (-0.1) (0.00) (0.2)
Gondola - Commercial - 4416.56(1) 3469.73(2) 3396.00(3) 2262.38(4) 2254.45(5)Maniaca forest benefits (-35.7) (-37.0) (-37.2) (-43.9) (-44.2)
Household 28.35(5) 77.62(2) 102.66(1) 38.95(4) 54.66(3)forest benefits (35.7) (18.0) (13.6) (56.3) (21.9)Household total 28183.10(4) 28284.40(2) 28368.00(1) 28149.10(5) 28192.10(3)benefits (0.1) (0.2) (0.3) (0.1) (0.1)Household 39.36(4) 39.50(2) 39.61(1) 39.31(5) 39.37(3)benefits per (0.1) (0.2) (0.3) (0.1) (0.1)capitac
a The figures in italics represent changes (in%) from the corresponding base results, and the figures inroman parentheses are the ranking of the management regimes.bNC = Non-cooperative, COOP=Cooperative, CM-S=Command social,CM-E=Command environment, CM-SE=Command social and environment. cUS $ per year

378 POLICY IMPACT ON WOODLAND RESOURCE MANAGEMENT, USE AND CONSERVATION IN MOZAMBIQUE
sector of more than 35% under all management regimes. The largest reduction isobserved under the command regime with environmental and social concerns, wherethe discounted net benefits relative to base scenario would be reduced by 45% inDondo, 47% in Nhamatanda and 44% in Gondola-Manica. These results conform to apriori expectations since the social concern component is in favour of the householdsector, meaning that in addition to the restriction on harvesting implied by takingup environmental concerns, the commercial sector is indirectly penalised by thesocial consideration that favours free access to the woodlands by the householdsector for its needs. The discounted net benefits would appear to be least sensitive(smallest reduction relative to base results) to fees increase under the non-cooperativeregime. However, the net benefits in relation to base results would be reduced by37% in Dondo and 36% in both Nhamatanda and Gondola-Manica. This would implythat an open access situation would be conducive to increased harvesting andcommercialisation to offset/contain the loss in volume of revenue due to an increasein royalty fees. Comparing the discounted net benefits under alternative managementoptions the same ranking is maintained as in Table 2 (basic results) in the case ofDondo and Nhamatanda. The results therefore indicate that the commercial sectorbenefits would be very sensitive to modest changes in royalty charges and that thenon-cooperative regime (an open access situation) followed by the cooperative regimewould offer the best opportunities to cushion some of this impact through increasedharvesting.
(b) Potential effects on household sector forest benefitsThe imposition of royalty fees without an increase in the sales price of forest productsis expected to reduce commercial harvesting of the woodlands, thus releasing labourthat could possibly be engaged in agriculture and increase household benefits (Table6). The results for the Dondo and Gondola-Manica sites show an increase in discountedtotal household benefits under all management arrangements (Table 5) as comparedto basic results (Table 2). In Nhamatanda, all but the command regime with environmentalconcerns show an increase in total household benefits relative to the base results,with the highest values being attained under a cooperative regime. The same trendis maintained with respect to discounted net forest benefits that would increaseappreciably, but from the insignificant changes in total household benefits this meansthat in value terms the forest benefits are relatively small. The observed increase inhousehold discounted net forest benefits from miombo activities would be obtainedas a by-product of land conversion to agriculture (agriculture becomes relatively morebeneficial than miombo activities) through the sale of forest products harvestedfrom the converted land. More labour would be available for household activities dueto a decline in demand by the commercial sector as indicated in Table 6.
When the management regimes are compared after an increase in royalty fees, thesame ranking as in the base scenario is maintained in terms of discounted forest benefitsto the household sector in all sites. This would imply that a royalty fee increase policywould not influence the relative suitability of the five management regimes in thethree sites when the development goal is to sustain or increase household benefits.The best forest management regime per site, as indicated by the base results, couldtherefore continue to be maintained under such circumstances.

379G. Mlay, M. Falcao, I. Nhantumbo and G. Kowero
(c) Potential impact on combined agricultural and woodland benefits to household sectorThe overall potential impact of royalty fee increase on total household benefits fromagriculture and forest activities appears to be small, less than 0.5% for both Nhamatandaand Gondola-Manica and between 1 and 2% for Dondo (Table 5). The substitution effectsresulting from changes in relative net prices can explain this apparent lack of sensitivity.The benefits from crops on the expanded agricultural land coupled with benefits derivedfrom miombo products harvested and sold from the converted land would be more thansufficient to compensate for the modest increase in royalty fees charged on anycommercialised forest product. This result implies that the royalty fees charged are toolow to affect the total household income. Again, the relative ranking of the managementregimes in terms of discounted total household benefits has been maintained as in thebasic results. In all sites the command regime incorporating social concerns continuesto have the highest potential total household benefits.
d) Potential impact on labour employment and on woodland resourcesAn increase in fees has the potential to reduce labour employment by the commercialsector under all management regimes because commercial harvesting would becomeless profitable. However, the degree of responsiveness in the reduction of labouremployment potential would be dependent on the forest management regime. As itcan be seen in Table 6, the largest reduction in labour employment potential forcommercial activities relative to basic results would be achieved under the commandmanagement regime that emphasizes social and environmental concerns in Dondoand Gondola-Manica and the command management regime that emphasizesenvironmental concerns in Nhamatanda. The least reduction would be achieved underthe cooperative management regime in Dondo and the command management regimewith social concerns in Nhamatanda and Gondola-Manica.
When the management regimes are compared, in terms of their ranking, withthe base results, Dondo and Gondola-Manica maintain the same rankings. For theNhamatanda site, a switch in ranking occurs between the command-social and command-social-environment management regimes.
Labour employment behaviour in the household sector when fees for woodlandproducts are increased would appear to be opposite to that of the commercial sector,with the exception of the command-environment regime in the Nhamatanda site. Asexplained earlier, the potential for increased profitability of agriculture relative toforest activities would create a demand for more labour for land conversion toagriculture. This labour would be withdrawn from the less profitable commercial sector.As in the case of commercial labour employment, the degree of responsiveness to afees increase would be dependent on the forest management regime and study sites.When the management regimes are ranked in terms of the level of labour employmentpotential by the household sector, Dondo and Gondola-Manica maintain the samerankings, in which the command management regime that provides for environmentalconcerns would appear to have the highest potential for labour employment (i.e. wouldrelease most labour), followed by the non-cooperative management regime. In thecase of the Nhamatanda site, the cooperative management regime would have thehighest potential, followed by the non-cooperative management regime.
An increase in fees has often been argued to have potential to promote forest orbiodiversity conservation. The impact of increased fees on biodiversity conservationwould be most pronounced under the two command management regimes that

380 POLICY IMPACT ON WOODLAND RESOURCE MANAGEMENT, USE AND CONSERVATION IN MOZAMBIQUE
incorporate environmental concerns in all sites (Table 6), as seen from the proportionof woodland stock left standing at the end of the simulation. These managementoptions would lead to the highest area of standing miombo woodlands in all sites atthe end of the simulation period. However, in both Nhamatanda and Gondola-Manicathe non-cooperative regime would also lead to the same conclusion, apparently fromthe reducing pressure now experienced on these resources. The forest royalty feeincrease would be least effective in mitigating deforestation under the cooperativeregime and the command with social concerns regime in all three sites. These resultsseem to suggest that the management options that will minimize conflicts betweenmultiple objectives will be between these two extremes.
4.2.2. An increase in agricultural output prices by 25% and 75%Policies leading to an increase in agricultural output prices are intended to stimulateimprovement in agricultural production and consequently improve rural incomes andfood security. The impact of price increases on agricultural production will be constrainedby the resources and production technologies, at least in the short run.
Table 6. Potential effects of a 30% increase in fees on labour employment and woodlandconservationa
Study site Variable Management regimeb
NC COOP CM-S CM-E CM-SE
Dondo Commercial forest 0.481(1) 0.294(2) 0.201(3) 0.167(4) 0.129(5)labour (Proportion) (-15.2) (-13.3) (-17.6) (-31.1) (-32.5)Household forest 0.110(4) 0.132(3) 0.320(1) 0.005(5) 0.134(2)labour (proportion) (25.9) (16.8) (17.7) (54.3) (25.2)Standing miombo 24.17(5) 32.71(3) 29.58(4) 46.89(1) 43.64(2)woodlands (17.4) (5.1) (1.7) (17.4) (21.6)(% of initial area)
Nhamatanda Commercial 0.440(1) 0.290(2) 0.233(3) 0.012(5) 0.107(4)forest labour (-10.2) (-9.4) (-7.2) (-93.5) (-33.95)(Proportion)Household 0.104(4) 0.126(2) 0.257(1) 0.000(5) 0.108(3)forest labour (15.7) (22.3) (8.9) (-0.35) (4.9)(Proportion)Standing miombo 29.37(5) 44.83(2) 39.23(4) 50.45(1) 44.65(3)woodlands (14.2) (5.9) (3.3) (11.51) (12.02)(% of initial area)
Gondola- Commercial forest 0.606(1) 0.403(2) 0.386(3) 0.188(4) 0.185(5)Manica labour (Proportion) (-13.9) (-12.2) (-12.1) (-32.6) (-33.2)
Household 0.095(4) 0.113(2) 0.185(1) 0.018(5) 0.103(3)forest labour (14.7) (11.9) (10.8) (26.8) (11.7)(Proportion)Standing miombo 22.75(5) 35.12(3) 34.66(4) 54.04(1) 45.02(2)woodlands (25.7) (15.3) (14.4) (23.3) (27.3)(% of initial area)
a The figures in italics represent changes in% from the corresponding base results, and the figures inroman parentheses are the ranking of the management regimes.b NC = Non-cooperative, COOP=Cooperative, CM-S=Command social, CM-E=Command environment,CM-SE=Command social and environment.

381G. Mlay, M. Falcao, I. Nhantumbo and G. Kowero
(a) Potential effects on stakeholders’ benefitsThe results on the potential effects of an increase in agricultural/crop output priceson stakeholders’ benefits are presented in Tables 7 and 8. When agricultural pricesincrease, keeping other factors constant, forest activities will become less profitablerelative to agriculture, causing a shift of more labour to agriculture. It is thereforeexpected that the benefits to the commercial sector will decline. In the case of thehousehold sector, benefits from forest activities can actually increase as a result ofthe revenue obtained from the sale of wood products obtained in the process of landconversion to agriculture. However, our results show that the theoretical predictionsare not always achieved, since these are constrained by initial land productivity andforest endowment (which are site specific) and forest management regime. The initialland productivity and forest endowment will influence the level of price changes atwhich a switch from forest activities to agriculture would occur.
Further, in this and other sections caution should be exercised in interpreting themagnitudes of percentage changes that might appear to be very high or very small,because these changes are related to the initial conditions. For example, an increase inbenefits from US$1 to US$2 would represent a very big percentage change while in realmonetary values the change would appear small, while a benefit change from US$100 toUS$110 will represent a small percentage change but a higher monetary value change.
(i) Potential impact on commercial sector benefitsThe commercial sector forest benefits would appear to be insensitive to increases inagricultural prices by 25% and 75%. At the 25% crop output price increase the changesin commercial forest benefits in relation to the base scenario would be less than 1% inall study sites and under all management regimes (Table 7). The highest change at the75% crop output price increase would be achieved in Dondo under the command-environment management regime with a 4.28% decline in benefits relative to the thosein the base results (Table 8).
The results also show a mixed effect (indeterminate) of price increase on benefits,depending on substitution effects resulting from changes in relative net prices, thegoal of each management regime, and site specific initial conditions. For example, inDondo, an increase in commercial forest benefits is predicted under the non-cooperativemanagement regime and a decline is also predicted in all other regimes when there isa 25% crop output price increase. When the crop output price is increased to 75%, adecline is predicted under all management regimes. In the case of Nhamatanda, atthe 25% crop output price increase commercial forest benefits are predicted to go upunder the non-cooperative, cooperative and command-social regimes and would declineunder the command-environment and command-social-environment regimes. At the75% crop output price increase, the benefits under the cooperative regime woulddecline while the other management regimes would maintain the same pattern observedunder 25% crop output price increase. Similar results are also observed for the Gondola-Manica site.
With 25 and 75% crop output price increases the ranking of the forest managementregimes in terms of potential to improve commercial sector benefits appears to remainthe same as in the base results in all study sites. The non-cooperative managementregime continues to be the most profitable in all sites, while the command regime withenvironment and the command with social concerns would be least in all sites

382 POLICY IMPACT ON WOODLAND RESOURCE MANAGEMENT, USE AND CONSERVATION IN MOZAMBIQUE
Table 7. Potential effects of a 25% increase in crop output prices on stakeholder’s benefits
(US $ ‘000)a
Study site Variable Management regimeb
NC COOP CM-S CM-E CM-SE
Dondo Commercial 5758.77(1) 4185.18(2) 3563.07(3) 3212.10(4) 2859.38(5)forest benefits (0.1) (-0.5) (-0.4) (-0.5) (-0.6)Household 90.28(4) 235.86(3) 433.14(1) 27.80(5) 283.35(2)forest benefits (3.1) (3.2) (5.6) (29.6) (3.9)Household 12823.0(4) 13169.6(3) 13701.7(1) 12568.0(5) 13191.8(2)total benefits (4.5) (4.5) (4.6) (4.5) (4.5)Household 58.79(4) 60.38(3) 62.82(1) 57.62(5) 60.49(2)total benefits (4.5) (4.5) (4.6) (4.5) (4.5)per capitac
Nhamatanda Commercial 4557.46(1) 3443.53(2) 3075.87(3) 2459.45(4) 2265.78(5)forest benefits (0.3) (0.1) (0.2) (-0.6) (-0.1)Household 39.58(4) 86.96(3) 182.75(1) 1.77(5) 123.57(2)forest benefits (-12.0) (3.4) (1.2) (1173.4) (8.5)Household 34109.2(4) 34248.6(3) 34523.4(1) 33945.5(5) 34291.0(2)total benefits (4)(31.8) (31.9) (31.8) (31.9) (31.9)Household total 50.70(4) 50.91(3) 51.32(1) 50.46(5) 50.98(2)benefits (31.8) (31.9) (31.8) (31.9) (31.9)per capitac
Gondola – Commercial 6875.17(1) 5505.90(2) 5409.37(3) 4030.03(5) 4048.49(4)Maniaca forest benefits (0.1) (-0.0) (-0.0) (-0.1) (0.2)
Household 12.23(5) 60.33(2) 87.14(1) 25.48(4) 36.46(3)forest benefits (-41.5) (-2.0) (-3.5) (2.5) (-18.7)Household 35228.9(4) 35341.6(2) 35421.0(1) 35224.8(5) 35249.6(3)total benefits (25.2) (25.2) (25.2) (25.2) (25.2)Household 49.20(4) 49.35(2) 49.46(1) 49.19(5) 49.22(3)total benefits (25.2) (25.2) (25.2) (25.2) (25.2) per capitac
a The figures in italics represent changes in% from the corresponding base results, and the figuresin roman parentheses are the ranking of the management regimes.b NC = Non-cooperative, COOP=Cooperative, CM-S=Command Social, CM-E=Command Environment,CM-SE=Command social and environment.c US $ per year
(ii) Potential impact on household sector benefitsIncreasing agricultural output prices by 25 and 75% would increase household discountednet forest benefits under all forest management regimes in Dondo, while in Nhamatanda adecline would be realized under the non-cooperative management regime. There wouldbe a decline in Gondola-Manica under all forest management regimes except under thecommand regime incorporating environmental/biodiversity concerns (Tables 7 and 8).However, the overall impact of a 25% crop output price increase on annual total benefitsper capita in the household sector would be positive, ranging from slightly above 4% inDondo, to 25% in Manica-Gondola and 32% in Nhamatanda, with small differences betweenforest management regimes (Table 7). On the other hand the potential effect of a 75%crop output price increase on total benefits per capita in the household would be large,ranging from 47% in Dondo to 75% in Gondola-Manica and 85% in Nhamatanda, withminor differences between forest management regimes within a study site (Table 8).

383G. Mlay, M. Falcao, I. Nhantumbo and G. Kowero
As explained earlier the increase in household forest benefits resulting from cropoutput price increases would result from sale of forest products obtained when convertingthe forest to cropland (Tables 9 and 10). Such forest benefits would be higher at the 75%than at the 25% crop output price increase, probably because with a 75% crop outputprice increase more forest land would be converted to cropland (Table 10), a processthat would be accompanied by more saleable forest products from the converted land.
The ranking of the forest management regimes in relation to household forestbenefits has been maintained as in the base results in all sites. The same appears true inthe case of total household benefits from agriculture and forest activities, with theexception of Gondola-Manica, where a switch occurs between non-cooperative andcommand-environment. The implication could be that the relative suitability of theforest management regimes to individual sites does not appear to be sensitive to orinfluenced by fairly significant rises in crop output price.
Table 8. Potential effects of a 75% increase in crop output prices on stakeholders’ benefits
(US $ ‘000)a
Study site Variable Management regimeb
NC COOP CM-S CM-E CM-SE
Dondo Commercial 5737.33 (1) 4134.24(2) 3551.57(3) 3089.05(4) 2797.29(5)forest benefits (-0.26) (-1.73) (-0.77) (-4.28) (-2.77)Household forest 107.98(4) 295.45(3) 522.28(1) 79.06(5) 370.87(2)benefits (23.28) (29.21) (27.23) (268.58) (35.96)Household total 17968.0(4) 18483.6(3) 19224.7(1) 17668.3(5) 18549.7(2)benefits (46.40) (46.65) (46.75) (46.65) (46.97)Household total 82.38(4) 84.75(3) 88.15(1) 81.01(5) 85.05(2)benefits per capitac (46.40) (46.65) (46.75) (46.65) (46.97)
Nhamatanda Commercial forest 4560.64(1) 3440.52(2) 3087.43(3) 2432.82(4) 2258.62(5)benefits (0.37) (-0.01) (0.60) (-1.65) (-0.37)Household forest 41.29(4) 96.81(3) 199.51(1) 7.71(5) 148.04(2)benefits (-8.22) (15.01) (10.51) (5446.86) (29.94)Household total 47744.1(4) 47949.3(3) 48328.5(1) 47528.9(5) 48026.0(2)benefits (84.49) (84.60) (84.51) (84.65) (84.68)Household total 70.97(4) 71.28(3) 71.84(1) 70.65(5) 71.39(2)benefits per capitac (84.49) (84.60) (84.51) (84.65) (84.68)
Gondola— Commercial 6880.9(1) 5515.16(2) 5414.7(3) 4022.45(5) 4047.54(4)Maniaca forest benefits (0.14) (0.16) (0.09) (-0.32) (0.15)
Household 5.02(5) 60.55(2) 86.95(1) 29.62(4) 40.49(3)forest benefits (-75.98) (-1.61) (-3.76) (19.15) (-9.68)Household 49307.4(5) 49473.8(2) 49587.4(1) 49317.3(4) 49406.0(3)total benefits (75.17) (75.23) (75.23) (75.28) (75.40)Household total 68.86(5) 69.09(2) 69.25(1) 68.87(4) 68.99(3)benefits per capitac (75.17) (75.23) (75.23) (75.28) (75.40)
a The figures in italics represent changes in% from the corresponding base results, and the figures in romanparentheses are the ranking of the management regimes.b NC = Non-cooperative, COOP=Cooperative, CM-S=Command Social, CM-E=Command environment,CM-SE=Command social and environment.c US $ per year

384 POLICY IMPACT ON WOODLAND RESOURCE MANAGEMENT, USE AND CONSERVATION IN MOZAMBIQUE
(b) Potential effects on forest or biodiversity conservationTable 9 shows that a 25% crop output price increase would have an insignificant effecton the area of standing miombo at the end of the simulation period in all three siteswhen compared to base results. The results are mixed, with both decreases and increasesin deforestation. For example, in Dondo, a small decline relative to the base results(less than 1%) is observed under non-cooperative, command with environmental/biodiversity concern, and command with social concern management regimes. A potentialincrease in deforestation of less than 1% is indicated in Gondola-Manica under allmanagement regimes.
When the management regimes are ranked in terms of the percentage of standingmiombo at the end of the simulation period, the command regime with environmentalconcerns occupies the first position and the non-cooperative regime occupies the last
Table 9. Potential effects of a 25% increase in crop output prices on woodland conservationa
Study site Variable Management regimeb
NC COOP CM-S CM-E CM-SE
Dondo Commercial 0.570(1) 0.335(2) 0.243(3) 0.227(4) 0.190(5)forest labour (0.5) (-1.2) (-0.4) (-0.4) (-0.5)Proportion)Household 0.089(4) 0.112(2) 0.274(1) 0.004(5) 0.108(3)forest labour (1.3) (-0.9) (0.7) (27.3) (0.9)(Proportion)Standing 20.46(5) 31.22(3) 29.12(4) 39.82(1) 35.93(2)miombo (-0.6) (0.3) (0.2) (-0.2) (-0.3)(% of initial forest area)Land converted 29.09(4) 58.80(3) 113.25(1) 3.70(5) 64.70(2)to agriculture (ha) (2.3) (2.0) (3.4) (29.8) (2.9)
Nhamatanda Commercial forest 0.492(1) 0.321(2) 0.253(3) 0.186(4) 0.162(5)labour (proportion) (0.4) (0.3) (0.8) (-0.5) (0.0)Household forest 0.078(4) 0.099(3) 0.230(1) 0.000(5) 0.103(2)labour (Proportion) (-12.5) (-4.0) (-2.5) (1191.8) (0.0)Standing miombo 25.98(5) 38.35(3) 38.05(4) 45.17(1) 44.78(2)(% of initial (1.0) (0.2) (0.2) (-0.2) (0.0)forest area)Land converted 18.09(4) 31.33(3) 63.38(1) 0.29(5) 38.25(2)to agriculture (ha) (0.3) (8.9) (10.2) (545.9) (12.8)
Gondola- Commercial 0.700(1) 0.460(2) 0.440(3) 0.278(4) 0.277(5)Manica forest labour (-0.6) (0.2) (0.2) (-0.4) (0.0)
(Proportion)Household 0.070(4) 0.099(2) 0.164(1) 0.014(5) 0.088(3)forest labour (-15.4) (-2.4) (-1.8) (-1.4) (-4.9)(Proportion)Standing miombo 18.25(5) 30.52(3) 30.33(4) 36.59(1) 35.43(2)(% of initial forest area) (0.8) (0.2) (0.1) (0.2) (0.2)Land converted 9.82(3) 24.80(2) 37.01(1) 5.78(5) 8.87(4)to agriculture (ha) (-0.9) (11.1) (11.5) (11.4) (7.9)
a The figures in italics represent changes in% from the corresponding base results, and the figuresin roman parentheses are the ranking of the management regimes.b NC = Non-cooperative, COOP=Cooperative, CM-S=Command social, CM-E=Command environment,CM-SE=Command social and environment.

385G. Mlay, M. Falcao, I. Nhantumbo and G. Kowero
position in all three sites. Nhamatanda and Gondola-Manica have maintained the samerankings as in the base run results.
Producer price increase appears to have the potential to promote forest conversionto agriculture under all management regimes in all three sites except under the non-cooperative regime in Gondola-Manica, where a small decline (less than 1%) is observedin relation to base results, implying that the crop output price increase would notnecessarily be accompanied by an increase in deforestation. The response to priceincrease, in percentage terms, in forest conversion to agriculture is more pronouncedunder the command regime incorporating environmental benefits in the case of Dondoand Nhamatanda (29.8% and 545.9% respectively, relative to base results) and the non-cooperative regime in Gondola Manica (36% relative to base results). However, in absoluteterms, the land area values involved would be very small despite the extremely highpercentage changes associated with some management regimes in the tables, and thisis also influenced by the initial conditions. Also, the physical area converted to croplandwould be higher under the command management regime with social concerns while thecommand regime with environmental/biodiversity concerns hold potential for least forestarea conversion. The model’s prediction conforms to Barbier’s (2000) observation thatin low input agriculture, an increase in output prices will promote area expansion insteadof intensification, at least in the short run. Although land conversion has beendemonstrated to be responsive to modest price increase, its impact on deforestationwould be insignificant largely because the areas involved are small, reflecting the lowefficiency implicit in the hand tools used for forest conversion as well as, probably,inadequate adult male labour in the household. Normally men undertake the laborioustask of clearing forests when opening new farms.
The impact of a 75% increase in producer price has maintained the same trend ofdeforestation observed under a 25% price increase (Table 10) in all sites and under allforest management regimes. The rate of deforestation under all forest managementregimes has maintained its insensitivity to price changes, from the 25% to the 75%producer price increase. Much as forest conversion to agriculture shows a largepercentage increase in comparison to the base results, in absolute terms the changein actual forest area converted to cropland would be small. Again, adult labour andtechnological constraints would indicate that the response of area converted toagriculture as a result of price increase has little impact on deforestation.
When the management regimes are ranked in terms of the area of standing forestat the end of the simulation period, the command-environment regime occupies thefirst position, while the non-cooperative regime (implicit of status quo) occupies thelast position in all study sites. The results suggest that a compromise between conservationand profit will be found between these two extreme management regimes.
When the alternative forest management regimes are compared with the currentpractice (non-cooperative regime), they all appear to be better alternatives for forestresource conservation.
If the policy objective is also to improve the forest benefits of rural households,the command regime incorporating social concerns, the command regime incorporatingboth social and environmental concerns and the cooperative management regimeconstitute the best three forest management regimes for the study areas. It thereforeappears that the government, as well as the local communities, have important roles toplay in managing these resources, and that the advocacy on government devolution ofmanagement of these resources to local communities might not be appropriate to allnatural forests.

386 POLICY IMPACT ON WOODLAND RESOURCE MANAGEMENT, USE AND CONSERVATION IN MOZAMBIQUE
4.2.3 Impact of an increase in crop yields by 25% and 75%Modest crop yield increases of 25% through improved agronomic practices appear tohave the potential to improve total household benefits per capita in all study sites andunder all management regimes (Table 11).
This improvement in benefits would be accompanied by increased forest conversionto agriculture in all sites and under all management regimes (Table 12). An exception isobserved in the case of the cooperative model in Nhamatanda, where a 5% decline inland conversion to agriculture is predicted. A reduction of about 2% is also observed inGondola-Manica under the non-cooperative regime. The modest increase in crop yield(or reduction in post-harvest crop losses) would not be sufficient to cover householdconsumption and income needs, hence the continued increase in deforestation orforest conversion into cropland.
Table 10. Potential effects of a 75% increase in crop output prices on labour employmentand woodland conservationa
Study site Variable Management regimeb
NC COOP CM-S CM-E CM-SE
Dondo Commercial forest 0.563(1) 0.332(2) 0.243(3) 0.218(4) 0.185(5)labour (Proportion) (-0.70) (-2.06) (-0.41) (-4.39) (-3.14)Household forest 0.084(4) 0.113(3) 0.271(1) 0.011(5) 0.119(2)labour (Proportion) (-3.43) (0.0) (-0.39) (258.73) (11.22)Standing miombo 20.7(5) 30.8(3) 29.0(4) 39.1(1) 35.5(2)woodlands (0.50) (-1.03) (-0.40) (-2.16) (-1.45)(% of initial forest area)Land converted 32.7(4) 67.4(3) 128.3(1) 10.1(5) 78.68(2)to agriculture (ha) (14.987) (16.89) (17.13) (254.03) (25.15)
Nhamatanda Commercial forest 0.497 0.321(2) 0.255(3) 0.181(4) 0.162(5)labour (Proportion) (1)(1.43) (0.32) (1.59) (-3.21) (0.0)Household 0.070(4) 0.094(3) 0.224(1) 0.002(5) 0.107(2)forest labour (-22.12) (-8.45) (-5.10) (6787.2) (3.88)(Proportion)Standing miombo 26.1(5) 38.5(3) 38.0(4) 45.0(1) 44.7(2)woodlands (1.37) (0.5) (-0.08) (-0.53) (-0.13)(% of initial forest area)Land converted 18.7(4) 34.01(3) 69.6(1) 1.2(5) 44.19(2)to agriculture (ha) (3.60) (18.25) (20.97) (2461.25) (30.35)
Gondola- Commercial 0.706(1) 0.461(2) 0.441(3) 0.278(3) 0.277(5)Manica forest labour (0.28) (0.43) (0.46) (-0.36) (0.0)
(Proportion)Household 0.056(4) 0.095(2) 0.160(1) 0.015(5) 0.087(3)forest labour (-32.08) (-6.44) (-4.19) (7.25) (-5.53)(Proportion)Standing miombo 18.3(5) 30.5(3) 30.3(4) 36.5(1) 35.4(2)woodlands (1.16) (0.12) (0.07) (0.02) (0.26)(% of initial forest area)Land converted 9.65(4) 28.02(2) 42.5(1) 7.2(5) 19.9(3)to agriculture (ha) (-2.62) (25.53) (28.04) (39.11) (142.1)
a The figures in italics represent changes in% from the corresponding base results, and the figuresin roman parentheses are the ranking of the management regimes.bNC = Non-cooperative, COOP=Cooperative, CM-S=Command social, CM-E=Command environment,CM-SE=Command social and environment.

387G. Mlay, M. Falcao, I. Nhantumbo and G. Kowero
Table 11. Potential effects of a 25% increase in crop yields on stakeholders’ benefits(US $ ‘000)
Study site Variable Management regimeb
NC COOP CM-S CM-E CM-SE
Dondo Commercial 5743.69(1) 4160.07(2) 3556.73(3) 3138.99(4) 2829.02(5)forest benefits (-0.1) (-1.1) (-0.6) (-2.7) (-1.7)Household 103.13(4) 271.29(3) 483.37(1) 55.82(5) 333.26(2)forest benefits (17.7) (18.7) (17.8) (59.3) (22.2)Household 15625.6(4) 16062.3 16706.8(1) 15337.9(5) 16104.0(2)total benefits (27.3) (3)(27.4) (27.5) (27.6) (27.6)Household total 71.64(4) 73.65(3) 76.60(1) 70.33(5) 73.84(2)benefits per capitac (27.3) (27.4) (27.5) (27.6) (27.6)
Nhamatanda Commercial 4557.78(1) 3459.26(2) 3078.67(3) 2457.85(4) 2265.26(5)forest benefits (0.3) (0.5) (0.3) (-0.6) (-0.1)Household 40.5(4) 68.97(3) 183.39(1) 2.23(5) 124.78(2)forest benefits (-10.0) (-18.0) (1.6) (1504.3) (9.5)Household 34851.7(4) 34944.7(3) 35272.0(1) 34683.1(5) 35036.2(2)total benefits (34.7) (34.5) (34.6) (34.8) (34.7)Household 51.81(4) 51.95(3) 52.43(1) 51.56(5) 52.08(2)total benefits (34.7) (34.5) (34.6) (34.8) (34.7)per capitac
Gondola- Commercial 6881.22(1) 5506.13(2) 5409.2(3) 4029.18(5) 4044.52(4)Maniaca forest benefits (0.1) (0.0) (-0.0) (-0.2) (0.1)
Household 12.09(5) 62.31(2) 87.06(1) 25.35(4) 36.43(3)forest benefits (-42.1) (1.3) (-3.6) (2.0) (-18.7)Household 35165.7(4) 35283.5(2) 35357.7(1) 35161.9(5) 35186.5(3)total benefits (24.9) (25.0) (25.0) (25.0) (24.9)Household total 49.11(4) 49.27 49.38 49.10 49.14benefits (24.9) (25.0) (25.0) (25.0) (24.9) per capitac
a The figures in italics represent changes in% from the corresponding base results, and the figures inroman parentheses are the ranking of the management regimes.bNC = Non-cooperative, COOP=Cooperative, CM-S=Command social, CM-E=Command environment,CM-SE=Command social and environment.cUS $ per year
On the other hand, a 75% yield increase would reduce forest conversion to agriculturein Gondola-Manica site under all management regimes (Table 14). In the case of Dondo,land conversion to agriculture would increase under all management regimes, althoughthe increase is smaller than at the 25% price increase with the exception of the threecommand regimes, which show an increase in forest conversion to agriculture of 12.2%,157%, 16.4% respectively in comparison to the basic scenario. The results indicate thatfor the Dondo and Gondola-Manica sites, a high yield increase in agriculture has thepotential to reduce deforestation through land conversion to agriculture. In the case ofNhamatanda, land conversion to agriculture declines by 6.2% under the non-cooperativeregime and increases under the remaining management regimes (Table 14).
Total household net benefits per capita per year would improve significantly in allsites and under all management regimes in comparison with the base results (Table 13).The improvement in net benefits would range from about 64% in Dondo to slightly above100% in Nhamatanda. A big improvement in crop yields would appear to significantly

388 POLICY IMPACT ON WOODLAND RESOURCE MANAGEMENT, USE AND CONSERVATION IN MOZAMBIQUE
increase household food self sufficiency and incomes to the extent that demand fornew cropland (excised from the woodlands) would decline, resulting in a decreasedrate of forest conversion to cropland.
At 25% and 75% crop yield improvements, the effect on commercial forest benefitswould be insignificant (Table 11) largely because of insignificant labour mobility betweencommercial and household consumption activities. However, the results on householdforest benefits would be significant and direction of change indeterminate (Table11).
In terms of the well-being of rural households, the command regime withenvironmental concern is the only option that would leave the households worse off inrelation to the current management practice (open access), with the command regimewith social concerns as the best. It would appear than crop yields would have toincrease considerably before conversion of woodlands to cropland could be reversed.Only in Gondola-Manica and with crop yields of 75% could forest conversion be reversed(and under all the five management regimes); the other sites would probably needhigher crop yields for woodland conversion to stop. These results suggest that policy
Table 12. Potential effects of a 25% increase in crop yields on employment and woodlandconservationa
Study sites Variable Management regimeb
NC COOP CM-S CM-E CM-SE
Dondo Commercial 0.585(1) 0.335(2) 0.242(3) 0.221(4) 0.187(5)forest labour(Proportion) (-0.3) (-1.2) (-0.8) (-3.1) (-2.1)Household forest 0.087(4) 0.114(3) 0.273(1) 0.008(5) 0.115(2)labour (proportion) (-0.3) (0.9) (0.4) (58.4) (7.5)Standing miombo 20.6(5) 30.8(3) 29.0(4) 39.4(1) 35.6(2)woodlands (0.2) (1.0) (-0.1) (-1.3) (-1.3)(% of initial forest area)Land converted 31.58(4) 64.26(3) 122.47(1) 7.22(5) 72.94(2)to agriculture (ha) (11.0) (11.5) (11.8) (53.3) (16.0)
Nhamatanda Commercial 0.495(1) 0.322(2) 0.253(3) 0.186(4) 0.162(5)forest labour (1.0) (0.8) (0.8) (-0.5) (0.0)Household 0.079(4) 0.097(3) 0.230(1) +0.000(5) 0.103(2)forest labour (-11.7) (-5.9) (-2.5) (1573.2) (0.0)Standing miombo 25.9(5) 38.5(3) 38.0(4) 45.2(1) 44.8(2)woodlands (0.7) 0.4(3) (+0.0) (-0.2) (+0.0)Land converted 18.36(4) 27.40(3) 63.76(1) 0.36(5) 38.62(2)to agriculture (1.8) (-4.7) (10.9) (699.5) (13.9)
Gondola- Commercial 0.704(1) 0.460(2) 0.439(3) 0.278(4) 0.277(5)Manica forest labour (0.0) (0.2) (-0.0) (-0.4) (0.0)
Household 0.070 0.099 0.164 0.014 0.088forest labour (-15.0) (-2.2) (-1.8) (-1.4) (-4.9)Standing miombo 18.2(5) 30.5(3) 30.3(4) 36.6(1) 35.5(2)woodlands (0.4) (0.2) (0.1) (0.2) (0.4)Land converted 9.74(3) 25.46(2) 36.95(1) 5.75(5) 8.79(4)to agriculture (-1.7) (14.1) (11.3) (10.8) (6.9)
a The figures in italics represent changes in% from the corresponding base results, and the figures in romanparentheses are the ranking of the management regimes.b NC = Non-cooperative, COOP=Cooperative, CM-S=Command social, CM-E=Command environment,CM-SE=Command social and environment.

389G. Mlay, M. Falcao, I. Nhantumbo and G. Kowero
Table 13. Potential effects of a 75% increase in crop yields on stakeholders’ benefits(US $ ‘000)a
Study site Variable Management regimeb
NC COOP CM-S CM-E CM-SEDondo Commercial 5764.82(1) 4171.89(2) 3564.51(3) 3141.93(4) 2827.52(5)
forest benefits (0.2) (-8.3) (-0.4) (-2.6) (1.8)Household 90.47(4) 264.81(3) 467.48(1) 55.37(5) 326.48(2)forest benefits (3.3) (15.8) (13.9) (158.1) (19.7)Household 20169.7(4) 20707.0(3) 21479.1(1) 19840.6(5) 20746.3(2)total benefits (64.3) (64.3) (64.0) (65.0) (64.4)Household 92.48(4) 94.94(3) 98.48(1) 90.97(5) 95.12(2)total benefits (64.3) (64.3) (64.0) (65.0) (64.4)per capitac
Nhamatanda Commercial 4573.5(1) 3460.86(2) 3093.9(3) 2459.13(4) 2274.56(5)forest benefits (0.7) (0.6) (0.8) (-0.6) (0.3)Household 31.53(4) 79.7(3) 165.03(1) 1.88(5) 118.31(2)forest benefits (-29.9) (-5.2) (-8.6) (1252.5) (3.8)Household 52709.5(4) 52917.8(3) 53302.7(1) 52497.9(5) 52974.1(2)total benefits (103.7) (103.7) (103.5) (104.0) (103.7)Household 78.36(4) 78.66(3) 79.24(1) 78.04(5) 78.75(2)total benefits (103.7) (103.7) (103.5) (104.0) (103.7)per capitac
Gondola- Commercial 6886.44(1) 5522.18(2) 5426.98(3) 4054.58(5) 4062.12(4)Manica forest benefits (0.2) (0.3) (0.3) (0.5) (0.5)
Household 0.01(5) 37.67(2) 55.37(1) 10.69(4) 16.67(3)forest benefits (-100.0) (-38.8) (-38.7) (-57.0) (-62.8)Household 49168.7(3) 49286.7(2) 49372.5(1) 49152.6(4) 49146.1(5)total benefits (74.7) (74.6) (74.5) (74.7) (74.5)Household 68.66(3) 68.83(2) 68.95(1) 68.64(4) 68.63(5)total benefits (74.7) (74.6) (74.5) (74.7) (74.5)per capitac
a The figures in italics represent changes in% from the corresponding base results, and the figures in romanparentheses are the ranking of the management regimes.bNC = Non-cooperative, COOP=Cooperative, CM-S=Command social, CM-E=Command environment,CM-SE=Command social and environment.cUS $ per year
intervention leading to only moderate crop productivity improvement might not leadto natural resource conservation, but at a high level of productivity increase, forestconservation could be promoted.
4.2.5 A simultaneous increase in agricultural producer prices and royalty feesOn one hand, an increase in producer prices promotes agricultural expansion, while onthe other hand, an increase in royalty fees discourages exploitation of forest products.This interaction is felt by household sector, which performs both activities, while thecommercial sector perceives the direct impact of royalty fees increase, and possibly anindirect impact of increases in crop output prices through labour supply reduction.

390 POLICY IMPACT ON WOODLAND RESOURCE MANAGEMENT, USE AND CONSERVATION IN MOZAMBIQUE
Table 14. Potential effects of a 75% increase in crop yields on labour employment andwoodland conservationa
Study Site Variable Management Regimeb
NC COOP CM-S CM-E CM-SE
Dondo Commercial 0.569(1) 0.337(2) 0.243(3) 0.222(4) 0.187(5)forest labour (0.4) (0.6) (-0.4) (-2.6) (-2.1)(Proportion)Household 0.080(4) 0.112(3) 0.270(1) 0.008(5) 0.113(2)forest labour (-8.1) -0.9(2) (-0.7) (156.5) (5.6)(Proportion)Standing miombo 20.61(5) 30.98(3) 29.17(4) 39.34(1) 35.78(2)woodlands (0.1) (-0.5) (0.3) (-1.4) (-0.8)(Percent of initial forest area)Land converted 29.99(4) 54.21(3) 122.90(1) 7.26(5) 73.16(2)to agriculture (Ha) (5.5) (11.3) (12.2) (154.7) (16.4)
Nhamatanda Commercial forest 0.498(1) 0.324(2) 0.255(3) 0.186(4) 0.163(5)labour (Proportion) (1.6) (1.3) (1.6) (-0.5) (0.6)Household forest 0.066(4) 0.091(3) 0.221(1) +0.000(5) 0.099(2)labour (Proportion) (-27.1) (-11.5) (-6.4) (1172.4) (-4.0)Standing miombo 26.17(5) 38.54(3) 38.19(4) 45.17(2) 44.79(1)woodlands (1.8) (0.7) (0.5) (-0.2) (0.2)(Percent of initial forest area)Land converted 16.92(4) 31.77(3) 66.26(1) 0.31(5) 39.87(2)to agriculture (Ha) (-6.2) (10.5) (15.2) (599.3) (17.6)
Gondola- Commercial forest 0.704(1) 0.462(2) 0.443(3) 0.280(4) 0.278(5)Manica labour (Proportion) (0.0) (0.7) (0.9) (0.4) (0.4)
Household forest 0.053(4) 0.090(2) 0.157(1) 0.006(5) 0.077(3)labour (Proportion) (-36.1) (-11.2) (-6.0) (-59.0) (-16.8)Standing miombo 18.36(5) 30.63(3) 30.32(4) 36.84(1) 35.35(2)woodlands (1.4) (0.5) (0.1) (0.9) (0.9)(Percent of initial forest area)Land converted 6.89(3) 20.2(2) 31.56(1) 2.44(4) 0.33(5)to agriculture (Ha) (-30.5) (-9.5) (-4.9) (-53.0) (-95.9)
a The figures in italics represent changes in% from the corresponding base results, and the figures in romanparentheses are the ranking of the management regimes.b NC = Non-cooperative, COOP=Cooperative, CM-S=Command social, CM-E=Command environment,CM-SE=Command social and environment.
A 30% increase in royalty fees and a 25% increase in crop output prices wereevaluated simultaneously. In the Dondo and Nhamatanda sites, the household discountednet benefits from wood products and total net benefits per capita per year wouldincrease under all management regimes in relation to base results (Table 15). In thecase of the commercial sector, the discounted net forest benefits would decline underall management options. Land conversion to agriculture resulting from improved termsof trade (emanating from the increase in agricultural prices with a re-enforcementeffect coming from the royalty fees increase) would appear to be responsible for the

391G. Mlay, M. Falcao, I. Nhantumbo and G. Kowero
increase. The increase in net benefits from wood products would come from the woodobtained in the process of land conversion to agriculture. In the Gondola-Manica site,an increase in total household benefits would materialize under the three managementvariants of command model, while a decline is predicted cooperative model.
With regard to the policy impact on the forest resource, it is observed that in allthree sites, the percentage of standing woodland would increase in relation to thebase results (Table 16). This improvement would basically be due to a significantdecline in exploration by the commercial sector. The observed large percentageincrease in land conversion to agriculture would, however, translate to a small landarea largely due to constraints on availability of household male labour for forestclearing and the rudimentary technology for the job (mainly hand tools).
As compared to Table 9, more land would be converted to cropland (Table 16) dueto the increased labour availability that would result from decreased commercial
Table 15. Potential effects of a 30 % increase in fees and 25% increase in agriculturalproducts prices on stakeholders’ benefits (US $ ‘000)a
Study site Variable Management regimeb
NC COOP CM-S CM-E CM-SE
Dondo Commercial 3608.85(1) 2518.23(2) 2077.68(3) 1804.66(4) 1585.50(5)forest benefits (-37.3) (-40.1) (-41.9) (-44.1) (-44.9)Household 130.67(4) 293.08(3) 576.85(1) 43.25(5) 377.79(2)forest benefits (49.2) (27.7) (40.6) (101.6) (38.5)Household 12998.9(4) 13306.4(3) 13970.7(1) 12580.8(5) 13442.0(2)total benefits (5.9) (5.6) (6.6) (4.6) (6.5)Household 59.60(4) 61.01(3) 64.06(1) 57.68(5) 61.63(2)total benefits (5.9) (5.6) (6.6) (4.6) (38.5)per capitac
Nhamatanda Commercial 2899.04(1) 2153.26(2) 1913.27(3) 1317.47(4) 1206.49(5)forest benefits (-46.2) (-37.4) (-37.7) (-46.7) (-46.8)Household 56.32(4) 100.46(3) 206.17(1) 3.80(5) 127.51(2)forest benefits (25.8) (19.4) (14.2) (2633.8) (11.9)Household 34196.6(4) 34282.5(3) 34620.6(1) 33947.6(5) 34354.4(2)total benefits (32.1) (32.0) (32.2) (31.9) (32.1)Household 50.83(4) 50.96(3) 51.47(1) 50.46(5) 51.07(2)total benefits (32.1) (32.0) (32.2) (31.9) (32.1)per capitac
Gondola- Commercial forest4423.66(2) 5524.66(1) 3398.43(3) 2259.71(4) 2259.18(5)Manica benefits (-35.6) (0.3) (-37.2) (-44.0) (-44.1)
Household 18.39(5) 50.77(2) 100.78(1) 42.38(3) 41.70(4)forest benefits (-12.0) (-17.5) (11.5) (70.5) (-7.0)Household 35269.50(2) 28214.7(5) 35570.8(1) 5240.7(4) 35268.6(3)total benefits (25.3) (-0.1) (25.2) (25.3) (25.2)
Household 49.25(2) 239.40(5) 49.59(1) 49.21(4) 49.25(3)total benefits (25.3) (-0.1) (25.5) (25.3) (25.2)per capitac
a The figures in italics represent changes in% from the corresponding base results, and the figuresin roman parentheses are the ranking of the management regimes.bNC = Non-cooperative, COOP=Cooperative, CM-S=Command social, CM-E=Command environment,CM-SE=Command social and environment.cUS $ per year

392 POLICY IMPACT ON WOODLAND RESOURCE MANAGEMENT, USE AND CONSERVATION IN MOZAMBIQUE
Table 16. Potential effects of a 30 % increase in fees and 25% increase in agriculturalproducts prices on labour employment and woodland conservationa
Study site Variable Management regimeb
NC COOP CM-S CM-E CM-SE
Dondo Commercial forest 0.479(1) 0.292(2) 0.202(3) 0.156(4) 0.129(4)labour (Proportion) (-15.5) (-13.9) (-17.2) (-31.6) (-32.5)Household forest 0.110(4) 0.133(3) 0.321(1) 0.006(5) 0.137(2)labour (Proportion) (25.9) (17.7) (18.0) (91.1) (28.0)Standing miombo 24.20(5) 32.66(3) 29.46(4) 46.78(1) 43.68(2)woodlands (17.5) (4.9) (1.3) (17.2) (21.2)(Percent of initial forest area)Land converted 49.26(4) 83.38(3) 163.09(1) 6.81(5) 103.88(2)to agriculture (Ha) (73.2) (44.6) (48.9) (139.0) (65.2)
Nhamatanda Commercial forest 0.440(1) 0.292(2) 0.233(3) 0.122(4) 0.107(5)labour (Proportion) (-10.2) (-8.7) (-7.2) (-34.8) (-33.9)Household forest 0.098(4) 0.119(2) 0.252(1) 0.001(5) 0.111(3)labour (Proportion) (8.8) (15.5) (6.8) (3012.8) (7.8)Standing miombo 29.61(5) 40.79(3) 39.39(4) 50.38(1) 50.15(2)woodlands (15.1) (6.5) (3.7) (11.3(1) (12.0)(Percent of initial forest area)Land converted 28.40(4) 42.78(3) 83.10(1) 0.70(5) 49.71(2)to agriculture (Ha) (57.4) (48.8) (44.5) (1459.0) (46.6)
Gondola- Commercial 0.608(1) 0.461(2) 0.387(3) 0.188(4) 0.186(5)Manica forest labour (-13.6) (0.4) (-11.8) (-32.6) (-32.8)
(Proportion)Household 0.084(4) 0.095(3) 0.182(1) 0.018(5) 0.097(2)forest labour (1.2) (-6.0) (9.0) (33.3) (5.0)(Proportion)Standing miombo 22.82(5) 30.65(4) 34.67(3) 45.02(2) 45.13(1)woodlands (26.1) (0.6) (14.5) (23.3) (27.7)(Percent of initial forest area)Land converted 17.87(3) 20.39(2) 54.81(1) 10.6(5) 14.22(4)to agriculture (Ha) (80.3) (-8.6) (65.1) (104.2) (73.0)
a The figures in italics represent changes in% from the corresponding base results, and the figures inroman parentheses are the ranking of the management regimes.bNC = Non-cooperative, COOP=Cooperative, CM-S=Command social, CM-E=Command environment,CM-SE=Command social and environment.
activities. The combined policy strategy (forest fees/royalty and crop output priceincreases) also has potential to improve forest conservation, as illustrated by thegreater area of standing miombo woodlands that is predicted to be there at the end ofthe simulation period (Table 16) as compared with a policy strategy that relies only onincreasing forest fees (Table 9).
The simultaneous increase in crop yields and royalty fees demonstrated similarbehaviour to that observed for the price-royalty fees combination. While the commercial

393G. Mlay, M. Falcao, I. Nhantumbo and G. Kowero
sector’s net benefits were predicted to decline, those of the household sector wouldincrease. In relation to base results, the percentage of standing forest at the end ofsimulation period was predicted to improve in all sites and under all managementoptions. As expected, labour employment for miombo activities by the commercialsector was observed to decline and only increase in the household sector.
5. SUMMARY AND IMPLICATION OF THE RESULTS1. The results show that improvement in the well-being of woodland dependent
households and resource conservation can be achieved with sound managementpractices. These results show that the command regime incorporating socialconcerns and the command regime incorporating social and environmentalconcerns have the potential to provide higher benefits to the household sectorthan the open access regime. The command management regime incorporatingsocial concerns has the potential to raise discounted net benefits from woodproducts by over 300% in all three sites relative to the non-cooperativemanagement regime. In the case of the command arrangement incorporatingsocial and environmental concerns, this increase would range from slightlyover 100% in Gondola-Manica to about 200% in Dondo. This means thatcommand management regime incorporating social concerns and the commandregime incorporating social and environmental concerns have the potential toimprove the well-being of the rural communities and encourage forestconservation only if these benefits were actually felt at the community level.The results on the cooperative management regime show that both the localcommunities and the commercial sectors could gain under this arrangement.Although the commercial sector will have to forgo some direct benefits infavour of the household sector, the cost saving emanating from the reductionof conflicts between the two sectors might induce this cooperation. In thecase of Mozambique, where the land law permits the communities to enterinto partnership with private sector in managing and using natural forestresources the results show that such cooperation is potentially beneficial tolocal communities if properly implemented, and further, this could be the bestoption given that the benefits arising from the command model do not actuallyreach the other stakeholders.
2. Sectoral policies in the form of fees charged on various forest products manifesttheir impact on the forest resource mainly through commercial sector activitiesin the form of a reduction of harvesting activities, when there is no compensationin the form of an increase in sales price. In the case of the household sector,short-term compensation would be achieved through land clearing for agriculture.The reduced employment resulting from reduced private sector activities couldhave negative ramifications for rural development, if complementary policiesare not put into place to create alternative employment opportunities.Promotion of small-scale rural agro processing industries through publicinvestment in rural roads, electricity and water infrastructure and tax incentivesare potential intervention measures to create rural employment alternatives.
3. The extrasectoral policies, particularly those directed at promotinge agriculturalproduction, have both positive and negative effects on forest development.Our results show that modest price and productivity increases in agriculture

394 POLICY IMPACT ON WOODLAND RESOURCE MANAGEMENT, USE AND CONSERVATION IN MOZAMBIQUE
would not encourage significant woodland clearing for cropland. Reduction inland clearing for agriculture would be achieved only if improvement inagricultural production technology leads to a large increase in productivity.Further, the impact of these policies on the forest resources and the welfare ofstakeholders would be influenced by the management regime in place.
4. The impact of management regime and/or policy intervention on the welfareof stakeholders and on the forest resource will depend on the amount of naturalresource endowment and the initial economic conditions on the ground. Whilethe general direction of policy or institutional change can be predicted, theactual impact will depend on the initial conditions, which are site specific. Inaddition, the results show that there is no management regime capable ofsatisfying all goals; that is, a trade-off between goals is necessary.
ENDNOTES1. Nash based strategies, are the choices made such that each player’s strategy is an optimal
response to the opponents’ strategies.2. Concession is the right of use of land under specified conditions and period.
REFERENCESAngelsen, A. and Kaimowitz, D. 2001 Introduction: the role of agricultural technologies
in tropical deforestation. In: Angelsen, A. and Kaimowitz, D. (eds.) Agriculturaltechnologies and tropical deforestation, 1-17. CAB International. New York.
Assembleia da República (AR1) 1997 Lei de Terras. BR I : 40 PORM. Maputo.Assembleia da República (AR2) 1997 Lei de Florestas e Fauna Bravia. Maputo.Barbier, E.B. 2000 Links between economic liberalization and resource degradation in
developing regions. Agricultural Economics 23: 299-310.Cardenas, J.C., Stranlund, J. and Willis, C. 2000 Local environmental control and
institutional crowding-out. World Development 28: 1719-1733.Cuco, A. 1994 The impact of structural adjustment on forest industry in Mozambique.
Unasylva 45: 45-50Governo de Moçambique 1998 Estratégia de segurança alimentar e nutricional. Maputo.Governo de Moçambique 1999 Política e estratégia comercial. Ministério da Industria,
Comercio e Turismo.Governo de Mocambique 1998 Programa sectorial de investimento. Ministério da
Agricultura e Pescas, Maputo.Governo de Moçambique 2001 Plano de acção para a dedução da pobreza absoluta
(2001-2005). PARPA.Kaimowitz, D. and Angelsen, A. 1998 Economic models of tropical deforestation: A
Review. CIFOR, Bogor.Kant, S. and Nautiyal, J.C. 1993 Sustainable management through bargaining: A bilateral
monopoly gaming approach. Forest Ecology and Management 65: 251-264.McCarthy, N. 2000 An economic analysis of the effects of production risk on the use and
management of common-pool rangelands. In: McCarthy, N., Swallow, B., Kirk, M.and Hazell, P. (eds.) Property rights, risk, and livestock development in Africa.IFPRI.

395G. Mlay, M. Falcao, I. Nhantumbo and G. Kowero
Ministério de Agricultura e Pescas 1995 Política agrária e estratégia de implementação.Serie Documento de Base no. 1. Ministério da Agricultura e Pescas, Maputo.
Republica de Moçambique 1998 PROAGRI: Programa sectorial de investimento público.Ministério da Agricultura e Pescas, Maputo.
Ministry of Planning and Finance, Eduardo Mondlane University and IFPRI 1998Understanding poverty and well-being in Mozambique. The First National Assessment(1996-97). Ministry of Planning and Finance, Maputo.
Mlay, G.I., Turuka, F. Kowero, G. and Kachule, R. 2003 Agricultural policies and forestrydevelopment in Malawi, Mozambique, Tanzania and Zimbabwe: Complementaritiesand conflicts. (In this book)
Pandey, K.R. and Wheeler, D. 2001 Structural adjustment and forest resources: Theimpact of World Bank operations. Working Paper No. 2584, Development ResearchGroup, World Bank.
Sumaila, U.R. 1995 Irreversible capital investment in a two-stage bimatrix fishery gamemodel. Marine Resource Economics 10: 263-283.
Sumaila, U.R. 1999 A review of game theoretic models of fishing. Marine Policy 23: 1-10.
Sumaila, U.R., Angelsen, A. and Kowero, G. 2001 A system dynamics model for managementof miombo woodlands. In: Modelling methods for policy analysis in miombowoodlands, 17-30. Occasional Paper No. 35. CIFOR, Bogor.
Vosti, S.A. and Witcover, J. 1996 Slash-and-burn agriculture – household perspectives.Agriculture, Ecosystems and Environment 58: 23-38.
White, B. 2000 A review of the economics of biological natural resources. Journal ofAgricultural Economics 51: 419–462.

396 POLICY IMPACT ON WOODLAND RESOURCE MANAGEMENT, USE AND CONSERVATION IN MOZAMBIQUE
ANNEX 1. SOME MIOMBOSIM COMPONENTS FOR MOZAMBIQUE
A. Household SectorA non-separable household model is assumed since the communities operate in anenvironment with incomplete markets. A representative household is assumed tomaximize utility derived from income (I) and leisure (T=Lmax-L)
U(I, T)=(I-Imin)α +v(Lmax-L)β (1)
where:I=gross income of the householdImin=subsistence consumptionLmax=Maximum labour available from the householdL=labour used by household in activities undertaken α ,β are parameters of the utility function
The shadow wage (z) is obtained by total differentiation of the utility function and ispresented in equation 2.
(2)
The allocation of labour is made such that the marginal return to labour is the sameacross all activities and equal to the shadow wage. The production activities performedby the households are divided into three categories, namely: agriculture, harvesting ofmiombo wood and non-wood products and off-farm/off-miombo employment. For thismodel non-wood products have been excluded for lack of data. Wood products includedare poles, firewood and charcoal (energy). The gross income and labour utilization arepresented in the accounting equations 3 and 4 respectively
Ih=Im+Ia+Iof (3)
Lh=Lm+(La+Ln)+Loff (4)
where:h=household, a=agriculture, off=off-farm/off-miombo, n=new converted land. Ln
=labour required for converting land to agriculture and La =labour required to cultivateland currently under agriculture.
i. Income from agriculture and decision to convert miombo woodlands to agricultureIn the model the income from agriculture is a sum of the income from the differentagricultural enterprises practiced by a typical household as described in the descriptiveresults (Mlay et al. 2003). Optimal use of purchased inputs (where applicable) isdetermined from an additive production function presented in equation 5.

397G. Mlay, M. Falcao, I. Nhantumbo and G. Kowero
x=a+bl+cfd (5)
where: x =crop yield per hectare, l=labour requirement per hectare and f=purchasedinput per hectare and a, b,c, and d are parameters to be estimated.
Optimal input use is derived from first order conditions of gross marginmaximization. On the basis of optimal quantities of purchased inputs and correspondingyields, net income from agriculture can be obtained on the basis of equation 6.
Ia=(Pax-Paf)Ha (6)
Labour to be employed in agriculture is obtained by equation 7.
La=lHa (7)
where Ha is total land under agriculture, which is equal to the sum of the initial land
under agriculture (Hi) and new land converted to agriculture (Hc).The decision on whether to convert miombo woodlands to agriculture is made by
comparing the net benefits from a hectare converted to agriculture (Ba-zlc) with benefitsfrom miombo wood products per hectare (Bm)
where: Ba=Pax-Pff-zl (8)
The conversion cost should be convex in land cleared to reflect increased labour asdistance increases from the homestead. A convex labour function as presented in equation9 is used.
, g>0 (9)
where Hn= new land converted to agriculture, lc=labour requirement per hectare andτ and g area parameters
The total labour required to convert land to agriculture is given by equation 10.
(10)
If Ba-zlc>Bm for all positive values of Hn land will be converted to agriculture. If Ba-zlc< Bm then no conversion will take place. Conversion of miombo woodlands toagriculture will continue until B
a-zl
c=B
m.
It should be noted that in the conversion process there are one-time benefitscoming from the wood cleared (if it is used for poles, energy) which are accounted forin the model.

398 POLICY IMPACT ON WOODLAND RESOURCE MANAGEMENT, USE AND CONSERVATION IN MOZAMBIQUE
ii. Miombo activitiesThe households are assumed to harvest wood products for energy (firewood and woodfor charcoal making) and building poles. The gross income from miombo activitieswould be given by equation 11.
Im=PaveHm (11)
where Hm is the volume of miombo wood harvested for poles and fuel (firewood andcharcoal) and Pave is a weighted price of the two products
The allocation of the total volume between energy (Hfw) and poles (Hpo) is given byequations 12 and 13 respectively.
(12)
(13)
The volume of miombo products to be harvested by the household sector dependson the volume of standing miombo (N) and labour allocated for this activity (L
m). A
Cobb-Douglass function as presented in equation 14 is used to depict the functionalrelationship.
(14)
where qh is the household efficiency parameter, and are partial elasticities ofproduction.
iii. Off farm/off-miombo activitiesThe income from off-farm/off-miombo activities depend on the wage rate (w) andlabour allocated to these activities (Lof) as depicted by equation 15.
(15)
B. Commercial SectorThe commercial sector component of the model is simpler than the household sectorsince it involves only one activity logging. The decision here is how much miombo toharvest each year in order to maximize total discounted benefits. The harvesting andnet benefit functions for the commercial sector are presented in equations 16 and 17respectively.

399G. Mlay, M. Falcao, I. Nhantumbo and G. Kowero
(16)
where qc is the harvest efficiency parameter for the commercial sector. Since theharvesting process is semi mechanized, the private sector efficiency parameter islarger than that for the household sector.
(17)
where k=is the wage rate exogenously determined, pc price of a cubic meter of logs.
The labour used by the commercial sector is part of the labour available from thehousehold sector.
C. Institutional ComponentAs was pointed out earlier, in Mozambique land belongs to the state and its use and theresources therein is regulated by the government to maximize society-wide benefits,which include direct economic benefits, social benefits (Bs) and environmental benefits(Be). The problem the government or regulator faces is to determine the volume ofmiombo to be harvested by each sector in each year in order to maximize society-wide objectives.
Defining Bh as household private net benefits and Bc as commercial sector privatenet benefits, the social (s) and environmental (e) benefits (B) can be presented asfollows:
(18)
(19)
Where:a) θ
h θ
c are parameters reflecting the social preference of the society given to a
participant in harvesting miombo wood products. The parameters take a value of0 if there is no social preference and 1 if there is social preference. In the modelθ
h is assigned a value of zero and θ
c is assigned a value of 1 indicating that the
household sector is given social preference in harvesting miombo wood products.b) is a parameter to capture society-wide concern about environment. It is
assigned a value of 1 if the society cares about the environmental benefits and0 otherwise.

400 POLICY IMPACT ON WOODLAND RESOURCE MANAGEMENT, USE AND CONSERVATION IN MOZAMBIQUE
D. Miombo woodland dynamicsThe ecology of miombo is represented by a regeneration equation (equation 20),where a constant annual regeneration rate is assumed and miombo stock equation(equation 21). The two equations are presented below.
Rt=Kt (20)
Nt=sNt-1+Rt-Hc,t-Hh,t; (21)
No is the initial stock of miombo woodlands, s is the survival rate.For the implementation of the model, area under miombo and average volume perhectare of wood products were used.
21.A system dynamics model for managementof miombo woodlands in two communalareas of Zimbabwe
C. Sukume and E. Guveya
ABSTRACTThis paper reports results on the use of a systems dynamic model of woodlandmanagement (MIOMBOSIM) to two communities in communal areas of Zimbabwe –one abundant and the other less abundant in woodlands resources. The relativelywell-endowed community borders the Mafungautsi Forest Reserve in Gokwe. The lessendowed site was Mutangi in Chivi area. The objective of the modelling exercise wasto simulate the effects over time of changes in agricultural and other economic policieson how local communities use woodlands under an open access regime and underinstitutional constraints imposing biodiversity concerns.
The simulations point to the following basic conclusions: a) rate of deforestationis higher in resource abundant areas; b) enforcing biodiversity requirements in aresource abundant area reduces deforestation at a lower cost in terms of loss inhousehold benefits from woodland use compared to a resource poor area; c) increasein agricultural crop output price increases deforestation; d) decline in crop yieldsreduce deforestation; and e) increases in agricultural input prices and decrease in theincome for basic needs produced indeterminate impacts on deforestation.
Key words: Woodlands, system dynamics, communal area, Zimbabwe.
1. INTRODUCTIONThe total surface area of Zimbabwe is about 39 million hectares of which 41% isoccupied by woodlands (Chipika and Kowero 2000). Close to a quarter of thesewoodlands consists of miombo woodlands, an African woodland dominated byBrachystegia species, either in pure stands or in association with Julbernadia and/or

402 A SYSTEM DYNAMICS MODEL FOR MANAGEMENT OF MIOMBO WOODLANDS
Isoberlinia species (Chipika and Kowero 2000). The woodlands provide the bulk of theforest products required by the rural populace as well as serving the wood resourceneeds of many urbanites.
History and recent social changes have had a significant impact on the plight ofmiombo woodlands in Zimbabwe. Segregatory policies during pre-independence periodled to the majority indigenous people being confined to agro-ecologically poor andcrowded areas known presently as communal areas. The continually growing pressurefor cultivation land and pastures has led to massive degradation of miombo in thecommunal areas. Deteriorating economic conditions especially during the 1990s, whichled to massive retrenchments of workers, escalating cost of living and removal ofgovernment subsidies (Chipika and Kowero 2000) added to the burden of communalareas. The traditional role of communal areas being places of last refuge has meantthat most retrenched workers come into these areas, worsening the impact on thewoodland resources and the economic conditions of the households.
The above factors tend to encourage people to increase reliance on the woodlandsfor additional agricultural and pasture land. They could also provide an incentive to ruralcommunities to increase harvesting of the woodlands for products for sale to supplementincomes. These and other activities have potential for deforestation and/or degradationof the woodlands. In Zimbabwe, we would expect factors affecting agriculture to havea particularly significant impact on woodland degradation. Unlike in countries such asTanzania and Mozambique where a well-developed commercial market for charcoal exists,most woodland use in communal areas of Zimbabwe is in the form of wood for domesticuse and clearing for agricultural production. Campbell et al. (1993), based on analysis ofaerial photos, note that most deforestation is largely due to land clearing for cultivation.
The miombo in communal areas is used and managed under weak common propertyarrangements. In recent years, concerted effort has gone into attempts to strengthenmanagement regimes for these woodlands (for example CAMPFIRE)1 as a way ofconserving and unlocking latent non-exploitative benefits from the woodlands.Designing institutions and strategies to protect these resources requires tools thatcan mimic the implications of alternative management regimes and policies.
The main problem in the woodland areas is one of reconciling the interests of keystakeholders. The local communities would want to continue relying on the woodlandsfor the many needs already mentioned. At the same time society in general is interestedin sustained supply of goods and services of a public good character that can only besafeguarded if environmental protection measures guide management of the woodlands.All these demands have to be met in an environment of rapidly changing socio-economicpolicies that guide economic development in Zimbabwe.
In this paper, we develop and test a simulation model of miombo woodlandmanagement adapted from a generalised community miombo woodlands managementmodel developed by Sumaila et al. (2001), on communities in Gokwe and Chivi. Themodel demonstrates the potential impacts of key sectoral and macroeconomic policieson local community benefits derived from the woodlands as well as potentialenvironmental implications. This way the model serves as a potentially useful tool forrural development planning as specific hypotheses associated with the policies can beevaluated.
The paper is organised as follows. The next section provides a description of thetwo communities of Gokwe and Chivi that were the basis of the study. It is followed byan overview of the Sumaila et al. (2001) conceptual framework as well as modifications

403C. Sukume and E. Guveya
made to adapt the model to the prevailing situations at the project sites. Section 4presents the data used to run the model while section 5 presents and discusses simulationresults of impacts of different policy scenarios and management regimes. The lastsection gives a summary of major conclusions from the study.
2. DESCRIPTION OF STUDY SITESThe two districts, Chivi and Gokwe, within which the study sites are located, werepurposely selected as they have differing agricultural potential, and settlement history.In Chivi, Mutangi, a dam catchment area was selected while in Gokwe, villages withina radius of about 30km from the Mafungautsi state forest were selected. Mutangi is 6km on a gravel road from the main tar road running through Chivi business centre.The site is 80 km from Masvingo town and 19 km from Chivi business centre.
Chivi communal area, the major part of Chivi district, covers 3534 km2. Itsadministrative centre is Chivi business centre, an old settlement established in theearly part of the 20th century. Chivi was settled by its forefathers in the mid 19th
century. At the turn of the century the estimated population of Chivi district was onlyaround 15 000 (Scoones et al. 1996). By 1930 the population had grown to an estimated28 500, in part due to population movements in the reserves brought about by theimplementation of the Land Apportionment Act of 1930 which set aside large tracts ofland for the exclusive use of white settlers. Census figures in 1962, 1969 and 1982showed district populations of 57 220, 80 580 and 103 656, respectively (CSO 1985). The1992 census shows a total population for Chivi district of 157 428, with a growth rate of1.98% and a population density of 44.5 people per square km. Campbell et al. (2001)calculated population densities at 58.2 people/km2 for Mutangi.
Long-term mean annual rainfall at Chivi business centre is 545 mm (1913-2001).On average, 89% of this annual rainfall is received during the summer rainy seasonfrom November to March. However, rainfall amount, intensity and distribution arehighly variable, and inter-annual variation is large (Campbell et al. 2002). The long-term mean has a standard deviation of 207 mm or coefficient of variation of 38 percent. Droughts are recurrent in the region, and the most recent in 1991/92 was theworst on record, when only 83 mm of rain fell in the district. The rainfall average inMutangi is 550 mm. Mutangi is a dam catchment utilised for irrigation, fishing, andwater supply for domestic and livestock use by the local community. The soils are verypoor and the area is very prone to droughts. Due to high population pressure, woodlandsare being cleared for arable land, and to meet firewood and construction wood needsof the community.
The dominant vegetation in Mutangi is the woodland that forms an enclave ofapproximately 360 square kilometres surrounded by about five villages who share it(Campbell et al. 2002). The top three dominant tree species found in the area areColophospermum mopane, Terminalia sericea and Acacia tortilis. Fruit trees also occurbut are relatively scarce. Examples of the most commonly occurring fruit trees areDiospyros mespiliformis, Azanza garckeana, Berchemia discolor and Ficus sycomorus.Other forest products like honey, mushrooms, and medicinal plants also occur in thewoodlands. There is very little wild game except for small animals like rabbits that canbe found in some parts of the woodland. The woodland is mainly utilised as a grazingarea for livestock, source of firewood, construction poles and occasionally as a sourceof fruits and other non-timber forest products (NTFPs).

404 A SYSTEM DYNAMICS MODEL FOR MANAGEMENT OF MIOMBO WOODLANDS
The study area in Gokwe was one of communities surrounding the Mafungautsistate forest. Villages included in the survey are within a radius of 30 km from thewestern edges of the Mafungautsi state forest and about 50 km from Gokwe businesscentre. These communities have settled in the area for less than 70 years. Thecommunities are still relatively sparsely settled and most areas are still covered bywoodlands. Furthermore the communities have access to the Mafungautsi State Forest,a protected forest covering an area of 82 659 hectares (Vermeulen 1997). Villageslocated near the boundaries can access a total area of about 600 square kilometres ofthe forest.
Mafungautsi State Forest is entirely situated on the Mafungautsi plateau, one ofthe most northerly extensions of the Kalahari sands in Zimbabwe (Vermeulen 1997). Thesoils are dystrophic with poor water holding capacity. Mean annual rainfall for the areais around 819 mm. The forest is very dense with many tall and old trees. The dominanttree species is the Terminalia sericea, while important commercial timber species suchas Baikiea plurijuga and Pterocarpus angolensis are also abundant. Many fruit trees canstill be found within the forest. Wild game especially warthogs and antelopes still occurin large numbers in the forest. During the wet season, mushrooms sprout quite extensivelyin most parts of the forest. In addition, communities surrounding the forest are allowedto graze their livestock, collect dead wood and NTFPs like mushrooms, thatch andbroom grass. However, the communities are not allowed to cut down trees, collecthoney or hunt game.
3. CONCEPTUAL MODELTo simulate potential impacts of different policies on woodlands use and condition, thestudy adopted a simulation model in Sumaila et al. (2001). The household is assumed tomaximise utility (U (.)), which is a function of income(I) net of subsistencerequirements(Imin) and leisure(Lmax – L). That is
(1)where:
I =gross household incomeImin =value of subsistence consumptionLmax =maximum labour available to the householdL =labour used by the household in all income generating activities; and
α and β are parameters of the utility function.
Based on the utility specification in equation (1), the shadow wage (z) is obtainedby total differentiation of the utility function to yield (See Sumaila et al. 2001),
(2)
The household derives income from use of labour and other resources in threeprincipal activities – agricultural related activities (Ia), woodland related activities(Im) and off farm and off-woodland activities (Iof). The gross household income (I) isthus
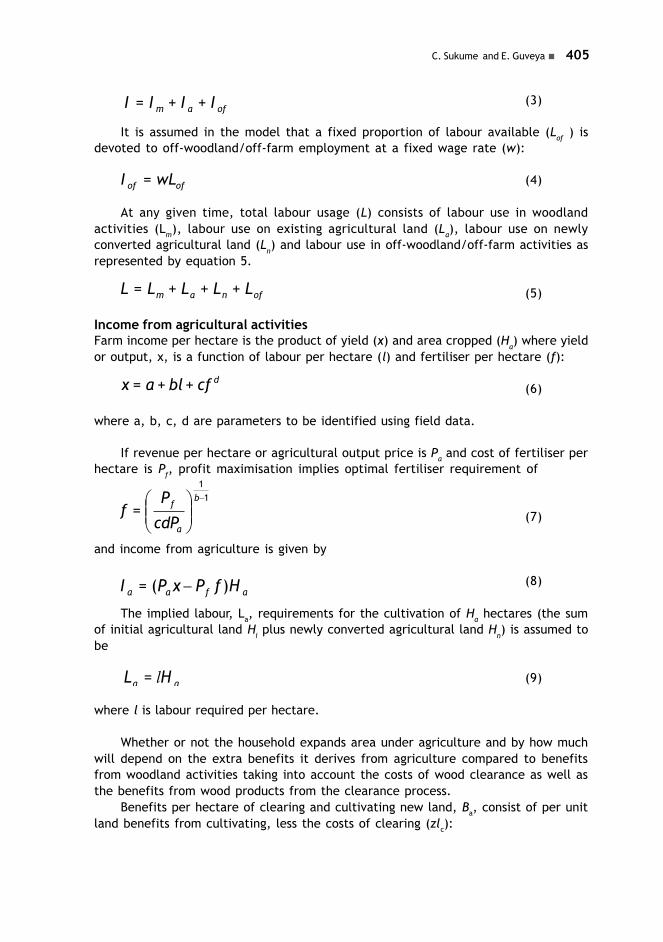
405C. Sukume and E. Guveya
(3)
It is assumed in the model that a fixed proportion of labour available (Lof ) isdevoted to off-woodland/off-farm employment at a fixed wage rate (w):
(4)
At any given time, total labour usage (L) consists of labour use in woodlandactivities (Lm), labour use on existing agricultural land (La), labour use on newlyconverted agricultural land (L
n) and labour use in off-woodland/off-farm activities as
represented by equation 5.
(5)
Income from agricultural activitiesFarm income per hectare is the product of yield (x) and area cropped (H
a) where yield
or output, x, is a function of labour per hectare (l) and fertiliser per hectare (f):
(6)
where a, b, c, d are parameters to be identified using field data.
If revenue per hectare or agricultural output price is Pa and cost of fertiliser perhectare is Pf, profit maximisation implies optimal fertiliser requirement of
(7)
and income from agriculture is given by
(8)
The implied labour, La, requirements for the cultivation of Ha hectares (the sumof initial agricultural land H
i plus newly converted agricultural land H
n) is assumed to
be
(9)
where l is labour required per hectare.
Whether or not the household expands area under agriculture and by how muchwill depend on the extra benefits it derives from agriculture compared to benefitsfrom woodland activities taking into account the costs of wood clearance as well asthe benefits from wood products from the clearance process.
Benefits per hectare of clearing and cultivating new land, Ba, consist of per unitland benefits from cultivating, less the costs of clearing (zlc):

406 A SYSTEM DYNAMICS MODEL FOR MANAGEMENT OF MIOMBO WOODLANDS
(10)
where labour per hectare required to clear land, lc, increases the more the householdhas to move to clear land. That is
(11)
where Hn is land cleared of woodlands and τ and g are parameters.
Given the specification of (11), total labour, Ln, required to clear land at anygiven time is
(12)
If benefits from woodlands are greater than those from agriculture on convertedland, no land will be converted to agriculture. However, if the reverse is true, forestswill be converted to agriculture up to the point when marginal benefits from woodlandsjust equal marginal benefits from converted land less costs of land clearing.
Woodland activitiesThe products harvested from woodlands are mainly fuelwood (Hfw) and poles (Hpo).Due to lack of information, non-timber forest products were not included in thecalculation of net benefits from miombo woodlands. What proportion of the forestproduct harvested is used as poles and fuelwood was determined by the relative pricesof each product. The proportion of area harvested for fuelwood, Hfw, was estimatedas
(13)
where:Hm is the total area of woodland harvested for fuelwood and poles,Pfw is the price of fuelwood/firewood (these terms are used interchangeably inthis text),Ppo is the price of poles.Similarly for poles, H
po, was estimated as
(14)
Meanwhile, the total harvest function for woodlands was formulated as a Cobb-Douglas function of existing stocks of woodlands and labour:

407C. Sukume and E. Guveya
(15)
where:N is the volume of standing woodland (stock), and are parameters of the harvest function, each assumed to be 0.5 in themodel, qh is the harvest efficiency coefficient, that is, the proportion of the totalwoodland resources that can be cleared using all the capacity available to the householdsin a given period.
If Pave is the weighted average price of poles and fuel wood, income from woodharvested can be presented as:
(16)
Woodland growth dynamicsGiven the encroachment on forests implied by the relationships in previous sections,the state of the resource stock at any given time (N
t) is postulated to depend on the
stock in the previous period, its natural survival rate(s) and the regeneration (Rt)(equivalent to the volume, Kt, created in a given year) as well as the amount, Ht,harvested in the year. This is captured by the following relationships:
(17)
(18)
Objectives in managementThe most fundamental modification to the conceptual model in Sumaila, et al. (2001) isthat we have only one player or participant group here, and that is the household.There is no commercial or private sector in the two sites. So, the model is a soleowner/player/user model, which operates basically by an assumption that the interestsof the members of the group are coordinated. However, environmental concerns areincorporated to reflect the desire to guide communities towards taking care of thewoodlands as reflected in the growing emphasis worldwide on communities to managesuch resources sustainably. When undertaking a participatory rural appraisal (PRA) ofthe two sites it was observed that there were local attempts to manage the woodlands,though they were taking off fairly slowly in Chivi. Further, woodland managementapproaches brought to the communities by outsiders were reported as weak, irrelevantand detached from existing social structures.
Figure 1 presents the steps taken by households on these two sites in makingdecisions on the allocation of woodland resources to either agricultural production orwoodland use. It provides guidance on how to mathematically formulate the model.
For each site and at any time t, there is an area Nt of woodlands, a portion ofwhich is initially under agriculture cultivation, denoted Na, and area Nm, which remainsforested and available for future use as poles, Hpo, and fuelwood, Hfw, as well as forconversion to agricultural land, Ha.
The communities in these two sites are assumed to seek to maximise the presentvalue, B, of net benefits derived through their allocation of labour to woodland, agriculturaland off-farm/off-woodland activities over time. Following the logic of Figure 1 theobjective in decision making by the household is summarised by the following function:

408 A SYSTEM DYNAMICS MODEL FOR MANAGEMENT OF MIOMBO WOODLANDS
Subject to:
(19)
where:Bh = benefits to householdsρ = discount factorBe = environmental benefits = weight attached to woodland harvests to reflect concern for environment. =0implies no environmental concern, and >0 implies the opposite. and s is the survival rate of the woodlands.
Figure 1. Steps in decision making by the households in Gokwe and Chivi
Total miombo land (Nt)
Agric land (Na) Miombo (Nm) forest
Househld use (Hh)
Wood harvest (Hh) Conversion toAgriculture (Ha)
Fuelwood (Hfw) Poles (Hpo)

409C. Sukume and E. Guveya
In the above equations,
(20)
(21)
where Hh,t
is woodland susceptible to agricultural encroachment and harvesting forpoles and firewood. Be is such that
Table 1. Model data
Item Site
Gokwe Chivi
Environmental parameter (θ ) 1 1Discount factor (ρ ) 0.893 0.893Harvest efficiency parameter (qh) 0.133 0.0641Off-woodland labour (proportion) (Lof) 0.1 0.15Average agric price/m3 equiv (US$) (Pave) 5.71 7.31Wood demand/ household/per year (m3) 62 40Fertilizer cost (US$/kg) (Pf) 0.14 0.10Forest area (ha) (Nt) 42,120 5,670Existing agric land at start of analysis (Na) 18,323 1,042Maximum annual labour available to household users(L) (normalized) 1 1Number of households in the community 4,558 453Off woodland wage for all households (US$) (w) 2,007,526 199,519Price per m3 of woodland firewood bythe household (US$) (Pfw) 1.84 2.76Price per m3 of woodland poles (US$) (Ppo) 1.84 2.76Revenue from a hectare of agricultural produce (US$) (Pa) 285 365Cost of seed (US$) 0.15 0.21Subsistence income for the community (US$) 1,429,329 160,370Woodland survival rate (s) 0.95 0.95Total person days in community per year 4,562,558 453,453Parameter to labour cost function of households (v) 0.5 0.5Standing volume of wood per hectare (Kt) 50 50Initial volume of woodland for the site (normalized) 1 1Parameters in household cost function 0.9 0.1
4. MODEL OPERATIONALISATIONTo solve the above decision making model, the study uses the numerical algorithms(MIOMBOSIM) in Sumaila et al. (2001), which is implemented using the simulation packagePowersim. Data used is based on surveys conducted in 1999 by Siziba and Mutamba(2002). The field data in this report was used to estimate the MIOMBOSIM parametersfor the two sites as presented in Table 1.
In Table 1, the discount factor assumed is based on a social interest rate of 12percent, the rate used by government for planning purposes in Zimbabwe. Based onPRA and questionnaire data about 55% of the population was active and the household

410 A SYSTEM DYNAMICS MODEL FOR MANAGEMENT OF MIOMBO WOODLANDS
size averaged 7 people in both sites. Further, it is assumed there are 260 workingdays in a year. The total person days per community per year is calculated as theproduct of the active population and the number of working days per year. Subsistenceincome for the community is the product of per household income and the total numberof households in the community. The per-household income used is the optimal incomefrom Linear Programming models of representative households in the two communitiesunder study. Off-woodland wage for all households was estimated as the product ofminimum commercial farm worker wage ($0.44 per day), the total active populationin the community and the total working days in a year (260 days).
Wood demand per household per year was estimated as the product of averagewood collected per day and the average number of days in a year the household collectswood, based on survey estimates. Siziba and Mutamba (2002) estimated that forChivi the average household collected 0.35 m3 per day for 116 days in a year while inGokwe average household collected 0.43 m3 per day for 142 days in a year. Revenuefrom a hectare of agricultural production was estimated as the weighted average ofrevenues from all crops grown by the community with proportion of area put to thedifferent crops being used as weights. This was converted to average agriculturalprice per cubic metre of wood by dividing the revenue per hectare by the standingvolume of wood per hectare (assumed to be 50 m3).
5. IMPACTS OF POLICIES ON WOODLAND USE: SIMULATION RESULTSThe model allows us to answer a number of questions about the likely effects of changesin the socio-economic environment in which the Gokwe and Chivi communities understudy reside. Specifically, we scrutinise the likely impacts on levels of woodland use,labour utilised in woodland related activities, household incomes, community benefitsfrom woodlands, among others, under the following scenarios:
• Continuation of current community practices;• Continuation of current community practices but with institutional
arrangements instituted to safeguard biodiversity concerns;• All agricultural commodity prices increased;• Agricultural productivity reduced;• Agricultural input prices reduced;• Money required to satisfy subsistence income reduced and• Wage rates in the non-woodland use sector reduced.
The justification for selecting each of these scenarios is given in the followingsections.
5.1 Base case runsTable 2 presents the base case results from the simulation runs of the model based ondata for Gokwe and Chivi study areas. For both sites, the results reveal the trade-offsin the use of woodland resources for current economic gains versus conservation ofthe resources for biodiversity concerns. If the objective is to maximize householdseconomic benefits without any special consideration given to environmental concerns,a net present values of US$ 2.52 million and US$ 81,000 are realised in Gokwe andChivi, respectively. Present values are reduced to US$ 2.45 million and US$ 62,000 for

411C. Sukume and E. Guveya
Gokwe and Chivi, respectively; when the objective is to maximize household economicbenefits while protecting/conserving the environment. This represents a revenue lossof about 2.4% and 24% for Gokwe and Chivi, respectively. Gokwe borders a Governmentforest reserve with abundant firewood that is freely collected for household use andminimal sales at low prices. Chivi is a wood scarce area with high population pressureon land and woodland resources, thus raising the price of firewood much higher ascompared to that obtaining in Gokwe (see Table 1). Therefore, financially householdsin Chivi could lose proportionally more than those in Gokwe if environmentalconservation measures are rigorously enforced on the woodlands.
Table 2. Baseline Results of Simulations in Gokwe and Chivi
Gokwe ChiviNo-Env* Env* % Change No-Env Env % Change
Benefits from woodlands($’000) 2,515 2,453 -2.4 81 62 -24
Sustainable amount ofwoodlands 0.25 0.27 8.5 0.51 0.54 6
Labour used in woodlandactivities (%) 17 16 -7 5 3.2 -37
Woodland area convertedto agric. land (ha/yr) 642 609 -5 19 13 -34
Average area of standingwoodland (ha) 17,058 17523 2.7 3,978 4,090 2.8
Community use of woodlandproducts (m3/yr) 43,015 40,808 -5 1,337 888 -34
Household disposableincome ($/yr) 901 896 -1 552 540 -2
*No-Env and Env indicate simulated values under respectively the ‘without’ and the ‘with’environmental concern scenarios, and ‘% change’ is percent difference between the two.
A measure of resource preservation is how much of the initial woodlands in thelong term can be sustainably maintained based on current consumption patterns. Theresults again show a marked trade-off between the ‘with and the ‘without’environmental concerns scenarios. For Gokwe, current woodland products consumptionpatterns imply a long run sustained stock of a quarter of current woodland resourcesunder the ‘without’ environmental concern scenario. With the environmental concern,the long-run sustainable proportion of the resources increases to about 27% of initial.For Chivi, continuing with the current consumption pattern and without environmentalconcerns holds potential for sustaining, in the long run, about 51% of initial woodlandstock, while the proportion could increase slightly to 54% were environmental orbiodiversity conservation measures adhered to. The difference between the two sitescan partly be explained by the more than 50% higher per household woodland productsconsumption observed in the sample of households in Gokwe (see Table 1). Thedifference in sustained stock levels tends to indicate that households and communitydo adjust their consumption in response to scarcity. Gokwe households currentlyconsume more resources because they have an abundant supply while Chivi households

412 A SYSTEM DYNAMICS MODEL FOR MANAGEMENT OF MIOMBO WOODLANDS
used to a relatively poor resource base have adjusted their consumption downwards.The model as currently structured, however, does not allow for adjustment in demandin response to increasing scarcity.
The high woodland products consumption in Gokwe translates into a high proportion(17% and 16%) of labour used on woodland activities compared to Chivi (5% and 3.2%),both in the ‘without’ and ‘with’ environmental concern cases. Results also show that asignificant proportion of woodland use in Gokwe is from agriculture encroaching intoforest areas. The model predicts that 642 hectares of land on average could be convertedinto agricultural land each year in Gokwe as compared to only 19 hectares in Chivi, ifthere is free access to the woodlands or encroachment on them cannot be contained.When considerations for environmental or biodiversity conservation are taken into accountGokwe’s encroachment could be reduced by 5% as compared to 34% in Chivi.
The ‘without’ and the ‘with’ environmental concern results in Table 2 indicatethat for the Gokwe community, an 8.5% increase in the proportion of sustainedforest resources can be realized for the loss of only 2.4 % of net benefits from theforest. However, gains in environmental benefits come at a higher cost to the Chivicommunity. A 6% gain in proportion of initial forest sustainably remaining comes ata cost of close to 24% loss in household economic benefits. The losses are magnifiedif we use the average area of standing woodlands over time as a measure ofsustainability of resources. In this case the gain in resource conservation due to theincorporation of environmental concerns are 2.7 and 2.8 percent for Gokwe andChivi, respectively.
Finally, Table 2 reports average household disposable income in the ‘with’ and‘without’ environmental concern scenarios for the two communities. The resultsreflect the relative wealth of Gokwe community compared to Chivi due to the betteragro-ecological endowments in the former. Using per household disposable incomeas a welfare measure dampens the effect of incorporating environmental concernsin woodland use decision-making. Here households’ income losses at 1 and 2 % forGokwe and Chivi, respectively, are smaller than the ecological gains in terms of bothaverage standing woodlands and long-run sustained forest as proportion of initialforest. This means that in relative terms more is gained ecologically whenenvironmental concerns are incorporated in the objective function than what is lostin terms of disposable income. In other words, the households lose relatively lessdisposable income compared to the relative gain in environmental benefits. Thisoutcome is achieved most probably because the household cost function isendogenously determined, hence, costs (mainly labour costs) decrease enough inthe ‘without’ scenario to bridge the gap that would have emerged as a result of thereduction in woodland harvested.
5.2 Effects of an increase in output pricesTo assess the impact of general increase in output prices that could be brought aboutby for instance, improvement in road infrastructure, setting up of marketinginfrastructure closer to the community, devaluation of an overvalued exchange rate orremoval of explicit government taxes on outputs, we simulated the Gokwe and Chivimodels with prices of outputs set at 25 % more than current prices. Table 3 reportsthe simulated outcomes as well as percent changes from the base model results obtainedfor the two study sites.

413C. Sukume and E. Guveya
A priori, we would expect a general increase in output prices to increase agriculturalprofitability encouraging expansion of agriculture and causing deforestation. Indeeda substantial body of research shows that general increases in agricultural prices leadto deforestation. Using data from 19 Tanzanian regions Angelsen et al. (1999) observeda significant increase in cropped area with increases in agricultural prices. A study byDeininger and Minten (1996) using satellite imagery information from Mexico found asignificant positive relationship between deforestation and agricultural price increases.Similar results were found in two separate studies on deforestation in Thailand byCropper et al. (1997) and Panayotou and Sungsuwan (1994). In Zimbabwe, a study byChipika and Kowero (2000) found a weak positive relationship between agriculturalland expansion and crop price increases.
Simulation results from the two sites in this study presented in Table 3 generallyagree with the above-cited findings. For Gokwe, a 25 % increase in agricultural priceshas the potential to induce about 22% increase in economic benefits from woodlanduse under both the ‘without’ and ‘with’ environmental concern objective functions.These increases in community benefits from the woodlands translate to close to 35 %increase in per household disposable income under the two scenarios. The bulk ofthese benefits would come from an expansion in agricultural land. A projected 7% and8% more land could be converted to agriculture under the ‘without’ and ‘with’environmental concern scenario.
In terms of impact on woodland resource stock, the results from the Gokwe siteimply a modest 2% reduction in the long-term sustainable standing woodlands underboth the ‘without’ and ‘with’ environmental concern scenario. Thus, the cost inenvironmental damage would appear to be relatively small and making the inclusion ofenvironmental concerns in managing and using the woodlands to marginally impairlong term sustainability of the woodlands. Only 3.5% and 4% more household labour isdiverted to the exploitation of woodland resources under the ‘without’ and ‘with’environmental concern scenario, respectively.
Simulations of effects of general agricultural price increases for the Chivicommunity gave results similar to those for Gokwe with the exception being a morepronounced conservation effect compared to the Gokwe site results. The price increaseis estimated to induce 26 and 28% increases in economic benefits under the ‘without’and ‘with’ environmental concern scenarios, respectively. Under both scenarios,households are projected to gain about 40% increase in disposable income, mostprobably due to higher output prices obtaining in Chivi as compared to Gokwe (seeTable 1). Based on the ‘without’ environmental concern objective function, 6% moreland is converted to agriculture compared to 11% under the ‘with’ environmental concernscenario. Thus, taking into account biodiversity concerns into account results in 5%less converted agricultural land for no loss in individual disposal incomes. This isreflected in woodland product consumption that drops by less than 1% under the ‘without’compared to 5% drop under the ‘with’ biodiversity concerns scenario. Consequently,only 1% (half that of Gokwe) and 6% (slightly higher than that of Gokwe) more householdlabour is devoted to exploiting woodlands under the ‘without’ and ‘with’ environmentalconcern scenarios.
In conclusion, agricultural price increases hold potential for improving livelihoodsin Chivi communities more than in Gokwe. This happens through modest increases indisposable incomes, slightly higher levels of woodland products harvesting andconsumption, encroachment on protected woodlands for agriculture, slight increase in

414 A SYSTEM DYNAMICS MODEL FOR MANAGEMENT OF MIOMBO WOODLANDS
labour employment in woodland activities and overall benefits from sale of woodlandproducts. All this comes at a negligible cost in terms of loss in woodland sustainability inthe long run.
Table 3. Impacts of a 25 % increase in output prices
Gokwe Chivi
% % % %No-Env change Env change No-Env change Env change
Benefits from woodlands($’000) 3,068 22 2,999 22 102 26 79 28
Sustainable proportionof woodlands 0.25 -1 0.26 -2 0.51 0.2 0.54 -0.2
Labour used in woodlandactivities (%) 18 3.5 17 4 5 1 3 6
Woodland area convertedto agric. land (ha/yr) 687 7 657 8 20 6 14 11
Average area of standingwoodland (ha) 16,730 -2 17,188 -2 3,959 -0.5 4,065 -0.6
Woodland products usedby community (m3/yr) 43,560 1 41,716 2 1,338 0.1 928 5
Household disposableincome ($/yr) 1,210 34 1,205 35 771.24 40 757 40
5.3 Effect of a loss in agricultural productivityIn general, we would expect changes in agricultural productivity to have anindeterminate direction of impact on woodland use. On one hand, an increase inproductivity which does not have an appreciable impact on commodity prices andlabour demand will lead to an increase in agricultural profitability and hence promoteconversion of woodland to agriculture. On the other hand, yield improvements maytrigger declines in prices affecting agricultural profitability reducing pressure onwoodlands (Kaimowitz and Angelsen 1998). This indeterminacy of the impact ofproductivity on deforestation is borne out in empirical research. Studies by Deiningerand Minten (1996) and Panayoutou and Sungsuwan (1994) showed that increase inagricultural yield was associated with a reduction in deforestation while studies byAngelsen et al. (1999) and Katila (1995) report an increase in deforestation withproductivity improvement. Yet studies by Barbier and Burgess (1996) and Chakraborty(1994) showed no significant effect of yield changes on deforestation.
To assess the impact of general decline in agricultural productivity, we simulatedthe Gokwe and Chivi models with yields reduced by 25 %. Results in Table 4 generallysupport the results of studies elsewhere referred in the previous paragraph. ForGokwe, the decrease in yields are projected to induce, respectively, 22 and 23% reductionin economic benefits from miombo use under the ‘without’ and ‘with’ environmentalconcern objective functions. There is also a 34 % decrease in per household disposable

415C. Sukume and E. Guveya
income under both scenarios. These are largely stemming from 10% and 11% less landconverted to agriculture under the ‘without’ and ‘with’ environmental concern objectivefunctions, respectively.
The Gokwe simulations also indicate that a 25% productivity decline has potentialto boost the average area of standing miombo by 2.7 and 3.4 % under the ‘without’and ‘with’ environmental concern scenario, respectively. The reduction onencroachment on woodlands translates to 2% and 6% less woodland use relatedemployment under the ‘without’ and ‘with’ environmental concern scenarios,respectively.
The simulations for Chivi, a more resource poor community showed similar butmore pronounced of impacts of yield decrease on woodland resource utilisation. A 25%yield decline is projected to induce 26 and 30% decrease in economic benefits fromwoodland use under the ‘without’ and ‘with’ environmental concern scenarios,respectively. At household level, this results in a decrease of 40% in disposable income.
There is scope for a significant reduction in pressure on the woodlands, in relationto demand for agricultural land, in Chivi as compared to Gokwe on both ‘with’ and‘without’ scenarios. However, the trade-off for this appears to be partly reflected in4% and 11% less woodland related employment potential under both scenarios. Becauseconsumption is much lower under baseline conditions in Chivi compared to Gokwe(see Table 1) the effect of the agricultural yield decline on the woodlands is significantlyless. About 1 % more area of woodlands under both the ‘without’ and ‘with’environmental concern scenarios are maintained.
These results show that in both sites agricultural yield reduction could constraindeforestation. This result ought to be qualified much as logic would support thatpressure on the woodlands could be alleviated if households had better incomes.However, the model does not endogenously allow for the possibility of supply inducedchanges in prices due to productivity changes, thus not permitting the possibility ofland extensification compensating for reduced yield.
Table 4. Simulation of effects of 25% decrease in agricultural yields
Gokwe Chivi
% % % %No-Env change Env change No-Env change Env change
Benefits from woodlands($’000) 1,956 -22 1,894 -23 60 -26 43 -30
Sustainable proportionof woodlands (%) 0.25 2 0.28 4 1 0.00 0.53 -1
Labour used in woodlandactivities (%) 17 -2 15 -6 5 -4 3 -11
Woodland area convertedto agric. land (ha/yr) 578 -10 540 -11 17 -11 11 -17
Average area of standingwoodlands (ha) 17,521 2.7 18,120 3.4 4,005 0.7 4,126 0.9
Woodland products useby community (m3/yr) 42,238 -2 39,452 -3 1,308 -2 806 -9
Household disposableincome ($/yr) 593 -34 588 -34 333 -40 322 -40

416 A SYSTEM DYNAMICS MODEL FOR MANAGEMENT OF MIOMBO WOODLANDS
5.4 Effect of an increase in input pricesIncreasing the prices of inputs is likely to lead to two opposing effects (Kaimowitz andAngelsen (1998). On one hand, an increase in input prices could decrease agriculturalprofitability thereby decreasing the incentive for conversion of woodland to agriculture.On the other hand, subsistence farmers following a safety-first food production strategymay substitute cash inputs with land if input prices are increased and this could increasedeforestation. The net effect of this price change is therefore likely to be indeterminate.In a number of CGE modelling efforts that looked at impact of lowering agriculturalsubsidies – which is the same as increasing input prices – this indeterminacy seems tobe supported. A study by Mwanawina and Sankayan (1996) in Zambia estimated thatan increase in input prices tends to increase the level of encroachment on woodlandswhile a similar study in Tanzania showed no effect due to input price increases. Astudy by Coxhead and Shively (1995) in the Philippines estimated a reduction indeforestation due to input price increases.
Other dimensions that may affect how responsive a community’s woodlands useis to input price increases are the initial levels of cash inputs use and the croppingpatterns. Communities in the study areas that use a lot of cash inputs and are involvedin cash crops such as cotton that demand more cash inputs (fertilisers, seedagrochemicals) would tend to exhibit more inelastic response to changes in prices ascompared to communities that traditionally use little bought inputs. Thus we wouldexpect the response to be more muted in Gokwe where cotton growing is a majorenterprise as compared to Chivi which is relatively more subsistence oriented.
To assess the impact of general increase in cash input prices we simulated theGokwe and Chivi models with cash input prices increased by 25 %. Table 5 reports thechanges from the base model results obtained for the two study sites. The minutechanges projected in woodland use as well as inconsistent directions of impacts wouldtend to support the indeterminacy hypothesis. For Gokwe the 25% increase in inputprices is projected to induce only 1 and 1.3% reduction in economic benefits fromwoodland products under the ‘without’ and ‘with’ environmental concern scenarios,respectively. Even though the projected impact is reduction on encroachment onagricultural land, the effects are almost insignificant. Close to 0.2% less land isconverted to agriculture under the ‘without’ and 1% more in the ‘with’ environmentalconcern scenarios, respectively. Corresponding drops on woodland related employmentare only 2% and 1% under the ‘without’ and ‘with’ environmental concern objectivefunctions, respectively. The net projected impact on woodlands indicates contradictoryand very insignificant effects. Though there is a projected 0.1% decrease in area ofwoodlands under the ‘without’ environmental concern scenario, the results for the‘with’ environmental concern scenarios indicate a 0.4% increase in average area ofwoodland resources.
Results show that responses tend to be slightly larger in Chivi supporting thehypothesis that more commercialised communities are more input price inelastic.Still the results show very small changes in woodland use from the 25% input priceincrease in Chivi tending to support the indeterminacy hypothesis. The price increaseis projected to induce only 3 and 2.5% decreases in economic benefits from woodlandproducts under respectively the ‘without’ and ‘with’ environmental concern scenariosaccompanied by loss in woodland related employment that amounts to close to 3% and1% under the ‘without’ and ‘with’ environmental concern, respectively, as well asreductions in per household disposable income that amounts to less than 2 % in both

417C. Sukume and E. Guveya
scenarios. Land converted to agriculture could be reduced by about 0.6% and 0.2%under the ‘without’ and ‘with’ environmental concern scenarios, respectively. Averagewoodland area improves by about 0.2 and 0.1 % under the ‘without’ and ‘with’environmental concern scenarios, respectively. All these results support our earlierassertion that responses in Gokwe would most likely be more muted as compared toChivi.
Table 5. Simulation of effects of 25% increase in agricultural input prices
Gokwe Chivi
% % % %Outcome No-Env change Env change No-Env change Env change
Benefits fromwoodlands ($’000) 2,492 -1 2421 -1.3 79 -3 60 -2.5
Sustainable proportionof woodland 0.25 -0.4 0.27 1 0.51 0.4 0.54 0.00
Labour used on woodlandactivities (%) 17 -2 16 -1 5 -3 3 -1
Woodland converted toagric land (ha/yr) 641 -0.2 604 -1 19 -3 13 -0.2
Average area of standingwoodland (ha) 17,043 -0.1 17,596 0.4 3,988 0.2 4,093 0.1
Woodland products usedby community (m3/yr) 43,099 0.2 40,615 -0.5 1,306 -2 888 0.1
Household disposableincome ($/yr) 887 -1.6 881 -1.7 543 -1.8 531 -1.6
5.5 Effect of a decrease in subsistence incomeThe reduction in income necessary to meet community basic needs which can comeabout through lowering of consumption goods due to economic growth or improvementsin social infrastructure – better roads, clinics near homesteads, more retail out lets,etc – lowering transactions costs, will likely have two conflicting impacts on thewoodlands use. It lowers the need for agriculture to generate enough income to meetsubsistence need and therefore reducing use of woodlands. On the other hand, reductionin labour demand on existing agricultural land may make more labour available forwoodland related activities thus increasing pressure on the forests.
To assess the impact of such a change in the community’s economy we simulatedthe Gokwe and Chivi models with the subsistence parameter arbitrarily set at 25 %less than current. Table 6 reports the changes from base model results obtained forthe two study sites. For Gokwe the decrease in subsistence requirements generallyinduced very mild impacts on woodland use. Table 6 shows that Gokwe experienced atenth of a percent increase in economic benefits under the ‘without’ and third of apercent reduction in economic benefits under the ‘with’ environmental concernscenarios, respectively. All other indicators of woodland condition and community wellbeing with the exception of household disposable income showed responses of less

418 A SYSTEM DYNAMICS MODEL FOR MANAGEMENT OF MIOMBO WOODLANDS
than 1 percent. The only significant impact was on disposable income which increasedby about 9% under both the ‘without and ‘with’ environmental concern scenarios.
Similar results were observed in the case of Chivi with the exception that theimpact on income in Chivi was substantially higher than in Gokwe showing animprovement in per household disposable incomes of about 16% under both scenarios.
The net results tend to support the indeterminacy hypothesis under both decision-making scenarios and in both sites.
Table 6. Simulation of effects of 25% decrease in subsistence income
Gokwe Chivi
% % % %No-Env change Env change No-Env change Env change
Benefits fromwoodlands ($’000) 2,517 0.1 2,446 -0.3 80 -1 62 0.3
Sustainable proportionof woodland (%) 0.25 -0.4 0.27 0.8 0.51 0.2 0.54 0.00
Labour used in woodlandactivities (%) 17 0.00 16 -0.6 5 -1 3 0.3
Woodland convertedto agric land(ha/yr) 644 0.3 607 -0.4 19 -1 13 0.3
Average area of standingwoodland (ha) 17,033 -0.2 17,581 0.3 3,982 0.1 4,089 -0.01
Woodland products useby community (m3/yr) 43,129 0.3 40,647 -0.4 1,325 -1 890 0.3
Household disposableincome ($/yr) 980 9 974 9 641 16 628 16.4
5.6 Effect of a decrease in off-woodland/off-farm wageThe reduction in off-woodland wages, which can come about through poor growth inthe rest of the economy, will likely increase the pressure on woodlands in order tosustain the community (Kaimowitz and Angelsen 1998). To assess the impact of sucha change in the community’s economy we simulated the Gokwe and Chivi models withthe off-woodland wage parameter arbitrarily set at 25 % less than current. Table 7reports the changes from base model results obtained for the two study sites.
The decrease in off-woodland wages generally induced very mild and mixed impactson woodland use in both Gokwe and Chivi. Table 7 shows that impacts on all indicatorsof woodland use were 1 % or less in Gokwe under the two decision scenarios. Largestimpacts of 1.2% and 1.3 % were experienced for decreases in disposable income.Similar results were observed in the case of Chivi. However, in Chivi the negativeimpact on disposable income at 3% under the two scenarios were more pronouncedthan in Gokwe.
An explanation of the mixed direction of impacts of reduction in off-woodlandwages is that our model does not allow reallocation of labour between woodland/

419C. Sukume and E. Guveya
agricultural use and off-woodland activities. Labour allocated to off-woodland activitiesis fixed for the community. Thus, declines in off-woodland incomes will not lead to ashift in labour into agriculture or woodland using activities. In addition, the mild impactswe observe may be partly due to the fact this source of income constitutes only a smallpart of the total income of the household.
Table 7. Simulation of effects of a 25% decrease in off-woodland wages
Gokwe Chivi
% % % %No-Env change Env change No-Env change Env change
Benefits fromwoodlands ($’000) 2,520 0.2 2,441 -0.5 80.75 -0.4 60 -3.4
Sustainable proportionof woodland (%) 0.25 -0.4 0.27 1 0.505 0.00 0.54 0.2
Labour used in woodlandactivities (%) 17 0.00 16 -0.6 5 -1 3 -3
Woodland converted toagric land (ha/yr) 644 0.3 605 -0.7 19 -1 12 -3
Average area ofstanding woodland (ha) 17,023 -0.2 17,627 0.6 3,980 0.05 4,098 0.21
Woodland products useby community (m3/yr) 43,111 0.2 40,525 -0.7 1328 -1 866 -3
Household disposableincome ($/yr) 890 -1.2 884 -1.3 536 -3 523 -3.2
6. MAIN FINDINGS AND CONCLUSIONSThis paper presents and demonstrates a useful framework for analysing the impactsof policies on woodland condition and use. The findings point to the following basicconclusions:
• There is a tendency to extract more wood resources in Gokwe compared toChivi, which, given the difference in access on the two sites, supports the notionthat easy access to woodlands promotes deforestation.
• Introducing biodiversity concerns in a resource abundant area such as Gokwecould reduce deforestation at a lower cost in terms of loss in benefits from thewoodlands as compared to a resource poor area such as Chivi.
• Increase in agricultural product prices has the potential to increase deforestationon both project sites. The magnitude of woodland loss, however, tends to bemore in the forest resource abundant Gokwe compared to a resource poor Chivi.
• Decrease in yields could lead to reduced deforestation in both resource abundantand scarce areas. However, this result may be misleading since the model doesnot allow for a price response to changes in supply.
• Increase in agricultural input prices could lead to a decrease in woodland area on

420 A SYSTEM DYNAMICS MODEL FOR MANAGEMENT OF MIOMBO WOODLANDS
both sites in the long run. However, the change in steady-state proportion ofremaining woodland would appear to be indeterminate tending to support thehypothesis that there are two opposing impacts caused by input price increases –decrease in deforestation due to decline in profitability, and increase indeforestation due to substitution of land for cash inputs.
• A decrease in income required to meet subsistence needs could lead to mixedimpacts on deforestation under both community profit maximisation andmaximisation subject to environmental concern constraints. Though a reductionin the requirement for agriculture to meet basic needs may lead to lessencroachment on forests, the labour released from existing agricultural landmay promote non-agricultural forms of woodland use that exert pressure on theenvironment.
• Though we would expect that declines in growth in the rest of the rural economyto reduce non-agricultural wages and enhance reliance on agriculture therebyleading to deforestation, simulations in this study show mixed results. This islargely due to the structure of the model, which does not allow for a shift inlabour away from off-woodland activities to agriculture.
These conclusions demonstrate the strong effect on woodland use and conditionof agricultural policies and institutional arrangements protecting forests. As Zimbabweproceeds with its second - and much expanded - phase of the land reform andredistribution exercise, it is important that issues of protection of the woodlands arenot ignored. Of particular concern is the lack of consideration for development oflocal level institutions governing the use of forest resources in the current landredistribution exercise. The model presented here provides a tool for potential use incrafting new policies and institutions governing woodland resource use in the newlysettled areas.
However, despite its robustness the model used in the current study can beimproved in a number of ways. There is need to allow for price response to changingsupply and demand conditions for both inputs and outputs from woodlands andagriculture. Differences in woodland product consumption between resource abundantand resource poor areas indicate the need to allow for a demand response to scarcityin the model. Finally, the model can benefit from explicit incorporation of populationdynamics.
ENDNOTES1. CAMPFIRE stands for Communal Areas Management Programme for Indigenous Resources.
REFERENCESAngelsen, A., Shitindi, E.F.K. and Aarrestad, J. 1999 Why do farmers expand their land
into forests. Theories and evidence from Tanzania. Environment and DevelopmentEconomics 4: 313–331.
Barbier, E. J. and Burgess, J.C. 1996 Economic analysis of deforestation in Mexico.Environment and Development Economics 1: 203–39.

421C. Sukume and E. Guveya
Campbell, B., Grundy, I. and Matose, F.1993 Trees and woodlands resources – Technicalpractices of small-scale farmers. In: Bradley, P.N. and McNamara, K. (eds.) Livingwith trees: Policies for forestry management in Zimbabwe. World Bank TechnicalPaper No.210. World Bank, Washington, DC, p 29–62.
Campbell, B.M., Jeffrey, S., Kozanayi, W., Luckert, M., Mutamba, M. and Zindi, C. 2002Household livelihoods in semi-arid regions: Options and constraints. Center forInternational Forestry Research, Bogor.
Central Statistical Office (CSO) 1992 Zimbabwe national census report. GovernmentPrinters, Government of Zimbabwe, Harare.
Chakraborty, M.1994 An analysis of the causes of deforestation in India. In: Brown, K.and Pearce, D. (eds.) The causes of tropical deforestation: Economic and statisticalanalysis of factors giving rise to the loss of tropical forests, 226–39. UniversityCollege Press, London.
Chipika, J.T. and Kowero, G. 2000 Deforestation of woodlands in communal areas ofZimbabwe: Is it due to agricultural policies? Agriculture, Ecosytems and Environment79:175–185.
Coxhead, I. and Shively, G. 1995 Measuring the environmental impacts of economicchange: The case of land degradation in Philippine agriculture. Agricultural EconomicsStaff Paper Series No. 384. University of Wisconsin, Madison.
Cropper, M., Griffiths, C. and Mani, M. 1997 Roads, population pressures, and deforestationin Thailand, 1976–89. Policy Research Working Paper 1726. World Bank, Washington,DC.
Deininger, K. and Minten, B. 1996 Poverty, policies, and deforestation: The case ofMexico. Research project on social and environmental consequences of growth-oriented policies. Working Paper No. 5. Policy Research Department. World Bank,Washington, DC.
Kaimowitz, D. and Angelsen, A. 1998 Economic models of tropical deforestation: Areview. Center for International Forestry Research, Bogor, Indonesia.
Katila, M. 1995 Modelling deforestation in Thailand. Paper presented at the IUFRO WorldCongress, Tampere, Finland.
Mwanawina, I. and Sankayan, P.L. 1996 A computable general equilibrium model tomeasure the effects of structural adjustment programmes on ecology anddevelopment in Zambia. In: Structural adjustment policies and the environment inTanzania, Zambia, and Ethiopia. Preliminary Seminar Report. Agricultural Universityof Norway.
Panayotou, T. and Sungsuwan, S. 1994 An econometric analysis of the causes of tropicaldeforestation: The case of Northeast Thailand. In: Brown, K. and Pearce, D. (eds.)The causes of tropical deforestation: Economic and statistical analysis of factorsgiving rise to the loss of tropical forests, 226–39. University College Press, London.
Scoones, I., Chibudu, C. and Mudhara, M. 1996 Hazards and opportunities: Farminglivelihoods in dryland Africa, lessons from Africa. ZED Books Ltd, New Jersey.
Siziba, S. and Mutamba, M. 2002 Household livelihood strategies in two miombo woodlandsites of different agricultural potential in Zimbabwe. Mimeo.
Sumaila, U.R., Angelsen, A. and Kowero, G. 2001 A system dynamics model for managementof miombo woodlands. In: Modelling methods for policy analysis in miombowoodlands, 17–30. Occasional Paper No. 35, CIFOR, Bogor.

422 A SYSTEM DYNAMICS MODEL FOR MANAGEMENT OF MIOMBO WOODLANDS
Vermeulen, S. 1997 Sharing of state owned resources with local residents: The case ofwood in Mafungautsi State Forest in Gokwe communal areas. Institute ofEnvironmental Studies Working Paper 4. Institute of Environmental Studies,University of Zimbabwe, Harare.
Weibelt, M. 1994 Stopping deforestation in the Amazon: Trade-off between ecologicaland economic targets? Review of World Economics 131: 542–68.

22.Management of miombo woodlandsin Malawi: An application of systemdynamics modelling
R. Kachule, H. Tchale and C. Mataya
ABSTRACTThe effect of different policy changes in the forestry and agriculture sectors of Malawiwere assessed using a systems dynamic model with the acronym MIOMBOSIM on threedifferent sites, namely, Chimaliro, Dzalanyama and Mdeka. The model was applied toestablish the effect of five management regimes on the welfare of the local communitiesand sustainability of forest resources. Five management scenarios were evaluated,namely, ‘command management regime’ which assumes that central, local or villagegovernment controls management of the resources; ‘cooperative management regime’whereby local communities manage the resource with active cooperation amongthemselves; and ‘non cooperative management regime’ whereby stakeholders havefree access to the resources without taking the interests of each other into account.The latter mimics an open access scenario. Further, the command management regimeassumes that the government takes into account ‘social’, ‘environmental’, ‘socialand environmental’ concerns of all stakeholders; thus giving us three potentialmanagement scenarios.
Results indicated that highest total monetary benefits from the woodlands to allstakeholders would be realized under the command model with social concerns in allthe sites. This is contrary to expectations because current policy by the centralgovernment is to devolve management of the woodland resources to the localcommunities and the private sector, a move that implicitly advocates the cooperativemanagement approach. The potential for environmental protection or biodiversityconservation in all sites would appear to lie with the command regime that emphasisesenvironmental concerns. Increases in the price of fuelwood to 75% might notsignificantly influence deforestation in the three sites under all management regimes,

424 MANAGEMENT OF MIOMBO WOODLANDS IN MALAWI
most probably due to the fact that labour for harvesting and transporting the producton the head or with bicycles to distant markets could be a limiting factor for householdsto take advantage of the high prices. Increases in fertilizer prices by 75% could resultin modest increases in total household benefits in both Dzalanyama and Chimaliro,because households would harvest and sell more fuelwood to more than offset anycuts in crop production that would result from using less fertilizer. However, in Mdekatotal household benefits would decline as this site is almost depleted of woodlandresources that households could fall on to offset decreases in agricultural productiondue to low fertilizer use.
Key words: System dynamics, forest resources, households, Malawi.
1. INTRODUCTIONMalawi is a small landlocked country surrounded by Mozambique to the south, east andwest, Tanzania to the north and east and Zambia to the west. It has a land area of118,480 km2. About 9.8 million of its inhabitants occupy a land area of 9.4 million ha.Of the total land area, agricultural land accounts for 61% while forests occupy about38%. About 20% of the total land area is under protected forests consisting of naturalforests (71%), natural grassland (15%), plantation forest area (6%), potentiallyagricultural land (7%) and other protected areas (1percent) (Government of Malawi1998).
The country’s forests are dominated by miombo woodlands, mainly species ofBrachystegia, Julbernadia and Isoberlinia. Miombo woodlands account forapproximately 70% of the total forest area and 97% of all forest species (Governmentof Malawi 1996). The distribution of the forest resources is skewed; with 50% of themin the Northern Region and the rest of the forest resources are distributed equallybetween the densely populated southern and central regions. Administratively, thecountry is divided into three regions (northern, central and southern regions) with atotal of 27 districts.
The population of the country is estimated at 9.8 million with the Southern regionaccounting for 47%, Central region 41% and Northern region 12%. Population growthrate is estimated at 1.9% and 50% of the population is below the age of 15 years.Poverty is widespread in the country and is characterized by hunger, malnutrition, andlow per capita incomes with the most vulnerable groups being women, children andthe elderly. Literacy rate is estimated at 56.6% and 27.2% for men and women,respectively. Life expectancy at birth is estimated at 38.9% for women and 38.6% formen. HIV sero-prevalence rates range from 3.3% in rural areas to 30.4% in majorurban centers (United Nations and Government of Malawi 1993).
The country’s economy is based on agriculture which contributes about 40% ofthe Gross Domestic Product (GDP), accounts for about 90% of the export earnings,offers employment to almost 80% of the population and supplies over 90% of thefood consumed in the country while manufacturing accounts for only 13% of GDP(Malawi Government 2001). Productivity in agriculture has remained low and about60% of the people live below the poverty line. Unless the rate of economic growthexceeds that of population, poverty will continue to increase and exert pressure onshrinking cropland and natural resources. The result could be an ecological imbalancethat has potential to adversely affect the agricultural sector, the backbone oflivelihoods of rural households and the national economy.

425R. Kachule, H. Tchale and C. Mataya
In an effort to contain the deteriorating economic situation, Malawi has since1981 implemented economic reforms, commonly referred to as Structural AdjustmentProgrammes (SAPs), in collaboration with the International Monetary Fund and theWorld Bank. The SAPs aimed at:
• Stabilizing the economy;• Accelerating agricultural growth;• Diversifying the export base;• Increasing efficiency of export substituting enterprises and parastatals;• Improving the mobilization and management of public resources including
sustainable utilisation of natural resources to anchor the economic activities(World Bank 1994).
In line with other on-going initiatives to improve the well being of Malawians,these reforms have potential to influence the behaviour of individuals and industry inways that could impact on the sustainability of the country’s forest resources.
This study was initiated with the purpose of developing a model that woulddemonstrate the potential effects of selected economic reform (SAPs) and sectoralpolicies on the welfare of rural communities and the status of forest resourcesthey depend on. The model was constructed to demonstrate these effects underfive potential natural forest management scenarios, namely: management bygovernment (central, local or village government), referred to as ‘commandregime’; management by local communities with active cooperation amongthemselves, referred to as ‘cooperative regime’; and a situation wherebystakeholders have free access to the resources and do not take the interests ofeach other into account, referred to as ‘non-cooperative regime’. The latter mimicsan open access situation. The command management regime assumes that theregulator who controls the woodland resources (i.e. the government) would takeinto account social and environmental concerns of all stakeholders. This meansthat the regulator could give more weight to environmental concerns when managingthe woodland resources, and this would give us an ‘environmental scenario’ aswould be the case of protecting biodiversity in fragile ecosystems or managingwater catchment areas. Alternatively the regulator could give more weight inmanaging the woodlands to the social concerns of the local communities that dependon these resources, like allowing them free access to collect firewood or performrituals in sacred forests. This would give us a ‘social concern scenario’. Further,the regulator could take into account in managing the woodlands both the socialand environmental concerns, thus giving us a fifth management regime, the ‘socialand environmental concerns scenario’.
Policy experiments were carried out to highlight the potential effects of differentpolicies on rural employment, household incomes, and encroachment on natural forests,and sustainability of the forest resources.
This paper is arranged as follows: section 2 describes the study sites; section 3describes the methodology employed, section 4 presents results on baseline scenarios,section 5 presents policy experiments/sensitivity analyses, and section 6 summarisesthe major findings.

426 MANAGEMENT OF MIOMBO WOODLANDS IN MALAWI
2. DESCRIPTION OF STUDY SITESThe research was conducted in three different sites bordering forest reserves namely,Chimaliro and Dzalanyama in the central region of the country and Mdeka in the SouthernRegion of the country. Tchale et al. (in this book) gives detailed description of eachsite, with more details on Dzalanyama found in Ngalande (1995) and that of Chimaliroin Lowore et al. (1995). Proximity of the area to urban centers was one of the criteriaused in selecting the study sites, since this defined a gradient of accessibility tomarkets and other infrastructure, with those areas far from urban centers being themost deprived of these facilities. Dzalanyama and the Mdeka sites are close to thecities of Lilongwe and Blantyre, respectively, while the Chimaliro site was selectedbecause of its remoteness.
3. METHODOLOGY
3.1 The conceptual modelThe systems dynamic model follows the generic model developed by Sumaila et al.(2001). Two user groups of miombo woodland resources identified in the study sitesbelonged to the ‘household sector’ and the ‘commercial sector’. It was necessary todisaggregate them this way so as to differentiate ‘household consumption’ activitiesas constituting a ‘household sector’ from those that target ‘commercialisation’ offorest products that is done by a few households and mainly in collaboration withmiddlemen, as constituting a ‘commercial sector’. Otherwise in these rural areas weare principally dealing with households only. A third woodland stakeholder is a ‘regulator’who influences decision-making and therefore activities of the two user groups. Theregulator in this case can be the central or local government, or the village authority/government (Figure 1).
Figure 1. Main agents in the model
Household Commercialsector sector
Regulator

427R. Kachule, H. Tchale and C. Mataya
The logic or reasoning guiding the use of the woodland resources is illustrated inFigure 2. In any site there is an area of miombo woodland that local communities haveaccess to, and this area is denoted as Nt. It is part of this area that has been clearedfor the existing agricultural land, Na, which is found in the site and which supportscrops, livestock, habitation and other land-based household necessities. Householdsin the study areas have to make decisions on how to improve food availability/securityand incomes.
For example, both goals and objectives could be partly achieved by encroachingon a woodland area Nm that they harvest for poles and fuelwood for both householdconsumption (Hh) or for sale (Hc).
Figure 2. Decision making process of the household
Total miombo land (Nt)
Agric land (Na) Miombo (Nm)
Household use (Hh) Commercial (Hc)
Fuelwood (Hfw) Poles (Hpo)
Subsistencefarming
Commercialfarming

428 MANAGEMENT OF MIOMBO WOODLANDS IN MALAWI
As mentioned earlier there is no clear demarcation between the household andthe commercial sector in the sense that it is the same household members that indulgein some commercial activities based on forest products. What actually happens isthat households extract firewood and poles principally for domestic use. However,because of limited alternative sources of income, the households extract more thantheir domestic requirements and sell the excess for cash income. This also includescharcoal in some cases. It is the selling activities of the households that basicallyconstitute the activities of the commercial sector in this model. Commercialisation offorest products is increasingly becoming a feature of rural households and is confinedto the informal sector of the economy. It is therefore important to monitor itsdevelopment and contribution to household livelihoods.
Secondly households could improve food security and incomes by expandingcropland area Na through encroachment on the woodland area Nt for subsistence andcommercial farming as well as livestock husbandry.
The households implement these activities within a defined policy environmentthat influences decisions on crop and livestock production as well as harvesting andselling of woodland products. The policy environments and their potential impacts onthe welfare of the households and sustainability of the woodland resources are exploredin detail in Section 5.
3.2 The MIOMBOSIM for Malawi
3.2.1 The command modelIn the command model, the regulator/government influences the behaviour of thehousehold as to its consumption (‘household sector’ activities) and sales choices(‘commercial sector’ activities) by, for example, regulating access to and prices ofwoodland resources. The assumption is that the government would want the householdsto maximize total net benefits Bt through the choice of the amount of labour to beused in the ‘commercial sector’ (Lc) and the ‘household sector’ (Lh) activities in eachyear and in the time horizon, T, of the model. This is the situation that has beencommon in central government policies, but it was observed to be scantly demonstratedor completely absent on the ground in the study sites. The objective function is thereforepresented as follows:
(1)
subject to the relevant ecological and household labour constraints.
and
(2)
where:Bt = Total benefits accruing to household and commercial sectorsBc = Net private benefits accruing to the commercial sector from the use of
woodland resources (i.e. benefits from sales of woodland products plus value

429R. Kachule, H. Tchale and C. Mataya
of harvested woodland products for household use. This applies to householdsthat reported selling woodland products)
Bh
= Net private benefits accruing to the household sector from the use of woodlandresources (i.e. value of harvested woodland products consumed by thehousehold. This applies to households that did not report sale of woodlandproducts)
Be
= Environmental benefitsB
s = Benefits accruing to the whole society
θ = weight put on the harvests by the two sectors to reflect their concern forenvironmental protection, with a value of one indicating strict environmentalor biodiversity protection and a value of zero meaning that there is noprotection for environment or biodiversity, as would be the case in an openaccess situation. We also put weights on the harvests of the ‘commercial’(H
c) and ‘household’ (H
h) sectors in order to incorporate social concerns.
Also,
where ρ is the discount factor and r is the discount rate.The regulator therefore influences choices that reflect environmental, social or a
combination of social and environmental concerns.
3.2.2 The cooperative modelUnder the cooperative regime, it is assumed that there are efforts towards participatorymanagement of the natural resources by all households either on their own or in a jointventure with the government. It is the type of management that governments areencouraging by devolving management of natural forests to local communities. Wewere therefore interested to find out the potential for it and its implication in all thestudy sites. In a cooperative management case we put weights α and (1- α ) to respectivelythe ‘commercial’ and ‘household’ sector benefits as a measure of their preferences soas to maximize their combined benefits from exploiting the woodland resource (Sumailaet al. 2001). The objective function for the cooperative model is presented as:
(3)
subject to the relevant ecological and household labour constraints.
whereBc = Benefits accruing to the ‘commercial sector’Bh = Benefits accruing to the ‘household sector’ α and 1- α = weight put by the commercial and household sectors as a measure oftheir preference in maximizing benefits from the woodland resources.
3.2.3 The non-cooperative modelIn the non-cooperative model, each household aims at maximizing its own privatebenefits without taking into account interests of the other stakeholders. The

430 MANAGEMENT OF MIOMBO WOODLANDS IN MALAWI
management problem facing ‘household sector’ under the non-cooperation is definedas:
(4)
subject to the relevant stock and the labour constraints.Similarly, the non-cooperative management by the ‘commercial sector’ can be
stated as follows.
(5)
subject to the relevant stock and the labour constraints, andwhere
Bc = Benefits accruing to the ‘commercial sector’Bh = Benefits accruing to the ‘household sector’
Based on the conceptual framework of the MIOMBOSIM model and the descriptionof the study sites, it would appear that the cooperative model best describes thesituation observed on the ground during data collection in Dzalanyama and Chimalirosites while the non-cooperative model would appear to depict the prevailing situationin the Mdeka site. However for purposes of this study, policy experiments were madeon the different management scenarios (command, cooperative and non-cooperative)on all the three study sites to find out what would be the outcome if each managementstyle were applied.
All the models were solved using a software package called Powersim.
4. BASELINE DATA AND SCENARIOSBaseline data that was used to run the models for all the three sites are presented inTable 1. This data set gave the base case scenarios, i.e., the “status quo” in all thethree sites. The base case scenarios formed the basis on which policy experimentswere conducted. The data was obtained from field surveys while some were computedfrom secondary sources.
4.1 Results of base case scenarioThe base runs were made under the five different woodland management regimes,viz. command regime with social, environmental and both social and environmentalconcerns; cooperative management regime, and the non-cooperative managementregime. These runs were made to determine, among others, the total monetary woodlandbenefits accruing to both the household and the commercial sectors, average woodlandresources remaining at the end of the simulation period (Ave_WLR), and the employmentand environmental/biodiversity conservation implications associated with the generationof these benefits, among others.

431R. Kachule, H. Tchale and C. Mataya
Table 1. Baseline data for the model
Dzalanyama Chimaliro Mdeka
Proportion of household labour employedon existing agricultural activities (%) 0.39 0.45 0.30
Existing agricultural land, Na, (ha) 8,000 16,300 2,800Social concern parameter, 0.5 0.5 0.5Cost of employing households inharvesting woodland resources (US$/m3) 7.60 6.34 5.10
Cost of inputs including labour used by commercialsector in harvesting woodland resources (US$/ha) 75 30 90
Discount factor [0.89;0.87] [0.89;0.87] [0.91;0.90]Efficiency parameters1 [0.023;0.07] [0.023;0.07] [0.023;0.07]Fertilizer cost (US$/kg) 10.25 10.25 10.25Forest area, Nt, (ha) 17,110 16,000 5,000Proportion of household labour employedfor collecting firewood 0.12 0.12 0.15
Proportion of household labour employed formanagement and control of forest resources .001 .001 .000
Maximum labour available normalized to 1 1 1 1Off-miombo wage (US$/man day) 0.41 0.41 0.41Price paid by of commercial sector fora cubic metre of firewood (US$) 5.7 5.7 5.3
Price paid by of household sector forcubic metre of firewood (US$) 3.2 2.0 4.0
Revenue per ha. of agric. land, Na, (US$) 434.17 180.12 148.30Seed cost (US$/kg) 3.46 5.64 2.45Subsistence income for all households inthe community (US$000) 380.25 519.02 257.95
Survival rate of the miombo woodland 0.95 0.95 0.80Environmental concern parameter [0;1] [0;1] [0;1]Total man days in community (000’ man days/year) 25317.56 18654.70 28246.76Parameter to labour cost function 0.5 0.5 0.5Parameters to household cost function 2 (0.9,0.1) (0.9,0.1) (0.9,0.1)Volume of firewood harvested per household/year (m3) 10 12 10Volume of standing miombo (m3/ha) 80 85 60Initial woodland resources (WLR_0) normalized to 1 1 1 1
1An efficiency parameter represents the efficiency with which either the householdor the commercial sector is harvesting the woodland resources.2 The household is assumed to maximise utility (U (.)), a function of income (I) net ofsubsistence requirements (Imin) and leisure (Lmax - L). That is:
where: (6)
I = gross household incomeImin = subsistence consumptionLmax = maximum labour available to the householdL = labour used by the household in all income generating activities; and α and β areparameters of the utility function.

432 MANAGEMENT OF MIOMBO WOODLANDS IN MALAWI
4.2 Monetary woodland benefitsThe base case scenario (Tables 2a-c) indicates that highest total benefits ( for ‘householdsector’ and ‘commercial sector’) would be derived under the command regime withsocial concerns in all the three sites.
Since some values are very small, they have been reported beyond two decimalpoints to facilitate comparisons because when the absolute values are aggregated forall households in all the sites, the outcome, especially in monetary terms, would probablybe easily ignored in decision making.
Table 2a. Base run scenario for Chimaliro
Variable Command management regime Cooperative Non-
Social Environ- Social plus management cooperative mental environmental management
Benefits to commercialsector ($000’) 179 148 136 199 145
Benefits to householdsector ($000’) 331 109 251 246 107
Total benefits ($000’) 510 257 386 446 252
Ave_WLR 0.526 0.607 0.597 0.591 0.521
Proportion of labourin commercial sector 0.0872 0.065 0.0598 0.0994 0.0642
Proportion of labourin household sector 0.232 0.0249 0.127 0.125 0.0242
Quantity harvested byhousehold sector (000m3) 3061 2635 2431 3632 2658
Quantity harvested bycommercial sector (000m3) 20717 3469 13836 13591 3457
Table 2b. Base run scenario for Dzalanyama
Variable Command management regime Cooperative Non-
Social Environ- Social plus management cooperative mental environmental management
Benefits to commercialsector ($000’) 174 145 128 191 103
Benefits to householdsector ($000’) 539 298 461 434 250
Total benefits ($000’) 713 443 589 645 354
Ave_WLR 0.517 0.601 0.578 0.571 0.425
Proportion of labourin commercial sector 0.0857 0.0642 0.0564 0.0953 0.0564
Proportion of labourin household sector 0.237 0.0549 0.149 0.144 0.0454
Quantity harvested byhousehold sector (000m3) 21353 6785 6784 15671 15209
Quantity harvested bycommercial sector (000m3) 3000 2606 2290 340 2317

433R. Kachule, H. Tchale and C. Mataya
The results also show that households in the ‘household sector’ would derivemore benefits under the same management regime in all the three sites. However,these benefits would be realized at the expense of much lower standing miombo atthe end of the simulation period. In other words, these outcomes would be associatedwith the highest loss of biodiversity in practically all sites.
On the other hand, the commercial sector could derive more benefits under thecooperative management regime in the Chimaliro and Dzalanyama sites.
This would imply that households that engage in selling of woodland productswould have more potential to trade in these products in these two sites as opposed tothe woodland scarce Mdeka site. However, the central government through its ForestDepartment tends to discourage commercially oriented activities from the indigenouswoodlands while at the same time encouraging communities’ participation inmanagement of the woodlands. In return to these efforts, households are allowed tofreely harvest some of the woodland resources such as dead wood for firewood, grass,thatch and poles for house construction.
The non-cooperative regime, which mimics an open access situation, wouldproduce the lowest total benefits in Chimaliro and Dzalanyama, while for Mdeka itwould be the command model with environmental concerns. The latter managementregime is implicit of strict biodiversity conservation with minimal or no harvesting ofthe woodlands, and therefore logically leading to minimal monetary benefits.
4.3 Labour employment potentialThere appears to be a potential for households to increase their employment inwoodland activities for their own consumption rather than for sale for all managementregimes. However, this potential is very low for Mdeka households, ranging fromzero to about 4%, while for Dzalanyama and Chimaliro, sites that are more endowedwith woodland resources, the potential ranges from about 2 to 23%. The commandregime with social concerns appears to offer the best opportunities for labour
Table 2c. Base run scenario for Mdeka
Variable Command management regime Cooperative Non-
Social Environ- Social plus management cooperative mental environmental management
Benefits to commercialsector ($000’) 1.58 0.149 0.141 0.406 0.317
Benefits to householdsector ($000’) 38 0.0845 14.59 14.58 1.19
Total benefits ($000’) 39 0.234 14.73 14.99 1.50
Ave_WLR 0.196 0.208 0.205 0.205 0.185Proportion of labour incommercial sector 0.0162 0.00871 0.00826 0.0133 0.000186
Proportion of labour inhousehold sector 0.0412 0.000247 0.00868 0.00854 0.000373
Quantity harvested byhousehold sector (000m3) 654 1.94 211.43 212.43 29.08
Quantity harvested bycommercial sector (000m3) 29 8.15 8.02 17.25 5.44

434 MANAGEMENT OF MIOMBO WOODLANDS IN MALAWI
employment in household activities in the woodlands while, as expected, the commandregime with environmental concerns offers the least potential. The same trend wasobserved for monetary benefits to the households in all sites. This observation wouldappear to confirm that it is the households that tend to use much of the woodlandresources for own consumption and probably for unreported commercialization. Thecommercial sector appears to be not well developed as demonstrated by its relativelylow monetary benefits in all sites as well as its low potential for labour employmentopportunities ranging from 6 to 10% in Dzalanyama and Chimaliro to zero to 2% inMdeka. Probably the prevailing prices for fuelwood are not high enough to allow forsignificant dislocation of labour from crop production to harvesting and sale offuelwood. Further, the woodlands do not appear to have potential for a significantalleviation of rural unemployment.
4.4 Environmental/biodiversity conservation implicationsWith respect to environmental benefits, i.e., proportion of woodland resources(Ave_WLR) remaining at the end of the simulation period, the command regime withenvironmental concern had the highest values of remaining woodland resources in allthe three sites, being about 60% for Chimaliro and Dzalanyama and about 20% forMdeka. This makes sense because Chimaliro and Dzalanyama have more woodlandresources than Mdeka.
With respect to volumes of harvested wood, the commercial sector would appearto have the potential for harvesting more from the Chimaliro site as compared to thehousehold sector. This could be attributed to the tobacco industry in the Chimaliroarea whereby estate owners buy a lot of wood for use in tobacco production. In thecase of Dzalanyama, the household sector would harvest more woodland resources ascompared to the commercial sector, most probably due to unreported commercializationdone by the household sector and perhaps as a response to woodland conservationmeasures implicit in the co-management efforts introduced by the Forest Departmentin the area; measures that would curb open commercialization of fuelwood whileallowing for its harvesting for household consumption.
The woodlands are mainly encroached upon for agriculture. The three sites havean average household size of five people and a land-holding size of 1.44, 1.25 and0.55 hectares for Dzalanyama, Chimaliro and Mdeka, respectively. The results indicatethat at the end of the simulation period about 40 to 60% of the initial land underwoodlands would remain in Dzalanyama and Chimaliro under all management regimes,while the proportion for Mdeka would be much lower, averaging 20% for all managementregimes. Mdeka experiences more land pressure as already seen from the small averageland holding size for households of similar size to the other two sites. Further, Mdekahas much less woodland cover.
It would appear that the command with social concerns and the non-cooperativemanagement regimes have the potential to deplete the woodlands more rapidly thanthe other regimes. The command regime with environmental concerns appears tohave the best potential for protecting biodiversity.

435R. Kachule, H. Tchale and C. Mataya
5. POLICY EXPERIMENTS/SENSITIVITY ANALYSISSome sensitivity analyses or policy experiments were run based on the results fromthe base scenarios. They were made based on some assumed policy changes withpotential effects on the behaviour and decisions of the household and commercialsectors as they relate to the miombo woodlands. The policy simulations were based onpotential increases in the prices of fuelwood and agricultural inputs, given the stronglinkages between the agriculture and forestry sectors.
Results of the sensitivity analyses would help to guide policy makers on the choiceof woodland management regime to adopt in order to maintain a sustainable stand ofindigenous forest resources as well as to improve the welfare of the local communitiesthat depend on these woodlands.
5.1 Potential effects of increasing the price of fuelwoodRural and urban dwellers in Malawi depend heavily on fuelwood. However, fuelwoodsources are dwindling, very fast in the south and rather slowly in the north of thecountry. Land clearance for agriculture and related activities in Malawi is estimatedat about 48,000 hectares annually (Minde et al. 1997). The pressure on forests andwoodlands fluctuates widely among in the three administrative regions. In thesouthern region that supports 50% of the population, there is little forest cover leftoutside forest reserves. Annual deforestation in this region has been estimated at2,000 hectares. The highest pressure on the forests and woodlands is in the centralregion, which supports about 39% of the population. In this region annual deforestationhas been estimated at about 32,000 hectares. In the northern region that supportsabout 11% of the population the pressure is less and there are more forests andwoodlands. The estimated annual deforestation in this region is about 14,000 hectares(ibid.).
As demand for fuelwood increases its price is bound to increase. We explored thepotential effect of fuelwood price increase on household consumption, commercialisationand sustainability of the woodlands.
In the more woodland rich Dzalanyama and Chimaliro areas, a modest increase inthe price of firewood by 25% would produce a very insignificant effect on the woodlandremaining at the end of the simulation period. This woodland area would decline bybetween 1 and 2% for all management regimes and would remain unchanged in thenon-cooperative management regime in Dzalanyama. Further, this firewood priceincrease would also have a modest but indeterminate effect on commercialisedfuelwood, ranging from 3 to 8% in Dzalanyama, but the changes could become morepronounced in Chimaliro, ranging from 1% (with command management regime thatemphasises social concerns) to 275% under the non-cooperative management regime.
With a price increase of 50% the proportion of woodland that would remain at theend of the simulation period would not decline significantly, remaining under 2% inboth Chimaliro and Dzalanyama for all management regimes. However, if prices wereto increase by 75%, the decline could jump to between 1% and 3% with the exception ofcommand with social and environmental concerns in Dzalanyama that would have adecline of 13%.
However, in the woodland scarce Mdeka, the picture would be more or less the

436 MANAGEMENT OF MIOMBO WOODLANDS IN MALAWI
same, with the area of woodland remaining at the end of the simulation period decliningby less than 1% when firewood prices increase by 25, 50 and 75%.
These price increases might not significantly influence deforestation in all studysites under all management regimes. Labour for harvesting and transporting the producton the head or with bicycles to distant markets could be a limiting factor for householdsto take advantage of the high prices. Further, firewood prices are fairly low, andincreasing them modestly might not trigger a significant relocation of labour fromcrop production to firewood harvesting and selling.
5.2 Potential effects of increasing the price of fertilizerThe major inputs to crop production are fertilizers. These are mostly imported andtheir prices continue to rise. The hypothesis in this section is that increases in fertilizerprices could constrain agriculture production therefore encouraging the localcommunities to increase their reliance on the woodlands, a development that wouldincrease deforestation.
The results indicate that there would be modest changes to total household benefitsfrom woodland resources arising from increasing fertilizer prices by between 25% and50%. When fertilizer prices are increased by 25% household total benefits could increaseby between zero and 11% in Dzalanyama and 4 to 11% in Chimaliro, but decline bybetween 1 and 45% in Mdeka. In Dzalanyama households would harvest more wood forsale, with the non-cooperative management regime providing more flexibility in this,followed by the cooperative management regime. Both these regimes would respectivelyallow for a 135% and 124% increase in commercialized fuelwood. This could increase to106% and 500% if fertilizer prices were to increase by 50%. The increases incommercialized fuelwood would more than offset decline in net revenues from cropproduction due to fertilizer price increases, resulting into the noted modest increasesto total household benefits. The same trends are noted for Chimaliro, with the non-cooperative regime encouraging increased harvest of fuelwood by 68% and this couldrise to about 184% if fertilizer prices were increased by 50%.
Mdeka is a woodland scarce area and would therefore not have the capacity tocushion a decline in total household incomes through increased fuelwood sales whenfertilizer prices increase, hence the noted decreases in total household benefits tobetween 2 and 3% at 25 and 50% fertilizer price increases for respectively the commandmanagement regime with social and command management regime with environmentalconcerns. The decrease is much more pronounced to 27% and 45% for respectively thecooperative and command with social and environmental concerns regimes.
The magnitudes of the resultant changes in fuelwood harvests in the three studysites appear to be very big in some cases, but the actual volumes of fuelwood to beharvested from the woodlands would be fairly small. Since the commercialized volumesof fuelwood are a small fraction of the fuelwood for household consumption the observedpotential increases in commercialized fuelwood would appear to have insignificanteffects on the woodland that would remain at the end of the simulation period. Inother words, the sustainable woodland resources at the end of the simulation periodwould remain relatively unaffected by these fertilizer price increases.

437R. Kachule, H. Tchale and C. Mataya
6. MAIN OBSERVATIONS AND CONCLUSIONa) The results demonstrate that the command management regime that
emphasizes managing the woodlands with emphasis on social concerns wouldbe more relevant to all the three study sites if derivation of highest totalbenefits to both household and commercial sectors is the criterion. Thehouseholds would also derive highest benefits under this management regimein all the three sites, while the commercial sector would do better under thecooperative management regime in Chimaliro and Dzalanyama. These resultswould appear to contradict the logic of the present drive by centralgovernment to devolve ownership and management of the woodlands tothe local communities, a move that implicitly advocates for the adoption ofthe cooperative management regime by the households in managing theseresources. Further, the results demonstrate the relevance of continuingwith government management of the woodland resources in all sites so longas the government gives priority access to the local communities (i.e.employing the command management regime with social concerns).
b) The potential for environmental protection or biodiversity conservation inall sites would appear to lie with the command management regime thatemphasises environmental concerns.
c) In terms of potential for creating employment in these rural areas (or alleviatingunemployment) the command management regime that emphasises socialconcerns would appear to be the best in all sites for household relatedactivities. However, the cooperative management regime appears to havemore labour employment potential for commercialised forestry activities.In general the potential for the forestry sector to alleviate or reduce ruralunemployment in the three sites would appear to be relatively small.
d) Increases in price of fuelwood to at most 75% might not significantly influencedeforestation in the three sites under all management regimes, mostprobably due to the fact that labour for harvesting and transporting theproduct on the head or with bicycles to distant markets could be a limitingfactor for households to take advantage of the high prices. Further, fuelwoodprices are fairly low, and modest increases in prices might not trigger asignificant relocation of labour from crop production to fuelwood harvestingand selling. Another possible reason for this result is that we are dealinglargely with subsistence communities and once they attain their subsistencelevel of income the pressure on the woodlands declines.
e) Increases in fertilizer prices by at most 75% could result in modest increasesin total household benefits in both Dzalanyama and Mdeka, becausehouseholds would harvest more woodland products to more than offset anycuts in crop marketable surplus that would result from using less fertilizer.However, in Mdeka total household benefits would decline as this site isalmost depleted of woodland resources that households could fall on to offsetrevenue declines in agricultural production.
f) Much as emphasis has been on the agriculture and forest sectors, the systemsdynamic model can also incorporate other sectors, like those of mining andconstruction to assess their impact on forest resources and welfare of ruralcommunities.

438 MANAGEMENT OF MIOMBO WOODLANDS IN MALAWI
REFERENCESForestry Research Institute of Malawi 1995 Management of miombo by local communities:
Proceedings of a workshop for technical forestry staff held at Lissasadzi ResidentialTraining Centre – Kasungu District.
Government of Malawi 1996. National Forest Policy of Malawi. Ministry of NaturalResources. 70p.
Government of Malawi 1998 State of environment report for Malawi. EnvironmentalAffairs Department. Montfort Press, Blantyre.
Lowore, J.D., Coote, H.C., Abbot, P.G., Chapola, G.B. and Malembo, L.N. 1995Community use and management of indigenous trees and forest products in Malawi:The case of four villages close to Chimaliro Forest Reserve. 2nd Edition. ForestryResearch Institute of Malawi. Zomba, Malawi.
Minde, I., Kachule, R. and Luhanga, J. 1997 Macro-economic and sectoral policies andtheir influence on the livelihood strategies of households in the miombo woodlands:The case of Malawi. Draft Report. Agricultural Policy Research Unit, University ofMalawi. 86p.
Ngalande, J.D. 1995 An integrated management plan for Dzalanyama Forest Reserve,Malawi. M.Sc. Dissertation, University of Aberdeen. 124p.
Sumaila, U.R., Angelsen, A. and Kowero, G. 2001 A system dynamics model for managementof miombo woodlands. In: Modelling methods for policy analysis in miombowoodlands, 17-30. Occasional Paper No. 35. CIFOR, Bogor.
United Nations and Government of Malawi 1993 A situation analysis of poverty. UNDP/Government of Malawi, Lilongwe.
World Bank 1994 Adjustments in Africa: Reforms, results, and the road ahead. OxfordUniversity Press, Oxford.

Editors
Godwin Kowero, Bruce M. Campbell, Ussif Rashid Sumaila
Policies and Governance Structures
in Woodlands of Southern Africa
Southern Africa is essentially a woodland region. The woodlands are home to some of
the largest herds of wildlife in the world, support a vast livestock industry, play a
pivotal role in the hydrological functioning of the region, support the livelihoods of
millions of people through agriculture, forest products and other services. However,
there is scanty scientific information to guide their development and management.
Given the numerous end uses and many stakeholders, it is not possible to rely
exclusively on conventional forestry approaches and tools to manage the woodlands.
This book highlights different facets of local community governance of woodlands.
The outcomes for people and forest are often dependent on local institutional
arrangements (rules, regulations, organisational dynamics). The book explores the
role of local institutional arrangements in woodland management, in community-based
approaches and in conflict resolution.
It documents approaches and tools to reconcile the demands of the three key
stakeholders on the woodlands (the local communities, government and private sector)
in the framework of the three prominent rural development goals of food security,
increased rural incomes and biodiversity or forest conservation. It also highlights
tradeoffs between the goals and between five potential woodland management options
by: (i) local communities, as a result of devolution of authority and management from
central government, (ii) government but with a strict biodiversity conservation focus,
(iii) government with access given to local communities for basic needs, (iv)
government with a combined conservation focus and limited local community access
for basic needs, and (v) perpetuating the present situation of open access.
PO
LIC
IES AN
D G
OVERN
AN
CE STRU
CTU
RES
IN W
OO
DLA
ND
S O
F SO
UT
HER
N A
FR
ICA
Edit
ors
Godw
in K
ow
ero, B
ruce M
. Cam
pbell,
Ussif R
ashid
Sum
aila
Policies and Governance
Structures in Woodlands
of Southern Africa