Floodplain influences on dissolved organic matter composition and export from the lower...
12
Floodplain influence on dissolved organic matter composition and export from the Mississippi–Atchafalaya River system to the Gulf of Mexico Yuan Shen, * Ce ´dric G. Fichot, and Ronald Benner University of South Carolina, Marine Science Program, Columbia, South Carolina Abstract Comparisons of the concentrations and compositions of dissolved organic matter (DOM) between the lower Mississippi River (MR) and its distributary, the Atchafalaya River (AR), indicated a strong influence of floodplains on DOM in the AR. Concentrations of dissolved organic carbon (DOC), lignin phenols, amino acids, neutral sugars, and chromophoric DOM (CDOM) absorption coefficients were higher in the AR than in the MR. Significantly lower syringyl to vanillyl phenol ratios (S : V) in the AR indicated substantial contributions from gymnosperms (e.g., Taxodium distichum). The lowest S : V values in the AR were measured during maximal litterfall in October–November when yields of lignin phenols were highest. Lower spectral slope coefficients (S 275–295 ) in the AR were indicative of relatively high-molecular-weight CDOM. Yields and compositions of amino acids and neutral sugars indicated DOM in the AR was more bioavailable than in the MR. Nitrogen removal in the floodplain was in part responsible for the significantly lower concentrations of total dissolved nitrogen (TDN) in the AR. Seasonal variability in DOM composition was greater in the AR. About 35% of the DOC and . 44% of the lignin phenols, amino acids, and neutral sugars exported from the Mississippi–Atchafalaya River system was carried by the AR, thereby revealing the important role of the AR in DOM export from the river system. DOC export from rivers was predominantly controlled by water discharge. The long-term (1996–2010) average DOC export from the Mississippi–Atchafalaya River system was 2.70 Tg yr 21 (MR: 1.75 Tg yr 21 ; AR: 0.95 Tg yr 21 ), accounting for 0.8–1.1% of global riverine DOC export. Riverine dissolved organic matter (DOM) influences biological productivity, community structure, microbial metabolism, and air–sea carbon dioxide fluxes in river- influenced ocean margins (Gattuso et al. 1998). Those influences are largely determined by the chemical compo- sition of DOM, which is shaped by source and biogeo- chemical processing (Hedges et al. 1994, 2000). River floodplains are highly productive environments with diverse biogeochemical processes and organic matter sources, so interactions between rivers and their floodplains can have a large effect on the concentrations of dissolved organic carbon (DOC) in rivers (Tockner et al. 1999). Rapid organic matter accumulation occurs in floodplains, which are considered sinks of particulate organic matter and sources of DOM (Tockner et al. 1999). Many of the characteristics of organic matter found in floodplain-influenced rivers are believed to result from floodplain contributions, but they can also be due to variations in upstream water sources, hydrological and climatic conditions, and river size (Battin 1998; Hedges et al. 2000). Direct evidence demonstrating the effects of floodplains on the composition of riverine DOM based on comparisons of rivers having similar climatologies and water sources but distinct floodplain interactions is scarce. The Mississippi (MR) and Atchafalaya (AR) Rivers form the largest river system in North America. The two rivers have similar water sources, but the reaches of the MR and AR from the Old River Control Structure to the Gulf of Mexico are very different. The MR is channelized by artificial levees and has little interaction with its floodplains, whereas the AR floods its alluvial system annually for long time periods and has substantial interactions with its floodplain (Lambou and Hern 1983). The sharp contrast in geomorphology and floodplain interaction between the two rivers together with similar climatic and hydrologic conditions provide a unique opportunity to investigate the influence of floodplains on the concentration and composition of DOM from the Mis- sissippi–Atchafalaya River system. The northern Gulf of Mexico receives large amounts of DOM from the Mississippi–Atchafalaya River system (Malcolm and Durum 1976). Estimates of DOC export from the MR range from 1.7–3.5 Tg yr 21 (Malcolm and Durum 1976; Leenheer 1982; Bianchi et al. 2004), but these estimates do not include the export of DOC from the AR, which accounts for , 30% of the water discharge in the Mississippi–Atchafalaya River system (Kammerter 1990). The AR flows through the largest swamp wilderness in the United States (Atchafalaya Basin Program 2009) and carries higher concentrations of DOC than the MR (Chen and Gardner 2004). Thus, the export of DOC from the AR to the northern Gulf of Mexico is likely large and should therefore be considered. In the present study, the concentrations and composi- tions of DOM from the MR and AR were determined and compared at various stages of the hydrograph during 2009– 2010. DOC, chromophoric dissolved organic matter (CDOM), total dissolved lignin phenols (TDLP), amino acids (TDAA), neutral sugars (TDNS), and nitrogen (TDN) from the two rivers were characterized. In addition, long-term (1996–2010) estimates of DOC export from the MR and AR were examined. * Corresponding author: [email protected] Limnol. Oceanogr., 57(4), 2012, 1149–1160 E 2012, by the Association for the Sciences of Limnology and Oceanography, Inc. doi:10.4319/lo.2012.57.4.1149 1149
Transcript of Floodplain influences on dissolved organic matter composition and export from the lower...
Floodplain influence on dissolved organic matter composition and export from the
Mississippi–Atchafalaya River system to the Gulf of Mexico
Yuan Shen,* Cedric G. Fichot, and Ronald Benner
University of South Carolina, Marine Science Program, Columbia, South Carolina
Abstract
Comparisons of the concentrations and compositions of dissolved organic matter (DOM) between the lowerMississippi River (MR) and its distributary, the Atchafalaya River (AR), indicated a strong influence offloodplains on DOM in the AR. Concentrations of dissolved organic carbon (DOC), lignin phenols, aminoacids, neutral sugars, and chromophoric DOM (CDOM) absorption coefficients were higher in the AR than inthe MR. Significantly lower syringyl to vanillyl phenol ratios (S : V) in the AR indicated substantialcontributions from gymnosperms (e.g., Taxodium distichum). The lowest S : V values in the AR were measuredduring maximal litterfall in October–November when yields of lignin phenols were highest. Lower spectralslope coefficients (S275–295) in the AR were indicative of relatively high-molecular-weight CDOM. Yields andcompositions of amino acids and neutral sugars indicated DOM in the AR was more bioavailable than in theMR. Nitrogen removal in the floodplain was in part responsible for the significantly lower concentrations oftotal dissolved nitrogen (TDN) in the AR. Seasonal variability in DOM composition was greater in the AR.About 35% of the DOC and . 44% of the lignin phenols, amino acids, and neutral sugars exported from theMississippi–Atchafalaya River system was carried by the AR, thereby revealing the important role of the ARin DOM export from the river system. DOC export from rivers was predominantly controlled by waterdischarge. The long-term (1996–2010) average DOC export from the Mississippi–Atchafalaya River systemwas 2.70 Tg yr21 (MR: 1.75 Tg yr21; AR: 0.95 Tg yr21), accounting for 0.8–1.1% of global riverine DOCexport.
Riverine dissolved organic matter (DOM) influencesbiological productivity, community structure, microbialmetabolism, and air–sea carbon dioxide fluxes in river-influenced ocean margins (Gattuso et al. 1998). Thoseinfluences are largely determined by the chemical compo-sition of DOM, which is shaped by source and biogeo-chemical processing (Hedges et al. 1994, 2000). Riverfloodplains are highly productive environments withdiverse biogeochemical processes and organic mattersources, so interactions between rivers and their floodplainscan have a large effect on the concentrations of dissolvedorganic carbon (DOC) in rivers (Tockner et al. 1999).Rapid organic matter accumulation occurs in floodplains,which are considered sinks of particulate organic matterand sources of DOM (Tockner et al. 1999).
Many of the characteristics of organic matter found infloodplain-influenced rivers are believed to result fromfloodplain contributions, but they can also be due tovariations in upstream water sources, hydrological andclimatic conditions, and river size (Battin 1998; Hedgeset al. 2000). Direct evidence demonstrating the effects offloodplains on the composition of riverine DOM based oncomparisons of rivers having similar climatologies and watersources but distinct floodplain interactions is scarce. TheMississippi (MR) and Atchafalaya (AR) Rivers form thelargest river system in North America. The two rivers havesimilar water sources, but the reaches of the MR and ARfrom the Old River Control Structure to the Gulf of Mexicoare very different. The MR is channelized by artificial levees
and has little interaction with its floodplains, whereas theAR floods its alluvial system annually for long time periodsand has substantial interactions with its floodplain (Lambouand Hern 1983). The sharp contrast in geomorphology andfloodplain interaction between the two rivers together withsimilar climatic and hydrologic conditions provide a uniqueopportunity to investigate the influence of floodplains on theconcentration and composition of DOM from the Mis-sissippi–Atchafalaya River system.
The northern Gulf of Mexico receives large amounts ofDOM from the Mississippi–Atchafalaya River system(Malcolm and Durum 1976). Estimates of DOC exportfrom the MR range from 1.7–3.5 Tg yr21 (Malcolm andDurum 1976; Leenheer 1982; Bianchi et al. 2004), but theseestimates do not include the export of DOC from the AR,which accounts for , 30% of the water discharge in theMississippi–Atchafalaya River system (Kammerter 1990).The AR flows through the largest swamp wilderness in theUnited States (Atchafalaya Basin Program 2009) andcarries higher concentrations of DOC than the MR (Chenand Gardner 2004). Thus, the export of DOC from the ARto the northern Gulf of Mexico is likely large and shouldtherefore be considered.
In the present study, the concentrations and composi-tions of DOM from the MR and AR were determined andcompared at various stages of the hydrograph during 2009–2010. DOC, chromophoric dissolved organic matter(CDOM), total dissolved lignin phenols (TDLP), aminoacids (TDAA), neutral sugars (TDNS), and nitrogen(TDN) from the two rivers were characterized. In addition,long-term (1996–2010) estimates of DOC export from theMR and AR were examined.* Corresponding author: [email protected]
Limnol. Oceanogr., 57(4), 2012, 1149–1160
E 2012, by the Association for the Sciences of Limnology and Oceanography, Inc.doi:10.4319/lo.2012.57.4.1149
1149
Methods
Study area—The MR and its distributary, the AR, aredefined herein as the Mississippi–Atchafalaya River system.It is the largest river system in North America and flows3732 km from its headwater source in Lake Itasca(Minnesota) to the northern Gulf of Mexico, draining about41% of the conterminous United States. The Red River joinsthe MR and diverts , 30% of the combined water flow intothe AR at the Old River Control Structure, and theremaining , 70% flows down the lower MR main channel,which is restricted by flood-control levees. Water in the lowerMR travels about 520 km in 5–6 d from the control structureto the Gulf of Mexico. Water discharge from the Mississippi–Atchafalaya River system averaged 5.8 3 1011 m3 yr21
between 1951 and 1979 (Kammerter 1990), supplying about80% of total riverine discharge to the Gulf of Mexico.
The AR, a distributary of the MR, is located in south-central Louisiana and is characterized by extensive flood-plains (Lambou and Hern 1983). The AR combines waterfrom the Red River with water diverted from the MR nearSimmesport (Louisiana) and flows 275 km in a southeasterlydirection to the Gulf of Mexico. The water transit time fromthe control structure to the Gulf of Mexico is about 7 d. Inthe upper 84 km of the AR, water flow is confined by guide(Hern et al. 1980). The flow subsequently enters theAtchafalaya Basin Floodway, where it enters the bayoussystem and floods the basin (Lambou and Hern 1983). TheAtchafalaya Basin Floodway comprises 2129 km2 andexperiences extensive flooding (. 1619 km2 during normalyears; Lambou and Hern 1983). Hydrological patterns inBuffalo Cove and Fordoche (both are within the floodway)reveal prolonged overbank flooding throughout the entireyear. The maximal depth of flooding in these areas variesfrom , 0.1 m to . 1.1 m (Lambou and Hern 1983). Most(60–70%) of the AR discharge enters Atchafalaya Baythrough the main channel from Morgan City, and the restpasses through the Wax Lake Outlet (Fig. 1). The river basinis predominantly forest, cypress (Taxodium distichum)–tupelo (Nyssa aquatica) swamp, and freshwater marsh(Atchafalaya Basin Program 2009).
Sample collection—Water samples were collected duringfive cruises to the northern Gulf of Mexico on the R/VCape Hatteras and the R/V Hugh Sharp between January2009 and March 2010. Sampling sites in the two riverswere located downstream of the Head of Passes in the MRdelta (29.0465uN, 89.3169uW) and in Atchafalaya Bay(29.3824uN, 91.3747uW) (Fig. 1). Average salinity of theMR and AR samples was 0.31 (0.08–0.83) and 0.55 (0.15–1.36), respectively. Water samples were collected near thesurface (1–3 m) with Niskin bottles mounted on aconductivity-temperature-depth (CTD) rosette. Immediate-ly following collection, samples were filtered through pre-combusted (450uC, 4 h) GF/F filters and stored frozen(220uC) in high-density polyethylene screw-cap bottlesuntil analysis of DOC, TDN, amino acids, and neutralsugars in the home laboratory. Water samples for opticalcharacterization were passed through 0.2-mm-pore-sizecartridge filters (Whatman Polycap AS) and stored in the
dark at 4uC in clean glass vials. Dissolved lignin wasisolated by solid-phase extraction from filtered (0.2-mm-pore-size) water samples, which were acidified to pH 2.8with sulfuric acid (Louchouarn et al. 2000).
Chemical analyses—DOC and TDN concentrations weremeasured using high-temperature combustion via a Shimadzutotal organic carbon–V analyzer equipped with an inlinechemiluminescence nitrogen detector. TDAA were measuredas o-phthaldialdehyde derivatives using an Agilent 1100 high-performance liquid chromatography system with a fluores-cence detector (Kaiser and Benner 2005). Asparagine andglutamine were converted to aspartic acid and glutamic acid,respectively, during acid hydrolysis. Sixteen amino acids werequantified: aspartic acid + asparagine (Asx), glutamic acid +glutamine (Glx), serine (Ser), glycine (Gly), threonine (Thr),b-alanine (b-Ala), arginine (Arg), alanine (Ala), c-aminobu-tyric acid (c-Aba), tyrosine (Tyr), valine (Val), phenylalanine(Phe), isoleucine (Ile), and lysine (Lys). Hydrolyzable neutralsugars were determined as TDNS using a Dionex 500 high-performance liquid chromatography system with a pulsedamperometric detector (Kaiser and Benner 2009). Sevenneutral sugars were quantified: fucose (Fuc), rhamnose (Rha),arabinose (Ara), galactose (Gal), glucose (Glc), mannose(Man), and xylose (Xyl). DOC-normalized yields of TDAAand TDNS were calculated as the percentage of DOC asamino acids and neutral sugars, respectively.
Lignin phenols were analyzed using the CuO oxidationmethod (Kaiser and Benner 2011). Lignin phenols weremeasured as trimethylsilyl derivatives using an Agilent7890A gas chromatograph equipped with a DB-5 capillarycolumn and an Agilent 5975 mass selective detector usingselected ion monitoring. Eleven dissolved lignin phenoloxidation products (TDLP11) were quantified: p-hydro-xybenzaldehyde (PAL), p-hydroxyacetophenone (PON),p-hydroxybenzoic acid (PAD), vanillin (VAL), acetovanil-lone (VON), vanillic acid (VAD), syringaldehyde (SAL),acetosyringone (SON), syringic acid (SAD), p-coumaricacid (CAD), and ferulic acid (FAD). DOC-normalizedyields of TDLP11 were calculated as the percentage of DOCas lignin phenols. For comparison purposes, the traditionallignin parameters, L6 and L8 (mg lignin phenols 3 [100 mgorganic carbon]21), are presented in the text. L6 wascalculated based on the sum of vanillyl (VAL, VON, VAD)and syringyl phenols (SAL, SON, SAD), whereas L8 alsoincluded the cinnamyl phenols (CAD and FAD). Molarratios of lignin phenols are presented in this article.
CDOM absorbance spectra (250–800 nm) were measuredusing a dual-beam Shimadzu 1601 spectrophotometer andquartz cuvettes (1- or 5-cm pathlength). Absorbances wereconverted to absorption coefficients, aCDOM(l) (m21), wherel is the wavelength. aCDOM(350) is reported in this study.Spectral slope coefficients, S275–295 (nm21), were calculatedover the range of 275–295 nm assuming an exponentialfunction and using a linear fit of log-linearized aCDOM(l):
aCDOM lð Þ~aCDOM l0ð Þ exp {S l{l0ð Þ½ � ð1Þ
where aCDOM(l) and aCDOM(l0) are absorption coefficientsat wavelengths l and l0 (l0 , l). The DOC-normalized
1150 Shen et al.
aCDOM(350) absorption coefficients (aCDOM(350) DOC21, Lmol21 cm21) were calculated as ratios of aCDOM(350) toDOC concentrations.
Calculations of riverine DOM export—Daily waterdischarge at Belle Chasse and combined discharge atMorgan City and Wax Lake Outlet from January 2009 toMarch 2010 were obtained from the United StatesGeological Survey (USGS) and used as river dischargefor the MR and the AR, respectively. Concentrations ofDOC, TDLP11, TDAA, TDNS, and TDN from the fivesampling dates were averaged to calculate their meanconcentrations. For each parameter, a prediction intervalfor the concentration was calculated using the Student’s t-
distribution (80% confidence level). Normality of distribu-tion was assumed. Daily fluxes of each parameter werecalculated as a range by multiplying their concentrationintervals by daily water discharge. Ranges of the annualexport of DOC, TDLP11, TDAA, TDNS, and TDN fromthe two rivers were calculated as the sum of daily fluxranges of individual parameters in 2009.
Historic (1996–2010) water discharge and DOC concen-trations from U.S. Army Corps of Engineers (USACE) andUSGS National Stream Quality Accounting Network(NASQAN), respectively, were used to provide moreaccurate estimates of DOC export from the MR and theAR. Daily discharge data for the MR (at Tarbert Landing,Mississippi) and the AR (at Simmesport, Louisiana) are
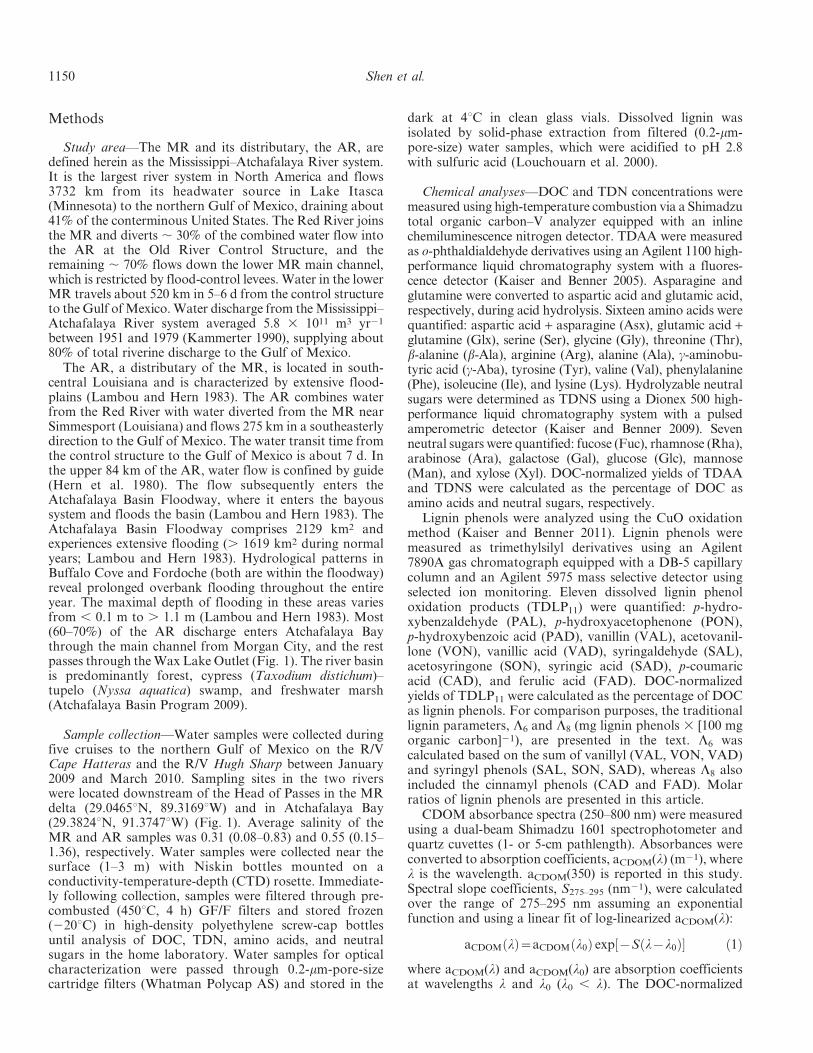
Fig. 1. (a) Map of sampling sites and (b) water fluxes in the Mississippi (MR) andAtchafalaya Rivers (AR). Water samples were collected during five cruises (highlighted by graybars in (b)) between January 2009 and March 2010 from the Mississippi delta near the Head ofPasses (29.0465uN, 89.3169uW) and in Atchafalaya Bay (29.3824uN, 91.3747uW). Five cruiseswere conducted at various stages of the hydrograph. Daily water discharge at Belle Chasse (MR)and the combined discharges at Morgan City and Wax Lake Outlet (AR) were obtained from theUnited States Geological Survey (USGS). The map was generated with Ocean Data View.
Floodplain influence on riverine DOM 1151
available from http://www.mvn.usace.army.mil/eng/edhd/wcontrol/discharge.asp. DOC concentrations in the MR(near St. Francisville, Louisiana) and the AR (at Melville,Louisiana) are available from http://water.usgs.gov/nasqan/,with 209 measurements in each river. Linear interpolationswere performed between successive measurements to esti-mate the concentrations of DOC during ungauged periods.The daily DOC fluxes in the two rivers were determined bymultiplying their daily DOC concentrations by daily waterdischarge. Daily DOC fluxes within a year were summed upto calculate the annual DOC export.
Statistical analyses—Statistically significant differencesbetween the two rivers were tested using the paired-samplest-test (two-tailed, a 5 0.1). A least-squares-fit linearregression was used to examine the relationship betweenvariables. Statistical analyses were performed in IBMStatistical Package for the Social Sciences (SPSS) version 19.
Results
Summary of river discharge during sampling seasons—In2009, water discharge in the MR (at Belle Chasse) and theAR (at Morgan City and Wax Lake Outlet) averaged17,524 and 8004 m3 s21 and ranged from 8042–31,715 m3 s21 and from 2866–15,093 m3 s21, respectively(Table 1; Fig. 1). The MR and the AR exhibited similardischarge patterns (Fig. 1), with a nearly constant waterdischarge ratio of 7 : 3 as regulated by the Old RiverControl Structure. In 2009, high discharge occurredbetween late spring and early summer, followed by lowdischarge from midsummer to early fall. Discharge inspring 2010 was more variable and generally higher than inspring 2009 (Fig. 1). The five sampling dates occurredduring representative stages of the hydrograph (Fig. 1).
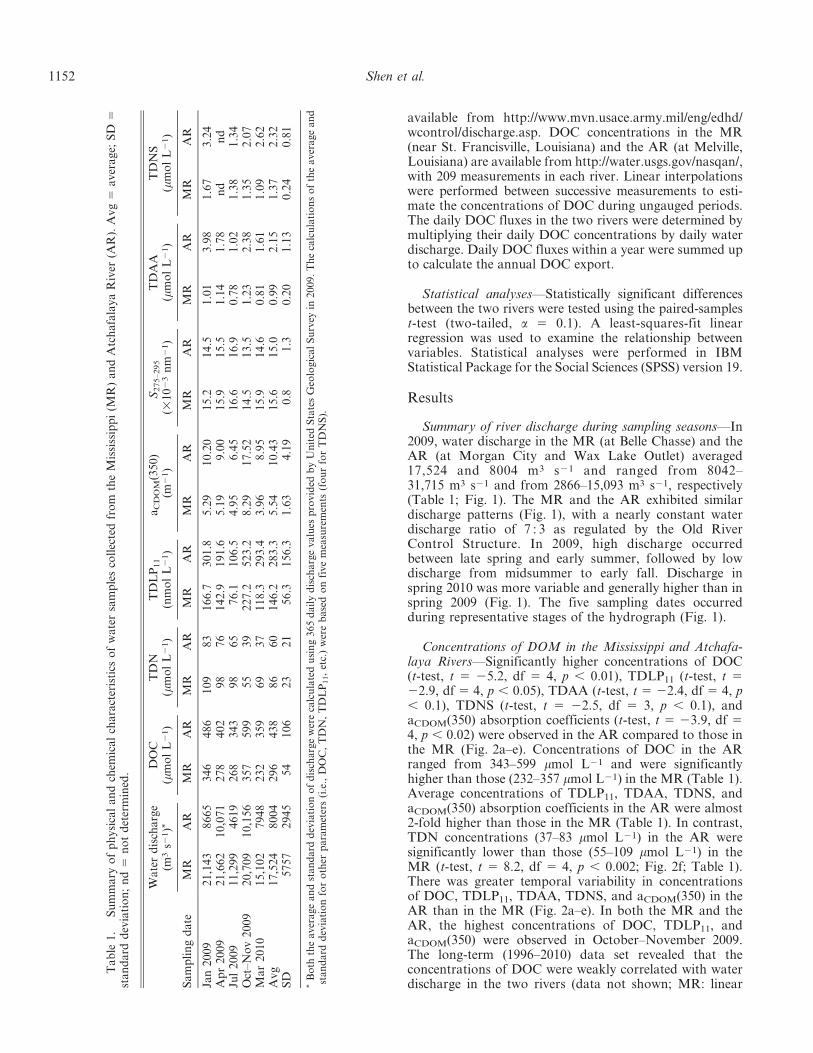
Concentrations of DOM in the Mississippi and Atchafa-laya Rivers—Significantly higher concentrations of DOC(t-test, t 5 25.2, df 5 4, p , 0.01), TDLP11 (t-test, t 522.9, df 5 4, p , 0.05), TDAA (t-test, t 5 22.4, df 5 4, p, 0.1), TDNS (t-test, t 5 22.5, df 5 3, p , 0.1), andaCDOM(350) absorption coefficients (t-test, t 5 23.9, df 54, p , 0.02) were observed in the AR compared to those inthe MR (Fig. 2a–e). Concentrations of DOC in the ARranged from 343–599 mmol L21 and were significantlyhigher than those (232–357 mmol L21) in the MR (Table 1).Average concentrations of TDLP11, TDAA, TDNS, andaCDOM(350) absorption coefficients in the AR were almost2-fold higher than those in the MR (Table 1). In contrast,TDN concentrations (37–83 mmol L21) in the AR weresignificantly lower than those (55–109 mmol L21) in theMR (t-test, t 5 8.2, df 5 4, p , 0.002; Fig. 2f; Table 1).There was greater temporal variability in concentrationsof DOC, TDLP11, TDAA, TDNS, and aCDOM(350) in theAR than in the MR (Fig. 2a–e). In both the MR and theAR, the highest concentrations of DOC, TDLP11, andaCDOM(350) were observed in October–November 2009.The long-term (1996–2010) data set revealed that theconcentrations of DOC were weakly correlated with waterdischarge in the two rivers (data not shown; MR: linear
Table
1.
Su
mm
ary
of
ph
ysi
cal
an
dch
emic
al
cha
ract
eris
tics
of
wa
ter
sam
ple
sco
llec
ted
fro
mth
eM
issi
ssip
pi
(MR
)a
nd
Atc
ha
fala
ya
Riv
er(A
R).
Av
g5
av
era
ge;
SD
5st
an
da
rdd
evia
tio
n;
nd
5n
ot
det
erm
ined
.
Sa
mp
lin
gd
ate
Wa
ter
dis
cha
rge
(m3
s21)*
DO
C(m
mo
lL
21)
TD
N(m
mo
lL
21)
TD
LP
11
(nm
ol
L2
1)
aC
DO
M(3
50
)(m
21)
S2
75
–2
95
(31
02
3n
m2
1)
TD
AA
(mm
ol
L2
1)
TD
NS
(mm
ol
L2
1)
MR
AR
MR
AR
MR
AR
MR
AR
MR
AR
MR
AR
MR
AR
MR
AR
Jan
20
09
21
,14
38
66
53
46
48
61
09
83
16
6.7
30
1.8
5.2
91
0.2
01
5.2
14
.51
.01
3.9
81
.67
3.2
4A
pr
20
09
21
,66
21
0,0
71
27
84
02
98
76
14
2.9
19
1.6
5.1
99
.00
15
.91
5.5
1.1
41
.78
nd
nd
Jul
20
09
11
,29
94
61
92
68
34
39
86
57
6.1
10
6.5
4.9
56
.45
16
.61
6.9
0.7
81
.02
1.3
81
.34
Oct
–N
ov
20
09
20
,70
91
0,1
56
35
75
99
55
39
22
7.2
52
3.2
8.2
91
7.5
21
4.5
13
.51
.23
2.3
81
.35
2.0
7M
ar
20
10
15
,10
27
94
82
32
35
96
93
71
18
.32
93
.43
.96
8.9
51
5.9
14
.60
.81
1.6
11
.09
2.6
2A
vg
17
,52
48
00
42
96
43
88
66
01
46
.22
83
.35
.54
10
.43
15
.61
5.0
0.9
92
.15
1.3
72
.32
SD
57
57
29
45
54
10
62
32
15
6.3
15
6.3
1.6
34
.19
0.8
1.3
0.2
01
.13
0.2
40
.81
*B
oth
the
av
era
ge
an
dst
an
da
rdd
evia
tio
no
fd
isch
arg
ew
ere
calc
ula
ted
usi
ng
36
5d
ail
yd
isch
arg
ev
alu
esp
rov
ided
by
Un
ited
Sta
tes
Geo
log
ica
lS
urv
eyin
2009.
Th
eca
lcu
lati
on
so
fth
eaver
age
an
dst
an
da
rdd
evia
tio
nfo
ro
ther
pa
ram
eter
s(i
.e.,
DO
C,
TD
N,
TD
LP
11,
etc.
)w
ere
ba
sed
on
fiv
em
easu
rem
ents
(fo
ur
for
TD
NS
).
1152 Shen et al.
regression, R2 5 0.0218, p , 0.05, n 5 209; AR: linearregression, R2 5 0.0356, p , 0.01, n 5 209).
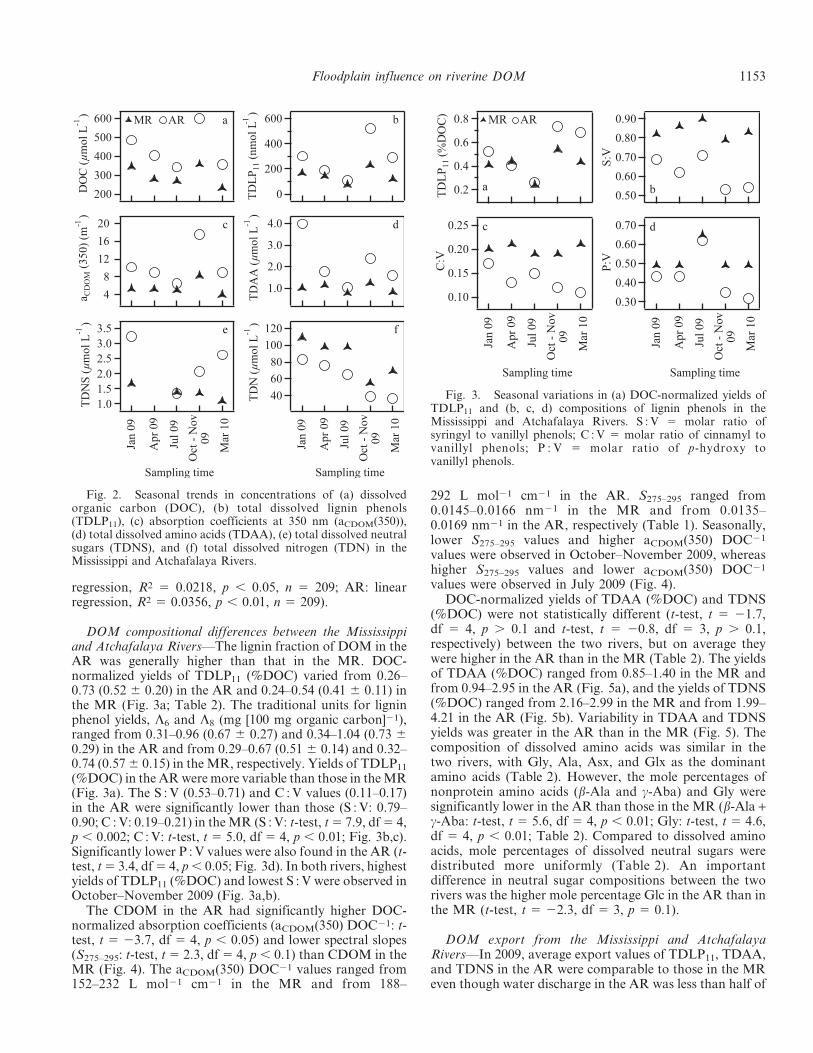
DOM compositional differences between the Mississippiand Atchafalaya Rivers—The lignin fraction of DOM in theAR was generally higher than that in the MR. DOC-normalized yields of TDLP11 (%DOC) varied from 0.26–0.73 (0.52 6 0.20) in the AR and 0.24–0.54 (0.41 6 0.11) inthe MR (Fig. 3a; Table 2). The traditional units for ligninphenol yields, L6 and L8 (mg [100 mg organic carbon]21),ranged from 0.31–0.96 (0.67 6 0.27) and 0.34–1.04 (0.73 60.29) in the AR and from 0.29–0.67 (0.51 6 0.14) and 0.32–0.74 (0.57 6 0.15) in the MR, respectively. Yields of TDLP11
(%DOC) in the AR were more variable than those in the MR(Fig. 3a). The S : V (0.53–0.71) and C : V values (0.11–0.17)in the AR were significantly lower than those (S : V: 0.79–0.90; C : V: 0.19–0.21) in the MR (S : V: t-test, t 5 7.9, df 5 4,p , 0.002; C : V: t-test, t 5 5.0, df 5 4, p , 0.01; Fig. 3b,c).Significantly lower P : V values were also found in the AR (t-test, t 5 3.4, df 5 4, p , 0.05; Fig. 3d). In both rivers, highestyields of TDLP11 (%DOC) and lowest S : V were observed inOctober–November 2009 (Fig. 3a,b).
The CDOM in the AR had significantly higher DOC-normalized absorption coefficients (aCDOM(350) DOC21: t-test, t 5 23.7, df 5 4, p , 0.05) and lower spectral slopes(S275–295: t-test, t 5 2.3, df 5 4, p , 0.1) than CDOM in theMR (Fig. 4). The aCDOM(350) DOC21 values ranged from152–232 L mol21 cm21 in the MR and from 188–
292 L mol21 cm21 in the AR. S275–295 ranged from0.0145–0.0166 nm21 in the MR and from 0.0135–0.0169 nm21 in the AR, respectively (Table 1). Seasonally,lower S275–295 values and higher aCDOM(350) DOC21
values were observed in October–November 2009, whereashigher S275–295 values and lower aCDOM(350) DOC21
values were observed in July 2009 (Fig. 4).DOC-normalized yields of TDAA (%DOC) and TDNS
(%DOC) were not statistically different (t-test, t 5 21.7,df 5 4, p . 0.1 and t-test, t 5 20.8, df 5 3, p . 0.1,respectively) between the two rivers, but on average theywere higher in the AR than in the MR (Table 2). The yieldsof TDAA (%DOC) ranged from 0.85–1.40 in the MR andfrom 0.94–2.95 in the AR (Fig. 5a), and the yields of TDNS(%DOC) ranged from 2.16–2.99 in the MR and from 1.99–4.21 in the AR (Fig. 5b). Variability in TDAA and TDNSyields was greater in the AR than in the MR (Fig. 5). Thecomposition of dissolved amino acids was similar in thetwo rivers, with Gly, Ala, Asx, and Glx as the dominantamino acids (Table 2). However, the mole percentages ofnonprotein amino acids (b-Ala and c-Aba) and Gly weresignificantly lower in the AR than those in the MR (b-Ala +c-Aba: t-test, t 5 5.6, df 5 4, p , 0.01; Gly: t-test, t 5 4.6,df 5 4, p , 0.01; Table 2). Compared to dissolved aminoacids, mole percentages of dissolved neutral sugars weredistributed more uniformly (Table 2). An importantdifference in neutral sugar compositions between the tworivers was the higher mole percentage Glc in the AR than inthe MR (t-test, t 5 22.3, df 5 3, p 5 0.1).
DOM export from the Mississippi and AtchafalayaRivers—In 2009, average export values of TDLP11, TDAA,and TDNS in the AR were comparable to those in the MReven though water discharge in the AR was less than half of
Fig. 2. Seasonal trends in concentrations of (a) dissolvedorganic carbon (DOC), (b) total dissolved lignin phenols(TDLP11), (c) absorption coefficients at 350 nm (aCDOM(350)),(d) total dissolved amino acids (TDAA), (e) total dissolved neutralsugars (TDNS), and (f) total dissolved nitrogen (TDN) in theMississippi and Atchafalaya Rivers.
Fig. 3. Seasonal variations in (a) DOC-normalized yields ofTDLP11 and (b, c, d) compositions of lignin phenols in theMississippi and Atchafalaya Rivers. S : V 5 molar ratio ofsyringyl to vanillyl phenols; C : V 5 molar ratio of cinnamyl tovanillyl phenols; P : V 5 molar ratio of p-hydroxy tovanillyl phenols.
Floodplain influence on riverine DOM 1153
that in the MR (Table 3). More than 44% of the totalaverage export of TDLP11, TDAA, and TDNS werederived from the AR, whereas only 24% of the totalTDN export was derived from the AR (Table 3).
During 1996–2010, the daily export of DOC from theMississippi–Atchafalaya River system exhibited large annu-al and interannual variations (Fig. 6a). The daily export ofDOC from the river system varied 3–10-fold within a yearand 2–4-fold within a month (Fig. 6a). Typically, lowerDOC export occurred between late summer and fall (e.g.,August–October), and higher export occurred between earlyspring and midsummer (e.g., February–June), with peak
export occurring between April and early June (Fig. 6b).Annual variations appeared to be more pronounced inperiods of higher DOC export and less marked during lowexport periods (Fig. 6b). The pattern of the 15-yr averagedaily DOC flux generally followed the hydrograph (Fig. 6b).DOC fluxes were strongly correlated with water discharge inboth the MR and the AR (data not shown; MR: linearregression, R2 5 0.8650, p , 0.0001, n 5 209; AR: linearregression, R2 5 0.8640, p , 0.0001, n 5 209). A muchweaker relationship was found between DOC fluxes andDOC concentrations in the two rivers (data not shown; MR:linear regression, R2 5 0.2246, p , 0.0001, n 5 209; AR:linear regression, R2 5 0.2556, p , 0.0001, n 5 209).
Annual DOC export during 1996–2010 in the MR andAR varied widely year by year (Table 4). The high DOCexport in 1996, 2008, and 2009 was nearly double the lowvalues in 2000 and 2006. Interestingly, the percentagecontribution of the AR to the total DOC export from theriver system varied within a narrow range (32–38%;Table 4). Over the 15-yr period, the average annual exportof DOC from the Mississippi–Atchafalaya River systemwas 2.70 6 0.61 Tg yr21 (MR: 1.75 6 0.40 Tg yr21; AR:0.95 6 0.21 Tg yr21), with about 35% of the contributioncoming from the AR (Table 4).
Discussion
Floodplain contributions to DOM in the AtchafalayaRiver—The water diverted from the MR at the Old RiverControl Structure accounts for , 75% of the water in the
Table 2. Mole percentages (mol%) and DOC-normalizedyields (%DOC) of amino acids, lignin phenols, and neutral sugarsin the Mississippi (MR) and Atchafalaya River (AR). Data arepresented as average 6 standard deviation. DAA 5 dissolvedamino acids; DLP 5 dissolved lignin phenols; DNS 5 dissolvedneutral sugars. n 5 the number of measurements.
n MR AR
Compound*
Amino acids (DAA, mol%) 5Asx 12.760.7 13.162.0Glx 8.060.8 10.563.2Ser 7.761.1 9.964.1Gly 29.366.0 24.364.0Thr 7.861.7 8.161.1b-Ala 5.361.4 4.261.6Arg 2.060.5 2.260.4Ala 14.161.0 13.061.0c-Aba 1.460.3 1.060.3Tyr 0.860.5 1.160.2Val 4.061.7 4.961.4Phe 2.460.6 2.460.4Ile 2.260.6 2.460.9Lys 2.260.5 2.960.4
Lignin phenols (DLP, mol%) 5PAL 5.660.1 5.860.9PON 4.560.4 4.260.7PAD 10.261.7 9.561.8VAL 16.161.2 18.461.4VON 8.860.3 10.160.8VAD 14.260.5 17.562.2SAL 13.460.6 12.060.7SON 8.760.6 7.160.7SAD 10.760.2 9.160.2CAD 3.160.2 2.660.4FAD 4.760.4 3.760.3
Neutral sugars (DNS, mol%) 4Fuc 14.560.8 11.462.1Rha 14.063.5 12.661.5Ara 11.361.6 10.662.0Gal 18.966.3 14.762.4Glc 17.561.6 30.0610.6Man 10.960.8 8.662.9Xyl 12.862.0 12.062.2
Yield (%DOC)
TDAA 1.1260.20 1.7060.75TDLP11 0.4160.11 0.5260.20TDNS 2.6460.35 3.0661.10
* Abbreviations were provided in the Methods.
Fig. 4. Seasonal variations in (a) DOC-normalized CDOMabsorption coefficients (aCDOM(350) DOC21) and (b) spectralslopes (S275–295) in the Mississippi and Atchafalaya Rivers.
1154 Shen et al.
AR. The Red River joins the Atchafalaya just below the OldRiver Control Structure and contributes the remaining waterforming the AR. Substantially higher concentrations ofDOC, dissolved lignin, amino acids, neutral sugars, andCDOM absorption coefficients were measured in the ARcompared to the MR in this study, and the long-term (1996–2010) average DOC concentration in the AR is significantlyhigher than in the MR (t-test, t 5 211.2, df 5 207, p ,0.0001). The higher DOC concentrations in the AR could bedue to the input of high concentrations from the Red River,input from the extensive floodplains and swamp–bayousystems in the Atchafalaya basin, or both. Total organiccarbon in the Red River (at Alexandria, Louisiana) duringthis study averaged 754 mmol L21 (USGS 2009, 2010), andassuming DOC is 60% of total organic carbon (Meybeck1982), the average DOC concentration in the Red River was, 452 mmol L21. This DOC concentration is higher than theaverage concentration (296 mmol L21) in the MR and could
account for , 13% of the elevated DOC concentrationsobserved in the AR. This indicates another source of DOMbesides the Red River is primarily responsible for elevatedDOC concentrations in the AR.
The drainage basins of the MR and the AR have similarclimatic conditions but different vegetation, land use, andgeomorphological features. About 57% of the Mississippibasin is used for row-crop agriculture (Brown et al. 2005),whereas the Atchafalaya basin is predominantly bottom-land hardwood forest, cypress–tupelo swamp, and fresh-water marsh (Atchafalaya Basin Program 2009). TheAtchafalaya basin is considered to be among the mostproductive swamps in the world (Atchafalaya BasinProgram 2009). The MR is constrained by levees and haslimited interaction with floodplain vegetation and soils,whereas the AR flows through vast bayous, swamps, andbackwater lakes that flood annually for extended periods(Lambou and Hern 1983). During wet seasons, higherwater levels in the AR cause inundation of the surroundingcypress–tupelo swamps, bayous, and organic-rich soils.Watershed vegetation, hydrology, floodplain interactions,and land use have major influences on dissolved constit-uents in rivers (Hern et al. 1980; Lambou and Hern 1983;Peduzzi et al. 2008), and their influences on the concentra-tion and composition of DOM in the MR and the AR areapparent.
The composition of lignin phenols is particularly usefulfor distinguishing between angiosperm and gymnospermvegetation based on the relative abundances of syringyl (S)and vanillyl (V) phenols (Hedges and Mann 1979; Hedgeset al. 2000). The relatively high S : V ratios in MR DOM areindicative of a dominant angiosperm source. The S : Vvalues in the AR were significantly lower, indicatingimportant contributions from gymnosperms within thebasin or the Red River. Grasses account for nearly half ofthe vegetation in the Red River watershed, and cottonwood(e.g., Populus deltoides), willow (e.g., Salix nigra), and oak(e.g., Quercus alba) are also common (Matthews et al.2005). Because these plants are angiosperms, the Red Riveris an unlikely source of the low S : V values in AR DOM. Incontrast, the AR basin encompasses large cypress–tupeloswamps, and cypresses are deciduous gymnosperms thathave no syringyl phenols (Opsahl and Benner 1995). Thelow S : V values in AR DOM are consistent with the inputof lignin phenols derived from cypress needles and woodwithin the numerous swamps and bayous in the flood-plains. It is also possible that sorption (Hernes et al. 2007)
Fig. 5. Seasonal variations in DOC-normalized yields of (a)TDAA and (b) TDNS in the Mississippi and Atchafalaya Rivers.
Table 3. Annual export of freshwater, DOC, TDLP11, TDAA, TDNS, and TDN from the Mississippi (MR) and Atchafalaya River(AR) in 2009.
Water(31011 m3 yr21)
DOC(31011 mol yr21)
TDLP11
(3107 mol yr21)TDAA
(3108 mol yr21)TDNS
(3108 mol yr21)TDN
(31010 mol yr21)
MR 5.5 1.6(60.5) 8.1(65.2) 5.5(61.8) 7.6(62.4) 4.7(62.1)AR 2.5 1.1(60.4) 7.2(66.6) 5.4(64.8) 5.9(63.7) 1.5(60.9)River system 8.1 2.7(60.9) 15(612) 11(66.6) 13(66.2) 6.3(63.0)AR contribution (%)* 31 40 47 50 44 24
Export is reported as average values with prediction intervals in the parentheses (80% confidence level).* The relative contribution (%) of the Atchafalaya River to the total DOC export from the river system.
Floodplain influence on riverine DOM 1155
as well as biological and photochemical processes (Bennerand Kaiser 2011) play a role in shaping the composition oflignin phenols in the two rivers.
Lignin phenols and CDOM are readily leached fromplant litter and surface soils (Benner et al. 1990; Hernes etal. 2007). The elevated DOC-normalized yields of ligninphenols (%DOC) and CDOM (aCDOM(350) DOC21) in theAR compared to the MR are indicative of floodplaincontributions to AR DOM. The lower S275–295 values in theAR are indicative of high-molecular-weight CDOM thathas experienced minimal photochemical degradation(Helms et al. 2008; Fichot and Benner in press). Theaverage yields (%DOC) of neutral sugars and amino acidsare both higher in the AR than in the MR, indicating theoccurrence of fresh and bioavailable DOM in the AR(Benner 2003). The relative enrichment of glycine indissolved amino acids is indicative of an increasing extentof biodegradation (Hedges et al. 1994), and the significantlyhigher glycine content in MR DOM indicates more extensive
biodegradation than was observed in AR DOM. Nonproteinamino acids (b-Ala and c-Aba) are also indicative of morehighly altered DOM (Hedges et al. 2000), and theycomprised a significantly larger percentage of the aminoacids in MR than AR DOM. Neutral sugar compositions inMR DOM are relatively enriched in deoxy sugars (Rha andFuc) and depleted in Glc compared with the AR DOM,further indicating the input of fresher DOM in the AR andmore altered DOM in the MR (Hedges et al. 2000). Thesecomparisons of DOM composition in the two riversconsistently indicate a strong floodplain source of relativelyfresh, less altered, and more bioavailable DOM in the AR.
Significantly lower concentrations of TDN were ob-served in the AR. This could be due to dilution by the RedRiver, nitrogen removal in the AR floodplain, or both.Dissolved inorganic nitrogen in the Red River (atAlexandria, Louisiana) during this study averaged14 mmol L21 (USGS 2009, 2010). This value is about 4–8times lower than the dissolved nitrogen concentrations in
Fig. 6. (a) Long-term (1996–2010) daily DOC fluxes in the Mississippi–Atchafalaya River system, and (b) daily average DOC fluxes(solid line) and water fluxes (dashed line) during the 15-yr period from 1996 to 2010. The gray lines represent the standard deviations ofdaily average DOC fluxes.
1156 Shen et al.
the MR and is largely responsible for the lower TDNconcentrations in the AR. A variety of processes, such asbiological assimilation, denitrification, and sedimentationin the AR floodplain can also remove dissolved nitrogenfrom river water. Nitrogen assimilation by floodplainvegetation in the AR is likely to be substantial given itshigh productivity (Atchafalaya Basin Program 2009).Denitrification has been observed in a variety of habitatsin the Atchafalaya floodplain (Lindau et al. 2008). The
deposition and resuspension of sediments in Atchafalayafloodplain soils enhances the biogeochemical processing ofnitrogen, and high sedimentation rates lead to storage ofnitrogen in floodplain sediments (Xu 2006). The Atchafa-laya floodplain has been reported to be a sink for totalnitrogen (Xu 2006). It appears nitrogen removal processesin the lower MR are less efficient because flood-controllevees limit interactions with floodplains.
Concentrations of DOC, lignin phenols, amino acids,neutral sugars, and CDOM varied seasonally. Temporalvariability in the concentrations and compositions of DOMwas more pronounced in the AR than in the MR.Differences in DOM concentrations and compositionsbetween the two rivers were enhanced during higher waterdischarge. Particularly high concentrations of DOC,TDLP11, and CDOM absorption coefficients and theirDOC-normalized yields were observed in the AR duringOctober–November 2009. Litterfall in bottomland hard-wood and cypress–tupelo swamps is maximal duringSeptember through November in southern Louisiana(Conner and Day 1976), and the observed increases inDOC, TDLP11, and CDOM during October–November2009 coincided with peak litterfall in the Atchafalayafloodplain. The highest yields of TDLP11 and the lowestS : V values in the AR were observed at this time and areconsistent with greater input from cypress. These observa-tions taken together suggest that the coupling between thefloodplain and hydrology greatly regulates seasonal trendsin the concentrations and compositions of riverine DOM(Peduzzi et al. 2008).
Export of DOC from the Mississippi–Atchafalaya Riversystem—The 15-yr (1996–2010) average DOC export fromthe MR was estimated to be 1.75 Tg yr21. Previousestimates of DOC export from the MR are quite variable,
Table 4. Long-term (1996–2010) annual DOC export fromthe Mississippi (MR) and Atchafalaya River (AR). Avg 5average; SD 5 standard deviation.
YearMR
(Tg yr21)AR
(Tg yr21)River system
(Tg yr21)AR contribution
(%)*
1996 2.34 1.21 3.54 341997 1.83 1.02 2.85 361998 2.21 1.03 3.24 321999 1.66 0.89 2.55 352000 1.13 0.70 1.83 382001 1.77 1.04 2.81 372002 1.87 1.07 2.94 362003 1.44 0.78 2.22 352004 1.95 1.11 3.06 362005 1.26 0.64 1.90 342006 1.09 0.59 1.69 352007 1.48 0.82 2.31 362008 2.21 1.14 3.35 342009 2.22 1.31 3.53 372010 1.87 0.90 2.77 32Avg 1.75 0.95 2.70 35SD 0.40 0.21 0.61 2
Both the average and standard deviation were calculated using datacollected over 15 yr from 1996–2010.
* The relative contribution (%) of the Atchafalaya River to the total DOCexport from the river system.
Table 5. Comparison of DOC export estimates in the Mississippi and Atchafalaya Rivers. n 5 the number of DOC measurements;nd 5 not determined.
YearDischarge
(31011 m3 yr21)DOC*
(mmol L21) n
DOC export (Tg yr21){
ReferenceCalculated Reported
MR
1969 4.5 293662 6 1.59 1.72 Malcolm and Durum 1976nd 4.4 500 nd 2.63 3.48 Leenheer 19821998–1999 4.9 4896163 6 2.88 3.11 Bianchi et al. 2004May 2000–May 2001 3.8 375642 13 1.72 1.51 Dubois et al. 20102009 5.5 312646 4 2.07 1.96 This study2009 5.8 321627 12 2.22 nd USACE and NASQAN1996–2010 4.6 309663 209 1.75 nd USACE and NASQAN
AR
1974–1977 2.1 5176167 770 1.30 nd Hern et al. 1980nd 1.2 533 nd 0.74 0.76 Leenheer 19821976–1977 1.2 333 36 0.46 0.46 Lambou and Hern 19832009 2.5 4586111 4 1.39 1.33 This study2009 2.5 431664 12 1.31 nd USACE and NASQAN1996–2010 2.0 3866111 209 0.95 nd USACE and NASQAN
* DOC concentrations are reported as average values 6 standard deviations.{ Except for USACE and NASQAN, calculated DOC export for other studies was determined by multiplying the average DOC concentrations by water
discharge.
Floodplain influence on riverine DOM 1157
ranging from 1.51–3.48 Tg yr21 (Table 5). Differencesamong export estimates could be due to the use of differentcalculation methods, variability in DOC concentrations,and the interannual variability in water discharge. Leenheer(1982) reported the highest DOC export from the MR, andbased on our simple calculation it appears that the methodsused by Leenheer (1982) to calculate DOC export were, inpart, responsible for the high export estimate (Table 5).Bianchi et al. (2004) reported a relatively high DOC export(3.11 Tg yr21) for 1998–1999, but their water discharge (5.33 1011 m3 yr21) value obtained from Meade (1996)included discharge from both the MR and the AR. In thecalculated DOC export presented in Table 5 (2.88 Tg yr21),discharge (4.9 3 1011 m3 yr21) from the MR duringsampling years (1998–1999) was used. The similaritybetween reported DOC export and calculated values forother studies suggests relatively little effect of calculationapproaches on reported export from the MR and AR(Table 5). Estimates of the MR DOC export in 2009 usingdata from this study and data from USACE and NASQANwere similar, but they were relatively high compared withthe 15-yr average value (Table 5). The relatively high DOCexport in 2009 was associated with El Nino and hurricaneevents that caused higher than normal precipitation andwater discharge.
The 15-yr (1996–2010) average DOC export from theAR was estimated to be 0.95 Tg yr21. As observed in theMR, differences among previous DOC export estimates(0.46–1.40 Tg yr21) from the AR were largely due tovarying discharge and DOC concentrations (Table 5). LowDOC export estimates (0.46 and 0.74 Tg yr21) wereassociated with low water discharge (Leenheer 1982;Lambou and Hern 1983). The AR discharge reported byLeenheer (1982) was recorded at Morgan City, which didnot include discharge through the Wax Lake Outlet (30–40% of total AR discharge). Comparable DOC exportestimates (1.06–1.23 Tg yr21) were obtained by includingthe discharge through the Wax Lake Outlet. Dischargevalues reported by Lambou and Hern (1983) weremeasured in the AR floodway during 1976–1977 whenthe discharge was much lower than historic values andtherefore the DOC export estimate was relatively low. Thelow DOC concentration reported by Lambou and Hern(1983) also contributed to the low DOC export estimate for1976–1977 (Table 5). Estimates of the AR DOC export in2009 using data from this study and data from USACE andNASQAN were similar.
The AR accounts for , 30% of the total water dischargein the Mississippi–Atchafalaya River system. However,DOC budgets for the northern Gulf of Mexico typically donot include the AR contribution. The long-term (1996–2010) average DOC export from the AR accounted for 35%of the total export from the river system. In 2009, theexport of total dissolved lignin, amino acids, and neutralsugars from the AR was comparable to those from the MR.Therefore, the export of DOM from the AR should beconsidered in future studies of the effects of riverinematerials on coastal processes, such as coastal productivityand hypoxia in the northern Gulf of Mexico. Here, wesuggest using the 15-yr average DOC export value. The
average export of DOC from the Mississippi–AtchafalayaRiver system between 1996 and 2010 was 2.70 Tg yr21.Global riverine DOC export is estimated to be 250–360 Tg yr21 (Meybeck 1982; Aitkenhead and Mcdowell2000); thus, the Mississippi–Atchafalaya River systemsupplies 0.8–1.1% of riverine DOC to the global ocean.
Large temporal (annual and interannual) variations inDOC export from the river system were apparent between1996 and 2010. Regression analyses indicated DOC exportfrom the two rivers was influenced by DOC concentrations,but export was predominantly controlled by water dis-charge, which explained . 86% of the variation in DOCexport from both rivers. Riverine DOC export increases inDecember and crests between April and early June, whenhigh discharge normally occurs. Seasonal lows in waterdischarge normally occur during late summer and early fall,sharply reducing the export of DOC from the rivers. Highannual DOC export occurred during years (1996, 2008, and2009) with high water discharge, whereas low DOC exportoccurred in years (2000 and 2006) with historically lowwater discharge.
Comparisons with other large river systems—The threelargest river systems in terms of water discharge are theAmazon, Congo, and Orinoco Rivers (Milliman andMeade 1983). The DOC export from the Mississippi–Atchafalaya River system (2.70 Tg yr21) is much lowerthan that from the Amazon (22.1 Tg yr21; Richey et al.1990), Congo (12.4 Tg yr21; Coynel et al. 2005), andOrinoco Rivers (5.0 Tg yr21; Lewis and Saunders 1989),largely due to the substantially higher water discharge fromthe three largest rivers and, in the case of the Congo River,due also to higher DOC concentrations. The two largestArctic rivers, the Yenisei and Lena, have comparable waterdischarge to the Mississippi–Atchafalaya River system but, 2-fold higher DOC export (4.69 and 5.83 Tg yr21,respectively) due to their higher DOC concentrations(Raymond et al. 2007). Dissolved lignin (TDLP11) exportfrom the Yenisei and Lena Rivers were recently estimated(75 and 122 Gg yr21, respectively; R. M. W. Amonunpubl.) and are 3–5-fold higher than that from theMississippi–Atchafalaya River system (25 Gg yr21). Thegreater relative export of DOC and lignin from the Yeniseiand Lena Rivers compared with the Mississippi–Atchafa-laya River system could be related to floodplain interac-tions during peak discharge of Arctic rivers in the spring,but additional studies are needed to explore this possibility.
Floodplains are typically very productive environmentswith diverse metabolic and physicochemical gradients thatinfluence the fluxes, transformations, and fates of dissolvedand particulate materials in rivers. Comparisons of DOMin the Mississippi and Atchafalaya Rivers revealed thatfloodplain interactions increase DOC concentrations, alterDOM compositions, and reduce nitrogen loading in theAtchafalaya River. Similar observations can be gleanedfrom comparisons of CDOM from other free-flowing andregulated rivers. Higher CDOM absorption coefficientsand DOC-normalized yields were observed in the Congo(Spencer et al. 2009), Orinoco (Battin 1998), Mackenzie(Osburn et al. 2009), Yukon (Spencer et al. 2008), and
1158 Shen et al.
Atchafalaya Rivers (this study), compared to regulatedrivers like the Yangtze (Guo et al. 2007), Mississippi (thisstudy), and Rhone Rivers (Para et al. 2010). Additionalstudies are needed to gain further insights about the roles offloodplains in shaping the concentrations and compositionsof DOM in rivers. The processes occurring in riverfloodplains affect the photochemical and microbial reac-tivity of riverine DOM exported to the coastal ocean andthereby influence the metabolic balance and air–sea carbondioxide exchange in ocean margins.
AcknowledgmentsWe thank Steven E. Lohrenz, Wei-Jun Cai, and Kjell
Gundersen for providing us with the opportunity to participatein the GulfCarbon cruises. We thank Shengkang Liang formeasurements of neutral sugars, and Leanne Powers and thecrews of the R/V Cape Hatteras and the R/V Hugh Sharp forsampling assistance. We are grateful to the associate editor andtwo anonymous reviewers for their thoughtful suggestions andconstructive comments. This research was funded by grants fromthe U.S. National Science Foundation (0850653 to R. Benner,0752254 to S. E. Lohrenz, and 0752110 to W.-J. Cai).
References
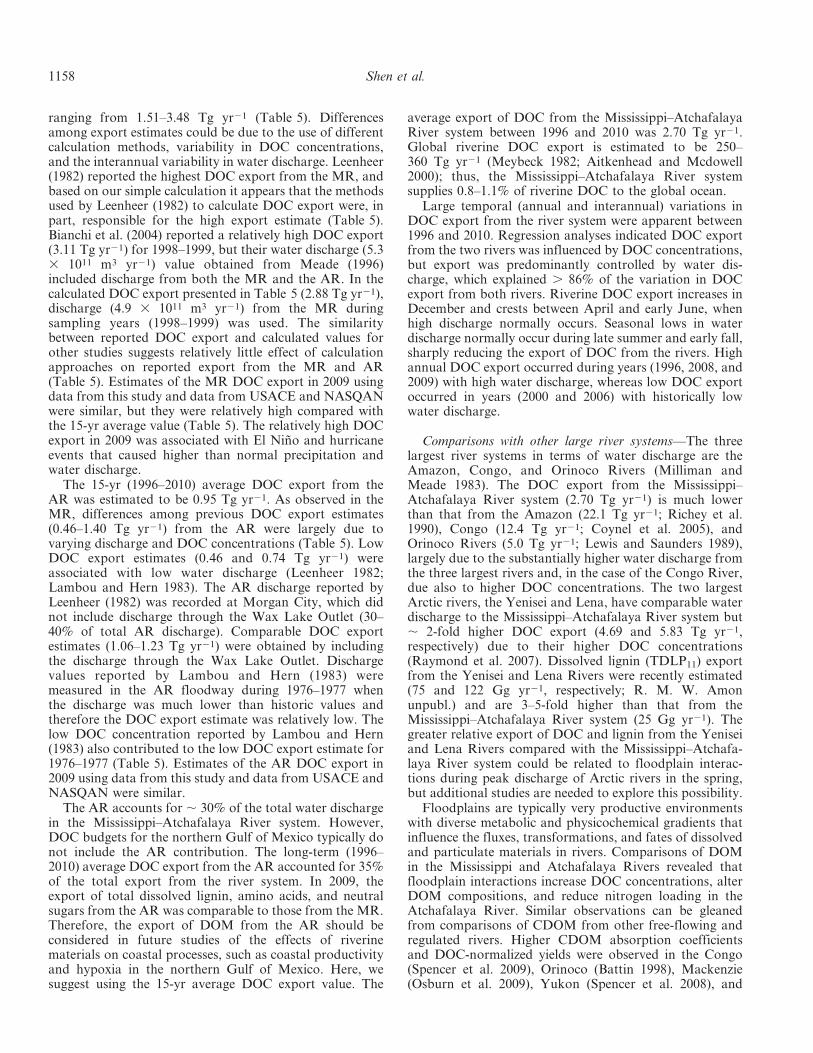
AITKENHEAD, J. A., AND W. H. MCDOWELL. 2000. Soil C : N ratioas a predictor of annual riverine DOC flux at local and globalscales. Global Biogeochem. Cycles 14: 127–138, doi:10.1029/1999GB900083
ATCHAFALAYA BASIN PROGRAM. 2009. FY 2010 annual plan.Louisiana Department of Natural Resources.
BATTIN, T. J. 1998. Dissolved organic matter and its opticalproperties in a blackwater tributary of the upper OrinocoRiver, Venezuela. Org. Geochem. 28: 561–569, doi:10.1016/S0146-6380(98)00028-X
BENNER, R. 2003. Molecular indicators of the bioavailability ofdissolved organic matter, p. 121–137. In S. Findlay and R.Sinsbaugh [eds.], Aquatic ecosystems: Interactivity of dis-solved organic matter. Elsevier.
———, AND K. KAISER. 2011. Biological and photochemicaltransformations of amino acids and lignin phenols in riverinedissolved organic matter. Biogeochemistry 102: 209–222,doi:10.1007/s10533-010-9435-4
———, K. WELIKY, AND J. I. HEDGES. 1990. Early diagenesis ofmangrove leaves in a tropical estuary: Molecular-levelanalyses of neutral sugars and lignin-derived phenols.Geochim. Cosmochim. Acta 54: 1991–2001, doi:10.1016/0016-7037(90)90267-O
BIANCHI, T. S., T. FILLEY, K. DRIA, AND P. G. HATCHER. 2004.Temporal variability in sources of dissolved organic carbon inthe lower Mississippi River. Geochim. Cosmochim. Acta 68:959–967, doi:10.1016/j.gca.2003.07.011
BROWN, A. V., K. B. BROWN, D. C. JACKSON, AND W. K. PIERSON.2005. Lower Mississippi River and its tributaries, p. 231–281.In A. C. Benke and C. E. Cushing [eds.], Rivers of NorthAmerica. Elsevier Academic Press.
CHEN, R. F., AND G. B. GARDNER. 2004. High-resolutionmeasurements of chromophoric dissolved organic matter inthe Mississippi and Atchafalaya River plume regions. Mar.Chem. 89: 103–125, doi:10.1016/j.marchem.2004.02.026
CONNER, W. H., AND J. W. DAY. 1976. Productivity andcomposition of a baldcypress-water tupelo site and abottomland hardwood site in a Louisiana swamp. Am. J.Bot. 63: 1354–1364, doi:10.2307/2441844
COYNEL, A., P. SEYLER, H. ETCHEBER, M. MEYBECK, AND D.ORANGE. 2005. Spatial and seasonal dynamics of totalsuspended sediment and organic carbon species in the CongoRiver. Global Biogeochem. Cycles 19: GB4019, doi:10.1029/2004GB002335
DUBOIS, K. D., D. LEE, AND J. VEIZER. 2010. Isotopic constraintson alkalinity, dissolved organic carbon, and atmosphericcarbon dioxide fluxes in the Mississippi River. J. Geophys.Res. Biogeosciences 115: G02018, doi:10.1029/2009JG001102
FICHOT, C. G., AND R. BENNER. In press. The spectral slopecoefficient of chromophoric dissolved organic matter (S275–295)as a tracer of terrigenous dissolved organic carbon in river-influenced ocean margins. Limnol. Oceanogr.
GATTUSO, J. P., M. FRANKIGNOULLE, AND R. WOLLAST. 1998.Carbon and carbonate metabolism in coastal aquaticecosystems. Annu. Rev. Ecol. Syst. 29: 405–434, doi:10.1146/annurev.ecolsys.29.1.405
GUO, W., C. A. STEDMON, Y. HAN, F. WU, X. YU, AND M. HU. 2007.The conservative and non-conservative behavior of chromo-phoric dissolved organic matter in Chinese estuarine waters.Mar. Chem. 107: 357–366, doi:10.1016/j.marchem.2007.03.006
HEDGES, J. I., G. L. COWIE, J. E. RICHEY, P. D. QUAY, R. BENNER,M. STROM, AND B. R. FORSBERG. 1994. Origins and processingof organic-matter in the Amazon River as indicated bycarbohydrates and amino-acid. Limnol. Oceanogr. 39:743–761, doi:10.4319/lo.1994.39.4.0743
———, AND D. C. MANN. 1979. The characterization of planttissues by their lignin oxidation products. Geochim. Cos-mochim. Acta 43: 1803–1807, doi:10.1016/0016-7037(79)90028-0
———, AND OTHERS. 2000. Organic matter in Bolivian tributaries ofthe Amazon River: A comparison to the lower mainstream.Limnol. Oceanogr. 45: 1449–1466, doi:10.4319/lo.2000.45.7.1449
HELMS, J. R., A. STUBBINS, J. D. RITCHIE, E. C. MINOR, D. J.KIEBER, AND K. MOPPER. 2008. Absorption spectral slopes andslope ratios as indicators of molecular weight, source, andphotobleaching of chromophoric dissolved organic matter.Limnol. Oceanogr. 53: 955–969, doi:10.4319/lo.2008.53.3.0955
HERN, S. C., V. W. LAMBOU, AND J. BUTCH. 1980. Descriptivewater quality for the Atchafalaya Basin, Louisiana. Las Vegas(Nevada): US Environmental Protection Agency, Office ofResearch and Development, Environmental MonitoringSystems Laboratory.
HERNES, P. J., A. C. ROBINSON, AND A. K. AUFDENKAMPE. 2007.Fractionation of lignin during leaching and sorption andimplications for organic matter ‘‘freshness.’’ Geophys. Res.Lett. 34: L17401, doi:10.1029/2007GL031017
KAISER, K., AND R. BENNER. 2005. Hydrolysis induced racemiza-tion of amino acids. Limnol. Oceanogr.: Methods 3: 318–325,doi:10.4319/lom.2005.3.318
———, AND ———. 2009. Biochemical composition and sizedistribution of organic matter at the Pacific and Atlantic time-series stations. Mar. Chem. 113: 63–77, doi:10.1016/j.marchem.2008.12.004
———, AND ———. 2011. Characterization of lignin by gaschromatography and mass spectrometry using a simplifiedCuO oxidation method. Anal. Chem. 84: 459–464, doi:10.1021/ac202004r
KAMMERTER, J. C. 1990. Water fact sheet: Largest rivers in theUnited States. Open-file report 87-242. U.S. GeologicalSurvey, Department of Interior.
LAMBOU, V. W., AND S. C. HERN. 1983. Transport of organic-carbon in the Atchafalaya basin, Louisiana. Hydrobiologia98: 25–34, doi:10.1007/BF00019248
Floodplain influence on riverine DOM 1159
LEENHEER, J. 1982. United States Geological Survey datainformation service, p. 355–356. In E. T. Degens [ed.],Transport of carbon and minerals in major world rivers, Part1. Geologisch-Palaontologischen Institut, Univ. Hamburg.
LEWIS, W. M., AND J. F. SAUNDERS. 1989. Concentration andtransport of dissolved and suspended substances in theOrinoco River. Biogeochemistry 7: 203–240, doi:10.1007/BF00004218
LINDAU, C. W., R. D. DELAUNE, A. E. SCARONI, AND J. A. NYMAN.2008. Denitrification in cypress swamp within the Atcha-falaya River Basin, Louisiana. Chemosphere 70: 886–894,doi:10.1016/j.chemosphere.2007.06.084
LOUCHOUARN, P., S. OPSAHL, AND R. BENNER. 2000. Isolation andquantification of dissolved lignin from natural waters usingsolid-phase extraction and GC/MS. Anal. Chem. 72:2780–2787, doi:10.1021/ac9912552
MALCOLM, R., AND W. DURUM. 1976. Organic carbon andnitrogen concentrations and annual organic carbon load ofsix selected rivers of the United States. Water-Supply Paper1817-F. U.S. Geological Survey.
MATTHEWS, W. J., C. C. VAUGHN, K. B. GIDO, AND E. MARSH-MATTHEWS. 2005. Southern plains rivers, p. 283–325. In A. C.Benke and C. E. Cushing [eds.], Rivers of North America.Elsevier Academic Press.
MEADE, R. 1996. River-sediment inputs to major deltas, p. 63–85.In J. Milliman and B. Haq [eds.], Sea-level rise and coastalsubsidence: Causes, consequences and strategies. Kluwer.
MEYBECK, M. 1982. Carbon, nitrogen, and phosphorus transport byworld rivers. Am. J. Sci. 282: 401–450, doi:10.2475/ajs.282.4.401
MILLIMAN, J. D., AND R. H. MEADE. 1983. World-wide delivery ofriver sediment to the oceans. J. Geol. 91: 1–21, doi:10.1086/628741
OPSAHL, S., AND R. BENNER. 1995. Early diagenesis of vascularplant-tissues—lignin and cutin decomposition and biogeo-chemical implications. Geochim. Cosmochim. Acta 59:4889–4904, doi:10.1016/0016-7037(95)00348-7
OSBURN, C. L., L. RETAMAL, AND W. F. VINCENT. 2009.Photoreactivity of chromophoric dissolved organic mattertransported by the Mackenzie River to the Beaufort Sea. Mar.Chem. 115: 10–20, doi:10.1016/j.marchem.2009.05.003
PARA, J., P. G. COBLE, B. CHARRIERE, M. TEDETTI, C. FONTANA,AND R. SEMPERE. 2010. Fluorescence and absorption proper-ties of chromophoric dissolved organic matter (CDOM) incoastal surface waters of the northwestern Mediterranean Sea,influence of the Rhone River. Biogeosciences 7: 4083–4103,doi:10.5194/bg-7-4083-2010
PEDUZZI, P., F. ASPETSBERGER, T. HEIN, F. HUBER, S. KARGL-WAGNER, B. LUEF, AND Y. TACHKOVA. 2008. Dissolved organicmatter (DOM) and bacterial growth in floodplains of theDanube River under varying hydrological connectivity.Fundam. Appl. Limnol. 171: 49–61, doi:10.1127/1863-9135/2008/0171-0049
RAYMOND, P. A., AND OTHERS. 2007. Flux and age of dissolvedorganic carbon exported to the Arctic Ocean: A carbonisotopic study of the five largest Arctic rivers. GlobalBiogeochem. Cycles 21: GB4011, doi:10.1029/2007GB002934
RICHEY, J. E., J. I. HEDGES, A. H. DEVOL, P. D. QUAY, R.VICTORIA, L. MARTINELLI, AND B. R. FORSBERG. 1990.Biogeochemistry of carbon in the Amazon River. Limnol.Oceanogr. 35: 352–371, doi:10.4319/lo.1990.35.2.0352
SPENCER, R. G. M., G. R. AIKEN, K. P. WICKLAND, R. G. STRIEGL,AND P. J. HERNES. 2008. Seasonal and spatial variability indissolved organic matter quantity and composition from theYukon River basin, Alaska. Global Biogeochem. Cycles 22:GB4002, doi:10.1029/2008GB003231
———, AND OTHERS. 2009. Photochemical degradation of dissolvedorganic matter and dissolved lignin phenols from the CongoRiver. J. Geophys. Res. Biogeosciences 114: G03010,doi:10.1029/2009JG000968
TOCKNER, K., D. PENNETZDORFER, N. REINER, F. SCHIEMER, AND J.V. WARD. 1999. Hydrological connectivity, and the exchangeof organic matter and nutrients in a dynamic river–floodplainsystem (Danube, Austria). Freshw. Biol. 41: 521–535,doi:10.1046/j.1365-2427.1999.00399.x
USGS. 2009. Water-data report, Red River at Alexandria, LA[Internet]. Baton Rouge (Louisiana): United Sates GeologicalSurvey (USGS) [accessed 2011 May 05], Available fromhttp://wdr.water.usgs.gov/wy2009/pdfs/07355500.2009.pdf
USGS. 2010. Water-data report, Red River at Alexandria, LA[Internet]. Baton Rouge (Louisiana): United Sates GeologicalSurvey (USGS) [accessed 2011 May 05]. Available fromhttp://wdr.water.usgs.gov/wy2010/pdfs/07355500.2010.pdf
XU, Y. J. 2006. Total nitrogen inflow and outflow from a largeriver swamp basin to the Gulf of Mexico. Hydrol. Sci. J. 51:531–542, doi:10.1623/hysj.51.3.531
Associate editor: Roland Psenner
Received: 22 November 2011Accepted: 24 April 2012Amended: 25 April 2012
1160 Shen et al.