Incorporating Uncertainty Into the Ranking of SPARROW Model Nutrient Yields From...
16
INCORPORATING UNCERTAINTY INTO THE RANKING OF SPARROW MODEL NUTRIENT YIELDS FROM MISSISSIPPI ⁄ ATCHAFALAYA RIVER BASIN WATERSHEDS 1 Dale M. Robertson, Gregory E. Schwarz, David A. Saad, and Richard B. Alexander 2 ABSTRACT: Excessive loads of nutrients transported by tributary rivers have been linked to hypoxia in the Gulf of Mexico. Management efforts to reduce the hypoxic zone in the Gulf of Mexico and improve the water quality of rivers and streams could benefit from targeting nutrient reductions toward watersheds with the highest nutrient yields delivered to sensitive downstream waters. One challenge is that most conventional watershed modeling approaches (e.g., mechanistic models) used in these management decisions do not consider uncertainties in the predictions of nutrient yields and their downstream delivery. The increasing use of parameter estimation procedures to statistically estimate model coefficients, however, allows uncertainties in these predictions to be reliably estimated. Here, we use a robust bootstrapping procedure applied to the results of a previous application of the hybrid statistical ⁄ mechanistic watershed model SPARROW (Spatially Referenced Regression On Watershed attributes) to develop a statistically reliable method for identifying ‘‘high priority’’ areas for management, based on a probabilistic ranking of delivered nutrient yields from watersheds throughout a basin. The method is designed to be used by managers to prioritize watersheds where additional stream monitoring and evaluations of nutrient-reduction strategies could be undertaken. Our ranking proce- dure incorporates information on the confidence intervals of model predictions and the corresponding watershed rankings of the delivered nutrient yields. From this quantified uncertainty, we estimate the proba- bility that individual watersheds are among a collection of watersheds that have the highest delivered nutri- ent yields. We illustrate the application of the procedure to 818 eight-digit Hydrologic Unit Code watersheds in the Mississippi ⁄ Atchafalaya River basin by identifying 150 watersheds having the highest delivered nutri- ent yields to the Gulf of Mexico. Highest delivered yields were from watersheds in the Central Mississippi, Ohio, and Lower Mississippi River basins. With 90% confidence, only a few watersheds can be reliably placed into the highest 150 category; however, many more watersheds can be removed from consideration as not belonging to the highest 150 category. Results from this ranking procedure provide robust information on watershed nutrient yields that can benefit management efforts to reduce nutrient loadings to downstream coastal waters, such as the Gulf of Mexico, or to local receiving streams and reservoirs. (KEY TERMS: statistical methods; ranking; Mississippi; load; yield; nutrients; Gulf of Mexico, hypoxia.) Robertson, Dale M., Gregory E. Schwarz, David A. Saad, and Richard B. Alexander, 2009. Incorporating Uncertainty Into the Ranking of SPARROW Model Nutrient Yields From Mississippi ⁄ Atchafalaya River Basin Watersheds. Journal of the American Water Resources Association (JAWRA) 45(2):534-549. DOI: 10.1111 ⁄ j.1752- 1688.2009.00310.x 1 Paper No. JAWRA-08-0192-P of the Journal of the American Water Resources Association (JAWRA). Received October 15, 2008; accepted January 18, 2009. ª 2009 American Water Resources Association. No claim to original U.S. government works. Discussions are open until October 1, 2009. 2 Respectively, Research Hydrologist and Hydrologist (Robertson and Saad), U.S. Geological Survey, Wisconsin Water Science Center, Middleton, Wisconsin; and Economist and Hydrologist (Schwarz and Alexander), U.S. Geological Survey, National Center, Reston, Virginia (E-Mail ⁄ Robertson: [email protected]). Re-use of this article is permitted in accordance with the Creative Commons Deed, Attribution 2.5, which does not permit commercial exploitation. JAWRA 534 JOURNAL OF THE AMERICAN WATER RESOURCES ASSOCIATION JOURNAL OF THE AMERICAN WATER RESOURCES ASSOCIATION Vol. 45, No. 2 AMERICAN WATER RESOURCES ASSOCIATION April 2009
Transcript of Incorporating Uncertainty Into the Ranking of SPARROW Model Nutrient Yields From...
INCORPORATING UNCERTAINTY INTO THE RANKING OF SPARROW MODELNUTRIENT YIELDS FROM MISSISSIPPI ⁄ATCHAFALAYA RIVER BASIN WATERSHEDS1
Dale M. Robertson, Gregory E. Schwarz, David A. Saad, and Richard B. Alexander2
ABSTRACT: Excessive loads of nutrients transported by tributary rivers have been linked to hypoxia in theGulf of Mexico. Management efforts to reduce the hypoxic zone in the Gulf of Mexico and improve the waterquality of rivers and streams could benefit from targeting nutrient reductions toward watersheds with thehighest nutrient yields delivered to sensitive downstream waters. One challenge is that most conventionalwatershed modeling approaches (e.g., mechanistic models) used in these management decisions do not consideruncertainties in the predictions of nutrient yields and their downstream delivery. The increasing use ofparameter estimation procedures to statistically estimate model coefficients, however, allows uncertainties inthese predictions to be reliably estimated. Here, we use a robust bootstrapping procedure applied to theresults of a previous application of the hybrid statistical ⁄ mechanistic watershed model SPARROW (SpatiallyReferenced Regression On Watershed attributes) to develop a statistically reliable method for identifying ‘‘highpriority’’ areas for management, based on a probabilistic ranking of delivered nutrient yields from watershedsthroughout a basin. The method is designed to be used by managers to prioritize watersheds where additionalstream monitoring and evaluations of nutrient-reduction strategies could be undertaken. Our ranking proce-dure incorporates information on the confidence intervals of model predictions and the correspondingwatershed rankings of the delivered nutrient yields. From this quantified uncertainty, we estimate the proba-bility that individual watersheds are among a collection of watersheds that have the highest delivered nutri-ent yields. We illustrate the application of the procedure to 818 eight-digit Hydrologic Unit Code watershedsin the Mississippi ⁄ Atchafalaya River basin by identifying 150 watersheds having the highest delivered nutri-ent yields to the Gulf of Mexico. Highest delivered yields were from watersheds in the Central Mississippi,Ohio, and Lower Mississippi River basins. With 90% confidence, only a few watersheds can be reliably placedinto the highest 150 category; however, many more watersheds can be removed from consideration as notbelonging to the highest 150 category. Results from this ranking procedure provide robust information onwatershed nutrient yields that can benefit management efforts to reduce nutrient loadings to downstreamcoastal waters, such as the Gulf of Mexico, or to local receiving streams and reservoirs.
(KEY TERMS: statistical methods; ranking; Mississippi; load; yield; nutrients; Gulf of Mexico, hypoxia.)
Robertson, Dale M., Gregory E. Schwarz, David A. Saad, and Richard B. Alexander, 2009. IncorporatingUncertainty Into the Ranking of SPARROW Model Nutrient Yields From Mississippi ⁄ Atchafalaya River BasinWatersheds. Journal of the American Water Resources Association (JAWRA) 45(2):534-549. DOI: 10.1111 ⁄ j.1752-1688.2009.00310.x
1Paper No. JAWRA-08-0192-P of the Journal of the American Water Resources Association (JAWRA). Received October 15, 2008; acceptedJanuary 18, 2009. ª 2009 American Water Resources Association. No claim to original U.S. government works. Discussions are open untilOctober 1, 2009.
2Respectively, Research Hydrologist and Hydrologist (Robertson and Saad), U.S. Geological Survey, Wisconsin Water Science Center,Middleton, Wisconsin; and Economist and Hydrologist (Schwarz and Alexander), U.S. Geological Survey, National Center, Reston, Virginia(E-Mail ⁄ Robertson: [email protected]).
Re-use of this article is permitted in accordance with the Creative Commons Deed, Attribution 2.5, which does not permit commercial exploitation.
JAWRA 534 JOURNAL OF THE AMERICAN WATER RESOURCES ASSOCIATION
JOURNAL OF THE AMERICAN WATER RESOURCES ASSOCIATION
Vol. 45, No. 2 AMERICAN WATER RESOURCES ASSOCIATION April 2009
INTRODUCTION
Over-enrichment of nutrients is a major problemin many streams and rivers and can result in theoverabundance of benthic algae, phytoplankton, andmacrophytes. In addition to local effects, excessivetransport of nutrients has been linked to eutrophica-tion of downstream lakes, bays, and estuaries, andalso linked to hypoxia in the Gulf of Mexico (USEPA,2000). Under recommendations of the Clean WaterAction Plan in 1998, the United States Environmen-tal Protection Agency (USEPA) developed a nationalstrategy for establishing water body-specific nutrientcriteria for rivers and streams, wetlands, lakes andreservoirs, and estuaries (USEPA, 1998). This strat-egy encouraged states and tribes to establish nutrientstandards sufficient to reduce nutrient concentrationsand improve the beneficial ecological uses of surfacewaters. In addition, the Mississippi River ⁄ Gulf ofMexico Watershed Nutrient Task Force (2008) estab-lished a goal to reduce the size of the hypoxic zone inthe Gulf of Mexico to 5,000 km2, which will requiresubstantial reductions in nutrient loadings from theMisssissippi ⁄ Atchafalaya River basin (MARB).
To achieve the nutrient standards under consider-ation for rivers, streams, lakes, and reservoirs, and tomeet the goal for a reduced size of the hypoxic zonein the Gulf of Mexico, nutrient loading from theupstream watersheds will need to be reduced.Although reducing nutrient loadings from all water-sheds throughout the MARB would provide a compre-
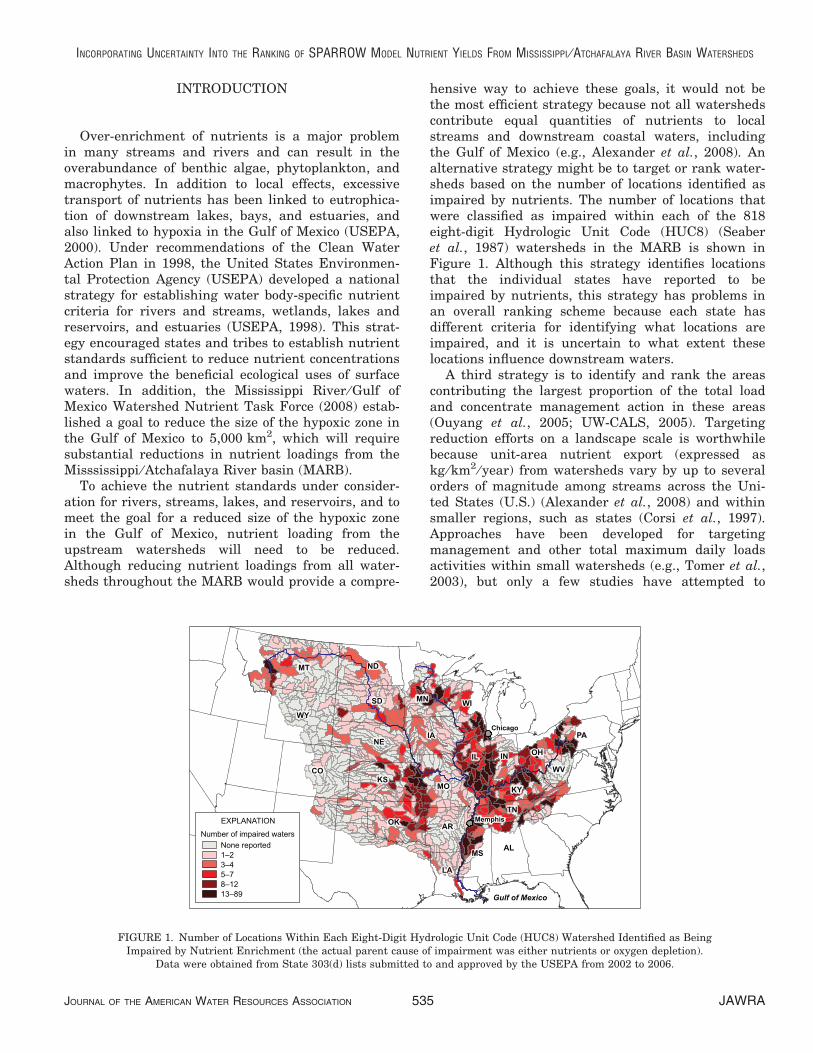
hensive way to achieve these goals, it would not bethe most efficient strategy because not all watershedscontribute equal quantities of nutrients to localstreams and downstream coastal waters, includingthe Gulf of Mexico (e.g., Alexander et al., 2008). Analternative strategy might be to target or rank water-sheds based on the number of locations identified asimpaired by nutrients. The number of locations thatwere classified as impaired within each of the 818eight-digit Hydrologic Unit Code (HUC8) (Seaberet al., 1987) watersheds in the MARB is shown inFigure 1. Although this strategy identifies locationsthat the individual states have reported to beimpaired by nutrients, this strategy has problems inan overall ranking scheme because each state hasdifferent criteria for identifying what locations areimpaired, and it is uncertain to what extent theselocations influence downstream waters.
A third strategy is to identify and rank the areascontributing the largest proportion of the total loadand concentrate management action in these areas(Ouyang et al., 2005; UW-CALS, 2005). Targetingreduction efforts on a landscape scale is worthwhilebecause unit-area nutrient export (expressed askg ⁄ km2 ⁄ year) from watersheds vary by up to severalorders of magnitude among streams across the Uni-ted States (U.S.) (Alexander et al., 2008) and withinsmaller regions, such as states (Corsi et al., 1997).Approaches have been developed for targetingmanagement and other total maximum daily loadsactivities within small watersheds (e.g., Tomer et al.,2003), but only a few studies have attempted to
FIGURE 1. Number of Locations Within Each Eight-Digit Hydrologic Unit Code (HUC8) Watershed Identified as BeingImpaired by Nutrient Enrichment (the actual parent cause of impairment was either nutrients or oxygen depletion).
Data were obtained from State 303(d) lists submitted to and approved by the USEPA from 2002 to 2006.
INCORPORATING UNCERTAINTY INTO THE RANKING OF SPARROW MODEL NUTRIENT YIELDS FROM MISSISSIPPI ⁄ ATCHAFALAYA RIVER BASIN WATERSHEDS
JOURNAL OF THE AMERICAN WATER RESOURCES ASSOCIATION 535 JAWRA
target watersheds at broad geographic scales (such astargeting specific river basins or specific states in theMARB) (Goolsby et al., 1999; Ouyang et al., 2005;Alexander et al., 2008; Diebel et al., 2009). Diebelet al. (2009) developed a predictive model to estimatethe sediment and phosphorus load reduction thatshould be achievable following the implementation ofriparian buffers in watersheds throughout Wisconsin,and used this information to rank the watershedsbased on their potential load reductions. Ouyanget al. (2005) developed a GIS (geographic informationsystem)-based erosion model for the Great Lakes trib-utaries to assess and compare their relative loadingsof sediments, status of conservation practices, andtheir potential for further reductions to sediment andcontaminant loadings. Goolsby et al. (1999) usedmultiple-regression techniques relating nitrogeninputs from various sources and measured nitrogenyields from 42 large drainage basins to estimate andrank nitrogen yields from all of the large river basinsthroughout the MARB. Alexander et al. (2008) usedthe Spatially Referenced Regression On Watershedattributes (SPARROW) model to estimate yields oftotal phosphorus (TP) and total nitrogen (TN) fromsmall watersheds (median size of �60 km2) through-out the MARB to the Gulf of Mexico, and used thisinformation to compare the relative contributionsfrom each state.
Watersheds can be ranked on the basis of theirrespective loads, yields (by compensating forwatershed size), incremental yields (that part gener-ated in individual stream-segment drainages), ordelivered incremental yields (by compensating for theloss of nutrients with transport from each watershedto the downstream receiving body) (Alexander et al.,2008). Which of these characteristics should be usedin the ranking procedure depends on the reason forthe ranking. If one is most interested in the down-stream receiving body, such as the Gulf of Mexico,then a ranking based on delivered incremental yieldis appropriate. If one is more interested in delivery tolocal streams, then ranking based on incrementalyields is appropriate.
Various types of models have been used to estimateloads and yields in large watersheds and can supportthe development and evaluation of watershed rankingstrategies. These models range from simple statisticalmodels, such as that in Goolsby et al. (1999) whereTN yields were estimated as a function of severalwatershed attributes, to complex mechanistic simula-tion models, such as the Soil and Water AssessmentTool (Gassman et al., 2003; Neitsch et al., 2005) thatsimulate the primary hydrological, chemical, and bio-chemical processes in the soil and during the trans-port downstream. The SPARROW model (Smithet al., 1997) has a hybrid statistical ⁄ mechanistic
structure, which includes aspects of these twoapproaches and takes advantage of their strengths.All watershed models have estimation errors inherentin their predictions; however, these errors are rarelyreflected in the watershed rankings that are devel-oped from the model predictions of loads and yields.A more statistically rigorous and robust rankingwould be to directly incorporate measures of theuncertainties in model predictions. For example,although a watershed may have a predicted load thatis higher than several other watersheds, the loads(and thus the rankings) may not be statistically dif-ferent. Thus, measures of the uncertainty in predic-tions of incremental and delivered yields areessential to develop reliable and informative rankingstrategies. Although prediction uncertainties can bedetermined for mechanistic simulation models usingparameter estimation methods (e.g., Doherty, 2004),these methods are difficult to use with complex,highly parameterized models (Beven, 2002) and maynot incorporate all of the uncertainties in the model’spredictions. These parameter estimation methods areespecially challenging to use in large watersheds andriver basins, such as the Mississippi and its majortributaries, where mechanistic models are rarelyapplied. By contrast, prediction uncertainties arecomparatively easy to generate using statistical mod-els, such as SPARROW, which have been applied inlarge river basins, including the Mississippi andAtchafalaya (Goolsby et al., 1999; Alexander et al.,2008).
In this paper, we use results from a publishedSPARROW model (Alexander et al., 2008) to estimateand rank TP and TN incremental yields from the 818HUC8 watersheds throughout the entire MARB thatare delivered to the Gulf of Mexico (for this analysis,taken to be the reach containing the U.S. GeologicalSurvey monitoring station near St. Francisville, Loui-siana). We describe and demonstrate robust statisti-cal bootstrapping procedures to place confidencelimits on nutrient yield predictions from SPARROW,and to place confidence limits on the individual ranksof the HUC8 watersheds. This information is thenused to estimate the probability that each HUC8watershed is among a collection of watersheds thatcontributes the largest quantities of nutrients to theGulf of Mexico. We illustrate the application of theprocedure to 818 watersheds in the MARB by identi-fying 150 watersheds that have the largest deliverednutrient yields (i.e., ‘‘top 150’’). The selection of thenumber 150 is arbitrary and the method presentedhere could be applied to any user-selected number ofwatersheds. Results from this ranking procedure canbe used by state and federal managers to targeta set of ‘‘high priority’’ inland watersheds, whereadditional stream monitoring and evaluations of
ROBERTSON, SCHWARZ, SAAD, AND ALEXANDER
JAWRA 536 JOURNAL OF THE AMERICAN WATER RESOURCES ASSOCIATION

nutrient-reduction strategies could be undertaken.We also demonstrate how the results can be used byspecific states to prioritize the target watershedsbased on nutrient deliveries to local streams. Thismethod of ranking is not a fully optimal approach toconcurrent management of coastal and inland waters.Watersheds that rank near the lowest end of thespectrum in terms of nutrient delivery to the Gulf ofMexico, with management, can be expected toimprove the water quality of local receiving waters.These local improvements may be of similar orgreater value compared to the incremental improve-ments in the coastal receiving waters.
METHODS
SPARROW Model
SPARROW is a GIS-based watershed model thatuses a hybrid statistical ⁄ mechanistic approach to esti-mate nutrient sources, transport, and transformationin terrestrial and aquatic ecosystems of watershedsunder long-term steady state conditions (Smith et al.,1997; Alexander et al., 2008). The present applicationof SPARROW includes nonconservative transport,mass-balance constraints, and water flow-pathsdefined by topography, streams, and reservoirs, basedon a detailed stream-reach network (1:500,000 scale)with reach catchments (median size �60 km2) delin-eated from 1-km digital elevation models (Nolanet al., 2002); the MARB contains �25,000 reaches.Given a specification of nutrient sources, the model isused to estimate nutrient delivery to streams fromsubsurface and overland flow (‘‘land-to-water’’ deliv-ery) in relation to landscape properties, including cli-mate, soils, topography, drainage density, andartificial drainage. A brief description of the SPAR-ROW model is given in the Appendix, and a detaileddescription of the model is given in Schwarz et al.(2006).
The SPARROW model was used to simulate themean annual flux of TN and TP from each reach ofthe �25,000 reaches in the MARB as a function of tennutrient sources (eight for TP), six climatic and land-scape factors that influence land-to-water delivery(five for TP), and two factors describing nutrientremoval in streams and reservoirs (Alexander et al.,2008). Nutrient sources included atmospheric deposi-tion of nitrogen, urban sources, and nutrients in therunoff and subsurface flow from agricultural andother lands. The population within the drainage areaof each reach was used as a surrogate for all urbanpoint and nonpoint sources of nutrients. Agricultural
sources were separated according to their associationwith either cultivated croplands or nonrecovered man-ure. Cropland includes nutrient inputs from biologicalN2 fixation (soybeans, alfalfa, and hay), commercialfertilizer use on seven major crops, and animal man-ure that is recovered from confined animals on nearbyfarms and applied to crops as fertilizer. Nonrecoveredmanure pertains to nutrients derived from unconfinedanimals in pastures or losses from feedlots.
Model parameters for the sources, land-to-waterdelivery factors, and instream-decay terms were sta-tistically estimated using weighted nonlinear leastsquares (WNLLS) regression, based on a calibrationto the long-term mean annual loads (1975-1995) (Sch-warz et al., 2006) of TN and TP (i.e., the steady stateresponse variables in the model) at 425 monitoringstations in the conterminous U.S. that were part ofthe National Stream Quality Accounting Network(Hooper et al., 2001). Most of the stations used in thecalibration have relatively large drainage areas: 90%of stations had drainages >820 km2. Mean annualloads for each station were standardized to the 1992base-year to give an estimate of the mean nutrientload that would have occurred in 1992 if the meanflow conditions from 1975 to 2000 had prevailed(nutrient source inputs to the model are those for1992). Although the model cannot be used to evaluateyear-to-year changes, it also is not biased by theshort-term meteorological variability that may occurthroughout the study area in a given year. The spe-cifics about the source and transport process specifi-cation, calibration, accuracy, and precision of thefinal models are presented in Alexander et al. (2008).
The 818 HUC8 watersheds in the MARB (mediansize = 3,400 km2) are used as the units for evaluatinguncertainties in the rankings of SPARROW predic-tions of the nutrient incremental yields that aredelivered to the Gulf of Mexico. The incrementalnutrient yield (and delivered yield) was computed foreach HUC8 watershed by summing the loads (ordelivered loads) from each reach within the HUC8watershed, and then dividing by the total area of theHUC8 watershed. The HUC8-level aggregation of the�25,000 reach-level SPARROW predictions in theMARB provides the most reliable spatial scale forevaluating the model predictions, one that is gener-ally consistent with the spatial scale of the monitor-ing stations used to estimate the model parameters.
The model predictions of the incremental yieldsand delivered incremental yields that are used in theHUC8 ranking procedures reflect the simulatednutrient yields in circa 2002. The simulated yieldsaccount for changes from 1992 to 2002 in agriculturalsources (biological N2 fixation in crops, farm fertilizeruse, and crop harvesting); however, changes from1992 to 1997 are used for animal manure nutrients
INCORPORATING UNCERTAINTY INTO THE RANKING OF SPARROW MODEL NUTRIENT YIELDS FROM MISSISSIPPI ⁄ ATCHAFALAYA RIVER BASIN WATERSHEDS
JOURNAL OF THE AMERICAN WATER RESOURCES ASSOCIATION 537 JAWRA

and from 1990 to 2000 are used for population asdescribed in Alexander et al. (2008). The coefficientsof the calibrated model are unchanged for 2002 simu-lations; steady state conditions are also assumedbased on long-term average streamflow over the 1975to 2000 period. The predicted yields for 2002 onlyreflect changes in nutrient sources and are indepen-dent of any actual changes in streamflow from 1992to 2002. The changes in agricultural sources alsoaccount for changes in the marginal rates of crop pro-duction from 1992 to 2002 (i.e., harvested biomassrelative to nutrient inputs) (note that the estimated1992 base-year model implicitly reflects crop produc-tion related to climatic conditions and farm practicesand technologies in that year). The predicted yieldsfor 2002 do not include the effects of any changes infarm management practices unrelated to crop fertil-izer use and production or animal populations (e.g.,addition of buffer strips or improvements in feedlotoperations).
Confidence Limits in SPARROW Predictions
The actual delivered fluxes from SPARROW areassumed to depend on a multiplicative error termthat represents other sources and processes notincluded in the SPARROW analysis. Because of thisresidual term, and because the determination of pre-dicted flux depends on coefficients that are estimatedvia statistical methods, the delivered yields and theranking of those yields across HUC8 watersheds aresubject to uncertainty. Because of the nonlinear man-ner in which the estimated coefficients enter themodel, it was necessary to use bootstrap methods(Schwarz et al., 2006) to assess the uncertainty. Boot-strap analyses were also used to correct for potentialbias caused by log retransformations in the yield pre-dictions, an additional consequence of the nonlinearmodel specification. A brief summary of the bootstrapmethod is presented here; a full description of thebootstrap methodology is provided in the Appendix tothis paper.
The bootstrapping method was implemented byperforming 200 repeated calibrations of the SPAR-ROW model using randomly selected integer weights(which sum to 425, the total number of monitoredreaches in both the TN and TP models) applied toeach of the squared residuals at monitored reaches,resulting in 200 realizations of the estimated coeffi-cients, yields, delivered yields, and residuals. The dis-tribution of the estimated delivered yields for eachreach from the 200 iterations was used to estimatethe standard errors in the yields from SPARROW.The estimated confidence interval for delivered yieldsrequired explicit consideration of the distribution of
residuals in the model, rather than just the summarystatistical properties of the residuals. The bootstrapmethod for incorporating the distribution of themodel residuals is based on the empirical distributionof the combined bootstrap-iteration estimate of themodeled component of delivered flux and a randomlyselected weighted error from the original 425 moni-tored values obtained in the original calibration ofthe model. The 90% confidence interval for the deliv-ered incremental yield from each HUC8 was thenestimated using a ratio formulation of the hybridbootstrap confidence limit (see Shao and Tu, 1995and Schwarz et al., 2006).
Statistical Significance of the HUC8 Rankings
The assessment of uncertainty in the ranks of thedelivered yields was also based on bootstrap methods.Unlike the methods used to place confidence limits onspecific SPARROW predictions, the theoretical basisbehind the underlying assessment of uncertainty inranks was less rigorous. The bootstrapping methodwas implemented by performing 200 repeated estima-tions of the delivered incremental yields from eachHUC8 watershed. In each iteration, the deliveredincremental yields were estimated by multiplying themodeled estimate of delivered incremental yield for
FIGURE 2. Distributions of Predicted DeliveredIncremental Total Nitrogen (TN) Yields for Three HUC8
Watersheds From the Bootstrapping Procedure, WithTwo Selected Values From Specific Iterations.
ROBERTSON, SCHWARZ, SAAD, AND ALEXANDER
JAWRA 538 JOURNAL OF THE AMERICAN WATER RESOURCES ASSOCIATION

each watershed by a randomly selected, exponentiat-ed, weighted model residual from the 425 residualsestimated in the WNLLS regression calibration of theSPARROW model. With each bootstrap iteration, adifferent delivered incremental yield is obtained foreach of the 818 HUC8 watersheds. These estimatesare distributed around the delivered incrementalyield obtained directly from the original SPARROWmodel and used in the original ranking (the distribu-tions of these estimates are shown for three sites inFigure 2). After each bootstrap iteration, the deliv-ered incremental yields from the 818 watersheds areranked. Delivered incremental yields for two itera-tions of this process are shown in Figure 2. On thebasis of the 200 different ranks for each HUC8watershed (a different rank for each bootstrap
iteration), it is possible to (1) determine with whatcertainty (probability) a specific watershed would beranked in, or not in, the top specified number ofwatersheds and (2) estimate the confidence intervalsof the rankings. A specific watershed would be placedin the top 150 contributing watersheds with 90% con-fidence, if 90% or more of the time (‡180 of the 200bootstrap iterations), the watershed ranked £150, andwould be placed out of the top 150 watersheds, if 90%of the time the watershed did not rank £150.
Confidence intervals were placed on the rankingsfor each HUC8 watershed on the basis of the percen-tiles of the distributions of the 200 different ranksfrom the bootstrapping procedure. The 5th and 95thpercentile of the distributions of the ranking from thebootstrapping procedure represent the lower and
FIGURE 3. Distributions (deciles) of Incremental Yields (A) and Delivered Incremental Yields to the Gulf of Mexico(B) of Total Nitrogen (TN) for the HUC8 Watersheds Within the MARB for Conditions Similar to 2002.
INCORPORATING UNCERTAINTY INTO THE RANKING OF SPARROW MODEL NUTRIENT YIELDS FROM MISSISSIPPI ⁄ ATCHAFALAYA RIVER BASIN WATERSHEDS
JOURNAL OF THE AMERICAN WATER RESOURCES ASSOCIATION 539 JAWRA

upper bounds of the 90% confidence limits of therankings for each watershed.
RESULTS
Incremental Nutrient Yields by HUC8 Watershed
Incremental TN and TP yields describe the massof nutrients entering streams per unit area of theincremental drainages, and are mediated by theamount of nutrients supplied to the area and the cli-mate and landscape properties that affect theirdelivery to nearby streams. Incremental yields from
HUC8 watersheds in the MARB range from 9.4 to6,900 kg ⁄ km2 ⁄ year for TN (Figure 3A) and 4.0 to858 kg ⁄ km2 ⁄ year for TP (Figure 4A). Highest TNand TP yields are generally in similar regions andinclude many watersheds in the Central Mississippi,Ohio, and Lower Mississippi River basins. The high-est TN yields closely coincide with intense agricul-ture in Indiana, Illinois, and Iowa, whereas highestTP yields are spread over a larger area (often associ-ated with urban areas) and shifted southward.Differences in the geographic patterns in the yieldscan be primarily explained by differences in thetypes of agricultural and nonagricultural sourcesthat contribute nutrients and the presence of majorurban areas. Lowest yields for TN and TP are fromwatersheds in the western regions of the MARB,
FIGURE 4. Distributions (deciles) of Incremental Yields (A) and Delivered Incremental Yields to the Gulf of Mexico(B) of Total Phosphorus (TP) for the HUC8 Watersheds Within the MARB for Conditions Similar to 2002.
ROBERTSON, SCHWARZ, SAAD, AND ALEXANDER
JAWRA 540 JOURNAL OF THE AMERICAN WATER RESOURCES ASSOCIATION

where streamflows are lower and inputs of nutrientsare generally smaller.
Delivered incremental yield describes the amountof the incremental yield that is delivered to somedownstream point, in this case the Gulf of Mexico,after accounting for the cumulative effect of aquaticremoval processes (primarily denitrification for TNand deposition in reservoirs for TP). Delivered incre-mental TN yields from HUC8 watersheds range from0 to 5,540 kg ⁄ km2 ⁄ year (Figure 3B) and delivered TPyields range from 0 to 540 kg ⁄ km2 ⁄ year (Figure 4B).Instream and in-reservoir losses result in much ofthe TN and TP delivered to the Gulf of Mexico origi-nating from similar regions: primarily from water-sheds in the Central Mississippi, Ohio, and LowerMississippi River basins, especially those near largerivers. Lowest delivered incremental yields were fromwatersheds in the western regions of the MARB,where streamflow is lower, inputs are generally smal-ler, and longer river distances enhance instreamremoval.
Although the magnitude of the incremental yieldsand delivered incremental yields differ, the geo-graphic patterns in incremental yields and delivered
incremental yields for TN differ only slightly, as seenin the decile distributions in Figure 3; the highestdelivered TN yields occur a little further east thanthe incremental yields. The largest differences in thepatterns are the result of decreases in delivery fromsouthern Minnesota and Iowa. There are largerchanges in the patterns for TP than for TN. The larg-est changes in TP patterns are that the relativelyhigher delivered yields are closer to the main rivers,such as the Mississippi and Ohio Rivers, than werethe yields themselves. The largest relative decreasesin delivery occur in Arkansas, Tennessee, and Iowa,and are primarily caused by losses in reservoirs. Therelative decreases can be best seen in eastern Ten-nessee (Figure 4), where the relatively large incre-mental TP yields are reduced by losses in largereservoirs.
Ranking of HUC8 Watersheds by Nutrient Yields
Ranking the HUC8 watersheds throughout theMARB by the predicted incremental yields or deliv-ered incremental yields from SPARROW can be as
FIGURE 5. Map Showing the Top 150 HUC8 Contributing Watersheds Within the MARB to the Gulf of Mexico for TN (A) and TP (B) andMaps Showing the Certainty With Which the Watersheds are Placed In or Out of the Top 150 Contributing Watersheds for TN (C) and TP (D).
INCORPORATING UNCERTAINTY INTO THE RANKING OF SPARROW MODEL NUTRIENT YIELDS FROM MISSISSIPPI ⁄ ATCHAFALAYA RIVER BASIN WATERSHEDS
JOURNAL OF THE AMERICAN WATER RESOURCES ASSOCIATION 541 JAWRA
straightforward as sorting the predicted yields andranking them from 1 (highest yield) to 818 (lowestyield). All incremental yields and delivered incremen-tal yields and their respective rankings are given inthe Supporting Information material to this paper.The results of the ranking process are shown fordelivered incremental yields for TN and TP inFigures 5A and 5B (only the top 150 watersheds arecolored). Almost all of the top 150 watersheds are inthe Corn Belt or near the Mississippi River, with thehighest yields of TN being in northern Illinois andcentral Indiana and highest yields of TP being fromwatersheds along the Mississippi River, and in north-ern Kentucky, and distributed through Missouri, Illi-nois, and Indiana. The HUC8 watershed with thehighest TN and TP incremental yields encompassesthe area near Chicago. Therefore, if one were inter-ested in placing management efforts only in a speci-fied number of the highest contributing watersheds,the watersheds to place efforts could be readily iden-tified.
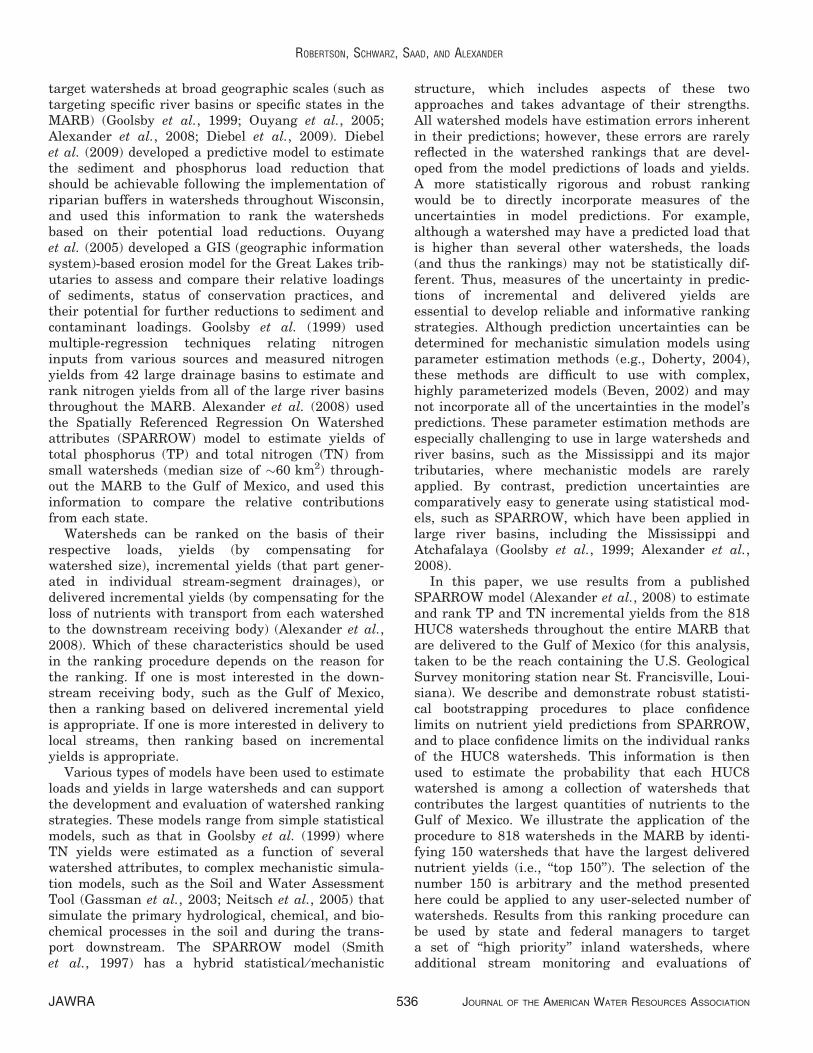
After sorting the HUC8 watersheds on the basis oftheir delivered incremental yields and summing theyields from the highest ranked watersheds to thelowest, an accumulated yield plot can be created(Figure 6). From this figure, it is possible to deter-mine the minimum number of watersheds required toreduce the total load to the Gulf of Mexico by a speci-fied percentage or specified load in kg. For example,if one wanted to obtain a 50% reduction in TN load-ing to the Gulf of Mexico, it would require removingall the TN loading from the top �150 HUC8 water-sheds. If it were assumed that only 75% of the deliv-ered load could be removed from each watershed,then it would require that �225 watersheds be
included to obtain a �50% reduction. If only 50% ofthe delivered load could be removed from eachwatershed, then it would require that all of the 818watersheds be included.
Effects of Uncertainty on the Ranking
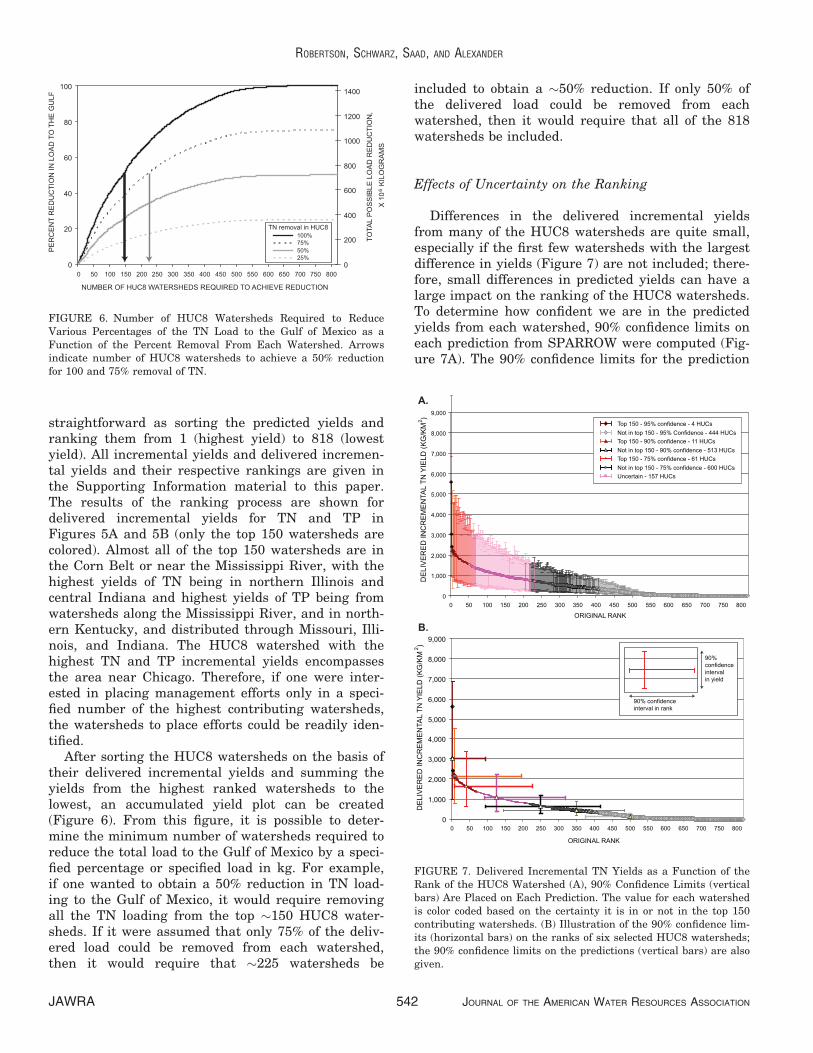
Differences in the delivered incremental yieldsfrom many of the HUC8 watersheds are quite small,especially if the first few watersheds with the largestdifference in yields (Figure 7) are not included; there-fore, small differences in predicted yields can have alarge impact on the ranking of the HUC8 watersheds.To determine how confident we are in the predictedyields from each watershed, 90% confidence limits oneach prediction from SPARROW were computed (Fig-ure 7A). The 90% confidence limits for the prediction
FIGURE 6. Number of HUC8 Watersheds Required to ReduceVarious Percentages of the TN Load to the Gulf of Mexico as aFunction of the Percent Removal From Each Watershed. Arrowsindicate number of HUC8 watersheds to achieve a 50% reductionfor 100 and 75% removal of TN.
FIGURE 7. Delivered Incremental TN Yields as a Function of theRank of the HUC8 Watershed (A), 90% Confidence Limits (verticalbars) Are Placed on Each Prediction. The value for each watershedis color coded based on the certainty it is in or not in the top 150contributing watersheds. (B) Illustration of the 90% confidence lim-its (horizontal bars) on the ranks of six selected HUC8 watersheds;the 90% confidence limits on the predictions (vertical bars) are alsogiven.
ROBERTSON, SCHWARZ, SAAD, AND ALEXANDER
JAWRA 542 JOURNAL OF THE AMERICAN WATER RESOURCES ASSOCIATION
of the yields from any specific HUC8 watershed werequite large, typically within a factor of 2-3 of the ori-ginal value. To determine how the uncertainty in thepredicted yields affect the ranking of the HUC8watersheds, a bootstrapping procedure was conductedto incorporate the uncertainty in the predicted yieldsinto the ranking process (see the Methods Section).As a result of this process, 90% confidence limits wereplaced on the ranks themselves (the 90% confidencelimits of the ranks are shown as horizontal bars forsix example sites in Figure 7B). The 90% confidencelimits on the ranks demonstrate that because of theuncertainties in the SPARROW algorithms, our cer-tainty in the specific ranking of any HUC8 watershedis quite wide. For example, the 90% confidence in theranking of the Upper Wabash River watershed inIndiana and Ohio, which was originally rankedeighth with respect to delivered incremental TNyields, ranges from 8 to 227, and the PecatonicaRiver watershed in Illinois and Wisconsin that origi-nally ranked 125, ranges from 26 to 320. The originalranking for the delivered incremental yields for TPand TN and their respective 90% confidence limitsare given for each HUC8 watershed in the Support-ing Information material to this paper.
Having confidence limits in the yields and therankings of the yields, rather than having specificvalues, makes it much more difficult to determine,which HUC8 watersheds to suggest to implementmanagement efforts in, if only a selected number ofcontributors are to be considered. For example, if wewant to identify which HUC8 watersheds are in thetop 150 contributors to the Gulf of Mexico (theapproximate number of watersheds for which loadswould have to be totally removed to obtain a 50%reduction in the TN load), this uncertainty should beconsidered. Given the wide 90% confidence intervalsin the yields, many of the watersheds that originallyranked near 150, may or may not actually be in thetop 150. One approach to incorporate this uncertaintyis to use the information from the bootstrapping pro-cedure, which was used to place confidence intervalsin the original ranking (Figure 7B). If a watershedranked in the top 150 in ‡95% bootstrapping itera-tions, then we can say the watershed is in the top150 with 95% confidence. If a watershed were in thetop 150 in ‡90% of the bootstrap iterations, then itwould be in the top 150 with 90% confidence, and soon. Similarly, if a watershed ranked in the top 150 in<5% of the bootstrap iterations, then it would not bein the top 150 with 95% confidence. If a watershedranked in the top 150 in <10% of the bootstrap itera-tions, then it would not be in the top 150 with 90%confidence, and so on.
This information was then used to determinewhich watersheds could be considered to be in the
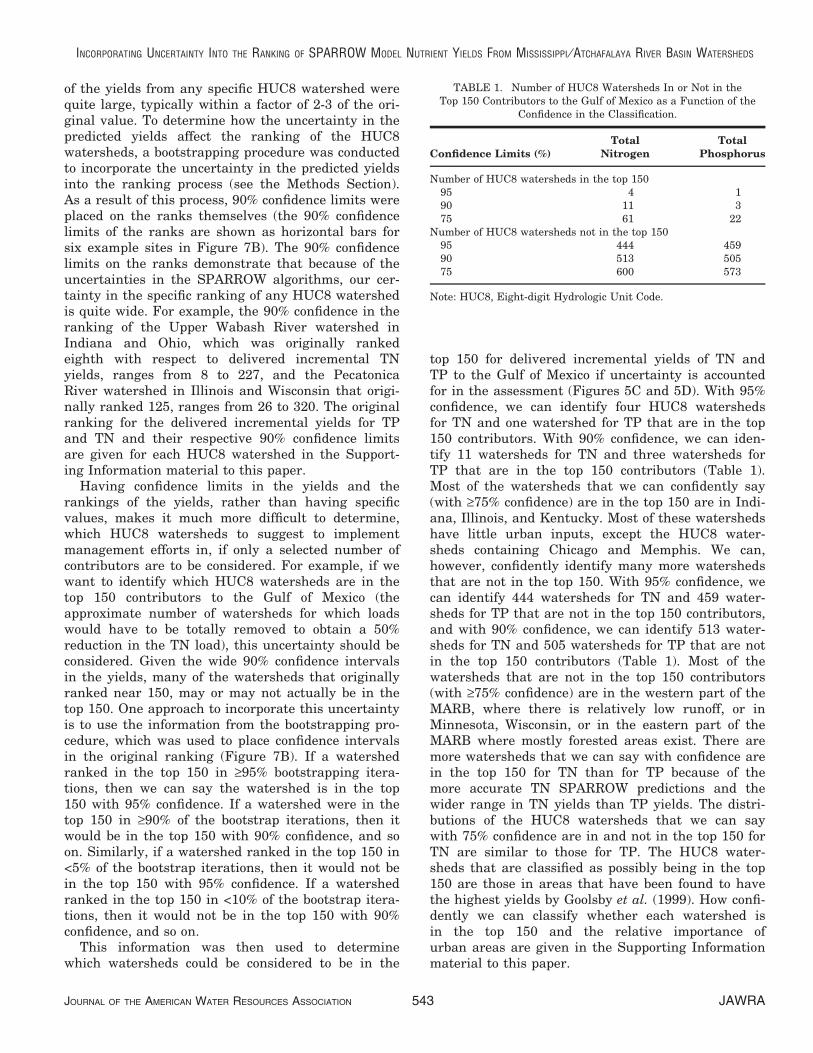
top 150 for delivered incremental yields of TN andTP to the Gulf of Mexico if uncertainty is accountedfor in the assessment (Figures 5C and 5D). With 95%confidence, we can identify four HUC8 watershedsfor TN and one watershed for TP that are in the top150 contributors. With 90% confidence, we can iden-tify 11 watersheds for TN and three watersheds forTP that are in the top 150 contributors (Table 1).Most of the watersheds that we can confidently say(with ‡75% confidence) are in the top 150 are in Indi-ana, Illinois, and Kentucky. Most of these watershedshave little urban inputs, except the HUC8 water-sheds containing Chicago and Memphis. We can,however, confidently identify many more watershedsthat are not in the top 150. With 95% confidence, wecan identify 444 watersheds for TN and 459 water-sheds for TP that are not in the top 150 contributors,and with 90% confidence, we can identify 513 water-sheds for TN and 505 watersheds for TP that are notin the top 150 contributors (Table 1). Most of thewatersheds that are not in the top 150 contributors(with ‡75% confidence) are in the western part of theMARB, where there is relatively low runoff, or inMinnesota, Wisconsin, or in the eastern part of theMARB where mostly forested areas exist. There aremore watersheds that we can say with confidence arein the top 150 for TN than for TP because of themore accurate TN SPARROW predictions and thewider range in TN yields than TP yields. The distri-butions of the HUC8 watersheds that we can saywith 75% confidence are in and not in the top 150 forTN are similar to those for TP. The HUC8 water-sheds that are classified as possibly being in the top150 are those in areas that have been found to havethe highest yields by Goolsby et al. (1999). How confi-dently we can classify whether each watershed isin the top 150 and the relative importance ofurban areas are given in the Supporting Informationmaterial to this paper.
TABLE 1. Number of HUC8 Watersheds In or Not in theTop 150 Contributors to the Gulf of Mexico as a Function of the
Confidence in the Classification.
Confidence Limits (%)Total
NitrogenTotal
Phosphorus
Number of HUC8 watersheds in the top 15095 4 190 11 375 61 22
Number of HUC8 watersheds not in the top 15095 444 45990 513 50575 600 573
Note: HUC8, Eight-digit Hydrologic Unit Code.
INCORPORATING UNCERTAINTY INTO THE RANKING OF SPARROW MODEL NUTRIENT YIELDS FROM MISSISSIPPI ⁄ ATCHAFALAYA RIVER BASIN WATERSHEDS
JOURNAL OF THE AMERICAN WATER RESOURCES ASSOCIATION 543 JAWRA

Even with the relatively large confidence limits pre-sented here, the results from SPARROW can be veryuseful in the ranking process for HUC8 watersheds inthe MARB or other smaller areas. For example, of the818 watersheds in the MARB, only 218 for TN and 245for TP are considered to possibly be in the top 150, theremaining 444 (for TN) and 459 (for TP) watershedsstatistically rank above 150 and, therefore, can beremoved from special consideration (with 95% confi-dence), or 600 (for TN) and 573 (for TP) watershedscan be removed from special consideration with 75%confidence. Therefore, this information can be used toremove many areas from special consideration withrespect to their importance of their contributions toloading to the Gulf of Mexico.
DISCUSSION
Ranking Over Different Geographical Scales
The ranking discussed thus far has focused on theimportance of export from specific HUC8 watershedsto the overall loading to the Gulf of Mexico. Actualimplementation and prioritization of efforts, however,are often done at a smaller scale, such as in a specificstate. An example of the ranking results for a givenstate, Tennessee, is shown in Figure 8. If water-qualitymanagers in Tennessee are most interested in decreas-ing the load to some downstream location, such as theGulf of Mexico, they could examine the delivered incre-mental yields as previously discussed. If water-qualitymanagers are most interested in improving the water-quality in local streams and reservoirs, however, theymay want to target or identify the watersheds basedon the nutrients delivered to local streams. In thiscase, they would examine the incremental yields.Which of these conditions managers are most inter-ested in improving, affects the prioritization process.
If water-quality managers are most interested indecreasing the number of locations that were identi-fied as impaired (Figure 1), they would probably wantto compute the incremental yields from each of theirHUC8 watersheds and then rank them (Figure 8A). Ifthey are primarily interested in reducing the TP loadto the Gulf of Mexico, they would rank the deliveredincremental yields (Figure 8B). These two yields canbe quite different. In the case of TP, the differences inthe yields and ranking for the eastern and centralparts of Tennessee were primarily caused by the depo-sition of TP in large reservoirs. This information canassist managers in prioritizing efforts to improve localstreams and downstream coastal waters, such as theGulf of Mexico; however, the final overall ranking will
need to consider the relative importance of improvinglocal problems relative to downstream problems.
Statistical Models vs. Mechanistic Models
Statistical models require an extensive dataset ofstream monitoring sites with information for both thedependent (average annual loads) and independentvariables (nutrient sources and environmental vari-ables), whereas mechanistic models (i.e., without sta-tistically estimated parameters) can be used tosimulate water-quality conditions with only very lim-ited stream monitoring data. A more extensive data-set, however, is required to characterize the complexset of processes and state conditions in applications ofmechanistic models to large river basins. Hybrid sta-tistical ⁄ mechanistic models, like SPARROW, sharemany of the benefits of mechanistic simulation modelsbut also allow confidence limits to be reliably esti-mated for the model’s predictions and watershedrankings. The confidence limits on the individual pre-dictions from SPARROW are generally large butincorporate several sources of error, including error inthe estimations of the model due to the reliance on afinite sample, and structural error in the predictionalgorithms due to factors that are not accounted for in
FIGURE 8. Distribution (deciles) of the Incremental TotalPhosphorus (TP) Yields (A) and Delivered Incremental TP Yields
(B) for the HUC8 Watersheds Within Tennessee.
ROBERTSON, SCHWARZ, SAAD, AND ALEXANDER
JAWRA 544 JOURNAL OF THE AMERICAN WATER RESOURCES ASSOCIATION

the model. Most mechanistic models, on the otherhand, simulate specific processes, but each simulationusually only has one prediction for a given locationand confidence limits can be difficult to estimate.Therefore, the specific rankings provided by manymechanistic models may provide a false sense of accu-racy in the final ranking among watersheds. Statisti-cal approaches have been developed that attempt toquantify the confidence limits in the predictions frommechanistic models. For example, parameter estima-tion methods, such as in the Parameter Estimationmodel (PEST) (Doherty, 2004), can be applied tomechanistic models to estimate uncertainties associ-ated with the model coefficients and predictions andhence provide an estimate of the confidence intervalsfor predictions of nutrient yield. However, it is diffi-cult to reliably quantify the structural errors of mech-anistic models without detailed calibration datasets(Moore and Doherty, 2005), which are especially diffi-cult to obtain for large watersheds and river basins.Only with the confidence limits incorporated into thefinal predictions from watershed models can onedetermine if the small simulated differences in nutri-ent yields and rankings among watersheds are realand should be used to prioritize the targeting ofwatersheds for nutrient management.
SPARROW Modeling at Smaller Regional Scales
The results presented in this paper were based onSPARROW models calibrated using 425 sites distrib-uted throughout the U.S. (Alexander et al., 2008).These models enabled yields and confidence limits inthese yields to be estimated for rivers throughout thecountry. Within the MARB, there was �2.5-3 ordersof magnitude variation in the incremental TN and TPyields, with even a wider range in the delivered incre-mental yields, whereas, the 90% confidence in thepredictions were only within a factor of 2-3 of the pre-dicted value. These predictions, with the specifiedconfidence ranges, enable general management deci-sions to be made; however, the certainty in the pre-dicted values and the ranking may not be adequate toguide local decisions. If regional SPARROW modelswere developed that incorporate additional water-quality data from other federal, state, and local agen-cies, especially from small watersheds, and incorpo-rate better defined watershed attributes, such aspoint source data, then more specific sources anddelivery terms may be determined. Finer scaleregional SPARROW models may enable yields to bequantified more accurately at smaller than a HUC8scale, and should result in smaller errors in modelcoefficients, narrower confidence limits on predictions,and enable a more precise watershed ranking process.
CONCLUSIONS
To reduce the size of the hypoxic zone in the Gulf ofMexico and improve the water quality of rivers,streams, and other receiving water bodies, manage-ment efforts must be implemented at specific locationsin the landscape to reduce nutrient runoff. The meth-ods described herein could be applied to identify andtarget management efforts (including additionalstream monitoring) in the areas producing the highestnutrient yields. Various types of numerical models canbe used to predict yields over large geographical areas,and it is a straightforward process to use the outputfrom these models to rank or prioritize managementefforts. However, all numerical models have estimationerrors in their predictions; these uncertainties shouldbe considered in efforts to prioritize watersheds formanagement. Whereas, it is very difficult to estimatethe overall uncertainty in many mechanistic models; itis comparatively easier to estimate the overall uncer-tainties in the predictions from statistical models.
In this paper, we used results from the hybrid sta-tistical ⁄ mechanistic watershed model, SPARROW, toestimate delivered incremental yields from the 818HUC8 watersheds in the MARB and then rank thewatersheds based on their respective yields. Withinthe MARB, there was �2.5-3 orders of magnituderange in the incremental yields, with even a widerrange in the delivered incremental yields, whereas,the 90% confidence in the predictions were only a fac-tor of 2-3 of the predicted values. The highest TN andTP incremental yields and delivered incrementalyields were generally in similar regions of the MARB:watersheds in the Central Mississippi, Ohio, andLower Mississippi River basins. A robust statisticalbootstrapping procedure was presented, which usesthe uncertainties in the nutrient yield predictions(from SPARROW), to place confidence limits on theindividual ranks. Information from the bootstrappingprocedure was then used to estimate the probabilitythat each HUC8 watershed is among a collection ofwatersheds that contributes the largest quantities ofnutrients (e.g., ‘‘top 150’’) to the Gulf of Mexico.Because of the wide confidence intervals in the predic-tions from SPARROW, only a few watersheds couldbe placed into the top 150 with statistical certainty;however, many more watersheds could be removedfrom consideration of being in the top 150. This rank-ing procedure was also demonstrated for use by a spe-cific state to prioritize the targeting of watersheds forlocal improvements in streams and reservoirs.
The information presented here for the MARBcould assist managers in prioritizing managementefforts based on improving nutrient conditions inlocal streams and improving nutrient conditions in
INCORPORATING UNCERTAINTY INTO THE RANKING OF SPARROW MODEL NUTRIENT YIELDS FROM MISSISSIPPI ⁄ ATCHAFALAYA RIVER BASIN WATERSHEDS
JOURNAL OF THE AMERICAN WATER RESOURCES ASSOCIATION 545 JAWRA

downstream coastal waters, such as the Gulf of Mex-ico. This method of ranking is not a fully optimalapproach to concurrent management of coastal andinland waters. For example, watersheds that ranknear the lowest end of the spectrum in terms of nutri-ent delivery to the Gulf of Mexico, with management,can be expected to improve the water quality of localreceiving waters. These local improvements may beof similar or greater value compared to the incremen-tal improvements in coastal receiving waters.
APPENDIX
Brief Description of the SPARROW Model
SPARROW is a GIS-based watershed model thatuses a hybrid statistical ⁄ mechanistic approach toestimate nutrient sources, transport, and transforma-tion in terrestrial and aquatic ecosystems of water-sheds under long-term steady state conditions (Smithet al., 1997; Alexander et al., 2008). SPARROWincludes nonconservative transport, mass-balanceconstraints, and water flow-paths defined by topogra-phy, streams, and reservoirs, based on a stream-reach network with delineated reach catchments. Themodel-estimated flux leaving each reach (i) in SPAR-ROW, F�i , is given by
F�i ¼Xj2J ið Þ
F0j
0@
1AdiT ZS
i ;ZRi ; hS; hR
� �
þXNS
n¼1Sn;ianDn ZD
i ; hD� � !
T0 ZSi ;Z
Ri ; hS; hR
� �ðA1Þ
The first summation term represents the flux (F�j )from all upstream confluent reaches J ið Þ that aredelivered downstream to reach i. di is the fraction ofupstream flux delivered to reach i; di generally equals1 unless the upstream end of reach i is the location ofa diversion. T �ð Þ is the stream transport function rep-resenting attenuation processes acting on flux as ittravels along the reach pathway (instream decay).This function defines the fraction of the flux enteringreach i at the upstream node that is delivered to thereach’s downstream node. The factor is a function ofmeasured stream and reservoir characteristics,denoted by the vectors ZS and ZR, with correspondingcoefficient vectors hS and hR.
The second summation term represents the incre-mental flux (that is introduced to the stream networkin reach i). This term is composed of the flux originat-ing from specific sources, indexed by n = 1,…, NS.
Associated with each source is a source variable,denoted Sn. Depending on the nature of the source,this variable could represent the mass of the sourceavailable for transport to streams, or it could be thearea of a particular land use. The variable an is asource-specific coefficient that converts source vari-able units to flux units. The function Dn �ð Þ representsthe land-to-water delivery factor. For sources associ-ated with the landscape, this function along with thesource-specific coefficient determines the amount of aconstituent delivered to streams. The land-to-waterdelivery factor is a source-specific function of a vectorof delivery variables, denoted by ZD
i , and an associ-ated vector of coefficients hD. The last term in theequation, function T 0 �ð Þ, represents the fraction offlux originating in and delivered to downstream endof reach i. This term is similar in form to the streamdelivery factor defined in the first summation termbut is used to transport flux only from the midpointof the reach to the outlet. A more in-depth descriptionof the SPARROW model is given in Schwarz et al.(2006).
Confidence Limits in SPARROW Predictions
The actual delivered flux from SPARROW isassumed to depend on a multiplicative error termadded to Equation (A1), which represents othersources and processes not included in the SPARROWanalysis. Because of this residual term, and becausethe determination of the predicted flux depends oncoefficients that are estimated via statistical methods,the estimated delivered yield, and the ranking of thatyield across HUC8s is subject to uncertainty. Due tothe nonlinear manner in which the estimated coeffi-cients enter the model, it was necessary to usebootstrap methods to assess the uncertainty in theyields from SPARROW and the ranking based on theyields.
Delivered yield for each HUC8 is estimated bysumming the incremental flux component of Equa-tion (A1) across all reaches within a HUC8watershed, and then dividing the sum by the areaof the HUC8 watershed. To simplify notation, let b
represent the set of all model coefficients, b ¼ a; hf g,and let DFi bð Þ denote the incremental flux for reach i,that is, DFi bð Þ corresponds to the second summationterm and factor T 0 �ð Þ in Equation (A1). �Ti bð Þ is thendefined as the fraction of flux leaving reach i that isdelivered to the Gulf of Mexico and is formed by theproduct of the delivery factor for all reaches in theflow path between reach i and the mouth of the Gulfof Mexico. The modeled component of delivered yieldfor HUC8 watershed u is given by the aggregation ofdelivered incremental flux across all reaches in the
ROBERTSON, SCHWARZ, SAAD, AND ALEXANDER
JAWRA 546 JOURNAL OF THE AMERICAN WATER RESOURCES ASSOCIATION
unit, I uð Þ, normalized by the cataloging unit area, Au.Actual delivered yield, denoted Yu, is composed ofmodeled delivered yield and a multiplicative modelerror term,
Yu ¼P
i2I uð Þ Ti bð ÞDFi bð ÞAu
� exp euð Þ; ðA2Þ
where eu is an independent, identically distributederror term, assumed to have the same statistical dis-tribution as the weighted residual from the estimatedSPARROW model. Note that this formulation of themodel error, consistent with the prediction methodol-ogy used in SPARROW (see Schwarz et al., 2006),assumes the error term does not accumulate acrossreaches, but is simply ‘‘tacked-on’’ to the modeledcomponent to account for unexplained variation influx. The use of a multiplicative error is consistentwith the assumption, and general observation,that the error process in a SPARROW model is scale-independent (see Schwarz et al., 2006, for additionaldiscussion).
Equation (A2), the amount of delivered yield froma HUC8 watershed, depends on unknown values ofthe model coefficients, b, and the error term, eu. Thecalibrated SPARROW model provides WNLLS esti-mates of the coefficients, b. Additionally, theweighted residuals from the model, obtained by com-paring monitored and predicted flux at the NM moni-tored reaches [denoted by the set I Mð Þ] andnormalized by the leverage for the observation, hi,can be used to form a mean estimate of an exponenti-ated error term,
exp euð Þ^
¼ 1
NM
Xi2I Mð Þ
exp eiffiffiffiffiffiffiffiffiffiffiffiffiffiffiffiffiffiffiffiffiffiffiffiwi= 1� hið Þ
p� �; ðA3Þ
where ei is the estimated residual for monitored reachi, and wi is the weight applied to the observation(only the TN model received non-unitary weights)(see Alexander et al., 2008 and Schwarz et al., 2006,for details). The WNLLS estimate of delivered yield isgiven by
Yu ¼P
i2I uð Þ Ti b� �
DFi b� �
Au� exp euð Þ
^ðA4Þ
The nonlinearity of the Ti �ð Þ and DFi �ð Þ functionswith respect to the estimated coefficients, b, causesthe WNLLS estimate of predicted yield given inEquation (A4) to be biased. A bootstrap procedure,described in greater detail in Schwarz et al. (2006), is
applied to correct for this bias. The method is imple-mented by repeated estimation of the SPARROWmodel using randomly selected integer weights(that sum to NM), resulting in R realizations of theestimated coefficients and estimated mean exponenti-
ated residual, denoted bðrÞ
and exp euð Þ^
ðrÞ, r = 1,…, R(note that the integer weights used to implement thebootstrap method are not included in the weights, wi,used to compute the mean exponentiated weightedresidual via the bootstrap iteration-specific computa-tion of Equation A3 for the TN model). Accordingly,the rth bootstrap-iteration estimate of delivered yieldis given by
YðrÞu ¼
Pi2I uð Þ Ti b
ðrÞ� �
DFi bðrÞ
� �Au
� exp euð Þ^
ðrÞ ðA5Þ
R equals 200 for all bootstrap estimates derived inthe present analysis. The bias-corrected estimate ofdelivered yield, denoted Yc
u, is obtained using a ratioformulation of the bootstrap and WNLLS estimates
Ycu ¼
Y2u
1R
PRr¼1 Y
ðrÞu
ðA6Þ
The standard error of the bias-corrected estimateof delivered yield is given by (see Schwarz et al.,2006, for a derivation)
SE Ycu
� �¼ Yc
u
ffiffiffiffiffiffiffiffiffiffiffiffiffiffiffiffiffiffiffiffiffiffiffiffiffiffiffiffiffiffiffiffiffiffiffiffiffiffiffiffiffiffiffiffiffiffiffiffiffiffiffiffiffiffiffiffiffiffiffiffiffiffiffiffiffiffiffiffiffiffiffiffiV exp ei
ffiffiffiffiffiffiffiffiffiffiffiffiffiffiffiffiffiffiffiffiffiffiffiwi= 1� hið Þ
p� �� �exp euð Þ
2^ þ
V YðrÞu
� �Y2
u
vuuuut ;
ðA7Þ
where V �ð Þ is the standard variance operator,
V xið Þ ¼ 1=Nð ÞXN
i¼1 xi � 1=Nð ÞXN
j¼1 xj
� �2The estimate of the confidence interval for deliv-
ered yield requires explicit consideration of the distri-bution of the model residuals, rather than just thestatistical properties of the exponential residuals aswas used to derive the bias-corrected and standarderror estimates. The bootstrap method for incorporat-ing the distribution of the model residuals is to deter-mine the empirical distribution of the combinedbootstrap-iteration estimate of the modeled compo-nent of delivered flux and a randomly selected, expo-nentiated weighted error from the original NM values
INCORPORATING UNCERTAINTY INTO THE RANKING OF SPARROW MODEL NUTRIENT YIELDS FROM MISSISSIPPI ⁄ ATCHAFALAYA RIVER BASIN WATERSHEDS
JOURNAL OF THE AMERICAN WATER RESOURCES ASSOCIATION 547 JAWRA

obtained with the WNLLS model estimation (NM
equals 425 for both the TN and TP applicationsdescribed in this paper). Let exp e
ffiffiffiffiffiffiffiffiffiffiffiffiffiffiffiffiffiffiffiffiw= 1� hð Þ
p� �ðrÞu
denote the rth bootstrap-iteration random selectionfrom among the NM WNLLS estimates ofexp ei
ffiffiffiffiffiffiffiffiffiffiffiffiffiffiffiffiffiffiffiffiffiffiffiwi= 1� hið Þ
p� �, i 2 I Mð Þ. As explained in Schwarz
et al. (2006), the R values of
q ¼
Pi2I uð Þ Ti b
ðrÞ� �
DFi bðrÞ
� �Au
� exp �effiffiffiffiffiffiffiffiffiffiffiffiffiffiffiffiffiffiffiffiw= 1� hð Þ
p� �ðrÞu;
ðA8Þare set in ascending order. Let Pc denote the confi-dence interval coverage probability (set to 0.9 for thisanalysis), let qlo correspond to the R 1� Pcð Þ=2b c þ 1ranked value, and let qhi represent thePcRd e þ R 1� Pcð Þ=2b c ranked value ( �b c and �d e repre-
sents the next lowest and next highest integer,respectively). The resulting 90% confidence interval,known as an equal-tailed hybrid confidence interval(Shao and Tu, 1995), is given by
Yu
exp euð Þ^
0B@
1CA
2
1
qhi;1
qlo
ðA9Þ
SIGNIFICANCE LEVEL AND CONFIDENCELIMITS IN RANKINGS OF THE HUC8 BASINS
The assessment of uncertainty in the ranking ofthe delivered yields was also based on bootstrapmethods. Unlike the methods used to place confi-dence limits on specific SPARROW predictions, thetheoretical basis behind the underlying assessmentof uncertainty in ranks was less rigorous. The ad hocmethod used here is based on a bootstrap percentileapproach to estimating a significance level and confi-dence interval (Shao and Tu, 1995). The bootstrapmethod is based on R repetitions of the generatedquantity
zðrÞu ¼
Pi2I uð Þ Ti b
ðrÞ� �
DFi bðrÞ
� �Au
� exp effiffiffiffiffiffiffiffiffiffiffiffiffiffiffiffiffiffiffiffiw= 1� hð Þ
p� �ðrÞu
ðA10Þ
For each repetition, r, the rank of each estimateddelivered incremental yield (z
ðrÞu ) is recorded. The
empirical distribution of these 200 individual ranks
is assumed to be similar to the true distribution ofranks given the information contained in theSPARROW model. The model residual component ofzðrÞu , which represents the bulk of the uncertainty in
the analysis, conforms well with this assumption.Then on the basis of the 200 different ranks foreach HUC8 watershed from the bootstrapping, it ispossible to determine with what certainty (probabil-ity) a specific HUC8 would be ranked in or not inthe top specified number of watersheds. For exam-ple, a specific watershed would be in the top 150with 90% confidence, if 90% or more of the time(‡180 times of the 200 repetitions), the watershedranked £150.
Additionally, the 90% confidence limits of the rank-ings for each watershed can be estimated by the 5thand 95th percentiles of the 200 rankings from thebootstrapping procedure.
SUPPORTING INFORMATION
Additional Supporting Information may be foundin the online version of this article:
Table S1. Ranking of HUC8 Watersheds in theMississippi ⁄ Atchafalaya River Basin on the Basis ofTotal Nitrogen Yields, With Confidence Intervals.
Table S2. Ranking of HUC8 Watersheds in theMississippi/Atchafalaya River Basin on the Basis ofTotal Phosphorus Yields, With Confidence Intervals.
Please note: Neither AWRA nor Wiley-Blackwell isresponsible for the content or functionality of anysupporting materials supplied by the authors. Anyqueries (other than missing material) should be direc-ted to the corresponding author for the article.
ACKNOWLEDGMENTS
Partial funding for this study was provided by the U.S. Environ-mental Protection Agency and the U.S. Geological Survey’sNational Water-Quality Assessment Program. We would like tothank Dennis Heisey for assistance in developing statistical proce-dures for this study, Joe Schubauer-Berigan, Steve Preston, DonnaMyers, and Kevin Breen for reviewing early versions of this manu-script, and Bill Franz, Darrell Brown, and Janice Ward for coordi-nating interagency discussions.
LITERATURE CITED
Alexander, R.B., R.A. Smith, G.E. Schwarz, E.W. Boyer, J.V.Nolan, and J.W. Brakebill, 2008. Differences in Phosphorusand Nitrogen Delivery to the Gulf of Mexico From theMississippi River Basin. Environmental Science and Technology42:822-830.
ROBERTSON, SCHWARZ, SAAD, AND ALEXANDER
JAWRA 548 JOURNAL OF THE AMERICAN WATER RESOURCES ASSOCIATION

Beven, K.J., 2002. Towards an Alternative Blueprint for a Physi-cally Based Digitally Simulated Hydrologic Response ModelingSystem. Hydrological Processes 16:189-206.
Corsi, S.R., D.J. Graczyk, D.W. Owens, and R.T. Bannerman, 1997.Unit-Area Loads of Suspended Sediment, Suspended Soils, andTotal Phosphorus From Small Watersheds in Wisconsin. U.S.Geological Survey, Fact Sheet 195-197, Middleton, Wisconsin
Diebel, M.W., J.T. Maxted, S. Han, D.M. Robertson, and M.J. Van-der Zanden, 2009. Landscape Planning for Agricultural Non-point Source Pollution Reduction III: Assessing Phosphorus andSediment Reduction Potential. Environmental Management43:69-83.
Doherty, J., 2004. PEST: Model-Independent Parameter Estima-tion, User Manual, Version 5. Watermark Numerical Comput-ing, Brisbane, Qld.
Gassman, P.W., M. Jha, S. Secchi, and J.G. Arnold, 2003. InitialCalibration and Validation of the SWAT Model for the UpperMississippi River Basin. In: Diffuse Pollution and Basin Man-agement, M. Bruen (Editor). Centre for Water ResourcesResearch, Civil Engineering Department, University College,Dublin, Ireland, pp. 10-35 to 10-40.
Goolsby, D.A., W.A. Battaglin, G.B. Lawrence, R.S. Artz, B.T. Au-lenbach, R.P. Hooper, D.R. Keeney, and G.J. Stensland, 1999.Flux and Sources of Nutrients in the Mississippi-AtchafalayaRiver Basin—Topic 3 Report for the Integrated Assessment onHypoxia in the Gulf of Mexico: Silver Spring, MD, NOAACoastal Ocean Office, NOAA Coastal Ocean Program DecisionAnalysis Series No. 17, 130 pp.
Hooper, R.P., B.T. Aulenbach, and V.J. Kelly, 2001. The NationalStream Quality Accounting Network: A Flux-Based Approach toMonitoring Water Quality of Large Rivers. Hydrological Pro-cesses 15:1089-1106.
Mississippi River ⁄ Gulf of Mexico Watershed Nutrient Task Force,2008. Gulf Hypoxia Action Plan 2008 for Reducing, Mitigating,and Controlling Hypoxia in the Northern Gulf of Mexico andImproving Water Quality in the Mississippi River Basin, Wash-ington, D.C.
Moore, C. and J. Doherty, 2005. Role of the Calibration Process inReducing Model Predictive Error. Water Resources Research41(W05020):14.
Neitsch, S.L., J.G. Arnold, J.R. Kiniry, and J.R. Williams, 2005.Soil and Water Assessment Tool Theoretical Documentation,Version 2005. Grassland, Soil and Water Research Laboratory,Agricultural Research Service, Temple, Texas, 476 pp. ftp://ftp.brc.tamus.edu/pub/swat/doc/swat2005/, accessed March 8,2008.
Nolan, J.V., J.W. Brakebill, R.B. Alexander, and G.E. Schwarz,2002. Enhanced River Reach File 2. U.S. Geological Survey,Open-File Report 02-40.
Ouyang, D., J. Bartolic, and J. Selegean, 2005. Assessing SedimentLoading From Agricultural Croplands in the Great Lakes Basin.Journal of American Science 1:14-21.
Schwarz, G.E., A.B. Hoos, R.B. Alexander, and R.A. Smith, 2006.The SPARROW Surface Water-Quality Model: Theory, Applica-tion and User Documentation. U.S. Geological Survey, Tech-niques and Methods Report, Book 6, Chapter B3, Reston,Virginia.
Seaber, P.R., F.P. Kapinos, and G.L. Knapp, 1987. Hydrologic UnitMaps: U.S. Geological Survey Water-Supply Paper 2294, 63 pp.http://www.water.usgs.gov/GIS/huc.html, accessed March 3,2008.
Shao, J. and D. Tu, 1995. The Jackknife and Bootstrap. Springer,New York, 516 pp.
Smith, R.A., G.E. Schwarz, and R.B. Alexander, 1997. RegionalInterpretation of Water-Quality Monitoring Data. WaterResources Research 33:2781-2798.
Tomer, M.D., D.E. James, and T.M. Isenhart, 2003. Optimizing thePlacement of Riparian Practices in a Watershed Using TerrainAnalysis. Journal of the Soil and Water Conservation 58:198-206.
USEPA (U.S. Environmental Protection Agency), 1998. NationalStrategy for the Development of Regional Nutrient Criteria:Office of Water, EPA-822-R-98-002, 47 pp.
USEPA (U.S. Environmental Protection Agency), 2000. NutrientCriteria Technical Guidance Manual—Lakes and Reservoirs:Office of Water, EPA-822-B-00-001, 238 pp.
UW-CALS (University of Wisconsin-Madison, College of Agricul-tural and Life Sciences), 2005. The Wisconsin Buffer Initiative:A Report to the Natural Resources Board of the WisconsinDepartment of Natural Resources. http://www.nelson.wisc.edu/people/nowak/wbi/reports/nrbFinalReport.pdf, accessed March 3,2008.
INCORPORATING UNCERTAINTY INTO THE RANKING OF SPARROW MODEL NUTRIENT YIELDS FROM MISSISSIPPI ⁄ ATCHAFALAYA RIVER BASIN WATERSHEDS
JOURNAL OF THE AMERICAN WATER RESOURCES ASSOCIATION 549 JAWRA