Flood in Central Europe -Focus Germany — Impact and management - CEDIM Forensic Disaster Analysis...
22
Center for Disaster Management and Risk Reduction Technology 1 CEDIM Forensic Disaster Analysis Group (FDA) June 2013 flood in Central Europe - Focus Germany Report 2 — Update 1: Impact and management 1 (This report includes developments up to 20 Jun 2013 at 10:00 a.m.) Authors: Bijan Khazai, Tina Bessel, Stella Möhrle, André Dittrich, Kai Schröter, Bernhard Mühr, Florian Elmer, Tina Kunz-Plapp, Werner Trieselmann, Michael Kunz Breached levee at Fischbeck (Photo from 10 Jun 2013), Stendal District, northern Saxony-Anhalt (Photo: Berns-Volker Brahms / Volksstimme) 2 1 This report was published on 13 Jun 2013, revised on 17 Jun and updated on 27 Jun 2013. 2 After a levee was breached at Fischbeck (Photo) in the north of Saxony-Anhalt, floodwaters from the Elbe have been flowing into the Elbe-Havel- Winkel since early Monday morning (10 Jun 2013). By 12 Jun, 6000 people in several areas had been evacuated; a total of 40 000 were evacuated in Saxony-Anhalt. The break in the breached levee can only be closed when the water levels are receding. In this photo, the water level was 8.20 meters — 52 centimeters above the last record from 2002. Reproduced with permission from the chief editorial staff at "Volksstimme" (Magdeburg/Stendal).
Transcript of Flood in Central Europe -Focus Germany — Impact and management - CEDIM Forensic Disaster Analysis...

Center for Disaster Management and Risk Reduction Technology
1
CEDIM Forensic Disaster Analysis Group (FDA)
June 2013 flood in Central Europe - Focus Germany
Report 2 — Update 1: Impact and management1 (This report includes developments up to 20 Jun 2013 at 10:00 a.m.)
Authors: Bijan Khazai, Tina Bessel, Stella Möhrle, André Dittrich, Kai Schröter, Bernhard Mühr, Florian Elmer,
Tina Kunz-Plapp, Werner Trieselmann, Michael Kunz
Breached levee at Fischbeck (Photo from 10 Jun 2013), Stendal District, northern Saxony-Anhalt (Photo: Berns-Volker Brahms / Volksstimme)2
1This report was published on 13 Jun 2013, revised on 17 Jun and updated on 27 Jun 2013.
2 After a levee was breached at Fischbeck (Photo) in the north of Saxony-Anhalt, floodwaters from the Elbe have been flowing into the Elbe-Havel-
Winkel since early Monday morning (10 Jun 2013). By 12 Jun, 6000 people in several areas had been evacuated; a total of 40 000 were evacuated in Saxony-Anhalt. The break in the breached levee can only be closed when the water levels are receding. In this photo, the water level was 8.20 meters — 52 centimeters above the last record from 2002. Reproduced with permission from the chief editorial staff at "Volksstimme"
(Magdeburg/Stendal).

CEDIM Report on the 2013 June floods in Central Europe
2
Summary .......................................................................................................................................... 4
1 Short overview of floods ........................................................................................................... 5
2 Impact and damage.................................................................................................................. 6
2.1 General impact ................................................................................................................... 6
2.2 Impact on transport infrastructure ........................................................................................ 7
2.3 Analysis of Twitter messages on the impact of the floods ...................................................12
3 Management ...........................................................................................................................14
3.1 Evacuations .......................................................................................................................14
3.2 Resilience in the affected areas: Indicator-based analysis ..................................................15
3.3 Analysis of the impact of the floods ....................................................................................18
3.4 Comparison of resilience potential and evacuations.................................................................20
4 Literature and sources .............................................................................................................21

CEDIM Report on the 2013 June floods in Central Europe
3
Short summary of the 2013 June floods
Basic hydrometeorological information (see Report 1 — Update 2)
Key areas affected
Germany (Saxony-Anhalt, Saxony, Thuringia, Bavaria, Austria, Czech Republic; catchment
area of the Danube (including the Regen, Lech, and Inn-Salzach) and the Elbe (including
the Saale and the Mulde)
Hydrological
magnitude
Largest area affected of all flood events since 1950 (>46 % of major rivers in Germany
are affected by floods with at least a 5-years return period). Discharges and water levels in
many areas in the catchment areas of the Danube and Elbe reached record values.
Flood type: large scale river floods with rivers overflowing their banks and the danger of
levees breaching and extensive flooding of the hinterland.
Preconditions and
meteorological causes
Snow cover in high-altitude alpine mountains lasting till May. Extremely wet month of May,
resulting in extensive oversaturation of the soil (greatest extent in the past 50 years),
highly reduced infiltration capacity of the soil.
Stable meteorological condition (TM) constantly brought moist air from South Eastern
Europe northwards and from a northeastern direction to Central Europe. Situation was
aggravated in areas of heavy rainfall in the Central Uplands and the Alps due to
orographic forcing: Prolonged heavy precipitation in the Central Uplands and the areas
close to the Alps.
Sources Own analyses, German Weather Service (DWD), wettergefahren-fruehwarnung.de,
Hochwasserzentralen.de.
Basic information on impact
Death toll and persons
affected by
evacuations (as of 09
Jun 2013)
8 deaths in Germany to date (25 deaths in all affected countries)
A minimum of 52 500 persons affected by evacuations along the Danube and Elbe
Disruptions in
infrastructure (31 May
to 04 Jun 2013)
Obstruction of traffic on German federal and interstate highways due to floods in 89 state
districts. In total, there was a minimum of 4866 h of obstructed traffic in the interregional
transportation network.
Potential damages
No model-based CEDIM estimates as yet; significant amount of damages in all important
sectors is expected: residential buildings, business premises, infrastructure, agriculture;
indirect damages due to the interruption of traffic and business; reconstruction costs;
increase in flood protection budget; intangible costs (e.g. psychological impact)
External estimates of total damages (Filch Rating, GDV): approx. € 12 billion;
For Germany: flood relief funds amounting to € 8 billion
Resilience (based on
socio-economic and
institutional factors)
High resilience along the Bavarian Danube, mid to high resilience along the Upper Rhine
and Lower Elbe, low to mid resilience along the Lower Rhine, Elbe and Mulde.
Preliminary estimate of
impact (resilience, flood
intensity)
Moderate impact along Danube and Lech (most significant exception: the district of
Deggendorf), low impact along the Rhine, high impact along the Elbe (calculations for
Lower Elbe are preliminary, as the event has yet to reach its peak at these sections).

CEDIM Report on the 2013 June floods in Central Europe
4
Sources Independent analyses, Filch Rating, German Insurance Association (GDV)
Starting on 31 May 2013, the development of a large-scale flood event began in Central Europe, which primarily
affected Germany, but also its neighboring countries Austria, Switzerland, the Czech Republic and Poland, as well as
Slovakia, Hungary, Croatia and Serbia.3 The meteorological cause which ultimately triggered the floods was a stable
general weather pattern in Central Europe ("Trough Central Europe" - TrM according to the German Weather Service
classification scheme). A cut-off upper low pressure system over the European continent that was slowly shifting
eastwards continuously supplied moist, unstable air of subtropical origin in a wide sweep over northern to central
Europe on its eastern side, which precipitated in long periods of heavy rain, especially in areas of orographic uplift in
the Alps and the Central Uplands. The extent of the floods was aggravated by the extreme and widespread saturation
of the soil in the affected catchment areas, which resulted from a strong precipitation anomaly during the month of
May.
The key areas affected were along the Danube and Elbe and their larger tributaries. The nature of the event was
primarily that of a flood caused by (the slow drainage of) river waters. The area affected by the event (floods with
possibility of recurrence/return period of a min. of 5 years) is the largest observed (>46 % of German drainage system
considered) for the observational period (since c. 1950). Water levels and discharge in many areas (incl. the Danube,
Middle Elbe, Mulde) reached record levels.
As of 09 Jun, this flood event had claimed 8 lives in Germany, and the total number of deaths in all affected countries
is 25.4 A minimum of 52 500 people have been affected by evacuations in the catchment areas of the Elbe and the
Danube.
It is still too early for a model-based estimation of the damages by CEDIM. Significant direct and indirect damages are
expected in all essential sectors such as residential buildings, business premises, agriculture and infrastructure as
well as due to traffic congestion (31 May to 04 June: a min. of 4900 h of flood-related congestion in the German road
network), interruptions in business operations and similar consequences. Initial external estimates assume total
damages similar to or higher than those incurred during the floods of August 2002 (Fitch Rating: 12 billion euros,
German Insurance Association (GdV): same as 2002 at 11.6 billion euros or higher, German flood relief funds
amounting to € 8 million).
Based on social, economic and institutional indicators, CEDIM analyzes the resilience (the ability to compensate for
external hazards) of selected affected areas in Germany on the district (Landkreise) level. The resilience indicator is
supplemented with information on the number of people affected by evacuations per district. Combined with the
information on the magnitude of the event (maximum return period of discharge per district), an index is calculated
that allows for an initial but preliminary estimate of the impact of the floods at the district level for the areas
affected.
With the high resilience of the administrative districts along the Danube and the comparatively low number of
administrative districts along the Elbe and Mulde, the expected impact of the floods along the Lech and Danube will
mainly be at a moderate level (exceptions: the districts Deggendorf, Straubing, Ostallgäu), while heavy impact is
expected along the Mulde and Elbe. The calculations for the Middle and Lower Elbe will continue to change markedly,
as the event has not yet reached its conclusion.
3 Wikipedia: http://de.wikipedia.org/wiki/Hochwasser_in_Mitteleuropa_2013 (in German, accessed on 26 Jun 2013)
4 ibid.

CEDIM Report on the 2013 June floods in Central Europe
5
1
Prolonged heavy precipitation together with extremely disadvantageous preconditions led to a large-scale flood event
that affected multiple catchments. In terms of extent and overall magnitude, this event exceeded the August 2002
floods and the previous record event: the summer floods in July 1954. The catchment areas of the Danube and the
Elbe were particularly affected (see Fig. 1).
In the Danube catchment area, the Danube, Lech, Regen and Inn-Salzach region were especially affected. At the
confluence of the Danube and the Inn in Passau, a historical floodwater level of 12.75 m was recorded (03 Jun). In
addition to Passau, the district of Deggendorf was particularly affected, where from 5th June onwards the levees were
no longer able to hold back the high water levels.
Along the Elbe, the flood wave coming from the Czech Republic had been passing through Dresden, Torgau and
Dessau since the 6th of June, and reached Magdeburg on the 9
th of June. Due to the strong inflow from the Saale (in
particular Halle) and Mulde, which were also affected, the mouth of the Saale and the downstream areas of the Elbe
from that point on (incl. Magdeburg) were especially affected. The water levels along the Middle Elbe, Saale and
Mulde reached previous maximum values. In northern Saxony-Anhalt, the breach of a levee at Fischbeck on 10th
June resulted in widespread flooding in the Elbe-Havel-Winkel.
Other affected catchment areas are those of the Weser (in particular the Werra) and the Rhine. In these regions, the
situation has eased considerably. The flood waves from the Tauber, Main and Neckar did not experience unusual
consequences for the flood events in the Central and Lower Rhine areas.
The comparison of the spatial dimensions and the magnitude (Fig. 1) shows the markedly larger spatial extent of the
2013 event and the increased intensity/event magnitude over large areas (Middle and Lower Elbe, Danube, Inn).
However, the hydrological classification alone does not allow the forming of any conclusions concerning the amount of
expected damage.
Table 1: Comparison of significant flood events – Causes, intensity, consequences
Year –
Name Cause of flood
Waterway(s) and water levels with maximum recurrence interval (in
years)
Impact in-dices
1):
S: Strength
L: spatial extent
Deaths Economic loss-
es/financial damages
1954
Summer floods Heavy rains
>200
White Elster, Greiz gauge (TH)
S = 42.4
L = 28.2 % n.s. n.s.
1999 Spring floods
Heavy rains ~200 Ammer, Stege gauge, (BY)
S = 24.4 L = 18.7 %
7 (Em-Dat) 2)
€ 412 mil (Kron 2004) 3)
*
2005 August floods ("the Alpine
Floods")
Heavy rains < 75 Lech, Landsberg/Lech gauge (BY)
S = 19.2 L = 16.9 %
n.s. € 190 mil (LfU 2006)
4)
2002
August floods Heavy rains
> 500
Freiberger Mulde, Nossen gauge (SN)
S = 35.9
L = 22.4 % 27 (Em-Dat) € 11.8 mil (Kron 2004)
3)*
2013 July floods
High soil saturation followed by heavy
rains
~500
Zwickauer Mulde, Wechselburg gauge (SN)
S = 75 L = 46 %
8 (as of 20 Jun 2013)
~12 bil (Fitch Rating – first estimates)
1) S: Recurrence interval of peak discharge above HQ5 multiplied by the assigned river length (L: river length with discharge > HQ5 as percentage of
entire river network considered, modified according to Uhlemann et al. 2010 (DOI: 10.5194/hess-14-1277-2010) 2)
EM-DAT (http://www.emdat.be/database), queried in June 2012 3)
Kron 2004: Zunehmende Überschwemmungsschäden: Eine Gefahr für die Versicherungswirtschaft? (Increasing flood damages: A danger for the
insurance industry?), ATV-DVWK Bundestagung, Würzburg 4)
LfU (Bavarian State Environmental Authority) 2006: August-Hochwasser 2005 in Südbayern (2005 August floods in southern Bavaria), Augsburg

CEDIM Report on the 2013 June floods in Central Europe
6
Figure 1: Comparison of the 1954 and 2002 events with the current June 2013 event: Max. return period in years (probability of flood as a recurrence interval) along the flood affected major rivers
The flood resistance of the affected areas, changes/improvements in flood protection, the differing geomorphology,
settlement pattern and hence the exposition of people and material assets have a decisive influence on the extent of
the losses and will be analyzed in Chapter 3: Management.
This report concentrates on the impact of the event. Report on the event can be viewed at
http://www.cedim.de/english/2408.php. In these reports, it is primarily the hydrometeorological nature of the event that
will be described in detail.
2
2.1
This flood event has had a great impact on people, transportation and the economy. Numerous levee breaches, e.g. in
Bavaria and along the Elbe, resulted in large-scale regional floods. In many areas, often thousands of people were
forced to leave their apartments, homes and towns due to evacuation measures. In the Salzland District in Saxony-
Anhalt, a volunteer relief worker died during the filling of sandbags and a woman died during an evacuation. In Baden-
Württemberg, 3 persons have died since the beginning of the floods, including a fireman. So far, in all affected flood
areas in the Czech Republic, Germany, Austria, and Switzerland, a minimum of 25 deaths (8 of which in Germany)
have been recorded, and 4 people have been reported missing.5
Utilities such as the electrical grid and the local water supply failed during the floods or were shut down as a
precautionary measure in order to prevent more extensive damage to the networks. Repairing the utility networks and
bringing them back into service may take several more days or weeks in certain cities and districts. Furthermore, there
were also a number of disruptions in the area of transportation. In addition to the large-scale flooding of numerous city
centers, traffic was also disrupted in the interregional transportation network, and even on federal highways. Due to a
breached levee on 10 Jun, the long-distance transportation lines of the Deutsche Bahn AG had to be shut down in the
district of Stendal, resulting in trains being canceled and long delays.
In addition, many economic sectors such as agriculture were heavily affected by the floods. "So far, at least 150 000
hectares of grassland and arable land has been flooded, reported the German Farmers' Association (DBV). It is
5 Wikipedia: http://de.wikipedia.org/wiki/Hochwasser_in_Mitteleuropa_2013 (accessed on 26 Jun 2013)

CEDIM Report on the 2013 June floods in Central Europe
7
estimated that the area affected will increase to a total of 250 000 hectares."6 In large industrial corporations such as
Porsche AG (factory in Leipzig), Volkswagen AG (factory in Zwickau) or Südzucker AG (factory in Zeitz), production
has stopped temporarily or for longer periods because manufacturing facilities were damaged and/or the company's
logistics supply chains were interrupted due to disruptions in transport infrastructure. Medium-sized and small
companies in the regions affected by the flood are also heavily affected. The total extent of direct and indirect
damages is currently not foreseeable and can only be ascertained once the floodwaters in the affected areas have
receded.
Based on currently available information, model-based analyses of direct and indirect damages cannot yet be carried
out, as data on the exact extent of the flooding (flood masks from remote sensing data or hydraulic modeling, but most
importantly because the corresponding flooding depths are not yet available.
A compilation of initial external damage estimates, primarily from and for (re)insurance purposes is summarized in
Table 2 (as of 12 Jun 2012) and shows damages that are on a scale comparable to that of the August 2002 event.
Table 2: Information available to date on total damages due to the 2013 June floods (cf.: 2002 August floods: total damages of 11.1 billion euros; adjusted to today's values with BPI: 14.8 billion euros)
Region Estimate Date Source
All affected areas EUR 16.5 bil 10 Jun 2013 Advisen Insurance Intelligence (as cited in Willis)
All EUR 10 bil 06 Jun 2013 AIR (at Touchstone presentation in Zurich)
Germany EUR 12 bil 11 Jun 2013 Fitch Rating
Germany EUR >11 bil 08 Jun 2013 DIHK (Association of German Chambers of Commerce and
Industry)
Germany EUR 10 bil 06 Jun 2013 AIR (at Touchstone presentation in Zurich)
Saxony EUR 2.5 bil 06 Jun 2013 Head of Task Force for Reconstruction, Jaeckel (MDR)
Germany EUR 8 bil Aid allocated for federal and state flood relief funds
Austria EUR 3 bil 10 Jun 2013 Erik Ebyl, Generali (as cited in Willis)
Austria EUR 2.2 bil 10 Jun 2013 EcoAustria (Economic research institute)
2.2
Comprehensive data on the type, extent and duration of the obstruction of traffic is necessary in order to evaluate
indirect damages in the transport sector. In order to obtain accurate information on road traffic, ongoing traffic reports
from police sources in Germany have been monitored and recorded daily from 6 a.m. to 12 a.m. at 3-hour intervals
since Friday, 31 Jun 2013, and filtered for disruptions with a correlation to the flood event. The data compiled is then
stored in a database. The construction of this database will continue even after this report has been released.
The first evaluation of the data was carried out for the period from 31 May 2013 at 12 p.m. to 04 Jun 2013 at 12 p.m.,
initially for the interregional transportation network consisting of federal highways (BAB or Bundesautobahn) and
interstate highways. In this evaluation, the causes and types of obstruction of traffic as well as the number and
duration of disruptions which can be traced back to the flood event are considered.
Figure 2 shows the percentages of natural causes of traffic disruptions. The main cause at 81.6 % is the risk of floods
and the actual flooding of transportation routes, which are subsumed under the category "Floods". In addition, fallen
trees and landslides also caused disruptions/blockages in the flow of traffic.
6 Source: http://www.tagesschau.de/wirtschaft/hochwasser-schaeden100.html (in German, accessed on 12 Jun 2013)

CEDIM Report on the 2013 June floods in Central Europe
8
Figure 2 (left): Causes of nature-related traffic obstructions in the period from 31 May to 04 Jun 2013 on German federal and inter-
state highways.
Figure 3 (right): Types of nature-related traffic obstructions in the period from 31 May to 04 Jun 2013 on German federal and in-
terstate highways.
The term "traffic obstruction" includes disruptions of all types. Figure 3 shows the percentages of the types of
obstruction in traffic due to the flood event. 46.1 % of traffic obstructions recorded were roads that had been closed in
both directions. The full closure of a road completely interrupts the flow of traffic on the routes affected, and hence
probably results in the greatest amount of indirect damages in comparison with other types of obstructions. At 36.7 %,
the second most common type of obstruction of traffic is "other obstructions". This includes obstructions such as water
or dirt on the road surface or the risk of hydroplaning, the occurrence of which is related to the flood event.
Tables 3 to 5 and Figures 7 and 8 give information on the number and duration of traffic obstructions per district. In
total, for the time period considered, traffic disruptions were recorded for federal and interstate highways in 89
German administrative districts. For this purpose, 245 traffic reports related to the flood event from police sources
were evaluated. In total, traffic obstructions lasting for a minimum of 4866 hours were recorded. On average, a single
disruption lasted for approximately 19.86 hours.

CEDIM Report on the 2013 June floods in Central Europe
9
Table 3: TOP 10 - Administrative districts according to no. of traffic obstructions
Rank Administrative districts
(Federal state)
No. of traffic
obstructions
1 Traunstein (BY) 19
2 Erzgebirgskreis (SN) 10
3 Berchtesgadener Land (BY) 9
Rheingau-Taunus-Kreis (HE) 9
Saale-Holzland-Kreis (TH) 9
Vogtlandkreis (SN) 9
7 Miesbach (BY) 6
Mittelsachsen (SN) 6
Reutlingen (BW) 6
Rosenheim (BY) 6
Saale-Orla-Kreis (TH) 6
The administrative districts with the highest number of traffic disruptions are ranked in Table 3. In Traunstein, the
interstate highways B 304 and B 305 have been particularly affected since the 2nd of June. The B 304 was blocked at
multiple locations due to fallen trees and landslides. The B 305 was flooded at several locations. Several sections of
the federal highway A 8 in the Traunstein district as well as in the neighboring Rosenheim district were also interrupted
due to flooding. In the Erzgebirgskreis district, the interstate highway B 180 was closed due to fallen trees and a
landslide, and the B 283 and B 95 were closed due to flooding. In the Vogtlandkreis district, traffic on the interstate
highways B 173 and B 169 was interrupted several times due to floods. In the Saale-Holzland-Kreis district, the B 7
and the B 88 were also affected by repeated closures of certain sections. The federal highways A 4 and A 9 in
Thuringia were closed mostly for short periods. In the Rheingau-Taunus-Kreis district, multiple sections of the B 42
have been closed due to flooding.

CEDIM Report on the 2013 June floods in Central Europe
10
Table 4: TOP 10 - Administrative districts according to total duration of traffic obstructions
Rank Administrative districts
(Federal state)
Total duration of traffic
obstructions (in h)
1 Erzgebirgskreis (SN) 276
2 Traunstein (BY) 255
Vogtlandkreis (SN) 255
4 Saale-Holzland-Kreis (TH) 252
5 Rheingau-Taunus-Kreis
(HE) 192
6 Greiz (TH) 168
7 Leipzig (SN) 162
8 Miesbach (BY) 153
9 Berchtesgadener Land (BY) 150
10 Mittelsachsen (SN) 147
Figure 5 shows the total duration of traffic obstructions per district. This is extremely high in the Erzgebirge region due
to the occurrence of a large number of disruptions that have persisted since 31 May 2013. The total duration of traffic
obstructions can also increase with the number of disruptions, which is why most of the TOP 10 districts from Table 3
are also represented in Table 4.
Table 5 and Figure 8 show the average duration of a traffic obstruction in the respective districts. The Wartburgkreis
district is at the top of the ranking because the interstate highway B 62 in the district was closed from 31 May 2013 to
the end of the time period considered (and beyond). In this district, no other disruptions were reported in the
interregional transportation network, resulting in an extremely high average duration. Similarly, the other districts listed
in Table 5 also have only a few but long-term disruptions in traffic. It may be assumed that such limited closures on
interstate highways can be circumnavigated due to the high density of the transport network in Germany. However,
this inference is only possible to a limited extent, as the regional traffic routes were not considered and hence it is not
possible to draw a final conclusion on the issue.
In summary, it can be said that the evaluation of the first four days of the flood event already show large-scale
obstructions in the traffic sector. The construction of the database mentioned at the beginning will continue in order to
enable future assessments for an extended observation period as well as an extended areal analysis that includes
regional roads and town areas. Initial results allow the conjecture that the flood event will cause significant impairment
of road traffic, resulting in considerable indirect damages.
The expansion of the study to include rail transport as well as inland marine traffic is also planned. Initial reports in the
media and press releases such as those from the Deutsche Bahn AG lead to the conclusion that numerous long-term
disruptions, interruptions and obstructions are also present in these transport sectors. Considerable indirect damages
may also be expected in these areas.

CEDIM Report on the 2013 June floods in Central Europe
11
Table 5: TOP 10 - Administrative districts according to average duration of a traffic obstruction
Rank Administrative districts
(Federal state)
Average duration of a
traffic obstruction (in h)
1 Wartburgkreis (TH) 93
2 Neckar-Odenwald-Kreis
(BW) 57
Ostallgäu (BY) 57
4 Schmalkalden-Meiningen
(TH) 51
5 Weimarer Land (TH) 43
6 Schwäbisch Hall (BW) 42
7 City of Jena (TH) 40.5
8 Altenburger Land (TH) 39
9 Bergstraße (HE) 36
10 City of Heidelberg (BW) 34.5
City of Karlsruhe (BW) 34.5
CEDIM Report on the 2013 June floods in Central Europe
12
2.3
For an extended situational and damage analysis that includes the affected, Tweets (Twitter messages) whose content
included references to the ongoing flood event and also contained geographic coordinates (longitude [°] and latitude
[°]) were recorded. In order to obtain the best possible coverage of all relevant messages, the real-time Twitter data
stream was automatically filtered with a list of event-related keywords. In the second step, the messages identified
were examined manually as to their significance.
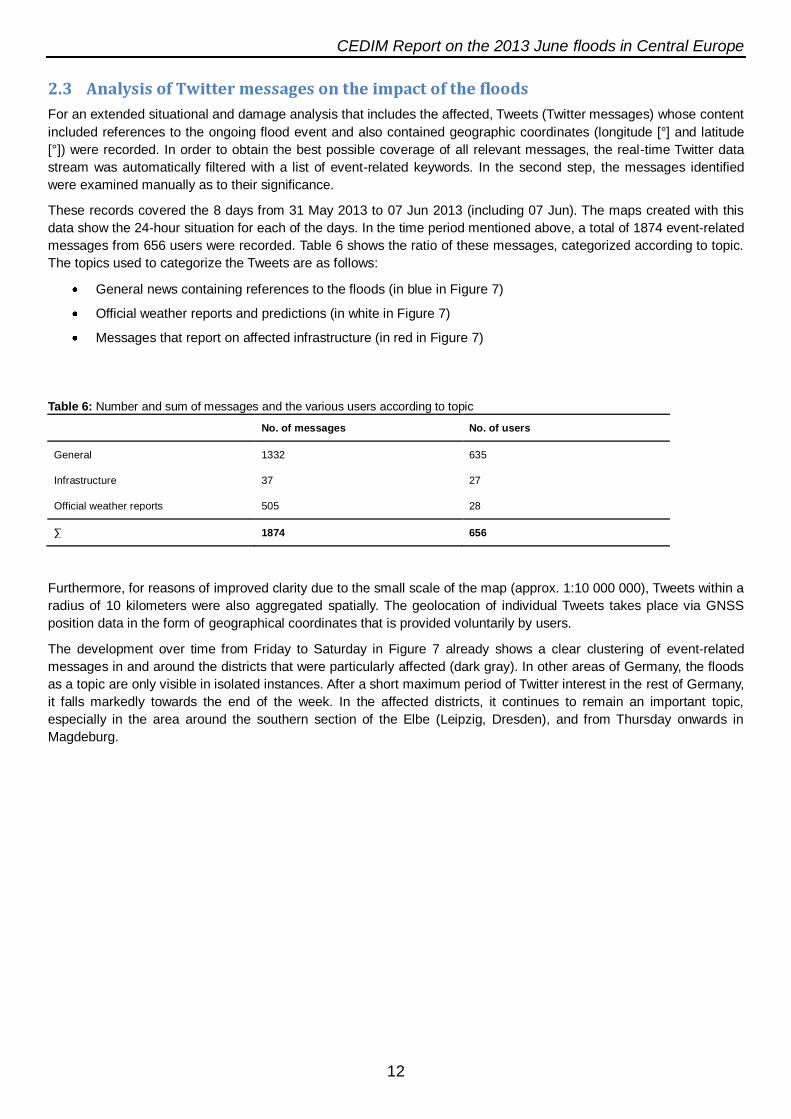
These records covered the 8 days from 31 May 2013 to 07 Jun 2013 (including 07 Jun). The maps created with this
data show the 24-hour situation for each of the days. In the time period mentioned above, a total of 1874 event-related
messages from 656 users were recorded. Table 6 shows the ratio of these messages, categorized according to topic.
The topics used to categorize the Tweets are as follows:
General news containing references to the floods (in blue in Figure 7)
Official weather reports and predictions (in white in Figure 7)
Messages that report on affected infrastructure (in red in Figure 7)
Table 6: Number and sum of messages and the various users according to topic
No. of messages No. of users
General 1332 635
Infrastructure 37 27
Official weather reports 505 28
∑ 1874 656
Furthermore, for reasons of improved clarity due to the small scale of the map (approx. 1:10 000 000), Tweets within a
radius of 10 kilometers were also aggregated spatially. The geolocation of individual Tweets takes place via GNSS
position data in the form of geographical coordinates that is provided voluntarily by users.
The development over time from Friday to Saturday in Figure 7 already shows a clear clustering of event-related
messages in and around the districts that were particularly affected (dark gray). In other areas of Germany, the floods
as a topic are only visible in isolated instances. After a short maximum period of Twitter interest in the rest of Germany,
it falls markedly towards the end of the week. In the affected districts, it continues to remain an important topic,
especially in the area around the southern section of the Elbe (Leipzig, Dresden), and from Thursday onwards in
Magdeburg.

CEDIM Report on the 2013 June floods in Central Europe
13
Friday, 31 May 2013 Saturday, 01 Jun Saturday, 02 Jun
Monday, 03 Jun Tuesday, 04 Jun Wednesday, 05 Jun
Thursday, 06 Jun Friday, 07 Jun Entire week
Figure 7: Twitter messages on the impact of the floods per day for the week of 31 May - 06 Jun 2013

CEDIM Report on the 2013 June floods in Central Europe
14
In addition to these general trends, concrete information can also be derived from individual messages. Table 7 lists
some examples of messages that refer to interruptions in infrastructure.
However, to some extent, the verification of the Twitter messages is difficult. The users mainly report on extremely
small-scale events in the inner city area and only seldom on the infrastructure previously considered in the
interregional transportation network. Likewise, the flooded roads described are not always officially closed off, and
hence are not included in the police reports. The many photos that are included in the Tweets can be viewed as a
boost to their credibility. These usually give a clear description of the situation on the ground.
Table 7: Examples of Twitter messages (translated from German)
Date Longitude [°]
Latitude [°] Message
01 Jun 2013 12.9719 51.7816 B187 completely closed off between #Wittenberg and #Jessen due to #Hochwas-
ser. Detour via #Zahna and #Seyda — plan for delays!
02 Jun 2013 8.0886 50.0202 #Hochwasser along the #Rhein: Water levels rising rapidly. Erbacher underpass blocked. B42 will be closed off starting at Oestrich and maritime traffic will be stopped soon...
02 Jun 2013 12.0689 50.8849 Jolie-Curie-Straße, Schellingstraße and sections of the Leibnizstraße are already
under water. #Gera-Untermhaus #Hochwasser #WeißeElster
06 Jun 2013 12.0975 49.0234 Grieser Spitz bridge is closed until further notice. Detour with bicycle across stone bridge possible #Hochwasser #Regensburg #Stadtamhof
3
3.1
What follows is an overview of the people and animals affected by evacuation measures between 31 May 2013 and
07 Jun 2013. Most of the figures represent minimum values and the information is derived mainly from press releases
from the respective administrative districts.
In Saxony, Saxony-Anhalt, Lower Saxony, Bavaria, Brandenburg and Baden-Württemberg, approximately 52 549
people and 650 animals were affected by evacuations due to the flood situation along the Elbe, Danube and Mulde.
The evacuations in Saxony affected approximately 26 992 people, 11 669 in Saxony-Anhalt and 9600 in Bavaria.
The first few evacuations were carried out on 01 Jun in the Sigmaringen district in Baden-Württemberg. On 02 Jun,
evacuation measures followed in Saxony in the city of Meißen, in the districts of Mittelsachsen, Zwickau,
Erzgebirgskreis and Vogtlandkreis. Dresden and the Leipzig district in Saxony, Dessau-Roßlau and the Anhalt-
Bitterfeld district in Saxony-Anhalt, as well as Passau and Kelheim in Bavaria would follow on 03 Jun. The state of
Saxony-Anhalt intensified its evacuation efforts from 05 Jun onwards. Among the affected were a children's home in
the district of Wittenberg housing approximately 70 children, a nursing home in the Salzlandkreis district, 46 severe
cases in a hospital in the Jerichower Land district, and in the Anhalt-Bitterfeld district a hospital with 20 intensive care
patients and a nursing home. In Magdeburg, a hospital with 420 persons and an old age home were among the
facilities evacuated. In a nursing facility for intensive care patients, patients had to be relocated as electricity and
district heating had been shut off. Because utilities were shut down for an entire street, bedridden patients had to be
transferred out. In the city areas along the eastern section of the Elbe, persons in need of long-term medical care were
and continue to be affected by evacuation measures.
In many administrative districts, people saw to it that they obtained private accommodation. In Dresden, a total of
2600 people were affected by evacuations. Two emergency shelters were available. On 06 Jun, an evacuation center
was closed. At this point in time, 63 persons were being housed in the other center and 19 persons in nursing homes.
Alone in the Meißen district, 1542 persons left their homes and apartments. Approximately 300 persons were housed
in temporary accommodation. Of the 8670 affected persons in the district Sächsische Schweiz-Osterzgebirge, 372
persons were located in emergency shelters on 07 Jun. In the district Mittelsachsen, a total of 396 persons were
asked to leave their home and living environment by relief workers. On 04 Jun, 73 persons were housed in emergency
shelters.
CEDIM Report on the 2013 June floods in Central Europe
15
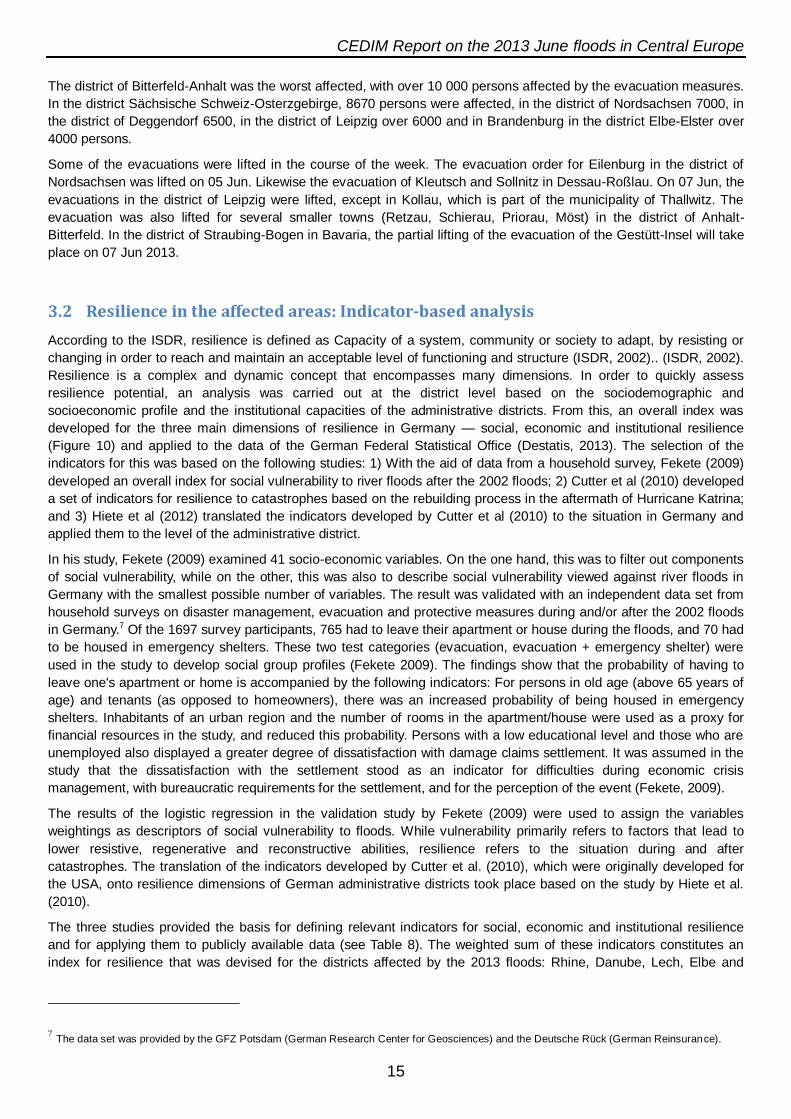
The district of Bitterfeld-Anhalt was the worst affected, with over 10 000 persons affected by the evacuation measures.
In the district Sächsische Schweiz-Osterzgebirge, 8670 persons were affected, in the district of Nordsachsen 7000, in
the district of Deggendorf 6500, in the district of Leipzig over 6000 and in Brandenburg in the district Elbe-Elster over
4000 persons.
Some of the evacuations were lifted in the course of the week. The evacuation order for Eilenburg in the district of
Nordsachsen was lifted on 05 Jun. Likewise the evacuation of Kleutsch and Sollnitz in Dessau-Roßlau. On 07 Jun, the
evacuations in the district of Leipzig were lifted, except in Kollau, which is part of the municipality of Thallwitz. The
evacuation was also lifted for several smaller towns (Retzau, Schierau, Priorau, Möst) in the district of Anhalt-
Bitterfeld. In the district of Straubing-Bogen in Bavaria, the partial lifting of the evacuation of the Gestütt-Insel will take
place on 07 Jun 2013.
3.2 -
According to the ISDR, resilience is defined as Capacity of a system, community or society to adapt, by resisting or
changing in order to reach and maintain an acceptable level of functioning and structure (ISDR, 2002).. (ISDR, 2002).
Resilience is a complex and dynamic concept that encompasses many dimensions. In order to quickly assess
resilience potential, an analysis was carried out at the district level based on the sociodemographic and
socioeconomic profile and the institutional capacities of the administrative districts. From this, an overall index was
developed for the three main dimensions of resilience in Germany — social, economic and institutional resilience
(Figure 10) and applied to the data of the German Federal Statistical Office (Destatis, 2013). The selection of the
indicators for this was based on the following studies: 1) With the aid of data from a household survey, Fekete (2009)
developed an overall index for social vulnerability to river floods after the 2002 floods; 2) Cutter et al (2010) developed
a set of indicators for resilience to catastrophes based on the rebuilding process in the aftermath of Hurricane Katrina;
and 3) Hiete et al (2012) translated the indicators developed by Cutter et al (2010) to the situation in Germany and
applied them to the level of the administrative district.
In his study, Fekete (2009) examined 41 socio-economic variables. On the one hand, this was to filter out components
of social vulnerability, while on the other, this was also to describe social vulnerability viewed against river floods in
Germany with the smallest possible number of variables. The result was validated with an independent data set from
household surveys on disaster management, evacuation and protective measures during and/or after the 2002 floods
in Germany.7 Of the 1697 survey participants, 765 had to leave their apartment or house during the floods, and 70 had
to be housed in emergency shelters. These two test categories (evacuation, evacuation + emergency shelter) were
used in the study to develop social group profiles (Fekete 2009). The findings show that the probability of having to
leave one's apartment or home is accompanied by the following indicators: For persons in old age (above 65 years of
age) and tenants (as opposed to homeowners), there was an increased probability of being housed in emergency
shelters. Inhabitants of an urban region and the number of rooms in the apartment/house were used as a proxy for
financial resources in the study, and reduced this probability. Persons with a low educational level and those who are
unemployed also displayed a greater degree of dissatisfaction with damage claims settlement. It was assumed in the
study that the dissatisfaction with the settlement stood as an indicator for difficulties during economic crisis
management, with bureaucratic requirements for the settlement, and for the perception of the event (Fekete, 2009).
The results of the logistic regression in the validation study by Fekete (2009) were used to assign the variables
weightings as descriptors of social vulnerability to floods. While vulnerability primarily refers to factors that lead to
lower resistive, regenerative and reconstructive abilities, resilience refers to the situation during and after
catastrophes. The translation of the indicators developed by Cutter et al. (2010), which were originally developed for
the USA, onto resilience dimensions of German administrative districts took place based on the study by Hiete et al.
(2010).
The three studies provided the basis for defining relevant indicators for social, economic and institutional resilience
and for applying them to publicly available data (see Table 8). The weighted sum of these indicators constitutes an
index for resilience that was devised for the districts affected by the 2013 floods: Rhine, Danube, Lech, Elbe and
7 The data set was provided by the GFZ Potsdam (German Research Center for Geosciences) and the Deutsche Rück (German Reinsurance).

CEDIM Report on the 2013 June floods in Central Europe
16
Mulde (Table 9 and Figure 10). Based on the indicators listed in Table 8, this results in an initial overview of the/a
resilience pattern in the areas potentially affected by the 2013 floods. It then becomes clear that the resilience is
highest in southern Germany and lowest in eastern Germany and in metropolitan areas.
Table 8: Resilience indicators
Dimension Factor Indicator Influence on
resilience
Social resilience
Education Percentage of population without a school leaving certificate (Hauptschulabschluss)
-
Age Percentage of elderly (> 65 years) Percentage of children (< 6 years)
-
Special requirements Percentage of population in need of long-term care -
Economic resilience
Employment Percentage of unemployed -
Number of rooms Living space per person (cubic meter per person) +
Home ownership Percentage of single family and duplex houses +
Income disparity Percentage of population receiving social welfare -
Institutional resilience
Law and order Public spending for internal security per person +
Crisis management and social in-
volvement Percent of population active in voluntary fire service +
Medical capacity Number of hospital beds per 10 000 inhabitants +
Table 9: TOP 10 and BOTTOM 10 administrative districts according to highest and lowest overall index for resilience
Top 10 Rank District Resilience index
1 Eichstätt 0.667
2 Straubing-Bogen 0.661
3 Regensburg 0.658
44 Deggendorf 0.646
5 Unterallgäu 0.644
6 Neuburg- Schrobenhausen
0.641
7 Donau-Ries 0.640
8 Ostallgäu 0.638
9 Aichach-Friedberg 0.637
10 Kelheim 0.635
Bottom 10 Rank District Resilience index
1 Duisburg 0.349
2 Düsseldorf 0.386
3 Leipzig 0.391
4 Cologne 0.399
5 Chemnitz 0.411
6 Zwickau 0.415
7 Krefeld 0.416
8 Ludwigslust 0.420
9 Magdeburg 0.421
10 Dresden 0.425
Figure 8: Overall index for resilience of the administrative districts along the rivers transporting floodwaters.

CEDIM Report on the 2013 June floods in Central Europe
17
Table 10: Districts according to max. repeat period in years along the rivers transporting floodwaters
District Intensity:
Tn = repeat period (years)
Kelheim
Tn > 100 y.
Eichstätt
Pfaffenhofen a. d. Ilm
Regensburg
Deggendorf
Straubing
Passau
Sächsische Schweiz -Osterzgebirge
Dresden
Meißen
Nordsachsen
Elbe-Elster
Wittenberg
Salzlandkreis
Leipzig
Dessau-Roßlau
Anhalt-Bitterfeld
Magdeburg
Jerichower Land
Mittelsachsen
Erzgebirgskreis
Zwickau
Chemnitz
Leipzig
Kempten (Allgäu)
Oberallgäu
50 <Tn < 100 y.
Unterallgäu
Dillingen a. d. Donau
Neu-Ulm
Biberach
Günzburg
Ulm
Alb-Donau-Kreis
Donau-Ries
Ostallgäu
Kaufbeuren 10 <Tn < 50 y.
Regensburg
Figure 9: Districts according to max. repeat period in years along the rivers transporting floodwaters in the period from 31 May to 07 Jun 2013

CEDIM Report on the 2013 June floods in Central Europe
18
3.3
For an initial, preliminary analysis on the impact of the floods, the administrative districts along the selected
river systems were compared and ordered according to the following types of impact:
Max. repeat period in years along the rivers transporting floodwaters in the period from 31 May to 07 Jun 2013
(Table 10 and Figure 9)
Number of persons affected by evacuations along the rivers transporting floodwaters in the period from 31
May to 07 Jun 2013 (Table 11 and Figure 10)
Traffic obstructions in the period from 31 May to 04 Jun 2013 on German federal and interstate highways
(Table 12 and Figure 11)
Subsequently, the information on the impact was combined with the indicators for resilience via the intersection of
various planes. To do so, the values for the intensity of the floods (according to repeat period), the number of
people affected by the floods and the extent of traffic disruptions was added to the potential for resilience, which
was determined via the resilience index (see section 3.2). In this manner, a map with a preliminary estimate of
possible flood consequences was created, whereby the flood intensity was weighted at 40 %, the number of
people affected by evacuations at 30 %, traffic disruptions at 20 % and weak resilience or the lack of resilience
was weighted at 10 % (Table 11 and Figure 12).
Economic damages and levee breaches could not yet be considered at the time of this preliminary analysis. In
addition, the flood situation had already developed past the data included in the analysis and will continue to do
so. The analysis is based on information compiled for the time period 31 May to 07 Jun 2013 (flood intensity, no.
of people affected by floods) and/or for the period 31 May 2013 to 04 Jun 2013 (traffic disruptions).
Table 11: Administrative districts according to number of people affected by evacuations along the rivers transporting floodwaters
Rank District Persons
1 Anhalt-Bitterfeld > 10 000
2 Sächsische Schweiz -Osterzgebirge
8670
3 Nordsachsen > 7000
4 Deggendorf > 6500
5 Leipzig > 6000
6 Elbe-Elster > 4000
7 Straubing-Bogen approx. 3000
8 Dresden 2600
9 Meißen 1542
10 Vogtlandkreis approx. 750
11 Dessau-Roßlau approx. 640
12 Salzlandkreis approx. 453
13 Magdeburg > 420
14 Mittelsachsen 396
15 Lüchow-Dannenberg approx. 280
16 Wittenberg approx. 110
17 Passau 60
18 Jerichower Land 46
19 Pfaffenhofen a.d. Ilm > 32
20 Erzgebirgskreis 23
21 Zwickau > 11
22 Kelheim 9
23 Sigmaringen > 7
Figure 10: Districts: Number of persons affected by evacuations along the rivers transporting floodwaters in the period from 31 May to 07 Jun 2013

CEDIM Report on the 2013 June floods in Central Europe
19
Table 12: Overall index for traffic obstructions per administrative district in the period from 31 May to 04 Jun 2013 on German federal and interstate highways.
Rank District Traffic obstructions —
Overall index
1 Erzgebirgskreis 1.0000
2 Rheingau-Taunus-Kreis 0.9000
3 Dresden 0.7000
4 Leipzig 0.7000
5 Mittelsachsen 0.7000
6 Ostallgäu 0.6000
7 Nordsachsen 0.5000
8 Karlsruhe 0.5000
9 Heidelberg 0.5000
10 Sächsische Schweiz -
Osterzgebirge 0.4000
11 Meißen 0.4000
12 Zwickau 0.4000
13 Bergstraße 0.4000
14 Anhalt-Bitterfeld 0.3000
15 Deggendorf 0.3000
16 Salzlandkreis 0.3000
17 Chemnitz 0.3000
18 Passau 0.3000
19 Alb-Donau-Kreis 0.3000
20 Sigmaringen 0.3000
Figure 11: Overall index for traffic obstructions per administrative district in the period from 31 May to 04 Jun 2013 on German federal and interstate highways.
Table 13: Preliminary impact of the flood according to max. repeat period in years along the rivers transporting floodwaters; number of persons involved in the evacuation measures; traffic obstructions on German federal and interstate highways and overall index for resilience per administrative district for the time period 31 May to 07 Jun 2013. Rank District Flood impact index
1 Anhalt-Bitterfeld 0.8913
2 Sächsische Schweiz -
Osterzgebirge
0.8451
3 Nordsachsen 0.7894
4 Dresden 0.7327
5 Erzgebirgskreis 0.7242
6 Leipzig 0.6878
7 Deggendorf 0.6276
8 Mittelsachsen 0.6253
9 Meißen 0.6008
10 Elbe-Elster 0.5982
Figure 12: Preliminary flood impact per administrative district for the time period 31 May to 07 Jun 2013

CEDIM Report on the 2013 June floods in Central Europe
20
3.4
From 31 May to 07 Jun 2013, 23 administrative districts were affected by floods with a repeat period of 100 years or
more. As the districts experienced comparable flood intensity, a relative comparison of the districts can be made for
the resilience index along the three dimensions — social, economic and institutional (see Figure 13).
Figure 13: Ranking of the administrative districts with repeat periods greater than Tn = 100 years according to indicators for social (top left), economic (top right), institutional (bottom left), resilience and overall resilience index (bottom right).
As soon as better information on the surface area affected by the floods is available, the elements listed may also be
considered and drawn on for normalization. In addition, the evacuation measures are also contingent on levee
breaches, which cannot yet be appropriately considered in the analyses at the present time. However, the resilience
index and the number of people affected by evacuations can be contrasted as a preliminary overview. (see Figure 14).
Even though the pattern is not entirely distinct, the districts with a higher resilience index seem to have required the
institution of less evacuation measures. As soon as more information on flooded areas and damages becomes availa-
ble, the spatial distribution of the resilience can be validated in accordance with the indicators. The consideration of
evacuation models (e.g. number of persons affected by evacuations, number of persons housed in emergency shel-
ters), degree of preparedness and effectiveness of crisis management during the 2013 floods can help with the evalu-
ation and understanding of the factors and trends of (flood) resilience in Germany through further research, and ulti-
mately help improve resilience.

CEDIM Report on the 2013 June floods in Central Europe
21
Figure 14: Comparison of persons in evacuation measures and resilience index for administrative districts with repeat periods of Tn > 100 years along the rivers transporting floodwaters.
4
Cutter, S.; Burton, C.; Emrich, C. (2010): Disaster resilience indicators for benchmarking baseline conditions. J Home-
land Security Emerg Manag 7(1). doi:10.2202/1547-7355.1732
Fekete, A. (2009): Validation of a social vulnerability index in context to river-floods in Germany. Nat Hazards and
Earth Syst Sci 9: 393 - 403
Hiete, M., et al. (2012): "Trapezoidal fuzzy DEMATEL method to analyze and correct for relations between variables in
a composite indicator for disaster resilience." OR spectrum 34.4 (2012): 971 - 995
ISDR (2002): Living with Risk: A global review of disaster reduction initiatives. Preliminary version, UN, Geneva.
The information provided on evacuations in chapter 5 are based on the following sources (mainly in German):
www.dresden.de
www.stadt-meissen.de
http://www.landkreis-nordsachsen.de/r-aktuell-a-3133.html
http://www.landratsamt-pirna.de
http://www.kreis-meissen.org
http://www.landkreis-wittenberg.de
http://www.wittenberg.de/
http://www.hochwasservorhersage.sachsen-anhalt.de
http://www.sachsen-anhalt.de
http://www.dessau.de/
http://www.magdeburg.de/Start/B%C3%BCrger-Stadt/Aktuelles-Publikationen/Pressemeldungen
http://www.anhalt-bitterfeld.de
http://www.bitterfeld-wolfen.de/
http://www.salzlandkreis.de
https://www.lkjl.de
CEDIM Report on the 2013 June floods in Central Europe
22
www.luechow-dannenberg.de/hochwasser
www.straubing.de/
http://www.landkreis-straubing-bogen.de/
http://www.landkreisleipzig.de
http://www.landkreis-zwickau.de
http://www.zwickau.de/de/aktuelles/pressemitteilungen/2013/06/s000.php
http://www.erzgebirgskreis.de
http://www.vogtland-anzeiger.de/Vogtland_Anzeiger/cms-nachrichten/vogtland/ticker-zum-hochwasser-im-
vogtland.html&html2pdf_sumbit=1
http://www.deggendorf.de/
http://www.landkreis-deggendorf.de/
www.br.de
http://www.abendzeitung-muenchen.de
http://www.pnp.de/hochwasser/
http://www.spiegel.de
This report as well as other reports and information on the 2013 June floods and updates can be accessed online at
www.cedim.de.
For a better understanding of technical terms, CEDIM has made available the glossary "Terms and definitions of risk
sciences" online at
www.cedim.de/download/glossar-gesamt-20050624.pdf.