![Phonetic features and phonological features, by Theo Vennemann and Peter Ladefoged [1973]](https://static.fdokumen.com/doc/165x107/631b5827a906b217b9066a9d/phonetic-features-and-phonological-features-by-theo-vennemann-and-peter-ladefoged.jpg)
Phonetic features and phonological features, by Theo Vennemann and Peter Ladefoged [1973]
Upload
independentCategory
view
4download
0
Interaction between the native and second languagephonetic subsystems
James E. Flege a,*, Carlo Schirru b, Ian R.A. MacKay c
a Division of Speech and Hearing Sciences, University of Alabama at Birmingham, CH20, Room 119, 1530 3rd Avenue,
South Birmingham, AL 35294-2042, USAb Department of Linguistics, University of Padua, 35137, Padua, Italy
c Department of Linguistics, University of Ottawa, 70 Laurier Avenue East, Ottawa, Ont., Canada KIN 6N5
Received 1 April 2001; received in revised form 2 January 2002; accepted 20 May 2002
Abstract
The underlying premise of this study was that the two phonetic subsystems of a bilingual interact. The study tested
the hypothesis that the vowels a bilingual produces in a second language (L2) may differ from vowels produced by
monolingual native speakers of the L2 as the result of either of two mechanisms: phonetic category assimilation or
phonetic category dissimilation. Earlier work revealed that native speakers of Italian identify English /ei/ tokens as
instances of the Italian /e/ category even though English /ei/ is produced with more tongue movement than Italian /e/ is.
Acoustic analyses in the present study examined /ei/s produced by four groups of Italian–English bilinguals who differed
according to their age of arrival in Canada from Italy (early versus late) and frequency of continued Italian use (low-L1-
use versus high-L1-use). Early bilinguals who seldom used Italian (Early-low) were found to produce English /ei/ with
significantly more movement than native English speakers. However, both groups of late bilinguals (Late-low, Late-
high) tended to produced /ei/ with lessmovement than NE speakers. The exaggerated movement in /ei/s produced by the
Early-low group participants was attributed to the dissimilation of a phonetic category they formed for English /ei/
from Italian /e/. The undershoot of movement in /ei/s produced by late bilinguals, on the other hand, was attributed to
their failure to establish a new category for English /ei/, which led to the merger of the phonetic properties of English /ei/
and Italian /e/.
� 2002 Elsevier Science B.V. All rights reserved.
Keywords: Bilingualism; Second language acquisition; Vowel production; Language interaction; Tongue movement; English; Italian
1. Introduction
Many studies have shown that the age of first
exposure to a second language (L2) exerts a strong
and usually persistent influence on overall success
in acquiring the L2. In some studies (including this
one) the age of first exposure to the L2 has been
indexed by immigrants’ age of arrival (AOA) in a
predominantly L2-speaking country. Research has
demonstrated better performance in the L2 by
individuals who arrived in childhood (‘‘early’’
bilinguals) than by individuals who arrived in late
adolescence or early adulthood (‘‘late’’ bilinguals).
Age effects have been observed for the productionof L2 consonants (e.g. Flege et al., 1995b; MacKay
et al., 2001) and the perception of L2 consonants
*Corresponding author.
E-mail address: [email protected] (J.E. Flege).
0167-6393/02/$ - see front matter � 2002 Elsevier Science B.V. All rights reserved.doi:10.1016/S0167-6393(02)00128-0
Speech Communication 40 (2003) 467–491www.elsevier.com/locate/specom

(Yamada, 1995; MacKay et al., 2001). Age effects
have also been observed for the production of L2
vowels (Flege, 1992; Munro et al., 1996; Flege
et al., 1999a; Piske et al., 2002), L2 vowel percep-tion (Flege et al., 1999a), overall degree of foreign
accent in L2 sentences (Flege et al., 1995a; Yeni-
Komshian et al., 2000; Piske et al., 2001) and the
recognition of L2 words presented in noise (Mayo
et al., 1997; Meador et al., 2000).
The literature has offered three general types of
explanation for age effects on L2 speech perfor-
mance. One explanation is that as the age of firstexposure to the L2 increases, the mechanisms used
in L1 speech acquisition operate less effectively due
to maturational constraints. For example, some
researchers attribute the widespread presence of
foreign accent in late bilinguals to the passing of a
critical period for speech acquisition (Scovel, 1988;
Patkowski, 1989; Mack, In press). 1
A second type of explanation offered for ageeffects is that late bilinguals receive less adequate
L2 phonetic input than early bilinguals usually do.
Grosjean (1982) observed that the contexts in
which languages are learned and used influence a
bilingual’s performance in both the L1 and the L2.
He observed that the L2 may become a bilingual’s
dominant language if it is used more than the L1
and is needed for a wider range of everyday activ-ities, and that the dominant language is likely to
develop to a greater extent than the non-dominant
language does. Work by Jia and Aaronson (1999)
provided cross-sectional and longitudinal evidence
suggesting that child immigrants to the United
States from China received more L2 input from
native English speakers than adolescent immi-
grants did, and so were more likely to becomeEnglish-dominant (see also Grenier, 1984). An ex-
amination of United States census data suggested
to Stevens (1999) that age effects on immigrants’
learning of English as an L2 in the United States
might be attributed to ‘‘social and demographicconsiderations’’. For example, child immigrants
are usually enrolled in a school where they interact
frequently with native speakers of English, whereas
adult immigrants often enter the workplace where
they interact frequently with fellow native speakers
of their L1. Early bilinguals are also more likely to
marry L2 native speakers than late bilinguals are.
Economic and social factors may well be linked toor even cause variation in motivation to learn the
L2 well (Gardner and Lambert, 1972).
Speech research has suggested that the accuracy
with which L2 phonetic segments are produced
depends on how much native-speaker input as
opposed to foreign-accented L2 input is received
(compare Flege and Eefting, 1987, to Flege, 1991).
For example, Flege and Liu (2001) examined theidentification of word-final English consonants by
groups of Chinese speakers who had lived in the
United States for averages of 2 and 7 years. Half of
the participants in the 2-year and 7-year residence
groups were enrolled as full-time students at an
American university, whereas the other half had
occupations (e.g. laboratory technician) that were
likely to reduce the frequency of interactions withnative English (NE) speakers. The long-residence
students obtained significantly higher identifica-
tion scores than the short-residence students did,
but there was no difference between two groups of
non-students who differed in length of residence.
The students and non-students did not differ in
terms of self-reported percentage use of English
(roughly 50% for both groups). This led to the in-ference that what differentiated the long-residence
students and non-students was not how frequently
they used English, but with whom.
A third type of explanation for age effects is
language interaction. Were completely native-like
performance in an L2 to be observed, it would
imply that bilinguals can prevent their L1 and L2
sub-systems from influencing one another. How-ever, most theorists have rejected the notion that
the L1 and L2 phonetic subsystems of a bilingual
can be separated completely (e.g. Lambert and
Rawlings, 1969; Paradis, 1978; Grosjean, 1989,
1 One might hypothesize that perceptual differences between
L2 learners and monolingual native speakers of the L2 is due to
the loss of ability to re-weight the features used in decoding
phonetic segments following perceptual attunement to the L1
phonetic system (see Sebasti�aan-Gall�ees and Soto-Faraco, 1999,p. 112). Or, one might hypothesize that as the L2 phonetic
system develops, cross-language phonetic differences that are
detectable auditorily in some task conditions tend to be filtered
out by a kind of cross-language ‘‘categorical perception’’ (see
Hall�ee et al., 1999, p. 302).
468 J.E. Flege et al. / Speech Communication 40 (2003) 467–491

1997, 1999). The speech learning model, or SLM
(Flege, 1995, 1999, 2002) posits that the phonic
elements making up the L1 and L2 phonetic sub-
systems of a bilingual exist in a ‘‘common pho-nological space’’, and so will necessarily influence
one another (see also Mack, 1989).
The aim of this study was to investigate the third
explanation for age effects on L2 speech acquisi-
tion, viz. language interaction. It did so by testing
predictions generated by a language interaction
model, the SLM, regarding the production of En-
glish vowels. The participants examined in thisstudy were native speakers of Italian who learned
English when they emigrated from Italy to Canada.
The Italian–English bilinguals were assigned to one
of four groups based on an orthogonal variation in
AOA and self-reported percentage L1 (Italian) use.
Previous research led to the expectation that the
early bilinguals would produce English vowels
more accurately than the late bilinguals would.Previous research also suggested that the bilinguals
who used Italian seldom would produce English
vowels more accurately than those who continued
to use Italian relatively often (Flege et al., 1997;
Guion et al., 2000; Meador et al., 2000; MacKay
et al., 2001; Piske et al., 2001, 2002).
The SLM proposes that the capacity for speech
learning remains intact across the life span. Ac-cording to the SLM, age effects arise primarily
from age-related changes in how the L1 and L2
phonetic subsystems interact. The phonetic cate-
gories used to produce and perceive the phonetic
segments distinguishing L1 words are hypothe-
sized to become more powerful attractors of L2
vowels and consonants as they develop through
childhood and into adulthood (e.g. Parnell andAmerman, 1978; Lee et al., 1999; Hazan and
Barrett, 1999; Walley and Flege, 2000; Johnson,
2000). That is, as L1 vowels and consonants de-
velop, they will perceptually assimilate neighbor-
ing L2 vowels and consonants more strongly (see
Baker et al., 2002). This leads to the prediction
that, all else being equal, early bilinguals will be
more likely to establish new phonetic categoriesfor L2 speech sounds than late bilinguals will be.
Of course, some L2 speech sounds are too similar
to L1 speech sounds for new category formation to
occur. Another hypothesis of the SLM is that the
likelihood of a category being formed for an L2
speech sound varies inversely as a function of its
degree of perceived dissimilarity from the closest
L1 speech sound.According to the SLM, L1 and L2 speech
sounds interact through two distinct mechanisms.
The first mechanism, ‘‘category assimilation’’, is
thought to operate when a new category fails to be
established an L2 speech sound despite audible
differences between it and the closest L1 speech
sound. By hypothesis, category formation will be
blocked if instances of an L2 speech categorycontinue to be identified as instances of an L1
category. The SLM predicts that in such cases, a
‘‘merged’’ category will develop over time that
subsumes the phonetic properties of the percep-
tually linked L1 and L2 speech sounds. Consider,
for example, a native speaker of a language in
which /t/ is implemented as a short-lag stop having
an average voice onset time (VOT) value of about20 ms (e.g. French or Spanish). Such a person who
later learns an L2 in which /t/ is implemented as a
long-lag stop having an average VOT value of
about 80 ms (e.g. English) might develop a merged
L1–L2 /t/ category that specifies an intermediate
VOT value. 2 By hypothesis, the properties speci-
fied by a merged L1–L2 category can be modeled
as a probability–density function (see, e.g. Klu-ender et al., 1998) reflecting all tokens of the per-
ceptually linked L1 and L2 sounds that have been
experienced (with recent tokens perhaps being
given greater weight than tokens encountered in
the distant past; see Sancier and Fowler, 1997). L2
learners often begin by producing L2 words using
unmodified L1 phonetic segments, but they typi-
cally approximate L2 phonetic norms for certainL2 phonetic segments more closely over time as
they gain experience in the L2 (e.g., Flege and
Port, 1981). Given that a single, merged L1–L2
category is used to produce corresponding speech
sounds in the L1 and L2 in the absence of category
formation, the SLM predicts that the more a
2 This example greatly oversimplifies the complexity of
phonetic category representations, for phonetic categories
specify an array of co-varying, contextually sensitive properties
that differ in perceptual weight and auditory salience.
J.E. Flege et al. / Speech Communication 40 (2003) 467–491 469

bilingual approximates the phonetic norm for an
L2 speech sound, the more her production of the
corresponding L1 speech sound will tend to di-
verge from L1 phonetic norms.Flege (1987) observed the operation of phonetic
category assimilation in a study examining the
production of /t/ in French and English words by
late English–French and French–English biling-
uals. English /t/ is produced with longer VOT val-
ues than French /t/ is. The /t/s produced by the
bilinguals in both of their languages tended to have
VOT values that were intermediate in value to thevalues observed in stops produced by French and
English monolinguals. This suggested that the bil-
inguals’ L1 /t/ had influenced their productions of
/t/ in the L2, and vice versa. MacKay et al. (2001)
examined the production and perception of voiced
stops by Italian–English bilinguals. Italian /b d g/
are produced with lead VOT values (i.e. pre-voic-
ing) whereas English /b d g/ are typically producedwith short-lag VOT values. The bilinguals tended
to misidentify short-lag tokens of English /b d g/
as /p t k/. They tended to produce English voiced
stops with pre-voicing more often than NE
speakers did, but to pre-voice Italian voiced stops
less often than Italian monolinguals did. 3 Impor-
tantly, production in the two languages was cor-
related: The less the bilinguals pre-voiced inEnglish (and so approximated L2 phonetic norms),
the less they tended to do so in Italian (and thus to
diverge from L1 phonetic norms).
The second mechanism through which L1 and
L2 phonetic segments are hypothesized to interact
is called ‘‘phonetic category dissimilation’’. This
mechanism is thought to operate when a new cat-
egory has been established for an L2 speech sound.
It will cause a newly established L2 category and
the nearest L1 speech category to shift away from
one another in phonetic space. The SLM posits
that category dissimilation occurs because biling-uals strive to maintain phonetic contrast between
all of the elements in their combined L1þ L2phonetic space in the same way that monolinguals
(or human languages, see Lindblom, 1998) strive
to maintain phonetic contrast among the elements
making up their (L1-only) phonetic space.
Mack (1990) obtained evidence for the opera-
tion of category dissimilation in a case study ex-amining a bilingual child. Flege and Eefting (1987)
obtained evidence of category dissimilation in a
study examining VOT in the production of Span-
ish /p t k/. Both of two groups of early Spanish–
English monolinguals produced significantly
longer VOT values in English than Spanish /p t k/;
and both groups produced Spanish /p t k/ with
shorter VOT values than did age-matched groupsof Spanish monolinguals. This suggested that the
early bilinguals’ Spanish /p t k/ categories dissim-
ilated from categories they established somewhat
later in life for English /p t k/. A later study (Flege
and Eefting, 1988) provided independent evidence
that the bilinguals had established new phonetic
categories for English /t/. 4
However, two other studies did not show ashortening of VOT values in the L1 /p t k/ after
English was learned as an L2. Mack et al. (1995)
observed no difference in the VOT values pro-
duced in French /p t k/ by monolingual French
children and French–English bilingual children
living in France. This finding does not provide
counter-evidence to the hypothesized role of pho-
netic category dissimilation because the bilingualchildren seemed to have lacked the phonetic input
3 The finding obtained in a recent perceptual experiment also
suggested the operation of category assimilation. One might
expect late Italian–English bilinguals to discriminate Italian
vowels better than early Italian–English bilinguals because their
Italian vowel system was better established when they began
learning English and because they typically use Italian more
than early bilinguals do. However, Flege et al. (1999a) observed
a poorer discrimination of Italian vowels by late than early
bilinguals, suggesting that the late bilinguals’ Italian vowels had
changed as the result of category assimilation in the absence of
category formation for English vowels.
4 Participants in the Flege and Eefting (1988) study rapidly
imitated the randomly presented members of a VOT continuum
that ranged from a pre-voiced /d2/ to a long-lag/t2/. Englishmonolinguals produced stops having the predominantly short-
lag and long-lag VOT values typical for English /d/ and /t/.
Spanish monolinguals produced stops having the pre-voiced and
short-lag VOT values that are typical for Spanish /d/ and /t/. The
early bilinguals, on the other hand, produced stops having pre-
voiced, short-lag, and long-lag VOT values when imitating the
same set of synthetic stimuli.
470 J.E. Flege et al. / Speech Communication 40 (2003) 467–491

needed to establish long-lag VOT categories for
English /p t k/. 5 However, counter-evidence was
obtained by Flege (1991), who observed no
shortening of VOT in Spanish /p t k/ by earlySpanish–English bilinguals. Differences in the na-
ture of the L2 /p t k/ categories that were formed
may explain why VOT shortened in the production
of Spanish /p t k/ by early Spanish–English bil-
inguals in the Flege and Eefting (1987) study but
not those in the Flege (1991) study. Participants in
the Flege and Eefting (1987) study were exposed
primarily to Spanish-accented English and pro-duced English /p t k/ with shorter VOT values than
NE speakers did, whereas participants in the Flege
(1991) study were exposed primarily to native-
produced English and produced English /p t k/
with native-like VOT values. If this explanation is
correct, it means that category dissimilation will
occur only if a new L2 category is relatively close
in phonetic space to a pre-existing L1 category.Another study failed to provide evidence of
phonetic category dissimilation in the production of
vowels. English /u/ is anterior in the vowel space
with respect to French /u/; that is, it is a ‘‘fronted’’
vowel produced with higher F2 values than French
/u/ is. Flege (1987) examined the production of
English /u/ and French /u/ by groups of monoling-
uals and bilinguals. The F2 values in French /u/would not be expected to change as the result of
phonetic category dissimilation because French /u/
is maximally posterior due to physiological limita-
tions. English /u/ might be produced with even
higher F2 values than is typical for English due to
dissimilation. However, the English–French biling-
uals’ English /u/s had only slightly higher F2 values
than vowels spoken by English monolinguals. Thismight mean that phonetic category assimilation
does not influence the production of L1 vowels, as
predicted by the SLM. However, the mechanism
might not have operated due to the absence of
phonetic category formation for French /u/. All 18participants produced French /u/ with English-like
F2 values that were too high for French.
The present study evaluated the production of
English /ei/ to determine if its production would
manifest the predicted effect of phonetic category
dissimilation. Several factors led to the selection of
this vowel for analysis. As reported below, English
/ei/ is produced with far more formant movementthan Italian /e/ is. 6 Recent research with Italian
adults whowere inexperienced in English (Flege and
MacKay, Submitted) revealed that /ei/ tokens were
perceptually assimilated by Italian /e/, but were
nevertheless judged to differ more from Italian /e/
than English /u/ tokens were judged to differ from
Italian /u/. 7 Finally, Flege et al. (1999a) noted that
just one of four groups of Italian–English bilingualsexamined––early bilinguals who seldom used Ital-
ian––were able to discriminate /ei/ and /e/ tokens at a
significantly above-chance rate. This was inter-
preted to mean that an early exposure to English
5 The children’s primary source of English input was their
American or British mothers, who had lived in France for 9–14
years. The results of Flege (1987) suggest that the mothers may
have produced English /p t k/ with VOT values that were
intermediate to the short-lag and long-lag VOT values typical
for French and English, respectively. Perhaps because of this,
four of the seven children produced English /p t k/ with VOT
values that were much closer (range: 27–37 ms) to the mean
value observed for French monolinguals (26 ms) than to the
mean value observed for English monolinguals (78 ms).
6 The English vowel in ‘‘code’’ (symbolized here as /o/) is
probably also produced with more formant movement than its
Italian counterpart (/o/), but there is evidence that English /ei/ is
produced with more movement than English /o/ is (Flege, 1989;
see also Flege et al., 1986, Figs. 5 and 7). This suggests that
English /ei/ may differ more from Italian /e/ than English /o/
differs from Italian /o/. If so, then category formation should be
more likely for English /ei/ than /o/ according to the SLM.7 Eleven Italian university students who had lived in Ottawa
for just three months classified multiple natural tokens of the
Canadian English vowels /i II e ei æ Z d u o/ in terms of one ofthe seven vowels of standard Italian (/i e e a co u/). Thestudents also rated each vowel token for goodness (1 ¼ verydifferent, 5 ¼ very similar) as an instance of the Italian vowelused to classify it. The modal classifications of the English
vowels /i/, /ei/, /Z/, /o/ and /u/ were unsurprising: Italian /i/, /e/,/a/, /o/ and /u/, respectively. However, the goodness of fit ratings
suggested that some of the English vowels differed to a greater
extent from the closest Italian vowel than others did. For
example, the English /ei/ tokens received a lower rating (mean
3.3) than the English /u/ tokens did (mean 4.2) but a higher
rating than the /d/ tokens did (mean 1.7). The Italian studentsmay have given lower goodness ratings to the English /ei/
tokens than to the English /u/ tokens because of /ei/’s lower
position in vowel space than Italian /e/ or to the greater formant
movement in English /ei/ than in Italian /e/.
J.E. Flege et al. / Speech Communication 40 (2003) 467–491 471

and a relatively infrequent use of the L1 promoted
phonetic category formation for English /ei/.
These findings, when taken together with the
hypotheses of the SLM, led to the two predictionstested in the present study. Bilinguals who continue
to judge /ei/ tokens to be instances of Italian
/e/––which is more likely to hold true for late than
early bilinguals––will fail to establish a category for
English /ei/. Such bilinguals should produce /ei/ with
less movement than NE monolinguals, but with
more movement than is typical for Italian /e/ as the
result of category assimilation. Bilinguals whomanage to establish a new category for English
/ei/––which should occur most often for early bil-
inguals who seldom use Italian––should produce /ei/
with even more movement than NE monolinguals
do as the result of phonetic category dissimilation.
These predictions were tested through acoustic
analysis of formant movement patterns in English
/ei/. The study was organized as follows. Section 2describes the procedures used to select participants
and elicit their production of consonant–vowel–
consonant (CVC) English words. Section 3 pre-
sents the results of analyses examining listeners’
judgments of the English vowels produced by the
four groups of Italian–English bilinguals and by
the participants in a NE control group. Section 4
presents the results of acoustic analyses that fo-cused on the production of /ei/.
2. Method
2.1. Participants
The mean characteristics of the five groups of
participants are presented in Table 1. All 90 of theparticipants were either members of a predomi-
nantly Italian Roman Catholic parish in Ottawa
where the testing took place or were socially con-
nected to it in some way. 8 The participants in four
groups were Italian–English bilinguals. To be in-
cluded, bilingual participants were required to
have been born in Italy and to have arrived in
Canada between the ages of 2 and 30 years. They
were also required to indicate either a relativelyfrequent or a relatively infrequent use of Italian
during a telephone pre-screening. The bilinguals
all lived in English-speaking neighborhoods lo-
cated Ottawa, Ontario at the time of testing. As
part of a language background questionnaire ad-
ministered before testing, the bilinguals were asked
to estimate their percentage use of Italian in the
preceding five years, five months, and five weeks.The three estimates were strongly correlated, and
so were averaged. The bilinguals’ mean estimates
of percentage Italian use, which are shown in
Table 1, appear to have been valid and reliable. 9
The bilinguals were assigned to four groups of
18 each based on an orthogonal variation in AOA
and percentage Italian use. The 36 bilinguals who
arrived in Canada between the ages of 2 and 13years have been designated ‘‘early’’ bilinguals. 10
The 36 native Italian speakers who arrived in
Canada between the ages of 15 and 26 years have
been designated ‘‘late’’ bilinguals. Subgroups of
early and late bilinguals differed according to self-
reported percentage Italian use. The individuals
8 Many of the participants lived in the vicinity of the Roman
Catholic parish where the tests were administered when they
first arrived from Italy in the 1950s and 1960s. However, most
of the participants subsequently moved to outlying English-
speaking suburbs.
9 As part of the language background questionnaire, each
bilingual was asked to name the persons with whom they
‘‘typically’’ or ‘‘sometimes’’ spoke Italian. The high-L1-use
bilinguals named significantly more persons than the low-L1-
use bilinguals did, F ð1; 68Þ ¼ 34:1, p < 0:01. However, the
number of persons named by the two groups of early bilinguals
and by the two groups of late bilinguals did not differ
significantly, F ð1; 68Þ ¼ 0:3, p > 0:10, nor did the AOA� L1use interaction reach significance in the analysis of the number
of named interlocutors, F ð1; 68Þ ¼ 0:27, p > 0:10. The biling-
uals were asked how much they used Italian at home, at work,
at social events, while shopping, while speaking on the
telephone, with friends, and with family members. The high-
L1-use bilinguals reported a higher percentage use of Italian
than the low-L1-use bilinguals did in each context, whereas
there was little difference between the early and late bilinguals.
When an average was computed for the contextualized L1 use
estimates, these estimates were strongly correlated with the
average Italian percentage use estimates in Table 1,
F ð1; 70Þ ¼ 0:91, p < 0:01.10 The terms ‘‘early’’ and ‘‘late’’ bilinguals are used here for
convenience, and should not be taken as an implicit claim
regarding the state of neurological development associated with
a particular chronological age.
472 J.E. Flege et al. / Speech Communication 40 (2003) 467–491

who reported using Italian between 1% and 13% ofthe time were designated the ‘‘low-L1-use’’ bi-
linguals; those who reported using Italian between
25% and 85% of the time were designated the
‘‘high-L1-use’’ bilinguals. The four groups formed
in this way were named ‘‘Early-low’’ (early bi-
linguals who seldom used Italian), ‘‘Early-high’’
(early bilinguals who used Italian often), ‘‘Late-
low’’ (late bilinguals who seldom used Italian), and‘‘Late-high’’ (late bilinguals who used Italian of-
ten). The bilinguals were born in one of 13 Italian
regions (Abruzzo-24, Calabria-12, Sicilia-8, Ve-
neto-7, Campania-6, Basilicata-4, Lazio-3, Friuli-
2, Puglia-2, Lombardia-1, Marche-1, Piemonte-1,
Toscana-1). Place of birth did not vary systemat-
ically across the four bilingual groups.
The mean age of the bilinguals, 49 years, wascomparable to that of the participants in the NE
control group. This group consisted of 18 native
speakers of English who were born and raised in
the Ottawa, Ontario region. The NE speakers were
‘‘monolingual’’ in the sense that they did not use
any language other than English in their daily lives
(Grosjean, 1982). They all had some knowledge of
French because this language is usually studied byCanadian anglophones at school; however, none
of them reported speaking French well or using it
often. None of the 90 participants reported a his-
tory of auditory disorder, and all passed a pure-tone hearing screening at octave frequencies be-
tween 500 and 4000 Hz (re: 35 dB HL) prior to
participating.
Characteristics of the four groups of bilinguals
(Table 1) were assessed in a series of AOA (early,
late)�L1 use (low-L1-use, high-L1-use) ANO-VAs. As intended, the high-L1-use bilinguals re-
ported a higher percentage use of Italian than thelow-L1-use bilinguals did, F ð1; 68Þ ¼ 267:7, p <0:01. The late bilinguals reported using Italianmore than the early bilinguals did, F ð1; 68Þ ¼ 7:3,p < 0:01. However, as intended by the design, theAOA and L1 use factors did not interact signifi-
cantly in the analysis of self-reported percentage
Italian use, F ð1; 68Þ ¼ 2:45, p > 0:10. The earlybilinguals arrived in Canada at significantly earlierages than the late bilinguals had, F ð1; 68Þ ¼ 227:3,p < 0:01. However, the low-L1-use and high-L1-use bilinguals’ AOAs did not differ significantly,
F ð1; 68Þ ¼ 0:7, p > 0:10. As intended by the de-sign, the interaction between AOA and L1 use was
non-significant in the analysis of the AOA values,
F ð1; 68Þ ¼ 0:9, p > 0:10.Nearly all of the bilinguals were highly experi-
enced in English. All but two had lived in Canada
for more than 10 years; and all but three had lived
there for at least 20 years. The bilinguals’ length of
Table 1
Characteristics (means, SDs, ranges) of the five groups of participants
Gender Age AOA %Use LOR NII EDUC
Native English 9 m 50(4) – – – – –
9 f 39–57
Early-low 8 m 50(4) 7(3) 7%(4) 42(4) 2.8(1.4) 14(3)
10 f 42–58 2–13 1–13 36–50 1–7 10–18
Early-high 8 m 49(6) 8(4) 43%(15) 40(4) 5.0(1.7) 11(6)
10 f 35–61 2–13 25–80 33–49 2–10 2–24
Late-low 10 m 51(7) 20(3) 10%(5) 31(8) 2.6(1.0) 2(2)
8 f 29–62 15–25 2–15 4–42 0–5 0–6
Late-high 8 m 49(8) 20(3) 53%(13) 29(9) 4.4(1.6) 2(2)
10 f 29–57 15–26 30–75 8–39 2–7 0–8
M 49(6) 14(7) 28%(23) 36(9) 3.7(1.8) 7(6)
Note: Age, chronological age, in years; AOA, age of arrival in Canada, in years; %Use, self-reported percentage use of Italian; LOR,
length of residence in Canada, in years; NII, number of interlocutors with whom Italian was used; EDUC, years of education in
Canada, in years.
J.E. Flege et al. / Speech Communication 40 (2003) 467–491 473

residence (LOR) in Canada was confounded with
AOA because the four groups of bilinguals were
matched for chronological age. An ANOVA re-
vealed that the early bilinguals had lived in Canadalonger than the late bilinguals had, F ð1; 68Þ ¼ 47:5,p < 0:01. Importantly, however, the low-L1-useand high-L1-use bilinguals’ LORs did not differ
significantly, F ð1; 68Þ ¼ 1:4, p > 0:10, and AOAdid not interact with L1 use in the analysis of the
LOR values, F ð1; 68Þ ¼ 0:0, p > 0:10.All of the early bilinguals were enrolled in En-
glish-speaking schools in Canada when they firstarrived in Canada. They remained in school at least
through the end of high school. However, most of
the late bilinguals entered the work force or worked
in the home upon arriving in Canada. Fifteen of the
36 late bilinguals never attended school in Canada.
Not surprisingly, the early bilinguals had received
significantly more education in Canada than the
late bilinguals had, F ð1; 68Þ ¼ 168:9, p < 0:01.However, the low-L1-use and high-L1-use biling-
uals did not differ significantly in years of Canadian
education, F ð1; 68Þ ¼ 2:2, p > 0:10, nor did AOAand L1 use interact significantly in the analysis of
years of Canadian education, F ð1; 68Þ ¼ 1:78,p > 0:10.
2.2. Procedures
The participants were tested by a NE-speaking
experimenter in a small, quiet room following theadministration of a pure-tone hearing screening
and a language background questionnaire. The
vowel production experiment reported here was
administered following a sentence repetition task
(all 90 participants) and a sentence translation task
(just the bilinguals).
The participants produced /CVd/ words con-
taining the vowels /Z d ei o u e II æ i/ (see Table2). The words were elicited using a delayed repe-
tition task to avoid the influence of orthography
(see, e.g. Piske et al., 2002) and to reduce variation
in speaking rate, which is known to influence de-
gree of formant movement in /ei/ (Gay, 1968,
Table 2). The participants repeated the /CVd/ words
after hearing them via a loudspeaker. The stimulus
words to be repeated were spoken by one male andone female native speaker of English from Ottawa,
then digitized (at 22.05 kHz with 16-bit resolution)
and normalized for peak intensity. The stimulus
words produced by the female talker were pre-
sented for repetition following the male talker’s
stimuli. Only words repeated in response to the
female talker’s stimuli were analyzed, however.
The words were elicited in two conditions. Inthe ‘‘1-word’’ condition, the stimulus words were
presented one at a time at the beginning of a
carrier phrase (‘‘. . . is the next word to say’’). Toreduce the likelihood of direct imitation, the
participants were required to listen to the entire
utterance before repeating the variable utterance-
initial stimulus. The likelihood of direct imitation
was further reduced in the ‘‘3-word’’ condition,where the stimuli from the 1-word condition were
presented as the middle word of 3-word sequences
placed at the beginning of a carrier phrase (‘‘. . . arethe next words to say’’). The participants repeated
all three words in the sequence after listening to
the entire utterance, but just the middle word was
subsequently analyzed.
3. Listener judgments
The words elicited as just described were later
digitized and presented to NE-speaking listeners.
The dependent variable examined in the non-
parametric statistical analyses presented in Section3.2 was the number of listeners who judged each
Table 2
The stimuli used to elicit vowel production in two conditions
Vowel Elicitation condition
1-Word 3-Word
/Z/ cod bad cod heard
/d/ heard cud heard bade
/ei/ bade heed bade hid
/o/ code heard code bad
/u/ booed bade booed cod
/ / could hid could bed
/e/ bed bad bed hid
/II/ hid cod hid bad
/æ/ bad heard bad bade
/ / cud bade cud heard
/i/ heed code heed booed
Note: Only the italicized words were analyzed. Filler material at
the beginning and end of the lists is not shown.
474 J.E. Flege et al. / Speech Communication 40 (2003) 467–491

token as having been produced accurately, as op-
erationally defined below. In Section 3.3, a single
NE-speaking phonetician transcribed subsets of
tokens which, according to the listener data inSection 3.2, had been produced accurately or in-
accurately. The aim of the transcriptional analysis
was to provide insight into why the listeners tended
to judge certain tokens as being a distorted instance
of the intended category or an instance of some
other, non-target vowel. Finally, the regression
analyses presented in Section 3.4 examined the
predictive power of the two variables that had beenused to select the bilingual participants (AOA,
percentage Italian use) on NE-speaking listeners’
judgments of vowels the bilinguals had produced in
two elicitation conditions.
3.1. Method
The participants� repetitions of 1980 /CVd/words (5 groups� 18 participants� 11 vowels� 2elicitation conditions) were digitized at 22.05 kHz
(16-bit resolution) using a waveform editor (CoolEdit, Syntrillium Corp.), then normalized to 50%
of full-scale intensity. Prior to analysis, any pre-
voicing that was present in word-initial /b/ tokens
(in ‘‘bad, bed, bade, booed’’) was edited out. This
was done to remove an unwanted disparity be-
tween the late bilinguals, who tended to pre-voice
often, and the NE speakers, who seldom pre-
voiced (see MacKay et al., 2001). Similarly, theinitial /h/ in three other words (‘‘heed, heard, hid’’)
was edited out because a few bilinguals omitted
this consonant due to its absence in Italian. Finally,
all portions of the words following constriction of
the final /d/ tokens were removed to prevent pos-
sible between-group differences in the final stops
from affecting the listeners� vowel judgments.Vowels in the digitized words were evaluated
auditorily by NE adults (six male, five female). It
would have been ideal to recruit a panel of NE-
speaking listeners who were matched in age, social
class and education to the 90 participants who
produced the vowels being evaluated, and who had
spent their entire lives in the same communities in
Ontario where the 90 participants had lived and
were currently residing. This was not possible,however. The 11 listeners who participated were
monolingual (as defined above) speakers of Ca-
nadian English with a mean age of 31 years (range:
20–46 years). The listeners had an average of 5
years of post-secondary education (range: 1–8years). They were all born and raised in Ontario
(Toronto-6, Ottawa-1, Hamilton-1, Fort Francis-
1, Deep River-1, Brantford-1). All of them re-
ported normal hearing and passed a pure-tone
hearing screening prior to participating.
The digitized words were presented via loud-
speakers at a self-selected comfortable level to the
listeners, who were tested individually in a soundbooth. The 180 words containing each target vowel
(90 participants� 2 conditions) were randomlypresented in separate counterbalanced blocks to
each listener. The stimuli comprising each block
were presented one time each in a different ran-
domized order to each listener. Ten practice stimuli
at the beginning of each block were not analyzed.
The listeners judged the vowel in each word byclicking one of four buttons displayed from left to
right on the screen of a personal computer. The
buttonswere labeled ‘‘wrong vowel’’ (1), ‘‘distorted’’
(2), ‘‘acceptable’’ (3), ‘‘good’’ (4). The listeners were
not trained on the rating task. However, the target
vowel to be judged in each block was illustrated
by three written keywords (e.g. ‘‘bad’’, ‘‘dad’’ and
‘‘sad’’ for /æ/) before the block began. The listenerswere told to say the keywords aloud, and to use
their own pronunciation of the keywords as a point
of reference when rating the intended productions
of each vowel category. They were told to focus
their attention on the vowel in each stimulus, and
to ignore variation in voice quality or subjective
loudness insofar as possible. The interval between
each response and the next trial was 1.0 s.
3.2. Between-group differences
The dependent variable examined in non-para-
metric analyses was the number of listeners who
judged each vowel token to have been produced
accurately. A vowel token was operationally de-
fined as ‘‘accurate’’ if it was judged to be an ‘‘ac-
ceptable’’ or ‘‘good’’ instance of its intended
category (i.e. received a rating of 3 or 4).
The average numbers of listeners who judgedvowels elicited in the 1-word condition to have
J.E. Flege et al. / Speech Communication 40 (2003) 467–491 475
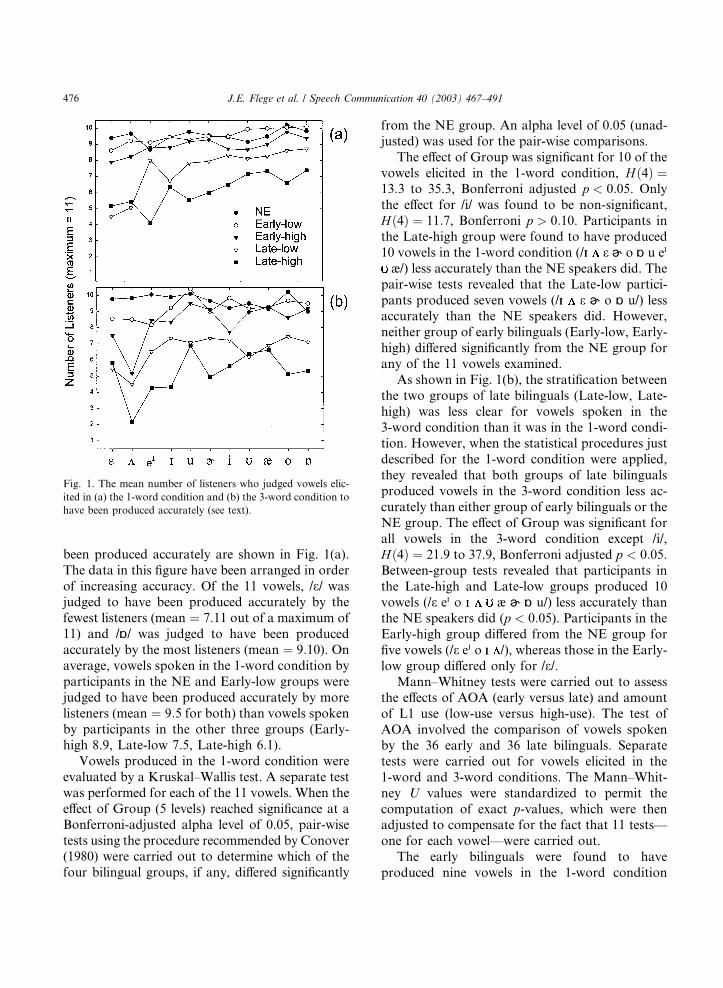
been produced accurately are shown in Fig. 1(a).
The data in this figure have been arranged in order
of increasing accuracy. Of the 11 vowels, /e/ wasjudged to have been produced accurately by the
fewest listeners (mean ¼ 7:11 out of a maximum of11) and /Z/ was judged to have been producedaccurately by the most listeners (mean ¼ 9:10). Onaverage, vowels spoken in the 1-word condition by
participants in the NE and Early-low groups were
judged to have been produced accurately by more
listeners (mean ¼ 9:5 for both) than vowels spokenby participants in the other three groups (Early-
high 8.9, Late-low 7.5, Late-high 6.1).
Vowels produced in the 1-word condition were
evaluated by a Kruskal–Wallis test. A separate test
was performed for each of the 11 vowels. When the
effect of Group (5 levels) reached significance at a
Bonferroni-adjusted alpha level of 0.05, pair-wise
tests using the procedure recommended by Conover(1980) were carried out to determine which of the
four bilingual groups, if any, differed significantly
from the NE group. An alpha level of 0.05 (unad-
justed) was used for the pair-wise comparisons.
The effect of Group was significant for 10 of the
vowels elicited in the 1-word condition, Hð4Þ ¼13:3 to 35.3, Bonferroni adjusted p < 0:05. Onlythe effect for /i/ was found to be non-significant,
Hð4Þ ¼ 11:7, Bonferroni p > 0:10. Participants inthe Late-high group were found to have produced
10 vowels in the 1-word condition (/II e d o Z u ei
æ/) less accurately than the NE speakers did. The
pair-wise tests revealed that the Late-low partici-
pants produced seven vowels (/II e d o Z u/) lessaccurately than the NE speakers did. However,
neither group of early bilinguals (Early-low, Early-
high) differed significantly from the NE group for
any of the 11 vowels examined.
As shown in Fig. 1(b), the stratification between
the two groups of late bilinguals (Late-low, Late-
high) was less clear for vowels spoken in the
3-word condition than it was in the 1-word condi-tion. However, when the statistical procedures just
described for the 1-word condition were applied,
they revealed that both groups of late bilinguals
produced vowels in the 3-word condition less ac-
curately than either group of early bilinguals or the
NE group. The effect of Group was significant for
all vowels in the 3-word condition except /i/,
Hð4Þ ¼ 21:9 to 37.9, Bonferroni adjusted p < 0:05.Between-group tests revealed that participants in
the Late-high and Late-low groups produced 10
vowels (/e ei o II æ d Z u/) less accurately thanthe NE speakers did (p < 0:05). Participants in theEarly-high group differed from the NE group for
five vowels (/e ei o II /), whereas those in the Early-low group differed only for /e/.Mann–Whitney tests were carried out to assess
the effects of AOA (early versus late) and amount
of L1 use (low-use versus high-use). The test of
AOA involved the comparison of vowels spoken
by the 36 early and 36 late bilinguals. Separate
tests were carried out for vowels elicited in the
1-word and 3-word conditions. The Mann–Whit-
ney U values were standardized to permit the
computation of exact p-values, which were thenadjusted to compensate for the fact that 11 tests––
one for each vowel––were carried out.
The early bilinguals were found to have
produced nine vowels in the 1-word condition
Fig. 1. The mean number of listeners who judged vowels elic-
ited in (a) the 1-word condition and (b) the 3-word condition to
have been produced accurately (see text).
476 J.E. Flege et al. / Speech Communication 40 (2003) 467–491

(/ei II e d o Z u/) more accurately than the latebilinguals did, z ¼ 3:20 to 4.74, Bonferroni ad-justed p < 0:05. (Differences between the early andlate bilinguals for the remaining two vowels nar-rowly missed reaching significance; /æ/ z ¼ 2:76,Bonferroni p ¼ 0:06; /i/ z ¼ 2:65, Bonferroni p ¼0:08.) The early bilinguals produced all 11 vowelsin the 3-word condition except /i/ more accu-
rately than the late bilinguals did, z ¼ 3:37 to 5.20,Bonferroni p < 0:05. (The difference for /i/ nar-rowly missed reaching significance, z ¼ 2:82,Bonferroni p ¼ 0:052.)The test of L1 use involved comparisons of
vowels spoken by the 36 low-L1-use and 36 high-
L1-use bilinguals. None of the tests examining
vowels elicited in the 1-word condition reached
significance, z ¼ 0:24 to 2.21, Bonferroni adjustedp > 0:10. Tests examining vowels spoken in the 3-word condition yielded one significant difference.
More listeners judged the low-L1-use bilinguals’than the high-L1-use bilinguals’ production of / /
to be accurate, z ¼ 2:96, Bonferroni p < 0:05.
3.3. Transcriptions
A subset of the 1980 vowels were transcribed
phonetically to provide insight into the nature of
the vowel production errors made by late biling-
uals. This analysis focussed on vowels produced by
males. (This is because one of the acoustic analyses
to be reported later focused on males’ vowels.)
Only ‘‘accurate’’ or ‘‘inaccurate’’ vowels were in-cluded in the transcription analysis. Included
among the accurate vowels were tokens that re-
ceived a rating of 3 (acceptable) or 4 (good) by at
least 10 of the 11 listeners. Five accurate produc-
tions of all 11 vowels in both conditions were se-
lected for transcription. In the case of tie scores,
the token with a higher rating (see below) was
used. Of the 110 accurate tokens, 97 were spokenby NE speakers and 13 were spoken by Early-low
participants. The criterion used in selecting the
inaccurate tokens was a rating of 3 or 4 by five or
fewer listeners. It was not possible to find five in-
accurate tokens of all 11 vowels in both condi-
tions. The 108 inaccurate tokens identified for this
analysis were all produced by late bilinguals.
The 218 selected tokens were transcribed by one
of the authors who is a native speaker of English
with training in phonetics (JEF). The vowel tokens
were randomly presented to this listener in twosessions. Each token was labeled as an instance of
one of the 14 vowels and diphthongs of English.
The 14 (6.5%) tokens that were labeled differently
in the two sessions were transcribed a third time by
the same listener. The labeling discrepancies were
resolved for all but one token, a front rounded
vowel deemed unclassifiable as even a poor in-
stance of an English vowel.The transcriptions are summarized in Table 3.
As expected, the tokens classified as accurate
based on the listener data reported earlier were
transcribed as instances of their intended cate-
gories more often than the tokens classified as
inaccurate were (96% versus 35%). No obvious
generalization can be drawn regarding the inac-
curate productions of the target vowels /Z o u/,which were transcribed as instances of several
different non-target vowel categories. However, a
generalization can be drawn regarding errors for
the high and mid front vowels /i II ei e/. Whenproduced inaccurately, these vowels tended to be
heard as vowels that were lower in vowel space
than the target vowel. The inaccurate /i/ tokens
tended to be transcribed as /ei/; the /II/ tokens as /ei/,/e/ or /æ/; the /ei/ tokens as /e/ or /æ/; and the /e/tokens as /æ/. 11 The basis for these misidentifica-
tions is uncertain. It might have been the result of
a systematic cross-language difference in vowel
production (see, e.g. the comparison of German
and English front vowels by Bohn and Flege, 1992,
Fig. 1) or to a systematic tendency in how listeners
identify ambiguous vowels. 12
11 A reviewer noted that the word ‘‘bade’’ is pronounced
/bæd/ rather than /beid/ in some varieties of English. However,
this was unlikely to have been responsible for the several /æ/ for
/ei/ substitutions observed here. Other front vowels were
sometimes incorrectly realized as an [æ]-quality vowel; and /ei/
production was elicited by having the participant’s repeat NE
speakers’ productions of /beid/.12 Peterson and Barney (1952) found that NE-speaking
listeners miss-classified /II/ tokens spoken by fellow NE speakers
as /e/ in 7% of instances, and /e/ tokens as /æ/ in 9% of instances.A later replication by Hillenbrand et al. (1995) revealed a
smaller proportion of /e/-for-/II/ and /æ/-for-/e/ confusions.
J.E. Flege et al. / Speech Communication 40 (2003) 467–491 477

3.4. Regression analyses
The non-parametric analyses presented earlier
suggested that variation in the bilinguals’ AOA
exerted a stronger influence on vowel production
than percentage Italian use did. The early biling-uals’ vowels were judged to have been produced
accurately by more listeners than the late biling-
uals’ vowels were in 19 of 22 possible instances (11
vowels� 2 conditions). However, vowels spokenby low-L1-use and high-L1-use bilinguals differed
in just one of 22 possible instances, suggesting that
the effect of L1 use on L2 vowel production was
negligible. The aim of the analyses presented herewas to provide a more precise assessment of the
relative effects of AOA and L1 use. Following the
practice of previous research (Munro, 1993; Piske
et al., 2002), the listener ratings described in Sec-
tion 3.1 were treated as an interval scale and
subjected to parametric statistical analyses. More
specifically, the dependent variable examined in
this section were average ratings based on eachparticipants’ production of all 11 vowels in the 1-
word and 3-word conditions. The mean ratings
obtained in this way are presented in Appendix A
as a function of group and vowel.
Separate step-wise multiple linear regression
analyses were carried out to examine the mean
ratings obtained for vowels spoken in the two
elicitation conditions. The variables used in se-
lecting the bilingual participants served as predic-
tor variables in both analyses. As required by the
design of the study, these variables––AOA and
percentage L1 use––were uncorrelated (see Table4). The model developed for vowels elicited in the
1-word condition accounted for 63.4% of the
variance in the vowel ratings, F ð1; 70Þ ¼ 81:9,p < 0:01. AOA accounted for 53.9% of the vari-ance at Step 1 and percentage Italian use ac-
Table 3
Transcriptions of English vowels produced relatively well (‘‘accurate’’) or poorly (‘‘inaccurate’’) by male participants in two elicitation
conditions
Accurate Inaccurate
1-Word 3-Word 1-Word 3-Word
/i/ i–3, ei–2 i–3, ei–2 ei–5 ei–3, II–2
/II/ II–5 II–5 e–2, ei–1, æ–1 e–2, ei–1, æ–1*–1 i–1
/ei/ ei–5 ei–5 e–3, æ–2 æ–3, e–1, II–1/e/ e–5 e–5 æ–4, e–1 æ–4, e–1/æ/ æ–5 æ–5 æ–3, –1, d–1 æ–3, –1, e–1/Z/ Z–4, –1 Z–5 Z–4 –2, Z–1, d–1
o–1
/ / –5 –5 Z–2, –1, æ–1 Z–2, d–2, –1
–1
/d/ d–5 d–5 d–5 d–4, e–1/o/ o–5 o–5 o–3, –1 o–3, Z–2/ / –5 –5 –4, d–1 –4, o–1
/u/ u–5 u–5 –3, u–1, o–1 o–4, d–1
Note: The numbers indicate how many tokens were labeled using each phonetic symbol (maximum ¼ 5 in all but two instances). Onetoken that was unclassifiable as an English vowel has been designated by an asterisk.
Table 4
Pearson correlations between the participant variables shown in
Table 1
AOA % Ital-
ian use
LOR NII EDUC
Age 0.18 0.04 0.61�� )0.15 )0.26�
AOA 0.18 )0.66�� )0.14 )0.86��
% Italian use )0.12 0.42�� )0.25�
LOR 0.01 0.49��
NII 0.10
EDUC
Note: Age, chronological age, in years; AOA, age of arrival in
Canada, in years; % Italian use, self-reported percentage use of
Italian; LOR, length of residence in Canada, in years; NII,
number of interlocutors with whom Italian was used; EDUC,
years of education in Canada, in years. One and two asterisks
indicate significance at the 0.01 and 0.05 levels, respectively.
478 J.E. Flege et al. / Speech Communication 40 (2003) 467–491

counted for an additional 9.5% of the variance at
Step 2. The model developed for vowels in the 3-
word condition accounted for 71.7% of the vari-
ance, F ð1; 70Þ ¼ 113:2, p < 0:01. AOA accountedfor 61.8% of the variance at Step 1 and percentage
Italian use accounted for 9.9% of the variance at
Step 2. AOA and percentage Italian use were also
found to account for significant amounts of vari-
ance in the early and late bilinguals’ vowels when
these groups were examined separately. 13
A well-known problem in L2 speech and lan-
guage research is that AOA is often confoundedwith variables that might reasonably be expected
to influence L2 performance (see, e.g. Bahrick
et al., 1994; Flege, 1998; Flege et al., 1999b; Yeni-
Komshian et al., 2000). Pearson correlations
among the participant variables shown in Table 1
have been summarized in Table 4. AOA was cor-
related with length of residence (LOR) in Canada
and the number of years of formal education inEnglish-speaking Canadian schools. The later in
life the bilinguals had arrived in Canada, the
shorter was their LOR in Canada at the time of
testing and the fewer years of education they had
received in English-speaking Canadian schools.
Two variables were also correlated with the bil-
inguals’ percentage use of Italian: the number of
specific interlocutors in Italian the bilinguals wereable to name and years of education in Canadian
schools. The weak correlation with the latter
variable indicated that the bilinguals who had re-
ceived relatively few years of education in Canada
(and also to have arrived in Canada relatively late
in life and to have lived there a relatively short
time) tended to use Italian relatively often.Partial correlation analyses were carried out to
determine if AOA was correlated with the average
vowel ratings after confounded variables had been
controlled statistically. The simple correlation be-
tween AOA and the ratings for vowels elicited in
the 1-word condition, rð70Þ ¼ �0:73, p < 0:01,remained significant when the influence of LOR
and years of Canadian education were partialledout, rð68Þ ¼ �0:32, p < 0:01. The simple correla-tion between AOA and the ratings obtained for
vowels spoken in the 3-word condition, rð70Þ ¼�0:79, p < 0:01, also remained significant whenLOR and years of Canadian education were par-
tialled out, rð68Þ ¼ �0:38, p < 0:01.Similar analyses were carried out to determine if
the bilinguals’ self-reported percentage Italian usewas correlated with the average vowel ratings when
the influence of a confounded variable was statis-
tically controlled. The simple correlation between
L1 use and the ratings obtained for vowels spoken
in the 1-word and 3-word conditions, rð70Þ ¼�0:44 and )0.45, p < 0:01, indicated that the morethe bilinguals continued to use Italian, the less ac-
curately they tended to produce English vowels.These correlations remained significant when
variation in years of Canadian education was
partialled out, rð70Þ ¼ �0:38 and )0.42, p < 0:01.
3.5. Summary
The NE listeners’ ratings of English vowels in-
dicated that AOA influenced the Italian–English
bilinguals’ production of English vowels. Non-
parametric analyses revealed that the early bil-
inguals produced most of the English vowelsexamined more accurately than the late bilinguals
did. This agrees with the findings of previous
studies examining the production of English
vowels by Italian–English bilinguals (e.g. Munro
et al., 1996; Flege et al., 1999a; Piske et al., 2002).
L1 use was also found to influence the bilinguals’
production of English vowels. Non-parametric
tests indicated that the low-L1-use bilinguals pro-duced just one English vowel (/ /, in the 3-word
13 Separate step-wise multiple regression analyses were
carried out to examine the effect of AOA and percentage
Italian use on the mean ratings accorded vowels spoken by the
36 early bilinguals. Two other analyses examined the 36 late
bilinguals’ ratings. All four analyses accounted for a significant
amount of variance in the mean ratings (F-values ranging from
8.5 to 21.6 with 1,33/34 dfs, p < 0:01). Percentage Italian use
accounted for 20.0% of the variance in the early bilinguals’
production of vowels in the 1-word condition. AOA accounted
for 43.9% of the variance in the early bilinguals’ production of
vowels in the 3-word condition at Step 1, and percentage Italian
use accounted for an additional 12.8% of the variance at Step 2.
For the late bilinguals, AOA accounted for 24.1% of the
variance for vowels in the 1-word condition at Step 1, and
percentage Italian use accounted for 13.2% of the variance at
Step 2. Percentage Italian use accounted for 26.1% of the
variance for vowels in the 3-word condition at Step 1, and AOA
accounted for 15.9% of the variance at Step 2.
J.E. Flege et al. / Speech Communication 40 (2003) 467–491 479
condition) more accurately than the high-L1-use
bilinguals did. However, regression analyses ex-
amining the average ratings obtained for all 11
vowels revealed that percentage Italian use ac-counted for a significant amount of variance for
vowels spoken by both early and late bilinguals in
both elicitation conditions. The L1 use effect ob-
tained here agrees with the findings obtained by
Piske et al. (2002) for groups of early Italian–
English bilinguals that were matched for AOA (7
years) but differed according to percentage Italian
use (Early-low ¼ 8%, Early-high ¼ 32%).The lack of between-group differences for /i/ may
have been due to the fact that the difference between
English /i/ and Italian /i/ is too small for NE lis-
teners to detect (even assuming that the bilinguals
examined here used Italian /i/ without modification
in English words). Two possible explanations exist
for between-group differences in the production of
the remaining 10 vowels (/Z d ei o u e II æ /),which were likely to have differed from Italian
vowels that the bilinguals had acquired as young
children (see Munro et al., 1996, Fig. 4). The groups
of participants may have differed in how effectively
they adapted their production of an Italian vowel
for use in English words. Alternatively, they may
have differed in their ability to establish new English
vowel categories. The aim of the acoustic analysespresented in the next section was to evaluate the
second hypothesis.
4. Acoustic analyses
As mentioned in the Introduction, the SLM
(Flege, 1995) hypothesizes that learning will pro-
ceed differently for an L2 vowel depending on
whether or not a new category is established for it.
Predictions generated by the SLM were tested herethrough acoustic analyses of the vowel /ei/. The
first prediction was that more early than late bi-
linguals would produce English /ei/ with a greater
amount of movement than the NE speakers. The
second prediction was that more late than early
bilinguals would produce English /ei/ with less
movement than the NE speakers.
This section is organized as follows. Section 4.2compared the direction and magnitude of move-
ment in tokens of /ei/ and /e/ that were classified bylisteners as accurate or inaccurate in the last sec-
tion. Section 4.3 compared degree of movement in
English /ei/ and Italian /e/. Section 4.4 assessedamount of movement in the /ei/ tokens produced
by NE speakers and the four groups of Italian–
English bilinguals. Finally, regression analyses in
Section 4.5 examined the effect of variation in
movement on listeners’ judgments of /ei/ produc-
tion accuracy.
4.1. Method
Commercially available software (the Multi-
speech program of Kay Elemetrics, Inc.) was used
to make spectral and temporal measurements.
Three measurement locations in the ‘‘vowel’’ por-tion of each digitized word were identified from
time domain waveforms and spectrographic repre-
sentations. Using procedures similar to those de-
scribed by Hillenbrand et al. (1995), points located
20%, 50%, and 80% into the vowel interval were
identified in each token. These points were desig-
nated the ‘‘beginning’’, ‘‘midpoint’’, and ‘‘ending’’
locations. A 20-ms Blackman window was centeredat each location and the auto-correlation method of
linear predictive coding (LPC) analysis was used to
estimate the frequency of the first two vowel for-
mants (F1, F2). Twenty-four LPC coefficients were
calculated in most instances. The estimates ob-
tained in the LPC analyses were confirmed through
FFT analyses and, when necessary, visual inspec-
tion of spectrographic representations. The samesoftware was also used to obtain estimates of fun-
damental frequency (F0) at each location. Finally,
the duration of each vowel token was measured
from the onset to the offset of periodicity in the
vocalic portion of each waveform.
4.2. Accurate versus inaccurate vowels
The first question of interest was whether the
accurate and inaccurate tokens of /ei/ (see Section
3.3) were produced with differing amounts of for-
mant movement. To address this question, the first
and second formant frequency values obtained for
accurate and inaccurate /ei/ tokens produced bymales were converted from Hertz to Bark units
480 J.E. Flege et al. / Speech Communication 40 (2003) 467–491

(Syrdal and Gopal, 1986), then plotted in a two-
dimensional (B1 versus B2) space. The beginning
value for each token (marked by a cross) and the
ending value (marked by a filled or unfilled circle,depending on accuracy) was connected by a
straight line to provide a rough indication of the
change in vowel quality that occurred as each
vowel token was produced. Such changes were
likely to have occurred primarily as the result of
tongue movement (Flege et al., 1986).
The values for /ei/ tokens produced in the 1-
word and 3-word conditions are shown in the twopanels of Fig. 2. Relatively low B1 and B2 values in
this figure indicates relatively high and posterior
vowel qualities, respectively. The ending values of
the accurate /ei/ tokens are marked by unfilled
circles. These tokens consistently showed move-
ment toward a higher, fronter vowel quality
whereas the inaccurate /ei/ tokens (whose ending
values are marked by filled circles) did not. Theending values for the accurate /ei/ tokens from both
elicitation conditions specified vowel qualities that
were higher and fronter in the vowel space than did
the ending values for inaccurate /ei/ tokens. This
suggested that the tongue moved up and forward
during the production of the accurate but not the
inaccurate /ei/ tokens. It can be seen that move-
ments for the inaccurate /ei/ tokens were smaller inmagnitude than those for the accurate tokens, went
in the wrong direction, or both. The midpoint
values (not shown) for all but one of the inaccurate
/ei/ tokens were lower in the vowel space than those
for the accurate /ei/ tokens. This finding is consis-
tent with the fact that the inaccurate /ei/ tokens
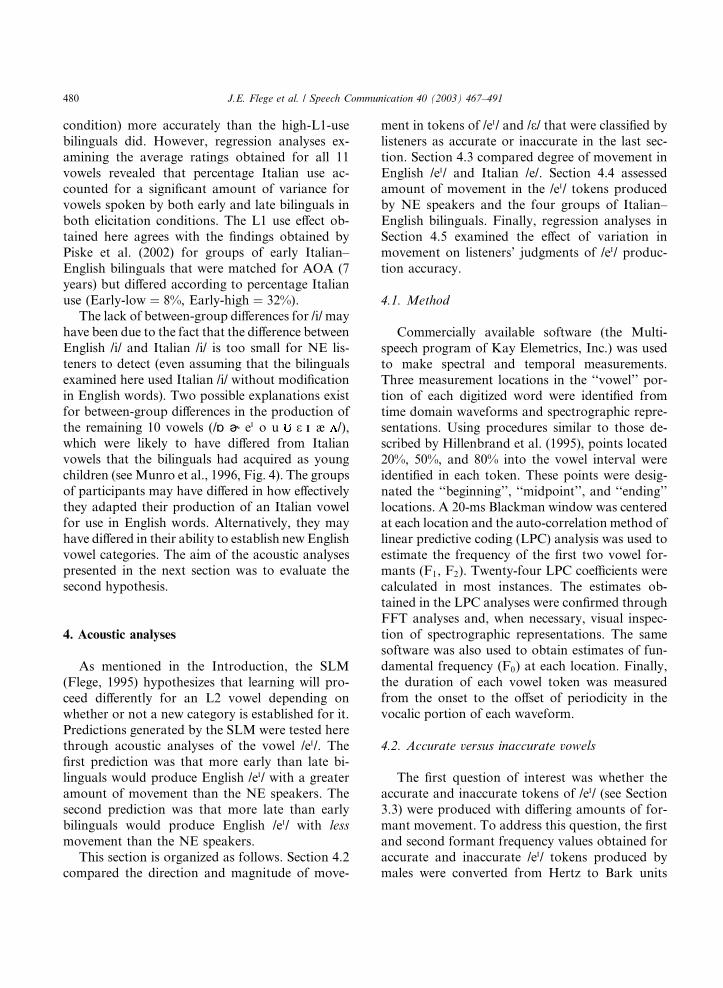
were transcribed as /e/ or /æ/ in Section 3.3.Results obtained by applying the same proce-
dures to the accurate and inaccurate /e/ tokenshave been plotted in Fig. 3 for the purpose of
comparison. As expected from more direct mea-
sures of tongue movement (Flege et al., 1986, Fig.
5), the accurate /e/ tokens were produced with farless formant movement than the accurate /ei/ to-
kens were. The accurate and inaccurate /e/ tokenswere not distinguished by different movementpatterns as was the case for the accurate and in-
accurate /ei/ tokens considered earlier. The mid-
point values (not shown) of the inaccurate /e/tokens specified vowel qualities that were lower in
the vowel space did the values obtained for the
accurate /e/ tokens. This is consistent with the factthat most of the inaccurate /e/ tokens were labeledas /æ/ in Section 3.3.
4.3. Italian /e/ versus English /ei/
The results presented in the last section suggeststhat some Italian–English bilinguals produced
English /ei/ with too little movement due to cross-
language phonetic interference (Flege and Port,
1981). This explanation assumes that Italian /e/ is
Fig. 2. Frequency values obtained for tokens of /ei/ elicited in
(a) the 1-word condition and (b) the 3-word condition. A
straight line connects the beginning values (crosses) and the
ending values (filled or unfilled circle) for each token.
J.E. Flege et al. / Speech Communication 40 (2003) 467–491 481
produced with less movement than English /ei/, as
is the case for /e/ in other Romance languages (e.g.
Delattre, 1964). The acoustic results obtained by
Flege et al. (1999a) supported this assumption, but
this analysis was based on just five English /ei/tokens and five Italian /e/ tokens.
The aim of the analysis presented here was to
compare English /ei/ and Italian /e/. Speech sam-
ples were elicited from two groups for this pur-
pose. The English monolinguals (four males, eight
females) had a mean age of 28 years. They were
residents of Columbus, Ohio or Birmingham, Al-
abama. The Italian monolinguals (four males,
eight females) had a mean age of 26 years and were
living in Padua, Italy when recorded. The partici-
pants in the two groups began by repeating four
words in their native language following a native-speaker model. Each word contained the vowel of
interest (/ei/ for English, /e/ for Italian). After
hearing the four words again, the participants in-
serted the vowel found in all four words into a
/b_do/ context, yielding a non-word. After saying a
non-word (/beido/ or /bedo/) in isolation, the par-
ticipants produced it two times in a carrier phrase.
This yielded 36 tokens of English /ei/ and 36 tokensof Italian /e/, all in a /b_do/ context.
The F0, F1 and F2 frequencies of each /ei/ and
/e/ token were measured at the beginning and
ending locations as described earlier. Given that
both groups contained males and females, values
in Hertz were converted to Bark values, and Bark
difference values were then computed. As dis-
cussed by Syrdal and Gopal (1986), this proceduresubstantially reduces gender-based differences
arising from differences in vocal tract size. It pro-
vided estimates of vowel quality in two dimen-
sions. Subtracting the F0 value from F1 values
(B1–B0) provided estimates of vowel quality in a
high–low dimension. Subtracting the F1 values
from the F2 values (B2–B1) provided estimates of
vowel quality in a front–back dimension.The mean beginning and ending values for
English /ei/ and Italian /e/ are plotted in a two-
dimensional (high–low versus front–back) pho-
netic vowel space in Fig. 4. The beginning and
ending values have been connected with a straight
line to provide a rough indication of tongue
movement. As expected, the English /ei/ tokens
were produced with more movement than theItalian /e/ tokens were. Although the ending values
of the two vowels were similar, their beginning
values differed considerably.
A Language ðItalian versus EnglishÞ�measure-ment location ðbeginning versus endingÞ � dimen-sion ðhigh–low versus front–backÞ ANOVA
examining the Bark difference values yielded a
significant three-way interaction, F ð1; 70Þ ¼ 37:3,p < 0:01. Tests of simple main effects revealed thatthe beginning B1–B0 values were smaller for Italian
/e/ than English /ei/ (p < 0:01) indicating a highervowel quality at the onset of /e/ than /ei/. The be-
Fig. 3. Frequency values obtained for tokens of /e/ elicited in(a) the 1-word condition and (b) the 3-word condition. A
straight line connects the beginning values (crosses) and the
ending values (filled or unfilled circle) for each token.
482 J.E. Flege et al. / Speech Communication 40 (2003) 467–491

ginning B2–B1 values were larger for Italian /e/than English /ei/ (p < 0:01), indicating a more an-terior vowel quality at the onset of /e/ than /ei/.
However neither the ending B1–B0 nor the ending
B2–B1 values obtained for Italian /e/ and English
/ei/ differed significantly.
The Euclidean distances between the beginning
B1–B0 and B2–B1 values and the ending B1–B0 and
B2–B1 values were computed for each token. Thisprovided an estimate of amount tongue of move-
ment in a 2-dimensional vowel space. An ANOVA
confirmed that the distance values were signifi-
cantly greater for English /ei/ than Italian /e/,
F ð1; 70Þ ¼ 36:8, p < 0:01. It is not certain, ofcourse, that this finding will generalize to the
vowels of all English and Italian varieties or dia-
lects, or that the measures obtained here for Italian/e/ typified the /e/s spoken by the Italian–English
bilinguals when they first arrived in Canada.
4.4. Formant movement in /ei/
Previous sections revealed that NE-speaking
listeners judged the /ei/s produced by some Italian–
English bilinguals––especially late bilinguals––to
be inaccurate. Acoustic analyses suggested that thebilinguals’ inaccurate /ei/ tokens were often pro-
duced with less movement than the bilinguals’ ac-
curate /ei/ tokens were. This may have been due to
the fact that the Italian vowel that most often
perceptually assimilates English /ei/, viz. Italian /e/,is produced with less movement than English /ei/ is.
The purpose of this section was to assess
amount of movement in the /ei/s produced by all
90 participants. The 180 /ei/ tokens (5 groups� 18participants� 2 elicitation conditions) presentedto listeners in Section 3 were measured acoustically
using the procedures described earlier.
Fig. 5 shows the mean beginning and endingvalues for /ei/s spoken in both elicitation condi-
tions by the five groups in a 2-dimensional (high–
low versus front–back) formant space. The
beginning quality of the vowels spoken by all five
groups were similar, but the ending vowel quality
values of the five groups differed considerably.
Bilinguals in the Late-high group seem to have
produced /ei/ with ending qualities that were lowerand farther back in the vowel space than the NE
speakers did. Conversely, the Early-low partici-
pants seem to have produced /ei/ with ending
vowel qualities that were higher and farther for-
ward in the vowel space than the NE speakers did.
Analyses of the beginning and ending Bark
differences values revealed that the Early-low
groups’ ending values were higher in vowel spacethan the NE and Late-high groups’ values
(p < 0:05), and that the Early-low and Early-highgroups’ ending values were fronter than the Late-
high groups’ ending values (p < 0:05). 14 The
Fig. 4. The mean beginning and ending frequency values for
productions of English /ei/ and Italian /e/ by 12 monolingual
speakers of each language.
14 The Bark difference values in Fig. 5 were examined in
a group ð5 levelsÞ �measurement location ðbeginning versusendingÞ � dimension ðfront–back versus high–lowÞ ANOVA.
The three-way interaction it yielded, F ð4;82Þ ¼ 5:9, p < 0:01,was explored by simple effect tests. The effect of group was non-
significant for the beginning high–low (B1–B0) values, F ð4;82Þ ¼ 0:2, n.s., and the beginning front–back (B2–B1) values,F ð4;82Þ ¼ 0:2, n.s. However, the simple effect of group wassignificant for both the ending high–low values, F ð4;82Þ ¼ 5:0,p < 0:01, and the ending front–back values, F ð4;82Þ ¼ 4:6,p < 0:01. Tukey’s tests revealed that the Early-low groups’vowels had significantly smaller B1–B0 ending values than the
NE and Late-high groups’ vowels (p < 0:05). Vowels spoken by
the Early-low and Early-high groups had significantly larger B2–
B1 values than the Late-high groups’ vowels (p < 0:05). Noother between-group differences reached significance.
J.E. Flege et al. / Speech Communication 40 (2003) 467–491 483

amount of movement exhibited by each token was
estimated by computing the Euclidean distance
between its beginning and ending values. The dis-
tance scores obtained for the five groups (NE 1.53,
Early-low 2.14, Early-high 1.81, Late-low 1.53,
Late-high 1.33) were found to differ significantly,
F ð4; 175Þ ¼ 5:9, p < 0:01. A Tukey’s post-hoc testrevealed that the Early-low groups’ values weresignificantly larger than those obtained for the NE,
Late-low and Late-high groups (p < 0:05). Noother between-group differences reached signifi-
cance.
One possible interpretation of the between-
group difference just reported is that more partic-
ipants in the Early-low group than in the two late
bilingual groups established a category for English/ei/, and this new category dissimilated from a pre-
existing Italian /e/ category in order to preserve
phonetic contrast (Flege, 1995, 2002). Several po-
tential objections might be raised concerning this
interpretation, however. Participants in the Early-
low group might have produced /ei/ with more
movement than the late bilinguals did because
their /ei/s were longer. Variation in vowel durationwas probably not responsible for the observed
differences, however. The vowels produced by the
five groups (NE 284 ms, Early-low 282, Early-high
296, Late-low 280, Late-high 260) did differ sig-
nificantly in duration, F ð4; 175Þ ¼ 3:2, p < 0:05,but the Early-low participants’ vowels were scar-
cely longer than the late bilinguals’ vowels. A
Tukey’s test using duration as a co-variate again
revealed that the Early-low groups’ distance values
to be significantly greater than the NE, Late-Low,and Late-high groups’ values (p < 0:01).A second possible objection to the interpreta-
tion offered earlier is that the analysis included
vowel tokens that were not identifiable either as
English /ei/ or Italian /e/. Perhaps the participants
in certain groups produced vowels with less
movement than participants in the Early-low
group did because they were attempting to pro-duce some vowel other than /ei/ or its Italian
counterpart /e/. A second analysis was, therefore,
carried out which excluded any token that was not
an instance of the /ei/ category, as judged by an
author who is a NE speaker, or an instance of the
Italian /e/ category, as judged by an author who is
a native Italian speaker.
The beginning and ending values for this subsetof tokens are shown in Fig. 6. The effect of group
(NE mean ¼ 1:52, 35 tokens; Early-low mean ¼2:23, 33 tokens; Early-high mean ¼ 1:85, 34 to-kens; Late-low mean ¼ 1:75, 30 tokens; Late-highmean ¼ 1:34, 22 tokens) was significant in anANOVA examining distance values, F ð4; 149Þ ¼5:7, p < 0:01. A post-hoc test indicated that vowelsspoken by the Early-low group had larger distancevalues than the vowels spoken by participants in
Fig. 5. The mean beginning values (crosses) and ending values
(various symbols) for English /ei/s produced in two conditions
by five groups of participants.
Fig. 6. The mean beginning values (crosses) and ending values
(various symbols) for the subset of English /ei/ tokens produced
by the participants in five groups that were judged to be in-
stances of either /ei/ or /e/ (see text).
484 J.E. Flege et al. / Speech Communication 40 (2003) 467–491

the NE and Late-high groups (p < 0:05). Theseresults suggest that the difference between the
Early-low group and other groups cannot be at-
tributed to the inclusion of non-target vowels.Still another potential objection to consider is
that the Late-low groups’ beginning and ending
values (and, by extension, amount of tongue
movement) were virtually identical to the values
obtained for the NE speakers, at least when all
tokens were considered (see Fig. 5). The theoretical
expectation generated by the SLM is that expe-
rienced Italian–English bilinguals will either pro-duce /ei/ with less movement than NE speakers (if
they continue to identify English /ei/s as instances
of the Italian /e/ category) or they will produce /ei/
with more movement than NE speakers (if they
establish a category for /ei/ which dissimilates from
Italian /e/). Fig. 7(a) shows the distribution of
differences between the beginning and ending high-
low (B1–B0) values. (The values for the Early-lowgroup are also shown for the purpose of compar-
ison). Fig. 7(b) shows the distribution of values
obtained for movement in the front–back (B2–B1)
dimension. As expected theoretically, the distri-
bution of /ei/ movement values obtained for the
Late-low and NE groups differed. Values obtainedfor the Late-low participants in both dimensions
tended to be larger or smaller than the values
obtained for the NE speakers, which clustered in a
narrow region. The fact that the Late-low partic-
ipants’ average values were virtually identical to
those of the NE speakers in Fig. 5 is, therefore, a
statistical artifact.
Another question of interest was how manytokens the bilinguals produced with more or less
movement than was typical for the NE speakers.
To address this question, each /ei/ token having a
distance value exceeding the NE speakers’ mean
by more than 1.0 standard deviation (SD) was
identified. These were designated the ‘‘overshoot’’
tokens. The /ei/ tokens having distance values that
were more than 1.0 SD smaller than the NEspeakers’ mean distance value were also identified.
These were designated the ‘‘undershoot’’ tokens.
The numbers of overshoot and undershoot tokens
produced by the five groups of participants are
shown in Table 5. Of the four bilingual groups,
only the Early-low group produced more over-
shoot tokens than the NE group did, X ð1Þ ¼ 7:53,p < 0:01. Conversely, both groups of late biling-uals produced more undershoot tokens then the
NE group did, Late-low X ð1Þ ¼ 4:0, Late-highX ð1Þ ¼ 5:55, p < 0:05.
4.5. Multiple regression analyses
The data just presented suggest the followinginterpretation. Participants in the Early-low group
Fig. 7. The distribution of change values observed in two di-
mensions for /ei/ tokens produced by three groups of partici-
pants: (a) movement in the high–low (B1–B0) dimension, (b)
movement the front–back (B2–B1) dimension.
Table 5
The number of /ei/ tokens (maximum 36) produced with dis-
tance values that were at least 1 SD greater than the mean
distance values observed for the NE group (overshoot) or 1 SD
less than the NE group’s mean (undershoot)
Undershoot Overshoot
NE 4 6
Early-low 3 21�
Early-high 4 12
Late-low 12� 11
Late-high 14� 9
Note: The frequencies marked by an asterisk exceed the fre-
quency observed for the NE group at the 0.05 level by a Chi-
square test (p < 0:05).
J.E. Flege et al. / Speech Communication 40 (2003) 467–491 485

may have produced a large number of /ei/ tokens
with exaggerated movement (the ‘‘overshoot’’ to-
kens) because many of them established a new
category for English /ei/ that dissimilated fromItalian /e/. This is consistent with the finding that,
of the four groups examined by Flege et al.
(1999a), only participants in an Early-low group
were able to discriminate English /ei/ and Italian /e/
tokens at a significantly above-chance rate. Par-
ticipants in the two late bilingual groups, on the
other hand, may have produced English /ei/ with
less movement than the NE speakers did becausemany of them continued to treat /ei/ tokens as
instances of the Italian /e/ category, and so merged
the properties of English /ei/ and Italian /e/.
The interpretation just offered assumes that
listeners can perceptually distinguish variations in
amount of movement in /ei/-quality and /e/-quality
vowels. This assumption agrees with the findings
of previous research (e.g. Nearey, 1989; Strange,1989; Strange and Bohn, 1998; Hillenbrand et al.,
1995) showing that listeners make use of spectral
information distributed over the entire vowel when
perceiving vowels. The analyses presented here
evaluated the role of movement on listeners’ rat-
ings of English /ei/ by regressing acoustic measure
of /ei/ onto the mean ratings obtained from NE-
speaking listeners in Section 3.Five acoustic measures were regressed onto the
listener ratings of /ei/ tokens produced by the 72
Italian–English bilinguals. The predictor variables
were the front–back (B2–B1) and high–low (B1–B0)
values obtained at the beginning location (i.e. the
vowel onset), amount of movement in the front–
back and high–low dimensions (quantified as the
amount of B2–B1 and B1–B0 change from the be-ginning to the end of the vowel), and vowel du-
ration. The model accounted for 74.6% of the
variance, F ð4; 139Þ ¼ 102:1, p < 0:01. Movementin the front–back dimension accounted for 56.2%
of the variance at Step 1. Front–back (B2–B1)
values at the beginning of the vowel accounted for
additional 13.7% of the variance at Step 2, dura-
tion for 3.6% at Step 3, and movement in the high–low (B1–B0) dimension for 1.1% of the variance at
Step 4.
The results of this analysis suggested that
tongue movement differences in productions of /ei/
can be detected by listeners. The possibility existed,
however, that the amount of variance accounted
for by the regression model was artificially aug-
mented by the inclusion of tokens not identifiableas /ei/ or /e/. A second regression analysis was,
therefore, carried out. It examined /ei/s produced
by the 36 early bilinguals, whose /ei/s were nearly
always heard as intended by the NE listeners. This
analysis accounted for 71.2% of the variance,
F ð2; 69Þ ¼ 85:1, p < 0:01. Movement in the front–back dimension accounted for 62.2% of the vari-
ance at Step 1, and the front–back (B2–B1) valuesat the beginning of the vowel accounted for an
additional 8.9% of the variance at Step 2. These
results also suggested that the NE listeners’ judg-
ments of /ei/ depended importantly on the amount
of movement.
One further objection might be raised regarding
the conclusion that the listeners’ ratings were in-
fluenced by amount of movement. It is that severalpredictor variables were correlated. Movement in
the front–back dimension was modestly correlated
with duration, rð70Þ ¼ 0:23, p ¼ 0:052, and thebeginning high–low values, rð70Þ ¼ 0:31, p < 0:01.Movement in the high–low dimension was corre-
lated with the beginning high–low values, rð70Þ ¼0:39, p < 0:01. Accordingly, a hierarchical regres-sion analysis examining the early bilinguals’ pro-ductions of /ei/ was carried out. The beginning
high–low values, the beginning front–back values,
and vowel duration were entered at Step 1. The
acoustic measures of movement in the high–low
and front–back dimensions were entered at Step 2.
Duration accounted for 10.1% of the variance at
Step 1. Movement in the front–back dimension
accounted for an additional 54.1% of the varianceat Step 2, F ð2; 69Þ ¼ 61:9, p < 0:01, independentlyof the confounded variables. This confirmed that
variation in tongue movement exerted an influence
on the listeners’ ratings of /ei/.
5. General discussion
This study examined Italian–English bilinguals’
production of 11 English vowels. The bilinguals
were selected on the basis of when in life they ar-rived in Canada and how much they continued to
486 J.E. Flege et al. / Speech Communication 40 (2003) 467–491
use Italian (four groups in all). Both AOA and L1
use were found to influence the bilinguals’ pro-
duction of English vowels. Parametric and non-
parametric analyses of listeners’ ratings indicatedthat early bilinguals tended to produce the English
vowels more accurately than late bilinguals did
and low-L1-use bilinguals tended to produce En-
glish vowels more accurately than high-L1-use
bilinguals. These findings agreed with previous
research examining the effect of age of L2 learning
(Flege, 1992; Yamada, 1995; Munro et al., 1996;
Flege et al., 1995a,b; Flege et al., 1999a; Meadoret al., 2000; Yeni-Komshian et al., 2000; MacKay
et al., 2001; MacKay et al., 2001; Piske et al., 2001,
2002) and amount of continued L1 use (Flege et al.,
1997; Guion et al., 2000; Meador et al., 2000;
MacKay et al., 2001; Piske et al., 2001, 2002).
The primary purpose of the study, however,
was to examine the production of English /ei/ in
detail. A language interaction model, the SLM(e.g. Flege, 1995, 1999, 2002) generated two pre-
dictions that were tested here. The first prediction
was that participants in the Early-low group would
produce English /ei/ with a more movement than
participants in the two late bilinguals groups
(Late-low, Late-high) would. The second predic-
tion was that the late bilinguals would produce
English /ei/ with less movement than the NEspeakers. Both hypotheses were supported. The
amount of movement in each /ei/ token was esti-
mated by computing the distance between the
beginning and ending values in a 2-dimensional
formant space. The distance values were signifi-
cantly larger for vowels spoken by the Early-low
group than by the NE, Late-low and Late-high
groups. A second analysis restricted to vowel to-kens identifiable as /ei/ or /e/ indicated that the
Early-low group produced /ei/ with significantly
more movement than participants in the NE and
Late-high groups did. Another analysis focused on
the number of individuals who produced /ei/ with
distance values that were at least 1 SD greater than
the mean value obtained for the NE group (des-
ignated ‘‘overshoot’’ tokens) or at least 1 SD less
than the NE mean (‘‘undershoot’’ tokens). Of the
four native Italian groups, only the Early-low
group produced more overshoot tokens than the
NE group did; conversely, both groups of late
bilinguals produced more undershoot tokens than
the NE group did.
These findings can be interpreted within the
framework of the SLM. Participants in the twolate bilingual groups may have tended to produce
English /ei/ with less movement than the NE
speakers did because they continued to treat /ei/
tokens as instances of the Italian /e/ category. That
is, they may have merged the properties of English
/ei/ and Italian /e/ as the result of the mechanism of
category assimilation. As discussed in the Intro-
duction, the effect of category assimilation hasbeen observed in previous studies examining the
production of L2 stop consonants (Flege, 1987;
MacKay et al., 2001).
Participants in the Early-low group, on the
other hand, may have produced a large number of
/ei/ tokens with exaggerated movement (overshoot)
because many of them established a new category
for English /ei/ that dissimilated from Italian /e/.This is consistent with the finding that, of the four
groups examined by Flege et al. (1999a), only
participants in an Early-low group discriminated
English /ei/ and Italian /e/ tokens at a significantly
above-chance level. Category dissimilation has
been observed in previous research in which early
bilinguals established a new category for an L2
stop consonant (Flege and Eefting, 1987, 1988).The SLM posits that an L2 phonetic category may
dissimilate from a neighboring L1 vowel category
in order to preserve phonetic contrast among the
elements of the L1 and L2 subsystems, which are
said to exist in a common phonological space.
That is, Italian–English bilinguals may have pro-
duced English /ei/ with more movement than is
typical for English in order to make it distinctfrom their Italian /e/.
The inference that more participants in the
Early-low group than in either of the two late bi-
lingual groups established a category for English
/ei/ is consistent with the findings of a study by
Flege and MacKay (Submitted). These authors
examined the categorial discrimination of nine
pairs of English vowels by the same four groups ofItalian–English bilinguals who participated in this
study. Both AOA and L1 use affected the biling-
uals’ discrimination of English vowels. Partici-
pants in the Early-low group obtained the highest
J.E. Flege et al. / Speech Communication 40 (2003) 467–491 487
discrimination scores whereas participants in the
Late-high obtained the lowest scores. Bilingual
participants were credited with native-like per-
ception if they obtained a score that fell within 2SDs of the NE speakers’ mean. Significantly more
early than late bilinguals were so credited; and
there was a non-significant trend for more low-use
than high-use participants to be so credited.
At least one alternative account can be offered
for the effects observed here. It could be hypoth-
esized that participants in the Early-low group
were more likely than those in the other threebilingual groups to identify strongly with Cana-
dian culture and/or the English language. If this
were so, more Early-low participants may have
wanted to ‘‘sound Canadian’’ for affective or
socio-cultural reasons. This might explain why
participants in the Early-low group used Italian
less than those in the Early-high group, and why
they tended to produce English /ei/ with exagger-ated movement. That is, the Early-low partici-
pants’ productions of English /ei/ with exaggerated
formant movement might be seen as evidence of
‘‘hypercorrection’’.
Additional research examining Italian–English
bilinguals’ production of Italian vowels might be
useful in helping to choose between the hyper-
correction account and a language interactionaccount. If research reveals that only bilinguals
showing undershoot in English /ei/ produce Ital-
ian /e/ with more movement in that vowel than
Italian monolinguals do, it would support the
view that the overshoot in English /ei/ seen in this
study arose from the establishment of an /ei/
category.
Additional research will also be needed toevaluate bilinguals’ perception of English /ei/. If an
overshoot of movement in /ei/ is the result of cat-
egory dissimilation, whereas undershoot is the re-
sult of category assimilation by individuals who
fail to establish a category for /ei/, then different
perceptual outcomes should be observed for sub-
groups of experienced Italian–English bilinguals.
Specifically, bilinguals showing overshoot in /ei/should be able to differentially identify English /ei/
and Italian /e/ tokens in a language identification
task, and to discriminate English /ei/ and /e/ tokens
at an above-chance rate in a categorial discrimi-
nation task (e.g. Flege et al., 1999a). They should
also prefer /ei/ tokens with much movement to /ei/
tokens with little movement in a goodness rating
task. Conversely, bilinguals who show movementundershoot in producing /ei/ should either not
show these effects or show them to a significantly
lesser extent than the bilinguals who show over-
shoot in production. This is because, by hypothe-
sis, the bilinguals who show undershoot do so
because they continue to treat English /ei/ tokens
as instances of Italian /e/ and, as a result, fail to
establish a new category for English /ei/.In summary, the results obtained here sup-
ported the prediction that certain Italian–English
bilinguals would produce /ei/ with too little tongue
movement whereas other would produce this vo-
wel with too much movement. The findings were
taken as support for the hypothesis that the L1
and L2 phonetic subsystems of bilinguals interact
through two distinct mechanisms, phonetic cate-gory assimilation and phonetic category dissimi-
lation. If additional research supports this view of
L1–L2 interactions, it will be necessary to deter-
mine how much of the native versus non-native
differences observed in L2 speech research can be
attributed to language interaction effects.
Acknowledgements
This study was supported by grant DC00257
from the National Institute for Deafness andOther Communicative Disorders. The authors
thank St. Anthony’s parish in Ottawa, all of the
participants, and K. Aoyama, A. Højen, S. Imai,
M. Mack, K. Tsukada and an anonymous re-
viewer for comments on earlier versions of the
article. Thanks are also extended to A. Zamboni,
E. Magno Caldognetto and F. Ferrero of the Is-
tituto di Fonetica e Dialettologia, Padua, Italy, forassistance in recording Italian vowels.
Appendix A
The mean ratings obtained for vowels spokenby five groups in two elicitation conditions
488 J.E. Flege et al. / Speech Communication 40 (2003) 467–491

References
Bahrick, H., Hall, L., Goggin, J., Bahrick, L., Berger, S., 1994.
Fifty years of language maintainance in bilingual Hispanic
immigrants. J. Exp. Psych. Gen. 123, 264–283.
Baker, W., Trofimovich, P., Mack, M., Flege, J.E., 2002. The
effect of perceived phonetic similarity on non-native sound
learning by children and adults. In: Do, A., Dom�ıınguez, L.,
Johansen, A. (Eds.), BUCLD 26: Proceedings of the 26th
Annual Boston University Conference on Language Devel-
opment. Cascadilla Press, Somerville, MA.
Bohn, O.-S., Flege, J.E., 1992. The production of new and
similar vowels by adult German learners of English. Stud.
Second Lang. Acquis. 14, 131–158.
Conover, W., 1980. Practical Nonparametric Statistics, second
ed. John Wiley & Sons, New York.
Delattre, P., 1964. Comparing the vocalic features of English,
German, Spanish and French. Int. Rev. Appl. Ling. 2, 71–
97.
Flege, J.E., 1987. The production of ‘new’ and ‘similar’ phones
in a foreign language: evidence for the effect of equivalence
classification. J. Phonetics 15, 47–65.
Flege, J.E., 1989. Differences in inventory size affects the
location but not the precision of tongue positioning in vowel
production. Lang. Speech 32, 123–147.
Flege, J.E., 1991. Age of learning affects the authenticity of
voice onset time (VOT) in stop consonants produced in a
second language. J. Acoust. Soc. Am. 89, 395–411.
Flege, J.E., 1992. Speech learning in a second language. In:
Ferguson, C., Menn, L., Stoel-Gammon, C. (Eds.), Phono-
logical Development: Models, Research, and Implications.
York Press, Timonium, MD, pp. 565–604.
Flege, J.E., 1995. Second-language speech learning: theory,
findings, and problems. In: Strange, W. (Ed.), Speech
Perception and Linguistic Experience, Issues in Cross-
linguistic research. York Press, Timonium, MD, pp. 233–
277.
Flege, J.E., 1998. The role of subject and phonetic variables in
L2 speech acquisition. In: Gruber, M., Higgins, D., Olsen,
K., Wysocki, T. (Eds.), Papers from the 34th Annual
Meeting of the Chicago Linguistic Society, Vol. II, The
Panels. Chicago, Chicago Linguistic Society, pp. 213–232.
Flege, J.E., 1999. Age of learning and second-language speech.
In: Birdsong, D.P. (Ed.), Second Language Acquisition and
EC Vowel
/Z/ /d/ /ei/ /o/ /u/ / / /e/ /II/ /�/ / / /i/
NativeEnglish
1 3.5(0.3)
3.4(0.2)
3.2(0.6)
3.5(0.3)
3.4(0.2)
3.3(0.4)
3.4(0.2)
3.3(0.3)
3.3(0.5)
3.4(0.2)
3.3(0.2)
3 3.3
(0.6)
3.4
(0.3)
3.5
(0.2)
3.6
(0.3)
3.5
(0.1)
3.5
(0.1)
3.5
(0.2)
3.4
(0.2)
3.3
(0.4)
3.5
(0.3)
3.3
(0.5)
Early-
low
1 3.5
(0.2)
3.4
(0.2)
3.4
(0.6)
3.5
(0.3)
3.3
(0.3)
3.4
(0.2)
3.3
(0.4)
3.4
(0.3)
3.5
(0.2)
3.2
(0.6)
3.4
(0.2)
3 3.4
(0.4)
3.3
(0.3)
3.1
(0.8)
3.4
(0.3)
3.5
(0.2)
3.4
(0.2)
3.2
(0.2)
3.3
(0.3)
3.3
(0.3)
3.1
(0.8)
3.4
(0.2)
Early-
high
1 3.4
(0.3)
3.3
(0.4)
3.3
(0.5)
3.4
(0.3)
3.3
(0.3)
3.2
(0.5)
3.0
(0.7)
3.2
(0.5)
3.3
(0.4)
3.1
(0.6)
3.2
(0.6)
3 3.3
(0.3)
3.3
(0.3)
3.2
(0.6)
3.3
(0.3)
3.3
(0.2)
3.2
(0.6)
2.9
(0.7)
3.2
(0.3)
3.3
(0.3)
2.4
(0.9)
3.0
(0.8)
Late-
low
1 3.2
(0.3)
3.0
(0.2)
3.1
(0.7)
3.2
(0.3)
3.0
(0.3)
3.1
(0.4)
2.4
(0.6)
2.9
(0.5)
3.1
(0.6)
2.5
(0.6)
3.2
(0.4)
3 2.9
(0.5)
3.0
(0.4)
2.8
(0.9)
3.0
(0.5)
2.9
(0.4)
2.8
(0.4)
2.6
(0.6)
2.9
(0.5)
2.7
(0.5)
2.2
(0.8)
2.9
(0.8)
Late-
High
1 2.9
(0.7)
2.7
(0.5)
2.2
(0.9)
2.8
(0.7)
2.6
(0.5)
2.9
(0.4)
2.5
(0.8)
2.8
(0.5)
2.9
(0.6)
2.5
(0.7)
2.7
(0.7)
3 2.5
(0.9)
2.4
(0.6)
2.2
(0.9)
2.5
(0.7)
2.8
(0.5)
2.8
(0.5)
2.6
(0.8)
2.3
(0.8)
2.8
(0.5)
1.7
(0.4)
2.5
(0.9)
Note: EC, elicitation condition (1-word versus 3-word). Standard deviations are in parentheses.
J.E. Flege et al. / Speech Communication 40 (2003) 467–491 489

the Critical Period Hypothesis. Lawrence Erlbaum, Hills-
dale, NJ, pp. 101–132.
Flege, J.E., 2002. Interactions between the native and second-
language phonetic systems. In: Burmeister, P., Piske, T.,
Rohde, A. (Eds.), An Integrated View of Language Devel-
opment: Papers in Honor of Henning Wode. Wissenschaf-
tlicher Verlag Trier, Trier.
Flege, J.E., Eefting, W., 1987. The production and perception
of English stops by Spanish speakers of English. J.
Phonetics 15, 67–83.
Flege, J.E., Eefting, W., 1988. Imitation of a VOT continuum
by native speakers of English and Spanish: evidence for
phonetic category formation. J. Acoust. Soc. Am. 83, 729–
740.
Flege, J.E., Fletcher, S., McCutcheon, M., Smith, S., 1986. The
physiological specification of American English vowels.
Lang. Speech 29, 361–388.
Flege, J.E., Frieda, E.M., Nozawa, T., 1997. Amount of native-
language (L1) use affects the pronunciation of an L2. J.
Phonetics 25, 169–186.
Flege, J.E., Liu, S., 2001. The effect of experience on adults’
acquisition of a second language. Stud. Second Lang.
Acquis. 23, 527–552.
Flege, J.E., MacKay, I.R.A., Meador, D., 1999a. Native Italian
speakers’ production and perception of English vowels. J.
Acoust. Soc. Am. 106, 2973–2987.
Flege, J.E., MacKay, I.R.A. Constraints on the perception of
vowels in a second language, submitted.
Flege, J.E., Munro, M.J., MacKay, I.R.A., 1995a. Factors
affecting degree of perceived foreign accent in a second
language. J. Acoust. Soc. Am. 97, 3125–3134.
Flege, J.E., Munro, M.J., MacKay, I.R.A., 1995b. The effect of
age of second language learning on the production of
English consonants. Speech Commun. 16, 1–26.
Flege, J.E., Port, R., 1981. Cross-language phonetic interfer-
ence: Arabic to English. Lang. Speech 24, 125–146.
Flege, J.E., Yeni-Komshian, G.H., Liu, H., 1999b. Age con-
straints on second language acquisition. J. Mem. Lang. 41,
78–104.
Gardner, R.C., Lambert, W.E., 1972. Attitudes and Motivation
in Second-languageLearning.NewburyHouse, Rowley,MA.
Gay, T., 1968. Effect of speaking rate on diphthong formant
movements. J. Acoust. Soc. Am. 44, 1570–1573.
Grenier, G., 1984. Shifts to English as usual language by
Americans of Spanish mother tongue. Social Sci. Quart. 65,
537–550.
Grosjean, F., 1982. Life with Two Languages. Harvard
University Press, Cambridge, MA.
Grosjean, F., 1989. Neurolinguists, beware! The bilingual is not
two monolinguals in one person. Brain Lang. 36, 3–15.
Grosjean, F., 1997. Processing mixed language: issues, findings
and models. In: de Groot, A., Kroll, J. (Eds.), Tutorials in
Bilingualism: Psycholinguistic Perspectives. Lawrence Erl-
baum, Mahwah, NJ, pp. 225–254.
Grosjean, F., 1999. Studying bilinguals: Methodological and
conceptual issues. Bilingualism: Lang. Cognition 1, 117–
130.
Guion, S.G., Flege, J.E., Loftin, J.D., 2000. The effect of L1 use
on pronunciation in Quichua-Spanish bilinguals. J. Phonet-
ics 28, 27–42.
Hall�ee, P., Best, C., Levitt, A., 1999. Phonetic versus phonolog-
ical influences on French listeners’ perception of American
English approximants. J. Phonetics 27, 281–306.
Hazan, V., Barrett, S., 1999. The development of phoneme
categorisation in children aged 6 to 12 years. J. Phonetics
28, 377–396.
Hillenbrand, J., Getty, L., Clark, M., Wheeler, K., 1995.
Acoustic characteristics of American English vowels. J.
Acoust. Soc. Am. 97, 3099–3111.
Jia, G., Aaronson, D., 1999. Age differences in second language
acquisition the dominant language switch and maintainance
hypothesis. In: Greenhill, A., Littlefield, H., Tano, C. (Eds.),
Proceedings of the 23rd Annual Boston University Confer-
ence on Language Development. Cascadilla Press, Somer-
ville, MA, pp. 301–312.
Johnson, C., 2000. Children’s phoneme identification in rever-
beration and noise. J. Speech Lang. Hear. Res. 43, 129–143.
Kluender, K., Lotto, A., Holt, L., Bloedel, S., 1998. Role of
experience for language-specific functional mappings of
vowel sounds. J. Acoust. Soc. Am. 104, 3568–3582.
Lambert, W.E., Rawlings, C., 1969. Bilingual processing of
mixed-language associative networks. J. Verbal Learning
Verb. Behav. 8, 604–609.
Lee, S., Potamianos, A., Narayanan, S., 1999. Acoustics of
children’s speech: developmental changes of temporal and
spectral parameters. J. Acoust. Soc. Am. 105, 1455–1468.
Lindblom, B., 1998. Systemic constraints and adaptive change
in the formation of sound structures. In: Hurford, J.,
Stuttert-Kennedy, M., Knight, C. (Eds.), Approaches to the
Evolution of Language: Social and Cognitive Bases. Cam-
bridge University Press, Cambridge.
Mack, M., 1989. Consonant and vowel perception and
production: early English–French bilinguals and English
monolinguals. Percep. Psychophys. 46, 187–200.
Mack, M., 1990. Phonetic transfer in a French–English
bilingual child. In: Nelde, P.H. (Ed.), Language Attitudes
and Language Conflict. D€uummler, Bonn, Germany.
Mack, M., 2003. The phonetic systems of bilinguals. In: Banich,
M.T., Mack, M. (Eds.), Mind, Brain, and Language:
Multidisciplinary Perspectives. Lawrence Erlbaum Press,
Mahwah, NJ, in press.
Mack, M., Bott, S., Boronat, C., 1995. Mother, I’d rather do it
myself, maybe: an analysis of voice-onset time produced by
early French–English bilinguals. Issues Develop. English
Appl. Ling. 8, 23–55.
MacKay, I.R.A, Meador, D., Flege, J.E., 2001. The identifica-
tion of English consonants by native speakers of Italian.
Phonetica 58, 103–125.
MacKay, I.R.A., Flege, J.E., Piske, T., Schirru, C., 2001.
Category restructuring during second-language (L2) speech
acquisition. J. Acoust. Soc. Am. 110, 516–528.
Mayo, L., Florentine, M., Buus, S., 1997. Age of second-
language acquisition and perception of speech in noise. J.
Speech Hear. Res. 40, 686–693.
490 J.E. Flege et al. / Speech Communication 40 (2003) 467–491
Meador, D., Flege, J.E., MacKay, I.R.A., 2000. Factors
affecting the recognition of words in a second language.
Bilingualism: Lang. Cognition 3, 55–67.
Munro, M., 1993. Productions of English vowels by native
speakers of Arabic: acoustic measurements and accented-
ness ratings. Lang. Speech 36, 39–66.
Munro, M.J., Flege, J.E., MacKay, I.R.A., 1996. The effects of
age of second-language learning on the production of
English vowels. Appl. Psycholing. 17, 313–334.
Nearey, T., 1989. Static, dynamic, and relational properties in
vowel perception. J. Acoust. Soc. Am. 85, 2088–2113.
Paradis, M., 1978. The stratification of bilingualism. In:
Paradis, M. (Ed.), Aspects of Bilingualism. Hornbeam
Press, Columbia, SC, pp. 165–176.
Parnell, M., Amerman, J., 1978. Maturational influences on the
perception of coarticulatory effects. J. Speech Hear. Res. 21,
682–701.
Patkowski, M., 1989. Age and accent in a second language: a
reply to James Emil Flege. Appl. Ling. 11, 73–89.
Peterson, G., Barney, H., 1952. Control methods used in a
study of the vowels. J. Acoust. Soc. Am. 24, 175–184.
Piske, T., Flege, J.E., MacKay, I.R.A., Meador, D., 2002. The
production of English vowels by fluent early and late
Italian–English bilinguals. Phonetica 59, 49–71.
Piske, T., MacKay, I.R.A., Flege, J.E., 2001. Factors affecting
degree of foreign accent in an L2: a review. J. Phonetics 29,
191–215.
Sancier, M., Fowler, C., 1997. Gestural drift in a bilingual
speaker of Brazilian Portuguese and English. J. Phonetics
25, 421–437.
Scovel, T., 1988. A Time to Speak. A Psycholinguistic Inquiry
into the Critical Period for Human Speech. Newbury House
Publishers, Cambridge, MA.
Sebasti�aan-Gall�ees, N., Soto-Faraco, S., 1999. On-line processing
of native and non-native phonemic contrasts in early
bilinguals. Cognition 72, 111–123.
Stevens, G., 1999. Age at immigration and second language
proficiency among foreign-born adults. Lang. Soc. 28, 555–
578.
Strange, W., 1989. Dynamic specification of coarticulated
vowels in sentence contexts. J. Acoust. Soc. Am. 85, 2135–
2153.
Strange, W., Bohn, O.-S., 1998. Dynamic specification of
coarticulated German vowels: perceptual and acoustical
studies. J. Acoust. Soc. Am. 104, 488–504.
Syrdal, A., Gopal, H., 1986. A perceptual model of vowel
recognition based on the auditory representation of Amer-
ican English vowels. J. Acoust. Soc. Am. 79, 1086–1100.
Walley, A.C., Flege, J.E., 2000. Effects of lexical status on
children’s and adults’ perception of native and non-native
vowels. J. Phonetics 27, 307–332.
Yamada, R., 1995. Age and acquisition of second language
speech sounds: perception of American English / / and /l/ by
native speakers of Japanese. In: Strange, W. (Ed.), Speech
Perception and Linguistic Experience, Issues in Cross-
language Research. York Press, Timonium, MD, pp. 305–
320.
Yeni-Komshian, G.H., Flege, J.E., Liu, S., 2000. Pronunciation
proficiency in the first and second languages of Korean–
English bilinguals. Bilingualism: Lang. Cognition 3, 131–150.
J.E. Flege et al. / Speech Communication 40 (2003) 467–491 491
Copyright © 2022 FDOKUMEN


![Phonetic detail in assimilation: Problems in Germanic phonology [1972]](https://static.fdokumen.com/doc/165x107/631db0714265d1c0f107156f/phonetic-detail-in-assimilation-problems-in-germanic-phonology-1972.jpg)