Five-factor personality traits and trajectories of glycaemic ...
341
Sweet Disposition: Five-factor personality traits and trajectories of glycaemic control, self-care, negative affect and coping in Australian youth with type I diabetes Daniel Waller B.Psychology (Hons) A thesis submitted in fulfilment of the requirements for the degree of Doctor of Philosophy School of Education University of Western Sydney January 2013
-
Upload
khangminh22 -
Category
Documents
-
view
0 -
download
0
Transcript of Five-factor personality traits and trajectories of glycaemic ...

Sweet Disposition: Five-factor personality
traits and trajectories of glycaemic control,
self-care, negative affect and coping in
Australian youth with type I diabetes
Daniel Waller
B.Psychology (Hons)
A thesis submitted in fulfilment of the requirements for
the degree of Doctor of Philosophy
School of Education
University of Western Sydney
January 2013

Acknowledgements
Completing my doctoral thesis has been one of the most challenging
experiences of my life. Achieving this goal would have been impossible
without the following people who have my heartfelt thanks.
I’d like to thank my supervisors Associate Professor Christine Johnston, Dr
Lorraine Smith and Associate Professor Jane Overland for their guidance
and unerring support. Thanks Chris for your encouragement, good humour
and countless free coffees. Thanks Lorraine for your calm reassurance,
organisation and willingness to drop everything for your students. Thanks
Jane for your dedication, constructive feedback and astute
recommendations.
I’d also like to thank the rest of the team from the Diabetes Research into
Adolescent Transitions (DRAT) project. Thanks to Lin Singh who worked
tirelessly to organise us and keep the project moving forward. Thanks to my
fellow PhD student Kristy Hatherly for her welcoming manner and support.
Special thanks both to Lynda Molyneaux and Dr Alex Yeung (the statistics
gurus) for their help with data analysis. Thanks to the administrative staff at
the University of Western Sydney who provided fantastic advice. Thanks to
the Australian Research Council, Novo Nordisk and the Royal Prince Alfred
Diabetes Centre for funding the DRAT project and thanks to the participating
pharmacies and hospitals for help with recruitment of participants. My
gratitude is also to Dr Steve Provost and the psychology staff at Southern
Cross University who provided much support in my final year of research. A
great big thank you to the unbelievably hospitable participants of the DRAT
study without whom this research would be impossible.
Most of all, I would like to thank my family and my gorgeous girlfriend Amy
Armour (I love you!) for their patience and support over the years. The faith
you have in me has been inspiring and I could not have finished this thesis
without you.

Declaration Certificate
I hereby certify that the work embodied in this thesis is the result of original
research and has not been submitted for a higher degree at any other
University or Institution.
Signed……………………………………..…..
Dated……………………………………..……

Publications and Presentations
The research presented in this thesis has been published and presented as
follows:
Peer-reviewed journal articles
Waller, D., Johnston, C., Molyneaux, L., Brown-Singh, L., Hatherly, K.,
Smith, L., & Overland, J. (2013). “Glycaemic control and blood glucose
monitoring over time in a sample of young Australians with type 1
diabetes: the role of personality.” Diabetes Care, In Press.
Hatherly, K., Smith, L., Overland, J., Johnston, C., Brown-Singh, L., Waller,
D., and Taylor, S. (2011). “Glycaemic control and type 1 diabetes:
the differential impact of model of care and income”. Diabetes. 12(2)
115-9. doi: 10.1111/j.1399-5448.2010.00670.x.
Conference presentations
Hatherly, K., Smith, L., Overland, J., Johnston, C., Brown-Singh, L., Waller,
D. and Taylor, S. (2010). “Implementation of Australian Paediatric
Endocrine Group (APEG) clinical management guidelines: A major
shortfall identified”. Australian Diabetes Society and Australian
Diabetes Educators Association Annual Scientific Meeting. (Sydney,
September 2010).
Waller, D., Johnston, C., Smith, L. & Overland, J. (2009) “Big Five
Personality Traits and Self-Management of Type 1 Diabetes in
Adolescence”. 8th Australasian Conference on Personality & Individual
Differences. (University of Sydney, Australia, 25th November, 2009).
Waller, D. (2009) “Personality and Type I Diabetes”. College of Arts
Conference. (University of Western Sydney, 11 October, 2009).

Waller, D. (2009) “Metabolic Control in Adolescents with Type I Diabetes: An
Argument for the Role of Personality”. 23rd Annual Congress of the
European Health Psychologists Society. (Palazzo Dei Congressi, Pisa,
Italy, 25th September, 2009).
Hatherly, K., Smith, L., Overland, J., Johnston, C., Brown-Singh, L., Waller,
D., and Taylor, S. (2009). “Exploring the role of healthcare in the lives
children and adolescents with Type 1 diabetes”. Faculty of Pharmacy
seminar series. (University of Sydney, September 2009).
Waller, D. (2008). “Personality and Type 1 Diabetes”. College of Arts and
Education. (University of Western Sydney, October 2008).
Hatherly, K., Smith, L., Overland, J., Johnston, C., Brown-Singh, L., Waller,
D., and Taylor, S. (2008). “The role of diabetes teams in the care of
children and adolescents with Type 1 diabetes”. Australian Disease
Management Association 4th Annual National Disease Management
Conference. (Sydney, September 2008).
Hatherly, K., Smith, L., Overland, J., Johnston, C., Brown-Singh, L., Waller,
D., and Taylor, S. (2008). “Children and Adolescents with Type 1
diabetes: an Australian experience”. Postgraduate Seminar Series,
Faculty of Pharmacy. (University of Sydney, June 2008).

i
Table of Contents
List of Tables ................................................................................................ v
List of Figures ........................................................................................... viii
List of Abbreviations ................................................................................... x
Abstract ....................................................................................................... xi
Chapter 1 Introduction ................................................................................ 1
Type I diabetes .................................................................................................. 2
The Diabetes Control and Complications Trial ............................................... 4
Self-management of type I diabetes ................................................................ 6
Determining quality of diabetes self-management ......................................... 6
Self-management of type I diabetes in youth .................................................. 8
Factors influencing self-management of type I diabetes in youth ................. 9
Personality and self-management of type I diabetes .................................... 11
Chapter 2 Why Study Personality? .......................................................... 13
The five-factor model: The unique strengths of structure
and permanence .............................................................................................. 15
The five-factor model of personality .............................................................. 16
Employing the five-factor model as an organisational framework .................. 20
Employing the five-factor model as a longitudinal predictor........................... 25
Theoretical and research perspectives on personality-health interactions 29
The Health–Behaviour Model ....................................................................... 30
The Stress Model ......................................................................................... 33
The Adaptation to Illness Model .................................................................... 34
The value of personality research: Identification and intervention ............. 37
Summary .......................................................................................................... 42
Chapter 3 Five-factor Personality Traits and Management of Diabetes 43
Personality traits and self-management of type I diabetes .......................... 45
Conscientiousness........................................................................................ 45
Emotional regulation ..................................................................................... 49
Agreeableness .............................................................................................. 55
Extraversion.................................................................................................. 59
Openness to experience ............................................................................... 60

ii
New directions for research ........................................................................... 62
Proposing methodological and theoretical explanations for research findings .......................................................................................... 62
Promoting a comprehensive view of diabetes self-management ................... 65
Examining the role of personality in self-management outcomes over time .. 66
Aim, research questions and hypotheses ..................................................... 67
Research Question 1: ................................................................................... 67
Research Question 2: ................................................................................... 67
Research Question 3: ................................................................................... 67
Hypotheses .................................................................................................. 68
Chapter 4 Design and Methodology ......................................................... 70
The DRAT project design................................................................................ 71
Recruitment of participants ............................................................................ 72
The personality study design ......................................................................... 74
Measures ......................................................................................................... 75
Demographic information .............................................................................. 75
Diabetes treatment and level of responsibility for care .................................. 76
Personality .................................................................................................... 76
Self-care behaviours ..................................................................................... 78
Glycaemic control ......................................................................................... 79
Incidence of hyperglycaemic emergency and hypoglycaemia ....................... 79
Depression, anxiety and stress ..................................................................... 79
Coping .......................................................................................................... 83
Procedures ...................................................................................................... 84
Annual visits ................................................................................................. 85
Quarterly phone calls .................................................................................... 86
Collection of personality (FFPI-C) data ......................................................... 87
Procedures to maximise retention ................................................................. 88
Ethical approval and conduct ........................................................................ 88
Chapter 5 Statistical Procedures .............................................................. 90
Data screening ................................................................................................ 91
Identification of missing data ......................................................................... 91
Reliability analysis ........................................................................................ 92
Exploratory factor analysis of CODI avoidance scale .................................... 94
Univariate analyses ...................................................................................... 94
Data transformation attempts ........................................................................ 96

iii
Description of the sample and preliminary analyses ................................... 97
Inclusion and exclusion of variables from personality analyses ..................... 99
Answering research questions .................................................................... 100
Bivariate analyses ...................................................................................... 101
Longitudinal analyses of personality traits and self-management trajectories ...................................................................... 104
Chapter 6 Sample Characteristics and Preliminary Analyses ............ 106
Description of the sample ............................................................................. 107
Age and duration of diabetes ...................................................................... 107
Treatment Modality ..................................................................................... 110
Ethnicity ...................................................................................................... 111
Geographical location ................................................................................. 111
Household annual income .......................................................................... 112
Responsibility for diabetes care .................................................................. 112
Personality ..................................................................................................... 115
Self-management outcomes ......................................................................... 119
Glycaemic control ....................................................................................... 120
Blood glucose monitoring............................................................................ 121
Adherence to prescribed insulin .................................................................. 123
Utilisation of health-care ............................................................................. 124
Hospitalisations and hypoglycaemia ........................................................... 125
Coping ........................................................................................................ 126
Depression ................................................................................................. 128
Anxiety........................................................................................................ 130
Stress ......................................................................................................... 133
Summary of preliminary results ................................................................... 136
Inclusion of variables in further analyses .................................................... 139
Chapter 7 Results .................................................................................... 141
Research Question 1 ..................................................................................... 141
Five-factor model traits and HbA1c values ................................................... 141
Five-factor model traits and frequency of blood glucose testing .................. 145
Five-factor model traits and hypoglycaemia ................................................ 146
Five-factor model traits and depression ...................................................... 146
Five-factor model traits and anxiety ............................................................ 148
Five-factor model traits and stress .............................................................. 149
Five-factor model traits and acceptance coping .......................................... 150

iv
Five-factor model traits and avoidance coping ............................................ 150
Summary of bivariate analyses ................................................................... 151
Research Question 2 ..................................................................................... 152
Determining independent trait predictors of HbA1c scores ........................... 152
Determining independent trait predictors of blood glucose testing .............. 155
Determining independent trait predictors of hypoglycaemia ........................ 157
Determining independent trait predictors of depression scores ................... 158
Determining independent trait predictors of anxiety scores ......................... 160
Determining independent trait predictors of stress scores ........................... 162
Determining independent trait predictors of acceptance coping .................. 163
Determining independent trait predictors of avoidance coping .................... 165
Summary of regression analyses ................................................................ 166
Research Question 3 ..................................................................................... 168
Conscientiousness and HbA1c trajectories .................................................. 168
Agreeableness and HbA1c trajectories ........................................................ 170
Emotional regulation and HbA1c trajectories ................................................ 172
Conscientiousness and blood glucose testing trajectories .......................... 174
Emotional regulation and depression trajectories ........................................ 176
Emotional regulation and anxiety trajectories .............................................. 177
Emotional regulation and stress trajectories ............................................... 179
Emotional regulation and avoidance coping trajectories ............................. 180
Agreeableness and avoidance coping trajectories ...................................... 182
Openness to experience and acceptance coping trajectories ..................... 183
Summary of longitudinal analyses .............................................................. 185
Chapter 8 Conclusions and Future Directions ...................................... 187
Study strengths ............................................................................................. 187
Summary of key findings .............................................................................. 189
Limitations ..................................................................................................... 199
Avenues for intervention .............................................................................. 202
References................................................................................................ 205
List of Appendices ................................................................................... 231

v
List of Tables
Table 4.1: Raw scores for DASS and related Z scores and percentile ranks ............................................................................. 82
Table 4.2: Psychometric properties of CODI subscales ............................... 84
Table 5.1: Cronbach’s alphas for measurement scales ............................... 93
Table 5.2: Descriptives for first year variables ............................................. 96
Table 5.3: Control and outcome measures included in personality analyses ...................................................................... 100
Table: 6.1: Baseline characteristics for personality study and DRAT project .............................................................................. 107
Table 6.2: Depression scores for newly diagnosed participants ................ 109
Table 6.3: Acceptance coping stratified by gender .................................... 110
Table 6.4: Mean-levels of responsibility over three years .......................... 113
Table 6.5: Relationships between demographics and self-management ... 115
Table 6.6: Test-retest correlations for FFPI-C traits over three years ........ 116
Table 6.7: Gender differences in openness to experience ......................... 117
Table 6.8: Gender differences in emotional regulation ............................... 118
Table 6.9: Relationships between demographics and personality ............. 119
Table 6.10: Diabetes outcomes at baseline ............................................... 119
Table 6.11: Pearson’s test-retest correlations for HbA1c over three years ................................................................... 120
Table 6.12: Spearman’s test-retest correlations for BGL tests over three years ................................................................................................. 122
Table 6.13: Adherence to prescribed insulin over three years ................... 123
Table 6.14: Diabetes appointments over three years ................................. 125
Table 6.15: Hospitalisations and hypoglycaemia over three year .............. 125
Table 6.16: Spearman’s test-retest correlations for hypoglycaemia frequency .................................................................. 126
Table 6.17: Mean-levels of coping over three years .................................. 127

vi
Table 6.18: Spearman’s test-retest correlations for coping over three years ..................................................................... 127
Table 6.19: Mean-levels of depression over three years ........................... 128
Table 6.20: Mean-levels of depression for participants outside normal range at baseline....................................................... 130
Table 6.21: Mean-levels of anxiety over three years .................................. 130
Table 6.22: Mean anxiety scores for individuals with anxiety outside of the normal range ..................................................................................... 132
Table 6.23: Mean-levels of anxiety for participants outside normal range at baseline ............................................................................................. 133
Table 6.24: Mean-levels of stress over three years ................................... 134
Table 6.25: Mean-levels of stress for participants outside normal range at baseline ............................................................................................. 135
Table 6.26: Control, predictor and outcome measures .............................. 139
Table 7.1: Correlations between five-factor model traits and HbA1c ............... 142
Table 7.2: Correlations between five-factor model traits and blood glucose testing ................................................................................................ 145
Table 7.3: Correlations between five-factor model traits and hypoglycaemia ............................................................................ 146
Table 7.4: Correlations between five-factor model traits and depression .................................................................................. 147
Table 7.5: Correlations between five-factor model traits and anxiety ........ 148
Table 7.6: Correlations between five-factor model traits and stress........... 149
Table 7.7: Correlations between five-factor model traits and acceptance .. 150
Table 7.8: Correlations between five-factor model traits and avoidance .... 151
Table 7.9: Forced-entry multiple regressions of HbA1c scores ................... 154
Table 7.10: Forced-entry multiple regressions of blood glucose testing .... 156
Table 7.11: Forced-entry multiple regressions of hypoglycaemia .............. 158
Table 7.12: Forced-entry multiple regressions of depression scores ......... 159
Table 7.13: Forced-entry multiple regressions of anxiety scores ............... 161

vii
Table 7.14: Forced-entry multiple regressions of stress scores ................. 162
Table 7.15: Forced-entry multiple regressions of acceptance coping ........ 164
Table 7.16: Forced-entry multiple regressions of avoidance coping .......... 166
Table 7.17: Summary of regression analyses ............................................ 167
Table 7.18: Longitudinal analyses of personality and self-management .... 167
Table 7.19: Mean HbA1c levels for baseline conscientiousness groups ..... 168
Table 7.20: Mean HbA1c levels for baseline agreeableness groups ........... 171
Table 7.21: Mean HbA1c levels for baseline emotional regulation groups .. 173
Table 7.22: Mean number of blood glucose tests per fortnight for baseline conscientiousness groups .............................................. 175
Table 7.23: Mean depression scores for upper and lower baseline tertiles of emotional regulation ...................................................................... 176
Table 7.24: Mean anxiety scores for upper and lower baseline tertiles of emotional regulation ...................................................................... 178
Table 7.25: Mean stress scores for upper and lower baseline tertiles of emotional regulation ...................................................................... 179
Table 7.26: Mean avoidance coping scores for upper and lower baseline tertiles of emotional regulation ........................................................... 181
Table 7.27: Mean stress scores for upper and lower baseline tertiles of agreeableness ................................................................................... 182
Table 7.28: Mean acceptance coping for upper and lower baseline tertiles of openness .................................................... 184

viii
List of Figures
Figure 4.1: Geographical distribution of DRAT study participants at baseline ..................................................................................... 73
Figure 4.2: Procedures for the current personality study ............................ 85
Figure 5.1: Statistical procedures ................................................................ 90
Figure 5.2: Procedures for preliminary analyses ......................................... 98
Figure 5.3: Procedure for statistical analysis of personality data .............. 101
Figure 5.4: Procedure for regression analyses ......................................... 104
Figure 5.5: Procedure for longitudinal analyses ........................................ 105
Figure 6.1: Rates of depression outside of the normal range ................... 129
Figure 6.2: Rates of anxiety outside the normal range .............................. 131
Figure 6.3: Rates of stress outside the normal range ............................... 134
Figures 7.1 to 7.3: Scatterplots of emotional regulation and HbA1c ................ 143
Figure 7.4: HbA1c values for baseline tertile groups of conscientiousness over three years ............................................. 170
Figure 7.5: HbA1c values for baseline tertile groups of agreeableness over three years .................................................. 172
Figure 7.6: HbA1c values for baseline quintile groups of emotional regulation over three years .......................................... 174
Figure 7.7: Mean number of blood glucose tests per fortnight for baseline tertile groups of conscientiousness over three years ................... 175
Figure 7.8: Mean depression scores for baseline tertile groups of emotional regulation over three years ...................................... 177
Figure 7.9: Mean anxiety scores for baseline tertile groups of emotional regulation over three years ...................................... 178
Figure 7.10: Mean stress scores for baseline tertile groups of emotional regulation over three years ...................................... 180
Figure 7.11: Mean avoidance coping for baseline tertile groups of emotional regulation over three years ...................................... 181
Figure 7.12: Mean avoidance coping scores for baseline tertile groups of agreeableness over three years ............................................... 183

ix
Figure 7.13: Mean acceptance coping scores for baseline tertile groups of openness to experience over three years ................................ 184

x
List of Abbreviations
ACT Australian Capital Territory
BGLT Blood Glucose Level Testing
CODI Coping with a Disease Inventory
DASS Depression, Anxiety, Stress Scales
DCCT Diabetes Control and Complications Trial
DRAT Diabetes Research into Adolescent Transitions
FFPI-C Five Factor Personality Inventory – Children
HbA1c Glycosylated haemoglobin
IQR Inter-quartile range
NSW New South Wales
SD Standard deviation

Abstract
Type I diabetes is a chronic endocrine disease which can significantly impact
upon the life of a young person. Poor glycaemic control can lead to grave
and irreversible complications and the prevalence of depression, anxiety and
stress in this cohort is high. Despite therapeutic advances, there is much
variability in youths’ responses to treatment programs and many struggle to
cope effectively with their condition.
Whilst prior research suggests that five-factor model personality traits
influence a young person’s self-management of diabetes, longitudinal
findings have not been reported and the role of personality in determining
psychological wellbeing in this population is unclear. This is unfortunate as
personality research could help health-care professionals to identify
individuals at risk for poor outcomes and allow them to intervene early.
The aim of the current investigation was to elucidate the role of five-factor
model personality traits in longitudinal trajectories of glycaemic control, self-
care and psychological wellbeing in youth with type I diabetes. A total of 104
Australian children and adolescents (aged 8-19 years at baseline) from the
Diabetes Research into Adolescent Transitions (DRAT) project participated in
this study.
Participants completed the Five-Factor Personality Inventory for Children
(FFPI-C), the Depression, Anxiety, Stress Scales (DASS 21) and the Coping
with a Disease questionnaire (CODI) annually over three years. Participants
also reported annual demographic, self-care and treatment information and
provided a yearly capillary blood sample to determine quality of glycaemic
control.
Bivariate analyses and multiple regressions were employed to identify five-
factor model traits that predicted self-management outcomes independent of

Abstract
xii
controls. Next, groups were created using baseline scores of personality
traits and mixed-design and repeated-measures analyses of variance were
employed to assess the role of personality in trajectories of self-management
outcomes.
Results demonstrated that five-factor model personality traits are associated
with several critical aspects of self-management. Furthermore, these
relationships often persist or have a cumulative effect over time. Low levels
of conscientiousness were associated with less frequent blood glucose
testing and deterioration of glycaemic control over the course of the three-
year study. Similarly, low agreeableness was associated with worsening
glycaemic control and was also associated with greater avoidance coping.
Low levels of emotional regulation were related to higher ratings of
depression, anxiety and stress and greater avoidance coping. Interestingly,
emotional regulation showed a curvilinear relationship with glycaemic control.
Those moderate in emotional regulation had superior glycaemic control over
time. Finally, high levels of openness to experience were related to increases
in acceptance of diabetes over the time.
Overall, these findings suggest that personality plays a crucial role in a young
person’s self-management of type I diabetes over time. This underlines the
need for clinicians to consider patient personality when formulating treatment
plans. Further research is needed to uncover variables that mediate
associations between the personality and self-management outcomes
measured here.

Chapter 1
Introduction
Type I diabetes is a chronic endocrine disease that requires steadfast
dedication to self-management practices on a constant and continual basis.
Despite therapeutic advances, there is still variability in people’s responses to
treatment programs and many individuals struggle to maintain optimal control
of their disease, particularly children and adolescents (Dabadghao, Vidmar, &
Cameron, 2001; Holl et al., 2003; Svensson, Eriksson, & Dahlquist, 2004;
Vollrath, Landolt, Gnehm, Laimbacher, & Sennhauser, 2007).
Whilst much research has focused on the role of physiological factors in the
management of young people’s diabetes (Buczkowska, Jarosz-Chobot, &
Machnica, 2009; Mortensen et al., 2010; Skowera et al., 2008), there is a
growing body of evidence that demonstrates psychosocial investigations can
also provide significant insights (Grey, Davidson, Boland, & Tamborlane,
2001; E. Harkness et al., 2010; La Greca, Swales, Klemp, Madigan, & Skyler,
1995; Peyrot & Rubin, 2007). Such knowledge is essential as it can be
utilised to identify personal factors that may predict critical outcomes for
those with this disease.
One personal factor shown to be important to a young person’s management
of their diabetes is their personality (Skinner, Hampson, & Fife-Schaw, 2002;
Vollrath et al., 2007). This suggests that clinicians need to consider patient
personality when making treatment recommendations and formulating
management plans involving youth. Therefore, it is critical that we have a
broad and accurate body of personality research to guide these clinical
decisions.

Chapter 1: Introduction
2
Unfortunately, there has been little research investigating relationships
between personality and youths’ self-management of diabetes (Vollrath et al.,
2007). Whilst existing studies are laudable (Skinner et al., 2002; Vollrath et
al., 2007), longitudinal findings have not been reported and this makes it
difficult to predict how a young person’s personality may influence their
management of diabetes over time. Furthermore, there has been no research
investigating whether personality is associated with important psychological
outcomes such as negative affect or coping in youth with diabetes.
Consequently, a comprehensive understanding of the role of personality in
young people’s management of diabetes is yet to be achieved.
The current research thesis presents an investigation into the role of
personality in trajectories of type I diabetes self-management in Australian
youth. Accordingly, this chapter introduces the main issues surrounding
management of diabetes within this cohort. The purpose of this discussion is
to articulate the nature of diabetes self-management and its implications and
to provide a platform for discussing the role of personality in health. Particular
focus is given to the devastating complications caused by poor glycaemic
control and the high levels of psychological morbidity in young people with
diabetes.
Type I diabetes
Type I diabetes is caused by an autoimmune response which occurs when a
person with a genetic predisposition for this disease is exposed to some
environmental trigger, such as infection (Hanas, 1998). This leads to the
cellular mediated destruction of pancreatic islet beta cells, which produce
insulin; a hormone used for proper cell function. Insulin transports glucose
from the blood stream into the cells of the body, and without this hormone,
blood glucose levels continually rise (leading to hyperglycaemia) whilst the
cells of the body become starved of energy (Hanas, 1998). Medical
intervention becomes essential with individuals requiring lifelong injections of
exogenous insulin for their survival.

Chapter 1: Introduction
3
Whilst prevalence data for type I diabetes are still unavailable in many
countries (Soltesz, Patterson, & Dahlquist, 2007), epidemiological research
shows that it is one of the most common non-communicable diseases in
North America, the United Kingdom and Australia (S. Wild, Roglic, Green,
Sicree, & King, 2004). In Australia, around 91,000 people (almost 0.5% of the
population) have been diagnosed with this disease, and an estimated 13,700
of these individuals are under the age of 25 (Australian Bureau of Statistics,
2006a; Australian Institute of Health and Welfare, 2008).
Incidence rates for childhood-onset type I diabetes have increased in
Australia over the past fifteen years at a rate of about 3% per year
(Catanzariti, Faulks, & Waters, 2007; Craig, Howard, Silink, & Chan, 2000;
Haynes, Bower, Bulsara, Jones, & Davis, 2004; Taplin et al., 2005) and this
appears to be a worldwide trend, with international registries reporting
significant increases in the incidence of type I diabetes; especially in young
people (Soltesz et al., 2007). In fact, the Australian Institute of Health and
Welfare (2002) argues that type I diabetes is one of the fastest growing
chronic conditions in youth today.
Research into the rising incidence of type I diabetes suggests that many
individuals who develop this disease may not have acquired it (or at least as
early) in prior generations (Fourlanos et al., 2008; Soltesz et al., 2007).
Evidence suggests that increased incidence rates are explained by a growing
preponderance of environmental risk factors, with individuals with lower
genetic risk now more likely to develop the disease early (Fourlanos et al.,
2008). This research warns health professionals to expect more cases of
type I diabetes in the future: a concerning prospect due to the significant
personal and economic costs of this disease.
Type I diabetes can cause devastating long-term microvascular,
macrovascular and neurological complications (The Diabetes Control and
Complications Trial Research Group, 1993) leading to significant personal
disability and reductions in quality of life (Overland, 2004; Rose, Hildebrandt,

Chapter 1: Introduction
4
Fliege, Klapp, & Schirop, 2002). Since the introduction of synthesised insulin,
diabetic complications have been the chief cause of mortalities attributed to
type I diabetes (The Diabetes Control and Complications Trial Research
Group, 1993). In comparison to their non-diabetic counterparts, individuals
with diabetes are twice as likely to develop cardiovascular disease, are three
times more likely to have a stroke and are fifteen times more likely to require
a lower-limb amputation (Australian Institute of Health and Welfare, 2008).
Diabetes is the main cause of new cases of blindness among adults 20 to 74
years old (Aylward, 2005; Fong, Aiello, Ferris, & Klein, 2004) and is one of
the leading causes of kidney failure (McDonald, Chang, & Excell, 2007).
Diabetic complications also create a substantial economic toll. The DiabCost
report (Australian Diabetes Society, 2002) listed the average annual hospital
cost of an individual with diabetes without complications as $4,025 (AUD),
whilst the average annual hospital cost of a patient with diabetes with both
macrovascular and microvascular complications is recorded as $9,645 (AUD)
(Australian Diabetes Society, 2002). These figures highlight the increasing
incidence of type I diabetes as a significant issue for health policy makers
and reinforce the importance of preventing complications.
Research suggests that complications may be prevented by avoiding
persistent hyperglycaemia (The Diabetes Control and Complications Trial
Research Group, 1993). High blood sugar levels damage both large and
small blood vessels in the body, giving rise to a host of related medical
problems. Fortunately, the landmark Diabetes Control and Complications
Trial (DCCT) (1993) has demonstrated that an individual with diabetes can
avoid these complications by effectively self-managing their blood glucose
levels.
The Diabetes Control and Complications Trial
The Diabetes Control and Complications Trial (1993) investigated the impact
of intensive insulin therapy on the development and progression of diabetes

Chapter 1: Introduction
5
complications in a sample of people with type I diabetes aged 13 to 39 at
baseline (baseline n = 1,441). In the DCCT, intensive therapy was designed
to keep blood glucose values as close to the normal range as possible and
was achieved through three or more daily injections of insulin or treatment
with an insulin pump. Daily adjustments in insulin dosages were made
according to self-monitoring of blood glucose (at least four times a day),
dietary intake and anticipated exercise. Patients in intensive therapy had
frequent contact with health professionals to review and adjust treatment
regimens and were given a three monthly goal for blood glucose
concentrations of glycosylated haemoglobin (HbA1c) levels less than 6.05%
(within the normal range). HbA1c serves as a broad index of blood-sugar
levels over the preceding 6-8 weeks and is generally accepted as the best
available measure of glycaemic control (Hanas, 1998; Kilpatrick, 2000). In
contrast to intensive therapy, conventional therapy in the DCCT consisted of
one or two daily injections of insulin, daily monitoring of blood glucose and
education about diet and exercise. Daily adjustments of insulin use were not
usually made for the conventional therapy cohort.
Although participants in the intensive therapy cohort struggled to maintain
HbA1c values within the goal range of 6.05% or less, results demonstrated
that keeping blood glucose averages (HbA1c values) as close to the normal
range as possible reduced the threat of developing long-term complications.
The DCCT (1993) demonstrated that intensive blood glucose control reduced
the risk for eye disease by 76%, kidney disease by 50% and nerve disease
by 60%.
These findings were revolutionary in that for the first time they clearly
established that the complications associated with diabetes could be
prevented or at least delayed by the patient’s engaging in good self-care
behaviour. Based on these results, researchers from the DCCT (1993) called
for a redefinition of therapeutic goals in type I diabetes, with an intensified
focus on self-management of glycaemic levels. In Australia today, youth are
advised to maintain a general target HbA1c range of < 7.5% to avoid

Chapter 1: Introduction
6
complications (National Health and Medical Research Council, 2005; Rewers
et al., 2009).
Self-management of type I diabetes
In response to the Diabetes Control and Complications Trial, modern
treatment approaches have shifted the emphasis of management from the
clinician to the patient. Individuals with diabetes are now expected to take
personal responsibility for the management of their condition (Funnell &
Anderson, 2004). Whilst this move towards self-management represents a
positive step forward in the treatment of type I diabetes, it means that the
personal traits of the patient are now more important than ever, with the
success of treatment chiefly depending on the patient’s maintenance of
adherence and self-care behaviours.
To maintain good glycaemic control people with type I diabetes must adjust
their behaviour on a daily basis, balancing the increases in blood glucose
caused by carbohydrate intake or hormones against the decreases in blood
glucose caused by insulin dose or physical activity (Schneider et al., 2007).
They are required to repeatedly check their blood glucose levels and use this
information to make judicious management decisions (Schneider et al.,
2007). To accomplish this, individuals with diabetes need to actively cope
with the daily demands of their disease and must curb the impact of their
condition on their emotional and social life (Flinders Human Behavioural &
Health Science Unit, 2006). This shows that self-management of type I
diabetes is quite the balancing act involving complex processes of day-to-day
self-regulation. Critically, the extent to which optimal self-management is
achieved is affected by a range of personal characteristics, some
physiological, some behavioural and some psychosocial.
Determining quality of diabetes self-management
Despite the importance of optimal diabetes self-management, there has been
no consensus on a universal definition of this concept within the literature (R.

Chapter 1: Introduction
7
M. Anderson, 1995; Glasgow, 1995; Glasgow & Anderson, 1999; Hearnshaw
& Lindenmeyer, 2006; McNabb, 1997; Schilling, Grey, & Knafl, 2002a,
2002b; Schneider et al., 2007). Researchers have employed a multitude of
different measures to operationalise self-management and this makes it
difficult to identify outcome variables that should be included in future studies.
Historically, many researchers have relied solely on measures of behavioural
adherence to reflect the quality of an individual’s self-management of
diabetes (Ikeda & Tsuruoka, 1994; Rhee et al., 2005; The Diabetes Control
and Complications Trial Research Group, 1993; Zisser, Bailey, & Jovanovic,
2006). This approach to research typically employs popular measures such
as insulin adherence, frequency of blood glucose testing, frequency of
hypoglycaemia and HbA1c to gauge self-management success. Whilst these
outcomes are important and necessary components of self-management, this
approach may disregard the significance of relevant psychological outcomes.
Consequently, many researchers now apply an extended bio-psychosocial
model to conceptualise diabetes self-management (Amer, 1999; Flinders
Human Behavioural & Health Science Unit, 2006; Graue, Wentzel-Larsen,
Bru, Hanestad, & Savik, 2004; Petersen, Schmidt, & Bullinger, 2006; Taylor,
Frier, Gold, & Deary, 2003). This approach emphasises the importance of
psychological and social outcomes in the management of type I diabetes,
arguing that optimal self-management is more than just a function of sound
behaviours relating to blood glucose testing and insulin regimes. Diabetes
researchers are now considering psychological outcomes such as
depression, anxiety, stress and coping alongside measures of behavioural
adherence (Amer, 1999; Ciechanowski, Katon, & Russo, 2000; Coelho,
Amorim, & Prata, 2003; Dantzer, Swendsen, Maurice-Tison, & Salamon,
2003; Delameter, 1992; Grey et al., 2001; Herzer & Hood, 2010; Kramer,
Ledolter, Manos, & Bayless, 2000; Luyckx, Seiffe-Krenke, & Hampson, 2010;
Taylor et al., 2003). This is a constructive development within self-
management research as this approach not only gives a picture of
behavioural management of diabetes but also represents how well an

Chapter 1: Introduction
8
individual has adapted to living with this disease. For the current research
thesis, this model of type I diabetes self-management is employed.
Self-management of type I diabetes in youth
Disturbingly, research demonstrates that youth with type I diabetes struggle
to effectively self-manage their condition (Dabadghao et al., 2001; Holl et al.,
2003; Svensson et al., 2004). HbA1c levels rise steadily throughout
adolescence and research suggests that as many as 50% of young people
with type I diabetes will develop at least one complication by the time they
reach adulthood (Svensson et al., 2004). Despite treatment advances a
significant proportion of youth with diabetes still show unsatisfactory
glycaemic control and the prevalence of microvascular complications in this
group remains high (Holl et al., 2003; Olsen et al., 1999; Svensson et al.,
2004). Indeed, even in the Diabetes Control and Complications Trial (1993),
youths demonstrated significantly worse glycaemic control in the intensive
self-management condition than their adult counterparts suggesting that they
struggled with aspects of this treatment approach.
Furthermore, many youths with type I diabetes report difficulties coping with
the demands of their disease and there is a greater incidence of psychiatric
disorder in this cohort (Blanz, Rensch-Reimann, Fritz-Sigmund, & Schmidt,
1993; Dantzer et al., 2003; Grey, Cameron, Lipman, & Thurber, 1995;
Hanson et al., 1989; Kovacs, Goldston, Obrosky, & Bonar, 1997; Wysocki,
1993). Adolescents with diabetes are at higher risk of having elevated levels
of depression and anxiety in contrast to their non-diabetic peers (Dantzer et
al., 2003; Kanner, Hamrin, & Grey, 2003; Massengale, 2005), and
maladaptive coping styles, stress, anxiety and depression have all been
linked to poor self-care behaviour and glycaemic control (Dantzer et al.,
2003; De Groot, Anderson, Freedland, Clouse, & Lustman, 2001; Graue et
al., 2004; Herzer & Hood, 2010; P. J Lustman et al., 2000). These findings
further highlight the poor prognosis for young people with type I diabetes and
underline the importance of uncovering predictors of negative affect and poor

Chapter 1: Introduction
9
coping in this cohort. These findings further highlight the poor prognosis for
young people with type I diabetes and underline the importance of
uncovering predictors of negative affect and poor coping in this population.
But why do youths struggle? Whilst research suggests that hormonal
fluctuations may play an influential role in glycaemic control (Hanas, 1998)
and even mood states (Buchanan, Eccles, & Becker, 1992) during
adolescence, there is much evidence to suggest that the majority of the
variability in these factors can be attributed to psychosocial factors and the
young person’s management of their disease (Brendgen, Lamrache, Wanner,
& Vitaro, 2010; Holl et al., 2003; Levine et al., 2001; Schneiders, Nicolson, &
Berkhof, 2007; Silverstein et al., 2005; Weissberg-Benchell et al., 1995).
Adolescence is a transitional period for patients with diabetes where they are
expected to take more responsibility for the management of their condition
and begin to gain independence from their parents. Unfortunately, self-
management often falters during this time and this can lead to poor
glycaemic control (Dashiff, McCaleb, & Cull, 2006; Holl et al., 2003;
Jacobson et al., 1990). By distinguishing personal characteristics that predict
self-care behaviours, glycaemic control, negative affect and coping, we may
be able to detect individuals at risk of developing complications and identify
variables on which we could focus to improve self-management.
Factors influencing self-management of type I diabetes in
youth
A number of research studies have shown that demographic, social and
treatment factors impact on diabetes outcomes (Amer, 1999; Anderson,
Auslander, Jung, Miller, & Santiago, 1990; Anderson et al., 2002; Chisholm
et al., 2007; Grey, Whitmore, & Tamborlane, 2002; Hassan, Loar, Anderson,
& Heptulla, 2006; Hepburn, Langan, Deary, Macleod, & Frier, 1994;
Kavanagh, Gooley, & Wilson, 1993; Levine et al., 2001; Pickup, Mattock, &
Kerry, 2002). Often cited predictor variables include age, gender, method of
treatment, time lived with diabetes and the level of responsibility a patient

Chapter 1: Introduction
10
takes for their care (Anderson et al., 1990; Chisholm et al., 2007; Hepburn et
al., 1994). Other predictors of interest have included ethnic background,
household income and geographical location (Ambler, Fairchild, Craig, &
Cameron, 2006).
Research suggests that glycaemic control and self-care behaviours are
typically worst in older adolescents (15 - 20) and those who have had
diabetes for longer periods of time (Dabadghao et al., 2001; Holl et al., 2003;
Svensson et al., 2004). In addition, gender interacts with age so that teenage
girls and boys display increases in average HbA1c at different periods
(Hanas, 1998). These differences are partly due to hormonal fluctuations that
occur during puberty (Hanas, 1998).
Older adolescents (15 - 20) also report higher rates of depression, anxiety
and stress and these reports are most prevalent in females (Amer, 1999;
Dantzer et al., 2003; Eiser, Riazi, Eiser, Hammersley, & Tooke, 2001; Herzer
& Hood, 2010; Kanner et al., 2003; La Greca et al., 1995; Massengale,
2005). Unsurprisingly, anxiety and depression are also prominent in
individuals newly diagnosed with diabetes (Grey et al., 1995; Grey & Kanner,
2000).
Finally, individuals who hail from low-income families, non-European
backgrounds, and/or rural areas are likely to engage in poorer self-
management of type I diabetes (Ambler et al., 2006; Australian Institute of
Health and Welfare, 2005). Sub-optimal glycaemic control and increased
rates of depression and anxiety are common within these groups and this
could be somewhat mediated by access to health-care (Ambler et al., 2006;
Ciechanowski et al., 2000; Hassan et al., 2006; Massengale, 2005; Zgibor et
al., 2000). Youth who use insulin pumps and share the responsibility of
diabetes care with parents are also likely to have better control of their
diabetes (Anderson et al., 2002; Pickup et al., 2002).

Chapter 1: Introduction
11
The reliability of these predictors has differed widely across studies and a
substantial proportion of the variance in specific self-management outcomes
remains unexplained when relying solely on these measures. This indicates
that other predictive variables need to be identified and tested. Any further
factors need to be tested against these variables to determine whether they
explain additional variance in outcomes. One individual factor that has
received relatively little attention is personality.
Personality and self-management of type I diabetes
A young person’s personality may be particularly important in the long-term
self-management of type I diabetes. Indeed, in many respects, the type of
person the patient is determines their self-management of diabetes. An
individual with type I diabetes requires psychological resources and self-
regulatory skills in order to negotiate the complex daily demands of living with
type I diabetes and the success of treatment is significantly dependent on the
patient having the necessary resources to maintain adherence and self-care
behaviours.
Whilst psychosocial variables such as emotions or self-efficacy may fluctuate
over time (Röcke, Li, & Smith, 2009; Thompson, Dorsey, Miller, & Parrot,
2003), personality traits are enduring psychological constructs (Pervin, 2003)
and these may impact upon the behavioural management of diabetes on a
daily basis. In addition, personality is known to influence more narrow
psychological constructs such as coping and affect (Carver & Connor-Smith,
2010; Digman, 1989; Goldberg 1990; McCrae & Costa, 1999) and could thus
provide a framework from which to better understand these phenomena
within the ambit of type I diabetes.
If personality does play a role in the long-term management of young
people’s diabetes it is critical to understand how it does this. By discovering
traits that influence trajectories of self-management, it may be possible to
identify individuals at risk and intervene early. This information could also

Chapter 1: Introduction
12
help to guide the design and implementation of programs aimed at improving
adolescents’ psychological adaptation to diabetes and their glycaemic
control. Given these potential opportunities, further investigation into the role
of personality in the management of youths’ type I diabetes is required.
Hence, the study with which this thesis is concerned arises from a
longitudinal study following a sample of 158 Australian children and
adolescents (aged 8-19 years) with type I diabetes. Of this sample, 104
completed personality data over the three waves of the study. The aim of this
research was to investigate the role of five-factor model personality
dimensions in trajectories of self-management in youth with type I diabetes.
To this aim, a bio-psychosocial approach to health was taken with measures
of psychological well-being (depression, anxiety, stress and coping) and
diabetic management (blood glucose testing and glycaemic control) included
in analyses. This study incorporated a cross-sectional design with annual
quantitative data on glycaemic control, psychosocial, demographic and
treatment variables gathered over three years.

Chapter 2
Why Study Personality?
The study of personality has a firm foothold in the growing fields of
behavioural medicine and health psychology (Smith, 2006) and involves
systematic efforts to understand relationships between an individual’s
consistent patterns of thought, emotion and behaviour and their health.
The increased interest in the role of personality in health is likely due to three
reasons. Firstly, perspectives in health-related fields have moved towards a
bio-psychosocial approach which emphasises the importance of biological,
psychological and social factors in conceptualisations of health (Caltabiano,
Sarafino, Byrne, & Martin, 2002). Secondly, scientific and medical
advancements mean that many of the leading causes of mortality are now
due to modifiable factors such as an individual’s behaviour or lifestyle
(Bermudez, 1999). Finally, a general acceptance of the five-factor model as
the dominant structural paradigm in personality research has re-energised
the field creating an upsurge in personality research in recent years
(Bermudez, 1999; Booth-Kewley & Vickers Jr, 1994; Chua & Job, 2000; De
Raad & Perugini, 2002; Goodwin & Friedman, 2006; Hampson, Goldberg,
Vogt, & Dubanoski, 2006; Raynor & Levine, 2009).
Together, these developments appear to have moved researchers and
theorists to consider personality as a factor that may determine health
outcomes (Contrada, Leventhal, & O'Leary, 1990; Friedman et al., 1993;
Marshall, Wortman, Vickers, Kusulas, & Hervig, 1994; Smith & Williams,
1992; Wiebe & Smith, 1997). Such research is laudable as it may help to
identify individuals at risk for poor health and allow clinicians to intervene
early thus preventing the development of more serious health consequences
Chapter 2: Why Study Personality?
14
(Conrod, Castellanos, & Mackie, 2007; Smith & MacKenzie, 2006). In fact,
the Australian Institute of Health and Welfare (2010) lists health promotion
and disease prevention as national health priorities underlining the
importance and practical utility of predicting medical outcomes from personal
characteristics.
Unfortunately, the burgeoning interest in relationships between personality
traits and health factors that appears evident in today’s psychological
literature (Bermudez, 1999; Booth-Kewley & Vickers Jr, 1994; Bryan &
Stallings, 2002; Byrdon et al., 2010; Chua & Job, 2000) is not reflected in
research involving youth with type I diabetes (Vollrath et al., 2007).
Consequently, there is still much to know about the role of personality in
young people’s self-management of this disease.
But why focus on the influence of personality on self-management
outcomes? What is the rationale for studying personality over the plethora of
competing psychosocial constructs of interest? What theoretical support is
there for a relationship between personality and health? And most
importantly, what do we stand to gain from such investigations? The
following chapter endeavours to provide the reader with answers to these
questions and aims to develop a scientific and logical argument for the need
for personality investigations in research involving youth with type I diabetes.
The first section of this chapter introduces the reader to the five-factor model
of personality and focuses on two distinctive strengths of this framework.
These strengths are the structural organisation and enduring nature of the
five-factor model personality dimensions. Using the literature, it is asserted
that the five-factor model provides a broad and hierarchically structured
reference point from which to understand and integrate health research
involving a diverse range of psychosocial factors. Furthermore, it is argued
that the enduring nature of these personality dimensions allows researchers
to explore longitudinal relationships between personality and significant
health outcomes.

Chapter 2: Why Study Personality?
15
In the second section, relevant theoretical models supporting the role of
personality in health are evaluated. These models are the health-behaviour
model, the stress-health model, and the adaptation to chronic illness model.
Evidence to support these theoretical frameworks is presented and the
pertinence of these models to type I diabetes is underlined. On the basis of
these models, it is asserted that a bio-psychosocial approach is needed
when conceptualising indicators of diabetes self-management. It is
maintained that researchers assessing youth with type I diabetes should
utilise measures of self-care and glycaemic control in conjunction with
measures of psychological wellbeing such as depression, anxiety, stress and
coping.
Finally, in the closing section of this chapter, the success of personality-
based health interventions is reviewed and the applicability of such
interventions to youth with type I diabetes considered. It is contended that
personality research could lead to the development and implementation of
targeted interventions for youth who struggle to self-manage their diabetes.
Based on the reviewed literature, it is concluded that personality
investigations employing the five-factor model may provide enhanced insight
into relationships between psychological variables and health, particularly in
the case of youth with type I diabetes. In undertaking such research, we may
clarify the role of five-factor personality traits in trajectories of self-
management in youth with type I diabetes and this could lead to interventions
aimed at improving long-term psychological wellbeing and glycaemic control
in this cohort.
The five-factor model: The unique strengths of structure and
permanence
Over the past two decades, researchers and theorists have encouraged us
to pay greater attention to the role of personality in health (Contrada et al.,
1990; Friedman et al., 1993; Lahey, 2009; Marshall et al., 1994; Smith &

Chapter 2: Why Study Personality?
16
Williams, 1992; Wiebe & Smith, 1997). Notably, much of the interest in this
area appears to have been motivated by a growing acceptance of the five-
factor model as the preeminent framework for understanding and
researching personality (De Raad & Perugini, 2002; Goldberg, 1993).
Indeed, the five-factor model possesses certain unique strengths not offered
by other personality frameworks or psychosocial variables (Marshall et al.,
1994).
Two distinctive strengths of the five-factor model are the hierarchically
organised structure and enduring nature of the five-factor model dimensions
(Bermudez, 2006; Costa & McCrae, 1992a; Friedman et al., 1993; Marshall
et al., 1994). Research suggests that the five-factor model of personality can
be used as a lasting structural reference for organising and understanding
research and predicting long-term health outcomes (Friedman, Hawley, &
Tucker, 1994; Hampson et al., 2006; Marshall et al., 1994). Hence, the five-
factor model may help investigators to synthesise psychosocial findings in
type I diabetes research and forecast trajectories of self-management. For
these reasons, the five-factor model of personality was employed in the
current study. Accordingly, a description of the model and its unique
strengths is detailed below.
The five-factor model of personality
The five-factor model of personality is a trait model that suggests that
personality can be parsimoniously assessed using five broad and
independent dimensions of personality which are made up of a collection of
more specific traits that correlate (McCrae & Costa, 1999). There has been
increasing consensus on the reliability and validity of these five dimensions
of personality (De Raad & Perugini, 2002; Goldberg, 1993) and this has led
proponents of the model to hail it as the foremost structural paradigm for
conducting personality research (Costa & McCrae, 1992a; Goldberg, 1992;
John & Srivastava, 1999; McCrae & Costa, 1999; Saucier, 2002).
Chapter 2: Why Study Personality?
17
A central tenet of the five-factor model is that personality is somehow
universally structured across individuals and that individual differences result
from dimensional rather than categorical variations in personality (Pervin &
John, 2001). This suggests that differences in personality are due to the
degree to which individual traits are expressed rather than any differences in
general structure. In this way, personality can be conceptualised as
consisting of a finite number of lasting and universally distributed personality
traits. Although trait levels may change over time (Roberts, Walton, &
Viechtbauer, 2006), the structure of personality should remain constant.
Based on this premise, researchers have employed psycho-lexical and factor
analytic approaches to try to extrapolate the underlying structure of
personality (Allport & Odbert, 1936; Cattell, 1943; Fiske, 1949; Tupes &
Christal, 1961). Much of this research has been based on the lexical
hypothesis which posits that the most significant and socially important
personality constructs are encoded in our general lexicon and thus can be
uncovered by examining words we use to describe ourselves and others
(Pervin & John, 2001). If this hypothesis is correct, we should be able to
derive the basic structure of human personality by sampling language for
descriptors of individual differences.
Over the years, many researchers have conducted factor analyses of large
sets of trait adjectives in an attempt to derive a reliable structure for
personality (Cattell, 1947, 1956; Digman & Takemoto-Chock, 1981; Eysenck,
1946; Fiske, 1949; Guilford, 1975; Norman, 1963; Peabody, 1967; Tupes &
Christal, 1961). The majority of these investigators have tended to agree
upon the existence and validity of five orthogonal dimensions within their
data (Digman & Takemoto-Chock, 1981; Fiske, 1949; Norman, 1963; Tupes
& Christal, 1961). The case for a five-factor model of personality has been
further bolstered by research that has found the same five-factor dimensions
in independently gathered item pools (Digman & Inouye, 1986; Goldberg,
1990, 1992) and separately constructed personality tests (Costa & McCrae,
1988; John, 1990; Ostendorf & Angleitner, 1992).

Chapter 2: Why Study Personality?
18
Notably, several five-factor models of personality have been proposed
(Goldberg, 1993) with the most prominent of these being McCrae and
Costa’s five-factor model (McCrae & Costa, 1999) and the big-five model of
personality (Digman, 1989; Goldberg, 1990). Although these frameworks
were developed from independent approaches to studying the underlying
structure of personality, they differ only slightly in regard to the labels and
definitions of the five emergent personality factors. Subsequently, the
personality measures developed from these models show high correlations
and are dimensionally aligned (Goldberg, 1993). Given the equivalence of
these models, the term five-factor model will be exclusively used throughout
this thesis in order to aid presentation.
The five bipolar factors encapsulated by the five-factor model are termed
conscientiousness, emotional regulation (or neuroticism), extraversion,
agreeableness, and openness to experience (Costa & McCrae, 1992c;
McGhee, Ehrler, & Buckhalt, 2007). There is much research attesting to the
replicablility of these personality dimensions in English speaking cultures
(Costa & McCrae, 1992a; Digman, 1989; McCrae & John, 1992; Ostendorf &
Angleitner, 1994; Rolland, 1993). These five factors are described below:
The conscientiousness dimension of the five-factor model refers to an
individual’s tendency to be reliable, perseverant and self-disciplined.
Individuals high in conscientiousness are more likely to delay gratification, be
goal directed, and follow norms and rules whilst individuals low in
conscientiousness are characterised by an inability to control impulses or
stick to plans (Bogg & Roberts, 2004; Costa & McCrae, 1992c).
The emotional regulation dimension of the five-factor model concerns an
individual’s capability to control their emotional responses to their
environment and others. People scoring low on this factor are prone to be
emotionally overactive and may be more vulnerable to stress and negative
emotional states such as anger, sadness, fear or anxiety (Digman, 1990).
Those scoring high on emotional regulation tend to be calm, rational and

Chapter 2: Why Study Personality?
19
resistant to worry or stress (Digman, 1990). The emotional regulation
dimension was originally termed ‘neuroticism’ to reflect an individual’s
proneness to being emotionally overactive, but today the terms ‘emotional
regulation’ or ‘emotional stability’ are preferred to reflect the adaptive nature
of affective control (McGhee et al., 2007). Thus, within this thesis the term
‘emotional regulation’ is used exclusively to avoid any confusion.
The extraversion factor concerns an individual’s propensity towards activity
and social engagement. Individuals high in extraversion are usually
physically active, friendly, assertive and talkative (McGhee et al., 2007).
Those low on this factor are typically quiet, reflective, soft spoken and prefer
solitude.
The agreeableness factor relates to a person’s tendency to cooperate and
get along with others (McGhee et al., 2007). Individuals high on this factor
are compassionate, trusting and altruistic in their interpersonal relationships
and are seen as approachable, friendly and courteous. Those low in
agreeableness may be stubborn, self-centred, opinionated, cynical and rude.
The openness to experience factor refers to one’s tendency to be
intellectually curious and crave new experiences. Individuals high in
openness are creative, curious, insightful and willing to try new things
(McGhee et al., 2007). Individuals who are low in openness are practical,
routine-oriented and may be close-minded when confronted with new
experiences or situations.
There is a large amount of research supporting the existence of the
abovementioned personality dimensions (Costa & McCrae, 1992; Digman,
1989; McCrae & John, 1992; Ostendorf & Angleitner, 1994; Rolland, 1993).
In fact, research demonstrates that the five-factor model of personality is
replicable across age, gender, and to some extent, cultural backgrounds
(Costa & McCrae, 1992a, 1992b; Saucier & Goldberg, 2001). Furthermore,
the five-factor dimensions show good convergent, discriminant and criterion-
related validity (Costa & McCrae, 1992a, 1992b; McGhee et al., 2007;

Chapter 2: Why Study Personality?
20
Saucier & Goldberg, 2001) and can be used to predict significant outcomes
in applied settings (Bogg & Roberts, 2004; Friedman et al., 1993; Hong &
Paunonen, 2009; John & Srivastava, 1999; McCrae & Costa, 1999).
However, this does not mean that the five-factor model is a perfect
representation of personality. Thoughtful critiques of the five-factor model
(Block, 1995, 2001; Eysenck, 1991, 1993; Tellegen, 1993) have highlighted
several issues that investigators need to be mindful of when employing this
personality framework. These are typically related to the development,
theoretical underpinnings, universality and comprehensiveness of the five-
factor model dimensions (Poropat, 2004). Nevertheless, the five-factor
structure appears to be the most reliable and parsimonious structural
representation of personality available (Costa & McCrae, 1992a; Goldberg,
1992; John & Srivastava, 1999; McCrae & Costa, 1999; Poropat, 2004;
Saucier, 2002). Indeed, structural models of personality involving more or
less than five independent factors have not been widely supported by
research results (Saucier, 2002).
Together, these findings (Costa & McCrae, 1992a; Goldberg, 1992; John &
Srivastava, 1999; McCrae & Costa, 1999; Poropat, 2004; Saucier, 2002)
underline the validity, reliability and robustness of the five-factor model of
personality and provide support for the utilisation of the five-factor model in
personality-health research.
Employing the five-factor model as an organisational framework
The beauty of personality research is that it recognises individuals in their
entirety (Pervin & John, 2001). Necessarily, the five-factor model of
personality is a broad and hierarchically-structured psychological framework
which has been argued to encompass a vast number of smaller psychosocial
traits (Costa & McCrae, 1992a).

Chapter 2: Why Study Personality?
21
Given the breadth and hierarchical structure of the five-factor model (Costa &
McCrae, 1992a), it seems reasonable to suppose that this framework may
provide a useful reference from which to base psychological investigations in
health research (Marshall et al., 1994). Indeed, when talking about the role of
psychological factors in the management of diabetes, parents in the current
study appeared more likely to discuss their child’s global personality traits
(such as conscientiousness) rather than specific psychosocial variables as
contributing factors.
This is likely due to the fact that we naturally organise narrow psychosocial
variables into broader traits in order to understand others’ behaviour (Pervin
& John, 2001). In this way, the hierarchical structure provided by the five-
factor model may serve as an organisational framework to better compare,
and synthesise findings from research studies focusing on the role of
psychosocial and personality factors in health. By taking this approach, we
may be able to find common dimensions that influence general health and
the management of type I diabetes.
Unfortunately, there appears to have been little work focused on integrating
health research in this way. Past investigations have studied a plethora of
psychosocial constructs, yet many of these focus on a single or small
number of narrowly defined variables which have unknown relationships to
one another (Marshall et al., 1994; Walsylkiw & Fekken, 2002). Furthermore,
the array of competing psychosocial measures available creates problems
for a researcher trying to gauge convergent and divergent validity hampering
confidence in the generalisability of obtained results (Marshall et al., 1994;
Smith & Williams, 1992). Consequently, researchers are left with isolated
fragments of knowledge, which are difficult to synthesise and interpret.
Regrettably, this then creates difficulties for health practitioners trying to
make informed clinical decisions.
This quandary appears evident in psychosocial research involving youth with
type I diabetes. For instance, investigators have studied the role of a diverse

Chapter 2: Why Study Personality?
22
range of narrow psychosocial constructs in the management of youths’
diabetes including but not limited to; impulsiveness, self-efficacy, optimism
and locus of control (Holmes et al., 2006; Ryden, Nevander, Johnsson,
Westbom, & Sjoblad, 1990; Wright, 1997). However, there appears to have
been little attempt to synthesise this research meaningfully. Consequently,
these results are difficult to interpret meaningfully in any broad sense and
this could have significant implications for the quality of health-care and
interventions in this area.
Whilst research on isolated variables provides valuable and rich information
about the complexity of the experience of chronic disease, the value of this
information is lessened if it cannot be meaningfully integrated into a pool of
knowledge that can be utilised for improving treatment services. Without
some conceptual framework to synthesise the plethora of psychosocial
research in the area of type I diabetes, we cannot bring adequate coherence
to the field.
The utilisation of the five-factor model of personality in health research may
serve to ameliorate this problem (Bermudez, 1999; Marshall et al., 1994).
The five-factor model hails from an empirical approach to the study of
personality and hence there is an abundance of research on the universality,
reliability, convergent validity and lower order structure of these factors
(Costa & McCrae, 1992a, 1992c; Digman, 1989; Digman & Inouye, 1986;
Digman & Takemoto-Chock, 1981). Additionally, many narrow psychological
variables (such as hostility, dutifulness and sociability) can be subsumed and
meaningfully interpreted through this framework (Bermudez, 1999; Costa &
McCrae, 1992a). These findings suggest that the five-factor model may be
used to bring order to prior psychosocial research involving people with type
I diabetes. Undeniably, utilisation of this structural framework affords several
significant advantages for health researchers.
Firstly, the universal structure of the five-factor model allows researchers to
compare discrete traits across individuals, groups and testing occasions

Chapter 2: Why Study Personality?
23
(Costa & McCrae, 1992a; Marshall et al., 1994; McCrae & John, 1992). For
instance, a researcher may compare five-factor model traits of individuals
with good control of type I diabetes against those who have poor control of
diabetes. Alternatively, a researcher could test for differences in the
expression of these traits between individuals with diabetes and the general
population. A researcher could also follow a cohort of individuals with
diabetes over an extended period noting any changes in five-factor model
dimensions that occur over time. These are very different research questions
but the universal structure provided by the five-factor model allows
researchers to test all of them.
Secondly, measures of five-factor model dimensions show good convergent
validity (Costa & McCrae, 1992a; De Raad & Perugini, 2002; Marshall et al.,
1994), which means that researchers can be assured that they are
measuring the same construct across different studies. This means that we
can easily replicate health research employing different five-factor measures
to test the authenticity and reliability of previously uncovered associations.
Replication is an important scientific process as it reduces the likelihood of
type I error (Meltzoff, 2004) and by doing this we can achieve greater
accuracy in personality-health research and reduce the likelihood of invalid
conclusions.
Thirdly, the large amount of research on relationships between five-factor
traits and health variables allows researchers to extrapolate from studies
involving different populations to other populations where little research has
been conducted (Marshall et al., 1994; Van Heck, 1997). For example, we
may be able to understand more about the role of young people’s personality
in type I diabetes by examining the role of five-factor model personality
dimensions in young people’s management of other chronic diseases or the
role of five-factor model dimensions in the management of diabetes in older
populations. In this way, the five-factor model serves as an especially useful
tool for investigators working in fields, such as adolescent type I diabetes
research, where little personality research is available.

Chapter 2: Why Study Personality?
24
Finally, as previously stated, the hierarchical structure of the five-factor
model provides a framework with which to integrate research on narrow
psychological constructs known to play a role in health (Bermudez, 1999;
Costa & McCrae, 1992a; Marshall et al., 1994). The accumulation of
research on the lower order structure of the five-factor model suggests that
many narrow traits can be meaningfully understood through this framework
(Costa & McCrae, 1992a) enabling researchers to organise and streamline
the vast amount of psychosocial research conducted in health domains.
To illustrate, past research has shown that the construct of attention span is
related to quality of type I diabetes management in youth (Rovert & Ehrlich,
1988). Research also suggests that the construct of attention span can be
subsumed by the five-factor dimension of conscientiousness (Costa &
McCrae, 1992c; Pervin, 2003). Together, these findings provide speculative
support for the role of conscientiousness in diabetes outcomes. By using this
information we may begin to build hypotheses about the function of this trait
in the management of this disease. Admittedly, not all psychological
constructs will fit under the umbrella of the five-factor model, yet many do
(Costa & McCrae, 1992a), and this highlights the usefulness of continued
research in this area.
In all, the five-factor model of personality provides researchers with a broad
structural framework from which to base health investigations. The
framework allows researchers to replicate, compare, integrate and
extrapolate from studies focusing on the role of psychosocial factors in
health. To date, there appears to have been little work focused on integrating
and extending past health research in this way and this suggests that further
research in this area should be conducted. Further research could lead to a
greater understanding of the role of psychosocial factors in the management
of young people’s diabetes and perhaps herald significant improvements to
health care services and interventions for young people with type I diabetes.
Chapter 2: Why Study Personality?
25
Employing the five-factor model as a longitudinal predictor
The other great advantage of personality research lies in the enduring nature
of this construct. By its very definition, personality should have a constant
and continual influence on the manner in which we live (Pervin, 2003). If this
is true, personality could be a useful predictor of long-term health.
Health issues and disease often develop and progress over a course of
decades (Caltabiano et al., 2002). In the case of type I diabetes,
complications arise from extended periods of persistently elevated blood
glucose levels due to routine poor self-management (The Diabetes Control
and Complications Trial Research Group, 1993). This demonstrates that
poor health behaviours typically need to be maintained over long periods to
have significant consequences for the individual. Thus for personal factors to
influence longitudinal health outcomes, the individual must display a
characteristic style of responding to everyday situations (or stressors) that is
unhealthy or maladaptive.
This suggests that psychosocial factors need to demonstrate two properties
if they are to reliably predict long-term health. First, they need to be present
most (or all) of the time, and second, they need to be relatively stable across
occasions. Of all the psychosocial phenomena, the construct of personality
appears to best fit this description (Allik, Laidra, Realo, & Pullmann, 2004;
Asendorpf & van Aken, 2003; Costa & McCrae, 1992a, 1992c; Donnellan,
Conger, & Burzette, 2007; Hampson & Goldberg, 2006; Roberts, Caspi, &
Moffitt, 2001; Roberts & DelVecchio, 2000; Shiner & Caspi, 2003; Sneed,
Gullone, & Moore, 2002).
Research and theory suggests that personality is one of the only
psychosocial constructs that is a continual factor in our lives (Costa &
McCrae, 1992a; McCrae & Costa, 1999; Pervin, 2003). Indeed, the five-
factor model personality traits have been evidenced in child, adolescent,
adult and elderly populations and this speaks to the permanence of these
personality structures (Allik et al., 2004; Asendorpf & van Aken, 2003; Costa

Chapter 2: Why Study Personality?
26
& McCrae, 1992a, 1992c; Shiner & Caspi, 2003; Sneed et al., 2002). In
contrast, other psychological variables such as mood states can fluctuate
widely over time or may not be expressed (Röcke et al., 2009). Therefore,
personality may be a superior predictor of long-term health as it is more likely
to influence our thoughts, affect and behaviour on a daily basis. Certainly, at
any given point in time, not all people will be depressed yet all will have a
personality (however dull).
It should be noted that a stable pattern of response is needed for personality
to have predictive value for long-term health outcomes. If an individual’s
personality changed from day-to-day it would be difficult to untangle any
genuine relationships between long-term health and this construct.
Consequently, it is important to examine the stability of personality across
the lifespan. Only if personality traits are stable across time can we use them
to predict long-term management of diabetes or the development of
complications.
There has been ongoing debate about the stability of personality over the life
course and there appears to be evidence supporting both consistency and
change in personality traits over time (Donnellan et al., 2007; Hampson &
Goldberg, 2006; Roberts et al., 2001; Roberts & DelVecchio, 2000). Whilst
mean level changes are evidenced across the lifespan, research suggests
that relative differences within an age cohort are often preserved (Roberts &
DelVecchio, 2000). Thus, people’s comparative position to other individuals
in their age group remains relatively unchanged despite normative changes
in their personalities. This is referred to as rank-order consistency and is
measured using correlations to test if individuals have changed ranks within
their cohort on a particular trait over time.
Within adults, personality traits show substantial rank-order consistency over
time with test-retest correlations improving from 0.51 in early adulthood to
0.75 around age 50 (Roberts & DelVecchio, 2000). This suggests that adult
personality is a stable construct that continues to develop across the

Chapter 2: Why Study Personality?
27
lifespan. In regards to the five-factor model traits, extraversion and
agreeableness (r = 0.54) appear to be the most stable traits across
adulthood whilst emotional regulation (r = 0.50) is the least (Roberts &
DelVecchio, 2000). This may be due to the fact that emotional regulation is
the factor most associated with transient emotional states (Hampson &
Goldberg, 2006). Nevertheless, according to Cohen’s rule of thumb,
correlations between 0.30 and 0.70 reflect medium to large effects (Field,
2009) and such findings demonstrate that the five-factor traits, including
emotional regulation, are stable psychological constructs in adulthood.
The stability of personality in younger populations appears to be less
assured (Donnellan et al., 2007; Hampson & Goldberg, 2006; Roberts et al.,
2001; Roberts & DelVecchio, 2000). Roberts and DelVecchio (2000)
demonstrated that the rank-order correlation for personality in children aged
6 to 12 years is 0.45, which improves to 0.47 in youth aged 12 to 18.
Similarly, Hampson and Goldberg (2006) demonstrated that short-term test-
retest reliabilities for the five-factor model traits range from 0.22 to 0.55 in
childhood compared to a range of 0.70 to 0.79 in adulthood. As in adults, the
trait of emotional regulation showed the lowest rank-order correlation (r =
0.22) (Hampson & Goldberg, 2006). Together these findings suggest that
personality is less stable in youth but that increases in stability occur with
maturity (B. W. Roberts & DelVecchio, 2000). This implies that predicting
adult personality from childhood traits may be a difficult task.
However, Hampson and Goldberg’s study (2006) demonstrated that certain
five-factor traits in childhood (as rated by teachers) are related to self-rated
personality traits 40 years later. In particular, extraversion (r = 0.29),
conscientiousness (r = 0.23), openness to experience (r = 0.16), and to a
lesser extent, agreeableness (r = 0.09) showed statistically significant
consistency over the 40-year period. Further, Roberts, Caspi and Moffit
(2001) followed a sample of teenagers and found test-retest correlations for
personality traits over an eight year test interval that ranged from 0.43 to 0.67
with an average of 0.55 suggesting that there is relative stability from

Chapter 2: Why Study Personality?
28
adolescence to young adulthood. Whilst many of these correlations would
not be considered as representing large effects (Field, 2009) they do show
that there is at least some continuity in personality from childhood to
adulthood, especially over shorter periods (Roberts et al., 2001).
Furthermore, longitudinal research demonstrates that childhood personality
factors can influence self-reported health, health behaviours and even
survival rates over periods of 40 to 60 years (Friedman et al., 1995;
Friedman et al., 1993; Hampson et al., 2006; Hampson, Goldberg, Vogt, &
Dubanoski, 2007). These are remarkable findings and they underline the
importance of identifying five-factor personality model traits that may have a
significant impact upon long-term health.
The five-factor trait of conscientiousness appears to be of most importance in
long-term health (Brickman, Yount, Blaney, & Rothberg, 1996; Friedman et
al., 1995; Friedman et al., 1993; Hampson et al., 2006, 2007). Conscientious
children appear to be more likely to avoid accidents and to grow up to have
better health habits (Friedman et al., 1995). They appear to be less likely to
be heavy drinkers or smokers and often have lower body mass indexes
(Friedman et al., 1993; Hampson et al., 2006). The association between
conscientiousness and self-reported health appears to be mediated through
educational attainment, eating habits and smoking, yet, several direct effects
of childhood personality on health status have also been observed
(Hampson et al., 2007). Whilst conscientiousness predicts longevity it does
not differentially predict cause of death (Friedman et al., 1995) and, in this
way, conscientiousness appears to serve as a general protective factor
rather than predicting specific causes of mortality.
Other five-factor model traits have also been implicated in long-term health
(Hampson & Goldberg, 2006; Hampson et al., 2007). For example, low
agreeableness and high extraversion in childhood appear to be related to
smoking behaviour in later life (Hampson et al., 2007). Furthermore, high
levels of extraversion and low levels of emotional regulation in childhood

Chapter 2: Why Study Personality?
29
have been associated with alcohol use (Hampson et al., 2006). Also, lower
levels of childhood agreeableness are related to higher body mass index
(Hampson et al., 2006) and extraversion appears to be related to physical
activity (Hampson et al., 2007).
Although this is only a brief summary of the multitude of relationships found
between childhood five-factor traits and long-term health, this information
provides researchers with much knowledge from which to base further
investigations into health. Whilst the majority of the relationships found
between childhood personality and long-term health showed small effects
(Friedman et al., 1995; Friedman et al., 1993; Hampson et al., 2006, 2007),
even associations of a small magnitude can have great implications for
public health, especially if it means the difference between life and death
(Smith & Spiro, 2002).
Overall, the research presented shows that personality is a constant and
continual factor in our lives, which can have a significant influence on long-
term health outcomes and even mortality (Friedman et al., 1993; Hampson et
al., 2006). Whilst the long-term stability of child personality over the lifespan
is muted (Hampson et al., 2006), personality is relatively stable during the
transition from adolescence to young adulthood (Roberts et al., 2001) and
this period would be long enough for an individual with type I diabetes to
develop complications (The Diabetes Control and Complications Trial
Research Group, 1993). Together, these findings speak to the potential role
of personality in determining outcomes in type I diabetes and underline the
importance of conducting longitudinal personality research in young people
with this disease.
Theoretical and research perspectives on personality-health
interactions
Another reason for studying the role of five-factor model traits in the
management of young peoples’ diabetes comes from the strong theoretical

Chapter 2: Why Study Personality?
30
ties between personality and health outcomes (Wiebe & Smith, 1997). A
theoretical foundation is critical in exploratory research (such as the current
study) as it can provide researchers with a framework within which to work
and can guide the formulation and testing of specific research hypotheses
(Meltzoff, 2004). With respect to the role of personality in diabetes, there are
several theoretical models that can be used to direct and inform research
(Wiebe & Smith, 1997) and these provide an excellent starting point from
which to devise research hypotheses and make measurement decisions.
Three models that may be particularly relevant to the management of type I
diabetes are health-behaviour models, stress models and adaptation to
illness models and these paradigms appear to be supported by empirical
research (Bogg & Roberts, 2004; Chida & Steptoe, 2009; Wiebe & Smith,
1997). Given the empirical support for these models, research utilising these
frameworks in type I diabetes appears warranted. Accordingly, the
applicability of each of these models to the management of young people’s
diabetes is discussed in detail below.
The Health–Behaviour Model
The health-behaviour model concentrates on the influence of personality on
specific behaviours which may increase or decrease the risk for disease or
mortality (Suls & Rittenhouse, 1987; Wiebe & Smith, 1997). Theorists
contend that individuals create and seek out situations that suit their
personality, and hence, some people may be exposed to riskier
circumstances than others (Suls & Rittenhouse, 1987). For example, some
individuals may be more likely to engage in unhealthy habits or risky
practices (such as unsafe sex, dangerous driving, drug and alcohol use,
sedentary lifestyle or poor diet), whilst others may be more likely to engage
in health protective behaviours (such as healthy diet, exercise or medical
screening) (Bermudez, 1999).

Chapter 2: Why Study Personality?
31
Unsurprisingly, research supports the health-behaviour model with five-factor
variables found to be related to a multitude of behaviours in several large-
scale and meta-analytic studies (Bogg & Roberts, 2004; Hong & Paunonen,
2009; Munafo, Zetteler, & Clark, 2006; Raynor & Levine, 2009; Rhodes &
Smith, 2006). In adolescent cohorts, five-factor dimensions have been
implicated in health-relevant behaviours such as smoking (Brook, Whiteman,
Czeisler, Shapiro, & Cohen, 1997), sun protective behaviours (Brayne, Do,
Green, & Green, 1998), exercise adherence (Douthitt, 1994) and drug and
alcohol abuse (Brook et al., 2001; Loukas, Krull, Chassin, & Carle, 2000).
Such findings have led researchers to argue that behaviour may play a
greater role in mediating personality-health relationships than currently
acknowledged (Contrada, Coups, Cameron, & Leventhal, 2003). Undeniably,
many of the main causes of mortality today are related to an individual’s
engagement in unhealthy behaviours (Bermudez, 1999).
Given the associations between five-factor model personality traits and
health behaviour (Hong & Paunonen, 2009; Munafo et al., 2006; Nicholson,
Soane, Fenton-O'Creevy, & Willman, 2005; Rhodes & Smith, 2006), and the
behavioural nature of type I diabetes self-management (Glasgow et al.,
1999), research into the personality determinants of diabetes self-
management and glycaemic control is warranted.
Youth with type I diabetes need to regulate their behaviour on a daily basis in
order to maintain near-normal blood glucose levels (Schneider et al., 2007)
and an individual who is dedicated in their self-care is more likely to avoid
long-term complications (The Diabetes Control and Complications Trial
Research Group, 1993). Furthermore, an unhealthy diet and poor self-care
behaviours can impact blood glucose levels (Hanas, 1998) and increase the
risk for long-term complications (The Diabetes Control and Complications
Trial Research Group, 1993), drug use can lead to hyperglycaemia (and in
some cases hyperglycaemic coma) (Brenner, 2006) and excessive alcohol
use increases the risk for hypoglycaemic attack which can in some cases
lead to unconsciousness and hospitalisation (Kerr, Cheyne, Thomas, &

Chapter 2: Why Study Personality?
32
Sherwin, 2007). Thus, if five-factor model personality traits truly predispose
individuals to engage in either protective or risky health behaviours in
diabetes, it is critical for researchers to understand these relationships.
It is important to note that observed personality-health relationships may in
fact be related to self-reports of health behaviour or illness reports rather
than actual health or behaviour (Wiebe & Smith, 1997). Self-report measures
of health and health behaviour are not guaranteed to be objective or reliable
and this underlines the importance of employing unbiased measures in
personality research. An objective measure of diabetic control is required.
Glycosylated haemoglobin (HbA1c) tests provide such a measure. As
aforementioned, HbA1c tests are the gold standard for assessing a patient’s
blood glucose control over the previous 6-8 weeks and regular testing is
employed by clinicians to guide insulin prescription and self-care
recommendations (Hanas, 1998; Kilpatrick, 2000). By using HbA1c as an
objective measure of behavioural management, researchers can assess the
validity of any proposed relationships between personality and diabetic
management and investigate any associations between this measure and
self-reported health. This may promote health and prevent adverse
outcomes by allowing us to predict poor behavioural management of type I
diabetes.
Finally, researchers and clinicians need to be aware that the level of
responsibility one takes for their care may influence the role of personality in
health management. If an individual is not responsible for engaging in self-
care behaviours, then the predictive value of personality may be attenuated.
This may be of particular relevance to younger individuals with type I
diabetes who may not yet take charge of many diabetes tasks. In such
cases, parents of the person with diabetes may take more responsibility for
behaviours such as insulin administration, blood glucose testing or diet.
Therefore, it is essential to consider how levels of responsibility for self-care
may impact upon the results of personality-health studies.

Chapter 2: Why Study Personality?
33
The Stress Model
It has been hypothesised that personality characteristics may also influence
physiological stress response, which can play a role in the development and
progression of disease (Suls & Rittenhouse, 1987; Wiebe & Smith, 1997).
Theorists argue that some individuals respond with greater physiological
reactivity when confronted with stressful situations (Suls & Rittenhouse,
1987) and this can influence health through several physiological pathways
(Wiebe & Smith, 1997). A stress response causes hyper-arousal of the
sympathetic nervous system, reduced immune function and altered
production of hormones (Contrada et al., 1990; Van Heck, 1997; Wiebe &
Smith, 1997) and it is surmised that if this physiological hyper-arousal is
continued or intense, this may strain bodily organs and increase risk of
disease (Suls & Rittenhouse, 1987). Furthermore, stress levels should be
seen as an independent outcome in type I diabetes as they are a good
general indicator of psychological wellbeing and are associated with quality
of life (Ames, Jones, Howe, & Brantley, 2001; Ward & Tannner, 2010).
Theory suggests that individuals’ stress levels are influenced by their
appraisal of challenging events whilst the behavioural and cognitive
strategies they employ may influence the intensity or the duration of the
event (Contrada et al., 1990; Wiebe & Smith, 1997). Interestingly, it has been
suggested that certain people may be more likely to create stressful
situations through their choices and behaviours (Wiebe & Smith, 1997), and
taken together, this information suggests that personality may predict stress
levels and subsequent health.
Prominent support for the role of personality in stress-health interactions
came from research applications that attempted to elucidate relationships
between Type A behaviour and coronary heart disease (Cooper, Detre, &
Weiss, 1981). Individuals displaying Type A behaviour are generally
characterised as hostile, competitive and impatient, and early research
demonstrated that these people displayed increased physiological response
to stressors, accentuated appraisals of general stress, and greater

Chapter 2: Why Study Personality?
34
susceptibility for coronary heart disease (Caltabiano et al., 2002). Whilst this
research was challenged on methodological grounds (Mann & Brennan,
1987), research improvements have revitalised this area of investigation,
focusing on the traits of anger and hostility which have been shown to better
predict heightened physiological reactivity to stress (Byrdon et al., 2010) and
development of coronary heart disease (Chida & Steptoe, 2009; Jackson,
Kubzansky, Cohen, Jacobs Jr, & Wright, 2007; Myrtek, 2001). Above all,
research has demonstrated that interventions aimed at reducing hostility and
stress are successful in reducing coronary risk (Daubenmier et al., 2007;
Gidrpn, Davidson, & Bata, 1999) underscoring the practical utility of
personality-health research and stress-health models.
The stress-health model may be particularly relevant to type I diabetes, in
that stress responses lead to changes in adrenaline and neuroendocrine
function (Wiebe & Smith, 1997) which are known to play a role in the
regulation of blood glucose (Hanas, 1998). Research shows that adolescents
with type I diabetes who report higher life stress display poorer glycaemic
control (Helgeson, Escobar, Siminerio & Becker, 2007). Likewise, individuals
with type I diabetes who report reduced ability to deal with stress display
poorer HbA1c results (Skocic, Rudan, Brajkovic, & Marcinko, 2010).
Moreover, there may be a reciprocal relationship between stress levels and
diabetic outcomes; higher stress levels may increase HbA1c scores, whilst
receiving news of a higher HbA1c score may potentially influence stress
levels. If five-factor model traits do predict stress levels in type I diabetes, it is
crucial to understand these associations as it may help to identify those at
risk for poor psychological wellbeing and self-management outcomes.
The Adaptation to Illness Model
A further model of personality-health interaction focuses on the role that
personality plays in coping with acute medical crises and adaptation to
chronic disease (Wiebe & Smith, 1997). This model underlines the
importance of personality in an individual’s psychological response to

Chapter 2: Why Study Personality?
35
disease and treatment and aims to identify personality characteristics that
may make people more or less vulnerable to psychological morbidity,
negative affect and poor coping when living with illness (Smith & Williams,
1992). A real asset of this approach is that it underlines the importance of
coping and the absence of psychological morbidity in conceptualisations of
health; they can be seen as predictors of health outcomes or as outcomes in
their own right.
This model of personality-health association is closely aligned with the bio-
psychosocial model of health (Engel, 1977) and represents a positive move
from reductionist biomedical models of disease that assume a simple
dichotomy between health and physiological illness (Harris et al., 2000). This
approach offers a comprehensive conceptualisation of wellbeing which
emphasises levels of health and vitality as much as levels of impairment or
disability (Bandura, 2005).
Whilst measures of self-care or physiological outcomes may serve to indicate
how a person’s behaviour corresponds with medical regimens or advice from
health professionals, it does not capture the complexity of chronic condition
self-management or the need for individuals to control the disease within the
context of their lives (Schilling et al., 2002a). Certainly, no clinician could
argue that an adolescent with perfect glycaemic control has optimal
management of their condition if they also display clinical levels of
depression due to the demands of their disease. By focusing on factors such
as general coping style, depression and anxiety we can get a picture of how
a young person has adapted to living with a chronic condition (Livneh &
Antonak, 2005) and may better understand how this disease affects and
impacts upon their life.
Youths with type I diabetes often report difficulties adjusting to their disease
and there are higher rates of depression, anxiety and maladaptive coping in
this cohort (Dantzer et al., 2003; Grey et al., 1995; Hanson et al., 1989;
Kanner et al., 2003; Wysocki, 1993). Poor coping, anxiety and depression

Chapter 2: Why Study Personality?
36
have also been associated with poor glycaemic control (Dantzer et al., 2003;
De Groot et al., 2001; Graue et al., 2004; Herzer & Hood, 2010; P. J
Lustman et al., 2000) and this highlights the importance of finding five-factor
personality traits that may predict such outcomes.
In summary, the above theoretical models of personality-health interactions
make a strong case for the potential role of personality in the management of
type I diabetes and underline the importance of taking a bio-psychosocial
approach towards conceptualisations of health. Whilst it is possible that any
relationship between personality and health could simply reflect the work of a
third latent variable or constitutional predisposition (Wiebe & Smith, 1997),
the links found between personality and health related behaviours (Bogg &
Roberts, 2004; Hong & Paunonen, 2009) suggest that the proposed models
do hold validity.
The aforementioned models are not thought to be mutually exclusive (Suls &
Rittenhouse, 1987; Van Heck, 1997; Wiebe & Smith, 1997) and it is
reasonable to expect bi-directional and reciprocal effects amongst these
processes (Peyrot & Rubin, 2007; Van Heck, 1997). In this way, there may
be multiple pathways between five-factor model personality traits and self-
management outcomes in type I diabetes.
By using these frameworks, researchers may better understand the complex
nature of personality-health relationships in type I diabetes and propose
testable hypotheses regarding the role of personality in this disease. This
suggests that investigators need to consider markers of psychological
wellbeing (such as stress, anxiety, depression and coping) and markers of
diabetic control (such as HbA1c, hypoglycaemia and self-care behaviours)
when examining self-management outcomes in type I diabetes research.

Chapter 2: Why Study Personality?
37
The value of personality research: Identification and
intervention
A final reason for studying the role of personality in health comes from what
can be achieved with this information. The ultimate goal of personality-health
research should be to guide the development and implementation of
interventions for the prevention and management of disease (Smith &
MacKenzie, 2006). Certainly, a comprehensive approach towards the
creation of health interventions requires consideration of a multitude of
determinants of health; including personality (Smith, Jenkins, & Orleans,
2004).
If as suggested, personality influences health in predictable ways, personality
research could help clinicians to detect individuals vulnerable for illness and
identify variables on which we could focus to improve health (Bermudez,
1999). An increased awareness of the role of personality factors in type I
diabetes may help to identify people at risk of poor psychological wellbeing
or glycaemic control and allow for the development of tailored interventions
aimed at improving these outcomes.
Researchers have argued that standard care is now insufficient to achieve
optimal outcomes in type I diabetes (Murphy, Rayman, & Skinner, 2006) and
that advances in diabetes treatments (such as intensive insulin regimes and
insulin pumps) have necessitated increases in patient support and education
(Glasgow et al., 1999). There has been a call for ongoing assessment of
people’s psychological and social situation in the medical management of
diabetes (Gage et al., 2004; Glasgow et al., 1999; Murphy et al., 2006; van
der Ven et al., 2005) and this has led to the conceptualisation and
development of a variety of educational, behavioural and psychosocial
interventions aimed at improving outcomes for individuals with type I
diabetes (Gage et al., 2004; Hampson, Skinner, et al., 2000; Hampson et al.,
2001; E. Harkness et al., 2010; Murphy et al., 2006). These developments
signal a positive step forward in the treatment of this disease, particularly for
adolescents for whom intervention may be especially relevant.

Chapter 2: Why Study Personality?
38
Adolescence is a pivotal time for implementing diabetes-focused
interventions as responsibility for self-management typically increases during
this period whilst metabolic control generally declines (Dashiff et al., 2006;
Holl et al., 2003; Jacobson et al., 1990). The detection of adolescents who
are at risk for poor metabolic control is critical because, without intercession,
these people are likely to have poor control throughout their adult lives
(Dabadghao et al., 2001) increasing the risk for developing complications
(The Diabetes Control and Complications Trial Research Group, 1993).
Furthermore, the fact that Australian youth have greater access to diabetes
clinics than adults (National Health and Medical Research Council, 2005),
and the fact that clinicians can effectively incorporate structured interventions
into patient sessions (Peyrot & Rubin, 2007) suggest that this is a good time
for implementing interventions aimed at improving glycaemic control.
Meta-analyses and systematic reviews of the literature support this
demonstrating that behavioural, psychosocial and educational interventions
have a beneficial effect on diabetes management practices and HbA1c levels
in adolescents (Gage et al., 2004; Hampson, Skinner, et al., 2000; Hampson
et al., 2001; Murphy et al., 2006). Whilst the benefits of such interventions
are not always sustained (Gage et al., 2004), some studies have reported
significant reductions in HbA1c over periods of up to 2 years (Rubin, Peyrot, &
Saudek, 1989) underscoring the importance of accurately conceptualising
and developing such programs.
Regrettably, many interventions for adolescents with poorly controlled type I
diabetes are not theoretically guided (Gage et al., 2004; Hampson, Skinner,
et al., 2000) and there is large inter-individual variability in the effectiveness
of specific interventions (Hains, Davies, Parton, & Silverman, 2001). Such
findings imply that intervention programmes that work well in one setting (or
with a certain cohort) may not work as well in others. Research demonstrates
that theoretically-based interventions produce larger effect sizes (Hampson,
Skinner, et al., 2000) underlining the need for an expanded theoretical base
to guide the selection of appropriate intervention techniques and assessable

Chapter 2: Why Study Personality?
39
outcomes. It may be that the greatest therapeutic benefits for individuals with
type I diabetes are achieved by ‘matching’ patients with specific treatments
or interventions.
There is research to suggest that targeted approaches to intervention in type
I diabetes may be effective (Christensen, 2000; Franks, Chapman,
Duberstein, & Jerant, 2009; van der Ven et al., 2005). Firstly, five-factor
model personality traits are known to moderate the effectiveness of
interventions in chronic disease (Franks et al., 2009). In a study by Franks et
al (2009), a self-efficacy enhancing intervention proved successful only for
individuals who were low in the personality traits of emotional regulation
(termed neuroticism by study author), agreeableness, conscientiousness and
extraversion.
Secondly, personal characteristics and disease-related contextual variables
appear to interact to determine the success of health interventions or
treatment. For example, Christensen (2000) found that an active coping style
was associated with better adherence when individuals were undergoing
home-based dialysis that is highly patient-directed whereas a passive coping
style was associated with better adherence in individuals receiving hospital
based, clinician-controlled treatment.
Together, these findings suggest that specific health interventions need to
work in congruence with the patient receiving treatment. Specific
interventions may produce superior outcomes for a particular subset of the
patient population whilst this relationship may not occur or may even be
reversed in other subgroups (Christensen, 2000). This shows that we need
to identify individuals displaying high-risk characteristics and develop
interventions for cohorts in which therapeutic effects are likely to be
strongest.
Personality research provides promise for tailored health interventions and
this appears to be a growing area of interest (Castellanos & Conrod, 2006;

Chapter 2: Why Study Personality?
40
Conrod et al., 2007; Conrod, Stewart, Comeau, & Maclean, 2006; Conrod et
al., 2000). Personality-based health interventions generally try to match
individuals to treatments and are designed to help the patient manage
maladaptive behaviours and coping strategies that are influenced by their
personality (Conrod et al., 2006).
Research studies (Conrod et al., 2007; 2006; 2000) have highlighted the
efficacy of targeted personality-interventions in reducing alcohol and drug
abuse behaviour. In these studies, participants who showed elevated scores
on one of the personality risk factors related to alcohol and drug misuse
(negative thinking, sensation seeking, anxiety sensitivity, impulsivity or
introverted-hopelessness) were assigned to a personality-matched
intervention that focused on the individual’s thoughts, behaviours and
emotions in a personality-specific fashion. The goal of these programs was
to intervene at the level of personality risk focusing on the maladaptive
coping strategies associated with personality and problem behaviours.
Individuals in these studies were randomly assigned to one of three brief
interventions where they either received a motivation-matched intervention
which involved personality-specific motivational and coping skills training, a
control group which involved viewing a motivational film and a supportive
discussion with a therapist, or a motivational mismatched intervention which
targeted a theoretically different personality profile (Castellanos & Conrod,
2006; Conrod et al., 2007; 2006; 2000). The findings from this research are
encouraging and have several implications.
Firstly, this research suggests that ‘personality matched’ interventions are
effective in preventing or reducing alcohol and drug abuse whereas
‘personality mismatched’ interventions have no effect (Conrod et al., 2000).
These findings demonstrate the importance of personality variables in
response to treatment interventions and may explain the inter-individual
variability observed in the effectiveness of specific interventions (Hains et al.,

Chapter 2: Why Study Personality?
41
2001). Such results suggest that an intervention that does not ‘match’ the
individual’s personality is likely to be ineffective.
Secondly, the effect sizes obtained for ‘personality matched’ interventions
were comparable to, or greater than, those reported by high-quality
interventions for youth alcohol or drug prevention programs (Conrod et al.,
2007; 2006). In one study, the effect size for a specific ‘personality matched’
intervention was double any reported by youth alcohol prevention programs
(Conrod et al., 2007). Furthermore, this lasted for over 12 months whereas
the effects of other brief interventions often disappeared after a few weeks
(Conrod et al., 2007). These findings suggest that personality-targeted
interventions may produce robust changes in maladaptive behaviour and
may have greater long-term benefits than standard interventions.
Thirdly, findings demonstrate that personality-targeted interventions not only
improve health behaviour but also improve psychological wellbeing
(Castellanos & Conrod, 2006). ‘Personality matched’ interventions produced
reductions in personality-related psychological symptoms. A negative
thinking intervention significantly reduced depression scores, whilst an
anxiety intervention reduced panic attacks and truancy. These findings
demonstrate that personality-targeted interventions not only improve health
behaviour but also improve psychological wellbeing; a remarkable finding as
there are scant interventions that improve both physical and mental health in
type I diabetes (E. Harkness et al., 2010).
Together, these studies suggest that personality-targeted interventions can
engender significant and long-lasting health behaviour change and underline
the importance of continued research into personality-health interactions.
Furthermore, the techniques employed in these intervention studies
(Castellanos & Conrod, 2006; Conrod et al., 2007; 2006; 2000) may be
successful in the treatment of individuals with type I diabetes. In the future,
by identifying individuals who display personality traits that predict poor self-
management, we may be able to intervene early providing focused care that

Chapter 2: Why Study Personality?
42
concentrates on specific personality traits that may determine outcomes.
Results of this research revealed that the interventions did not influence
scores on personality dimensions implying that the interventions help youths
to better manage their personality rather than change it (Conrod et al., 2006).
Summary
In summary, personality investigations could greatly contribute to our
knowledge of type I diabetes self-management in younger populations.
Personality research is a growing area and the dominance of the five-factor
model provides researchers with unique opportunities to create a
comprehensive body of information, which we could potentially use to predict
long-term outcomes. In addition, theoretical perspectives show that
personality could influence a range of outcomes in type I diabetes such as
depression, anxiety, stress and coping along with traditionally employed
outcomes such as measures of self-care and glycaemic control. By using the
five-factor model to look at the role of personality in longitudinal trajectories
of such outcomes we may be able to recognise individuals at risk and identify
variables on which we could focus to improve self-management of type I
diabetes. Therefore, the following chapter examines research relevant to the
five-factor model of personality, self-care, psychological wellbeing and
glycaemic control in young people with type I diabetes.

Chapter 3
Five-factor Personality Traits and
Management of Diabetes
Given the popularity of the five-factor personality model (Costa & McCrae,
1992a; Digman, 1989; McCrae & John, 1992; Ostendorf & Angleitner, 1994;
Rolland, 1993), and the importance of five-factor traits in health (Bogg &
Roberts, 2004; Brickman et al., 1996; Friedman et al., 1995; Hampson et al.,
2006; Hong & Paunonen, 2009), it is surprising that little personality research
has been conducted in the area of adolescent type I diabetes using this
framework.
To date, there have only been two studies that have examined relationships
between five-factor model traits and type I diabetes outcomes in younger
cohorts (Skinner et al., 2002; Vollrath et al., 2007). Unfortunately, this lack of
research hampers any in-depth understanding of the role of personality in
young people’s management of this disease. Although the aforementioned
investigations have provided valuable information, it is inappropriate to draw
broad conclusions based on the findings of so few studies.
Consequently, further investigation is required to validate previous findings
and bring more certainty to the field (Skinner et al., 2002; Vollrath et al.,
2007). Additionally, this research could help to uncover important new
knowledge, resolve incongruent findings, identify particular issues that
require further attention and assist clinicians in helping young people at risk
for poor self-management of diabetes.

Chapter 3: Five-factor Personality Traits and Diabetes
44
In order to embark on such a task, it is imperative to objectively review the
literature relevant to personality and young people’s experience of diabetes.
Familiarity with this research will help investigators to formulate hypotheses
regarding associations between five-factor model traits and important self-
management outcomes. Researchers can also determine new areas of
inquiry by acknowledging any limitations of this work.
Due to the small amount of research involving five-factor model measures of
personality and youth with type I diabetes (Skinner et al., 2002; Vollrath et
al., 2007), it is important to broaden the literature review to include research
involving similar populations (such as adults with type I diabetes and people
with type II diabetes) and variables conceptually and empirically related to
five-factor model traits (such as temperament or narrow personality
constructs). By using the five-factor model to compare, integrate and
extrapolate from these studies, a clearer picture of the role of personality in
the management of type I diabetes may be achieved.
Therefore, the current chapter presents a broad review of research relevant
to the five-factor model of personality and self-management of type I
diabetes in youth. A bio-psychosocial approach to health is taken and the
role of personality in diabetic control and psychological wellbeing is
considered. In addition, the limitations of the available research are
highlighted and areas that deserve further attention are discussed. To aid
presentation, this review is divided into three sections.
The first section examines research relevant to the role of five-factor model
traits in diabetic control and psychological wellbeing. The second section
discusses the limitations of current research and the implications for future
studies. The third section presents the aim, research questions and
hypotheses of the current study.

Chapter 3: Five-factor Personality Traits and Diabetes
45
Personality traits and self-management of type I diabetes
A systematic examination of the research was performed to determine
current knowledge regarding the role of personality traits in determining self-
management outcomes in type I diabetes. Exploration of the literature
demonstrated that the existing studies have typically focused on outcomes
such as blood glucose testing behaviours, glycaemic control and insulin
adherence (Edwards, 1999; Lane et al., 2000; Marks, 2000; Skinner et al.,
2002; Vollrath et al., 2007). The role of personality in an individual’s
psychological adaptation to diabetes has received little attention.
The discussion therefore focuses on relationships between personality
factors and measures of self-care and glycaemic control in diabetic
populations. In addition, potential associations between personality and
psychological adaptation to diabetes are postulated by examining links
between personality and psychological wellbeing in non-diabetic populations.
To bring order and coherence to an exploration of these findings, the review
is organised in reference to the traits of the five-factor model of personality.
Conscientiousness
The five-factor model trait of conscientiousness has been linked to a large
variety of health outcomes across the life course (Bogg & Roberts, 2004;
Friedman, 2000; Friedman et al., 1994; Hampson et al., 2006; B. W. Roberts,
Walton, & Bogg, 2005). Such findings have led some researchers to contend
that this trait may be the most important and reliable personality predictor of
long-term health (Bogg & Roberts, 2004; B. W. Roberts et al., 2005).
Research suggests that associations between conscientiousness and health
are primarily mediated by health behaviours (Bogg & Roberts, 2004; B. W.
Roberts et al., 2005). Individuals high in conscientiousness typically engage
in health protective behaviours and avoid unhealthy practices whereas those
low in conscientiousness exhibit poorer self-care and partake in more risky
activities (Bogg & Roberts, 2004; Friedman et al., 1995; Hampson, Andrews,

Chapter 3: Five-factor Personality Traits and Diabetes
46
Barckley, Lichtenstein, & Lee, 2000; Hampson et al., 2006; Hong &
Paunonen, 2009; Munafo et al., 2006; Raynor & Levine, 2009; Rhodes &
Smith, 2006). If conscientiousness similarly predicts engagement in health
behaviours in youth with type I diabetes, this could have weighty
consequences for individuals low on this trait.
The trait of conscientiousness is related to the characteristics of
perseverance and discipline and is associated with an individual’s ability to
plan, monitor and control their behaviour (Costa & McCrae, 1992c; Gailliot,
Mead, & Baumeister, 2008; Hoyle, 2006). Type I diabetes requires continual
and proactive self-management (Glasgow et al., 1999), and people high in
conscientiousness may better achieve this as they are more adept at self-
regulating their actions on a daily basis (Costa & McCrae, 1992c; Gailliot et
al., 2008; Hoyle, 2006). We might therefore expect conscientious youth with
type I diabetes to display better engagement in self-care and superior
glycaemic control. Unsurprisingly, research involving both youth and adults
with diabetes appears to support this proposition (Brickman et al., 1996;
Christensen & Smith, 1995; Edwards, 1999; Garrison, Biggs, & Williams,
1990; Liakopoulou, Korvessi, & Dacou-Voutetakis, 1992; Marks, 2000;
Rovert & Ehrlich, 1988; Ryden et al., 1990; Skinner et al., 2002; Vollrath et
al., 2007).
For example, Vollrath, Landolt, Gnehm, Laimbacher and Sennhauser (2007)
followed a sample of newly diagnosed youth (aged 6-16) and found that
average conscientiousness scores (calculated from measures at 6 weeks, 6
months and 12 months after diagnosis) were negatively correlated with
average HbA1c values (calculated from measures at 6 months, 12 months
and 24 months after diagnosis). Significant correlations were also found for
the conscientiousness subscales of concentration, perseverance and order.
A stepwise multiple regression of five-factor model personality traits on
HbA1c further highlighted the importance of conscientiousness (Vollrath et al.,
2007). Conscientiousness was the only significant predictor of glycaemic

Chapter 3: Five-factor Personality Traits and Diabetes
47
control explaining 11% of the variability in HbA1c scores (Vollrath et al.,
2007). These results suggest that conscientiousness may be the most
important personality factor in young people’s glycaemic management.
Therefore, clinicians can expect youth with diabetes who are focused, orderly
and perseverant to have good glycaemic control.
There is also evidence to suggest that a relationship between
conscientiousness and glycaemic control in young people may be due to an
association between this personality factor and specific diabetes self-care
behaviours. In a mediational study, Skinner, Hampson & Fife-Schaw (2002)
found that high levels of conscientiousness in young people with type I
diabetes were associated with reports of better diet, increased exercise
engagement, greater number of blood glucose tests and adherence to
insulin. Structural equation modelling of these data suggested self-care
behaviours were influenced by health beliefs about self-efficacy to control
their diabetes and prevent complications, which were in turn, influenced by
conscientiousness.
Finally, further (albeit speculative) support for a potential role for
conscientiousness in young people’s management of diabetes comes from
research involving adults with diabetes and research investigating the role of
narrow personality traits and temperamental factors. High conscientiousness
in adults with diabetes has been related to health beliefs, adherence, self-
care behaviours and glycaemic control (Christensen & Smith, 1995;
Edwards, 1999; Marks, 2000; Szymborska-Kajanek, Wrobel, Cichocka,
Grzeszczak, & Strojek, 2006) whilst superior adherence and glycaemic
control in youth with type I diabetes has been associated with
conscientiousness-related traits such as longer attention span (Garrison et
al., 1990; Rovert & Ehrlich, 1988), greater regularity in routine (Rovert &
Ehrlich, 1988), greater effort at school (Liakopoulou et al., 1992) and low
impulsivity (Ryden et al., 1990). Collectively, these findings make a strong
case for the importance of conscientiousness in the behavioural
management of type I diabetes.

Chapter 3: Five-factor Personality Traits and Diabetes
48
It is also important to note that conscientiousness may influence
psychological adaptation to type I diabetes. Conscientious people tend to
accept difficult or unchangeable situations and work proactively within the
constraints of their circumstances (Carver & Connor-Smith, 2010; Connor-
Smith & Flachsbart, 2007; Kidachi, Kikuchi, Nishizawa, Hiruma, & Kaneko,
2007). They are also unlikely to use disengagement strategies such as
avoidance to cope with demands (Carver & Connor-Smith, 2010; Connor-
Smith & Flachsbart, 2007). Based on these findings, we might expect highly
conscientious youth with diabetes to come to terms with a diagnosis of a
chronic disease, learn to live with the personal limitations imposed by this
situation and develop some sense of understanding. Additionally, we can
expect these people to actively engage in the management of their diabetes
and not evade the daily demands placed on them by intensive insulin
regimens. This may have consequences for psychological wellbeing in youth
with this disease.
Research suggests that individuals high in conscientiousness report lower
rates of depression, anxiety and stress and that this association remains
when objective measures of psychological wellbeing are employed (K. W.
Anderson & McLean, 1997; Bartley & Roesch, 2011; Carver & Connor-Smith,
2010; Ebstrup, Eplov, Pisinger, & Jorgensen, 2011; Kotov, Gamez, Schmidt,
& Watson, 2010; Scher & Osterman, 2002; Vollrath, 2000, 2001; Weiss,
Sutin, Duberstein, Friedman, Bagby, & Costa Jr, 2009). This shows that
conscientiousness may serve as a protective factor against psychological
morbidity and may even reduce the risk of exposure to stressful or
distressing events. High conscientiousness may promote acceptance coping,
suppress avoidance coping and shield youth with type I diabetes from
experiencing maladaptive levels of negative affect.
The above research suggests superior outcomes for individuals high in
conscientiousness. Individuals high in conscientiousness are likely to display
better self-care behaviours, superior glycaemic control and greater
psychological adaptation to type I diabetes. It is likely that people high in

Chapter 3: Five-factor Personality Traits and Diabetes
49
conscientiousness will accept their diabetes and utilise less avoidance
coping strategies to adapt to their disease. It is also likely that rates of
depression, anxiety and stress would be lower in young people high on this
trait.
Emotional regulation
A second five-factor model trait that may play an indispensable role in a
young person’s self-management of diabetes is emotional regulation.
Emotional regulation has been related to a variety of mental and physical
outcomes in non-diabetic populations and has recently been highlighted as a
factor that has a significant impact on public health (Carver & Connor-Smith,
2010; Charles, Gatz, Kato, & Pedersen, 2008; Clark, Watson, & Mineka,
1994; Connor-Smith & Flachsbart, 2007; Goodwin, Cox, & Clara, 2006;
Kendler, Gatz, Gardner, & Pedersen, 2006; Khan, Jacobson, Gardner,
Prescott, & Kendler, 2005; Lahey, 2009; Shipley, Weiss, Taylor, & Deary,
2007; Smith & MacKenzie, 2006; Watson, Clark, & Harkness, 1994). Given
the importance of emotional regulation in these other health domains, it is
crucial to understand the role of this trait within the context of type I diabetes.
Emotional regulation is strongly linked to psychological adaptation and could
thus have significant implications for coping and mental wellbeing in youth
with diabetes (Carver & Connor-Smith, 2010; Clark et al., 1994; Connor-
Smith & Flachsbart, 2007; Kendler et al., 2006; Khan et al., 2005; Watson et
al., 1994). For instance, individuals low in emotional regulation appraise
themselves as having poor coping resources, are less likely to accept difficult
circumstances and are more likely to engage in avoidance coping as a way
of dealing with stress (Bolger, 1990; Carver & Connor-Smith, 2010; Cimbolic-
Gunthert, Cohen, & Armeli, 1999; Connor-Smith & Flachsbart, 2007). They
also report more negative life events and poorer quality of life (Arrindell,
Heesink, & Feij, 1999; Taylor et al., 2003; Vollrath, 2001).

Chapter 3: Five-factor Personality Traits and Diabetes
50
Furthermore, low levels of this trait appear to be a general risk factor for
lifetime psychopathology (Carver & Connor-Smith, 2010; Clark et al., 1994;
Kendler et al., 2006; Khan et al., 2005; Watson et al., 1994). Low scores on
emotional regulation have been consistently associated with increased rates
of depression, anxiety and stress (Bienvenu et al., 2004; Bolger &
Zuckerman, 1995; Kendler et al., 2006; Khan et al., 2005; Kotov et al., 2010;
Lahey, 2009; Roelofs, Huibers, Peeters, & Arntz, 2008) and these
relationships remain even when overlapping measurement items are taken
into account (Lahey, 2009). This has led some researchers to argue that the
trait of emotional regulation may actually index a genetic risk for negative
affect and psychopathology (Kendler et al., 2006; Lahey, 2009). Undeniably,
research looking at the physiological mechanisms underlying these
psychological constructs supports this position (Hauner et al., 2008).
Emotional regulation can then be expected to play a central role in
determining levels of negative affect and coping in youth with a chronic
disease. In fact from a stress-diathesis perspective, being able to regulate
one’s emotions may be more important for individuals with a chronic
condition as they are exposed to additional stressors not experienced by the
general population (Glasgow et al., 1999). The higher rates of depression
and anxiety evidenced in diabetic cohorts (Dantzer et al., 2003; Kanner et al.,
2003; Massengale, 2005) support this idea and suggest that greater
emotional regulation may be needed for individuals to adapt successfully to
living with this disease. If this is so, we might expect the association between
emotional regulation and measures of negative affect and coping to be
particularly strong in this group. Furthermore, if emotional regulation does
influence coping, depression anxiety and stress in youth with diabetes, we
can also expect this trait to influence self-care behaviours and physical
health.
Low emotional regulation is a significant risk factor for inadequate self-care
and poorer long-term health in the general population (Charles et al., 2008;
Goodwin et al., 2006; Lahey, 2009; Shipley et al., 2007; Smith & MacKenzie,

Chapter 3: Five-factor Personality Traits and Diabetes
51
2006). Whilst often linked to over-reporting of symptoms or illness, poorly
regulated emotion has also been associated with a diverse range of objective
health outcomes such as arthritis, type II diabetes, kidney disease, ulcer,
cardiovascular disease, coronary heart disease, gastrointestinal conditions
and mortality in older adults (Charles et al., 2008; Costa Jr & McCrae, 1987;
Feldman, Cohen, Doyle, Skoner, & Gwaltney Jr, 1999; Goodwin et al., 2006;
Lahey, 2009; Lindberg, 2002; Shipley et al., 2007). Furthermore, low levels
of this trait have been associated with negative health behaviours such as
increased smoking, greater alcohol intake, and abuse of illicit substances
(Goodwin & Friedman, 2006; Goodwin & Hamilton, 2002; Hong & Paunonen,
2009; Loukas et al., 2000; Terracciano & Costa Jr., 2004). In all, these
associations suggest that low emotional regulation may be a risk factor for
poorer self-care and glycaemic control in people with diabetes. Indeed, low
emotional regulation may predict the co-morbidity of mental and physical
health problems potentially multiplying the risk for poorer long-term outcomes
(Lahey, 2009).
There is research that suggests poor emotional regulation may predict
substandard self-care and glycaemic control (Chatzialexiadi et al., 2005;
Gilbert, 1992; Vollrath et al., 2007). For instance, Vollrath and colleagues
(2007) discovered that youth scoring low on emotional regulation had worse
glycaemic control as measured by HbA1c scores. Similar results were
uncovered by Gilbert (2004) who found a positive association between
emotional regulation and HbA1c using Eysenck’s three-factor personality
questionnaire (EPQ). In addition, Chatzialexiaidi, Kounenoy, Kompoti et al.,
(2005) demonstrated that adults with type I diabetes with good glycaemic
control (HbA1c < 7.0%) had significantly higher scores on emotional
regulation than those with poor glycaemic control (HbA1c > 8.0%). Together,
these studies imply that low emotional regulation is disadvantageous and is
related to negative outcomes in type I diabetes.
However, other research conflicts with these findings (Lane et al., 2000;
Taylor et al., 2003; Weissberg-Benchell & Glasgow, 1997). Using Eysenck’s
Chapter 3: Five-factor Personality Traits and Diabetes
52
personality questionnaire, Taylor, Frier, Gold, and Deary (2004) found a
correlation between low emotional regulation and good glycaemic control in a
sample of adults recently diagnosed with type I diabetes. Participants with
poorly regulated emotion demonstrated better HbA1c results 12 months after
diagnosis. Similarly, Lane and colleagues (2000) found lower blood glucose
levels to be associated with lower scores on emotional regulation in a sample
of adults with Type II diabetes. Finally, Weissberg-Benchell and Glasgow
(1997) found that a tendency towards negative moods was also related to
better HbA1c values. Collectively, these studies suggest that low emotional
regulation is associated with better glycaemic control in individuals with
diabetes; a finding that does not sit well with the aforementioned research.
These intriguing results demonstrate an inconsistency within the literature
and suggest that the relationship between emotional regulation and
glycaemic control may be less straightforward than originally conceived.
Whilst it is important to note that the differing methods, measures and
populations employed in these studies could influence results (Chatzialexiadi
et al., 2005; Gilbert, 1992; Lane et al., 2000; Taylor et al., 2003; Vollrath et
al., 2007; Weissberg-Benchell & Glasgow, 1997), these differences may be
better explained by taking a rigorous theoretical approach to the research
findings.
One simple explanation for the differences across studies is that the results
may have been confounded by participants’ experiences of hypoglycaemia.
Experimental research shows that low blood glucose levels can induce
negative mood states (Heller, 2002; McCrimmon, Frier, & Dreary, 1999;
Merbis, Snoek, Kanc, & Heine, 1996) and this tendency towards negative
affect could itself influence scores on measures of emotional regulation.
Hence, researchers need to examine the relationships between negative
affect and hypoglycaemia to ensure that low blood glucose levels do not
unduly prejudice scores on emotional regulation.

Chapter 3: Five-factor Personality Traits and Diabetes
53
A second explanation for the differing results across studies is that the
relationship between emotional regulation and glycaemic control may be
non-linear in nature. In particular, this relationship may reflect a curvilinear
function, which is commonly found in psychological literature (Anderson,
1994; Wiebe & Christensen, 1996). Probably the best known example of a
curvilinear relationship is the Yerkes-Dodson law (1908) which states that
task performance increases with emotional arousal up to an ‘optimum point’;
beyond which reductions in performance occur. Notably, these kinds of
relationships are masked when using traditional linear statistical approaches.
If the relationship between emotional regulation and glycaemic control is
curvilinear, the results obtained from empirical studies would depend on
where along the dimension of emotional regulation the participants tested lie.
Consequently, differences in levels of emotional regulation between samples
could significantly influence research results. Additionally, the strength of any
associations found between these variables would be underestimated using
linear statistics such as correlation and regression (Goodwin & Leech, 2006;
Wiebe & Christensen, 1996). The importance of considering non-linear
relationships when investigating associations between personality and
glycaemic control is clear.
Indeed, there is some evidence to support the existence of a curvilinear
relationship between emotional regulation and glycaemic control. In a study
involving diabetes patients on dialysis treatment, Brickman, Yount, Blaney et
al (1996) demonstrated that extreme scores on emotional regulation (either
high or low) were related to shorter renal deterioration times. These
researchers suggested that those moderate in emotional regulation took
longer to develop the renal complications associated with type I diabetes due
to better long-term glycaemic control. Whilst this study is limited by the
absence of more objective or short-term measures of glycaemic control, the
results do suggest that further consideration needs to be given to the
possibility of a non-linear relationship. These findings suggest that there may
be several pathways linking emotional regulation and glycaemic control.

Chapter 3: Five-factor Personality Traits and Diabetes
54
Levels of negative affect may mediate one such pathway. As mentioned, low
levels of emotional regulation are strongly linked to depression, anxiety and
stress (Bienvenu et al., 2004; Bolger & Zuckerman, 1995; Kendler et al.,
2006; Khan et al., 2005; Lahey, 2009; Roelofs et al., 2008) and these high
levels of psychological distress may impel a person to primarily focus on their
emotions to the detriment of their physical health. Importantly, poor
regulation of emotions could predict reductions in positive health behaviours
as well as increases in negative health behaviours used to help cope with
psychological distress (Vollrath, Knoch, & Cassano, 1999).
Unsurprisingly, research confirms that negative affect influences health
behaviours in type I diabetes. Depression, anxiety and stress are related to
poorer self-care and glycaemic control and low emotional regulation is
related to greater fear of hypoglycaemia, which is known to influence
hypoglycaemia avoidance behaviours such as overeating or deliberate
omission of prescribed insulin dose (Dantzer et al., 2003; De Groot et al.,
2001; Helgeson et al.; Herzer & Hood, 2010; Lustman et al., 2000; Wild et
al., 2007). This suggests that individuals with very low levels of emotional
regulation may be too distressed about their illness (or other aspects of their
life) to adequately self-manage their diabetes.
In contrast, a high level of emotional regulation may be problematic as this
could influence risk judgements and subsequent motivation for self-care.
Individuals high in emotional regulation are more externally focused, discount
health risks and tend to worry less about developing diabetes complications
(Vollrath et al., 1999; Wiebe, Alderfer, Palmer, Lindsay, & Jarrett, 1994).
Importantly, these health perceptions translate into poorer engagement in
self-care behaviours (Skinner, Hampson & Fife-Schaw, 2002).
It may be, then, that a moderate level of psychological distress is needed for
individuals with diabetes to maintain appropriate self-care behaviours over
long periods. Indeed, lower levels of emotional regulation have been
associated with greater attention to symptoms of ill-health, greater utilisation

Chapter 3: Five-factor Personality Traits and Diabetes
55
of health care and overestimation of blood glucose levels (Cox, Borger,
Asmundson, & Taylor, 2000; Howren, Bryant, & Suls, 2011; Rosmalen,
Neeleman, Gans, & de Jonge, 2007; Williams et al., 2010). Such findings
seem to support the Yerkes-Dodson law (1908); peak performance (in this
instance motivation to engage in long-term self-care) is most likely to occur
at optimal levels of emotional arousal.
Whilst it is likely that emotional regulation plays a crucial role in individuals’
long-term management of type I diabetes, further research is needed to
investigate differences in glycaemic control between individuals moderate,
high and low in emotional regulation. By testing for non-linear relationships,
researchers may reduce divergence in the field and achieve more clinically
meaningful results.
Agreeableness
A third personality trait that may influence a young person’s self-
management of type I diabetes is agreeableness. Individuals high in
agreeableness report positive health attitudes, better self-rated health,
superior health maintenance behaviours and less engagement in risky
practices (Bermudez, 2006; Booth-Kewley & Vickers Jr, 1994; Hampson et
al., 2007; Lemos-Giraldez & Fidalgo-Aliste, 1997; Loukas et al., 2000;
Nicholson et al., 2005; Vollrath et al., 1999). They are also more likely to
seek out complementary medicines and are more inclined to adhere to
medical treatments (Ediger et al., 2007; Sirois & Purc-Stephenson, 2008;
Telles-Correia, Barbosa, Mega, & Monteiro, 2009; Zugelj et al., 2010). This
trait is therefore likely to have considerable implications for those working
with young people with type I diabetes.
Indeed, Vollrath and colleagues (2007) have shown that children high in
agreeableness demonstrate better average HbA1c results. For youth in this
study, the agreeableness trait showed the second strongest correlation with
glycaemic control. Similar results have been observed in adults with both

Chapter 3: Five-factor Personality Traits and Diabetes
56
type I and type II diabetes (Auerbach et al., 2002; Szymborska-Kajanek et
al., 2006). In fact, Auerbach et al (2002) showed that a combination of
agreeableness and a desire for behavioural control accounted for as much
as 21% of the variance in patients’ HbA1c scores. Finally, Giles et al (1992)
demonstrated that a socially desirable method of responding to others is
related to better glycaemic control (Giles et al., 1992). Again, this speaks to
the importance of higher levels of agreeableness in determining better self-
care and control of blood glucose levels.
Furthermore, agreeableness has been consistently associated with higher
levels of social support and may actually influence therapeutic relationships
between doctors and patients (Bermudez, 2006; Carver & Connor-Smith,
2010; Stone & McCrea, 2007). Thus, researchers suggest that the negative
correlations between agreeableness and HbA1c may be mediated by trust
and adherence to treatment (Auerbach et al., 2002). Higher agreeableness is
related to greater trust in others and a less confrontational attitude which
may influence a person’s willingness to engage in proper self-care (Costa &
McCrae, 1992a; McGhee et al., 2007; Mooradian, Renzl, & Matzler, 2006;
Sanz, Garcia-Vera, & Magan, 2010).
Conversely, individuals low in agreeableness have been found to have
poorer relationships with health professionals and often report being
unhappy with medical treatments (Carver & Connor-Smith, 2010; Roter &
Hall, 2006; Serber, Cronan, & Walen, 2003; Stone & McCrea, 2007).
Importantly, these relationships with physicians appear to influence
adherence and glycaemic control in people with diabetes (Lee & Lin, 2009;
Mancuso, 2009, 2010). Here, too, there are strong implications for those
working with those with type I diabetes.
However, there is some research to suggest that agreeableness may not
always be a protective factor (Helgeson et al., 2007; Hyphantis et al., 2005;
Lane et al., 2000). For example, Lane and colleagues (2000) found that the
agreeableness facet of altruism was positively correlated with average

Chapter 3: Five-factor Personality Traits and Diabetes
57
weekly blood glucose values and HbA1c scores at baseline, 6 months and 12
months. Intriguingly, this suggests that individuals high in agreeableness
may have spent more time looking after the needs of others than caring for
their own health. Related results were uncovered by Hegelson, Siminerio,
Escobar and Becker (2007) who found that unmitigated communion, a focus
on others at the expense of oneself, was a marginal predictor of poor
glycaemic control in youth with diabetes. Furthermore, individuals with type II
diabetes who adopt a self-sacrificing defence style tend to delay the initiation
of treatment which also has implications for glycaemic management
(Hyphantis et al., 2005). Together, these studies imply that focusing on the
needs of others could prove to be a risk factor for poor glycaemic control.
This research brings the role of agreeableness in type I diabetes into
question (Helgeson et al., 2007; Hyphantis et al., 2005; Lane et al., 2000).
Whilst high levels of this trait may prompt adherence to treatment, they may
also promote a tendency to neglect self-care for the sake of others. Further
research is needed to verify the role of agreeableness in youths’ self-care
and glycaemic management.
It may also be important to investigate the role of agreeableness in people’s
psychological adaptation to type I diabetes. Research suggests that
agreeableness may play a role in determining adaptive coping processes
with this trait having been related to marginal increases in acceptance coping
and some modest decreases in avoidance strategies (Burgess, Irvine &
Wallymahmed, 2010; Carver & Connor-Smith, 2010; Connor-Smith &
Flachsbart, 2007; Hambrick & McCord, 2010; Kidachi et al., 2007; Lawson,
Bundy, Belcher, & Harvey, 2010; Ratsep, Kallasmaa, Pulver, & Gross-Paju,
2000). Whilst the strength of associations uncovered between coping and
agreeableness are negligible when compared to those found for
conscientiousness and emotional regulation (Carver & Connor-Smith, 2010;
Connor-Smith & Flachsbart, 2007), agreeableness has been linked to greater
active coping in youth with type I diabetes (Lawson et al., 2010). If
agreeableness influences levels of acceptance or avoidance coping, this

Chapter 3: Five-factor Personality Traits and Diabetes
58
could have implications for general psychological wellbeing pointing to the
need for further study.
Finally, research suggests that low rates of agreeableness may not only
confer a slight risk for increased depressive symptoms (Kendler & Myers,
2010; Weiss, Sutin, Duberstein, Friedman, Bagby, & Costa, 2009) but also
may make individuals more vulnerable to relapse and recurrence of
depression (Harkness, Bagby, Joffe, & Levitt, 2002; Hoth, Christensen,
Ehlers, Raichle, & Lawton, 2007; Ode & Robinson, 2009; Weiss, Sutin,
Duberstein, Friedman, Bagby, & Costa, 2009). Indeed, high agreeableness is
related to less negative social exchanges and greater social support and this
may influence a person’s recovery from depression (Finch & Graziano, 2001;
Hoth et al., 2007). Furthermore, it would appear that agreeableness interacts
with social support. Individuals high in agreeableness show decreases in
depressive symptomology with increased social support whereas increased
social support has no effect for those with low levels of agreeableness (Hoth
et al., 2007). In all, this research suggests that low levels of agreeableness
may play a more important role in determining recovery from depression than
initial depressive symptoms.
In summary, agreeableness may play a role in determining quality of
diabetes self-management. Whilst the relationship between agreeableness,
self-care and glycaemic control may be complex, prior research involving
youth with diabetes suggests that higher levels of this trait should be
advantageous (Vollrath et al., 2007). Additionally, higher levels of
agreeableness may predict more adaptive coping responses and improved
trajectories of depressive symptoms. Further research is needed to clarify
the role of this trait in trajectories of self-care, glycaemic control and
psychological wellbeing.

Chapter 3: Five-factor Personality Traits and Diabetes
59
Extraversion
Whilst there is relatively strong evidence to suggest that the traits of
conscientiousness, emotional regulation and agreeableness are important to
the self-management of type I diabetes, support for a central role for
extraversion in a person’s management of this disease is less compelling
(Edwards, 1999; Lane et al., 1988; Lustman, Frank, & McGill, 1991; Marks,
2000; Vollrath et al., 2007). Although a significant positive relationship
between extraversion and blood glucose levels has been reported in the past
(Lane et al., 1988), this association has not been widely replicated (Edwards,
1999; Lane et al., 2000; Marks, 2000; Taylor et al., 2003; Vollrath et al.,
2007). Hence, there is little evidence to support a definitive relationship
between extraversion, self-care and glycaemic control.
This may be due to the fact that higher levels of this trait are associated with
both positive and negative health behaviours (Raynor & Levine, 2009;
Rhodes & Smith, 2006). Individuals high in extraversion are more likely to
engage in risky behaviours, smoke cigarettes, drink large quantities of
alcohol, use illicit substances, lose sleep, engage in unsafe sex and have
multiple sexual partners (Munafo et al., 2006; Nicholson et al., 2005; Raynor
& Levine, 2009; Vollrath & Torgensen, 2008). On the other hand, higher
levels of this trait are also associated with positive outcome expectancies
and engagement in health maintenance behaviours (such as physical
exercise) which help to prevent disease (Rhodes & Smith, 2006; Williams,
O'Brien, & Colder, 2004). These findings imply that any relationship between
extraversion and health outcomes may be so complex and affected by other
factors that comprehensive study in individuals with diabetes would prove
difficult to achieve.
However, extraversion may be a somewhat clearer predictor of psychological
wellbeing. Studies suggest modest (r = 0.15) associations between
extraversion and engagement coping with higher levels of extraversion
related to greater acceptance (Carver & Connor-Smith, 2010; Connor-Smith
& Flachsbart, 2007). Further, high extraversion appears to confer a slightly

Chapter 3: Five-factor Personality Traits and Diabetes
60
decreased risk for depression, anxiety and stress although whether low
extraversion is a cause or consequence of psychological distress is debated
(Bienvenu, 2006; Burgess et al., 2010; del Barrio, Moreno-Rosset, Lopez-
Martinez, & Olmedo, 1997; Jylha & Isometsa, 2006; Kendler et al., 2006;
Kendler & Myers, 2010; Kotov et al., 2010).
Altogether, the above research suggests that extraversion may play a limited
role in determining self-management outcomes in youth with type I diabetes.
Whilst to some extent higher extraversion may predict lower rates of negative
affect and better coping, whether these relationships are significant or
influence glycaemic control is yet to be seen.
Openness to experience
Definitive links between openness to experience and management of type I
diabetes are also yet to be established (Edwards, 1999; Lane et al., 1988; P.
J. Lustman et al., 1991; Marks, 2000; Vollrath et al., 2007). Indeed, studies
investigating associations between openness, health behaviours and
psychological wellbeing have often reported mixed results perhaps indicating
that straightforward relations between this trait and diabetes outcomes may
be difficult to uncover (Bermudez, 1999; Booth-Kewley & Vickers Jr, 1994;
Carrillo, Rojo, Sanchez-Bernardos, & Avia, 2001; Kendler & Myers, 2010;
Kotov et al., 2010; Lemos-Giraldez & Fidalgo-Aliste, 1997; Vollrath et al.,
1999; Wolfenstein & Trull, 1997).
For instance, high levels of openness have been related to negative health
behaviours such as substance abuse and risky sexual practices but have
also been related to positive health maintenance behaviours and less driving
accidents (Bermudez, 1999; Booth-Kewley & Vickers Jr, 1994; Lemos-
Giraldez & Fidalgo-Aliste, 1997; Vollrath et al., 1999). Similarly, whilst meta-
analyses and reviews of the literature suggest no link between openness to
experience and disordered levels of negative affect (Kendler & Myers, 2010;
Kotov et al., 2010), higher scores on the aesthetics, feelings and fantasy

Chapter 3: Five-factor Personality Traits and Diabetes
61
facets of openness to experience have been associated with increased
depression whereas higher scores on the actions facet of this trait have been
associated with decreases in depression (Carrillo et al., 2001; Wolfenstein &
Trull, 1997). Hence, the role of openness in type I diabetes management is
likely to be very complex or unpredictable at best.
Indeed, to date, no replicable relationships between openness to experience
and management of diabetes have been reported (Edwards, 1999; Marks,
2000; Vollrath et al., 2007). Furthermore, the existing research involving
conceptually related behavioural traits is inconclusive (Lane et al., 1988;
Lustman et al., 1991; McCrae & Costa, 1999; McCrae & John, 1992). For
example, Lane and colleagues (1988) found that low curiosity was
associated with poorer glycaemic control whereas Lustman, Frank and
McGill (1991) found that low novelty seeking was associated with better
blood glucose control. These results reinforce the notion that the role of
openness to experience may be difficult to predict. Importantly, these
conflicting findings may indicate no relationship between openness and
diabetic management or could indicate the existence of a non-linear
association between these variables. Alternatively, the personality
assessments utilised in prior research may not be comparable or suitably
fine-grained to uncover reliable trends.
Perhaps the only straightforward or predictable relationship between
openness to experience and diabetes outcomes occurs with acceptance
coping. Individuals high in openness are more likely to employ adaptive
coping strategies such as active planning and reframing and typically accept
and deal with stressful experiences (Carver & Connor-Smith, 2010; Connor-
Smith & Flachsbart, 2007; Lawson et al., 2010). Accordingly, clinicians can
expect individuals high in openness to accept a diagnosis of diabetes and
integrate this into their everyday life.
Overall, prior research suggests that personality may play an important role
in determining a youth’s management of type I diabetes. In particular, the

Chapter 3: Five-factor Personality Traits and Diabetes
62
traits of conscientiousness, emotional regulation and agreeableness may
have a significant influence on self-care, glycaemic control, coping, and
levels of negative affect. Based on this research, it appears that individuals
high in conscientiousness and agreeableness and moderate in emotional
regulation may display superior self-care and glycaemic control whereas
individuals high in conscientiousness, agreeableness and emotional
regulation may display greater psychological wellbeing. Although the
influence of extraversion and openness upon diabetes outcomes may be
restricted, these traits may play a small role in determining levels of
acceptance coping and depression. Given the small amount of research
looking at self-care, glycaemic control and psychological wellbeing in youth
with type I diabetes, further research is needed to confirm or clarify these
relationships.
New directions for research
Whilst the abovementioned personality studies have provided a wealth of
information to help clinicians individualise treatment approaches for youth
with type I diabetes, there is room for methodological development and new
avenues of inquiry within this field. In order to improve and extend upon the
existing studies, researchers can propose and test methodological and
theoretical explanations for research findings, promote a more
comprehensive view of diabetes self-management, and examine the role of
personality in self-management outcomes over time. By enhancing research
in these ways, it may be possible to achieve a greater understanding of the
relationship between a young person’s personality and how they manage
their diabetes. Accordingly, specific approaches to achieving these goals are
discussed below.
Proposing methodological and theoretical explanations for
research findings
As stated earlier, personality research involving individuals with diabetes has
at times provided mixed results (Chatzialexiadi et al., 2005; Gilbert, 1992;

Chapter 3: Five-factor Personality Traits and Diabetes
63
Lane et al., 2000; Taylor et al., 2003; Vollrath et al., 2007; Weissberg-
Benchell & Glasgow, 1997). Consequently, it is difficult to translate this
research into resolute practical recommendations or guidelines that could
promote optimal self-management in youth with type I diabetes. Theorists
have argued that a lack of consistent and reliable findings is one of the
biggest impediments towards developing a comprehensive model of diabetes
self-management (Lorig, 1993). Therefore, it is key that researchers find
methodological or theoretical explanations for incongruent or unexpected
research results.
The simplest way of explaining unexpected results is to look in detail at the
research methodologies of conflicting studies. By taking study design and
measurement methodology into account, it is possible to determine whether
unanticipated results represent a genuine effect or whether these findings
are a product of a particular research approach. Although the ability of the
five-factor model to provide reliable and valid personality data has already
been highlighted (Bermudez, 1999; Marshall et al., 1994), there are other
methodological considerations that may also be important.
One explanation for the differing results across prior studies is that some
investigations have employed samples that have amalgamated distinct
groups such as populations with type I and type II diabetes (Edwards, 1999;
Lustman et al., 1991) or children and adults (Skinner et al., 2002). Another
explanation for differences in study results is that researchers have at times
employed outcome measures which cannot be readily compared which
makes evaluating results across investigations difficult. For instance, some
researchers have measured self-care behaviours in youth with type I
diabetes whilst others have employed HbA1c as an index of behavioural
management (i.e. Skinner et al., 2002; Vollrath et al., 2007).
These difficulties indicate that researchers need to emphasise research
design and methodology when comparing and contrasting their results with
the work of others. Future studies should focus on well-defined populations

Chapter 3: Five-factor Personality Traits and Diabetes
64
and employ standardised measures such as HbA1c or scientifically validated
scales to ensure some equivalency of research outcomes. By using this
approach, researchers can conduct replicable and valid psychological
research, which will help to determine reliable associations between
personality and diabetes management.
A second method of explaining unexpected research results is to explore
extraneous variables that may be influencing outcomes. Demographic and
treatment variables could alter the strength and direction of relationships
uncovered between personality and diabetes self-management, suggesting
that researchers may need to control for the influence of these factors. In
particular, variables such as the participant’s age, gender, duration of
diabetes and responsibility for diabetes tasks may have a significant impact
on relationships between personality and self-management.
The influence of these extraneous variables is especially important to
consider when studying younger individuals. Indeed many of these people
may not be old enough or have had diabetes for long enough to take
complete responsibility for carrying out many diabetes tasks. By
understanding the influence of demographic and treatment variables upon
self-management outcomes researchers can control for the influence of
these variables and propose testable hypotheses to explain conflicting
results.
A final method of explaining incongruent results is to interrogate theoretical
accounts for research outcomes. To date, personality research in the area of
type I diabetes has not been extensively tied to theoretical models and this is
unfortunate as theory can help to clarify results and provide further testable
hypotheses. By appropriating theoretical models from other relevant areas of
psychology researchers may find solutions to research quandaries and
promote a more comprehensive understanding of the role of personality in
type I diabetes. To do this, researchers can focus on established personality-
health models and hypothesise mediating pathways worthy of further

Chapter 3: Five-factor Personality Traits and Diabetes
65
attention. As mentioned, it may also be important to examine the potentiality
of non-linear relationships. This analytical approach to explaining research
results was employed in the current study.
Promoting a comprehensive view of diabetes self-management
A second way of improving upon prior research is to endorse a more
comprehensive view of diabetes self-management. Whilst theorists argue
that chronic condition self-management involves a complex interplay of
psychosocial, demographic and service factors (Flinders Human Behavioural
& Health Science Unit, 2006), this paradigm has not been consistently
studied by personality researchers. Thus far, personality studies involving
participants with diabetes have typically focused on a single or small number
of measures (such as HbA1c) to define a person’s quality of diabetes self-
management (Lane et al., 2000; Vollrath et al., 2007). Unfortunately, this
approach does not fully explain the complexity of the experience of chronic
disease. Indeed, the role of personality in determining psychological
wellbeing, tendency towards hypoglycaemia, or engagement in specific self-
care behaviours in individuals with type I diabetes has received little
attention.
There is thus still much to know about how an individual’s personality may
influence their day-to-day management of type I diabetes. To do so the
scope of current personality research needs to be broadened by including
measures of psychological wellbeing such as depression, anxiety, stress,
and coping alongside indices of HbA1c, hypoglycaemia and self-care
behaviour. This could help us to obtain a more comprehensive picture of the
role of five-factor model traits in the management of young people’s
diabetes.

Chapter 3: Five-factor Personality Traits and Diabetes
66
Examining the role of personality in self-management outcomes
over time
A final way of improving upon prior personality research involving individuals
with diabetes is to investigate the role of personality factors in trajectories of
diabetes self-management. To date, personality studies involving individuals
with diabetes have largely employed cross-sectional or retrospective designs
making it difficult to examine the role of personality in diabetic management
over time (Brickman et al., 1996; Marks, 2000; Skinner et al., 2002; Vollrath
et al., 2007 etc).
Importantly, retrospective personality research is problematic as it may be
subject to recall bias. Further, it is difficult to infer causality using this
research design; personality may influence health status or health status
may influence personality (Smith & Spiro, 2002). Cross-sectional research is
also problematic as this only provides a brief snapshot of the relationship
between personality and health. Using cross-sectional methods it is
impossible for researchers to test the reliability of uncovered associations or
elucidate the role of personality in trajectories of important outcomes (Smith
& Spiro, 2002). Therefore, it is critical to conduct longitudinal research to
examine whether five-factor model traits predict improvement, stability or
deterioration in diabetes self-management. By engaging in this research it
may be possible to identify personality risk factors that have a cumulative
impact over time.
Overall, the limitations of prior research demonstrate that there is still much
to know about the role of personality in diabetes self-management. Future
research can expand on this groundwork by proposing and testing
methodological and theoretical explanations for research findings, promoting
a comprehensive view of diabetes self-management, and examining the role
of personality in trajectories of management outcomes. This approach could
lead to a more in-depth understanding of how a person’s personality
influences their management of diabetes and could help to identify
individuals who need extra support.

Chapter 3: Five-factor Personality Traits and Diabetes
67
Aim, research questions and hypotheses
The current research study was designed to build upon the previously
conducted personality investigations in the area of adolescent type I diabetes
(Skinner et al., 2002; Vollrath et al., 2007). The study aims to elucidate the
role of five-factor model traits in trajectories of diabetes self-management in
youth aged 8 to 18 years at baseline. By utilising the five-factor model in
conjunction with outcome measures of HbA1c, frequency of hypoglycaemia,
blood glucose testing behaviour, depression, anxiety, stress and coping, it
was hoped that a comprehensive picture of the role of personality in the
management of this disease would emerge. Accordingly, the research
questions for this study are listed below.
Research Question 1:
What relationships exist between five-factor model traits and HbA1c,
hypoglycaemia, frequency of blood glucose testing, depression, anxiety,
stress, avoidance coping and acceptance coping in youth with type I
diabetes? What are the directions of these relationships and are they linear?
Research Question 2:
Are there particular five-factor model traits that predict HbA1c,
hypoglycaemia, frequency of blood glucose testing, depression, anxiety,
stress, avoidance coping and acceptance coping independent of age,
duration of diabetes, responsibility and gender? Which five-factor model trait
is the best personality predictor of these specific self-management
outcomes?
Research Question 3:
Do five-factor model personality traits predict trajectories of HbA1c,
hypoglycaemia, frequency of blood glucose testing, depression, anxiety,
stress, avoidance coping and acceptance coping over time?

Chapter 3: Five-factor Personality Traits and Diabetes
68
Hypotheses
Based on the reviewed literature, hypotheses for the role of each five-factor
personality trait were proposed:
Conscientiousness should be a protective factor independent of
control variables. Individuals high in conscientiousness should display
greater self-care and superior glycaemic control as indexed by more
frequent blood glucose testing, less frequent hypoglycaemia and
lower annual HbA1c scores. Furthermore individuals high in
conscientiousness should display better psychological wellbeing as
measured by lower levels of depression, anxiety, stress and
avoidance coping and higher levels of acceptance coping. Differences
between those high and low in conscientiousness at baseline should
remain stable or increase over time.
Emotional regulation should have a clear relationship with
psychological wellbeing. Low levels of emotional regulation should
predict greater depression, anxiety, stress and avoidance coping and
lower levels of acceptance independent of control variables. Moderate
levels of emotional regulation may predict greater blood glucose
testing, less frequent hypoglycaemia and lower annual HbA1c results.
Differences between emotional regulation groups at baseline should
remain stable or increase over time.
Agreeableness should also be a protective factor independent of
control variables. Individuals high in agreeableness should display
greater self-care and superior glycaemic control and greater overall
psychological wellbeing. Differences between those high and low in
agreeableness at baseline should remain stable or increase over time.
Extraversion may play a limited role in determining self-management
outcomes. Individuals high in extraversion may display greater overall
psychological wellbeing as indicated by lower levels of depression,

Chapter 3: Five-factor Personality Traits and Diabetes
69
anxiety, stress and avoidance coping and higher levels of acceptance
coping. These relationships may not reach statistical significance.
There may be a weak relationship between high extraversion and
worse glycaemic control as measured by HbA1c. Differences between
those high and low in extraversion may be variable over time.
Openness to experience may also play a limited role determining self-
management outcomes. Individuals high in openness may display
greater acceptance coping. Differences between those high and low in
openness to experience may be variable over time.
To date this study is the only prospective longitudinal study of five-factor
model traits in youth with type I diabetes to employ a battery of self-
management outcomes measures. By examining changes in specific
outcomes over time it may be possible to identify five-factor model traits that
predict improvement or deterioration of diabetes management throughout
adolescence.
Chapter 4
Design and Methodology
The current personality investigation was an extension of the Diabetes
Research into Adolescent Transitions (DRAT) project, a comprehensive
study exploring the complex interplay among a host of psychosocial,
demographic, family and service factors and glycaemic control in 158
Australian children and adolescents (8-18 years) with type I diabetes. The
DRAT project ran for three years and aimed to map the range of pathways
leading to optimal self-management of type I diabetes by determining the
relative contribution and stability over time of these factors.
The decision to investigate the role of personality within the scope of the
DRAT project was made after the first wave of data collection was initiated.
The rationale for including a personality scale to the battery of existing
measures came from theoretical and research considerations (Wiebe &
Smith, 1997) and on the basis of anecdotal reports from parents of
participants in the DRAT study who saw their child’s personality as important
in managing diabetes. A number of parents referred to the importance of
stable traits such as dependability and conscientiousness when discussing
their child’s self-management and this suggested that studying personality
might be a worthy avenue of inquiry.
In order to investigate the role of personality in young people’s management
of type I diabetes, the five-factor personality inventory for children (FFPI-C)
was added to the battery of DRAT measures. For the current investigation,
child personality data and related consent forms were gathered from 142

Chapter 4: Design and Methodology
71
families in the DRAT project with 104 of these families (65.8% of the total
sample) returning data for all 3 years of the study
The DRAT project design
The DRAT project incorporated a longitudinal, cross sectional design with
annual quantitative data on metabolic control, psychosocial, demographic
family and service variables gathered over three years. Participants were
also contacted quarterly via the telephone to collect self-reported data on
diabetes control.
To maximise variability in the demographic variables of interest, the decision
was made to recruit DRAT participants across the state of New South Wales
and the Australian Capital Territory. This approach differentiates this project
from many others in the area of type I diabetes research in that we engaged
participants independent of source of care and thus did not simply rely on a
single sample drawn from one hospital population. In addition, the decision
was made to hold annual interviews at the participants’ homes in the interest
of maximising retention rates for the DRAT project. Annual interviews
provided the opportunity to foster positive and genuine relationships between
the DRAT researchers and participating families and this appeared to be
successful with the DRAT project recording relatively small dropout rates
(143 retained from 158 over three years). This is especially noteworthy for
research involving children and adolescents.
The broad and comprehensive approach to data collection taken in the
DRAT project prohibited the recruitment of a very large sample due to the
financial and time constraints associated with travel for annual interviews and
quarterly phone calls. Nevertheless, given the amount and richness of
information gathered from participating families, the DRAT project represents
a comprehensive and in-depth study of a varied sample of youth with type I
diabetes.

Chapter 4: Design and Methodology
72
Recruitment of participants
Research documents the difficulties of recruiting young participants for
research studies, particularly those over 15 years (Croft, Webber, Parker, &
Berenson, 1984; Gattuso, Hinds, Tong, & Srivastava, 2006; Liese et al.,
2008; Roberts, 2000). For example, in a large study looking at participation
rates in youngsters with diabetes (Liese et al., 2008), individuals between 15
and 17 years were about half as likely as children younger than 10 to
participate in research. Individuals aged 18 years of age at recruitment had
an even smaller likelihood of participating.
Research shows that employing a variety of approaches to recruitment tends
to lead to optimal participation (Drews et al., 2009). Hence, the DRAT project
utilised a variety of recruitment methods which are outlined below.
Recruitment efforts were focused in New South Wales (NSW) and the
Australian Capital Territory (ACT) and the broad and mixed-method
approach employed ensured wide variation in potential demographic factors
of interest. Figure 4.1 shows the geographical locations across NSW and the
ACT where participants lived at baseline.
One of our first and most successful recruitment approaches involved
advertising the DRAT project. Paid advertisements were included in the New
South Wales Sunday Herald newspaper and diabetes relevant magazines
(Appendix 1). Posters and advertisements were also displayed in pertinent
areas around hospitals, pharmacies, schools, and in school letters (Appendix
2). The DRAT project also arranged for an information sheet and consent
form to be sent to families who were registered members of the Juvenile
Diabetes Research Fund (JDRF) notifying them of the study (Appendix 3).
This gave the project exposure to a broad demographic of individuals who
met the criteria for inclusion. These advertisements provided information
about the project and contact details of project organisers for interested
individuals to contact.

Chapter 4: Design and Methodology
73
Figure 4.1: Geographical distribution of DRAT study participants at baseline
Next, researchers visited participating diabetes clinics and gave individuals
aged between 8-19 years and their parents information about the project
together with a reply paid envelope to mail the consent form if they wished to
participate (see Appendix 3). Contact details of the researchers were
provided in case the young person or their family wanted more information
before making a decision. Participants were also recruited from the hospital
clinic setting by clinic staff, using the information sheet regarding the project
(see Appendix 3). Local nursing staff were asked to speak to potential
participants about the study at their appointment and provide them with the
information statement, consent form and a stamped self-addressed
envelope.
A final method of recruitment used was a snowball recruitment approach
(Appendix 4). Participating families who knew someone else who was
eligible to participate were asked to pass on the study information to third

Chapter 4: Design and Methodology
74
parties and leave it to them to initiate contact with the researcher if they were
interested.
The DRAT recruitment period ran from late 2006 to mid 2007 and resulted in
a final sample size of n =158. We had initially hoped to recruit 200
participants for the DRAT project but stopped recruitment at just over 6
months to enable the study to be completed within the proposed timeframe.
Given the difficulty of recruiting young people for research studies (Liese et
al., 2008), it is unsurprising that we were unable to reach a sample of 200
participants in the allocated timeframe. Indeed, longer recruitment periods
are to be expected when recruiting children and adolescents (Savage &
McCarron, 2009).
The personality study design
As an extension of the DRAT project, the current study incorporated the
same recruits, design and measures as the parent study. The aim of the
personality study was to determine the role of personality in the self-
management of young people’s diabetes by examining the associations
between five-factor model traits and the psychosocial, physiological and self-
care variables measured in the DRAT project.
However, because the personality inventory was included after the first wave
of DRAT data collection had commenced, a different approach was needed
to gather these data. Participants received an additional informed consent
form (Appendix 5), and an instructional form (Appendix 6), so that personality
data could be gathered either through postal or interview methods (see
procedures). Due to this different method of data collection, the personality
study received less returned data from the participating families than the
DRAT project. Thus, to allow for longitudinal comparisons, statistical
analyses for this research thesis were conducted using only the information
from participants returning all three years of personality data (n = 104).

Chapter 4: Design and Methodology
75
This provided three waves of personality data that could be matched to the
three waves of annual data collected through the DRAT study. Whilst the
association between the first wave of personality and DRAT data was
retrospective in nature, the amount of time between data collection points
was minimal (1-5 months). Furthermore, it was important to include this
information to have three waves of data to test longitudinal stability and
change.
Measures
Due to the reduced number of participants returning personality data for all
waves, and the large number of measures involved in the DRAT project, the
decision was made to analyse a subset of the battery of completed DRAT
measures for this research thesis. This decision was made in the interest of
reducing the likelihood of type I error and for the purpose of focus for the
thesis. The Self Description Questionnaires (Marsh, 1988, 1990a, 1990b),
the Michigan Diabetes Research Centre’s Brief Diabetes Knowledge Test
(Michigan Diabetes Research Training Center) and the Self Efficacy for
Diabetes Scale (Grossman, Brink, & Hauser, 1987) were excluded from
analyses. Accordingly, a short synopsis of these excluded measures and the
reason for their exclusion is detailed in the appendices (Appendix 7).
The measures included in the personality study assessed demographic
characteristics, diabetes treatment modality, level of responsibility for
diabetes care, personality traits, quality of diabetes control and levels of
psychological wellbeing. These included measures are detailed below.
Demographic information
Demographic information was collected using an annual personal information
form (Appendix 8). Information was gathered on the participant’s contact
details, age, gender, age of diagnosis with diabetes and geographical
location. Furthermore, parents of participants were asked to report annual
household income on a four-point scale aligned with corresponding

Chapter 4: Design and Methodology
76
Australian Census data (less than $31,199, $31,200 to $51,999, $52,000 to
$83,199 and more than $83,200) (Australian Bureau of Statistics, 2006b).
Parents were also asked to provide information about their ethnic origin.
Further data such as the child’s birth order, family history of diabetes, and
work/study arrangements were gathered, although, these variables were not
included in analyses.
Diabetes treatment and level of responsibility for care
Self-report information on participants’ treatment for diabetes was gathered
at the three annual visits using an annual data collection form (Appendix 9).
Quarterly updates were made over the phone using a shortened version of
the annual form (Appendix 10). To determine method of diabetes treatment,
individuals were asked whether they were primarily using injections or an
insulin pump to deliver insulin.
In addition, the Diabetes Family Responsibility Questionnaire (DFRQ)
(Anderson et al., 1990) was used at each annual interview to measure parent
involvement in their child’s diabetes care (Appendix 11). The DFRQ is a 17-
item scale designed to assess sharing of diabetes responsibilities between
children with type I diabetes and their parents. The measure was piloted on
121 American youth (aged 6-21) with type I diabetes and their mothers and
measures perceptions of who takes responsibility for specific diabetes tasks.
Personality
Quantitative personality data for this study were gathered using the Five-
Factor Personality Inventory for Children (FFPI-C). The FFPI-C is an un-
timed pen and paper questionnaire designed to tap the big-five personality
dimensions of openness to experience, conscientiousness, extraversion,
agreeableness and emotional regulation in children and adolescents aged
from 9 years, 0 months to 18 years, 11 months (McGhee et al., 2007). The
FFPI-C was normed on an age-stratified sample of 1,284 North American
youth and has demonstrated high test-retest reliability (r for different factors

Chapter 4: Design and Methodology
77
ranging from 0.84 to 0.88 over two week period), internal consistency (alpha
for different factors ranging from 0.74 to 0.86) and criterion-related validity
(McGhee et al., 2007). It is an efficacious measure for this study as it is
representative of our cohort, takes only a short period of time to complete
and can be self-administered, individually administered or group
administered (McGhee et al., 2007). Due to copyright issues, the Five-Factor
Personality Inventory for Children is not available in the appendices of this
thesis.
The FFPI-C consists of 75 items (15 items per factor) with each item having
two opposing anchor statements aimed to assess trait variability on the
dimensions of the five-factor model. There are five circles between the
anchor statements which allow the test taker to choose the statement that
best reflects their opinion and make a qualitative decision on the degree of
support for their choice (McGhee et al., 2007). If a person agrees with a
sentence they are instructed to colour in the circle closest to that sentence. If
they somewhat agree they are asked to colour in the second closest circle to
that sentence. If unable to decide between sentences, test takers are
instructed to colour in the middle circle. Test takers are instructed that there
are no right or wrong answers but are encouraged to make a decision
between statements and use the middle circle as little as possible. In the
practice example below the individual has indicated that they somewhat
agree with the statement ‘I think dogs are nice’.
Example:
I think dogs are nice. ○ ● ○ ○ ○ I think dogs are scary.
(McGhee, et al., 2007, p. 7)
To score the FFPI-C all questions need to be answered. Raw scores are
then summed (some questions are reversed) for each dimension (15 items
for each factor) and converted to T-scores using the manual provided (see
FFPI-C manual for T-score conversion tables). T-scores are computed from
a distribution that has a mean of one and a standard deviation of ten and

Chapter 4: Design and Methodology
78
provide a more accurate and understandable indicator of variation in a
person’s personality profile (McGhee et al., 2007).
Whilst the DRAT project included participants out of the age range of the
FFPI-C norms (thirteen participants under 9 years old and two participants
over 18 and 11 months at baseline), the benefits of employing a single and
reliable measure of personality were considered to outweigh any potential
disadvantages. The FFPI-C has a low reading level (year three) (McGhee et
al., 2007) and was judged as the best available measure for indexing five-
factor model dimensions within our cohort. To further ensure the validity of
FFPI-C responses, parents were instructed to help younger children with any
difficult or ambiguous items if needed.
Self-care behaviours
Information relating to the participants’ adherence to insulin regimen, health-
care utilisation and frequency of blood glucose testing were gathered using
the annual data collection form at the three annual visits (Appendix 9).
Quarterly updates were collected over the phone using the abridged form
(Appendix 10). To measure adherence to insulin, participants were asked
whether they had taken their insulin as prescribed and were provided with a
four-point ordinal scale to answer (none of the time, some of the time, most
of the time or all of the time). Frequency of blood glucose testing was
measured by asking the participant to recall the number of blood glucose
tests carried out over the preceding two weeks. Self-reports of glucose
testing were matched against actual test results recorded in the memory
meters of blood glucose monitors and were closely correlated (r = 0.86 in
year one, r =0.82 in year two, r = 0.81 in year three, all p’s < 0.01). Finally,
self-report information on health-care utilisation was gathered by noting the
number of planned and actual attendances at appointments with diabetes
health care professionals over the preceding three-month period.

Chapter 4: Design and Methodology
79
Glycaemic control
Glycosylated haemoglobin (HbA1c) levels were employed as an objective,
physiological index of glycaemic control. Researchers collected a capillary
blood sample from participants at annual visits and sent the sample to a
central laboratory to undergo an HLPC assay. The same laboratory and
HLPC assay were used for all three years of the study. As aforementioned,
HbA1c serves as a broad index of blood-sugar levels over the preceding 6-8
weeks and is commonly accepted as the best available measure of
glycaemic control (Hanas, 1998; Kilpatrick, 2000).
To avoid the development and progression of diabetes complications, the
International Society for Pediatric and Adolescent Diabetes (ISPAD) and the
Australian National Health and Medical Research Council (NHMRC) suggest
a general target HbA1c range of < 7.5% for all youth (National Health and
Medical Research Council, 2005; Rewers et al., 2009). Thus for the current
study, participants with HbA1c values above 7.5% were considered to have
‘poor’ glycaemic control.
Incidence of hyperglycaemic emergency and hypoglycaemia
The frequency and severity of hypoglycaemia (low blood glucose) and
diagnosis of hyperglycaemic emergency (very high blood glucose) were
recorded on a quarterly basis. At the three annual visits and on a quarterly
basis for the first two years of the study participants were asked how many
times they had obtained a blood glucose reading below 3 mmol/L in the last
two weeks. They were also asked to count the number of hypoglycaemic
attacks that led to unconsciousness and the number of times they had been
admitted to hospital with elevated blood glucose levels over the preceding 3
months (see Appendices 9 and 10).
Depression, anxiety and stress
Data on stress and emotional states in our sample were gathered annually
using the Australian developed, short form of the Depression, Anxiety, Stress

Chapter 4: Design and Methodology
80
Scales (DASS21) (Lovibond & Lovibond, 1995a), a set of brief self-report
measures designed to index changes in the core emotional symptoms of
depression, anxiety and stress over time (Appendix 12).
The Depression, Anxiety, Stress Scales (DASS) were originally developed
with the aim of creating a measure of depression and anxiety that provided
maximum discrimination between these conceptually distinct constructs.
Depression and anxiety inventories had historically shown high correlations,
and by removing any item overlap between scales, Lovibond and Lovibond
(1995a) were able to minimise construct relatedness. Through the
development process of the DASS, multiple group factor analysis revealed a
third factor of stress that appeared to deal with non-specific arousal (such as
restlessness). This factor was considered sufficiently differentiated from
anxiety to warrant the addition of further items to define the stress construct.
In an iterative procedure, the researchers added stress-related items and
removed items that did not load substantially on any of the scales. This
process resulted in the final 42-item Depression, Anxiety, and Stress Scales
(DASS) that employed 14 items for measuring each construct. The DASS21
is a shortened version of the complete Depression, Anxiety, and Stress
Scales that was created for testing situations where a brief measure is
required and includes 7 items for measuring each construct (norms for these
constructs are provided in Appendix 13).
One of the major strengths of the DASS is that they are based on a
dimensional rather than categorical conceptualisation of psychological
disorder. On the basis of clinical and pilot research for the DASS, Lovibond
and Lovibond (1995) concluded that the experience of depression and
anxiety is not qualitatively different between clinical and non-clinical
populations. This approach suggests that anxiety and depression run along a
continuum and it is the degree of severity that differentiates these groups.
Consequently, the DASS was normed on a non-clinical population and is
valid for use in both clinical and non-clinical populations

Chapter 4: Design and Methodology
81
Specifically, the DASS was normed on 2,914 Australian individuals aged 17-
69 years who showed no clinical signs of depression or anxiety (Lovibond &
Lovibond, 1995a). Both the DASS and the DASS21 have high internal
consistency, show good criterion-related validity, and can measure current
state or change in depression, anxiety and stress over time (Lovibond &
Lovibond, 1995a, 1995b). Notably, the scales can be administered and
scored by non-psychologists.
Both the DASS and the DASS 21 are designed to measure emotional states
rather than traits. Respondents are asked to rate the degree to which they
have experienced each state over the past week on a four point scale
ranging from 0 (did not apply to me at all) to 3 (applied to me very much or
most of the time). The three distinct scale scores are determined by
summing the scores for each relevant item. Importantly, the scales of the
DASS21 were created by selecting items that were representative of the
subscales in the full version DASS (7 subscales for depression, 4 for anxiety,
5 for stress) and can hence be converted to full DASS scores by multiplying
by 2.
Z scores can be computed from the full-scale scores so that comparisons
can be made across the depression, anxiety and stress scales and against
normative values (Z score conversions for the DASS 21 are listed in
Appendix 14). The researchers also provide recommended cut offs for
conventional severity levels, which can be seen in Table 4.1.
Due to the positive skew of the normative data, a Z score of 0 corresponds to
the 60th percentile, which indicates that 60% of the subjects in the sample
scored at or below the mean. These individuals are assigned to the ‘normal’
category indicating that there is no significant emotional disturbance within
this group. The category ‘mild’ is given to depression, anxiety or stress
scores that fall between the 78th and 87th percentile, ‘moderate’ refers to
scores between the 87th and 95th percentile ‘severe’ refers to scores within

Chapter 4: Design and Methodology
82
the 95th and 98th percentile and ‘extremely severe’ refers to scores between
the 98th to 100th percentile.
Table 4.1: Raw scores for DASS and related Z scores and percentile ranks
Raw Scores
Z Score Percentile Depression Anxiety Stress
Normal
< 0.5 0-78 0-9 0 -7 0-14
Mild
0.5 – 1.0 78-87 10-13 8-9 15-18
Moderate
1.0 – 2.0 87-95 14-20 10-14 19-25
Severe
2.0 – 3.0 95-98 21-27 15-19 26-33
Extremely Severe > 3.0 98-100 28+ 20+ 34+
* Conversion of Z scores to percentiles is not exact because frequency distributions for the DASS are un-identical
(Lovibond & Lovibond, 1995a, p. 27)
Whilst the lower age limit of the development sample for the DASS was 17
years (Lovibond & Lovibond, 1995a), the researchers who developed these
scales argue that there should be no problem using them with children as
young as 12-years. This is still a concern for our sample though, as we
included participants as young as 8 years old. Unfortunately, there are few
measures of depression, anxiety and stress that were developed for younger
populations that can be scored easily by non-psychologists.
To help ensure that the DASS was scored correctly for those of a younger
age, researchers in the DRAT project were careful to ensure that the
participants understood the meaning of each item during testing. Whilst this
cannot assure the validity of participants’ responses, there appeared to be no
comparative measures available for the age group in our sample and we
were hesitant to use a multitude of differing measures of depression, anxiety
and stress within the same study.

Chapter 4: Design and Methodology
83
Coping
Coping was measured at baseline and annually using a modified version of
the Coping with a Disease (CODI) questionnaire (Petersen, Schmidt,
Bullinger, & the DISABKIDS Group, 2004). The CODI is a 29-item measure
designed to assess how well a young person handles living with a chronic
disease and how upsetting tasks or thoughts related to their illness are
(Appendix 15). The scale was piloted on a sample of 188 young people
(aged 8-18 years) with a range of chronic diseases hailing from several
countries and has been shown to be a valid and reliable measure for
estimating patients’ general coping with chronic disease (Petersen et al.,
2004). The CODI can be administered and interpreted quickly and easily,
making it useful for research studies such as this one involving a battery of
tests.
There are six hypothetically orthogonal subscales of the CODI, which are
indexed on a 5-point likert scale ranging from ‘never’ to ‘always’. These
factors are acceptance, avoidance, cognitive-palliative coping, distance,
emotional reaction, and wishful thinking. There is also one question focused
on overall coping which asks the individual to rate how well they cope with
their disease on a 5-point likert scale ranging from ‘not very well’ to ‘very well’
(Petersen et al., 2004). To make the CODI more suitable for the population
under investigation, we replaced the word ‘illness’ with ‘diabetes’ in 15 of the
original 29 items. These modifications were deemed innocuous, as they did
not change the actual content of the questions.
As the CODI subscales are unable to be meaningfully aggregated, the a
priori decision was made to employ only two subscales from this measure in
statistical analyses. The avoidance and acceptance subscales were chosen
for this purpose as they have been more consistently studied than the other
factors (Connor-Smith & Flachsbart, 2007), have been linked to management
of type I diabetes in prior studies (Coelho et al., 2003; Duangdao & Roesch,
2008; Hanson et al., 1989) and were most closely aligned with structural and
hierarchical models of general coping (Connor-Smith & Flachsbart, 2007).

Chapter 4: Design and Methodology
84
Furthermore, the items within these scales were considered to best gauge
how well an individual with type I diabetes has adapted to living with their
disease. The test-retest reliability scores, range, means and standard
deviation for the included CODI subscales are detailed below in Table 4.2.
Table 4.2: Psychometric properties of CODI subscales
Scale Range Mean Std. Dev
Acceptance 0.83 6-30 22.66 5.15
Avoidance 0.72 4-20 12.74 4.01
(Petersen et al., 2004, p. 639)
A limitation of the CODI is that it has not been comprehensively normed
(Petersen et al., 2004) which makes it difficult to compare the results
obtained from the current study to the CODI development sample. The
original CODI data showed signs of skew (Petersen 2010, personal
communication, September, 2010) yet details regarding medians and inter-
quartile ranges for the developed sub-scales are not provided with the
measure (Petersen et al., 2004). Unfortunately CODI researchers were
unable to access this information at the time of data analysis (Petersen 2010,
personal communication, September, 2010).
This means that it is difficult to compare scores on this measure across
populations. Nevertheless, the CODI appears to be the only measure
available that is designed for gauging levels of coping in children with a
chronic disease (Petersen et al., 2004) and is a useful measure for the
purpose of understanding the role of personality in coping with type I
diabetes in the current sample.
Procedures
The procedures for the personality study (with which this thesis is concerned)
largely followed those of the DRAT parent study (see Figure 4.2). For clarity,
the procedures relevant to the collection of data and retention of participants
for the personality study are covered below.

Chapter 4: Design and Methodology
85
Figure 4.2: Procedures for the current personality study
Annual visits
Data collection interviews were held at participants’ homes and the average
length of time between these visits was 12.60 months (S.D. = 1.81). After
receiving informed consent, participating families were contacted by phone to
organise a time for a data collection interview at their home. Participating
families were reminded that the interview would take about one hour and that
the young person with diabetes and the parent most responsible for diabetes
care would both need to be present. Parents were not strictly required to be
at interviews for participants older than eighteen years. During the interview,
participants and their parents were asked to complete the battery of
psychosocial, demographic, family and service measures and the young
person with diabetes was asked to provide a sample of blood to undergo
HbA1c analysis. To improve validity of responses, participants were
instructed not to spend too much time on any particular items in the battery
of questionnaires and, researchers were available to provide support with
clarifying any difficult or ambiguous items.
As touched upon earlier, the decision to conduct interviews at the
participants’ homes was made in order to improve retention rates for the
Recruitment
Home visit – year 1
Home visit – year 2
Home visit – year 3
Telephone reviews (3 2
nd personality
questionnaire posted
3rd
personality questionnaire posted
1st personality
questionnaire taken to interview or posted

Chapter 4: Design and Methodology
86
study. Young people are notoriously difficult to retain in longitudinal research
studies (Bruzzese, Gallagher, McCann-Doyle, Reiss, & Wijetunga, 2009;
Jones & Broome, 2001; Kealey et al., 2007; Seed, Juarez, & Alantour, 2009;
Villarruel, Jemmot, Jemmot, & Eakin, 2006) and retention rates can be
improved by researchers developing a relationship with participants and
providing empathy and respect (Good & Schuler, 1997; Jones & Broome,
2001). Annual visits provided the opportunity for researchers to build genuine
relationships with participating families and this appeared to influence
retention rates in both the DRAT sample and the specific personality study.
Over the three years, a small number of families were unable to arrange a
suitable time for interviews. In this case, participants were sent a postal pack
that included a letter of thanks (Appendix 16), a list of questionnaires to be
completed (Appendix 17), and instructions on how to collect and send a
blood sample for HbA1c analysis (Appendix 18).
Quarterly phone calls
Participating families were called every three months via the telephone to
collect self-reported data on self-management and diabetes control. This
information provided researchers with a rich and detailed view of the
individual’s self-management of diabetes over time and reduced the potential
for recall bias. By examining the quarterly data, it was possible to examine
stability and change in the quality of self-management over time.
Quarterly phone calls also provided frequent contact between participants
and researchers which can help maximise retention rates (Bruzzese et al.,
2009). Quarterly phone calls were non-invasive and took no more than ten
minutes to complete. If unable to contact the participating family within 8
weeks of the scheduled quarterly phone call, these data were coded as
missing.

Chapter 4: Design and Methodology
87
Collection of personality (FFPI-C) data
Collection of baseline personality data was undertaken through two methods.
For individuals who had not received their first annual visit in the DRAT
project, a consent form (see Appendix 5) and a copy of the FFPI-C were
taken along to the annual interview. If individuals consented, they were
asked to complete the FFPI-C along with the battery of other tests. If the
family had already participated in annual data collection, the FFPI-C and the
informed consent form were posted to them shortly (1-5 months) after their
baseline interview. A phone call was also made to the family detailing the
measure and why it had been included in the study.
For the second and third waves it was decided that all FFPI-C data collection
would be carried out through postal methods. This decision was influenced
by the high response rate to post-outs in the initial wave and concerns over
the large number of measures that participants were required to complete in
annual visits. It was concluded that avoiding invalid response styles related
to fatigue and boredom effects would improve the authority of obtained
results. Accordingly, a copy of the FFPI-C and instructions were posted to
participants one month preceding the allocated date of their second and third
annual DRAT visits.
For self-administered tests, instructions (see Appendix 6) were provided with
the measure and parents were asked to assist their child as needed.
Participants were instructed to complete the measure in one sitting. Self-
administration of the FFPI-C was not deemed a problem as all of our
participants had a reasonable command of the English language and this
measure was designed for this purpose (McGhee et al., 2007). Participants
were explicitly told that if they had any concerns or queries about the
questionnaire they could contact the DRAT team. On receipt of completed
questionnaires, researchers ensured all items were answered and scored
accurately.

Chapter 4: Design and Methodology
88
For missing items or items with multiple ratings, researchers contacted
participants by phone and asked them to re-evaluate their answer and
decide on one choice. These calls were made because all questions need to
be completed to correctly score the FFPI-C (McGhee et al., 2007). If the
participant could not be contacted, the missing or multiple-rated response
was given a middle value. Only 17 missing or multiply rated items were
recorded and replaced over the 3 waves of data collection.
Procedures to maximise retention
To improve retention, participants were sent thank you cards (Appendix 19)
and a special biannual newsletter (Appendix 20) which detailed the progress
of the DRAT and personality studies and provided helpful information about
diabetes relevant services.
Ethical approval and conduct
Ethical approval for the DRAT project was obtained through the University of
Western Sydney’s Human Research Ethics Committee (Appendix 21).
Additionally, in order to approach and recruit individuals from diabetes
clinics, ethical approval was obtained from the Hunter New England Health
ethics committee (Appendix 22). No further ethics submissions were made to
area health providers as the major diabetes services within NSW and the
ACT are based within Sydney and the Hunter region.
Informed consent for participation in the study was obtained from parents of
the individuals with type I diabetes. If the person with diabetes was over the
age of 18, they also signed a consent form. Researchers ensured that
children under the age of consent assented to the research and were under
no undue pressure to participate. Participants were given the contact details
of the Human Research Ethics Committee at the University of Western
Sydney to voice any concern or reservations about the ethical conduct of this
research.

Chapter 4: Design and Methodology
89
Furthermore, individuals reporting elevated depression, anxiety or stress
within the ambit of the research study were provided with resources and
contacts for psychological care if they wished to utilise them.

Chapter 5
Statistical Procedures
Once the current research study had concluded, the data were entered and
analysed using predictive analytics software (PASW) version 17.0. All of the
reported statistics and graphs included in the results sections of this thesis
were produced using this program. These results were regarded as
significant at the p < 0.05 (two-tailed) level.
Statistical procedures for the analysis of the study data progressed in four
main steps.
Figure 5.1: Statistical procedures
The first step involved screening the data. The second step involved
describing the sample and determining the quality of diabetes self-
management in this cohort (see Chapter 6 for results). The third step
Data screening
Data screened to identify
missing information,
ensure reliability of
included measures and
examine distributions of
variables.
Description of sample
Preliminary analyses
used to describe sample,
examine quality of self-
management and
highlight relationships
between demographics
and diabetes outcomes.
Addressing research
questions
Multivariate and mixed-
design analyses used to
address research
questions and clarify the
role of personality in
specific diabetes
outcomes.
Exclusion of variables
Variables that did not meet inclusion criteria for further analyses
removed to provide focus and reduce likelihood of error.

Chapter 5: Statistical Procedures
91
involved excluding variables from further analyses (see Chapter 6 for
results). The final step involved answering the specific research questions of
the current study (see Chapter 7 for results). These procedures are
discussed in detail below and are outlined in Figure 5.1.
Data screening
Data screening is a critical process in research involving statistics (Field,
2009). By thoroughly examining study data, researchers can ensure that
reported results are not biased by poorly performing measures or violations
of the underlying assumptions of statistical tests (Field, 2009; Meltzoff,
2004). Therefore, the current study data were subjected to a rigorous
inspection process to assure the validity of findings. This involved excluding
measures with unacceptable rates of missing data, assessing the reliability of
the psychosocial measurement scales and examining the distributions of
each of the included study variables.
Identification of missing data
Missing data causes problems for researchers employing statistics (Field,
2009; Singer & Willett, 2003). Specifically, a smaller number of responses on
a particular measure reduces statistical power thus decreasing the likelihood
of achieving significant results (Field, 2009). More importantly, if there is a
consistent reason for missing data (i.e. data are not missing completely at
random), then the results of any statistical analyses are likely to be biased
(Singer & Willett, 2003). It was thus vital to identify missing data and assess
whether this missing information could influence results.
To identify missing data, frequencies were calculated for each of the
measured variables (Appendix 23). Results demonstrated that there were
little missing data from the three annual collection periods. However, there
was missing information from the quarterly collections of self-management
data. Furthermore, these data did not appear to be missing at random. In
particular, frequencies for the second and third quarterly collections of the
Chapter 5: Statistical Procedures
92
second year showed that a number of participants did not provide
information at these times suggesting that some level of participant fatigue
may have occurred.
Whilst painstaking attempts were made to acquire these data (including
leaving messages on phone voicemail), researchers were also wary of
‘hounding’ participants for information. Thus, if quarterly data were not
received after several phone calls, these data were coded as missing.
Despite best efforts, the amount of missing data from quarterly self-
management measures was deemed to exceed acceptable limits. Hence, the
decision was made to drop this information from statistical analyses.
Consequently, quarterly values for self-management variables are not
described in this thesis, only the annual data are reported. Although this
means less data were analysed, the high completion rates for the annual
collections of data suggest that this information provides unbiased and valid
estimates from which to examine relationships between variables (beyond
that which could be achieved by analysing quarterly information).
Reliability analysis
It is important for researchers to assess the internal reliability of the
psychosocial measures they employ (Meltzoff, 2004). Thus, the next step in
data screening involved assessing the internal consistency of the Five Factor
Personality Inventory – Children (FFPI-C), the Depression, Anxiety, Stress
Scales (DASS), the Diabetes Family Responsibility Questionnaire (DFRQ)
and the Coping with a Disease questionnaire (CODI). By examining the
internal consistency of these questionnaires it was possible to ensure that
any obtained results reflected genuine relationships rather than variations
caused by measurement error.
Internal consistency was assessed using Cronbach’s alpha enabling
judgement of how well items within each scale performed and how reliable

Chapter 5: Statistical Procedures
93
the scales were as a whole. A Cronbach’s alpha below 0.70 for an entire
scale is problematic as it suggests that items within the measure are poorly
related (Steiner & Norman, 2003). Therefore, any measurement scale with a
Cronbach’s alpha below 0.70 was earmarked for further scrutiny.
In general, the included scales showed good internal consistency (see table
5.1). The only problematic measure was the avoidance scale of the CODI,
which had a Cronbach’s alpha of 0.67. Examination of the inter-item
correlations for this scale (Appendix 24) demonstrated that the item ‘I think
about my diabetes’ (which was reverse-scored) was only weakly related to
the other items. Furthermore, item-total statistics suggested that the
Cronbach’s alpha for this scale would be considerably improved (from 0.67
to 0.79) if this item were deleted (Appendix 25).
Table 5.1: Cronbach’s alphas for measurement scales
Measure α Measure α
Depression 0.91 Openness 0.75
Anxiety 0.83 Conscientiousness 0.88
Stress 0.87 Extraversion 0.81
Acceptance 0.77 Agreeableness 0.79
Avoidance 0.67* Emotional regulation 0.81
Responsibility 0.85 * Cronbach’s alpha below 0.70
Due to the findings of the reliability analysis, the decision was made to
remove the reverse-coded item from the CODI avoidance scale. This course
was taken because the CODI has not been as comprehensively developed
as the other included measures (Anderson et al., 1990; Lovibond &
Lovibond, 1995a; McGhee et al., 2007; Petersen et al., 2004) and research
suggests that reverse-coded items can be harmful to the reliability and
validity of measurement scales (Barnette, 2000; Herche & Engelland, 1996;

Chapter 5: Statistical Procedures
94
Marsh, 1996). No items were dropped from the other included measures
because of the high internal consistency of these scales.
Exploratory factor analysis of CODI avoidance scale
To test whether removal of the reverse-coded item from the CODI avoidance
scale would affect construct validity, an exploratory factor analysis (EFA) was
conducted. Using the guidelines recommended by Field (2009), a factor
loading below 0.40 was taken as suggesting that the item may tap a different
psychosocial construct (and hence may be removed).
The four items from the CODI avoidance scale were included in the
exploratory factor analysis and a one-factor solution was forced. Results
(Appendix 26) showed that the reverse-coded item loaded poorly on the
avoidance scale (factor loading of 0.15). All of the other avoidance items
loaded well on this factor (all factor loadings above 0.60). Together, these
results suggest that the reverse-coded item does not sufficiently tap the
construct of avoidance coping thus supporting the decision to drop the
problematic item from the CODI scale. Consequently, any reported data for
the CODI avoidance scale within this thesis excludes this item.
Univariate analyses
The next stage in data screening involved running univariate analyses to
examine the distributions of the baseline variables. First, descriptive statistics
were used to identify continuous variables with skew, kurtosis or restricted
variance. These analyses showed that some of the study variables had
limited variance whilst others were skewed or kurtotic (Appendix 27).
Specifically, the number of hospitalisations for diabetes, number of planned
diabetes appointments and number of missed diabetes appointments
showed limited range and variance. Hence, these variables were dropped
from statistical analyses because limited variance restricts the likelihood of
achieving statistically significant results (Field, 2009). Nevertheless,

Chapter 5: Statistical Procedures
95
descriptives for these variables were employed to describe the sample and
are reported in results (see chapter 6).
Descriptives also showed that age, duration of diabetes, acceptance coping,
depression, anxiety, number of blood glucose tests, number of
hypoglycaemic incidents, number of days off, number of diabetes
appointments, number of missed appointments, number of hospitalisations
for diabetes and adherence to insulin showed signs of skew and kurtosis.
Thus, Kolmogorov-Smirnov statistics (Appendix 27), frequency distributions
(Appendix 28) and P-P plots (Appendix 29) were employed to gauge whether
variable distributions significantly deviated from normality. These
demonstrated that HbA1c, responsibility and the five-factor model traits were
normally distributed. In contrast, the other demographic and self-care
variables, depression, anxiety, stress, and coping significantly deviated from
normality. Table 5.2 shows the descriptive statistics for the main variables of
interest in this study (see Appendix 27 for further detail).
Importantly, the variables of gender, household income, experience of
unconscious hypoglycaemia, geographical location, treatment modality and
insulin adherence were either nominal or ordinal data. Therefore, the non-
continuous nature of these variables was taken into account when
conducting later statistical analyses

Chapter 5: Statistical Procedures
96
Table 5.2: Descriptives for first year variables
Variable Mean Std. Dev Variance Skew Kurtosis
Age in years 12.15 2.77 7.67 0.30 -0.81
Years with diabetes 4.05 3.21 10.33 1.21 1.13
HbA1c 8.50 1.25 1.59 0.21 0.97
Openness 50.76 7.74 59.85 0.21 0.09
Conscientiousness 49.84 7.44 55.38 -0.18 0.57
Extraversion 47.89 9.31 86.74 -0.01 0.18
Agreeableness 54.46 6.24 38.89 -0.27 0.16
Emotional regulation 52.35 7.66 58.60 -0.50 0.13
Avoidance Coping 7.17 3.44 11.84 0.59 -0.65
Acceptance Coping 24.30 4.30 18.52 -0.76 0.48
Depression 7.06 9.08 82.40 1.80 2.79
Anxiety 7.29 8.41 70.75 1.67 2.49
Stress 10.02 9.09 82.60 0.88 -0.12
Responsibility 32.31 5.56 30.95 0.22 0.08
No. BGL tests 73.63 34.15 1165.88 3.15 17.59
No. Hypos 2.45 2.91 8.48 2.65 9.27
Data transformation attempts
Given that many statistical tests work on the assumption of normally
distributed variables (Field, 2009), square root and logarithmic
transformations were attempted to normalise the data. These
transformations can help to correct skewed or kurtotic data (Field, 2009) but
were unsuccessful in this instance. Nevertheless, non-parametric statistics
can be successfully employed to analyse non-normal data and some
parametric statistics such as analysis of variance (ANOVA) and regression
can be robust to deviations in normality (Field, 2009).
Furthermore, some theorists argue that transforming data is not always
advisable as it does not necessarily improve the validity of probability
statements (Field, 2009; Glass, Peckham, & Sanders, 1972; Norris & Aroian,
2004) and also changes the nature of the proposed hypotheses and

Chapter 5: Statistical Procedures
97
measured constructs (Grayson, 2004). Together, this demonstrates that the
non-normal nature of the study data is unproblematic as long as care is given
when performing statistical analyses.
Description of the sample and preliminary analyses
The second step in statistical procedures was to describe the sample and
examine relationships between demographic variables and self-management
outcomes (see Chapter 6 for results). This was achieved through in-depth
exploration of the three annual waves of collected data. In doing this, it was
possible to achieve a greater understanding of the cohort, and how well they
managed their diabetes. This also served to identify specific control variables
that should be included in later analyses of personality and diabetes
management.
Descriptives including means (with standard deviation), medians (with inter-
quartile range) and percentages were employed to describe the baseline
sample and their quality of self-management. Average HbA1c levels for the
cohort were compared to the target range recommended by the International
Society for Pediatric and Adolescent Diabetes (ISPAD) and the Australian
National Health and Medical Research Council (NHMRC). Rates of
depression, anxiety and stress were established by using the DASS-21 cut-
offs for conventional severity levels (see table 4.1 in chapter 4) (Lovibond &
Lovibond, 1995a). Finally, repeated measures statistics were employed to
determine the longitudinal stability of self-management variables and
bivariate analyses were conducted to highlight any statistically significant
relationships between demographic characteristics and self-management.
Because transformations were unsuccessful in normalising the study data,
the decision was made to employ non-parametric statistics when analysing
continuous variables that were non-normally distributed (see chapters 6 and
7). Therefore, the demographic and self-care variables, depression, anxiety,
stress, and coping were all analysed using Spearman’s correlations, Mann-

Chapter 5: Statistical Procedures
98
Whitney tests and Wilcoxon signed-rank tests. These results were reported
using medians with inter-quartile range. Conversely, HbA1c and the five-
factor personality model traits (which were normally distributed) were
analysed using Pearson’s correlations, independent t-tests and repeated
measures t-tests. These results were expressed as mean with standard
deviation. If statistical analyses involved both normally distributed and non-
normally distributed variables, non-parametric statistics were favoured.
Importantly, parametric analyses of variance (ANOVAs) were employed with
both normal and non-normal data. ANOVA is known to be robust to
deviations in normality (P.F. Lovibond 2010, personal communication,
September, 2010; Field, 2009; Keith, 2006). The decision to employ this
statistical test with non-parametric data was made in the interest of
maintaining a consistent approach to analyses since in later statistical
analyses, mixed-design ANOVAs were employed which have no non-
parametric equivalent. Thus, parametric analyses of variance (ANOVAs)
were used for all continuous data to provide comparable results. When
employing ANOVA, results were reported using the mean and standard
deviations of included variables. Figure 5.2 shows the procedures for these
preliminary analyses.
Figure 5.2: Procedures for preliminary analyses
Describe sample
Means, medians, and
percentages used to
describe sample.
Conventional cut-offs
used to determine levels
of glycaemic control and
psychological morbidity.
Assess stability of
self-management
Repeated-measures
ANOVAs, Wilcoxon tests,
dependent t-tests and
retest correlations
employed to assess
stability of self-
management over time.
Bivariate analyses
Mann-Whitney tests, t-
tests, correlations and
one-way ANOVAs used
to examine relationships
between demographics
and diabetes outcomes.

Chapter 5: Statistical Procedures
99
Inclusion and exclusion of variables from personality analyses
The current study took a comprehensive approach to measuring
demographic and self-management variables that may play a role in
determining important outcomes in type I diabetes. However, the sample size
(n =104) precluded complex statistical analysis and the large number of
variables measured increased the risk of making type I errors (Field, 2009;
Meltzoff, 2004; Singer & Willett, 2003). It was thus critical to reduce the
number of variables included in analyses aimed at answering the research
questions. This approach increases confidence in the validity of the results
and minimises the risk of reporting chance findings (Meltzoff, 2004).
Therefore, in order for variables to be retained in further analyses, they
needed to meet two basic criteria. Firstly, there had to be substantive
theoretical or clinical reasons for retaining these data. Theoretical and clinical
research (Dabadghao et al., 2001; Dantzer et al., 2003; Dashiff et al., 2006;
Eiser et al., 2001; Hanson et al., 1989; Hochhauser, Rapaport, Shemesh,
Schmeidler, & Chemtob, 2008; Kramer et al., 2000; Naar-King et al., 2006;
Turan, Osar, Turan, Damci, & Ilkova, 2002 etc) helped to identify important
outcome measures and distinguish control variables that should be included
in statistical analyses. Secondly, the retained variable needed to
demonstrate acceptable data properties. The majority of conventional
statistical tests rely on continuous data that have suitable levels of variance
(Field, 2009). Thus, data that were non-continuous and data that had low
variance were scrutinised further. The results of preliminary analyses
(Chapter 6) were then employed to guide the exclusion of some of these
variables.
This approach ensured that the most imperative self-management outcomes
were examined and that any reported relationships between personality and
these outcomes were not better explained by demographic variables. The
specific control and outcome variables to be included in further analyses are
detailed below in table 5.3. However, reasons for inclusion and exclusion of
specific variables are provided in more detail at the end of chapter 6. As can

Chapter 5: Statistical Procedures
100
be seen, the included outcome variables provide a good representation of
the complexity of diabetes self-management.
Table 5.3: Control and outcome measures included in personality analyses
Control variables Outcome variables
Age HbA1c
Gender Frequency of blood glucose testing
Duration of diabetes Depression
Responsibility for diabetes care Anxiety
Stress
Acceptance coping
Avoidance coping
Frequency of hypoglycaemia
Answering research questions
The final stage of statistical analyses involved answering the specific
research questions of the current study. Thus, statistical tests were
employed to determine significant relationships between five-factor model
personality traits and the specific diabetes outcomes listed above. In
addition, statistics were utilised to examine the role of baseline personality
traits in trajectories of these self-management outcomes.
To achieve this, the first, second and third waves of personality data were
‘matched’ to the first, second and third waves of self-management outcomes.
Bivariate analyses were then carried out to test for linear and non-linear
associations between the five-factor model personality traits and outcomes.
Next, multiple regressions were employed to identify five-factor model traits
that predicted self-management outcomes (independent of controls) for each
’matched’ year. Non-significant trait predictors of outcomes were excluded
from any further analyses based on the results of these regressions. Finally,
mixed-design and repeated-measures analyses of variance (ANOVAs) were

Chapter 5: Statistical Procedures
101
used to assess the role of baseline personality traits in trajectories of self-
management.
By employing this procedure it was possible to identify five-factor model traits
important to glycaemic control and psychological wellbeing. Furthermore, this
approach helped to achieve a greater understanding of the role of these
traits in the management of diabetes over time. Figure 5.3 depicts the
procedure for these statistical analyses.
Figure 5.3: Procedure for statistical analysis of personality data
Bivariate analyses
Correlations and scatterplots were employed to test for simple relationships
between five-factor model personality traits and self-management outcomes.
Pearson’s correlations were employed to identify significant linear
relationships between the FFPI-C traits and parametric variables (HbA1c)
whilst Spearman’s correlations were used to identify significant linear
associations between FFPI-C traits and non-parametric variables
(depression, anxiety, stress, blood glucose tests, hypoglycaemia,
acceptance coping and avoidance coping).
Bivariate Analyses
Scatterplots,
correlations and
bivariate regressions
employed to test for
linear and non-linear
associations between
personality and self-
management
outcomes.
Multiple Regressions
Regressions
including control
variables employed
to identify five-factor
model traits that are
significant predictors
of self-management
outcomes.
Longitudinal analyses
Mixed-design ANOVAs and repeated-measure ANOVAs employed to determine the role of baseline personality traits in trajectories of self-management outcomes.
Exclusion of variables
Non-significant trait predictors of self-management
outcomes excluded from further analyses.

Chapter 5: Statistical Procedures
102
Scatterplots were then inspected to determine the possibility of non-linear
relationships between self-management outcomes and personality traits. To
confirm non-linear associations between personality traits and specific
outcomes, bivariate regressions were conducted following the procedure
outlined by Keith (2006) and Mallery (2009). Based on scatterplots, these
analyses tested for significant curvilinear relationships between specific
personality and outcome variables (see chapter 7).
Multiple regressions of five-factor model traits on self-management
Next, the five-factor model personality traits were regressed onto the self-
management outcomes for each ‘matched’ year. This helped to identify
which five-factor model traits were the best predictors of these outcomes. For
each of the regressions, the control variables of gender, age, duration of
diabetes and level of responsibility for diabetes tasks were included to
ensure that any trait predictors of self-management outcomes were not
confounded or better explained by these variables.
Initially, hierarchical multiple regressions were employed. These were carried
out using prior research findings to guide block-wise entry of predictor
variables for all analyses. Block-wise entry is a preferable method of
regression analysis as it relies more on past research and theory than on
arbitrary statistical computations (Field, 2009). Based on prior research and
theory (Anderson et al., 1990; Dabadghao et al., 2001; Hochhauser et al.,
2008; Naar-King et al., 2006), the control variables (gender, age,
responsibility and duration of diabetes) were entered into the first regression
block. Research findings (Deary et al., 1995; Kendler et al., 2006; Roelofs et
al., 2008; Skinner et al., 2002; Vollrath et al., 2007 etc) were then employed
to guide block-wise entry of the five-factor model personality traits.
After this round of analyses, significant predictors of specific self-
management outcomes were retained and put into a final regression model
for each year following the procedure outlined by Field (2009). Field
recommends dropping non-significant variables from hierarchical regressions

Chapter 5: Statistical Procedures
103
and re-running multiple regressions using significant predictors only. This
can increase the reliability of regression analyses and can improve
confidence in the obtained statistical models (Field, 2009). The rationale for
this method was based on concerns over the study sample size (n =104) and
the small size of anticipated effects. Adoption of this procedure allowed the
number of predictors to be reduced thereby producing more reliable
regression models (Field, 2009; Keith, 2006).
Accordingly, multiple regressions for each year were re-run using only
significant independent predictors from the three ‘matched’ years. To
minimise the risk of type II error, any variable identified as a significant
predictor in any year of the study was included in these regressions. As
suggested by Field (2009), these variables were inputted into regression
models at the same time using forced-entry methods.
This resulted in six regressions being run for each self-management
outcome (3 x hierarchical regressions and 3 x forced-entry regressions).
Thus, to maintain a coherent structure for reporting results, regression tables
for the forced-entry regressions are presented in the results section whereas
regression tables for hierarchical regressions are included in the appendices
only (see chapter 6). The figure below (figure 5.4) depicts the procedure for
these regression analyses.

Chapter 5: Statistical Procedures
104
Figure 5.4: Procedure for regression analyses
Longitudinal analyses of personality traits and self-management
trajectories
Once significant trait predictors of outcomes had been identified, longitudinal
analyses were conducted to test the role of these personality factors in self-
management trajectories. To do this, groups were created using baseline
scores of personality traits. By doing this, it was possible to assess how
baseline personality traits influenced changes in self-management outcomes
over time. The decision to group the participants was made based on the
ease of analysis and because groups could represent logical and distinct
end-points for personality constructs.
Groups were created using the upper and lower tertiles of the five-factor
model traits. The upper and lower tertile groups were employed as they
represented discrete populations yet retained a large enough sample within
each group to retain statistical power. A different approach was employed to
test the role of variables displaying curvilinear relationship with outcome
variables. For these analyses, quintiles were computed and the high, low and
middle quintiles were compared. Again, this procedure was based on
Hierarchical regressions
3 x hierarchical regressions employed for each self-management outcome. All FFM traits and control variables included to determine independent trait predictors.
Forced-entry regressions
3 x forced-entry regressions employed for each self-management outcome. Only significant predictors included to improve model reliability.
Exclusion of variables
Non-significant trait predictors of self-management outcomes excluded from further regressions.

Chapter 5: Statistical Procedures
105
maximising differences between groups whilst retaining an adequate sample
size to maintain statistical power.
Using these newly formed groups, mixed design analyses of variance
(ANOVAs) were performed to examine overall differences in glycaemic
control between groups and to test for any significant interaction between
personality and self-management outcomes over time. If a significant
interaction was discovered, repeated measures analyses of variance
(ANOVAs) with bonferonni adjustment were conducted to examine whether
glycaemic control changed significantly over time within each group. Figure
5.5 demonstrates the procedure used for these longitudinal analyses.
Figure 5.5: Procedure for longitudinal analyses
In summary, a systematic approach to data analysis was employed for this
research. Data were meticulously screened and the sample was
comprehensively scrutinised to improve the relibility and validity of results.
The multivariate and longitudinal methods of analyses helped to achieve a
greater understanding of the complex role of personality in longitudinal
trajectories of self-management in the current sample.
Create baseline
groups
Tertile scores used to
create high and low trait
groups to examine
linear relationships.
Quintile scores used to
create high, moderate
and low trait groups to
examine curvilinear
relationships.
Repeated measures ANOVAs
Repeated-measures
ANOVAs employed to
test for significant
within-group changes in
self-management
outcomes.
Mixed-design
ANOVAs
Mixed-design ANOVAs
employed to test for
between-group effects
and interactions
between personality
and self-management
over time.

Chapter 6
Sample Characteristics and Preliminary Analyses
The current study presents researchers with a detailed picture of Australian
youth with type I diabetes. The breadth of data gathered over multiple time-
points provides rich information about the course of self-management and
may afford enhanced insight into the experience of type I diabetes during
childhood and adolescence. Therefore, before evaluating the role of
personality in the self-management of diabetes, it is important to describe the
sample and determine how well these young people have managed their
disease.
This chapter therefore presents information regarding the characteristics of
the sample and the quality of participants’ self-management of diabetes.
Firstly, a description of the group is provided including demographics,
treatment modality and degree of responsibility for diabetes care. Attention is
given to relationships between these variables and self-management
outcomes. Next, the longitudinal stability of the five-factor model personality
traits is assessed and relationships between personality and demographic
variables are highlighted. The quality of glycaemic control, levels of
engagement in self-care behaviour and rates of psychological wellbeing are
then reported. The stability of these outcomes over time is also examined.
Finally, a brief summary of preliminary results is provided followed by a
rationale for the exclusion of particular variables from further analyses.
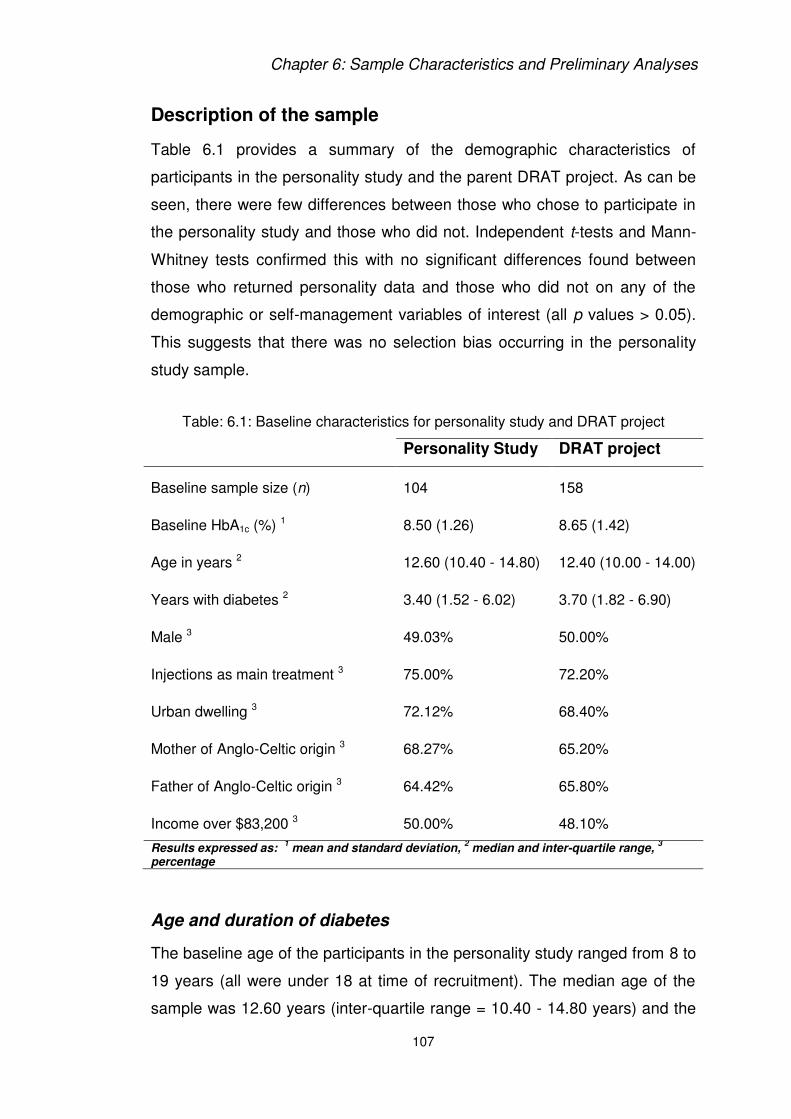
Chapter 6: Sample Characteristics and Preliminary Analyses
107
Description of the sample
Table 6.1 provides a summary of the demographic characteristics of
participants in the personality study and the parent DRAT project. As can be
seen, there were few differences between those who chose to participate in
the personality study and those who did not. Independent t-tests and Mann-
Whitney tests confirmed this with no significant differences found between
those who returned personality data and those who did not on any of the
demographic or self-management variables of interest (all p values > 0.05).
This suggests that there was no selection bias occurring in the personality
study sample.
Table: 6.1: Baseline characteristics for personality study and DRAT project
Personality Study DRAT project
Baseline sample size (n) 104 158
Baseline HbA1c (%) 1 8.50 (1.26) 8.65 (1.42)
Age in years 2 12.60 (10.40 - 14.80) 12.40 (10.00 - 14.00)
Years with diabetes 2 3.40 (1.52 - 6.02) 3.70 (1.82 - 6.90)
Male 3 49.03% 50.00%
Injections as main treatment 3 75.00% 72.20%
Urban dwelling 3 72.12% 68.40%
Mother of Anglo-Celtic origin 3 68.27% 65.20%
Father of Anglo-Celtic origin 3 64.42% 65.80%
Income over $83,200 3 50.00% 48.10%
Results expressed as: 1 mean and standard deviation,
2 median and inter-quartile range,
3
percentage
Age and duration of diabetes
The baseline age of the participants in the personality study ranged from 8 to
19 years (all were under 18 at time of recruitment). The median age of the
sample was 12.60 years (inter-quartile range = 10.40 - 14.80 years) and the

Chapter 6: Sample Characteristics and Preliminary Analyses
108
median amount of time since diagnosis was 3.40 years (inter-quartile range =
1.52 - 6.02 years). Examination of scatterplots (Appendix 30) confirmed that
there were no non-linear (or age-group specific) relationships between self-
management outcomes and age or duration of diabetes. Thus, Spearman’s
correlations were employed to uncover linear associations.
Unexpectedly, HbA1c was not associated with age or duration of diabetes at
any point in the three-year study (all p values > 0.05). Such findings are at
odds with prior investigations that report positive correlations between these
variables in similarly-aged cohorts (Dabadghao et al., 2001; Helgeson,
Siminerio, Escobar, & Becker, 2007; Ingerski, Anderson, Dolan, & Hood,
2010; Springer et al., 2006).
However, age and duration of diabetes were associated with measures of
self-care. Duration of diabetes was negatively correlated with frequency of
blood glucose testing in the first year (ρ = -0.23) and age was negatively
associated with frequency of blood glucose testing in the first (ρ = -0.22),
second (ρ = -0.26) and third years (ρ = -0.23) (all p values < 0.05). These
results support prior studies that have demonstrated poorer engagement in
self-care behaviour amongst older adolescents with diabetes (Dashiff et al.,
2006; Ingerski et al., 2010; Weissberg-Benchell et al., 1995).
Results also showed that age and duration of diabetes were related to
psychological wellbeing. For example, duration of diabetes was significantly
related to depression scores in the first year (ρ = -0.22) of the study. The
direction of this association suggests that those with a more recent diagnosis
of diabetes were likely to report elevated levels of depression. This finding is
consistent with research that shows high levels of depression in youths
newly diagnosed with type I diabetes (Grey et al., 1995).
Remarkably, duration of diabetes was not significantly related to depression
levels in the second or third year (all p values > 0.05). This suggests that
individuals with a shorter duration of diabetes may have psychologically

Chapter 6: Sample Characteristics and Preliminary Analyses
109
adapted to living with diabetes over time. A repeated-measures analysis of
variance supported this assumption showing that depression scores
significantly improved over the three years for individuals who had a duration
of diabetes under 12 months at baseline, F (2, 30) = 3.51, p = 0.04. Table 6.2
shows the depression scores for this group over three years.
Table 6.2: Depression scores for newly diagnosed participants
Depression score
Year 1 11.13 (11.29)
Year 2 5.25 (5.05)
Year 3 6.50 (8.63)
Results expressed as: mean and standard deviation
Noteworthy associations were also found between age and anxiety levels.
Spearman’s correlations demonstrated that the age of the participant was
negatively associated with anxiety levels in the second (ρ = -0.21) and third
(ρ = -0.24) waves of data collection (all p values < 0.05). Thus, older
participants were less anxious at these occasions. These results are
interesting as they conflict with findings from prior research that shows higher
rates of anxiety in older adolescents (Dantzer et al., 2003; de Matos, Barrett,
Dadds, & Shortt, 2003). Importantly, the association between anxiety and
age was not explained by duration of diabetes (all p values > 0.05).
Finally, neither age nor duration of diabetes was significantly related to
stress, acceptance coping, avoidance coping or frequency of hypoglycaemia
(all p values > 0.05). This suggests that age and duration of diabetes did not
play a strong role in determining these self-management outcomes within the
current sample.

Chapter 6: Sample Characteristics and Preliminary Analyses
110
Gender
The gender split within the study sample was almost 50:50 with 51 males
and 53 females returning three years of personality data. No significant
gender differences were found for glycaemic control, depression, anxiety,
stress, avoidance coping, frequency of blood glucose testing or frequency of
hypoglycaemia over the three years (all p values > 0.05).
However, Mann-Whitney tests demonstrated that there were significant
gender differences in levels of acceptance coping in the second and third
years. In the second year, males reported significantly higher levels of
acceptance than females, U = 976.00, z = -2.18, p = 0.03. Males also
reported higher acceptance of their diabetes in the third year compared to
females, U = 813.00, z = -3.15, p = 0.00. These results suggest that males in
the current cohort accepted their diabetes more than females. Table 6.3
shows the results for acceptance coping stratified by gender.
Table 6.3: Acceptance coping stratified by gender
Male Female
Year 1 25.00 (22.00 - 29.00) 24.00 (21.00 - 27.00)
Year 2 25.00 (22.75 - 29.00)* 24.00 (22.00 - 25.00)*
Year 3 26.50 (23.50 - 28.25)** 23.00 (22.00 -26.00)**
Results expressed as: median and inter-quartile range
* Between-groups difference significant at p <0.05
** Between-groups difference significant at p <0.01
Treatment Modality
In the first year of the study, 78 (75.00%) participants were receiving
injections as their main source of treatment whilst 26 (25.00%) were using an
insulin pump. Pump use increased over the three-year period with 47
(45.19%) of the participants using pumps in the second year and 52
(50.00%) using pumps in the third year. These findings likely reflect an

Chapter 6: Sample Characteristics and Preliminary Analyses
111
increased drive from health-care professionals to put youths on insulin
pumps.
No significant differences in HbA1c scores were found between individuals
receiving injections or pump therapy over the three years of the study (all p
values > 0.05). This is a noteworthy finding as it demonstrates that use of an
insulin pump does not necessarily improve glycaemic control as measured
by HbA1c. This finding runs counter to that from a prior systematic review
looking at these differences between these treatment methods (Pickup et al.,
2002).
Similarly, no significant between-group differences in acceptance coping,
avoidance coping, depression, anxiety, stress, blood glucose testing or
frequency of hypoglycaemia occurred over the three-year period (all p values
> 0.05). Together, these findings suggest that treatment modality did not
have a direct impact upon self-management outcomes within this cohort.
Ethnicity
The sample included a range of ethnic backgrounds. However, the majority
of participants reported an Anglo-Celtic heritage which is to be expected in
Australia (Australian Bureau of Statistics, 2006b) and people with type I
diabetes (Hanas, 1998). Independent t-tests and Mann-Whitney statistics
comparing those of Anglo-Celtic heritage to the rest of the sample suggested
no between-groups differences on any of the self-management outcomes of
interest (all p values > 0.05).
Geographical location
Participants came from a broad range of locations within New South Wales
(NSW) and the Australian Capital Territory (ACT) (see figure 4.1 for a map
displaying geographical dispersion). To analyse these data, the Australian
Standard Geographical Classification system (Australian Bureau of Statistics,
2007) was employed. Using these guidelines, 75 (72.12%) individuals from

Chapter 6: Sample Characteristics and Preliminary Analyses
112
the study were identified as living in an urban area whilst 29 (27.88%) were
identified as living in a rural or remote area. Independent t-tests and Mann-
Whitney tests suggested that there were no differences in self-management
outcomes between these groups over the course of the study (all p values >
0.05).
Household annual income
Of those families who reported their annual income (n = 97), 52 earned over
$83,200 a year, 24 earned between $52,000 and $83,199, 13 earned
$31,200 to $51,999 and 8 reported an annual household income of less than
$31,199. When compared to Australian Bureau of Statistics data (2009), our
study sample appears to have a greater percentage of families within the
mid-to-high brackets of annual income and a lower percentage of low income
families. This suggests that those with lower incomes may be less willing or
able to participate in research studies. Alternatively, participants may have
been less likely to report low household income.
To examine whether annual income was related to self-management
outcomes, the sample was split into two groups. Those reporting an annual
income above $83,200 were labelled the high-income group whilst those
earning below this amount were labelled the low to mid-range income group.
These categories were formed to create larger sample sizes between the
groups thus minimising the likelihood of making statistical errors (Field,
2009). Independent t-tests and Mann-Whitney tests demonstrated no
significant differences between these income groups on any of the measured
self-management outcomes (all p values > 0.05).
Responsibility for diabetes care
Results of a one-way repeated-measures analysis of variance (ANOVA)
showed that mean-levels of responsibility increased for the sample over the
course of the three year study, F (1.81, 168.67) = 26.73, p = 0.001. Table 6.4

Chapter 6: Sample Characteristics and Preliminary Analyses
113
shows the means and standard deviations for responsibility scores over the
three years.
Unsurprisingly, responsibility for diabetes tasks was related to age.
Spearman’s correlations demonstrated a strong positive association between
age and responsibility in the first (ρ = 0.68), second (ρ = 0.69) and third year
(ρ = 0.74). These results highlight the fact that adolescence is a transitional
period where youths begin to take greater responsibility for self-management
tasks as they get older (Anderson et al., 1990; Ingerski et al., 2010). Notably,
duration of diabetes, gender and HbA1c values were unrelated to levels of
responsibility over the three years (all p values > 0.05).
Table 6.4: Mean-levels of responsibility over three years
Responsibility score
Year 1 32.51 (5.61)
Year 2 34.21 (6.14)
Year 3 35.73 (6.82)
Results expressed as: mean and standard deviation
Interestingly, responsibility was related to avoidance coping. Baseline levels
of responsibility were negatively associated with avoidance coping in the
second (ρ = -0.27) and third years (ρ = -0.27). Furthermore, second year
responsibility was associated with second year avoidance coping (ρ = -0.24)
and third year avoidance coping (ρ = -0.24). Together, this suggests that
those who took greater responsibility for their care relied less on avoidance
as a way of coping with their disease. No significant associations were found
between third year responsibility and avoidance coping (all p values > 0.05),
which could be a result of a slight floor effect for avoidance in this year.
Finally, responsibility was associated with levels of anxiety and stress in the
sample. Responsibility in the second year was negatively associated with

Chapter 6: Sample Characteristics and Preliminary Analyses
114
anxiety in the second (ρ = -0.29) and third years (ρ = -0.34) and stress in the
second year (ρ = -0.22). Similarly, responsibility in the third year was related
to anxiety in the second year (ρ = -0.25) and third year (ρ = -0.23). These
results show that individuals who took less responsibility for their care had
greater levels of anxiety and stress.
At first glance, these findings appear counterintuitive. One would typically
expect individuals who take greater responsibility for their diabetes to be
more anxious and stressed about their condition. However, these results
may be explained by task familiarity. For example, individuals who exhibit
lower levels of responsibility are likely to be at the initial stages of transition
to self-managed care (Anderson et al., 1990; Anderson et al., 2002; Hanas,
1998). At this stage, the individual is confronted with many new and
unfamiliar tasks. In contrast, individuals who take greater responsibility are
likely to be accustomed to carrying out these duties (Hanas, 1998). Research
demonstrates that familiarity with tasks leads to reductions in anxiety and
stress (Fink, 2000; MacIntyre & Gardner, 1994; Pagano, 1973). Thus, higher
rates of anxiety and stress in individuals with lower levels of responsibility
could reflect the complex process of transitioning to self-managed care.
In all, demographic characteristics appeared to have a role in self-
management of type I diabetes within the study cohort. Variables of
particular note include the participant’s age, duration of diabetes, gender and
level of responsibility for diabetes tasks. The statistically significant
relationships (all p values < 0.05) between these variables and self-
management outcomes demonstrate that these particular measures should
be retained in later analyses aimed at answering the research questions.
Table 6.5 summarises the significant relationships uncovered between
sample characteristics and self-management outcomes.

Chapter 6: Sample Characteristics and Preliminary Analyses
115
Table 6.5: Relationships between demographics and self-management
Outcome
Responsibility
Neg
correlation
Avoidance
Neg
correlation
Anxiety
Neg
correlation
Stress
Age
Neg
correlation
BGL tests
Neg
correlation
Anxiety
Duration of
diabetes
Neg
correlation
BGL tests
Neg
correlation
Depression
Gender
Males
have greater
Acceptance
Personality
Test-retest correlations (Table 6.6) were employed to examine the
longitudinal stability of the five-factor model traits. These demonstrated good
rank-order consistency for each personality factor over the three years of
data collection. Any correlation above 0.50 represents a large effect (Field,
2009) and this suggests that personality was stable in the study cohort.
Importantly, the high stability of these traits means that baseline measures of
personality may be employed to predict trajectories of self-management
outcomes within this sample.
Statistical analysis revealed that demographic variables were associated with
personality traits. Age was positively associated with levels of openness to
experience in the first (ρ = 0.27), second (ρ = 0.29) and third (ρ = 0.20)
‘matched’ years. These results demonstrate that older children in the sample
were more open to experience than their younger peers.

Chapter 6: Sample Characteristics and Preliminary Analyses
116
Table 6.6: Test-retest correlations for FFPI-C traits over three years
In addition, Pearson’s correlations demonstrated that responsibility for
diabetes was associated with openness in the second (r = 0.26) and third (r =
0.32) ‘matched’ years. These findings show that individuals with higher
scores on openness took greater responsibility for their self-care. However,
the significance of this relationship disappeared when controlling for age (all
p values > 0.05).
Agreeableness was also related to responsibility in the first (r = 0.25) and
third years (r = 0.22). This suggests that youth who are more agreeable take
on greater responsibility for diabetes tasks.
Notably, conscientiousness was only associated with responsibility for
diabetes care in the final year of data collection (r = 0.29). Here, individuals
higher in conscientiousness reported greater responsibility for diabetes
management.
Finally, there appeared to be some gender differences in personality traits.
For example, males were significantly higher in openness to experience in
the first year, t (102) = 2.50, p = 0.01. Whilst research findings regarding
gender differences in openness to experience are mixed (Schmitt, Voracek,
Realo, & Allik, 2008), this finding seems likely to be explained by young
r 1st and 2nd year r 2nd and 3rd year r 1st and 3rd year
Conscientiousness 0.67** 0.78** 0.65**
Extraversion 0.73** 0.84** 0.72**
Openness 0.68** 0.85** 0.76**
Agreeableness 0.56** 0.78** 0.58**
Emotional regulation 0.59** 0.77** 0.64**
* = significant at p <0.05
** =significant at p <0.01

Chapter 6: Sample Characteristics and Preliminary Analyses
117
males’ propensity to endorse new adventures and novel experiences
(Zupancic, Slobodskaya, & Knyazev, 2008). Indeed, perusal of the five-factor
personality inventory for children (FFPI-C) demonstrates that the items for
the openness to experience scale tend to reflect openness to ideas rather
than openness to feelings or aesthetics (McGhee et al., 2007).
Males were also significantly higher in emotional regulation than females in
the third year of the study, t (102) = 2.63, p = 0.01. This result echoes prior
research findings that show adolescent and adult males report greater
emotional regulation than their female counterparts (Costa Jr, Terracciano, &
McCrea, 2001; Schmitt et al., 2008; Zupancic et al., 2008). No other
demographic variables showed significant relationships with personality (all p
values > 0.05). Table 6.7 and table 6.8 show the annual means and standard
deviations for openness to experience and emotional regulation stratified by
gender.
Table 6.7: Gender differences in openness to experience
Male Female
Year 1 52.65 (6.91)* 48.94 (8.11)*
Year 2 50.89 (8.05) 48.89 (8.33)
Year 3 51.71 (8.48) 48.32 (9.30)
Results expressed as: mean and standard deviation
* = between-groups difference significant at p <0.05
** = between-groups difference significant at p <0.01

Chapter 6: Sample Characteristics and Preliminary Analyses
118
Table 6.8: Gender differences in emotional regulation
Male Female
Year 1 52.67 (7.57) 52.04 (7.79)
Year 2 52.71 (8.46) 50.32 (8.24)
Year 3 54.04 (7.62)* 49.81 (8.73)*
Results expressed as: mean and standard deviation
* = between-groups difference significant at p <0.05
** = between-groups difference significant at p <0.01
In summary, the five-factor model personality traits were stable within the
cohort over the course of the three-year study. The test-retest correlations for
this sample were higher than reported in prior studies involving youth and
this appears to be due to the shorter time-frame involved and the fact that
the measure employed was specifically designed for this cohort (Donnellan
et al., 2007; Hampson & Goldberg, 2006; McGhee et al., 2007; B. W.
Roberts et al., 2001; B. W. Roberts & DelVecchio, 2000). Importantly, the
temporal stability of the five-factor model dimensions within this study
indicates that baseline personality factors may be used as predictor variables
when examining longitudinal trajectories of self-management outcomes.
In addition, the five-factor model traits were linked to age, gender and
responsibility for diabetes care. Whilst the causal directions of some of these
associations are unclear, the statistical significance of these relationships (all
p values < 0.05) underlines the importance of retaining these variables in any
further analyses involving personality traits. By retaining these variables, it
will be possible to assess whether longitudinal relationships between
personality and self-management are better explained by these demographic
factors. Thus to assist the reader, table 6.9 summarises the significant
relationships found between sample characteristics and the five-factor model
personality traits.

Chapter 6: Sample Characteristics and Preliminary Analyses
119
Table 6.9: Relationships between demographics and personality
Outcome
Responsibility
Pos
correlation
Openness
Pos
correlation
Agreeableness
Pos
correlation
Conscientiousness
Age
Pos
correlation
Openness
Gender
Males
have greater
Openness
Males
have greater Emotional
regulation
Self-management outcomes
In order to look at how well the youths in the study sample self-managed
their diabetes, it was important to take a bio-psychosocial approach.
Therefore, the participants were assessed not only on levels of glycaemic
control and self-care, but also on measures of psychological well being such
as depression, anxiety, stress and coping. The information gleaned from this
sample provides a valuable snapshot into the lives of people with type I
diabetes. Accordingly, table 6.10 provides a summary of the diabetes
outcomes for the study sample at baseline.
Table 6.10: Diabetes outcomes at baseline
HbA1c (%)1 8.50 (1.26)
Number of hypoglycaemic incidents in two weeks 2 2.00 (1.00 - 4.00)
Number of blood glucose tests in two weeks 2 70 (56.00 - 84.00)
Always taken insulin as prescribed 3 61.17%
Attended one or more appointments in 3 months 3 96.15%
Missed one or more booked appointments in 3 months 3 1.92%
Depression score out of normal range 3 28.85%
Anxiety score out of normal range 3 34.62%
Stress score out of normal range 3 27.88%
Unconscious hypoglycaemic incident in three months3 3.85%
Hospitalised for diabetes in three months3 2.88%
HbA1c over 7.5% 3 77.88%
Results expressed as: 1 mean and standard deviation, 2 median and inter-quartile
range, 3 percentage

Chapter 6: Sample Characteristics and Preliminary Analyses
120
Glycaemic control
HbA1c values in the first year of data collection ranged from 5.70% to 12.90%
with a mean of 8.50% (standard deviation = 1.26). Alarmingly, the majority of
the sample (77%) had HbA1c values greater than the benchmark of 7.5% set
by the International Society for Pediatric and Adolescent Diabetes (ISPAD)
and the Australian National Health and Medical Research Council (NHMRC)
(National Health and Medical Research Council, 2005; Rewers et al., 2009).
No statistically significant changes in glycaemic control were observed for
the cohort in the following years, F (2, 198) =1.25, p= 0.29. In the second year
of data collection the mean HbA1c score was 8.66% (standard deviation =
1.25) and 87.50% of the sample had sub-optimal glycaemic control (HbA1c >
7.5%). In the third year, the mean HbA1c score was 8.61% (standard
deviation = 1.26) and 84.62% of the sample had sub-optimal glycaemic
management (HbA1c > 7.5%).
These findings support the large number of studies that show that youths
struggle to manage their blood glucose levels effectively (Dabadghao et al.,
2001; Holl et al., 2003; Svensson et al., 2004). For each year, a substantial
proportion of the sample displayed sub-optimal glycaemic control (National
Health and Medical Research Council, 2005; Rewers et al., 2009).
Furthermore, test-retest correlations (table 6.11) showed high temporal
stability in HbA1c values, which suggests that a subsample of this cohort had
chronic poor management of blood glucose levels.
Table 6.11: Pearson’s test-retest correlations for HbA1c over three years
r 1st and 2nd year r 2nd and 3rd year r 1st and 3rd year
HbA1c 0.63** 0.60** 0.52**
* = significant at p <0.05 ** =significant at p <0.01
These results demonstrate that many of the individuals in the study cohort
are at increased risk for developing diabetic complications (National Health

Chapter 6: Sample Characteristics and Preliminary Analyses
121
and Medical Research Council, 2005; Rewers et al., 2009; The Diabetes
Control and Complications Trial Research Group, 1993) underlining the
importance of finding predictors of poor glycaemic control. Importantly, if
personality traits predict long-term management of blood glucose levels, we
could use this information to identify those young people at risk and
intervene early in targeted ways.
Blood glucose monitoring
The median number of blood glucose level (BGL) tests carried out in the two
weeks prior to baseline interview was 70 (Inter-quartile range = 56.00 -
84.00). This suggests that the majority of participants were conducting
around five tests per day which is above the minimum benchmark of four
daily tests proposed by most diabetes experts (Benjamin, 2002; National
Health and Medical Research Council, 2005; The Diabetes Control and
Complications Trial Research Group, 1993).
However, the number of BGL tests carried out over the two-week period was
highly variable across individuals. Reports ranged from 6 tests per fortnight
to 295 tests per fortnight. This means that at the lowest end of the scale, an
individual was testing their blood glucose once every second or third day,
whilst at the other end of the scale, a participant was testing their blood
glucose around 21 times a day.
Similar results were found for the second and third years of the study. In the
second year, the median number of blood glucose tests was 70 (Inter-
quartile range = 56.00 - 84.00) but reports of testing ranged from 3 tests per
fortnight to 169 tests per fortnight. The median number of tests in the third
year was also 70 (Inter-quartile range = 50.00 - 84.00) but the reported
number of tests ranged from 0 to 160. Engagement in blood glucose testing
was thus highly variable across participants.

Chapter 6: Sample Characteristics and Preliminary Analyses
122
To examine mean-level changes in blood glucose testing, a repeated-
measures analysis of variance (ANOVA) was employed. One influential case
(the individual who reported testing 295 times) was removed from analysis.
This approach was taken because large outliers can significantly impact
upon ANOVA statistics (Field, 2009). Results demonstrated that the number
of blood glucose tests performed within the sample did not significantly
change over the course of the three year study, F (1.83, 177.11) = 2.29, p = 0.10.
Furthermore, Spearman’s correlations showed that the frequency of blood
glucose testing was relatively stable within individuals over the three years
(see Table 6.12). This indicates that individuals with poor self-monitoring of
blood glucose at baseline were likely to have poor self-monitoring throughout
the course of the study. It should be noted that removal of the outlier case
did not considerably change these correlations (Appendix 31).
Table 6.12: Spearman’s test-retest correlations for BGL tests over three years
ρ 1st and 2nd year ρ 2nd and 3rd year ρ 1st and 3rd year
Blood glucose testing 0.54** 0.67** 0.43**
* = significant at p <0.05 ** =significant at p <0.01
Finally, Spearman’s correlations were employed to assess whether blood
glucose testing influenced quality of glycaemic control (see Appendices 32
and 33 for correlations including and excluding outlier case). Results
demonstrated that blood glucose testing was significantly associated with
HbA1c values in the third year only (ρ = -0.32). This finding highlights the fact
that self-monitoring of blood glucose is but one aspect of glycaemic control
(Flinders Human Behavioural & Health Science Unit, 2006; Schneider et al.,
2007). Nevertheless, blood glucose testing is a critical factor in diabetes
management (Holmes et al., 2006; Ikeda & Tsuruoka, 1994; Ingerski et al.,
2010; Laffel, Antisdel, Brackett, Dietrich, & Anderson, 1998) and it is
important to uncover predictors of this behaviour.

Chapter 6: Sample Characteristics and Preliminary Analyses
123
In all, results demonstrated that blood glucose level testing was highly
variable across participants. Furthermore, the reported frequency of testing
was relatively stable within participants across the three-year period. There
are therefore large individual differences in engagement in specific diabetes
self-care behaviours and these differences are maintained over time. These
are important findings, especially given the observed relationship between
blood glucose testing and glycaemic control in the third year. Given the vast
individual differences evidenced in blood glucose monitoring, interest in the
role of personality appears warranted.
Adherence to prescribed insulin
Examination of participant responses (table 6.13) demonstrated that the
majority of the sample reported being adherent to their prescribed insulin
regimen over the three years.
The average HbA1c score for individuals who reported adhering to treatment
‘all the time’ was compared to that of the rest of the study sample.
Independent t-tests demonstrated that there were no significant between-
groups differences in HbA1c for the first, second or third year (all p values >
0.05). This finding is noteworthy as it disagrees with the results of a number
of studies that have identified insulin adherence as a critical factor
determining glycaemic control in type I diabetes (Krapek et al., 2004;
Stewart, Emslie, Klein, Haus, & White, 2005; Toljamo & Hentinen, 2001).
Table 6.13: Adherence to prescribed insulin over three years
Adhered all of
the time
Adhered most
of the time
Adhered some
of the time
Adhered none
of the time
Year 1 61.17% 33.98% 3.88% 0.97%
Year 2 54.90% 40.20% 4.90% 0%
Year 3 61.00% 35.00% 4.00% 0%
Results expressed as: percentage of respondents

Chapter 6: Sample Characteristics and Preliminary Analyses
124
This result may be due to the fact that the scale used did not enable
sufficient differentiation. The majority of participants reported adhering to
prescribed insulin ‘all’ or ‘most’ of the time. In order for statistically significant
differences in HbA1c to be observed, there may need to be a greater
difference in rates of adherence between the compared groups.
Nonetheless, for the purpose of the current study, reported adherence did
not appear to be related to glycaemic control.
Utilisation of health-care
The National Health and Medical Research Council (2005) recommends that
young people with type I diabetes visit a health-care professional once every
three-to-four months in order to assess glycaemic management. Self-reports
from participating families suggested that the majority of youth in the study
did this. However, the number of participants who missed booked
appointments increased over the three years. In other words, health care
attendance become poorer as our participants got older.
Notably, the participants who reported not attending a diabetes appointment
were different for each year, which shows that all participants had access to
some level of care over the course of the study. These findings suggest that
the poor glycaemic control observed in the majority of the study sample was
caused by factors other than deprived access to diabetes services. Table
6.14 shows the percentage of respondents who reported attending or
missing a diabetes appointment in the three months prior to each annual
interview.

Chapter 6: Sample Characteristics and Preliminary Analyses
125
Table 6.14: Diabetes appointments over three years
Attended one
appointment in prior
three months
Attended more than
one appointment in
prior three months
Missed booked
appointment in prior
three months
Year 1 96.15% 25.96% 1.92%
Year 2 89.22% 19.61% 5.88%
Year 3 93.00% 20.41% 7.14%
Results expressed as: percentage of respondents
Hospitalisations and hypoglycaemia
As can be seen in table 6.15, few people were hospitalised for diabetes over
the course of the study. This shows that only a small group of individuals in
the study experienced life-threatening acute symptoms of diabetes such as
extreme hypoglycaemia or extreme hyperglycaemia (ketoacidosis).
Table 6.15: Hospitalisations and hypoglycaemia over three years
Hypoglycaemia in
two weeks
Unconscious
hypoglycaemia in
three months
Hospitalised for
diabetes in three
months
Year 1 76.92% 3.85% 2.88%
Year 2 83.33% 1.96% 5.88%
Year 3 79.59% 3.00% 3.00%
Results expressed as: percentage of respondents
Nonetheless, the prevalence of mild hypoglycaemia in the sample was high.
For each year, the majority of respondents reported obtaining a blood
glucose reading below 3.00 mmol/L. in the preceding two weeks. Of these
people, a small percentage lost consciousness. Overall, these findings
demonstrate that mild levels of hypoglycaemia were common amongst the
participants of this study.

Chapter 6: Sample Characteristics and Preliminary Analyses
126
For each year, the median number of hypoglycaemic events experienced by
individuals over a period of two weeks was 2. The number of hypoglycaemic
incidents ranged from 0 to 16 (inter-quartile range = 1.00 - 4.00) in the first
year, 0 to 15 (inter-quartile range = 1.00 - 4.00) in the second year and 0 to
16 (inter-quartile range = 0.00 - 4.00) in the third year. Unsurprisingly a
repeated-measures analysis of variance showed no significant changes in
the mean-level of hypoglycaemic incidents over the three years, F (2, 188) =
0.63, p = 0.54.
Spearman’s test-retest correlations (table 6.16) showed that frequency of
hypoglycaemia had relatively low temporal stability. In fact, the number of
hypoglycaemic incidents in the first year was uncorrelated with the number of
hypoglycaemic incidents in the third year. This shows that an individual who
reported a high number of hypoglycaemic incidents at baseline did not
necessarily have a high number of hypoglycaemic incidents in the final year
of the study. Such findings suggest that experience of hypoglycaemia may
be more difficult to predict than glycaemic control as measure by HbA1c.
Table 6.16: Spearman’s test-retest correlations for hypoglycaemia frequency
ρ 1st and 2nd year ρ 2nd and 3rd year ρ 1st and 3rd year
Number of hypos 0.32** 0.34** 0.07
* = Significant at p <0.05 ** =Significant at p <0.01
Coping
Repeated measures analyses of variance were employed to examine mean-
level changes in coping over time. Results demonstrated no significant
changes in acceptance coping, F (1.78, 174.14) = 0.12, p = 0.86, or avoidance
coping, F (1.85, 174.00) = 0.95, p = 0.38 over the three years (see table 6.17 for
means).

Chapter 6: Sample Characteristics and Preliminary Analyses
127
Table 6.17: Mean-levels of coping over three years
Acceptance coping Avoidance coping*
Year 1 24.26 (4.40) 7.65 (3.35)
Year 2 24.16 (3.94) 7.12 (3.50)
Year 3 24.39 (4.03) 7.29 (3.42)
Results expressed as: mean and standard deviation * Mean for avoidance coping does not include reverse-coded item
Given the gender differences found in acceptance coping, a second repeated
measures analyses of variance was conducted to look for temporal changes
in acceptance coping within each sex. Results showed that acceptance
coping did not change over time in either males, F (1.73, 83.16) = 0.87, p = 0.41,
or females, F (1.65, 80.63) = 0.51, p = 0.60. Mean-levels of coping remained
unchanged throughout the course of the study.
Notably, Spearman’s correlations did suggest some instability in the rank-
order of coping scores over time. Test-retest correlations for coping (table
6.18) were relatively strong for the second and third year. However,
correlations between the first and second, and first and third year only
revealed small to medium sized relationships (Field, 2009). This shows that
intra-individual changes in coping occurred over time.
Table 6.18: Spearman’s test-retest correlations for coping over three years
ρ 1st and 2nd year ρ 2nd and 3rd year ρ 1st and 3rd year
Acceptance coping 0.41** 0.52** 0.22**
Avoidance coping 0.29** 0.56** 0.26**
* = Significant at p <0.05 ** =Significant at p <0.01
Whilst coping was found to be changeable over time, no consistent pattern in
changes was discernable for this cohort. Coping may thus be a highly
personal experience again speaking to the role of personality in determining

Chapter 6: Sample Characteristics and Preliminary Analyses
128
outcomes. Surprisingly, Spearman’s correlations showed no significant
relationships between glycaemic levels as measured by HbA1c and
acceptance or avoidance coping (all p values > 0.05).
Depression
There were no significant mean-level differences in depression scores for the
sample over the three years, F (1.79, 173.21) = 2.02, p = 0.14. This suggests
that overall depression scores did not change for the group throughout the
course of the study (for means see table 6.19). However, when examining
severity levels of depression (Lovibond & Lovibond, 1995a), a different story
emerged.
Table 6.19: Mean-levels of depression over three years
Depression score
Year 1 7.37 (9.22)
Year 2 5.88 (6.90)
Year 3 5.59 (7.73)
Results expressed as: mean and standard deviation
The DASS-21 cut-offs for conventional severity levels (Lovibond & Lovibond,
1995a) were employed to distinguish rates of depression that were outside of
the normal range (see Table 4.1, chapter 4). At baseline, 28.85% of
respondents (30 people) reported elevated levels of depression compared to
22.00% of the DASS normative sample (Lovibond & Lovibond, 1995a).
Notably, when participants reported depression, these ratings were often of a
greater severity than that reported by norms (see Appendix 34).
Elevated severity of depression appeared to drop in the second and third
years of the study. 24.51% of respondents (25 people) reported depression
out of the normal range in the second year whilst 20.00% of respondents (20
people) reported levels of depression outside of the normal range in the third

Chapter 6: Sample Characteristics and Preliminary Analyses
129
year. Figure 6.1 shows the percentage of participants who showed higher
than normal levels of depression over the three years compared to the DASS
norms (Lovibond & Lovibond, 1995a).
Figure 6.1: Rates of depression outside of the normal range
These findings are intriguing. The baseline results support prior research that
has observed higher depression rates in young people with type I diabetes
(Dantzer et al., 2003; Kanner et al., 2003; Massengale, 2005), yet, the
reductions in depression severity across the years show that participants in
the current study may have adapted to the demands of living with diabetes.
Indeed, by the third year, the prevalence of depression outside of the normal
range (20.00%) was lower than that found in the DASS normative sample
(22.00%). Thus, by the final year of data collection, rates of depression in the
sample appear to be lower than what is expected in the general population.
A repeated measures analysis of variance using the DASS-21 conventional
severity cut-offs (see table 6.20 for means) supported the argument for
adaptation, showing that depression scores significantly improved over the
three years for individuals who reported some level of depressive
symptomology at baseline, F (2, 56) = 24.67, p = 0.01.

Chapter 6: Sample Characteristics and Preliminary Analyses
130
Table 6.20: Mean-levels of depression for participants
outside normal range at baseline
Depression score
Year 1 18.97 (9.10)
Year 2 10.00 (8.18)
Year 3 7.03 (7.24)
Results expressed as: mean and standard deviation
These are exciting results, which appear to be unique to this study. Whilst
prior research involving youth with type I diabetes has demonstrated
improvements in depression over time, these gains are often short-lived and
at no point did the individuals with diabetes report lower levels of depression
than the general population (Dantzer et al., 2003; Grey et al., 1995;
Massengale, 2005). If replicable, these results should provide hope for
health-care professionals as they suggest that the majority of youth adapt to
the challenge of living with type I diabetes and eventually display ‘normal’
rates of depression.
Anxiety
A repeated-measures analysis of variance demonstrated a significant main
effect of time on mean-levels of anxiety, F (1.77, 171.68) = 3.44, p = 0.04.
Perusal of the means (table 6.21) showed that overall anxiety scores
decreased over the three years. Pair-wise comparisons (with Bonferroni
adjustment) demonstrated no statistically significant differences between
these individual time-points (all p values > 0.05) suggesting gradual
improvements in mean-levels of anxiety over the course of the study.
Table 6.21: Mean-levels of anxiety over three years
Anxiety score
Year 1 7.59 (8.52)
Year 2 6.00 (5.51)
Year 3 5.76 (6.22)
Results expressed as: mean and standard deviation

Chapter 6: Sample Characteristics and Preliminary Analyses
131
However, looking at rates of anxiety that exceeded the DASS norms
provided a contrasting picture (see Appendix 34 for severity levels). At
baseline, 34.62% of respondents (36 people) reported anxiety symptoms
outside the normal range compared to 22.00% in the DASS sample
(Lovibond & Lovibond, 1995a). These rates rose in the second year with
41.18% of respondents (42 people) reporting some form of anxiety. In the
third year, prevalence rates for anxiety symptoms outside the normal range
dropped to their lowest level of 27.00% (27 people). Figure 6.2 shows the
percentage of individuals experiencing greater than normal levels of anxiety
over the three years and compares these to the levels observed in the DASS
normative sample (Lovibond & Lovibond, 1995a).
Figure 6.2: Rates of anxiety outside the normal range
These findings are interesting because the temporal pattern for mean-levels
of anxiety did not correspond with the number of participants reporting
anxiety symptoms that were outside of the normal range. Whilst mean-levels
of anxiety declined over each testing occasion, a larger proportion of the
study sample reported above average symptoms of anxiety in the second
year (rather than the first).

Chapter 6: Sample Characteristics and Preliminary Analyses
132
This disparity appears to be explained by a reduction in the severity of
anxiety for many participants in the second year. In the first year, 9.62% of
respondents reported ‘extremely severe’ levels of anxiety as defined by
(Lovibond & Lovibond, 1995a) compared to 0.96% of respondents in the
second year (see Appendix 34 for details). Thus, whilst the number of
individuals reporting above-average anxiety increased in the second year,
the severity of this anxiety was lower than that reported at baseline. This
reduced the grand mean for the entire sample in the second year.
Observation of the means for those reporting anxiety outside of the normal
range in each year substantiates this deduction. These findings suggest that
even though the prevalence of anxiety increased in the second year, the
overall severity of anxiety improved each year within the cohort. Table 6.22
shows the mean anxiety scores for those reporting anxiety outside the
normal range at the three separate time-points.
Table 6.22: Mean anxiety scores for individuals with anxiety outside of the normal range
n Anxiety score
Year 1 36 18.00 (8.24)
Year 2 42 14.24 (7.34)
Year 3 27 13.04 (8.05)
Results expressed as: mean and standard deviation
A repeated measures ANOVA was employed to examine whether the
improvements observed in mean-levels of anxiety could be due to
participants with anxiety at baseline reporting less severe anxiety over time.
Results demonstrated that mean-levels of anxiety significantly decreased for
this group over the course of the study, F (2.00, 68.00) = 35.28, p = 0.00. It may
be that these individuals may have begun to adapt to living with type I
diabetes. Pair-wise comparisons showed a highly significant difference
between anxiety scores in the first and second years in this cohort (p = 0.00)

Chapter 6: Sample Characteristics and Preliminary Analyses
133
indicating that much of the improvement in anxiety levels occurred between
these times. Table 6.23 shows the anxiety scores for those individuals who
reported elevated anxiety at baseline.
Table 6.23: Mean-levels of anxiety for participants outside normal range at baseline
Anxiety score
Year 1 16.40 (8.50)
Year 2 8.80 (5.78)
Year 3 7.14 (6.85)
Results expressed as: mean and standard deviation
It is important to note that whilst some improvements in the severity of
anxiety were observed over the course of the study, the prevalence of
anxiety in the sample was still higher than the established DASS norms
(22.00%) in each of these years (Lovibond & Lovibond, 1995a). This finding
supports research that shows a greater prevalence of anxiety and anxiety
disorders in youth with type I diabetes (Dantzer et al., 2003) and
demonstrates that researchers need to identify factors that may influence the
experience of anxiety within this cohort.
Crucially, reports of anxiety in this study do not seem to be a product of
biased reporting due to hypoglycaemic symptoms mirroring those of anxiety.
Spearman’s correlations demonstrated that anxiety was unrelated to
frequency of hypoglycaemia over the three years (all p’s > 0.05), which
suggests that the DASS anxiety scores reflect valid experience of anxiety.
Stress
A repeated-measures analysis of variance demonstrated a significant main
effect of time on mean-levels of stress, F (1.87, 181.42) = 3.35, p = 0.04. As can
be seen in table 6.24, mean scores for stress declined over the course of the
three-year study. Pair-wise comparisons (with Bonferroni adjustment)

Chapter 6: Sample Characteristics and Preliminary Analyses
134
showed a significant difference between the first and third year (p = 0.04)
which shows that mean-levels of stress had substantially improved by the
end of this investigation.
Table 6.24: Mean-levels of stress over three years
Stress score
Year 1 10.20 (9.22)
Year 2 8.71 (7.45)
Year 3 8.00 (6.84)
Results expressed as: mean and standard deviation
Comparable results were found when looking at the DASS-21 cut-offs for
stress scores outside of the normal range (Lovibond & Lovibond, 1995a). In
the first year 27.88% of respondents (29 people) reported symptoms of
stress but this dropped to 23.53% of respondents (24 people) in the second
year (for severity levels see Appendix 34).
Figure 6.3: Rates of stress outside the normal range
Rates dropped again in the third year, and by this time, the study group
reported lower rates of non-trivial stress (16.00%) than the DASS normative

Chapter 6: Sample Characteristics and Preliminary Analyses
135
sample (22.00%) (Lovibond & Lovibond, 1995a). Figure 6.3 shows the
percentage of participants who reported stress outside of the normal range
over the three years compared to the DASS cohort (Lovibond & Lovibond,
1995a).
A repeated measures analysis of variance suggested that much of the
improvement in mean-levels of stress occurred in participants reporting
elevated levels of stress at baseline F (2.00,54.00) = 39.60, p = 0.00. Table 6.25
shows the mean levels of stress for each year within this group.
Table 6.25: Mean-levels of stress for participants outside normal range at baseline
Stress score
Year 1 22.57 (5.68)
Year 2 11.00 (8.07)
Year 3 11.71 (7.88)
Results expressed as: mean and standard deviation
Again, these findings support the notion of youth with type I diabetes
adapting to the demands of their disease. Whilst the baseline results agree
with research that has demonstrated increased stress levels in individuals
with type I diabetes (Amer, 1999; Delameter, 1992), third year figures show
that the number of individuals reporting greater-than-average stress was
lower in the study cohort than in the general population (Lovibond &
Lovibond, 1995a). Furthermore, those reporting elevated stress at baseline
improved significantly across the three years. Thankfully, this finding implies
that health-care workers can expect to see improvements in stress levels in
the majority youth with type I diabetes over time.
It is vital to note that the above-reported findings for the DASS-21 scales
were not a product of biased reporting from children outside the specified
age range of the Depression Anxiety Stress Scales (Lovibond & Lovibond,
1995a). Participants under the age of 12 did not significantly differ from the

Chapter 6: Sample Characteristics and Preliminary Analyses
136
rest of the sample on measures of depression, anxiety and stress in any year
of data collection (all p values > 0.05). This authenticates the validity of
results and suggests that the responses of children as young as 8 years old
can be considered as legitimate and unbiased when using the DASS-21
measure. Whilst the DASS-21 is just one of a suite of indices required to
diagnose clinical levels of depression, anxiety and stress, the reported
results give a good indication of levels of negative affect and general
psychological wellbeing within the study population.
Summary of preliminary results
In summary, preliminary analyses provided much information about the study
sample and their management of diabetes over time. This knowledge allows
researchers to assess the generalisability of obtained results and identify
specific self-management outcomes that require further attention.
Accordingly, the most noteworthy findings are detailed below.
First, the sample appears to provide a valid cross-section of Australian
youth with type I diabetes. Participants came from a diverse range of
cultural backgrounds and lived in a variety of geographical locations in
New South Wales and the Australian Capital Territory. The group
included almost equal numbers of males and females and there was a
satisfactory distribution of ages within this cohort. Similarly, there was a
good distribution of income groups (albeit with a slight ceiling effect) and
treatment modes. Crucially, all participants had satisfactory access to
health-care indicating that personal factors must have contributed to
results.
Second, demographic variables were related to diabetes self-
management and personality. Age, gender, duration of diabetes, and
responsibility for diabetes care were related to specific self-management
outcomes, whereas age, gender and responsibility were related to
personality traits. This demonstrates that these demographic factors

Chapter 6: Sample Characteristics and Preliminary Analyses
137
should be retained as control variables in further analyses investigating
the role of personality in type I diabetes self-management.
Third, results demonstrated that a sizeable proportion of the sample
displayed poor glycaemic control in each year of the study (National
Health and Medical Research Council, 2005; Rewers et al., 2009).
Critically, individual glycaemic control showed little temporal variance.
This suggests that many participants had chronic poor control which
increases the risk for developing serious diabetic complications (National
Health and Medical Research Council, 2005; Rewers et al., 2009; The
Diabetes Control and Complications Trial Research Group, 1993). Such
findings highlight the need to find predictors of long-term glycaemic
control in this population.
Fourth, self-care behaviour appeared to be variable across participants.
There was large inter-individual variability in the number of blood glucose
tests conducted within the sample. Furthermore, self-monitoring of blood
glucose was stable over time which suggests that some participants
were engaging in what has been determined as sub-standard self-care
(Benjamin, 2002; National Health and Medical Research Council, 2005;
The Diabetes Control and Complications Trial Research Group, 1993) at
every time-point in the study. The high individual variability in blood
glucose testing suggests that factors such as personality may be
important.
Fifth, hypoglycaemia was a common factor in participants’ lives. The
majority of the sample reported obtaining a blood glucose reading below
3.00 in the two weeks preceding each annual interview. Remarkably,
hypoglycaemia showed some rank-order instability. This means that a
person who experienced a low number of hypoglycaemic incidents at
baseline did not necessarily experience a low number of hypoglycaemic
incidents throughout the rest of the study. Thus, it may be interesting to

Chapter 6: Sample Characteristics and Preliminary Analyses
138
explore whether personality influences these temporal changes in
individuals’ experiences of hypoglycaemia.
Sixth, the extent to which individuals coped with diabetes was variable
over time. Mean-levels of coping did not change throughout the study but
test-retest correlations demonstrated rank-order instability in acceptance
and avoidance coping. This suggests that coping was a highly
personalised experience and speaks to the role of personal factors in
coping with type I diabetes.
Seventh, participants appeared to improve on measures of depression,
anxiety and stress over time. Whilst there were high rates of negative
affect at baseline, the prevalence of depression and stress scores that lie
outside the normal range were below population norms by the third year.
Prevalence of anxiety symptomology also began to approach ‘normal’
levels by this time. These findings suggest that some individuals may
have adapted to living with diabetes over the course of the study. By
finding predictors of trajectories of negative affect it may be possible to
identify those at risk for chronic poor psychological wellbeing.
Finally, personality was stable over the three-year investigation. Test-
retest correlations across the three years were strong and this high
temporal stability suggests that any relationships uncovered between
personality and self-management could have long-term implications.
In all, preliminary results demonstrate that the current study sample provides
researchers with an excellent opportunity to examine the role of personality
in the self-management of type I diabetes over time. Furthermore, these
results clearly identify control variables and self-management outcomes
worthy of further interest. These are briefly discussed below.

Chapter 6: Sample Characteristics and Preliminary Analyses
139
Inclusion of variables in further analyses
Table 6.26 shows the control, predictor and outcome variables included
further analyses aimed at answering the research questions.
Table 6.26: Control, predictor and outcome measures
Control variables Predictors Outcome variables
Age Openness to experience HbA1c
Gender Conscientiousness Depression
Duration of diabetes Extraversion Anxiety
Responsibility for care Agreeableness Stress
Emotional regulation Acceptance coping
Avoidance coping
Frequency of BGL testing
Frequency of hypoglycaemia
Control variables
The variables of age, gender, duration of diabetes and responsibility for
diabetes care were retained for further analyses based on their theoretical
importance (Anderson et al., 2002; Dabadghao et al., 2001; Helgeson et al.,
2007; Ingerski et al., 2010; Olsen et al., 1999; Springer et al., 2006) and their
relationships with personality and/or self-management outcomes in the
current study. Retaining these variables ensured that any relationships
between personality and self-management outcomes were not better
explained by these phenomena. No other control variables were retained
based on their non-significant relationships with outcomes.
Predictors
The five-factor model personality traits of openness to experience,
conscientiousness, extraversion, agreeableness and emotional regulation

Chapter 6: Sample Characteristics and Preliminary Analyses
140
were all retained for further analyses based on their longitudinal stability.
This permitted longitudinal associations between these personality and self-
management outcomes to be examined.
Outcomes
The variables of HbA1c, blood glucose testing, depression, anxiety, stress,
coping and frequency of hypoglycaemia were retained as self-management
outcomes because they have theoretical and clinical importance (Dantzer et
al., 2003; Holmes et al., 2006; Ikeda & Tsuruoka, 1994; Ingerski et al., 2010;
Laffel et al., 1998; Massengale, 2005; National Health and Medical Research
Council, 2005; Rewers et al., 2009; The Diabetes Control and Complications
Trial Research Group, 1993; Wiebe & Smith, 1997), showed good data
properties and provided a good overview of diabetes self-management. The
other outcome measures from this study were excluded from further
analyses because they were categorical, ordinal or had low variance.
Together, the included variables should provide researchers with a wealth of
information about the role of personality in young people’s diabetes. By
engaging in this research, a clearer understanding of the long-term influence
of personality may be achieved.

Chapter 7
Results
Chapter 7 details the results of statistical analyses used to answer the
research questions of the current study. To lend order to these findings, the
chapter is divided into three sections, one section per research question.
Results for specific self-management outcomes are discussed separately
within these sections. Significant correlations, results of forced-entry
regressions and results of mixed-design and repeated measures analyses of
variance (ANOVAs) are presented within the text. For any further information
the reader is directed to the appendices. There, a complete table of
correlations is presented in Appendix 35 and a complete list of hierarchical
regressions is presented in Appendix 36. Prior research and the clinical
implications of current findings are considered when discussing the obtained
results. The potentially prospective nature of associations between
personality and self-management outcomes are also highlighted.
Research Question 1
What relationships exist between five-factor model traits and HbA1c,
hypoglycaemia, frequency of blood glucose testing, depression, anxiety,
stress, avoidance coping and/or acceptance coping in youth with type I
diabetes?
Five-factor model traits and HbA1c values
Pearson’s product-moment correlations (Table 7.1) demonstrated that
agreeableness and conscientiousness were the only five-factor model

Chapter 7: Results
142
personality traits to show repeated linear associations with HbA1c values. As
hypothesised, these traits were generally negatively correlated with HbA1c
scores meaning that individuals high in conscientiousness and
agreeableness tended to have better glycaemic control over the course of
the study. These results echo the findings of previous studies involving youth
with diabetes (Vollrath et al., 2007). However, there was an unexpected
finding. HbA1c values from the first year of data collection demonstrated few
significant linear associations with five-factor model personality traits.
Table 7.1: Correlations between five-factor model traits and HbA1c
1st year HbA1c 2nd year HbA1c
3rd year HbA1c
1st year Conscientiousness - -0.25* -0.35**
2nd year Conscientiousness - -0.30** -0.30**
3rd year Conscientiousness - -0.26** -0.32**
1st year Agreeableness - -0.36** -0.28**
2nd year Agreeableness - -0.31** -
3rd year Agreeableness -0.22** -0.34** -.31**
2nd year Openness -0.20* -0.29** -0.28**
*Significant at p<0.05 (2-tailed)
** Significant at p<0.01 (2-tailed)
Computed using Pearson’s product-moment correlations
The absence of significant associations in the first year is difficult to explain
and may be an artefact of the study sample. Nevertheless, first year scores
for agreeableness and conscientiousness were related with HbA1c levels in
the second and third years and this illustrates that personality traits may
influence future glycaemic control. The nature of such prospective
relationships warrants further investigation.
Whilst second year openness to experience was significantly correlated with
HbA1c values across the three years, the first and third year measures of this

Chapter 7: Results
143
trait were unrelated to glycaemic control. Furthermore, no consistent
relationships between HbA1c and the five-factor trait of extraversion were
uncovered. As postulated, it appears that these traits have a less reliable or
important role in the regulation of blood glucose values in youth with type I
diabetes.
Examination of the scatterplots (Figures 7.1 to 7.3) for emotional regulation
and HbA1c uncovered a non-linear relationship between these two variables.
In accordance with hypotheses, there appeared to be a curvilinear
association between these phenomena with individuals high or low on
emotional regulation having poorer HbA1c results.
Figures 7.1 to 7.3: Scatterplots of emotional regulation and HbA1c
To establish the validity of a curvilinear relationship between emotional
regulation and HbA1c, bivariate regressions using emotional regulation as an

Chapter 7: Results
144
independent variable and HbA1c as a dependent variable were conducted for
each year of data collection following the procedure outlined by Keith (2006)
and Mallery (2009). A quadratic term for emotional regulation was included in
these regression analyses, which allowed linear and quadratic regression
models to be compared.
If the addition of a quadratic term for an independent variable significantly
improves the overall fit of a bivariate regression model, this means that the
relationship between the independent and dependent variables is of a
curvilinear nature (Keeley, Zayac, & Correia, 2008; Keith, 2006; Mallery,
2009). Thus, to support the existence of a curvilinear association between
emotional regulation and HbA1c, a regression model that includes both a
linear and quadratic term for emotional regulation (model 2) would need to
provide a better fit than a model that includes a linear term only (model 1).
For the first year, a linear model did not significantly predict HbA1c values
(R2= 0.01, F (1,102) = 0.55, p = 0.46). However, model 2 which included a
quadratic term produced a significant change in R2 (R2 change = 0.05 F (1,
101) = 5.69, p = 0.02) and a significant model (R2= 0.06, F (2,101), p = 0.05).
For the second year, a linear model did not predict HbA1c (R2= 0.01, F (1,102)
= 1.29, p = 0.26), and although inclusion of a quadratic term significantly
improved fit (R2 change = 0.04F (1, 101) = 4.09, p = 0.05), this did not produce
a significant model (R2= 0.05, F (2,101) = 2.71, p = 0.07). Similarly, a linear
model did not achieve significance in the final year (R2= 0.03, F (1, 98) = 2.76,
p = 0.10), but addition of a quadratic term produced a significant change in
R2 (R2 change = 0.05 F (1, 97) = 5.21, p = 0.03) and a significant model (R2=
0.08, F (2, 97) = 4.05, p = 0.02).
In all, the fact that inclusion of a quadratic term for emotional regulation
significantly improved the fit of regression models of HbA1c for each year of
the research study provides evidence for a U-shaped relationship between
these variables (Keeley, Zayac, &Correia, 2008; Keith, 2006; Mallery, 2009).
Examination of the scatterplots confirmed that the direction of this

Chapter 7: Results
145
association remained constant over the three years of the study with
individuals low or high in emotional regulation having poorer glycaemic
control than individuals who were moderate on this trait. These results are
intriguing and have not been previously reported in studies involving youth
with type I diabetes (Skinner et al., 2002; Vollrath et al., 2007). Given these
findings, all further analyses of the role of emotional regulation in glycaemic
control were conducted with the curvilinear nature of this association in mind.
Five-factor model traits and frequency of blood glucose testing
Spearman’s correlations established that the traits of conscientiousness and
agreeableness were related to frequency of blood glucose testing in the
second and third years (Table 7.2). Like HbA1c, there was no association
between blood glucose testing and personality traits in the first year, which
again indicate that personality, may have a prospective relationship with
diabetes self-management. The results of correlations showed that
individuals higher in agreeableness and conscientiousness tested their blood
glucose levels on a more regular basis. These findings are consistent with
prior research that relates conscientiousness and agreeableness to
adherence with medical treatments and self-care behaviours (Auerbach et
al., 2002; Bogg & Roberts, 2004; Lee & Lin, 2009; Mancuso, 2009, 2010; B.
W. Roberts et al., 2005; Skinner et al., 2002).
Table 7.2: Correlations between five-factor model traits and blood glucose testing
1st year
BGT 2nd year
BGT
3rd year
BGT
1st year Conscientiousness - 0.28** 0.23*
2nd year Conscientiousness - 0.32** 0.28**
3rd year Conscientiousness - 0.31** 0.26**
1st year Agreeableness - 0.22* 0.21*
2nd year Agreeableness - - -
3rd year Agreeableness - 0.24* -
*Significant at p<0.05 (2-tailed) ** Significant at p<0.01 (2-tailed)
Computed using Spearman’s Rho

Chapter 7: Results
146
Five-factor model traits and hypoglycaemia
Spearman’s correlations demonstrated few significant relationships between
frequency of hypoglycaemia and personality traits (Table 7.3). The only five-
factor model trait significantly associated with hypoglycaemia was
agreeableness and this was only so for the number of hypoglycaemic
incidents experienced in the first year. This reveals that the relationship
between agreeableness and hypoglycaemia may be unreliable or a product
of type I error. Further research may be needed to look at this relationship in
more depth.
Table 7.3: Correlations between five-factor model traits and hypoglycaemia
1st year Hypo 2nd year Hypo 3rd year Hypo
1st year Agreeableness -0.21* - -
2nd year Agreeableness -0.30** - -
3rd year Agreeableness -0.22* - -
* Significant at p<0.05 (2 tailed)
** Significant at p<0.01 (2-tailed)
Computed using Spearman’s Rho
Five-factor model traits and depression
As expected, Spearman’s correlations demonstrated significant and reliable
negative associations between emotional regulation and depression scores
(Table 7.4). Furthermore, the traits of conscientiousness, extraversion and
openness also showed some negative correlations with depression.
These findings are in line with a large body of research that argues emotional
regulation is a critical predictor of negative affect (Bienvenu et al., 2004;
Bolger & Zuckerman, 1995; Kendler et al., 2006; Khan et al., 2005; Kotov et
al., 2010; Lahey, 2009; Roelofs et al., 2008). However, the relationship
between emotional regulation and depression was not as strong as
expected. The strength of correlations between emotional regulation and
depression ranged from -0.24 to -0.39 in the current study whereas

Chapter 7: Results
147
correlations stronger than -0.50 are often reported in the general population
(Bienvenu et al., 2004; Bolger & Zuckerman, 1995; Kendler et al., 2006;
Khan et al., 2005; Kotov et al., 2010; Lahey, 2009; Roelofs et al., 2008).
Table 7.4: Correlations between five-factor model traits and depression
1st year Dep 2nd year Dep 3rd year Dep
1st year Conscientiousness - - -0.20*
3rd year Conscientiousness -0.19* - -
1st year Extraversion - - -
2nd year Extraversion - - -0.24*
3rd year Extraversion - - -0.24*
1st year Emotional regulation -0.24* -0.38** -0.32**
2nd year Emotional regulation -0.31** -0.38** -0.39**
3rd year Emotional regulation -0.34** -0.41** -0.34**
1st year Openness - - -
2nd year Openness -.020* - -
3rd year Openness -0.22* - -
*Significant at p<0.05 (2-tailed)
** Significant at p<0.01 (2-tailed)
Computed using Spearman’s Rho
These findings reveal that the strength of the association between emotional
regulation and depression may be weaker in youth with type I diabetes than
in the general population. Importantly, this could be due to extraneous
variables such as diabetes control and contact with health professionals
(including psychological services) influencing depression scores.
Alternatively, a restricted sample size and slight floor effects for depression
scores may have influenced these results. Whilst these results are not
definitive, they do point to the need for further research in this area.

Chapter 7: Results
148
Five-factor model traits and anxiety
Spearman’s correlations also demonstrated reliable associations between
emotional regulation and anxiety scores (Table 7.5). These correlations
indicate that higher levels of emotional regulation protect a young person
with diabetes from experiencing high levels of anxiety. Similar to depression,
the size of observed correlations for emotional regulation and anxiety were
smaller than reported in studies involving non-diabetics (Bienvenu,
2006;Khan, et al., 2005; Kotov, et al., 2010; Roelofs, et al., 2008). Again, this
highlights that other latent factors may play a role in determining negative
affect within this cohort.
Table 7.5: Correlations between five-factor model traits and anxiety
1st year Anx 2nd year Anx 3rd year Anx
1st year Conscientiousness - - -0.23*
3rd year Agreeableness -0.20* - -
1st year Extraversion - - -0.28**
2nd year Extraversion - - -
3rd year Extraversion - - -0.23*
1st year Emotional regulation -0.22* -0.32** -0.27**
2nd year Emotional regulation -0.24* -0.30** -0.29**
3rd year Emotional regulation -0.26** -0.35** -0.37**
1st year Openness - - -0.22*
2nd year Openness - - -0.21*
3rd year Openness - -0.21* -
*Significant at p<0.05 (2-tailed)
** Significant at p<0.01 (2-tailed)
Computed using Spearman’s Rho
Notably, significant negative associations between anxiety and openness,
extraversion and conscientiousness were also observed. This indicates that
these traits may have also influenced anxiety levels. However, these

Chapter 7: Results
149
relationships were less consistent and it is difficult to infer causality. For
example, low extraversion may be a cause or consequence of anxiety.
Five-factor model traits and stress
Emotional regulation was the only personality trait to demonstrate a reliable
relationship with stress levels in the study cohort (Table 7.6). Emotional
regulation was negatively associated with stress across the three years
indicating that individuals with type I diabetes who are able to regulate their
emotions feel less stress. Such findings mirror the results of prior research
that posit a principal link between this personality trait and stress (Bolger &
Zuckerman, 1995; Cimbolic-Gunthert, Cohen, & Armeli, 1999; Vollrath,
2001).
Remarkably, there were no significant associations between the five-factor
model trait of conscientiousness and stress. This finding runs counter to the
study hypotheses and illustrates that a planful and responsible disposition
does not necessarily reduce stress levels in youth with diabetes. Finally,
there was a significant negative association observed between third year
stress and first year extraversion. However, the lack of a reliable temporal
relationship between these variables signifies that this association may be
due to type I error. Together, these results suggest that emotional regulation
is the key personality trait that determines levels of stress in youth with
diabetes.
Table 7.6: Correlations between five-factor model traits and stress
1st year Str 2nd year Str 3rd year Str
1st year Extraversion - - -0.20*
1st year Emotional regulation -0.27* -0.31** -0.37**
2nd year Emotional regulation -0.32** -0.31** -0.42**
3rd year Emotional regulation -0.30** -0.38** -0.40**
*Significant at p<0.05 (2-tailed)
** Significant at p<0.01 (2-tailed)
Computed using Spearman’s Rho

Chapter 7: Results
150
Five-factor model traits and acceptance coping
As hypothesised, individuals high in openness to experience relied on
acceptance as a way of coping with their diabetes. Spearman’s correlations
(Table 7.7) demonstrated that openness to experience was related to
acceptance in both the second and third ‘matched’ years. Furthermore, third
year acceptance showed significant associations with levels of openness in
the first, second and third year. Such results hint at the possibility of a
prospective relationship between these two variables.
Similarly, high levels of emotional regulation appeared to be related to
greater acceptance of diabetes. However, these relationships appeared to be
less consistent. Once more, these relationships appeared to be prospective
underlining the importance of further longitudinal analyses.
Table 7.7: Correlations between five-factor model traits and acceptance
1st year Acc 2nd year Acc 3rd year Acc
1st year Emotional regulation - - -
2nd year Emotional regulation - - 0.22*
3rd year Emotional regulation - 0.27** 0.21*
1st year Openness - - 030**
2nd year Openness - 0.25* 0.23*
3rd year Openness 0.20* 0.27** 0.28**
*Significant at p<0.05 (2-tailed)
** Significant at p<0.01 (2-tailed)
Computed using Spearman’s Rho
Five-factor model traits and avoidance coping
Associations between five-factor traits and avoidance coping also followed
the directions hypothesised (Table 7.8). Emotional regulation had clear and
relatively reliable negative correlations with avoidance. Conscientiousness
followed a similar pattern with individuals high on this trait reporting lower
avoidance coping in the second and third years. Finally, agreeableness

Chapter 7: Results
151
displayed some significant (albeit less reliable) relationships with avoidance
coping. Together these results imply that a personality pattern of high
conscientiousness, high emotional regulation and high agreeableness may
reduce reliance on avoidance as a method of coping in youth with diabetes.
Table 7.8: Correlations between five-factor model traits and avoidance
1st year Avo 2nd year Avo 3rd year Avo
1st year Conscientiousness - -0.27** -0.22*
2nd year Conscientiousness - -0.23* -0.25*
3rd year Conscientiousness - - -0.21*
1st year Agreeableness -0.21* - -
3rd year Agreeableness - - -0.29**
1st year Emotional regulation -0.21* -0.31** -0.31**
2nd year Emotional regulation - -0.23* -0.30**
3rd year Emotional regulation -0.24* -0.24* -0.27**
*Significant at p<0.05 (2-tailed)
** Significant at p<0.01 (2-tailed)
Computed using Spearman’s Rho
Summary of bivariate analyses
Overall, the results of bivariate analyses reveal that personality does play a
role in youths’ self-management of type I diabetes. In particular, the traits of
conscientiousness, agreeableness and emotional regulation seem important
to maintenance of glycaemic control whilst the traits of emotional regulation,
conscientiousness and openness to experience seem to play a role in coping
and negative affect.
Remarkably, many of the associations between first year personality and
outcomes measures did not reach statistical significance. This could imply
that the influence of personality is cumulative over time and hence has a
greater impact on future outcomes. At-risk individuals (either low or high on a
particular personality trait) may show progressive declines in self-
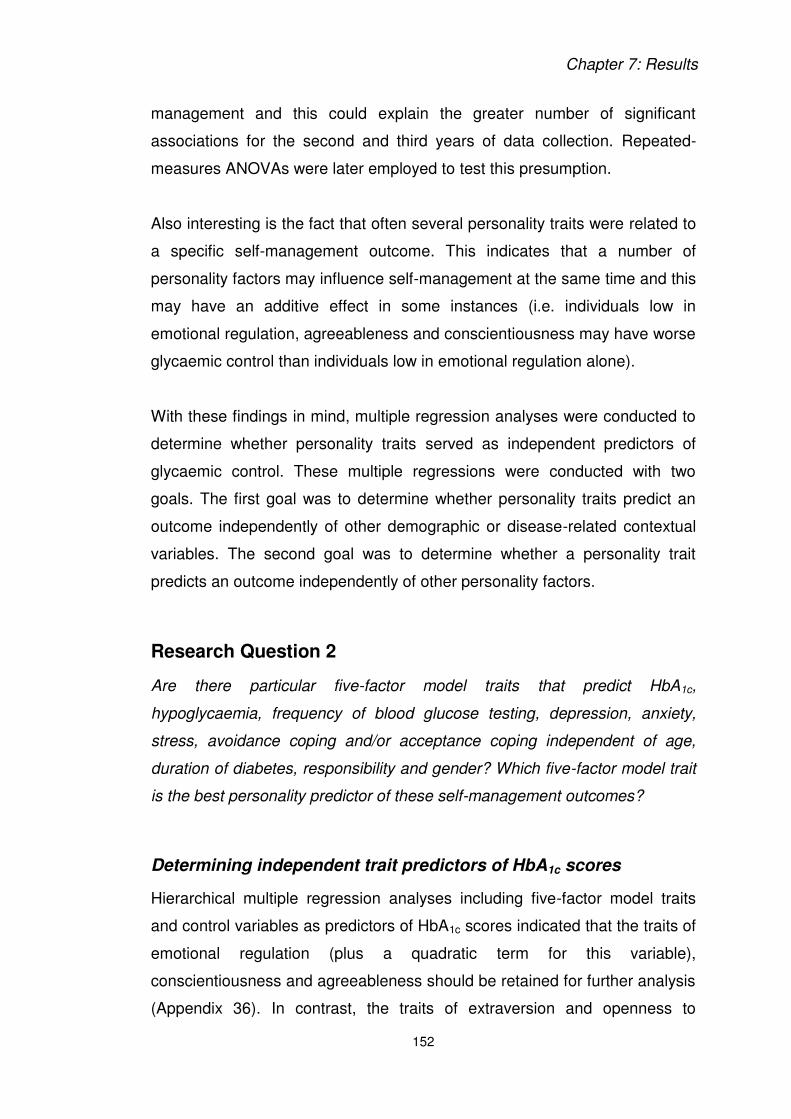
Chapter 7: Results
152
management and this could explain the greater number of significant
associations for the second and third years of data collection. Repeated-
measures ANOVAs were later employed to test this presumption.
Also interesting is the fact that often several personality traits were related to
a specific self-management outcome. This indicates that a number of
personality factors may influence self-management at the same time and this
may have an additive effect in some instances (i.e. individuals low in
emotional regulation, agreeableness and conscientiousness may have worse
glycaemic control than individuals low in emotional regulation alone).
With these findings in mind, multiple regression analyses were conducted to
determine whether personality traits served as independent predictors of
glycaemic control. These multiple regressions were conducted with two
goals. The first goal was to determine whether personality traits predict an
outcome independently of other demographic or disease-related contextual
variables. The second goal was to determine whether a personality trait
predicts an outcome independently of other personality factors.
Research Question 2
Are there particular five-factor model traits that predict HbA1c,
hypoglycaemia, frequency of blood glucose testing, depression, anxiety,
stress, avoidance coping and/or acceptance coping independent of age,
duration of diabetes, responsibility and gender? Which five-factor model trait
is the best personality predictor of these self-management outcomes?
Determining independent trait predictors of HbA1c scores
Hierarchical multiple regression analyses including five-factor model traits
and control variables as predictors of HbA1c scores indicated that the traits of
emotional regulation (plus a quadratic term for this variable),
conscientiousness and agreeableness should be retained for further analysis
(Appendix 36). In contrast, the traits of extraversion and openness to

Chapter 7: Results
153
experience and the control variables of age, gender, duration of diabetes and
level of responsibility for diabetes tasks did not significantly predict HbA1c
scores over the three year period.
These findings demonstrate that personality had a greater influence on
HbA1c levels over the course of the study than control variables previously
identified as important to glycaemic control (Anderson et al., 1990;
Dabadghao et al., 2001; Hochhauser et al., 2008; Naar-King et al., 2006).
Furthermore, the results of these regressions denote that any associations
between personality and glycaemic control are not strongly mediated or
moderated by responsibility, age, duration of diabetes or gender as the
inclusion of these variables did not substantially weaken associations
between five-factor model traits and HbA1c.
In all, results indicate that researchers and clinicians should concentrate
further on the role of emotional regulation, agreeableness and
conscientiousness in the daily regulation of blood glucose. Indeed, the
importance of these traits has been highlighted in prior research studies
involving young people with diabetes (Skinner et al., 2002; Vollrath et al.,
2007). Consequently, these traits were entered into three forced-entry
regressions that examined the impact of these predictors on glycaemic
control for each ‘matched’ year (Table 7.9).
For the first year, the traits of conscientiousness, agreeableness and
emotional regulation (plus quadratic term) did not produce a significant
model to predict HbA1c scores, R2 = 0.08, F (4, 99) = 2.04, p = 0.09. However,
both the linear and quadratic terms for emotional regulation were significant
independent predictors (both p’s = 0.02) indicating that this personality trait
best predicted glycaemic control on this measurement occasion.
For the second year, the traits of conscientiousness, agreeableness and
emotional regulation (plus quadratic term) produced a significant model that
explained around 16% of the variance in HbA1c scores, R2 = 0.16, F (4, 99) =

Chapter 7: Results
154
4.73, p = 0.00. This demonstrates that a sizeable proportion of the variance
in glycaemic control was accounted for by these personality traits in this
year. Of these factors, agreeableness was the only significant independent
predictor of HbA1c scores (p = 0.03).
Table 7.9: Forced-entry multiple regressions of HbA1c scores
Year 1 B
Std. Error B
Beta
t Sig.
Constant 19.23 4.02 4.78 0.00
Emotional regulation -0.39 0.16 -2.36 -2.47 0.02*
Emotional regulation
(quadratic)
0.00 0.00 2.30 2.41 0.02*
Agreeableness -0.03 0.02 -0.13 -1.30 0.20
Conscientiousness 0.01 0.02 0.08 0.70 0.48
R2 = 0.08, F (4, 99) = 2.04, p = 0.09
Year 2 B
Std. Error B
Beta
t Sig.
Constant 17.19 2.68 6.41 0.00
Emotional regulation -0.19 0.11 -1.26 -1.76 0.08
Emotional regulation
(quadratic)
0.00 0.00 1.25 1.77 0.08
Agreeableness -0.04 0.02 -0.22 -2.19 0.03*
Conscientiousness -0.04 0.02 -0.20 -1.96 0.05
R2 = 0.16, F (4,99) = 4.73, p = 0.00**
Year 3 B
Std. Error B
Beta
t
Sig.
Constant 19.40 3.16 6.14 0.000
Emotional regulation -0.26 0.12 -1.73 -2.09 0.04*
Emotional regulation
(quadratic)
0.00 0.00 1.68 2.04 0.04*
Agreeableness -0.04 0.02 -0.21 -2.10 0.04*
Conscientiousness -0.04 0.02 -0.22 -2.05 0.04*
R2 = 0.18, F (4, 95) = 5.43, p = 0.00**
*Significant at the 0.05 level (2 tailed) **Significant at the 0.01 level (2 tailed)

Chapter 7: Results
155
For the third year of data collection, a significant model was also achieved,
R2 = 0.18, F (4, 95) =5.43, p = 0.00. This time, the traits of conscientiousness,
agreeableness and emotional regulation were all independent predictors of
glycaemic control. This suggests that these traits had a cumulative effect in
this year. Thus, individuals with low scores on all three of these personality
traits were likely to demonstrate the poorest glycaemic control.
Overall, these results give strong support to a role of personality in
determining glycaemic control. However, it was impossible to make a
definitive judgement regarding the most important personality predictor of
HbA1c scores. Furthermore, the lack of a significant overall model for the first
year is puzzling and signifies that some other unmeasured factors may have
better explained differences in the regulation of blood glucose levels during
this period. Such results could also indicate that personality may better
predict future rather than current glycaemic levels, particularly given the
correlations evidenced between first year personality measures and
subsequent annual measures of glycaemic control.
Determining independent trait predictors of blood glucose testing
Hierarchical multiple regressions indicated that conscientiousness, gender
and age played a significant role in determining the number of blood glucose
tests that a participant carried out over a two week period (Appendix 36). The
results of these analyses indicate that conscientiousness was the only
significant personality predictor of blood testing behaviour, which highlights
the importance of further interest in this trait.
Thus, to test whether conscientiousness independently predicted blood
glucose testing, the predictors of conscientiousness, age and gender were
entered into three forced-entry regressions that examined the impact of
these predictors on blood testing for each ‘matched’ year (Table 7.10).

Chapter 7: Results
156
Results from the first year regression demonstrate that the variables of
gender, age and conscientiousness did not produce a significant model for
blood glucose testing, R2 = 0.05, F (3, 100) = 1.67, p = 0.18. This means that
other unmeasured factors must have influenced this outcome at this time.
Nevertheless, conscientiousness was listed as a significant independent
predictor within this model (p = 0.05).
Table 7.10: Forced-entry multiple regressions of blood glucose testing
Year 1
B
Std. Error
B
Beta
t Sig.
Constant 40.67 30.46 1.34 0.19
Gender 1.47 6.68 0.02 0.22 0.83
Age -1.10 1.19 -0.09 -0.92 0.36
Conscientiousness 0.89 0.45 0.20 1.99 0.05*
R2 = 0.05, F (3, 100) = 1.67, p = 0.18
Year 2
B
Std. Error
B
Beta
t Sig.
Constant 33.26 24.76 1.34 0.18
Gender 3.31 4.99 0.06 0.66 0.51
Age -2.66 0.90 -0.27 -2.97 0.00**
Conscientiousness 1.34 0.37 0.33 3.57 0.00**
R2 = 0.19, F (3, 96) = 7.64, p = 0.00**
Year 3
B
Std. Error
B
Beta
t
Sig.
Constant 36.63 24.36 1.50 0.14
Gender -1.44 5.10 -0.03 -0.28 0.78
Age -2.43 0.90 -0.25 -2.71 0.01**
Conscientiousness 1.37 0.35 0.36 3.90 0.00**
R2 = 0.19, F (3, 99) = 7.52, p = 0.00**
*Significant at the 0.05 level (2 tailed) **Significant at the 0.01 level (2 tailed)
A different result was found for the second year regression. In the second
year, the included predictor variables produced a significant model that

Chapter 7: Results
157
predicted around 19% of the variance in blood glucose testing, R2 = 0.19, F
(3, 96) = 7.64, p = 0.00.For this model, conscientiousness was a highly
significant independent predictor of glucose testing behaviour (p = 0.00).
Similarly, the third year ‘matched’ data produced a significant regression
model, R2 = 0.19, F (3, 99) = 7.52, p = 0.00. Again, this model predicted 19%
of the variance in blood glucose testing, and again, conscientiousness was a
strong independent predictor (p = 0.00).
In total, the results of these regression analyses confirm that
conscientiousness is a strong independent predictor of blood glucose testing
behaviour. Furthermore, this trait appears to be the sole personality variable
determining the frequency of these tests. Whilst prior research studies have
often related blood glucose testing to age and gender (Anderson et al., 1990;
Dabadghao et al., 2001; Hochhauser et al., 2008; Naar-King et al., 2006), the
results of these regressions verify that conscientiousness also plays a key
role. Indeed, the fact that a combination of age, gender and
conscientiousness predicted 19% of the variance in blood glucose testing at
two different time points suggests that conscientiousness may be one of the
most critical psychological factors determining blood glucose testing
behaviour. It is thus imperative to examine whether conscientiousness may
predict increases or decreases in blood glucose testing over time.
Determining independent trait predictors of hypoglycaemia
Whilst hierarchical analyses confirmed that responsibility and extraversion
play a role in hypoglycaemia (Appendix 36), subsequent forced entry
regressions did not produce significant models over the course of the three-
year study (all p’s > 0.05). These results indicate that the predictor variables
measured in this study did not reliably predict experience of hypoglycaemic
events (Table 7.11).

Chapter 7: Results
158
Given the nature of the collected data, these findings are unsurprising. Whilst
the majority of participants experienced a hypoglycaemic event, the number
of events experienced by each person was generally low. This caused a
slight floor effect and a restriction of range for these data and this most likely
influenced the results of regressions. Based on the absence of significant
results and the restrictions of these data, no further analyses of interactions
between personality and hypoglycaemia were undertaken.
Table 7.11: Forced-entry multiple regressions of hypoglycaemia
Year 1 B
Std. Error
B Beta
t Sig.
Constant -2.06 2.37 -0.87 0.39
Responsibility 0.05 0.05 0.10 1.02 0.31
Extraversion 0.06 0.03 0.18 1.823 0.07
R2 = 0.04, F (2, 101) = 2.14, p = 0.12
Year 2 B
Std. Error
B Beta
t Sig.
Constant -1.15 2.35 -0.49 0.63
Responsibility 0.03 0.05 0.06 0.57 0.57
Extraversion 0.07 0.04 0.18 1.79 0.08
R2 = 0.04, F (2, 97) = 1.91, p = 0.15
Year 3 B
Std. Error
B Beta
t Sig.
Constant 4.34 1.99 2.17 0.03
Responsibility -0.07 0.04 -0.17 -1.64 0.10
Extraversion 0.01 s0.03 0.04 0.42 0.67
R2 = 0.03, F (2, 96) = 1.35, p = 0.26
*Significant at the 0.05 level (2 tailed) **Significant at the 0.01 level (2 tailed)
Determining independent trait predictors of depression scores
Initial hierarchical regressions including both personality and control
variables (Appendix 36) indicated that emotional regulation and duration of

Chapter 7: Results
159
diabetes played a role in determining depression scores. Accordingly, these
variables were retained in forced-entry regressions to clarify the nature of
these relationships (Table 7.12).
Table 7.12: Forced-entry multiple regressions of depression scores
Year 1
B
Std. Error
B Beta
t Sig.
Constant 38.03 5.64 6.70 0.00
Duration of diabetes -0.71 0.25 -0.25 -2.90 0.01**
Emotional regulation -0.54 0.10 -0.45 -5.20 0.00**
R2 = 0.24, F (2,101) = 16.36, p = 0.00**
Year 2 B
Std. Error
B Beta
t Sig.
Constant 22.82 3.94 5.79 0.00
Duration of diabetes 0.12 0.19 0.06 0.65 0.52
Emotional regulation -0.34 0.07 -0.43 -4.69 0.00**
R2 = 0.19, F (2, 99) = 11.33, p = 0.00**
Year 3 B
Std. Error
B
Beta
t
Sig.
Constant 20.31 4.81 4.22 0.000
Duration of diabetes 0.01 0.22 0.00 0.05 0.96
Emotional regulation -0.28 0.09 -0.32 -3.26 0.00**
R2 = 0.32, F (2, 96) = 5.33, p = 0.01**
*Significant at the 0.05 level (2 tailed) **Significant at the 0.01 level (2 tailed)
For the first year, duration of diabetes and emotional regulation produced a
significant model that predicted 24% of the variance in depression scores, R2
= 0.24, F (2,101) = 16.36, p = 0.00. Both of the included variables were
significant independent predictors of depression (p = 0.01 and 0.00
respectively). These results establish that youth with a shorter duration of
diabetes and low levels of emotional regulation were more susceptible to
depression in the first ‘matched’ year of data collection.
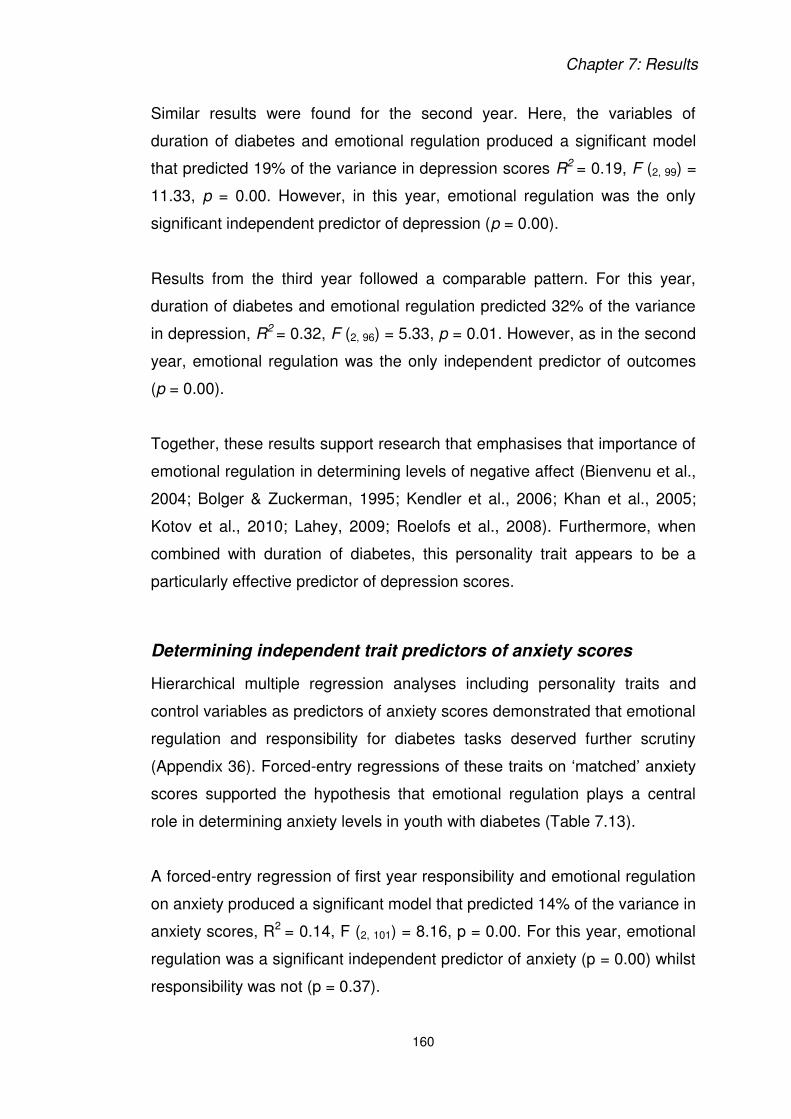
Chapter 7: Results
160
Similar results were found for the second year. Here, the variables of
duration of diabetes and emotional regulation produced a significant model
that predicted 19% of the variance in depression scores R2 = 0.19, F (2, 99) =
11.33, p = 0.00. However, in this year, emotional regulation was the only
significant independent predictor of depression (p = 0.00).
Results from the third year followed a comparable pattern. For this year,
duration of diabetes and emotional regulation predicted 32% of the variance
in depression, R2 = 0.32, F (2, 96) = 5.33, p = 0.01. However, as in the second
year, emotional regulation was the only independent predictor of outcomes
(p = 0.00).
Together, these results support research that emphasises that importance of
emotional regulation in determining levels of negative affect (Bienvenu et al.,
2004; Bolger & Zuckerman, 1995; Kendler et al., 2006; Khan et al., 2005;
Kotov et al., 2010; Lahey, 2009; Roelofs et al., 2008). Furthermore, when
combined with duration of diabetes, this personality trait appears to be a
particularly effective predictor of depression scores.
Determining independent trait predictors of anxiety scores
Hierarchical multiple regression analyses including personality traits and
control variables as predictors of anxiety scores demonstrated that emotional
regulation and responsibility for diabetes tasks deserved further scrutiny
(Appendix 36). Forced-entry regressions of these traits on ‘matched’ anxiety
scores supported the hypothesis that emotional regulation plays a central
role in determining anxiety levels in youth with diabetes (Table 7.13).
A forced-entry regression of first year responsibility and emotional regulation
on anxiety produced a significant model that predicted 14% of the variance in
anxiety scores, R2 = 0.14, F (2, 101) = 8.16, p = 0.00. For this year, emotional
regulation was a significant independent predictor of anxiety (p = 0.00) whilst
responsibility was not (p = 0.37).

Chapter 7: Results
161
Table 7.13: Forced-entry multiple regressions of anxiety scores
Year 1 B
Std. Error
B Beta
t Sig.
Constant 23.43 7.51 3.12 0.00
Responsibility 0.13 0.14 0.08 0.91 0.37
Emotional regulation -0.39 0.10 -0.36 -3.88 0.00**
R2 = 0.14, F (2, 101) = 8.16, p = 0.00**
Year 2 B
Std. Error
B Beta
t Sig.
Constant 24.73 4.02 6.15 0.00
Responsibility -
0.260
0.08 -0.29 -3.14 0.00**
Emotional regulation -0.19 0.06 -0.29 -3.16 0.00**
R2 = 0.18, F (2, 99) = 10.84, p = 0.00**
Year 3 B
Std. Error
B Beta
t Sig.
Constant 22.97 4.46 5.15 0.00
Responsibility -0.15 0.09 -0.16 -1.69 0.09
Emotional regulation -0.23 0.07 -0.32 -3.34 0.00**
R2 = 0.14, F (2, 97) = 7.96, p = 0.00**
*Significant at the 0.05 level (2 tailed) **Significant at the 0.01 level (2 tailed)
In the second year, a combination of these variables produced a significant
model that explained 18% of the variance in anxiety scores, R2 = 0.18, F (2,
99) = 10.84, p = 0.00. This time, both responsibility and emotional regulation
independently predicted anxiety levels (both p’s = 0.00). A final forced-entry
regression of third year data produced a significant model that explained
14% of variance in anxiety scores, R2 = 0.14, F (2, 97) = 7.96, p = 0.00. Once
again, responsibility did not predict anxiety levels (p = 0.09) whereas
emotional regulation was a strong independent predictor (p = 0.00).
Overall, the results of these regressions reveal that emotional regulation is a
key predictor of anxiety in young people with diabetes. Furthermore, this trait

Chapter 7: Results
162
predicted anxiety independently of responsibility. This indicates that the daily
demands of diabetes are not a wholly sufficient explanation for the increased
anxiety levels commonly reported in youth with type I diabetes. Such findings
demonstrate that personality researchers should focus on the trait of
emotional regulation when trying to implement interventions aimed at
improving anxiety in youth with diabetes. Future research could look at
interactions between these variables to clarify relationships.
Determining independent trait predictors of stress scores
Hierarchical regression confirmed that emotional regulation, extraversion and
openness to experience deserved further attention (Appendix 36).
Accordingly, table 7.14 presents the results of forced-entry regressions of
these variables over the three years.
Table 7.14: Forced-entry multiple regressions of stress scores
Year 1 B
Std. Error B Beta
t Sig.
Constant 30.07 7.64 3.94 0.00
Emotional regulation -0.39 0.12 -0.33 -3.29 0.00**
Extraversion 0.14 0.10 0.14 1.33 0.19
Openness -0.12 0.12 -0.11 -1.05 0.30
R2 = 0.11, F (3, 100) = 4.22, p = 0.01**
Year 2 B
Std. Error
B Beta
t Sig.
Constant 11.38 5.98 1.90 0.06
Emotional regulation -0.30 0.09 -0.34 -3.39 0.00**
Extraversion 0.18 0.09 0.20 1.96 0.05
Openness 0.09 0.09 0.10 1.04 0.30
R2 = 0.12, F (3, 98) = 4.42, p = 0.01**
Year 3 B
Std. Error
B Beta
t Sig.
Constant 16.34 4.96 3.30 0.00
Emotional regulation -0.35 0.08 -0.44 -4.33 0.00**
Extraversion 0.01 0.08 0.01 0.11 0.91
Openness 0.19 0.07 0.25 2.56 0.01*
R2 = 0.19, F (3, 96) = 7.62, p = 0.00**
*Significant at the 0.05 level (2 tailed)
**Significant at the 0.01 level (2 tailed)

Chapter 7: Results
163
The first year regression produced a significant model that explained 11% of
the variance in stress, R2 = 0.11, F (3, 100) = 4.22, p = 0.01. Only emotional
regulation independently predicted stress levels at this time (p = 0.00). For
the second ‘matched’ year, regression analyses produced a significant model
that predicted 12% of the variance in stress scores, R2 = 0.12, F (3, 98) = 4.42,
p = 0.01. Again, the only independent predictor of outcomes was emotional
regulation (p = 0.00). Comparable results were found for the third year of
data collection with the included predictors producing a significant model that
explained 19% of the variance in stress levels, R2 = 0.19, F (3, 96) = 7.62, p =
0.00. This time, the traits of emotional regulation and openness to
experience both independently predicted stress scores (p = 0.00 and 0.01
respectively).
These results illustrate that the trait of emotional regulation is a critical factor
determining stress levels in youth with type I diabetes. Clinicians therefore
need to be mindful of a young person’s ability to manage their emotions
when recommending difficult-to-achieve self-management goals that may
contribute to stress levels. Further research may help to clarify the role of
openness to experience in stress responses.
Determining independent trait predictors of acceptance coping
Initial hierarchical regression analyses (Appendix 36) established that
responsibility, age, gender and openness to experience were important to
acceptance coping in youth with diabetes. Therefore, these variables entered
into forced-entry regression for each matched year (Table 7.15)

Chapter 7: Results
164
Table 7.15: Forced-entry multiple regressions of acceptance coping
Year 1 B
Std. Error
B Beta
t Sig.
Constant 24.67 6.46 3.82 0.00
Responsibility -0.07 0.09 -0.09 -0.72 0.47
Age 0.10 0.18 0.07 0.56 0.58
Gender -0.66 0.88 -0.08 -0.75 0.46
Openness 0.03 0.06 0.06 0.59 0.56
R2 = 0.03, F (4, 99) = 0.86, p = 0.49
Year 2 B
Std. Error
B Beta
t Sig.
Constant 19.08 3.20 5.96 0.00
Responsibility 0.04 0.09 0.06 0.41 0.68
Age 0.09 0.19 0.07 0.48 0.63
Gender -1.30 0.76 -0.17 -1.72 0.09
Openness 0.09 0.05 0.20 1.94 0.06
R2 = 0.10, F (4, 97) = 2.80, p = 0.03*
Year 3 B
Std. Error
B Beta
t Sig.
Constant 23.20 3.05 7.61 0.00
Responsibility 0.17 0.09 0.28 1.81 0.07
Age -0.41 0.21 -0.29 -1.96 0.05
Gender -2.45 0.78 -0.30 -3.16 0.00**
Openness 0.10 0.04 0.22 2.22 0.03*
R2 = 0.19, F (4, 96) = 5.62., p = 0.00**
*Significant at the 0.05 level (2 tailed) **Significant at the 0.01 level (2 tailed)
The first year regression produced a non-significant model, R2 = 0.03, F (4, 99)
= 0.86, p = 0.49. However, different results were obtained in the second year
of data collection where a significant model was achieved that predicted 10%
of the variance in acceptance coping scores, R2 = 0.10, F (4, 97) = 2.80, p =
0.03. None of the variables included in this model served as a significant
independent predictor of acceptance coping (all p’s >0.05).

Chapter 7: Results
165
A final regression of third year values also produced a significant model, R2 =
0.19, F (4, 96) = 5.62., p = 0.00. This time, the model predicted 19% of the
variance in coping scores and the variables of gender and openness to
experience served as independent predictors of acceptance (p = 0.00 and
0.03 respectively). This analysis verifies that the relationship between
acceptance and openness was not solely mediated through gender. This
also indicates that individuals who crave new experiences may be more
likely to accept unchangeable events and try to integrate these into their life.
Consequently, this relationship was flagged for further longitudinal analysis.
Determining independent trait predictors of avoidance coping
The results of hierarchical regressions indicated that responsibility, emotional
regulation and agreeableness help to predict scores on avoidance coping
(Appendix 36).
Forced-entry regression analysis (Table 7.16) of the first round of ‘matched’
data demonstrated that responsibility for diabetes tasks and the personality
traits of emotional regulation and agreeableness significantly predicted 11%
of the variance in scores for avoidance coping, R2 = 0.11, F (3, 100) = 4.27, p =
0.01. Emotional regulation (p = 0.03) was a significant independent predictor
in this model.
The second year regression also produced a significant model in which
responsibility and emotional regulation were independent predictors of
outcomes, R2 = 0.12, F (3, 96) = 4.49, p = 0.01. Similarly, the third year
regression produced a significant model R2 = 0.18, F (3, 94) = 6.85, p = 0.00
with emotional regulation and agreeableness independently predicting
coping scores. These results suggest further attention be given to the traits
of agreeableness and emotional regulation in determining trajectories of
avoidance coping in youth with type I diabetes.

Chapter 7: Results
166
Table 7.16: Forced-entry multiple regressions of avoidance coping
Year 1 B
Std. Error
B Beta
t Sig.
Constant 11.49 4.12 2.79 0.01
Responsibility 0.11 0.06 0.18 1.87 0.06
Emotional regulation -0.09 0.04 -0.22 -2.25 0.03*
Agreeableness -0.05 0.05 -0.10 -1.04 0.30
R2 = 0.11, F (3, 100) = 4.27, p = 0.01*
Year 2 B
Std. Error
B Beta
t Sig.
Constant 18.77 3.53 5.32 0.00
Responsibility -0.14 0.06 -0.24 -2.51 0.01*
Emotional regulation -0.09 0.04 -0.21 -2.19 0.03*
Agreeableness -0.04 0.05 -0.08 -0.85 0.40
R2 = 0.12, F (3, 96) = 4.49, p = 0.01**
Year 3 B
Std. Error
B Beta
t Sig.
Constant 22.32 3.46 6.45 0.00
Responsibility -0.05 0.05 -0.10 -1.01 0.31
Emotional regulation -.012 0.04 -0.29 -3.03 0.00**
Agreeableness -0.14 0.05 -0.25 -2.56 0.01*
R2 = 0.18, F (3, 94) = 6.85, p = 0.00**
*Significant at the 0.05 level (2 tailed) **Significant at the 0.01 level (2 tailed)
Summary of regression analyses
In summary, personality traits appear to influence several self-management
outcomes in youth with type I diabetes, independent of other psychosocial
predictors. Table 7.17 displays the five-factor model personality traits and
highlights those that that were significant independent predictors of
outcomes.

Chapter 7: Results
167
Table 7.17: Summary of regression analyses
HbA1c BGL
tests Hypo Dep Anx Stress Accept Avoid
Conscientiousness
Agreeableness
Emotional
regulation
Openness to
experience
Extraversion
Specifically, conscientiousness predicted HbA1c scores and blood glucose
testing, emotional regulation predicted HbA1c, depression, anxiety, stress
and avoidance coping, agreeableness predicted HbA1c and avoidance
coping whilst openness to experience somewhat predicted stress and levels
of acceptance coping.
On the basis of these results, longitudinal analyses were undertaken to
examine whether baseline levels of these personality traits were associated
with longitudinal trajectories of these associated self-management outcomes.
Table 7.18 summarises the longitudinal analyses undertaken.
Table 7.18: Longitudinal analyses of personality and self-management
Personality trait Self-management trajectories examined
Conscientiousness HbA1c, Blood glucose testing
Agreeableness HbA1c, Avoidance coping
Emotional regulation HbA1c, Depression, Anxiety, Stress, Avoidance coping
Openness to experience Stress, Acceptance coping
Extraversion No associations tested

Chapter 7: Results
168
Research Question 3
Do five-factor model personality traits predict trajectories of HbA1c,
hypoglycaemia, frequency of blood glucose testing, depression, anxiety,
stress, avoidance coping and acceptance coping over time?
Conscientiousness and HbA1c trajectories
A mixed design ANOVA using baseline tertile groups for conscientiousness
demonstrated no significant main effect of time on HbA1c values, F (2, 134)
=1.02, p= 0.36, but a significant between-groups effect of conscientiousness
on HbA1c values F (1, 67) = 4.74, p = 0.03. This denotes that, for the included
sample, glycaemic control did not change but that there were differences in
control between those in high and low conscientiousness groups.
There was a significant interaction between conscientiousness group and
time, F (2, 134) = 5.00, p = 0.01, which verifies that conscientiousness levels
were associated with improvement or deterioration of glycaemic control over
the three year period. Repeated tests of within-subjects contrasts
demonstrated that the interaction effect was significant between the first and
second years F (1, 67) = 6.78, p = 0.01. Between-group differences in
glycaemic control therefore significantly increased over this period.
Examination of the means for HbA1c (Table 7.19) demonstrated that
individuals in the lowest tertile of conscientiousness had worsening control
whilst individuals in the highest tertile group demonstrated improvements in
glycaemic control over time.
Table 7.19: Mean HbA1c levels for baseline conscientiousness groups
1st year HbA1c 2nd year HbA1c
3rd year HbA1c
Low Conscientiousness
n = 39
8.6 (1.2) 9.1 (1.4) 9.2 (1.5)
High Conscientiousness
n = 30
8.5 (1.1) 8.4 (1.0) 8.3 (1.0)
Quartile points differ across longitudinal analyses due to FFPI-C T-Score conversions and small missing data
Results presented as mean and standard deviation

Chapter 7: Results
169
To clarify the nature of changes in glycaemic control within each
conscientiousness group, separate repeated-measures ANOVAs were
conducted. This was undertaken to test if the changes in HbA1c within each
group were statistically significant. Results demonstrated a significant main
effect of time on HbA1c scores for the low conscientiousness group F (2, 76) =
5.35, p = 0.01. Pair-wise comparisons with Bonferroni adjustment
demonstrated that first year HbA1c values were significantly different from
second (p = 0.01) and third year (p = 0.03) HbA1c values in this cohort. This
indicates that individuals low in conscientiousness experienced significant
deterioration of glycaemic control over time.
In contrast, no significant changes in HbA1c values were found for the high
conscientiousness group F (2, 58) = 0.87, p = 0.42 which demonstrates that
high conscientiousness may protect against the worsening control that often
occurs during adolescence (Dabadghao et al., 2001).
These findings reveal that low levels of baseline conscientiousness may
predict statistically significant deterioration of glycaemic control over time. In
this way, low conscientiousness at time of diagnosis may present a risk for
poor long-term management of glycaemic levels. The figure below (Figure
7.4) depicts trajectories of glycaemic control for these groups over the course
of the three-year study.

Chapter 7: Results
170
Figure 7.4: HbA1c values for baseline tertile groups of conscientiousness over three years
Agreeableness and HbA1c trajectories
A mixed design ANOVA comparing the upper and lower baseline tertiles of
agreeableness established no significant main effect of time on HbA1c
values, F (2, 140) = 0.69, p= 0.50, but a significant between-groups effect of
agreeableness on HbA1c values F (1, 70) = 11.02, p = 0.00. There was also a
significant interaction between agreeableness group and time, F (2, 140)
=3.44, p = 0.04. This verifies that differences in HbA1c values occurred
between groups over time. Tests of within-subjects contrasts substantiated
that the interaction effect was significant between the first and second years
F (1, 70) = 8.65, p= 0.00. Examination of the means (Table 7.20) indicated that
individuals in the lowest tertile of agreeableness had worsening glycaemic
control whilst individuals high in agreeableness showed improvement in
HbA1c from baseline.

Chapter 7: Results
171
Table 7.20: Mean HbA1c levels for baseline agreeableness groups
1st year HbA1c 2nd year HbA1c
3rd year HbA1c
Low Agreeableness
n = 38
8.9 (1.3) 9.3 (1.5) 9.2 (1.3)
High Agreeableness
n = 34
8.4 (1.4) 8.2 (0.9) 8.3 (1.1)
Quartile points differ across longitudinal analyses due to FFPI-C T-Score conversions and small missing data
Results presented as mean and standard deviation
To test the statistical significance of changes in HbA1c within groups,
separate repeated-measures ANOVAs were employed. These demonstrated
no significant main effect of time on HbA1c scores for the low agreeableness
group, F (1.54, 56.93) = 3.10, p = 0.07. However, pair-wise comparisons with
Bonferroni adjustment showed that second year HbA1c values in this group
were significantly higher than first year values (p = 0.00). This provides
evidence that low agreeableness is a risk factor for deteriorating glycaemic
control over time. No significant main effect of time on HbA1c values was
found for the high agreeableness group F (2, 66) = 0.83, p = 0.44.This signifies
that glycaemic control was stable within this group over time. Figure 7.5
displays the mean HbA1c values for both the high and low agreeableness
groups over the course of the three-year study.
Together, these findings support the importance of agreeableness in
management of blood glucose levels during adolescence. Like individuals
low in conscientiousness, those low in agreeableness in our sample had
worsening glycaemic control over time.

Chapter 7: Results
172
Figure 7.5: HbA1c values for baseline tertile groups of agreeableness over three years
Emotional regulation and HbA1c trajectories
The upper, middle and lower quintile groups for baseline emotional
regulation were compared to examine the role of this trait in long-term
glycaemic control. These groups were compared based on the curvilinear
relationship between emotional regulation and HbA1c scores.
A mixed design ANOVA revealed no significant main effect of time on HbA1c
values, F (2, 130)= 0.76, p= 0.47 and no significant interaction between
emotional regulation group and time, F (4, 130) =1.11, p = 0.36. However,
examination of the means (Table 7.21) indicated that there were differences
in glycaemic control between groups.

Chapter 7: Results
173
Table 7.21: Mean HbA1c levels for baseline emotional regulation groups
1st year HbA1c 2nd year HbA1c
3rd year HbA1c
Low Emotional regulation
n = 20
9.1 (1.4) 9.2 (1.6) 9.3 (1.4)
Moderate Emotional regulation
n = 28
8.2 (0.9) 8.4 (0.9) 8.4 (1.2)
High Emotional regulation
n = 21
9.0 (1.4) 9.1 (1.4) 8.6 (1.2)
Quartile points differ across longitudinal analyses due to FFPI-C T-Score conversions and small missing data
Results presented as mean and standard deviation
Statistical analysis supported the existence of a significant between-groups
effect, F (2,65)= 4.02, p = 0.02. Pair-wise comparisons confirmed that the
HbA1c scores for the low emotional regulation group were significantly
different to the moderate emotional regulation group (p = 0.03) over the
course of the study. As can be seen in table 7.20, the individuals in the low
emotional regulation group had consistently worse glycaemic control than
those in the moderate emotional regulation group over the three years.
There were no other significant differences between emotional regulation
groups. This implies that those low in emotional regulation have persistently
elevated blood glucose levels which increase the risk of developing diabetic
complications (The Diabetes Control and Complications Trial Research
Group, 1993). The figure below (Figure 7.6) shows the mean HbA1c values
for the high, low and moderate emotional regulation groups over the course
of the research study.
In all, these findings confirm that the five-factor personality model traits of
conscientiousness, agreeableness and emotional regulation play a role in the
regulation of glycaemic levels over time. Specifically, low conscientiousness,
low agreeableness and low emotional regulation are risk factors for poor or
worsening glycaemic control. These findings have significant clinical

Chapter 7: Results
174
implications and demonstrate that clinicians need to take personality into
account when formulating diabetes treatment and management plans.
Figure 7.6: HbA1c values for baseline quintile groups of emotional regulation over three years
Conscientiousness and blood glucose testing trajectories
Results of a mixed-design ANOVA comparing baseline conscientiousness
tertile groups indicated no significant main effect of time on blood glucose
testing blood glucose testing within this cohort, F (1.64, 114.47) =2.05, p= 0.13.
Similarly there was no significant interaction between conscientiousness and
blood glucose testing over time, F (1.64, 114.47) = 0.30, p= 0.74. However, a
significant between-groups effect of conscientiousness on blood glucose
level testing was uncovered, F (1, 70) = 4.05, p = 0.05. These results verify
that higher conscientiousness was consistently related to greater frequency
of blood glucose tests over the course of the research study. Table 7.22
shows the means for the upper and lower tertile groups.

Chapter 7: Results
175
Table 7.22: Mean number of blood glucose tests per fortnight for baseline conscientiousness groups
1st year BGT 2nd year BGT 3rd year BGT
Low Conscientiousness
n = 40
68.95 (25.96) 61.28 (23.09) 60.27 (27.90)
High Conscientiousness
n = 32
78.91 (51.17) 75.53 (31.73) 75.03 (26.99)
Quartile points differ across longitudinal analyses due to FFPI-C T-Score conversions and small missing data
Results presented as mean and standard deviation
These results support prior investigations that have highlighted the role of
conscientiousness in determining diabetes-related self-care behaviour
(Christensen & Smith, 1995; Edwards, 1999; Marks, 2000; Szymborska-
Kajanek et al., 2006). Further research involving larger sample sizes could
help to model relationships and interactions between this trait, blood glucose
testing and glycaemic control over extended periods. Figure 7.7 plots these
scores over the three years of data collection.
Figure 7.7: Mean number of blood glucose tests per fortnight for baseline tertile groups of conscientiousness over three years

Chapter 7: Results
176
Emotional regulation and depression trajectories
A mixed design ANOVA revealed no significant main effect of time on
depression within the upper and lower tertile groups for baseline emotional
regulation, F (1.81, 108.80) = 0.60, p = 0.54. No significant interaction was found
between emotional regulation and time, F (1.81, 108.80) = 1.47, p = 0.24 but a
highly significant between-groups effect was found, F (1, 60) = 8.78, p = 0.00.
These results demonstrate that individuals with low levels of emotional
regulation had consistently higher scores for depression over the three
years. Table 7.23 displays the mean depression scores for these groups
over the three-year study.
Table 7.23: Mean depression scores for upper and lower baseline tertiles of emotional regulation
1st year Dep 2nd year Dep 3rd year Dep
Low Emotional regulation
n = 36 10.76 (11.18) 8.81 (8.31) 7.50 (7.79)
High Emotional regulation
n = 26 4.07 (4.68) 4.97 (5.39) 4.96 (7.54)
Quartile points differ across longitudinal analyses due to FFPI-C T-Score conversions and small missing data
Results presented as mean and standard deviation
Whilst no significant within-group changes were found in this analysis,
inspection of the means for each group indicated that depression scores for
those low in emotional regulation were within the normal range for the
second and third years (refer to Table 4.1). This indicates that there was
some (albeit non-statistically significant) improvement of psychological
functioning within this group over time. It would be interesting to collect
further rounds of data on depression scores within these groups to examine
whether the changes within depression approached significance over longer
periods. Such results show that further research examining the role of
emotional regulation in determining long-term psychological responses in
youth with type I diabetes would be beneficial. Figure 7.8 graphs the

Chapter 7: Results
177
trajectories of depression scores for the upper and lower baseline tertiles of
emotional regulation over the study period.
Figure 7.8: Mean depression scores for baseline tertile groups of emotional regulation over three years
Emotional regulation and anxiety trajectories
Results of a mixed-design ANOVA employing high and low baseline tertile
groups of emotional regulation demonstrated no significant main effect of
time on anxiety, F (1.80, 107.72) = 1.55, p = 0.22. Furthermore, no significant
interaction between emotional regulation and time was uncovered, F (1.80,
107.72) = 1.52, p = 0.22. These results demonstrate that there were no
significant changes in anxiety levels over time for either group. However, as
expected, a significant between-groups effect was found for emotional
regulation on anxiety, F (1, 60) = 2.40, p = 0.13. Table 7.24 shows that
individuals low in emotional regulation had consistently higher mean anxiety
levels over the three years.
As can be seen in the table below, individuals in the low emotional regulation
group had consistently higher levels of anxiety over time. Like depression,
there were changes in the experience of anxiety that was outside of the

Chapter 7: Results
178
normal range for the low emotional regulation group (refer to Table 4.1).
Mean anxiety scores for this group moved from moderate DASS cut-off in the
first year, to mild in the second and then to normal in the third year. Again,
further rounds of data collection would be helpful to analyse this relationship
further.
Table 7.24: Mean anxiety scores for upper and lower baseline tertiles of emotional regulation
1st year Anx 2nd year Anx 3rd year Anx
Low Emotional regulation
n = 36 10.00 (10.42) 8.00 (5.68) 6.83 (6.24)
High Emotional regulation
n = 26 5.73 (5.40) 6.00 (5.58) 6.15 (7.15)
Quartile points differ across longitudinal analyses due to FFPI-C T-Score conversions and small missing data
Results presented as mean and standard deviation
Figure 7.9 illustrates the mean stress scores for the low and high emotional
regulation group over the three data collection periods.
Figure 7.9: Mean anxiety scores for baseline tertile groups of emotional regulation over three years

Chapter 7: Results
179
Emotional regulation and stress trajectories
The association between emotional regulation and stress followed a similar
pattern to depression and anxiety. A mixed-design ANOVA found no
significant main effect of time on stress, F (1.71, 102.85) = 1.29, p = 0.28, no
significant interaction between time and emotional regulation, F (1.71, 102.85) =
1.08, p = 0.34, but a highly significant between-groups effect, F (1, 60) =
10.64, p = 0.00. As table 7.25 reveals, individuals with low emotional
regulation had consistently higher levels of stress. Nevertheless, mean-levels
of stress within both groups were below the norm level proposed by the
DASS researchers (see Table 4.1) for each of year of data collection.
Table 7.25: Mean stress scores for upper and lower baseline tertiles
of emotional regulation
1st year Str 2nd year Str 3rd year Str
Low Emotional regulation
n = 36
13.24 (10.41) 12.11 (8.29) 10.44 (7.11)
High Emotional regulation
n = 26
7.67 (6.13) 7.17 (6.49) 7.11 (5.18)
Quartile points differ across longitudinal analyses due to FFPI-C T-Score conversions and small missing data
Results presented as mean and standard deviation
These findings demonstrate that the ability of youth with type I diabetes to
regulate their emotions is important in determining stress levels over time.
Hence, this personality trait could serve as a good predictor of general
psychological outcomes in youth with diabetes over time. Figure 7.10
displays the annual scores for stress within each emotional regulation group.

Chapter 7: Results
180
Figure 7.10: Mean stress scores for baseline tertile groups of emotional regulation over three years
Emotional regulation and avoidance coping trajectories
Analysis of the longitudinal relationships between emotional regulation and
avoidance coping demonstrated no significant main effect of time on
avoidance scores, F (2, 116) = 0.22, p = 0.80, and no significant interaction
between time and emotional regulation, F (2, 116) = 0.06, p = 0.94. This
demonstrates that, for the included sample, avoidance coping did not change
either for the whole group or within individual groups. However, a significant
between-groups effect was found for emotional regulation on avoidance
coping, F (1, 58) = 6.51, p = 0.01. Examination of the means (Table 7.26)
illustrates that individuals in the low emotional regulation group relied more
on avoidance as a way of coping with the demands of their diabetes.

Chapter 7: Results
181
Table 7.26: Mean avoidance coping scores for upper and lower baseline tertiles of emotional regulation
1st year Avo 2nd year Avo 3rd year Avo
Low Emotional regulation
n = 35
8.59 (3.34) 8.39 (3.60) 8.39 (3.76)
High Emotional regulation
n = 25
6.73 (2.92) 7.07 (3.24) 6.50 (3.13)
Quartile points differ across longitudinal analyses due to FFPI-C T-Score conversions and small missing data
Results presented as mean and standard deviation Means do not include excluded item
These results further emphasise the importance of emotional regulation in
the management of diabetes in youth. The differences between the low and
high emotional regulation groups are represented in Figure 7.11 below.
Figure 7.11: Mean avoidance coping for baseline tertile groups of emotional regulation over three years

Chapter 7: Results
182
Agreeableness and avoidance coping trajectories
Longitudinal analyses demonstrated that levels of agreeableness were also
important in predicting avoidance coping over time. A significant between-
groups effect was found for agreeableness on avoidance, F (1, 67) = 5.83, p =
0.02, with individuals in the low agreeableness group reporting higher levels
of avoidance coping across all three years (Table 7.27). No significant main
effect of time on avoidance was found, F (2, 134) = 0.72, p = 0.49 and there
was no significant interaction between time and agreeableness, F (2, 134) =
0.26, p = 0.77.
Table 7.27: Mean stress scores for upper and lower baseline tertiles of agreeableness
Avoid year 1 Avoid year 2 Avoid year 3
Low Agreeableness
n = 38
8.38 (3.50) 7.72 (3.61) 7.82 (3.56)
High Agreeableness
n = 31
6.56 (2.47) 6.50 (3.13) 6.47 (2.90)
Quartile points differ across longitudinal analyses due to FFPI-C T-Score conversions and small missing data
Results presented as mean and standard deviation Means do not include excluded item
These results denote that individuals with diabetes who are cooperative and
compassionate are less likely to rely on avoidance coping strategies over
time. Further research in this area could focus on specific variables that may
underpin this relationship. Figure 7.12 displays the changes in mean-levels
of avoidance coping within the upper and lower tertile groups over the course
of the study.

Chapter 7: Results
183
Figure 7.12: Mean avoidance coping scores for baseline tertile groups of agreeableness over three years
Openness to experience and acceptance coping trajectories
Finally, longitudinal analysis demonstrated no significant main effect of time
on acceptance coping, F (1.84, 124.75) = 0.28, p = 0.76 but a significant
interaction between openness to experience and acceptance coping over
time, F (1.84, 124.75) = 3.11, p = 0.05. A significant between-groups effect was
also found for openness on acceptance, F (1, 68) = 5.27, p = 0.03. These
results demonstrate that levels of acceptance coping were significantly
different between individuals in the low and high baseline tertile groups for
openness and that these differences increased over time. As can be seen in
Table 7.28, acceptance coping increased in the high openness to experience
group over time.
A within-groups, repeated-measures ANOVA demonstrated that the changes
within the high openness to experience group approached significance, F
(1.65, 54.44) = 2.80, p = 0.07. In contrast, no significant changes in acceptance
coping were found for the low openness to experience group F (2, 70) = 0.75,
p = 0.48.

Chapter 7: Results
184
Table 7.28: Mean acceptance coping for upper and lower baseline tertiles of openness
1st year Acc 2nd year Acc 3rd year Acc
Low Openness
n = 36
23.85 (3.98) 23.19 (4.42) 22.68 (4.19)
High Openness
n = 34
24.06 (5.16) 24.94 (3.84) 25.88 (3.11)
Quartile points differ across longitudinal analyses due to FFPI-C T-Score conversions
and small missing data
Results presented as mean and standard deviation
These results suggest that a person who craves new experiences may be
more likely to come to terms with a diagnosis of type I diabetes over time.
Figure 7.13 graphs the mean scores on acceptance coping for these groups
over the three years of data collection.
Figure 7.13: Mean acceptance coping scores for baseline tertile groups of openness to experience over three years

Chapter 7: Results
185
Summary of longitudinal analyses
Overall, the obtained results demonstrate that five-factor model personality
traits played an important role in determining longitudinal trajectories self-
management outcomes in the study sample. The findings presented here
confirm that baseline personality scores had a continuous effect on certain
management outcomes and these effects where, in some cases, cumulative
over time. This indicates that, at times, personality traits may be a better
predictor of long-term outcomes than other psychosocial predictors that have
previously received attention in the diabetes literature.
Specifically, low levels of emotional regulation, agreeableness,
conscientiousness and openness to experience appear to predict poor self-
management of type I diabetes over time. The relationships between these
personality traits and self-management outcomes are summarised below:
Individuals scoring low on the trait of conscientiousness engage in
consistently less blood glucose testing and have worsening glycaemic
control over time.
Individuals scoring low on emotional regulation tend to have
consistently poorer psychological profiles with higher rates of
depression, anxiety, stress and avoidance coping along with
consistently poorer management of glycaemic levels.
Individuals scoring low on agreeableness consistently rely on
avoidance to cope with diabetes and have worsening glycaemic
control.
Finally, individuals scoring low on openness to experience are less
likely to accept their diabetes whereas those high on this trait appear
to come to accept their condition over time.

Chapter 7: Results
186
These findings are significant as they underline the importance of personality
in determining self-management of type I diabetes in youth over time.
Reported results show there are specific personality traits that may serve as
red flags for poor psychological wellbeing and deterioration of glycaemic
control during adolescence, and by understanding this, clinicians can identify
youth at risk and provide tailored support that ‘matches’ the individual’s
personality. If these results are replicable, this information could provide the
groundwork for future studies examining the potential of personality-based
interventions in diabetes care. Critically, this could reduce levels of negative
affect within this population and diminish the likelihood of developing
devastating complications. This underlines the importance of further research
within this area

Chapter 8
Conclusions and Future Directions
The present investigation underlines the importance of personality in
determining self-management of type I diabetes in youth over time. This
research offers a significant contribution to current knowledge and the
obtained results merit detailed analysis and interpretation in line with findings
reported from prior studies in this domain. Accordingly, this chapter provides
a summary of the main strengths, key findings, limitations and potential
clinical implications of this study. Particular emphasis is given towards
identifying future avenues of inquiry and providing theoretical explanations
for the obtained results.
Study strengths
When compared to other studies in this area (Skinner et al., 2002; Vollrath et
al., 2007), this research has several strengths that make it one of the most
comprehensive investigations of the role of personality traits in young
people’s glycaemic control and management of type I diabetes. These
strengths add weight to the research findings and provide confidence in the
obtained results.
A major strength of this study is that it is the largest study to employ the five-
factor model as a framework for measuring personality in adolescents with
type I diabetes. The only other study to include all five-factor model traits in
analyses included a sample of 64 juveniles (Vollrath et al., 2007), practically
half the number recruited for the current study (n = 104). Whilst the study
conducted by Skinner et al (2002) consisted of 358 participants, this project

Chapter 8: Conclusion and Future Directions
188
did not specifically target youth and included participants up to 30 years of
age. In all, this means that the current study provides the clearest
representation of relations between five-factor model traits and diabetes self-
management during adolescence. Crucially, the organisational structure of
the five-factor personality model allows the research findings from this study
to be easily contrasted with results from prior studies in this domain.
A second strength of this study is that the research employed a range of
psychosocial, behavioural and physiological measures to index the quality of
participants’ diabetes self-management. As highlighted previously, a
limitation of diabetes research has been that studies have not utilised
multiple measures to operationalise this construct. Prior research in the area
of personality has often relied solely on measures of glycaemic control
(Vollrath et al, 2007) or a small number of adherence behaviours (Lane et al,
2000). By utilising a bio-psychosocial model of health, the current research
builds on the work of others who have endeavoured to conceptualise a
broader view of diabetes self-management in research (Flinders Human
Behavioural & Health Science Unit, 2006; Skinner et al., 2002).
A final strength of this study is that it examined prospective associations
between five-factor personality traits and markers of diabetic self-
management. Review of the literature reveals that the majority of personality
investigations in type I diabetes have been cross-sectional in nature (Lane et
al., 2000; Marks, 2000; Skinner et al., 2002). Indeed, even the results
presented by Vollrath and colleagues (2007) are cross-sectional as these
researchers created aggregate scores from repeated measurements of
personality and glycaemic control. The only longitudinal study prior to the
current research involved retrospective comparisons between personality
and self-management outcomes (Brickman et al, 1996), and this
methodology creates difficulties when making casual claims. Hence, the
current study is an important first as repeated prospective measurements
over multiple time points allows researchers to analyse temporal changes in
outcomes and predict future results.
Chapter 8: Conclusion and Future Directions
189
Together, these points indicate that the design and methodology of the
current study represents a gold standard in diabetes-personality research to
date. This shows that the findings of this research deserve attention from
fellow researchers and clinicians working in the field of paediatric type I
diabetes. There were several key outcomes from the current research that
replicate and extend upon prior research results (Lane et al., 2000; Marks,
2000; Skinner et al., 2002; Vollrath et al., 2007) and these could have
significant implications for theory and practice. The following section outlines
the key findings of the current research.
Summary of key findings
The present study provides an abundance of information about personality
and self-management of type I diabetes in Australian youth. Specifically,
there are five key findings that deserve attention. These findings are listed
below and are discussed in detail in the following pages of this thesis.
Key finding #1: Five-factor model personality traits serve as significant
and independent predictors of a variety of self-management outcomes
in youth with type I diabetes.
Key finding #2: Low conscientiousness in youth with diabetes is a risk
factor for sub-standard blood glucose testing, sub-optimal glycaemic
control and worsening glycaemic control over time.
Key finding #3: Low emotional regulation is a risk factor for
consistently poor psychological wellbeing and sub-optimal glycaemic
control. High emotional regulation may also increase the risk of sub-
optimal glycaemic control.
Key finding #4: Low agreeableness is a risk factor for avoidance
coping, sub-optimal glycaemic control and worsening glycaemic
control over time.

Chapter 8: Conclusion and Future Directions
190
Key finding #5: Low openness to experience is related to less
acceptance of diabetes over time.
Key finding #1: Five-factor model personality traits serve as significant and
independent predictors of a variety of self-management outcomes in youth
with type I diabetes.
The major finding of this research is that personality plays a central role in
self-management of type I diabetes in youth. Correlational and regression
analyses over a period of three years indicate that specific five-factor model
personality traits (conscientiousness, agreeableness, emotional regulation
and openness to experience) can predict a diverse range of outcomes
including glycaemic control, blood glucose testing, depression, anxiety,
stress and coping. These findings are generally in line with the postulated
hypotheses and support past research involving individuals with type I
diabetes (Brickman et al., 1996; Chatzialexiadi et al., 2005; Edwards, 1999;
Gilbert, 1992; Lane et al., 2000; Marks, 2000; Skinner et al., 2002; Vollrath et
al., 2007).
Importantly, results from the current study demonstrate that five-factor model
traits may work in concert to predispose an individual towards poor self-
management. For example, conscientiousness, agreeableness and
emotional regulation were all significant independent predictors of glycaemic
control in the final year of data collection. This suggests that the impact of
one maladaptive personality attribute could be compounded by another
maladaptive attribute. Alternatively, adaptive attributes could help individuals
to compensate for difficulties in other areas. This demonstrates that future
research should investigate the additive effects of personality traits and
whether there are combinations of traits or specific personality profiles that
predict poor self-management of type I diabetes. Indeed, the impact of
personality on self-management may be greater than reported within this
thesis if personality factors interact in this cumulative fashion.

Chapter 8: Conclusion and Future Directions
191
Study results also demonstrate that personality may play a stronger role in
determining self-management outcomes than traditional predictor variables
such as age, gender, duration of diabetes or responsibility for diabetes care
(Anderson et al., 1990; Chisholm et al., 2007; Hepburn et al., 1994).
Statistical analyses showed that these demographic factors were often non-
significant predictors of self-management outcomes when entered into
hierarchical regression models along with personality traits. These results
are novel and warrant further attention.
Whilst prior research involving youth with diabetes has shown that
personality and temperament variables can exert their effects on self-
management outcomes independent of demographic and treatment factors
(Vollrath et al, 2007; Weissberg-Benchell & Glasgow, 1997), this appears to
be the first time that personality factors have predicted more of the variance
in outcomes than traditional demographic factors within this population
(Skinner et al., 2002; Vollrath et al., 2007). However, similar results have
been reported in different cohorts. In their study involving adults with type I
diabetes, Lane and colleagues (2000) included age, sex and duration of
diabetes as covariates in their regression models and found that five-factor
model personality traits were stronger predictors of glycaemic control and
self-monitoring of blood glucose levels. Although this suggests that the
current results are valid, replication is required to confirm whether personality
truly plays a greater role in determining self-management than other
demographic factors of interest.
Key finding #2: Low conscientiousness in youth with diabetes is a risk factor
for sub-standard blood glucose testing, sub-optimal glycaemic control and
worsening glycaemic control over time.
Results confirm that conscientiousness plays a significant function in
determining the quality of diabetes management in young people with
diabetes. As predicted, there was a linear relationship between this trait and
factors related to the behavioural control of blood glucose levels. More

Chapter 8: Conclusion and Future Directions
192
specifically, youth in this study scoring low on conscientiousness had
significantly higher HbA1c levels and were less rigorous with their blood
glucose testing. These findings are supported by a host of prior research that
has identified conscientiousness as an important factor related to treatment
adherence in chronic health conditions (Bogg & Roberts, 2004; Brickman et
al., 1996; Christensen & Smith, 1995; Friedman et al., 1995; Raynor &
Levine, 2009; Skinner et al., 2002; Vollrath et al., 2007).
Most critically, the current study builds on this past research by
demonstrating that low conscientiousness can predict worsening of
glycaemic management over time. Individuals with low conscientiousness at
study baseline showed significant increases in average HbA1c over the three-
year study period whereas those with high conscientiousness at baseline
maintained stable HbA1c levels. These results are ground-breaking and
indicate that the influence of conscientiousness on diabetes control may be
cumulative over time. If this long-term relationship was upheld over greater
periods (such as a decade) this would likely predict the development of
diabetic complications. Indeed, this trait has been retrospectively associated
with renal deterioration times in individuals with diabetes and this suggests
that such a relationship may exist (Brickman et al., 1996).
These results underline the worth of continued longitudinal research in this
area. By following the current sample over a longer period of time it would be
possible to determine whether the uncovered relationships between self-
management and conscientiousness are maintained through their adult life.
Adolescents tend to become more conscientious as they move into
adulthood (B. W. Roberts, Walton, & Viechtbauer, 2006), and it would be
interesting to see whether any observed increases in conscientiousness
were mirrored by changes in diabetic self-management or glycaemic control.
Key finding #3: Low emotional regulation is a risk factor for consistently poor
psychological wellbeing and sub-optimal glycaemic control. High emotional
regulation may also increase the risk of sub-optimal glycaemic control.

Chapter 8: Conclusion and Future Directions
193
The present research highlights that emotional regulation plays an
instrumental, albeit complex, role in self-management of type I diabetes in
youth. Low levels of emotional regulation were related to poorer
psychological profiles as expected. However, the existence of a curvilinear
relationship between this trait and HbA1c is an original finding. Jointly, these
results show that emotional regulation deserves further attention in diabetes
research.
The relationship between emotional regulation and psychological wellbeing is
well documented. This personality trait is often described as a causal
predictor of depression, anxiety, stress and coping and there is typically
substantial overlap between this trait and such outcomes (Carver & Connor-
Smith, 2010; Clark et al., 1994; Kendler et al., 2006; Khan et al., 2005;
Watson et al., 1994). It is thus no surprise that individuals scoring low on
emotional regulation in the current sample reported higher rates of
depression, anxiety, stress and avoidance coping.
Of greater interest is the fact that baseline levels of emotional regulation
were related to consistently higher rates of negative affect over the course of
the three-year study. The temporal stability of this relationship supports
research positing a genetic component of emotional regulation that predicts
risk for longstanding negative affect and psychopathology (Kendler et al.,
2006; Lahey, 2009). Whilst continued longitudinal research is needed to
support this claim, such results indicate that this trait may predict long-term
psychological outcomes within this specific population. Future research
should test this hypothesis and also examine whether targeted interventions
can promote improvements in psychological wellbeing for individuals with
diabetes who score low on this trait.
Sustained work is also needed to better understand the role of emotional
regulation in determining glycaemic control. Although the curvilinear
relationship between emotional regulation and HbA1c reported here provides
an explanation for previously conflicting results (Chatzialexiadi et al., 2005;

Chapter 8: Conclusion and Future Directions
194
Gilbert, 1992; Lane et al., 2000; Taylor et al., 2003; Vollrath et al., 2007;
Weissberg-Benchell & Glasgow, 1997), there is still much to be clarified.
Researchers need to understand how these relationships are upheld which
can only be done by replicating these findings and testing theoretical
explanations for the obtained results. At any rate, the current study highlights
that theorists need to consider the relationship between this personality trait
and management of blood glucose levels in greater depth.
Theoretically, the association found between low emotional regulation and
poor glycaemic control makes sense. Results from the current study indicate
that low levels of emotional regulation contribute to consistently poor
glycaemic control over time and this fits with prior work that has linked this
trait to self-care in individuals with diabetes (Chatzialexiadi et al., 2005;
Gilbert, 1992). Furthermore, self-care may interact with psychological
wellbeing in ways not tapped by the measures and analyses utilised in this
study. As mentioned, low levels of emotional regulation can predict co-
morbidity of mental and physical health problems (Lahey, 2009), and this
could contribute to a relationship between low emotional regulation and poor
management of blood glucose. Critically, if such relationships remain stable
over long periods it would be likely that complications would develop for
those very low in emotional regulation.
The relationship between high emotional regulation and poor glycaemic
control also makes some substantive sense. As highlighted previously,
individuals high in emotional regulation often discount health risks (Vollrath et
al., 1999; D. J. Wiebe, Alderfer, Palmer, Lindsay, & Jarrett, 1994) and this
may have contributed to the results of the current study. At each testing
occasion, individuals with very high levels of emotional regulation had poorer
HbA1c results and this suggests that these individuals were deficient in some
aspect of their self-care. Importantly though, high emotional regulation at
baseline was not a significant predictor of control over the course of the
three-year study and HbA1c scores trended downwards for this baseline
group over time. This suggests that further follow-up is needed to determine

Chapter 8: Conclusion and Future Directions
195
whether high levels of this trait serve as a stable predictor of long-term
glycaemic control within this cohort.
Together, these results provide preliminary support for a curvilinear
relationship between emotional regulation and glycaemic control. Such
findings are supported by the work of Brickman, Yount, Blaney et al (1996)
who demonstrated that extreme scores on emotional regulation are
predictive of long-term diabetic complications. These results also mirror the
classic Yerkes-Dodson law (1908); where optimal performance is predicted
by moderate levels of emotional arousal. Given these strong theoretical ties
and the repeated measurements employed, the validity of this curvilinear
relationship appears relatively certain. Nevertheless, these results require
replication and the mechanisms underlying this association still remain
unclear.
Whilst the current study has uncovered a non-linear relationship between
emotional regulation and glycaemic control, it has not successfully identified
factors that mediate this relationship. Contrary to hypotheses and prior
research (Chatzialexiadi et al., 2005; Gilbert, 1992), emotional regulation
showed no relationship (either curvilinear or linear) with the included
measures of diabetes self-care. Furthermore, the design and sample size of
the research study did not allow for any detailed analysis of factors that
mediated relationships between personality and self-management outcomes.
This suggests that future research should use more sensitive measures of
self-care and should employ statistical methods such as structural equation
modelling to answer these questions.
Finally, longer-term follow-up is required to determine whether mean-level
and intra-individual changes in emotional regulation are related to significant
improvement or decline in glycaemic control. Research suggests that
individuals generally display increases in emotional regulation from ages 20
to 40 (B. W. Roberts, Walton, & Viechtbauer, 2006) and it would be
worthwhile to track changes in this trait along with glycaemic control in the

Chapter 8: Conclusion and Future Directions
196
current sample. If the long-term stability of emotional regulation is high within
this cohort, we may expect those particularly low or high in emotional
regulation at baseline to exhibit signs of diabetic complications later in life.
Key finding #4: Low agreeableness is a risk factor for avoidance coping, sub-
optimal glycaemic control and worsening glycaemic control over time.
The current investigation indicates that agreeableness also substantially
contributes to the quality of diabetes self-management in youth. As
hypothesised, this trait was a significant independent predictor of glycaemic
management. Furthermore, this trait was related to the coping strategies that
the study participants employed. These results suggest that agreeableness
during adolescence may predict both long-term physical and psychosocial
outcomes for people with diabetes.
The negative linear relationships found between agreeableness and HbA1c
are supported by prior research involving individuals with diabetes (Auerbach
et al., 2002; Szymborska-Kajanek et al., 2006; Vollrath et al., 2007). In their
study involving youth with diabetes, Vollrath and colleagues (2007) reported
that high scores on agreeableness were significantly related to lower HbA1c
results when averaged over three time-points. The replication of these
results provides further evidence for the validity of this association.
Unlike Vollrath et al’s (2007) research, the current study found that
agreeableness remained a significant independent predictor of glycaemic
control when entered into hierarchical regressions with other personality
factors. This difference between study findings is notable and is likely due to
the larger sample size of the current study and the associated increases in
statistical power. Such results underline the importance of continued
research in this area utilising larger study cohorts.
The current study also highlights the importance of agreeableness in
determining deterioration of glycaemic control over time. Differences in
HbA1c scores between those rated high and low in agreeableness at baseline
Chapter 8: Conclusion and Future Directions
197
increased significantly over the study period with individuals low in
agreeableness showing worsening glycaemic control over the three-year
study period. Like conscientiousness, it appears that this trait may have a
cumulative effect on glycaemic management over time. If this trajectory
continues, it is likely that those low in agreeableness at study baseline would
develop diabetes complications. Clearly, follow-up research is needed to test
whether the strength of the negative association between agreeableness and
HbA1c continues to increase over time. Research shows that individuals
become less agreeable as they move into adulthood (B. W. Roberts, Walton,
& Viechtbauer, 2006), and these mean-level changes in personality have an
unknown impact on glycaemic control at this stage.
Notably, there were no non-linear effects of agreeableness on blood glucose
levels within the study sample over the three-year study period. Such
findings disagree with research that has suggested a negative impact of
agreeableness related characteristics upon glycaemic control (Helgeson et
al., 2007; Hyphantis et al., 2005; Lane et al., 2000). This requires further
investigation, as the personality measure used for the current study did not
allow analyses at a facet level. This makes it impossible to confirm or
disprove the reported positive association between the agreeableness facet
of altruism and HbA1c reported by Lane et al (2000). Based on the current
results, only a negative linear relationship between agreeableness and HbA1c
scores can be confirmed.
Finally, the obtained results indicate that agreeableness may influence
youths’ selection of coping strategies. Significant correlations between
agreeableness and avoidance coping were uncovered for the first and third
years of matched data and mixed design analyses of variance demonstrated
a significant between-groups effect for those high and low on agreeableness
over time. These results suggest that individuals low on agreeableness
consistently rely on avoidance as a coping mechanism in times of stress.
Prior work in this area supports the validity of this research (Carver &
Connor-Smith, 2010; Connor-Smith & Flachsbart, 2007; Hambrick & McCord,

Chapter 8: Conclusion and Future Directions
198
2010; Kidachi et al., 2007; Lawson, Bundy, Belcher, & Harvey, 2010). This
indicates that agreeableness could be used to predict poor coping with
diabetes within younger cohorts.
Overall, high levels of agreeableness appear to be a protective factor in
youth with type I diabetes. However, further work is needed to uncover
variables that underpin the relationships reported here. Targeted
interventions could stem from uncovering specific mediating factors and this
underlines the need for further work in this field. As suggested earlier, levels
of social support and the therapeutic relationship between doctor and patient
could be influenced by the trait of agreeableness and this suggests that links
between these factors and personality need to be tested. Similarly,
researchers should focus on whether coping styles mediate relationships
between this trait and glycaemic control.
Key finding #5: Low openness to experience is related to less acceptance of
diabetes over time.
The final key finding from this research is that openness to experience can
impact upon a young person’s management of diabetes. Whilst prior
investigations involving this trait have delivered mixed results (Edwards,
1999; Lane et al., 1988; P. J. Lustman et al., 1991; Marks, 2000; Vollrath et
al., 2007), the current study uncovered significant associations with
acceptance coping over repeated testing occasions. These results are in line
with hypotheses and are supported by prior research on coping (Carver &
Connor-Smith, 2010; Connor-Smith & Flachsbart, 2007; Lawson et al.,
2010).
Results demonstrate that high openness to experience is related to greater
use of acceptance coping strategies in youth with diabetes. Furthermore,
longitudinal analyses indicate that the between-group differences for those
scoring high or low on openness to experience at baseline significantly
increased over the course of the study. Longitudinal increases in acceptance

Chapter 8: Conclusion and Future Directions
199
coping for the high openness group approached statistical significance and
this suggests that high openness leads to greater adaptation to diabetes in
adolescence.
These findings make sense. Prior research and theory suggests that people
high in openness tend to accept stressful experiences, framing difficult
situations as a challenge rather than a threat (Carver & Connor-Smith, 2010;
Connor-Smith & Flachsbart, 2007; Lawson et al., 2010). Furthermore, there
appears to be some overlap between this trait and definitions of
psychological hardiness (Smith & Williams, 1992), which is likely related to
acceptance of uncontrollable circumstances such as chronic disease.
These results support the utilisation of a biopsychosocial model of diabetes
self-management in personality-health research and highlight the need for
further work in this area. The current results show that personality can
influence a range of self-management factors other than glycaemic control
and these should be recognised as important outcomes in their own right. By
focusing more on the relationship between openness to experience and
acceptance coping, researchers may be able to identify factors that
contribute to a young person’s quality of life when living with a chronic
disease. Further work employing larger sample sizes and mediational
analyses could help to do this.
Limitations
Whilst the results reported above appear promising, health professionals
must understand the limitations of this study when interpreting these findings.
The size of the study sample, the probability of type I error, rates of missing
data and the tendency towards non-significant relationships in the first year
of data collection should all be taken into account before making treatment or
policy decisions based on this research. Hence, these limitations are critically
discussed below.

Chapter 8: Conclusion and Future Directions
200
It is first important to recognise that the reported findings are based on a
comparatively small sample of participants (n = 104). Whilst this study is the
largest of its kind, the sample size was impacted by the limited personnel
available for data collection and the documented difficulties of recruiting
youth for research (Croft et al., 1984; Gattuso et al., 2006; Liese et al., 2008;
H. Roberts, 2000). Consequently, complex statistical modelling of the
completed measures was not undertaken.
It would therefore be worthwhile to conduct a larger-scale study to replicate
the results reported here. A study of this kind would allow for more complex
statistical analyses that could provide greater detail about the temporal
relationships between personality and self-management of diabetes. Such
research should also investigate interactions between personality,
demographic variables and self-management outcomes as prior research
suggests that mediating and moderating effects between these variables
exist (Cameron, Young, & Wiebe, 2007; Skinner et al., 2002).
Secondly, it is important to recognise that a large number of statistical
analyses were carried out on the current study data. Multiple comparisons
increase the risk of type I error (Field, 2009) and this indicates that there is a
small risk that some of the reported significant results capitalised on chance
relationships. Nevertheless, Bonferronni adjustments were used which
minimises the likelihood of type I error and the reported directions of
relationships were largely consistent over the three years of data collection.
This suggests that the results can reasonably be presumed valid and
significant.
Third, the missing quarterly data collected as part of the DRAT study was
beyond acceptable limits. Although, this information could have provided
greater knowledge on associations between personality and self-
management over time, basing a study on this information would be
imprudent due to the potential for sample bias. In contrast, the annual data

Chapter 8: Conclusion and Future Directions
201
collections demonstrated excellent completion rates, which indicate that
these data are valid and unbiased.
Finally, there was a lack of significant relationships between personality
variables and self-management outcomes in the first year. Whilst these
results are not strictly a limitation of the study, they are puzzling and require
explanation. Importantly, the lack of significant relationships does not appear
to be due to the different methods employed to collect personality data as the
five-factor model variables showed high temporal stability within participants.
The most plausible explanation for the obtained results is that personality
truly has a cumulative effect over time. Psychological and physical health
issues often develop over long periods (Caltabiano et al., 2002), and it may
take time for the influence of personality to be seen. Indeed, poor health
behaviours must usually be present over long periods to have any real
consequences for the individual. This indicates that we should expect
baseline personality scores to be related to progressive improvement or
decline in outcome variables over time. For the current study, this result was
upheld. In fact, significant differences in self-management outcome scores
were often present for the high and low baseline trait groups in this study.
This suggests that underlying relationships were present in the first year but
these failed to reach significance due to reduced variance in outcomes
measures.
Another explanation for these results could be related to sample size and
measurement error. The current sample was relatively small and it may be
that this did not provide enough power to uncover significant results in the
first year. Measurement error may have also been high at the first testing
occasion as participants were unfamiliar with the study procedures. This
combination may have influenced first year results reducing the strength, and
subsequently, the significance of associations between personality and self-
management outcomes.

Chapter 8: Conclusion and Future Directions
202
Overall, this suggests further research is needed to explain results from the
first year of data collection. Researchers should replicate this study to
determine whether similar results are achieved. Furthermore, it would be
worthwhile to follow-up with the current sample to determine whether
association between personality and self-management continue along the
trajectories uncovered here. Such work could pave the way for focused
interventions to assist youth with type I diabetes.
Avenues for intervention
Whilst the above-reported results are preliminary, it is interesting to consider
what these would mean for intervention. Such findings suggest that clinicians
need to be conscious of the personality traits of their young patients and
apply methods of treatment that suit these individuals. Whilst personality-
testing of patients is unlikely (and unnecessary), a greater knowledge of the
relationships between personality and diabetes self-management could help
doctors and diabetes educators to take a more proactive approach towards
treating their patients. Tailored treatments may be particularly successful.
For example, clinicians working with youth who show signs of low
conscientiousness could focus on strategies to improve organisation, time-
management and planning and should implement strategies to increase
frequency of glycaemic testing. To protect against the risk of worsening
glycaemic management, clinicians could also emphasise the benefits of
short-term glycaemic control rather than highlighting negative long-term
outcomes.
When treating patients who show signs of low agreeableness, health care
workers should work to gain the trust of their patients and make them feel
involved in any decision-making processes. Reliance on avoidance as a
mechanism for coping with diabetes should be discouraged and strategies
for healthy conflict resolution should be promoted. By encouraging the
patient to take an active role in the management of their diabetes, clinicians

Chapter 8: Conclusion and Future Directions
203
may improve the therapeutic relationship and foster optimal glycaemic
control.
If working with youth low in emotional regulation, doctors and educators
should attempt to promote active coping and reduce negative affect.
Referrals to psychological services may be necessary, particularly as
relationships between glycaemic control and negative affect may be
reciprocal in nature. These individuals should be followed closely over time,
as worsening glycaemic control within this group is likely. Reliance on
avoidance as a coping strategy should be prevented and alternative
approaches emphasised.
When treating youth high in emotional regulation, clinicians may need to
educate about the severity and seriousness of long-term diabetes
complications and also encourage patients to focus on the short-term
advantages of optimal glycaemic control.
Finally, clinicians treating youth low in openness to experience should try to
counsel their patients to accept their diabetes and to incorporate this
experience into their life.
Hopefully, this investigation will lay the groundwork for continued research
into the long-term role of personality in diabetes management that can lead
to evidence-based treatment approaches such as those mentioned above.
Whilst it is unlikely that personality can be altered, clinicians may provide
patients with specialised treatment that could help them to deal with aspects
of their personality. This speaks to the utility of personality research to inform
actual clinical practice and underlines the importance of the current research.
In overview, this research highlights the importance of personality in youths’
self-management of type I diabetes. It also underlines the utility of the five-
factor model of personality integrate and extend upon current knowledge
regarding the role of personality in health. Future research should look to

Chapter 8: Conclusion and Future Directions
204
replicate the results reported here, examine these relationships over longer
time periods and posit mediating or moderating pathways between
personality and long-term management of diabetes in young people. By
replicating this study with a larger sample, subtle relationships may be
uncovered which could lead to greater knowledge and specific interventions
aimed at helping youth at risk for poor self-management of diabetes. It would
also be worthwhile to follow the current sample over a longer period of time
to examine whether the prospective links between personality and self-
management outcomes continue along these same trajectories.
.
References
Allik, J. R., Laidra, K., Realo, A., & Pullmann, H. (2004). Personality development from 12 to 18 years of age: changes in mean levels and structure of traits. European Journal of Personality, 18(6), 445-462.
Allport, G. W., & Odbert, H. S. (1936). Trait-Names: A Psycho-Lexical Study. Psychological Monographs(No. 211).
Aluja, A., & Garcia, L. F. (2004). Relationships Between Big Five Personality Factors and Values. Social Behavior & Personality: An International Journal, 32(7), 619-626.
Ambler, G., Fairchild, J., Craig, M., & Cameron, F. (2006). Contemporary Australian outcomes in childhood and adolescent type 1 diabetes: 10 years post the Diabetes Control and Complications Trial. Journal of Paediatrics & Child Health, 42(7), 403-410.
Amer, K. S. (1999). Children's adaptation to insulin dependent diabetes mellitus: a critical review of the literature. Pediatric Nursing, 25(6), 627.
Ames, S. C., Jones, G. N., Howe, J. T., & Brantley, P. J. (2001). A prospective study of the impact of stress on quality of life: An investigation of low-income individuals with hypertension. Annals of Behavioral Medicine, 23(2), 112-119.
Anderson, B. J., Auslander, W. F., Jung, K. C., Miller, J. P., & Santiago, J. V. (1990). Assessing Family Sharing of Diabetes Responsibilities. Journal of Pediatric Psychology, 15(4), 477-492.
Anderson, B. J., Vangsness, L., Connell, A., Butler, D., Goebel-Fabbri, A., & Laffel, L. M. B. (2002). Family conflict, adherence, and glycaemic control in youth with short duration Type 1 diabetes. Diabetic Medicine, 19(8), 635-642.
Anderson, B. J., & Wolpert, H. A. (2004). A Developmental Perspective on the Challenges of Diabetes Education and Care During the Young Adult Period. Patient Education & Counseling, 53(3), 347-352.
Anderson, K. J. (1994). Impulsivity, Caffeine, and Task Difficulty: A Within-Subjects Test of the Yerkes-Dodson Law. [Article]. Personality and Individual Differences, 16(6), 813-829.
Anderson, K. W., & McLean, P. D. (1997). Conscientiousness in depression: tendencies, predictive utility, and longitudinal stability. Cognitive Therapy and Research, 21(2), 223-238.
Anderson, R. M. (1995). Patient empowerment and the traditional medical model: a case of irreconcilable differences? Diabetes Care, 18(3), 412-415.
Arrindell, W. A., Heesink, J., & Feij, J. A. (1999). The satisfaction with life scale: Appraisal with 1700 healthy young adults in the Netherlands. Personality and individual differences, 26, 815-826.

References
206
Asendorpf, J. B., & van Aken, M. A. G. (2003). Validity of Big Five personality judgments in childhood: a 9 year longitudinal study. European Journal of Personality, 17(1), 1-17.
Auerbach, S. M., Clore, J. N., Kiesler, D. J., Orr, T., Pegg, P. O., Quick, B. G., & Wagner, C. (2002). Relation of diabetic patients' health-related control appraisals and physician-patient interpersonal impacts to patients' metabolic control and satisfaction with treatment. [Article]. Journal of Behavioral Medicine, 25(1), 17-31.
Australian Bureau of Statistics. (2006a). 2004-05 National Health Survey: Summary of Results. Canberra: ABS.
Australian Bureau of Statistics. (2006b). Census of population and housing. Canberra: ABS.
Australian Bureau of Statistics. (2007). Australian Standard Geographical Classification (ASGC). Canberra: ABS.
Australian Bureau of Statistics. (2009). 2007-2008 Household income and income distribution Canberra: ABS.
Australian Diabetes Society. (2002). DiabCost Australia: Assessing the burden of type 2 diabetes in Australia. Australia: Diabetes Australia.
Australian Institute of Health and Welfare. (2002). Diabetes: Australian facts. AIHW Cat. No. CVD 20 (Diabetes
Series No.3). Canberra: AIHW.
Australian Institute of Health and Welfare. (2005). Selected chronic diseases among Australia's children. Bulletin no. 29. AIHW cat. no. AUS 62. Canberra: AIHW.
Australian Institute of Health and Welfare. (2008). Diabetes: Australian Facts 2008. Diabetes series no. 8. Cat. no. CVD 40. Canberra: AIHW.
Australian Institute of Health and Welfare. (2010). Australia’s health 2010. Australia’s health series no. 12. Cat. no. AUS 122. Canberra: AIHW.
Aylward, G. W. (2005). Progressive Changes in Diabetics and Their Management. Eye, 19(10), 1115-1118.
Bandura, A. (2005). The Primacy of Self-Regulation in Health Promotion. Applied Psychology: An International Review, 54(2), 245-254.
Barnette, J. J. (2000). Effects of stem and Likert response option reversals on survey internal consistency: If you feel the need, there is a better alternative to using those negatively worded stems. Educational and Psychological Measurement, 60, 361-367.
Bartley, C. E., & Roesch, S. C. (2011). Coping with daily stress: The role of conscientiousness. Personality and Individual Differences, 50, 79-83.
Benjamin, E. M. (2002). Self-monitoring of Blood Glucose: The basics. Clinical Diabetes, 20(1), 45-47.

References
207
Bermudez, J. (1999). Personality and health-protective behaviour. European Journal of Personality, 13(2), 83-103.
Bermudez, J. (2006). Personality science, self-regulation, and health behavior. Applied Psychology-an International Review-Psychologie Appliquee-Revue Internationale, 55(3), 386-396.
Bienvenu, O. (2006). Personality and anxiety disorders. Current Psychiatry Reports, 8(4), 263-269.
Bienvenu, O., Samuels, J. F., Costa, P. T., Reti, I. M., Eaton, W. W., & Nestadt, G. (2004). Anxiety and Depressive Disorders and the Five-Factor Model of Personality: A Higher- and Lower-Order Personality Trait Investigation in a Community Sample. Depression and Anxiety, 20, 92-97.
Blanz, B., Rensch-Reimann, B., Fritz-Sigmund, D., & Schmidt, M. (1993). IDDM is a Risk Factor for Adolescent Psychiatric Disorders. Diabetes Care, 1993(16), 1579-1587.
Block, J. (1995). A Contrarian View of the Five-Factor Appraoch to PErsonality Description. Psychological Bulletin, 117(187-215).
Block, J. (2001). Millennial Contrarianism: The Five-Factor Approach to Personality Description 5 Years Later. Journal of Research in Personality, 35, 98-107.
Bogg, T., & Roberts, B. W. (2004). Conscientiousness and health-related behaviors: A meta-analysis of the leading behavioral contributors to mortality Psychological Bulletin (Vol. 130, pp. 887-919).
Bolger, N. (1990). Coping as a personality process: A prospective study. Journal of Personality and Social Psychology, 59, 525-537.
Bolger, N., & Zuckerman, A. (1995). A framework for studying personality in the stress process. Journal of Personality and Social Psychology, 69, 890-902.
Booth-Kewley, S., & Vickers Jr, R. R. (1994). Associations between major domains of personality and health behavior. [Article]. Journal of Personality, 62(3), 281-298.
Brayne, C., Do, K. A., Green, L., & Green, A. C. (1998). Is health protective behaviour in adolescents related to personality? A study of sun protective behaviour and the Eysenck Personality Questionnaire (junior version) in Queensland. Personality and Individual Differences, 25(5), 889-895.
Brendgen, M., Lamrache, V., Wanner, B., & Vitaro, F. (2010). Links between friendship relations and early adolescents' trajectories of depressed mood Developmental Psychology, 46(2), 491-501.
Brenner, Z. A. (2006). Management of Hyperglycemic Emergencies. AACN Clinical Issues, 17(1), 50-59.
Brickman, A. L., Yount, S. E., Blaney, N. T., & Rothberg, S. T. (1996). Personality Traits and Long-Term Health Status: The Influence of Neuroticism and Conscientiousness on Renal Deterioration in Type-1 Diabetes. Psychosomatics: Journal of Consultation Liaison Psychiatry, 37(5), 459-468.

References
208
Brook, J. S., Brook, D. W., De la Rosa, M., Whiteman, M., Johnson, E., & Montoya, I. (2001). Adolescent illegal drug use: The impact of personality, family, and environmental factors. Journal of Behavioral Medicine, 24(2), 183-203.
Brook, J. S., Whiteman, M., Czeisler, L. J., Shapiro, J., & Cohen, P. (1997). Cigarette smoking in young adults: Childhood and adolescent personality, familial, and peer antecedents. Journal of Genetic Psychology, 158(2), 172-188.
Bruzzese, J.-M., Gallagher, R., McCann-Doyle, S., Reiss, P. T., & Wijetunga, N. A. (2009). Effective Methods to Improve Recruitment and Retention in School-Based Substance Use Prevention Studies. Journal of School Health, 79(9), 400-407.
Bryan, A., & Stallings, M. C. (2002). A case control study of adolescent risky sexual behavior and its relationship to personality dimensions, conduct disorder, and substance use. Journal of Youth and Adolescence, 31(5), 387-396.
Buchanan, C. M., Eccles, J. S., & Becker, J. B. (1992). Are adolescents the victims of raging hormones? Evidence for activational effects of hormones on moods and behaviour at adolescence. Psychological Bulletin, 111(1), 62-107.
Buczkowska, O., Jarosz-Chobot, P., & Machnica, L. (2009). The role of amylin in glucose homeostasis regulation and possible future usage in adolescents with type 1 diabetes. Experimental and clinical diabetology, 9(2), 41-45.
Burgess, L., Irvine, F., & Wallymahmed, A. (2010). Personality, stress and coping in intensive care nurses: a descriptive exploratory study. Nursing in Critical Care, 15(3), 129-140. doi: 10.1111/j.1478-5153.2009.00384.x
Byrdon, L., Strike, P. C., Bhattacharyya, M. R., Whitehead, D. L., McEwan, J., Zachary, I., & Steptoe, A. (2010). Hostility and Physiological Responses to Laboratory Stress in Acute Coronary Syndrome. Journal of Psychosomatic Research, 68(2), 109-116.
Caltabiano, M. L., Sarafino, E. P., Byrne, D., & Martin, P. R. (2002). Health Psychology: Biopsychosocial Interactions. Milton: John Wiley & Sons.
Carrillo, J. M., Rojo, N., Sanchez-Bernardos, M. L., & Avia, M. D. (2001). Openness to experience and depression. European Journal of Psychological Assessment, 17(2), 130-136.
Carver, C. S., & Connor-Smith, J. (2010). Personality and coping. Annual review of psychology, 61, 679-704.
Castellanos, N., & Conrod, P. J. (2006). Brief Interventions Targeting Personality Risk Factors for Adolescent Substance Misuse Reduce Depression, Panic and Risk-Taking Behaviours. Journal of Mental Health, 15(6), 645-658.
Catanzariti, L., Faulks, K., & Waters, A.-M. (2007). Diabetes Register: Statistical Profile 1999–2005. Cat. no. CVD 39. Diabetes Series no. 7. Canberra: Australian Institute of Health and Welfare.
Cattell, R. B. (1943). The Description of Personality: Basic Traits Resolved into Clusters. Journal of Abnormal and Social Psychology, 38(4), 476-506.

References
209
Cattell, R. B. (1947). Confirmation and Clarification of Primary Personality Factors. Psychometrika, 12, 197-220.
Cattell, R. B. (1956). Second-Order Personality Factors. Journal of Consulting Psychology, 20, 411-418.
Charles, S. T., Gatz, M., Kato, K., & Pedersen, N. L. (2008). Physical health 25 years later: The predictive ability of Neuroticism. Health Psychology, 27(3), 369-378.
Chatzialexiadi, R., Kounenoy, K., Kompoti, M., Rousoy, V., Iraklianoy, S., & Melidonis, A. (2005). Is There any Association Between Personality Properties and Glycemic Control in Patients With Diabetes Mellitus Type 1? [Abstract]. Diabetologia, 48, A323-A323.
Chida, Y., & Steptoe, A. (2009). The Association of Anger and Hostility with Future Coronary Heart Disease: A Meta-Analytic Review of Prospective Evidence. Journal of the American College of Cardiology, 53, 936-946.
Chisholm, V., Atkinson, L., Donaldson, C., Noyes, K., Payne, A., & Kelnar, C. (2007). Predictors of treatment adherence in young children with type 1 diabetes. Journal of Advanced Nursing, 57(5), 482-493.
Christensen, A. J. (2000). Patient-by-Treatment Context Interaction in Chronic Disease: A Conceptual Framework for the Study of Patient Adherence. Psychosomatic Medicine, 62, 435-443.
Christensen, A. J., & Smith, T. W. (1995). Personality and Patient Adherence - Correlates of the 5-Factor Model in Renal Dialysis. Journal of Behavioral Medicine, 18(3), 305-313.
Chua, F. J., & Job, R. F. S. (2000). Personality as predictors of health and disease. International Journal of Psychology, 35(3-4), 202-202.
Ciechanowski, P. S., Katon, W. J., & Russo, J. E. (2000). Depression and diabetes. Archives of International Medicine, 160, 3278-3285.
Cimbolic-Gunthert, K., Cohen, L. H., & Armeli, S. (1999). The role of neuroticism in daily stress and coping. Journal of Personality and Social Psychology, 77(5), 1087-1100.
Clark, L. A., Watson, D., & Mineka, S. (1994). Temperament, personality, and the mood and anxiety disorders Journal of Abnormal Psychology, 103, 103-116.
Coelho, R., Amorim, I., & Prata, J. (2003). Coping Styles and Quality of Life in Patients With Non-Insulin-Dependent Diabetes Mellitus. Psychosomatics, 44(4), 312-318.
Connor-Smith, J. K., & Flachsbart, C. (2007). Relations Between Personality and Coping: A Meta-Analysis. Journal of Personality and Social Psychology, 93(6), 1080-1107.
Conrod, P. J., Castellanos, N., & Mackie, C. (2007). Personality-Targeted Interventions Delay the Growth of Adolescent Drinking and Binge Drinking. Child Psychology and Psychiatry, 49(2), 181-190.

References
210
Conrod, P. J., Stewart, S. H., Comeau, N., & Maclean, A. M. (2006). Efficacy of Cognitive-Behavioral Interventions Targeting Personality Risk Factors for Youth Alcohol Misuse. Journal of Child and Adolescent Psychology, 35(4), 550-563.
Conrod, P. J., Stewart, S. H., Pihl, R. O., Cote, S., Fontaine, V., & Dongier, M. (2000). Efficacy of Brief Coping Skills Interventions That Match Different Personality Profiles of Female Substance Abusers. Psychology of Addictive Behaviours, 14(3), 231-242.
Contrada, R. J., Coups, E. J., Cameron, L. D., & Leventhal, H. (2003). Personality and self-regulation in health and disease: Toward an integrative perspective The self-regulation of health and illness behaviour. (pp. 66-94): Routledge.
Contrada, R. J., Leventhal, H., & O'Leary, A. (1990). Personality and Health. In L. A. Pervin (Ed.), Handbook of Personality: Theory and Research. New York: The Guilford Press.
Cooper, T., Detre, T., & Weiss, S. M. (1981). Coronary-Prone Behaviour and Coronary Heart Disease: A Critical Review. Circulation, 63(1199-1215).
Costa Jr, P. T., & McCrae, R. R. (1987). Neuroticism, Somatic Complaints and Disease: Is the Bark Worse than the Bite? Journal of Personality, 55(2), 299-316.
Costa Jr, P. T., Terracciano, A., & McCrea, R. R. (2001). Gender differences in personality traits across cultures: Robust and surprising findings. Journal of Personality and Social Psychology, 81(2), 322-331.
Costa, P. T., & McCrae, R. R. (1988). From Catalog to Classification: Murray's Needs and the Five-Factor Model. Journal of Personality and Social Psychology, 55(258-265).
Costa, P. T., & McCrae, R. R. (1992a). 4 Ways 5 Factors Are Basic. Personality and Individual Differences, 13(6), 653-665.
Costa, P. T., & McCrae, R. R. (1992b). Reply to Eysenck. Personality and Individual Differences, 13(8), 861-865.
Costa, P. T., & McCrae, R. R. (1992c). Revised NEO personality inventory and NEO five-factor inventory professional manual. Odessa, FL: Psychological Assessment Resources.
Cox, B. J., Borger, S. C., Asmundson, G. J. G., & Taylor, S. (2000). Dimensions of hypochondriasis and the five-factor model of personality. Personality and Individual Differences, 29(1), 99-108.
Craig, M. E., Howard, N. J., Silink, M., & Chan, A. (2000). The rising incidence of childhood type 1 diabetes in New South Wales, Australia. Journal of Pediatric Endocrinology & Metabolism, 13(4), 363-372.
Croft, J. B., Webber, L. S., Parker, F. C., & Berenson, G. S. (1984). Recruitment and Participation of Children in a Long-term Study of Cardiovascular Disease: The Bogalusa Heart Study, 1973-1982 American Journal of Epidemiology, 120, 436-448.

References
211
Dabadghao, P., Vidmar, S., & Cameron, F. J. (2001). Deteriorating diabetic control through adolescence: Do the origins lie in childhood? Diabetic Medicine, 18(11), 889-894.
Dantzer, C., Swendsen, J., Maurice-Tison, S., & Salamon, R. (2003). Anxiety and depression in juvenile diabetes: A critical review. Clinical Psychology Review, 23(6), 787-800.
Dashiff, C. J., McCaleb, A., & Cull, V. (2006). Self-care of young adolescents with type 1 diabetes. Journal of Pediatric Nursing, 21(3), 222-232.
Daubenmier, J. J., Weidner, G., Sumner, M. D., Mendell, N., Merrit-Worden, T., Studley, J., & Ornish, D. (2007). The Contribution of Changes in Diet, Exercise and Stress Management to Changes in Coronary Risk in Women and Men in the Multisite Cardiac Lifestyle Intervention Program. Annals of Behavioral Medicine, 33(1), 57-68.
De Groot, M. P., Anderson, R. B. A., Freedland, K. E. P., Clouse, R. E. M. D., & Lustman, P. J. P. (2001). Association of Depression and Diabetes Complications: A Meta-Analysis. Psychosomatic Medicine, 63(4), 619-630.
de Matos, M. G., Barrett, P., Dadds, M., & Shortt, A. (2003). Anxiety, depression, and peer relationships during adolescence: Results from the Portuguese national health behaviour in school-aged children survey. European Journal of Psychology of Education, 28(1), 3-14.
De Raad, B., & Perugini, M. (Eds.). (2002). Big Five Assessment. Toronto: Hogrefe & Huber Publishers.
Deary, I. J., Frier, B. M., Spielberger, C. D., Sarason, I. G., Brebner, J. M. T., Greenglass, E., & Laungani, P. (1995). Personality, stress, and diabetes Stress and emotion: Anxiety, anger, and curiosity. (pp. 33-49): Taylor & Francis.
del Barrio, V., Moreno-Rosset, C., Lopez-Martinez, R., & Olmedo, M. (1997). Anxiety, depression and personality structure. Personality and individual differences, 23(2), 327-335.
Delameter, A. M. (1992). Stress, Coping and Metabolic Control Among Youngsters With Diabetes. In A. La Greca, L. J. Siegel & S. J. Siegel (Eds.), Stress and Coping in Child Health (pp. 191-211). New York: The Guildford Press.
Digman, J. M. (1989). 5 Robust Trait Dimensions - Development, Stability, and Utility. Journal of Personality, 57(2), 195-214.
Digman, J. M. (1990). Personality Structure - Emergence of the 5-Factor Model. Annual Review of Psychology, 41, 417-440.
Digman, J. M., & Inouye, J. (1986). Further Specification of the 5 Robust Factors of Personality. Journal of Personality and Social Psychology, 50(1), 116-123.
Digman, J. M., & Takemoto-Chock, N. K. (1981). Factors in Natural Language of Personality: Reanalysis, Comparison and Interpretation of Six Major Studies. Multivariate Behavioral Research, 16(149-170).

References
212
Donnellan, M. B., Conger, R. D., & Burzette, R. G. (2007). Personality Development From Late Adolescence to Young Adulthood: Differential Stability, Normative Maturity, and Evidence for the Maturity-Stability Hypothesis. Journal of Personality, 75(2), 237-263.
Douthitt, V. L. (1994). Psychological Determinants of Adolescent Exercise Adherence. Adolescence, 29(115), 711-722.
Drews, K. L., Harrell, J. S., Thompson, D., Mazzuto, S. L., Ford, E. G., Carter, M., . . . Roullet, J.-B. (2009). Recruitment and Retention Strategies and Methods in the HEALTHY Study. International Journal of Obesity, 33, S21-S28.
Duangdao, K. M., & Roesch, S. C. (2008). Coping with diabetes in adulthood: a meta-analysis. Journal of Behavioral Medicine, 31, 291-300.
Ebstrup, J. F., Eplov, L. F., Pisinger, C., & Jorgensen, T. (2011). Association between the Five Factor personality traits and perceived stress: is the effect mediated by general self-efficacy? Anxiety, Stress and Coping 24(4), 407-420.
Ediger, J. P., Walker, J. R., Graff, L., Lix, L., Clara, I., Rawsthorne, P., . . . Bernstein, C. N. (2007). Predictors of Medication Adherence in Inflammatory Bowel Disease. [Article]. American Journal of Gastroenterology, 102(7), 1417-1426. doi: 10.1111/j.1572-0241.2007.01212.x
Edwards, D. L. (1999). Psychological Factors Affecting Adherence and Metabolic Control in Diabetes Mellitus [Abstract]. Dissertation Abstracts International: Section B: The Sciences and Engineering, 60, 0825-0825.
Eiser, J. R., Riazi, A., Eiser, C., Hammersley, S., & Tooke, J. E. (2001). Predictors of psychological well-being in types 1 and 2 diabetes. Psychology & Health, 16(1), 99-110.
Engel, G. L. (1977). The Need for a New Medical Model: A Challange for Biomedicine. Science, 196, 129-136.
Eysenck, H. J. (1946). The measurement of personality. Proceedings of the royal society of medicine, 40(2), 75-80.
Eysenck, H. J. (1991). Dimensions of Personality - 16, 5 or 3 - Criteria for a Taxonomic Paradigm. Personality and Individual Differences, 12(8), 773-790.
Eysenck, H. J. (1993). Comment On Goldberg. American Psychologist, 48, 1299-1300.
Feldman, P. J., Cohen, S., Doyle, W. J., Skoner, D. P., & Gwaltney Jr, J. M. (1999). The Impact of Personality on Reporting of Unfounded Symptoms and Illness. Journal of Personality and Social Psychology, 77(2), 370-378.
Field, A. (2009). Discovering Statistics Using SPSS (3rd ed.). London: SAGE Publications Ltd.
Finch, J. F., & Graziano, W. G. (2001). Predicting Depression From Temperament, Personality, and Patterns of Social Relations. Journal of Personality, 69(1), 27-55.

References
213
Fink, G. (Ed.). (2000). Encyclopedia of Stress Vol. 1. London: Academic Press.
Fiske, D. W. (1949). Consistency of the Factorial Structures of Personality Ratings from Different Sources. Journal of Abnormal and Social Psychology, 44, 329-344.
Flinders Human Behavioural & Health Science Unit. (2006). The 'Flinders Model' of Chronic Condition Self-Management.
Fong, D. S., Aiello, L. P., Ferris, F. L., & Klein, R. (2004). Diuabetic Retinopathy. Diabetes Care, 27(10), 2540-2553.
Fourlanos, S., Varney, M. D., Tait, B. D., Morahan, G., Honeymoon, M. C., Colman, P. G., & Harrison, L. C. (2008). The Rising Incindence of Type 1 Diabetes Is Accounted for by Cases With Lower-Risk Human Leukocyte Antigen Genotypes. Diabetes Care, 31(8), 1546-1549.
Franks, P., Chapman, B., Duberstein, P., & Jerant, A. (2009). Five Factor Model Personality Factors Moderated the Effects of an Intervention to Enhance Chronic Disease Self-Management Self-Efficacy. British Journal of Health Psychology, 14, 473-487.
Friedman, H. S. (2000). Long-term relations of personality and health: Dynamisms, mechanisms, tropisms. Journal of Personality, 68(6), 1089-1107.
Friedman, H. S., Hawley, P. H., & Tucker, J. S. (1994). Personality, Health, and Longevity. Current Directions in Psychological Science, 3(2), 37-41.
Friedman, H. S., Tucker, J. S., Schwartz, J. E., Martin, L. R., Tomlinson-Keasey, C., Wingard, D. L., & Criqui, M. H. (1995). Childhood conscientiousness and longevity : Health behaviors and cause of death. Journal of Personality and Social Psychology, 68(4), 696-703.
Friedman, H. S., Tucker, J. S., Tomlinson-Keasey, C., Schwartz, J. E., Wingard, D. L., & Criqui, M. H. (1993). Does childhood personality predict longevity? Journal of Personality and Social Psychology, 65(1), 176-185.
Funnell, M. M., & Anderson, R. M. (2004). Empoowerment and Self-Management of Diabetes. Clinical Diabetes, 22(3), 123-127.
Gage, H., Hampson, S., Skinner, T. C., Hart, J., Storey, L., Foxcroft, D., . . . McEvilly, E. A. (2004). Educational and Psychosocial Programmes for Adolescents With Diabetes: Approaches, Outcomes and Cost-Effectiveness. Patient Education & Counseling, 53, 333-346.
Gailliot, M. T., Mead, N. L., & Baumeister, R. F. (2008). Self-regulation. In O. P. John, R. W. Robins & L. A. Pervin (Eds.), Handbook of personality: theory and research (3rd ed.): The Guildford Press.
Garrison, W. T., Biggs, D., & Williams, K. (1990). Temperament characteristics and clinical outcomes in young children with diabetes mellitus. Journal of Child Psychology and Psychiatry, 31, 1079-1088.

References
214
Gattuso, J., Hinds, P., Tong, X., & Srivastava, K. (2006). Monitoring Child and Parent Refusals to Enrol in Clinical Research Protocols. Journal of Advanced Nursing, 53(3), 319-326.
Gidrpn, Y., Davidson, K., & Bata, I. (1999). The Short-Term Effects of a Hostility-Reduction Intervention on Male Coronary Heart Disease Patients. Health Psychology, 18(4), 416-420.
Gilbert, B. O. (1992). Insulin-Dependent Diabetes Control, Personality and Life Stress in Adolescents. [Article]. Personality and Individual Differences, 13(3), 269-273.
Giles, D., Strowig, S., Challis, P., & Raskin, P. (1992). Personality traits as predictors of good diabetic control. Journal of Diabetes Complications, 6, 101-104.
Glasgow, R. E. (1995). A practical model of diabetes management and education. Diabetes Care, 18(1), 117-126.
Glasgow, R. E., & Anderson, R. M. (1999). In diabetes care, moving from compliance to adherence is not enough. Something entirely different is needed. Diabetes Care, 22(12), 2090-2092.
Glasgow, R. E., Fisher, E. B., Anderson, B. J., La Greca, A., Marrero, D., Johnson, S. B., . . . Cox, D. J. (1999). Behavioural Science in Diabetes: Contributions and Opportunities. Diabetes Care, 22(5), 832-843.
Glass, G. V., Peckham, P. D., & Sanders, J. R. (1972). Consequences of failure to meet assumptions underlying the fixed effects analysis of variance and covariance. Review of Educational Research, 42(3), 237-288.
Goldberg, L. R. (1990). An alternative 'description of personality': The big-five factor structure. Journal of Personality and Social Psychology, 59(6), 1216-1229.
Goldberg, L. R. (1992). The development of markers for the big-five factor structure. Psychological Assessment, 4(1), 26-42.
Goldberg, L. R. (1993). The Structure of Phenotypic Personality Traits. American Psychologist, 48(1), 26-34.
Good, M., & Schuler, L. (1997). Subject Retention in a Controlled Clinical Trial. Journal of Advanced Nursing, 26, 351-355.
Goodwin, L. D., & Leech, N. L. (2006). Understanding Correlation: Factors That Affect the Size of r. The Journal of Experimental Education, 74(3), 251-266.
Goodwin, R., Cox, B. J., & Clara, I. (2006). Neuroticism and physical disorders among adults in the community: Results from the National Comorbidity Survey. Journal of Behavioral Medicine, 29(3), 229-238.
Goodwin, R., & Friedman, H. S. (2006). Health status and the five-factor personality traits in a nationally representative sample. Journal of Health Psychology, 11(5), 643-654.
Goodwin, R., & Hamilton, S. P. (2002). Cigarette smoking and panic: The role of neuroticism. American Journal of Psychiatry, 159, 1208-1113.

References
215
Graue, M., Wentzel-Larsen, T., Bru, E., Hanestad, B. R., & Savik, O. (2004). The coping styles of adolescents with type 1 diabetes are associated with degree of metabolic control. Diabetes Care, 27(6), 1313-1317.
Grayson, D. (2004). Some myths and legends in quantitative psychology. Understanding Statistics, 3(1), 101-134.
Grey, M., Cameron, M., Lipman, T., & Thurber, F. (1995). Psychosocial status of children with diabetes in the first 2 years after diagnosis. Diabetes Care, 18, 1330-1336.
Grey, M., Davidson, M., Boland, E., & Tamborlane, W. V. (2001). Clinical and psychosocial factors associated with achievement of treatment goals in adolescents with diabetes mellitus. Journal of Adolescent Health, 28(5), 377-385.
Grey, M., & Kanner, S. (2000). Care of the child or adolescent with type 1 diabetes. Nursing Clinics of North America, 35(1), 1-13.
Grey, M., Whitmore, R., & Tamborlane, W. (2002). Depression in type 1 diabetes in children: Natural history and correlates. Journal of Psychosomatic Research, 53, 907-911.
Grossman, H. Y., Brink, S., & Hauser, S. T. (1987). Self-Efficacy in Adolescent Girls and Boys with Insulin-Dependent Diabetes Mellitus. Diabetes Care, 10(3), 324-329.
Guilford, J. P. (1975). Factors and factors of personality. Psychological Bulletin, 82, 802-814.
Hains, A. A., Davies, W. H., Parton, E., & Silverman, A. H. (2001). Brief Report: A Cognitive Behavioral Intervention for Distressed Adolescents With Type I Diabetes. Journal of Pediatric Psychology, 26(1), 61-66.
Hambrick, E. P., & McCord, D. M. (2010). Proactive coping and its relation to the Five-Factor Model of personality. Individual Differences Research, 8(2), 67-77.
Hampson, S. E., Andrews, J. A., Barckley, M., Lichtenstein, E., & Lee, M. E. (2000). Conscientiousness, perceived risk, and risk-reduction behaviors: A preliminary study. Health Psychology, 19(5), 496-500.
Hampson, S. E., & Goldberg, L. R. (2006). A first large cohort study of personality trait stability over the 40 years between elementary school and midlife. Journal of Personality & Social Psychology, 91(4), 763-779.
Hampson, S. E., Goldberg, L. R., Vogt, T. M., & Dubanoski, J. P. (2006). Forty years on: Teachers' assessments of children's personality traits predict self-reported health behaviors and outcomes at midlife. Health Psychology, 25(1), 57-64.
Hampson, S. E., Goldberg, L. R., Vogt, T. M., & Dubanoski, J. P. (2007). Mechanisms by Which Childhood Personality Traits Influence Adult Health Status: Educational Attainment and Healthy Behaviors. Health Psychology, 26(1), 121-125.

References
216
Hampson, S. E., Skinner, T. C., Hart, J., Storey, L., Gage, H., Foxcroft, D., . . . McEvilly, E. A. (2000). Behavioral Interventions for Adolescents With Type 1 Diabetes: How Effective Are They? Diabetes Care, 23(9), 1416-1422.
Hampson, S. E., Skinner, T. C., Hart, J., Storey, L., Gage, H., Foxcroft, D., . . . Walker, J. (2001). Effects of Educational and Psychosocial Interventions for Adolescents with Diabetes Mellitus: A Systematic Review. Health Technology Assessment, 5(10).
Hanas, R. (1998). Insulin-Dependent Diabetes in Children, Adolsecents and Adults. Uddevalla, Sweden: Piara HB.
Hanson, C. L., Cigrang, J. A., Harris, M. A., Carle, D. L., Relyea, G., & Burghen, G. A. (1989). Coping Styles in Youths with Insulin-Dependent Diabetes Mellitus. Journal of Consulting and Clinical Psychology, 57, 644-651.
Harkness, E., Macdonald, W., Valderas, J., Coventry, P., Gask, L., & Bowler, P. (2010). Identifying Psychosocial Interventions that Improve Both Physical and Mental Health in Patients with Diabetes. Diabetes Care, 33(4), 926-930.
Harkness, K. L., Bagby, R. M., Joffe, R. T., & Levitt, A. (2002). Major depression, chronic minor depression, and the five-factor model of personality. [Article]. European Journal of Personality, 16(4), 271-281.
Harris, M. A., Wysocki, T., Sadler, M., Wilkinson, K., Harvey, L. M., Buckloh, L. M., . . . White, N. H. (2000). Validation of a Structural Interview for the Assessment of Diabetes Self-management. Diabetes Care, 23(9), 1301-1304.
Hassan, K., Loar, R., Anderson, B. J., & Heptulla, R. A. (2006). The role of socioeconomic status, depression, quality of life, and glycemic control in type 1 diabetes mellitus. The Journal of Pediatrics, 149, 526-531.
Hauner, K. K. Y., Adam, E. K., Mineka, S., Doane, L. D., DeSantis, A. S., Zinbarg, R., . . . Griffith, J. W. (2008). Neuroticism and introversion are associated with salivary cortisol patterns in adolescents. Psychoneuroendocrinology, 33, 1344-1356.
Haynes, A., Bower, C., Bulsara, M. K., Jones, T. W., & Davis, E. A. (2004). Continued increase in the incidence of childhood Type 1 diabetes in a population-based Australian sample (1985-2002). Diabetologia, 47(5), 866-870.
Hearnshaw, H., & Lindenmeyer, A. (2006). What do we mean by adherence to treatment and advice for living with diabetes? A review of the literature on definitions and measurements. Diabetic Medicine: A Journal Of The British Diabetic Association, 23(7), 720-728.
Helgeson, V. S., Escobar, O., Siminerio, L., & Becker, D. (2007). Relation of stressful life events to metabolic control among adolescents with diabetes: 5-year longitudinal study. Health Psychology, 29(2), 153-159.
Helgeson, V. S., Siminerio, L., Escobar, O., & Becker, D. (2007). Predictors of metabolic control among adolescents with diabetes: A 4-year longitudinal study. Journal of Pediatric Psychology, 34(3), 262-270.

References
217
Helgeson, V. S., Siminerio, L., Escobar, O., & Becker, D. (2009). Predictors of Metabolic Control among Adolescents with Dibates: A 4-Year Longitudinal Study. Journal of Pediatric Psychology, 34(3), 254-270.
Heller, S. R. (2002). Hypoglycaemia in Diabetes. Medicine, 30(2), 54-57.
Hepburn, D. A., Langan, S. J., Deary, I. J., Macleod, K. M., & Frier, B. M. (1994). Psychological and demographic correlates of glycemic control in adult patients with Type-1 diabetes. [Article]. Diabetic Medicine, 11(6), 578-582.
Herche, J., & Engelland, B. (1996). Reversed-polarity items and scale unidimensionality. Journal of the Academy of Marketing Science, 24, 366-374.
Herzer, M., & Hood, K. K. (2010). Anxiety Symptoms in Adolescents with Type 1 Diabetes: Association with Blood Glucose Monitoring and Glycemic Control. Journal of Pediatric Psychology, 35(4), 415-425.
Hochhauser, C. J., Rapaport, R., Shemesh, E., Schmeidler, J., & Chemtob, C. M. (2008). Age at diagnosis, gender, and metabolic control in children with type I diabetes. Pediatric Diabetes, 9(1), 303-307.
Holl, R. W., Swift, P. F., Mortensen, H. B., Lynggaard, H., Hougaard, P., Aanstoot, H.-J., . . . Sovik, O. (2003). Insulin injection regimens and metabolic control in an international survey of adolescents with type 1 diabetes over 3 years: results from the Hvidore study group. European Journal of Pediatrics, 162(1), 22.
Holmes, C. S., Chen, R., Streisand, R., Marschall, D. E., Souter, S., Swift, E. E., & Peterson, C. C. (2006). Predictors of Youth Diabetes Care Behaviors and Metabolic Control: A Structural Equation Modeling Approach. Journal of Pediatric Psychology, 31(8), 770-784.
Hong, R. Y., & Paunonen, S. V. (2009). Personality Traits and Health-Risk Behaviours in University Students. European Journal of Personality, 23, 675-696.
Hoth, K., Christensen, A., Ehlers, S., Raichle, K., & Lawton, W. (2007). A Longitudinal examination of social support, agreeableness and depressive symptoms in chronic kidney disease. [Article]. Journal of Behavioral Medicine, 30(1), 69-76. doi: 10.1007/s10865-006-9083-2
Howren, M., Bryant, I., & Suls, J. (2011). The symptom perception hypothesis revised: Depression and anxiety play different roles in concurrent and retrospective symptom reporting. Journal of Personality and Social Psychology, 100(1), 182-195.
Hoyle, R. H. (2006). Personality and self-regulation: Trait and information processing perspectives. Journal of Personality, 74(6), 1507-1526.
Hyphantis, T., Kaltsouda, A., Triantafillidis, J., Platis, O., Karadagi, S., Christou, K., . . . Mavreas, V. (2005). Personality correlates of adherence to type 2 diabetes regimens. International Journal of Psychiatry in Medicine, 35(1), 103-107.
Ikeda, Y., & Tsuruoka, A. (1994). Self-Monitoring of Blood-Glucose, as a Means of Self-Management. Diabetes Research and Clinical Practice, 24, S269-S271.

References
218
Ingerski, L. M., Anderson, B. J., Dolan, L. M., & Hood, K. K. (2010). Blood glucose monitoring and glycemic control in adolescence: Contribution of diabetes-specific responsibility and family conflict. Journal of Adolescent Health, 47(2), 191-197.
Jackson, B., Kubzansky, L. D., Cohen, S., Jacobs Jr, D. R., & Wright, R. J. (2007). Does Harbouring Hostility Hurt? Associations BetweenHostility and Pulmonary Function in the Coronary Artery Risk Development in (Young) Adults (CARDIA) Study. Health Psychology, 26(3), 333-340.
Jacobson, A. M., Hauser, S. T., Lavori, P., Wolfsdorf, J. I., Herskowitz, R. D., Milley, J. E., . . . Stein, J. (1990). Adherence among children and adolescents with insulin dependent diabetes mellitus over a four-year longitudinal follow-up: !. The influence of patient coping and adjustment. Journal of Pediatric Psychology, 15, 511-526.
John, O. P. (1990). The "Big Five" Taxonomy: Dimensions of Personality in the Natural Language and in Questionnaires. In L. A. Pervin (Ed.), Handbook of Personality Theory and Research. New York: Guilford Press.
John, O. P., & Srivastava, S. (1999). The Big-five trait taxonomy: History, measurement, and theoretical perspectives. In L. Pervin & O. P. John (Eds.), Handbook of personality: Theory and research (2 ed.). New York: Guilford.
Jones, F. C., & Broome, M. E. (2001). Focus Groups With African American Adolescents: Enhancing Recruitment and Retention in Intervention Strategies. Journal of Pediatric Nursing, 16(88-96).
Jylha, P., & Isometsa, E. (2006). The relationship of neuroticism and extraversion to symptoms of anxiety and depression in the general population. Depression and Anxiety, 23(5), 281-289.
Kanner, S., Hamrin, V., & Grey, M. (2003). Depression in adolescents with diabetes. Journal of Child & Adolescent Psychiatric Nursing, 16(1), 15-24.
Kavanagh, D. J., Gooley, S., & Wilson, P. H. (1993). Prediction of Adherence and Control in Diabetes. Journal of Behavioral Medicine, 16(5), 509-522.
Kealey, K. A., Ludman, E. J., Mann, S. L., Marek, P. M., Phares, M. M., Riggs, K. R., & Peterson Jr, A. V. (2007). Overcoming Barriers to Recruitment and Retention in Adolescent Smoking Cessation. Nicotine and Tobacco Research, 9(2), 257-270.
Keeley, J., Zayac, R., & Correia, C. (2008). Curvilinear relationships between statistics anxiety and performance among undergraduate students: Evidence for optimal anxiety. Statistics Education Research Journal, 7(1), 4-15.
Keith, T. Z. (2006). Multiple regression and beyond. New York: Pearson.
Kendler, K. S., Gatz, M., Gardner, C. O., & Pedersen, N. L. (2006). Personality and Major Depression. Archives of General Psychiatry, 63, 1113-1120.
Kendler, K. S., & Myers, J. (2010). The genetic and environmental relationship between major depression and the five-factor model of personality. Psychological Medicine, 40(5), 801-806. doi: 10.1177/s0033291709991140

References
219
Kerr, D., Cheyne, E., Thomas, P., & Sherwin, R. (2007). Influence of acute alcohol ingestion on the hormonal responses to modest hypoglycaemia in patients with Type 1 diabetes. Diabetic Medicine, 24(3), 312-316.
Khan, A. A., Jacobson, K. C., Gardner, C. O., Prescott, C. A., & Kendler, K. S. (2005). Personality and comorbidity of common pstchiatric disorders. British Journal of Psychiatry, 186, 190-196.
Kidachi, R., Kikuchi, A., Nishizawa, Y., Hiruma, T., & Kaneko, S. (2007). Personality types and coping style in hemodialysis patients. Psychiatry and clinical neurosciences, 61, 339-347.
Kilpatrick, E. S. (2000). Glycated Haemoglobin in the Year 2000. Journal of Clinical Pathology, 53, 335-339.
Kotov, R., Gamez, W., Schmidt, F., & Watson, D. (2010). Linking “big” personality traits to anxiety, depressive, and substance use disorders: A meta-analysis. Psychological Bulletin, 136(5), 768-821.
Kovacs, M., Goldston, D., Obrosky, D., & Bonar, L. (1997). Psychiatric Disorders in Youths with IDDM: Rates and Risk Factors. Diabetes Care, 20, 36-44.
Kramer, J. R., Ledolter, J., Manos, G. N., & Bayless, M. L. (2000). Stress and Metabolic Control in Diabetes Mellitus: Methodological Issues and an Illustrative Analysis. Annals of Behavioral Medicine, 22(1), 17-28.
Krapek, K., King, K., Warren, S. S., George, K. G., Caputo, D. A., Mihelich, K., . . . Lubowski, T. J. (2004). Medication adherence and associated hemoglobin A(1c) in type 2 diabetes. Annals of Pharmacotherapy, 38(9), 1357-1362.
La Greca, A. M., Swales, T., Klemp, S., Madigan, S., & Skyler, J. (1995). Adolescents With Diabetes: Gender Differences in Psychosocial Functioning and Glycemic Control. Children's Health Care, 24(1), 61.
Laffel, L., Antisdel, J., Brackett, J., Dietrich, J., & Anderson, B. (1998). Adherence to blood glucose monitoring (BGM) predicts optimal glycemic control and reduces adverse outcomes in youth with IDDM. Diabetes, 47, A43-A43.
Lahey, B. B. (2009). Public Health Significance of Neuroticism. [Review]. American Psychologist, 64(4), 241-256. doi: 10.1037/a0015309
Lane, J. D., McCaskill, C. C., Williams, P. G., Parekh, P. I., Feinglos, M. N., & Surwit, R. S. (2000). Personality Correlates of Glycemic Control in Type 2 Diabetes. Diabetes Care, 23(9), 1321.
Lane, J. D., Stabler, B., Ross, S. L., Morris, M. A., Litton, J. C., & Surwit, R. S. (1988). Psychological predictors of glucose control in patients with IDDM. Diabetes Care, 11(10), 798-800.
Lawson, V. L., Bundy, C., Belcher, J., & Harvey, J. N. (2010). Mediation by illness perceptions of the effect of personality and health threat communication on coping with the diagnosis of diabetes. British Journal of Psychology, 15, 623-642.

References
220
Lee, Y. Y., & Lin, J. L. (2009). The effects of trust in physician on self-efficacy, adherence and diabetes outcomes. Social Science & Medicine, 68(6), 1060-1068. doi: 10.1016/j.socscimed.2008.12.033
Lemos-Giraldez, S., & Fidalgo-Aliste, A. M. (1997). Personality dispositions and health-related habits and attitudes: A cross-sectional study. [Article]. European Journal of Personality, 11(3), 197-209.
Levine, B.-S., Anderson, B., Butler, D., Antisdel, J., Brackett, J., & Laffel, L. (2001). Predictors of glycemic control and short-term adverse outcomes in youth with type I diabetes. The Journal of Pediatrics, 139(2), 197-203.
Liakopoulou, M., Korvessi, M., & Dacou-Voutetakis, C. (1992). Personality characteristics, environmental factors and glycemic control in adolescents with diabetes. European Child & Adolescent Psychiatry, 1(2), 82-88.
Liese, A. D., Liu, L., Davis, C., Standiford, D., Waitzfelder, B., Dabelea, D., . . . Lawrence, J. M. (2008). Participation in Pediatric Epidemiological Research: The SEARCH for Diabetes in Youth Study Experience
Contemporary Clinical Trials, 29, 829-836.
Lindberg, M. A. (2002). The Role of Suggestions and Personality Characteristics in Producing Illness Reports and Desires for Suing the Responsible Party. The Journal of Psychology, 136(2), 125-140.
Livneh, H., & Antonak, R. F. (2005). Pyschosocial Adaptation to Chronic Illness and Disability: A Primer for Counselors. Journal of Counseling and Development, 83, 12-20.
Lorig, K. (1993). Self-management of Chronic Illness: A Model for the Future. Generations, 17(3), 11-14.
Loukas, A., Krull, J. L., Chassin, L., & Carle, A. C. (2000). The relation of personality to alcohol abuse/dependence in a high-risk sample. Journal of Personality, 68(6), 1153-1175.
Lovibond, S. H., & Lovibond, P. F. (1995a). Manual for the Depression Anxiety Stress Scales (2nd ed.). Sydney: Psychology Foundation Monograph.
Lovibond, S. H., & Lovibond, P. F. (1995b). The Structure of Negative Emotional States: Comparison of the Depression Anxiety Stress Scale (DASS) with the Beck Depression and Anxiety Inventories.
Lustman, P. J., Anderson, R. J., Freedland, K. E., De Groot, M., Carney, R. M., & Clouse, R. E. (2000). Depression and Poor Glycaemic Control. Diabetes Care, 23(7), 934-942.
Lustman, P. J., Frank, B. L., & McGill, J. B. (1991). Relationship of personality-characteristics to glucose regulation in adults with diabetes. [Article]. Psychosomatic Medicine, 53(3), 305-312.
Luyckx, K., Seiffe-Krenke, I., & Hampson, S. E. (2010). Glycemic Control, Coping and Internalizing and Externalizing Symptoms in Adolescents With Type 1 Diabetes: A Cross-Lagged Approach. Diabetes Care, 33(7), 1424-1429.

References
221
MacIntyre, P. D., & Gardner, R. (1994). The effects of induced anxiety on three stages of cognitive processing in second language learning. Studies in second language acquisition, 16, 1-17.
Mallery, P. (2009). SPSS for Windows step by step: A simple guide and reference 16.0 update (9th ed.). New York: Pearson.
Mancuso, J. M. (2009). The impact of health literacy and patient trust on glycemic control. Western Journal of Nursing Research,, 31(8), 1086-1087.
Mancuso, J. M. (2010). Impact of health literacy and patient trust on glycemic control in an urban USA population. Nursing & Health Sciences, 12(1), 94-104. doi: 10.1111/j.1442-2018.2009.00506.x
Mann, A. H., & Brennan, P. J. (1987). Type A behaviour score and the incidence of cardiovascular disease: A failure to replicate the claimed associations. Journal of Psychosomatic Research, 31(6), 685-692.
Marks, G. R. (2000). Five-factor model of personality and diabetes outcomes: Differential contributions of neuroticism, conscientiousness, and agreeableness. Psychosomatic Medicine, 62(1), 99.
Marsh, H. W. (1988). Self-Description Questionnaire I. SDQ-I Manual and Research Monograph. San Antonio: The Psychological Corporation.
Marsh, H. W. (1990a). Self-Description Questionnaire II. SDQ-II Manual and Research Monograph. California: Harcourt Brace Jovanovich.
Marsh, H. W. (1990b). Self-Description Questionnaire III. SDQ-III Manual and Research Monograph. Sydney: University of Western Sydeny.
Marsh, H. W. (1996). Positive and negative global self-esteem: A substantively meaningful distinction or artifactors? Journal of Personality and Social Psychology, 70(4), 810-819.
Marshall, G. N., Wortman, C. B., Vickers, R. R., Kusulas, J. W., & Hervig, L. K. (1994). The five-factor model of personality as a framework for personality-health research. Journal of Personality and Social Psychology, 67(2), 278-286.
Massengale, J. (2005). Depression and the adolescent with type 1 diabetes: the covert comorbidity. Issues in Mental Health Nursing, 26(2), 137-148.
McCrae, R. R., & Costa, P. T. (1999). A five-factor theory of personality. In L. A. Pervin & O. P. John (Eds.), Handbook of personality: Theory and research (pp. 139-153). New York: Guilford.
McCrae, R. R., & John, O. P. (1992). An Introduction to the 5-Factor Model and Its Applications. Journal of Personality, 60(2), 175-215.
McCrimmon, R. J., Frier, B. M., & Dreary, I. J. (1999). Appraisal of Mood and Personality During Hypoglycaemia in Human Subjects.
McDonald, S. P., Chang, S., & Excell, L. (2007). ANZDATA Registry Report 2007. Adelaide: Australian and New Zealand Dialysis and Transplant Registry.

References
222
McGhee, R. L., Ehrler, D. J., & Buckhalt, J. A. (2007). Five-Factor Personality Inventory-Children: Examiners Manual. Austin: Pro-Ed.
McNabb, W. L. (1997). Adherence in diabetes: Can we define it and can we measure it? Diabetes Care, 20(2), 215-218.
Meltzoff, J. (2004). Critical thinking about research: Psychology and related fields. Washington DC: American Psychological Association.
Merbis, M. A. E., Snoek, F. J., Kanc, K., & Heine, R. J. (1996). Hypoglycaemia Induces Emotional Disruption. Patient Education & Counseling, 2, 117-122.
Michigan Diabetes Research Training Center. Diabetes Knowledge Test, from www.med.umich.edu/mdrtc/profs/survey.html#dkt
Mooradian, T., Renzl, B., & Matzler, K. (2006). Who Trusts? Personality, Trust and Knowledge Sharing. Management Learning, 37(4), 523-540. doi: 10.1177/1350507606073424
Mortensen, H. B., Swift, P. G. F., Holl, R., Hougaard, P., Hansen, L., Bjoerndalen, H., . . . Knip, M. (2010). Mutational study in children and adolescents with newly diagnosed type 1 diabetes: Association of age, ketoacidosis, HLA status, and autoantibodies on residual beta-cell function and glycemic control 12 months after diagnosis. Pediatric Diabetes, 11(4), 218-226.
Munafo, M. R., Zetteler, J. I., & Clark, T. G. (2006). Personality and Smoking Status: A Meta-Analysis. Nicotine and Tobacco Research, 9(3), 405-413.
Murphy, H. R., Rayman, G., & Skinner, T. C. (2006). Psycho-Educational Interventions for Children and Young People with Type 1 Diabetes. Diabetic Medicine, 23, 935-943.
Myrtek, M. (2001). Meta-Analyses of Prospective Studies on Coronary Heart Disease, Type A Personality and Hostility. International Journal of Cardiology, 79, 245-251.
Naar-King, S., Idalski, A., Ellis, D., Frey, M., Templin, T., Cunningham, P. B., & Cakan, N. (2006). Gender differences in adherence and metabolic control in urban youth with poorly controlled type 1 diabetes: The mediating role of mental health symptoms. Journal of Pediatric Psychology, 31(8), 793-802.
National Health and Medical Research Council. (2005). Clinical practice guidelines: Type I diabetes in children and adolescents. Canberra.
Nicholson, N., Soane, E., Fenton-O'Creevy, M., & Willman, P. (2005). Personality and domain-specific risk taking. Journal of Risk Research, 8(2), 157-176.
Norman, W. T. (1963). Toward an Adequate Taxonomy of Personality Attributes: Replicated Factor Structure in Peer Nomination Personality Ratings. Journal of Abnormal and Social Psychology, 66, 574-583.
Norris, A. E., & Aroian, K. J. (2004). To transform or not to transform skewed data for psychometric analysis: That is the question! Nursing Research, 53(1), 67-71.

References
223
Ode, S., & Robinson, M. D. (2009). Can agreeableness turn gray skies blue? A role for agreeableness in moderating neuroticism-linked dysphoria. Journal of Social and Clinical Psychology, 28(4), 436-462. doi: 10.1521/jscp.2009.28.4.436
Olsen, B. S., Johannesen, J., Sjolie, A. K., Borch-Johnsen, K., Hougaard, P., Thorsteinsson, B., . . . Childhood, i. (1999). Metabolic control and prevalence of microvascular complications in young Danish patients with Type 1 diabetes mellitus. Diabetic Medicine, 16(1), 79-85.
Ostendorf, F., & Angleitner, A. (1992). On the Generality and Comprehensiveness of the Five-Factor Model of Personality: Evidence for Five Robust Factors in Questionnaire Data. In G. V. Caparara & G. L. Van Heck (Eds.), Modern Personality Psychology (pp. 73-109). New York: Harvester Wheatsheaf.
Ostendorf, F., & Angleitner, A. (1994). The 5-Factor Taxonomy - Robust Dimensions of Personality Description. Psychologica Belgica, 34(4), 175-194.
Overland, J. (2004). Economics of care: Australia and New Zealand. In R. A. DeFronzo, E. Ferrannini, H. Keen & P. Z. Zimmet (Eds.), International Textbook of Diabetes Mellitus (3 ed.): John Wiley & Sons.
Pagano, D. F. (1973). Effects of task familiarity on stress responses of repressors and sensitizers. Journal of Consulting and Clinical Psychology, 40(1), 22-26.
Peabody, D. (1967). Trait inferences: Evaluative and descriptive aspects. Journal of Personality and Social Psychology Monographs, 7(Whole No. 644).
Pervin, L. A. (2003). The science of personality (2nd ed.). New York: Oxford University Press.
Pervin, L. A., & John, O. P. (2001). Personality: Theory and research (8th ed.). New York: Wiley.
Petersen, C., Schmidt, S., & Bullinger, M. (2006). Coping With a Chronic Pediatric Health Condition and Health-Related Quality of Life. European Psychologist, 11(1), 50-56.
Petersen, C., Schmidt, S., Bullinger, M., & the DISABKIDS Group. (2004). Brief Report: Development and Pilot Testing of a Coping Questionnaire for Children and Adolescents With Chronic Health Conditions. Journal of Pediatric Psychology, 29(8), 635-640.
Peyrot, M., & Rubin, R. R. (2007). Behavioural and Psychosocial Interventions in Diabetes: A Conceptual Review. Diabetes Care, 30(10), 2433-2440.
Pickup, J., Mattock, M., & Kerry, S. (2002). Glycaemic control with continuous subcutaneous insulin infusion compared with intensive insulin injections in patients with type 1 diabetes: meta-analysis of randomised controlled trials. British Medical Journal, 324(7339).
Poropat, A. E. (2004). An Examination of Relationship Between Personality and Citizen Performance in Academic and Workplace Settings. University of Queensland, Brisbane.

References
224
Ratsep, T. T., Kallasmaa, T. T., Pulver, A. A., & Gross-Paju, K. K. (2000). Personality as a predictor of coping efforts in patients with multiple sclerosis. Multiple Sclerosis, 6(6), 397-402.
Raynor, D. A., & Levine, H. L. (2009). Associations Between the Five-Factor Model of Personality and Health Behaviours Among College Students. Journal of American College Health, 58(1), 73-81.
Rewers, M., Pihoker, C., Donaghue, K., Hanas, R., Swift, P., & Klingensmith, G. (2009). ISPAD clinical practice consensus guidelines 2009 compendium: Assessment and monitoring of glycemic control in children and adolescents with diabetes. Pediatric Diabetes, 10(S12), 71-81.
Rhee, M. K., Slocum, W., Ziemer, D. C., Culler, S. D., Cook, C. B., El-Kebbi, I. M., . . . Phillips, L. S. (2005). Patient adherence improves glycemic control. Diabetes Educator, 31(2), 240-250.
Rhodes, R. E., & Smith, N. E. I. (2006). Personality Correlates of Physical Activity: A Review and Meta-Analysis. British Journal of Sports Medicine, 40, 958-965.
Roberts, B. W., Caspi, A., & Moffitt, T. E. (2001). The Kids Are Alright: Growth and Stability in Personality Development From Adolescence to Adulthood. Journal of Personality and Social Psychology, 81(4), 670-683.
Roberts, B. W., & DelVecchio, W. F. (2000). The Rank-Order Consistency of Personality Traits From Childhood to Old Age: A Quantitative Review of Longitudinal Studies. Psychological Bulletin, 126(1), 3-25.
Roberts, B. W., Walton, K. E., & Bogg, T. (2005). Conscientiousness and health across the life course. Review of General Psychology, 9(2), 156-168.
Roberts, B. W., Walton, K. E., & Viechtbauer, W. (2006). Patterns of mean-level change in personality traits across the life course: A meta-analysis of longitudinal studies. Psychological Bulletin, 132(1), 1-25.
Roberts, H. (2000). Listening to Children: And Hearing Them In P. Christenson & A. James (Eds.), Research With Children: Perspectives and Practices (pp. 225-240). New York: Routledge Falmer.
Röcke, C., Li, S., & Smith, J. (2009). Intraindividual Variability in Positive and Negative Affect over 45 days: Do Older Adults Fluctuate Less Than Young Adults? Psychology and Aging, 24(4), 863-878.
Roelofs, J., Huibers, M., Peeters, F., & Arntz, A. (2008). Effects of Neuroticism on Depression and Anxiety: Rumination as a Possible Mediator. Personality & Individual Differences, 44(3), 574-584.
Rolland, J. P. (1993). Construct-Validity of Big 5 Personality Dimension Markers. European Review of Applied Psychology-Revue Europeenne De Psychologie Appliquee, 43(4), 317-337.
Rose, M., Hildebrandt, M., Fliege, H., Klapp, B. F., & Schirop, T. (2002). The Network of Psychological Variables in Patients With Diabetes and Their Importance for Quality of Life and Metabolic Control. Diabetes Care, 25(1), 35.

References
225
Rosmalen, J. G. M., Neeleman, J., Gans, R. O. B., & de Jonge, P. (2007). The Association Between Neuroticism and Self-Reported Common Somatic Symptoms in a Population Cohort. Journal of Psychosomatic Research, 62, 305-311.
Roter, D., & Hall, A. (2006). Doctors talking with patients/patients talking with doctors: Improving communication in medical visits. Westport: Praeger Publishers.
Rovert, J. F., & Ehrlich, R. M. (1988). Effect of Temperament on Metabolic Control in Children With Diabetes Mellitus [Abstract]. Diabetes Care, 11(1), 77-82.
Rubin, R. R., Peyrot, M., & Saudek, C. D. (1989). Effect of Diabetes Education on Self-Care, Metabolic Control, and Emotional Well-being. Diabetes Care, 12, 673-679.
Ryden, O., Nevander, L., Johnsson, P., Westbom, L., & Sjoblad, S. (1990). Diabetic children and their parents - personality correlates of metabolic control. [Article]. Acta Paediatrica Scandinavica, 79(12), 1204-1212.
Sanz, J., Garcia-Vera, M. P., & Magan, I. (2010). Anger and hostility from the perspective of the Big Five personality model. Scandinavian Journal of Psychology, 51(3), 262-270. doi: 10.1111/j.1467-9450.2009.00771.x
Saucier, G. (2002). Gone too far - Or not far enough? Comments on the article by Ashton and Lee (2001). European Journal of Personality, 16, 55-62.
Saucier, G., & Goldberg, L. R. (2001). Lexical studies of indigenous personality factors: Premises, products and prospects. Journal of Personality, 69(6), 847-879.
Savage, E., & McCarron, S. (2009). Research Access to Adolescents and Young Adults. Applied Nursing Research, 22, 63-67.
Scher, S. J., & Osterman, N. M. (2002). Procrastination, conscientiousness, anxiety, and goals: Exploring the measurement and correlates of procrastination among school-aged children. Psychology in the Schools, 39(4), 385-398.
Schilling, L. S., Grey, M., & Knafl, K. A. (2002a). The concept of self-management of type 1 diabetes in children and adolescents: an evolutionary concept analysis. [Article]. Journal of Advanced Nursing, 37(1), 87-99.
Schilling, L. S., Grey, M., & Knafl, K. A. (2002b). A review of measures of self-management of type 1 diabetes by youth and their parents. Diabetes Educator, 28(5), 796-808.
Schmitt, D. P., Voracek, M., Realo, A., & Allik, J. (2008). Why can't a man be more like a woman? Sex differences in Big Five personality traits across 55 cultures. Journal of Personality and Social Psychology, 94(1), 168-182.
Schneider, S., Iannotti, R. J., Nansel, T. R., Haynie, D. L., Simons-Morton, B., Sobel, D. O., . . . Plotnick, L. P. (2007). Identification of distinct self-management styles of adolescents witht type I diabetes. Diabetes Care, 30(5), 1107-1112.
References
226
Schneiders, J., Nicolson, N. A., & Berkhof, J. (2007). Mood in daily contexts: Relationship with risk in early adolescence. Journal of research on adolescence, 17(4), 697-722.
Seed, M., Juarez, M., & Alantour, R. (2009). Improving Recruitment and Retention Rates in Preventive Longitudinal Research with Adolescent Mothers. Journal of Child and Adolescent Psychiatric Nursing, 22(3), 150-153.
Serber, E. R., Cronan, T. A., & Walen, H. R. (2003). Predictors of patient satisfaction and health care costs for patients with fibromyaglia. Psychology and Health, 18(6), 771-788.
Shiner, R. L., & Caspi, A. (2003). Personality differences in childhood and adolescence: measurement, development and consequences. Journal of Child Psychology and Psychiatry, 44, 2-32.
Shipley, B. A., Weiss, A., Taylor, M. D., & Deary, I. J. (2007). Neuroticism, extraversion and mortality in the UK Health and Lifestyle Survey: A 21-year prospective cohort study. Psychosomatic Medicine, 69, 923-931.
Silverstein, J., Klingensmith, G., Copeland, K., Plotnick, L., Kaufman, F., Laffel, L., & Clark, N. (2005). Care of Children and Adolescents With Type 1 Diabetes. Diabetes Care, 28(1), 186-212.
Singer, J. D., & Willett, J. B. (2003). Applied longitudinal data analysis. New York: Oxford university press.
Sirois, F. M., & Purc-Stephenson, R. J. (2008). Personality and consultations with complementary and alternative medicine practitioners: A five-factor model investigation of the degree of use and motives. The journal of alternative and complementary medicine, 14(9), 1151-1158.
Skinner, T. C., Hampson, S. E., & Fife-Schaw, C. (2002). Personality, Personal Model Beliefs, and Self-Care in Adolescents and Young Adults With Type 1 Diabetes. Health Psychology, 21(1), 61-70.
Skocic, M., Rudan, V., Brajkovic, L., & Marcinko, D. (2010). Relationship among psychopathological dimensions, coping mechanisms, and glycemic control in a Croatian sample of adolescents with diabetes mellitus type 1. European Child & Adolescent Psychiatry, 19(6), 525-533.
Skowera, A., Ellis, R. J., Varela-Calvino, R., Arif, S., Huang, G. C., Van-Krinks, C., . . . Peakman, M. (2008). CTLs are targeted to kill beta cells in patients with type 1 diabetes through recognition of a glucose-regulated preproinsulin epitope. The Journal of Clinical Investigation, 118(10), 3390-3402.
Smith, T. W. (2006). Personality as risk and resilience in physical health. Current Directions in Psychological Science, 15(5), 227-231.
Smith, T. W., Jenkins, C. D., & Orleans, C. T. (2004). Prevention and Health Promotion: Decades of Progress, New Challanges, and an Emerging Agenda. Health Psychology, 23(2), 126-131.
Smith, T. W., & MacKenzie, J. (2006). Personality and Risk of Physical Illness. Annual Review of Clinical Psychology, 2, 435-467.

References
227
Smith, T. W., & Spiro, A. (2002). Personality, health, and aging: Prolegomenon for the next generation. Journal of Research in Personality, 36, 363-394.
Smith, T. W., & Williams, P. G. (1992). Personality and Health: Advantages and Limitations of the Five-Factor Model. Journal of Personality, 60(2), 395-423.
Sneed, C. D., Gullone, E., & Moore, S. (2002). Reliability and factor structure of the NEO-Five-factor Inventory for Australian adolescents. Behaviour Change, 19(2), 121-126.
Soltesz, G., Patterson, C. C., & Dahlquist, G. (2007). Worldwide Childhood Type 1 Diabetes Incidence - What Can We Learn From Epidemiology? Pediatric Diabetes, 8(S6), 6-14.
Springer, D., Dziura, J., Tambolane, W. V., Steffen, A. T., Ahern, J. H., Vincent, M., & Weinzimer, S. A. (2006). Optimal control of type I diabetes mellitus in youth receiving intensive treatment. The Journal of Pediatrics, 149, 227-232.
Steiner, D. L., & Norman, G. R. (2003). Health measurement scales: A practical guide to their development and use (3rd ed.). New York: Oxford University Press.
Stewart, S. M., Emslie, G. J., Klein, D., Haus, S., & White, P. (2005). Self-care and glycemic control in adolescents with type I diabetes. [Article]. Children's Health Care, 34(3), 235-244.
Stone, S. V., & McCrea, R. R. (2007). Personality and Health. In S. Ayers, A. Baum & C. McManus (Eds.), Cambridge handbook of psychology, health and medicine (2nd ed.). New York: Cambridge University Press.
Suls, J., & Rittenhouse, J. D. (1987). Personality and Health: An Introduction. Journal of Personality, 55, 155-167.
Svensson, M., Eriksson, J. W., & Dahlquist, G. (2004). Early Glycemic Control, Age at Onset, and Development of Microvascular Complications in Childhood-Onset Type 1 Diabetes. Diabetes Care, 27(4), 955-962.
Szymborska-Kajanek, A., Wrobel, M., Cichocka, M., Grzeszczak, W., & Strojek, K. (2006). The assessment of influence of personality type on metabolic control and compliance with physician's instruction in type 2 diabetic patients. Experimental & Clinical Diabetology, 6(1), 11-15.
Taplin, C. E., Craig, M. E., Lloyd, M., Taylor, C., Crock, P., Silink, M., & Howard, N. J. (2005). The rising incidence of childhood type 1 diabetes in New South Wales, 1990-2002. Medical Journal of Australia [NLM - MEDLINE], 183(5), 243.
Taylor, M. D., Frier, B. M., Gold, A. E., & Deary, I. J. (2003). Psychosocial factors and diabetes-related outcomes following diagnosis of type 1 diabetes in adults: The Edinburgh Prospective Diabetes Study. Diabetic Medicine, 20(2), 135-146.
Tellegen, A. (1993). Folk Concepts and Psychological Concepts of Personality and Personality Disorder. Psychological Inquiry, 4(2), 122-130.
Telles-Correia, D., Barbosa, A., Mega, I., & Monteiro, E. (2009). Adherence Correlates in Liver Transplant Candidates. [Article]. Transplantation Proceedings, 41(5), 1731-1734. doi: 10.1016/j.transproceed.2009.02.067

References
228
Terracciano, A., & Costa Jr., P. T. (2004). Research report: Smoking and the five-factor model of personality. [Article]. Addiction, 99(4), 472-481.
The Diabetes Control and Complications Trial Research Group. (1993). The Effect of Intensive Treatment of Diabetes on the Development and Progression of Long-Term Complications in Insulin-Dependent Diabetes Mellitus. The New England Journal of Medicine.
Thompson, T. L., Dorsey, A. M., Miller, K. I., & Parrot, R. (Eds.). (2003). Handbook of Health Communication. Mahwah, New Jersey: Lawrence Erlbaum Associates.
Toljamo, M., & Hentinen, M. (2001). Adherence to self-care and glycaemic control among people with insulin-dependent diabetes mellitus. Journal of Advanced Nursing, 34(6), 780-786.
Tupes, E. C., & Christal, R. E. (1961). Recurrent Personality Factors Based on Trait Ratings Technical Report ASD-TR-61-97 Texas: United States Air Force Aeronautical Systems Division.
Turan, B., Osar, Z., Turan, J. M., Damci, T., & Ilkova, H. (2002). Does coping with diabetes have an effect on adherence to treatment regimen and disease control in type 1 and insulin treated type 2 diabetic patients? Diabetes, 51, A438-A438.
van der Ven, N. C. W., Lubach, C. H. C., Hogenelst, M. H. E., van Iperen, A., Tromp-Wever, A. M. E., Vriend, A., . . . Snoek, F. J. (2005). Cognitive Behavioural Group Training (CBGT) for Patients With Type 1 Diabetes in Persistent Poor Glycaemic Control: Who Do We Reach? Patient Education & Counseling, 56, 313-322.
Van Heck, G. L. (1997). Personality and physical health: toward an ecological approach to health-related personality research. European Journal of Personality, 11(5), 415-443.
Villarruel, A. M., Jemmot, L. S., Jemmot, J. B., & Eakin, B. L. (2006). Recruitment and Retention of Latino Adolescents to a Reasearch Study: Lessons Learned from a Randomized Clinical Trial. JSPN, 11(4), 244-250.
Vollrath, M. (2000). Personality and hassles among university students: A three-year longitudinal study. European Journal of Personality, 14, 199-215.
Vollrath, M. (2001). Personality and stress. Scandinavian Journal of Psychology, 42, 335-347.
Vollrath, M., Knoch, D., & Cassano, L. (1999). Personality, risky health behaviour, and perceived susceptibility to health risks. European Journal of Personality, 13(1), 39-50.
Vollrath, M., Landolt, M., Gnehm, H., Laimbacher, J., & Sennhauser, F. (2007). Child and Parental Personality are Associated With Glyaemic Control in Type 1 Diabetes. Diabetic Medicine, 24, 1028-1033.
Vollrath, M., & Torgensen, S. (2008). Personality types and risky health behaviors in Norwegian students. Scandinavian Journal of Psychology, 49, 287-292.
References
229
Walsylkiw, L., & Fekken, G. C. (2002). Personality and Self-Reported Health: Matching Predictors and Criteria. Personality & Individual Differences, 33, 607-620.
Ward, L. S., & Tannner, A. D. (2010). Psychosocial stress and health-related quality of life for Latino migrant farmworkers. Southern Online Journak of Nursing Research, 10(1).
Watson, D., Clark, L. A., & Harkness, A. R. (1994). Structures of personality and their relevance to psychopathology. Journal of Abnormal Psychology, 102, 18-31.
Weiss, A., Sutin, A. R., Duberstein, P. R., Friedman, B., Bagby, R. M., & Costa Jr, P. T. (2009). The personality domains and styles of the five-factor model are related to incident depression in Medicare recipients aged 65 to 100. The American Journal of Geriatric Psychiatry, 17(7), 591-601.
Weiss, A., Sutin, A. R., Duberstein, P. R., Friedman, B., Bagby, R. M., & Costa, P. T., Jr. (2009). The personality domains and styles of the five-factor model are related to incident depression in Medicare recipients aged 65 to 100. American Journal of Geriatric Psychiatry, 17(7), 591-601.
Weissberg-Benchell, J., & Glasgow, A. (1997). The Role of Temperament in Children With Insulin-Dependent Diabetes Mellitus. Journal of Pediatric Psychology, 22(6), 795-809.
Weissberg-Benchell, J., Wirtz, P., Glasgow, A. M., Turek, J., Tynan, W. D., & Ward, J. (1995). Adolescent Diabetes Management and Mismanagement. Diabetes Care, 18(1), 77-82.
Wiebe, D. J., Alderfer, M. A., Palmer, S. C., Lindsay, R., & Jarrett, L. (1994). Behavioural self-regulation in adolescents with type I diabetes: Negative affectivity and blood glucose symptom perception. Journal of Consulting and Clinical Psychology, 62(6), 1204-1212.
Wiebe, D. J., & Smith, T. W. (1997). Personality and Health: Progress in Problems in Psychosomatics. In R. Hogan, J. Johnson & S. Briggs (Eds.), Handbook of Personality Psychology (pp. 891-918). San Diego: Academic.
Wiebe, J. S., & Christensen, A. J. (1996). Patient Adherence in Chronic Illness: Personality and Coping in Context. Journal of Personality, 64(4), 815-835.
Wild, D., von Maltzahn, R., Brohan, E., Christensen, T., Clauson, P., & Gonder-Frederick, L. (2007). A Critical Review of the Literature on Fear of Hypoglycemia in Diabetes: Implications for Diabetes Management and Patient Education. Patient Education and Counseling, 68(1), 10-15.
Wild, S., Roglic, G., Green, A., Sicree, R., & King, H. (2004). Global Prevalence of Diabetes: Estimates for the Year 2000 and Projections for 2030. Diabetes Care, 27(5), 1047-1053.
Williams, P. G., Colder, C. R., Lane, J. D., McCaskill, C. C., Feinglos, M. N., & Surwit, R. S. (2010). Examination of the Neuroticism-Symptom Reporting Relationship in Individuals With Type 2 Diabetes. Personality and Social Psychology Bulletin, 28(8), 1015-1025.

References
230
Williams, P. G., O'Brien, C. D., & Colder, C. R. (2004). The effects of neuroticism and extraversion on self-assessed health and health-relevant cognition. Personality and Individual Differences, 37, 83-94.
Wolfenstein, M., & Trull, T. J. (1997). Depression and openness to experience. Journal of Personality Assessment, 69(3), 614-632.
Wright, W. S. (1997). Predicting adolescent adjustment to diabetes mellitus from locus of control and optimism. Dissertation Abstracts International. Section B: The Sciences and Engineering, 57(10B), 6609.
Wysocki, T. (1993). Associations Among Teen-Parent Relationships, Metabolic Control and Adjustment to Diabetes in Adolescents. Journal of Pediatric Psychology, 18, 441-452.
Yerkes, R. M., & Dodson, J. D. (1908). The Relation of Strength of Stimulus to Rapidity of Habit-Formation. Journal of Comparative Neurology and Psychology, 18, 459-482
Zgibor, J. C., Songer, T. J., Kelsey, S. F., Weissfeld, J., Drash, A. L., Becker, D., & Orchard, T. J. (2000). The association of diabetes specialist care with health care practices and glycemic control in patients with type 1 diabetes: a cross-sectional analysis from the Pittsburgh Epidemiology of Diabetes Complications Study. Diabetes Care, 23(4), 472-476.
Zisser, H. C., Bailey, T., & Jovanovic, L. (2006). Diabetes self-management guided by continuous glucose-monitoring: Results of a pilot study. Diabetes, 55, A17-A17.
Zugelj, U., Zupancic, M., Komidar, L., Kenda, R., Varda, N. M., & Gregoric, A. (2010). Self-reported adherence behavior in adolescent hypertensive patients: the role of illness representations and personality. Journal of Pediatric Psychology, 35(9), 1049-1060.
Zupancic, M., Slobodskaya, H. R., & Knyazev, G. G. (2008). Gender differences in child/adolescent personality traits: Slovenes and Russians compared. Horizons of Psychology, 17(3), 43-63.

List of Appendices
Appendix 1: Newspaper Recruitment Advertisement .................................. 233
Appendix 2: Recruitment Poster ................................................................. 234
Appendix 3: DRAT Information Sheet and Informed Consent Form ........... 235
Appendix 4: Snowball Letter ....................................................................... 237
Appendix 5: Personality Study Information Sheet and Informed Consent Form ...................................................................................... 238
Appendix 6: FFPIC Instructions .................................................................. 240
Appendix 7: Excluded Measures ................................................................. 241
Appendix 8: Personal Information Sheet ..................................................... 242
Appendix 9: Annual Data Collection Form .................................................. 248
Appendix 10: Quarterly Review Form ......................................................... 255
Appendix 11: Diabetes Family Responsibility Questionnaire ...................... 258
Appendix 12: Depression Anxiety Stress Scale .......................................... 260
Appendix 13: DASS 21 Normative Sample Means and Standard Deviations by Sex .................................................................................... 262
Appendix 14: DASS Z Score Conversions .................................................. 263
Appendix 15: Coping with a Disease Inventory ........................................... 264
Appendix 16: Thank You Letter for Postal Participation .............................. 266
Appendix 17: List of Questionnaires for DRAT Postal Participation ............ 267
Appendix 18: Blood Collection Instructions for Participation by Post .......... 268
Appendix 19: Thank You Card .................................................................... 269
Appendix 20: DRAT Newsletter .................................................................. 270
Appendix 21: UWS Ethics Approval ............................................................ 274
Appendix 22: HNE Ethics Approval Letter .................................................. 277
Appendix 23: Missing Data ......................................................................... 279
Appendix 24: CODI Avoidance Inter-item Correlation Matrix ...................... 281
232
Appendix 25: Item-total Statistics for CODI Avoidance ............................... 282
Appendix 26: Exploratory Factor Analysis of CODI Avoidance ................... 283
Appendix 27: Baseline Descriptives for Study Variables ............................. 284
Appendix 28: Frequency Distributions ........................................................ 286
Appendix 29: P-P Plots ............................................................................... 288
Appendix 30: Bivariate Scatterplots ............................................................ 292
Appendix 31: Test-retest correlations for BGL Tests Including Outlier ........ 295
Appendix 32: Correlations for BGL Testing and HbA1c Including Outlier ... 296
Appendix 33: Correlations for BGL Testing and HbA1c Excluding Outlier .. 297
Appendix 34: Participants Falling into DASS Depression Severity Categories ............................................................... 298
Appendix 35: Table of Correlations ............................................................. 299
Appendix 36: Hierarchical Regressions ...................................................... 301

Appendix 1: Newspaper Recruitment Advertisement
233
Does your child have diabetes? Ever wondered why some young people, aged 8 to 19 years, seem to manage their diabetes better than others? We have too. If you are interested in helping us answer this question we would like to invite you and your family to be involved in an exciting new study being conducted by University of Western Sydney and The University of Sydney. To find out more about this study please contact Dr Jane Overland on 02 9515 5930 or [email protected]
Diabetes Research into
Adolescent Transitions

Appendix 2: Recruitment Poster
234

Appendix 3: DRAT Information Sheet and Informed Consent Form
235
Diabetes Research into Adolescent Transitions
Diabetes Research into Adolescent Transitions Project Information Sheet
Why is it that some people with type 1 diabetes are better able to keep their blood glucose levels as close to normal as possible while others struggle? This is a question that is currently being studied by a team of researchers from The University of Western Sydney, The University of Sydney, The Diabetes Centre at Royal Prince Alfred Hospital and Novo Nordisk Pharmaceuticals. The study will involved some 400 young people with type 1 diabetes, living in NSW, aged 8-18, and their families and will focus on the personal, family and environmental factors that may affect diabetes control. Children and young people and their families will be followed for three years so that we can determine what factors have most effect on the management of diabetes. If you agree to participate, one of the research team will visit you once a year. At this meeting, the child or young person with diabetes will be asked to allow a capillary blood sample to be taken for analysis of the blood glucose level and to complete a number of questionnaires relating to their knowledge of diabetes and how they are coping with its effect on their life. We believe that these questionnaires would take perhaps 1 ½ hours to complete. Parents will also be asked to complete some questionnaires relating to their knowledge of diabetes and how they are managing their child’s diabetes. This should take no more than 20 minutes to complete. As well, families (or the child/young person) will be contacted very few months by telephone to gather information on the child’s diabetes control. This would be a very brief call. We must emphasise that your access to services will not be affected in any way by whether you choose to participate in this project or not. You may also change your mind about participating in the project at any time. You should also know that all your responses will be confidential and no names will be used in any reports coming from the project. Should you have any questions about the project please do not hesitate to contact Assoc. Prof. Christine Johnston on 02 4736 0782, Dr Lorraine Smith on 02 9036 7079 or Dr Jane Overland on 02 9515 5930. This study has been approved by the University of Western Sydney Human Ethics Research Ethics Committee. If you have any complaints or reservations about the ethical conduct of this research, you may contact the Ethics Committee through the Ethics Research Officer (Tel: 02 4736 0883). Any issues you raise will be treated in confidence and investigated fully, and you will be informed of the outcome. Thank you for considering this request. We believe that this is a very important project as it will identify ways in which those living with type 1 diabetes could be better supported to ensure that they achieve effective self-management. If you decide to participate, please sign the attached consent form and return it in the enclosed envelope.
Assoc. Prof. Christine Johnston Dr Lorraine Smith Dr Jane Overland
University of Western Sydney The University of Sydney Diabetes Centre, RPAH

Appendix 3: DRAT Information Sheet and Informed Consent Form
236
D iabetes Research into Adolescent Transitions
DIABETES RESEARCH INTO ADOLESCENT TRANSITIONS
Consent to complete additional scales in the project:
If you are willing for you/your child to complete the additional scale in the Diabetes
Research into Adolescent Transitions Project please complete the following:
We understand that:
· I/my child will be asked to complete two additional questionnaires;
· Our names and all identifying information will be removed and that we will not be identifiable in the final report;
· My/my child’s responses on the Five Factor Personality Inventory – Children only will be given to Pro-Ed Inc. (the publishers of the scale), together with my/my child’s age and gender. No identifying information will be provided to Pro-Ed, and
· We may change our minds about participating in this part of the study at any time and that this will in no way affect our access to the services we are receiving or our involvement in the other part of the project.
Parent’s Name: _______________________________________________ Signed__________________________________________ Date________________ Child’s Name: ___________________________________________________ Signed__________________________________________ Date________________
Witness: Signature: Date:

Appendix 4: Snowball Letter
237
Diabetes Research into Adolescent Transit ions
Does your child have diabetes? Ever wondered why some young people, aged 8 to 19 years, seem to manage their diabetes better than others? We have too and so we have just started a three year study which we hope will help us answer that question. We hope that what we find out will make living with diabetes easier for young people and their families. But we need the help of young people with diabetes and their families to do this. The person who gave you this letter has already joined our study and has offered to pass this letter on to other people who might also like to be involved. If you are interested in helping us answer this very important question, we would like to invite you and your family to be part of this exciting new study being conducted by the University of Western Sydney and The University of Sydney. If you agree to participate, a member of our research team will visit you just once a year (for the next three years) at a time and place that is convenient to you. At this visit we will collect a finger prick sample of blood for an A1c and ask you to complete some questionnaires about your knowledge of diabetes and how you are coping with its effect on your life. If you are the young person with diabetes these questionnaire take about 1 hour to complete. If you are the mum or dad, your questionnaires will take about 20 minutes to complete. As well, we would contact you every few months to see how you are going. This would be a brief telephone call. If you do join the study, you should know that you may leave it at any time you wish, that anything you say will be confidential and that no-one will be identifiable in the results we publish. Also, all families who take part in the study will be sent a report of the final results. If you would like to find out more about this study please contact Dr Jane Overland on 02 9515 5930 or email us at [email protected]. The DRAT study team. (Assoc. Prof.) Christine Johnston (Dr) Lorraine Smith (Dr) Jane Overland Mr Daniel Waller Ms Kristy Hatherly Ms Linda Singh Diabetes Centre, RPA Sydney University University of Western Sydney

Appendix 5: Personality Study Information Sheet and Consent Form
238
Diabetes Research into Adolescent Transit ions
Diabetes Research into Adolescent Transitions Project: Additional measure
This is an update to let you know that we would like to include one more questionnaire to the DRAT study. This measure has been added to ensure that we are considering everything that might be important. This is because research on how people manage their diabetes is beginning to suggest that personality may be critical. We are therefore keen to look into this further. To explore the effect of personality, we will be asking the young person with diabetes to fill in the Five Factor Personality Inventory for Children (FFPI-C) when we come to visit you. We also want to send you these questionnaires if you have already received your initial annual interview. These can be completed and sent back to us in the provided reply paid envelope. The FFPI-C will be included in each round of data collection for three years. We estimate that completing this questionnaire will take no more than 20 minutes in all. As with the other measures in the study, your responses will be anonymous. No names or identifying information will be included in the final report. You may, of course, withdraw from the study at any time The Five Factor Personality Inventory for Children (FFPI-C) is new scale that, as far as we are aware, has not been used in Australia before. In order to help test its usefulness we have agreed to pass on the responses to this scale only to Pro-Ed Inc. who publish it. They will not receive any identifying information and will be given responses to the questions on the scale, the gender of the person and age only. This approach helps us create better, more reliable psychological scales. The anonymity and confidentiality of participants will be secure at all times. If you are interested in being involved in this part of the study please complete the consent form on the following page. If you have any questions about this part of the study please do not hesitate to call Assoc. Prof. Christine Johnston on (02) 4736 0782, Dr Lorraine Smith on (02) 9036 7079 or Dr Jane Overland on (02) 9515 5930 if you have any concern or questions regarding the project. Thank you for considering this request and for your support of the Diabetes Research into Adolescent Transitions Project. Yours faithfully,
Daniel Waller
NOTE: This study has been approved by the University of Western Sydney Human Research Ethics Committee. The approval number is HREC 06 - 011. If you have any complaints or reservations about the ethical conduct of this research, you may contact the Ethics Committee through the Research Ethics Officers (Tel.: 4736 0883 or 4736 0884). Any issues you raise will be treated in confidence and investigated fully, and you will be informed of the outcome.

Appendix 5: Personality Study Information Sheet and Consent Form
239
Diabetes Research into Adolescent Transit ions
Consent to complete additional scales in the project:
If you are willing for you/your child to complete the additional scale in the Diabetes Research into Adolescent Transitions Project please complete the following: We understand that: I/my child will be asked to complete two additional questionnaires; Our names and all identifying information will be removed and that we will not
be identifiable in the final report; My/my child’s responses on the Five Factor Personality Inventory – Children only will be given to Pro-Ed Inc. (the publishers of the scale), together with my/my child’s age and gender. No identifying information will be provided to Pro-Ed, and We may change our minds about participating in this part of the study at any time and that this will in no way affect our access to the services we are receiving or our involvement in the other part of the project.
Parent’s Name: _______________________________________________ Signed__________________________________________ Date________________ Child’s Name: ___________________________________________________ Signed__________________________________________ Date________________ Witness: Signature: Date:
Appendix 6: FFPI-C Instructions
240
Diabetes Research into Adolescent Transit ions
Instructions for Five Factor Personality Inventory – Children (FFPI-C) and Diabetes Management Questionnaire (DMQ)
Dear Family, We would like to thank you again for your help with our research project. Please find attached the Five Factor Personality Inventory – Children (FFPI-C). We would appreciate it if the young person with diabetes in your household could complete this questionnaire. The questionnaire is relatively easy to complete but just in case we thought we should include some instructions. Completing the Five Factor Personality Inventory – Children (FFPI-C) The FFPI-C is a little different to the other questionnaires that you would have completed. The questionnaire consists of 75 items with each item having two statements that are the opposite of each other. There are five circles between these statements. This allows you to choose the one that is closest to what you think and make a decision on how much you agree with it. If you agree with a sentence, colour in the circle closest to that sentence. If you somewhat agree, colour in the second closest circle to that sentence. If unable to decide between sentences, colour in the middle circle. There are no right or wrong answers but try to make a decision and use the middle circle as little as possible. In the example below the person has indicated that they somewhat agree with the statement “I think dogs are nice”.
Example: I think dogs are nice. ○ ● ○ ○ ○ I think dogs are scary. Please complete all of the questions on the inside two pages of the FFPI-C. Please do not pull the questionnaire apart or rip along the perforated lines. Parents helping children with questionnaires Children may need help with understanding the questions and parents should give as much help as they feel the child needs. Some children may find it easier if the statements are read to them. It is important, however, that they say what they really think. For this reason, there is no need to spend a lot of time thinking about the answer. Usually, it is the first answer which is the one that they believe. Returning completed questionnaires We have included a reply paid envelope to allow you to return the responses and consent form to our DRAT! Office. Please make sure you have your name on the questionnaire so that the answers can be properly entered with the rest of your responses on the other questionnaires you have been completing for us.
Important: Consent Form Please note that we need you to read through and sign the attached information and consent form before you complete these questionnaires. This is very important as we will not be able to use any information we receive from you unless this is done.

Appendix 7: Excluded Measures
241
List of Excluded Measures
Self-Description Questionnaires (SDQ I, SDQ II and SDQ III)
Self-concept was measured using the Self-Description Questionnaire (SDQ I) for
children (equivalent to grades 6 and under), the Self-Description Questionnaire (SDQ
II) for adolescents (equivalent to grades 7 - 12), and the Self-Description Questionnaire
(SDQ III) for young adults (equivalent to those who’ve finished high-school) (Marsh,
1988, 1990a, 1990b).
The Self-Description Questionnaires were excluded from analyses for a number of
reasons. First, the three scales (SDQ I, SDQ II and SDQ III) are difficult to compare
across age groups as they use different items and measure different higher-order
factors. Second, the items from the Self-Description Questionnaires could be
considered redundant when measuring personality as they measure some related
domains. Finally these scales were gauged to be predictors rather than outcomes of
self-management and hence were superfluous to the included battery of measures.
Michigan Diabetes Research and Training Centre’s Brief Diabetes Knowledge Test
Child and parental knowledge about type I diabetes was assessed using a modified
version of the Michigan Diabetes Research and Training Centre’s Brief Diabetes
Knowledge Test which is downloadable from the internet (Michigan Diabetes Research
Training Center). The test is a 23-item, multiple-choice measure composed of two
components; a 14-item general diabetes test, and a 9-item insulin-use subscale. The
knowledge test was excluded from analyses based on an extreme ceiling effect
present in scores. This provided little variance to analyse any statistical effects of
knowledge.
Self-Efficacy for Diabetes Scale (SEDS)
The participant’s confidence in their ability to manage their diabetes was measured
using the Self-Efficacy for Diabetes Scale (SEDS) (Grossman, Brink, & Hauser, 1987).
This measure includes 35 items that index self-efficacy in diabetes-specific (24 items),
medical (5 items), and general (6 items) situations. Again, scores showed a strong
ceiling effect and this hampered statistical analyses.

Appendix 8: Personal Information Form
242
PERSONAL INFORMATION FORM PART 1: Information about you, the person with Diabetes
1.Name: _____________________________________________________________ 2.Preferred Contact Details _______________________________________________
Email: _______________________________________________________________
Phone: ______________________________________________________________ 3. Date of Birth: _______________________________________________________ 4. Are you ………………………………… Male Female
5. How old were you when you were diagnosed with diabetes? __years ___months
6. How old are you now? ......................................................... ___________years__________months
7. How many brothers and sisters do you have? … brothers sisters
8. Are you the: a. eldest
b. 2nd eldest
c. 3rd eldest
d. 4th eldest
e. Other (please specify) ____________________________________
9. Does anyone else in your family have Type 1 diabetes? …….No Yes
If Yes please specify: a. Mother
b. Father
ID Number: ________Date:______ Researcher: ___________________
1
Appendix 8: Personal Information Form
243
c. Brother or Sister
d. Grandparent
e. Other (please specify) ______________
10. Are you currently studying? …………………………. No Yes
If Yes, please specify: a. Full time
b. Part time
11. If you are aged 12 or under, are you cared for by someone other than your parents after school hours, e.g. after school care? ………………………..
No Yes
If Yes, please specify ________________________________________
12. Are you currently working …………………No Yes
If Yes, please specify the number of hours per week …….
13. Do you participate in regular sport or exercise? … No Yes
If Yes, please specify the type of sport or exercise and how many hours a week you do that sport or exercise:
Type:________________________________hours/week
Type:________________________________hours/week
Type:________________________________hours/week
Type:________________________________hours/week

Appendix 8: Personal Information Form
244
14. Do you have any of the following problems with your health?
a. Coeliac disease No Yes Don’t Know
b. Addison’s disease No Yes Don’t Know
c. Thyroid disease No Yes Don’t Know
d. Rheumatoid arthritis No Yes Don’t Know
e. Asthma No Yes Don’t Know
f. Other (please specify) ____________________________________
15. Have you used a diabetes chat room in the last 12 months, e.g. Reality Check? No Yes 16. Have you attended a diabetes kids’ camp in the last 12 months? No Yes If Yes, please mark the line below with an X indicating how helpful you
found attending the camp. Very helpful _______________________________ Not at all helpful 17. Have you attended a diabetes support program in the last 12 months? No Yes If Yes, please mark the line below with an X indicating how helpful you found the program. Very helpful ______________________________ Not at all helpful 18. Are you registered with the National Diabetes Supply Scheme? No Yes

Appendix 8: Personal Information Form
245
19. Where do you get your diabetes supplies from?
Please mark an X in the appropriate boxes
Insulin Syringes, pen or pump
Blood glucose strips
a. Pharmacy/Chemist
b. Diabetes Australia
c. Diabetes Clinic
d. Mail Order
e. Other (Please specify)

Appendix 8: Personal Information Form
246
THIS SECTION TO BE COMPLETED BY PARENTS
PART 2: Information about the MOTHER of the family 20. Mother’s age 21. Mother’s ethnic origin ________________________________________________ 22. Mother’s highest educational level achieved a. Primary
b. Secondary
c. TAFE or certificate qualification
d. Tertiary
23. Mother’s work status - currently working ..………… No Yes
If Yes, please specify: a. Full time
b. Part time
24. Mother’s educational status - currently studying..…….. No Yes
If Yes, please specify: a. Full time
b. Part time
PART 3: Information about the FATHER of the family 25. Father’s age 26. Fathers ethnic origin _________________________________________________ 27. Father’s highest educational level achieved a. Primary
b. Secondary
c. TAFE or certificate qualification

Appendix 8: Personal Information Form
247
d. Tertiary
28. Father’s work status - currently working ..….………………..No Yes
If Yes, please specify: a. Full time
b. Part time
29. Father’s educational status - currently studying ..…………. No Yes
If Yes, please specify : a. Full time
b. Part time
PART 4: Information about the house in which you live 30. How many people aged 18 and over live in your house? …………………….. 31. How many people under the age of 18 live in your house? ………………….. 32. Is anyone in your house a member of JDRF? ……………..No Yes 33. Is anyone in your house a member of Diabetes Australia? …No Yes 34. What is your household’s annual income?
a. Less than $31,199
b. $31,200 to $51,999
c. $52,000 to $83,199
d. More than $83,200

Appendix 9: Annual Data Collection Form
248
ANNUAL DATA COLLECTION FORM PART 1: Diabetes Control
Blood Collected for A1c……………………………….Result % 1. Unconscious hypo in the last 3 months No Yes
2. No. of hypos (bsl <3) in the last 2 weeks……………….
3. Admission to hospital with hyperglycaemia in the last 3 months No Yes
4. No. of admissions to hospital for diabetes (hyper- or hypo-glycaemia or stabilization) in last 3 months………………….
5. No. of days off school or work in the last 3 months……………………………
PART 2: Diabetes Management 6. Diabetes Treatment: injections pump
7. If using injections: a. total daily dose (units) prescribed at last review…………..
b. no. of injections prescribed at last review……………………
c. carbohydrate exchanges… variable fixed
d. if fixed, total no. of exchanges a day………………………..
e. meal insulin………………..variable fixed
5 ID Number: ________Date:______ Researcher: ___________________
Time Ins 1 Ins 2 I Ins3
Morning M/T Lunch A/T Dinner Supper

249
Type (name) of Insulin: 1 = 2= 3 = 8. If using a pump: a. total basal dose (units) prescribed at last
review…………
b. insulin to carb ratio prescribed at last review……………………1 unit / grams carb
units/exchange
c. carbohydrate exchanges.. variable fixed
d. if fixed, total no. of exchanges a day…..
e. meal insulin………...variable fixed
All participants: 9. In the last 2 weeks, has the participant taken their insulin or adjusted their insulin as
prescribed: a. all of the time
b. most of the time
c. some of the time
d. none of the time
10. If less than all of the time, please make a comment________________________ _________________________________________________________________ _________________________________________________________________ _________________________________________________________________
11. In the last 2 weeks, has the participant missed injections of insulin or bolus doses: a. all of the time
b. most of the time
c. some of the time
d. none of the time
Time Insulin

250
12. If more than none of the time please make a comment _____________________ _________________________________________________________________ _________________________________________________________________ 13. No. of blood glucose tests over last 2 weeks……Estimated Actual Are blood glucose tests performed …… Randomly [ ] Before meals [ ] After meals [ ]
Paired (before and after a meal) [ ] Before bed [ ] Overnight [ ] To confirm hypo [ ] Other [ ]
If other, please make a comment as to when blood glucose tests are performed and why ______________________________________________________________
_________________________________________________________________ _________________________________________________________________ 14. No. of booked appointments for diabetes review in the last 3 months…….. 15. No. of attendances at diabetes review appointments in last 3 months…… 16. Date(s) of diabetes review(s) in next 3 months (appointment type(s) to be noted): ____________________________________________________________________ ____________________________________________________________________ ____________________________________________________________________ ____________________________________________________________________

251
PART 3: Model of Care 17. Health care professionals seen in the last 12 months HP Attended Wanted Helpful Service type hospital/community Service Type Who attended consult (mins)
to attend
GP [ ] Y/N Y/N child/mother/father
Endocrinologist [ ] Y/N Y/N private /public hospital/community paediatric/adult child/mother/father
Paediatrician [ ] Y/N Y/N private/public hospital/community child/mother/father
Diabetes educator [ ] Y/N Y/N private/public hospital/community paediatric/adult child/ mother/father
Nurse [ ] Y/N Y/N private/public hospital/community paediatric/adult child/ mother/father
Dietician [ ] Y/N Y/N private/public hospital/community paediatric/adult child/ mother/father
Social worker [ ] Y/N Y/N private/public hospital/community paediatric/adult child/ mother/father
Psychologist [ ] Y/N Y/N private/public hospital/community paediatric/adult child/ mother/father
Pharmacist [ ] Y/N Y/N private/public hospital/community paediatric/adult child/ mother/father
Other (please specify)
Attended / wanted to attend Y/N Helpful Y/N
Service Type – private or public; Hospital/Community
Who attended: child/mother/father
Consult (mins)

252
18. Time travelled to diabetes specialist services: a. < 1 hour
b. 1-2 hours
c. 2.1-4 hours
d. > 4 hours
19. Do you have access to 24 hour phone or email advice? No Yes
20. Do you have a team meeting with the people caring for you/your child? a. always Comment: ________________
b. sometimes __________________________
c. never __________________________
21. Is there one professional who takes responsibility for looking after your/your child’s needs? a. no Comment: _________________
b. not sure __________________________
c. yes __________________________
(If yes, who is this person (Diabetes educator etc)?
22. Do you feel that the professionals you see about your/your child’s diabetes know what the others are saying to you?
a. always Comment: ____________________
b. sometimes ____________________________
c. never ____________________________
23. Do you feel that the professionals you see understand your needs and lifestyle? a. always Comment: ____________________
b. sometimes ______________________________
c. never ______________________________

253
24. Do you feel that the professionals you see take your views and needs into account when deciding on treatment? a. always Comment: ___________________
b. sometimes ____________________________
c. never ____________________________
25. Who makes the decisions about what should happen with the management of your/your child’s diabetes?
a. me/my family Comment: _______
b. health care professionals ________________
c. joint decision between me/my family _________________ and health care professionals
26. Do staff really listen to your concerns? a. yes Comment: ____________________
b. to some extent _____________________________
c. no _____________________________
27. Are these concerns taken into account when decisions are made about your/your child’s treatment/management of diabetes?
a. yes Comment:_____________________
b. to some extent _____________________________
c. no _____________________________
28. Do you find that the professionals/service is able to change to meet your changing needs? a. yes Comment: _____________________
b. to some extent ______________________________
c. no ______________________________

254
29. Are you given information about other services and community resources? a. yes Comment: _____________________
b. to some extent ______________________________
c. no _______________________________
30. Are you given opportunities to meet other families/individuals with Type 1 diabetes? a. yes Comment: _____________________
b. to some extent ______________________________
c. no ______________________________
31. Do you think that your language and cultural needs are taken into account as well as they might? a. yes Comment: ____________________
b. to some extent _____________________________
c. no _____________________________ PART 4: Details for next contact in 3 months Preferred day and time of contact: _________________________________________ Preferred contact number: _______________________________________________

Appendix 10: Quarterly Review Form
255
QUARTERLY REVIEW FORM PART 1: Diabetes Control
1. Unconscious hypo in the last 3 months No Yes
2. No. of hypos (bsl <3) in the last 2 weeks……………….
5. Admission to hospital with hyperglycaemia in the last 3 months No Yes
6. No. of admissions to hospital for diabetes (hyper- or hypo-glycaemia or stabilization) in last 3 months………………….
5. No. of days off school or work in the last 3 months…………………………… PART 2: Diabetes Management 6. Diabetes Treatment: ………………………….. injections pump
7. If using injections: a. total daily dose (units) prescribed at last review…..
b. no. of injections prescribed at last review………
c. carbohydrate exchanges……variable fixed
d. if fixed, total no. of exchanges
e. meal insulin variable fixed
Type (name) of Insulin: 1 = 2= 3 =
ID Number: ________Date:______ Researcher: ___________________
11
Time Ins 1 Ins 2 I Ins3
Morning M/T Lunch A/T Dinner Supper

Appendix 10: Quarterly Review Form
256
8. If using a pump: a.total basal dose (units) prescribed at last review……
b. insulin to carb ratio prescribed at last review…………………………1 unit / grams carb
units/exchange
c. carbohydrate exchanges….. variable fixed
d. if fixed, total no. of exchanges a day.
e. meal insulin……... variable fixed
All participants: 9. In the last 2 weeks, has the participant taken their insulin or adjusted their insulin
as prescribed: a. all of the time
b. most of the time
c. some of the time
d. none of the time
10. If less than all of the time, please make a comment ________________________ _________________________________________________________________ _________________________________________________________________ _________________________________________________________________ 11. In the last 2 weeks, has the participant missed injections of insulin or bolus doses: a. all of the time
b. most of the time
c. some of the time
d. none of the time
12. If more than none of the time please make a comment ____________________ _________________________________________________________________ _________________________________________________________________
Time Insulin

Appendix 10: Quarterly Review Form
257
13. No. of blood glucose tests over last 2 weeks…Estimated Actual
Are blood glucose tests performed …… Randomly [ ] Before meals [ ] After meals [ ]
Paired (before and after a meal) [ ] Before bed [ ] Overnight [ ] To confirm hypo [ ] Other [ ]
If other, please make a comment as to when blood glucose tests are performed and why ___________________________________________________________
_________________________________________________________________ _________________________________________________________________ 14. No. of booked appointments for diabetes review in the last 3 months……… 15. No. of attendances at diabetes review appointments in last 3 months…….. 16. Date(s) of diabetes review(s) in next 3 months (appointment type(s) to be noted): _________________________________________________________________ _________________________________________________________________ _________________________________________________________________ _________________________________________________________________ PART 3: Details for next contact in 3 months Preferred day and time of contact __________________________________________ Preferred contact number ________________________________________________

Appendix 11: Diabetes Family Responsibility Questionnaire
258
DIABETES FAMILY RESPONSIBILITY QUESTIONNAIRE: DFRQ
Instructions: Below are different tasks or situations that relate to diabetes management in your family. Fill in the circle which best describes the way each task or situation is handled in your family.
Parent(s) take or initiate
responsibility almost all of
the time
Parent(s) and child
share responsibility for this about
equally
Child takes or initiates
responsibility almost all of
the time
1.
Remembering day of clinic appointment.
1 O O O
1
2. Telling teachers about diabetes.
2 O O O
2
3. Remembering to take morning or evening injection.
3 O O O
3
4.
Making appointments with dentists and other doctors.
4 O O O
4
5.
Telling relatives about diabetes.
5 O O O
5
6. Taking more or less insulin according to results of blood sugar or urine tests.
6 O O O
6
7.
Noticing differences in health, such as weight changes or signs of an infection.
7 O O O
7
8.
Telling friends about diabetes. .
8 O O O
8
9. Noticing the early signs of an hypo.
9 O O O
9
10. Giving insulin injections.
10 O O O
10
11
. Deciding what should be eaten when family has meals out (restaurants, friend’s home).
11 O O O 11
12 .
Examining feet and making sure shoes fit properly.
12 O O O 12
ID Number: ________Date:______ Researcher: ___________________
2

Appendix 11: Diabetes Family Responsibility Questionnaire
259
Parent(s) take or initiate
responsibility almost all of
the time
Parent(s) and child
share responsibility for this about
equally
Child takes or initiates
responsibility almost all of
the time
13.
Carrying some form of sugar in case of an hypo.
13 O O O
13
14.
Explaining absences from school to teachers or other school personnel.
14 O O O
14
15.
Rotating injection sites.
15 O O O
15
16. Checking expiration dates on medical supplies.
16 O O O
16
17.
Remembering times when blood sugar or urine should be tested.
17 O O O
17

Appendix 12: Depression, Anxiety, Stress Scales
260
DEPRESSION, ANXIETY, STRESS SCALES: 21 ITEM SHORTFORM: (DASS)
Instructions: Please read each statement and fill in the circle which indicates how much the statement applied to you OVER THE PAST WEEK. There are no right or wrong answers. Do not spend too much time on any statement.
Did not
apply to me at all
Applied to me
to some
degree, or
some of the time
Applied to me a
considerable degree, or a good part of
the time
Applied to me very
much, or
most of the time
1.
I found it hard to wind down.
1 O O O O
1
2. I was aware of dryness of my mouth.
2 O O O O
2
3. I couldn’t seem to experience any positive feeling at all.
3 O O O O
3
4.
I experienced breathing difficulty (eg. Excessively rapid breathlessness in the absence of any physical exertion).
4 O O O O
4
5 .
I found it difficult to work up the initiative to do things.
5 O O O O
5
6. I tended to over-react to situations.
6 O O O O
6
7. I experienced trembling (eg. In the hands).
7 O O O O
7
8. I felt that I was using a lot of nervous energy..
8 O O O O
8
9. I was worried about situations in which I might panic and make a fool of myself.
9 O O O O
9
10.
I felt that I had nothing to look forward to.
10 O O O O
10
11. I found myself getting agitated.
11 O O O O
11
12. I found it difficult to relax.
12 O O O O
12
ID Number: _______Date:______ Researcher: ___________________
8

Appendix 12: Depression, Anxiety, Stress Scales
261
Did not
apply to me at all
Applied to me
to some
degree, or
some of the time
Applied to me a
considerable degree, or a good part of
the time
Applied to me very
much, or
most of the time
13.
I felt down-hearted and blue.
13 O O O O
13
14.
I was intolerant of anything that kept me from getting on with what I was doing.
14 O O O O
14
15.
I felt I was close to panic.
15 O O O O
15
16.
I was unable to become enthusiastic about anything.
16 O O O O
16
17.
I felt I wasn’t worth much as a person.
17 O O O O
17
18.
I felt that I was rather touchy.
18 O O O O
18
19. I was aware of the action of my heart in the absence of physical exertion (eg. Sense of heart rate increase, heart missing a beat).
19 O O O O
19
20.
I felt scared without any good reason. .
20 O O O O
20
21
. I felt that life was meaningless.
21 O O O O
21

Appendix 13: DASS 21 Normative Sample Means and Standard Deviations, by Sex
262
DASS 21 Normative Sample Means and Standard Deviations, by Sex
Sex Depression
Anxiety Stress
Mean Std.
Dev
Mean Std.
Dev
Mean Std.
Dev
Males (n = 1044) 6.55 7.01 4.60 4.80 9.93 7.66
Females (n = 1870) 6.14 6.92 4.80 5.03 10.29 8.16
Overall (n = 2914) 6.34 6.97 4.70 4.91 10.11 7.91
(Lovibond & Lovibond, 1995a, p.29, Table 10)

Appendix 14: DASS Z Scores Conversions
263
DASS 21 Z score conversions
Scale Score Z Score
Depression Anxiety Stress
0 1 2 3 4 5 6 7 8 9
10 11 12 12 14 15 16 17 18 19 20 21 22 23 24 25 26 27 28 29 30 31 32 33 34 35 36 37 38 39 40 41 42
-0.91 -0.77 -0.62 -0.48 -0.34 -0.19 -0.05 0.09 0.24 0.38 0.53 0.67 0.81 0.96 1.10 1.24 1.39 1.53 1.67 1.82 1.96 2.10 2.25 2.39 2.53 2.68 2.82 2.96 3.11 3.25 3.39 3.54 3.68 3.82 3.97 4.11 4.26 4.40 4.54 4.69 4.83 4.97 5.12
-0.96 -0.75 -0.55 -0.35 -0.14 0.06 0.26 0.47 0.67 0.88 1.08 1.28 1.49 1.69 1.89 2.10 2.30 2.51 2.71 2.91 3.12 3.32 3.52 3.73 3.93 4.13 4.34 4.54 4.75 4.95 5.15 5.36 5.56 5.76 5.97 6.17 6.37 6.58 6.78 6.99 7.19 7.39 7.60
-1.28 -1.15 -1.03 -0.90 -0.77 -0.65 -0.52 -0.39 -0.27 -0.14 -0.01 0.11 0.24 0.37 0.49 0.62 0.74 0.87 1.00 1.12 1.25 1.38 1.50 1.63 1.76 1.88 2.01 2.14 2.26 2.39 2.51 2.64 2,77 2.89 3.02 3.15 3.27 3.40 3.53 3.65 3.78 3.91 4.04
(Lovibond & Lovibond, 1995a, p.42, Table 14)

Appendix 15: Coping with a Disease Inventory
264
COPING WITH A DISEASE INVENTORY: CODI
Instructions: Think of situations when you have been bothered or stressed because of your diabetes. Below you will find a list of ways in which young people may deal with their feelings in these situations. Please tell us how often you usually do the things or have these kinds of thoughts related to your diabetes by filling in the appropriate circle.
NEVER ALWAYS
1.
I am able to manage my diabetes.
1 O O O O O
1
2. I have got used to my diabetes.
2 O O O O O
2
3. I cope well with my diabetes.
3 O O O O O
3
4. I accept my diabetes.
4 O O O O O
4
5. I take my diabetes easy.
5 O O O O O
5
6. I face my situation with humour.
6 O O O O O
6
7. I try to ignore my diabetes.
7 O O O O O
7
8. I pretend to be all right. .
8 O O O O O
8
9. I try to forget my diabetes.
9 O O O O O
9
10. I think about my diabetes.
10 O O O O O
10
11. I believe that faith in God helps me.
11 O O O O O
11
12. I pray that my diabetes will go away.
12 O O O O O
12
13. I learn as much as possible about my diabetes.
13 O O O O O
13
14. I tell myself that even famous people have diabetes.
14 O O O O O
14
ID Number: ______Date:______ Researcher: ___________________
7
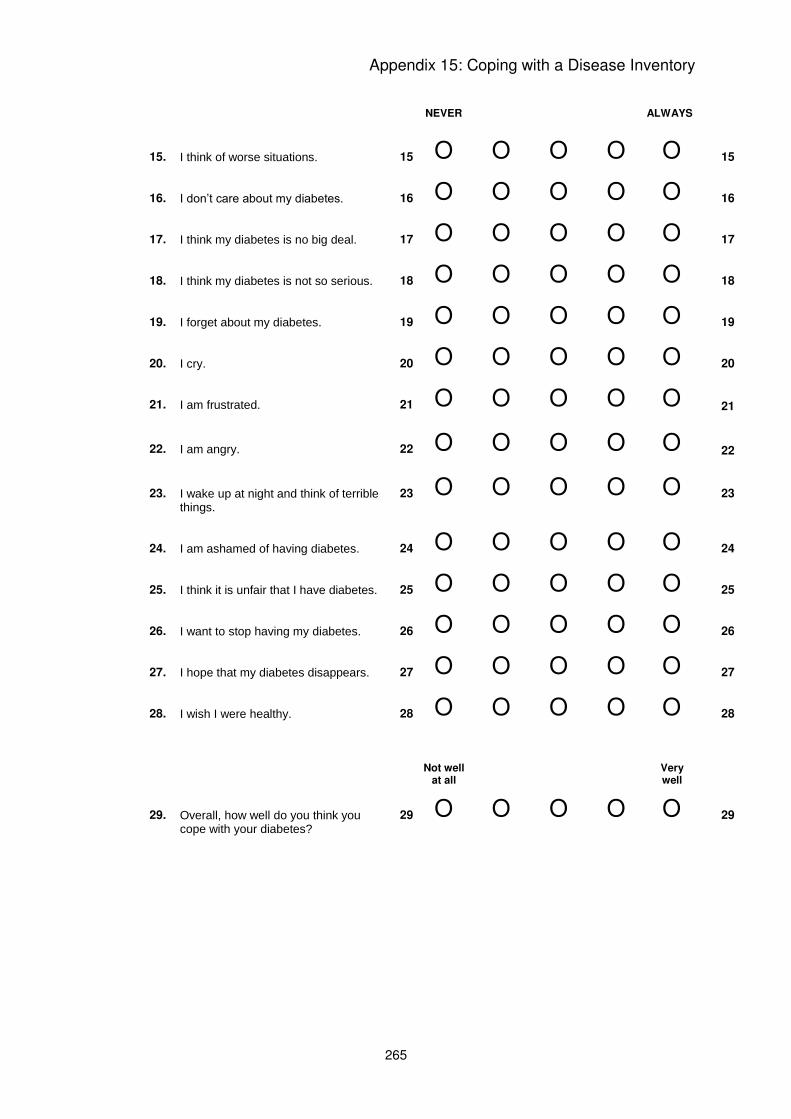
Appendix 15: Coping with a Disease Inventory
265
NEVER
ALWAYS
15.
I think of worse situations.
15 O O O O O
15
16. I don’t care about my diabetes.
16 O O O O O
16
17. I think my diabetes is no big deal.
17 O O O O O
17
18. I think my diabetes is not so serious.
18 O O O O O
18
19. I forget about my diabetes.
19 O O O O O
19
20. I cry.
20 O O O O O
20
21. I am frustrated.
21 O O O O O
21
22. I am angry.
22 O O O O O
22
23. I wake up at night and think of terrible things.
23 O O O O O
23
24.
I am ashamed of having diabetes.
24 O O O O O
24
25. I think it is unfair that I have diabetes.
25 O O O O O
25
26. I want to stop having my diabetes.
26 O O O O O
26
27. I hope that my diabetes disappears.
27 O O O O O
27
28. I wish I were healthy.
28 O O O O O
28
Not well at all Very
well
29.
Overall, how well do you think you cope with your diabetes?
29 O O O O O
29

Appendix 16: “Thank you” Letter for Postal Participation
266
Diabetes Research into Adolescent Transitions
c/- Assoc. Prof. Christine Johnston University of Western Sydney Locked Bag 1797 Penrith South DC, NSW, 1797
Dear Family, We would like to thank you again for agreeing to participate in the Diabetes Research into Adolescent Transitions Project. We realize that for some families, like yourselves, it is more convenient to complete the questionnaires in your own time at home and then post them in the reply paid envelope provided. We appreciate the time you will take and look forward to receiving your views and comments. Included in this package are a number of questionnaires which are related to insert name’s knowledge of diabetes and how he/she is coping with its effects on his/her life. We anticipate this should take no longer than one hour to complete. Parents are also asked to complete some questionnaires based on their knowledge of diabetes and how involved they are in managing their child’s diabetes. This should take no longer than 20 minutes to complete. We are also collecting some general information about your family and the care and support you are receiving from health professionals. Should you feel that any of the questions are too personal or sensitive you need not, of course, answer them. The reason we are collecting this type of information is that previous studies have shown that many of these factors play an important role in determining how children and young people manage their diabetes. Finally, we are hoping insert name can provide us with a small blood sample to be taken for analysis of the blood glucose level. The directions for carrying out this task, together with the pipette and vial are included in this letter. The attached table will provide you with an overview of the questionnaires and could be used as a checklist to ensure that we will receive all the information, views and opinions from insert name and your family. If you have any queries about the questionnaires please do not hesitate to contact me and you are also welcome to contact either Assoc. Prof. Christine Johnston on 02 4736 0782, Dr Lorraine Smith on 02 9036 7079 or Dr Jane Overland on 02 9515 5930 if you have any concerns or questions regarding the project. Please be reassured that all responses will be kept confidential and no names will be used in any reports coming from the project. We appreciate you taking the time to participate in this important research project and we look forward to meeting with you again soon. Yours Sincerely, On behalf of the research team
Assoc. Prof. Christine Johnston Dr. Lorraine Smith Dr. Jane Overland University of Western Sydney The University of Sydney Diabetes Centre, RPAH QUESTIONNAIRES FOR DRAT! PROJECT All questionnaires have instructions at the top to explain what to do. When you choose your answer you can tick the circle you want rather than colour it. This may be quicker for you.

Appendix 17: List of Questionnaires for DRAT Postal Participation
267
Diabetes Research into Adolescent Transitions Questionnaire Colour Comment Who will
complete Tick when completed
1 Personal Information Form
White Information about your child and family
Parents or older adolescents
2. DFRQ Pink How tasks related to Diabetes are handled in your family
Parents and child together
3. Michigan Knowledge Test
Yellow Parents/Carers – Column A: Your answer Column B: How you think your child would answer?
Parents
4. Michigan Knowledge Test
Gold The young person’s knowledge of Diabetes
Young Person
5. Annual Data Collection Form
White Information regarding Diabetes control, management and care
Parents
6. SEDS Blue How confident you are in doing some tasks.
Young Person
7. CODI Green Thoughts and feelings about coping with Diabetes
Young Person
8. DASS Grey How you are feeling in general Young Person 9. SDQ1 – For those in Primary School OR
Cream How you feel about school, yourself and family
Young Person
10 SDQ11 – For those in Secondary School or at work
Light Blue How you feel about school, yourself and family
Young Person
12. DMQ Light Blue How you feel about your
Diabetes Young Person
13. FFPI-C How you feel about yourself Young Person Blood Sample for an HbA1c
Please follow directions on the next page.
Please place all completed questionnaires and the solution with the blood sample
in the reply paid envelope provided. We very much appreciate the time you have taken to complete the questionnaires and look forward to receiving your responses.

Appendix 18: Blood Collection Instructions for Participation by Post
268
Diabetes Research into Adolescent Transitions
How to collect your blood for an HbA1c estimation
Included in this blood collecting pack is:
1. a small pipette (this is the thin glass tube attached to the bottom of this page), 2. a labelled sample pot containing a clear solution, 3. a sealable plastic pathology bag, 4. an addressed express post envelope for you to send your questionnaires and
blood sample to the DRAT Study team. Your HbA1c can be measured using a finger prick sample of blood. To collect this blood sample you need to prick your finger exactly the same way you do when you are testing your blood glucose level at home. Once you have pricked your finger, gently squeeze until a small drop of blood
forms. Remove the small pipette attached to the bottom of this letter and then place one end of the pipette into the drop of blood. The pipette will suck up the blood (you may need to tap the end of the pipette into the sample of blood several times for the pipette to become full). Once the pipette is full, open the labelled sampling pot and place the pipette in the clear solution. Now close the lid of the sample pot and shake the pot gently until the solution in the pot turns a pinkish/red colour. Lastly, place the sample pot in the plastic pathology bag provided and seal the bag.
Your sample can now be returned to the DRAT Team in the express post envelope provided. If you have any questions or concerns about collecting this blood sample please contact Dr Jane Overland on 02 9515 5930 or [email protected]. Small pipette

Appendix 19: Thank You Card
269

Appendix 20: DRAT Newsletter
270

Appendix 20: DRAT Newsletter
271

Appendix 20: DRAT Newsletter
272

Appendix 20: DRAT Newsletter
273

Appendix 21: UWS HREC – Ethics Approval
274

Appendix 21: UWS HREC – Ethics Approval
275

Appendix 21: UWS HREC – Ethics Approval
276

Appendix 22: Hunter New England HREC – Ethics Approval
277

Appendix 22: Hunter New England HREC – Ethics Approval
278

Appendix 23: Missing Data
279
Variable Year
1 Year
2 Year
3
Openness 104 104 104
Conscientiousness 104 104 104
Extraversion 104 104 104
Agreeableness 104 104 104
Emotional regulation 104 104 104
HbA1c 104 104 100
Avoidance Coping 104 102 101
Acceptance Coping 104 102 101
Depression 104 102 100
Anxiety 104 102 100
Stress 104 102 100
No. Blood glucose tests 104 100 103
No. Hypos 104 100 99
Variable Year
1 Year
2 Year
3
No. Unconscious Hypos 104 102 100
No. Hospitalisations 104 102 100
No. Missed Appointments 104 102 98
No. Appointments 104 102 98
Insulin adherence 103 102 100
Gender 104 104 104
Age 104 104 104
Duration of diabetes 104 104 104
Responsibility for care 104 102 101
Geographical location 104 104 104
Ethnicity 94 94 94
Treatment modality 104 104 104
Income 97 97 97

Appendix 23: Missing Data
280
Missing Quarterly Data
Variable Quarterly 1 Quarterly 2 Quarterly 3
No. BGL tests 102 100 96
No. Hypos 100 100 96
Unconscious hypos 101 102 97
No. Hospitalisations 101 102 96
No. appointments 101 102 96
Missed appointments 101 102 96
Insulin adherence 100 100 96
Treatment modality 100 100 96
Variable Quarterly 1 Quarterly 2 Quarterly 3
No. BGL tests 96 76 43
No. Hypos 96 76 43
Unconscious hypos 96 76 43
No. Hospitalisations 96 76 43
No. appointments 96 76 43
Missed appointments 95 76 43
Insulin adherence 95 76 43
Treatment modality 95 76 43
* All quarterly information was discounted from analyses based on missing data
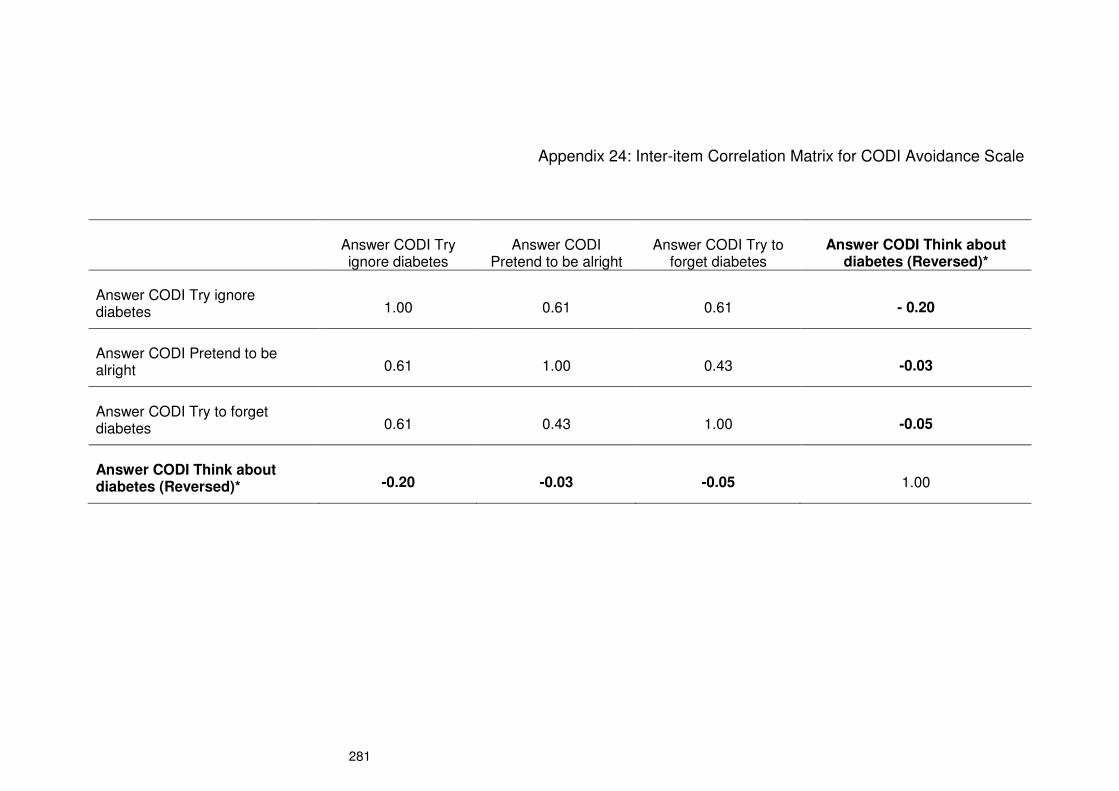
281
Appendix 24: Inter-item Correlation Matrix for CODI Avoidance Scale
Answer CODI Try ignore diabetes
Answer CODI Pretend to be alright
Answer CODI Try to forget diabetes
Answer CODI Think about diabetes (Reversed)*
Answer CODI Try ignore diabetes 1.00 0.61 0.61 - 0.20
Answer CODI Pretend to be alright 0.61 1.00 0.43 -0.03
Answer CODI Try to forget diabetes 0.61 0.43 1.00 -0.05
Answer CODI Think about diabetes (Reversed)* -0.20 -0.03 -0.05 1.00

282
Appendix 25: Item-total Statistics for CODI Avoidance
Scale Mean if Item Deleted
Scale Variance if Item Deleted
Corrected Item-Total Correlation
Squared Multiple Correlation
Cronbach's Alpha if Item Deleted
Answer CODI Try ignore diabetes
7.61 7.48 0.72 0.55 0.41
Answer CODI Pretend to be alright
7.23 8.65 0.51 0.38 0.57
Answer CODI Try to forget diabetes
7.39 9.00 0.52 0.38 0.56
Answer CODI Think about diabetes (Reversed)*
7.36 12.86 0.12 0.06 0.79
* = deleted item

283
Appendix 26: Exploratory Factor Analysis of CODI Avoidance Scale
Factor loading Eigenvalues % of Variance Cumulative %
Answer CODI Try ignore diabetes
0.96 2.13 53.25 53.25
Answer CODI Pretend to be alright
0.64 0.99 24.92 78.16
Answer CODI Try to forget diabetes
0.64 0.57 14.21 92.37
Answer CODI Think about diabetes (Reversed)*
0.15 0.31 7.63 100.00
Extraction method: Unweighted least squares
* = deleted item

284
Appendix 27: Baseline Descriptives for Study Variables
Variable Data type n Min Max Mean Std. Dev Variance Skew
S.E. Skew Kurtosis
S.E. Kurtosis
K-S statistic
Age Continuous 104 8.17 19.08 12.15 2.77 7.67 0.30 0.24 -0.81 0.47 0.13**
Duration of diabetes Continuous 104 0.33 14.50 4.05 3.21 10.33 1.21 0.24 1.13 0.47 0.12**
Responsibility Continuous 104 18.00 49.00 32.31 5.56 30.95 0.22 0.24 0.08 0.47 0.78
Openness Continuous 104 31.00 71.00 50.76 7.74 59.85 0.21 0.24 0.09 0.47 0.08
Conscientiousness Continuous 104 26.00 67.00 49.84 7.44 55.38 -0.18 0.24 0.57 0.47 0.09
Extraversion Continuous 104 23.00 71.00 47.89 9.31 86.74 -0.01 0.24 0.18 0.47 0.06
Agreeableness Continuous 104 35.00 70.00 54.46 6.24 38.89 -0.27 0.24 0.16 0.47 0.06
Emotional regulation Continuous 104 30.00 67.00 52.35 7.66 58.60 -0.50 0.24 0.13 0.47 0.08
HbA1c Continuous 104 5.70 12.90 8.50 1.25 1.59 0.21 0.24 0.97 0.47 0.09
Avoidance Coping Continuous 104 3.00 15.00 7.17 3.44 11.84 0.59 0.24 -0.65 0.47 0.14**
Acceptance Coping Continuous 102 7.00 30.00 24.30 4.30 18.52 -0.76 0.24 0.48 0.47 0.11**
Depression Continuous 104 0.00 38.00 7.06 9.08 82.40 1.80 0.24 2.79 0.47 0.24**
Anxiety Continuous 104 0.00 36.00 7.29 8.41 70.75 1.67 0.24 2.49 0.47 0.22**
Stress Continuous 104 0.00 36.00 10.02 9.09 82.60 0.88 0.24 -0.12 0.47 0.17**
* = significant at p <0.05 ** =significant at p <0.01

285
Baseline descriptives for study variables (continued)
Variable Data type n Min Max Mean Std. Dev Variance Skew
S.E. Skew Kurtosis
S.E. Kurtosis
K-S statistic
No. BGL tests Continuous 104 6.00 295.00 73.63 34.15 1165.88 3.15 0.24 17.59 0.47 0.15**
No. Hypos Continuous 104 0.00 17.00 2.45 2.91 8.48 2.65 0.24 9.27 0.47 0.20**
No. Hospitalisations Continuous 104 0.00 1.00 0.05 0.22 0.05 4.29 0.24 16.70 0.47 0.54**
Miss Appointment Continuous 104 0.00 1.00 0.05 0.22 0.05 4.29 0.24 16.70 0.47 0.54**
No. Appointments Continuous 104 0.00 8.00 1.33 0.99 0.98 3.65 0.24 20.33 0.47 0.39**
Gender Nominal 104 N/A N/A N/A N/A N/A N/A N/A N/A N/A N/A
Treatment modality Nominal 104 N/A N/A N/A N/A N/A N/A N/A N/A N/A N/A
Ethnicity Nominal 104 N/A N/A N/A N/A N/A N/A N/A N/A N/A N/A
Unconscious Hypos Nominal 104 N/A N/A N/A N/A N/A N/A N/A N/A N/A N/A
Location Nominal 104 N/A N/A N/A N/A N/A N/A N/A N/A N/A N/A
Insulin adherence Ordinal 103 N/A N/A N/A N/A N/A N/A N/A N/A N/A N/A
Income Ordinal 97 N/A N/A N/A N/A N/A N/A N/A N/A N/A N/A
* = significant at p <0.05 ** =significant at p <0.01

Appendix 28: Frequency Distributions
286

Appendix 28: Frequency Distributions
287

Appendix 29: P-Plots
288

Appendix 29: P-Plots
289

Appendix 29: P-Plots
290

Appendix 29: P-Plots
291

Appendix 30: Bivariate Scatterplots
292

Appendix 30: Bivariate Scatterplots
293

Appendix 30: Bivariate Scatterplots
294

Appendix 31: Test-retest Correlations for BGL Tests Including Outlier
295
Spearman’s test-retest correlations for BGL tests including outlier
ρ 1st and 2nd year ρ 2nd and 3rd year ρ 1st and 3rd year
Blood glucose testing 0.55** 0.67** 0.44**
* = significant at p <0.05 ** =significant at p <0.01

Appendix 32: Correlations for BGL Testing and HbA1c Including Outlier
296
Spearman’s correlations for BGL testing and HbA1c including outlier
Year 1 BGL tests Year 2 BGL tests Year 3 BGL tests
Year 1 HbA1c -0.15 -0.12 -0.19
Year 2 HbA1c -0.08 -0.18 -0.18
Year 3 HbA1c -0.09 -0.19 -0.32**

Appendix 33: Correlations for BGL Testing and HbA1c Excluding Outlier
297
Spearman’s correlations for BGL testing and HbA1c excluding outlier
Year 1 BGL tests Year 2 BGL tests Year 3 BGL tests
Year 1 HbA1c -0.15 -0.12 -0.19
Year 2 HbA1c -0.09 -0.18 -0.18
Year 3 HbA1c -0.11 -0.19 -0.32**

Appendix 34: Participants Falling into DASS Depression Severity Categories
298
Participants falling into DASS depression severity categories
Personality Study
DASS Rating DASS Norm Year 1 Year 2 Year 3
Normal 78.00% 71.15% 74.04% 76.92%
Mild 9.00% 12.50% 9.62% 7.69%
Moderate 8.00% 5.77% 10.58% 6.73%
Severe 3.00% 5.77% 1.92% 0.96%
Extremely severe 2.00% 4.81% 1.92% 3.85%
Missing data 0.00% 0.00% 1.92% 3.85%
Participants falling into DASS anxiety severity categories
DASS Rating DASS Norm Year 1 Year 2 Year 3
Normal 78.00% 65.38% 57.69% 70.19%
Mild 9.00% 6.73% 13.46% 6.73%
Moderate 8.00% 14.42% 17.31% 5.76%
Severe 3.00% 3.85% 8.65% 9.62%
Extremely severe 2.00% 9.62% 0.96% 3.85%
Missing data 0.00% 0.00% 1.92% 3.85%
Participants falling into DASS stress severity categories
DASS Rating DASS Norm Year 1 Year 2 Year 3
Normal 78.00% 72.12% 75.00% 80.77%
Mild 9.00% 10.58% 13.46% 8.65%
Moderate 8.00% 8.65% 5.77% 3.85%
Severe 3.00% 6.73% 3.85% 2.88%
Extremely severe 2.00% 1.92% 0.00% 0.00%
Missing data 0.00% 0.00% 1.92% 3.85%

299
Appendix 35: Table of Correlations
HbA1c11
HbA1c21
HbA1c31
BGTest12
BGTest22 BGTest3
2 Accept1
2 Accept2
2 Accept3
2 Avoid1
2 Avoid2
2 Avoid3
2
CON1 -0.00 -0.25* -0.35** 0.11 0.28** 0.23* 0.11 0.18 0.04 -0.18 -0.27** -0.22*
CON2 -0.03 -0.30** -0.30** 0.18 0.32** 0.28** -0.07 0.09 0.09 -0.10 -0.23* -0.25*
CON3 -0.07 -0.26** -0.32** 0.16 0.31** 0.26** 0.03 0.19 0.08 -0.10 -0.16 -0.21*
AGR1 -0.13 -0.36** -0.28** 0.06 0.22* 0.21* 0.05 0.07 0.16 -0.21* -0.11 -0.19
AGR2 -0.07 -0.31** -0.17 -0.14 0.11 0.05 -0.04 -0.06 0.09 -0.15 -0.11 -0.16
AGR3 -0.22* -0.34** -0.31** -0.06 0.24* 0.17 0.00 0.01 0.09 -0.14 -0.17 -0.29**
EXT1 -0.04 0.11 0.09 0.05 -0.10 -0.06 0.18 0.15 0.11 -0.08 0.00 -0.10
EXT2 0.04 0.03 0.01 0.05 -0.11 -0.06 0.06 0.02 -0.03 -0.05 -0.09 -0.16
EXT3 -0.05 0.01 0.04 0.10 -0.07 0.03 0.18 0.05 0.01 -0.10 -0.09 -0.14
EMO1 -0.07 -0.10 -0.17 0.09 0.18 0.13 0.12 -0.02 0.01 -0.21* -0.31** -0.31**
EMO2 0.08 -0.11 -0.06 0.11 0.18 0.07 0.07 0.13 0.22* -0.16 -0.23* -0.30**
EMO3 -0.05 -0.17 -0.17 0.17 0.16 0.13 0.16 0.27** 0.21* -0.24* -0.24* -0.27**
OPE1 -0.12 -0.20* -0.16 -0.07 0.06 -0.03 0.12 0.19 030** -0.06 -0.02 -0.04
OPE2 -0.10 -0.29** -0.12 -0.00 0.06 0.10 0.14 0.25* 0.23* -0.13 0.05 -0.06
OPE3 -0.17 -0.28** -0.12 -0.02 0.04 0.10 0.20* 0.27** 0.28** -0.16 -0.04 -0.08
* Significant at p< 0.05 **Significant at p < 0.01
1 = Pearson’s product-moment correlation
2 = Spearman’s rho correlation

300
Dep12 Dep2
2 Dep3
2 Anx1
2 Anx2
2 Anx3
2 Stress1
2 Stress2
2 Stress3
2 Hypo1
2 Hypo2
2 Hypo3
2
CON1 -0.16 -0.19 -0.20* -0.15 -0.16 -0.23* -0.05 -0.19 -0.06 -0.13 0.00 -0.01
CON2 -0.13 -0.18 -0.18 -0.06 -0.16 -0.19 -0.07 -0.19 0.01 -0.09 0.10 -0.03
CON3 -0.19* -0.19 -0.07 -0.06 -0.17 -0.19 -0.08 -0.16 0.01 0.03 0.09 0.03
AGR1 -0.18 -0.04 -0.10 -0.17 -0.12 -0.13 -0.15 -0.05 -0.08 -0.21* -0.01 0.08
AGR2 -0.08 -0.06 0.03 -0.12 -0.04 0.04 -0.09 -0.07 -0.03 -0.30** -0.13 -0.07
AGR3 -0.17 -0.05 -0.02 -0.20* -0.13 -0.02 -0.13 -0.11 -0.10 -0.22* -0.12 -0.01
EXT1 -0.09 -0.11 -0.24* 0.00 -0.10 -0.28** -0.02 -0.04 -0.20* 0.08 0.15 0.02
EXT2 -0.09 -0.03 -0.11 0.00 -0.03 -0.06 0.06 0.09 -0.02 -0.01 0.19 0.14
EXT3 -0.18 -0.11 -0.24* -0.03 -0.14 -0.23* -0.07 -0.10 -0.16 0.03 0.11 0.07
EMO1 -0.24* -0.38** -0.32** -0.22* -0.32** -0.27** -0.27* -0.31** -0.37** -0.19 -0.17 -0.12
EMO2 -0.31** -0.38** -0.39** -0.24* -0.30** -0.29** -0.32** -0.31** -0.42** -0.09 0.02 -0.01
EMO3 -0.34** -0.41** -0.34** -0.26** -0.35** -0.37** -0.30** -0.38** -0.40** -0.09 -0.00 -0.02
OPE1 -0.15 0.02 -0.01 -0.07 -0.12 -0.22* -0.10 0.13 0.08 -0.05 -0.02 -0.06
OPE2 -.020* -0.08 -0.04 -0.02 -0.10 -0.21* -0.10 0.06 0.14 -0.05 0.14 0.19
OPE3 -0.22* -0.10 -0.04 -0.04 -0.21* -0.18 -0.12 0.03 0.12 -0.04 0.09 0.07
* Significant at p< 0.05 **Significant at p < 0.01
1 = Pearson’s product-moment correlation
2 = Spearman’s rho correlation

Appendix 36: Hierarchical Regressions
301
Hierarchical multiple regression of 1st year HbA1c
B Std. Error B
Beta t Sig.
Block 1
Constant 7.18 1.52 4.73 0.00**
Responsibility for diabetes tasks 0.03 0.03 0.13 1.09 0.28
Age -0.01 0.05 -0.02 -0.15 0.88
Gender 0.08 0.25 0.03 0.32 0.75
Duration of diabetes 0.06 0.04 0.16 1.63 0.11
R2 = 0.05, F (4,99) = 1.16, p = 0.34
Block 2
Constant 18.69 4.61 4.05 .000**
Responsibility for diabetes tasks 0.02 0.03 0.07 0.55 0.59
Age -0.02 0.05 -0.05 -0.45 0.66
Gender 0.07 0.25 0.03 0.28 0.78
Duration of diabetes 0.07 0.04 0.18 1.80 0.08
Conscientiousness 0.01 0.02 0.06 0.54 0.59
Agreeableness -0.02 0.02 -0.12 -1.15 0.26
Emotional regulation -0.40 0.16 -2.42 -2.49 0.01*
Emotional regulation quadratic term 0.00 0.00 2.38 2.46 0.02*
R2= 0.12, F(8,95) = 1.54, p= 0.15
Block 3
Constant 19.47 4.72 4.12 0.00**
Responsibility for diabetes tasks 0.01 0.03 0.05 0.44 0.66
Age -0.02 0.05 -0.05 -0.41 0.68
Gender 0.01 0.25 0.00 0.04 0.97
Duration of diabetes 0.07 0.04 0.19 1.86 0.07
Conscientiousness 0.01 0.02 0.08 0.69 0.49
Agreeableness -0.02 0.02 -0.11 -1.07 0.29
Emotional regulation -0.40 0.16 -2.40 -2.46 0.02*
Emotional regulation quadratic term 0.00 0.00 2.39 2.45 0.02*
Openness to experience -0.02 0.02 -0.09 -0.80 0.43
Extraversion -0.00 0.02 -0.03 -0.29 0.77
R2= 0.12,F(10,93) = 1.32, p= 0.23
*Significant at the 0.05 level (2 tailed) **Significant at the 0.01 level (2 tailed)

Appendix 36: Hierarchical Regressions
302
Hierarchical multiple regression of 2nd year HbA1c
B Std. Error B
Beta t Sig.
Block 1
Constant 9.60 0.87 11.00 0.00**
Responsibility for diabetes tasks -0.04 0.03 -0.17 -1.21 0.23
Age 0.01 0.06 0.02 0.15 0.88
Gender 0.10 0.25 0.04 0.41 0.69
Duration of diabetes 0.00 0.04 0.01 0.06 0.96
R2= 0.02,F(4,97) = 0.68, p= 0.67
Block 2
Constant 18.08 2.92 6.19 0.00**
Responsibility for diabetes tasks -0.01 0.03 -0.04 -0.30 0.76
Age -0.04 0.06 -0.09 -0.66 0.51
Gender 0.19 0.24 0.08 0.78 0.44
Duration of diabetes 0.01 0.04 0.02 0.22 0.83
Conscientiousness -0.04 0.02 -0.20 -1.85 0.07
Agreeableness -0.04 0.02 -0.21 -2.06 0.04*
Emotional regulation -0.20 0.11 -1.39 -1.88 0.06
Emotional regulation quadratic term 0.00 0.00 1.41 1.92 0.06
R2= 0.18,F(8,93) = 2.49, p= 0.02*
Block 3
Constant 18.37 3.00 6.13 0.00**
Responsibility for diabetes tasks -0.01 0.03 -0.05 -0.34 0.73
Age -0.02 0.06 -0.04 -0.32 0.75
Gender 0.15 0.24 0.06 0.60 0.55
Duration of diabetes 0.01 0.04 0.03 0.34 0.74
Conscientiousness -0.03 0.02 -0.16 -1.46 0.15
Agreeableness -0.03 0.02 -0.16 -1.51 0.13
Emotional regulation -0.22 0.11 -1.45 -1.99 0.05*
Emotional regulation quadratic term 0.00 0.00 1.47 2.02 0.05*
Openness to experience -0.03 0.02 -0.21 -1.94 0.06
Extraversion 0.01 0.02 0.06 0.61 0.54
R
2= 0.21,F(10,91) = 2.41, p=
0.01*
*Significant at the 0.05 level (2 tailed) **Significant at the 0.01 level (2 tailed)

Appendix 36: Hierarchical Regressions
303
Hierarchical multiple regression of 3rd year HbA1c
B Std. Error B
Beta t Sig.
Block 1
Constant 8.44 0.83 10.21 0.00**
Responsibility for diabetes tasks -0.01 0.03 -0.08 -0.46 0.65
Age -0.01 0.07 -0.02 -0.141 0.89
Gender 0.32 0.26 0.13 1.261 0.21
Duration of diabetes 0.06 0.04 0.15 1.427 0.16
R2= 0.04,F(4,94) = 0.96, p= 0.43
Block 2
Constant 18.74 3.33 5.64 0.00**
Responsibility for diabetes tasks 0.02 0.03 0.09 0.60 0.55
Age -0.06 0.07 -0.14 -0.90 0.37
Gender 0.19 0.25 0.08 0.78 0.44
Duration of diabetes 0.06 0.04 0.17 1.78 0.08
Conscientiousness -0.04 0.02 -0.23 -2.12 0.04*
Agreeableness -0.05 0.02 -0.23 -2.23 0.03
Emotional regulation -0.24 0.12 -01.6 -1.94 0.06
Emotional regulation quadratic term 0.00 0.00 1.62 1.92 0.06
R
2= 0.22, F (8,90) = 3.18, p =
0.00**
Block 3
Constant 18.35 3.43 5.36 0.00**
Responsibility for diabetes tasks 0.02 0.03 0.09 0.53 0.60
Age -0.06 0.07 -0.14 -0.90 0.37
Gender 0.21 0.25 0.08 0.82 0.41
Duration of diabetes 0.06 0.04 0.17 1.77 0.08
Conscientiousness -0.04 0.02 -0.23 -1.96 0.05*
Agreeableness -0.04 0.02 -0.21 -2.03 0.05*
Emotional regulation -0.24 0.13 -1.67 -1.95 0.05*
Emotional regulation quadratic term 0.00 0.00 1.63 1.91 0.06
Openness to experience 0.00 0.02 0.00 0.03 0.98
Extraversion 0.01 0.02 0.07 0.61 0.54
R
2= 0.22,F(10,88) = 2.54, p=
0.01*
*Significant at the 0.05 level (2 tailed) **Significant at the 0.01 level (2 tailed)

Appendix 36: Hierarchical Regressions
304
Hierarchical multiple regression of 1st year BGL testing
B Std. Error B
Beta t Sig.
Block 1
Constant 141.70 40.89 3.47 0.00**
Responsibility for diabetes tasks -0.99 0.72 -0.16 -1.39 0.17
Age -1.97 1.45 -0.16 -1.36 0.18
Gender -0.69 6.70 -0.01 -0.10 0.92
Duration of diabetes -1.70 1.06 -0.16 -1.60 0.11
R2= 0.06, F(4,99) = 1.49, p= 0.21
Block 2
Constant 78.29 58.59 1.34 0.19
Responsibility for diabetes tasks -0.80 0.73 -0.13 -1.09 0.28
Age -1.69 1.46 -0.14 -1.16 0.25
Gender 0.19 6.69 0.00 0.03 0.98
Duration of diabetes -1.79 1.07 -0.17 -1.68 0.10
Conscientiousness 0.82 0.50 0.18 1.64 0.10
Agreeableness 0.20 0.57 0.04 0.36 0.72
Emotional regulation 0.00 0.48 0.00 0.00 1.00
R2= 0.09, F(7,96) = 1.40, p= 0.21
Block 3
Constant 83.82 62.82 1.33 0.19
Responsibility for diabetes tasks -0.84 0.75 -0.14 -1.13 0.26
Age -1.74 1.48 -0.14 -1.18 0.24
Gender -0.33 6.95 -0.01 -0.05 0.96
Duration of diabetes -1.78 1.08 -0.17 -1.65 0.10
Conscientiousness 0.86 0.51 0.19 1.67 0.10
Agreeableness 0.25 0.59 0.05 0.42 0.68
Emotional regulation -0.02 0.51 -0.00 -0.04 0.97
Openness to experience -0.21 0.50 -0.05 -0.42 0.68
Extraversion 0.10 0.41 0.03 0.23 0.82
R2= 0.10, F(9,94) = 1.10, p= 0.38
*Significant at the 0.05 level (2 tailed) **Significant at the 0.01 level (2 tailed)

Appendix 36: Hierarchical Regressions
305
Hierarchical multiple regression of 2nd year BGL testing
B Std. Error B
Beta t Sig.
Block 1
Constant 96.72 18.54 5.22 0.00
Responsibility for diabetes tasks 0.41 0.60 0.09 0.67 0.50
Age 2.39 5.26 0.05 0.46 0.65
Gender -2.93 1.33 -0.30 -2.20 0.03*
Duration of diabetes -1.33 0.81 -0.16 -1.63 0.11
R2= 0.11, F(4, 94) = 2.92, p= 0.03*
Block 2
Constant 29.05 28.91
1.01 0.32
Responsibility for diabetes tasks -0.19 0.61 -0.04 -0.30 0.76
Age 3.97 5.22 0.07 0.76 0.44
Gender -2.00 1.30 -0.21 -1.54 0.13
Duration of diabetes -1.33 0.78 -0.16 -1.70 0.09
Conscientiousness 1.18 0.45 0.28 2.60 0.01*
Agreeableness -0.07 0.39 -0.02 -0.19 0.85
Emotional regulation 0.37 0.32 0.12 1.17 0.25
R2= 0.21, F (7, 91) = 3.51, p = 0.00**
Block 3
Constant 42.07 31.20
1.35 0.18
Responsibility for diabetes tasks -0.12 0.61 -0.03 -0.20 0.84
Age 4.35 5.23 0.08 0.83 0.41
Gender -2.16 1.32 -0.22 -1.63 0.11
Duration of diabetes -1.40 0.78 -0.17 -1.79 0.08
Conscientiousness 1.12 0.46 0.27 2.43 0.02*
Agreeableness -0.28 0.41 -0.07 -0.69 0.50
Emotional regulation 0.50 0.33 0.16 1.52 0.13
Openness to experience 0.33 0.34 0.10 0.97 0.34
Extraversion -0.48 0.33 -0.15 -1.46 0.15
R2= 0.24, F (9, 89) = 3.04, p = 0. 00**
*Significant at the 0.05 level (2 tailed) **Significant at the 0.01 level (2 tailed)

Appendix 36: Hierarchical Regressions
306
Hierarchical multiple regression of 3rd year BGL testing
B Std. Error B
Beta t Sig.
Block 1
Constant 104.95 18.31
5.73 0.00
Responsibility for diabetes tasks 0.53 0.65 0.13 0.81 0.42
Age -3.13 1.57 -0.32 -1.99 0.05*
Gender -4.81 5.66 -0.09 -0.85 0.40
Duration of diabetes -0.65 0.86 -0.08 -0.76 0.45
R2= 0.07, F(4, 95) = 1.73, p= 0.15
Block 2
Constant 0.42 31.14
0.01 0.99
Responsibility for diabetes tasks -0.23 0.64 -0.06 -0.37 0.72
Age -2.11 1.51 -0.22 -1.40 0.17
Gender -0.75 5.45 -0.01 -0.14 0.89
Duration of diabetes -0.66 0.80 -0.08 -0.82 0.41
Conscientiousness 0.97 0.42 0.25 2.33 0.02*
Agreeableness 0.68 0.46 0.15 1.50 0.14
Emotional regulation 0.50 0.34 0.15 1.46 0.15
R2= 0.22, F (7, 92) = 3.69, p = 0.00**
Block 3
Constant 2.29 34.92 0.07 0.95
Responsibility for diabetes tasks -0.21 0.66 -0.05 -0.31 0.76
Age -2.12 1.53 -0.22 -1.39 0.17
Gender -0.97 5.59 -0.02 -0.17 0.86
Duration of diabetes -0.65 0.81 -0.08 -0.80 0.43
Conscientiousness 0.10 0.44 0.26 2.25 0.03*
Agreeableness 0.68 0.47 0.15 1.45 0.15
Emotional regulation 0.51 0.37 0.16 1.39 0.17
Openness to experience -0.08 0.34 -0.03 -0.23 0.82
Extraversion -0.01 0.36 -0.00 -0.04 0.97
R2= 0.22, F (9, 90) = 2.82, p = 0.01*
*Significant at the 0.05 level (2 tailed) **Significant at the 0.01 level (2 tailed)

Appendix 36: Hierarchical Regressions
307
Hierarchical multiple regression of 1st year Hypoglycaemia
B Std. Error B Beta t Sig.
Block 1
Constant 2.35 3.53 0.67 0.51
Responsibility for diabetes tasks 0.04 0.06 0.07 0.61 0.55
Age -0.05 0.13 -0.04 -0.36 0.72
Gender -0.71 0.58 -0.12 -1.22 0.23
Duration of diabetes 0.10 0.09 0.11 1.07 0.29
R
2=0.04, F(4, 99) = 0.93, p=
0.45
Block 2
Constant 8.36 5.08 1.65 0.10
Responsibility for diabetes tasks 0.02 0.06 0.04 0.29 0.77
Age -0.05 0.13 -0.05 -0.42 0.68
Gender -0.76 0.58 -0.13 -1.31 0.19
Duration of diabetes 0.10 0.09 0.11 1.05 0.30
Conscientiousness -0.02 0.04 -0.06 -0.50 0.62
Agreeableness -0.05 0.05 -0.10 -0.99 0.33
Emotional regulation -0.03 0.04 -0.07 -0.65 0.52
R
2=0.06, F(7, 96) = 0.92, p=
0.49
Block 3
Constant 6.85 5.33 1.29 0.20
Responsibility for diabetes tasks 0.01 0.06 0.02 0.18 0.86
Age -0.08 0.13 -0.08 -0.66 0.51
Gender -0.68 0.59 -0.12 -1.16 0.25
Duration of diabetes 0.09 0.09 0.10 0.96 0.34
Conscientiousness -0.02 0.04 -0.05 -0.45 0.66
Agreeableness -0.03 0.05 -0.07 -0.63 0.53
Emotional regulation -0.05 0.04 -0.14 -1.20 0.23
Openness to experience -0.02 0.04 -0.06 -0.48 0.63
Extraversion 0.07 0.04 0.23 2.04 0.05*
R
2=0.10, F(9, 94) = 1.20, p=
0.31
*Significant at the 0.05 level (2 tailed) **Significant at the 0.01 level (2 tailed)
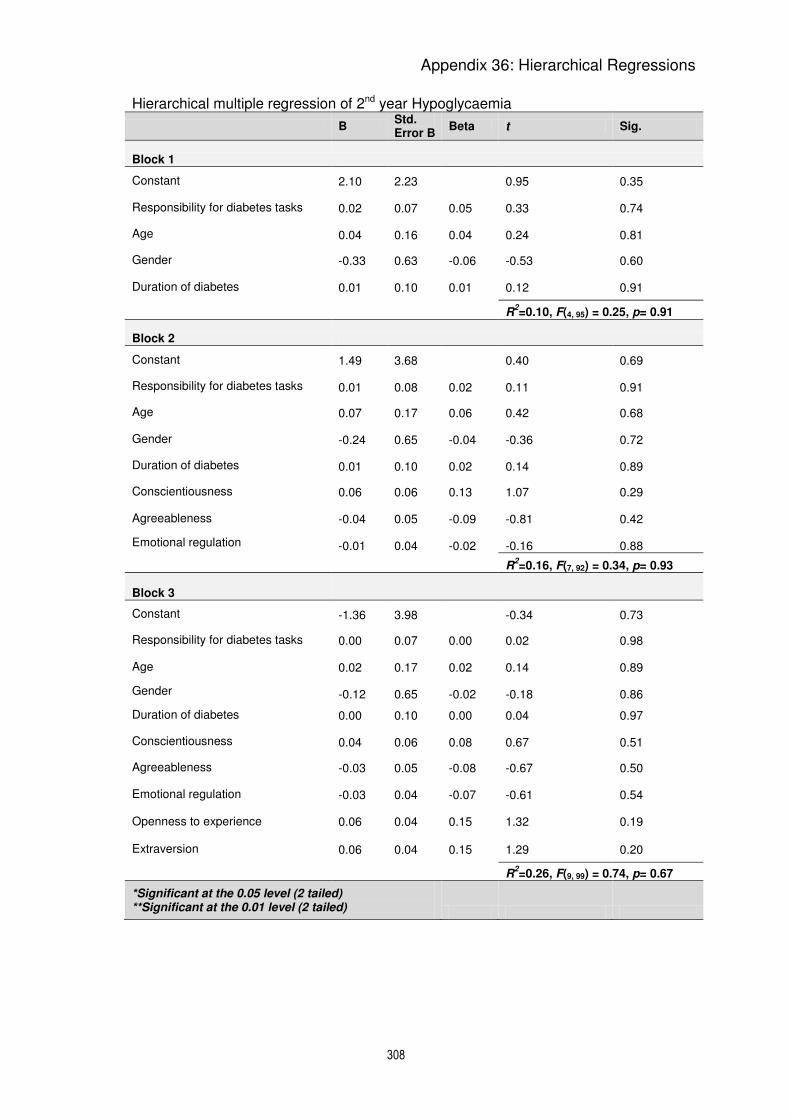
Appendix 36: Hierarchical Regressions
308
Hierarchical multiple regression of 2nd year Hypoglycaemia
B Std. Error B
Beta t Sig.
Block 1
Constant 2.10 2.23 0.95 0.35
Responsibility for diabetes tasks 0.02 0.07 0.05 0.33 0.74
Age 0.04 0.16 0.04 0.24 0.81
Gender -0.33 0.63 -0.06 -0.53 0.60
Duration of diabetes 0.01 0.10 0.01 0.12 0.91
R2=0.10, F(4, 95) = 0.25, p= 0.91
Block 2
Constant 1.49 3.68 0.40 0.69
Responsibility for diabetes tasks 0.01 0.08 0.02 0.11 0.91
Age 0.07 0.17 0.06 0.42 0.68
Gender -0.24 0.65 -0.04 -0.36 0.72
Duration of diabetes 0.01 0.10 0.02 0.14 0.89
Conscientiousness 0.06 0.06 0.13 1.07 0.29
Agreeableness -0.04 0.05 -0.09 -0.81 0.42
Emotional regulation -0.01 0.04 -0.02 -0.16 0.88
R2=0.16, F(7, 92) = 0.34, p= 0.93
Block 3
Constant -1.36 3.98 -0.34 0.73
Responsibility for diabetes tasks 0.00 0.07 0.00 0.02 0.98
Age 0.02 0.17 0.02 0.14 0.89
Gender -0.12 0.65 -0.02 -0.18 0.86
Duration of diabetes 0.00 0.10 0.00 0.04 0.97
Conscientiousness 0.04 0.06 0.08 0.67 0.51
Agreeableness -0.03 0.05 -0.08 -0.67 0.50
Emotional regulation -0.03 0.04 -0.07 -0.61 0.54
Openness to experience 0.06 0.04 0.15 1.32 0.19
Extraversion 0.06 0.04 0.15 1.29 0.20
R2=0.26, F(9, 99) = 0.74, p= 0.67
*Significant at the 0.05 level (2 tailed) **Significant at the 0.01 level (2 tailed)

Appendix 36: Hierarchical Regressions
309
Hierarchical multiple regression of 3rd year Hypoglycaemia
B Std. Error B Beta t Sig.
Block 1
Constant 3.85 1.79 2.16 0.03
Responsibility for diabetes tasks -0.12 0.06 -0.31 -1.89 0.06
Age 0.19 0.16 0.21 1.24 0.22
Gender 0.49 0.55 0.09 0.88 0.38
Duration of diabetes -0.08 0.08 -0.10 -0.96 0.34
R2=0.06, F(4, 93) = 1.35, p= 0.26
Block 2
Constant 3.15 3.35 0.94 0.35
Responsibility for diabetes tasks -0.14 0.07 -0.34 -2.00 0.05*
Age 0.22 0.16 0.24 1.39 0.17
Gender 0.43 0.58 0.08 0.74 0.46
Duration of diabetes -0.09 0.09 -0.11 -1.00 0.32
Conscientiousness 0.03 0.04 0.09 0.73 0.47
Agreeableness 0.01 0.05 0.03 0.29 0.77
Emotional regulation -0.03 0.04 -0.09 -0.82 0.41
R2=0.07, F(7, 90) = 0.92, p= 0.50
Block 3
Constant 1.76 3.65 0.48 0.63
Responsibility for diabetes tasks -0.16 0.07 -0.39 -2.25 0.03*
Age 0.23 0.161 0.25 1.43 0.16
Gender 0.57 0.59 0.11 0.97 0.34
Duration of diabetes -0.10 0.09 -0.12 -1.09 0.28
Conscientiousness 0.02 0.05 0.04 0.33 0.74
Agreeableness 0.02 0.05 0.04 0.32 0.75
Emotional regulation -0.04 0.04 -0.13 -1.02 0.31
Openness to experience 0.05 0.04 0.16 1.33 0.19
Extraversion 0.02 0.04 0.05 0.40 0.69
R2=0.09, F(9, 88) = 0.98, p= 0.47
*Significant at the 0.05 level (2 tailed) **Significant at the 0.01 level (2 tailed)

Appendix 36: Hierarchical Regressions
310
Hierarchical multiple regression of 1st year Depression
B Std. Error B
Beta t Sig.
Block 1
Constant 10.50 10.86 0.97 0.34
Responsibility for diabetes tasks 0.080 0.19 0.05 0.42 0.68
Age -0.31 0.39 -0.10 -0.79 0.43
Gender -0.20 1.78 -0.01 -0.11 0.91
Duration of diabetes -0.53 0.28 -0.19 -1.90 0.06
R
2= 0.06, F(4, 99) = 1.53, p=
0.20
Block 2
Constant 39.75 11.29 3.52 0.00
Responsibility for diabetes tasks 0.05 0.17 0.03 0.30 0.76
Age -0.25 0.35 -0.08 -0.73 0.47
Gender -0.57 1.59 -0.03 -0.36 0.72
Duration of diabetes -0.68 0.25 -0.24 -2.68 0.01**
Emotional regulation -0.53 0.10 -0.45 -5.08 0.00**
R
2= 0.26, F(5, 98) = 6.70, p=
0.00**
Block 3
Constant 40.27 15.01 2.68 0.01
Responsibility for diabetes tasks 0.03 0.18 0.02 0.14 0.89
Age -0.28 0.35 -0.09 -0.79 0.43
Gender -0.66 1.66 -0.04 -0.40 0.69
Duration of diabetes -0.69 0.26 -0.24 -2.67 0.01**
Emotional regulation -0.58 0.12 -0.49 -4.78 0.00**
Conscientiousness 0.08 0.12 0.07 0.67 0.51
Agreeableness -0.01 0.14 -0.01 -0.05 0.96
Extraversion 0.11 0.10 0.11 1.08 0.28
Openness to experience -0.10 0.12 -0.09 -0.86 0.40
R
2= 0.27, F(9, 94) = 3.84, p=
0.00**
*Significant at the 0.05 level (2 tailed) **Significant at the 0.01 level (2 tailed)
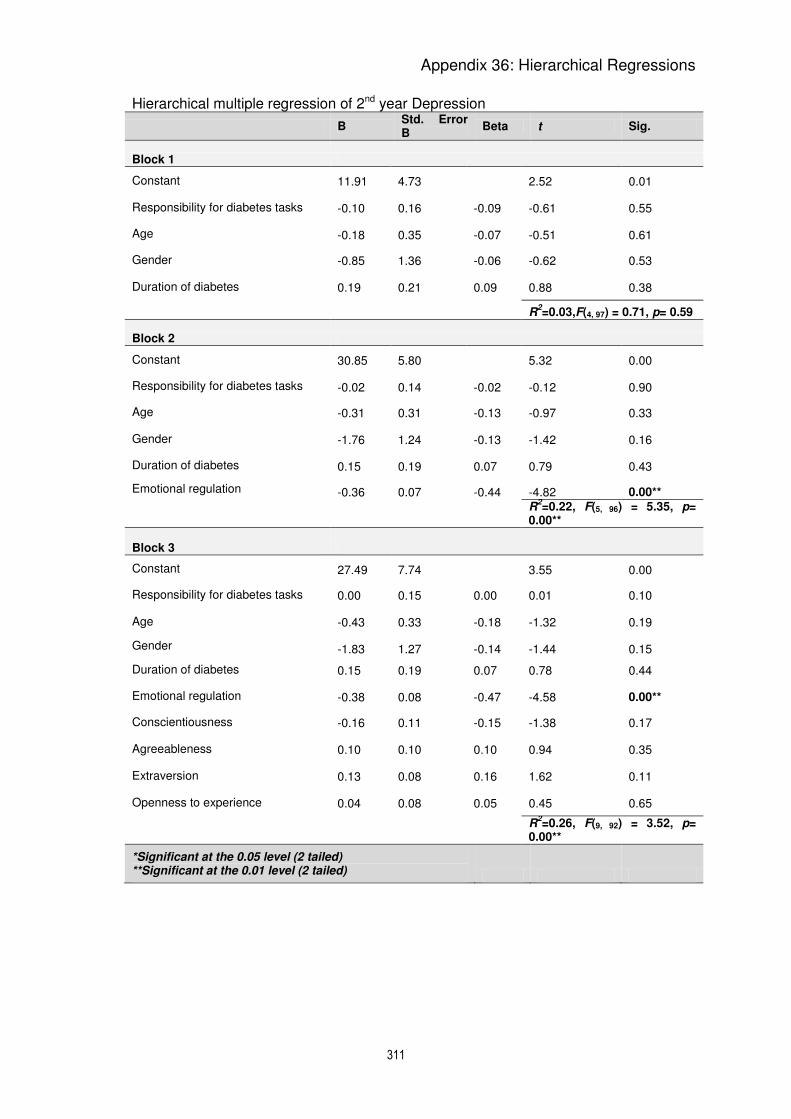
Appendix 36: Hierarchical Regressions
311
Hierarchical multiple regression of 2nd year Depression
B Std. Error B
Beta t Sig.
Block 1
Constant 11.91 4.73 2.52 0.01
Responsibility for diabetes tasks -0.10 0.16 -0.09 -0.61 0.55
Age -0.18 0.35 -0.07 -0.51 0.61
Gender -0.85 1.36 -0.06 -0.62 0.53
Duration of diabetes 0.19 0.21 0.09 0.88 0.38
R2=0.03,F(4, 97) = 0.71, p= 0.59
Block 2
Constant 30.85 5.80 5.32 0.00
Responsibility for diabetes tasks -0.02 0.14 -0.02 -0.12 0.90
Age -0.31 0.31 -0.13 -0.97 0.33
Gender -1.76 1.24 -0.13 -1.42 0.16
Duration of diabetes 0.15 0.19 0.07 0.79 0.43
Emotional regulation -0.36 0.07 -0.44 -4.82 0.00**
R
2=0.22, F(5, 96) = 5.35, p=
0.00**
Block 3
Constant 27.49 7.74 3.55 0.00
Responsibility for diabetes tasks 0.00 0.15 0.00 0.01 0.10
Age -0.43 0.33 -0.18 -1.32 0.19
Gender -1.83 1.27 -0.14 -1.44 0.15
Duration of diabetes 0.15 0.19 0.07 0.78 0.44
Emotional regulation -0.38 0.08 -0.47 -4.58 0.00**
Conscientiousness -0.16 0.11 -0.15 -1.38 0.17
Agreeableness 0.10 0.10 0.10 0.94 0.35
Extraversion 0.13 0.08 0.16 1.62 0.11
Openness to experience 0.04 0.08 0.05 0.45 0.65
R
2=0.26, F(9, 92) = 3.52, p=
0.00**
*Significant at the 0.05 level (2 tailed) **Significant at the 0.01 level (2 tailed)

Appendix 36: Hierarchical Regressions
312
Hierarchical multiple regression of 3rd year Depression
B Std. Error B
Beta t Sig.
Block 1
Constant 2.67 5.17 0.52 0.61
Responsibility for diabetes tasks -0.09 0.19 -0.08 -0.49 0.63
Age 0.13 0.45 0.05 0.30 0.77
Gender 2.54 1.59 0.17 1.59 0.11
Duration of diabetes 0.07 0.24 0.03 0.28 0.78
R
2=0.03, F(4, 94) = 0.67, p=
0.61
Block 2
Constant 16.66 6.95 2.40 0.02
Responsibility for diabetes tasks -0.05 0.18 -0.05 -0.29 0.78
Age 0.17 0.43 0.06 0.40 0.69
Gender 1.34 1.59 0.09 0.85 0.40
Duration of diabetes 0.02 0.23 0.01 0.08 0.94
Emotional regulation -0.27 0.09 -0.30 -2.89 0.01
R
2=0.11, F(5, 93) = 2.24, p=
0.06
Block 3
Constant 15.61 10.20 1.53 0.13
Responsibility for diabetes tasks -0.11 0.19 -0.10 -0.56 0.58
Age 0.25 0.45 0.09 0.55 0.59
Gender 1.71 1.63 0.11 1.05 0.30
Duration of diabetes 0.01 0.24 0.00 0.03 0.97
Emotional regulation -0.30 0.11 -0.33 -2.77 0.01**
Conscientiousness 0.04 0.13 0.04 0.33 0.74
Agreeableness -0.09 0.14 -0.07 -0.62 0.54
Extraversion -0.00 0.11 -0.00 -0.03 0.97
Openness to experience 0.11 0.01 0.13 1.13 0.26
R
2=0.13, F(9, 89) = 1.44, p=
0.18
*Significant at the 0.05 level (2 tailed) **Significant at the 0.01 level (2 tailed)

Appendix 36: Hierarchical Regressions
313
Hierarchical multiple regression of 1st year Anxiety
B Std. Error B
Beta t Sig.
Block 1
Constant 3.11 10.20 0.31 0.76
Responsibility for diabetes tasks 0.14 0.18 0.10 0.80 0.43
Age -0.04 0.36 -0.01 -0.10 0.92
Gender 0.65 1.67 0.04 0.39 0.70
Duration of diabetes -0.36 0.26 -0.14 -1.37 0.17
R
2=0.03, F(4, 99) = 0.85, p=
0.50
Block 2
Constant 25.94 11.02 2.35 0.02
Responsibility for diabetes tasks 0.12 0.17 0.08 0.73 0.47
Age 0.01 0.34 0.00 0.02 0.98
Gender 0.36 1.56 0.02 0.23 0.82
Duration of diabetes -0.48 0.25 -0.18 -1.92 0.06
Emotional regulation -0.41 0.10 -0.38 -4.07 0.00**
R
2=0.17, F(5, 98) = 4.09, p=
0.00**
Block 3
Constant 27.33 14.64 1.87 0.07
Responsibility for diabetes tasks 0.09 0.17 0.06 0.52 0.61
Age -0.05 0.35 -0.02 -0.13 0.90
Gender 0.57 1.62 0.03 0.35 0.73
Duration of diabetes -0.48 0.25 -0.18 -1.91 0.06
Emotional regulation -0.44 0.12 -0.40 -3.74 0.00**
Conscientiousness 0.01 0.12 0.01 0.07 0.95
Agreeableness -0.07 0.14 -0.05 -0.52 0.61
Extraversion 0.11 0.10 0.12 1.15 0.25
Openness to experience -0.00 0.12 -0.00 -0.03 0.98
R
2= 0.19, F(9, 94) = 2.44, p=
0.02
*Significant at the 0.05 level (2 tailed) **Significant at the 0.01 level (2 tailed)

Appendix 36: Hierarchical Regressions
314
Hierarchical multiple regression of 2nd year Anxiety
B Std. Error B
Beta t Sig.
Block 1
Constant 15.27 3.68 4.15 0.00
Responsibility for diabetes tasks -0.30 0.12 -0.33 -2.41 0.02*
Age 0.07 0.27 0.04 0.26 0.80
Gender 0.39 1.06 0.04 0.37 0.72
Duration of diabetes -0.09 0.16 -0.06 -0.58 0.57
R
2=0.10, F(4, 97) = 2.74, p=
0.03
Block 2
Constant 25.39 4.80 5.30 0.00
Responsibility for diabetes tasks -0.25 0.12 -0.28 -2.14 0.04*
Age 0.00 0.26 0.00 0.01 0.10
Gender -0.10 1.03 -0.01 -0.10 0.92
Duration of diabetes -0.11 0.16 -0.07 -0.72 0.47
Emotional regulation -0.19 0.06 -0.29 -3.12 0.00**
R
2=0.43, F(5, 96) = 4.33, p=
0.00**
Block 3
Constant 23.41 6.51 3.60 0.00
Responsibility for diabetes tasks -0.25 0.12 -0.28 -2.01 0.0\5*
Age -0.06 0.27 -0.03 -0.22 0.83
Gender -0.08 1.07 -0.01 -0.08 0.94
Duration of diabetes -0.12 0.16 -0.07 -0.72 0.47
Emotional regulation -0.20 0.07 -0.31 -2.96 0.00**
Conscientiousness -0.06 0.10 -0.07 -0.63 0.53
Agreeableness 0.03 0.09 0.04 0.37 0.71
Extraversion 0.06 0.07 0.10 0.93 0.36
Openness to experience 0.03 0.07 0.05 0.45 0.66
R
2=0.20, F(9, 92) = 2.51, p=
0.01*
*Significant at the 0.05 level (2 tailed) **Significant at the 0.01 level (2 tailed)

Appendix 36: Hierarchical Regressions
315
Hierarchical multiple regression of 3rd year Anxiety
B Std. Error B
Beta t Sig.
Block 1
Constant 9.74 4.04 2.41 0.02
Responsibility for diabetes tasks -0.12 0.15 -0.14 -0.84 0.40
Age -0.21 0.35 -0.10 -0.59 0.56
Gender 2.21 1.25 0.18 1.78 0.08
Duration of diabetes 0.02 0.19 0.01 0.13 0.90
R
2= 0.29, F(4, 94) = 2.10, p=
0.09
Block 2
Constant 20.70 5.43 3.81 0.00
Responsibility for diabetes tasks -0.09 0.14 -0.10 -0.66 0.51
Age -0.18 0.34 -0.08 -0.52 0.60
Gender 1.28 1.24 0.10 1.03 0.31
Duration of diabetes -0.01 0.18 -0.01 -0.07 0.94
Emotional regulation -0.21 0.07 -0.29 -2.89 0.01**
R
2=0.40, F(5, 93) = 3.49, p=
0.01**
Block 3
Constant 14.40 7.82 1.84 0.07
Responsibility for diabetes tasks -0.13 0.15 -0.14 -0.85 0.40
Age -0.24 0.34 -0.11 -0.70 0.49
Gender 1.52 1.25 0.12 1.21 0.23
Duration of diabetes -0.04 0.18 -0.02 -0.21 0.83
Emotional regulation -0.21 0.08 -0.30 -2.61 0.01*
Conscientiousness -0.15 0.10 -0.17 -1.51 0.14
Agreeableness 0.15 0.11 0.14 1.39 0.17
Extraversion 0.06 0.08 0.07 0.68 0.50
Openness to experience 0.11 0.08 0.16 1.46 0.15
R
2=0.21, F(9, 89) = 2.60, p=
0.01*
*Significant at the 0.05 level (2 tailed) **Significant at the 0.01 level (2 tailed)

Appendix 36: Hierarchical Regressions
316
Hierarchical multiple regression of 1st year Stress
B Std. Error B
Beta t Sig.
Block 1
Constant 11.72 10.90 1.08 0.29
Responsibility for diabetes tasks 0.12 0.19 0.08 0.65 0.52
Age -0.20 0.39 -0.06 -0.51 0.62
Gender -1.01 1.79 -0.06 -0.56 0.57
Duration of diabetes -0.52 0.28 -0.19 -1.85 0.07
R
2=0.05, F(4, 99) = 1.41, p=
0.24
Block 2
Constant 32.97 12.02 2.74 0.01
Responsibility for diabetes tasks 0.10 0.18 0.06 0.57 0.57
Age -0.16 0.37 -0.05 -0.42 0.67
Gender -1.28 1.70 -0.07 -0.75 0.45
Duration of diabetes -0.63 0.27 -0.22 -2.33 0.02*
Emotional regulation -0.39 0.11 -0.33 -3.47 0.00**
R
2=0.16, F(5, 98) = 3.66, p=
0.00**
Block 3
Constant 39.61 15.76 2.51 0.01
Responsibility for diabetes tasks 0.04 0.19 0.02 0.20 0.85
Age -0.19 0.37 -0.06 -0.51 0.61
Gender -1.32 1.74 -0.07 -0.76 0.45
Duration of diabetes -0.63 0.27 -0.22 -2.34 0.02*
Emotional regulation -0.44 0.13 -0.37 -3.48 0.00**
Conscientiousness 0.15 0.13 0.12 1.13 0.26
Agreeableness -0.16 0.15 -0.11 -1.09 0.28
Extraversion 0.14 0.10 0.14 1.32 0.19
Openness to experience -0.11 0.13 -0.10 -0.89 0.37
R
2=0.20, F(9, 94) = 2.55, p=
0.01*
*Significant at the 0.05 level (2 tailed) **Significant at the 0.01 level (2 tailed)

Appendix 36: Hierarchical Regressions
317
Hierarchical multiple regression of 2nd year Stress
B Std. Error B
Beta t Sig.
Block 1
Constant 19.51 5.10 3.83 0.00
Responsibility for diabetes tasks -0.25 0.17 -0.20 -1.47 0.15
Age -0.09 0.37 -0.03 -0.23 0.82
Gender -0.82 1.47 -0.06 -0.56 0.58
Duration of diabetes 0.06 0.23 0.03 0.27 0.79
R
2=0.05, F(4, 97) = 1.34, p=
0.26
Block 2
Constant 31.60 6.72 4.70 0.00
Responsibility for diabetes tasks -0.20 0.17 -0.16 -1.20 0.23
Age -0.17 0.36 -0.06 -0.46 0.65
Gender -1.40 1.44 -0.10 -0.97 0.33
Duration of diabetes 0.04 0.22 0.02 0.17 0.87
Emotional regulation -0.23 0.09 -0.26 -2.66 0.01**
R
2=0.12, F(5, 96) = 2.55, p=
0.03*
Block 3
Constant 25.27 8.71 2.900 0.01
Responsibility for diabetes tasks -0.19 0.17 -0.16 -1.15 0.25
Age -0.40 0.37 -0.15 -1.08 0.28
Gender -1.07 1.43 -0.07 -0.75 0.45
Duration of diabetes 0.03 0.22 0.01 0.12 0.90
Emotional regulation -0.28 0.09 -0.32 -3.01 0.00**
Conscientiousness -0.16 0.13 -0.14 -1.25 0.22
Agreeableness 0.02 0.11 0.02 0.18 0.86
Extraversion 0.19 0.09 0.22 2.09 0.04*
Openness to experience 0.18 0.10 0.20 1.90 0.06
R
2=0.21, F(9, 92) = 2.68, p=
0.01**
*Significant at the 0.05 level (2 tailed) **Significant at the 0.01 level (2 tailed)

Appendix 36: Hierarchical Regressions
318
Hierarchical multiple regression of 3rd year Stress
B Std. Error B
Beta t Sig.
Block 1
Constant 6.52 4.55 1.43 0.16
Responsibility for diabetes tasks -0.02 0.16 -0.02 -0.14 0.89
Age -0.14 0.39 -0.06 -0.36 0.72
Gender 2.40 1.40 0.18 1.71 0.09
Duration of diabetes 0.13 0.21 0.06 0.60 0.55
R
2= 0.04, F(4, 94) = 0.96, p=
0.44
Block 2
Constant 20.76 6.02 3.45 0.00
Responsibility for diabetes tasks 0.02 0.16 0.02 0.11 0.91
Age -0.10 0.37 -0.04 -0.28 0.78
Gender 1.18 1.38 0.09 0.86 0.39
Duration of diabetes 0.08 0.20 0.04 0.38 0.70
Emotional regulation -0.27 0.08 -0.34 -3.39 0.00**
R
2= 0.15, F(5, 93) = 3.15, p=
0.01*
Block 3
Constant 16.02 8.41 1.90 0.06
Responsibility for diabetes tasks -0.11 0.16 -0.11 -0.71 0.48
Age 0.08 0.37 0.04 0.23 0.82
Gender 1.91 1.34 0.14 1.42 0.16
Duration of diabetes 0.06 0.19 0.03 0.29 0.78
Emotional regulation -0.35 0.09 -0.44 -3.99 0.00**
Conscientiousness 0.14 0.11 0.15 1.35 0.18
Agreeableness -0.15 0.11 -0.13 -1.32 0.19
Extraversion 0.02 0.09 0.03 0.24 0.81
Openness to experience 0.19 0.08 0.26 2.39 0.02*
R
2= 0.24, F( 9, 89) = 3.14, p=
0.00**
*Significant at the 0.05 level (2 tailed) **Significant at the 0.01 level (2 tailed)

Appendix 36: Hierarchical Regressions
319
Hierarchical multiple regression of 1st year Avoidance
B Std. Error B
Beta t Sig.
Block 1
Constant 4.22 3.87 1.09 0.28
Responsibility for diabetes tasks 0.11 0.07 0.19 1.61 0.11
Age -0.06 0.14 -0.05 -0.44 0.66
Gender 0.42 0.63 0.06 0.66 0.51
Duration of diabetes -0.12 0.10 -0.12 -1.20 0.23
R
2=0.07, F(4, 99) = 1.92, p=
0.11
Block 2
Constant 11.80 4.71 2.50 0.01
Responsibility for diabetes tasks 0.10 0.07 0.17 1.47 0.15
Age -0.07 0.13 -0.06 -0.49 0.63
Gender 0.31 0.62 0.05 0.50 0.62
Duration of diabetes -0.14 0.10 -0.14 -1.43 0.16
Emotional regulation -0.09 0.04 -0.21 -2.01 0.05*
Conscientiousness -0.04 0.05 -0.10 -0.97 0.33
R
2=0.14, F(6, 97) = 2.67, p=
0.02*
Block 3
Constant 12.90 5.80 2.22 0.03
Responsibility for diabetes tasks 0.09 0.07 0.16 1.34 0.18
Age -0.06 0.14 -0.06 -0.47 0.64
Gender 0.39 0.64 0.06 0.61 0.54
Duration of diabetes -0.14 0.10 -0.14 -1.40 0.17
Emotional regulation -0.08 0.05 -0.20 -1.80 0.08
Conscientiousness -0.04 0.05 -0.10 -0.90 0.37
Agreeableness -0.05 0.05 -0.09 -0.85 0.40
Extraversion -0.01 0.04 -0.02 -0.18 0.86
Openness to experience 0.03 0.05 0.07 0.61 0.54
R
2=0.15, F(9, 94) = 1.85, p=
0.07
*Significant at the 0.05 level (2 tailed) **Significant at the 0.01 level (2 tailed)

Appendix 36: Hierarchical Regressions
320
Hierarchical multiple regression of 2nd year Avoidance
B Std. Error B
Beta T Sig.
Block 1
Constant 13.32 2.39 5.56 0.00
Responsibility for diabetes tasks -0.21 0.08 -0.36 -2.63 0.01*
Age 0.18 0.18 0.14 1.00 0.32
Gender -0.66 0.69 -0.10 -0.97 0.34
Duration of diabetes -0.07 0.11 -0.06 -0.62 0.54
R
2=0. 09,F(4, 95) = 2.35, p=
0.06
Block 2
Constant 20.39 3.77 5.41 0.00
Responsibility for diabetes tasks -0.18 0.08 -0.30 -2.16 0.03*
Age 0.11 0.18 0.09 0.63 0.53
Gender -0.93 0.68 -0.13 -1.36 0.18
Duration of diabetes -0.09 0.11 -0.08 -0.80 0.43
Emotional regulation -0.09 0.04 -0.21 -2.07 0.04*
Conscientiousness -0.05 0.06 -0.08 -0.81 0.42
R
2= 0.15, F(6, 93) = 2.75, p=
0.02*
Block 3
Constant 19.93 4.42 4.51 0.00
Responsibility for diabetes tasks -0.17 0.08 -0.30 -2.12 0.04*
Age 0.07 0.18 0.05 0.38 0.71
Gender -0.80 0.71 -0.11 -1.13 0.26
Duration of diabetes -0.09 0.11 -0.08 -0.84 0.41
Emotional regulation -0.09 0.05 -0.22 -2.01 0.05*
Conscientiousness -0.06 0.06 -0.10 -0.91 0.37
Agreeableness -0.02 0.06 -0.05 -0.41 0.68
Extraversion -0.00 0.05 -0.00 -0.01 0.99
Openness to experience 0.06 0.05 0.13 1.17 0.24
R
2=0.16, F(9, 90) = 1.97, p=
0.05
*Significant at the 0.05 level (2 tailed) **Significant at the 0.01 level (2 tailed)

Appendix 36: Hierarchical Regressions
321
Hierarchical multiple regression of 3rdyear Avoidance
B Std. Error B
Beta T Sig.
Block 1
Constant 10.47 2.31 4.53 0.00
Responsibility for diabetes tasks -0.04 0.08 -0.09 -0.52 0.61
Age -0.15 0.20 -0.13 -0.77 0.45
Gender 0.25 0.71 0.03 0.34 0.73
Duration of diabetes 0.03 0.11 0.03 0.31 0.76
R
2=0.04, F(4, 92) = 1.00, p=
0.41
Block 2
Constant 19.77 3.54 5.59 0.00
Responsibility for diabetes tasks -0.00 0.08 -0.00 -0.01 0.99
Age -0.18 0.20 -0.16 -0.95 0.35
Gender -0.42 0.70 -0.06 -0.60 0.55
Duration of diabetes 0.02 0.10 0.02 0.18 0.86
Emotional regulation -0.10 0.04 -0.26 -2.35 0.02*
Conscientiousness -0.08 0.05 -0.16 -1.51 0.14
R
2=0.15, F(6, 90) = 2.69, p=
0.02*
Block 3
Constant 24.26 4.43 5.48 0.00
Responsibility for diabetes tasks 0.01 0.08 0.02 0.11 0.91
Age -0.18 0.19 -0.15 -0.92 0.36
Gender -0.37 0.71 -0.06 -0.53 0.60
Duration of diabetes 0.03 0.10 0.03 0.31 0.76
Emotional regulation -0.11 0.05 -0.27 -2.29 0.02*
Conscientiousness -0.05 0.06 -0.10 -0.83 0.41
Agreeableness -0.13 0.06 -0.23 -2.16 0.03*
Extraversion -0.00 0.05 -0.01 -0.08 0.94
Openness to experience 0.01 0.04 0.03 0.22 0.83
R
2=0.20, F(9, 87) = 2.37, p=
0.02*
*Significant at the 0.05 level (2 tailed) **Significant at the 0.01 level (2 tailed)

Appendix 36: Hierarchical Regressions
322
Hierarchical multiple regression of 1st year Acceptance
B Std. Error B
Beta t Sig.
Block 1
Constant 26.93 5.22 5.16 0.00
Responsibility for diabetes tasks -0.08 0.09 -0.10 -0.85 0.40
Age 0.09 0.19 0.06 0.48 0.63
Gender -0.77 0.86 -0.09 -0.90 0.37
Duration of diabetes 0.04 0.14 0.03 0.32 0.75
R
2=0.03, F(4, 99) = 0.80, p=
0.53
Block 2
Constant 20.02 6.51 3.08 0.00
Responsibility for diabetes tasks -0.07 0.09 -0.09 -0.71 0.48
Age 0.10 0.19 0.06 0.53 0.60
Gender -0.67 0.85 -0.08 -0.79 0.43
Duration of diabetes 0.06 0.14 0.04 0.42 0.68
Emotional regulation 0.07 0.06 0.12 1.12 0.27
Conscientiousness 0.05 0.06 0.09 0.83 0.41
R
2=0.06, F(6, 97) = 1.07, p=
0.38
Block 3
Constant 18.45 8.04 2.30 0.02
Responsibility for diabetes tasks -0.06 0.10 -0.08 -0.67 0.50
Age 0.09 0.19 0.06 0.45 0.66
Gender -0.63 0.89 -0.07 -0.71 0.48
Duration of diabetes 0.05 0.14 0.04 0.37 0.71
Emotional regulation 0.06 0.07 0.10 0.84 0.40
Conscientiousness 0.05 0.07 0.09 0.76 0.45
Agreeableness 0.02 0.08 0.03 0.30 0.77
Extraversion 0.03 0.05 0.07 0.63 0.53
Openness to experience -0.01 0.06 -0.01 -0.10 0.92
R
2=0.07, F(9, 94) = 0.75, p=
0.67
*Significant at the 0.05 level (2 tailed) **Significant at the 0.01 level (2 tailed)

Appendix 36: Hierarchical Regressions
323
Hierarchical multiple regression of 2ndyear Acceptance
B Std. Error B
Beta t Sig.
Block 1
Constant 22.37 2.67 8.38 0.00
Responsibility for diabetes tasks 0.05 0.09 0.08 0.61 0.54
Age 0.12 0.20 0.08 0.60 0.55
Gender -1.41 0.77 -0.18 -1.83 0.07
Duration of diabetes 0.10 0.12 0.09 0.87 0.39
R
2=0.08, F(4, 97) = 2.00, p=
0.10
Block 2
Constant 19.14 4.24 4.52 0.00
Responsibility for diabetes tasks 0.03 0.09 0.05 0.36 0.72
Age 0.15 0.20 0.11 0.76 0.45
Gender -1.31 0.78 -0.17 -1.67 0.10
Duration of diabetes 0.10 0.12 0.09 0.86 0.39
Emotional regulation 0.03 0.05 0.07 0.61 0.54
Conscientiousness 0.04 0.07 0.06 0.54 0.59
R
2=0.09, F(6, 95) = 1.48, p=
0.19
Block 3
Constant 19.49 4.87 4.00 0.00
Responsibility for diabetes tasks 0.04 0.09 0.06 0.41 0.68
Age 0.09 0.21 0.06 0.43 0.67
Gender -1.11 0.80 -0.14 -1.40 0.17
Duration of diabetes 0.09 0.12 0.08 0.78 0.44
Emotional regulation 0.03 0.05 0.07 0.67 0.51
Conscientiousness 0.02 0.07 0.03 0.27 0.79
Agreeableness -0.05 0.06 -0.09 -0.76 0.45
Extraversion -0.03 0.05 -0.07 -0.61 0.54
Openness to experience 0.10 0.05 0.20 1.81 0.07
R2=0,12F(9, 92) = 1.38, p= 0.21
*Significant at the 0.05 level (2 tailed) **Significant at the 0.01 level (2 tailed)

Appendix 36: Hierarchical Regressions
324
Hierarchical multiple regression of 3rdyear Acceptance
B Std. Error B
Beta t Sig.
Block 1
Constant 27.41 2.50 10.96 0.00
Responsibility for diabetes tasks 0.23 0.09 0.40 2.62 0.01**
Age -0.49 0.22 -0.35 -2.28 0.03
Gender -2.74 0.77 -0.34 -3.55 0.00**
Duration of diabetes -0.02 0.12 -0.01 -0.14 0.89
R
2=0.15, F(4, 95) = 4.21, p=
0.00**
Block 2
Constant 25.22 3.95 6.39 0.00
Responsibility for diabetes tasks 0.24 0.09 0.40 2.52 0.01*
Age -0.52 0.22 -0.37 -2.35 0.02*
Gender -2.50 0.80 -0.31 -3.12 0.00**
Duration of diabetes -0.01 0.12 -0.00 -0.05 0.96
Emotional regulation 0.069 0.05 0.15 1.38 0.17
Conscientiousness -0.07 0.06 -0.05 -0.49 0.63
R
2=0.17, F(6, 93) = 3.12, p=
0.01**
Block 3
Constant 22.57 4.93 4.5 0.00
Responsibility for diabetes tasks 0.19 0.09 0.33 2.08 0.04*
Age -0.50 0.22 -0.36 -2.33 0.02*
Gender -2.33 0.79 -0.29 -2.95 0.00**
Duration of diabetes -0.03 0.11 -0.03 -0.28 0.78
Emotional regulation 0.08 0.05 0.18 1.60 0.11
Conscientiousness -0.10 0.06 -0.19 -1.67 0.10
Agreeableness 0.08 0.07 0.12 1.13 0.26
Extraversion -0.06 0.05 -0.13 -1.24 0.22
Openness to experience 0.12 0.05 0.27 2.43 0.02
R
2=0.24, F(9, 90) = 3.18, p=
0.00**
*Significant at the 0.05 level (2 tailed) **Significant at the 0.01 level (2 tailed)