Challenges in Measuring Glycaemic Index
108
135 Katja Hätönen RESEARCH Challenges in Measuring Glycaemic Index
-
Upload
khangminh22 -
Category
Documents
-
view
7 -
download
0
Transcript of Challenges in Measuring Glycaemic Index
135135 2014
Challenges in Measuring G
lycaemic Index
Katja Hätönen
135ISBN 978-952-302-289-8
RESE
ARCH
Katja Hätönen
Challenges in Measuring Glycaemic Index
RESE
ARCH
National Institute for Health and WelfareP.O. Box 30 (Mannerheimintie 166)FI-00271 Helsinki, FinlandTelephone: 358 29 524 6000www.thl.fi
Katja Hätönen
Glycaemic response to carbohydrate-containing foods is a combination of glucose absorption, endogenous glucose production, and tissue glucose uptake. The concept of the glycaemic index (GI) was developed to rank car-bohydrates according to their effect on blood glucose levels. The GI values of foods are classified into three categories: a GI value of 55 or less is conside-red low, 56-69 as medium, and 70 or more as high. Several methodological aspects influence measured GI values. This thesis considers some of these, e.g. the subject’s physiological background, choice of reference food, method of blood sampling, number of tests performed on the reference food, and the effect of fat, protein, coffee, and alcohol on the measured outcome.
Capillary blood samples should be used, and the reference glucose solution should be tested at least twice. Coffee as such does not modify the glucose and insulin responses to a carbohydrate food. Subjects’ physiological cha-racteristics, body weight, and glucose tolerance do not affect the measured GI values. Both fat and protein have an independent decreasing effect on glycaemia, and alcohol increases postprandial glucose and insulin responses.
Challenges in Measuring Glycaemic Index

RESEARCH 135 • 2014
Katja Hätönen
Challenges in Measuring Glycaemic Index
ACADEMIC DISSERTATION
To be presented with permission of the Faculty of Agriculture and Forestry of University of Helsinki for public examination in the Auditorium XII, University
Main Building, on October 24th, 2014, at12.
Department of Lifestyle and Participation, National Institute for Health and Welfare, Helsinki, Finland
and Department of Chronic Disease Prevention,
National Institute for Health and Welfare and
Department of Food and Environmental Science, Faculty of Agriculture and Forestry, University of Helsinki
Helsinki 2014
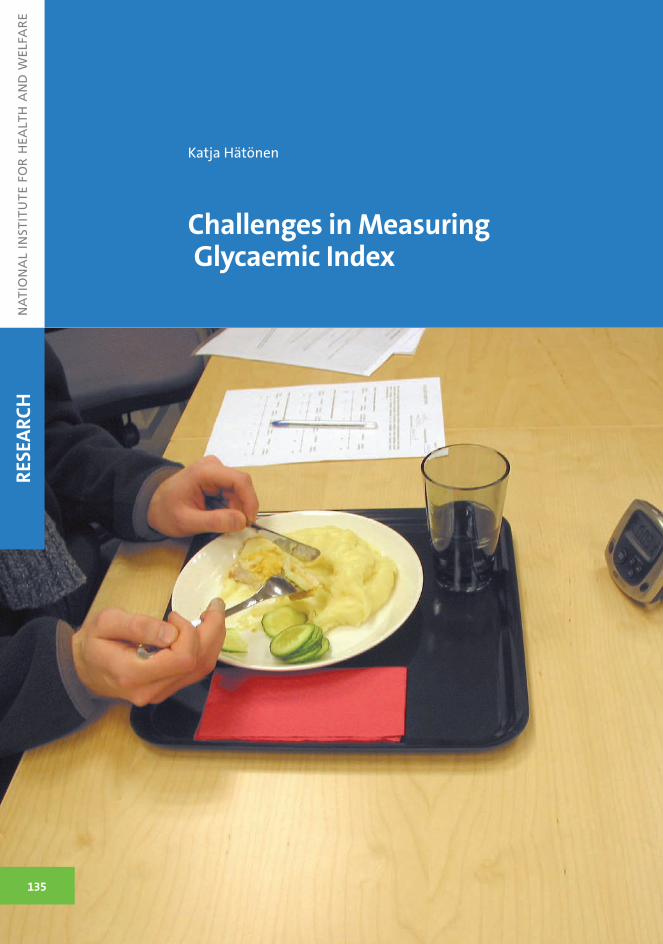
© Katja Hätönen and National Health Institute for Health and Welfare Cover photo: Katja Hätönen ISBN 978-952-302-289-8 (printed) ISSN 1798-0054 (printed) ISBN 978-952-302-290-4 (pdf) ISSN 1798-0062 (pdf)
Juvenes Print – Finnish University Print Ltd Tampere, Finland 2014
Supervisors Adjunct Professor Liisa Valsta, PhD Department of Lifestyle and Participation National Institute for Health and Welfare Helsinki, Finland (on leave of absence) and Evidence Management Unit European Food Safety Authority (EFSA) Parma, Italy and Research Professor Emeritus Jarmo Virtamo, MD, PhD Department of Chronic Disease Prevention National Institute for Health and Welfare Helsinki, Finland
and Professor Johan Eriksson, MD, DMSc Department of General Practice and Primary Health Care University of Helsinki Helsinki, Finland and Department of Chronic Disease Prevention National Institute for Health and Welfare Helsinki, Finland
Reviewers Professor Anne Raben, PhD Department of Nutrition, Exercise and Sports University of Copenhagen Copenhagen, Denmark and Adjunct Professor Marjukka Kolehmainen, PhD Department of Clinical Nutrition Institute of Public Health and Clinical Nutrition University of Eastern Finland Kuopio, Finland
Opponent Academy Professor Kaisa Poutanen, DTech Technical Research Centre of Finland (VTT) Espoo, Finland and Department of Clinical Nutrition Institute of Public Health and Clinical Nutrition University of Eastern Finland Kuopio, Finland


To my Family


THL — Research 135 • 2014 7 Challenges in Measuring Glycaemice Index
Abstract
Katja Hätönen. Challenges in Measuring Glycaemic Index. National Institute for Health and Welfare (THL). Research 135. 150 pages. Helsinki, Finland 2014. ISBN 978-952-302-289-8 (printed); ISBN 978-952-302-290-4 (pdf) Glycaemic response to carbohydrate-containing foods is a combination of glucose absorption, endogenous glucose production, and tissue glucose uptake. After a carbohydrate-containing meal, blood glucose rises, which stimulates insulin secretion. The different amount and type of carbohydrates influence postprandial glucose and insulin responses differently. The concept of the glycaemic index (GI) was developed to rank carbohydrates according to their effect on blood glucose levels. Food with a low GI value is considered beneficial in maintaining optimal blood glucose due to smaller incremental increase in blood glucose than food with a high GI value. Foods characterized by a low GI therefore have been found to induce benefits on several risk markers related to type 2 diabetes and cardiovascular disease. The concept of the GI was originally developed as a tool for individuals with diabetes in choosing the most beneficial carbohydrate-rich foods regarding blood glucose responses. To assess the extent to which eaten food raises insulin levels, the concept of the insulinaemic index (II) was launched. The calculation of II values is performed similarly to GI values.
The concept of GI has been widely studied and debated in the scientific literature. The main aim of this thesis was to investigate the effect of methodological choices on measured glucose and insulin responses, especially on GI values. To achieve these goals, five different postprandial studies were conducted in healthy individuals and in individuals with impaired glucose tolerance. Capillary and venous blood samples were collected up to 2-3 h postprandially and the incremental area under the curve (IAUC), GIs, and IIs were calculated.
In the first study, the effects of methodological choices on measured glycaemic response and GI values were determined. Comparisons were done between blood sampling type (capillary vs. venous blood samples), type of reference food (white bread vs. glucose solution), and how many times the reference food should be repeated. Results revealed that the variation was smaller when capillary samples were used, performing the reference food test twice is sufficient, and to achieve better accuracy the glucose solution should be used as the reference food.
In the second study, the effects of coffee on postprandial glucose and insulin responses were determined. Coffee as such does not modify the glucose and insulin responses of a carbohydrate food. Coffee had no marked effect on GI values.
In the third study, the effects of subjects’ physiological characteristics, namely glucose tolerance and overweight, on postprandial glucose and insulin responses were examined. Both overweight and impaired glucose tolerance increased glycaemic and insulinaemic responses to the tested meals and the reference food. As a consequence, physiological characteristics did not affect the measured GI values.
In the fourth study, the effects of other macronutrients, namely fat and protein, on glycaemic responses to a starchy food were examined. Both fat and protein have an independent decreasing effect on glycaemia, and as a consequence, GI values
THL — Research 135 • 2014 8 Challenges in Measuring Glycaemice Index
diminished. Insulin responses to the meals were also measured. Adding protein to the mashed potato-based meals considerably enhanced insulin responses to the meal.
In the fifth study, the effects of alcohol on postprandial glucose and insulin responses were determined. Alcohol was found to increase postprandial glucose and insulin responses, probably through acutely increased insulin resistance. In addition, high GI values were measured for both beer and non-alcoholic beer. This should be taken into account when GI databases are compiled for epidemiologic studies.
In summary, several factors affect measured GI values, highlighting that different methodological choices should be carefully considered. The use of recent international standards, for measuring GI values is highly recommended, and GI values measured prior to the standard should be interpreted and utilized with caution. To increase the reliability of GI measurements in the future, GI should be measured in combination with II measurements. Keywords: Glyacaemic index, insulinaemic index, glucose response, insulin response, postprandial responses
THL — Research 135 • 2014 9 Challenges in Measuring Glycaemice Index
Tiivistelmä
Katja Hätönen. Challenges in Measuring Glycamic Index [Glykeemisen indeksin mittaamisen haasteet]. Terveyden ja hyvinvoinnin laitos (THL). Tutkimus 135. 150 sivua. Helsinki, Finland 2014. ISBN 978-952-302-289-8 (printed); ISBN 978-952-302-290-4 (pdf) Hiilihydraattipitoisen elintarvikkeen verensokerivasteen muodostumiseen vaikuttavat hiilihydraattien imeytyminen, kehon oma glukoosintuotanto ja kudosten glukoosin sisäänotto. Aterian jälkeen verensokeri nousee, mikä stimuloi insuliinin eritystä. Erilaiset hiilihydraatit vaikuttavat aterianjälkeisiin verensokeri(glukoosi)- ja insuliinivasteisiin eri tavoin. Glykeeminen indeksi (GI) kehitettiin luokittelemaan hiilihydraattipitoisia elintarvikkeita niiden aikaansaamien verensokerivasteiden perustella. Elintarvikkeita, joilla on pieni GI, pidetään hyödyllisenä optimaalisen verensokeritason kannalta. Pienen GI:n elintarvikkeet nostavat verensokeria maltillisesti verrattuna suuren GI:n elintarvikkeisiin. Tästä johtuen pienen GI:n elintarvikkeiden syömisestä on osoitettu olevan hyötyä useiden kroonisten tautien, kuten tyypin 2 diabeteksen ja sydän- ja verisuonitautien, liittyvien riskitekijöiden kannalta. GI:n konsepti luotiin alun perin diabeetikoiden avuksi, jotta he voisivat valita mahdollisimman edullisia elintarvikkeista verensokerivasteiden kannalta. Syödyn elintarvikkeen insuliinivasteiden luokittelua varten kehitettiin insulineeminen indeksi (II), joka mitataan ja lasketaan samalla tavoin kuin elintarvikkeen GI.
GI-konsepti on paljon tutkittu ja tieteellinen keskustelu aiheesta on ollut runsasta. Tämän väitöstutkimuksen tarkoituksena oli tutkia menetelmällisten valintojen vaikutusta mitattuihin glukoosi- ja insuliinivasteisiin sekä etenkin GI-arvoihin. Väitöstutkimusta varten tehtiin viisi erillistä koesarjaa, joista neljä toteutettiin terveillä tutkittavilla ja yhdessä koesarjassa oli terveiden tutkittavien lisäksi tutkittavia, joiden glukoosinsieto oli heikentynyt. Tutkittavilta otettiin sormenpäästä ja laskimoista verinäytteitä kahden tai kolmen tunnin ajan. Näiden säännöllisin väliajoin otettujen verinäytteiden avulla määritettiin verensokeri- ja insuliinivasteet sekä laskettiin GI- ja II-arvot.
Ensimmäisessä koesarjassa tutkittiin menetelmällisten valintojen vaikutusta mitattuihin verensokerivasteisiin ja GI-arvoihin. Vertailuja tehtiin sormenpää- ja laskimoverinäytteiden välillä, kahden erilaisen vertailuelintarvikkeen (vaalea leipä vs. glukoosiliuos) ja sen välillä, kuinka monta kertaa vertailuelintarvike pitää testata. Tulokset osoittivat vaihtelun olevan pienempää, kun sormenpääverinäytteitä käytettiin verensokerivasteiden ja GI-arvojen mittaamiseen. Tulosten perusteella voidaan todeta, että vertailuelintarvikkeen toistaminen kerran aikaansaa riittävän mittaustarkkuuden ja vertailuelintarvikkeena tulisi käyttää glukoosiliuosta.
Toisessa koesarjassa tutkittiin vaikuttaako kahvi aterianjälkeisiin verensokeri- ja insuliinivasteisiin. Kahvi ei muokannut hiilihydraattipitoisen elintarvikkeen verensokeri- ja insuliinivasteita. Tästä johtuen kahvi ei vaikuta GI-arvojen mittaamiseen.
Kolmannessa koesarjassa tutkittiin tutkittavien fysiologisten ominaisuuksien, kuten glukoosinsiedon ja ylipainon, vaikutusta aterianjälkeisiin verensokeri- ja
THL — Research 135 • 2014 10 Challenges in Measuring Glycaemice Index
insuliinivasteisiin. Havaittiin, että tutkittavan ylipaino ja heikentynyt sokerinsieto suurentavat verensokeri- ja insuliinivasteita. Ylipainolla ja heikentyneellä sokerinsiedolla ei kuitenkaan havaittu olevan vaikutusta GI-arvoihin.
Neljännessä koesarjassa tutkittiin energiaravintoaineiden, rasvan ja proteiinin, vaikutusta tärkkelyspitoisen elintarvikkeen aikaansaamiin verensokerivasteisiin. Sekä rasva että proteiini pienensivät aterian aikaansaamaa verensokerivastetta. Tämän seurauksena GI-arvot laskivat. Koesarjassa määritettiin myös aterioiden insuliinivastee. Proteiinin lisääminen perunamuusiateriaan kasvatti insuliinivasteita huomattavasti.
Viidennessä koesarjassa tutkittiin alkoholin vaikutusta verensokeri- ja insuliinivasteisiin. Tutkimuksessa havaittiin, että alkoholi suurentaa verensokeri- ja insuliinivasteita. Tämä vaikutus välittyi todennäköisesti huonontuneen insuliiniherkkyyden kautta. Koesarjassa mitattiin suuret GI-arvot oluelle ja alkoholittomalle oluelle. Tämä havainto pitäisi ottaa huomioon, kun koostetaan GI-tietokantoja epidemiologisia tutkimuksia varten.
Yhteenvetona voidaan todeta useiden tekijöiden vaikuttavan mitattuihin GI-arvoihin. Tästä johtuen metodologisiin valintoihin tulee erityisesti kiinnittää huomiota. Määritettäessä GI-arvoja tulee noudattaa äskettäin julkaistua kansainvälistä standardia ja aiemmin mitattuja GI-arvoja pitää tulkita ja käyttää varoen. Jatkossa II-arvot tulisi mitata samanaikaisesti GI-arvojen kanssa. Käytäntö lisäisi mitattujen GI-arvojen luottavuutta. Avainsanat: Glykeeminen indeksi, insulineeminen indeksi, glukoosivaste, insuliinivaste, aterianjälkeiset vasteet
THL — Research 135 • 2014 11 Challenges in Measuring Glycaemice Index
Contents
Abstract ....................................................................................................................... 7 Tiivistelmä .................................................................................................................. 9 List of original papers ............................................................................................... 13 Abbreviations ............................................................................................................ 14 1 Introduction ............................................................................................................ 17 2 Review of the literature .......................................................................................... 19
2.1 Glycaemic index (GI), insulinaemic index (II), and glycaemic load (GL) ... 19 2.2 Protocol for measurement of GI .................................................................... 20 2.3 GI and GL and chronic diseases .................................................................... 21 2.4 Methodological choices affecting GI values ................................................. 22
2.4.1 Method of blood sampling .................................................................... 23 2.4.2 Reference and test food ......................................................................... 24 2.4.3 Coffee as a beverage in GI measurement .............................................. 29
2.5 Effects of subjects’ characteristics on GI values ........................................... 30 2.5.1 Glucose tolerance and insulin sensitivity .............................................. 30 2.5.2 Body weight .......................................................................................... 34
2.6 Macronutrients and glycaemic index ............................................................. 36 2.6.1 Fat .......................................................................................................... 36 2.6.2 Protein ................................................................................................... 36 2.6.3 Alcohol .................................................................................................. 41
3 Aims of the study ................................................................................................... 43 4 Subjects and methods ............................................................................................. 45
4.1 Study designs ................................................................................................. 45 4.2 Subjects .......................................................................................................... 46 4.3 Study foods, meals, and nutrient compositions ............................................. 48
4.3.1 Rye bread, instant mashed potato, and oatmeal porridge ...................... 48 4.3.2 Mashed potato-based meals .................................................................. 49 4.3.3 Coffee .................................................................................................... 49 4.3.4 Alcohol-containing beverages ............................................................... 49 4.3.5 Low- and high-GI meals ....................................................................... 53
4.4 Blood sampling and laboratory methods ....................................................... 56 4.4.1 Capillary blood glucose ......................................................................... 56 4.4.2 Venous blood glucose ........................................................................... 56 4.4.3 Capillary blood insulin .......................................................................... 56
4.5 Calculations and statistical analysis .............................................................. 57 4.5.1 Incremental area under the curve (IAUC) ............................................. 57 4.5.2 Glycaemic index (GI) ............................................................................ 58 4.5.3 Insulinaemic index (II) .......................................................................... 58 4.5.4 GI of the meal ........................................................................................ 59
THL — Research 135 • 2014 12 Challenges in Measuring Glycaemice Index
4.5.5 Statistical analysis ................................................................................. 59 5 Results .................................................................................................................... 61
5.1 Methodological choices ................................................................................. 61 5.1.1 Blood sampling ..................................................................................... 61 5.1.2 Reference food ...................................................................................... 66 5.1.3 Number of trials .................................................................................... 67 5.1.4 Coffee as the beverage of the meal ....................................................... 68
5.2 Subjects’ characteristics ................................................................................ 69 5.2.1 Glucose tolerance .................................................................................. 69 5.2.2 Body weight .......................................................................................... 70
5.3 Macronutrients ............................................................................................... 71 5.3.1 Fat .......................................................................................................... 71 5.3.2 Protein ................................................................................................... 72 5.3.3 Alcohol .................................................................................................. 73
6 Discussion .............................................................................................................. 75 6.1 Methodological choices ................................................................................. 75
6.1.1 Study design .......................................................................................... 75 6.1.2 Study foods and meals .......................................................................... 77 6.1.3 Blood sampling method ........................................................................ 78 6.1.4 Reference food ...................................................................................... 80 6.1.5 Number of reference food tests ............................................................. 80 6.1.6 Coffee .................................................................................................... 81
6.2 Subjects’ characteristics ................................................................................ 82 6.3 Macronutrients ............................................................................................... 83
6.3.1 Fat .......................................................................................................... 83 6.3.2 Protein ................................................................................................... 84 6.3.3 Alcohol .................................................................................................. 85
7 Conclusions ............................................................................................................ 87 8 Future perspectives ................................................................................................ 89 Acknowledgements ................................................................................................... 91 References ................................................................................................................. 93
THL — Research 135 • 2014 13 Challenges in Measuring Glycaemice Index
List of original papers
This thesis is based on the following original publications, which are referred to in the text by their Roman numerals:
I Hätönen KA, Similä ME, Virtamo JR, Eriksson JG, Hannila M-L, Sinkko HK, Sundvall JE, Mykkänen HM, Valsta LM. Methodologic considerations in the measurement of glycemic index: glycemic response to rye bread, oatmeal porridge, and mashed potato. Am J Clin Nutr 2006;84:1055-61.
II Hätönen KA, Virtamo J, Eriksson JG, Sinkko HK, Erlund I, Jousilahti P, Leiviskä JM, Valsta LM. Coffee does not modify postprandial glycaemic and insulinaemic responses induced by carbohydrates. Eur J Nutr 2012;51:801-806.
III Perälä MM, Hätönen KA, Virtamo J, Eriksson JG, Sinkko HK, Sundvall J, Valsta LM. Impact of overweight and glucose tolerance on postprandial responses to high and low glycaemic index meals. Br J Nutr 2011;105:1627-1634.
IV Hätönen KA, Virtamo J, Eriksson JG, Sinkko H, Sundvall J, Valsta LM. Protein and fat modify the glycaemic and insulinaemic responses of mashed potato-based meal. Br J Nutr 2011;106:248-253.
V Hätönen KA, Virtamo J, Eriksson JG, Perälä M-M, Sinkko HK, Leiviskä J, Valsta LM. Modifying effects of alcohol on the postprandial glucose and insulin responses in healthy subjects. Am J Clin Nutr 2012;96:44-49.
These articles are reproduced with the kind permission of their copyright holders. In addition, some unpublished material is included.
THL — Research 135 • 2014 14 Challenges in Measuring Glycaemice Index
Abbreviations
ACHO Available Carbohydrates
ANOVA Analysis of Variance
AUC Area under the Curve
BMI Body Mass Index
CCK Cholecystokinin
CV Coefficient of Variation
CVD Cardiovascular Disease
FAO Food and Agricultural Organization
FFQ Food Frequency Questionnaire
GI Glycaemic Index
GIP Gastric Inhibitory Peptide
GLP-1 Glucacon-Like Peptide 1
HOMA1-IR Homeostasis Model Assessment of Insulin Resistance
IAUC Incremental Area under the Curve
IFG Impaired Fasting Glucose
IGT Impaired Glucose Tolerance
II Insulinaemic Index
MMTT Mixed-meal Tolerance Test
NGT Normal Glucose Tolerance
OGTT Oral Glucose Tolerance Test
PUFA Polyunsaturated Fatty Acid
THL — Research 135 • 2014 15 Challenges in Measuring Glycaemice Index
PYY Peptide YY
RCT Randomized Controlled Trial
RGR Relative Glycaemic Response
SCFA Short-chain Fatty Acid
SD Standard Deviation
SEM Standard Error of Mean
SFA Saturated Fatty Acid
T1DM Type 1 Diabetes Mellitus
T2DM Type 2 Diabetes Mellitus
WHO World Health Organization

THL — Research 135 • 2014 17 Challenges in Measuring Glycaemice Index
1 Introduction
The quality of carbohydrates has been heavily debated in recent years. A joint FAO/WHO committee has recommended the consumption of a diet containing at least 55% of energy from carbohydrates to maintain health and prevent diseases (FAO/WHO 1998). Similar nutritional recommendations regarding the amount of carbohydrate and dietary fibre exist in Europe and America (EFSA 2010, Dietary Guidelines for Americans 2010). Interest in different carbohydrates is not a new issue. Already at the beginning of the 20th century, studies were conducted regarding the potency of carbohydrate-rich foods to increase blood glucose (Conn and Newburgh 1936). Glycaemic responses to various carbohydrate-containing foods were investigated more comprehensively in the 1970s (Otto and Niklas 1980). Later, the concept of the glycaemic index (GI) was introduced as an alternative system for classifying carbohydrate-containing foods (Jenkins et al. 1981). More recently, also insulin responses to foods were measured, and, correspondingly to the GI value, insulinaemic indices (IIs) were calculated (Bornet et al. 1987, Holt et al. 1992).
The nutritional properties of carbohydrates are influenced by the rate and extent of digestion and absorption in the small intestine (Wong and Jenkins 2007). Several factors affect postprandial glucose and insulin responses of carbohydrates and carbohydrate-containing foods, e.g. the chemical structure of a carbohydrate, food processing, and storage condition (Brand et al. 1985, Burton and Lightowler 2008, Larsen et al.2000, Simpson et al.1985b). In addition, other components of the ingested food, e.g. organic acids, fibre, protein, and fat, modify postprandial responses (Björck et al. 1994, Nuttall et al. 1984). There are also data on a second-meal effect indicating that the quality of a preceding meal impacts the glucose responses to the following meal (Axelsen et al. 1999, Axelsen et al. 2000, Granfeldt et al. 2006, Wolever et al. 1988c). These factors potentially provide a source of variability in both GIs and the day-to-day variability of glycaemic responses to the same food (Venn and Green 2007). However, the most important factor determining postprandial glucose and insulin responses is the amount of available carbohydrates food consumed (Wolever and Bolognesi 1996b, Wolever 2000). It is obvious that modulating carbohydrate digestion patterns can affect health in many ways. Postprandial hyperglycaemia and compensatory hyperinsulinaemia have been linked to the development of lifestyle-related chronic diseases such as type 2 diabetes and coronary heart disease (Giugliano et al. 2008, Riccardi et al. 2008). The risk of chronic diseases can be potentially modified by reducing glycaemic response to foods. It is supposed that low-GI foods cause a reduced rate of glucose absorption, which, in turn, elicits a diminished postprandial insulin response (Björck et al. 2000, Ludwig 2002). However, this assumption is not widely confirmed, with, for instance, inconsistencies occurring between glucose and insulin responses to milk
Introduction
THL — Research 135 • 2014 18 Challenges in Measuring Glycaemice Index
products (Östman et al. 2001). Protein increases the insulin response to carbohydrate-containing foods (Bao et al. 2011, Holt et al. 1997).
Despite three decades of research, the GI remains a contentious issue. Numerous GI values have been published to date. In the original study launching the GI concept, GI values for 62 food items were listed (Jenkins et al. 1981). The first international GI database was published in 1995 (Foster-Powell and Miller 1995). GI data have been compiled over time from different laboratories. However, the methodological choices have varied markedly between different laboratories, influencing the GIs measured. Since 1998, there has been an internationally accepted protocol for measuring GI values, but the protocol does not address all common methodological variations (FAO/WHO 1998). Vast variation exists in GI values of some food items listed in the international GI tables, which suggests that some GI testing groups are not using or only partially adhere to the WHO protocol (Nordic Council of Ministers. 2005).
This thesis aims to evaluate the effects of different methodological choices, e.g. type of blood sampling, choice of reference food, and number of the test of a reference food is repeated, on GI testing, the effect of subjects’ physiological background on GI values, and furthermore, the effects of macronutrients, fat, protein, and alcohol on postprandial glycaemia.
THL — Research 135 • 2014 19 Challenges in Measuring Glycaemice Index
2 Review of the literature
Carbohydrates are macronutrients that yield energy. The predominant carbohydrate-containing food groups in human nutrition are cereals, sweeteners, root crops, pulses, vegetables, fruit, and milk products. Of these, cereals are worldwide the most important source of energy in human nutrition (FAO/WHO 1998).
Carbohydrates can be classified based on the degree of polymerization. Carbohydrates are divided into three principal groups, i.e. sugars, oligosaccharides, and polysaccharides. The group of sugars consists of monosaccharides, e.g. glucose, fructose, and galactose, disaccharides, e.g. sucrose and lactose, and polyols (sugar alcohols), e.g. xylitol and sorbitol. The group of oligosaccharides consists of malto-oligosaccharides, raffinose, and fructo-oligosaccharides. The group of polysaccharides can be divided into starch and dietary fibre (non-starch polysaccharides). Carbohydrates can be also classified according to their physiological properties. Carbohydrates are then categorized as glycaemic and non-glycaemic carbohydrates, which simply means that glycaemic carbohydrates are capable of increasing blood glucose concentration, and non-glycaemic are not. Sugars, oligosaccharides, and starch are glycaemic carbohydrates, and dietary fibre and resistant starch are non-glycaemic carbohydrates (Cummings and Stephen 2007).
2.1 Glycaemic index (GI), insulinaemic index (II), and glycaemic load (GL)
Available carbohydrates (ACHO) are glycaemic carbohydrates, i.e. they increase blood glucose concentration, which in turn stimulates insulin secretion. Concentrations of blood glucose and insulin are primarily determined by intake of dietary carbohydrates, but such factors as body weight, genetic background, and epigenetic factors also have an effect. The concept of glycaemic index (GI) was introduced to classify the different sources of carbohydrates (CHO) and carbohydrate-rich foods according to their postprandial glycaemic responses (Jenkins et al. 1981). In other words, it is a method to physiologically classify carbohydrate-containing foods. GI was originally proposed for foods providing over 80% of their energy from available carbohydrates (Brouns et al. 2005). GI is defined as the incremental area under the blood glucose response curve (IAUC) of a 50-g carbohydrate portion of a test food expressed as a percentage of the response to the same amount of carbohydrate from a reference food consumed by the same subject (FAO/WHO 1998). The GI of a reference food is defined as 100. The GI values of foods are arbitrarily classified into three categories: a GI value of 55 or less is
Review of the literature
THL — Research 135 • 2014 20 Challenges in Measuring Glycaemice Index
considered low, 56-69 as medium, and 70 or more as high (International Standard ISO 26642:2010. 2010).
Insulin secretion is mainly stimulated by carbohydrates. However, postprandial insulin responses are not constantly proportional to blood glucose levels or to the carbohydrate content of the meal. Several insulinotropic factors are also recognized, including fructose, certain amino acids and fatty acids, and gastrointestinal hormones such as glucagon-like peptide-1 (GLP-1), gastric inhibitory peptide (GIP), and cholecystokinin (Collier et al. 1988). Initially, postprandial insulin responses were determined because it was suggested that merely measuring glycaemic response is insufficient (Coulston et al. 1984b, Hollenbeck et al. 1986). As a consequence, insulinaemic indices (IIs) were begun to be measured for carbohydrate-rich foods (Bornet et al. 1987, Brand Miller et al. 1995, Holt et al. 1992). The II indicates the insulinaemic response to different carbohydrate sources. II is measured and calculated in a similar way as GI values (WHO/FAO 1998). However, for II values no categories classifying values from low to high exist.
A considerable limitation of GI is that it is only a qualitative measure of carbohydrate that focuses on the ability of a carbohydrate to raise blood glucose. It does not take into account the effect of carbohydrate portion size on postprandial glucose responses. Thus, the concept of glycaemic load (GL) was introduced to account for the quantity of carbohydrate consumed. GL is proposed to be a better predictor of postprandial glucose response and insulin demand than available carbohydrate alone (Bao et al. 2011). GL is defined as the mathematical product of the GI of a food and its carbohydrate content (g) divided by 100 (GL = GI/100 × amount of available carbohydrate) (Salmeron et al. 1997). By definition, foods can be classified as having low (≤10), medium (10< 20), or high (≥20) GL value (Venn and Green 2007).
2.2 Protocol for measurement of GI After launching the concept of GI, several studies have used various procedures for measuring GI values. Typically, the protocol used has been adapted from the original procedure described by Wolever et al. (1991), which is in line with the protocol recommended by the FAO/WHO. The FAO/WHO expert report, published in 1998, has been referred to as the international standard. The protocol of determining GI values based on the recommendation of the FAO/WHO (1998) is briefly summarized as follows:
Review of the literature
THL — Research 135 • 2014 21 Challenges in Measuring Glycaemice Index
• At least six subjects should be studied • The portion of the study meal (the test or the reference food) should
contain 50 g of available carbohydrate, and it should be given to the participant after a 10- to12-h overnight fast
• The study meals should be tested in random order on separate days • A standard beverage of water, tea, or coffee should be given with each
study meal • The reference food can be either white bread or a glucose solution, and
the reference food should be tested at least three times in each subject • Either capillary or venous blood sampling can be used
Recent recommendations suggest that the amount of available carbohydrate be 25 g with foods having a low carbohydrate density to avoid a large test meal size (Brouns et al. 2005). The recommendation of the FAO/WHO (1998) also demonstrates how the GI can be applied to mixed meals or diets by calculating the weighted GI value of a meal or diet.
2.3 GI and GL and chronic diseases The concept of GI was originally developed to guide diabetic patients in food selection, with the focus on selecting foods with a low GI value. The underlying principle is that carbohydrates with a low GI value are absorbed at a slower rate, leading to a lower rise in blood glucose level (Brand et al. 1991). High-GI meals produce an initial period of high blood glucose and insulin concentrations, followed by reactive hypoglycaemia, counter-regulatory hormone secretion, and elevated nonesterified fatty acids (NEFAs) (Ludwig 2002). Evidence also suggests that diets with high GI or GL can cause oxidative stress and inflammatory responses (Kristo et al. 2013, Levitan et al. 2008).
A consensus exists that a low or attenuated glycaemic response is beneficial for both healthy and diabetic persons. Low-GI foods are useful in management of diabetes, obesity, and cardiovascular diseases (CVDs) (Ajala et al. 2013, Kelly et al. 2004, Thomas et al. 2007, Thomas and Elliott 2009). A recent randomized controlled trial did not, however, find a difference in weight loss when a moderate-carbohydrate (energy from carbohydrates 42%) low-GI diet was compared with a moderate-carbohydrate high-GI diet (Juanola-Falgarona et al. 2014). An earlier result was that a modest reduction in diet GI led to maintenance of weight loss after
Review of the literature
THL — Research 135 • 2014 22 Challenges in Measuring Glycaemice Index
a 26-week period (Larsen et al. 2010). However, a sustained effect of lower diet GI on weight regain was not observed in the subgroup analysis after one year (Aller et al. 2014).
Meta-analyses of prospective cohort studies have shown that dietary GI and GL are positively associated with increased risk of type 2 diabetes in both genders (Bhupathiraju et al. 2014, Livesey et al. 2013) and with coronary heart disease (CHD) events in women, but not in men (Mirrahimi et al. 2012). According to a meta-analysis of randomized controlled trials, low-GI meals improved blood glucose control in people with diabetes (Brand-Miller et al. 2003). In addition, a recent meta-analysis of RCTs has revealed a beneficial effect of long-term low-GI diets on fasting insulin in overweight subjects (Schwingshackl and Hoffmann 2013).
An increased consumption of low-GI foods and substituting low-GL foods for higher GL foods are advocated in nutritional recommendations (Evert et al. 2014, FAO/WHO 1998). Some concerns exist about nutrient adequacy when low-GI diets are followed, especially if nutritious high-GI foods, such as whole-grain breads and potatoes, are excluded from the diet. A recent study revealed, however, that a low-GI diet can be a more nutritionally adequate diet than a high-GI diet (Louie et al. 2012). Nevertheless, excluding high-GI whole-grain breads may not be wise because whole-grain breads, especially rye breads, have been shown to have positive effects on insulin metabolism (Juntunen et al. 2003b, Laaksonen et al. 2005).
2.4 Methodological choices affecting GI values Several factors, including type of starch, fibre content, ripeness, fat content, acid content, polyphenol content, and the physical form of an eaten food, can affect glycaemic response to the food (Aldughpassi et al. 2012, Björck et al. 1994, Törrönen et al. 2013). In general, it is incorrect to assume that all simple sugars (monosaccharides and disaccharides) have high GI values and “complex” carbohydrates, such as whole-grains or high-fibre foods, have low GI values. GI values for the major dietary sugars vary between 20 for fructose and 108 for maltose (Atkinson et al. 2008). Sucrose has a medium GI of ~60 because it contains only half the glucose-equivalents of an equal amount of glucose or starch. Intake of high-GI foods, including sugar-sweetened beverages (irrespective of GI value), results in a rapid rise in blood glucose, whereas low-GI foods, including non-starchy vegetables, milk, most fruits, legumes, and nuts, digest slower, therefore resulting in a more gradual rise in blood sugar levels (Brand-Miller et al. 2009). Accordingly, GI values do not directly correlate to the molecular weight of the carbohydrate component per se (Björck et al. 2000). For example, monosaccharides, glucose, and fructose have very different GI values (Jenkins et al. 1981, Lee and Wolever 1998). Differences in GI values are explained by the metabolism of glucose and fructose.
Review of the literature
THL — Research 135 • 2014 23 Challenges in Measuring Glycaemice Index
Firstly, fructose is poorly absorbed, and secondly, it has to be converted to glucose in the liver (Riby et al. 1993, Sun and Empie 2012).
In the Western world, carbohydrate-containing staple foods, including breads, potatoes, breakfast cereals, porridges, and other processed cereal foods, typically have high GI values due to the high degree of starch gelatinization, which leads to more rapid digestion and absorption (Atkinson et al. 2008). Current processing methods allow the starch to become fully hydrated and, as a consequence, rapidly hydrolysed into glucose in the intestinal tract, which may to lead to high GI values among most varieties of potato products, bread, breakfast cereals, and porridges (Brand et al. 1985). Even storage and preparation conditions, namely freezing and toasting, have an influence on glycaemic response to white bread and may affect GI values. A recent study reported that frozen and toasted white bread produced significantly lower (up to ~46% lower depending on condition) glycaemic responses than fresh white bread. The breads were tested in equivalent amounts of available carbohydrate (Burton and Lightowler 2008). Furthermore, reducing white bread volume from 3000 ml to 2400, 1700, and 1100 ml led to 14%, 28% and 62% reductions in GI values, respectively. All tested breads contained 50 g of available carbohydrate (Burton and Lightowler 2006).
Most information regarding starchy foods indicates a linear correlation between GIs and IIs, suggesting that low-GI foods are also less insulin-demanding (Björck et al. 2000). On the other hand, glucose responses are not always proportional to insulin responses (Holt et al. 1997). Inconsistency between glucose and insulin responses to milk products (typically low GI, but high II) and to rye products (typically high glucose responses, but moderate insulin responses) has been found in both healthy subjects and subjects with type 2 diabetes (Gannon et al. 1986, Juntunen et al. 2003a, Östman et al. 2001).
2.4.1 Method of blood sampling According to the FAO/WHO protocol, both capillary and venous blood sampling are considered acceptable to assess glycaemic responses to food. Both sampling methods are widely used (Atkinson et al. 2008), but the recent recommendation favours capillary blood sampling (Brouns et al. 2005). Differences between glycaemic responses may potentially also be due to the method of blood sampling. In postprandial studies, capillary blood sampling has produced a greater magnitude and less variability in glucose response than venous blood sampling (Granfeldt et al. 1995, Wolever et al. 1988b, Wolever and Bolognesi 1996a, Wolever et al. 2003, Vrolix and Mensink 2010). This suggests that capillary blood sampling increases sensitivity in GI testing (Wolever et al. 2003).
The FAO/WHO recommends drawing seven blood samples over 2 h when determining GI. The blood samples should be taken at 15-min intervals during the
Review of the literature
THL — Research 135 • 2014 24 Challenges in Measuring Glycaemice Index
first hour and at 30-min intervals during the second hour after the study meal. The area under the curve (AUC) should be calculated as the incremental AUC, ignoring the area beneath the fasting concentration (FAO/WHO 1998). The method was firstly described in detail by Wolever and Jenkins (1986). However, alternative methods of calculating AUC have also been used (Ha et al. 1992, Wolever 1989, Wolever 2004).
If the area below the fasting concentration was included in the calculation of the AUC, the AUC would be larger than ignoring the area below the fasting concentration. This means that GI values, as a consequence, may be smaller. However, the greater problem is the presence of a correlation between the GI value and the AUC. This may indicate that the method is invalid because the fasting glucose and the glucose tolerance of the subject should not affect GI values (Ha et al. 1992, Wolever 2004). Using the IAUC in the calculation also diminishes variation, and no significant correlation exists between GI and IAUC (Wolever 2004).
2.4.2 Reference and test food Glucose solution and white bread are generally used as reference foods in GI testing. Some studies also use rice or some other local starch-containing food as the reference (Sugiyama et al. 2003). In the study of Jenkins et al. (1981) the original reference food was a glucose solution, but shortly after launching the GI concept, white bread became more commonly used as a reference (Jenkins et al. 1983). The use of white bread has been advocated because it is closer to a physiological meal than a glucose solution (Wolever et al. 1985, Wolever et al. 1991). Moreover, subjects have complained that the sweetness of the glucose solution is nauseating. On the other hand, the high osmotic load caused by a glucose solution may lead to delayed gastric emptying, which may modify the results. White bread and other starchy foods contain fat and protein, while a glucose solution does not. As known, protein stimulates insulin secretion (Nuttall et al. 1984), which leads to greater insulin responses to starchy foods than to glucose solution despite lower glucose responses. Thus, one of the advantages of white bread is that the GI and II values are related (Bornet et al. 1987, Wolever et al. 1988b).
However, differences in the composition and digestibility characteristics of white bread from one experiment to another have been proposed to reduce its usability as a reference food (Bornet et al. 1987, Wolever et al. 2003). There have been contradictory findings regarding the variation of glucose responses when IAUCs of white bread and glucose solution have been compared. White bread and glucose solution have produced similar variation (Williams et al. 2008, Wolever et al. 2003) in contrast to the earlier findings where glucose solution produced 1.7 times higher variation than white bread (Wolever et al. 1996) (Table 1). In the interlaboratory study comparing the results of seven laboratories, the variability of GI values of white

Review of the literature
THL — Research 135 • 2014 25 Challenges in Measuring Glycaemice Index
bread was locally obtained and the portion size was based on local food tables, was similar to that of other foods provided (Wolever et al. 2003). However, a glucose solution should be used as the reference to ensure international standardization (Bornet et al. 1987, Wolever et al. 2003). Comparing different studies, the GIs are typically higher when white bread is used as the reference food. If white bread is used as the reference, the value should be multiplied by 0.71 for conversion to a glucose solution (FAO/WHO 1998).
Table 1. Coefficients of variation (CV) within subjects after intake of white bread and glucose solution1.
Reference Replicates White bread Glucose solution P
Wolever et al. 1996 3 12.7 21.42 ns
Wolever et al. 2003 3 27.7 23.1 ns
Williams et al. 2008 33 25.9 25.3 ns 1 Amount of available carbohydrate 50 g 2 Amount of available carbohydrate 75 g 3 Replicates of glucose solution 4
The number of reference tests affects the variability of GI values (Table 2). To
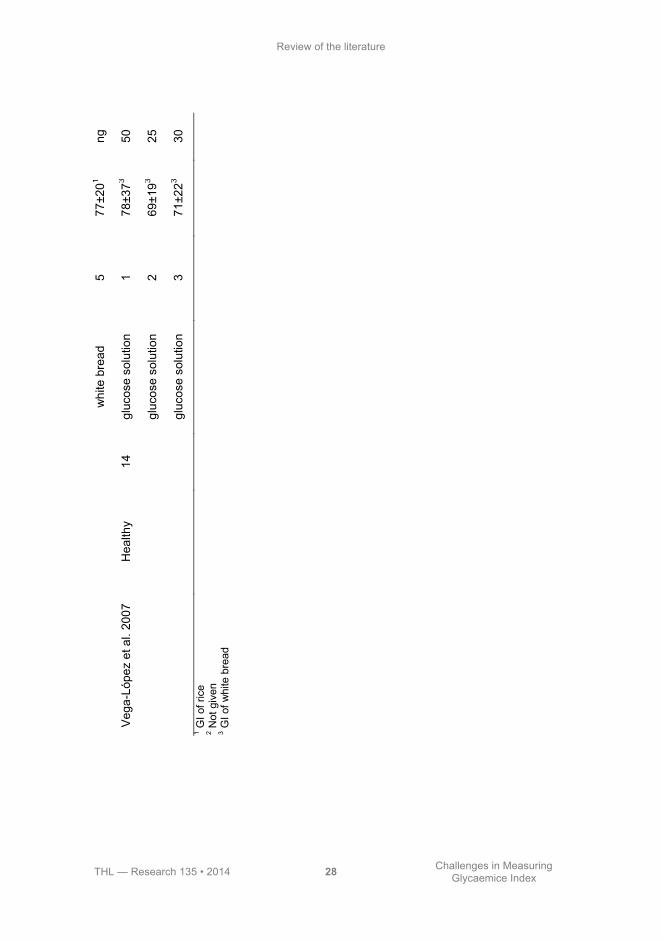
reduce variability, each subject should have at least three reference tests (Wolever et al. 1991). When only one test of the reference food was used to calculate the GI of the test food (Vega-Lopez et al. 2007, Wolever et al. 2003), it resulted in higher GI values and SDs than when GI was calculated using the mean of three tests, but contradictory findings have also been presented (Wolever et al. 1985). In a study where the reference food was tested several times in diabetic subjects, two additional tests did not improve accuracy. The GI values, SDs, and CVs did not improve when four or five reference tests were used (75.9±19.4, CV 26% and 76.6±19.7, CV 26%, respectively) relative to the GI estimate with three reference tests (75.4±18.9, CV 25%) (Wolever et al. 1985). The FAO/WHO protocol (FAO/WHO 1998) advocates testing the reference food three times, but adherence to the protocol has not been systematic. As repeating the test of the reference food improves reliability, it is important to evaluate the required number of reference tests to find a balance between the accuracy of GI values, the costs of testing, and the burden to participants (Brouns et al. 2005).
The GI values of test foods are calculated as a ratio of the test food IAUC and the mean of reference food IAUCs. As a consequence, the reference food is the denominator of each test food in the experiment, but repeating measurements of the test food will also improve precision of GI estimates (Brouns et al. 2005). In a study where the test food was repeated once, the between-subject variation diminished from 19% to 17%, but there was no significant effect on GI value (GIs for rice
Review of the literature
THL — Research 135 • 2014 26 Challenges in Measuring Glycaemice Index
80.5±15.2, tested once, and 83.4±14.9, tested twice) (Wolever et al. 1985). Similar findings were demonstrated in a study where four different test meals (rice, mashed potato, pumpernickel, and rye bread) were tested twice (Wolever et al. 1989). The variation decreased, but there was no significant difference between GI values. In another study, Wolever et al. (1990) evaluated two test meals, rice and spaghetti, and the reference food, white bread, four times each. They found that when individual tests were compared, differences in GI obtained were mainly due to day-to-day variability within the same subject (Wolever et al. 1990). Thus, repeating the test meal will also diminish variation in measured GI values. Currently, however, there is no recommendation for repeating measurements of the test food.

Review of the literature
THL — Research 135 • 2014 27 Challenges in Measuring Glycaemice Index
Ta
ble
2.
Gly
caem
ic in
dex
(GI)
and
repe
atin
g th
e re
fere
nce
food
.
Stu
dy
Su
bje
cts
n
R
efe
ren
ce
Rep
lic
ate
s
Me
an
±S
D
CV
%
Wol
ever
et a
l. 19
85
Type
2 D
M
10
whi
te b
read
1
68±2
21 ng
2
w
hite
bre
ad
2 72
±201
ng
w
hite
bre
ad
3 74
±201
ng
w
hite
bre
ad
4 74
±201
ng
w
hite
bre
ad
5 74
±191
ng
Ty
pe 1
DM
6
whi
te b
read
1
76±2
81 ng
w
hite
bre
ad
2 80
±251
ng
w
hite
bre
ad
3 77
±191
ng
w
hite
bre
ad
4 79
±181
ng
w
hite
bre
ad
5 82
±221
ng
D
iabe
tic
16
whi
te b
read
1
71±2
41 ng
w
hite
bre
ad
2 75
±221
ng
w
hite
bre
ad
3 75
±191
25
w
hite
bre
ad
4 76
±191
ng
Review of the literature
THL — Research 135 • 2014 28 Challenges in Measuring Glycaemice Index
whi
te b
read
5
77±2
01 ng
Veg
a-Ló
pez
et a
l. 20
07
Hea
lthy
14
gluc
ose
solu
tion
1 78
±373
50
gl
ucos
e so
lutio
n 2
69±1
93 25
gl
ucos
e so
lutio
n 3
71±2
23 30
1 G
I of r
ice
2 Not
giv
en
3 GI o
f whi
te b
read

Review of the literature
THL — Research 135 • 2014 29 Challenges in Measuring Glycaemice Index
2.4.3 Coffee as a beverage in GI measurement Caffeine ingested with a glucose solution has elicited greater blood glucose and insulin responses than glucose solution alone during an oral glucose tolerance test (OGTT) (Battram et al. 2006, Graham et al. 2001, Lane et al. 2004, Petrie et al. 2004, Thong and Graham 2002) (Table 3). Studies focusing on how caffeine in coffee affects postprandial glucose and insulin responses have produced inconsistent findings regarding postprandial glucose responses (Battram et al. 2006, Johnston et al. 2003, Pizziol et al. 1998) (Table 3).
Coffee is generally allowed as a drink in GI measurement, but the practice is not widely encouraged. Concerns have been expressed about the confounding effects of caffeine-containing beverages on GI measurement. Therefore, the recommendation is that subjects drink only water during GI measurement (Brouns et al. 2005). However, the effect of coffee on GI values remains open. In a previous study, coffee (250 ml) had no significant effect on glucose IAUCs of solid carbohydrate-containing test meals, but significantly increased the blood glucose concentration at 30 or 45 min compared with water (Aldughpassi and Wolever 2009b, Young and Wolever 1998).
Table 3. Effect of caffeine and coffee on glucose and insulin responses.
Study Glycaemia P Insulinaemia P
Graham et al.. 2001 Caffeine 24% ↑ ns 60% ↑ ≤0.001
Thong&Graham 2002 Caffeine - ns 38% ↑ <0.05
Lane et al.. 2004 Caffeine 21% ↑ 0.04 48% ↑ 0.01
Petrie et al.. 2004 Caffeine 10% ↑ ns 14% ↑ ≤0.05
Battram et al.. 2006 Caffeine 55% ↑ ≤0.05 48% ↑ ≤0.05
Pizziol et al.. 1998 Coffee 10% ↑ <0.001 2% ↑ ns
Johnston et al.. 2003 Coffee 1% ↑ ns 7% ↑ ns
Battram et al.. 2006 Coffee 4% ↓ ns 21% ↑ ns
↑=increase compared with caffeine capsules or decaffeinated coffee
↓=decrease compared with caffeine capsules or decaffeinated coffee

Review of the literature
THL — Research 135 • 2014 30 Challenges in Measuring Glycaemice Index
2.5 Effects of subjects’ characteristics on GI values Subjects’ characteristics, including age, sex, body mass index (BMI), and ethnicity, influence postprandial glycaemia. Differences in postprandial glycaemia are also due to differences in insulin sensitivity and secretion (Pi-Sunyer 2002). People who require a normal amount of insulin to process glucose are insulin-sensitive. Insulin resistance indicates an abnormal physiological response to insulin in its target tissues. In insulin-resistant subjects, postprandial glucose uptake is promoted by two factors, hyperinsulinaemia and hyperglycaemia. Hyperinsulinaemia will compensate impaired insulin action, and hyperglycaemia promotes tissue glucose uptake. Postprandial insulin response can be almost twofold higher in insulin-resistant subjects relative to insulin-sensitive subjects (Galgani and Ravussin 2012).
One of the concerns regarding GI has been that GI values are inconsistent due to variation between individuals, but no recommendation has been given regarding subjects’ background (FAO/WHO 1998). Reports have indicated that GI values are not significantly related to gender or ethnicity (Henry et al. 2008, Wolever et al. 2003, Wolever et al. 2008), but contradictory findings have also been described (Kataoka et al. 2013, Venn et al. 2010, Wolever et al. 2009). While the prevalence of impaired fasting glucose and diabetes is known to increase with age (Cowie et al. 2010), it has been suggested that GIs are not affected by age (Wolever et al. 1988a, Wolever et al. 2008, Wolever et al. 2009). The GI values of lentils measured among diabetic children and adults were virtually identical (Wolever et al. 1988a). In a recent study, however, older age increased postprandial glycaemia, resulting in a 25% higher GI value of cornflakes (P=0.008) compared with in a group of younger subjects (Venn et al. 2011).
Knowledge is still lacking regarding the mean and variation of GI data measured are in insulin-resistant or overweight subjects relative to the data measured in healthy subjects (Brouns et al. 2005).
2.5.1 Glucose tolerance and insulin sensitivity Subjects’ glucose tolerance influences their glucose and insulin responses. Postprandial glucose responses are greater in diabetic subjects and subjects with impaired glucose tolerance (IGT) than in subjects with normal glucose tolerance. Disease duration also affects insulin secretion; in long-standing type 2 diabetes insulin, secretion is usually reduced (Taylor 2013). Use of subjects with normal glucose tolerance has been recommended in GI testing because the variability in glycaemic response is greater in subjects with impaired glucose tolerance (Brouns et al. 2005). However, expressing glucose response to a tested food as a percentage of glucose response to the reference food should lead to similar GI values despite the subjects’ characteristics. In other words, the factors that affect glucose and insulin responses may not necessarily affect GI. However, the studies that have determined

Review of the literature
THL — Research 135 • 2014 31 Challenges in Measuring Glycaemice Index
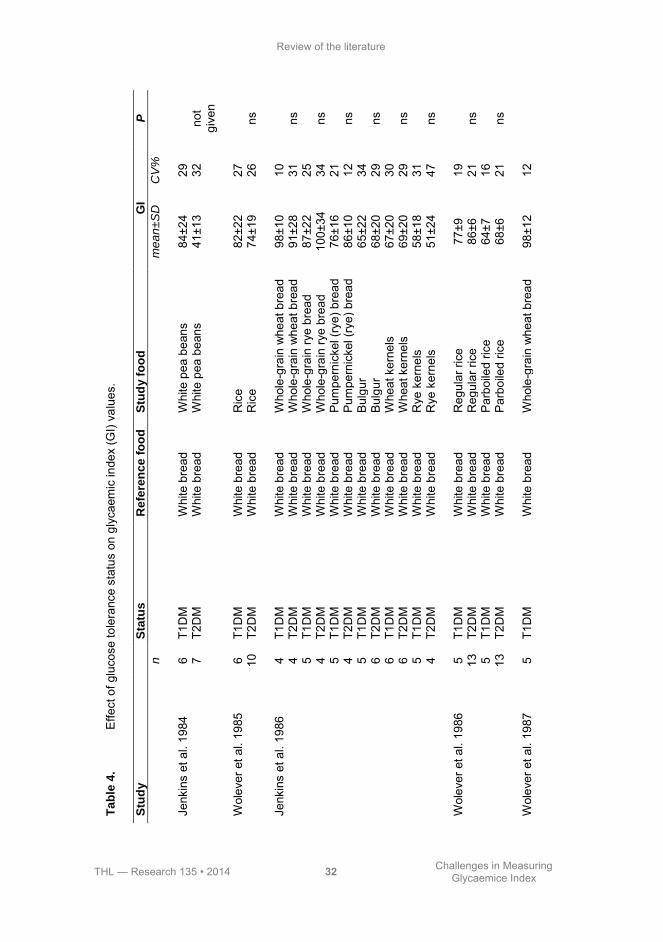
whether GI values are affected by subjects’ characteristics have compared healthy subjects with type 2 diabetic subjects (only two studies) or compared type 2 diabetic subjects with type 1 diabetic subjects (Jenkins et al. 1984, Jenkins et al. 1986, Wolever et al. 1985, Wolever et al. 1986, Wolever et al. 1987, Wolever et al. 1989) (Table 4). The GI values determined in subjects with diabetes or impaired glucose tolerance were separated from the values in healthy subjects in the latest international GI database (Atkinson et al. 2008). However, there are only a few studies that have assessed the effects of glucose tolerance and insulin sensitivity on GI values (Lan-Pidhainy and Wolever 2011, Wolever et al. 1998a) (Table 4). In addition, in many of the above-mentioned studies, the number of subjects was less than 10, which is the minimum number of subjects required for qualified GI studies (ISO 26642:2010. 2010). Further research is needed to clarify the effects of glucose tolerance on measured GI values.
Review of the literature
THL — Research 135 • 2014 32 Challenges in Measuring Glycaemice Index
Ta
ble
4.
Effe
ct o
f glu
cose
tole
ranc
e st
atus
on
glyc
aem
ic in
dex
(GI)
valu
es.
Stu
dy
S
tatu
s
Refe
ren
ce
fo
od
S
tud
y f
oo
d
GI
P
n
me
an
±S
D
CV
%
Je
nkin
s et
al.
1984
6
T1D
M
Whi
te b
read
W
hite
pea
bea
ns
84±2
4 29
7
T2D
M
Whi
te b
read
W
hite
pea
bea
ns
41±1
3 32
no
t gi
ven
Wol
ever
et a
l. 19
85
6 T1
DM
W
hite
bre
ad
Ric
e 82
±22
27
10
T2D
M
Whi
te b
read
R
ice
74±1
9 26
ns
Je
nkin
s et
al.
1986
4
T1D
M
Whi
te b
read
W
hole
-gra
in w
heat
bre
ad
98±1
0 10
4
T2D
M
Whi
te b
read
W
hole
-gra
in w
heat
bre
ad
91±2
8 31
ns
5 T1
DM
W
hite
bre
ad
Who
le-g
rain
rye
brea
d 87
±22
25
4 T2
DM
W
hite
bre
ad
Who
le-g
rain
rye
brea
d 10
0±34
34
ns
5 T1
DM
W
hite
bre
ad
Pum
pern
icke
l (ry
e) b
read
76
±16
21
4 T2
DM
W
hite
bre
ad
Pum
pern
icke
l (ry
e) b
read
86
±10
12
ns
5
T1D
M
Whi
te b
read
B
ulgu
r 65
±22
34
6 T2
DM
W
hite
bre
ad
Bul
gur
68±2
0 29
ns
6 T1
DM
W
hite
bre
ad
Whe
at k
erne
ls
67±2
0 30
6
T2D
M
Whi
te b
read
W
heat
ker
nels
69
±20
29
ns
5
T1D
M
Whi
te b
read
R
ye k
erne
ls
58±1
8 31
4
T2D
M
Whi
te b
read
R
ye k
erne
ls
51±2
4 47
ns
W
olev
er e
t al.
1986
5
T1D
M
Whi
te b
read
R
egul
ar ri
ce
77±9
19
13
T2
DM
W
hite
bre
ad
Reg
ular
rice
86
±6
21
ns
5
T1D
M
Whi
te b
read
P
arbo
iled
rice
64±7
16
13
T2
DM
W
hite
bre
ad
Par
boile
d ric
e 68
±6
21
ns
Wol
ever
et a
l. 19
87
5 T1
DM
W
hite
bre
ad
Who
le-g
rain
whe
at b
read
98
±12
12

Review of the literature
THL — Research 135 • 2014 33 Challenges in Measuring Glycaemice Index
11
T2
DM
W
hite
bre
ad
Who
le-g
rain
whe
at b
read
95
±23
24
ns
6
T1D
M
Whi
te b
read
W
hole
-gra
in ry
e br
ead
94±2
5 27
9
T2D
M
Whi
te b
read
W
hole
-gra
in ry
e br
ead
90±2
2 24
ns
6 T1
DM
W
hite
bre
ad
Pum
pern
icke
l bre
ad
88±3
2 36
9
T2D
M
Whi
te b
read
P
umpe
rnic
kel b
read
79
±10
13
ns
Wol
ever
et a
l. 19
89
6 T1
DM
W
hite
bre
ad
Pum
pern
icke
l 87
±27
31
5 T2
DM
W
hite
bre
ad
Pum
pern
icke
l 80
±12
15
ns
6
T1D
M
Whi
te b
read
R
ye b
read
86
±18
21
5 T2
DM
W
hite
bre
ad
Rye
bre
ad
86±1
4 16
ns
W
olev
er e
t al.
1998
10
H
ealth
y G
luco
se
Dia
bete
s sc
reen
ing
prod
uct
51±1
9 37
9
IGT
Glu
cose
D
iabe
tes
scre
enin
g pr
oduc
t 52
±12
23
8
T2D
M
Glu
cose
D
iabe
tes
scre
enin
g pr
oduc
t 54
±6
11
ns
Lan-
Pid
hain
y et
al.
2011
9
Hea
lthy
Glu
cose
S
ucro
se
68±2
7 40
12
H
yper
insu
linae
mic
1 G
luco
se
Suc
rose
69
±21
30
10
T2D
M
Glu
cose
S
ucro
se
68±1
6 24
0.
95
9
Hea
lthy
Glu
cose
M
ashe
d po
tato
10
1±21
21
12
H
yper
insu
linae
mic
1 G
luco
se
Mas
hed
pota
to
81±3
5 43
10
T2
DM
G
luco
se
Mas
hed
pota
to
98±1
6 16
0.
20
9
Hea
lthy
Glu
cose
W
hite
bre
ad
63±3
3 52
12
H
yper
insu
linae
mic
1 G
luco
se
Whi
te b
read
70
±21
30
10
T2D
M
Glu
cose
W
hite
bre
ad
71±1
9 27
0.
13
9
Hea
lthy
Glu
cose
R
ice
61±2
1 34
12
H
yper
insu
linae
mic
1 G
luco
se
Ric
e 72
±24
33
10
T2D
M
Glu
cose
R
ice
70±3
2 46
0.
10
9
Hea
lthy
Glu
cose
B
arle
y 58
±18
31
12
Hyp
erin
sulin
aem
ic1
Glu
cose
B
arle
y 44
±21
48
10
T2D
M
Glu
cose
B
arle
y 47
±16
34
0.55
1 H
yper
insu
linae
mic
= fa
stin
g se
rum
insu
lin ≥
40 p
mol
/l (T
his
cut-o
ff po
int
was
cho
sen
beca
use
it re
pres
ents
app
roxi
mat
ely
the
67th p
erce
ntile
for
non
-dia
betic
subj
ects
in th
e la
bora
tory
of W
olev
er e
t al.
(Lan
-Pid
hain
y an
d W
olev
er 2
011)
).
Review of the literature
THL — Research 135 • 2014 34 Challenges in Measuring Glycaemice Index
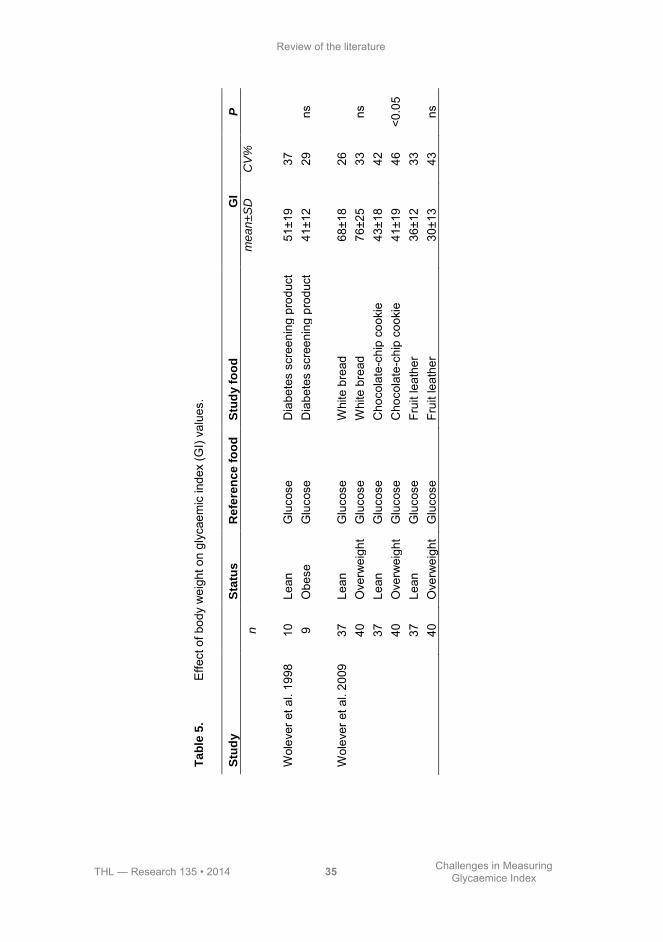
2.5.2 Body weight A strong association exists between overall obesity and risk of type 2 diabetes (Chan et al. 1994). Obesity increases insulin response by enhancing insulin secretion due to insulin resistance (Elahi et al. 1982), and also decreases insulin clearance (Jones et al. 2000, Meistas et al. 1983). Obese individuals tend to have higher insulin responses to a 75-g oral glucose challenge (Kim and Reaven 2008), but there are only a few studies have focused on the effect of body weight on GI values (Table 5). Overweight and obese subjects tended to produce smaller GI values than their leaner peers (Wolever et al. 2009, Wolever et al. 1998b), but the variation was smaller in lean subjects (Table 5). Based on the results of two interlaboratory studies, the subject’s BMI appears not to significantly alter GI values (Wolever et al. 2003, Wolever et al. 2008), but more studies are needed to confirm this (Brouns et al. 2005).
Review of the literature
THL — Research 135 • 2014 35 Challenges in Measuring Glycaemice Index
Ta
ble
5.
Effe
ct o
f bod
y w
eigh
t on
glyc
aem
ic in
dex
(GI)
valu
es.
Stu
dy
S
tatu
s
Refe
ren
ce
fo
od
S
tud
y f
oo
d
GI
P
n
me
an
±S
D
CV
%
W
olev
er e
t al.
1998
10
Le
an
Glu
cose
D
iabe
tes
scre
enin
g pr
oduc
t 51
±19
37
9 O
bese
G
luco
se
Dia
bete
s sc
reen
ing
prod
uct
41±1
2 29
ns
W
olev
er e
t al.
2009
37
Le
an
Glu
cose
W
hite
bre
ad
68±1
8 26
40
O
verw
eigh
t G
luco
se
Whi
te b
read
76
±25
33
ns
37
Le
an
Glu
cose
C
hoco
late
-chi
p co
okie
43
±18
42
40
Ove
rwei
ght
Glu
cose
C
hoco
late
-chi
p co
okie
41
±19
46
<0.0
5
37
Lean
G
luco
se
Frui
t lea
ther
36
±12
33
40
Ove
rwei
ght
Glu
cose
Fr
uit l
eath
er
30±1
3 43
ns
Review of the literature
THL — Research 135 • 2014 36 Challenges in Measuring Glycaemice Index
2.6 Macronutrients and glycaemic index As foods are seldom eaten alone, it is essential for the GI to also apply well to mixed meals. However, glycaemic and insulinaemic responses to mixed meals are modified by the amount of macronutrients in the meals. According to Wolever et al. (2006a), carbohydrate content and GI together explain about 90% of the variation of the glycaemic responses to mixed meals, and fat and protein have only negligible effects on glycaemic response. On the other hand, a study by Flint et al. (2004) suggested that the GI value of a meal is more strongly correlated with either the fat or protein content than the carbohydrate content alone. Regarding insulin responses, Wolever et al. (2006a) observed a strong correlation between the glycaemic and insulinaemic responses to mixed meals. However, mixed meals with similar carbohydrate contents induce a wide range of insulin responses, and the fat content of a mixed meal has a significant inverse relation with the insulinaemic responses (Bao et al. 2009).
2.6.1 Fat Fat reduces glycaemic responses by delaying gastric emptying and enhancing the secretion of incretins such as GLP-1 and GIP (Collier and O'Dea 1983, Deane et al. 2010, Gannon et al. 1993a, Gannon et al. 1993b, Gentilcore et al. 2006, Owen and Wolever 2003, Simpson et al. 1985a, Welch et al. 1987). Fat also reduces insulin responses (Gannon et al. 1993a, Gulliford et al. 1989, Welch et al. 1987).
When fat is ingested with carbohydrate-containing foods, glycaemic responses flatten and diminish, and hence, the overall GI is lower, but differences in GI values were not significant (Henry et al. 2006). Contrary findings also exist (Leeman et al. 2008) (Table 6). Dose-response effects of fat on glycaemic responses have been noted (Moghaddam et al. 2006), but different degrees of saturation of added fat did not affect glycaemic responses similarly (MacIntosh et al. 2003). The ability of fat to decrease glycaemic responses may be diminished in insulin-resistant subjects (Moghaddam et al. 2006) and in type 2 diabetic subjects (Gannon et al. 1993a).
2.6.2 Protein Protein ingested with carbohydrates increases insulin responses, which leads to reduced glycaemia (Krezowski et al. 1986, Nuttall et al. 1984, Spiller et al. 1987). In addition, ingested protein slows gastric emptying by increasing the secretion of GIP, cholecystokinin (CCK), peptide YY (PYY), and GLP-1 (Jahan-Mihan et al. 2011, Karamanlis et al. 2007). Slower gastric emptying causes reduced glycaemic
Review of the literature
THL — Research 135 • 2014 37 Challenges in Measuring Glycaemice Index
responses. Protein also suppresses ghrelin secretion (El Khoury et al. 2010). Ghrelin, in contrast to other gut peptides, stimulates gut motility. In addition, protein stimulates glucagon secretion which promotes glycogenolysis and gluconeogenesis, counteracting any insulin-induced decline in glucose levels (Schmid et al. 1992). Moreover, different proteins have different effects on insulin responses, which is likely due to a potentiating effect of amino acids on the β-cell. Proteins that are rich in the branched-chain amino acids leucine, valine, and isoleucine are particularly associated with enhanced insulin response (Gannon et al. 1988, Nilsson et al. 2004, van Loon et al. 2000).
Protein influences glucose and insulin responses in a dose-dependent manner (Gunnerud et al. 2013). The addition of protein into a carbohydrate-rich meal has been found to decrease GI values (Table 6), but at least 30 g of protein is needed to cause a significant effect (Moghaddam et al. 2006). Only a few studies have examined the effect of protein on GIs of solid foods (Bornet et al. 1987, Henry et al. 2006).

Review of the literature
THL — Research 135 • 2014 38 Challenges in Measuring Glycaemice Index
Ta
ble
6.
Effe
ct o
f fat
and
pro
tein
on
glyc
aem
ic in
dex
(GI)
valu
es.
Stu
dy
S
tatu
s
Refe
ren
ce
fo
od
S
tud
y f
oo
d
GI
P
n
me
an
±S
D
CV
%
B
orne
t et a
l. 19
87
18
T2D
M
Glu
cose
W
hite
bre
ad
95±1
5
18
T2D
M
Glu
cose
W
hite
bre
ad +
che
ese
(pro
tein
30
g) +
bu
tter (
fat 2
0 g)
~2
0% ↓
ns
18
T2
DM
G
luco
se
Pot
ato
74
±12
18
T2
DM
G
luco
se
Pot
ato
+ ch
eese
(pro
tein
30
g) +
but
ter (
fat
20 g
) ~2
0% ↓
ns
18
T2
DM
G
luco
se
Spa
ghet
ti 64
±15
18
T2
DM
G
luco
se
Spa
ghet
ti +
chee
se (p
rote
in 3
0 g)
+ b
utte
r (fa
t 20
g)
~20%
↓
ns
18
T2
DM
G
luco
se
Ric
e
56±2
18
T2D
M
Glu
cose
R
ice
+ ch
eese
(pro
tein
30
g) +
but
ter (
fat
20 g
) ~2
0% ↓
ns
18
T2
DM
G
luco
se
Lent
ils
30±1
5
18
T2D
M
Glu
cose
Le
ntils
+ c
hees
e (p
rote
in 3
0 g)
+ b
utte
r (fa
t 20
g)
~20%
↓
ns
18
T2
DM
G
luco
se
Bea
ns
23±1
18
T2D
M
Glu
cose
B
eans
+ c
hees
e (p
rote
in 3
0 g)
+ b
utte
r (fa
t 20
g)
~20%
↓
ns
Mac
Into
sh e
t al.
2003
10
H
ealth
y G
luco
se
Inst
ant m
ashe
d po
tato
+ s
unflo
wer
oil
(30
g; P
UFA
1 64%
) 68
±25
37
10
H
ealth
y G
luco
se
Inst
ant m
ashe
d po
tato
+ b
utte
r (30
g; S
FA2
69%
) 74
±32
43
ns
Hen
ry e
t al.
2006
10
H
ealth
y G
luco
se
Pot
ato
93±2
5 27

Review of the literature
THL — Research 135 • 2014 39 Challenges in Measuring Glycaemice Index
10
Hea
lthy
Glu
cose
P
otat
o +
ched
dar c
hees
e (1
20 g
) 39
±16
41
10
Hea
lthy
Glu
cose
P
otat
o +
tuna
(120
g)
76±2
2 29
ns
10
Hea
lthy
Glu
cose
P
asta
61
±28
46
10
Hea
lthy
Glu
cose
P
asta
+ c
hedd
ar c
hees
e (1
20 g
) 27
±13
48
10
Hea
lthy
Glu
cose
P
asta
+ tu
na (1
20 g
) 28
±9
32
ns
10
H
ealth
y G
luco
se
Whi
te to
ast
50±2
2 44
10
H
ealth
y G
luco
se
Whi
te to
ast +
che
ddar
che
ese
(120
g)
35±6
17
ns
M
ogha
ddam
et
al
. 20
06
20
Hea
lthy
Glu
cose
G
luco
se
100±
9 9
20
H
ealth
y G
luco
se
Glu
cose
+ c
orn
oil (
5 g)
10
6±27
27
20
H
ealth
y G
luco
se
Glu
cose
+ c
orn
oil (
10 g
) 10
0±27
27
20
H
ealth
y G
luco
se
Glu
cose
+ c
orn
oil (
30 g
) 99
±22
22
20
Hea
lthy
Glu
cose
G
luco
se +
soy
pro
tein
(5 g
) 96
±22
23
20
Hea
lthy
Glu
cose
G
luco
se +
cor
n oi
l (5
g) +
soy
pro
tein
(5 g
) 10
6±27
25
20
H
ealth
y G
luco
se
Glu
cose
+ c
orn
oil (
5 g)
+ s
oy p
rote
in (5
g)
91±3
1 34
20
H
ealth
y G
luco
se
Glu
cose
+ c
orn
oil (
10 g
) + s
oy p
rote
in (5
g)
88
±31
35
20
H
ealth
y G
luco
se
Glu
cose
+ c
orn
oil (
30 g
) + s
oy p
rote
in (5
g)
94
±22
23
20
H
ealth
y G
luco
se
Glu
cose
+ c
orn
oil (
0 g)
+ s
oy p
rote
in (1
0 g)
98
±36
37
20
H
ealth
y G
luco
se
Glu
cose
+ c
orn
oil (
5 g)
+ s
oy p
rote
in (1
0 g)
87
±22
25
20
H
ealth
y G
luco
se
Glu
cose
+ c
orn
oil (
30 g
) + s
oy p
rote
in (1
0 g)
72
±27
36
<0.0
5
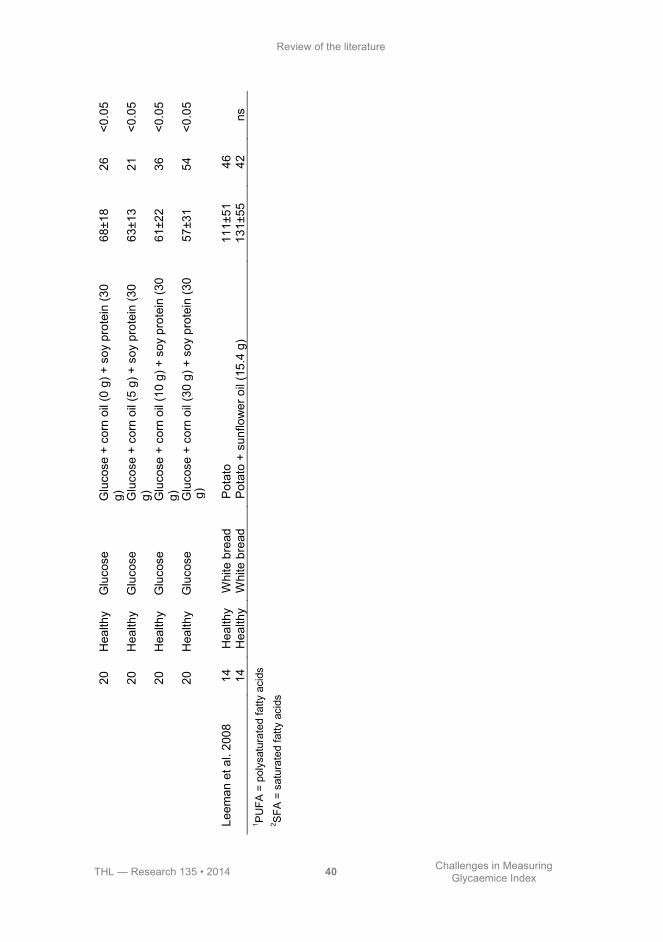
Review of the literature
THL — Research 135 • 2014 40 Challenges in Measuring Glycaemice Index
g)
Leem
an e
t al.
2008
14
H
ealth
y W
hite
bre
ad
Pot
ato
111±
51
46
14
Hea
lthy
Whi
te b
read
P
otat
o +
sunf
low
er o
il (1
5.4
g)
131±
55
42
ns
1 PU
FA =
pol
ysat
urat
ed fa
tty a
cids
2 S
FA =
sat
urat
ed fa
tty a
cids
20
Hea
lthy
Glu
cose
G
luco
se +
cor
n oi
l (0
g) +
soy
pro
tein
(30
g)
68±1
8 26
<0
.05
20
Hea
lthy
Glu
cose
G
luco
se +
cor
n oi
l (5
g) +
soy
pro
tein
(30
g)
63±1
3 21
<0
.05
20
Hea
lthy
Glu
cose
G
luco
se +
cor
n oi
l (10
g) +
soy
pro
tein
(30
g)
61±2
2 36
<0
.05
20
Hea
lthy
Glu
cose
G
luco
se +
cor
n oi
l (30
g) +
soy
pro
tein
(30
57±3
1 54
<0
.05
Review of the literature
THL — Research 135 • 2014 41 Challenges in Measuring Glycaemice Index
2.6.3 Alcohol Epidemiological studies have shown an association between moderate alcohol consumption and improved glucose tolerance and insulin sensitivity (Carlsson et al. 2000, Facchini et al. 1994, Kiechl et al. 1996, Mayer et al. 1993). The impact of alcohol on glucose homeostasis has also been investigated in short-term intervention studies lasting from 2 weeks to 3 months, but their results are inconsistent (Davies et al. 2002, Kim et al. 2009, Napoli et al. 2005, Shai et al. 2007, Zilkens et al. 2003). Alcohol acutely inhibits gluconeogenesis in the liver (Yki-Järvinen and Nikkilä 1985). Acute alcohol consumption also causes insulin resistance, whereas chronic alcohol consumption may improve insulin sensitivity (Ting and Lautt 2006).
Only a few studies have focused on postprandial responses to beer (Table 7). When non-alcoholic beer was compared with regular beer, postprandial glucose responses tended to decrease, but insulin responses increased (Christiansen et al. 1993). However, when beer was ingested with white bread, the results were controversial (Brand-Miller et al. 2007, Christiansen et al. 1994).
The carbohydrate contents of alcoholic beverages, including beer, are so low that it is difficult to measure their GI values using standard methods (Brand-Miller et al. 2007). Thus, no study testing the GI of beer by standard methodology has been published to date in a peer-reviewed journal. As a consequence, epidemiological studies focusing on the association between GI and chronic diseases have used highly variable GI values for beer, ranging from 36 to 95 (Flood et al. 2006, Neuhouser et al. 2006, Schulz et al. 2005). These imputed values have been deduced from carbohydrate-rich beverages such as milk and orange juice.
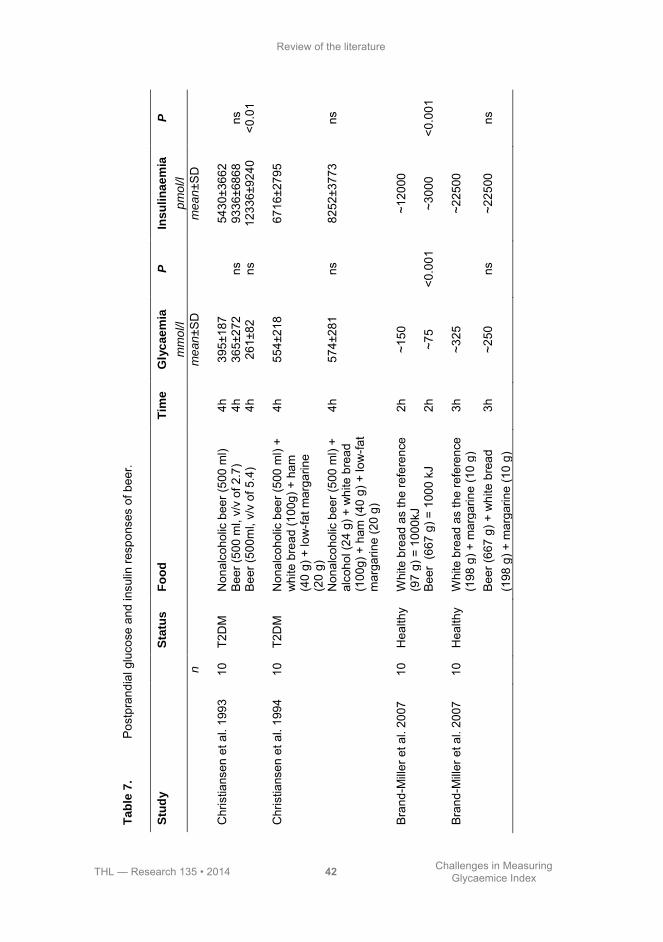
Review of the literature
THL — Research 135 • 2014 42 Challenges in Measuring Glycaemice Index
T
ab
le 7
. P
ostp
rand
ial g
luco
se a
nd in
sulin
resp
onse
s of
bee
r.
Stu
dy
S
tatu
s
Fo
od
T
ime
Gly
ca
em
ia
mm
ol/l
P
Ins
uli
na
em
ia
pm
ol/l
P
n
me
an
±SD
me
an
±SD
C
hris
tians
en e
t al.
1993
10
T2
DM
N
onal
coho
lic b
eer (
500
ml)
4h
395±
187
54
30±3
662
Bee
r (50
0 m
l, v/
v of
2.7
) 4h
36
5±27
2 ns
93
36±6
868
ns
B
eer (
500m
l, v/
v of
5.4
) 4h
26
1±82
ns
12
336±
9240
<0
.01
C
hris
tians
en e
t al.
1994
10
T2
DM
N
onal
coho
lic b
eer (
500
ml)
+ w
hite
bre
ad (1
00g)
+ h
am
(40
g) +
low
-fat m
arga
rine
(20
g)
4h
554±
218
67
16±2
795
N
onal
coho
lic b
eer (
500
ml)
+ al
coho
l (24
g) +
whi
te b
read
(1
00g)
+ h
am (4
0 g)
+ lo
w-fa
t m
arga
rine
(20
g)
4h
574±
281
ns
8252
±377
3 ns
B
rand
-Mill
er e
t al.
2007
10
H
ealth
y W
hite
bre
ad a
s th
e re
fere
nce
(97
g) =
100
0kJ
2h
~150
~120
00
B
eer
(667
g) =
100
0 kJ
2h
~7
5 <0
.001
~3
000
<0.0
01
B
rand
-Mill
er e
t al.
2007
10
H
ealth
y W
hite
bre
ad a
s th
e re
fere
nce
(198
g) +
mar
garin
e (1
0 g)
3h
~3
25
~2
2500
B
eer (
667
g) +
whi
te b
read
(1
98 g
) + m
arga
rine
(10
g)
3h
~250
ns
~2
2500
ns

THL — Research 135 • 2014 43 Challenges in Measuring Glycaemice Index
3 Aims of the study
The objective of this thesis was to examine the effect of methodological choices on glycaemic index (GI) and how glucose tolerance, other macronutrients, and beverages modify the index. Glycaemic responses were determined in order to assess the index. Specific aims were to answer the following questions:
• How do choice of blood sampling method, choice of the reference food, and
number of reference food tests conducted affect GI values (Study I)? • Does coffee co-ingested with carbohydrates affect GI values (Study II)? • Do glucose tolerance and body weight of subjects tested affect GI values
(Study III)? • What is the impact of co-ingested fat and protein on GI values (Study IV)? • How does alcohol modify GI values (Study V)?

THL — Research 135 • 2014 45 Challenges in Measuring Glycaemice Index
4 Subjects and methods
4.1 Study designs All studies were conducted at the National Institute for Health and Welfare (former National Public Health Institute) in 2004 (Studies I and IV), 2005 (Study II), 2007 (Study III), and 2008 (Study V). The postprandial tests were performed in the morning following an overnight fast. The tests were conducted in random order with approximately one week between each test.
The subjects were requested to follow their usual diet during the study. They were advised to consume at least 150 g of carbohydrates daily during the three days before the study day. Baseline data on diet, health, and lifestyle were assessed by questionnaires. Subjects’ mean energy intake was calculated on the basis of their estimated basal metabolic rate, taking into account their physical activity. This information was used to compose individual standardized meals for the evening preceding the study day. The energy content of the evening meal amounted to 15% of the daily energy needs of each individual, and the proportion of the energy from carbohydrates was 55%. The subjects were advised to avoid vigorous physical activity and not to consume alcohol on the day preceding the study day.
All postprandial studies were performed in the morning after a 10- to 12-h overnight fast. To avoid exercise on the study mornings, the subjects were advised to arrive by car or by public transportation. Every study morning, body weight was measured. Changes of up to 2 kg in weight were allowed during the study, and no weight changes of over 2 kg were observed.
Qualified nurses performed blood sampling. In Study I, upon arrival at the study site, an intravenous catheter was inserted into an antecubital vein in the subject’s forearm, and a baseline venous blood sample was drawn. Thereafter, a baseline finger-prick capillary blood sample was taken. Next, the subjects consumed a study meal within 10 min. In Study I, venous and finger-prick capillary blood samples were obtained at 15, 30, 45, 60, 90, 120, and 180 min after the start of the meal. Because the capillary sample was obtained first, the actual sampling time of the intravenous sample was recorded. In Studies II-V, a baseline capillary blood sample was taken from a fingertip. Fasting capillary glucose was measured in duplicate from the same fingertip and the mean of these measurements was applied in Studies III and V. Thereafter, the subject consumed the study meal within 10 min, and capillary blood samples were collected at 15, 30, 45, 60, 90, and 120 min. The subjects were asked to avoid physical activity for the duration of the tests.
All postprandial studies were conducted according to the guidelines laid down in the Declaration of Helsinki, and all procedures involving human subjects were
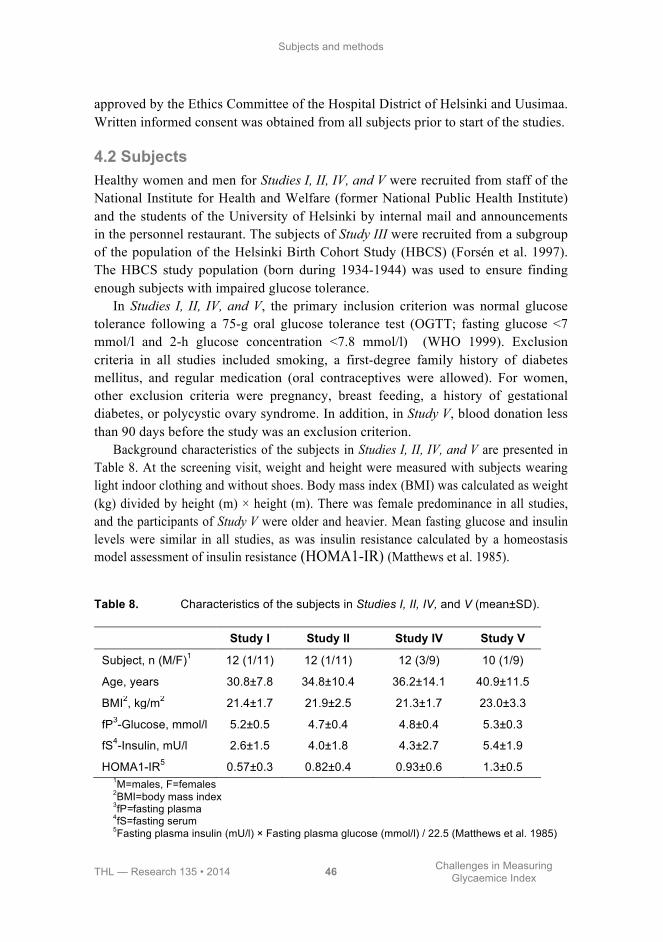
Subjects and methods
THL — Research 135 • 2014 46 Challenges in Measuring Glycaemice Index
approved by the Ethics Committee of the Hospital District of Helsinki and Uusimaa. Written informed consent was obtained from all subjects prior to start of the studies.
4.2 Subjects Healthy women and men for Studies I, II, IV, and V were recruited from staff of the National Institute for Health and Welfare (former National Public Health Institute) and the students of the University of Helsinki by internal mail and announcements in the personnel restaurant. The subjects of Study III were recruited from a subgroup of the population of the Helsinki Birth Cohort Study (HBCS) (Forsén et al. 1997). The HBCS study population (born during 1934-1944) was used to ensure finding enough subjects with impaired glucose tolerance.
In Studies I, II, IV, and V, the primary inclusion criterion was normal glucose tolerance following a 75-g oral glucose tolerance test (OGTT; fasting glucose <7 mmol/l and 2-h glucose concentration <7.8 mmol/l) (WHO 1999). Exclusion criteria in all studies included smoking, a first-degree family history of diabetes mellitus, and regular medication (oral contraceptives were allowed). For women, other exclusion criteria were pregnancy, breast feeding, a history of gestational diabetes, or polycystic ovary syndrome. In addition, in Study V, blood donation less than 90 days before the study was an exclusion criterion.
Background characteristics of the subjects in Studies I, II, IV, and V are presented in Table 8. At the screening visit, weight and height were measured with subjects wearing light indoor clothing and without shoes. Body mass index (BMI) was calculated as weight (kg) divided by height (m) × height (m). There was female predominance in all studies, and the participants of Study V were older and heavier. Mean fasting glucose and insulin levels were similar in all studies, as was insulin resistance calculated by a homeostasis model assessment of insulin resistance (HOMA1-IR) (Matthews et al. 1985).
Table 8. Characteristics of the subjects in Studies I, II, IV, and V (mean±SD).
Study I Study II Study IV Study V
Subject, n (M/F)1 12 (1/11) 12 (1/11) 12 (3/9) 10 (1/9)
Age, years 30.8±7.8 34.8±10.4 36.2±14.1 40.9±11.5
BMI2, kg/m2 21.4±1.7 21.9±2.5 21.3±1.7 23.0±3.3
fP3-Glucose, mmol/l 5.2±0.5 4.7±0.4 4.8±0.4 5.3±0.3
fS4-Insulin, mU/l 2.6±1.5 4.0±1.8 4.3±2.7 5.4±1.9
HOMA1-IR5 0.57±0.3 0.82±0.4 0.93±0.6 1.3±0.5 1M=males, F=females 2BMI=body mass index 3fP=fasting plasma 4fS=fasting serum 5Fasting plasma insulin (mU/l) × Fasting plasma glucose (mmol/l) / 22.5 (Matthews et al. 1985)

Subjects and methods
THL — Research 135 • 2014 47 Challenges in Measuring Glycaemice Index
Study III included 24 normal-weight and 24 overweight subjects, with BMI of
<25 kg/m2 and 27.5-34.9 kg/m2, respectively. The subjects were also screened by an OGTT, and based on this each weight group included 12 subjects with normal glucose tolerance (NGT) and 12 subjects with impaired glucose tolerance (IGT, fasting glucose <7.8 mmol/l and 2-h glucose 7.8-11.0 mmol/l). Exclusion criteria included a first-degree family history of diabetes mellitus, regular medication that would have an effect on glucose or lipid metabolism, gastrointestinal disease influencing absorption, milk allergy, and smoking.
Background characteristics of the subjects in Study III are shown in Table 9. Mean age and fasting glucose level were similar in the study subgroups. Fasting insulin was significantly higher in the overweight subjects than in normal-weight subjects, but IGT only non-significantly increased the fasting insulin level. HOMA1-IR followed the variation in insulin level.
Table 9. Characteristics of the subjects in Study III (mean±SD).
Normal-weight subjects (BMI<25 kg/m2)
Overweight subjects (BMI 27.5-34.9 kg/m2)
NGT1 IGT2 NGT1 IGT2
Subject, n (M/F)3 12 (6/6) 12 (5/7) 12 (6/6) 12 (4/8)
Age, years 65.9±2.5 66.7±2.0 65.8±2.4 66.3±3.3
BMI4, kg/m2 23.8±1.5 23.1±1.8 30.1±1.8 30.8±2.2
fP5-Glucose, mmol/l 5.4±0.4 5.4±0.5 5.5±0.6 5.6±0.4
2-h glucose, mmol/l 6.4±0.9 9.0±0.9 6.7±1.0 9.2±1.0
fS6-Insulin, mU/l 4.8±1.4 5.9±3.0 7.9±5.7 8.9±3.4
HOMA1-IR7 1.15±0.4 1.38±0.7 1.98±1.6 2.26±0.9 1 NGT = normal glucose tolerance: fasting glucose <7.0 mmol/l and 2-h glucose concentration after a 75-g glucose load <7.8 mmol/l 2IGT = impaired glucose tolerance: fasting glucose <7.8 mmol/l and 2-h glucose 7.8-11.0 mmol/l 3M=males, F=females 4BMI=body mass index 5fP=fasting plasma 6fS=fasting serum 7Fasting plasma insulin (mU/l) × Fasting plasma glucose (mmol/l) / 22.5 (Matthews et al. 1985)
Subjects and methods
THL — Research 135 • 2014 48 Challenges in Measuring Glycaemice Index
4.3 Study foods, meals, and nutrient compositions Studies I, II, and V tested individual food items, and Studies III and V tested mixed meals. In each study, the foods and mixed meals were served to each subject in a random order one week apart.
In Studies I-IV, the study meals were given as a portion providing 50 g of available carbohydrates. In Study V, the study meals were given as a portion providing 25 g of available carbohydrate to avoid an unrealistically large beverage volume for consumption within 10 min. The amounts of available carbohydrates were based on chemical analysis. In Studies I-IV, the reference glucose solution was prepared by dissolving 50 g of D-glucose powder (Yliopiston Apteekki, Finland) in 250 ml of tap water. In Study V, the amount of glucose powder was 25 g, and it was also dissolved in 250 ml of tap water. The total water volume of all meals was standardized to 500 ml in Study I and to 550 ml in Studies II-V by adjusting the water or volume of the beverage.
4.3.1 Rye bread, instant mashed potato, and oatmeal porridge In Study I, three test foods, whole-grain rye bread (whole-grain rye flour 69%, Jälkiuunileipä, Oululainen Ltd., Finland), instant mashed potato (Idahoan Foods, Lewisville, ID, USA), and oatmeal porridge (Elovena, Raisio Group Ltd., Finland), were evaluated. White bread (wheat flour 100%, Ranskanleipä, Vaasan&Vaasan Ltd., Finland) and glucose solution (Yliopiston Apteekki, Finland) were used as the reference meals. Oatmeal porridge and instant mashed potato were prepared according to package directions, except that the mashed potato was prepared with water instead of milk.
Each test food was tested once, and both reference foods were tested three times. The study foods were served with 40 g of cucumber (except oatmeal porridge and glucose solution). The subjects had the choice of water or a non-caloric orange beverage for consumption with the study food throughout the study. Of the 12 subjects, nine chose water and three chose the non-caloric beverage.
The chemical composition of the study foods and the evening meals was analysed by the VTT (Technical Research Centre of Biotechnology, Espoo, Finland). The protein content was estimated (N × 6.25) from the quantitative analysis of nitrogen by the Kjeldahl method (Eagan 1981). The fats were determined gravimetrically by extraction in diethyl ether and petroleum ether after hydrolysis with acid. Total fibre and soluble and insoluble fibres were determined by the Asp method (Asp et al. 1983). Free sugars (i.e. glucose, fructose, maltose, maltotriose, and sucrose) were measured by using an ion chromatograph system (Dionex, Sunnyvale, CA, USA). Furthermore, the enzymatically available starch contents of the study meals and evening meals were analysed by the method proposed by McCleary et al. (1997) using the assay kit of Megazyme (Wicklow, Republic of
Subjects and methods
THL — Research 135 • 2014 49 Challenges in Measuring Glycaemice Index
Ireland). The available carbohydrate was calculated as the sum of free sugars and enzymatically available starch. The nutrient composition of the study foods is shown in Table 10.
4.3.2 Mashed potato-based meals In Study IV, the subjects were given six different mashed potato-based meals (Van Gogh, prepared with water and margarine) once and the reference glucose solution twice. Each of the test meals and the reference food were given as portions, providing 50 g of available carbohydrates, except three of the meals that included salad as portions, providing about 54 g of available carbohydrates. Study meals were served with water and 40 g of cucumber, except for the meals including salad.
The nutrient composition of the mashed potato-based study meals was analysed by VTT (Technical Research Centre of Biotechnology, Espoo, Finland) similarly to Study I. The amount of available carbohydrates was calculated as the sum of the free sugars and the enzymatically available starch. The nutrient composition of the study meals is shown in Table 10.
4.3.3 Coffee In Study II, two different coffee portions (Juhlamokka, Gustav Paulig Ltd., Finland) were tested: a small coffee (125 ml) containing 150 mg of caffeine and a large coffee (250 ml) containing 300 mg of caffeine, both portions together with 250 ml of water containing 50 g of available carbohydrate. The twice-tested reference food was given as a portion providing 50 g of available carbohydrate.
The caffeine content of the coffees was analysed by the National Institute for Health and Welfare, using a method (Oikarinen et al. 2007) based on liquid-liquid extraction and high-performance liquid chromatography, HPLC (Agilent Eclipse XDP-C18, Palo Alto, CA, USA), and measured with a UV detector (Agilent 1100 Series, Palo Alto, CA, USA). The nutrient composition and caffeine content of the study beverages are shown in Table 10.
4.3.4 Alcohol-containing beverages In Study V, three test beverages, glucose solution with alcohol, non-alcoholic beer (Nikolai Lager, 0.0%vol, Sinebrychoff Ltd., Kerava, Finland), and beer (Nikolai Lager, 4.5%vol, Sinebrychoff Ltd., Kerava, Finland), were tested. Each of the test beverages and the twice-tested reference glucose solution were given as portions providing 25 g of available carbohydrates. The volume of non-alcoholic beer and beer was 640 ml and 510 ml, respectively, and that of glucose solution with and without alcohol was 500 ml. Both the glucose solution with alcohol and the beer
Subjects and methods
THL — Research 135 • 2014 50 Challenges in Measuring Glycaemice Index
provided 21 g of ethanol per portion. The glucose solution with alcohol was prepared by mixing 25 g of glucose and 21 g of alcohol (Spiritus Fortis A, Ethanolum, 96%, Berner Ltd., Helsinki, Finland) in 250 ml of water and served with 250 ml of water.
The nutrient composition of the study beverages was analysed by AnalyCen laboratory (Lidköping, Sweden). Starch was analysed by using an amyloglucosidase/α-amylase method (AOAC 996.11) (Association of Official Analytical Chemists 2003). Free sugars were measured by using an ion chromatograph system (Dionex, Sunnyvale, CA, USA). The malto-oligosaccharides of the study beverages were analysed by Eurofins Food (Eurofins Food B.V., Heerenveen, the Netherlands). The content of different malto-oligosaccharides was determined with high-performance anion exchange chromatography with pulsed amperometric detection (HPAEC-PAD) using external standards. The nutrient composition of the study beverages is shown in Table 10.
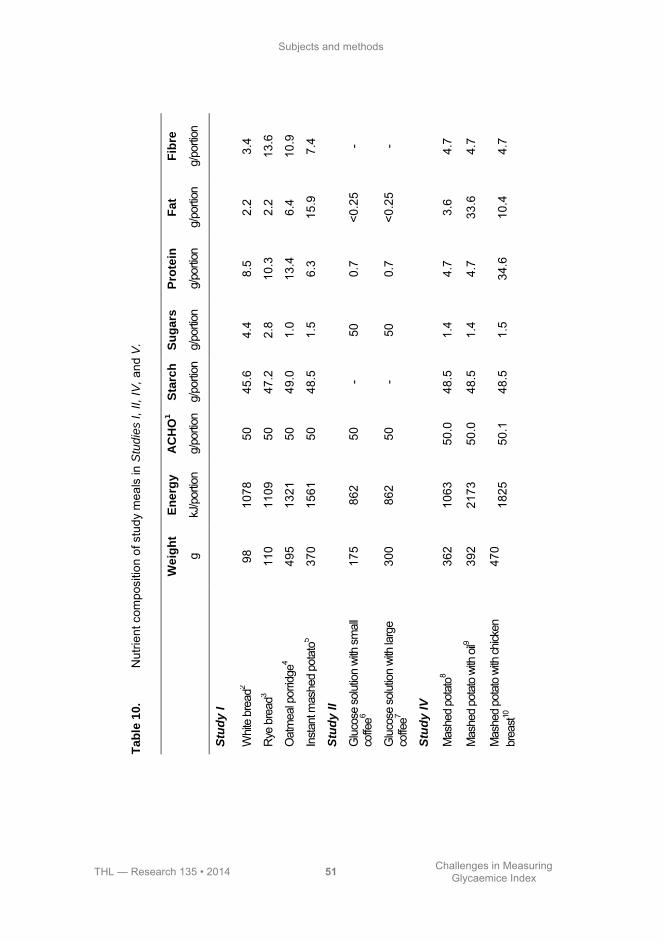
Subjects and methods
THL — Research 135 • 2014 51 Challenges in Measuring Glycaemice Index
T
ab
le 1
0.
Nut
rient
com
posi
tion
of s
tudy
mea
ls in
Stu
die
s I
, II,
IV, an
d V
.
W
eig
ht
En
erg
y
AC
HO
1
Sta
rch
S
ug
ars
P
rote
in
Fa
t F
ibre
g
kJ/p
ortio
n g/
porti
on
g/po
rtion
g/
porti
on
g/po
rtion
g/
porti
on
g/po
rtion
Stu
dy
I
Whit
e br
ead2
98
1078
50
45
.6
4.4
8.5
2.2
3.4
Rye
bre
ad3
110
1109
50
47
.2
2.8
10.3
2.
2 13
.6
Oat
mea
l por
ridge
4 49
5 13
21
50
49.0
1.
0 13
.4
6.4
10.9
Inst
ant m
ashe
d po
tato
5 37
0 15
61
50
48.5
1.
5 6.
3 15
.9
7.4
Stu
dy
II
Glu
cose
sol
utio
n wi
th s
mal
l co
ffee6
175
862
50
- 50
0.
7 <0
.25
-
Glu
cose
sol
utio
n wi
th la
rge
coffe
e7 30
0 86
2 50
-
50
0.7
<0.2
5 -
Stu
dy
IV
Mas
hed
pota
to8
362
1063
50
.0
48.5
1.
4 4.
7 3.
6 4.
7
Mas
hed
pota
to w
ith o
il9 39
2 21
73
50.0
48
.5
1.4
4.7
33.6
4.
7
Mas
hed
pota
to w
ith ch
icken
br
east10
47
0 18
25
50.1
48
.5
1.5
34.6
10
.4
4.7
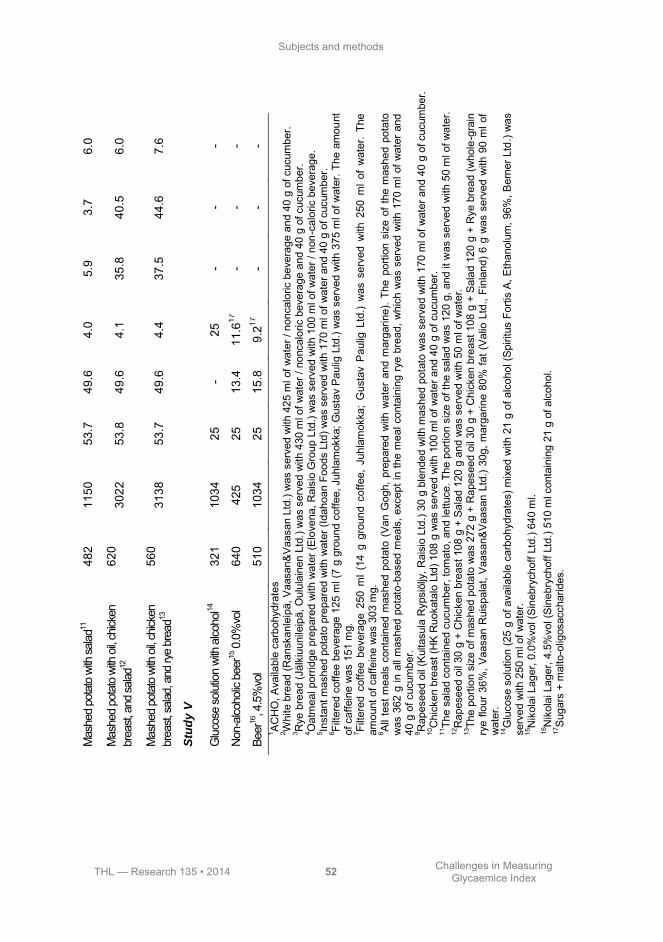
Subjects and methods
THL — Research 135 • 2014 52 Challenges in Measuring Glycaemice Index
Mas
hed
pota
to w
ith sa
lad11
48
2 11
50
53.7
49
.6
4.0
5.9
3.7
6.0
Mas
hed
pota
to w
ith o
il, ch
icken
br
east,
and
salad
12
620
3022
53
.8
49.6
4.
1 35
.8
40.5
6.
0
Mas
hed
pota
to w
ith o
il, ch
icken
br
east,
salad
, and
rye
brea
d13
560
3138
53
.7
49.6
4.
4 37
.5
44.6
7.
6
Stu
dy
V
Glu
cose
sol
utio
n wi
th a
lcoho
l14
321
1034
25
-
25
- -
-
Non
-alco
holic
bee
r15 0
.0%
vol
640
425
25
13.4
11
.617
-
- -
Beer
16, 4
.5%
vol
510
1034
25
15
.8
9.217
-
- -
1 AC
HO
, Ava
ilabl
e ca
rboh
ydra
tes
2 Whi
te b
read
(Ran
skan
leip
ä, V
aasa
n&V
aasa
n Lt
d.) w
as s
erve
d w
ith 4
25 m
l of w
ater
/ no
ncal
oric
bev
erag
e an
d 40
g o
f cuc
umbe
r.
3 Rye
bre
ad (J
älki
uuni
leip
ä, O
ulul
aine
n Lt
d.) w
as s
erve
d w
ith 4
30 m
l of w
ater
/ no
ncal
oric
bev
erag
e an
d 40
g o
f cuc
umbe
r.
4 Oat
mea
l por
ridge
pre
pare
d w
ith w
ater
(Elo
vena
, Rai
sio
Gro
up L
td.)
was
ser
ved
with
100
ml o
f wat
er /
non-
calo
ric b
ever
age.
5 In
stan
t mas
hed
pota
to p
repa
red
with
wat
er (I
daho
an F
oods
Ltd
) was
ser
ved
with
170
ml o
f wat
er a
nd 4
0 g
of c
ucum
ber.
6 Fi
ltere
d co
ffee
beve
rage
125
ml (
7 g
grou
nd c
offe
e, J
uhla
mok
ka; G
usta
v P
aulig
Ltd
.) w
as s
erve
d w
ith 3
75 m
l of w
ater
. The
am
ount
of
caf
fein
e w
as 1
51 m
g.
7 Filte
red
coffe
e be
vera
ge 2
50 m
l (14
g g
roun
d co
ffee,
Juh
lam
okka
; G
usta
v P
aulig
Ltd
.) w
as s
erve
d w
ith 2
50 m
l of
wat
er.
The
amou
nt o
f caf
fein
e w
as 3
03 m
g.
8 All
test
mea
ls c
onta
ined
mas
hed
pota
to (
Van
Gog
h, p
repa
red
with
wat
er a
nd m
arga
rine)
. The
por
tion
size
of t
he m
ashe
d po
tato
w
as 3
62 g
in a
ll m
ashe
d po
tato
-bas
ed m
eals
, exc
ept i
n th
e m
eal c
onta
inin
g ry
e br
ead,
whi
ch w
as s
erve
d w
ith 1
70 m
l of w
ater
and
40
g o
f cuc
umbe
r. 9 R
apes
eed
oil (
Kul
tasu
la R
ypsi
öljy
, Rai
sio
Ltd.
) 30
g bl
ende
d w
ith m
ashe
d po
tato
was
ser
ved
with
170
ml o
f wat
er a
nd 4
0 g
of c
ucum
ber.
10C
hick
en b
reas
t (H
K R
uoka
talo
Ltd
) 108
g w
as s
erve
d w
ith 1
00 m
l of w
ater
and
40
g of
cuc
umbe
r. 11
The
sala
d co
ntai
ned
cucu
mbe
r, to
mat
o, a
nd le
ttuce
. The
por
tion
size
of t
he s
alad
was
120
g, a
nd it
was
ser
ved
with
50
ml o
f wat
er.
12R
apes
eed
oil 3
0 g
+ C
hick
en b
reas
t 108
g +
Sal
ad 1
20 g
and
was
ser
ved
with
50
ml o
f wat
er.
13Th
e po
rtion
siz
e of
mas
hed
pota
to w
as 2
72 g
+ R
apes
eed
oil 3
0 g
+ C
hick
en b
reas
t 108
g +
Sal
ad 1
20 g
+ R
ye b
read
(who
le-g
rain
ry
e flo
ur 3
6%, V
aasa
n R
uisp
alat
, Vaa
san&
Vaa
san
Ltd.
) 30
g, m
arga
rine
80%
fat (
Val
io L
td.,
Finl
and)
6 g
was
ser
ved
with
90
ml o
f w
ater
. 14
Glu
cose
sol
utio
n (2
5 g
of a
vaila
ble
carb
ohyd
rate
s) m
ixed
with
21
g of
alc
ohol
(Spi
ritus
For
tis A
, Eth
anol
um, 9
6%, B
erne
r Ltd
.) w
as
serv
ed w
ith 2
50 m
l of w
ater
. 15
Nik
olai
Lag
er, 0
.0%
vol (
Sin
ebry
chof
f Ltd
.) 64
0 m
l. 16
Nik
olai
Lag
er, 4
.5%
vol (
Sin
ebry
chof
f Ltd
.) 51
0 m
l con
tain
ing
21 g
of a
lcoh
ol.
17S
ugar
s +
mal
to-o
ligos
acch
arid
es.
Subjects and methods
THL — Research 135 • 2014 53 Challenges in Measuring Glycaemice Index
4.3.5 Low- and high-GI meals In Study III, two test meals with different GI values (33 for low-GI meal and 81 for high-GI meal), but similar macronutrient content were evaluated. The GI values of the meals were calculated using the recommended method (FAO/WHO 1998), and the GI values of each component of the meals were based on the GI database of the National Institute for Health and Welfare (Similä et al. 2009). The glucose solution, used as a reference, was tested twice. The test meals and the reference meal contained 50 g of available carbohydrates. Both test meals contained the same amounts of energy, protein, fat, and fibre. The energy supply from macronutrients was in accordance with the Nordic Nutrition Recommendation (Nordic Council of Ministers 2004); 55% energy as carbohydrate, 15% energy as protein, and 30% energy as fat.
Both meals were served with a 150-ml beverage of choice, either water, coffee, or tea. Water was chosen by 12 (3 normal weight and NGT, 4 overweight and NGT, 2 normal weight and IGT, and 3 overweight and IGT), coffee by 27 (8 normal weight and NGT, 5 overweight and NGT, 6 normal weight and IGT and 8 overweight and IGT), and tea by 9 (1 normal-weight and NGT, 3 overweight and NGT, 4 normal weight and IGT, and 1 overweight and IGT) subjects.
The nutrient composition of the test meals was analysed by AnalyCen Laboratory (Lidköping, Sweden). The protein content of the meals was estimated by the method of Kjeldahl (Eagan et al. 1981), and the fat content by a modified method of Schmid–Bondzynski–Ratzlaff (Croon and Fuchs 1980). Free sugars (glucose, fructose, lactose, maltose, and sucrose) were determined by the Dionex ion chromatograph system, and the starch contents of the test meals were analysed by the modified Åman and Hesselman method (1984). Total fibre was analysed by an enzymatic gravimetric procedure (Association of Official Analytical Chemists 45.4.07). The study meals and their nutrient compositions are shown in Table 11.
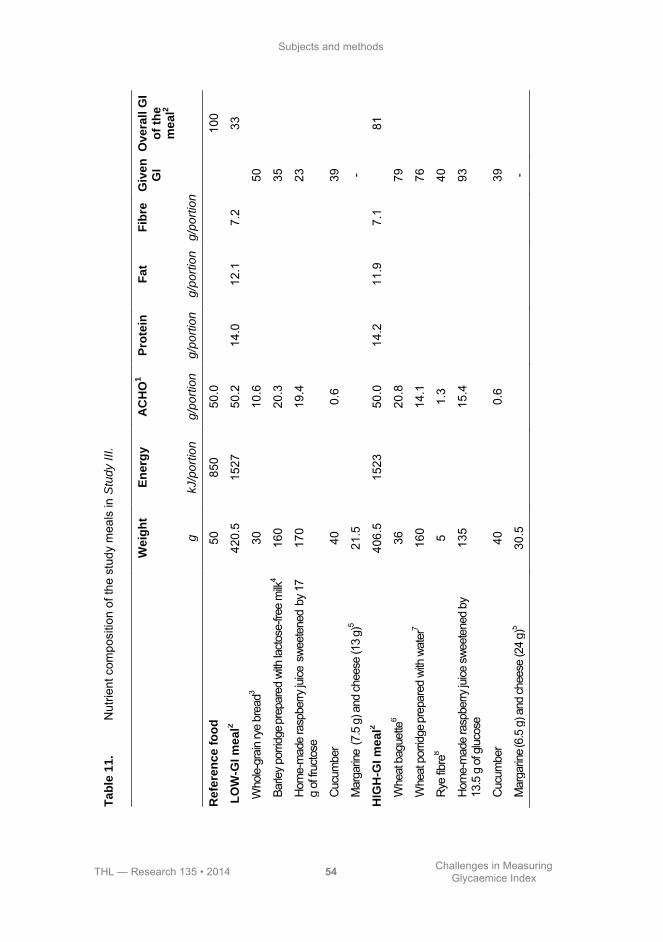
Subjects and methods
THL — Research 135 • 2014 54 Challenges in Measuring Glycaemice Index
T
ab
le 1
1.
Nut
rient
com
posi
tion
of th
e st
udy
mea
ls in
Stu
dy I
II.
W
eig
ht
En
erg
y
AC
HO
1
Pro
tein
F
at
Fib
re
Giv
en
G
I
Ove
rall
GI
of
the
m
ea
l2
g
kJ/p
ort
ion
g/p
ort
ion
g/p
ort
ion
g/p
ort
ion
g/p
ort
ion
Refe
ren
ce
fo
od
50
85
0 50
.0
100
LO
W-G
I m
ea
l2
420.
5 15
27
50.2
14
.0
12.1
7.
2
33
Who
le-g
rain
rye
brea
d3 30
10.6
50
Barle
y po
rridg
e prep
ared
with
lact
ose-
free
milk
4 16
0
20.3
35
Hom
e-m
ade
rasp
berry
juice
swe
eten
ed by
17
g of
fruc
tose
17
0
19.4
23
Cuc
umbe
r 40
0.6
39
Mar
garin
e (7
.5 g
) and
che
ese
(13
g)5
21.5
-
HIG
H-G
I m
ea
l2
406.
5 15
23
50.0
14
.2
11.9
7.
1
81
Whe
at b
ague
tte6
36
20
.8
79
Whe
at p
orrid
ge pr
epar
ed w
ith w
ater
7 16
0
14.1
76
Rye
fibre
8 5
1.
3
40
Hom
e-m
ade
rasp
berry
juice
swe
eten
ed b
y
13.5
g o
f glu
cose
13
5
15.4
93
Cuc
umbe
r 40
0.6
39
Mar
garin
e (6.5
g) a
nd ch
eese
(24
g)5
30.5
-
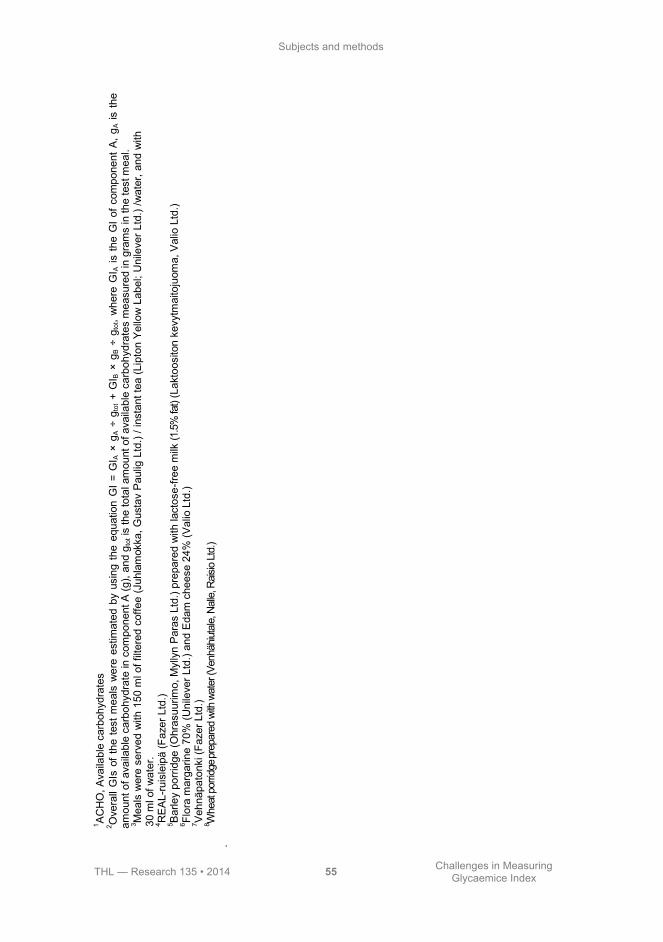
Subjects and methods
THL — Research 135 • 2014 55 Challenges in Measuring Glycaemice Index
2 Ove
rall
GIs
of t
he te
st m
eals
wer
e es
timat
ed b
y us
ing
the
equa
tion
GI =
GI A
× g
A ÷
gto
t + G
I B ×
gB ÷
gto
t, w
here
GI A
is th
e G
I of c
ompo
nent
A, g
A is
the
amou
nt o
f ava
ilabl
e ca
rboh
ydra
te in
com
pone
nt A
(g),
and
g tot is
the
tota
l am
ount
of a
vaila
ble
carb
ohyd
rate
s m
easu
red
in g
ram
s in
the
test
mea
l. 3 M
eals
wer
e se
rved
with
150
ml o
f filt
ered
cof
fee
(Juh
lam
okka
, Gus
tav
Pau
lig L
td.)
/ ins
tant
tea
(Lip
ton
Yel
low
Lab
el; U
nile
ver L
td.)
/wat
er, a
nd w
ith
30 m
l of w
ater
. 4 R
EA
L-ru
isle
ipä
(Faz
er L
td.)
5 Bar
ley
porri
dge
(Ohr
asuu
rimo,
Myl
lyn
Par
as L
td.)
prep
ared
with
lact
ose-
free
milk
(1.5
% fa
t) (L
akto
osito
n ke
vytm
aito
juom
a, V
alio
Ltd
.) 6 Fl
ora
mar
garin
e 70
% (U
nile
ver L
td.)
and
Eda
m c
hees
e 24
% (V
alio
Ltd
.) 7 V
ehnä
pato
nki (
Faze
r Ltd
.) 8 W
heat
por
ridge
prep
ared
with
wat
er (V
enhä
hiuta
le, N
alle,
Rais
io Lt
d.)
.
1 AC
HO
, Ava
ilabl
e ca
rboh
ydra
tes
Subjects and methods
THL — Research 135 • 2014 56 Challenges in Measuring Glycaemice Index
4.4 Blood sampling and laboratory methods The analyses of glucose and insulin were performed at the National Institute for Health and Welfare.
4.4.1 Capillary blood glucose In all studies, capillary blood glucose was analysed directly by using a glucose meter (HemoCue® Glucose 201 meter, HemoCue Ltd., Espoo, Finland). Before capillary blood sampling from the finger-tip, the subjects warmed their hands under running warm water to increase peripheral blood flow and facilitate blood sampling. The capillary blood sample was taken using a lancet (Medlance® Red, HTL-STREFA S.A., Poland) with a drop of blood collected into a HemoCue cuvette, and blood glucose concentration was measured using a HemoCue 201 Analyser. The HemoCue Glucose system is based on a glucose dehydrogenase method. The results were automatically transformed to express the plasma glucose values. A quality-control solution recommended by HemoCue was measured twice every study morning; the CV of these measurements was 1.1% (Study I), 1.5% (Study II), 1.2% (Study III), 0.3% (Study IV), and 0.6% (Study V).
4.4.2 Venous blood glucose In Study I, an intravenous cannula was inserted into a vein in the antecubital fossa, and blood samples (5 ml/sample) were drawn for venous blood glucose determination. The samples were collected in a fluoride-citrate tube (Venosafe®, Terumo Sweden Ltd., Västra Frölunda, Sweden) and were kept in the refrigerator (4ºC) for 20 min until centrifugation. The samples were centrifuged for 15 min at 4000 × g at 20°C to separate the plasma. Plasma glucose was analysed by a hexokinase method (Thermo Electron Ltd., Vantaa, Finland). The inter-assay and intra-assay coefficients of variation for venous glucose determination were 3.4% and 1.1%, respectively.
4.4.3 Capillary blood insulin Finger-prick capillary blood samples (0.5 ml/sample) were drawn for insulin determination. The samples were collected in non-heparin-treated gel tubes (Capiject®, Terumo Sweden Ltd., Västra Frölunda, Sweden). The samples were allowed to clot for 20 min at room temperature. After clotting, the samples were centrifuged (4000 × g; 15 min, Rotofix 32, Hettich Zentrifugen) within 20 min, and then they were separated into serum and kept at -70ºC until analysis. The serum insulin from the capillary samples was determined by an AxSYM system, which is
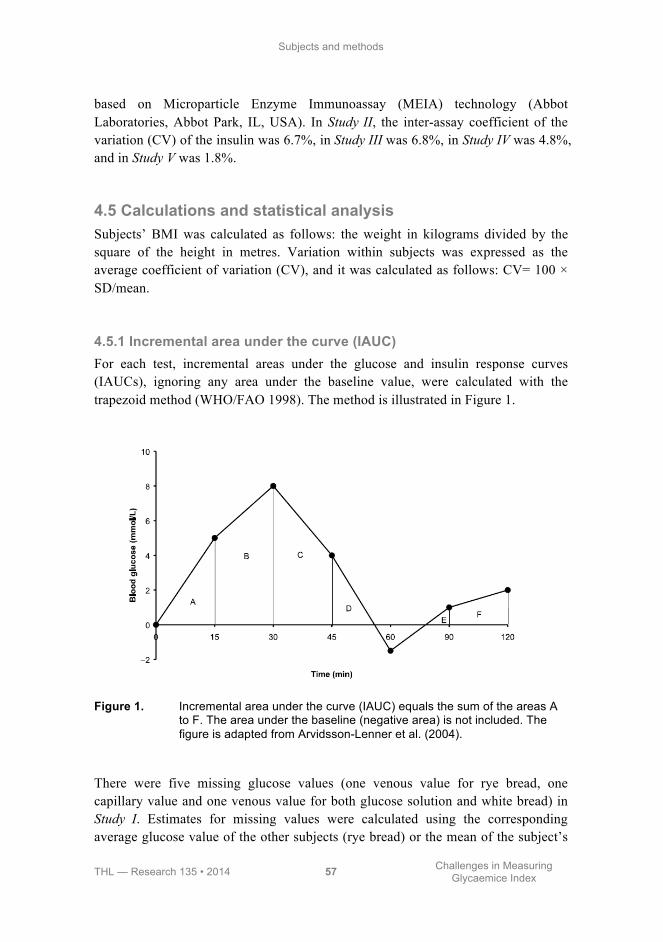
Subjects and methods
THL — Research 135 • 2014 57 Challenges in Measuring Glycaemice Index
based on Microparticle Enzyme Immunoassay (MEIA) technology (Abbot Laboratories, Abbot Park, IL, USA). In Study II, the inter-assay coefficient of the variation (CV) of the insulin was 6.7%, in Study III was 6.8%, in Study IV was 4.8%, and in Study V was 1.8%.
4.5 Calculations and statistical analysis Subjects’ BMI was calculated as follows: the weight in kilograms divided by the square of the height in metres. Variation within subjects was expressed as the average coefficient of variation (CV), and it was calculated as follows: CV= 100 × SD/mean.
4.5.1 Incremental area under the curve (IAUC) For each test, incremental areas under the glucose and insulin response curves (IAUCs), ignoring any area under the baseline value, were calculated with the trapezoid method (WHO/FAO 1998). The method is illustrated in Figure 1.
Figure 1. Incremental area under the curve (IAUC) equals the sum of the areas A to F. The area under the baseline (negative area) is not included. The figure is adapted from Arvidsson-Lenner et al. (2004).
There were five missing glucose values (one venous value for rye bread, one capillary value and one venous value for both glucose solution and white bread) in Study I. Estimates for missing values were calculated using the corresponding average glucose value of the other subjects (rye bread) or the mean of the subject’s

Subjects and methods
THL — Research 135 • 2014 58 Challenges in Measuring Glycaemice Index
other two reference tests (glucose solution and white bread). Each estimate was corrected by the difference between the level of the incomplete curve and the mean level of the complete curves (the levels were estimated as the mean of the blood glucose of all time-points, except the missing point). No values were estimated, nor were any IAUCs calculated for two white bread tests with more than one missing venous sample. The IAUCs for 180 min were missing for three test visits due to missing capillary and venous samples at 180 min. The other studies had no missing capillary blood values.
4.5.2 Glycaemic index (GI) The glycaemic index (GI) was defined as the percentage of the plasma glucose IAUC in study meal of that in the reference food (glucose solution or white bread)(WHO/FAO 1998).
GI = IAUC (study meal) ÷ mean IAUC (reference) × 100
4.5.3 Insulinaemic index (II) The insulinaemic index (II) was defined as the percentage of the serum insulin IAUC in the study meal of that in the reference glucose solution.
II = IAUC (study meal) ÷ mean IAUC (reference) × 100
In Studies II-V, the 2-h insulin curves that included one or more strongly or three or more mildly haemolysed serum samples were excluded from the analyses. In Study II, one 2-h insulin curve for a glucose solution with small coffee and five insulin curves for a glucose solution were excluded due to haemolysis. In Study III, two insulin curves for low-GI meal were excluded; both excluded insulin curves were among overweight subjects with NGT. In Study IV, 32 insulin curves were excluded from the analysis, 14 for a glucose solution, 6 for mashed-potato, 4 for mashed potato with rapeseed oil, 3 for mashed potato with chicken breast, and 5 for all meals that contained salad. In Study V, two insulin curves, one for a glucose solution and one for beer, were excluded.
Subjects and methods
THL — Research 135 • 2014 59 Challenges in Measuring Glycaemice Index
4.5.4 GI of the meal The overall GIs (GIpred) of the test meals were calculated by using the recommended method of weighting the GI of each component in the test meal (WHO/FAO 1998).
GIpred = GIA × gA ÷ gtot + GIB × gB ÷ gtot...,
where GIA is the GI of component A, gA is the amount of available carbohydrate
in component A (g), and gtot is the total amount of available carbohydrates measured in grams in the test meal.
In Study III, the GI values of each component of the meals were derived from the GI database of the National Institute for Health and Welfare (Similä et al. 2009).
4.5.5 Statistical analysis All results are presented as means and standard deviations (SDs). Differences in means were considered significant at P < 0.05.
In Study I, to determine the effect of using a single test versus a double or a triple test of the reference food on GI values, one or two IAUCs of the reference food were selected randomly from the three IAUCs of reference foods for each subject. The GI values were then calculated using the IAUC for the randomly selected glucose or white bread tests. All statistical analyses were carried out using SAS software (version 8.2, SAS Institute Inc., Cary, NC, USA).
In Study III, the independent sample t test with Bonferroni corrections was used for testing the differences between study groups. Insulin responses were non-normally distributed; statistical significance was therefore assessed by using the non-parametric Wilcoxon test. All statistical analyses were conducted using SPSS for Windows version 15.0 (SPSS Inc., Chicago, IL, USA).
In Studies II, IV, and V, the incremental peaks of glucose and insulin, the IAUCs, and GI and II values were analysed by non-parametric Friedman's test for repeated measures comparisons. Post-hoc comparisons were performed, adjusting for multiple comparisons with Bonferroni correction if Friedman's tests showed significant effects. A non-parametric Wilcoxon signed-rank test with Bonferroni corrections was used when the differences between beverages were tested. In Studies II and V, all statistical analyses were carried out using SAS software (version 8.2, SAS Institute Inc., Cary, NC, USA), and in Study IV using SPSS for Windows version 17.0 (SPSS Inc., Chicago, IL, USA).

THL — Research 135 • 2014 61 Challenges in Measuring Glycaemice Index
5 Results
5.1 Methodological choices
5.1.1 Blood sampling In Study I, two blood sampling methods, capillary and venous, were compared. The targeting preference was in capillary blood samples, which were taken as precisely as possible at 15, 30, 45, 60, 90, 120, and 180 min after the start of the meal. The venous samples were taken after the capillary samples, the average delays being 3.0-3.7 min at different time-points, but the differences between the venous IAUCs based on real and fixed time were not statistically significant (data not shown). However, the CVs of the IAUCs were slightly lower when real time was used, and thus, we used real time when comparing capillary and venous sampling.
Capillary blood samples elicited higher postprandial glucose responses than did venous blood samples (Figure 2). The 2-h glycaemic IAUCs measured from capillary samples were significantly larger, almost twice those measured from venous samples (Table 12). The CVs for capillary IAUCs were 20-40% lower than those for venous IAUCs (Table 12).
Contrary to the IAUCs, capillary samples produced smaller GI values than venous samples (Table 13). In addition, capillary samples had clearly lower variation, resulting in smaller CVs than venous samples (with the xception of rye bread when the reference food was glucose solution). Although the CV diminished slightly when three reference tests were used, capillary GIs were similar with two and three reference tests (Table 13).

Results
THL — Research 135 • 2014 62 Challenges in Measuring Glycaemice Index
Figure 2. Mean fasting and postprandial capillary and venous blood glucose after consumption of glucose solution and white bread. The values at the different time-points were based on 33 blood samplings. For glucose solution, the glucose concentration differed significantly between capillary and venous samples in all time-points, excluding 180 min. For white bread, the glucose concentration differed significantly between capillary and venous samples at all time-points. * = significant difference between capillary and venous glucose solution. # = significant difference between capillary and venous white bread.
Time (min)
Bloo
d gl
ucos
e (m
mol
/l)
0 15 30 45 60 90 120 180
5
6
7
8
Capillary glucose solutionVenous glucose solutionCapillary white breadVenous white bread
*#
*#
*#
*#
*#
*#
*#
#
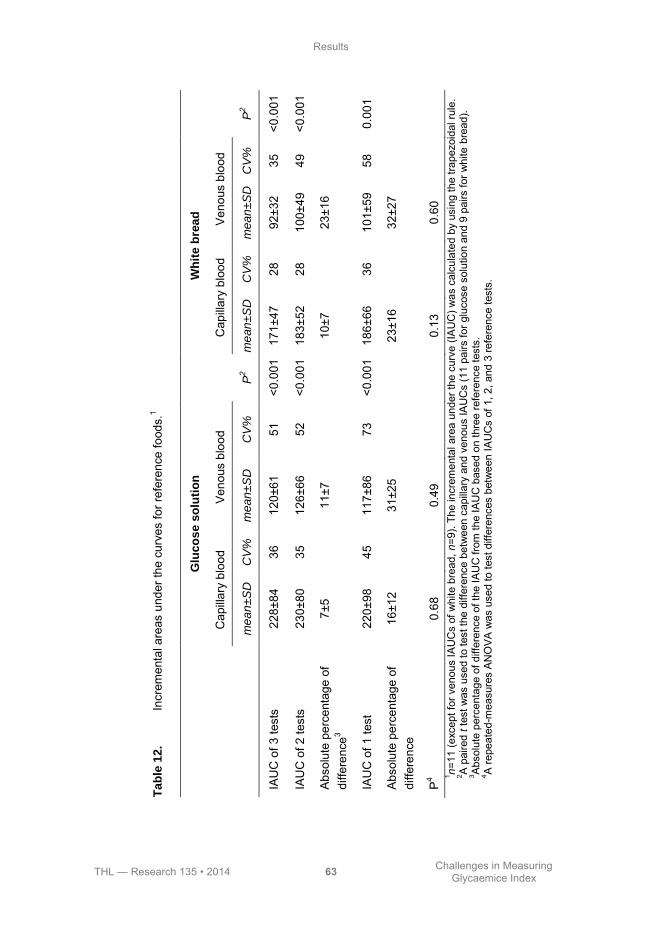
Results
THL — Research 135 • 2014 63 Challenges in Measuring Glycaemice Index
Ta
ble
12
. In
crem
enta
l are
as u
nder
the
curv
es fo
r ref
eren
ce fo
ods.
1
G
luc
os
e s
olu
tio
n
W
hit
e b
rea
d
C
apilla
ry b
lood
V
enou
s bl
ood
C
apilla
ry b
lood
V
enou
s bl
ood
m
ea
n±S
D
CV
%
me
an
±S
D
CV
%
P2
m
ea
n±S
D
CV
%
me
an
±S
D
CV
%
P2
IAU
C o
f 3 te
sts
228±
84
36
120±
61
51
<0.0
01
171±
47
28
92±3
2 35
<0
.001
IAU
C o
f 2 te
sts
230±
80
35
126±
66
52
<0.0
01
183±
52
28
100±
49
49
<0.0
01
Abs
olut
e pe
rcen
tage
of
diffe
renc
e3 7±
5
11±7
10
±7
23
±16
IAU
C o
f 1 te
st
220±
98
45
117±
86
73
<0.0
01
186±
66
36
101±
59
58
0.00
1
Abs
olut
e pe
rcen
tage
of
diffe
renc
e 16
±12
31
±25
23±1
6
32±2
7
P4
0.68
0.49
0.
13
0.
60
1 n=1
1 (e
xcep
t for
ven
ous
IAU
Cs
of w
hite
bre
ad, n
=9).
The
incr
emen
tal a
rea
unde
r the
cur
ve (I
AU
C) w
as c
alcu
late
d by
usi
ng th
e tra
pezo
idal
rule
. 2 A
pai
red
t tes
t was
use
d to
test
the
diffe
renc
e be
twee
n ca
pilla
ry a
nd v
enou
s IA
UC
s (1
1 pa
irs fo
r glu
cose
sol
utio
n an
d 9
pairs
for w
hite
bre
ad).
3 Abs
olut
e pe
rcen
tage
of d
iffer
ence
of t
he IA
UC
from
the
IAU
C b
ased
on
thre
e re
fere
nce
test
s.
4 A re
peat
ed-m
easu
res
AN
OVA
was
use
d to
test
diff
eren
ces
betw
een
IAU
Cs
of 1
, 2, a
nd 3
refe
renc
e te
sts.

Results
THL — Research 135 • 2014 64 Challenges in Measuring Glycaemice Index
Ta
ble
13
. G
lyca
emic
indi
ces
for r
ye b
read
, oat
mea
l por
ridge
, and
inst
ant m
ashe
d po
tato
.1
G
luc
os
e s
olu
tio
n
Wh
ite
bre
ad
C
apilla
ry b
lood
V
enou
s bl
ood
Cap
illary
blo
od
Ven
ous
bloo
d
N
umbe
r of t
ests
M
ean±
SD
C
V%
M
ean±
SD
C
V%
M
ean±
SD
C
V%
M
ean
± S
D
CV
%
Rye
bre
ad
1 85
±39
45
153±
183
120
99±4
6 46
14
4±11
9 83
2
78±3
8 48
77
±16
21
96±3
7 39
16
4±19
7 12
1
3
77±3
1 40
82
±18
22
102±
40
39
128±
80
63
P
0
.48
0
.31
0
.15
0
.68
Oat
mea
l por
ridge
1
82±3
8 46
22
1±36
2 16
4 97
±51
53
153±
141
92
2
74±2
6 35
91
±37
40
92±3
5 38
17
7±23
2 13
1
3
74±2
3 31
95
±41
43
98±3
6 36
13
4±97
73
P
0
.48
0
.12
0
.44
0
.75
Inst
ant m
ashe
d po
tato
1
90±4
0 44
18
2±24
7 13
5 10
8±58
53
14
8±11
7 79
2
79±2
1 27
86
±35
41
102±
42
41
164±
186
113
3
80±2
1 26
92
±40
44
108±
45
41
134±
84
63
P
0
.42
0
.31
0
.18
0
.75
1 n=1
1 (e
xcep
t for
ven
ous
sam
ples
of w
hite
bre
ad, n
=9).
The
glyc
aem
ic in
dex
(GI)
was
def
ined
as
the
perc
enta
ge o
f the
glu
cose
IAU
C o
f th
e te
st f
ood
divi
ded
by t
hat
of t
he r
efer
ence
glu
cose
sol
utio
n/w
hite
bre
ad.
A r
epea
ted-
mea
sure
s A
NO
VA w
as u
sed
to t
est
diffe
renc
es
betw
een
GIs
of 1
, 2, a
nd 3
refe
renc
e te
sts.
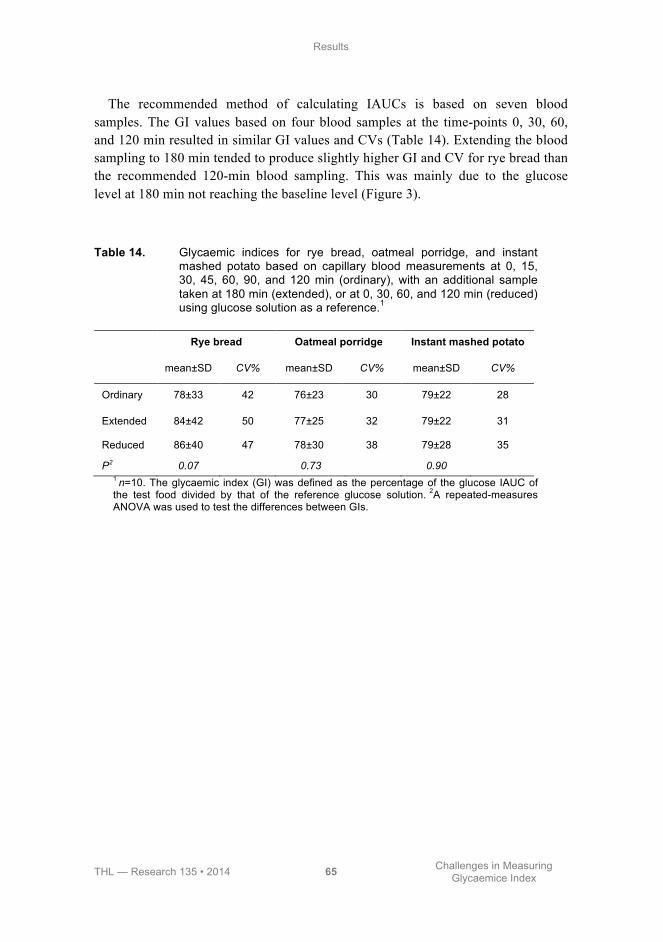
Results
THL — Research 135 • 2014 65 Challenges in Measuring Glycaemice Index
The recommended method of calculating IAUCs is based on seven blood samples. The GI values based on four blood samples at the time-points 0, 30, 60, and 120 min resulted in similar GI values and CVs (Table 14). Extending the blood sampling to 180 min tended to produce slightly higher GI and CV for rye bread than the recommended 120-min blood sampling. This was mainly due to the glucose level at 180 min not reaching the baseline level (Figure 3).
Table 14. Glycaemic indices for rye bread, oatmeal porridge, and instant mashed potato based on capillary blood measurements at 0, 15, 30, 45, 60, 90, and 120 min (ordinary), with an additional sample taken at 180 min (extended), or at 0, 30, 60, and 120 min (reduced) using glucose solution as a reference.1
Rye bread Oatmeal porridge Instant mashed potato
mean±SD CV% mean±SD CV% mean±SD CV%
Ordinary 78±33 42 76±23 30 79±22 28
Extended 84±42 50 77±25 32 79±22 31
Reduced 86±40 47 78±30 38 79±28 35
P2 0.07 0.73 0.90 1 n=10. The glycaemic index (GI) was defined as the percentage of the glucose IAUC of the test food divided by that of the reference glucose solution. 2A repeated-measures ANOVA was used to test the differences between GIs.

Results
THL — Research 135 • 2014 66 Challenges in Measuring Glycaemice Index
Figure 3. Changes in blood glucose after the consumption of rye bread. The glucose concentration differed significantly between capillary and venous samples at all time-points, excluding 0 min. * = significant difference between capillary and venous blood samples.
5.1.2 Reference food In Study I, two different reference foods, glucose solution and white bread, were compared. Both reference foods were repeated three times. The glucose solution elicited a more rapid initial rise and a higher peak rise at 30 min than white bread (Figure 2). The glucose solution produced 1.3 times higher IAUCs than white bread when the reference foods were tested two and/or three times. The CVs of the white bread were, however, lower than those of the glucose solution (Table 12).
When white bread was used as the reference food, both the GI values and their variation were higher. However, the CVs diminished when the reference food was tested two or three times. White bread provided ~1.3 times higher GIs than glucose solution when the GIs were measured from capillary samples (Table 13).
When the GI values were measured from capillary blood samples and glucose solution was used as the reference, rye bread resulted in a GI of 77±31, oatmeal porridge 74±23, and instant mashed potato 80±21 (Table 13). The CVs were the
Time (min)
Bloo
d gl
ucos
e (m
mol
/l)
0 15 30 45 60 90 120 180
5
6
7
8
Capillary blood rye breadVenous blood rye bread
*
* *
*
*
**

Results
THL — Research 135 • 2014 67 Challenges in Measuring Glycaemice Index
lowest when capillary blood was used and the reference glucose solution was tested three times, excluding rye bread, which produced the lowest CV when venous blood was used and the reference was repeated twice (Table 13). When white bread was tested as a test food and it was tested once and the reference glucose solution was tested three times, white bread resulted in a GI of 89±38 (Table 15).
5.1.3 Number of trials Reference foods tested two or three times produced similar IAUCs than when tested only once. The variation decreased when the reference food test was repeated, but repeating the test twice did not lead to more benefit, and the CVs for once or twice repeated reference tests were similar. The absolute percentage differences were slightly lower for glucose solution than for white bread, but the difference was significant only for the venous sample tested twice (Table 12).
The capillary GIs were lower with two or three tests of the reference food than with one test. The CVs were also lower when two or three tests were used than when the reference was tested once. The CVs of the GI values (glucose reference tested three times and capillary blood sampling) for rye bread, oatmeal porridge, and instant mashed potato were 40%, 31%, and 26%, respectively (Table 13).
Because the 2-h responses to glucose solution and white bread were tested three times, it is possible to estimate the effect of trial numbers of the test food on the GI values and the variation of the GI values. When white bread (the test food) was tested twice and glucose solution (the reference food) was tested two or three times, the GI value of white bread diminished from 89 (white bread tested once) to 84 and 85, respectively, and the variation clearly decreased (Table 15). When both glucose solution and white bread were tested three times, the GI of white bread decreased further to 79 (Table 15).
Table 15. Glycaemic indices based on capillary blood measurements for white bread using glucose solution as a reference.1
1 n=11. The glycaemic index (GI) was defined as the percentage of the glucose IAUC of the test food divided by that of the reference glucose solution/white bread.
Glucose solution
Tested once Tested twice Tested three times
Mean±SD CV% Mean±SD CV% Mean±SD CV%
White bread Tested once 94±37 40 89±41 46 89±38 43
Tested twice 84±23 27 85±21 24
Tested three times
79±19 24
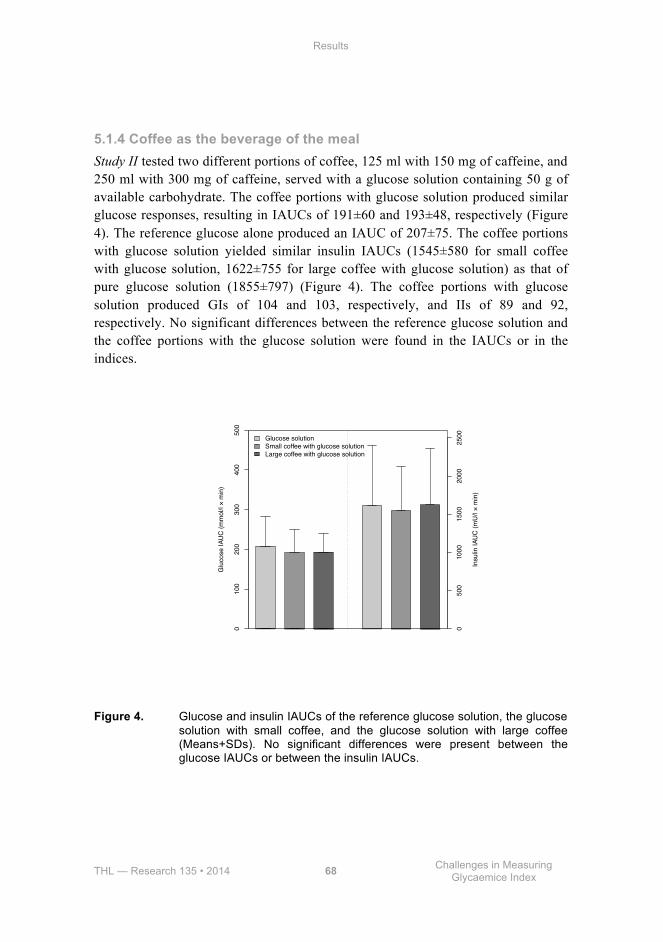
Results
THL — Research 135 • 2014 68 Challenges in Measuring Glycaemice Index
5.1.4 Coffee as the beverage of the meal Study II tested two different portions of coffee, 125 ml with 150 mg of caffeine, and 250 ml with 300 mg of caffeine, served with a glucose solution containing 50 g of available carbohydrate. The coffee portions with glucose solution produced similar glucose responses, resulting in IAUCs of 191±60 and 193±48, respectively (Figure 4). The reference glucose alone produced an IAUC of 207±75. The coffee portions with glucose solution yielded similar insulin IAUCs (1545±580 for small coffee with glucose solution, 1622±755 for large coffee with glucose solution) as that of pure glucose solution (1855±797) (Figure 4). The coffee portions with glucose solution produced GIs of 104 and 103, respectively, and IIs of 89 and 92, respectively. No significant differences between the reference glucose solution and the coffee portions with the glucose solution were found in the IAUCs or in the indices.
Figure 4. Glucose and insulin IAUCs of the reference glucose solution, the glucose solution with small coffee, and the glucose solution with large coffee (Means+SDs). No significant differences were present between the glucose IAUCs or between the insulin IAUCs.
010
020
030
040
050
0
Glu
cose
IAU
C (m
mol
/l ×
min
)
050
010
0015
0020
0025
00
Insu
lin IA
UC
(mU
/l ×
min
)
Glucose solutionSmall coffee with glucose solutionLarge coffee with glucose solution
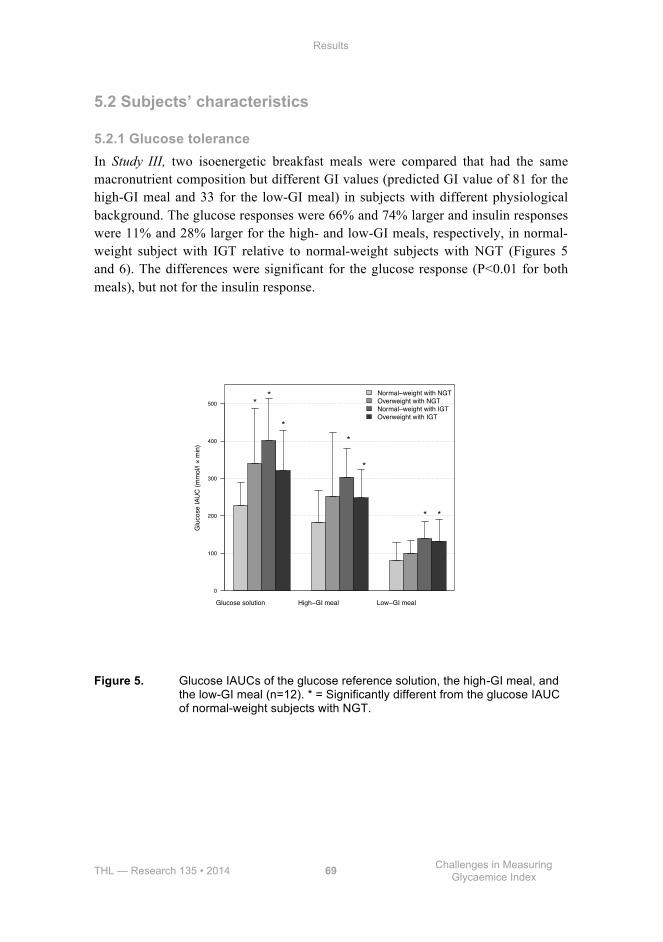
Results
THL — Research 135 • 2014 69 Challenges in Measuring Glycaemice Index
5.2 Subjects’ characteristics
5.2.1 Glucose tolerance In Study III, two isoenergetic breakfast meals were compared that had the same macronutrient composition but different GI values (predicted GI value of 81 for the high-GI meal and 33 for the low-GI meal) in subjects with different physiological background. The glucose responses were 66% and 74% larger and insulin responses were 11% and 28% larger for the high- and low-GI meals, respectively, in normal-weight subject with IGT relative to normal-weight subjects with NGT (Figures 5 and 6). The differences were significant for the glucose response (P<0.01 for both meals), but not for the insulin response.
Figure 5. Glucose IAUCs of the glucose reference solution, the high-GI meal, and the low-GI meal (n=12). * = Significantly different from the glucose IAUC of normal-weight subjects with NGT.
Glucose solution High−GI meal Low−GI meal
Glu
cose
IAU
C (m
mol
/l ×
min
)
0
100
200
300
400
500
Normal−weight with NGTOverweight with NGTNormal−weight with IGTOverweight with IGT
**
**
*
* *
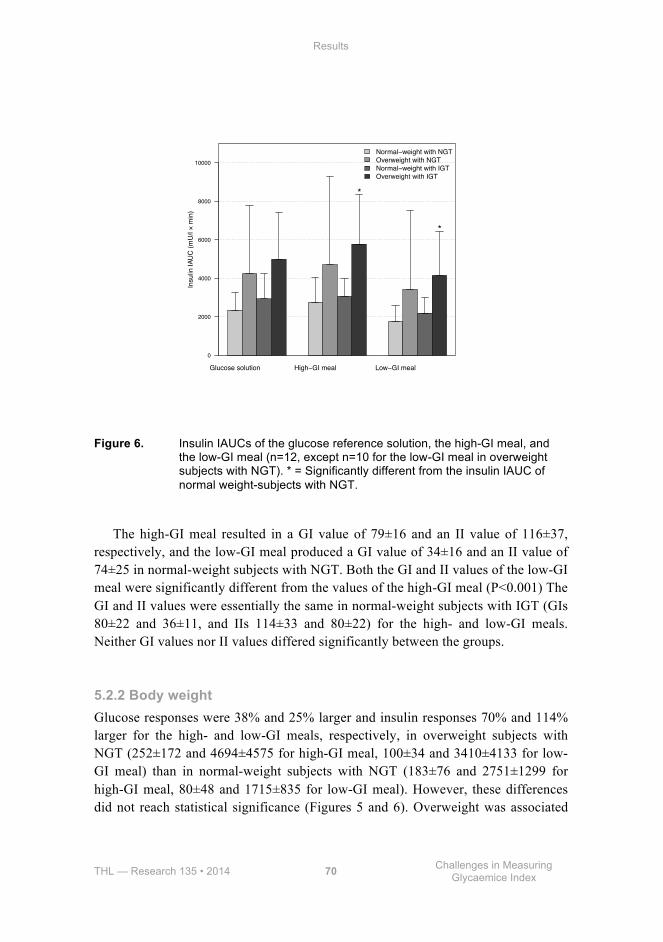
Results
THL — Research 135 • 2014 70 Challenges in Measuring Glycaemice Index
Figure 6. Insulin IAUCs of the glucose reference solution, the high-GI meal, and the low-GI meal (n=12, except n=10 for the low-GI meal in overweight subjects with NGT). * = Significantly different from the insulin IAUC of normal weight-subjects with NGT.
The high-GI meal resulted in a GI value of 79±16 and an II value of 116±37, respectively, and the low-GI meal produced a GI value of 34±16 and an II value of 74±25 in normal-weight subjects with NGT. Both the GI and II values of the low-GI meal were significantly different from the values of the high-GI meal (P<0.001) The GI and II values were essentially the same in normal-weight subjects with IGT (GIs 80±22 and 36±11, and IIs 114±33 and 80±22) for the high- and low-GI meals. Neither GI values nor II values differed significantly between the groups.
5.2.2 Body weight Glucose responses were 38% and 25% larger and insulin responses 70% and 114% larger for the high- and low-GI meals, respectively, in overweight subjects with NGT (252±172 and 4694±4575 for high-GI meal, 100±34 and 3410±4133 for low-GI meal) than in normal-weight subjects with NGT (183±76 and 2751±1299 for high-GI meal, 80±48 and 1715±835 for low-GI meal). However, these differences did not reach statistical significance (Figures 5 and 6). Overweight was associated
Glucose solution High−GI meal Low−GI meal
Insu
lin IA
UC
(mU
/l ×
min
)
0
2000
4000
6000
8000
10000
Normal−weight with NGTOverweight with NGTNormal−weight with IGTOverweight with IGT
*
*
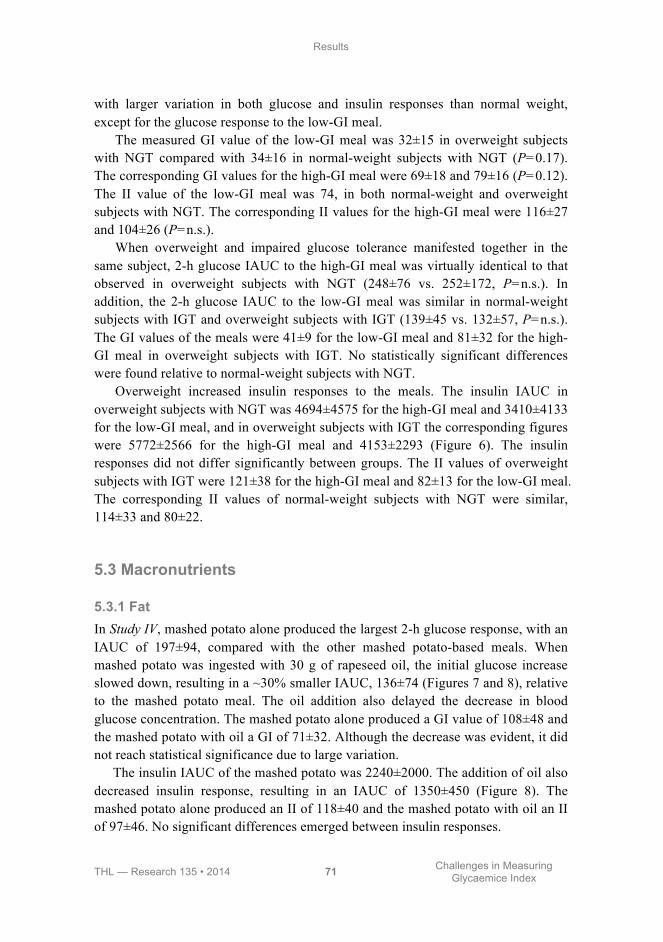
Results
THL — Research 135 • 2014 71 Challenges in Measuring Glycaemice Index
with larger variation in both glucose and insulin responses than normal weight, except for the glucose response to the low-GI meal.
The measured GI value of the low-GI meal was 32±15 in overweight subjects with NGT compared with 34±16 in normal-weight subjects with NGT (P=0.17). The corresponding GI values for the high-GI meal were 69±18 and 79±16 (P=0.12). The II value of the low-GI meal was 74, in both normal-weight and overweight subjects with NGT. The corresponding II values for the high-GI meal were 116±27 and 104±26 (P=n.s.).
When overweight and impaired glucose tolerance manifested together in the same subject, 2-h glucose IAUC to the high-GI meal was virtually identical to that observed in overweight subjects with NGT (248±76 vs. 252±172, P=n.s.). In addition, the 2-h glucose IAUC to the low-GI meal was similar in normal-weight subjects with IGT and overweight subjects with IGT (139±45 vs. 132±57, P=n.s.). The GI values of the meals were 41±9 for the low-GI meal and 81±32 for the high-GI meal in overweight subjects with IGT. No statistically significant differences were found relative to normal-weight subjects with NGT.
Overweight increased insulin responses to the meals. The insulin IAUC in overweight subjects with NGT was 4694±4575 for the high-GI meal and 3410±4133 for the low-GI meal, and in overweight subjects with IGT the corresponding figures were 5772±2566 for the high-GI meal and 4153±2293 (Figure 6). The insulin responses did not differ significantly between groups. The II values of overweight subjects with IGT were 121±38 for the high-GI meal and 82±13 for the low-GI meal. The corresponding II values of normal-weight subjects with NGT were similar, 114±33 and 80±22.
5.3 Macronutrients
5.3.1 Fat In Study IV, mashed potato alone produced the largest 2-h glucose response, with an IAUC of 197±94, compared with the other mashed potato-based meals. When mashed potato was ingested with 30 g of rapeseed oil, the initial glucose increase slowed down, resulting in a ~30% smaller IAUC, 136±74 (Figures 7 and 8), relative to the mashed potato meal. The oil addition also delayed the decrease in blood glucose concentration. The mashed potato alone produced a GI value of 108±48 and the mashed potato with oil a GI of 71±32. Although the decrease was evident, it did not reach statistical significance due to large variation.
The insulin IAUC of the mashed potato was 2240±2000. The addition of oil also decreased insulin response, resulting in an IAUC of 1350±450 (Figure 8). The mashed potato alone produced an II of 118±40 and the mashed potato with oil an II of 97±46. No significant differences emerged between insulin responses.
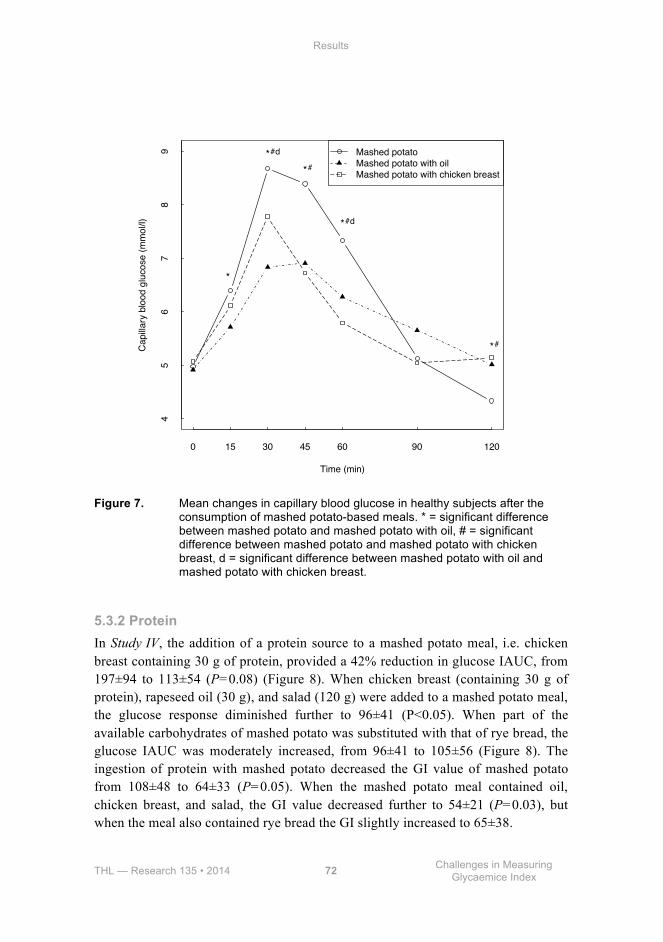
Results
THL — Research 135 • 2014 72 Challenges in Measuring Glycaemice Index
Figure 7. Mean changes in capillary blood glucose in healthy subjects after the consumption of mashed potato-based meals. * = significant difference between mashed potato and mashed potato with oil, # = significant difference between mashed potato and mashed potato with chicken breast, d = significant difference between mashed potato with oil and mashed potato with chicken breast.
5.3.2 Protein In Study IV, the addition of a protein source to a mashed potato meal, i.e. chicken breast containing 30 g of protein, provided a 42% reduction in glucose IAUC, from 197±94 to 113±54 (P=0.08) (Figure 8). When chicken breast (containing 30 g of protein), rapeseed oil (30 g), and salad (120 g) were added to a mashed potato meal, the glucose response diminished further to 96±41 (P<0.05). When part of the available carbohydrates of mashed potato was substituted with that of rye bread, the glucose IAUC was moderately increased, from 96±41 to 105±56 (Figure 8). The ingestion of protein with mashed potato decreased the GI value of mashed potato from 108±48 to 64±33 (P=0.05). When the mashed potato meal contained oil, chicken breast, and salad, the GI value decreased further to 54±21 (P=0.03), but when the meal also contained rye bread the GI slightly increased to 65±38.
Time (min)
Cap
illary
blo
od g
luco
se (m
mol
/l)
0 15 30 45 60 90 120
45
67
89 Mashed potato
Mashed potato with oilMashed potato with chicken breast
*
*#d
*#
*#d
*#
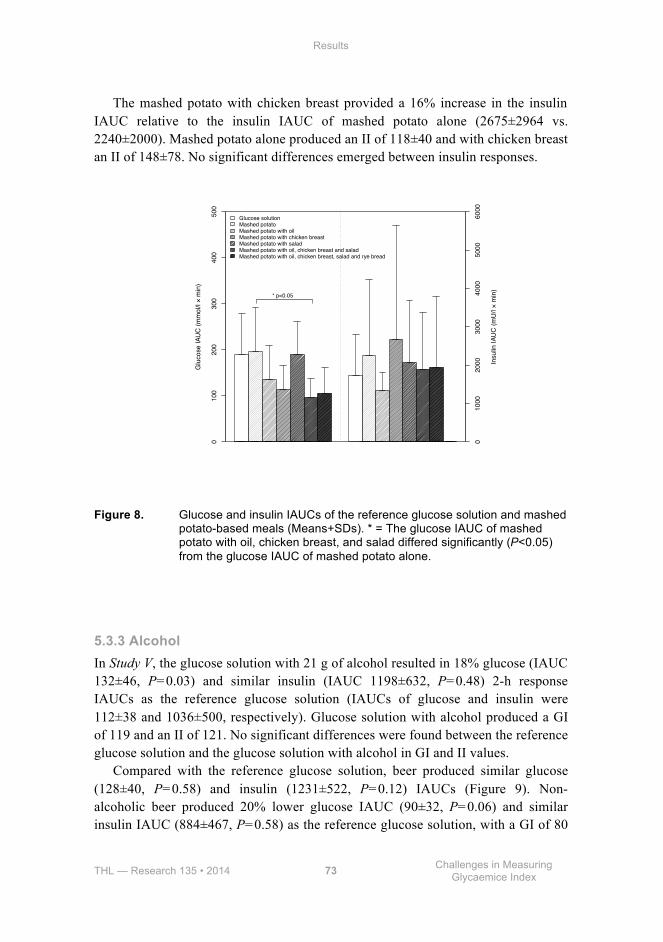
Results
THL — Research 135 • 2014 73 Challenges in Measuring Glycaemice Index
The mashed potato with chicken breast provided a 16% increase in the insulin IAUC relative to the insulin IAUC of mashed potato alone (2675±2964 vs. 2240±2000). Mashed potato alone produced an II of 118±40 and with chicken breast an II of 148±78. No significant differences emerged between insulin responses.
Figure 8. Glucose and insulin IAUCs of the reference glucose solution and mashed potato-based meals (Means+SDs). * = The glucose IAUC of mashed potato with oil, chicken breast, and salad differed significantly (P<0.05) from the glucose IAUC of mashed potato alone.
5.3.3 Alcohol In Study V, the glucose solution with 21 g of alcohol resulted in 18% glucose (IAUC 132±46, P=0.03) and similar insulin (IAUC 1198±632, P=0.48) 2-h response IAUCs as the reference glucose solution (IAUCs of glucose and insulin were 112±38 and 1036±500, respectively). Glucose solution with alcohol produced a GI of 119 and an II of 121. No significant differences were found between the reference glucose solution and the glucose solution with alcohol in GI and II values.
Compared with the reference glucose solution, beer produced similar glucose (128±40, P=0.58) and insulin (1231±522, P=0.12) IAUCs (Figure 9). Non-alcoholic beer produced 20% lower glucose IAUC (90±32, P=0.06) and similar insulin IAUC (884±467, P=0.58) as the reference glucose solution, with a GI of 80
010
020
030
040
050
0
Glu
cose
IAU
C (m
mol
/l ×
min
)
010
0020
0030
0040
0050
0060
00
Insu
lin IA
UC
(mU
/l ×
min
)
Glucose solutionMashed potatoMashed potato with oilMashed potato with chicken breastMashed potato with saladMashed potato with oil, chicken breast and saladMashed potato with oil, chicken breast, salad and rye bread
* p<0.05

Results
THL — Research 135 • 2014 74 Challenges in Measuring Glycaemice Index
and an II of 88. Comparing the differences between the beers, regular beer yielded 42% higher glucose (P=0.04) and 39% higher insulin (P=0.07) IAUCs than the non-alcoholic beer. Beer produced a GI value of 119, and an II value of 131. The GI and II values of beer and non-alcoholic beer were significantly different (P=0.02 and P=0.02, respectively). Glucose solution with alcohol and the beer produced similar glucose and insulin IAUCs (Figure 9).
Figure 9. Mean glucose and insulin IAUCs of the reference glucose solution, glucose solution with alcohol, non-alcoholic beer, and regular beer (Means+SDs). * = Significantly different from the reference glucose solution (P<0.05). ** = Significantly different from the non-alcoholic beer (P<0.05). # = Significantly different from the non-alcoholic beer (P<0.05).
010
020
030
040
0
Glu
cose
IAU
C (m
mol
/l ×
min
)
050
010
0015
0020
00
Insu
lin IA
UC
(mU
/l ×
min
)
Glucose solutionGlucose solution with alcoholNon−alcoholic beerBeer
* p<0.05 ** p<0.05
# p<0.05
THL — Research 135 • 2014 75 Challenges in Measuring Glycaemice Index
6 Discussion
The prevalence of type 2 diabetes is rapidly increasing worldwide, necessitating modifications in diet and lifestyle. Dietary advice for prevention of chronic diseases has recently undergone a notable change. Replacing fat, especially saturated fat, with carbohydrates has been reported not to be effective (Astrup et al. 2011, Jakobsen et al. 2009). Consequently, the quality of carbohydrates has become increasingly important (Buyken et al. 2014, Overby et al. 2013). For decades, glycaemic index (GI) and its impact on health have been subjects of considerable interest in the scientific community as well as in the general public. There are some misunderstandings of GI and its association with nutritional values of foods. For example, ripeness of fruit has an impact on GI value, but it is unimportant for nutritional composition (Aston et al. 2010). Different types of rice have very different GI values, but at the same time highly similar nutrient compositions (Aston et al. 2010). Concern has been raised that excluding some starchy foods with high GI values, e.g. whole-grain breads or potatoes, may have a negative impact on micronutrient intake. A recent study established that consuming foods with low GI values may help in reaching the nutrition recommendations goals (Louie et al. 2012).
Several methodological aspects influence measured GI values. This thesis considers some of these, e.g. the subject’s physiological background, choice of reference food, method of blood sampling, number of tests performed on the reference food, and the effect of fat, protein, coffee, and alcohol on the measured outcome.
The main findings of this thesis were that capillary blood sampling should be used in determining GI values, and the reference test should be repeated at least once. Coffee can be used as a beverage in GI measurement because it does not affect GI values. We also noted that overweight or glucose tolerance does not alter measured GI values. However, macronutrients, fat and protein together, and alcohol alone can modify the GI values measured.
6.1 Methodological choices
6.1.1 Study design In our studies, all subjects were screened with a standardized method to ensure normal glucose tolerance (WHO 1999), except in Study III, where two study groups included subjects with impaired glucose tolerance. Despite pre-study screening, marked individual differences can occur for various reasons, e.g. degree of insulin
Discussion
THL — Research 135 • 2014 76 Challenges in Measuring Glycaemice Index
sensitivity, body composition, and genetic factors. Subjects with an outlying result (>2 SD from the mean) have been suggested to be removed from the GI analysis (ISO 26642:2010. 2010, Wolever et al. 1991). Previously, no general rule has existed in statistical analysis to exclude outliers from the calculation of GIs, but several reasons have been given for unrepresentative results, e.g. incorrect subject preparation, analytical error, or errors in data calculations (Brouns et al. 2005). We did not find any obvious reasons for outlying results, and even if we excluded values >2 SD from the mean, the GIs did not change essentially (data not shown). Thus, without an evident reason, the outliers should not be excluded if a standardized protocol of determining GI values is used and the subjects are properly screened before enrolment in the study. Exclusion could, in fact, reduce true physiological findings. Nevertheless, the new international standard, published in 2010, recommends that if the mean within-subject CV for the reference food for the group of subjects tested is greater than 30%, one outlying result for the reference test in each subject can be deleted. However, two reference tests are still needed (International Standard ISO 26642:2010).
A common criticism of the GI is that GI values vary in different subjects or from day-to-day in the same subject (Aziz et al. 2013, Pi-Sunyer 2002). To diminish variation in glycaemic responses to study meals, we advised the subjects to control their diet and exercise on the preceding day, in accordance with the recommendations in the literature (Brouns et al. 2005). Firstly, the subjects were advised to follow their usual diet. Secondly, they were advised to consume at least 150 g of carbohydrates during the three days preceding the study day to ensure that their stored carbohydrate sources were adequate. Lastly, in Studies I and IV, the subjects were served a standardized evening meal providing 15% of the subject’s daily energy, and in Studies II, III, and V, the subjects were advised to consume an evening meal that would provide 15% of the calculated daily energy requirement. To ensure maximally similar second meal effect as possible (Granfeldt et al. 2006), the major proportion of the energy of the evening meals came from carbohydrates, mainly from white bread. Because the quality of the carbohydrates of the evening meal could affect colonic fermentation and/or differences in the pattern of short-chain fatty acid (SCFA) formed, white bread was chosen as the main source of carbohydrate. Earlier studies have shown that white bread has only a moderate influence on second meal effect (Nilsson et al. 2006, Nilsson et al. 2010). Moreover, it has also been shown that providing an evening meal reduces the variation in GI values (Wolever et al. 2008). However, contradictory findings have also been presented (Campbell et al. 2003). In our postprandial studies, the subjects were not allowed to consume alcohol for 24 h before each study day. There are suggestions that alcohol consumption may have profound effects on glucose homeostasis (Shelmet et al. 1988). However, in a recent study, moderate alcohol consumption on the preceding day did not impact the glycaemic response (Godley et al. 2009).

Discussion
THL — Research 135 • 2014 77 Challenges in Measuring Glycaemice Index
A methodological concern with most postprandial studies testing GI is that they have included 6-12 subjects. Ten people may be insufficient to obtain reliable estimates of GI (Venn and Green 2007). This is particularly true when GI levels are high because of increased variance. According to the recent standard, a minimum of 10 subjects is acceptable (International Standard ISO 26642:2010), but larger groups would give more confidence in the estimates (Williams et al. 2008). In addition, the sample size is dependent on the level of GI. This indicates that in order to detect differences between GI values (i.e. 10 units) on the lower scale (i.e. between 30 and 40) smaller sample size is required than on the upper scale (i.e. between 70 and 80) (Venn and Green 2007). This phenomenon explains why we found only a few significant differences between GI values in our postprandial studies.
In our postprandial studies, excluding Study III, we had a skewed gender distribution. Originally, the aim was to recruit a more balanced gender ratio, but due to the difference in interest to participate, we ended up in with skewed gender distribution. The skewed sex ratio may have slightly affected our results because sex steroids have been shown to impact insulin sensitivity in females (Escalante Pulido and Alpizar Salazar 1999). However, no differences have been observed in glycaemic responses between males and females (Brouns et al. 2005, Wolever et al. 2008). Another limitation is that - we tested only subjects of Caucasian origin. According to some recent studies (Pratt et al. 2011, Wolever et al. 2003, Wolever et al. 2008), ethnicity has no effect on GI values, but contrary findings have also been presented (Kataoka et al. 2013, Venn et al. 2010).
6.1.2 Study foods and meals The international tables of GI values contain marked variation for similar foods (Atkinson et al. 2008). One of the reasons for the variation could be the use of different food databases for calculating the sum of available carbohydrates. Commonly, use of total carbohydrate values calculated by difference (100 – (weight in grams [protein + fat + water + ash + alcohol] in 100 g of food) (FAO/WHO 2003)) increases inaccuracy (Englyst et al. 2007). In some cases, the fibre may be included in the amount of carbohydrates, along with available carbohydrates. Thus, the fact that we used a direct analysis of the starch and sugar content of the tested foods increases the validity of our measured GI and II values.
It has been recently recommended by the International Standards Organization (26642:2010) that the volume of a beverage served with a test food should be 250-500 ml. The water volume of the meal has been speculated to affect postprandial responses by the rate of gastric emptying (Torsdottir and Andersson 1989). A threefold increase in the water volume (from 200 ml to 600 ml) has resulted in a significant 21% increase in glucose response (Sievenpiper et al. 1998), but the opposite findings have also been demonstrated with the water volume varying from 50 ml to 1000 ml (Young and Wolever 1998). An increase in water volume reduces
Discussion
THL — Research 135 • 2014 78 Challenges in Measuring Glycaemice Index
osmolality, thus enhancing gastric emptying and leading to higher glucose responses (Thompson et al. 1982). Therefore, water volume may also have implications in glycaemic testing. On the other hand, studies determining GI values have suggested that varying the volume of a beverage does not significantly modify the results. The standardized volume of beverage should be used, but more research is needed to establish the optimal volume (Young and Wolever 1998). In all of our postprandial studies, the water volume of the meals was standardized to ~500 ml by adjustment of water, excluding the possibility that the differences in glucose responses are due to the varying volume of the meals.
Typically in GI testing, the subjects are allowed to consume coffee, tea or water with the study meals. In our postprandial studies, the subjects were not given the opportunity to choose the beverage; water was the beverage provided, with the exception of Study I, where three subjects chose non-caloric juice as the beverage. In addition, in Study III, the subjects were allowed to choose either water, coffee, or tea as the beverage consumed with meals. A total of 48 subjects (56%) chose coffee. Combining both caffeine-containing beverages, the proportion of subjects drinking coffee or tea was 75%. As seen in Study II, coffee modified glucose and insulin responses only modestly, and therefore, it is unlikely that caffeine-containing beverages affected the results.
6.1.3 Blood sampling method In Study I, we observed that capillary plasma glucose levels were consistently higher than the venous levels during the first two hours for all study meals, which is in line with previous findings (Granfeldt et al. 1995, Wolever et al. 1988b). The capillary blood samples produced almost twice as large IAUCs, but the CVs of the IAUCs were, however, significantly lower than for venous blood. This finding is in agreement with previous studies (Wolever and Bolognesi 1996a). The difference between capillary and venous blood levels is most likely due to the uptake of glucose by forearm muscles when blood flows from the fingertip capillary to the vein in the anticubital fossa. Thus, the greatest difference between capillary and venous blood is seen postprandially. Moreover, the largest difference has been found in healthy subjects who have enhanced peripheral insulin sensitivity, e.g. in young, lean, and fit athletes, and the smallest difference in insulin-resistant subjects (Coppack et al. 1990, Jackson et al. 1983, Marks 1996). Our subjects were lean and their glucose tolerance was screened by OGTT as normal before study enrolment. However, insulin sensitivity was not measured.
Capillary blood sampling is preferred for determining GI values, but it is also acceptable to use venous blood sampling (FAO/WHO 1998). We found that the GIs based on capillary blood sampling were lower than those based on venous blood sampling, which is in accordance with the data from Granfeldt et al. (1995).
Discussion
THL — Research 135 • 2014 79 Challenges in Measuring Glycaemice Index
Similarly to earlier findings (Wolever et al. 2003), we observed that venous blood sampling elicited markedly higher inter-individual variation in GI values (exception rye bread when glucose solution was used as the reference food) than capillary blood sampling. This suggests that capillary blood may allow smaller differences to be detected (Granfeldt et al. 1995, Wolever and Bolognesi 1996b, Vrolix and Mensink 2010). Thus, fingertip capillary blood has been recommended in GI testing because of the greater sensitivity (Brouns et al. 2005, ISO 26642:2010. 2010). Our results confirm the superiority of capillary sampling.
According to the recommendation of FAO/WHO, GI measurements should be based on collection of seven blood samples at 15- to 30-min intervals over 2 h (FAO/WHO 1998), but the effect of frequency of blood sampling has not been widely studied (Wolever 2004). We found that the GI values calculated by using only four time-points (0, 30, 60 and 120 min) were 3% higher for oatmeal porridge (76±23 vs. 78±30) and 9% higher for rye bread (78±33 vs. 86±40), but were not higher for mashed potato (79±22 vs. 79±28). The disparity between rye bread and oat porridge could be explained by lower blood glucose concentration at the 15-min time-point and higher blood glucose concentration at the 45- and 90-min time-points after eating rye bread. In other words, rye bread initially increases and then after the peak value is attained decreases the blood glucose more gradually than oat porridge. Reducing the frequency of blood sampling also produced higher standard deviation and larger variation of GI for all test foods. Our results are in line with an earlier study that demonstrated ~5% increase in GI values and higher SDs and larger variation when sampling frequency was reduced and was based on 4-5 time-points (Wolever 2004). When we extended blood sampling with an additional blood sample taken at 180 min, the GI values were virtually identical for oatmeal porridge (76±23 vs. 77±25) and mashed potato (79±22 vs. 79±24), but not for rye bread (78±33 vs. 84±42). This finding highlights the fact that rye bread produces more stable blood glucose levels which do not return to baseline values at the 120-min time-point.
Capillary blood samples are easier to obtain than venous blood samples, and thus, the sampling requires less skill. In addition, capillary sampling is less invasive than the insertion of a cannula in the forearm. When several venous samples must be collected, a cannula inserted into a vein in the antecubital fossa could be more practical, but requires more qualified personnel. Haemolysis of red blood cells releases insulin-degrading enzyme, which degrades insulin and, as a consequence, reduces insulin concentration in the blood sample (Chevenne et al. 1998). Because of strong haemolysis, we had to exclude some insulin samples from the analysis. To avoid haemolysis, the subjects were advised to warm their hands under running warm water and nurses were advised not to squeeze the fingertip because squeezing may dilute samples with plasma, which decreases both glucose and insulin concentration and may rupture red blood cells. Clear and detailed instructions and a
Discussion
THL — Research 135 • 2014 80 Challenges in Measuring Glycaemice Index
practise session on how to take capillary blood for insulin analysis before starting the study are crucial.
6.1.4 Reference food Both glucose solution and white bread can be used as a reference food (FAO/WHO 1998), but several other foods have also been used (Atkinson et al. 2008, Brouns et al. 2005). Originally, glucose solution was used as the reference in GI testing (Jenkins et al. 1981), but because of concerns that the osmotic effects of glucose solution could lead to delayed gastric emptying, white bread started to be used as a reference (Jenkins et al. 1983). The use of white bread is also advocated because it represents a more physiological meal than glucose solution (Wolever et al. 1991).
In the second interlaboratory study, subjects with a low average glucose IAUC of the reference food tended to have higher variation in reference food IAUC (Wolever et al. 2008). We did not find any correlation between the glucose solution reference IAUCs or the white bread reference IAUCs and within-person variability (data not shown). However, white bread as the reference produced smaller average IAUC with smaller within-subject variation.
We found that glucose produced 20-25% larger IAUCs than white bread when the reference test was repeated two or three times. However, the variation was slightly smaller when white bread was used as the reference. The mean CV of the capillary IAUCs for glucose solution was 36% and for white bread 28%, but different results have also been reported (Wolever et al. 1996, Wolever et al. 2003). Our results are in agreement with previous findings suggesting that a standardized starchy meal could allow more precise definition of 2-h postprandial glycaemia (Wolever et al. 1996).
White bread and its composition can, however, vary notably. As in our study, the amounts of available carbohydrates should be measured instead of taking the amount from local food tables (Wolever et al. 2003). We also used the same frozen and defrosted white bread throughout the study. Glucose response has been demonstrated to be significantly different between fresh, frozen, and defrosted white bread, possible due to an increased amount of retrograded starch during freezing (Burton and Lightowler 2008). This indicates the superiority of glucose solution as the reference. Thus, for international standardization, it is more reliable to use glucose solution as the reference food (Brouns et al. 2005, Wolever et al. 2003).
6.1.5 Number of reference food tests To reduce within-subject variation of blood glucose, the recommendation is that the reference food should be tested at least three times (FAO/WHO 1998, Wolever et al. 1991), but a literature search revealed that the recommendation has not been systemically followed (Atkinson et al. 2008). We determined the effect of using
Discussion
THL — Research 135 • 2014 81 Challenges in Measuring Glycaemice Index
only a single test of reference food on calculating the GI values compared with using two or three tests. We found that testing the reference food twice essentially diminished the variation. The variation in our study was slightly higher, 35-36% for the glucose solution and 28% for white bread, when capillary blood sampling was used, but when we calculated the absolute percentage of difference, it was slightly lower for glucose solution. Wolever et al. (2003) examined how repeating the reference test influenced GI values. They compared three tests with one test and found that when three reference tests were used both the measured GI value and its variation were lower. As known, the distribution of GI values in individual subjects is skewed to a higher value, thus, repeating IAUCs will reduce skewness (Wolever et al. 2008). Increasing the replicate number of the reference food test to three or four clearly decreased variation (Vega-Lopez et al. 2007, Williams et al. 2008).
In Study I, we also found that the variation considerably decreased when the test food (white bread) was tested two or three times. However, GI values of white bread still varied widely between individuals. Our observations are in agreement with earlier findings (Vega-Lopez et al. 2007).
6.1.6 Coffee Based on our study, coffee does not modify postprandial glycaemic and insulinaemic responses induced by carbohydrates. We examined the postprandial responses to two different portions of coffee ingested with a glucose solution. In the large coffee portion, the caffeine content was twofold that of the small portion. Despite the twofold difference in caffeine content, both portions induced an equal glucose response that was similar to a pure glucose solution ingested with water. Our results are in line with previous findings suggesting that coffee does not significantly affect 2-h postprandial glucose responses in healthy subjects (Aldughpassi and Wolever 2009a, Battram et al. 2006, Johnston et al. 2003, Pizziol et al. 1998, Young and Wolever 1998). Contradictory findings have also been reported. Caffeinated coffee compared with decaffeinated coffee significantly enhanced postprandial glycaemia over a 2-h period therefore also increasing the insulin responses in both healthy subjects (Moisey et al. 2008) and subjects with type 2 diabetes (Lane et al. 2007) after mixed-meal tolerance tests (MMTTs).
Earlier studies performed with caffeine capsules or caffeine infusion have shown a decreased insulin sensitivity in healthy humans (Battram et al. 2006, Keijzers et al. 2002, Thong and Graham 2002), in individuals with type 2 diabetes (Lane et al. 2004, Robinson et al. 2004), and in obese men (Petrie et al. 2004). Our findings, however, suggest that caffeine in coffee does not significantly alter postprandial insulin response. A previous study comparing the effects of caffeine capsules (4.45 mg/kg) and coffee with the same caffeine amount on insulin responses during an OGTT found almost 20% lower insulin response after drinking coffee than after

Discussion
THL — Research 135 • 2014 82 Challenges in Measuring Glycaemice Index
ingesting caffeine capsules (Battram et al. 2006). These findings imply that other components of coffee may improve glucose metabolism or attenuate the negative effect of caffeine. Chlorogenic acid found in coffee have been demonstrated to delay intestinal absorption (Johnston et al. 2003, van Dijk et al. 2009). However, when we estimated the impact of coffee on absorption by measuring the IAUCs 0 to 30 min (data not shown), the two different portion sizes of coffee yielded similar glucose responses. Thus, it is obvious that GI values are mainly determined by the carbohydrate source, and only a moderate impact of coffee on measured GI values existed. However, coffee diminished the variation, which is consistent with previous research (Aldughpassi and Wolever 2009b, Wolever et al. 2008).
6.2 Subjects’ characteristics In our study, overweight subjects had 20% larger 2-h glucose response than normal-weight subjects. However, subjects’ BMI did not affect GI values, consistent with previous studies (Wolever et al. 1998a, Wolever et al. 2008, Wolever et al. 2009). Glucose response also increased significantly when subjects had impaired glucose tolerance (IGT) compared with healthy individuals, but subjects’ glucose tolerance did not affect GI values. This finding is also in accordance with earlier results (Atkinson et al. 2008, Indar-Brown et al. 1992, Wolever et al. 1998b). IGT increased insulin response, but the difference was not significant relative to healthy subjects. When IGT and overweight manifested together, the insulin response increased significantly and was over twofold that of normal-weight subjects with normal glucose tolerance (NGT). Protein content of food has been shown to enhance insulin secretion in diabetic subjects (Nuttall et al. 1984, Simpson et al. 1985a). Our test meals contained 14 g of protein, which may partly explain the greater insulin response in subjects with IGT, but we did not observe significant differences in GIs. This finding is in line with previous studies (Wolever et al. 1998a). In insulin-sensitive subjects, ingested protein has enhanced the decline in blood glucose, but no relationship between insulin sensitivity and protein-stimulated insulinaemia has been demostrated (Brand-Miller et al. 2000).
It is well-known that obesity is associated with insulin resistance (Eckel et al. 2011, Johnson and Olefsky 2014, Kahn et al. 2006, Olefsky et al. 1985). In our study, overweight clearly increased insulin responses regardless of the level of glucose tolerance. We found that the insulin response was over twofold in overweight subjects relative to normal-weight subjects. This finding is in line with previous studies that have established a higher postprandial insulin response in overweight subjects than in their normal-weight peers (Jensen et al. 1999, Ramel et al. 2009, Umpaichitra et al. 2004). When overweight and IGT manifested together, the highest insulin responses to the study meals and the reference food were found.
Discussion
THL — Research 135 • 2014 83 Challenges in Measuring Glycaemice Index
This phenomenon has also been seen in earlier studies (Simpson et al. 1985a, Wolever et al. 1998b).
Nevertheless, we found no significant differences in GI values in normal-weight subjects relative to overweight subjects. A recent study observed that BMI correlated negatively with GI values (Al Dhaheri et al. 2010). Consequently, new studies with a larger number of subjects are needed to determine the effect of BMI on GI values more comprehensively.
6.3 Macronutrients Carbohydrate-rich foods are typically eaten as part of a mixed meal. It is a well-known that portion size, i.e. the larger amount of available carbohydrates, influences measured mean glycaemic responses (Wolever et al. 1996), which also affects the interpretation of the results. It is also known that both protein and fat decrease postprandial glycaemia and that protein enhances insulin secretion when ingested with a carbohydrate-rich meal (Gannon et al. 1993a). Carbohydrates has been suggested to explain about 90% of glycaemic response, with both protein and fat having only negligible effects (Wolever et al. 2006a). We found that adding a fat or a protein component either alone or together to a mashed potato-based meal decreased glycaemic responses. The GI values decreased considerably after the addition of oil and/or protein to the mashed potato meal, in line with earlier findings (Flint et al. 2004). Because GI testing is normally based on individual food items, much discussion has centred around measuring GI values for mixed meals and whether it is possible to predict the GI value of a meal (Dodd et al. 2011, Flint et al. 2005, Wolever et al. 2006a, Wolever and Bhaskaran 2012). It has also been suggested that GI values should not be measured for mixed meals (Wolever 2013a).
6.3.1 Fat Earlier studies have found that fat ingested with potato lowers glycaemic responses (Collier and O'Dea 1983, Ercan et al. 1994, Gannon et al. 1993a). However, among subjects with type 2 diabetes no effect on maximal plasma glucose or mean glucose area has been observed (Gannon et al. 1993a). In addition, it has previously been shown that the different degrees of saturation of added fat did not affect glycaemic responses or GI values (MacIntosh et al. 2003). Contrarily, when healthy subjects co-ingested 15 g of sunflower oil with boiled potatoes, an elevated GI was obtained (Leeman et al. 2008). We observed that the addition of 30 g of rapeseed oil to a mashed potato meal reduced glycaemic responses, resulting in a 37-unit smaller GI value than for the consumption of mashed potato alone. This finding is in line with earlier studies (Dodd et al. 2011, Henry et al. 2006, MacIntosh et al. 2003).
Discussion
THL — Research 135 • 2014 84 Challenges in Measuring Glycaemice Index
As known, fat decreases glycaemic response when added to a carbohydrate-rich meal, but the effect is only seen with relatively large amounts of added fat. Moreover, the effect of fat on glycaemic responses is not linear (Normand et al. 2001, Owen and Wolever 2003). When the impact of varying fat across its normal range of intake (from 0 g to 40 g) was examined, it was found that 40 g of fat reduced glucose IAUC by 30% and 5 g of fat produced more than half of this effect. Thus, the glycaemic response elicited by white bread was reduced dose-dependently by adding fat, but the dose-response curve was not linear (Owen and Wolever 2003). A recent study assessed the dose-dependent effect of fat on GI values (with 5-30 g of corn oil). There was no significant effect of fat on GI values in healthy subjects (Moghaddam et al. 2006). Even when we found a 34% decrease in the GI value of mashed potato with 30 g of rapeseed oil, this decrease was not significant. A larger number of subjects may be needed to detect a significant difference in GI value with this amount of fat (Williams et al. 2008).
6.3.2 Protein Adding a protein component to the mashed potato meal reduced glucose response, and insulin response. Our results are line with an earlier study with similar amounts of protein (25-50 g of protein added to 50 g of carbohydrate) showing that postprandial glucose response decreased due to increased insulin response (Gannon et al. 1988, Nuttall et al. 1984).
Protein is inversely associated with GI values and moreover has a 2- to3-fold greater reducing gram-for-gram impact on glycaemic response than fat (Moghaddam et al. 2006). We found that the co-ingestion of fat and protein with mashed potato decreased glycaemic response and the GI values, consistent with an earlier study (Gulliford et al. 1989).
Our finding that the mashed potato-based meals produced high insulin responses is line with previous observations (Coulston et al. 1984a). As a consequence of accumulating data, potato has been classified as one of the most insulinogenic foods (Holt et al. 1997). We measured an II of 118 for mashed potato, which is consistent with the previously reported value of 128 for instant mashed potato (Lan-Pidhainy and Wolever 2011). In our study, the mixed meal containing the protein component evoked the largest insulin response, thus markedly increasing the II. However, adding fat to the meal attenuated the increasing effect of protein on insulinaemic responses. Previous studies have shown that ingested protein significantly increases insulineamia (Bornet et al. 1987, Brand-Miller et al. 2000, Gannon et al. 1988, Gulliford et al. 1989, Krezowski et al. 1986, Nuttall et al. 1984, Nuttall and Gannon 1991), while fat reduces insulin responses (Gannon et al. 1993a, Gulliford et al. 1989, Welch et al. 1987), which is in line with our findings. Thus, the reduced glycaemia is clearly explained by the enhanced insulin secretion (Gentilcore et al.
Discussion
THL — Research 135 • 2014 85 Challenges in Measuring Glycaemice Index
2006, Ma et al. 2009). When rapeseed oil, chicken breast, and salad were included in a mashed potato meal, the insulin response was lower than for mashed potato alone. This suggests that oil and salad were able to overcome the strong increase in insulin response that was induced by the protein source alone. This finding may be explained by the higher energy content of the meal, which slows gastric emptying (Kwiatek et al. 2009). Possibly, the effect of fat on glycaemic responses may depend on insulin sensitivity. Moghaddam et al. (2006) found that fat reduced glycaemic responses less in hyperinsulinaemic subjects than in subjects with normal fasting insulin, but contradictory findings also exist.
A positive correlation between GI and II values emerged in several studies (Björck et al. 2000), but discrepant results have also been presented (Flint et al. 2004). However, adding fat and protein components to starchy has meals significantly increased the IIs of the meals in type 2 diabetic subjects (Bornet et al. 1987). We found that protein enhanced insulin response and increased the IIs of carbohydrate-rich meals, and simultaneously, glucose responses and GI values diminished in healthy subjects. These findings are in accord with previous reports (Bao et al. 2009).
6.3.3 Alcohol We found that alcohol increases postprandial glucose and insulin responses. This finding suggests that alcohol acutely impairs insulin sensitivity. Earlier studies have shown that alcohol induces hypoglycaemia in type 1 diabetic subjects, which is mainly mediated by the inhibition of gluconeogenesis and glycogenolysis (van de Wiel 2004). However, moderate amounts of alcohol seemed to enhance insulin secretion, while not notably affecting postprandial blood glucose in type 2 diabetic subjects (Christiansen et al. 1993). Acute alcohol consumption induces insulin resistance primarily in skeletal muscle (Ting and Lautt 2006). A potential mechanism causing insulin resistance may be increased postprandial triacylglycerol responses, seen in both healthy subjects (Fielding et al. 2000, Raben et al. 2003) and those with type 2 diabetes (Dalgaard et al. 2004). Moreover, no changes in glucose and insulin levels were observed in response to alcohol in a hyperinsulinaemic, euglycaemic clamp study (Christiansen et al. 1996). In addition, a light meal has been proposed to eliminate the insulinogenic effect of moderate alcohol intake in type 2 diabetic subjects (Christiansen et al. 1994). There are, however, only a few studies focusing on the postprandial effect of alcohol in healthy subjects. The impact of alcohol on postprandial glucose and insulin responses has been inconsistent when alcohol is served with meals (Brand-Miller et al. 2007, Fielding et al. 2000, Greenfield et al. 2005, Suter et al. 2001).
Beer produced a very high GI value of 119 (i.e. >70), and non-alcoholic beer a high GI value of 80. The measured GI values are in line with the GI values

Discussion
THL — Research 135 • 2014 86 Challenges in Measuring Glycaemice Index
published the brewing industry, 101 to 120 for four different beers (Walker 2006). However, to our knowledge, only one GI value of 66 for beer has been published (Brand-Miller et al. 2007), but the value is based on a non-standard 10-g carbohydrate portion size. Less than 20 g of available carbohydrate has been found to produce very large within-subject variation of IAUC, which may result in an imprecise estimate of GI (Wolever et al. 2006b) In the literature, a glucose score of 58 has also been presented for beer. However, this score was measured with a 1000-kJ portion of beer containing 33 g of alcohol and 13 g of carbohydrates and using a white bread containing 44 g of carbohydrates as the reference (Brand-Miller et al. 2007). Because of the study design, the glucose score of beer is not comparable with the measured GI values of beer.
A major strength of our study was that the amount of available carbohydrate in the beer was based on laboratory analysis. The analysis showed that the available carbohydrates in beer were starch and malto-oligosaccharides. Earlier studies have revealed that starchy foods have high GI values (Brand-Miller et al. 2009), and the GI values from 75 to 105 for maltose have been reported (Jenkins et al. 1981, Yang et al. 2006). These findings support our result of non-alcoholic beer producing a high GI value of 80. Non-alcoholic beer tended to produce smaller postprandial glucose response than the reference glucose solution, most likely due to the presence of complex malto-oligosaccharides. Products of fermentation have been speculated to result in a pronounced inhibitory effect of gastric emptying relative to the corresponding pure alcohol concentrations (Franke et al. 2004). However, beer and alcohol in glucose solution gave similar responses, which may suggest that alcohol catalyses the breakdown of complex carbohydrates into glucose. This may explain the significantly larger glucose response of beer than of non-alcoholic beer.
Epidemiological studies focusing on the association between GI and chronic diseases have used highly variable GI values for beer, ranging from 36 to 95 (Flood et al. 2006, Neuhouser et al. 2006, Schulz et al. 2005). Commonly, the imputed GI values have been based on other carbohydrate-rich beverages, such as milk and orange juice. Depending on the amount of consumed beer, the misclassification of beer into the group of low GI foods may cause substantial bias in epidemiological studies.
THL — Research 135 • 2014 87 Challenges in Measuring Glycaemice Index
7 Conclusions
This thesis contributes to the information on the relationship between different methodological choices and measurement of GI values of carbohydrate-rich foods. Specific findings of each study were as follows: Study I Capillary blood samples should be used when measuring GI values. In addition, the reference food should be tested at least twice and glucose solution should be used as a reference food to improve the accuracy of the measured GI value.
Study II Coffee as such does not modify the glucose and insulin responses to a carbohydrate food. Thus, coffee can be the beverage of choice in GI testing.
Study III Both overweight and impaired glucose tolerance increased glycaemic and insulinaemic responses to the tested meals and the reference food. As a consequence, subjects’ physiological characteristics, body weight, and glucose tolerance do not affect the measured GI values.
Study IV Both fat and protein have an independent decreasing effect on glycaemia. A mashed potato-based meal including a high-fat or high-protein meal component induces a substantially lower glycaemic response than mashed potato alone.
Study V Alcohol increases postprandial glucose and insulin responses, probably through ethanol-induced insulin resistance. Beer has a high GI value that should be taken into account when GI databases are compiled for epidemiologic research.

THL — Research 135 • 2014 89 Challenges in Measuring Glycaemice Index
8 Future perspectives
Recently, much discussion has centred around the validity of measured GI values and how useful the concept of GI is for the general public and for food labelling (Aziz et al. 2013, Chiu et al. 2011, Hare-Bruun et al. 2008, Wolever 2013a, Wolever 2013b). The GI values for different foods and food combinations have been measured for three decades. The methodological approaches to GI measurement remain under debate despite the recently published international standard (International Standard ISO 26642:2010).
The question arising from the findings of this thesis is how to overcome effects of methodological choices in GI testing. The concept of GI is highly complex. The physicochemical properties of carbohydrates and carbohydrate-rich foods, e.g. the chemical structure of carbohydrate, the food matrix, and food processing, have an impact on postprandial responses. The GI can be one quality measure of carbohydrate-rich foods, but should not to be the only one. The GI is a reliable tool for distinguishing between low- and high-GI foods, with some exceptions. It is possible that different population groups, e.g. groups of different ethnic backgrounds, may considerable affect the classification of the GI values.
Many open questions remain concerning the validity of measured GI values, e.g. questioning the number of study subjects needed and the background of subjects, despite the published international standard (ISO 26642:2010). Several earlier GI studies were conducted with insufficient numbers of study subjects (<10), but these values are still widely used in international databases of GI values, and, as a consequence, in scientific research. Is the GI a valid method for evaluating the quality of carbohydrates? The answer to this is not straightforward. Open-minded scientific discussion and more methodological research are warranted.
In GI testing, the number of subjects should be increased. Unfortunately, this means that many of the earlier GI studies need to be repeated with sufficient numbers of subjects. In addition, the 10 test subjects recommended in the international standard may still be too low. Open questions remain concerning the background of test subjects. Recent research has investigated ethnicity and how it affects postprandial glycaemia and insulinaemia. It has also been suggested that the II is clinically less useful because it varies in different groups of subjects, but thus far only a few studies have assessed the differences between groups of different physiological backgrounds. In addition, GI measurements are often confounded by other food components, such as fat and protein, and, people with different degrees of insulin sensitivity are known to react differently to the protein content of food (Brand-Miller et al. 2000).
Measured insulin responses are required to provide physiological explanations for different glycaemic responses to similar foods, e.g. breads. Recent interest has
Future perspectives
THL — Research 135 • 2014 90 Challenges in Measuring Glycaemice Index
focused on factors other than fat or protein that can modify postprandial responses to different type of breads such as white and rye bread. It has constantly been shown that rye bread produce lower insulin response than white bread despite similar GI values (Juntunen et al. 2002, Juntunen et al. 2003a, Leinonen et al. 1999, Törrönen et al. 2013). This highlights the fact that there is an urgent need for insulin measurements of carbohydrate-rich foods to clarify which starchy foods with similar GI values are better nutritional choices in the same food group. In other words, insulin responses to carbohydrate-rich foods and their IIs are an important topic of for further studies. If valid measurements for both GIs and IIs become available, it would be easier to compile new research settings where the impact of quality of carbohydrates on health can be measured without confounding factors.
THL — Research 135 • 2014 91 Challenges in Measuring Glycaemice Index
Acknowledgements
This study was mostly carried out at the Nutrition Unit of the Department of Lifestyle and Participation, National Institute for Health and Welfare (THL), Finland. Compiling this doctoral dissertation has been a lengthy process, and for the last two years I worked at the Diabetes Prevention Unit of the Department Chronic Disease Prevention, THL. I thank Research Professor, Assistant Director General Erkki Vartiainen, Research Professor Emerita, former Head of the Nutrition Unit Pirjo Pietinen, Research Professor, current Head of the Nutrition Unit Suvi Virtanen, and Adjunct Professor, Head of the Diabetes Prevention Unit Jaana Lindström for providing excellent research facilities.
This work was financially supported by the Academy of Finland, the Finnish Cultural Foundation, the Finnish Graduate School on Applied Bioscience: Bioengineering, Food & Nutrition, Environment, the Yrjö Jahnsson Foundation, the Juho Vainio Foundation, and the Wiipurilainen Osakunta Foundation.
My deepest gratitude goes to my supervisors Adjunct Professor Liisa Valsta, Research Professor Emeritus Jarmo Virtamo and Professor Johan Eriksson. I had a privilege to have three supervisors with enormous scientific expertise. I thank Adjunct Professor Liisa Valsta, who is the mother of ELSA postprandial studies and Project leader, for hiring me in the first place in 2003 and for introducing me to postprandial studies. Your enthusiasm was a core power of the postprandial studies and your expertise in the field of nutrition was extremely valuable. I am also deeply grateful to my supervisor, Research Professor Emeritus Jarmo Virtamo, for your ability to do high-quality work, your wise guidance and generous support, and in addition, for your sharp sense of humour. I thank my supervisor, Professor Johan Eriksson, for your positive attitude and encouragement during these years. I am also deeply grateful to your expertise in diabetes research.
I sincerely thank my official reviewers, Professor Anne Raben and Adjunct Professor Marjukka Kolehmainen, for the smooth review process, which yielded valuable advice and constructive criticism, and Academy Professor Kaisa Poutanen for accepting the role of opponent at my thesis defence. I also want to thank Carol Ann Pelli, who carried out the language revision of the summary.
The postprandial studies were carried out during 2004 and 2008. I warmly thank all of the volunteers who participated in these studies. Without your valuable contribution, this thesis would never have been written. I also warmly thank study nurses, especially Elina Rintala, for conducting the postprandial studies.
I warmly thank my co-authors Iris Erlund, Marja-Leena Hannila, Jaana Leiviskä, Professor Hannu Mykkänen, Mia-Maria Perälä, Harri Sinkko, and Jouko Sundvall. During my years at the THL, I have had many wonderful colleagues and co-workers, including Clarissa Bingham, Katri Hemiö, Niina Kaartinen, Tommi

Acknowledgements
THL — Research 135 • 2014 92 Challenges in Measuring Glycaemice Index
Korhonen, Jenni Lehtisalo, Mirka Lumia, Adjunct Professor Satu Männistö, Sari Niinistö, Adjunct Professor Marja-Leena Ovaskainen, Laura Paalanen, Heikki Pakkala, Merja Paturi, Marianne Prasad, Susanna Raulio, Heli Reinivuo, Anna-Maija Tianen, Päivi Valve, Liisa Uusitalo, and Katja Wikström, just to mention a few of them. Specials thanks go for statisticians Heli Tapanainen, Mikko Kosola, and Jukka Kontto for helping me using SAS and R programs.
Minna Similä, now it is finally over. During the PhD studies, we both learned a lot. Without your company, these years would have been more difficult and heavier, but also more boring. I appreciate your ability to discuss about everything. Many times I have been missed your “brains” after you left THL. I thank you for being the best colleague I have ever had, and at the same time, also being a very good friend with a good sense of humour.
I thank my friends Nina, Minttu, Mari, Taija, Piia, Riina, Tiina, and Mallu for bringing joy to my life. I also thank the Beaujolais group, Tuulia, Riku, Hanna, Kalle, Ilona, Vesku, Taina, and Sami, especially for lively discussions during the long nights of November. Friendship is one of the most valuable things in the world. I warmly thank my parents, my sister and brothers, and my grandmothers for being in my life, and giving me love and support.
This long-lasting project was a huge challenge for me and my family. Tiredness and despair almost resulted in many years of working going down the drain. In the end, impetus for finishing this thesis came not from my ambition, but rather from not bearing the thought of my family having suffered in vain. I am a mother of three wonderful sons, but raising twins and their 18 months younger little brother during PhD studies has tested my limits. I warmly thank my parents and parents-in-law for helping taking care of the children. Juha-Matti, we achieved our first goal: we succeeded in keeping our sons alive. I am so lucky to have you kind of spouse. Without you, I could not have managed during these overwhelming years. You and our precious sons, Eero, Otto, and Ossi, are the most important thing in my life.
Helsinki, September 2014
Katja Hätönen
THL — Research 135 • 2014 93 Challenges in Measuring Glycaemice Index
References
Ajala O, English P, Pinkney J (2013). Systematic review and meta-analysis of different dietary approaches to the management of type 2 diabetes. Am J Clin Nutr 97: 505-516. Al Dhaheri AS, Henry CJ, Lightowler HJ, Ismail LI, Tydeman E, Al Hourani HM (2010). Role of body composition in the glycaemic response to foods fed to three different ethnic groups: a pilot study. Ann Nutr Metab 56: 217-224. Aldughpassi A, Wolever TM (2009a). Effect of coffee and tea on the glycaemic index of foods: no effect on mean but reduced variability. Br J Nutr 101: 1282-1285. Aldughpassi A, Wolever TMS (2009b). Effect of coffee and tea on the glycaemic index of foods: no effect on mean but reduced variability. British Journal of Nutrition 101: 1282-1285. Aldughpassi A, Abdel-Aal el SM, Wolever TM (2012). Barley cultivar, kernel composition, and processing affect the glycemic index. J Nutr 142: 1666-1671. Aller EE, Larsen TM, Claus H, Lindroos AK, Kafatos A, Pfeiffer A et al. (2014). Weight loss maintenance in overweight subjects on ad libitum diets with high or low protein content and glycemic index: the DIOGENES trial 12-month results. Int J Obes (Lond). Arvidsson-Lenner R, Asp NG, Axelsen M, Bryngelsson S, Haapa E, Järvi A et al. (2004). Glycaemic index. Scandinavian Journal of Nutrition 48: 84-94. Asp NG, Johansson CG, Hallmer H, Siljestroemsp M (1983). Rapid enzymic assay of insoluble and soluble dietary fiber. J Agric Food Chem 31: 476–482.
Association of Official Analytical Chemists (2003). Official methods of analysis 17th ed. 2nd revision. AOAC International, Gaithersburg, MD. Aston LM, Jackson D, Monsheimer S, Whybrow S, Handjieva-Darlenska T, Kreutzer M et al. (2010). Developing a methodology for assigning glycaemic index values to foods consumed across Europe. Obes Rev 11: 92-100. Astrup A, Dyerberg J, Elwood P, Hermansen K, Hu FB, Jakobsen MU et al. (2011). The role of reducing intakes of saturated fat in the prevention of cardiovascular disease: where does the evidence stand in 2010? Am J Clin Nutr 93: 684-688. Atkinson FS, Foster-Powell K, Brand-Miller JC (2008). International tables of glycemic index and glycemic load values: 2008. Diabetes Care 31: 2281-2283. Axelsen M, Arvidsson Lenner R, Lonnroth P, Smith U (1999). Breakfast glycaemic response in patients with type 2 diabetes: effects of bedtime dietary carbohydrates. Eur J Clin Nutr 53: 706-710. Axelsen M, Lonnroth P, Lenner RA, Taskinen MR, Smith U, Arvidsson Lenner R (2000). Suppression of nocturnal fatty acid concentrations by bedtime carbohydrate supplement in type 2 diabetes: effects on insulin sensitivity, lipids, and glycemic control Breakfast glycaemic response in patients with type 2 diabetes: effects of bedtime dietary carbohydrates. Am J Clin Nutr 71: 1108-1114. Aziz A, Dumais L, Barber J (2013). Health Canada’s evaluation of the use of glycemic index claims on food labels. Am J Clin Nutr 98: 269-274. Bao J, de Jong V, Atkinson F, Petocz P, Brand-Miller JC (2009). Food insulin index: physiologic basis for predicting insulin demand evoked by composite meals. Am J Clin Nutr 90: 986-992. Bao J, Atkinson F, Petocz P, Willett WC, Brand-Miller JC (2011). Prediction of postprandial glycemia and insulinemia in lean, young, healthy
References
THL — Research 135 • 2014 94 Challenges in Measuring Glycaemice Index
adults: glycemic load compared with carbohydrate content alone. Am J Clin Nutr 93: 984-996. Battram DS, Arthur R, Weekes A, Graham TE (2006). The glucose intolerance induced by caffeinated coffee ingestion is less pronounced than that due to alkaloid caffeine in men. J Nutr 136: 1276-1280. Bhupathiraju SN, Tobias DK, Malik VS, Pan A, Hruby A, Manson JE et al. (2014). Glycemic index, glycemic load, and risk of type 2 diabetes: results from 3 large US cohorts and an updated meta-analysis. Am J Clin Nutr 100: 218-232. Björck I, Granfeldt Y, Liljeberg H, Tovar J, Asp NG (1994). Food properties affecting the digestion and absorption of carbohydrates. Am J Clin Nutr 59: 699S-705S. Björck I, Liljeberg H, Östman E (2000). Low glycaemic-index foods. Br J Nutr 83 Suppl 1: S149-155. Bornet FR, Costagliola D, Rizkalla SW, Blayo A, Fontvieille AM, Haardt MJ et al. (1987). Insulinemic and glycemic indexes of six starch-rich foods taken alone and in a mixed meal by type 2 diabetics. Am J Clin Nutr 45: 588-595. Brand-Miller J, Hayne S, Petocz P, Colagiuri S (2003). Low-glycemic index diets in the management of diabetes: a meta-analysis of randomized controlled trials. Diabetes Care 26: 2261-2267. Brand-Miller JC, Colagiuri S, Gan ST (2000). Insulin sensitivity predicts glycemia after a protein load. Metabolism: clinical and experimental 49: 1-5. Brand-Miller JC, Fatema K, Middlemiss C, Bare M, Liu V, Atkinson F et al. (2007). Effect of alcoholic beverages on postprandial glycemia and insulinemia in lean, young, healthy adults. Am J Clin Nutr 85: 1545-1551.
Brand-Miller JC, Stockmann K, Atkinson F, Petocz P, Denyer G (2009). Glycemic index, postprandial glycemia, and the shape of the curve in healthy subjects: analysis of a database of more than 1,000 foods. Am J Clin Nutr 89: 97-105. Brand JC, Nicholson PL, Thorburn AW, Truswell AS (1985). Food processing and the glycemic index. Am J Clin Nutr 42: 1192-1196. Brand JC, Colagiuri S, Crossman S, Allen A, Roberts DC, Truswell AS (1991). Low-glycemic index foods improve long-term glycemic control in NIDDM. Diabetes Care 14: 95-101. Brand Miller J, Pang E, Broomhead L (1995). The glycaemic index of foods containing sugars: comparison of foods with naturally-occurring v. added sugars. Br J Nutr 73: 613-623. Brouns F, Bjorck I, Frayn KN, Gibbs AL, Lang V, Slama G et al. (2005). Glycaemic index methodology. Nutrition research reviews 18: 145-171. Burton P, Lightowler HJ (2006). Influence of bread volume on glycaemic response and satiety. Br J Nutr 96: 877-882. Burton P, Lightowler HJ (2008). The impact of freezing and toasting on the glycaemic response of white bread. Eur J Clin Nutr 62: 594-599. Buyken AE, Goletzke J, Joslowski G, Felbick A, Cheng G, Herder C et al. (2014). Association between carbohydrate quality and inflammatory markers: systematic review of observational and interventional studies. Am J Clin Nutr 99:813-33. Campbell JE, Glowczewski T, Wolever TMS (2003). Controlling subjects' prior diet and activities does not reduce within-subject variation of postprandial glycemic responses to foods. Nutrition Research 23: 621-629. Carlsson S, Hammar N, Efendic S, Persson PG, Ostenson CG, Grill V (2000). Alcohol consumption,
References
THL — Research 135 • 2014 95 Challenges in Measuring Glycaemice Index
Type 2 diabetes mellitus and impaired glucose tolerance in middle-aged Swedish men. Diabet Med 17: 776-781. Chan JM, Rimm EB, Colditz GA, Stampfer MJ, Willett WC (1994). Obesity, fat distribution, and weight gain as risk factors for clinical diabetes in men. Diabetes Care 17: 961-969. Chevenne D, Letailleur A, Trivin F, Porquet D (1998). Effect of hemolysis on the concentration of insulin in serum determined by RIA and IRMA. Clin Chem 44: 354-356. Chiu CJ, Liu S, Willett WC, Wolever TM, Brand-Miller JC, Barclay AW et al. (2011). Informing food choices and health outcomes by use of the dietary glycemic index. Nutr Rev 69: 231-242. Christiansen C, Thomsen C, Rasmussen O, Glerup H, Berthelsen J, Hansen C et al. (1993). Acute effects of graded alcohol intake on glucose, insulin and free fatty acid levels in non-insulin-dependent diabetic subjects. Eur J Clin Nutr 47: 648-652. Christiansen C, Thomsen C, Rasmussen O, Hauerslev C, Balle M, Hansen C et al. (1994). Effect of alcohol on glucose, insulin, free fatty acid and triacylglycerol responses to a light meal in non-insulin-dependent diabetic subjects. Br J Nutr 71: 449-454. Christiansen C, Thomsen C, Rasmussen O, Hansen C, Hermansen K (1996). The acute impact of ethanol on glucose, insulin, triacylglycerol,and free fatty acid responses and insulin sensitivity in type 2 diabetes. The British journal of nutrition 76: 669-675. Collier G, O'Dea K (1983). The effect of coingestion of fat on the glucose, insulin, and gastric inhibitory polypeptide responses to carbohydrate and protein. Am J Clin Nutr 37: 941-944. Collier GR, Greenberg GR, Wolever TM, Jenkins DJ (1988). The acute effect of fat on insulin secretion. J Clin Endocrinol Metab 66: 323-326.
Conn JW, Newburgh LH (1936). The glycemic response to isoglucogenic quantities of protein and carbohydrate. J Clin Invest 15: 665–671. Coppack SW, Fisher RM, Gibbons GF, Humphreys SM, McDonough MJ, Potts JL et al. (1990). Postprandial substrate deposition in human forearm and adipose tissues in vivo. Clin Sci (Lond) 79: 339-348. Coulston AM, Hollenbeck CB, Liu GC, Williams RA, Starich GH, Mazzaferri EL et al. (1984a). Effect of source of dietary carbohydrate on plasma glucose, insulin, and gastric inhibitory polypeptide responses to test meals in subjects with noninsulin-dependent diabetes mellitus. Am J Clin Nutr 40: 965-970. Coulston AM, Hollenbeck CB, Reaven GM (1984b). Utility of studies measuring glucose and insulin responses to various carbohydrate-containing foods. Am J Clin Nutr 39: 163-167. Cowie CC, Rust KF, Byrd-Holt DD, Gregg EW, Ford ES, Geiss LS et al. (2010). Prevalence of diabetes and high risk for diabetes using A1C criteria in the U.S. population in 1988-2006. Diabetes Care 33: 562-568. Croon L-B, Fuchs G (1980). Fetthaltsbestämning i mjöl och mjölprodukter (Measurement of fat in flour and flour products). Vår föda 32: 425-427. Cummings JH, Stephen AM (2007). Carbohydrate terminology and classification. Eur J Clin Nutr 61 Suppl 1: S5-18. Dalgaard M, Thomsen C, Rasmussen BM, Holst JJ, Hermansen K (2004). Ethanol with a mixed meal decreases the incretin levels early postprandially and increases postprandial lipemia in type 2 diabetic patients. Metabolism 53: 77-83. Davies MJ, Baer DJ, Judd JT, Brown ED, Campbell WS, Taylor PR (2002). Effects of moderate alcohol intake on fasting insulin and glucose concentrations and insulin sensitivity in postmenopausal women: a randomized controlled trial. JAMA 287: 2559-2562.

References
THL — Research 135 • 2014 96 Challenges in Measuring Glycaemice Index
Deane AM, Nguyen NQ, Stevens JE, Fraser RJ, Holloway RH, Besanko LK et al. (2010). Endogenous glucagon-like peptide-1 slows gastric emptying in healthy subjects, attenuating postprandial glycemia. J Clin Endocrinol Metab 95: 215-221. Dodd H, Williams S, Brown R, Venn B (2011). Calculating meal glycemic index by using measured and published food values compared with directly measured meal glycemic index. Am J Clin Nutr 94: 992-996. Eagan H, Kirk RS, Sawyer R (1981). Pearson’s Chemical Analysis of Foods. Church Hill Livingstone pub: Edinburgh, London, Melbourne, and NewYork. Eagan H, R. S. Kirk and R. Sawyer. (1981). Pearson’s Chemical Analysis of Foods. . Church Hill Livingstone pub.: Edinburgh, London, Melbourne, and NewYork. Eckel RH, Kahn SE, Ferrannini E, Goldfine AB, Nathan DM, Schwartz MW et al. (2011). Obesity and type 2 diabetes: what can be unified and what needs to be individualized? Diabetes Care 34: 1424-1430. EFSA Panel on dietetic products, nutrition, and allergies (NDA) (2010). Scientific opinion on dietary reference values for carbohydrates and dietary fibre EFSA Journal 8: 1462. El Khoury D, El-Rassi R, Azar S, Hwalla N (2010). Postprandial ghrelin and PYY responses of male subjects on low carbohydrate meals to varied balancing proportions of proteins and fats. Eur J Nutr 49: 493-500. Elahi D, Nagulesparan M, Hershcopf RJ, Muller DC, Tobin JD, Blix PM et al. (1982). Feedback inhibition of insulin secretion by insulin: relation to the hyperinsulinemia of obesity. N Engl J Med 306: 1196-1202.
Englyst KN, Liu S, Englyst HN (2007). Nutritional characterization and measurement of dietary carbohydrates. Eur J Clin Nutr 61 Suppl 1: S19-39. Ercan N, Gannon MC, Nuttall FQ (1994). Effect of added fat on the plasma glucose and insulin response to ingested potato given in various combinations as two meals in normal individuals. Diabetes Care 17: 1453-1459. Escalante Pulido JME, Alpizar Salazar M (1999). Changes in insulin sensitivity, secretion and glucose effectiveness during menstrual cycle. Arch Med Res 30: 19-22. Evert AB, Boucher JL, Cypress M, Dunbar SA, Franz MJ, Mayer-Davis EJ et al. (2014). Nutrition therapy recommendations for the management of adults with diabetes. Diabetes Care 37 Suppl 1: S120-143. Facchini F, Chen YD, Reaven GM (1994). Light-to-moderate alcohol intake is associated with enhanced insulin sensitivity. Diabetes Care 17: 115-119. FAO/WHO. Carbohydrates in human nutrition. Report of a Joint FAO/WHO Expert Consultation: FAO Food Nutr Pap, 1998, vol 66, pp 1-140. FAO/WHO. Food energy - methods of analysis and conversion factors. Report of a Technical Workshop, Rome, 3-6, December 2002. Rome, Food and Agriculture Organizations of the United Nations, 2003. Fielding BA, Reid G, Grady M, Humphreys SM, Evans K, Frayn KN (2000). Ethanol with a mixed meal increases postprandial triacylglycerol but decreases postprandial non-esterified fatty acid concentrations. The British journal of nutrition 83: 597-604. Flint A, Moller BK, Raben A, Pedersen D, Tetens I, Holst JJ et al. (2004). The use of glycaemic index tables to predict glycaemic index of composite breakfast meals. Br J Nutr 91: 979-989.
References
THL — Research 135 • 2014 97 Challenges in Measuring Glycaemice Index
Flint A, Moller BK, Raben A, Tetens I, Holst JJ, Astrup A (2005). The use of glycaemic index tables to predict glycaemic index of breakfast meals. Br J Nutr 94: 135-136. Flood A, Subar AF, Hull SG, Zimmerman TP, Jenkins DJ, Schatzkin A (2006). Methodology for adding glycemic load values to the National Cancer Institute Diet History Questionnaire database. J Am Diet Assoc 106: 393-402. Forsén T, Eriksson JG, Tuomilehto J, Teramo K, Osmond C, Barker DJ (1997). Mother's weight in pregnancy and coronary heart disease in a cohort of Finnish men: follow up study. BMJ 315: 837-840. Foster-Powell K, Miller JB (1995). International tables of glycemic index. Am J Clin Nutr 62: 871S-890S. Franke A, Teyssen S, Harder H, Singer MV (2004). Effect of ethanol and some alcoholic beverages on gastric emptying in humans. Scand J Gastroenterol 39: 638-644. Galgani JE, Ravussin E (2012). Postprandial whole-body glycolysis is similar in insulin-resistant and insulin-sensitive non-diabetic humans. Diabetologia 55: 737-742. Gannon MC, Nuttall FQ, Krezowski PA, Billington CJ, Parker S (1986). The serum insulin and plasma glucose responses to milk and fruit products in type 2 (non-insulin-dependent) diabetic patients. Diabetologia 29: 784-791. Gannon MC, Nuttall FQ, Neil BJ, Westphal SA (1988). The insulin and glucose responses to meals of glucose plus various proteins in type II diabetic subjects. Metabolism: clinical and experimental 37: 1081-1088. Gannon MC, Ercan N, Westphal SA, Nuttall FQ (1993a). Effect of added fat on plasma glucose and insulin response to ingested potato in individuals with NIDDM. Diabetes Care 16: 874-880.
Gannon MC, Nuttall FQ, Westphal SA, Seaquist ER (1993b). The effect of fat and carbohydrate on plasma glucose, insulin, C-peptide, and triglycerides in normal male subjects. J Am Coll Nutr 12: 36-41. Gentilcore D, Chaikomin R, Jones KL, Russo A, Feinle-Bisset C, Wishart JM et al. (2006). Effects of fat on gastric emptying of and the glycemic, insulin, and incretin responses to a carbohydrate meal in type 2 diabetes. J Clin Endocrinol Metab 91: 2062-2067. Giugliano D, Ceriello A, Esposito K (2008). Glucose metabolism and hyperglycemia. Am J Clin Nutr 87: 217S-222S. Godley R, Brown RC, Williams SM, Green TJ (2009). Moderate alcohol consumption the night before glycaemic index testing has no effect on glycaemic response. Eur J Clin Nutr 63: 692-694. Graham TE, Sathasivam P, Rowland M, Marko N, Greer F, Battram D (2001). Caffeine ingestion elevates plasma insulin response in humans during an oral glucose tolerance test. Canadian journal of physiology and pharmacology 79: 559-565. Granfeldt Y, Hagander B, Björck I (1995). Metabolic responses to starch in oat and wheat products. On the importance of food structure, incomplete gelatinization or presence of viscous dietary fibre. Eur J Clin Nutr 49: 189-199. Granfeldt Y, Wu X, Bjorck I (2006). Determination of glycaemic index; some methodological aspects related to the analysis of carbohydrate load and characteristics of the previous evening meal. Eur J Clin Nutr 60: 104-112. Greenfield JR, Samaras K, Hayward CS, Chisholm DJ, Campbell LV (2005). Beneficial postprandial effect of a small amount of alcohol on diabetes and cardiovascular risk factors: modification by insulin resistance. J Clin Endocrinol Metab 90: 661-672. Gulliford MC, Bicknell EJ, Scarpello JH (1989). Differential effect of protein and fat ingestion on blood glucose responses to high- and low-glycemic-
References
THL — Research 135 • 2014 98 Challenges in Measuring Glycaemice Index
index carbohydrates in noninsulin-dependent diabetic subjects. Am J Clin Nutr 50: 773-777. Gunnerud UJ, Ostman EM, Bjorck IM (2013). Effects of whey proteins on glycaemia and insulinaemia to an oral glucose load in healthy adults; a dose-response study. Eur J Clin Nutr 67: 749-753. Ha M-A, Mann JI, Melton LD, Lewis-Barned NJ (1992). Calculation of the glycaemic index. Diabetes, Nutrition and Metabolism, Clinical and Experimental 5: 137-139. Hare-Bruun H, Nielsen BM, Grau K, Oxlund AL, Heitmann BL (2008). Should glycemic index and glycemic load be considered in dietary recommendations? Nutr Rev 66: 569–590. Henry CJ, Lightowler HJ, Kendall FL, Storey M (2006). The impact of the addition of toppings/fillings on the glycaemic response to commonly consumed carbohydrate foods. Eur J Clin Nutr 60: 763-769. Henry CJ, Lightowler HJ, Newens K, Sudha V, Radhika G, Sathya RM et al. (2008). Glycaemic index of common foods tested in the UK and India. Br J Nutr 99: 840-845. Hollenbeck CB, Coulston AM, Reaven GM (1986). Glycemic effects of carbohydrates: a different perspective. Diabetes Care 9: 641-647. Holt S, Brand J, Soveny C, Hansky J (1992). Relationship of satiety to postprandial glycaemic, insulin and cholecystokinin responses. Appetite 18: 129-141. Holt SH, Miller JC, Petocz P (1997). An insulin index of foods: the insulin demand generated by 1000-kJ portions of common foods. Am J Clin Nutr 66: 1264-1276. Indar-Brown K, Noreberg C, Madar Z (1992). Glycemic and insulinemic responses after ingestion
of ethnic foods by NIDDM and healthy subjects. Am J Clin Nutr 55: 89-95. International Organization for Standardization. (2010). Food products - Determination of the glycaemic index (GI) and recommendation for food classification. Geneva, Switzerland, 23 September 2010, ISO 26642:2010. Jackson RA, Blix PM, Matthews JA, Morgan LM, Rubenstein AH, Nabarro JD (1983). Comparison of peripheral glucose uptake after oral glucose loading and a mixed meal. Metabolism: clinical and experimental 32: 706-710. Jakobsen MU, O'Reilly EJ, Heitmann BL, Pereira MA, Balter K, Fraser GE et al. (2009). Major types of dietary fat and risk of coronary heart disease: a pooled analysis of 11 cohort studies. Am J Clin Nutr 89: 1425-1432. Jenkins DJ, Wolever TM, Taylor RH, Barker H, Fielden H, Baldwin JM et al. (1981). Glycemic index of foods: a physiological basis for carbohydrate exchange. Am J Clin Nutr 34: 362-366. Jenkins DJ, Wolever TM, Jenkins AL, Thorne MJ, Lee R, Kalmusky J et al. (1983). The glycaemic index of foods tested in diabetic patients: a new basis for carbohydrate exchange favouring the use of legumes. Diabetologia 24: 257-264. Jenkins DJ, Wolever TM, Wong GS, Kenshole A, Josse RG, Thompson LU et al. (1984). Glycemic responses to foods: possible differences between insulin-dependent and noninsulin-dependent diabetics. Am J Clin Nutr 40: 971-981. Jenkins DJ, Wolever TM, Jenkins AL, Giordano C, Giudici S, Thompson LU et al. (1986). Low glycemic response to traditionally processed wheat and rye products: bulgur and pumpernickel bread. Am J Clin Nutr 43: 516-520. Jensen J, Bysted A, Dawids S, Hermansen K, Holmer G (1999). The effect of palm oil, lard, and puff-pastry margarine on postprandial lipid and

References
THL — Research 135 • 2014 99 Challenges in Measuring Glycaemice Index
hormone responses in normal-weight and obese young women. Br J Nutr 82: 469-479. Johnson AM, Olefsky JM (2014). The origins and drivers of insulin resistance. Cell 152: 673-684. Johnston KL, Clifford MN, Morgan LM (2003). Coffee acutely modifies gastrointestinal hormone secretion and glucose tolerance in humans: glycemic effects of chlorogenic acid and caffeine. Am J Clin Nutr 78: 728-733. Jones CL, Abbasi F, Carantoni M, Polonsky KS, Reaven GM (2000). Roles of insulin resistance and obesity in regulation of plasma insulin concentrations. Am J Physiol Endocrinol Metab 278: E501-E508. Juanola-Falgarona M, Salas-Salvado J, Ibarrola-Jurado N, Rabassa-Soler A, Diaz-Lopez A, Guasch-Ferre M et al. (2014). Effect of the glycemic index of the diet on weight loss, modulation of satiety, inflammation, and other metabolic risk factors: a randomized controlled trial. Am J Clin Nutr 100: 27-35. Juntunen KS, Niskanen LK, Liukkonen KH, Poutanen KS, Holst JJ, Mykkanen HM (2002). Postprandial glucose, insulin, and incretin responses to grain products in healthy subjects. Am J Clin Nutr 75: 254-262. Juntunen KS, Laaksonen DE, Autio K, Niskanen LK, Holst JJ, Savolainen KE et al. (2003a). Structural differences between rye and wheat breads but not total fiber content may explain the lower postprandial insulin response to rye bread. Am J Clin Nutr 78: 957-964. Juntunen KS, Laaksonen DE, Poutanen KS, Niskanen LK, Mykkanen HM (2003b). High-fiber rye bread and insulin secretion and sensitivity in healthy postmenopausal women. Am J Clin Nutr 77: 385-391.
Kahn SE, Hull RL, Utzschneider KM (2006). Mechanisms linking obesity to insulin resistance and type 2 diabetes. Nature 444: 840-846. Kataoka M, Venn BJ, Williams SM, Te Morenga LA, Heemels IM, Mann JI (2013). Glycaemic responses to glucose and rice in people of Chinese and European ethnicity. Diabet Med 30: e101-107. Keijzers GB, De Galan BE, Tack CJ, Smits P (2002). Caffeine can decrease insulin sensitivity in humans. Diabetes Care 25: 364-369. Kelly SAM, Frost G, Whittaker V, Summerbell CD. Low glycaemic index diets for coronary heart disease: Cochrane Database of Systematic Reviews: Reviews 2004 Issue 4, John Wiley & Sons, Ltd, 2004. Kiechl S, Willeit J, Poewe W, Egger G, Oberhollenzer F, Muggeo M et al. (1996). Insulin sensitivity and regular alcohol consumption: large, prospective, cross sectional population study (Bruneck study). BMJ 313: 1040-1044. Kim SH, Reaven GM (2008). Insulin resistance and hyperinsulinemia. You can't have one without the other. Diabetes Care 31: 1433-1438. Kim SH, Abbasi F, Lamendola C, Reaven GM (2009). Effect of moderate alcoholic beverage consumption on insulin sensitivity in insulin-resistant, nondiabetic individuals. Metabolism 58: 387-392. Krezowski PA, Nuttall FQ, Gannon MC, Bartosh NH (1986). The effect of protein ingestion on the metabolic response to oral glucose in normal individuals. Am J Clin Nutr 44: 847-856. Kristo AS, Matthan NR, Lichtenstein AH (2013). Effect of diets differing in glycemic index and glycemic load on cardiovascular risk factors: review of randomized controlled-feeding trials. Nutrients 5: 1071-1080.
References
THL — Research 135 • 2014 100 Challenges in Measuring Glycaemice Index
Kwiatek MA, Menne D, Steingoetter A, Goetze O, Forras-Kaufman Z, Kaufman E et al. (2009). Effect of meal volume and calorie load on postprandial gastric function and emptying: studies under physiological conditions by combined fiber-optic pressure measurement and MRI. Am J Physiol Gastrointest Liver Physiol 297: G894-901. Laaksonen DE, Toppinen LK, Juntunen KS, Autio K, Liukkonen KH, Poutanen KS et al. (2005). Dietary carbohydrate modification enhances insulin secretion in persons with the metabolic syndrome. Am J Clin Nutr 82: 1218-1227. Lan-Pidhainy X, Wolever TM (2011). Are the glycemic and insulinemic index values of carbohydrate foods similar in healthy control, hyperinsulinemic and type 2 diabetic patients? Eur J Clin Nutr 65: 727-734. Lane JD, Barkauskas CE, Surwit RS, Feinglos MN (2004). Caffeine impairs glucose metabolism in type 2 diabetes. Diabetes Care 27: 2047-2048. Lane JD, Hwang AL, Feinglos MN, Surwit RS (2007). Exaggeration of postprandial hyperglycemia in patients with type 2 diabetes by administration of caffeine in coffee. Endocr Pract 13: 239-243. Larsen HN, Rasmussen OW, Rasmussen PH, Alstrup KK, Biswas SK, Tetens I et al. (2000). Glycaemic index of parboiled rice depends on the severity of processing: study in type 2 diabetic subjects. Eur J Clin Nutr 54: 380-385. Larsen TM, Dalskov SM, van Baak M, Jebb SA, Papadaki A, Pfeiffer AF et al. (2010). Diets with high or low protein content and glycemic index for weight-loss maintenance. N Engl J Med 363: 2102-2113. Lee BM, Wolever TM (1998). Effect of glucose, sucrose and fructose on plasma glucose and insulin responses in normal humans: comparison with white bread. Eur J Clin Nutr 52: 924-928.
Leeman M, Östman E, Björck I (2008). Glycaemic and satiating properties of potato products. Eur J Clin Nutr 62: 87-95. Leinonen K, Liukkonen K, Poutanen K, Uusitupa M, Mykkanen H (1999). Rye bread decreases postprandial insulin response but does not alter glucose response in healthy Finnish subjects. Eur J Clin Nutr 53: 262-267. Levitan EB, Cook NR, Stampfer MJ, Ridker PM, Rexrode KM, Buring JE et al. (2008). Dietary glycemic index, dietary glycemic load, blood lipids, and C-reactive protein. Metabolism: clinical and experimental 57: 437-443. Livesey G, Taylor R, Livesey H, Liu S (2013). Is there a dose-response relation of dietary glycemic load to risk of type 2 diabetes? Meta-analysis of prospective cohort studies. Am J Clin Nutr 97: 584-596. Louie JC, Buyken AE, Brand-Miller JC, Flood VM (2012). The link between dietary glycemic index and nutrient adequacy. Am J Clin Nutr 95: 694-702. Ludwig DS (2002). The glycemic index: physiological mechanisms relating to obesity, diabetes, and cardiovascular disease. Jama 287: 2414-2423. Ma J, Stevens JE, Cukier K, Maddox AF, Wishart JM, Jones KL et al. (2009). Effects of a protein 'preload' on gastric emptying, glycemia, and gut hormones after a carbohydrate meal in diet-controlled type 2 diabetes. Diabetes Care. MacIntosh CG, Holt SH, Brand-Miller JC (2003). The degree of fat saturation does not alter glycemic, insulinemic or satiety responses to a starchy staple in healthy men. J Nutr 133: 2577-2580. Marks V (1996). Blood glucose: Its measurement and clinical importance. Clinica Chimica Acta 251: 3-17.

References
THL — Research 135 • 2014 101 Challenges in Measuring Glycaemice Index
Matthews DR, Hosker JP, Rudenski AS, Naylor BA, Treacher DF, Turner RC (1985). Homeostasis model assessment: insulin resistance and beta-cell function from fasting plasma glucose and insulin concentrations in man. Diabetologia 28: 412-419. Mayer EJ, Newman B, Quesenberry CP, Jr., Friedman GD, Selby JV (1993). Alcohol consumption and insulin concentrations. Role of insulin in associations of alcohol intake with high-density lipoprotein cholesterol and triglycerides. Circulation 88: 2190-2197. McCleary BV, Gibson TS, Mugford DC (1997). Measurement of total starch in cereal products by amyloglucosidase - a-amylase method: Collaborative study. JAOAC Int 80: 571-579. Meistas MT, Margolis S, Kowarski AA (1983). Hyperinsulinemia of obesity is due to decreased clearance of insulin. Am J Physiol 245: E155-159. Mirrahimi A, de Souza RJ, Chiavaroli L, Sievenpiper JL, Beyene J, Hanley AJ et al. (2012). Associations of glycemic index and load with coronary heart disease events: a systematic review and meta-analysis of prospective cohorts. J Am Heart Assoc 1: e000752. Moghaddam E, Vogt JA, Wolever TM (2006). The effects of fat and protein on glycemic responses in nondiabetic humans vary with waist circumference, fasting plasma insulin, and dietary fiber intake. J Nutr 136: 2506-2511. Moisey LL, Kacker S, Bickerton AC, Robinson LE, Graham TE (2008). Caffeinated coffee consumption impairs blood glucose homeostasis in response to high and low glycemic index meals in healthy men. Am J Clin Nutr 87: 1254-1261. Napoli R, Cozzolino D, Guardasole V, Angelini V, Zarra E, Matarazzo M et al. (2005). Red wine consumption improves insulin resistance but not endothelial function in type 2 diabetic patients. Metabolism 54: 306-313.
Neuhouser ML, Tinker LF, Thomson C, Caan B, Horn LV, Snetselaar L et al. (2006). Development of a glycemic index database for food frequency questionnaires used in epidemiologic studies. J Nutr 136: 1604-1609. Nilsson A, Granfeldt Y, Ostman E, Preston T, Bjorck I (2006). Effects of GI and content of indigestible carbohydrates of cereal-based evening meals on glucose tolerance at a subsequent standardised breakfast. Eur J Clin Nutr 60: 1092-1099. Nilsson AC, Ostman EM, Knudsen KE, Holst JJ, Bjorck IM (2010). A cereal-based evening meal rich in indigestible carbohydrates increases plasma butyrate the next morning. J Nutr 140: 1932-1936. Nilsson M, Stenberg M, Frid AH, Holst JJ, Bjorck IM (2004). Glycemia and insulinemia in healthy subjects after lactose-equivalent meals of milk and other food proteins: the role of plasma amino acids and incretins. Am J Clin Nutr 80: 1246-1253. Nordic Council of Ministers. Nordic Nutrition Recommendations 2004: Integrating nutrition and physical activity. Copenhagen, Nordic Council of Ministers, 2004. AIP 2004:013. Nordic Council of Ministers. (2005). Glycemic index: from research to nutrition recommendations? Nordic Council of Ministers, Copenhagen 2005. TemaNord 2005:589. Nuttall FQ, Mooradian AD, Gannon MC, Billington C, Krezowski P (1984). Effect of protein ingestion on the glucose and insulin response to a standardized oral glucose load. Diabetes Care 7: 465-470. Nuttall FQ, Gannon MC (1991). Plasma glucose and insulin response to macronutrients in nondiabetic and NIDDM subjects. Diabetes Care 14: 824-838. Oikarinen SI, Erlund I, Mutanen M (2007). Tumor formation in multiple intestinal neoplasia (ApcMin/+) mice fed with filtered or unfiltered coffee.
References
THL — Research 135 • 2014 102 Challenges in Measuring Glycaemice Index
Scandinavian Journal of Food and Nutrition 51: 167-173. Olefsky JM, Ciaraldi TP, Kolterman OG (1985). Mechanisms of insulin resistance in non-insulin-dependent (type II) diabetes. Am J Med 79: 12-22. Otto H, Niklas L (1980). Differences d'action sur la glycemie d'ailments contenant des hydrates de carbone: consequences pour le traitment dietetique du diabete sucre. Med Hyg 38: 3424-3429. Owen B, Wolever TM (2003). Effect of fat glycaemic responses in normal subjects: a dose-response study. Nutrition Research 2003: 1341-1347. Overby NC, Sonestedt E, Laaksonen DE, Birgisdottir BE (2013). Dietary fiber and the glycemic index: a background paper for the Nordic Nutrition Recommendations 2012. Food Nutr Res 57. Petrie HJ, Chown SE, Belfie LM, Duncan AM, McLaren DH, Conquer JA et al. (2004). Caffeine ingestion increases the insulin response to an oral-glucose-tolerance test in obese men before and after weight loss. Am J Clin Nutr 80: 22-28. Pi-Sunyer FX (2002). Glycemic index and disease. Am J Clin Nutr 76: 290S-298S. Pizziol A, Tikhonoff V, Paleari CD, Russo E, Mazza A, Ginocchio G et al. (1998). Effects of caffeine on glucose tolerance: a placebo-controlled study. Eur J Clin Nutr 52: 846-849. Pratt M, Lightowler H, Henry CJ, Thabuis C, Wils D, Guerin-Deremaux L (2011). No observable differences in glycemic response to maltitol in human subjects from 3 ethnically diverse groups. Nutrition Research 31: 223-228. Raben A, Agerholm-Larsen L, Flint A, Holst JJ, Astrup A (2003). Meals with similar energy densities but rich in protein, fat, carbohydrate, or alcohol have different effects on energy expenditure and substrate
metabolism but not on appetite and energy intake. Am J Clin Nutr 77: 91-100. Ramel A, Gudmundsdottir FD, Thorsdottir I (2009). Effects of two different types of fast food on postprandial metabolism in normal and overweight subjects. Eur J Clin Nutr 66: 1193-1198. Riby JE, Fujisawa T, Kretchmer N (1993). Fructose absorption. Am J Clin Nutr 58: 748S-753S. Riccardi G, Rivellese AA, Giacco R (2008). Role of glycemic index and glycemic load in the healthy state, in prediabetes, and in diabetes. Am J Clin Nutr 87: 269S-274S. Robinson LE, Savani S, Battram DS, McLaren DH, Sathasivam P, Graham TE (2004). Caffeine ingestion before an oral glucose tolerance test impairs blood glucose management in men with type 2 diabetes. J Nutr 134: 2528-2533. Salmeron J, Manson JE, Stampfer MJ, Colditz GA, Wing AL, Willett WC (1997). Dietary fiber, glycemic load, and risk of non-insulin-dependent diabetes mellitus in women. Jama 277: 472-477. Schmid R, Schulte-Frohlinde E, Schusdziarra V, Neubauer J, Stegmann M, Maier V et al. (1992). Contribution of postprandial amino acid levels to stimulation of insulin, glucagon, and pancreatic polypeptide in humans. Pancreas 7: 698-704. Schulz M, Liese AD, Mayer-Davis EJ, D'Agostino RB, Jr., Fang F, Sparks KC et al. (2005). Nutritional correlates of dietary glycaemic index: new aspects from a population perspective. Br J Nutr 94: 397-406. Schwingshackl L, Hoffmann G (2013). Long-term effects of low glycemic index/load vs. high glycemic index/load diets on parameters of obesity and obesity-associated risks: a systematic review and meta-analysis. Nutr Metab Cardiovasc Dis 23: 699-706.
References
THL — Research 135 • 2014 103 Challenges in Measuring Glycaemice Index
Shai I, Wainstein J, Harman-Boehm I, Raz I, Fraser D, Rudich A et al. (2007). Glycemic effects of moderate alcohol intake among patients with type 2 diabetes: a multicenter, randomized, clinical intervention trial. Diabetes Care 30: 3011-3016. Shelmet JJ, Reichard GA, Skutches CL, Hoeldtke RD, Owen OE, Boden G (1988). Ethanol causes acute inhibition of carbohydrate, fat, and protein oxidation and insulin resistance. J Clin Invest 81: 1137-1145. Sievenpiper JL, Vuksan V, Wong EY, Mendelson RA, Bruce-Thompson C (1998). Effect of meal dilution on the postprandial glycemic response. Implications for glycemic testing. Diabetes Care 21: 711-716. Similä ME, Valsta LM, Virtanen MJ, Hätönen KA, Virtamo J (2009). Glycaemic index database for the epidemiological Alpha-Tocopherol, Beta-Carotene Cancer Prevention (ATBC) Study. Br J Nutr 101: 1400-1405. Simpson RW, McDonald J, Wahlqvist ML, Atley L, Outch K (1985a). Macronutrients have different metabolic effects in nondiabetics and diabetics. Am J Clin Nutr 42: 449-453. Simpson RW, McDonald J, Wahlqvist ML, Atley L, Outch K (1985b). Food physical factors have different metabolic effects in nondiabetics and diabetics. Am J Clin Nutr 42: 462-469. Spiller GA, Jensen CD, Pattison TS, Chuck CS, Whittam JH, Scala J (1987). Effect of protein dose on serum glucose and insulin response to sugars. Am J Clin Nutr 46: 474-480. Sugiyama M, Tang AC, Wakaki Y, Koyama W (2003). Glycemic index of single and mixed meal foods among common Japanese foods with white rice as a reference food. Eur J Clin Nutr 57: 743-752.
Sun SZ, Empie MW (2012). Fructose metabolism in humans - what isotopic tracer studies tell us. Nutr Metab (Lond) 9: 89. Suter PM, Gerritsen-Zehnder M, Hasler E, Gurtler M, Vetter W, Hanseler E (2001). Effect of alcohol on postprandial lipemia with and without preprandial exercise. Journal of the American College of Nutrition 20: 58-64. Taylor R (2013). Type 2 diabetes: etiology and reversibility. Diabetes Care 36: 1047-1055. Thomas D, Elliott EJ, Baur L. Low glycaemic index or low glycaemic load diets for overweight and obesity: Cochrane Database of Systematic Reviews: Reviews 2007 Issue 3, John Wiley & Sons, Ltd., 2007. Thomas D, Elliott EJ. Low glycaemic index, or low glycaemic load, diets for diabetes mellitus: Cochrane Database of Systematic Reviews: Reviews 2009 Issue 1, John Wiley & Sons, Ltd., 2009. Thompson DG, Wingate DL, Thomas M, Harrison D (1982). Gastric emptying as a determinant of the oral glucose tolerance test. Gastroenterology 82: 51-55. Thong FS, Graham TE (2002). Caffeine-induced impairment of glucose tolerance is abolished by beta-adrenergic receptor blockade in humans. J Appl Physiol 92: 2347-2352. Ting JW, Lautt WW (2006). The effect of acute, chronic, and prenatal ethanol exposure on insulin sensitivity. Pharmacol Ther 111: 346-373. Torsdottir I, Andersson H (1989). Effect on the postprandial glycaemic level of the addition of water to a meal ingested by healthy subjects and type 2 (non-insulin-dependent) diabetic patients. Diabetologia 32: 231-235. Törrönen R, Kolehmainen M, Sarkkinen E, Poutanen K, Mykkanen H, Niskanen L (2013). Berries reduce postprandial insulin responses to wheat and rye breads in healthy women. J Nutr 143: 430-436.
References
THL — Research 135 • 2014 104 Challenges in Measuring Glycaemice Index
U.S. Department of Agriculture, U.S. Department of Health and Human Services. Dietary Guidelines for Americans 2010. Washington, DC, U.S. Government Printing Office, December 2010. Umpaichitra V, Banerji MA, Castells S (2004). Postprandial hyperlipidemia after a fat loading test in minority adolescents with type 2 diabetes mellitus and obesity. J Pediatr Endocrinol Metab 17: 853-864. Walker C (2006). The glycaemic index of beer. Brewer & Distiller 2: 40-41. van de Wiel A (2004). Diabetes mellitus and alcohol. Diabetes Metab Res Rev 20: 263-267. van Dijk AE, Olthof MR, Meeuse JC, Seebus E, Heine RJ, van Dam RM (2009). Acute effects of decaffeinated coffee and the major coffee components chlorogenic acid and trigonelline on glucose tolerance. Diabetes Care 32: 1023-1025. van Loon LJ, Saris WH, Verhagen H, Wagenmakers AJ (2000). Plasma insulin responses after ingestion of different amino acid or protein mixtures with carbohydrate. Am J Clin Nutr 72: 96-105. Vega-Lopez S, Ausman LM, Griffith JL, Lichtenstein AH (2007). Interindividual variability and intra-individual reproducibility of glycemic index values for commercial white bread. Diabetes Care 30: 1412-1417. Welch IM, Bruce C, Hill SE, Read NW (1987). Duodenal and ileal lipid suppresses postprandial blood glucose and insulin responses in man: possible implications for the dietary management of diabetes mellitus. Clin Sci (Lond) 72: 209-216. Venn BJ, Green TJ (2007). Glycemic index and glycemic load: measurement issues and their effect on diet-disease relationships. Eur J Clin Nutr 61 Suppl 1: S122-131.
Venn BJ, Williams SM, Perry T, Richardson S, Cannon A, Mann JI (2011). Age-related differences in postprandial glycaemia and glycaemic index. Age Ageing 40: 755-758. Venn BS, Williams SM, Mann JI (2010). Comparison of postprandial glycaemia in Asians and Caucasians. Diabet Med 27: 1205-1208. WHO. Definition, diagnosis and classification of diabetes mellitus and its complications: report of a WHO consultation. Part 1, Diagnosis and classification of diabetes mellitus. Geneva, World Health Organization, 1999. Williams SM, Venn BJ, Perry T, Brown R, Wallace A, Mann JI et al. (2008). Another approach to estimating the reliability of glycaemic index. Br J Nutr 100: 364-372. Wolever TM, Nuttall FQ, Lee R, Wong GS, Josse RG, Csima A et al. (1985). Prediction of the relative blood glucose response of mixed meals using the white bread glycemic index. Diabetes Care 8: 418-428. Wolever TM, Jenkins DJ (1986). The use of the glycemic index in predicting the blood glucose response to mixed meals. Am J Clin Nutr 43: 167-172. Wolever TM, Jenkins JA, Kalmusky J, Jenkins A, Giordano C, Giudici S et al. (1986). Comparison of regular and parboiled rices: explanation of disparencies between reported glycemic responses to rice. Nutr Res 6: 349-357. Wolever TM, Jenkins DJ, Josse RG, Wong GS, Lee R (1987). The glycemic index: similarity of values derived in insulin-dependent and non-insulin-dependent diabetic patients. J Am Coll Nutr 6: 295-305. Wolever TM, Jenkins DJ, Collier GR, Ehrlich RM, Josse RG, Wong GS et al. (1988a). The glycaemic index: effect of age in insulin dependent diabetes mellitus. Diabetes Res 7: 71-74.
References
THL — Research 135 • 2014 105 Challenges in Measuring Glycaemice Index
Wolever TM, Jenkins DJ, Collier GR, Lee R, Wong GS, Josse RG (1988b). Metabolic response to test meals containing different carbohydrate foods: l. relationship between rate of digestion and plasma insulin response. Nutrition Research 8: 573-581. Wolever TM, Jenkins DJ, Ocana AM, Rao VA, Collier GR (1988c). Second-meal effect: low-glycemic-index foods eaten at dinner improve subsequent breakfast glycemic response. Am J Clin Nutr 48: 1041-1047. Wolever TM (1989). How important is prediction of glycemic responses? Diabetes Care 12: 591-593. Wolever TM, Csima A, Jenkins DJ, Wong GS, Josse RG (1989). The glycemic index: variation between subjects and predictive difference. J Am Coll Nutr 8: 235-247. Wolever TM, Jenkins DJ, Vuksan V, Josse RG, Wong GS, Jenkins AL (1990). Glycemic index of foods in individual subjects. Diabetes Care 13: 126-132. Wolever TM, Jenkins DJ, Jenkins AL, Josse RG (1991). The glycemic index: methodology and clinical implications. Am J Clin Nutr 54: 846-854. Wolever TM, Bolognesi C (1996a). Prediction of glucose and insulin responses of normal subjects after consuming mixed meals varying in energy, protein, fat, carbohydrate and glycemic index. J Nutr 126: 2807-2812. Wolever TM, Bolognesi C (1996b). Source and amount of carbohydrate affect postprandial glucose and insulin in normal subjects. J Nutr 126: 2798-2806. Wolever TM, Vuksan V, Palmason C (1996). Less variation of postprandial blood glucose after starchy test meals than oral glucose. Nutrition Research 16: 899-905.
Wolever TM, Chiasson JL, Hunt JA, Palmason C, Ross SA, Ryan EA (1998a). Similarity of relative glycaemic but not relative insulinaemic responses in normal, igt and diabetic subjects. Nutrition Research 18: 1667-1676. Wolever TM (2000). Dietary carbohydrates and insulin action in humans. Br J Nutr 83 Suppl 1: S97-102. Wolever TM, Vorster HH, Bjorck I, Brand-Miller J, Brighenti F, Mann JI et al. (2003). Determination of the glycaemic index of foods: interlaboratory study. Eur J Clin Nutr 57: 475-482. Wolever TM (2004). Effect of blood sampling schedule and method of calculating the area under the curve on validity and precision of glycaemic index values. Br J Nutr 91: 295-301. Wolever TM, Yang M, Zeng XY, Atkinson F, Brand-Miller JC (2006a). Food glycemic index, as given in glycemic index tables, is a significant determinant of glycemic responses elicited by composite breakfast meals. Am J Clin Nutr 83: 1306-1312. Wolever TM, Brand-Miller JC, Abernethy J, Astrup A, Atkinson F, Axelsen M et al. (2008). Measuring the glycemic index of foods: interlaboratory study. Am J Clin Nutr 87: 247S-257S. Wolever TM, Jenkins AL, Vuksan V, Campbell J (2009). The glycaemic index values of foods containing fructose are affected by metabolic differences between subjects. Eur J Clin Nutr 63: 1106-1114. Wolever TM, Bhaskaran K (2012). Use of glycemic index to estimate mixed-meal glycemic response. Am J Clin Nutr 95: 256-257; author reply 257-258. Wolever TM (2013a). Is glycaemic index (GI) a valid measure of carbohydrate quality? Eur J Clin Nutr 67: 522-531.
References
THL — Research 135 • 2014 106 Challenges in Measuring Glycaemice Index
Wolever TM (2013b). Glycemic index claims on food labels: review of Health Canada's evaluation. Eur J Clin Nutr. Wolever TMS, Chiasson J-L, Hunt JA, Pahnason C, Ross SA, Ryan EA (1998b). Similarity of relative glycaemic but not relative insulinaemic responses in normal, IGT and diabetic subjects. Nutr Res 18: 1667-1676. Wolever TMS, Gibbs AL, Spolar M, Hitchner EV, Heimowitz C (2006b). Equivalent glycemic load (EGL): a method for quantifying the glycemic responses elicited by low carbohydrate foods. Nutrition & Metabolism 3: 33. Wong JM, Jenkins DJ (2007). Carbohydrate digestibility and metabolic effects. J Nutr 137: 2539S-2546S. Vrolix R, Mensink RP (2010). Variability of the glycemic response to single food products in healthy subjects. Contemp Clin Trials 31: 5-11. Yang YX, Wang HW, Cui HM, Wang Y, Yu LD, Xiang SX et al. (2006). Glycemic index of cereals and tubers produced in China. World Journal of Gastroenterology 12: 3430-3433. Yki-Järvinen H, Nikkilä EA (1985). Ethanol decreases glucose utilization in healthy man. J Clin Endocrinol Metab 61: 941-945. Young KWH, Wolever TMS (1998). Effect of volume and type of beverage consumed with a standard test meal on postprandial blood glucose responses. Nutrition Research 18: 1857-1863. Zilkens RR, Burke V, Watts G, Beilin LJ, Puddey IB (2003). The effect of alcohol intake on insulin sensitivity in men: a randomized controlled trial. Diabetes Care 26: 608-612. Åman P, Hesselman K (1984). Analysis of starch and other main constituents of cereal grains. Swedish J Agric Res 14: 135-139.
Östman EM, Liljeberg Elmståhl HG, Björck IM (2001). Inconsistency between glycemic and insulinemic responses to regular and fermented milk products. Am J Clin Nutr 74: 96-100.