Relationship of glycaemic index with cardiovascular risk factors: analysis of the National Diet and...
15
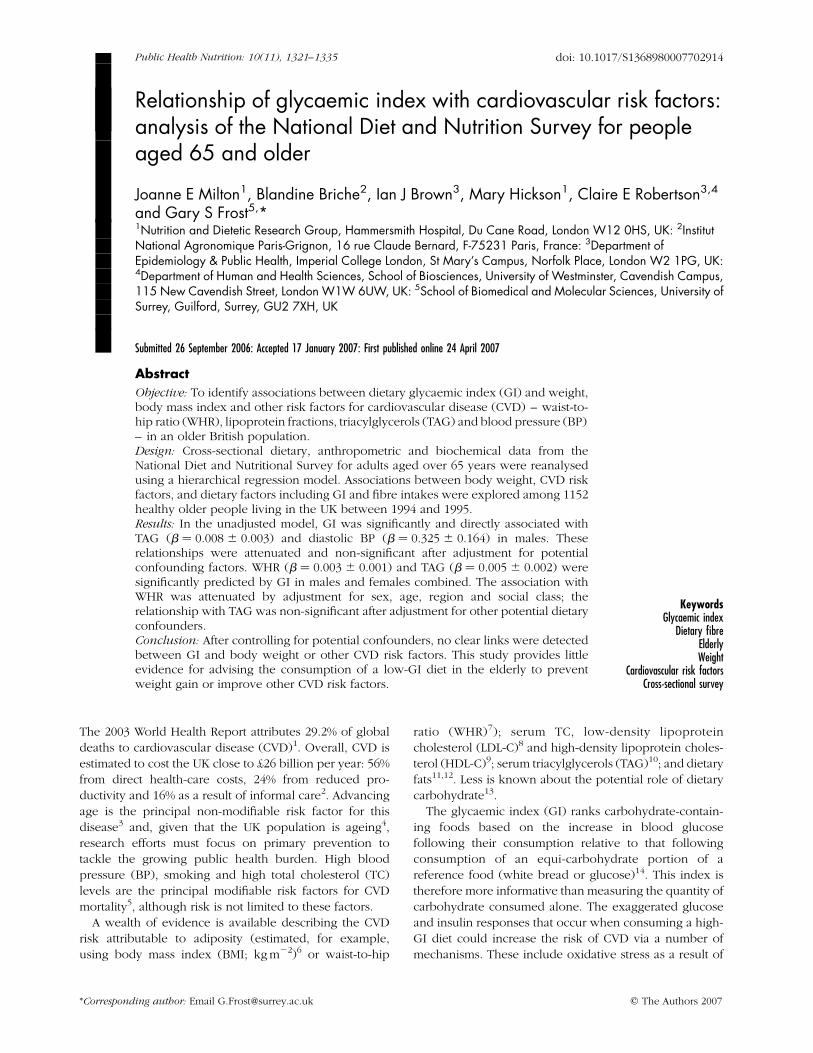
Relationship of glycaemic index with cardiovascular risk factors: analysis of the National Diet and Nutrition Survey for people aged 65 and older Joanne E Milton 1 , Blandine Briche 2 , Ian J Brown 3 , Mary Hickson 1 , Claire E Robertson 3,4 and Gary S Frost 5, * 1 Nutrition and Dietetic Research Group, Hammersmith Hospital, Du Cane Road, London W12 0HS, UK: 2 Institut National Agronomique Paris-Grignon, 16 rue Claude Bernard, F-75231 Paris, France: 3 Department of Epidemiology & Public Health, Imperial College London, St Mary’s Campus, Norfolk Place, London W2 1PG, UK: 4 Department of Human and Health Sciences, School of Biosciences, University of Westminster, Cavendish Campus, 115 New Cavendish Street, London W1W 6UW, UK: 5 School of Biomedical and Molecular Sciences, University of Surrey, Guilford, Surrey, GU2 7XH, UK Submitted 26 September 2006: Accepted 17 January 2007: First published online 24 April 2007 Abstract Objective: To identify associations between dietary glycaemic index (GI) and weight, body mass index and other risk factors for cardiovascular disease (CVD) – waist-to- hip ratio (WHR), lipoprotein fractions, triacylglycerols (TAG) and blood pressure (BP) – in an older British population. Design: Cross-sectional dietary, anthropometric and biochemical data from the National Diet and Nutritional Survey for adults aged over 65 years were reanalysed using a hierarchical regression model. Associations between body weight, CVD risk factors, and dietary factors including GI and fibre intakes were explored among 1152 healthy older people living in the UK between 1994 and 1995. Results: In the unadjusted model, GI was significantly and directly associated with TAG (b ¼ 0.008 ^ 0.003) and diastolic BP (b ¼ 0.325 ^ 0.164) in males. These relationships were attenuated and non-significant after adjustment for potential confounding factors. WHR (b ¼ 0.003 ^ 0.001) and TAG (b ¼ 0.005 ^ 0.002) were significantly predicted by GI in males and females combined. The association with WHR was attenuated by adjustment for sex, age, region and social class; the relationship with TAG was non-significant after adjustment for other potential dietary confounders. Conclusion: After controlling for potential confounders, no clear links were detected between GI and body weight or other CVD risk factors. This study provides little evidence for advising the consumption of a low-GI diet in the elderly to prevent weight gain or improve other CVD risk factors. Keywords Glycaemic index Dietary fibre Elderly Weight Cardiovascular risk factors Cross-sectional survey The 2003 World Health Report attributes 29.2% of global deaths to cardiovascular disease (CVD) 1 . Overall, CVD is estimated to cost the UK close to £26 billion per year: 56% from direct health-care costs, 24% from reduced pro- ductivity and 16% as a result of informal care 2 . Advancing age is the principal non-modifiable risk factor for this disease 3 and, given that the UK population is ageing 4 , research efforts must focus on primary prevention to tackle the growing public health burden. High blood pressure (BP), smoking and high total cholesterol (TC) levels are the principal modifiable risk factors for CVD mortality 5 , although risk is not limited to these factors. A wealth of evidence is available describing the CVD risk attributable to adiposity (estimated, for example, using body mass index (BMI; kg m 22 ) 6 or waist-to-hip ratio (WHR) 7 ); serum TC, low-density lipoprotein cholesterol (LDL-C) 8 and high-density lipoprotein choles- terol (HDL-C) 9 ; serum triacylglycerols (TAG) 10 ; and dietary fats 11,12 . Less is known about the potential role of dietary carbohydrate 13 . The glycaemic index (GI) ranks carbohydrate-contain- ing foods based on the increase in blood glucose following their consumption relative to that following consumption of an equi-carbohydrate portion of a reference food (white bread or glucose) 14 . This index is therefore more informative than measuring the quantity of carbohydrate consumed alone. The exaggerated glucose and insulin responses that occur when consuming a high- GI diet could increase the risk of CVD via a number of mechanisms. These include oxidative stress as a result of q The Authors 2007 *Corresponding author: Email [email protected] Public Health Nutrition: 10(11), 1321–1335 doi: 10.1017/S1368980007702914
-
Upload
independent -
Category
Documents
-
view
0 -
download
0
Transcript of Relationship of glycaemic index with cardiovascular risk factors: analysis of the National Diet and...
Relationship of glycaemic index with cardiovascular risk factors:analysis of the National Diet and Nutrition Survey for peopleaged 65 and older
Joanne E Milton1, Blandine Briche2, Ian J Brown3, Mary Hickson1, Claire E Robertson3,4
and Gary S Frost5,*1Nutrition and Dietetic Research Group, Hammersmith Hospital, Du Cane Road, London W12 0HS, UK: 2InstitutNational Agronomique Paris-Grignon, 16 rue Claude Bernard, F-75231 Paris, France: 3Department ofEpidemiology & Public Health, Imperial College London, St Mary’s Campus, Norfolk Place, London W2 1PG, UK:4Department of Human and Health Sciences, School of Biosciences, University of Westminster, Cavendish Campus,115 New Cavendish Street, London W1W 6UW, UK: 5School of Biomedical and Molecular Sciences, University ofSurrey, Guilford, Surrey, GU2 7XH, UK
Submitted 26 September 2006: Accepted 17 January 2007: First published online 24 April 2007
Abstract
Objective: To identify associations between dietary glycaemic index (GI) and weight,body mass index and other risk factors for cardiovascular disease (CVD) – waist-to-hip ratio (WHR), lipoprotein fractions, triacylglycerols (TAG) and blood pressure (BP)– in an older British population.Design: Cross-sectional dietary, anthropometric and biochemical data from theNational Diet and Nutritional Survey for adults aged over 65 years were reanalysedusing a hierarchical regression model. Associations between body weight, CVD riskfactors, and dietary factors including GI and fibre intakes were explored among 1152healthy older people living in the UK between 1994 and 1995.Results: In the unadjusted model, GI was significantly and directly associated withTAG (b ¼ 0.008 ^ 0.003) and diastolic BP (b ¼ 0.325 ^ 0.164) in males. Theserelationships were attenuated and non-significant after adjustment for potentialconfounding factors. WHR (b ¼ 0.003 ^ 0.001) and TAG (b ¼ 0.005 ^ 0.002) weresignificantly predicted by GI in males and females combined. The association withWHR was attenuated by adjustment for sex, age, region and social class; therelationship with TAG was non-significant after adjustment for other potential dietaryconfounders.Conclusion: After controlling for potential confounders, no clear links were detectedbetween GI and body weight or other CVD risk factors. This study provides littleevidence for advising the consumption of a low-GI diet in the elderly to preventweight gain or improve other CVD risk factors.
KeywordsGlycaemic index
Dietary fibreElderlyWeight
Cardiovascular risk factorsCross-sectional survey
The 2003 World Health Report attributes 29.2% of global
deaths to cardiovascular disease (CVD)1. Overall, CVD is
estimated to cost the UK close to £26 billion per year: 56%
from direct health-care costs, 24% from reduced pro-
ductivity and 16% as a result of informal care2. Advancing
age is the principal non-modifiable risk factor for this
disease3 and, given that the UK population is ageing4,
research efforts must focus on primary prevention to
tackle the growing public health burden. High blood
pressure (BP), smoking and high total cholesterol (TC)
levels are the principal modifiable risk factors for CVD
mortality5, although risk is not limited to these factors.
A wealth of evidence is available describing the CVD
risk attributable to adiposity (estimated, for example,
using body mass index (BMI; kg m22)6 or waist-to-hip
ratio (WHR)7); serum TC, low-density lipoprotein
cholesterol (LDL-C)8 and high-density lipoprotein choles-
terol (HDL-C)9; serum triacylglycerols (TAG)10; and dietary
fats11,12. Less is known about the potential role of dietary
carbohydrate13.
The glycaemic index (GI) ranks carbohydrate-contain-
ing foods based on the increase in blood glucose
following their consumption relative to that following
consumption of an equi-carbohydrate portion of a
reference food (white bread or glucose)14. This index is
therefore more informative than measuring the quantity of
carbohydrate consumed alone. The exaggerated glucose
and insulin responses that occur when consuming a high-
GI diet could increase the risk of CVD via a number of
mechanisms. These include oxidative stress as a result of
q The Authors 2007*Corresponding author: Email [email protected]
Public Health Nutrition: 10(11), 1321–1335 doi: 10.1017/S1368980007702914
postprandial hyperglycaemia and independent effects of
hyperinsulinaemia on lipid profile, blood pressure,
coagulation factors, inflammatory mediators and endo-
thelial function15.
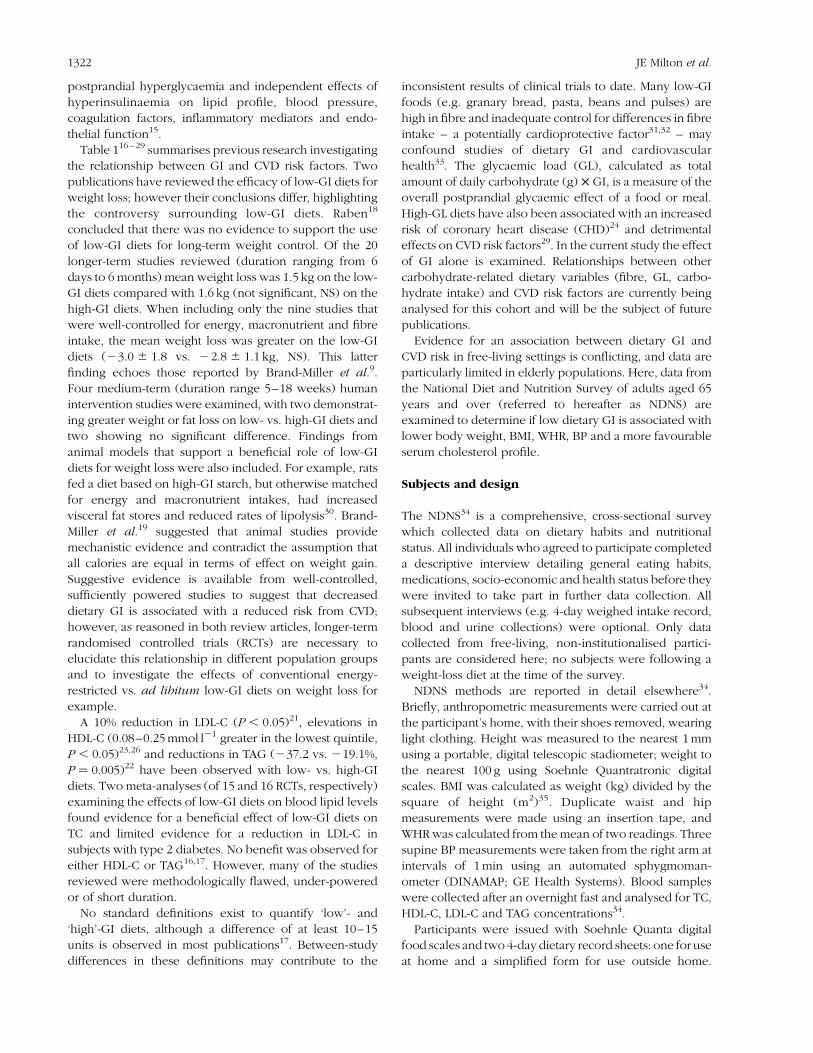
Table 116–29 summarises previous research investigating
the relationship between GI and CVD risk factors. Two
publications have reviewed the efficacy of low-GI diets for
weight loss; however their conclusions differ, highlighting
the controversy surrounding low-GI diets. Raben18
concluded that there was no evidence to support the use
of low-GI diets for long-term weight control. Of the 20
longer-term studies reviewed (duration ranging from 6
days to 6 months) mean weight loss was 1.5 kg on the low-
GI diets compared with 1.6 kg (not significant, NS) on the
high-GI diets. When including only the nine studies that
were well-controlled for energy, macronutrient and fibre
intake, the mean weight loss was greater on the low-GI
diets (23.0 ^ 1.8 vs. 22.8 ^ 1.1 kg, NS). This latter
finding echoes those reported by Brand-Miller et al.9.
Four medium-term (duration range 5–18 weeks) human
intervention studies were examined, with two demonstrat-
ing greater weight or fat loss on low- vs. high-GI diets and
two showing no significant difference. Findings from
animal models that support a beneficial role of low-GI
diets for weight loss were also included. For example, rats
fed a diet based on high-GI starch, but otherwise matched
for energy and macronutrient intakes, had increased
visceral fat stores and reduced rates of lipolysis30. Brand-
Miller et al.19 suggested that animal studies provide
mechanistic evidence and contradict the assumption that
all calories are equal in terms of effect on weight gain.
Suggestive evidence is available from well-controlled,
sufficiently powered studies to suggest that decreased
dietary GI is associated with a reduced risk from CVD;
however, as reasoned in both review articles, longer-term
randomised controlled trials (RCTs) are necessary to
elucidate this relationship in different population groups
and to investigate the effects of conventional energy-
restricted vs. ad libitum low-GI diets on weight loss for
example.
A 10% reduction in LDL-C (P , 0.05)21, elevations in
HDL-C (0.08–0.25 mmol l21 greater in the lowest quintile,
P , 0.05)23,26 and reductions in TAG (237.2 vs. 219.1%,
P ¼ 0.005)22 have been observed with low- vs. high-GI
diets. Two meta-analyses (of 15 and 16 RCTs, respectively)
examining the effects of low-GI diets on blood lipid levels
found evidence for a beneficial effect of low-GI diets on
TC and limited evidence for a reduction in LDL-C in
subjects with type 2 diabetes. No benefit was observed for
either HDL-C or TAG16,17. However, many of the studies
reviewed were methodologically flawed, under-powered
or of short duration.
No standard definitions exist to quantify ‘low’- and
‘high’-GI diets, although a difference of at least 10–15
units is observed in most publications17. Between-study
differences in these definitions may contribute to the
inconsistent results of clinical trials to date. Many low-GI
foods (e.g. granary bread, pasta, beans and pulses) are
high in fibre and inadequate control for differences in fibre
intake – a potentially cardioprotective factor31,32 – may
confound studies of dietary GI and cardiovascular
health33. The glycaemic load (GL), calculated as total
amount of daily carbohydrate (g) £ GI, is a measure of the
overall postprandial glycaemic effect of a food or meal.
High-GL diets have also been associated with an increased
risk of coronary heart disease (CHD)24 and detrimental
effects on CVD risk factors29. In the current study the effect
of GI alone is examined. Relationships between other
carbohydrate-related dietary variables (fibre, GL, carbo-
hydrate intake) and CVD risk factors are currently being
analysed for this cohort and will be the subject of future
publications.
Evidence for an association between dietary GI and
CVD risk in free-living settings is conflicting, and data are
particularly limited in elderly populations. Here, data from
the National Diet and Nutrition Survey of adults aged 65
years and over (referred to hereafter as NDNS) are
examined to determine if low dietary GI is associated with
lower body weight, BMI, WHR, BP and a more favourable
serum cholesterol profile.
Subjects and design
The NDNS34 is a comprehensive, cross-sectional survey
which collected data on dietary habits and nutritional
status. All individuals who agreed to participate completed
a descriptive interview detailing general eating habits,
medications, socio-economic and health status before they
were invited to take part in further data collection. All
subsequent interviews (e.g. 4-day weighed intake record,
blood and urine collections) were optional. Only data
collected from free-living, non-institutionalised partici-
pants are considered here; no subjects were following a
weight-loss diet at the time of the survey.
NDNS methods are reported in detail elsewhere34.
Briefly, anthropometric measurements were carried out at
the participant’s home, with their shoes removed, wearing
light clothing. Height was measured to the nearest 1 mm
using a portable, digital telescopic stadiometer; weight to
the nearest 100 g using Soehnle Quantratronic digital
scales. BMI was calculated as weight (kg) divided by the
square of height (m2)35. Duplicate waist and hip
measurements were made using an insertion tape, and
WHR was calculated from the mean of two readings. Three
supine BP measurements were taken from the right arm at
intervals of 1 min using an automated sphygmoman-
ometer (DINAMAP; GE Health Systems). Blood samples
were collected after an overnight fast and analysed for TC,
HDL-C, LDL-C and TAG concentrations34.
Participants were issued with Soehnle Quanta digital
food scales and two 4-day dietary record sheets: one for use
at home and a simplified form for use outside home.
JE Milton et al.1322
Table 1 Summary of previous research investigating the relationship between GI and CVD risk factors
Study category Study type
Author
and date
Number of
subjects
Subject
characteristics
Outcome
measure(s)
Intervention
period
Difference in GI,
mean (SD)
or range Results Significance
Intervention Meta-analysis Opperman
et al. (2004)16
396 Adults with T1DM (105) Change in fructosamine,
HbA1c, HDL-C, LDL-C,
TC and TG conc
12 days to
6 months
24 (9) units # in fructosamine in low-GI
groups (20.1 mmol l21)
P ¼ 0.05
Adults with T2DM (228) 21 (7) units # in HbA1c in low-GI
groups (20.27%)
P ¼ 0.03
Healthy adults (17) 22 (9) units No difference in HDL-C conc
(20.03 mmol l21)
P ¼ 0.23
Adults with CHD (46) 21 (10) units # in LDL-C conc in low-GI
groups (20.15 mmol l21)
P ¼ 0.06
22 (8) units # in TC conc in low-GI
groups (20.33 mmol l21)
P , 0.001
20 (9) units No difference in TG conc
(0.03 mmol l21)
P ¼ 0.73
Meta-analysis Kelly et al.
(2004)17
325 Adults with at least
1 major risk factor for
CHD or diagnosed
with CHD
Change in weight, fasting
glucose, fasting insulin,
TC, HDL-C, LDL-C, TG
and HbA1c conc
4 weeks to
6 months
5 to 32 units Pooled # in TC of 20.17mmol l21
for the low- vs. the high-GI group
P ¼ 0.03
No difference in change in HDL-C
between diets
No difference in change
in LDL-C between diets
No difference in change
in TG conc between diets
No difference in change
in body weight between diets
No difference in change in fasting
glucose, fasting insulin or
HbA1c between diets
Review – medium-
term human studies
Raben (2002)18 538 Normal weight, overweight
or obese children and adults
Change in weight 6 days to
6 month
Not provided No difference in mean weight loss
between low- and high-GI diets
(21.5 kg vs. 21.6 kg)
P . 0.05
Review – medium-
term human
studies
Brand-Miller
et al. (2002)19
170 Overweight or
obese children
and adults
Change in weight,
WC, fat mass
5 weeks to
4 months
Not provided 3 of 4 studies observed a greater #
in weight, BMI or fat mass on
low- vs. high-GI diets
P , 0.05
1 of 4 showed no difference
in weight loss between diets
P . 0.05
Meta-analysis Brand-Miller
et al. (2003)20
356 Adults with T2DM Change in HbA1c and
fructosamine conc
12 days to
12 months
Not provided Low-GI diets reduced HbA1c
by 0.43% points more
than high-GI diets
P , 0.05
Low-GI diets reduced glycated
proteins (HbA1c and fructosamine)
by 7.4% more than high-GI diets
Gly
caem
icin
dex
and
cardio
vascu
larrisk
factors
1323
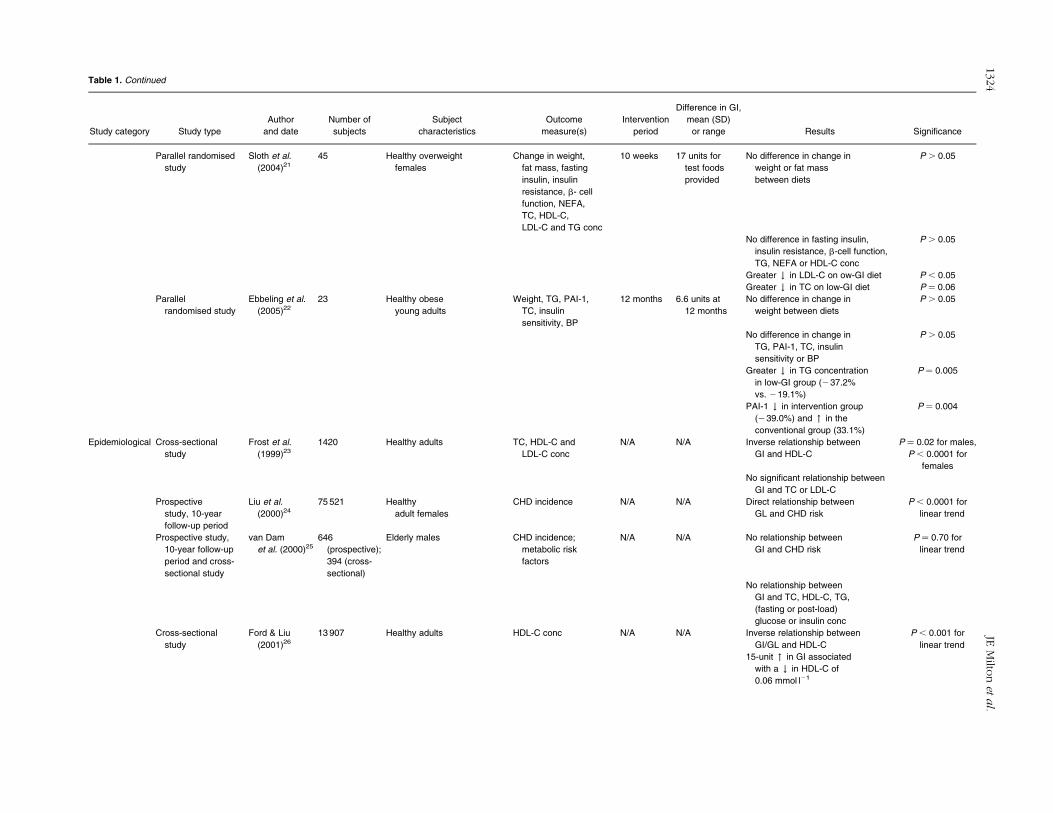
Table 1. Continued
Study category Study type
Author
and date
Number of
subjects
Subject
characteristics
Outcome
measure(s)
Intervention
period
Difference in GI,
mean (SD)
or range Results Significance
Parallel randomised
study
Sloth et al.
(2004)21
45 Healthy overweight
females
Change in weight,
fat mass, fasting
insulin, insulin
resistance, b- cell
function, NEFA,
TC, HDL-C,
LDL-C and TG conc
10 weeks 17 units for
test foods
provided
No difference in change in
weight or fat mass
between diets
P . 0.05
No difference in fasting insulin,
insulin resistance, b-cell function,
TG, NEFA or HDL-C conc
P . 0.05
Greater # in LDL-C on ow-GI diet P , 0.05
Greater # in TC on low-GI diet P ¼ 0.06
Parallel
randomised study
Ebbeling et al.
(2005)22
23 Healthy obese
young adults
Weight, TG, PAI-1,
TC, insulin
sensitivity, BP
12 months 6.6 units at
12 months
No difference in change in
weight between diets
P . 0.05
No difference in change in
TG, PAI-1, TC, insulin
sensitivity or BP
P . 0.05
Greater # in TG concentration
in low-GI group (237.2%
vs. 219.1%)
P ¼ 0.005
PAI-1 # in intervention group
(239.0%) and " in the
conventional group (33.1%)
P ¼ 0.004
Epidemiological Cross-sectional
study
Frost et al.
(1999)23
1420 Healthy adults TC, HDL-C and
LDL-C conc
N/A N/A Inverse relationship between
GI and HDL-C
P ¼ 0.02 for males,
P , 0.0001 for
females
No significant relationship between
GI and TC or LDL-C
Prospective
study, 10-year
follow-up period
Liu et al.
(2000)24
75 521 Healthy
adult females
CHD incidence N/A N/A Direct relationship between
GL and CHD risk
P , 0.0001 for
linear trend
Prospective study,
10-year follow-up
period and cross-
sectional study
van Dam
et al. (2000)25
646
(prospective);
394 (cross-
sectional)
Elderly males CHD incidence;
metabolic risk
factors
N/A N/A No relationship between
GI and CHD risk
P ¼ 0.70 for
linear trend
No relationship between
GI and TC, HDL-C, TG,
(fasting or post-load)
glucose or insulin conc
Cross-sectional
study
Ford & Liu
(2001)26
13 907 Healthy adults HDL-C conc N/A N/A Inverse relationship between
GI/GL and HDL-C
P , 0.001 for
linear trend
15-unit " in GI associated
with a # in HDL-C of
0.06 mmol l21
JEM
ilton
eta
l.1324
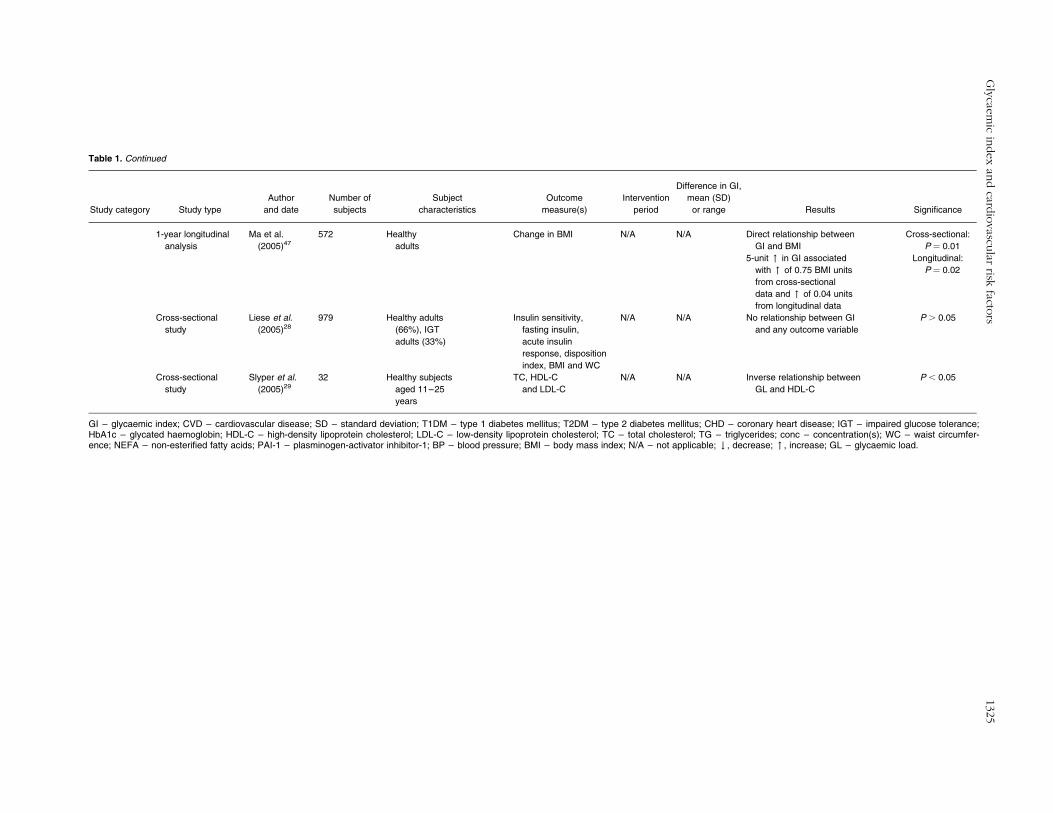
Table 1. Continued
Study category Study type
Author
and date
Number of
subjects
Subject
characteristics
Outcome
measure(s)
Intervention
period
Difference in GI,
mean (SD)
or range Results Significance
1-year longitudinal
analysis
Ma et al.
(2005)47
572 Healthy
adults
Change in BMI N/A N/A Direct relationship between
GI and BMI
Cross-sectional:
P ¼ 0.01
5-unit " in GI associated
with " of 0.75 BMI units
from cross-sectional
data and " of 0.04 units
from longitudinal data
Longitudinal:
P ¼ 0.02
Cross-sectional
study
Liese et al.
(2005)28
979 Healthy adults
(66%), IGT
adults (33%)
Insulin sensitivity,
fasting insulin,
acute insulin
response, disposition
index, BMI and WC
N/A N/A No relationship between GI
and any outcome variable
P . 0.05
Cross-sectional
study
Slyper et al.
(2005)29
32 Healthy subjects
aged 11–25
years
TC, HDL-C
and LDL-C
N/A N/A Inverse relationship between
GL and HDL-C
P , 0.05
GI – glycaemic index; CVD – cardiovascular disease; SD – standard deviation; T1DM – type 1 diabetes mellitus; T2DM – type 2 diabetes mellitus; CHD – coronary heart disease; IGT – impaired glucose tolerance;HbA1c – glycated haemoglobin; HDL-C – high-density lipoprotein cholesterol; LDL-C – low-density lipoprotein cholesterol; TC – total cholesterol; TG – triglycerides; conc – concentration(s); WC – waist circumfer-ence; NEFA – non-esterified fatty acids; PAI-1 – plasminogen-activator inhibitor-1; BP – blood pressure; BMI – body mass index; N/A – not applicable; # , decrease; " , increase; GL – glycaemic load.
Gly
caem
icin
dex
and
cardio
vascu
larrisk
factors
1325
A description/brand of all food and drink consumed at
home was recorded alongside the weight of food served
and any leftovers. For food consumed away from home –
where weighing was inconvenient – participants recorded
a description, price and place of purchase. Trained
interviewers then purchased and weighed the items. The
feasibility study revealed significant differences in nutrient
intake between different days of the week, so a diary
placement pattern (i.e. completing a set number or
proportion of diaries on each day of the week) was used
in the final survey to ensure that, for example, weekday vs.
weekend variation in intakes was accounted for36. Details
from both diaries were matched to nutrient composition
information (55 nutrients) using a nutrient databank of over
3500 foods, compiled by the Ministry of Agriculture,
Fisheries and Foods37.
GI calculation
A GI value (reference food ¼ glucose) was added to the
NDNS database for each of the 2323 carbohydrate-
containing food codes recorded in the diet diaries.
Values were obtained from the international table of GI
and GL values38 and other published sources39,40, using
means of multiple entries when available. Where no
published data were available, published analogues
were used (for example, the mean GI value for
‘oranges’ was imputed for ‘clementines’) or GI values
were calculated from recipes using the mixed-meal
formula41:
To calculate the average GI of each diet, the following
formula was applied42:
GIdiet ¼food
XGIfood £Quantityof carbohydrateinthefood ðgÞ
Totalquantityof carbohydrateinthedietðgÞ:
Many of the foods for which GI values were estimated
contributed only a small proportion of the total
carbohydrate consumed by each individual. To assess
the relative importance of GI values obtained from various
sources, the mean percentage of an individual’s total
carbohydrate intake attributable to each source of GI data
(international tables, other published data, estimations
and calculations) was calculated.
Validation of dietary intake
Basal metabolic rate (BMR), calculated using standard
regression equations based on age, sex and weight
(Schofield equations)43, was compared with energy intake
to identify underreporting. A habitual energy intake estimate
less than 1.2 £ BMR, considered incompatible with energy
balance44, was used here to define low energy reporters
(LERs). In the feasibility study, a 24-hour urine sample was
taken and p-aminobenzoic acid tablets were given to
participants to check the completeness of the sample.
Protein intakes were validated by comparing urinary and
dietary nitrogen (N) concentration: ratios of urinary N/
dietary N were 0.92 for males and 0.87 for females, close to
the permitted range for validity (0.70–0.90)36.
Statistical analysis
To control for the potentially confounding effect of energy
intake, all nutrient data are presented as energy-adjusted
variables. HDL-C, TC/HDL-C ratio, TAG and Englyst fibre
intake were log-transformed to normalise the distributions.
The ratio of polyunsaturated to saturated fatty acid intake
(P/S) was calculated and used in subsequent analyses to
improve the stability of the regression model. Differences in
means between LERs and non-LERs and between males and
femaleswere compared with unpaired t-tests for continuous
variables and by x2 tests for categorical variables.
To inform regression analyses and identify potential
collinearity, a Spearman correlation matrix, controlled for
energy intake (males and females separately and
combined), was constructed for nutrient and physical
activity level (PAL) data.
Associations of GI with CVD risk factors (weight,
n ¼ 993; BMI, n ¼ 983; WHR, n ¼ 993; BP, n ¼ 960;
lipoprotein sub-fractions, n ¼ 784; TAG, n ¼ 1100) were
analysed using multiple linear regression. The basic model
for all dependent variables was adjusted for age, region
and social class (non-manual or manual, classified by main
occupation prior to retirement). Analyses were carried out
separately for males and females and combined (with
adjustment for sex in combined analysis).
Evidence-based confounding factors were added
sequentially in additional models for each dependent
variable (e.g. BMI when BP was the dependent)45. In
subsequent models, reported potential confounders were
also added (e.g. P/S ratio when BP was the dependent)46.
To determine if the amount of fibre consumed affected the
relationship of dietary GI to the dependent variables, an
interaction term (GI £ Englyst fibre) was included in
additional regression models.
All analyses were performed with SPSS (version 12.0;
SPSS Inc.). Analyses were carried out on the full sample
and repeated with the exclusion of LERs. P-values
,0.05 (two-tailed) were considered statistically
significant.
GIfood ¼ingredient
XGIingredient £ Quantity of carbohydrate in the ingredient ðgÞ
Total quantity of carbohydrate in the food ðgÞ:
JE Milton et al.1326
Results
Study population
Of the free-living sample (n ¼ 2172 individuals), 75%
(n ¼ 1632) provided a full or partial interview (responding
sample) and 78% (n ¼ 1275) of the responding sample
also provided a 4-day weighed dietary intake record. Data
collected from those who reported being unwell during
the dietary recording period, with appetite/eating patterns
affected (8% males, n ¼ 50; 11% females, n ¼ 73), were
excluded. This resulted in a maximum study population of
1152 individuals (53% of the initial sample), of which
50.5% were male (age 75.9 ^ 7.0 years, BMI
26.3 ^ 3.6 kg m22; mean ^ standard deviation, SD) and
49.5% were female (age 77.6 ^ 8.0 years, BMI
26.6 ^ 4.8 kg m22; mean ^ SD). Selected demographic,
lifestyle, anthropometric, biochemical and nutrient charac-
teristics are presented by sex in Table 2. Some 49.2%
(n ¼ 478) of individuals (39.7% males, 59.4% females;
P , 0.001) were defined as LERs. The exclusion of these
participants did not materially affect the outcomes, and
thus only the analyses performed on the full dataset are
presented.
Source of GI values
GI values were assigned to 2323 individual food codes,
contributing 73% of the total weight of carbohydrate
consumed by participants. Of these, 235 (10%) were
assigned a mean value from multiple entries in the
international tables, and 358 (15%) were obtained from a
single entry in the international tables38. Values for 1580
(68%) codes were estimated from analogous foods with
published GI values, while 96 (4%) were calculated by the
mixed-meal method42. The 54 remaining GI values were
sourced from other published data39,40. On average, GI
values assigned from a mean value from the international
tables contributed 43.5 ^ 14.2% (mean ^ SD) of an
individual’s total carbohydrate intake; values obtained
from a single entry 24.7 ^ 13.0%; analogues 26.3 ^ 11.7%;
and mixed-meal calculated GI values 1.8 ^ 3.3%. The
remaining GI values, obtained from other published
sources39,40, contributed on average 3.5 ^ 3.4% of total
carbohydrate intake.
Correlation analyses
Correlation matrices for males and females are presented
in Tables 3 and 4, respectively. Dietary GI did not correlate
significantly with weight, BMI, WHR, BP or any lipoprotein
fraction in either sex. Dietary GI was inversely associated
with Englyst fibre intakes in males and females (r ¼ 20.34
and r ¼ 20.32, respectively).
Regression analyses
Associations of dietary GI with weight, BMI, WHR and
other CVD risk factors, with and without control for
potential confounders, are reported for males and females
in Tables 5 and 6, respectively.
In males, prior to controlling for potential confounders,
dietary GI was directly associated with 10g TAG
concentration (b ¼ 0.008 ^ 0.003). There was also a
direct relationship between GI and diastolic BP
(b ¼ 0.325 ^ 0.164). However, after adjusting for age,
social class and region (Model 2), neither association was
statistically significant. In females, dietary GI was not
significantly associated with any of the anthropometric
variables or CVD risk factors assessed, either before or
after adjustment for confounders.
When the analyses were repeated in males and females
combined (data not shown), WHR was significantly
predicted by dietary GI (b ¼ 0.003 ^ 0.001; P , 0.001)
in Model 1. However, after controlling for sex, age, social
class and region, the relationship was no longer
significant. Subsequent models further reduced the
strength of the relationship. Dietary GI predicted (log)
TAG concentration (b ¼ 0.005 ^ 0.002; P ¼ 0.017); the
association remained significant after control for sex, age,
social class and region (Model 2), and PAL and BMI (Model
3) (b ¼ 0.004 ^ 0.002; P ¼ 0.049). Adjusting for alcohol
(units week21) (Model 4), carbohydrate (g day21) (Model
5) and Englyst fibre (g day21) (Model 6) weakened the
association (b ¼ 0.02 ^ 0.02; P ¼ 0.362), which became
non-significant.
When the interactions between fibre and GI were
considered, it was apparent that in females the non-
significant relationships between dietary GI and weight
and between dietary GI and BMI were dependent on fibre
intake. The addition of a GI £ fibre interaction term to the
regression model revealed significant inverse associations
between GI and weight (b ¼ 20.995 ^ 0.360; P ¼ 0.008)
and GI and BMI (b ¼ 20.302 ^ 0.145; P ¼ 0.038).
Significant and borderline-significant interactions were
detected between fibre and GI in males for HDL-C,
TC/HDL-C ratio and TAG, indicating that the observed
relationships (non-significant) of dietary GI and these
outcome measures are also dependent on fibre intake.
Discussion
Carbohydrate is absorbed rapidly from high-GI (relative to
low-GI) foods, causing higher postprandial glucose and
insulin responses47. This encourages carbohydrate rather
than fat oxidation, stimulates lipolysis and increases
visceral non-esterified fatty acid release in the late
postprandial period, promoting body fat gain. Low-GI
carbohydrates have been associated with greater satiety
and hence reductions in subsequent energy intake48.
Thus, we hypothesised that low-GI diets would be
associated with lower body weight, BMI, WHR, BP and a
more favourable cholesterol profile in a free-living
population. Our study found a high-GI diet to be
associated with higher TAG concentrations and higher
Glycaemic index and cardiovascular risk factors 1327
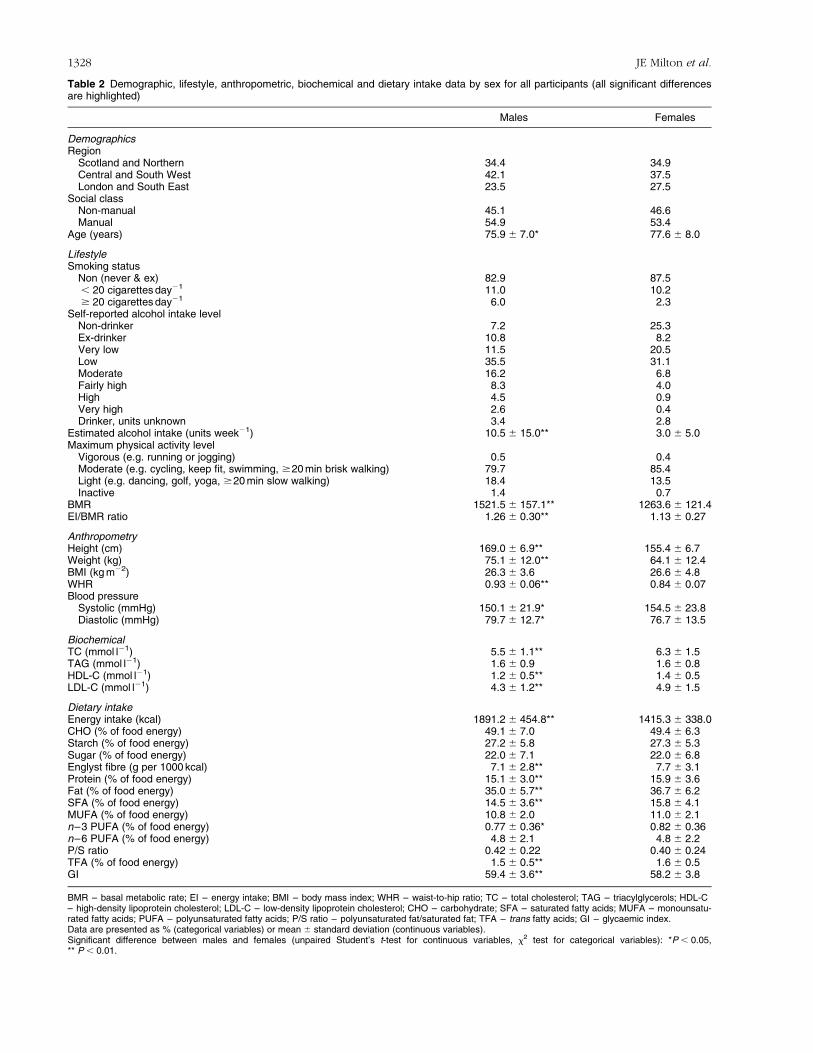
Table 2 Demographic, lifestyle, anthropometric, biochemical and dietary intake data by sex for all participants (all significant differencesare highlighted)
Males Females
DemographicsRegion
Scotland and Northern 34.4 34.9Central and South West 42.1 37.5London and South East 23.5 27.5
Social classNon-manual 45.1 46.6Manual 54.9 53.4
Age (years) 75.9 ^ 7.0* 77.6 ^ 8.0
LifestyleSmoking status
Non (never & ex) 82.9 87.5, 20 cigarettes day21 11.0 10.2$ 20 cigarettes day21 6.0 2.3
Self-reported alcohol intake levelNon-drinker 7.2 25.3Ex-drinker 10.8 8.2Very low 11.5 20.5Low 35.5 31.1Moderate 16.2 6.8Fairly high 8.3 4.0High 4.5 0.9Very high 2.6 0.4Drinker, units unknown 3.4 2.8
Estimated alcohol intake (units week21) 10.5 ^ 15.0** 3.0 ^ 5.0Maximum physical activity level
Vigorous (e.g. running or jogging) 0.5 0.4Moderate (e.g. cycling, keep fit, swimming, $20 min brisk walking) 79.7 85.4Light (e.g. dancing, golf, yoga, $20 min slow walking) 18.4 13.5Inactive 1.4 0.7
BMR 1521.5 ^ 157.1** 1263.6 ^ 121.4EI/BMR ratio 1.26 ^ 0.30** 1.13 ^ 0.27
AnthropometryHeight (cm) 169.0 ^ 6.9** 155.4 ^ 6.7Weight (kg) 75.1 ^ 12.0** 64.1 ^ 12.4BMI (kg m22) 26.3 ^ 3.6 26.6 ^ 4.8WHR 0.93 ^ 0.06** 0.84 ^ 0.07Blood pressure
Systolic (mmHg) 150.1 ^ 21.9* 154.5 ^ 23.8Diastolic (mmHg) 79.7 ^ 12.7* 76.7 ^ 13.5
BiochemicalTC (mmol l21) 5.5 ^ 1.1** 6.3 ^ 1.5TAG (mmol l21) 1.6 ^ 0.9 1.6 ^ 0.8HDL-C (mmol l21) 1.2 ^ 0.5** 1.4 ^ 0.5LDL-C (mmol l21) 4.3 ^ 1.2** 4.9 ^ 1.5
Dietary intakeEnergy intake (kcal) 1891.2 ^ 454.8** 1415.3 ^ 338.0CHO (% of food energy) 49.1 ^ 7.0 49.4 ^ 6.3Starch (% of food energy) 27.2 ^ 5.8 27.3 ^ 5.3Sugar (% of food energy) 22.0 ^ 7.1 22.0 ^ 6.8Englyst fibre (g per 1000 kcal) 7.1 ^ 2.8** 7.7 ^ 3.1Protein (% of food energy) 15.1 ^ 3.0** 15.9 ^ 3.6Fat (% of food energy) 35.0 ^ 5.7** 36.7 ^ 6.2SFA (% of food energy) 14.5 ^ 3.6** 15.8 ^ 4.1MUFA (% of food energy) 10.8 ^ 2.0 11.0 ^ 2.1n–3 PUFA (% of food energy) 0.77 ^ 0.36* 0.82 ^ 0.36n–6 PUFA (% of food energy) 4.8 ^ 2.1 4.8 ^ 2.2P/S ratio 0.42 ^ 0.22 0.40 ^ 0.24TFA (% of food energy) 1.5 ^ 0.5** 1.6 ^ 0.5GI 59.4 ^ 3.6** 58.2 ^ 3.8
BMR – basal metabolic rate; EI – energy intake; BMI – body mass index; WHR – waist-to-hip ratio; TC – total cholesterol; TAG – triacylglycerols; HDL-C– high-density lipoprotein cholesterol; LDL-C – low-density lipoprotein cholesterol; CHO – carbohydrate; SFA – saturated fatty acids; MUFA – monounsatu-rated fatty acids; PUFA – polyunsaturated fatty acids; P/S ratio – polyunsaturated fat/saturated fat; TFA – trans fatty acids; GI – glycaemic index.Data are presented as % (categorical variables) or mean ^ standard deviation (continuous variables).Significant difference between males and females (unpaired Student’s t-test for continuous variables, x2 test for categorical variables): *P , 0.05,** P , 0.01.
JE Milton et al.1328
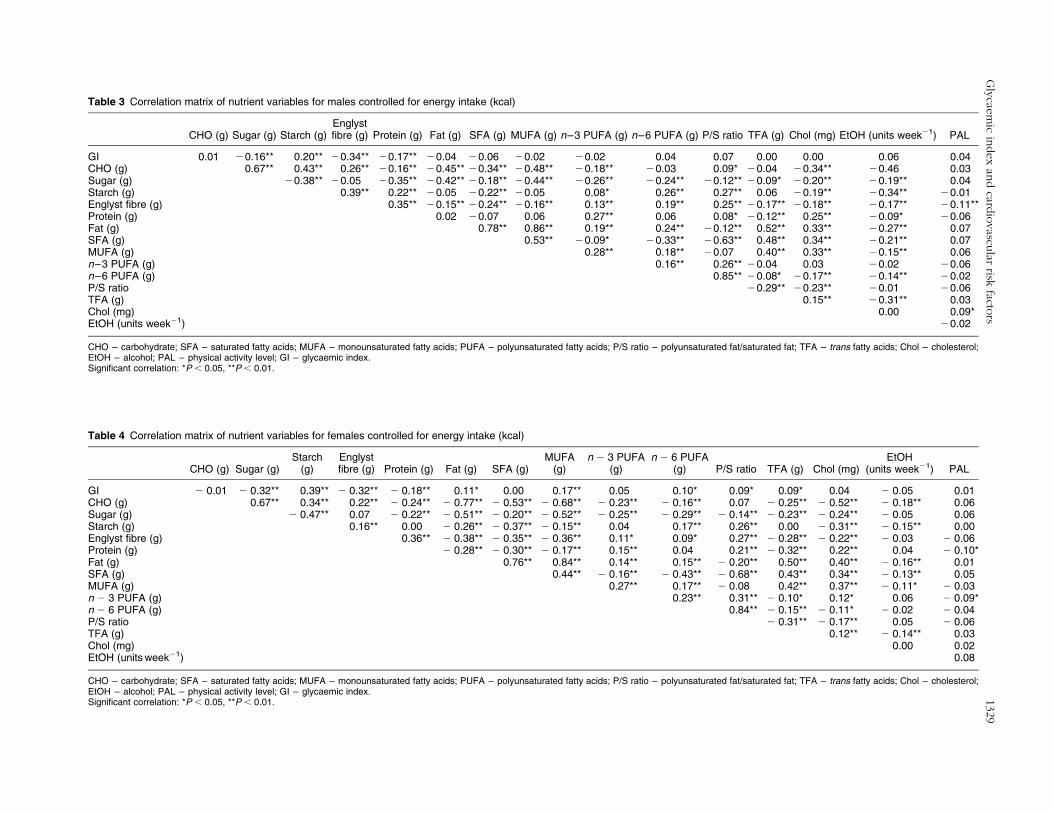
Table 3 Correlation matrix of nutrient variables for males controlled for energy intake (kcal)
CHO (g) Sugar (g) Starch (g)Englystfibre (g) Protein (g) Fat (g) SFA (g) MUFA (g) n–3 PUFA (g) n–6 PUFA (g) P/S ratio TFA (g) Chol (mg) EtOH (units week21) PAL
GI 0.01 20.16** 0.20** 20.34** 20.17** 20.04 20.06 20.02 20.02 0.04 0.07 0.00 0.00 0.06 0.04CHO (g) 0.67** 0.43** 0.26** 20.16** 20.45** 20.34** 20.48** 20.18** 20.03 0.09* 20.04 20.34** 20.46 0.03Sugar (g) 20.38** 20.05 20.35** 20.42** 20.18** 20.44** 20.26** 20.24** 20.12** 20.09* 20.20** 20.19** 0.04Starch (g) 0.39** 0.22** 20.05 20.22** 20.05 0.08* 0.26** 0.27** 0.06 20.19** 20.34** 20.01Englyst fibre (g) 0.35** 20.15** 20.24** 20.16** 0.13** 0.19** 0.25** 20.17** 20.18** 20.17** 20.11**Protein (g) 0.02 20.07 0.06 0.27** 0.06 0.08* 20.12** 0.25** 20.09* 20.06Fat (g) 0.78** 0.86** 0.19** 0.24** 20.12** 0.52** 0.33** 20.27** 0.07SFA (g) 0.53** 20.09* 20.33** 20.63** 0.48** 0.34** 20.21** 0.07MUFA (g) 0.28** 0.18** 20.07 0.40** 0.33** 20.15** 0.06n–3 PUFA (g) 0.16** 0.26** 20.04 0.03 20.02 20.06n–6 PUFA (g) 0.85** 20.08* 20.17** 20.14** 20.02P/S ratio 20.29** 20.23** 20.01 20.06TFA (g) 0.15** 20.31** 0.03Chol (mg) 0.00 0.09*EtOH (units week21) 20.02
CHO – carbohydrate; SFA – saturated fatty acids; MUFA – monounsaturated fatty acids; PUFA – polyunsaturated fatty acids; P/S ratio – polyunsaturated fat/saturated fat; TFA – trans fatty acids; Chol – cholesterol;EtOH – alcohol; PAL – physical activity level; GI – glycaemic index.Significant correlation: *P , 0.05, **P , 0.01.
Table 4 Correlation matrix of nutrient variables for females controlled for energy intake (kcal)
CHO (g) Sugar (g)Starch
(g)Englystfibre (g) Protein (g) Fat (g) SFA (g)
MUFA(g)
n 2 3 PUFA(g)
n 2 6 PUFA(g) P/S ratio TFA (g) Chol (mg)
EtOH(units week21) PAL
GI 2 0.01 2 0.32** 0.39** 2 0.32** 2 0.18** 0.11* 0.00 0.17** 0.05 0.10* 0.09* 0.09* 0.04 2 0.05 0.01CHO (g) 0.67** 0.34** 0.22** 2 0.24** 2 0.77** 2 0.53** 2 0.68** 2 0.23** 2 0.16** 0.07 2 0.25** 2 0.52** 2 0.18** 0.06Sugar (g) 2 0.47** 0.07 2 0.22** 2 0.51** 2 0.20** 2 0.52** 2 0.25** 2 0.29** 2 0.14** 2 0.23** 2 0.24** 2 0.05 0.06Starch (g) 0.16** 0.00 2 0.26** 2 0.37** 2 0.15** 0.04 0.17** 0.26** 0.00 2 0.31** 2 0.15** 0.00Englyst fibre (g) 0.36** 2 0.38** 2 0.35** 2 0.36** 0.11* 0.09* 0.27** 2 0.28** 2 0.22** 2 0.03 2 0.06Protein (g) 2 0.28** 2 0.30** 2 0.17** 0.15** 0.04 0.21** 2 0.32** 0.22** 0.04 2 0.10*Fat (g) 0.76** 0.84** 0.14** 0.15** 2 0.20** 0.50** 0.40** 2 0.16** 0.01SFA (g) 0.44** 2 0.16** 2 0.43** 2 0.68** 0.43** 0.34** 2 0.13** 0.05MUFA (g) 0.27** 0.17** 2 0.08 0.42** 0.37** 2 0.11* 2 0.03n 2 3 PUFA (g) 0.23** 0.31** 2 0.10* 0.12* 0.06 2 0.09*n 2 6 PUFA (g) 0.84** 2 0.15** 2 0.11* 2 0.02 2 0.04P/S ratio 2 0.31** 2 0.17** 0.05 2 0.06TFA (g) 0.12** 2 0.14** 0.03Chol (mg) 0.00 0.02EtOH (units week21) 0.08
CHO – carbohydrate; SFA – saturated fatty acids; MUFA – monounsaturated fatty acids; PUFA – polyunsaturated fatty acids; P/S ratio – polyunsaturated fat/saturated fat; TFA – trans fatty acids; Chol – cholesterol;EtOH – alcohol; PAL – physical activity level; GI – glycaemic index.Significant correlation: *P , 0.05, **P , 0.01.
Gly
caem
icin
dex
and
cardio
vascu
larrisk
factors
1329
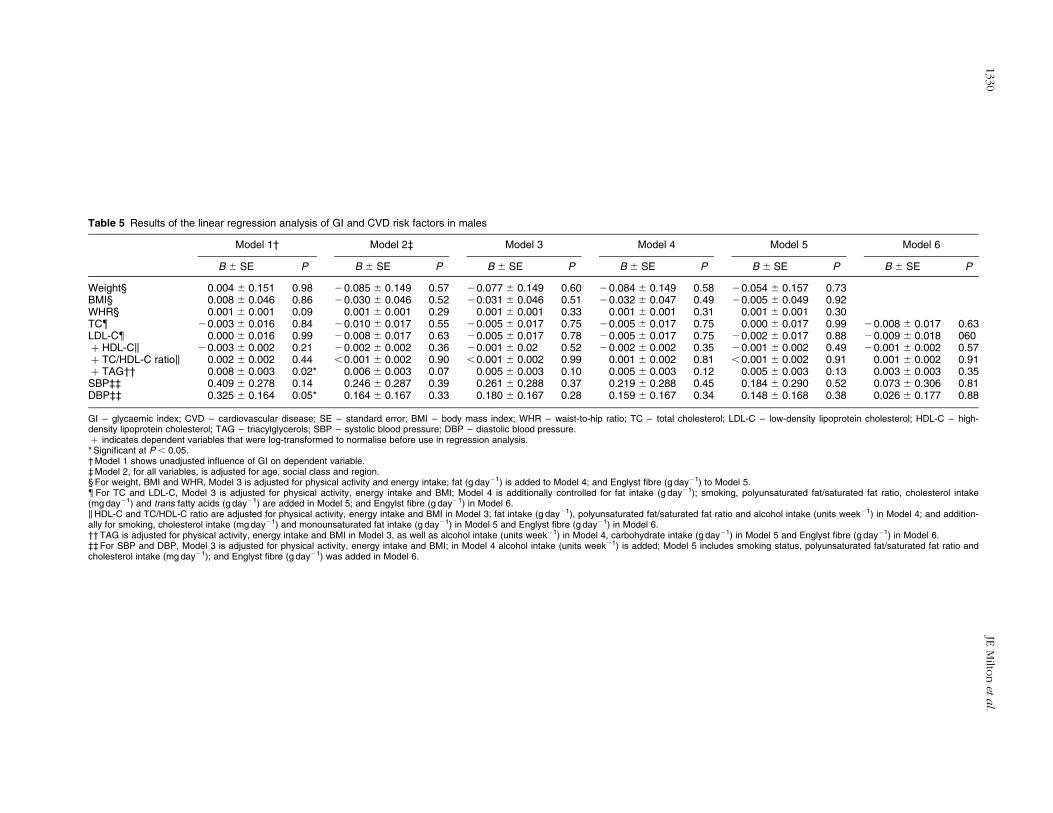
Table 5 Results of the linear regression analysis of GI and CVD risk factors in males
Model 1† Model 2‡ Model 3 Model 4 Model 5 Model 6
B ^ SE P B ^ SE P B ^ SE P B ^ SE P B ^ SE P B ^ SE P
Weight§ 0.004 ^ 0.151 0.98 20.085 ^ 0.149 0.57 20.077 ^ 0.149 0.60 20.084 ^ 0.149 0.58 20.054 ^ 0.157 0.73BMI§ 0.008 ^ 0.046 0.86 20.030 ^ 0.046 0.52 20.031 ^ 0.046 0.51 20.032 ^ 0.047 0.49 20.005 ^ 0.049 0.92WHR§ 0.001 ^ 0.001 0.09 0.001 ^ 0.001 0.29 0.001 ^ 0.001 0.33 0.001 ^ 0.001 0.31 0.001 ^ 0.001 0.30TC{ 20.003 ^ 0.016 0.84 20.010 ^ 0.017 0.55 20.005 ^ 0.017 0.75 20.005 ^ 0.017 0.75 0.000 ^ 0.017 0.99 20.008 ^ 0.017 0.63LDL-C{ 0.000 ^ 0.016 0.99 20.008 ^ 0.017 0.63 20.005 ^ 0.017 0.78 20.005 ^ 0.017 0.75 20.002 ^ 0.017 0.88 20.009 ^ 0.018 060þ HDL-Ck 20.003 ^ 0.002 0.21 20.002 ^ 0.002 0.36 20.001 ^ 0.02 0.52 20.002 ^ 0.002 0.35 20.001 ^ 0.002 0.49 20.001 ^ 0.002 0.57þ TC/HDL-C ratiok 0.002 ^ 0.002 0.44 ,0.001 ^ 0.002 0.90 ,0.001 ^ 0.002 0.99 0.001 ^ 0.002 0.81 ,0.001 ^ 0.002 0.91 0.001 ^ 0.002 0.91þ TAG†† 0.008 ^ 0.003 0.02* 0.006 ^ 0.003 0.07 0.005 ^ 0.003 0.10 0.005 ^ 0.003 0.12 0.005 ^ 0.003 0.13 0.003 ^ 0.003 0.35SBP‡‡ 0.409 ^ 0.278 0.14 0.246 ^ 0.287 0.39 0.261 ^ 0.288 0.37 0.219 ^ 0.288 0.45 0.184 ^ 0.290 0.52 0.073 ^ 0.306 0.81DBP‡‡ 0.325 ^ 0.164 0.05* 0.164 ^ 0.167 0.33 0.180 ^ 0.167 0.28 0.159 ^ 0.167 0.34 0.148 ^ 0.168 0.38 0.026 ^ 0.177 0.88
GI – glycaemic index; CVD – cardiovascular disease; SE – standard error; BMI – body mass index; WHR – waist-to-hip ratio; TC – total cholesterol; LDL-C – low-density lipoprotein cholesterol; HDL-C – high-density lipoprotein cholesterol; TAG – triacylglycerols; SBP – systolic blood pressure; DBP – diastolic blood pressure.þ indicates dependent variables that were log-transformed to normalise before use in regression analysis.* Significant at P , 0.05.† Model 1 shows unadjusted influence of GI on dependent variable.‡ Model 2, for all variables, is adjusted for age, social class and region.§ For weight, BMI and WHR, Model 3 is adjusted for physical activity and energy intake; fat (g day21) is added to Model 4; and Englyst fibre (g day21) to Model 5.{For TC and LDL-C, Model 3 is adjusted for physical activity, energy intake and BMI; Model 4 is additionally controlled for fat intake (g day21); smoking, polyunsaturated fat/saturated fat ratio, cholesterol intake(mg day21) and trans fatty acids (g day21) are added in Model 5; and Engylst fibre (g day21) in Model 6.kHDL-C and TC/HDL-C ratio are adjusted for physical activity, energy intake and BMI in Model 3; fat intake (g day21), polyunsaturated fat/saturated fat ratio and alcohol intake (units week21) in Model 4; and addition-ally for smoking, cholesterol intake (mg day21) and monounsaturated fat intake (g day21) in Model 5 and Englyst fibre (g day21) in Model 6.†† TAG is adjusted for physical activity, energy intake and BMI in Model 3, as well as alcohol intake (units week21) in Model 4, carbohydrate intake (g day21) in Model 5 and Englyst fibre (g day21) in Model 6.‡‡ For SBP and DBP, Model 3 is adjusted for physical activity, energy intake and BMI; in Model 4 alcohol intake (units week21) is added; Model 5 includes smoking status, polyunsaturated fat/saturated fat ratio andcholesterol intake (mg day21); and Englyst fibre (g day21) was added in Model 6.
JEM
ilton
eta
l.1330
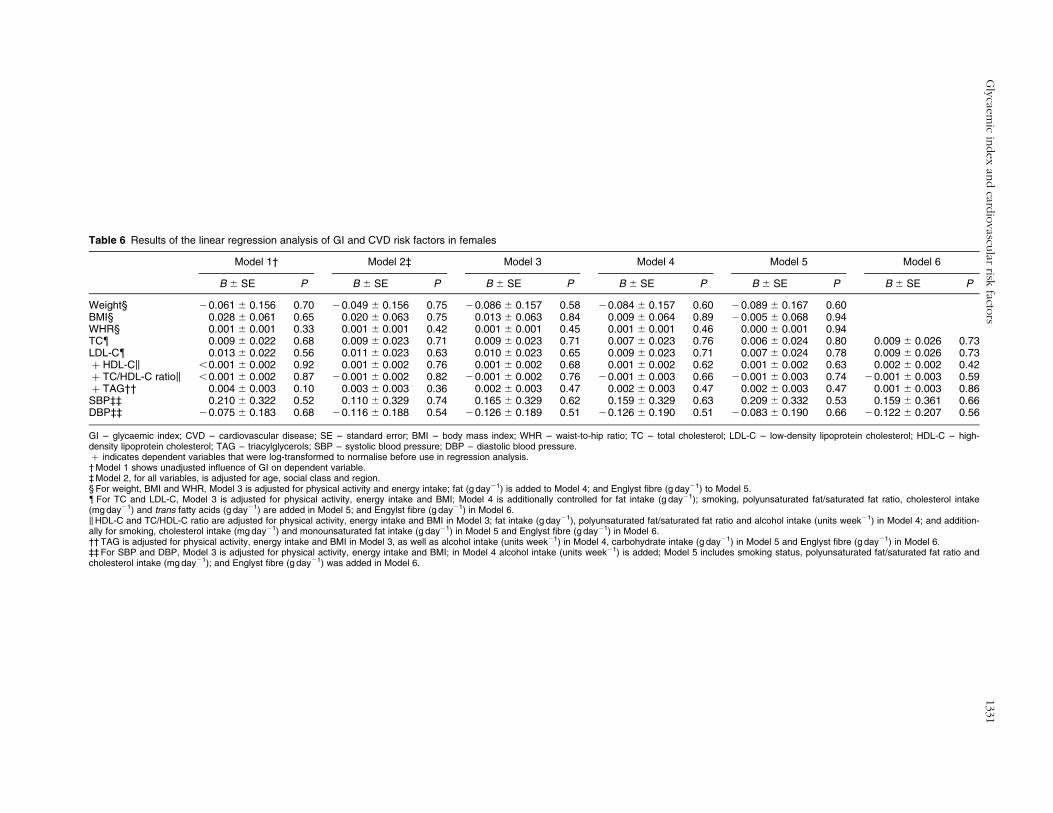
Table 6 Results of the linear regression analysis of GI and CVD risk factors in females
Model 1† Model 2‡ Model 3 Model 4 Model 5 Model 6
B ^ SE P B ^ SE P B ^ SE P B ^ SE P B ^ SE P B ^ SE P
Weight§ 20.061 ^ 0.156 0.70 20.049 ^ 0.156 0.75 20.086 ^ 0.157 0.58 20.084 ^ 0.157 0.60 20.089 ^ 0.167 0.60BMI§ 0.028 ^ 0.061 0.65 0.020 ^ 0.063 0.75 0.013 ^ 0.063 0.84 0.009 ^ 0.064 0.89 20.005 ^ 0.068 0.94WHR§ 0.001 ^ 0.001 0.33 0.001 ^ 0.001 0.42 0.001 ^ 0.001 0.45 0.001 ^ 0.001 0.46 0.000 ^ 0.001 0.94TC{ 0.009 ^ 0.022 0.68 0.009 ^ 0.023 0.71 0.009 ^ 0.023 0.71 0.007 ^ 0.023 0.76 0.006 ^ 0.024 0.80 0.009 ^ 0.026 0.73LDL-C{ 0.013 ^ 0.022 0.56 0.011 ^ 0.023 0.63 0.010 ^ 0.023 0.65 0.009 ^ 0.023 0.71 0.007 ^ 0.024 0.78 0.009 ^ 0.026 0.73þ HDL-Ck ,0.001 ^ 0.002 0.92 0.001 ^ 0.002 0.76 0.001 ^ 0.002 0.68 0.001 ^ 0.002 0.62 0.001 ^ 0.002 0.63 0.002 ^ 0.002 0.42þ TC/HDL-C ratiok ,0.001 ^ 0.002 0.87 20.001 ^ 0.002 0.82 20.001 ^ 0.002 0.76 20.001 ^ 0.003 0.66 20.001 ^ 0.003 0.74 20.001 ^ 0.003 0.59þ TAG†† 0.004 ^ 0.003 0.10 0.003 ^ 0.003 0.36 0.002 ^ 0.003 0.47 0.002 ^ 0.003 0.47 0.002 ^ 0.003 0.47 0.001 ^ 0.003 0.86SBP‡‡ 0.210 ^ 0.322 0.52 0.110 ^ 0.329 0.74 0.165 ^ 0.329 0.62 0.159 ^ 0.329 0.63 0.209 ^ 0.332 0.53 0.159 ^ 0.361 0.66DBP‡‡ 20.075 ^ 0.183 0.68 20.116 ^ 0.188 0.54 20.126 ^ 0.189 0.51 20.126 ^ 0.190 0.51 20.083 ^ 0.190 0.66 20.122 ^ 0.207 0.56
GI – glycaemic index; CVD – cardiovascular disease; SE – standard error; BMI – body mass index; WHR – waist-to-hip ratio; TC – total cholesterol; LDL-C – low-density lipoprotein cholesterol; HDL-C – high-density lipoprotein cholesterol; TAG – triacylglycerols; SBP – systolic blood pressure; DBP – diastolic blood pressure.þ indicates dependent variables that were log-transformed to normalise before use in regression analysis.† Model 1 shows unadjusted influence of GI on dependent variable.‡ Model 2, for all variables, is adjusted for age, social class and region.§ For weight, BMI and WHR, Model 3 is adjusted for physical activity and energy intake; fat (g day21) is added to Model 4; and Englyst fibre (g day21) to Model 5.{For TC and LDL-C, Model 3 is adjusted for physical activity, energy intake and BMI; Model 4 is additionally controlled for fat intake (g day21); smoking, polyunsaturated fat/saturated fat ratio, cholesterol intake(mg day21) and trans fatty acids (g day21) are added in Model 5; and Engylst fibre (g day21) in Model 6.kHDL-C and TC/HDL-C ratio are adjusted for physical activity, energy intake and BMI in Model 3; fat intake (g day21), polyunsaturated fat/saturated fat ratio and alcohol intake (units week21) in Model 4; and addition-ally for smoking, cholesterol intake (mg day21) and monounsaturated fat intake (g day21) in Model 5 and Englyst fibre (g day21) in Model 6.†† TAG is adjusted for physical activity, energy intake and BMI in Model 3, as well as alcohol intake (units week21) in Model 4, carbohydrate intake (g day21) in Model 5 and Englyst fibre (g day21) in Model 6.‡‡ For SBP and DBP, Model 3 is adjusted for physical activity, energy intake and BMI; in Model 4 alcohol intake (units week21) is added; Model 5 includes smoking status, polyunsaturated fat/saturated fat ratio andcholesterol intake (mg day21); and Englyst fibre (g day21) was added in Model 6.
Gly
caem
icin
dex
and
cardio
vascu
larrisk
factors
1331
diastolic BP in males. In the combined analysis of both
sexes the association with TAG persisted and a direct
relationship between GI and WHR was identified. These
relationships were attenuated by increasing levels of
adjustment for potential confounding factors, and became
statistically non-significant. No significant relationships
were observed for weight, BMI or lipoprotein
concentrations.
Previous intervention studies investigating the efficacy
of high- vs. low-GI diets for weight loss report conflicting
findings18,19. Liese et al. studied 979 normal (67%) and
‘glucose tolerance impaired’ (33%) adults and found no
association between GI (as assessed by food-frequency
questionnaire, FFQ) and BMI or waist circumference28.
This lack of association was attributed to the sample size
and the exclusion of people with pre-existing CVD or
diabetes, thus resulting in a cohort less susceptible to
environmental exposure13. In contrast, Ma et al. found a
direct association between GI (7-day dietary recall) and
BMI in a longitudinal study of 572 healthy adults27. Other
studies have found significant, direct relationships
between GI and weight, yet these tend to include obese
individuals or younger adults49,50. Fat mass increases and
lean mass decreases with age, independent of body
weight change. This change comprises increases in
visceral adipose tissue, intramyocellular and intramuscular
lipid and liver fat, and decreases in lean soft tissue and in
fat-free mass51. These changes may render an elderly
population less responsive to dietary changes and
comparisons of studies with different population ages
invalid.
Ingestion of high-GI carbohydrates results in reduced
insulin sensitivity, and potentially a reduction in HDL-C
and reciprocal increase in TAG concentration52. Low-GI
diets improve insulin sensitivity53, therefore higher HDL-C
and lower TAG concentrations might be expected in
individuals following such diets. Unlike previous popu-
lation studies23,26, we failed to observe an association
between dietary GI and HDL-C. Our results are consistent
with those from the Zutphen Elderly Study25, which
examined the association between high-GI diets and
hyperinsulinaemia, hyperglycaemia, dyslipidaemia and
CHD risk in 394 males (64–84 years). The lack of
association was attributed to the exclusion of males with a
history of diabetes or myocardial infarction13; however, no
such exclusions were applied here. The disparity in age
may explain these differences, as TC and LDL-C levels
have been shown to increase54, while fractional clearance
of LDL-C55 and the number of LDL receptors in hepatic
tissue decline56, with age.
TheNDNS had a low response rate (,50%), resulting in a
sample size half that estimated to observe significant
associations, and one potentially biased by differences in
diet, lifestyle and CVD risk factors between responders and
non-responders. A high proportion of LERs (40% males,
60% females) was identified and insufficient information is
available to determine whether under- or misreporting was
evident, or if reported low intakes were valid. Under-
reporting may not affect foods or nutrients system-
atically57,58; thus, although energy adjustment controls for
differences in energy intake, percentage intakes from
macronutrients may remain inaccurate. Protein intake was
validated in the NDNS feasibility study through compari-
sons of urinary with dietary nitrogen concentrations;
however, no biomarkers exist for carbohydrate or fibre and
therefore validation of GI calculations is not routine.
Our dietary GI values ranged from 40 to 72 units
(glucose ¼ 100), with a normal distribution. In the
Zutphen study25 values ranged from 39 to 65 units, with
a right skewed distribution. Frost et al.23 previously
associated low-GI diets with higher HDL-C concentrations
in healthy middle-aged adults. The total range of GI was
not presented, however data were normally distributed
and quintile means were similar to those of the current
study. The lack of variation in dietary GI is unlikely to be
responsible for the lack of association observed here;
therefore GI calculation estimates were considered. The
majority of values were obtained from international
tables38, many of which are sourced outside the UK; thus
estimates for processed foods (e.g. Special K) may be
invalid. Between-subject variation (for example, between
diabetic and non-diabetic test groups)59, methodological
differences, and differences in preparation, processing,
variety and ripeness may also introduce inaccuracies.
Using the mean of multiple estimates, we attempted to
improve the reliability of GI estimates, but undoubtedly
inaccuracies remain that could attenuate observed
associations60.
GI values estimated from analogues contributed to
approximately 26% carbohydrate. Where recipes and
mixed-meal calculations are used, effects of protein and fat
from non-carbohydrate-containing foods on insulin
secretion or gastric emptying are ignored61. One study of
eight healthy subjects demonstrated that variations in the
energy (395–610 kcal), fat (8–24 g) and protein (12–25g)
content of ameal have little effect on thepostprandial insulin
andglucose response62, the amountof carbohydrate and the
GI explaining 90% of the observed variation in glucose
response. Flint et al.41 disagree however. Their study of 28
subjects consuming 13 test meals found no association
between the estimated GI and that obtained using in vivo GI
measurements. The meals all contained 50g available
carbohydrate with varying amounts of fibre (1–24g), fat
(3–42 g) and protein (5–28g), and hence differing energy
contents (270–715kcal)41.
The current study is limited by its cross-sectional design.
We are trying to detect true associations between dietary
intake estimated from a 4-day record (which may or may
not represent long-term habitual intake) and various CVD
risk factors, which may have been influenced by diet for
more than 60 years, and which are also subject to other
environmental63 and genetic64 influences. Notably, dietary
JE Milton et al.1332
intakes differ between adulthood and old age due to
changes in physiology, dentition, and intended weight
gain or loss. Problems with dentition may cause elderly
individuals to eat softer, lower-fibre foods (e.g. white
bread (GI ¼ 70) vs. grainy/seeded bread (GI ¼ 54)) and
could explain why our results do not support those of
other studies; however, no food group analysis was
completed here.
The physiological changes associated with ageing might
limit or mask the beneficial effect of low-GI diets on body
weight or CVD risk factors. The prospective Nurses’ Health
Study investigated the effect of GI on CVD risk24 among
.75 000 US women followed-up for 10 years. The highest
quintile of GI (assessed by FFQ, relative to the lowest
category) was associated with a relative risk of 1.28
(P ¼ 0.02) for total CHD. We have examined risk factors
for CVD independently and found no significant beneficial
effect; however, small additive effects (undetectable in an
epidemiological study of this size) on individual risk
factors might combine to produce a measurable effect on
disease incidence in the long term.
Our results provide limited evidence for a beneficial
effect of low-GI diets with regard to body weight, BMI
or CVD risk factors in an older British population. The
relationship between GI and CVD risk may not exist in
this population, or may be confounded by factors such
as pre-existing CVD (58% taking cardiovascular medi-
cations) or diabetes (15% taking endocrine medi-
cations). Furthermore, regression analyses may be
under-powered and subject to attenuation of dietary
GI–CVD risk factor associations, the result of regression
dilution bias introduced by unreliable dietary GI
estimates60.
No data are available on frequencies of individual or
groups of foods consumed. Dairy products and high-fibre
foods have low GI38, but may affect anthropometric
variables, BP or dyslipidaemia differently due to variability
in fibre, micronutrient, antinutrient and antioxidant levels
for example. Our final regression analysis found
interactions between fibre and GI in some outcome
variables, indicating that a high dietary GI may be more
important in low- compared with high-fibre diets. The
interrelationships between GI, fibre and CVD risk warrant
further research. A factorial RCT could provide key
carbohydrate-containing foods and compare the CVD risk
profiles of four groups following combinations of low- or
high-GI and low- or high-fibre diets. Alternatively, large
RCTs could be used to examine the effect of GI on
anthropometric and CVD risk factors, while prospective
studies assessing food intake longitudinally with anthro-
pometric, biochemical and CVD outcomes would be
informative.
This study shows some associations between dietary GI
and measures of obesity, BP and lipoprotein profile in an
older British population, prior to adjusting for potential
confounding factors. However, there is very limited
evidence in an elderly population to justify advice to
lower dietary GI for CVD prevention.
Acknowledgements
Sources of funding: None.
Conflict of interest declaration: None.
Authorship responsibilities: J.E.M. was involved in
formulating the hypotheses, supervising the calculation
of dietary GI and undertaking the statistical analysis, and
interpreting the results. B.B. was responsible for assigning
GI values to foods, calculating dietary GI and preliminary
statistical analysis. I.J.B. and C.E.R. provided statistical
support and advice, and were responsible for manuscript
editing. G.S.F. and M.H. supervised the project and were
involved in all parts of the study from conception to
writing of the paper. All of the investigators were involved
in the writing of the paper.
Acknowledgements: The authors acknowledge the UK
Data Archive (University of Essex, UK) for providing the
data analysed in this study.
References
1 World Health Organization (WHO). World Health Report2003 – Shaping the Future. Geneva: WHO, 2003.
2 British Heart Foundation. Economic Cost of CVD and CHD[online], 24 May 2005. Available at www.heartstats.orgAccessed September 2005.
3 Kesteloot HE, Verbeke G. On the relationship between all-cause, cardiovascular, cancer and residual mortality rateswith age. European Journal of Cardiovascular Preventionand Rehabilitation 2005; 12(2): 175–81.
4 Office of National Statistics. The ageing UK population[online], 2002. Available at http://www.oheschools.org/ohech6pg3.html. Accessed 22 September 2005.
5 Ezzati M, Lopez AD, Rodgers A, Vander HS, Murray CJ.Selected major risk factors and global and regional burden ofdisease. Lancet 2002; 360(9343): 1347–60.
6 Hu G, Tuomilehto J, Silventoinen K, Barengo NC, PeltonenM, Jousilahti P. The effects of physical activity and body massindex on cardiovascular, cancer and all-cause mortalityamong 47 212 middle-aged Finnish men and women.International Journal of Obesity 2005; 29(8): 894–902.
7 Azizi F, Esmaillzadeh A, Mirmiran P, Ainy E. Is there anindependent association between waist-to-hip ratio andcardiovascular risk factors in overweight and obese women?International Journal of Cardiology 2005; 101(1): 39–46.
8 Ballantyne C, Arroll B, Shepherd J. Lipids and CVDmanagement: towards a global consensus. European HeartJournal 2005; 26(21): 2224–31.
9 Boden WE. High-density lipoprotein cholesterol as anindependent risk factor in cardiovascular disease: assessingthe data from Framingham to the Veterans Affairs High-Density Lipoprotein Intervention Trial. American Journal ofCardiology 2000; 86(12A): 19L–22L.
10 Onat A, Sari I, Yazici M, Can G, Hergenc G, Avci GS. Plasmatriglycerides, an independent predictor of cardiovasculardisease in men: a prospective study based on a populationwith prevalent metabolic syndrome. International Journalof Cardiology 2006; 108(1): 89–95.
11 Sacks FM, Katan M. Randomized clinical trials on the effectsof dietary fat and carbohydrate on plasma lipoproteins and
Glycaemic index and cardiovascular risk factors 1333
cardiovascular disease. American Journal of Medicine 2002;113(Suppl. 9B): 13S–24S.
12 Ascherio A. Epidemiologic studies on dietary fats andcoronary heart disease. American Journal of Medicine 2002;113(Suppl. 9B): 9S–12S.
13 Jenkins DJ, Kendall CW, Augustin LS, Vuksan V. High-complex carbohydrate or lente carbohydrate foods? Amer-ican Journal of Medicine 2002; 113(Suppl. 9B): 30S–7S.
14 Food and Agriculture Organization of the United Nations(FAO). Carbohydrates in Human Nutrition. Report of a JointFAO/World Health Organization Expert Consultation. FAOFood and Nutrition Paper No. 66. Rome: FAO, 1998; 1–140.
15 Ludwig DS. The glycemic index: physiological mechanismsrelating to obesity, diabetes, and cardiovascular disease.JAMA: Journal of the American Medical Association 2002;287(18): 2414–23.
16 Opperman AM, Venter CS, Oosthuizen W, Thompson RL,Vorster HH. Meta-analysis of the health effects of using theglycaemic index in meal-planning. British Journal ofNutrition 2004; 92(3): 367–81.
17 Kelly S, Frost G, Whittaker V, Summerbell C. Low glycaemicindex diets for coronary heart disease. Cochrane Database ofSystematic Reviews 2004; (4): CD004467.
18 Raben A. Should obese patients be counselled to follow alow-glycaemic index diet? No. Obesity Reviews 2002; 3(4):245–56.
19 Brand-Miller JC, Holt SH, Pawlak DB, McMillan J. Glycemicindex and obesity. American Journal of Clinical Nutrition2002; 76(1): 281S–5S.
20 Brand-Miller J, Hayne S, Petocz P, Colagiuri S. Low-glycemicindex diets in the management of diabetes: a meta-analysisof randomized controlled trails. Diabetes Care 2003; 26(8):2261–7.
21 Sloth B, Krog-Mikkelsen I, Flint A, Tetens I, Bjorck I, Vinoy S,et al. No difference in body weight decrease between alow-glycemic-index and a high-glycemic-index diet butreduced LDL cholesterol after 10-wk ad libitum intake of thelow-glycemic-index diet. American Journal of ClinicalNutrition 2004; 80(2): 337–47.
22 Ebbeling CB, Leidig MM, Sinclair KB, Seger-Shippee LG,Feldman HA, Ludwig DS. Effects of an ad libitum low-glycemic load diet on cardiovascular disease risk factors inobese young adults. American Journal of Clinical Nutrition2005; 81(5): 976–82.
23 Frost G, Leeds AA, Dore CJ, Madeiros S, Brading S, DornhorstA.Glycaemic indexas adeterminant of serumHDL-cholesterolconcentration. Lancet 1999; 353(9158): 1045–8.
24 Liu S, Willett WC, Stampfer MJ, Hu FB, Franz M, Sampson L,et al. A prospective study of dietary glycemic load,carbohydrate intake, and risk of coronary heart disease inUS women. American Journal of Clinical Nutrition 2000;71(6): 1455–61.
25 van Dam RM, Visscher AW, Feskens EJ, Verhoef P, KromhoutD. Dietary glycemic index in relation to metabolic riskfactors and incidence of coronary heart disease: the ZutphenElderly Study. European Journal of Clinical Nutrition 2000;54(9): 726–31.
26 Ford ES, Liu S. Glycemic index and serum high-densitylipoprotein cholesterol concentration among US adults.Archives of Internal Medicine 2001; 161(4): 572–6.
27 Ma Y, Olendzki B, Chiriboga D, Hebert JR, Li Y, Li W, et al.Association between dietary carbohydrates and bodyweight. American Journal of Epidemiology 2005; 161(4):359–67.
28 Liese AD, Schulz M, Fang F, Wolever TM, D’Agostino RBJr, Sparks KC, et al. Dietary glycemic index and glycemicload, carbohydrate and fiber intake, and measures ofinsulin sensitivity, secretion, and adiposity in the InsulinResistance Atherosclerosis Study. Diabetes Care 2005;28(12): 2832–8.
29 Slyper A, Jurva J, Pleuss J, Hoffmann R, Gutterman D.Influence of glycemic load on HDL cholesterol in youth.American Journal of Clinical Nutrition 2005; 81(2): 376–9.
30 Pawlak DB, Kushner JA, Ludwig DS. Effects of dietaryglycaemic index on adiposity, glucose homoeostasis, andplasma lipids in animals. Lancet 2004; 364(9436): 778–85.
31 Pereira MA, O’Reilly E, Augustsson K, Fraser GE, GoldbourtU, Heitmann BL, et al. Dietary fiber and risk of coronaryheart disease: a pooled analysis of cohort studies. Archives ofInternal Medicine 2004; 164(4): 370–6.
32 Slavin JL. Dietary fiber and body weight. Nutrition 2005;21(3): 411–8.
33 Bjorck I, Elmstahl HL. The glycaemic index: importance ofdietary fibre and other food properties. Proceedings of theNutrition Society 2003; 62(1): 201–6.
34 Finch S, Doyle W, Lowe C, Bates CJ, Prentice A, Smithers G,et al. National Diet and Nutrition Survey: People aged 65years and over. Vol. 1. Report of the Diet and NutritionSurvey. London: The Stationery Office, 1998.
35 Garrow JS, Webster J. Quetelet’s index (W/H2) as a measureof fatness. International Journal of Obesity 1985; 9(2):147–53.
36 Hughes JM, Smithers G, Gay C, Clarke PC, Smith P, Lowe C,et al. The British National Diet and Nutrition Survey ofpeople aged 65 years or over: protocol and feasibility study.Proceedings of the Nutrition Society 1995; 54(3): 631–43.
37 MAFF Nutrient Databank. Nutrition and Food Science 1993;2: 16–9.
38 Foster-Powell K, Holt SH, Brand-Miller JC. Internationaltable of glycemic index and glycemic load values: 2002.American Journal of Clinical Nutrition 2002; 76(1): 5–56.
39 Brand-Miller J. Glycemic Index [online], 13 December 2005.Available at www.glycemicindex.com Accessed January2006.
40 Henry CJ, Lightowler HJ, Strik CM, Renton H, Hails S.Glycaemic index and glycaemic load values of commerciallyavailable products in the UK. British Journal of Nutrition2005; 94(6): 922–30.
41 Flint A, Moller BK, Raben A, Pedersen D, Tetens I, Holst JJ,et al. The use of glycaemic index tables to predict glycaemicindex of composite breakfast meals. British Journal ofNutrition 2004; 91(6): 979–89.
42 Wolever TM, Jenkins DJ. The use of the glycemic index inpredicting the blood glucose response to mixed meals.American Journal of Clinical Nutrition 1986; 43(1):167–72.
43 Schofield WN. Predicting basal metabolic rate, newstandards and review of previous work. Human Nutri-tion. Clinical Nutrition 1985; 39(Suppl. 1): 5–41.
44 Goldberg GR, Black AE, Jebb SA, Cole TJ, Murgatroyd PR,Coward WA, et al. Critical evaluation of energy intake datausing fundamental principles of energy physiology: 1.Derivation of cut-off limits to identify under-recording.European Journal of Clinical Nutrition 1991; 45(12):569–81.
45 Brown CD, Higgins M, Donato KA, Rohde FC, Garrison R,Obarzanek E, et al. Body mass index and the prevalence ofhypertension and dyslipidemia. Obesity Research 2000; 8(9):605–19.
46 Rasmussen BM, Vessby B, Uusitupa M, Berglund L, PedersenE, Riccardi G, et al. Effects of dietary saturated, mono-unsaturated, and n–3 fatty acids on blood pressure inhealthy subjects. American Journal of Clinical Nutrition2006; 83(2): 221–6.
47 Granfeldt Y, Bjorck I, Hagander B. On the importance ofprocessing conditions, product thickness and egg additionfor the glycaemic and hormonal responses to pasta: acomparison with bread made from ‘pasta ingredients’.European Journal of Clinical Nutrition 1991;45(10): 489–99.
JE Milton et al.1334
48 Roberts SB. Glycemic index and satiety. Nutrition in ClinicalCare 2003; 6(1): 20–6.
49 Spieth LE, Harnish JD, Lenders CM, Raezer LB, Pereira MA,Hangen SJ, et al. A low-glycemic index diet in the treatmentof pediatric obesity. Archives of Pediatrics & AdolescentMedicine 2000; 154(9): 947–51.
50 Ebbeling CB, Leidig MM, Sinclair KB, Hangen JP, Ludwig DS.A reduced-glycemic load diet in the treatment of adolescentobesity. Archives of Pediatrics & Adolescent Medicine 2003;157(8): 773–9.
51 St Onge MP. Relationship between body compositionchanges and changes in physical function and metabolicrisk factors in aging. Current Opinion in Clinical Nutritionand Metabolic Care 2005; 8(5): 523–8.
52 Wolever TM, Bentum-Williams A, Jenkins DJ. Physiologicalmodulation of plasma free fatty acid concentrations by diet.Metabolic implications in nondiabetic subjects. DiabetesCare 1995; 18(7): 962–70.
53 Daly M. Sugars, insulin sensitivity, and the postprandial state.American Journal of Clinical Nutrition 2003; 78(4):865S–72S.
54 Abbott RD, Garrison RJ, Wilson PW, Epstein FH, Castelli WP,Feinleib M, et al. Joint distribution of lipoprotein cholesterolclasses. The Framingham study. Arteriosclerosis 1983; 3(3):260–72.
55 Millar JS, Lichtenstein AH, Cuchel M, Dolnikowski GG,Hachey DL, Cohn JS, et al. Impact of age on the metabolismof VLDL, IDL, and LDL apolipoprotein B-100 in men. Journalof Lipid Research 1995; 36(6): 1155–67.
56 Mahley RW. Development of accelerated atherosclerosis.Concepts derived from cell biology and animal modelstudies. Archives of Pathology & Laboratory Medicine 1983;107(8): 393–9.
57 Pryer JA, Vrijheid M, Nichols R, Kiggins M, Elliott P. Who arethe ‘low energy reporters’ in the dietary and nutritionalsurvey of British adults? International Journal of Epidemiol-ogy 1997; 26(1): 146–54.
58 Cook A, Pryer J, Shetty P. The problem of accuracy in dietarysurveys. Analysis of the over 65 UK National Diet andNutrition Survey. Journal of Epidemiology and CommunityHealth 2000; 54(8): 611–6.
59 Wolever TM. Aspects of some vitamins, minerals andenzymes in health and disease. In: Bourne GH, ed. TheGlycaemic Index. Basel: Karger, 1990; 120–85.
60 MacMahon S, Peto R, Cutler J, Collins R, Sorlie P, NeatonJ, et al. Blood pressure, stroke, and coronary heartdisease. Part 1, Prolonged differences in bloodpressure: prospective observational studies corrected forthe regression dilution bias. Lancet 1990; 335(8692):765–74.
61 Jenkins DJ, Wolever TM, Taylor RH, Barker H, Fielden H,Baldwin JM, et al. Glycemic index of foods: a physiologicalbasis for carbohydrate exchange. American Journal ofClinical Nutrition 1981; 34(3): 362–6.
62 Wolever TM, Bolognesi C. Prediction of glucose andinsulin responses of normal subjects after consumingmixed meals varying in energy, protein, fat, carbohydrateand glycemic index. Journal of Nutrition 1996; 126(11):2807–12.
63 Greiser KH, Kluttig A, Schumann B, Kors JA, Swenne CA,Kuss O, et al. Cardiovascular disease, risk factors and heartrate variability in the elderly general population: design andobjectives of the CARdiovascular disease, Living and Ageingin Halle (CARLA) Study. BMC Cardiovascular Disorders2005; 5: 33.
64 Allen JK. Genetics and cardiovascular disease. NursingClinics of North America 2000; 35(3): 653–62.
Glycaemic index and cardiovascular risk factors 1335